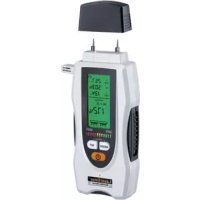
MultiWetMaster - Measuring equipment Laserliner - Free user manual and instructions
Find the device manual for free MultiWetMaster Laserliner in PDF.



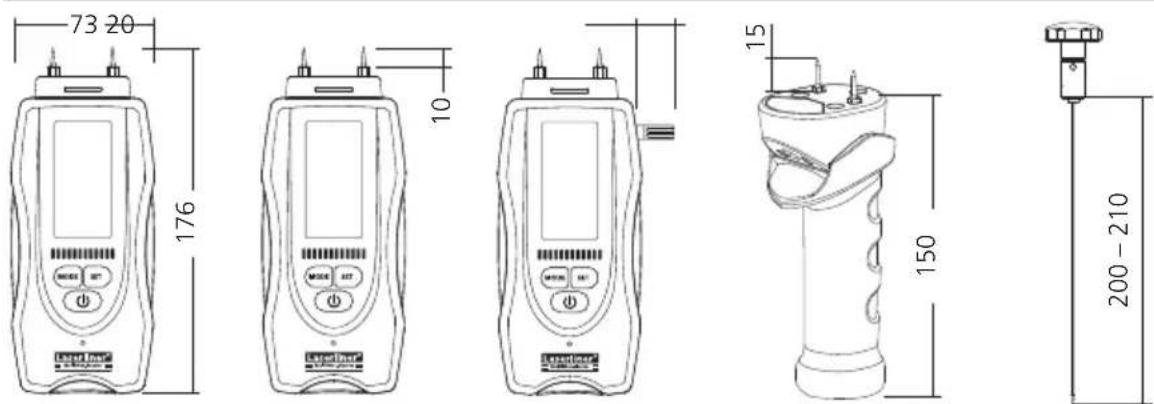
| Product type | Hygrometer for building materials and wood |
| Brand | Laserliner |
| Model | MultiWetMaster |
| Power supply | 9V battery (type 6LR61 / 6LR22) |
| Weight | 185 g |
| Measurement principle | Resistance measurement (pins) and capacitive (rubber contacts) |
| Wood moisture range (resistance) | 0 to 90% / Accuracy: ±1% (0-30%), ±2% (30-60%), ±4% (60-90%) |
| Wood moisture range (capacitive) | Softwood: 0-52%; Hardwood: 0-32% / Accuracy: ±2% (6-30%) |
| Ambient temperature range | -10°C to 60°C / Accuracy ±2°C |
| Relative air humidity range | 20% to 90% RH / Accuracy ±3% |
| Dew point indication | -20°C to 60°C |
| Display | Backlit LCD with AUTO/ON/OFF settings |
| LED indication | 12 bars: 4 green (dry), 3 yellow (damp), 5 red (wet) + audible signal |
| Preset materials | 19 building materials (1-19), 3 wood groups (A, B, C) for resistance; 2 wood groups (S, H) for capacitive |
| Index mode | Material-independent index value (0-1000) for comparative measurements |
| Special functions | Auto-Hold, auto-test, material temperature compensation, adjustable LED thresholds in Index mode |
| Ambient climate sensor | Retractable, measures air temperature and humidity |
| Operating temperature | 0°C to 40°C |
| Storage temperature | -20°C to 70°C |
| Optional accessories | Depth electrodes (ref. 082.026A), external portable electrode (ref. 082.024) |
| Safety | Protective cap mandatory during transport; do not force the pins |
| Maintenance | Clean with a dry cloth; avoid dust and dirt on the contacts |
| Compliance | WEEE directive; EU standards for free movement |
Frequently Asked Questions - MultiWetMaster Laserliner
User questions about MultiWetMaster Laserliner
0 question about this device. Answer the ones you know or ask your own.
Ask a new question about this device
Download the instructions for your Measuring equipment in PDF format for free! Find your manual MultiWetMaster - Laserliner and take your electronic device back in hand. On this page are published all the documents necessary for the use of your device. MultiWetMaster by Laserliner.
USER MANUAL MultiWetMaster Laserliner

Laserliner® Innovation in Tools
8...12 LEDs rot = nass
4 Raumklima-Messung
natural_image
Diagram of a mechanical device with two upright pins and an arrow indicating rotation (no text or symbols)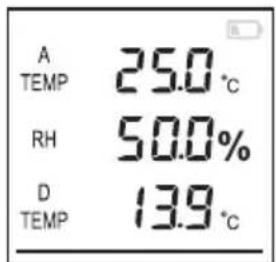
Holz
Read the operating instructions and the enclosed brochure „Guarantee and additional notices" completely. Follow the instructions they contain. Safely keep these documents for future reference.
Function / Application
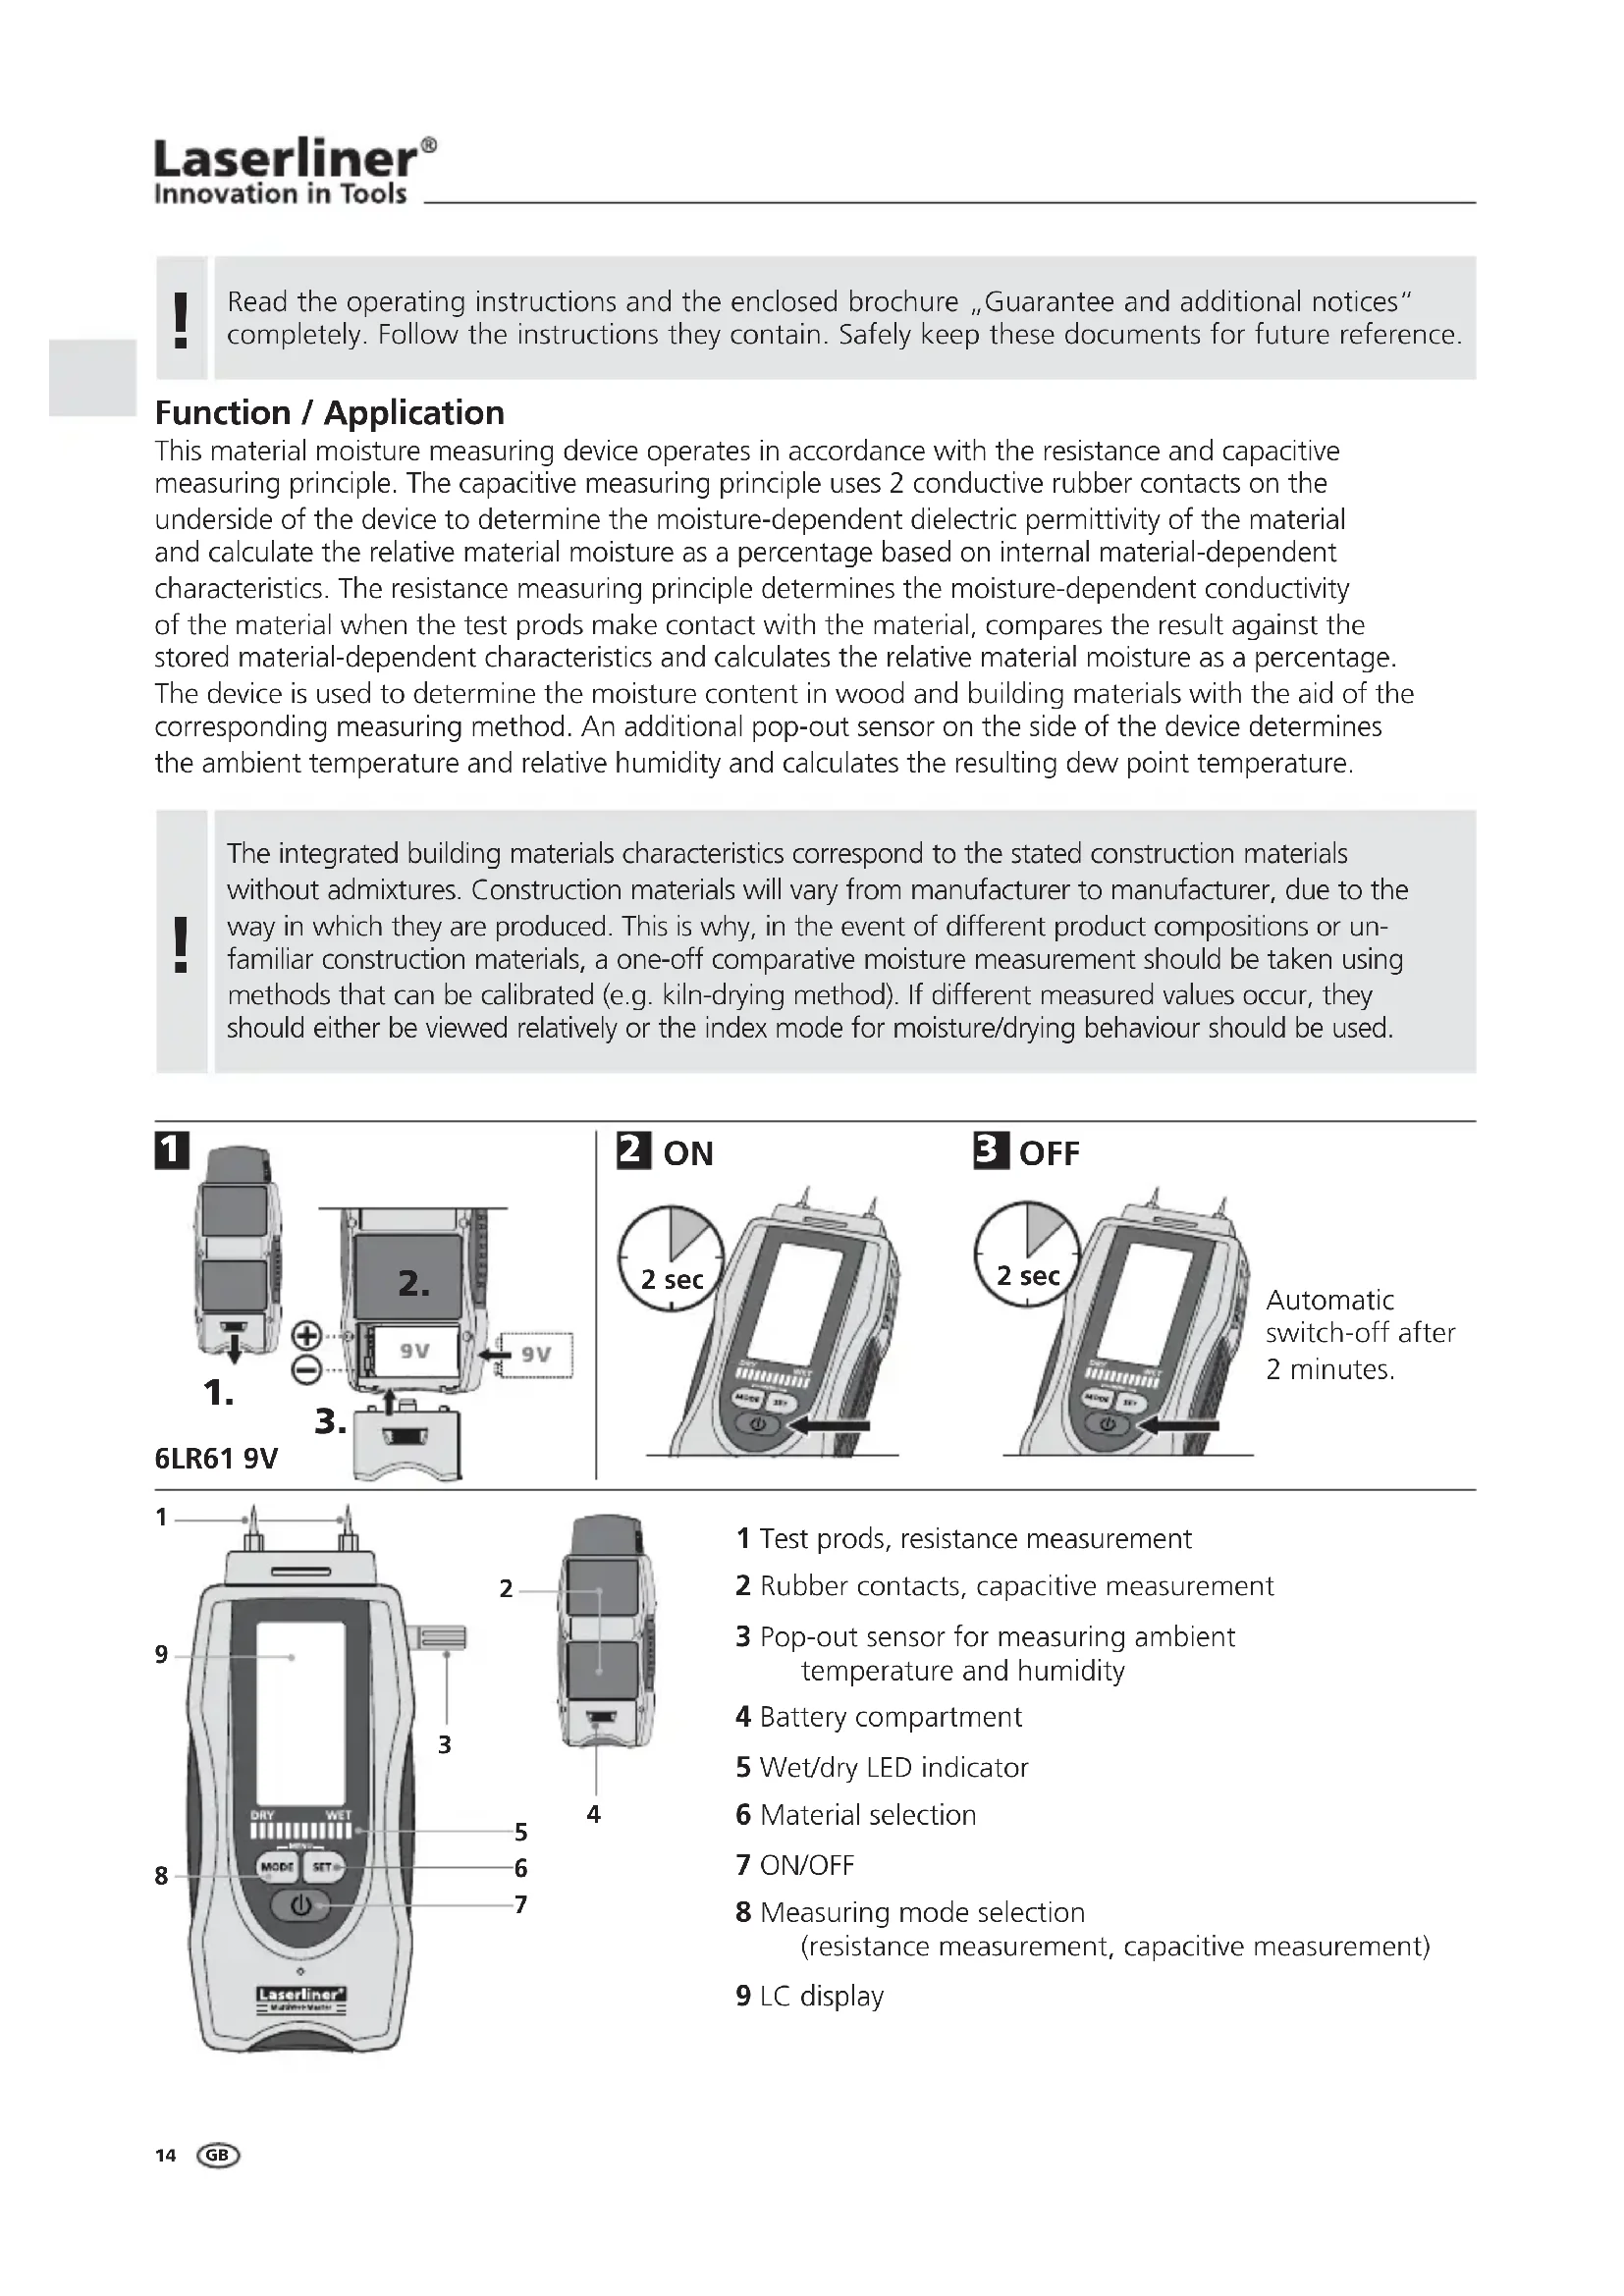
This material moisture measuring device operates in accordance with the resistance and capacitive measuring principle. The capacitive measuring principle uses 2 conductive rubber contacts on the underside of the device to determine the moisture-dependent dielectric permittivity of the material and calculate the relative material moisture as a percentage based on internal material-dependent characteristics. The resistance measuring principle determines the moisture-dependent conductivity of the material when the test prods make contact with the material, compares the result against the stored material-dependent characteristics and calculates the relative material moisture as a percentage. The device is used to determine the moisture content in wood and building materials with the aid of the corresponding measuring method. An additional pop-out sensor on the side of the device determines the ambient temperature and relative humidity and calculates the resulting dew point temperature.

The integrated building materials characteristics correspond to the stated construction materials without admixtures. Construction materials will vary from manufacturer to manufacturer, due to the way in which they are produced. This is why, in the event of different product compositions or unfamiliar construction materials, a one-off comparative moisture measurement should be taken using methods that can be calibrated (e.g. kiln-drying method). If different measured values occur, they should either be viewed relatively or the index mode for moisture/drying behaviour should be used.
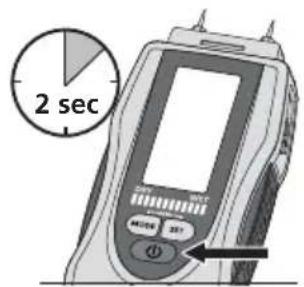
2 ON
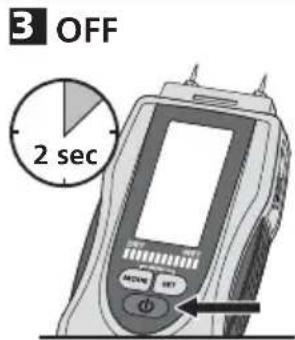
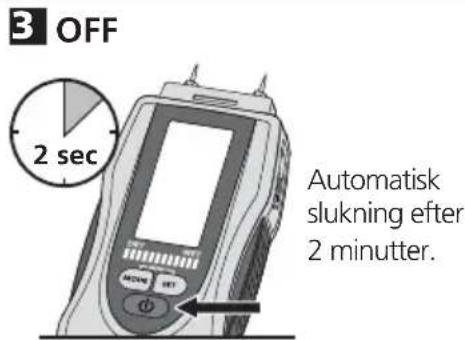
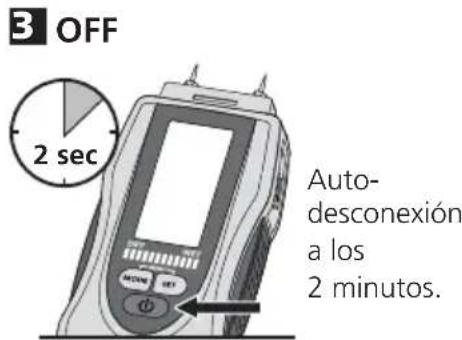
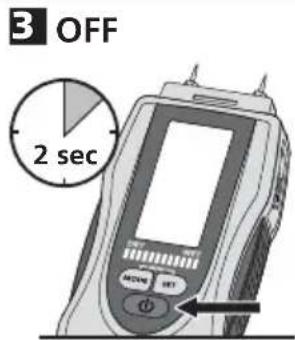
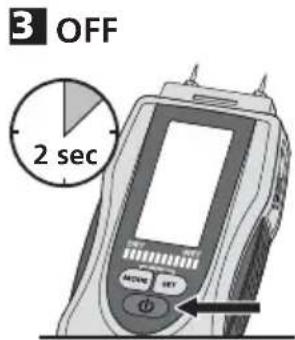
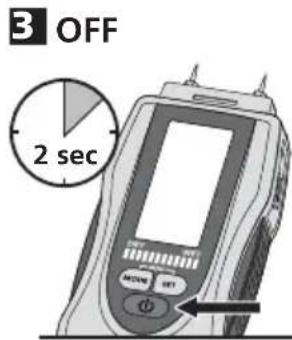
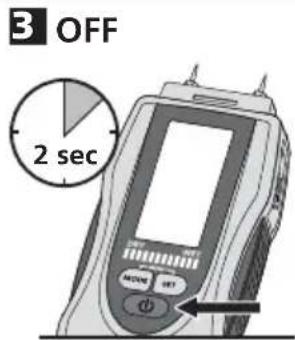
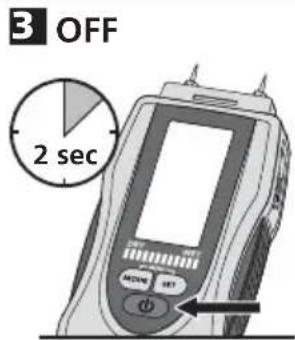
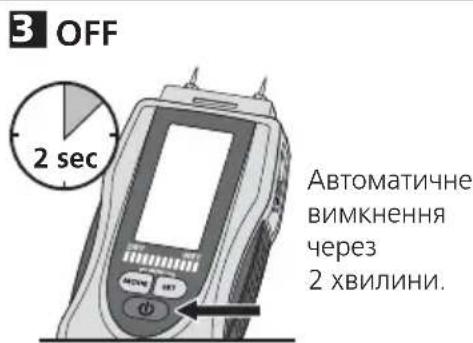
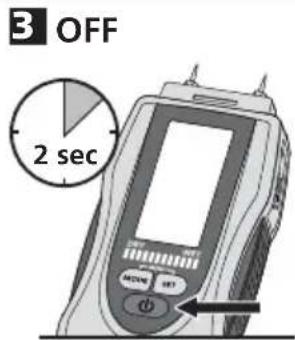
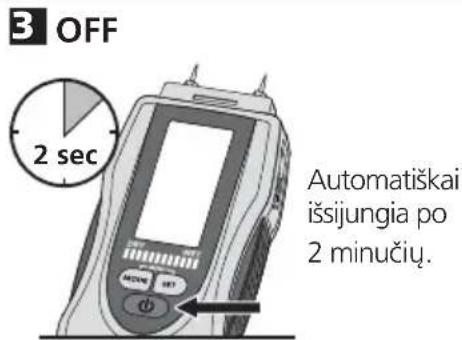
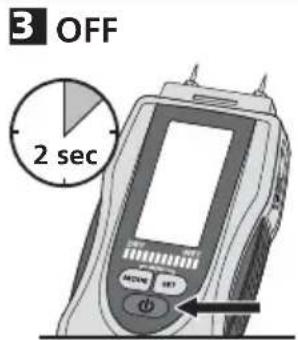
3 OFF
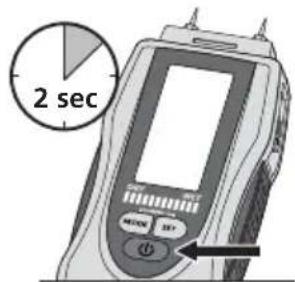
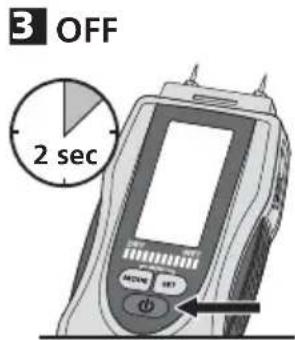
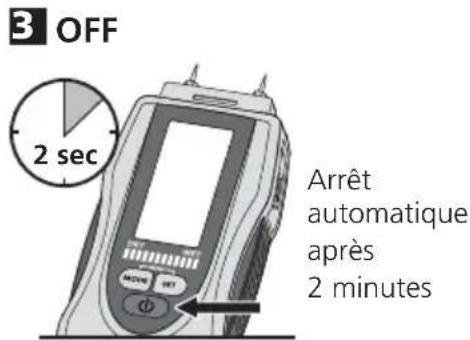
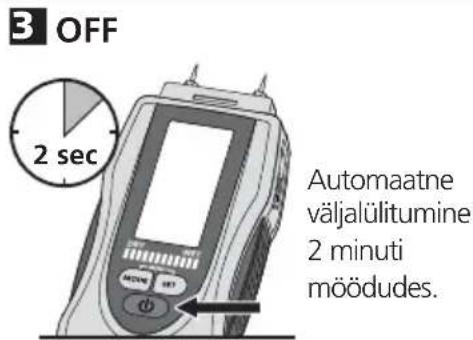
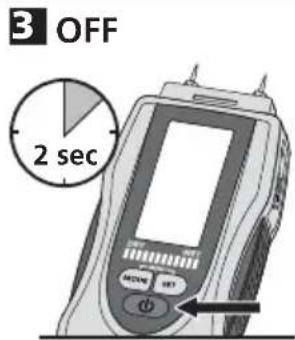
Automatic switch-off after 2 minutes.
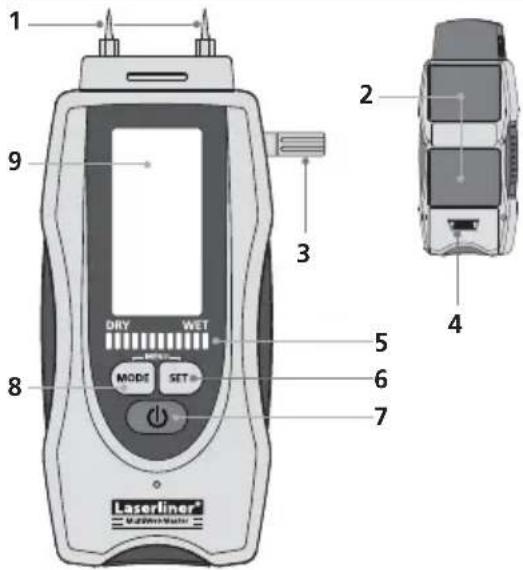
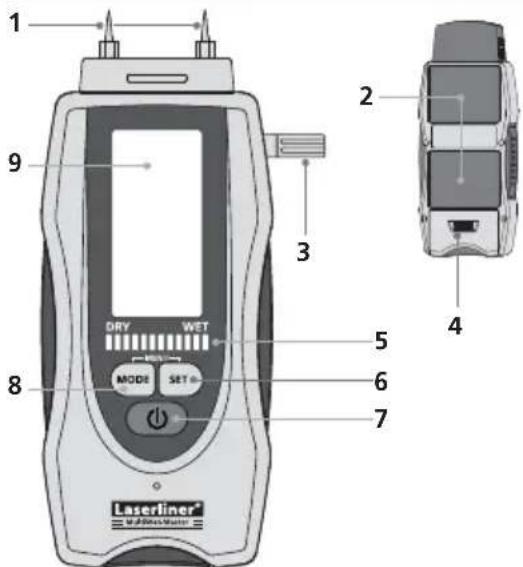
1 Test prods, resistance measurement
2 Rubber contacts, capacitive measurement
3 Pop-out sensor for measuring ambient temperature and humidity
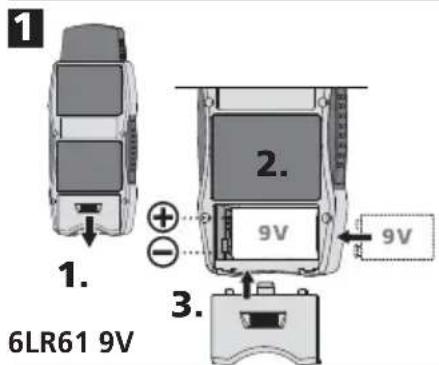
4 Battery compartment
5 Wet/dry LED indicator
6 Material selection
7 ON/OFF
8 Measuring mode selection
(resistance measurement, capacitive measurement)
9 LC display
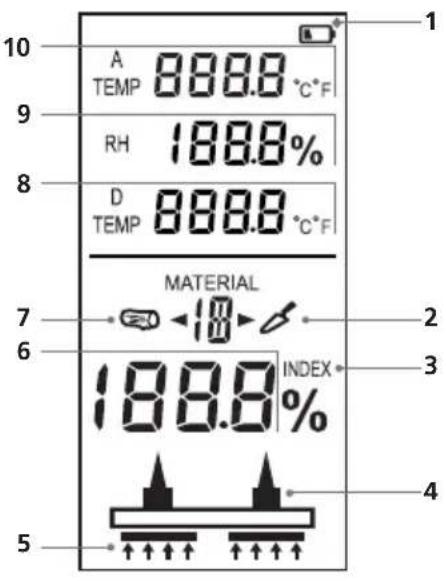
1 Battery charge
2 Material indicator for building materials
Resistance measurement: 1...19
3 Index mode
4 Resistance measurement
5 Capacitive measurement
6 Measured value in % of relative material moisture
7 Material indicator for wood
Resistance measurement: A, B, C
Capacitive measurement: S (softwood), H (hardwood)
8 Dew point temperature in °C/°F
9 Relative humidity in %
10 Ambient temperature in °C/°F
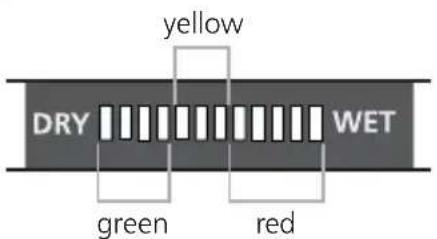
Wet/dry LED display
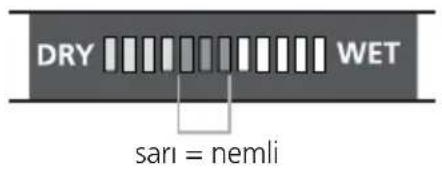
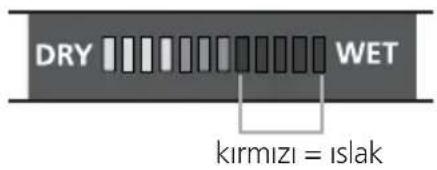
12-position LED: 0...4 LEDs green = dry
5...7 LEDs yellow = moist
8...12 LEDs red = wet
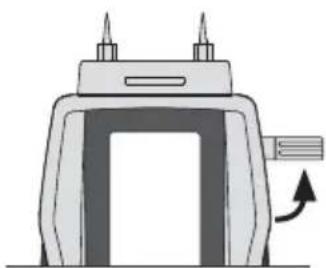
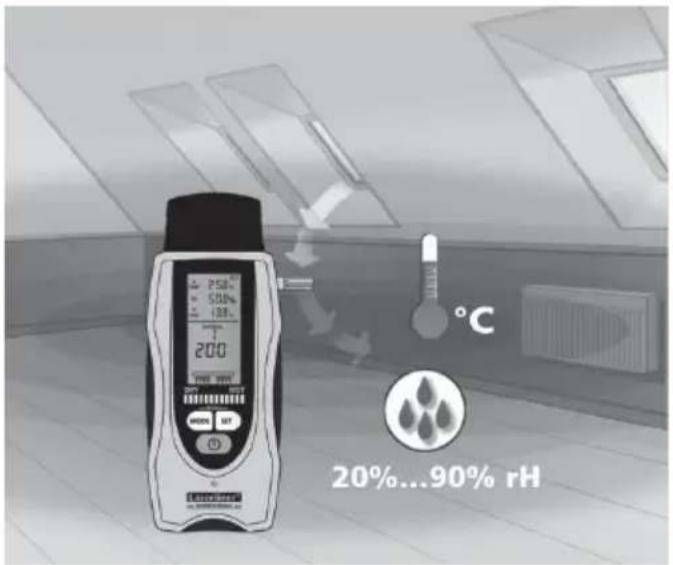
4 Room climate measurement
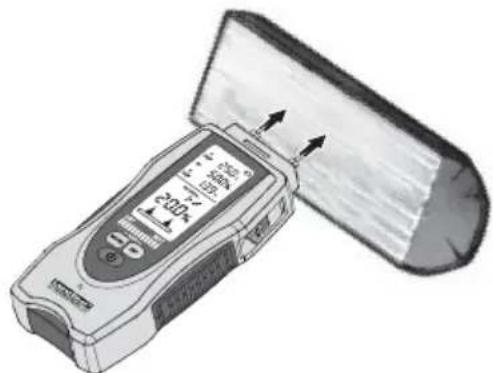
The device features a pop-out sensor to optimally measure ambient climatic conditions. Hold the sensor head close to the position to be measured and wait until the display has stabilised. The measured values for the ambient climatic conditions are permane.
natural_image
Diagram of a mechanical device with a handle and base, showing a rotational arrow (no text or symbols)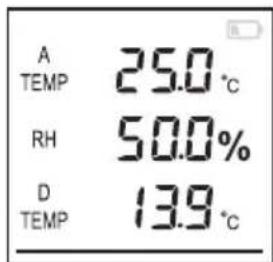
Although measurement is also possible with the sensor retracted, air exchange is improved with the sensor extended, thus ensuring faster stabilisation of the measured values.
Relative humidity
Relative humidity is indicated in relation to maximum possible humidity (100 %) at which air forms water vapour. The ability of air to hold water is temperature dependent. Thus humidity is the volume of water vapour in the air. The range for humidity is 0 ... 100%. 100% = saturation point. Under these conditions for temperature and atmospheric pressure, air cannot absorb any more water.
Dew point temperature
Dew point temperature is the temperature at which current air conditions would produce condensation. The MultiWet-Master calculates the dew point temperature from ambient temperature, relative humidity and ambient atmospheric pressure. If the temperature of the measured location drops below the dew point, condensation (water) will form on the surface.
5 Measuring mode selection
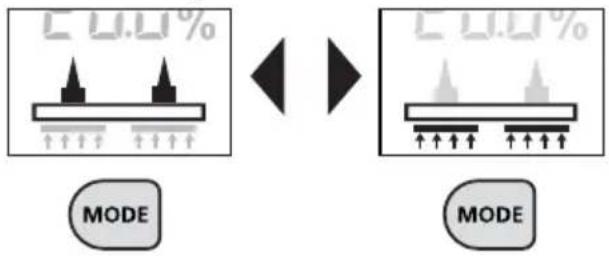
The device features two different measuring modes. Resistance measurement uses the test prods whereas capacitive measurement uses the contact surfaces on the underside of the device. You can switch between both measuring modes with the „MODE“ button.
Resistance Capacitive
flowchart
graph LR
    A["MODE"] --> B["40.0%"]
    B --> C["MODE"]
6 Resistance measurement / material selection
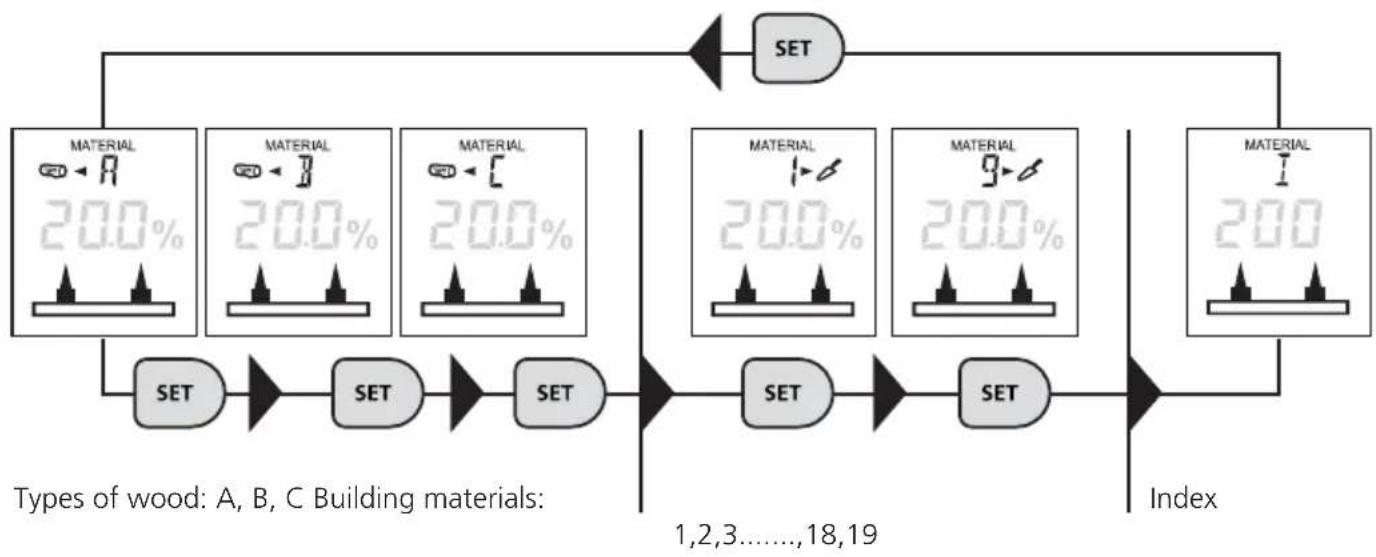
Various types of wood and building materials as well as material-independent index mode can be selected in resistance measuring mode. Measurements carried out in index mode are not material-related, i.e. for materials, for which no characteristics are stored in the device. Select the required material by pressing the „SET“ button. The types of wood and building materials that can be selected are listed under 7 and 8 in the following tables.
flowchart
graph TD
    A["Types of wood: A, B, C Building materials"] --> B["SET"]
    B --> C["SET"]
    C --> D["SET"]
    D --> E["SET"]
    E --> F["Index"]
    G["MATERIAL 20.0%"] --> H["SET"]
    I["MATERIAL 20.0%"] --> J["SET"]
    K["MATERIAL 20.0%"] --> L["SET"]
    M["MATERIAL 20.0%"] --> N["SET"]
    O["MATERIAL 20.0%"] --> P["SET"]
    Q["MATERIAL 20.0%"] --> R["SET"]
    S["MATERIAL 20.0%"] --> T["SET"]
    U["MATERIAL 20.0%"] --> V["SET"]
    W["MATERIAL 20.0%"] --> X["SET"]
    Y["MATERIAL 20.0%"] --> Z["SET"]
    style A fill:#f9f,stroke:#333
    style G fill:#f9f,stroke:#333
    style I fill:#f9f,stroke:#333
    style K fill:#f9f,stroke:#333
    style M fill:#f9f,stroke:#333
    style Q fill:#f9f,stroke:#333
    style R fill:#f9f,stroke:#333
    style S fill:#f9f,stroke:#333
    style T fill:#f9f,stroke:#333
    style U fill:#f9f,stroke:#333
    style V fill:#f9f,stroke:#333
    style X fill:#f9f,stroke:#333
    style Y fill:#f9f,stroke:#333
7 Material table - resistance measurement
| Building materials | ||||
| 1A Concrete C12/15 | 7 Cement screed, plastic additive | 15 Stone-wood, xylolite | ||
| 1B Concrete C20/25 | 16 Polystyrene | |||
| 1C Concrete C30/37 | 8 Ardurapid cement screed | 17 Soft fibre board wood, bitumen | ||
| 2 Cellular concrete (Hebel) | 9 Anhydrite screed | |||
| 3 Limestone, density 1.9 | 10 Elastizel screed | 18 Cement-bonded particle board | ||
| 4 Gypsum plaster | 11 Plaster screed | |||
| 5 Cement screed | 12 Wood cement screed | 19 Brick | ||
| 6 Cement screed, bitumen additive | 13 Lime mortar KM 1/3 | |||
| 14 Cement mortar ZM 1/3 | ||||
8 Material table - resistance measurement
| Wood | |||
| A | B | C | |
| Abachi | Agba | African mahogany | Afromosia |
| Abura | Maple | Pine | Rubber tree |
| Afzelia | Alder | Cherry wood | Imbuia |
| Pear wood | Patagonian cypress | Kosipo | Kokrodua |
| Black Afara | Purpleheart | Larch | Niové Bidinkala |
| Parana pine | Andiroba | Limba | Tola - real, red |
| Beech | Aspen | Mahogany | Cork |
| Dabema | Balsa | Cherry mahogany | Melamine particle board |
| Ebony | Basralocus | Melêze | Phenolic resin particle board |
| Oak, red | Tree heath | Poplar (all) | |
| Oak, white | Ebiara | Plum wood | |
| Ash Yellowheart | Birch | Pine | |
| Ash - American | Logwood | Red sandalwood | |
| Ash - Japanese | Juniper Beech - European hornbeam | Elm | |
| Hickory - silver poplar | Maritime pine | ||
| Hickory - swap | Hombeam - white | English oak | |
| Ilomba | Campeachy | Durmast oak | |
| Ipe | Aielé | Tola | |
| Iroko | Kapok | Tola - branca | |
| Small-leaved lime | Douka | Walnut | |
| Small-leaved lime - American | Douglas fir | Western red Cedar | |
| Oak | White maple | ||
| Mockernut hickory | Oak - holm, English, durmast | White birch | |
| Niangon | White beech | ||
| Niové | Emien | White poplar | |
| Okoumé | Alder - red, black | Swiss pine | |
| Rosewood | Ash | Common aspen | |
| Rio rosewood | Spruce | Damson wood | |
| Common beech | Ash | Cypress, real | |
| Red oak | Yellow birch | Fibre board | |
| Teak | Southern yellow pine | Wood fibre insulating board | |
| Willow | Hornbeam | ||
| White oak | Hickory - silver poplar | Wood fibre hardboard | |
| Cedar | Hickory - poplar | Kauramin particle board | |
| Cypress - C. Lusit | Izombé | Paper | |
| Board | Guanandi | Textiles | |
| Jarrah | |||
| Elm | |||
| Karri | |||
| Chestnut - sweet, red | |||
9 Resistance measurement / material moisture measurement
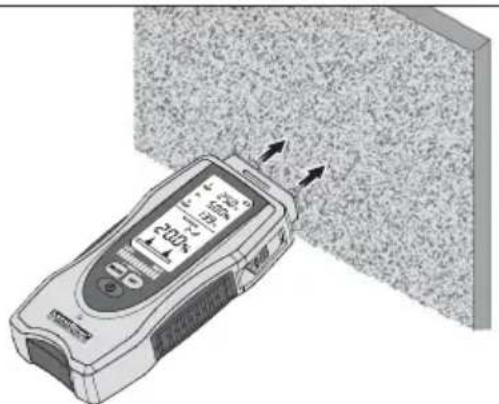
Be sure neither supply lines (electric lines, water pipes, etc) nor a metal subsurface is present at the location to be measured. Insert the electrodes as far into the material as possible but never use excessive or sudden impact force as this could damage the device. Always pull the device out of the material with left/right twisting motion. Perform several comparative measurements at different locations to minimise measurement error. The sharply pointed electrodes present an injury hazard. Always put the safety cap on the device when it is not in use or being transported.
Mineral building materials
Be aware that walls (or surfaces) with differing material structures, or even variations in material composition, can cause measurement results to be falsified. Perform multiple comparative measurements. Wait until the % symbol stops blinking and remains constantly lighted. Only then are measurement values stable.
natural_image
Illustration of a mobile phone with a digital display showing signal waves, interacting with a textured surface (no text or symbols visible)Wood
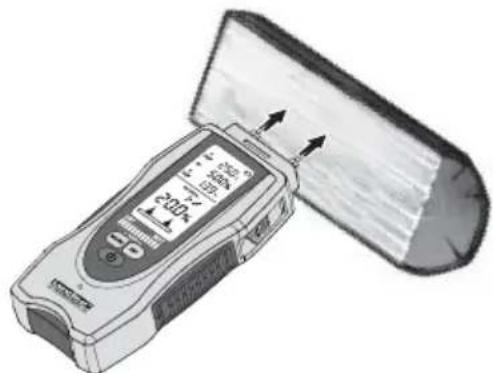
The location to be measured should be untreated, free of knots, dirt and resin. Measurements should not be made on the end faces of wood because these areas dry particularly quickly such that they produce incorrect measurement results. Perform multiple comparative measurements. Wait until the % symbol stops blinking and remains constantly lighted. Only then are measurement values stable.
10 Capacitive measurement / material selection
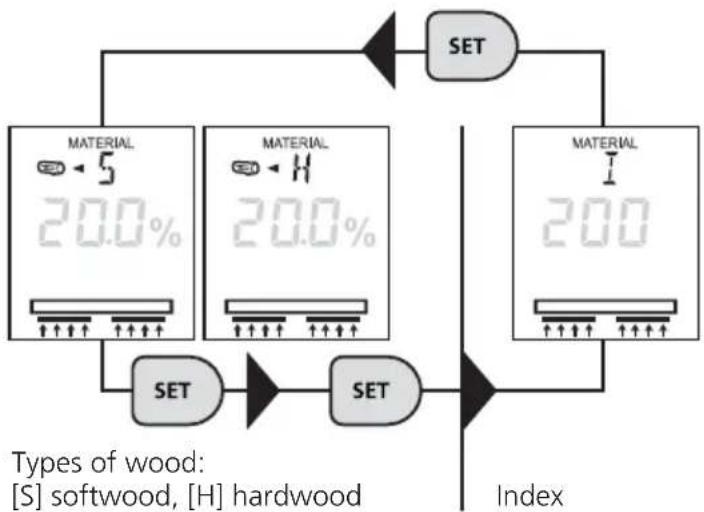
Two different wood groups and material-independent index mode can be selected in capacitive measuring mode. Measurements carried out in index mode are not material-related, i.e. for materials, for which no characteristics are stored in the device. Select the required material by pressing the „SET” button. The wood groups that can be selected are listed under 11 in the following table.
flowchart
graph TD
    A["SET"] --> B["MATERIAL 20.0%"]
    A --> C["MATERIAL 20.0%"]
    A --> D["MATERIAL 200"]
    B --> E["SET"]
    C --> F["SET"]
    D --> G["Index"]
11 Material table - capacitive measurement
| Softwood low-density woods: e.g. spruce, pine, limewood, poplar, cedar, mahogany |
| Hardwood higher-density woods: e.g. beech, oak, ash, birch |
12 Application notices
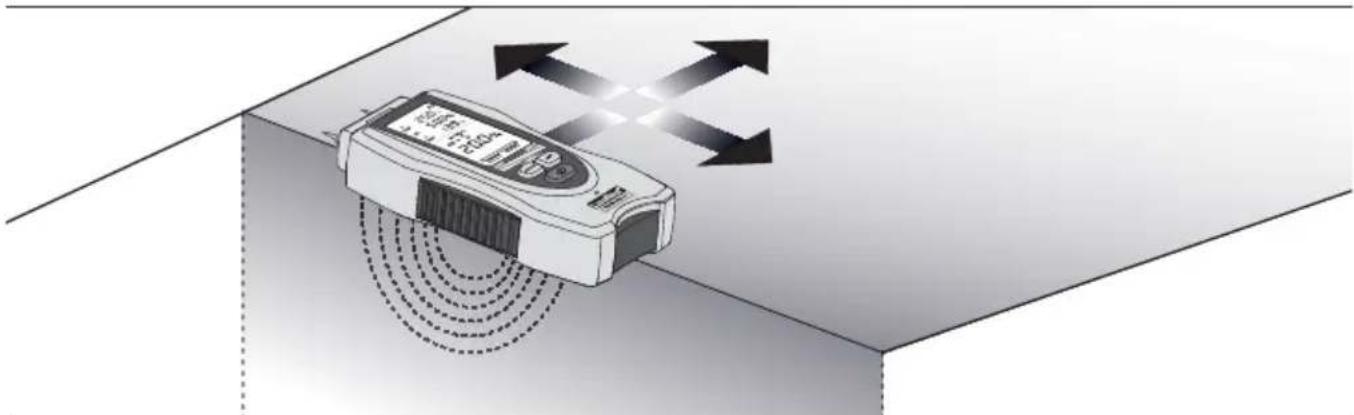
- place the conducting contacts completely on the material to be measured, pressing them down evenly and lightly to achieve good contact
– measured surface should be free of dust and dirt - keep at least a 5 cm distance from metal objects
– metal pipes, electric lines and reinforcing steel can falsify measurement results - make measurements at several locations on the surface
13 Determining material moisture
Due to the differing constitution and composition of materials, specific application notices are to be followed for their moisture assessment:
Wood: The measurement should be made with the length of the device in parallel with the grain of the wood. The measured depth in wood is 30 mm maximum but does vary somewhat with differing wood densities. Measurements made on thin wood boards should, if possible, be made on a stack of these boards as otherwise the measurement will be too low. Measurements made on installed wooden structures are influenced by the structural conditions and their chemical treatments (e.g. paints) with various materials. Thus such measurements should only be viewed relatively. Nevertheless, the differences in moisture distribution are very good for localising moist places as an indication of damage, e.g. in insulation.
Greatest accuracy is reached between 6 % and 30 % material moisture. In very dry wood (< 6 %) irregular moisture distribution can be detected, in very wet wood (> 30 %) saturation of the wood fibres begins. Material relative moisture reference values, in %, for use with wood:
- Outdoor usage: 12 % ... 19 %
- Use in unheated rooms: 12% ... 16%
- In heated rooms (12 °C ... 21 °C): 9 % ... 13 %
- In heated rooms (> 21 °C): 6 % ... 10 %
Example: 100% material moisture for 1 kg of wet wood = 500 g water.
14 Index mode
Index mode is used to rapidly locate moisture with comparative measurements, without a direct output of material moisture in %. The output value (0 through 1000) is an indexed value that increases as material moisture becomes greater. Measurements made in index mode are independent of material type and particularly useful with materials for which no characteristics are stored. When comparative measurements reveal strongly deviating values, the course of moisture in the material can be localized quickly.
Index mode can be used in both resistance measurement as well as in capacitive measurement. See Step 6 and 10 for setting index mode.
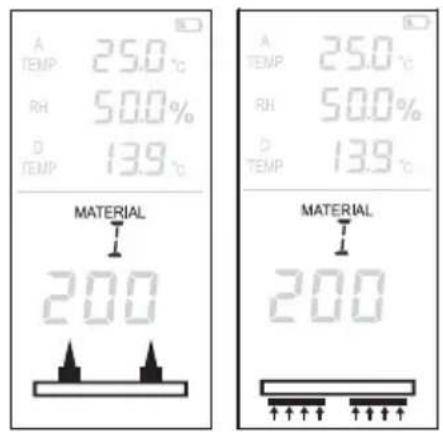
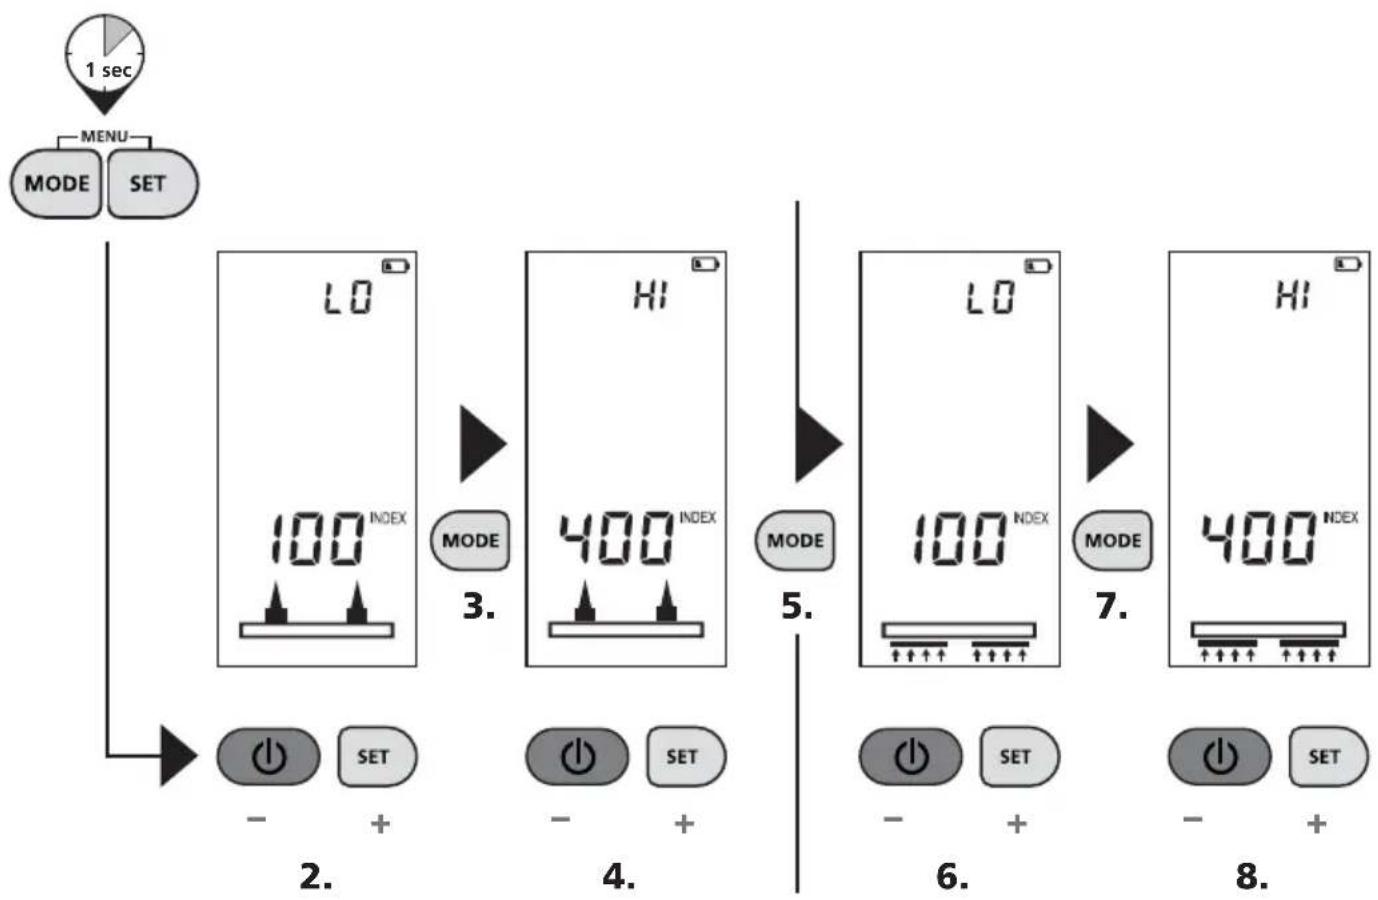
15 Setting the wet/dry threshold values in index mode
The wet/dry LED indicator is programmed in line with the relevant material characteristics so the LEDs also provide information about whether the material should be classified as dry, moist or wet. However the values in index mode, which is independent of the material type, are output on a neutral scale whose value increases as the moisture level rises. The LED indicator can be specifically programmed for index mode by defining the end values for "dry" and "wet". The difference between the value set for "dry" and that set for "wet" is converted and displayed by the 12 LEDs.
flowchart
graph TD
    A["1 sec"] --> B["MENU"]
    B --> C["MODE"]
    B --> D["SET"]
    C --> E["2."]
    D --> F["3."]
    E --> G["4."]
    F --> H["5."]
    G --> I["6."]
    H --> J["7."]
    I --> K["8."]
    J --> L["9."]
16 Wet/dry LED indicator
In addition to numeric measurement display in % of relative material moisture, the LED display also provides a material-dependent evaluation of moisture. The LED display bar becomes larger, from left to right, with increasing moisture content. The 12-position LED display is subdivided into 4 green (dry), 3 yellow (moist) and 5 red (wet) segments. Wet material causes an additional acoustic signal.
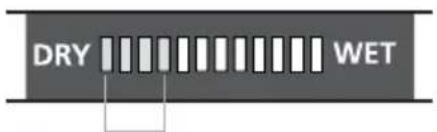
Green = dry Yellow = moist Red = wet
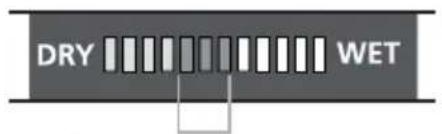
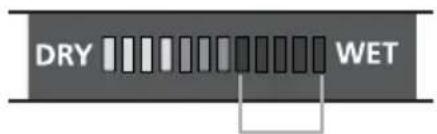
The classification „dry“ means that materials in a heated room have reached a balanced moisture level and are thus suitable for further processing.
17 Material temperature compensation
Relative material moisture is dependent on the temperature of the material. The device automatically compensates different material temperatures in that it measures ambient temperature and uses this measurement for its internal calculation.
However, the measuring device also offers an option for setting the temperature manually to increase measuring accuracy. This value is not stored and must be set again each time the device is switched on.
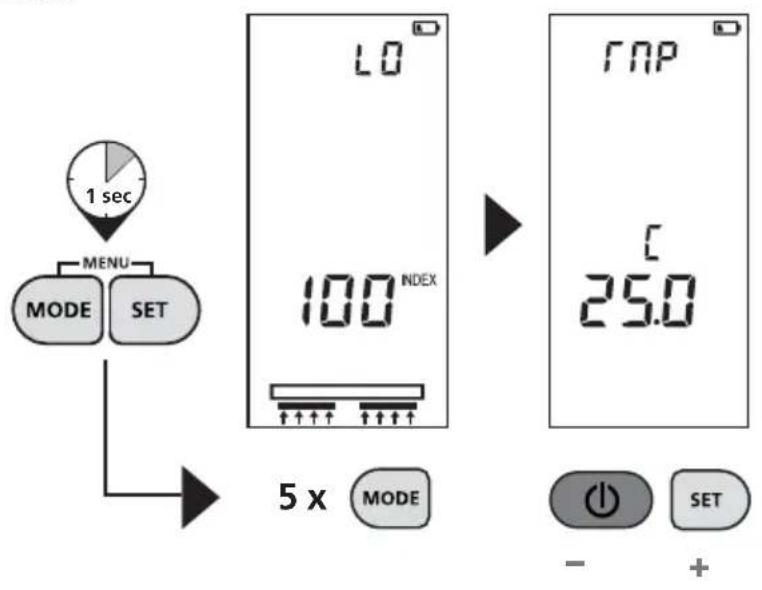
flowchart
graph TD
    A["1 sec"] --> B["MODE"]
    B --> C["MENU"]
    C --> D["SET"]
    D --> E["5 x MODE"]
    E --> F["L0"]
    F --> G["100 INDEX"]
    G --> H["↑↑↑↑ ↑↑↑↑"]
    H --> I["↑↑↑↑ ↑↑↑↑"]
    I --> J["→"]
    J --> K["RAP"]
    K --> L["25.0"]
    L --> M["+"]
    M --> N["SET"]
    N --> O["-"]
18 Temperature units of measure setting
The units of measure for ambient temperature and material compensation can be set to either ^ C or ^ F. The setting is stored and remains in effect until it is changed manually.
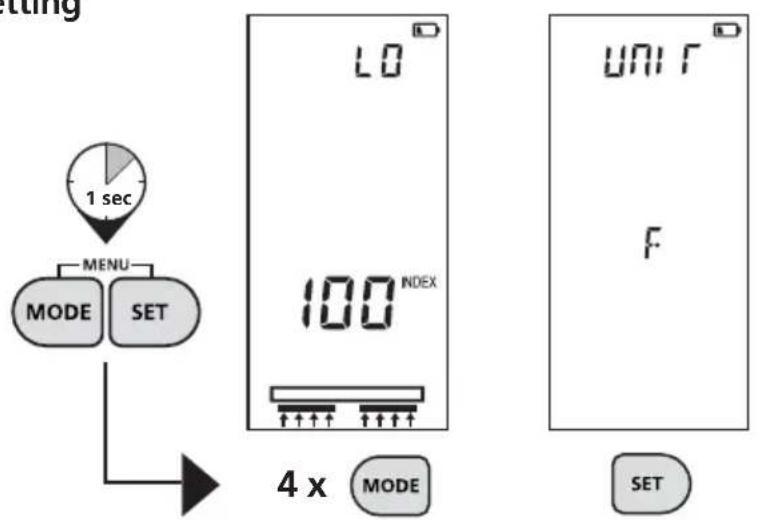
flowchart
graph TD
    A["1 sec"] --> B["MENU"]
    B --> C["MODE"]
    B --> D["SET"]
    C --> E["4 x MODE"]
    D --> E
    E --> F["UNIT"]
    F --> G["F"]
    G --> H["SET"]
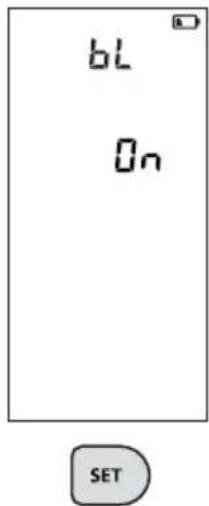
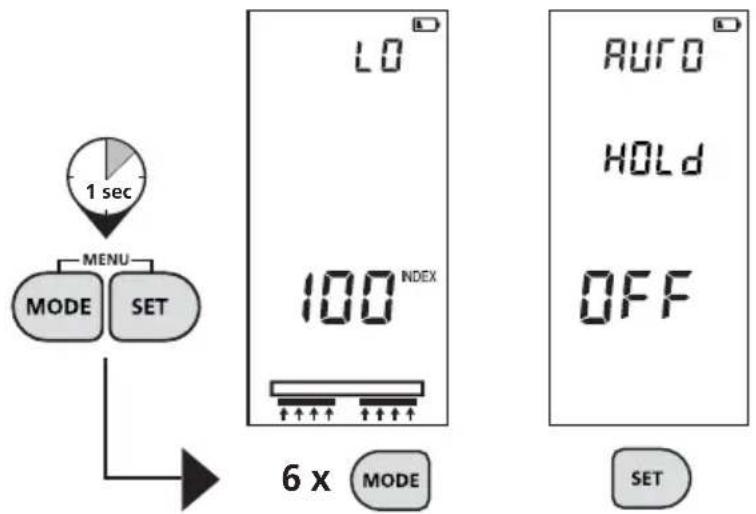
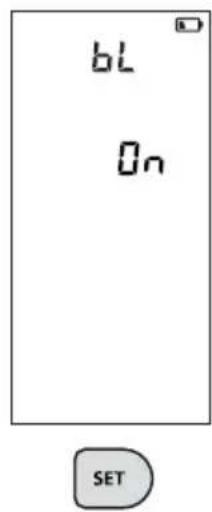
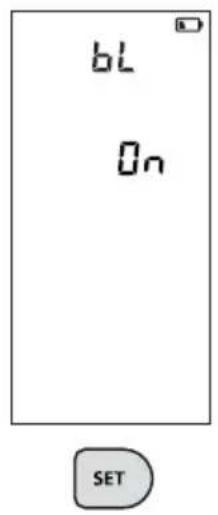
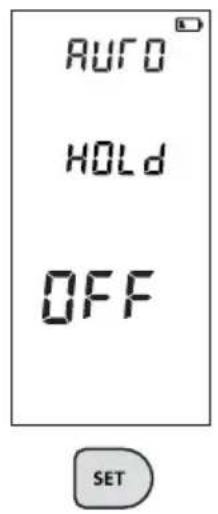
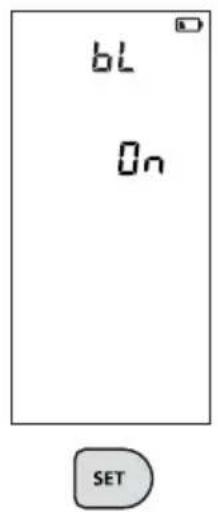
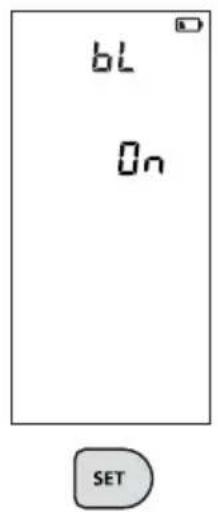
19 LCD backlight
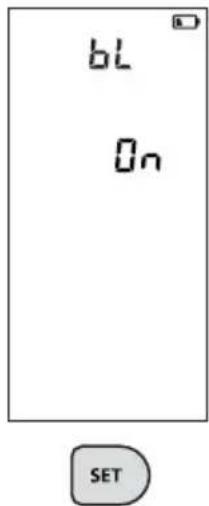
LED display illumination can be varied with 3 different settings:
AUTO: Display illumination switches off during periods of inactivity and switches on again automatically for measurement procedures.
ON: Display illumination remains on permanently.
OFF: Display illumination remains off permanently.
The setting is stored and remains in effect until it is changed manually.
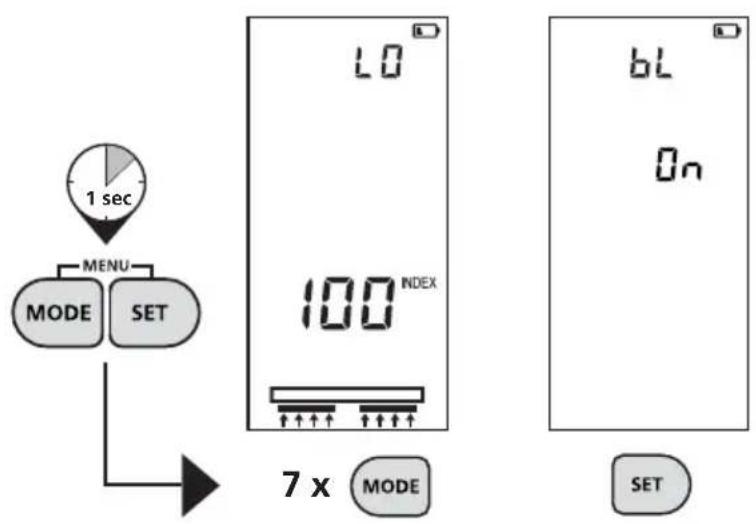
flowchart
graph TD
    A["1 sec"] --> B["MENU"]
    B --> C["MODE"]
    B --> D["SET"]
    D --> E["7 x MODE"]
    F["100 INDEX"] --> G["Display Display"]
    H["7x MODE"] --> I["Display Display"]
    J["6L On"] --> K["Display Display"]
    L["SET"] --> M["Display Display"]
20 Auto-Hold function
The last measurement value will continue to display for about 5 seconds after removing the device from the measured material. During this period the LEDs will blink and show the last measurement value.
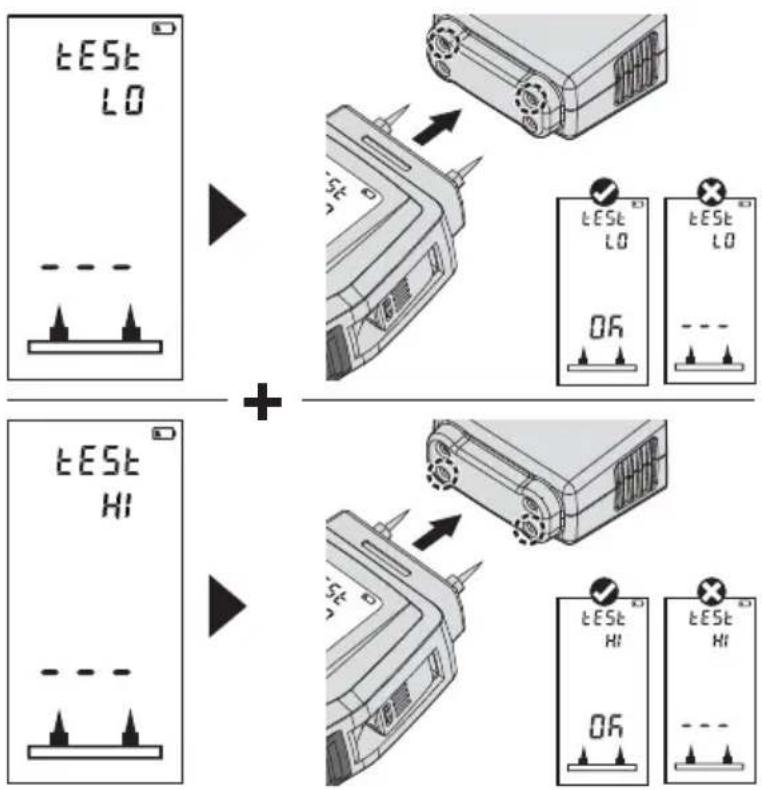
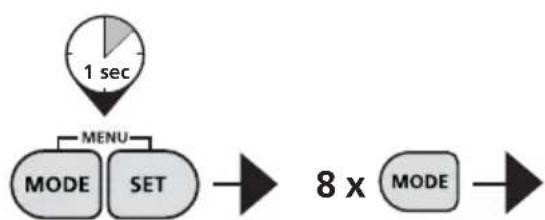
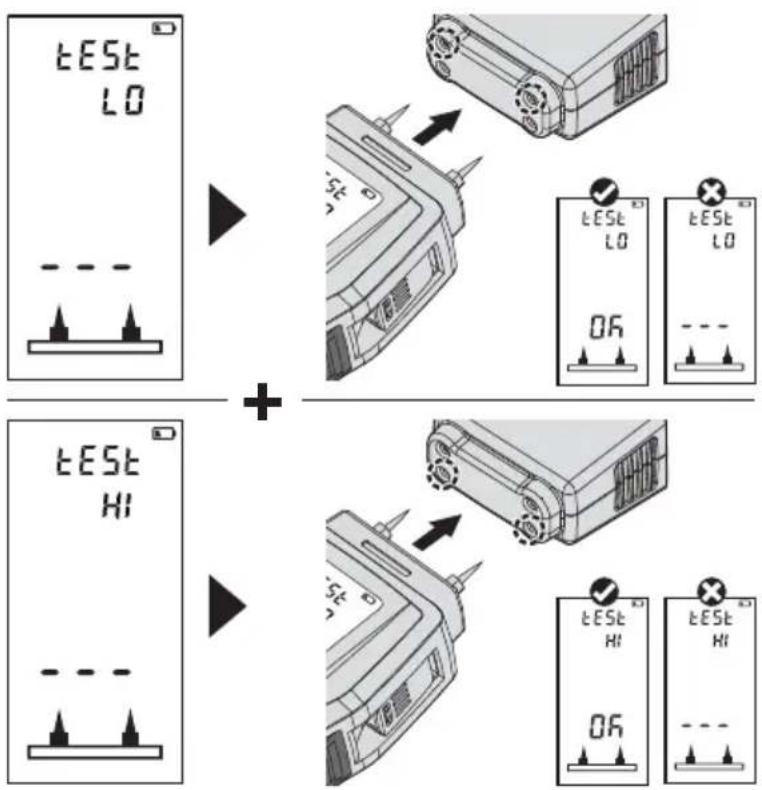
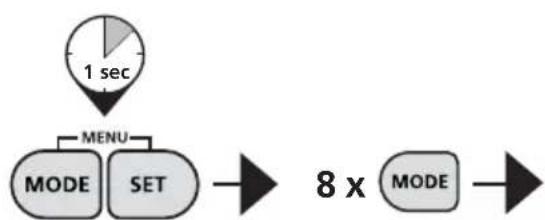
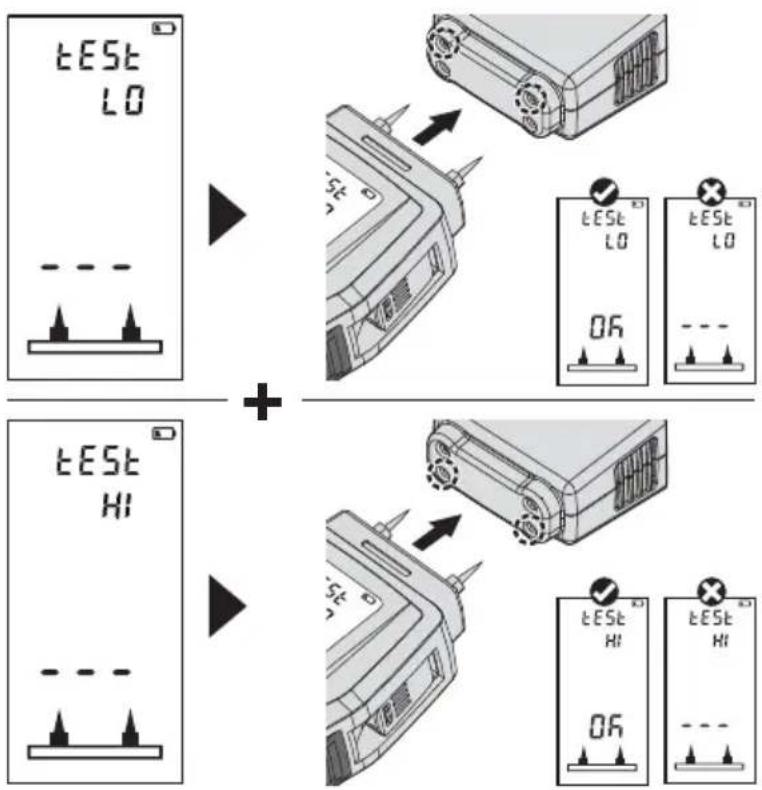
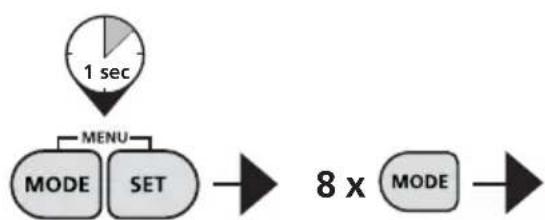
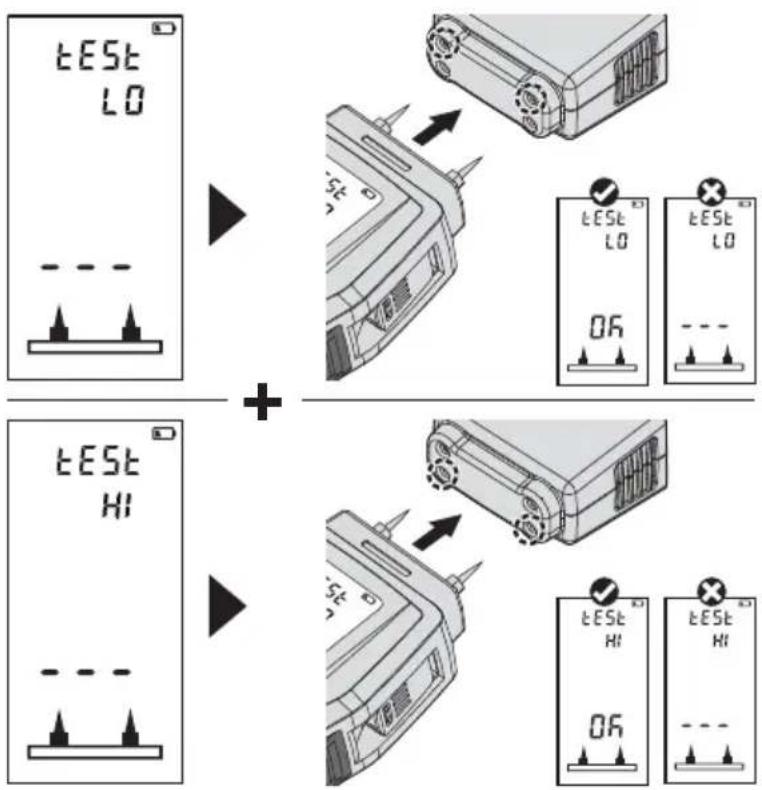
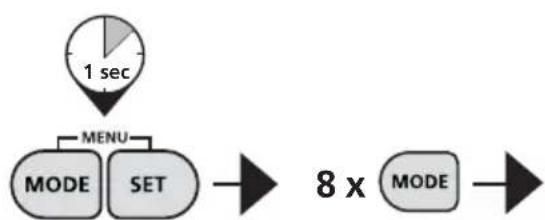
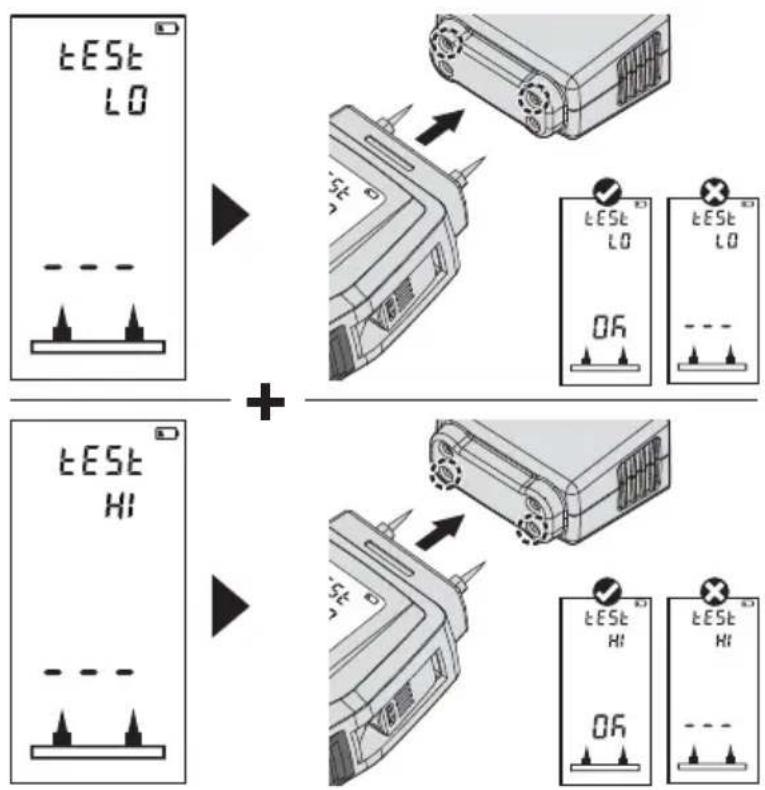
21 Self-test function
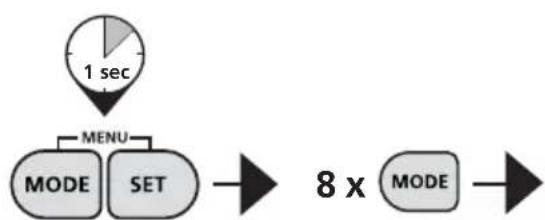
flowchart
graph LR
    A["1 sec"] --> B["MODE"]
    A --> C["SET"]
    B --> D["8 x MODE"]
    C --> D
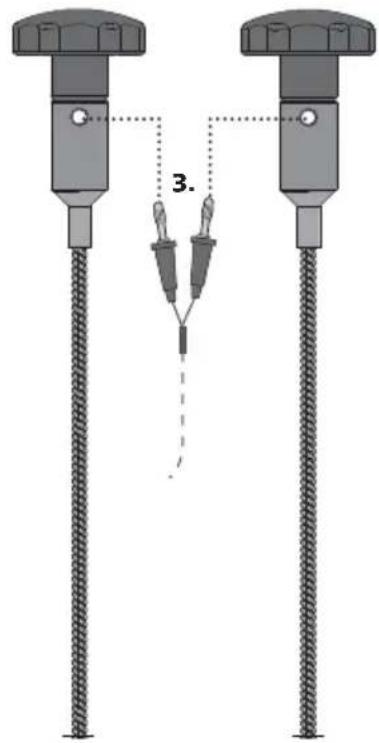
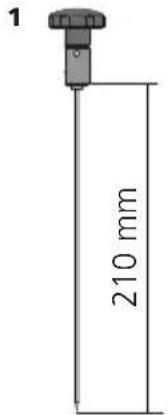
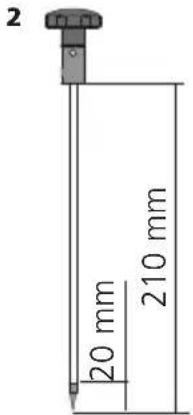
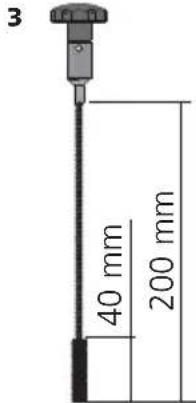
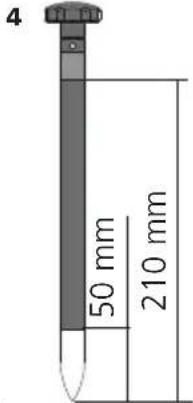
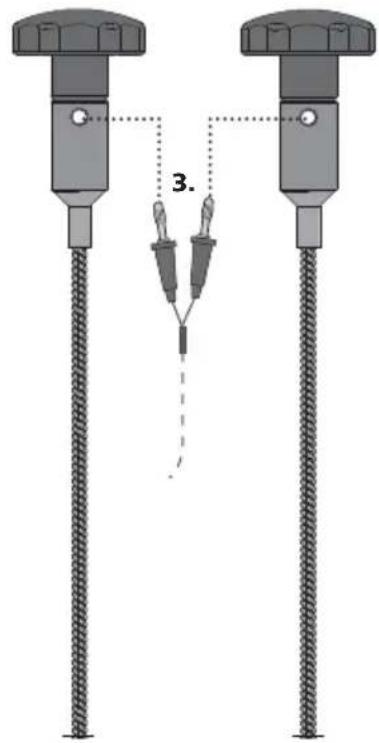
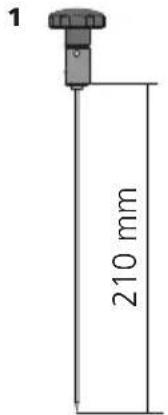
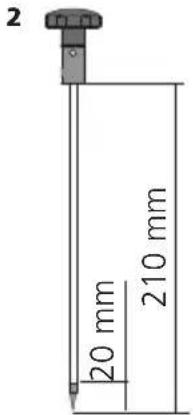
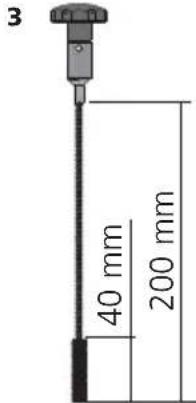
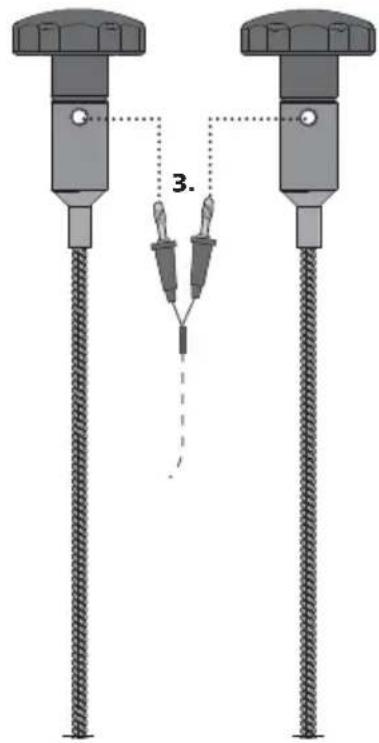
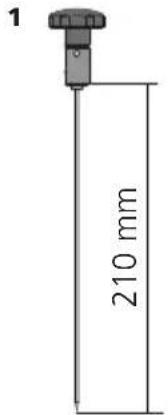
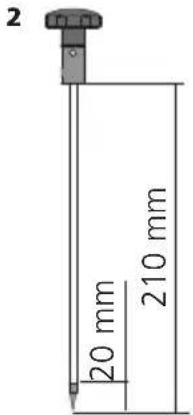
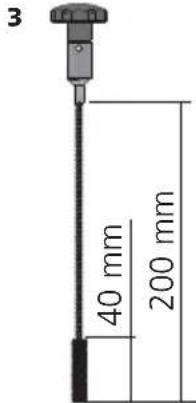
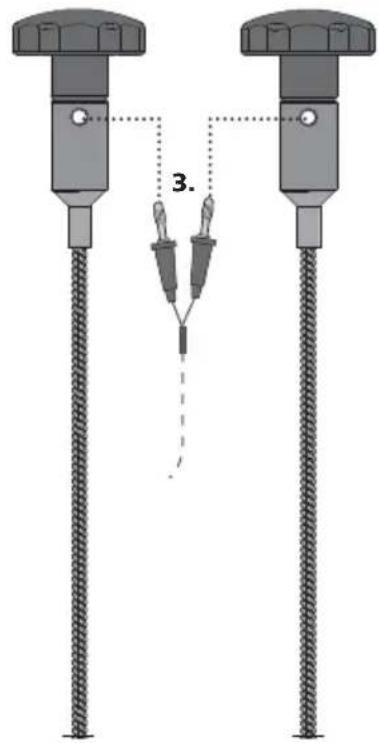
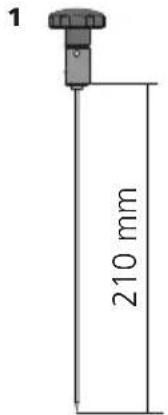
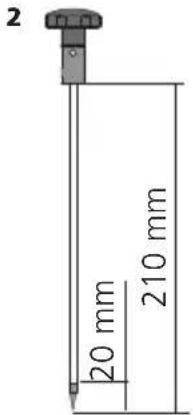
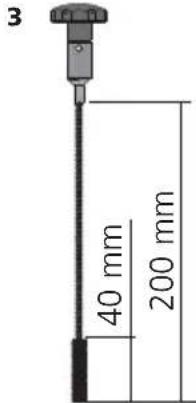
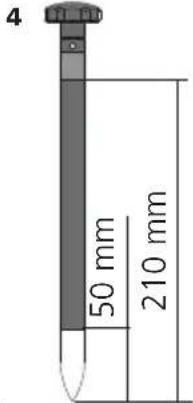
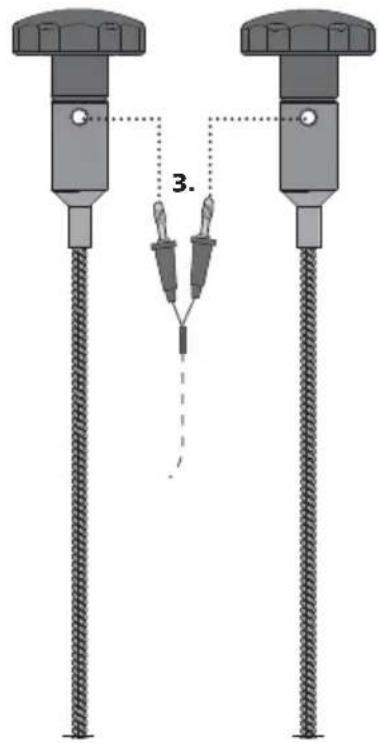
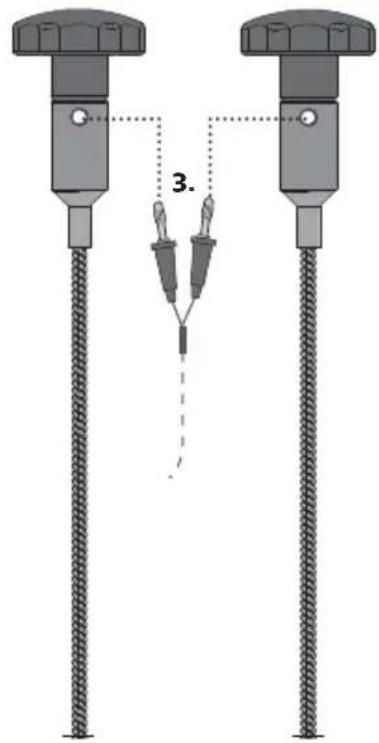
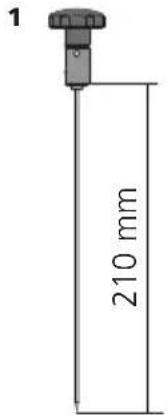
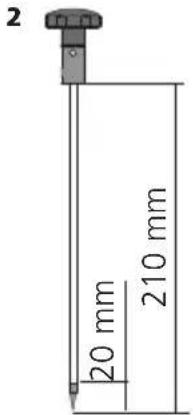
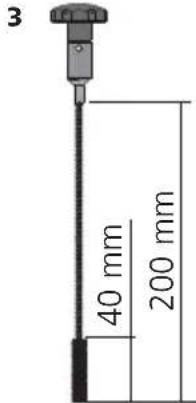
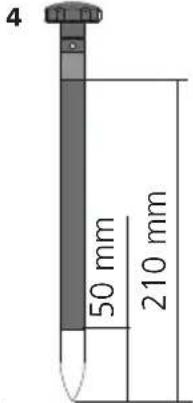
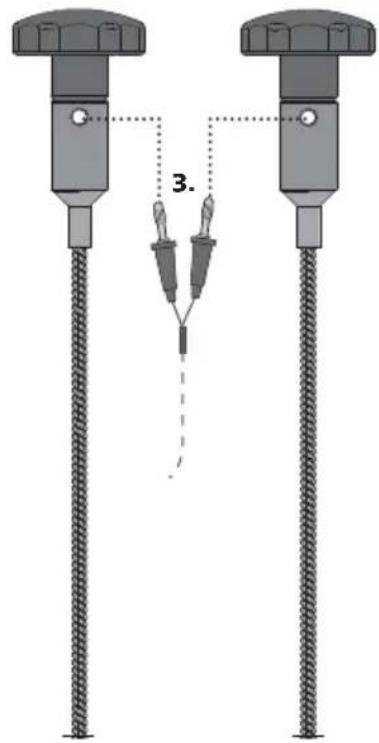
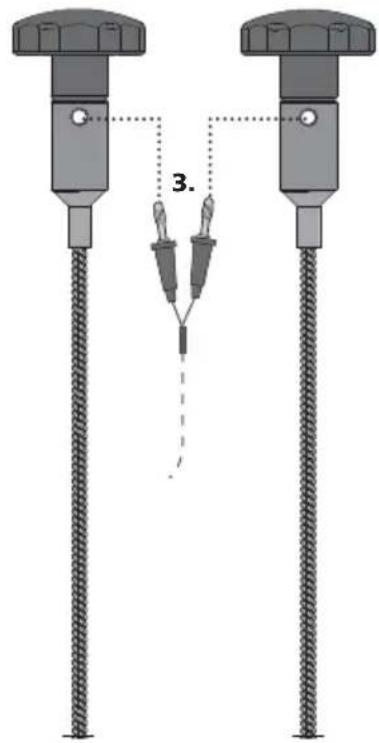
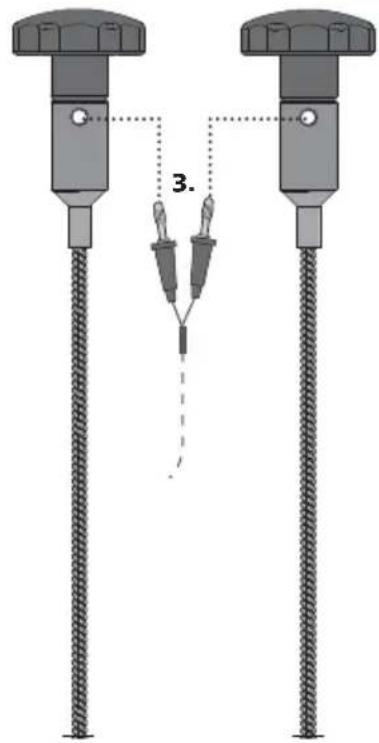
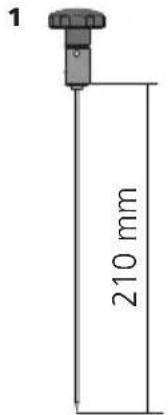
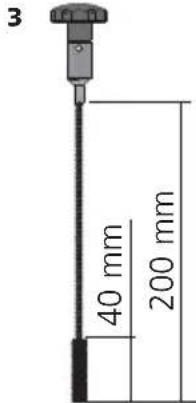
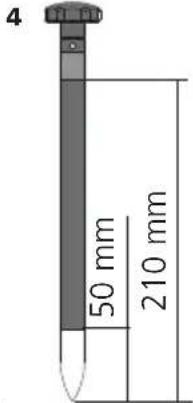
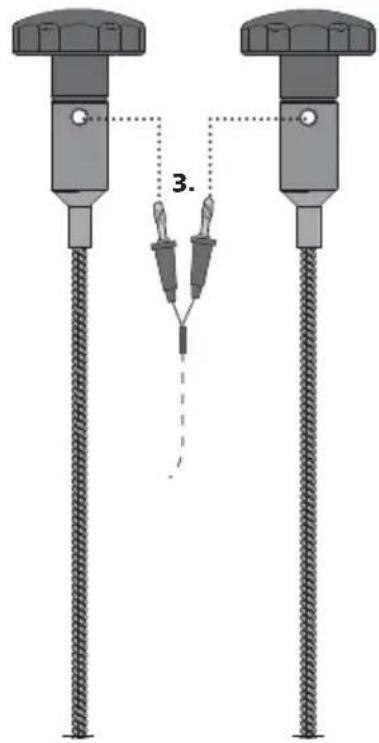
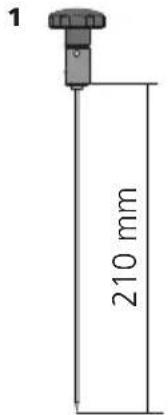
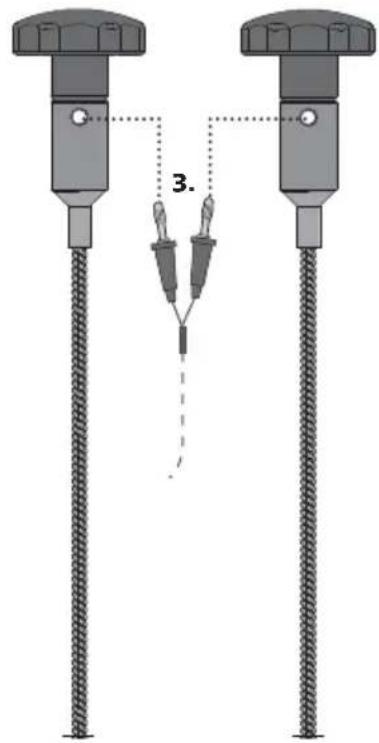
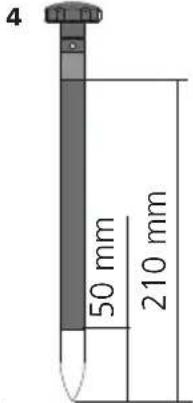
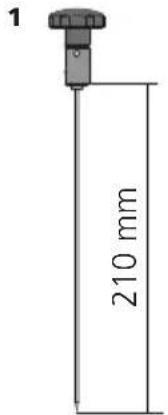
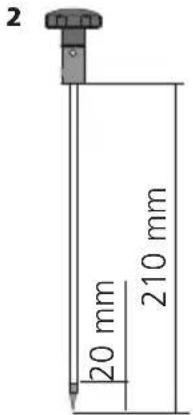
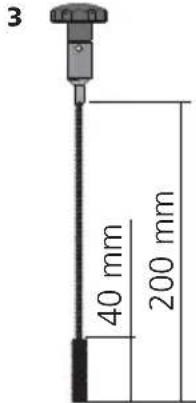
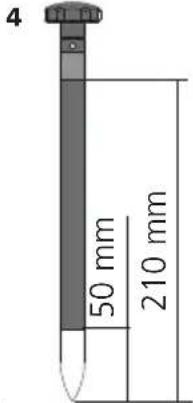
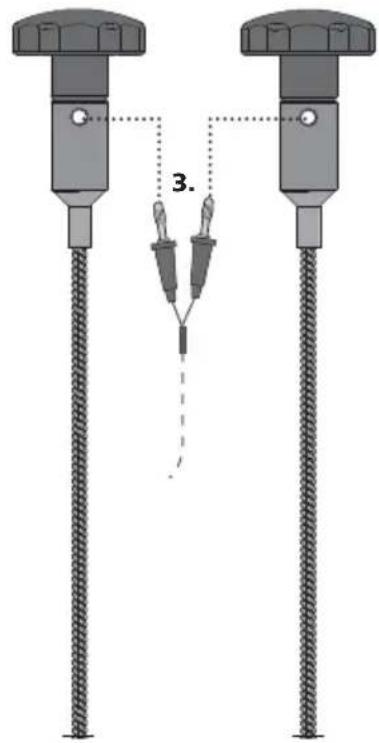
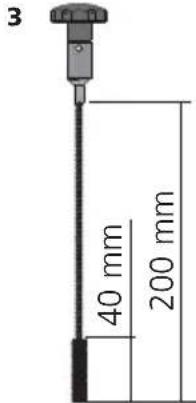
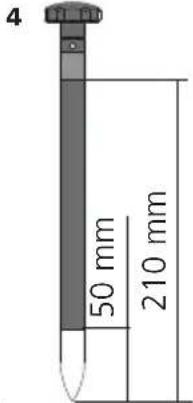
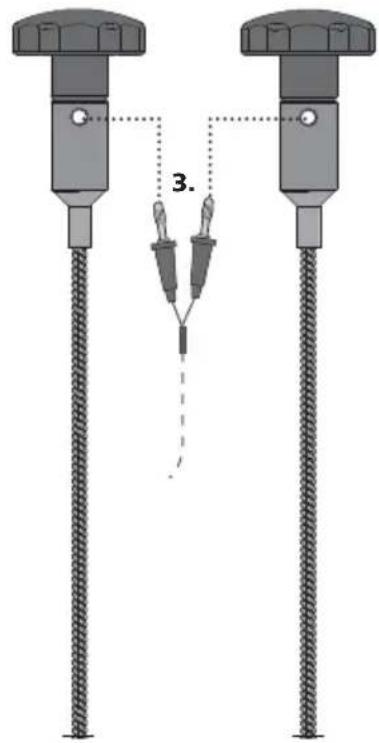
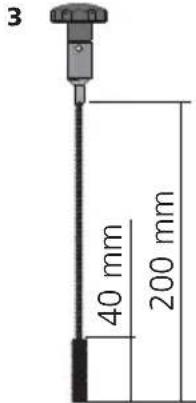
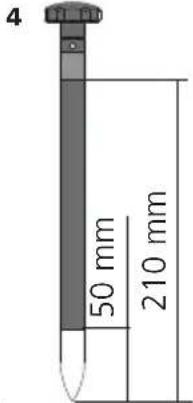
22 Connecting deep electrodes with connecting cable (Art.-Nr. 082.026A)
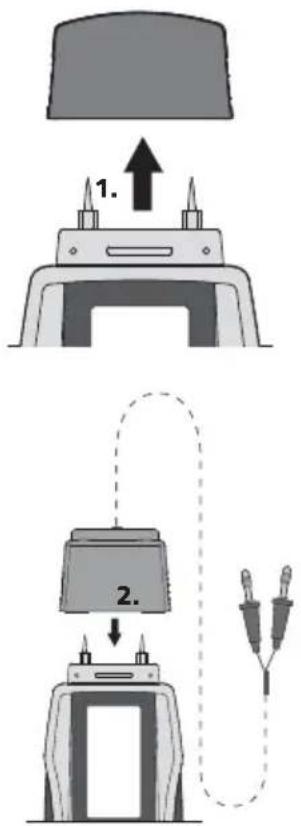

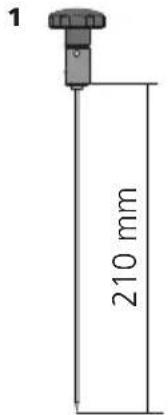
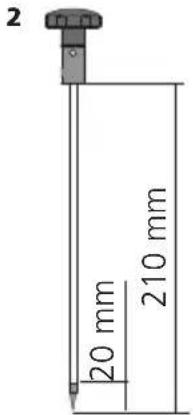
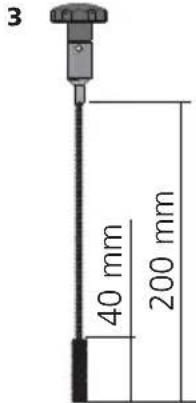
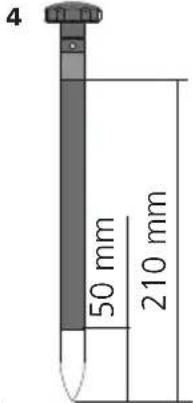
Use of deep electrodes
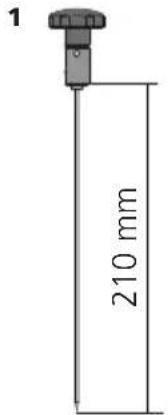
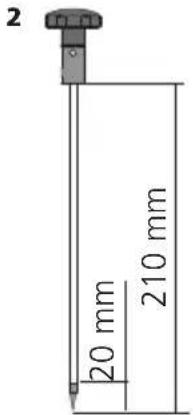
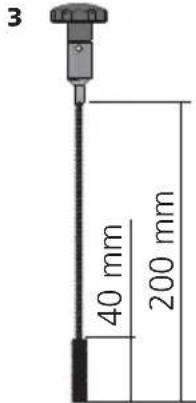
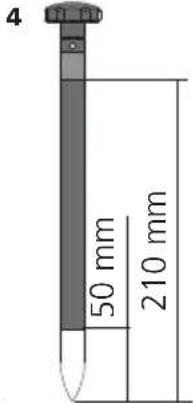
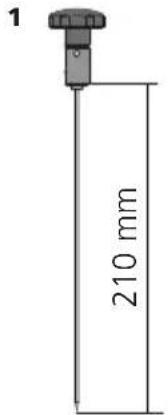
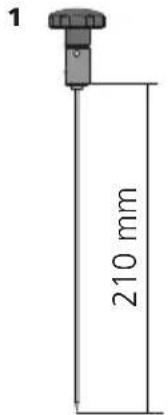
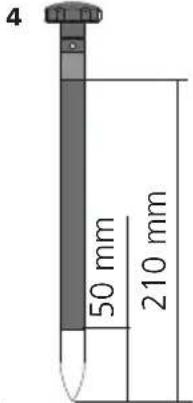
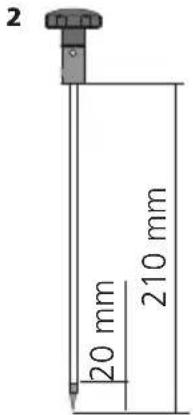
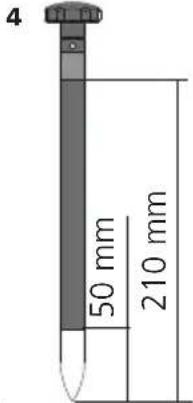
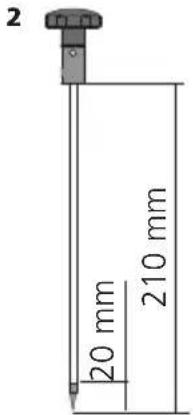
- Round deep-insertion electrode (non-insulated, 2 mm)
for moisture measurements in building and insulating materials or between joints or joint intersections.
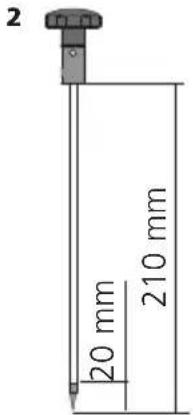
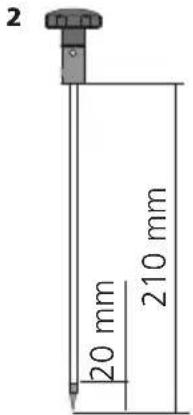
- Round deep-insertion electrode (insulated, ø 4 mm)
for moisture measurement in the concealed structure levels of multi-layer wall or ceiling structures.
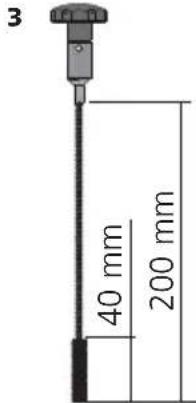
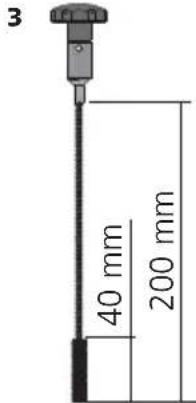
- Brush deep-insertion electrode
for moisture measurement in a homogeneous building material. Contact is established by the brush tip.
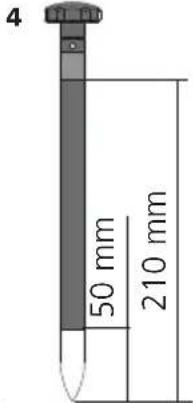
- Flat deep-insertion electrode (insulated, 1 mm flat)
for targeted moisture measurement in the concealed structure levels of multi-layer wall or ceiling structures. Electrodes can, for example, be inserted through edge strips or at the wall-ceiling transition.
Applying deep electrodes
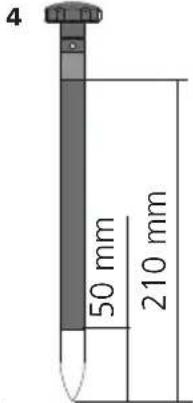
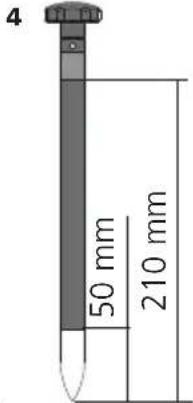
The spacing of bore holes should be between 30 and 50 mm and be 8 mm for brush electrodes. After boring the hole, wait for about 30 minutes to allow moisture driven out of the hole by drilling heat to return to its original value. Otherwise measurement results could be falsified.
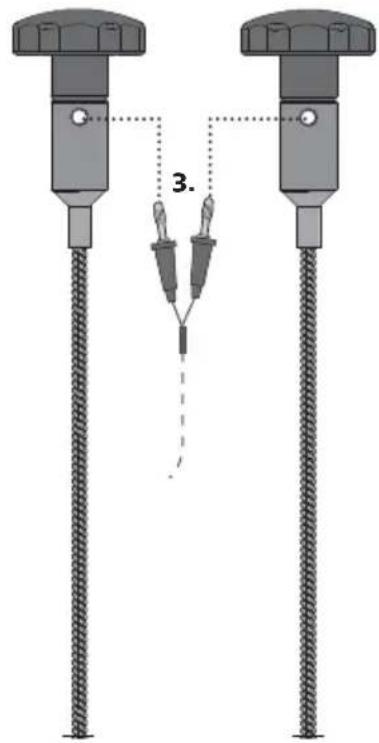
23 Connecting the external hand-held electrode (Art. No. 082.024)
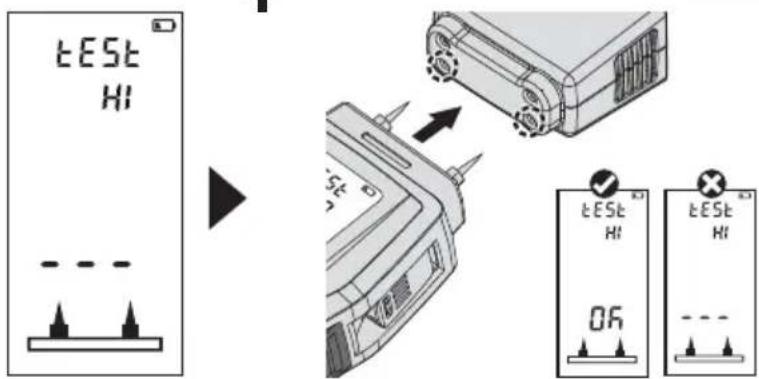
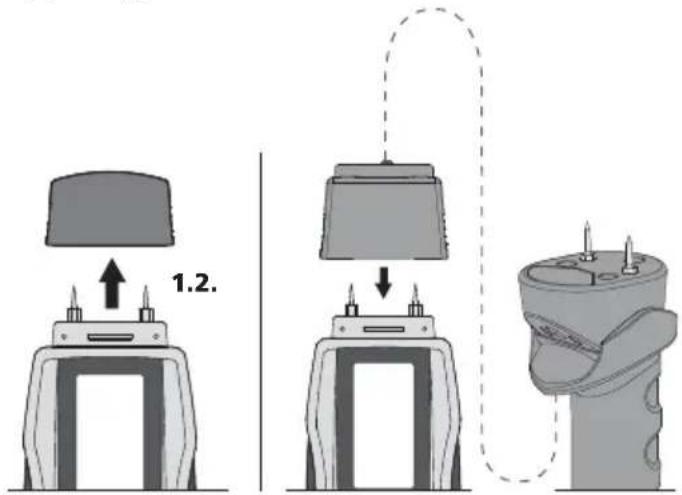
The external hand-held electrode is suitable for all types of wood and soft building materials. The self-test function can also be performed with the external hand-held electrode (see Step 21). Be sure the connecting cap is securely attached to the MultiWet-Master.
When you are not using the hand-held electrode, always keep it stored in its carrying case to prevent injuries from being caused by the electrode spikes.
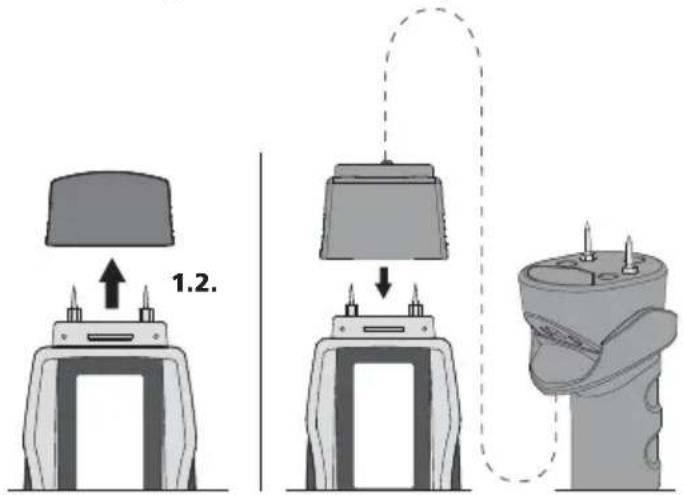
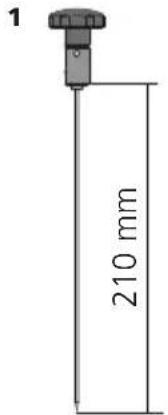
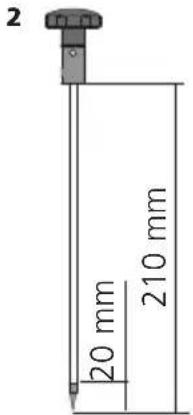
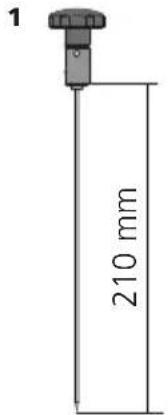
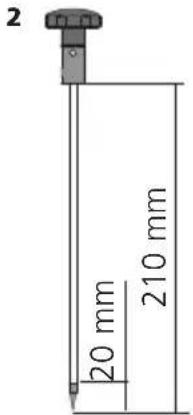
24 Replacing the measuring spikes
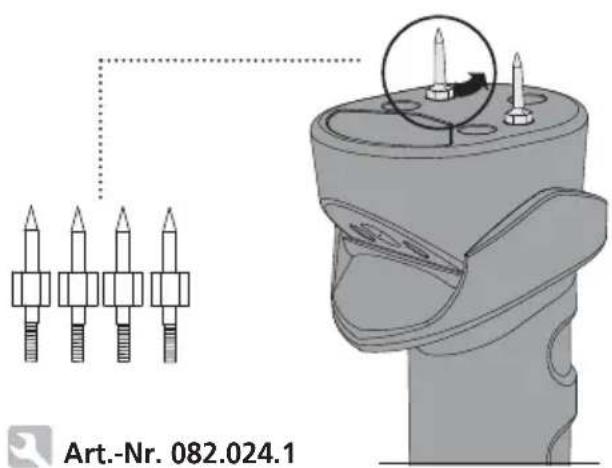
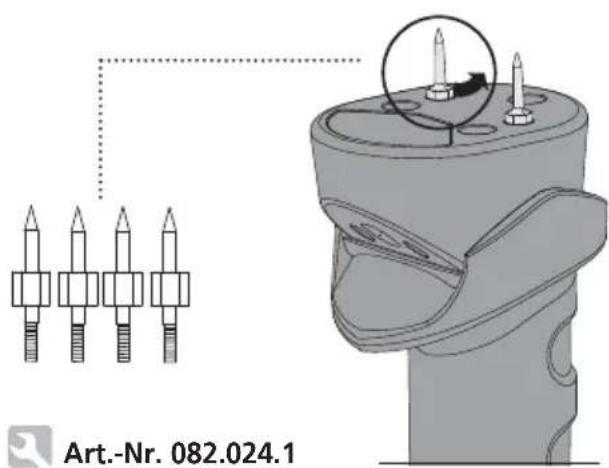
Functional and operational safety is only warranted when the instrument is operated within the specified climatic conditions and is only used for those purposes for which it is designed. The assessment of measurement results and actions taken as a consequence lie in the user's scope of responsibility, depending on the given type of work.
| Technical data | |
| Room climate measurement | |
| Measuring range / accuracy, ambient temperature -10 °C . | 60 °C/± 2 °C |
| Measuring range / accuracy, relative humidity 20 % ... 90 % | rH/±3 % |
| Dew point display -20 °C ... 60 °C | |
| Relative humidity resolution ±1 % | |
| Dew point resolution 1 °C | |
| Resistance measurement | |
| Measuring principle Material moisture measurement via integrated electrodes; 3 wood groups, 19 building materials, index mode, self-test function | |
| Measuring range / accuracy Wood: | 0...30 %/±1 %, 30...60 %/±2 %, 60...90 %/±4 %Other materials: ±0.5 % |
| Capacitive measurement | |
| Measuring principle Capacitive measurement via integrated rubber electrodes | |
| Measuring range / accuracy Softwood: | 0 %...52 %/±2 % (6 %...30 %)Hardwood:0 %...32 %/±2 % (6 %...30 %) |
| Operating temperature 0 °C ... 40 °C | |
| Storage temperature -20 °C ... 70 °C | |
| Power supply Type 9V E Block Type 6LR22 | |
| Weight 185 g | |
Technical revisions reserved. 10.11
EU directives and disposal
This device complies with all necessary standards for the free movement of goods within the EU.
This product is an electric device and must be collected separately for disposal according to the European Directive on waste electrical and electronic equipment.
Further safety and supplementary notices at: www.laserliner.com/info
8...12 leds rood = nat
natural_image
Diagram of a mechanical device with a handle and arrow indicating rotation (no text or symbols)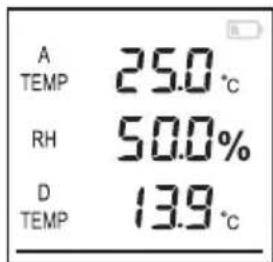
Hout
21 Zelftestfunctie
flowchart
graph LR
    A["1 sec"] --> B["MODE"]
    A --> C["SET"]
    B --> D["8 x MODE"]
    C --> D
natural_image
Diagram of a mechanical device with a handle and arrow indicating motion (no text or symbols)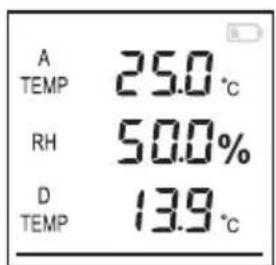
flowchart
graph LR
    A["MODE"] --> B["40.0%"]
    B --> C["MODE"]
natural_image
Illustration of a mobile phone with a digital display showing temperature reading, placed on a textured surface (no text or symbols visible)Træ
natural_image
Diagram of a mechanical device with a handle and arrow indicating motion (no text or symbols)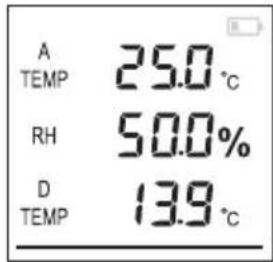
flowchart
graph LR
    A["MODE"] --> B["40.0%"]
    B --> C["MODE"]
Bois
natural_image
Diagram of a mechanical device with a handle and arrow indicating rotation (no text or symbols)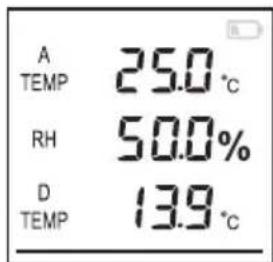
flowchart
graph LR
    A["MODE"] --> B["40.0%"]
    B --> C["MODE"]
Madera
21 Función autotest
flowchart
graph LR
    A["1 sec"] --> B["MODE"]
    A --> C["SET"]
    B --> D["8 x MODE"]
    C --> D
natural_image
Diagram of a mechanical device with two upright pins and an arrow indicating rotation (no text or symbols)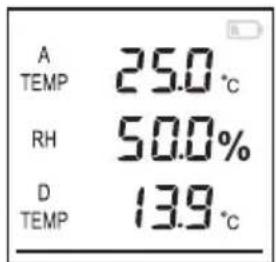
Legno
natural_image
Diagram of a mechanical device with two upright pins and an arrow indicating rotation (no text or symbols)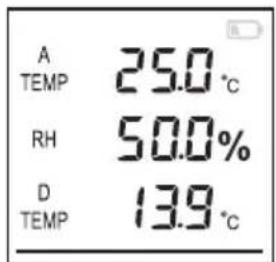
Drewno
natural_image
Diagram of a mechanical device with two upright pins and an arrow indicating rotation (no text or symbols)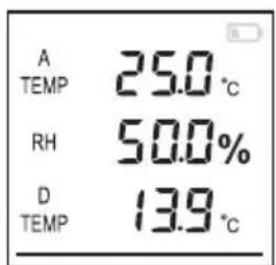
Puu
12 Käyttöohjeet
natural_image
Diagram of a mechanical device with a handle and arrow indicating motion (no text or symbols)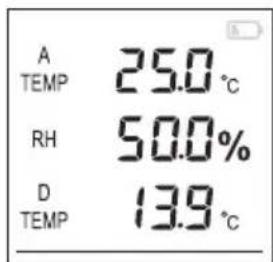
flowchart
graph LR
    A["MODE"] --> B["40.0%"]
    B --> C["MODE"]
Madeira
20 Função Auto-Hold
natural_image
Diagram of a mechanical device with a handle and arrow indicating motion (no text or symbols)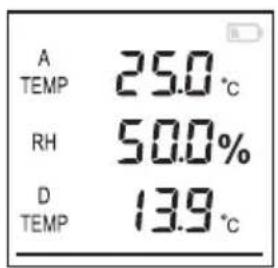
flowchart
graph LR
    A["MODE"] --> B["40.0%"]
    B --> C["MODE"]
Trä
21 Egentestfunktion
flowchart
graph LR
    A["1 sec"] --> B["MODE"]
    A --> C["SET"]
    B --> D["8 x MODE"]
    C --> D
natural_image
Diagram of a mechanical device with a handle and base, showing no text or symbols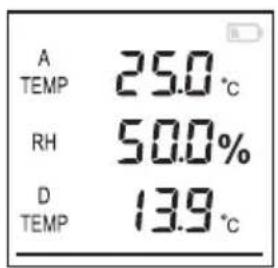
flowchart
graph LR
    A["MODE"] --> B["40.0%"]
    B --> C["MODE"]
6 Motstandsmåling / velge materiale
Tre
10 Kapasitiv måling / velge materiale
19 LCD - Backlight
For LED-belysningen kan det foretas
5...7 LED sari = nemli
natural_image
Diagram of a mechanical device with a handle and arrow indicating motion (no text or symbols)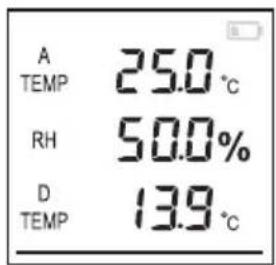
flowchart
graph LR
    A["MODE"] --> B["40.0%"]
    B --> C["MODE"]
Ağaç
natural_image
Technical illustration of a mechanical component with four cylindrical pins and a circular feature, shown alongside a detailed view (no text or symbols on the diagram itself)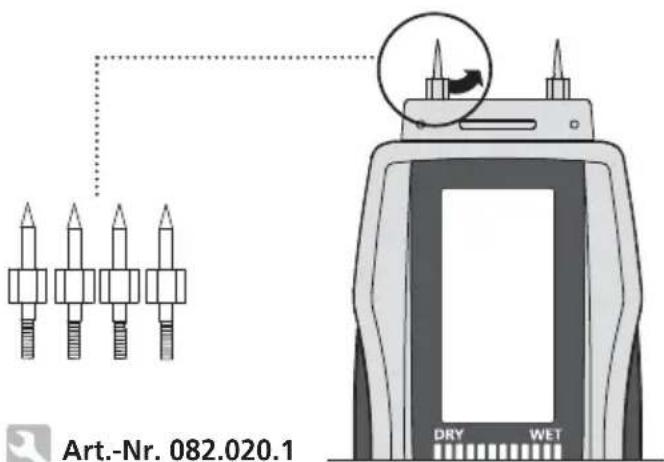
natural_image
Diagram of a spray gun with nozzle and handle, showing airflow direction (no text or symbols)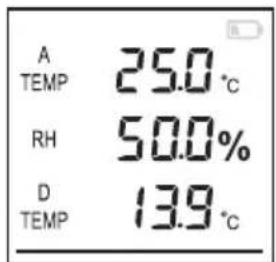
flowchart
graph LR
    A["MODE"] --> B["40.0%"]
    B --> C["MODE"]
Древесина

natural_image
Diagram of a mechanical device with a handle and arrow indicating motion (no text or symbols)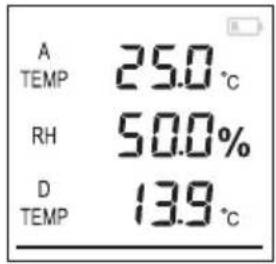
Деревина
natural_image
Diagram of a mechanical device with two protruding pins and a directional arrow indicating motion (no text or symbols)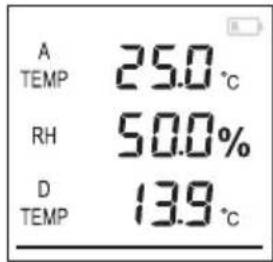
flowchart
graph LR
    A["MODE"] --> B["40.0%"]
    B --> C["MODE"]
Dřevo
20 Funkce Auto Hold

natural_image
Diagram of a mechanical device with a handle and arrow indicating motion (no text or symbols)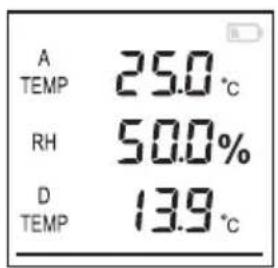
flowchart
graph LR
    A["MODE"] --> B["40.0%"]
    B --> C["MODE"]
Puit
12 Rakendusjuhised

5...7 LED dzelteni = mitrs
8...12 LED sarkani = slapjš
natural_image
Diagram of a mechanical device with a handle and base, showing motion direction (no text or symbols)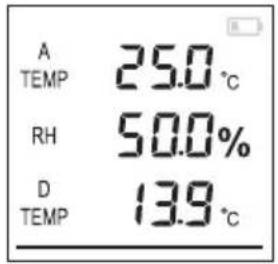

flowchart
graph LR
    A["MODE"] --> B["40.0%"]
    B --> C["MODE"]
natural_image
Illustration of a mobile phone displaying a digital display with arrows pointing to a textured surface (no text or symbols visible)Koksne
Vietai, kurai paredzçts veikt mçrijumus, jâbût neapstrâdâtai, bez zariem, netîrumiem un sveïiem. Nekad nedrikst veikt mçrijumus koksnes galos, jo tajos koks seviðii âtri izpüst un tâdçi var rasties kiûdaini rezultâti. Salîdzinâðanai veic vairâkus mçrijumus. Nogaida, lîdz %-simbols beidz mirgot un deg nepârtraukti. Tikai tad mçrâmãs vçrtîbas ir stabilas.

Dziiinâðanas elektrodu lietojums
- Apaïie, iespraupamie dziiinâðanas elektrodi (neizolçti, ø 2 mm)
paredzçti bûvmateriâlu un izolâcijas materiâlu mitruma mçrîðanai.
- Apaïie, iespraupamie dziiinâðanas elektrodi (izolçti, ø 4 mm)
paredzçti vairâku slâòu sienu un pârklâjumu apslçptu bûvelementu virsmu mitruma precîzai mçrîðanai.
- lespraupamie dziiinâðanas (birstveida) elektrodi
paredzçti homogçnu bûvmateriâlu mitruma mçrîðanai. Saskare rodas ar elektroda birstveida galvu.
- Plakanie, iespraupamie dziiinâðanas elektrodi (izolçti, 1 mm plakani)
paredzçti vairâku slâòu sienu un pârklâjumu apslçptu bûvelementu virsmu mitruma precîzai mçrîðanai.
Elektrodus var pievienot gar mçrâmâ materiâla malu vai sienu pârsedzes elementu pâreju.
Dziiinâðanas elektrodu pielietojums
leteicamais attâlums starp urbumu vietâm ir no 30 lîdz 50 mm, attiecîgi, mçrot ar birstveida elektrodiem, urbumu ø ir 8 mm. Pçc urbõanas caurumu noslçdz un nogaida apm. 30 min., lîdz urbõanas procesâ izmainîjies mitrums atgriepas sâkotnçjâ lîmenî. Pretçjâ gadîjumâ iegûtie mçrijumi var bût neprecîzi.
23 Ârcjo rokas elektrodu (Art.-Nr. 082.024) pieslçgõana
Ârcjo rokas elektrodu lietođana piemçrota visâm koku õiirnçm un mîkstajiem bûvmateriâliem. Paõkontroles funkcija darbojas aî ar ârcjiem rokas elektrodiem (sal. ar 21. darbîbu). Raudzîties, lai savienojuma vâciòõ stabili atrastos uz MultiWet-Master.
Kad rokas elektrodus nelieto, tos glabâ tiem paredzçtajâ somâ, tâdçjâdi izvairoties no ievainojumiem, ko var iegût smailo mçrelektrodu dçi.
24 Smailto elementu nomaiòa
natural_image
Diagram of a mechanical device with a handle and arrow indicating motion (no text or symbols)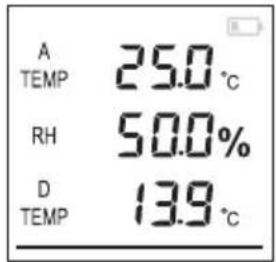
flowchart
graph LR
    A["MODE"] --> B["40.0%"]
    B --> C["MODE"]
Mediena
21 Savikontrolès funkcija
flowchart
graph LR
    A["1 sec"] --> B["MODE"]
    A --> C["SET"]
    B --> D["8 x MODE"]
    C --> D

8...12 leduri roşu = ud
natural_image
Diagram of a mechanical device with two upright pins and an arrow indicating motion (no text or symbols)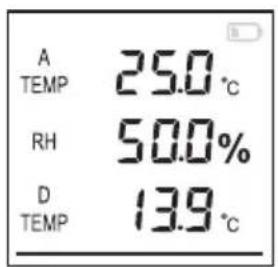

Lemn
natural_image
Diagram of a mechanical device with a handle and internal components, showing motion direction (no text or symbols)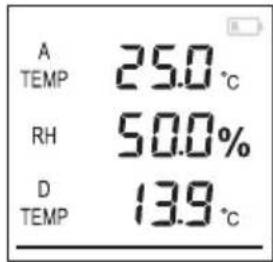

flowchart
graph LR
    A["MODE"] --> B["40.0%"]
    B --> C["MODE"]
Дърво
12 Указания за употреба
19 LCD – фоново осветление
natural_image
Diagram of a mechanical device with a handle and base, showing no text or symbols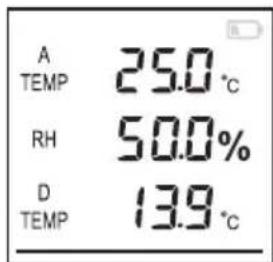
Εύλο
SERVICE


Umarex GmbH & Co KG
- Laserliner -
- Raumklima-Messung
- Holz
- Function / Application
- Wet/dry LED display
- Room climate measurement
- Relative humidity
- Dew point temperature
- Measuring mode selection
- Resistance measurement / material selection
- Material table - resistance measurement
- Resistance measurement / material moisture measurement
- Mineral building materials
- Wood
- Capacitive measurement / material selection
- Material table - capacitive measurement
- Application notices
- Determining material moisture
- Index mode
- Setting the wet/dry threshold values in index mode
- Wet/dry LED indicator
- Material temperature compensation
- Temperature units of measure setting
- LCD backlight
- Auto-Hold function
- Self-test function
- Connecting deep electrodes with connecting cable (Art.-Nr. 082.026A)
- Use of deep electrodes
- Applying deep electrodes
- Connecting the external hand-held electrode (Art. No. 082.024)
- Replacing the measuring spikes
- EU directives and disposal
- Hout
- Zelftestfunctie
- Træ
- Bois
- Madera
- Función autotest
- Legno
- Drewno
- Puu
- Käyttöohjeet
- Madeira
- Função Auto-Hold
- Trä
- Egentestfunktion
- Motstandsmåling / velge materiale
- Tre
- Kapasitiv måling / velge materiale
- LCD - Backlight
- Ağaç
- Древесина
- Деревина
- Dřevo
- Funkce Auto Hold
- Puit
- Rakendusjuhised
- Koksne
- Dziiinâðanas elektrodu lietojums
- Dziiinâðanas elektrodu pielietojums
- Ârcjo rokas elektrodu (Art.-Nr. 082.024) pieslçgõana
- Smailto elementu nomaiòa
- Mediena
- Savikontrolès funkcija
- Lemn
- Дърво
- Указания за употреба
- LCD – фоново осветление
- Εύλο
- SERVICE
- Umarex GmbH & Co KG
Brand : Laserliner
Model : MultiWetMaster
Category : Measuring equipment