ML2420 - TV Vevor - Free user manual and instructions
Find the device manual for free ML2420 Vevor in PDF.

| Product Type | MPPT Solar Charge Controller |
| Brand | Vevor |
| Model | ML2420 |
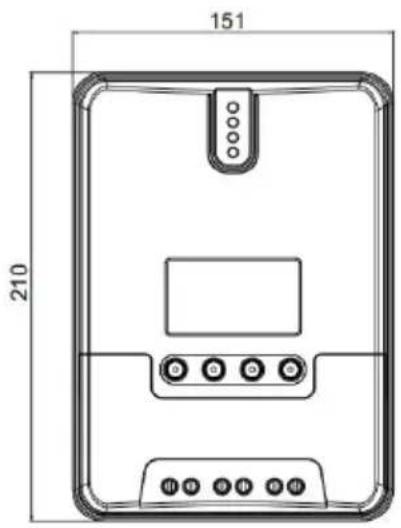
| Dimensions (L x W x H) | 210 x 151 x 59.5 mm |
| Weight | 1.4 kg |
| System Voltage | 12 V / 24 V automatic |
| Rated Charging Current | 20 A |
| Max. PV Input Voltage | 100 V (25 °C) / 90 V (-25 °C) |
| Max. PV Power | 260 W (12 V) / 520 W (24 V) |
| Conversion Efficiency | ≤ 98% |
| MPPT Tracking Efficiency | Up to 99.9% |
| Idle Consumption | 0.7 W to 1.2 W |
| Supported Battery Types | Sealed lead-acid, gel, open, lithium, user |
| Display | LCD screen + 4 LED indicators |
| Communication | RS232 / RS485 (Modbus protocol) |
| Protection Functions | Polarity reversal, overvoltage, short circuit, overheating, TVS lightning |
| Protection Rating | IP32 |
| Operating Temperature | -35 °C to 45 °C |
| Max. Altitude | 3000 m |
| Recommended Maintenance | Biannual inspection, heatsink cleaning, connection check |
| Spare Parts | Recommended fuse/circuit breaker (not included) |
| Warranty | Technical support via www.vevor.com/support |
Frequently Asked Questions - ML2420 Vevor
User questions about ML2420 Vevor
0 question about this device. Answer the ones you know or ask your own.
Ask a new question about this device
Download the instructions for your TV in PDF format for free! Find your manual ML2420 - Vevor and take your electronic device back in hand. On this page are published all the documents necessary for the use of your device. ML2420 by Vevor.
USER MANUAL ML2420 Vevor
ML MAXIMUM POWEF POINT TRACKING (MPPT
MODEL:ML2420

NEED HELP? CONTACT US!
Have product questions? Need technical support? Please feel fr contact us:
Technical Support and E-Warranty Certificate www.vevor.com/support
This is the original instruction, please read all manual instruction carefully before operating. VEVOR reserves a clear interpretation user manual. The appearance of the product shall be subject to product you received. Please forgive us that we won't inform you there are any technology or software updates on our product.
 | Warning-To reduce the risk of injury, user must read instructions manual carefully. |
 | This device complies with Part 15 of the FCC Rules. Operat subject to the following two conditions:(1)This device may not harmful interference, and (2)this device must accept any inter received, including interference that may cause undesired oper |
 | This product is subject to the provision of European D 2012/19/EC. The symbol showing a wheelie bin crossed through indicates that the product requires separate refu collection in the European Union. This applies to the p and all accessories marked with this symbol. Products as such may not be discarded with normal domestic w must be taken to a collection point for recycling electri electronic devices |
| Model | ML2420 |
| Battery voltage | 12V/24V |
| Max. PV open circuit voltag | 100V(25°C), 90V(-25°C) |
| Charge current | 20A |
| Max. PV input power | 20A |
Dear users, Thank you very much for choosing our products!
SAFETY INSTRUCTIONS
- As this controller deals with voltages that exceed the top limit for human safety, do not operate it before reading this manual carefully; completing safety operation training.
- The controller has no internal components that need maintenance of service, thus do not attempt to disassemble or repair the controller.
- Install the controller indoors, and avoid component exposure and water intrusion.
- During operation, the radiator may reach a very high temperature, therefore install the controller at a place with good ventilation condition
- It's recommended that a fuse or breaker be installed outside the controller.
- Before installing and wiring the controller, make sure to disconnect photovoltaic array and the fuse or breaker close to the battery termin
- After installation, check if all connections are solid and reliable so avoid loose connections that may give rise to dangers caused by heat accumulation.

Warning: means the operation in question is dangerous, and you should get properly prepared before proceeding.

Note: means the operation in question may cause damage.

Tips: means advice or instruction for the operator.
Table of Contents
- Product Introduction ......05
- Product Installation ....13
- Product Operation and Display....19
- Product Protection and System Maintenance....25
- Technical Parameters....30
- Conversion Efficiency Curve....32
- Product Dimensions....33
- APP control function....34
1. PRODUCT INTRODUCTION
1.1 Product Overview
- This product can keep monitoring the solar panel's generating power and tracking the highest voltage and current values(VI)in real time, enabling the system to charge the battery at maximum power. It's designed to be used in off-grid solar photovoltaic systems to coordinate operation of the solar panel, battery and load, functionir as the core control unit in off-grid photovoltaic systems.
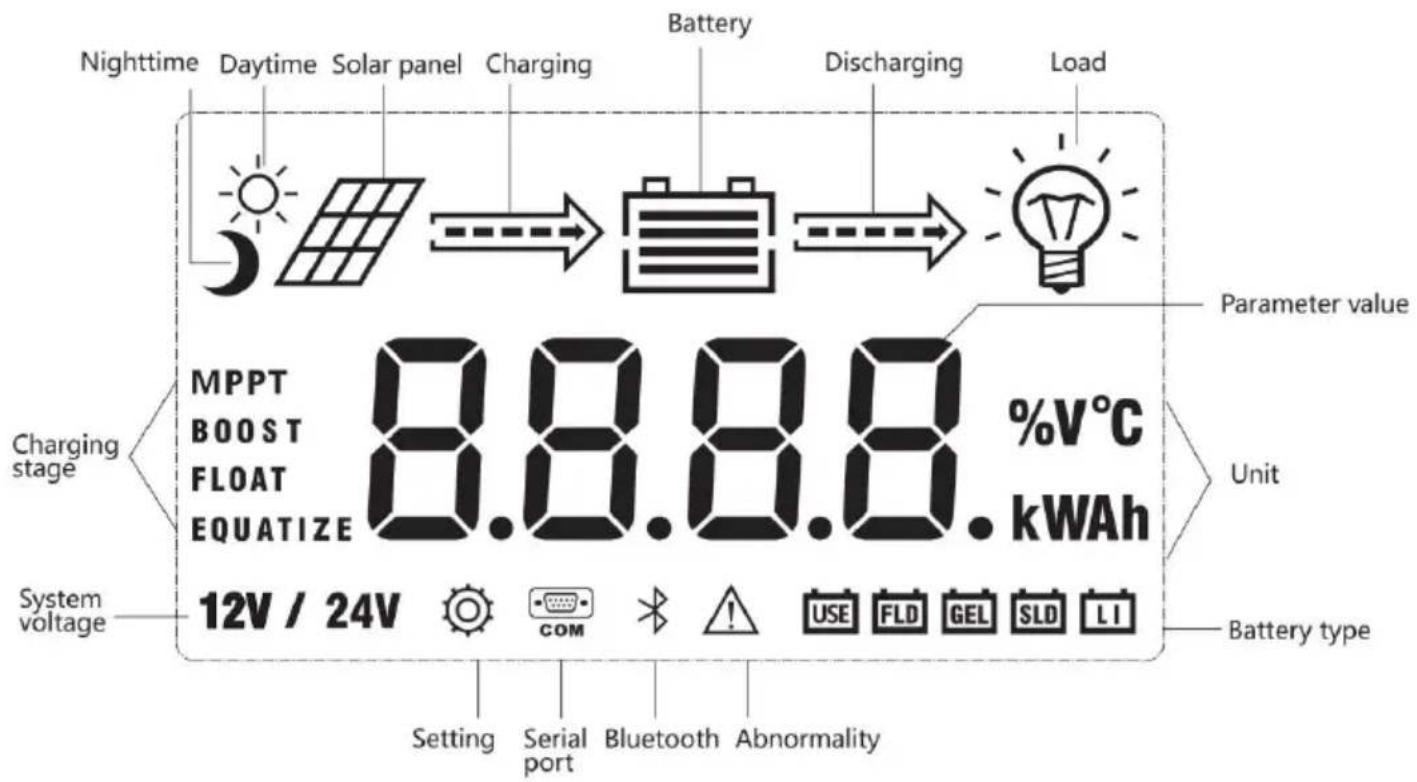
- This product features an LCD screen that can dynamically display operating status, operating parameters, controller logs, control parameters, etc. Users can conveniently check parameters by the keys, and modify control parameters to cater to different system requirements.
- The controller utilizes standard Modbus communication protocol, making it easy for users to check and modify system parameters their own. Besides, by providing free monitoring software, we give users the maximum convenience to satisfy their varied needs for remote monitoring.
- With comprehensive electronic fault self-detecting functions and powerful electronic protection functions built inside the controller, component damage caused by installation errors or system failures can be avoided to the greatest extent possible.
1.2 Product Features
- With the advanced dual-peak or multi-peak tracking technology, when the solar panel is shadowed or part of the panel fails resulting in multiple peaks on the I-V curve, the controller is still able to acc track the maximum power point.
- A built-in maximum power point tracking algorithm can significantly improve the energy utilization efficiency of photovoltaic systems, and raise the charging efficiency by 15% to 20% compa with the conventional PWM method.
- A combination of multiple tracking algorithms enables accurate tracking of the optimum working point on the I-V curve in an ext short time.
- The product boasts an optimum MPPT tracking efficiency of up to 99.9%.
- Advanced digital power supply technologies raise the circuit's energy conversion efficiency to as high as 98%.
- Charging program options are available for different types of batteries including gel batteries, sealed batteries, open batteries, lithium batteries, etc.
- The controller features a limited current charging mode. When the solar panel power exceeds a certain level and the charging current larger than the rated current, the controller will automatically lower charging power and bring the charging current to the rated level.
- Instantaneous large current startup of capacitive loads is supported.
● Automatic recognition of battery voltage is supported.
- LED fault indicators and an LCD screen which can display abnormality information help users to quickly identify system faults.
- Historical data storage function is available, and data can be stored up to a year.
- The controller is equipped with an LCD screen with which users can not only check device operating data and statuses, but also modify controller parameters.
- The controller supports standard Modbus protocol, fulfilling the communication needs of various occasions.
- The controller employs a built-in over-temperature protection mechanism. When temperature surpasses the set value, the charging current will decline in linear proportion to the temperature so as the temperature rise of the controller, effectively keeping the control from being damaged by overheating.
- Featuring a temperature compensation function, the controller can automatically adjust charging and discharging parameters in order to extend the battery's service life.
- TVS lighting protection.
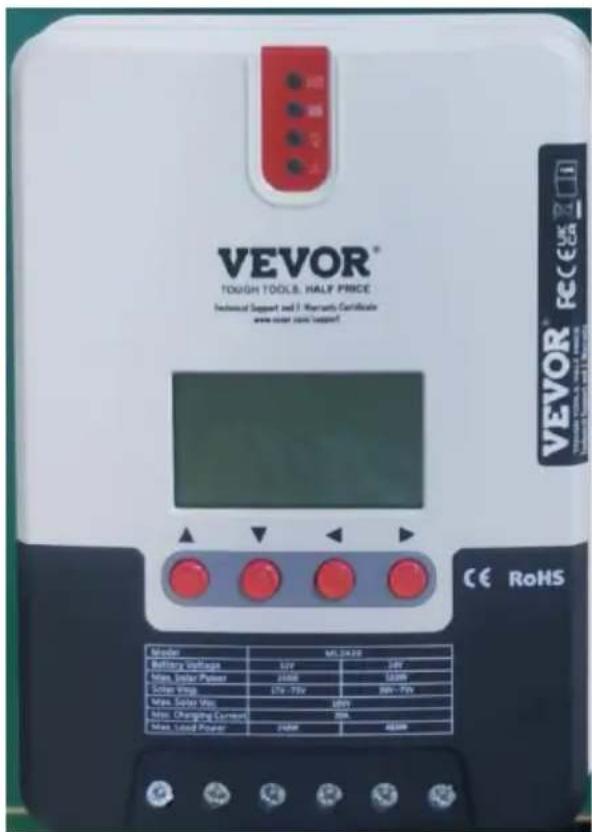
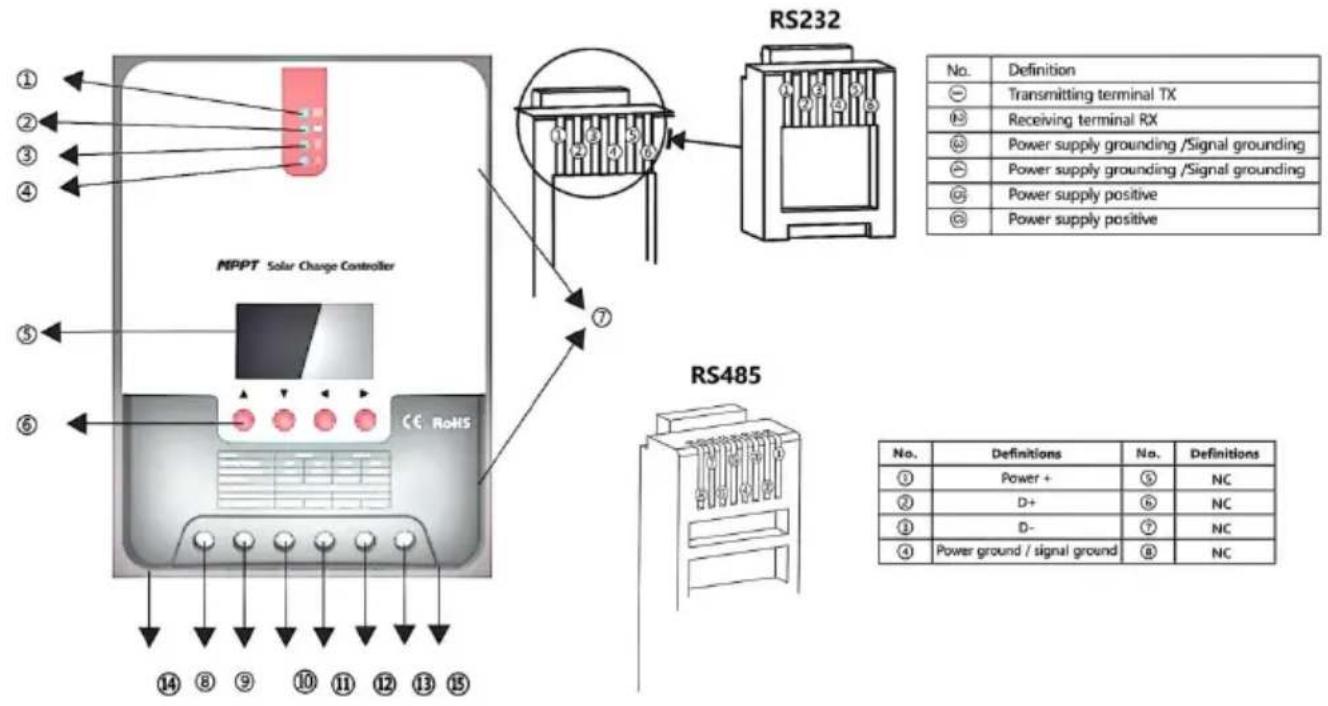
1.3 Exterior and Inter face s

Fig. 1-1 Product appearance and interfaces
| No. | Item | No. | Item |
| 1 | Charging indicator | 10 | Battery "+" interface |
| 2 | Battery indicator | 11 | Battery "-" interface |
| 3 | Load indicator | @ | Load "+" interface |
| 4 | Abnormality indicator | 13 | Load "-" interface |
| 5 | LCD screen | 14 | External temperature sampling interface |
| 6 | Operating keys | 15 | RS232/RS485 communication interface |
| 7 | Installation hole | ||
| 8 | Solar panel "+" interfad | ||
| 9 | Solar panel "-" interfad |
1.4 Introduction to Maximu m Po wer Point Tracking Technolog y
Maximum Power Point Tracking (MPPT) is an advanced charging technology that enables the solar panel to output more power by adjusting the electric module's operating status. Due to the nonlinearity of solar arrays, there exists a maximum energy output point (maximum power on their curves. Unable to continuously lock onto this point to charge battery, conventional controllers (employing switching and PWM charging technologies) can't get most of the power from the solar panel. But a charge controller featuring MPPT technology can continuously track array capacity at maximum power point so as to get the maximum amount of power to charge the battery.
Take a 12V system as an example. As the solar panel's peak voltage is approximately 17V while the battery's voltage is around 12V, when charging with a conventional charge controller, the solar panel's voltage will stay at around 12V, failing to deliver the maximum power. However, MPPT controller can overcome the problem by adjusting the solar panel input voltage and current in real time, realizing a maximum input power
Compared with conventional PWM controllers, the MPPT controller can make the most of the solar panel's max. power and therefore provide larger charging current. Generally speaking, the latter can raise the er utilization ratio by 15% to 20% in contrast with the former.

bar_line
| U (V) | I (A) - VP curve | I (A) - VI curve | P(W) | |-------|------------------|------------------|------| | 0.0 | 0.0 | 5.0 | 0.0 | | 2.8 | 0.5 | 4.9 | 13.5 | | 5.6 | 1.0 | 4.8 | 27.0 | | 8.4 | 1.5 | 4.7 | 40.5 | | 11.2 | 2.0 | 4.6 | 54.0 | | 14.0 | 2.5 | 4.5 | 67.5 | | 16.8 | 3.0 | 4.4 | 81.0 | | 19.6 | 3.5 | 4.3 | 94.5 | | 22.4 | 4.0 | 4.2 | 94.5 |Fig. 1-2 Solar panel output characteristic curve
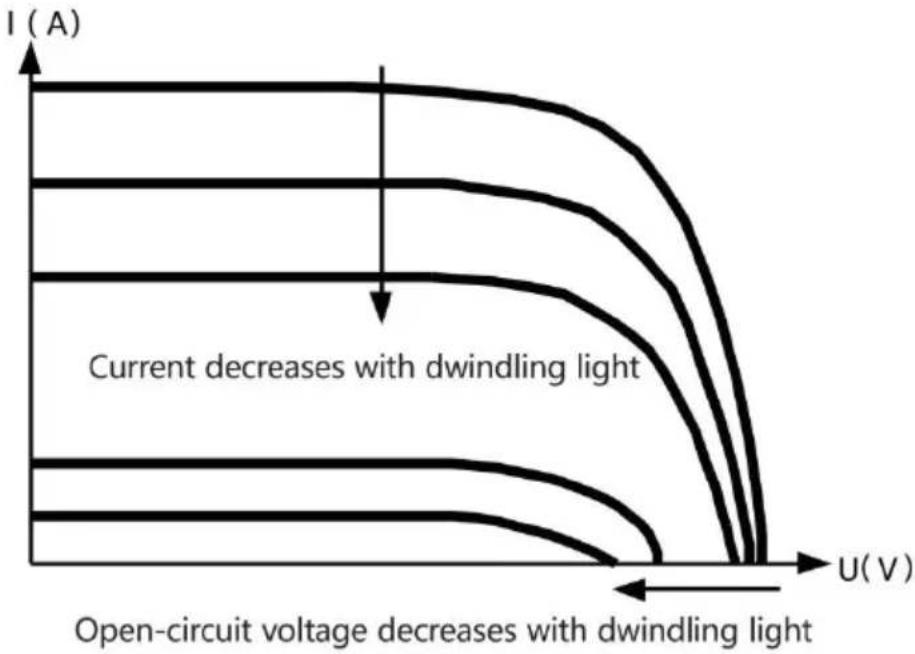
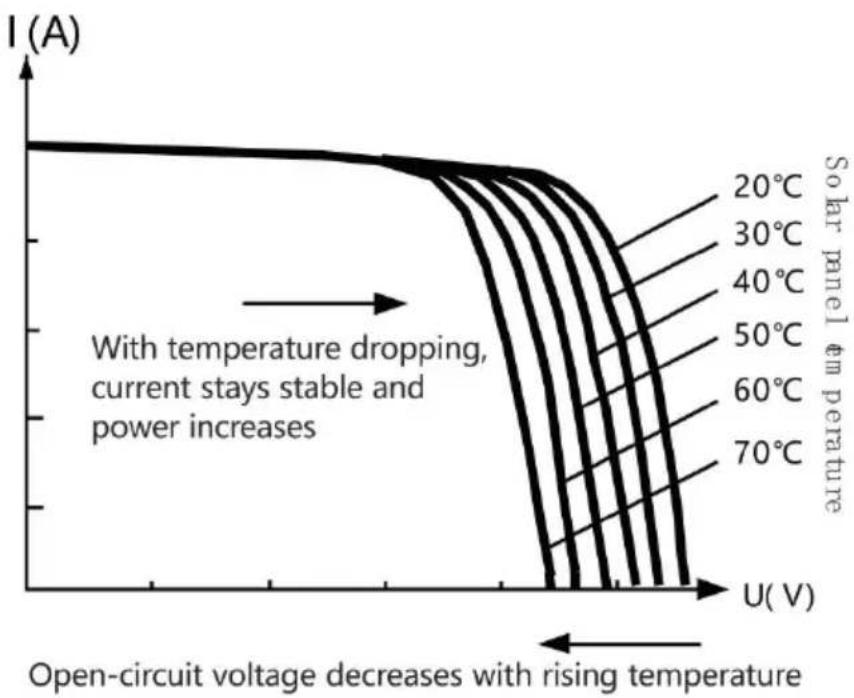
Meanwhile, due to changing ambient temperature and illumination conditions, the max. power point varies frequently, and our MPPT controller can adjust parameter settings according to the environmental conditions in real time, so as to always keep the system close to the operating point. The whole process is entirely automatic without the no for human intervention.
line
| U(V) | Current (A) | |------|-------------| | 0 | 0 | | 1 | ~0.5 | | 2 | ~0.8 | | 3 | ~1.0 | | 4 | ~1.2 | | 5 | ~1.5 | | 6 | ~1.8 | | 7 | ~2.0 | | 8 | ~2.2 | | 9 | ~2.5 | | 10 | ~2.8 | | 11 | ~3.0 | | 12 | ~3.2 | | 13 | ~3.5 | | 14 | ~3.8 | | 15 | ~4.0 | | 16 | ~4.2 | | 17 | ~4.5 | | 18 | ~4.8 | | 19 | ~5.0 | | 20 | ~5.2 | | 21 | ~5.5 | | 22 | ~5.8 | | 23 | ~6.0 | | 24 | ~6.2 | | 25 | ~6.5 | | 26 | ~6.8 | | 27 | ~7.0 | | 28 | ~7.2 | | 29 | ~7.5 | | 30 | ~7.8 | | 31 | ~8.0 | | 32 | ~8.2 | | 33 | ~8.5 | | 34 | ~8.8 | | 35 | ~9.0 | | 36 | ~9.2 | | 37 | ~9.5 | | 38 | ~9.8 | | 39 | ~10.0 | | 40 | ~10.2 | | 41 | ~10.5 | | 42 | ~10.8 | | 43 | ~11.0 | | 44 | ~11.2 | | 45 | ~11.5 | | 46 | ~11.8 | | 47 | ~12.0 | | 48 | ~12.2 | | 49 | ~12.5 | | 50 | ~12.8 | | 51 | ~13.0 | | 52 | ~13.2 | | 53 | ~13.5 | | 54 | ~13.8 | | 55 | ~14.0 | | 56 | ~14.2 | | 57 | ~14.5 | | 58 | ~14.8 | | 59 | ~15.0 | | 60 | ~15.2 | | 61 | ~15.5 | | 62 | ~15.8 | | 63 | ~16.0 | | 64 | ~16.2 | | 65 | ~16.5 | | 66 | ~16.8 | | 67 | ~17.0 | | 68 | ~17.2 | | 69 | ~17.5 | | 70 | ~17.8 | | 71 | ~18.0 | | 72 | ~18.2 | | 73 | ~18.5 | | 74 | ~18.8 | | 75 | ~19.0 | | 76 | ~19.2 | | 77 | ~19.5 | | 78 | ~19.8 | | 79 | ~20.0 | | 80 | ~20.2 | | 81 | ~20.5 | | 82 | ~20.8 | | 83 | ~21.0 | | 84 | ~21.2 | | 85 | ~21.5 | | 86 | ~21.8 | | 87 | ~22.0 | | 88 | ~22.2 | | 89 | ~22.5 | | 90 | ~22.8 | | 91 | ~23.0 | | 92 | ~23.2 | | 93 | ~23.5 | | 94 | ~23.8 | | 95 | ~24.0 | | 96 | ~24.2 | | 97 | ~24.5 | | 98 | ~24.8 | | 99 | ~25.0 | | 100 | ~25.2 |Fig. 1-3 Relation between solar panel output characteristics and illumination

line
| Temperature (°C) | Open-circuit voltage (V) | Current (A) | | ---------------- | ------------------------ | ----------- | | 20 | High | ~1.0 | | 30 | Medium | ~0.8 | | 40 | Low | ~0.6 | | 50 | Very Low | ~0.4 | | 60 | Very Low | ~0.3 | | 70 | Low | ~0.2 |Fig. 1-4 Relation between solar panel output characteristics and temperature
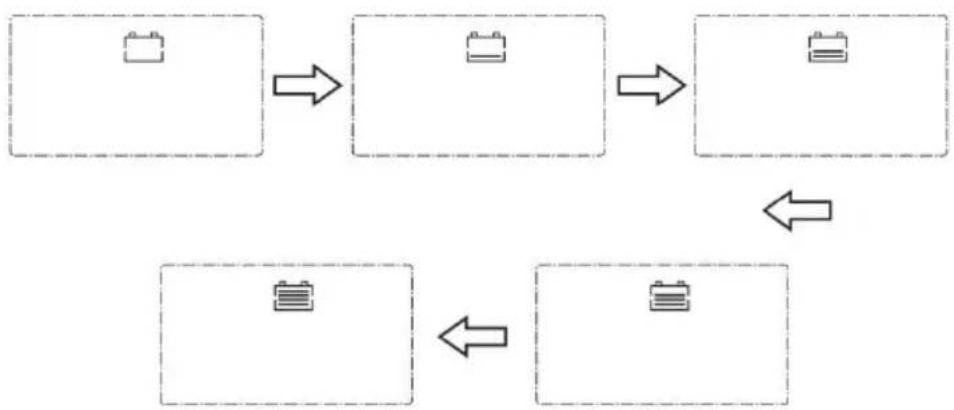
1.5 Charging Stage Introd ucti ons
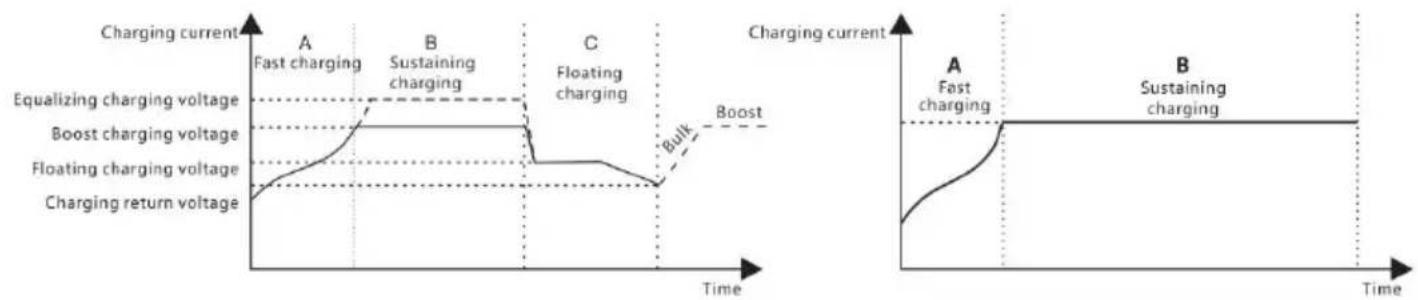
As one of the charging stages, MPPT cannot be used alone. It is required to combine boost charge, floating charge, equalizing charge a other charging methods to complete the battery charging process. A complete charging process includes: Quick charge, holding charge and floating charge. Charging curve is shown below:
line
| Time | Charging Current (A) | Charging Current (B) | | :--- | :--- | :--- | | Start | Fast charging | - | | Peak | Sustaining charging | - | | Midpoint | - | - | | End | Bulk | - | | Final | Boost | - | | Final | Fast charging | - | | Final | Sustaining charging | - |
line
| Time Segment | Charging Current | | ------------ | ---------------- | | Max. current | 10 | | Cumulative time | 3 |Fig. 1-5 SLD Battery charging stages diagram
Fig. 1-6 LI Battery charging stages diagram
a) Fast charging
At the fast charging stage, as the battery voltage has not reached the value of full voltage (i.e. equalizing/ boost voltage) yet, the controller perform MPPT charging on the battery with the maximum solar power. When the battery voltage reaches the preset value, constant voltage charging will begin.
b) Sustaining charging
When the battery voltage reaches the set value of holding voltage, the controller will perform constant voltage charging. This process will no longer include MPPT charging, and the charging current will gradually decrease with time. Holding charge comes in two stages, i.e. equalizing charge and boost charge. The two stages are conducted without repe in which equalizing charge is started once every 30 days.
Boost charging
By default, boost charging generally lasts for 2h, but users can adjust preset values of duration and boost voltage point according to the ac needs. When the duration reaches the set value, the system will ther switch to floating charging.
Equalizing charging

Warning: Risk of explosion!
In equalizing charging, an open lead-acid battery can produce explosive gas, therefore the battery chamber shall have good ventilation condition

Note: risk of equipment damage!
Equalizing charging may raise the battery voltage to a level that may damage to sensitive DC loads. Check and make sure that allowable voltages of all the loads in the system are greater than the set valu battery equalizing charging.

Note: risk of equipment damage!
Overcharge or too much gas generated may damage battery plates and cause active material on the battery plates to scale off. Equalizing ch to an excessively high level or for too long a period may cause dar Read carefully the actual requirements of the battery deployed in the system.
Some types of batteries benefit from regular equalizing charging which stir the electrolyte, balance the battery voltage and finish the electrochemical reaction. Equalizing charging raises the battery voltage a higher level than the standard supply voltage and gasifies the batte electrolyte. If the controller then automatically steers the battery into equalizing charging, the charging duration is 120 mins (default). In order avoid too much generated gas or battery overheating, equalizing charge and boosting charging won't repeat in one complete charging cycle.
Note:
1) When due to the installation environment or working loads, the system can't continuously stabilize the battery voltage to a constant level, the controller will initiate a timing process, and 3 hours after the battery
reaches the set value, the system will automatically switch to equalizing charging.
2) If no calibration has been done to the controller clock, the control perform equalizing charging regularly according to its internal clock.
➤ Floating charging
When finishing the sustaining charging stage, the controller will switch floating charging in which the controller lowers the battery voltage by diminishing the charging current and keeps the battery voltage at the value of floating charging voltage. In the floating charging process, visible light charging is carried out for the battery to maintain it full state. A stage, the loads can access almost all the solar power. If the loads consume more power than the solar panel can provide, the controller not be able to keep the battery voltage at the floating charging stage, the battery voltage drops to the set value for returning to boost charge, the system will exit floating charging and reenter into fast charging.
2. PRODUCT INSTALLATION
2.1 Inst all ation Prec aut ion
- Be very careful when installing the battery. For open lead-acid batteries, wear a pair of goggles during installation, and in case of contact with battery acid, flush with water immediately.
- In order to prevent the battery from being short-circuited, no metal objects shall be placed near the battery.
- Acid gas may be generated during battery charging, thus make sur the ambient environment is well ventilated.
- Keep the battery away from fire sparks, as the battery may produce flammable gas.
-
When installing the battery outdoors, take sufficient measures to keep the battery from direct sunlight and rain water intrusion.
-
Loose connections or corroded wire may cause excessive heat generation which may further melt the wire's insulation layer and I surrounding materials, and even cause a fire, therefore make sure connections are tightened securely. Wires had better be fixed prop with ties, and when needs arise to move things, avoid wire sway as to keep connections from loosening.
- When connecting the system, the output terminal's voltage may exceed the top limit for human safety. If operation needs to be sure to use insulation tools and keep hands dry.
- The wiring terminals on the controller can be connected with a single battery or a pack of batteries. Following descriptions in this manual apply to systems employing either a single battery or a pack of batteries.
- Follow the safety advice given by the battery manufacturer.
- When selecting connection wires for the system, follow the criterion that the current density is not larger than ^2 .4A/mm
- Connect the controller's earth terminal to the ground.
2.2 Wiring Speci ficatio ns
Wiring and installation methods must comply with national and local electrical specifications. The wiring specifications of the battery and load must be selected according to rated currents, and see the following t for wiring specifications:
| Models | Rated charging current | Rated discharging current | Battery wire diameter (mm2) | Load wire diameter (mm2) |
| ML2420 | 20A | 20A | 5 mm2 | 5 mm2 |
2.3 Inst all ation and Wiring
Warning: risk of explosion! Never install the
controller and an open battery in the same enclosed space! Nor shall controller be installed in an enclosed space where battery gas may accumulate.
Warning: danger of high voltage! Photovoltaic arrays
may produce a very high open-circuit voltage. Open the breaker or fu before wiring, and be very careful during the wiring process.
Note: when installing the controller, make sure that
enough air flows through the controller's radiator, and leave at least 1 mm of space both above and below the controller so as to ensure I convection for heat dissipation. If the controller is installed in an enclo box, make sure the box delivers a reliable heat dissipation effect.
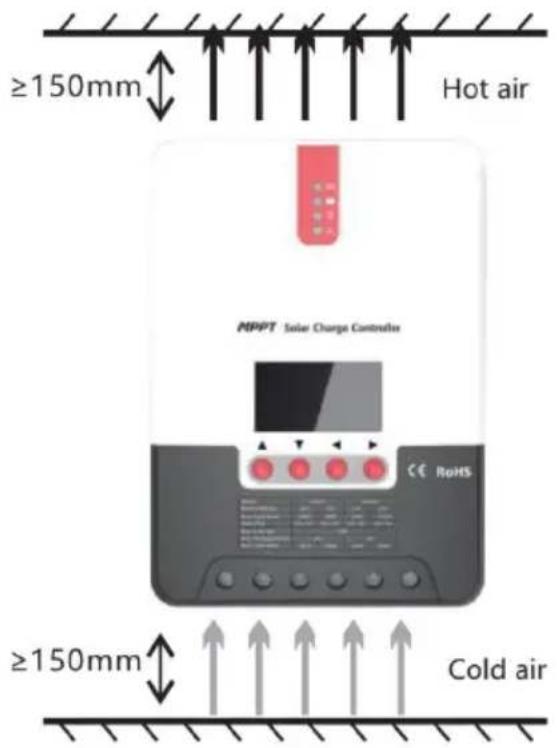
Fig. 2.1 Installation and heat dissipation
Step 1: choose the installation site
Do not install the controller at a place that is subject to direct sunlight temperature or water intrusion, and make sure the ambient environmer well ventilated.
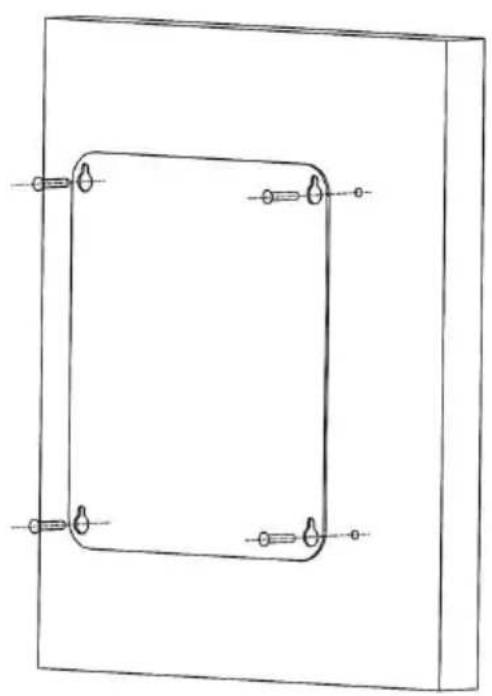
Step 2: first place the installation guide plate in a proper positio a marking pen to mark the mounting points, then drill 4 mountin holes at the 4 marked points, and fit screws in.
Step 3: fix the controller
Aim the controller's fixing holes at the screws fit in Step 2 and mou controller on.
natural_image
Simple line drawing of a rectangular frame with four corner handles and a central square (no text or symbols)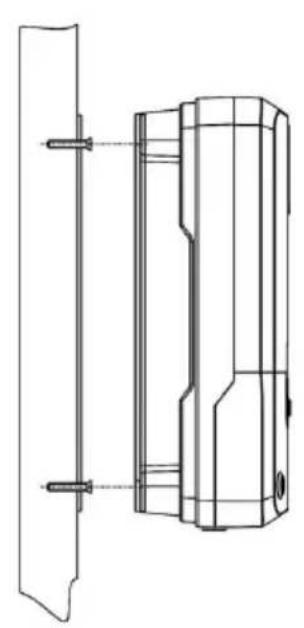
natural_image
Technical line drawing of a mechanical component with mounting holes and internal features (no text or symbols)Step 4: wire
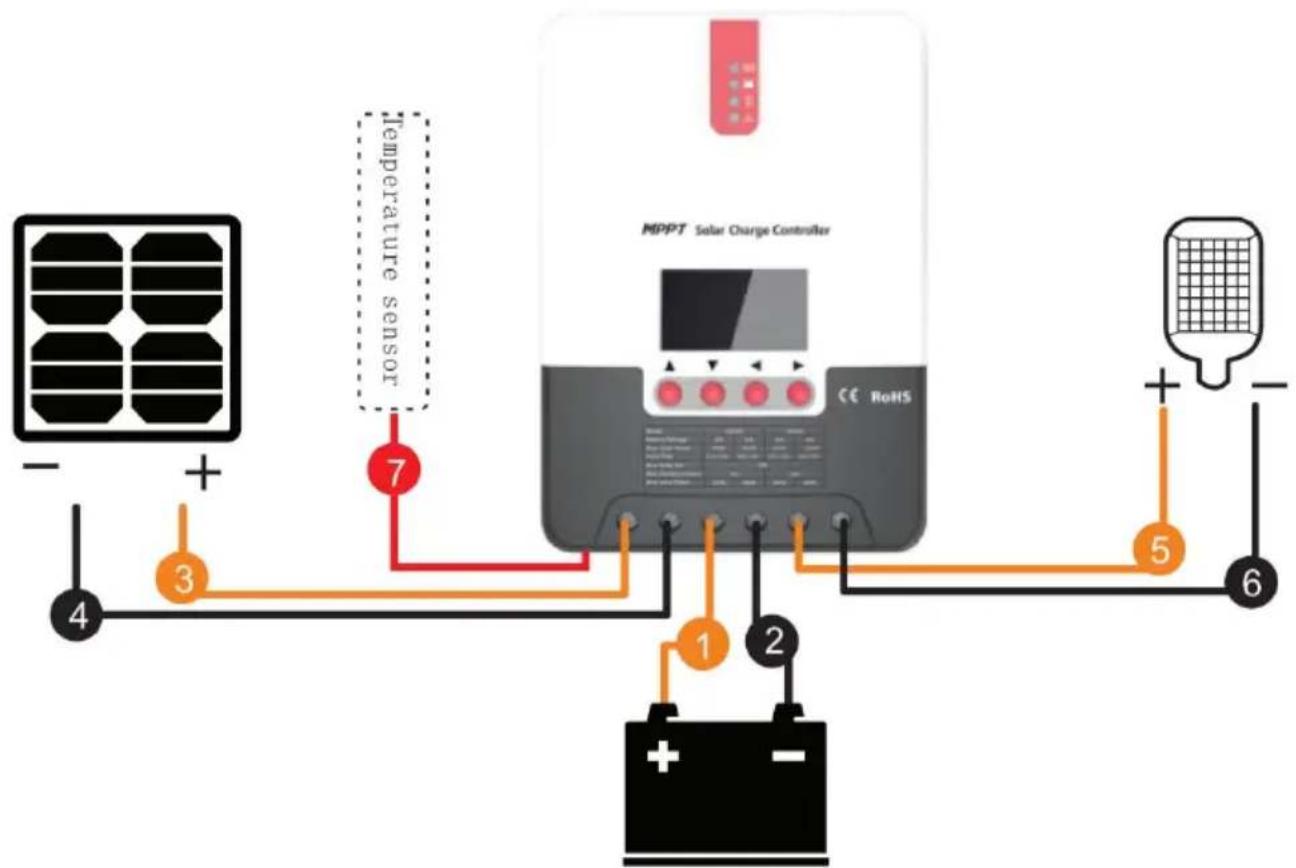
First remove the two screws on the controller, and then begin wiring operation. In order to guarantee installation safety, we recommend the following wiring order; however, you can choose not to follow this orc no damage will be incurred to the controller.
flowchart
graph TD
    A["Solar Panel"] -->|+| B["Temperature Sensor"]
    B -->|7| C["RoHS Controller"]
    C -->|1| D["Battery"]
    C -->|2| D
    C -->|3| E["Display Unit"]
    C -->|4| F["Ground"]
    C -->|5| G["Display Unit"]
    C -->|6| H["Display Unit"]
① Connecting to external temperature sampling interface
② Connecting communication cable
③ Connecting power cable
Warning: risk of electric shock! We strongly recommend that fuses breakers be connected at the photovoltaic array side, load side and b side so as to avoid electric shock during wiring operation or faulty operations, and make sure the fuses and breakers are in an open s before wiring.
Warning: danger of high voltage! Photovoltaic arrays may produce very high open-circuit voltage. Open the breaker or fuse before wiring be very careful during the wiring process.
Warning: risk of explosion! Once the battery's positive and negative terminals or leads that connect to the two terminals get short-circuited fire or explosion will occur. Always be careful in operation.
First connect the battery, then the load, and finally the solar panel. \ wiring, follow the order of first "+" and then "-".
④ Power on
After connecting all power wires solidly and reliably, check again when wiring is correct and if the positive and negative poles are reversely connected. After confirming that no faults exist, first close the fuse or breaker of the battery, then see whether the LED indicators light up LCD screen displays information. If the LCD screen fails to display information, open the fuse or breaker immediately and recheck if all connections are correctly done.
If the battery functions normally, connect the solar panel. If sunlight is intense enough, the controller's charging indicator will light up or flash begin to charge the battery.
After successfully connecting the battery and photovoltaic array, finally close the fuse or breaker of the load, and then you can manually test whether the load can be normally turned on and off. For details, reference information about load working modes and operations.
Warning: when the controller is in a normal charging state,
disconnecting the battery will have some negative effect on the DC load and in extreme cases, the loads may get damaged.
Warning: within 10 minutes after the controller stops charging, if the battery's poles are reversely connected, internal components of the controller may get damaged.
Note:
1) The battery's fuse or breaker shall be installed as close to the battery side as possible. It's recommended that installation distance be not more than 150mm.
2) If no remote temperature sensor is connected to the controller, the battery temperature will stay at 25 °C .
3) If an inverter is deployed in the system, directly connect the inverter to the battery, a connect it to the controller's load terminals.
3. PRODUCT OPERATION AND DISPLAY
3.1 LED Indic ator s
  | [H5CS] | PV array indicato | Indicating the controller's current charging mode. |
  |  | BAT indicator | Indicating the battery's current state. |
  |  | LOAD indicator | Indicating the loads' On/ Off and state. |
  |  | ERROR indicator | Indicating whether the controller is functioning norma |

PV array indicator:
| No. | CHARGE STATUS | Indicator state | Charging state | |
| 1 |  | BULK | Steady on | MPPT charging |
| 2 |  | ACCEPTANCE | Slow flashing(a cycle of 2s with on and of lasting for 1s) | Boost charging |
| 3 |  | FLOAT | Single flashing(a cycle of 2s with on and off respectively for 0 1s and 1 | Floating charging |
| 4 |  | EQUALIZE | Quick flashing(a cycle of 0.2s with on and of lasting for 0.1s) | Equalizing charging |
| 5 |  | CURRENT-LIMITED | Double flashing(a cycle of 2s with on for 0.1s, on again for 0.1s, and off for 1.7s) | Current-limited charging |
| 6 | Off | No charging | ||

BAT indicator:
| Indicator state | Battery state |
| Steady on | Normal battery voltage |
| Slow flashing (a cycle of 2s with on and off each 1s) | Battery over-discharged |
| Quick flashing (a cycle of 0.2s with on and off each 0.1s) | Battery over-voltage |

LOAD indicator:
| Indicator state | Load state |
| Off | Load turned off |
| Quick flashing (a cycle of 0.2s with on and off e lasting for 0.1s) | Load overloaded/ short-circuited |
| Steady on | Load functioning normally |

ERROR indicator:
| Indicator state | Abnormality indication |
| Off | System operating normally |
| Steady on | System malfunctioning |
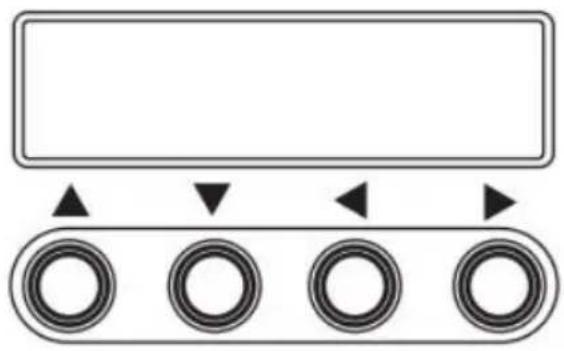
3.2 Keys Ope ration
| ▲ Up | Page up; increase the parameter value in setting |
| ▼ Down | Page down; decrease the parameter value in set |
| ◀ Return | Return to previous menu (exit without saving) |
| ▶ Set | Enter into sub-menu; set/ saveTurn on/ off loads (in manual mode) |
flowchart
graph TD
    A[" "] --> B[" "]
    B --> C[" "]
    C --> D[" "]
3.3 LCD Startup and Main Interface

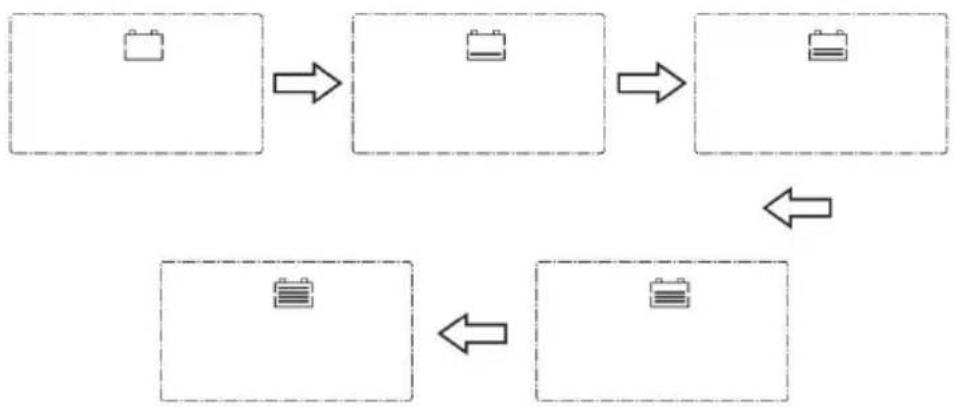
3.3.1 Startup interface
flowchart
graph TD
    A[" "] --> B[" "]
    B --> C[" "]
    C --> D[" "]
    D --> E[" "]
    E --> F[" "]
    F --> G[" "]
During startup, the 4 indicators will first flash successively, and after self-inspection, the LCD screen starts and displays the battery's voltage level which will be either a fixed voltage selected by the user or a automatically recognized.
3.3.2 Main interface
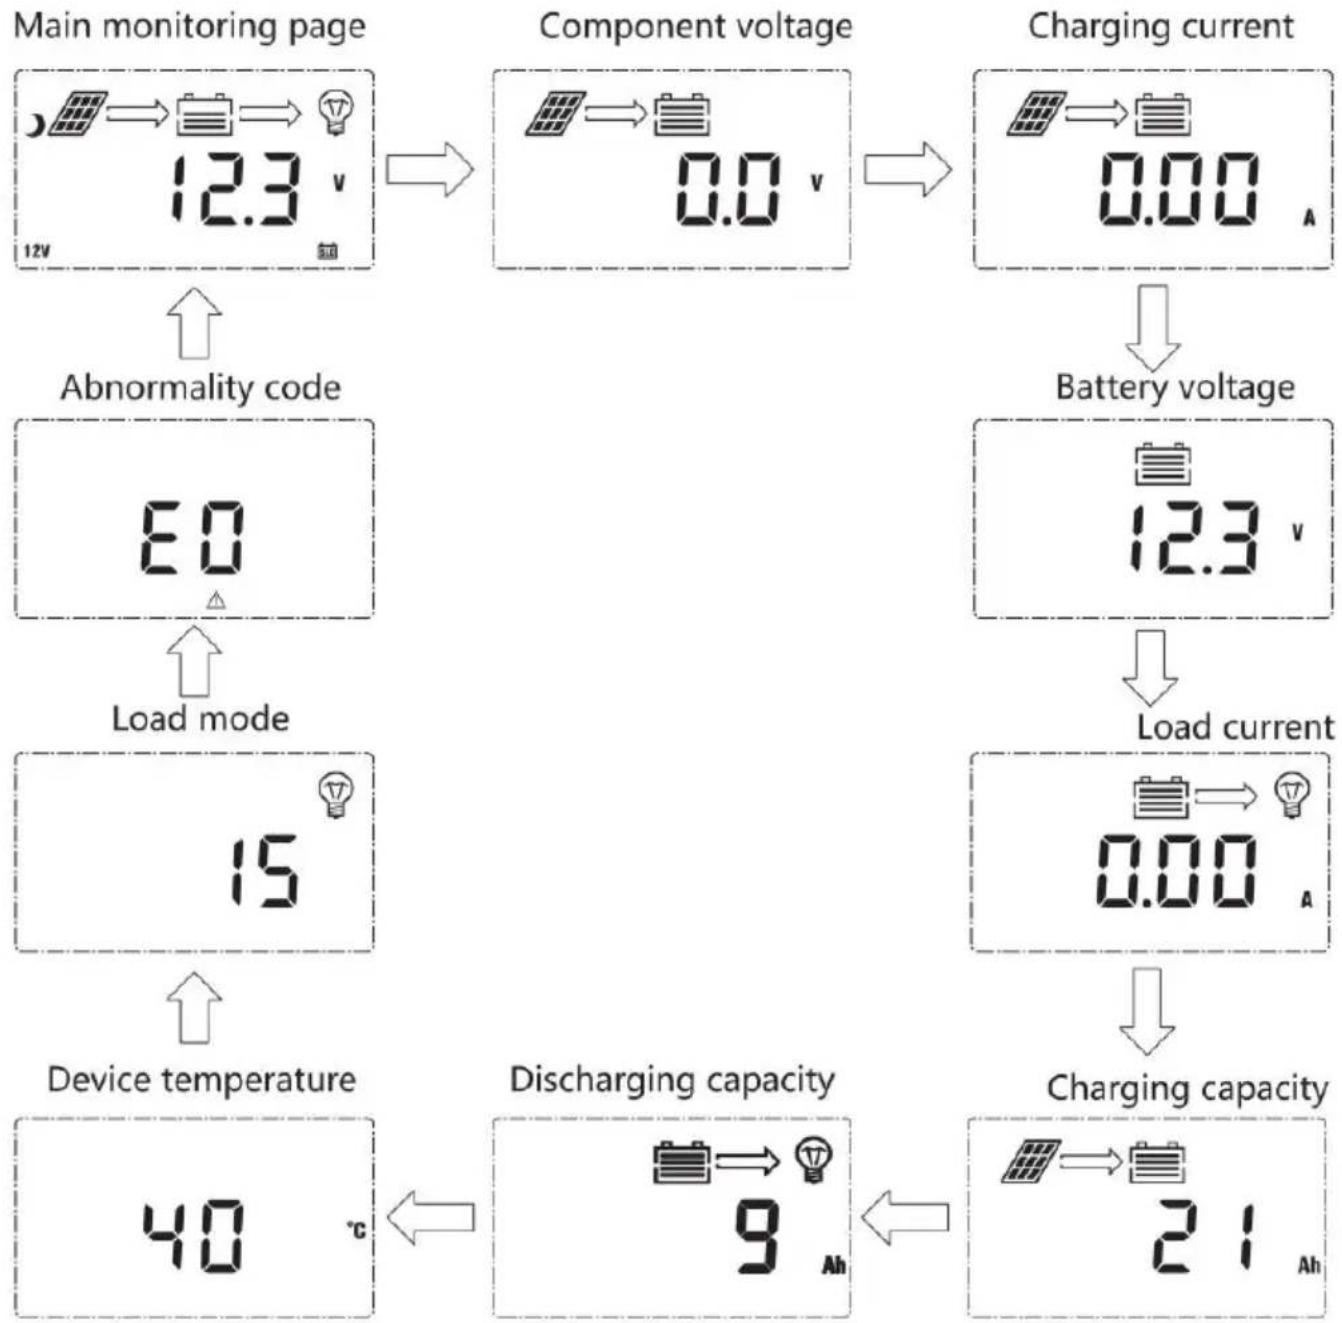
flowchart
graph TD
    A["Main monitoring page"] --> B["Component voltage"]
    B --> C["Battery voltage"]
    C --> D["Charging current"]

    subgraph Main monitoring page
        E["12V → 12.3 V"]
        F["12V → 12.3 V"]
        G["Load mode: 6.0 V"]
        H["Device temperature: 15 °C"]
    end

    subgraph Component voltage
        I["0.0 V → 0.0 V"]
        J["12.3 V → 12.3 V"]
        K["Load current: 0.00 A"]
    end

    subgraph Charging current
        L["0.00 A → 0.00 A"]
        M["Load current: 0.00 A"]
        N["Charging capacity: 2.1 Ah"]
    end

    O["Abnormality code"] --> P["Load mode"]
    Q["Discharging capacity"] --> R["40 °C"]
    S["Device temperature"] --> T["9 Ah"]
3.4 Load Mode Setting Inter fa
3.4.1 Load modes introduction
This controller has 5 load operating modes which will be described b
| No. | Mode | Descriptions |
| 0 | Sole light control (nighttime on and daytime off) | When no sunlight is present, the solar panel voltage is than the light control on voltage, and after a time delta controller will switch on the load; when sunlight emerge solar panel voltage will become higher than the light co off voltage, and after a time delay, the controller will s the load. |
| 1~14 | Light control + time contr to 14 hours | When no sunlight is present, the solar panel voltage is than the light control on voltage, and after a time delta controller will switch on the load. The load will be swit after working for a preset period of time. |
| 15 | Manual mode | In this mode, the user can switch the load on or off no matter whether it's day or night. This mode is desi some specially purposed loads, and is also used in the debugging process. |
| 16 | Debugging mode | Used for system debugging. With light signals, the load off; without light signals, the load is switched on. This enables a fast check of the correctness of system insta during installation debugging. |
| 17 | Normal on mode | The energized load keeps outputting, and this mode is for loads that need 24-hour power supply. |
3.4.2 Load mode adjustment
Users can adjust the load mode as needed on their own, and the d mode is debugging mode (see "load modes introduction"). The method adjusting load modes is as follows:
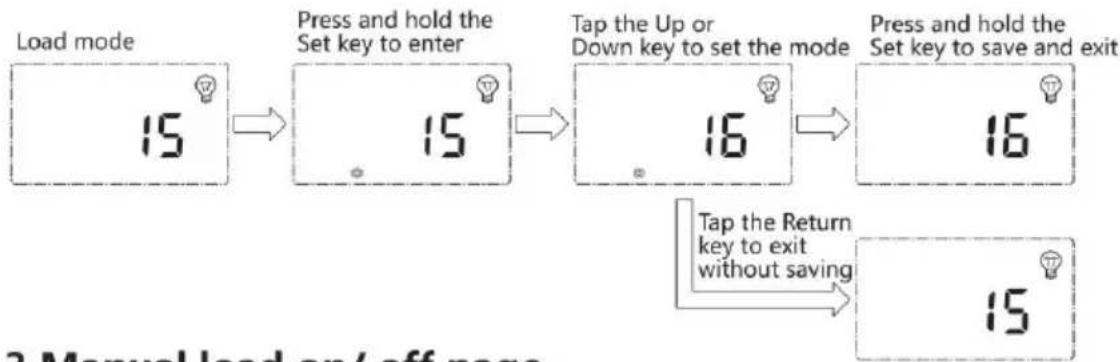
flowchart
graph LR
    A["Load mode 15"] --> B["Press and hold the Set key to enter 15"]
    B --> C["Tap the Up or Down key to set the mode 16"]
    C --> D["Press and hold the Set key to save and exit 16"]
    D --> E["Tap the Return key to exit without saving 15"]
3.4.3 Manual load on/ off page
Manual operation is effective only when the load mode is manual mode (15), and tap the Set key to switch on/off the load under any main interface.
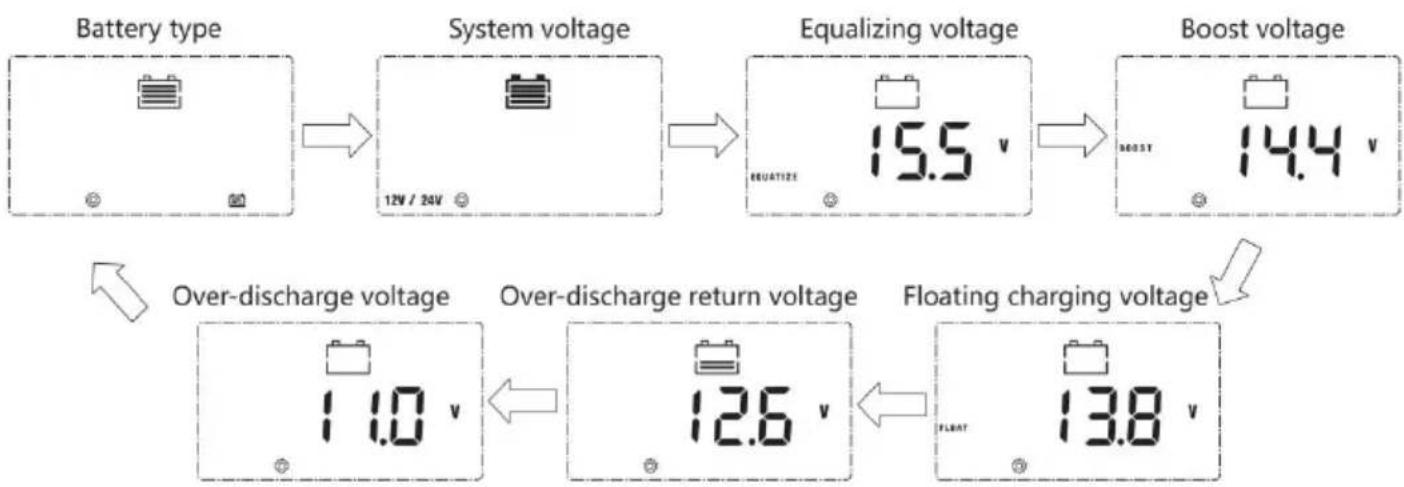
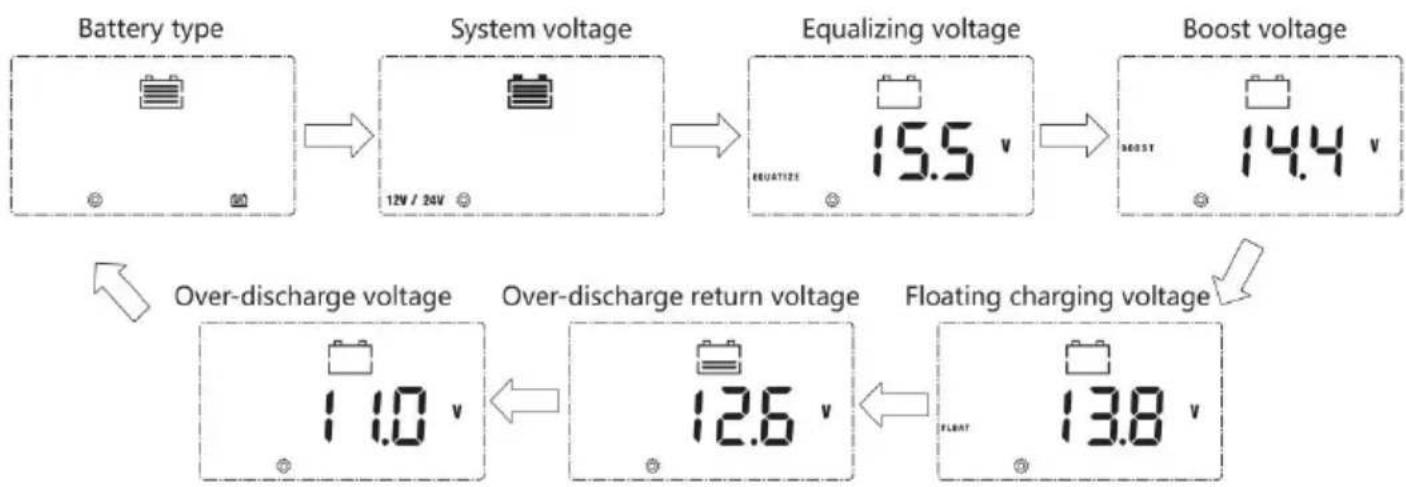
3.5 System Para meter Settings

flowchart
graph LR
    A["Battery type"] --> B["System voltage"]
    B --> C["Equalizing voltage"]
    C --> D["Boost voltage"]

    E["Over-discharge voltage"] --> F["Over-discharge return voltage"]
    F --> G["Floating charging voltage"]

    H["12V / 24V"] --> I["15.5 V"]
    J["1.0 V"] --> K["12.6 V"]
    L["13.8 V"] --> M["FLOAT"]
Under any interface other than load modes, press and hold the Set enter into the parameter setting interface.
After entering into the setting interface, tap the Set key to switch the parameter value in the menu. Then tap the Return key to exit (without saving parameter setting), or press and hold the Set key to save set and exit.

Note: after system voltage setting, power supply has to be switched off then on again, otherwise the system may work under an abnormal system voltage.
The controller enables users to customize the parameters according to actual conditions, but parameter setting must be done under the guidance of a professional person, or else faulty parameter settings may render system not able to function normally. For details about parameter settings see table 3
| Parameter setting cross reference table | ||||
| No. | Displayed item | Description | Parameter range | Default setting |
| 1 | TYPE OF BA | Battery type | User/flooded/Sealed/Gel | Sealed |
| 2 | VOLT OF SY | System voltage | 12V/24V | AUTO |
| 3 | EQUALIZ CHC | Equalizing charging voltage | 9.0 ~ 17.0V | 14.6V |
| 4 | BOOST CHG | Boost charging voltage | 9.0 ~ 17.0V | 14.4V |
| 5 | FLOAT CHG | Floating charging voltage | 9.0 ~ 17.0V | 13.8V |
| 6 | LOW VOL RECT | Over-discharge recovery voltage | 9.0 ~ 17.0V | 12.6V |
| 7 | LOW VOL DISC | Over-discharge voltage | 9.0 ~ 17.0V | 11.0V |
4. PRODUCT PROTECTION AND SYSTEM MAINTENANCE
4.1 Protecti ons
▶ Waterproofing protection
Rating: IP32
▶ Input power limited protection
When the power of solar panel is higher than the rated value, the c will limit the power of solar panel within the rated power range to p damage by over current, and the controller will enter the current-limiting charge.
▶ Battery reverse polarity protection
If the battery polarity is reversed, the system will not work but it will burn out the controller.
PV input end voltage is too high
If the voltage at the PV array input end is too high, the controller v automatically shut off the PV input.
PV input end short circuit protection
If the voltage at the PV array input end is short circuited, the control turn off charging; after short circuit is removed, charging will automatic recover.
PV input reverse polarity protection
When the polarity of PV array is reversed, the controller will not be damaged, and normal operation will continue after wiring error is corre
Night reverse charging protection
Prevent battery discharge through the solar panel at night.
▶ TVS lightning protection
➢ Over-temperature protection
When the controller temperature exceeds the set value, it will decrease charging power or halt charging.
See the following diagram:
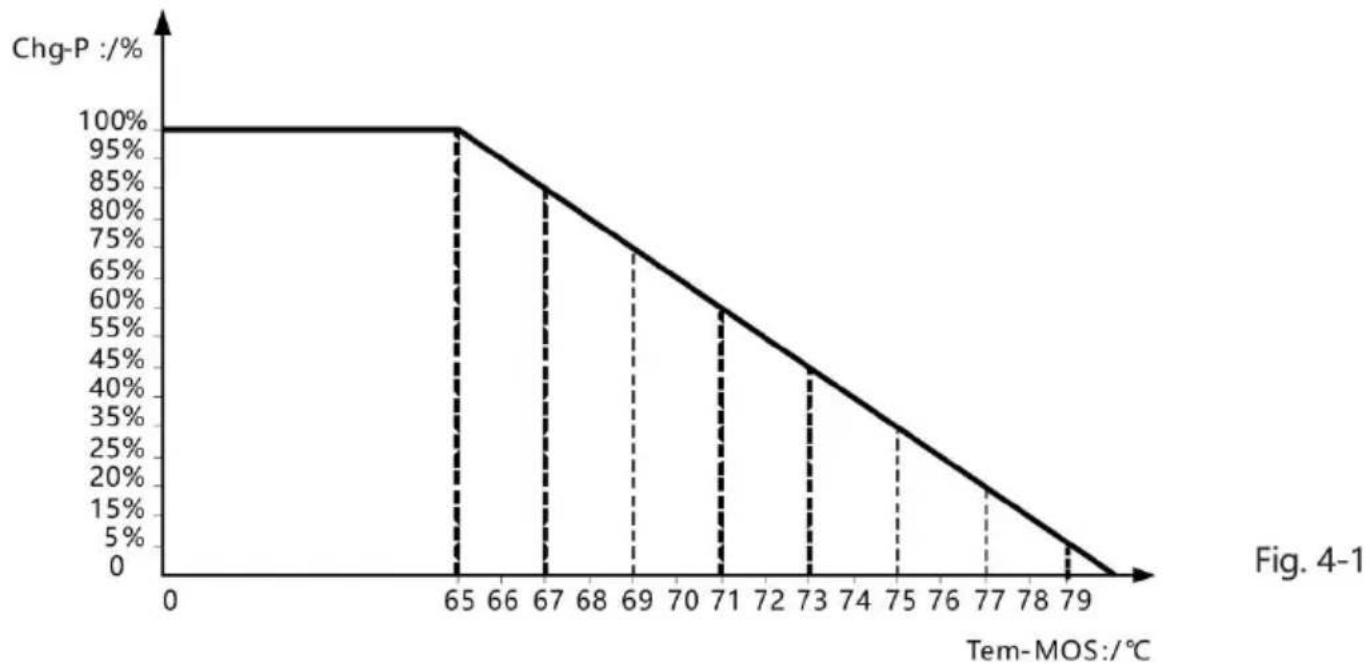
line
| Tem-MOS: /°C | Chg-P :/% | | ------------ | --------- | | 0 | 100 | | 65 | 100 | | 66 | 95 | | 67 | 85 | | 68 | 75 | | 69 | 65 | | 70 | 55 | | 71 | 45 | | 72 | 35 | | 73 | 25 | | 74 | 15 | | 75 | 5 | | 76 | 0 | | 77 | -5 | | 78 | -10 | | 79 | -15 |4.2 System Maintenance
- In order to maintain the best long-term performance for controller, it recommended to conduct inspections twice a year.
- Make sure the airflow around the controller is not obstructed and remove any dirt or debris from the heat sink.
- Check if the insulation layers of all exposed wires are damaged due to sun exposure, friction with other objects nearby, dry rot, destruction or insects or rodents, etc. If so, it is necessary to repair or replace wire.
- Verify if indicators are consistent with the device operations. Please note to take corrective actions for any malfunctions or error indica if necessary.
- Check all wiring terminals for corrosion, insulation damage, signs of high temperature or burning/discoloration and tighten the terminal screws firmly.
- Check for dirt, insects nesting and corrosion and clean as required.
- If the lightning arrester has failed, replace it in time to protect con and other devices of the user from being damaged by lightning.operations. Please note to take corrective actions for any malfunctions or error indications if necessary.
Warning: risk of electric shock! Before carrying out the abov checkings or operations, always make sure all power supplies of controller have been cut off!
4.3 Abnormality Disp lay and War nings
| Error | Description | Controller action | Indicator status |
| E0 | Normal | - | LED indication |
| E1 | Over discharge | Turn off load | BAT indicator flashes slowly, ERROR indi is steady on |
| E2 | Battery over voltage | Turn off charging | BAT indicator flashes fast, ERROR indica steady on |
| E3 | Under-voltage warning | Battery level indicatio | ERROR indicator is steady on |
| E4 | Load short circuit | Turn off load | LOAD indicator flashes fast, ERROR indic is steady on |
| E5 | Load over current | Delayed to turn off load | LOAD indicator flashes fast, ERROR indic is steady on |
| E6 | Device over temperature | Run with reduced power | ERROR indicator is steady on |
| E7 | Battery over temperature | Turn off charging | ERROR indicator is steady on |
| E8 | Solar panel power too large | Charge with limited current | ERROR indicator is steady on |
| E10 | Solar panel over voltage | Disable charging | ERROR indicator is steady on |
| E13 | Solar panel revers polarity | Disable charging | ERROR indicator is steady on |
| E15 | Battery not connected lithium battery feed protection | When the lithium battery meets the charging conditions will activate chargingLead-acid battery, when the battery is not detected, it disables charging, when the battery is detected, it will rescharging automatically | ERROR indicator is steady |
| E16 | Battery over temperature (E7 and E16 are different in that charging and discharging have separate upper limit protection temperatures) | Turn off load | ERROR indicator is steady |
| E18 | BMS over-current protection | Turn off charging | ERROR indicator is steady |
5. TECHNICAL PARAMETERS
5.1 Electrical parame ters
| Parameter | Value |
| Model | ML2420 |
| System voltage | 12V/24V Auto |
| No-load loss | 0.7W to 1.2W |
| Battery voltage | 9V to 35V |
| Max. solar input volta | 100V(25 °C) ; 90V(-25 °C) |
| Max. power point voltage | Battery Voltage+2V to 75V |
| Rated charging current | 20A |
| Rated load current | 20A |
| Max. capacitive load capacity | 10000uF |
| Max. photovoltaic system input power | 260W / 12V520W / 24V |
| Conversion efficiency | ≤98% |
| MPPT tracking efficien | >99% |
| Temperature | - 3 mv/°C / 2V (default) |
| Operating temperature | - 35 °C to 45 °C |
| Protection degree | IP32 |
| Weight | 1.4 kg |
| Communication method | RS232 / RS485 |
| Altitude | ≤ 3000 m |
| Product dimensions | 210 x 151 x 59.5 mm |
5.2. Batt ery type default paramet ers
| Comparison Table of Parameters for Each Type of Battery | |||||
| Setting VoltageBattery Type | SealedLead-AcidBattery | GelledLead-AcidBattery | OpenLead-AcidBattery | LI Battery | User(User-Defined) |
| OvervoltageDisconnectVoltage | 16.0V | 16.0V | 16.0V | 9~17V | |
| Equalizing Voltage | 14.6V | 14.8V | 9~17V | ||
| Boost Voltage | 14.4V | 14.2V | 14.6V | 14.4V | 9~17V |
| Floating Voltage | 13.8V | 13.8V | 13.8V | 9~17V | |
| Boost RestoringVoltage | 13.2V | 13.2V | 13.2V | 9~17V | |
| Low VoltageDisconnectRestoring Voltage | 12.6V | 12.6V | 12.6V | 12.6V | 9~17V |
| Under-VoltageAlarming Voltage | 12.0V | 12.0V | 12.0V | 9~17V | |
| Low VoltageDisconnectVoltage | 11.1V | 11.1V | 11.1V | 11.1V | 9~17V |
| Discharging LimitVoltage | 10.6V | 10.6V | 10.6V | 9~17V | |
| Over-DischargeDelay Time | 5s | 5s | 5s | 1~30s | |
| EqualizingDuration Time | 120Min | 120Min | 0~ 600Min | ||
| EqualizingCharging Interva | 30Days | 0Day | 30Days | 0~ 250D(0 refers close equalizing charging function) | |
| Boost DurationTime | 120Min | 120Min | 120Min | 10~600Min | |
When selecting User, the battery type is to be self-customized, and in case, the default system voltage parameters are consistent with those the sealed lead-acid battery. When modifying battery charging and discharging parameters, the following rule must be followed:
- Over-voltage cut-off voltage > Charging limit voltage ≥ Equalizing voltage ≥ Boost voltage ≥ Floating charging voltage > Boost return voltage;
● Over-voltage cut-off voltage > Over-voltage cut-off return voltage; - Low-voltage cut-off return voltage > Low-voltage cut-off voltage ≥ Discharging limit voltage;
● Under-voltage warning return voltage > Under-voltage warning voltage ≥ Discharging limit voltage; - Boost return voltage > Low-voltage cut-off return voltage
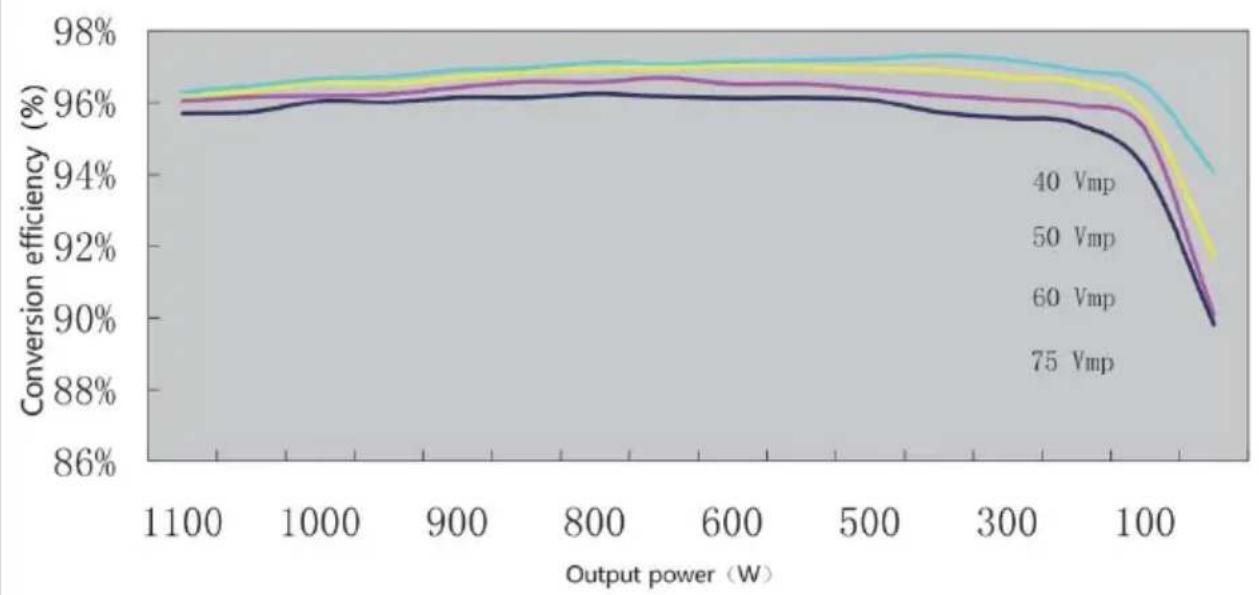
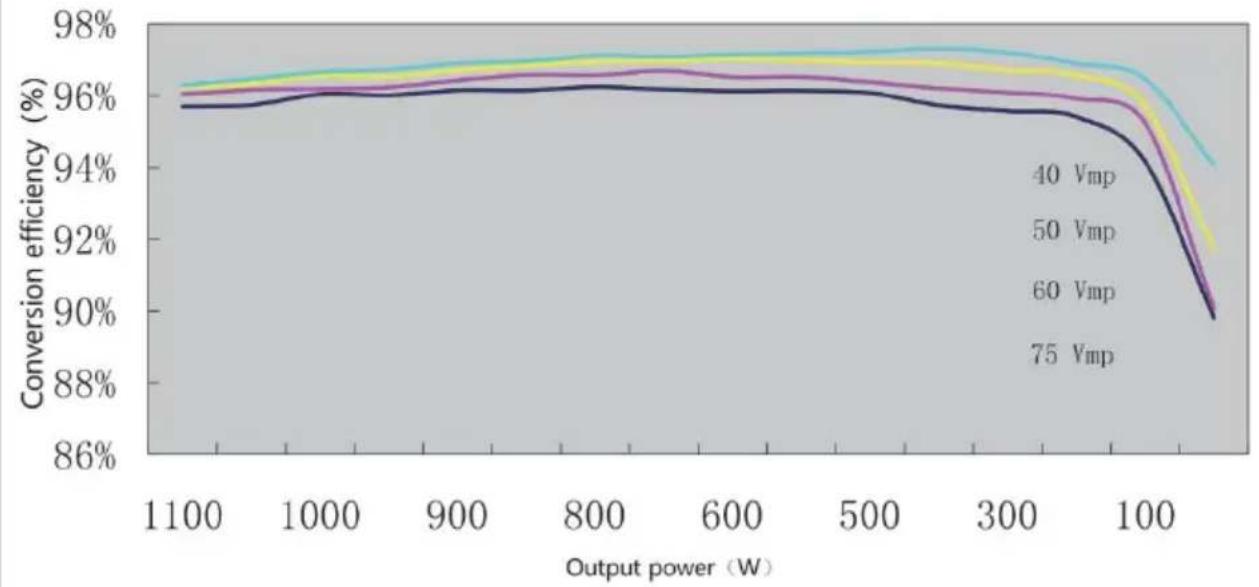
6. CONVERSION EFFICIENCY CURVE
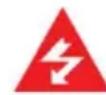
6.1 12V System Con version
line
| Output power (W) | 20 Vmp | 40 Vmp | 60 Vmp | 75 Vmp | | ---------------- | ------ | ------ | ------ | ------ | | 550 | 93.8% | 93.5% | 93.2% | 93.3% | | 500 | 94.0% | 93.7% | 93.4% | 92.8% | | 475 | 94.2% | 93.9% | 93.6% | 93.1% | | 450 | 94.5% | 94.1% | 93.8% | 93.3% | | 425 | 94.8% | 94.3% | 94.0% | 93.5% | | 400 | 95.0% | 94.5% | 94.2% | 93.6% | | 375 | 95.1% | 94.6% | 94.3% | 93.7% | | 350 | 95.2% | 94.7% | 94.4% | 93.8% | | 300 | 95.3% | 94.8% | 94.5% | 93.9% | | 250 | 95.4% | 94.9% | 94.6% | 94.0% | | 200 | 95.5% | 95.0% | 94.7% | 94.1% | | 150 | 95.6% | 95.1% | 94.8% | 94.2% | | 100 | 95.7% | 95.2% | 94.9% | 94.3% | | 50 | 95.8% | 95.3% | 95.0% | 94.4% |6.1 24V System Conversion
line
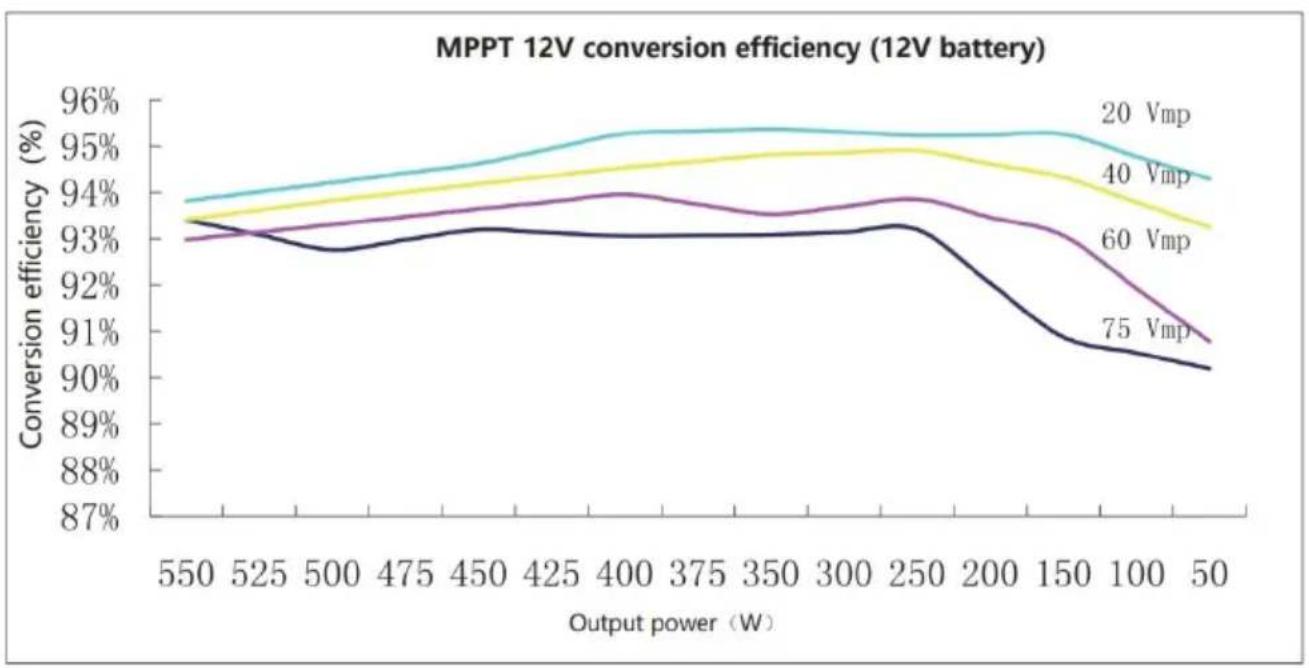
| Output power (W) | 40 Vmp | 50 Vmp | 60 Vmp | 75 Vmp | | ---------------- | ------ | ------ | ------ | ------ | | 1100 | 96% | 96% | 96% | 96% | | 1000 | 96% | 96% | 96% | 96% | | 900 | 96% | 96% | 96% | 96% | | 800 | 96% | 96% | 96% | 96% | | 600 | 96% | 96% | 96% | 96% | | 500 | 96% | 96% | 96% | 96% | | 300 | 96% | 96% | 96% | 96% | | 100 | 94% | 94% | 94% | 94% | | >100 | ~86% | ~86% | ~86% | ~86% |- PRODUCT DIMENSIONS
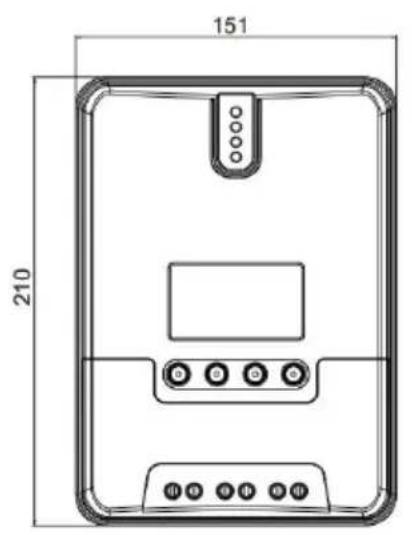
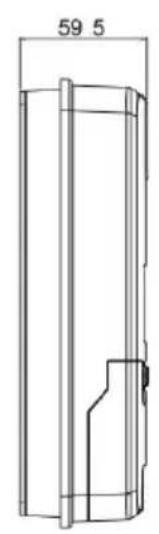
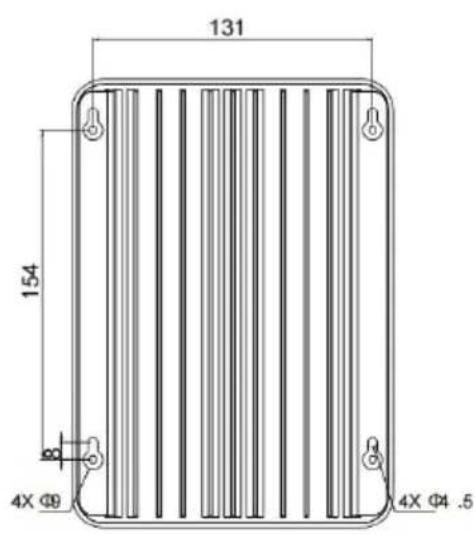
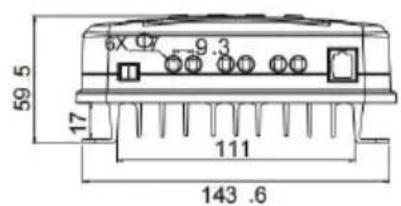
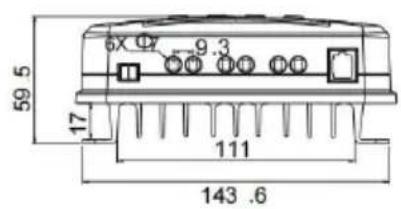
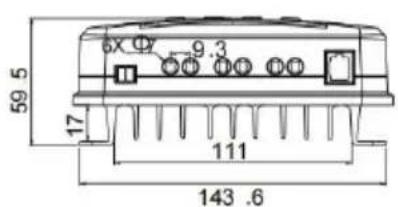
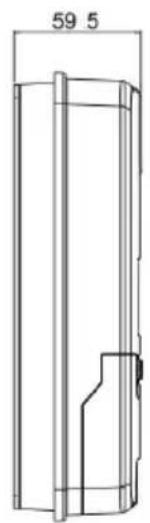
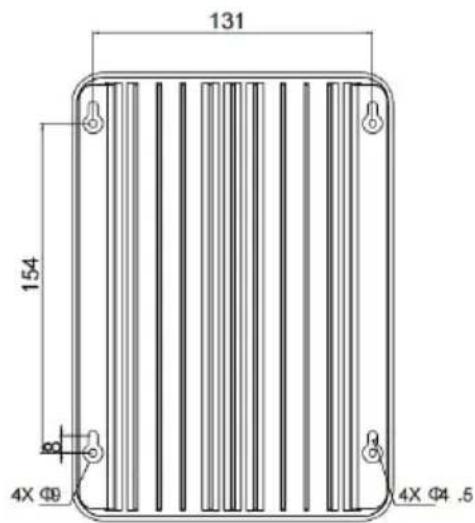
ML2420
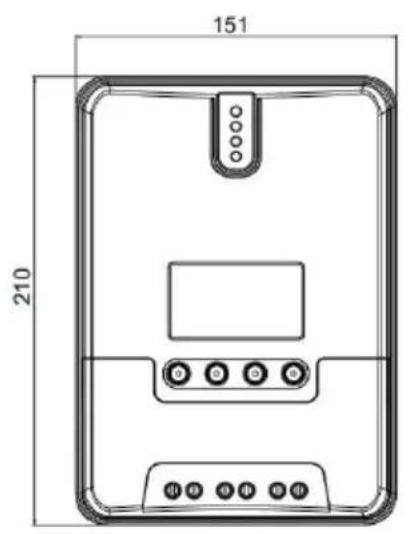
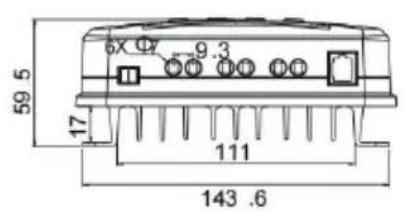
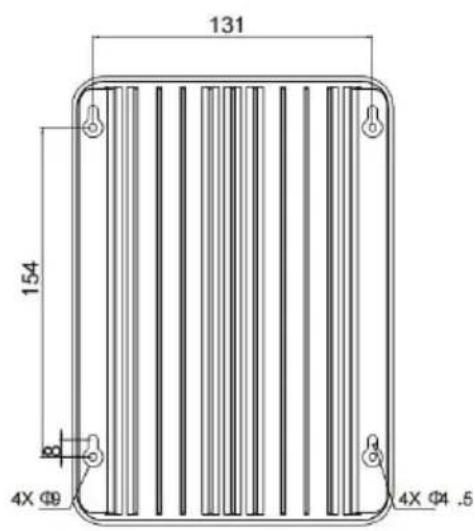
Product dimensions: 210*151*59.5mm
Hole positions: 154*131mm
Hole diameter: Φ3mm
Applicable wire: max. 8 AWG
8.APP CONTROL FUNCTION
- Please use your mobile phone to scan the QR code in the image

- Follow the prompts to download the APP software and complete the follow-up.
- After the APP installation is completed, please follow the prompts to set up the connection, after the connection is successful, you can query the information of the device and control the device on the mobile phone.
Address: Baoshanqu Shuangchenglu 803long 11hao 1602A-1609shi Shanghai
Imported to AUS: SIHAO PTY LTD, 1 ROKEVA STREETEASTWOOD NSW 2122 Australia
Imported to USA: Sanven Technology Ltd, Suite 250, 9166 Anaheim Place, Rancho Cucamonga, CA 91730
| EC | REP |
SHUNSHUN GmbH
Römeräcker 9 Z2021, 76351
Unit 5 Albert Edward House, The
Pavilions Preston, United Kingdom
Made In China
VEVOR®
TOUGH TOOLS, HALF PRICE
Technical Support and E-Warranty Certificate www.vevor.com/support
VEVOR®
TOUGH TOOLS, HALF PRICE
We continue to be committed to provide you tools with competitive price. "Save Half", "Half Price" or any other similar expressions used by us only represent of savings you might benefit from buying certain tools with us compared top brands and does not necessarily mean to cover all categories of tools offered are kindly reminded to verify carefully when you are placing an order with us actually saving half in comparison with the top major brands.
VEVOR®
TOUGH TOOLS, HALF PRICE
ML MAXIMUM POWEF POINT TRACKING (MPPT
MODÈLE:ML2420

NEED HELP? CONTACT US!
Have product questions? Need technical support? Please feel fr contact us:
Technical Support and E-Warranty Certificate www.vevor.com/support
This is the original instruction, please read all manual instruction carefully before operating. VEVOR reserves a clear interpretation user manual. The appearance of the product shall be subject to product you received. Please forgive us that we won't inform you there are any technology or software updates on our product.
1. PRODUCT INTRODUCTION
1.1 Product Overview
1.2 Product Features
1.3 Exterior and Inter face s

bar_line
| U (V) | I (A) - VP curve | I (A) - VI curve | P(W) | |-------|------------------|------------------|------| | 0.0 | 0.0 | 5.0 | 0.0 | | 2.8 | 1.0 | 4.9 | 13.5 | | 5.6 | 2.0 | 4.8 | 27.0 | | 8.4 | 3.0 | 4.7 | 40.5 | | 11.2 | 4.0 | 4.6 | 54.0 | | 14.0 | 4.5 | 4.5 | 67.5 | | 16.8 | 4.3 | 4.3 | 81.0 | | 19.6 | 3.0 | 3.0 | 94.5 | | 22.4 | 0.0 | 0.0 | 94.5 |Fig. 1-2 Solar panel output characteristic curve
Fig. 1-3 Relation between solar panel output characteristics and illumination
line
| Temperature (°C) | Open-circuit voltage (V) | Current (A) | | ---------------- | ------------------------ | ----------- | | 20 | High | ~1.0 | | 30 | Medium | ~0.8 | | 40 | Low | ~0.6 | | 50 | Very Low | ~0.4 | | 60 | Very Low | ~0.3 | | 70 | Low | ~0.2 |Fig. 1-4 Relation between solar panel output characteristics and temperature
1.5 Charging Stage Introd ucti ons
line
| Time Segment | Charging Current | | ------------ | ---------------- | | A | Fast charging | | B | Sustaining charging | | C | Floating charging | | Bulk | Boost |
line
| Time Segment | Charging Current | | ------------ | ---------------- | | Max. current | 2h (range: 10 to 600min) | | Cumulative time | 3h |Fig. 1-5 SLD Battery charging stages diagram
Fig. 1-6 LI Battery charging stages diagram
a) Charge rapide
2. PRODUCT INSTALLATION
2.1 Inst all ation Prec aut ion
Fig. 2.1 Installation and heat dissipation
natural_image
Simple line drawing of a rectangular frame with four corner handles and a central square (no text or symbols)
natural_image
Technical line drawing of a mechanical component with mounting holes and a cylindrical housing (no text or symbols)Étape 4 : le fil
3. PRODUCT OPERATION AND DISPLAY
3.1 LED Indic ator s
flowchart
graph TD
    A[" "] --> B[" "]
    B --> C[" "]
    C --> D[" "]
3.3 LCD Startup and Main Int er fa ce

3.3.1 Startup interface

flowchart
graph TD
    A[" "] --> B[" "]
    B --> C[" "]
    C --> D[" "]
    D --> E[" "]
    E --> F[" "]
    F --> G[" "]
flowchart
graph LR
    A["Load mode 15"] --> B["Press and hold the Set key to enter 15"]
    B --> C["Tap the Up or Down key to set the mode 16"]
    C --> D["Press and hold the Set key to save and exit 16"]
    D --> E["Tap the Return key to exit without saving 15"]
3.4.3 Manual load on/ off page
Manual operation is effective only when the load mode is manual mode (15), and tap the Set key to switch on/off the load under any main interface.
3.5 System Para meter Settings

flowchart
graph LR
    A["Battery type"] --> B["System voltage"]
    B --> C["Equalizing voltage"]
    C --> D["Boost voltage"]

    E["Over-discharge voltage"] --> F["Over-discharge return voltage"]
    F --> G["Floating charging voltage"]

    H["12V / 24V"] --> I["15.5 V"]
    J["14.4 V"] --> K["13.8 V"]
    L["11.0 V"] --> M["12.6 V"]
4.3 Abnormality Disp lay and Warning
line
| Output power (W) | 20 Vmp | 40 Vmp | 60 Vmp | 75 Vmp | | ---------------- | ------ | ------ | ------ | ------ | | 550 | 93.8% | 93.7% | 93.2% | 93.3% | | 525 | 94.0% | 93.9% | 93.3% | 93.1% | | 500 | 94.2% | 94.1% | 93.4% | 92.9% | | 475 | 94.4% | 94.3% | 93.5% | 92.8% | | 450 | 94.6% | 94.5% | 93.6% | 92.7% | | 425 | 94.8% | 94.7% | 93.7% | 92.6% | | 400 | 95.0% | 94.9% | 93.8% | 92.5% | | 375 | 95.1% | 95.0% | 93.9% | 92.4% | | 350 | 95.2% | 95.1% | 93.8% | 92.3% | | 300 | 95.3% | 95.2% | 93.7% | 92.2% | | 250 | 95.4% | 95.3% | 93.6% | 92.1% | | 200 | 95.5% | 95.4% | 93.5% | 91.8% | | 150 | 95.6% | 95.5% | 93.4% | 91.5% | | 100 | 95.7% | 95.6% | 93.3% | 91.2% | | 50 | 95.8% | 95.7% | 93.2% | 91.0% |6.1 24V Syste m Conversion
MPPT 24V conversion efficiency (24V battery)

line
| Output power (W) | 40 Vmp | 50 Vmp | 60 Vmp | 75 Vmp | | ---------------- | ------ | ------ | ------ | ------ | | 1100 | 96.2% | 96.1% | 96.0% | 95.8% | | 1000 | 96.3% | 96.2% | 96.1% | 95.9% | | 900 | 96.4% | 96.3% | 96.2% | 96.0% | | 800 | 96.5% | 96.4% | 96.3% | 96.1% | | 600 | 96.6% | 96.5% | 96.4% | 96.2% | | 500 | 96.7% | 96.6% | 96.5% | 96.3% | | 300 | 96.8% | 96.7% | 96.6% | 96.4% | | 100 | 94.5% | 94.4% | 94.3% | 94.2% | | >100 | ~89.5% | ~89.4% | ~89.3% | ~89.2% |7. PRODUCT DIMENSIONS


ML2420
Product dimensions: 210*151*59.5mm
Hole positions: 154*131mm
Hole diameter: Φ3mm
Applicable wire: max. 8 AWG
8.APP CONTROL FUNCTION
Unit 5 Albert Edward House, The
Pavilions Preston, United Kingdom
Fabriqué en Chine
VEVOR®
TOUGH TOOLS, HALF PRICE
ML MAXIMUM POWER POINT TRACKING (MPPT)-SERIE
ML2420 SOLAR-LADE- UND ENTLADEREGLER
BEDIENUNGSANLEITUNG
We continue to be committed to provide you tools with competitive price. "Save Half", "Half Price" or any other similar expressions used by us only represent of savings you might benefit from buying certain tools with us compared top brands and does not necessarily mean to cover all categories of tools offered are kindly reminded to verify carefully when you are placing an order with us actually saving half in comparison with the top major brands.
VEVOR®
TOUGH TOOLS, HALF PRICE
ML MAXIMUM POWEF POINT TRACKING (MPPT
MODELL:ML2420

NEED HELP? CONTACT US!
Have product questions? Need technical support? Please feel fr contact us:
Technical Support and E-Warranty Certificate www.vevor.com/support
This is the original instruction, please read all manual instruction carefully before operating. VEVOR reserves a clear interpretation user manual. The appearance of the product shall be subject to product you received. Please forgive us that we won't inform you there are any technology or software updates on our product.
1. PRODUCT INTRODUCTION
1.1 Product Overview
1.2 Product Features
1.3 Exterior and Inter faces

bar_line
| U (V) | I (A) - VP curve | I (A) - VI curve | P(W) | |-------|------------------|------------------|------| | 0.0 | 0.0 | 5.0 | 0.0 | | 2.8 | 1.0 | 4.9 | 13.5 | | 5.6 | 2.0 | 4.8 | 27.0 | | 8.4 | 3.0 | 4.7 | 40.5 | | 11.2 | 4.0 | 4.6 | 54.0 | | 14.0 | 4.5 | 4.5 | 67.5 | | 16.8 | 4.3 | 4.3 | 81.0 | | 19.6 | 3.0 | 3.0 | 94.5 | | 22.4 | 0.0 | 0.0 | 94.5 |Fig. 1-2 Solar panel output characteristic curve
line
| U(V) | Current (A) | |------|-------------| | Low | High | | Medium | Medium | | High | Low |Fig. 1-3 Relation between solar panel output characteristics and illumination

line
| Temperature (°C) | Open-circuit voltage (V) | Current (A) | | ---------------- | ------------------------ | ----------- | | 20 | High | ~1.0 | | 30 | Medium | ~0.8 | | 40 | Low | ~0.6 | | 50 | Very Low | ~0.4 | | 60 | Very Low | ~0.3 | | 70 | Low | ~0.2 |Fig. 1-4 Relation between solar panel output characteristics and temperature
1.5 Charging Stage Introd ucti ons
line
| Time Segment | Charging Current | | ------------ | ---------------- | | A | Fast charging | | B | Sustaining charging | | C | Floating charging | | Bulk | Boost |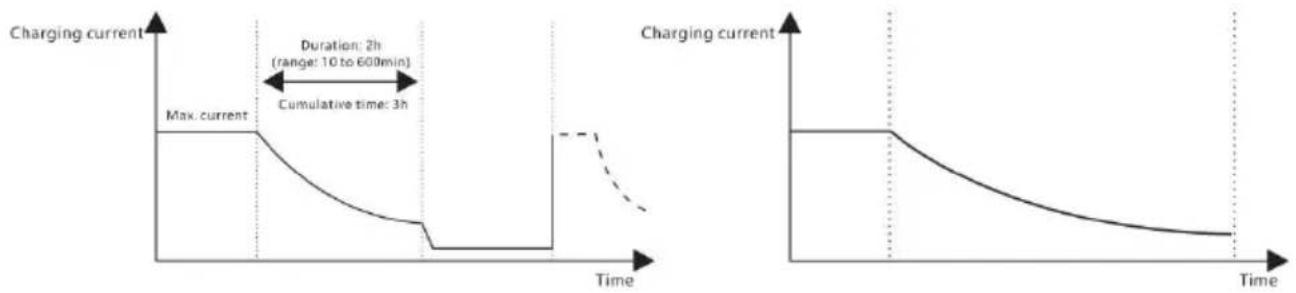
line
| Time Segment | Charging Current | |----------------------|------------------| | Max. current | 10 | | Duration: 2h (range: 10 to 600min) | 10 to 600 min | | Cumulative time: 3h | 3 |Fig. 1-5 SLD Battery charging stages diagram
Fig. 1-6 LI Battery charging stages diagram
a) Schnelles Laden
2. PRODUCT INSTALLATION
2.1 Inst all ation Prec aut ion
Fig. 2.1 Installation and heat dissipation
natural_image
Simple line drawing of a rectangular frame with four corner handles and a central square (no text or symbols)
natural_image
Technical line drawing of a mechanical component with mounting holes and a cylindrical housing (no text or symbols)Schritt 4: Draht
3. PRODUCT OPERATION AND DISPLAY
3.1 LED Indic ator s
flowchart
graph TD
    A[" "] --> B[" "]
    B --> C[" "]
    C --> D[" "]
3.3 LCD Startup and Main Int er fa ce

3.3.1 Startup interface

flowchart
graph TD
    A[" "] --> B[" "]
    B --> C[" "]
    C --> D[" "]
    D --> E[" "]
    E --> F[" "]
    F --> G[" "]
flowchart
graph LR
    A["Load mode 15"] --> B["Press and hold the Set key to enter 15"]
    B --> C["Tap the Up or Down key to set the mode 16"]
    C --> D["Press and hold the Set key to save and exit 16"]
    D --> E["Tap the Return key to exit without saving 15"]
3.4.3 Manual load on/ off page
Manual operation is effective only when the load mode is manual mode (15), and tap the Set key to switch on/off the load under any main interface.
3.5 System Para meter Settings
flowchart
graph LR
    A["Battery type"] --> B["System voltage"]
    B --> C["Equalizing voltage"]
    C --> D["Boost voltage"]

    E["Over-discharge voltage"] --> F["Over-discharge return voltage"]
    F --> G["Floating charging voltage"]

    H["12V / 24V"] --> I["15.5 V"]
    J["1.0 V"] --> K["12.6 V"]
    L["13.8 V"] --> M["FLOAT"]
4.3 Abnormality Disp lay and War nings
line
| Output power (W) | 20 Vmp | 40 Vmp | 60 Vmp | 75 Vmp | | ---------------- | ------ | ------ | ------ | ------ | | 550 | 93.8% | 93.8% | 93.2% | 93.2% | | 525 | 94.0% | 94.0% | 93.4% | 93.4% | | 500 | 94.2% | 94.2% | 93.6% | 93.6% | | 475 | 94.4% | 94.4% | 93.8% | 93.8% | | 450 | 94.6% | 94.6% | 94.0% | 93.8% | | 425 | 94.8% | 94.8% | 94.2% | 93.8% | | 400 | 95.0% | 95.0% | 94.4% | 93.8% | | 375 | 95.2% | 95.2% | 94.6% | 93.8% | | 350 | 95.2% | 95.2% | 94.6% | 93.8% | | 300 | 95.2% | 95.2% | 94.6% | 93.8% | | 250 | 95.2% | 95.2% | 94.6% | 93.8% | | 200 | 95.2% | 95.2% | 94.6% | 93.8% | | 150 | 95.2% | 95.2% | 94.6% | 93.8% | | 100 | 95.2% | 95.2% | 94.6% | 93.8% | | 50 | 95.2% | 95.2% | 94.6% | 93.8% |6.1 24V System Con versi on
MPPT 24V conversion efficiency (24V battery)

line
| Output power (W) | 40 Vmp | 50 Vmp | 60 Vmp | 75 Vmp | | ---------------- | ------ | ------ | ------ | ------ | | 1100 | 96.2% | 96.3% | 96.4% | 96.5% | | 1000 | 96.3% | 96.4% | 96.5% | 96.6% | | 900 | 96.4% | 96.5% | 96.6% | 96.7% | | 800 | 96.5% | 96.6% | 96.7% | 96.8% | | 600 | 96.6% | 96.7% | 96.8% | 96.9% | | 500 | 96.7% | 96.8% | 96.9% | 97.0% | | 300 | 96.8% | 96.9% | 97.0% | 97.1% | | 100 | 96.9% | 97.0% | 97.1% | 97.2% | | >100 | ~89.5% | ~89.8% | ~90.0% | ~90.2% |7. PRODUCT DIMENSIONS


ML2420
Product dimensions: 210*151*59.5mm
Hole positions: 154*131mm
Hole diameter: Φ3mm
Applicable wire: max. 8 AWG
8.APP CONTROL FUNCTION
Unit 5 Albert Edward House, The
Pavilions Preston, United Kingdom
We continue to be committed to provide you tools with competitive price. "Save Half", "Half Price" or any other similar expressions used by us only represent of savings you might benefit from buying certain tools with us compared top brands and does not necessarily mean to cover all categories of tools offered are kindly reminded to verify carefully when you are placing an order with us actually saving half in comparison with the top major brands.
VEVOR®
TOUGH TOOLS, HALF PRICE
ML MAXIMUM POWEF POINT TRACKING (MPPT
MODELLO:ML2420

NEED HELP? CONTACT US!
Have product questions? Need technical support? Please feel fr contact us:
Technical Support and E-Warranty Certificate www.vevor.com/support
This is the original instruction, please read all manual instruction carefully before operating. VEVOR reserves a clear interpretation user manual. The appearance of the product shall be subject to product you received. Please forgive us that we won't inform you there are any technology or software updates on our product.
1. PRODUCT INTRODUCTION
1.1 Product Overview
1.2 Product Features
1.3 Exterior and Inter faces

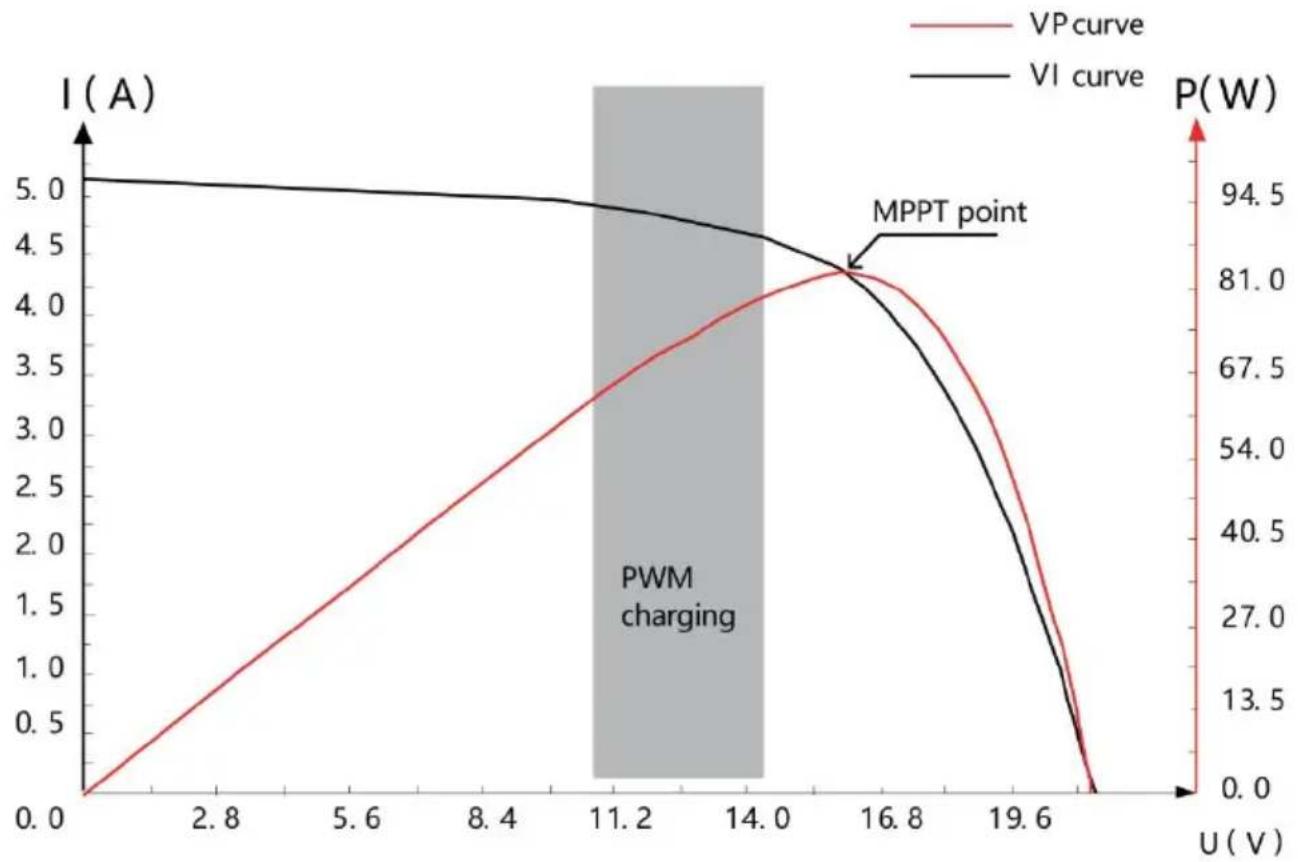
Fig. 1-2 Solar panel output characteristic curve
Fig. 1-3 Relation between solar panel output characteristics and illumination

line
| Temperature (°C) | Open-circuit voltage (V) | Current (A) | | ---------------- | ------------------------ | ----------- | | 20 | High | ~1.0 | | 30 | Medium | ~0.8 | | 40 | Low | ~0.6 | | 50 | Very Low | ~0.4 | | 60 | Very Low | ~0.3 | | 70 | Low | ~0.2 |Fig. 1-4 Relation between solar panel output characteristics and temperature
1.5 Charging Stage Introd ucti ons
line
| Time Segment | Charging Current | | ------------ | ---------------- | | A | Fast charging | | B | Sustaining charging | | C | Floating charging | | Bulk | Boost |
line
| Time Segment | Charging Current | |----------------------|------------------| | Max. current | 10 | | Duration: 2h (range: 10 to 600min) | 10 to 600 min | | Cumulative time: 3h | 3 |Fig. 1-5 SLD Battery charging stages diagram
Fig. 1-6 LI Battery charging stages diagram
a) Ricarica rapida
2. PRODUCT INSTALLATION
2.1 Inst all ation Prec aut ion
2.3 Inst all ation and Wiring
Fig. 2.1 Installation and heat dissipation
natural_image
Simple line drawing of a rectangular frame with four corner handles and a central square (no text or symbols)
natural_image
Technical line drawing of a mechanical component with mounting holes and a side view (no text or symbols)Fase 4: filo
3. PRODUCT OPERATION AND DISPLAY
3.1 LED Indic ator s
flowchart
graph TD
    A[" "] --> B[" "]
    B --> C[" "]
    C --> D[" "]
3.3 LCD Startup and Main Int er fa ce

3.3.1 Startup interface

flowchart
graph TD
    A[" "] --> B[" "]
    B --> C[" "]
    C --> D[" "]
    D --> E[" "]
    E --> F[" "]
flowchart
graph TD
    A["Main monitoring page"] --> B["Component voltage"]
    B --> C["Battery voltage"]
    C --> D["Charging current"]

    subgraph Main monitoring page
        E["12V → 12.3 V"]
        F["Abnormality code"]
        G["8.0"]
        H["Load mode"]
        I["15°"]
        J["Device temperature 40 °C"]
    end

    subgraph Component voltage
        K["0.0 V → 0.0 A"]
    end

    subgraph Charging current
        L["12.3 V → 0.0 A"]
        M["Battery voltage"]
        N["Load current"]
        O["Charging capacity 9 Ah"]
    end

    subgraph Discharging capacity
        P["9 Ah → 21 Ah"]
    end
3.4 Load Mode Setting Inter fac
flowchart
graph LR
    A["Load mode 15"] --> B["Press and hold the Set key to enter 15"]
    B --> C["Tap the Up or Down key to set the mode 16"]
    C --> D["Press and hold the Set key to save and exit 16"]
    D --> E["Tap the Return key to exit without saving 15"]
3.4.3 Manual load on/ off page
Manual operation is effective only when the load mode is manual mode (15), and tap the Set key to switch on/off the load under any main interface.
3.5 System Para meter Settings

flowchart
graph LR
    A["Battery type"] --> B["System voltage"]
    B --> C["Equalizing voltage"]
    C --> D["Boost voltage"]

    E["Over-discharge voltage"] --> F["Over-discharge return voltage"]
    F --> G["Floating charging voltage"]

    H["12V / 24V"] --> I["15.5 V"]
    J["14.4 V"] --> K["13.8 V"]
    L["11.0 V"] --> M["12.6 V"]
4.3 Abnormality Disp lay and Wa rnin gs
line
| Output power (W) | 20 Vmp | 40 Vmp | 60 Vmp | 75 Vmp | | ---------------- | ------ | ------ | ------ | ------ | | 550 | 93.8% | 93.5% | 93.2% | 93.3% | | 525 | 94.0% | 93.7% | 93.4% | 93.1% | | 500 | 94.2% | 93.9% | 93.6% | 92.9% | | 475 | 94.4% | 94.1% | 93.8% | 92.8% | | 450 | 94.6% | 94.3% | 94.0% | 92.7% | | 425 | 94.8% | 94.5% | 94.2% | 92.6% | | 400 | 95.0% | 94.7% | 94.4% | 92.5% | | 375 | 95.1% | 94.8% | 94.5% | 92.4% | | 350 | 95.2% | 94.9% | 94.6% | 92.3% | | 300 | 95.3% | 95.0% | 94.7% | 92.2% | | 250 | 95.4% | 95.1% | 94.8% | 92.1% | | 200 | 95.5% | 95.2% | 94.9% | 91.8% | | 150 | 95.6% | 95.3% | 95.0% | 91.5% | | 100 | 95.7% | 95.4% | 95.1% | 91.2% | | 50 | 95.8% | 95.5% | 95.2% | 91.0% |6.1 24V System Conversion
MPPT 24V conversion efficiency (24V battery)

line
| Output power (W) | 40 Vmp | 50 Vmp | 60 Vmp | 75 Vmp | | ---------------- | ------ | ------ | ------ | ------ | | 1100 | 96% | 96% | 96% | 96% | | 1000 | 96% | 96% | 96% | 96% | | 900 | 96% | 96% | 96% | 96% | | 800 | 96% | 96% | 96% | 96% | | 600 | 96% | 96% | 96% | 96% | | 500 | 96% | 96% | 96% | 96% | | 300 | 96% | 96% | 96% | 96% | | 100 | 94% | 94% | 94% | 94% | | >100 | ~89% | ~89% | ~89% | ~89% |7. PRODUCT DIMENSIONS


ML2420
Product dimensions: 210*151*59.5mm
Hole positions: 154*131mm
Hole diameter: Φ3mm
Applicable wire: max. 8 AWG
8.APP CONTROL FUNCTION
Importato in AUS: SIHAO PTY LTD, 1 ROKEVA STREETEASTWOOD NSW 2122 Australia
Importato negli USA: Sanven Technology Ltd, Suite 250, 9166 Anaheim Place, Rancho Cucamonga, CA 91730
| EC | REP |
SHUNSHUN GmbH
Römeräcker 9 Z2021, 76351
Unit 5 Albert Edward House, The
Pavilions Preston, United Kingdom
Made in China
VEVOR®
TOUGH TOOLS, HALF PRICE
We continue to be committed to provide you tools with competitive price. "Save Half", "Half Price" or any other similar expressions used by us only represent of savings you might benefit from buying certain tools with us compared top brands and does not necessarily mean to cover all categories of tools offered are kindly reminded to verify carefully when you are placing an order with us actually saving half in comparison with the top major brands.
VEVOR®
TOUGH TOOLS, HALF PRICE
ML MAXIMUM POWEF POINT TRACKING (MPPT
MODELO:ML2420

NEED HELP? CONTACT US!
Have product questions? Need technical support? Please feel fr contact us:
Technical Support and E-Warranty Certificate www.vevor.com/support
This is the original instruction, please read all manual instruction carefully before operating. VEVOR reserves a clear interpretation user manual. The appearance of the product shall be subject to product you received. Please forgive us that we won't inform you there are any technology or software updates on our product.
1. PRODUCT INTRODUCTION
1.1 Product Overview
1.2 Product Features
1.3 Exterior and Interface s

bar_line
| U (V) | I (A) - VP curve | I (A) - VI curve | P(W) | |-------|------------------|------------------|------| | 0.0 | 0.0 | 5.0 | 0.0 | | 2.8 | 1.0 | 4.9 | 13.5 | | 5.6 | 2.0 | 4.8 | 27.0 | | 8.4 | 3.0 | 4.7 | 40.5 | | 11.2 | 4.0 | 4.6 | 54.0 | | 14.0 | 4.5 | 4.5 | 67.5 | | 16.8 | 4.3 | 4.3 | 81.0 | | 19.6 | 3.0 | 3.0 | 94.5 | | 22.4 | 0.0 | 0.0 | 94.5 |Fig. 1-2 Solar panel output characteristic curve
Fig. 1-3 Relation between solar panel output characteristics and illumination

line
| Temperature (°C) | Open-circuit voltage (V) | Current (A) | | ---------------- | ------------------------ | ----------- | | 20 | High | ~1.0 | | 30 | Medium | ~0.8 | | 40 | Low | ~0.6 | | 50 | Very Low | ~0.4 | | 60 | Very Low | ~0.3 | | 70 | Low | ~0.2 |Fig. 1-4 Relation between solar panel output characteristics and temperature
1.5 Charging Stage Introd ucti ons
line
| Time Segment | Charging Current | | ------------ | ---------------- | | A | Fast charging | | B | Sustaining charging | | C | Floating charging | | Bulk | Boost |
line
| Time Segment | Charging Current | |----------------------|------------------| | Max. current | 2h | | Cumulative Time | 3h |Fig. 1-5 SLD Battery charging stages diagram
Fig. 1-6 LI Battery charging stages diagram
a) Carga rápida
2. PRODUCT INSTALLATION
2.1 Inst all ation Prec aut ion
2.3 Inst all ation and Wiring

Fig. 2.1 Installation and heat dissipation
natural_image
Simple line drawing of a rectangular frame with four corner handles and a central square (no text or symbols)
natural_image
Technical line drawing of a mechanical component with mounting holes and a side view (no text or symbols)Paso 4: cablear
3. PRODUCT OPERATION AND DISPLAY
3.1 LED Indic ator s
flowchart
graph TD
    A[" "] --> B[" "]
    B --> C[" "]
    C --> D[" "]
3.3 LCD Startup and Main Int er fa ce
3.3.1 Startup interface

flowchart
graph TD
    A[" "] --> B[" "]
    B --> C[" "]
    C --> D[" "]
    D --> E[" "]
    E --> F[" "]
flowchart
graph LR
    A["Load mode 15"] --> B["Press and hold the Set key to enter 15"]
    B --> C["Tap the Up or Down key to set the mode 16"]
    C --> D["Press and hold the Set key to save and exit 16"]
    D --> E["Tap the Return key to exit without saving 15"]
3.4.3 Manual load on/ off page
Manual operation is effective only when the load mode is manual mode (15), and tap the Set key to switch on/off the load under any main interface.
3.5 System Para meter Settings
flowchart
graph LR
    A["Battery type"] --> B["System voltage"]
    B --> C["Equalizing voltage"]
    C --> D["Boost voltage"]

    E["Over-discharge voltage"] --> F["Over-discharge return voltage"]
    F --> G["Floating charging voltage"]

    H["1.0 V"] --> I["12.6 V"]
    I --> J["13.8 V"]
4.3 Abnormality Disp lay and Warning
line
| Output power (W) | 20 Vmp | 40 Vmp | 60 Vmp | 75 Vmp | | ---------------- | ------ | ------ | ------ | ------ | | 550 | 93.8% | 93.5% | 93.2% | 93.3% | | 525 | 94.0% | 93.7% | 93.4% | 93.1% | | 500 | 94.2% | 93.9% | 93.6% | 92.9% | | 475 | 94.4% | 94.1% | 93.8% | 92.8% | | 450 | 94.6% | 94.3% | 94.0% | 92.7% | | 425 | 94.8% | 94.5% | 94.2% | 92.6% | | 400 | 95.0% | 94.7% | 94.4% | 92.5% | | 375 | 95.1% | 94.8% | 94.5% | 92.4% | | 350 | 95.2% | 94.9% | 94.6% | 92.3% | | 300 | 95.3% | 95.0% | 94.7% | 92.2% | | 250 | 95.4% | 95.1% | 94.8% | 92.1% | | 200 | 95.5% | 95.2% | 94.9% | 91.8% | | 150 | 95.6% | 95.3% | 95.0% | 91.5% | | 100 | 95.7% | 95.4% | 95.1% | 91.2% | | 50 | 95.8% | 95.5% | 95.2% | 91.0% |6.1 24V Syste m Conversion
MPPT 24V conversion efficiency (24V battery)
line
| Output power (W) | 40 Vmp | 50 Vmp | 60 Vmp | 75 Vmp | | ---------------- | ------ | ------ | ------ | ------ | | 1100 | 96.2% | 96.3% | 96.4% | 96.5% | | 1000 | 96.1% | 96.4% | 96.5% | 96.6% | | 900 | 96.0% | 96.3% | 96.4% | 96.5% | | 800 | 96.1% | 96.4% | 96.5% | 96.6% | | 600 | 96.2% | 96.5% | 96.6% | 96.7% | | 500 | 96.3% | 96.6% | 96.7% | 96.8% | | 300 | 96.4% | 96.7% | 96.8% | 96.9% | | 100 | 90.0% | 92.0% | 94.0% | 95.0% |7. PRODUCT DIMENSIONS
ML2420
Product dimensions: 210*151*59.5mm
Hole positions: 154*131mm
Hole diameter: Φ3mm
Applicable wire: max. 8 AWG
8.APP CONTROL FUNCTION
Importado a AUS: SIHAO PTY LTD, 1 ROKEVA STREETEASTWOOD NSW 2122 Australia
Importado a EE. UU.: Sanven Technology Ltd, Suite 250, 9166 Anah Place, Rancho Cucamonga, CA 91730
| EC | REP |
SHUNSHUN GmbH
Römeräcker 9 Z2021, 76351
Unit 5 Albert Edward House, The
Pavilions Preston, United Kingdom
Hecho en china
VEVOR®
TOUGH TOOLS, HALF PRICE
We continue to be committed to provide you tools with competitive price. "Save Half", "Half Price" or any other similar expressions used by us only represent of savings you might benefit from buying certain tools with us compared top brands and does not necessarily mean to cover all categories of tools offered are kindly reminded to verify carefully when you are placing an order with us actually saving half in comparison with the top major brands.
VEVOR®
TOUGH TOOLS, HALF PRICE
ML MAXIMUM POWEF POINT TRACKING (MPPT
MODEL:ML2420
NEED HELP? CONTACT US!
Have product questions? Need technical support? Please feel fr contact us:
Technical Support and E-Warranty Certificate www.vevor.com/support
This is the original instruction, please read all manual instruction carefully before operating. VEVOR reserves a clear interpretation user manual. The appearance of the product shall be subject to product you received. Please forgive us that we won't inform you there are any technology or software updates on our product.
1. PRODUCT INTRODUCTION
1.1 Product Overview
1.2 Product Features
1.3 Exterior and Inter face s
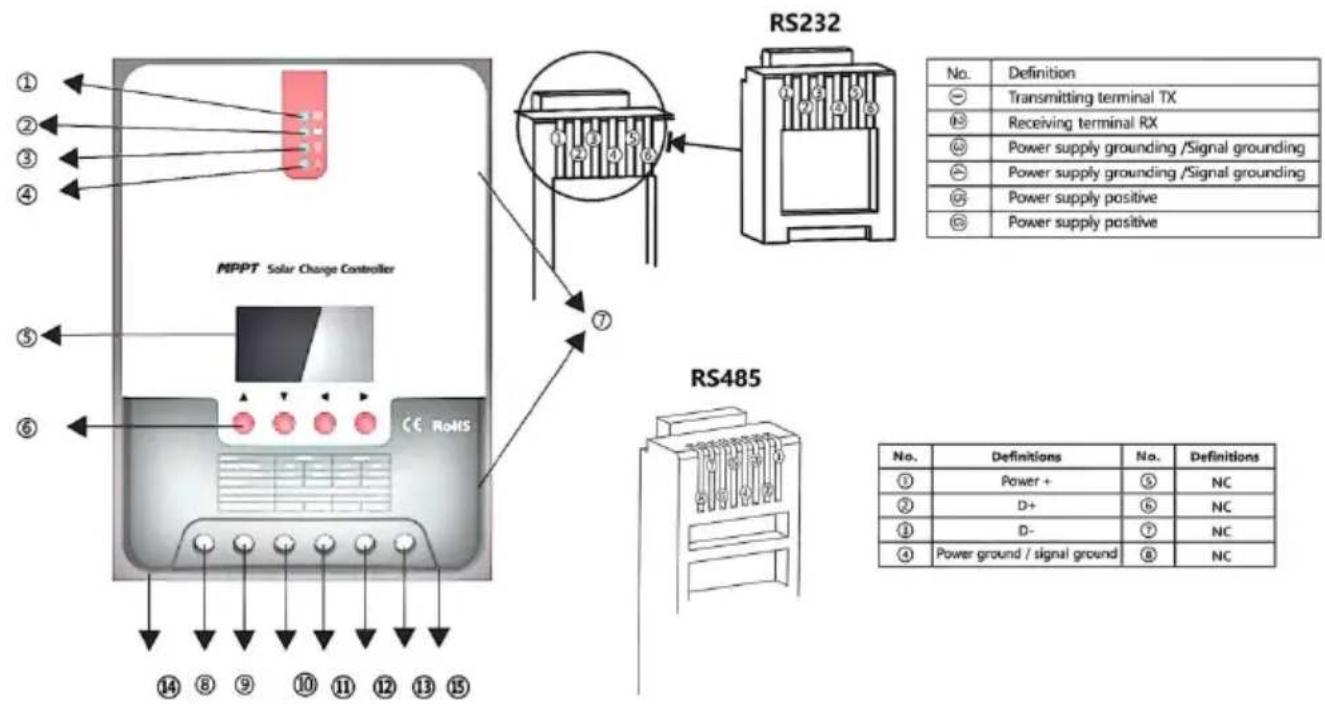

Fig. 1-2 Solar panel output characteristic curve
line
| U(V) | Current (A) | |------|-------------| | Low | High | | Mid | Decreasing | | High | Decreasing |Fig. 1-3 Relation between solar panel output characteristics and illumination

line
| Temperature (°C) | Open-circuit voltage (V) | Current (A) | | ---------------- | ------------------------ | ----------- | | 20 | High | ~1.0 | | 30 | Medium | ~0.8 | | 40 | Low | ~0.6 | | 50 | Very Low | ~0.4 | | 60 | Very Low | ~0.3 | | 70 | Low | ~0.2 |Fig. 1-4 Relation between solar panel output characteristics and temperature
1.5 Charging Stage Introd ucti ons
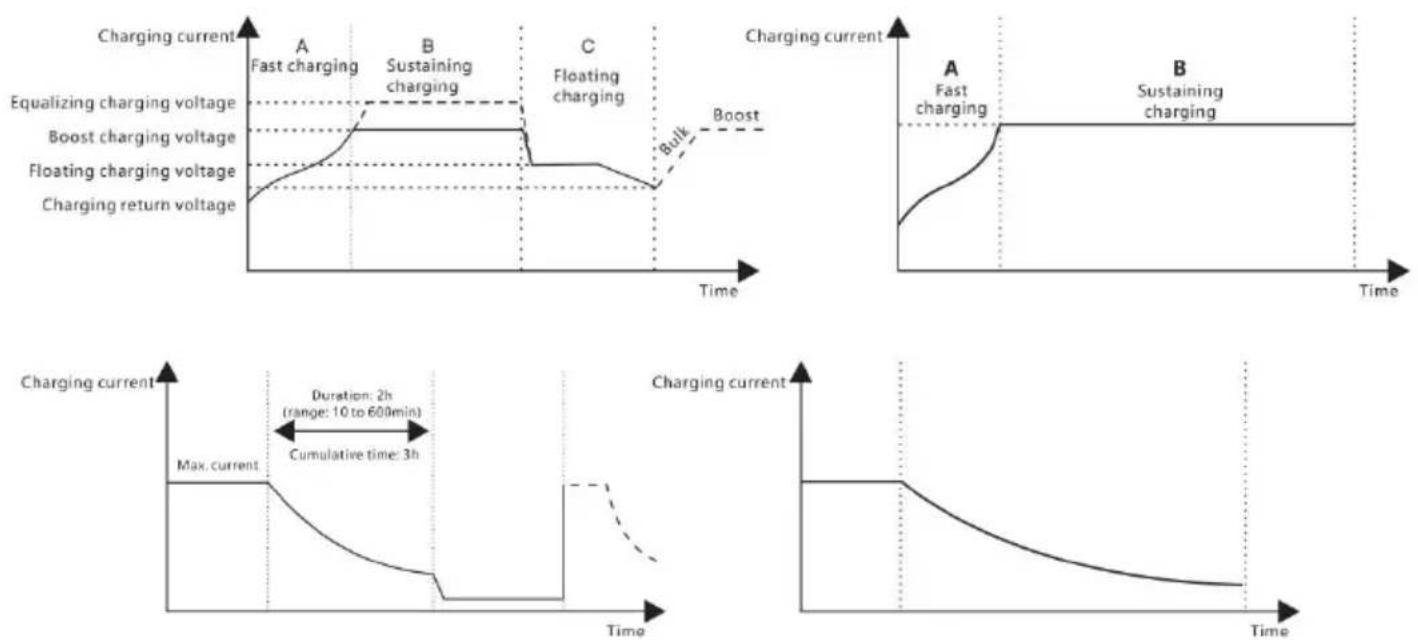
Fig. 1-5 SLD Battery charging stages diagram
Fig. 1-6 LI Battery charging stages diagram
2. PRODUCT INSTALLATION
2.1 Inst all ation Prec aut ion
Fig. 2.1 Installation and heat dissipation
natural_image
Simple line drawing of a rectangular frame with four corner handles and a central handle, no text or symbols present.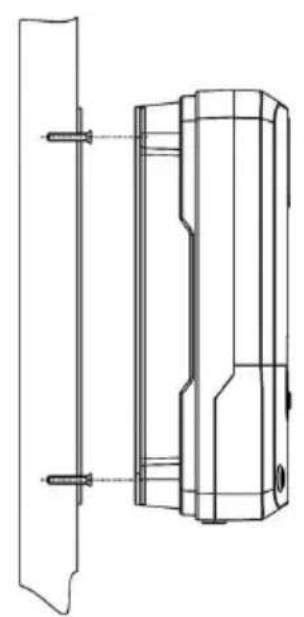
natural_image
Technical line drawing of a mechanical component with mounting holes and a side view (no text or symbols)Krok 4: drut
3. PRODUCT OPERATION AND DISPLAY
3.1 LED Indic ator s
flowchart
graph TD
    A[" "] --> B[" "]
    B --> C[" "]
    C --> D[" "]
3.3 LCD Startup and Main Int er fa ce

3.3.1 Startup interface

flowchart
graph TD
    A[" "] --> B[" "]
    B --> C[" "]
    C --> D[" "]
    D --> E[" "]
    E --> F[" "]
    F --> G[" "]
flowchart
graph LR
    A["Load mode 15"] --> B["Press and hold the Set key to enter 15"]
    B --> C["Tap the Up or Down key to set the mode 16"]
    C --> D["Press and hold the Set key to save and exit 16"]
    D --> E["Tap the Return key to exit without saving 15"]
3.4.3 Manual load on/ off page
Manual operation is effective only when the load mode is manual mode (15), and tap the Set key to switch on/off the load under any main interface.
3.5 System Para meter Settings

flowchart
graph LR
    A["Battery type"] --> B["System voltage"]
    B --> C["Equalizing voltage"]
    C --> D["Boost voltage"]

    E["Over-discharge voltage"] --> F["Over-discharge return voltage"]
    F --> G["Floating charging voltage"]

    H["12V / 24V"] --> I["15.5 V"]
    J["14.4 V"] --> K["13.8 V"]
    L["11.0 V"] --> M["12.6 V"]
4.3 Abnormality Disp lay and Wa rnings
line
| Output power (W) | 20 Vmp | 40 Vmp | 60 Vmp | 75 Vmp | | ---------------- | ------ | ------ | ------ | ------ | | 550 | 94% | 93.5% | 93% | 93.5% | | 500 | 94.5% | 93.8% | 93.2% | 92.8% | | 475 | 94.8% | 94.0% | 93.5% | 93.0% | | 450 | 95% | 94.2% | 93.8% | 93.2% | | 425 | 95.2% | 94.5% | 94% | 93.5% | | 400 | 95.5% | 94.8% | 94.2% | 93.8% | | 375 | 95.6% | 95% | 94.5% | 94% | | 350 | 95.7% | 95.2% | 94.8% | 94.2% | | 300 | 95.8% | 95.3% | 95% | 94.5% | | 250 | 95.9% | 95.4% | 95.2% | 94.8% | | 200 | 95.8% | 95.3% | 95% | 94.5% | | 150 | 95.7% | 95.2% | 94.8% | 94.2% | | 100 | 95.6% | 95.1% | 94.5% | 93.8% | | 50 | 95.5% | 94.8% | 93.8% | 91.0% |6.1 24V Syste m Conversion
MPPT 24V conversion efficiency (24V battery)
line
| Output power (W) | 40 Vmp | 50 Vmp | 60 Vmp | 75 Vmp | | ---------------- | ------ | ------ | ------ | ------ | | 1100 | 96% | 96% | 96% | 96% | | 1000 | 96% | 96% | 96% | 96% | | 900 | 96% | 96% | 96% | 96% | | 800 | 96% | 96% | 96% | 96% | | 600 | 96% | 96% | 96% | 96% | | 500 | 96% | 96% | 96% | 96% | | 300 | 96% | 96% | 96% | 96% | | 100 | 94% | 94% | 94% | 94% | | >100 | ~86% | ~86% | ~86% | ~86% |7. PRODUCT DIMENSIONS


ML2420
Product dimensions: 210*151*59.5mm
Hole positions: 154*131mm
Hole diameter: Φ3mm
Applicable wire: max. 8 AWG
8.APP CONTROL FUNCTION
STREETEASTWOOD NSW 2122 Australia
Importowane do USA: Sanven Technology Ltd, Suite 250, 9166 Anar Place, Rancho Cucamonga, CA 91730
| EC | REP |
SHUNSHUN GmbH
Römeräcker 9 Z2021, 76351
Unit 5 Albert Edward House, The
Pavilions Preston, United Kingdom
ML MAXIMUM POWER POINT TRACKING (MPPT)-SERIE
We continue to be committed to provide you tools with competitive price. "Save Half", "Half Price" or any other similar expressions used by us only represent of savings you might benefit from buying certain tools with us compared top brands and does not necessarily mean to cover all categories of tools offered are kindly reminded to verify carefully when you are placing an order with us actually saving half in comparison with the top major brands.
VEVOR®
TOUGH TOOLS, HALF PRICE
ML MAXIMUM POWEF POINT TRACKING (MPPT
MODEL:ML2420

NEED HELP? CONTACT US!
Have product questions? Need technical support? Please feel fr contact us:
Technical Support and E-Warranty Certificate www.vevor.com/support
This is the original instruction, please read all manual instruction carefully before operating. VEVOR reserves a clear interpretation user manual. The appearance of the product shall be subject to product you received. Please forgive us that we won't inform you there are any technology or software updates on our product.
1. PRODUCT INTRODUCTION
1.1 Product Overview
1.2 Product Features
1.3 Exterior and Interfaces
bar_line
| U (V) | I (A) - VP curve | I (A) - VI curve | P(W) | |-------|------------------|------------------|------| | 0.0 | 0.0 | 5.0 | 0.0 | | 2.8 | 1.0 | 4.9 | 13.5 | | 5.6 | 2.0 | 4.8 | 27.0 | | 8.4 | 3.0 | 4.7 | 40.5 | | 11.2 | 4.0 | 4.6 | 54.0 | | 14.0 | 4.5 | 4.5 | 67.5 | | 16.8 | 4.3 | 4.3 | 81.0 | | 19.6 | 3.0 | 3.0 | 94.5 | | 22.4 | 0.0 | 0.0 | 94.5 |Fig. 1-2 Solar panel output characteristic curve
Fig. 1-3 Relation between solar panel output characteristics and illumination

line
| Temperature (°C) | Open-circuit voltage (V) | Current (A) | | ---------------- | ------------------------ | ----------- | | 20 | High | ~1.0 | | 30 | Medium | ~0.8 | | 40 | Low | ~0.6 | | 50 | Very Low | ~0.4 | | 60 | Very Low | ~0.3 | | 70 | Low | ~0.2 |Fig. 1-4 Relation between solar panel output characteristics and temperature
1.5 Charging Stage Introd ucti ons
line
| Time Segment | Charging Current | Voltage Stage | | ------------ | ---------------- | ------------- | | A | Fast | Fast charging | | B | Sustaining | Sustaining charging | | C | Floating | Floating charging | | D | Bulk | Bulk |
line
| Time Segment | Charging Current | | ------------ | ---------------- | | Max. current | 10 | | Cumulative time | 3 |Fig. 1-5 SLD Battery charging stages diagram
Fig. 1-6 LI Battery charging stages diagram
a) Snel opladen
2. PRODUCT INSTALLATION
2.1 Inst all ation Prec aut ion
2.3 Inst all ation and Wiring

Fig. 2.1 Installation and heat dissipation
natural_image
Simple line drawing of a rectangular frame with four corner handles and a central square (no text or symbols)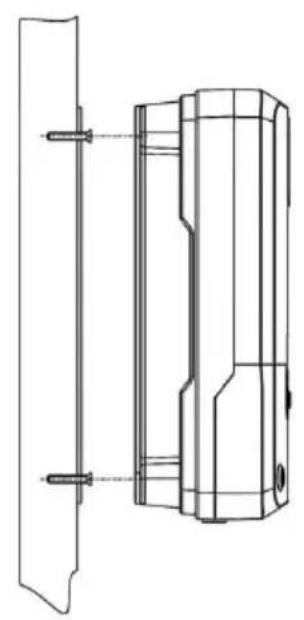
natural_image
Technical line drawing of a mechanical component with mounting holes and a cylindrical housing (no text or symbols)Stap 4: draad
3. PRODUCT OPERATION AND DISPLAY
3.1 LED Indic ator s
  |  | PV reeks indicat | Indiceren de controller ' s huidig opladen modus . |
  |  | KNUPPEL indicator | Indiceren de batterij ' s huidig staat . |
  |  | LADEN indicator | Indiceren de ladingen ' Aan / Uit En staat . |
  |  | FOUT indicator | Indiceren of de regelaar is functioneren normaal gesproken . |
PV-array-indicator:
flowchart
graph TD
    A[" "] --> B[" "]
    B --> C[" "]
    C --> D[" "]
3.3 LCD Startup and Main Int er fa ce

3.3.1 Startup interface
flowchart
graph TD
    A[" "] --> B[" "]
    B --> C[" "]
    C --> D[" "]
    D --> E[" "]
    E --> F[" "]
flowchart
graph TD
    A["Main monitoring page"] --> B["Component voltage"]
    B --> C["Battery voltage"]
    C --> D["Charging current"]

    subgraph Main monitoring page
        E["12V → 12.3 V"]
        F["Abnormality code"]
        G["Load mode"]
        H["Device temperature 40 °C"]
    end

    subgraph Component voltage
        I["0.0 V → 0.0 A"]
        J["15 V → Load mode"]
        K["Discharging capacity 9 Ah"]
    end

    subgraph Charging current
        L["0.00 A → 12.3 V"]
        M["Load current 0.00 A"]
        N["Charging capacity 21 Ah"]
    end
3.4 Load Mode Setting Inter fac
3.4.1 Inleiding tot laadmodi
flowchart
graph LR
    A["Load mode 15"] --> B["Press and hold the Set key to enter 15"]
    B --> C["Tap the Up or Down key to set the mode 16"]
    C --> D["Press and hold the Set key to save and exit 16"]
    D --> E["Tap the Return key to exit without saving 15"]
3.4.3 Manual load on/ off page
Manual operation is effective only when the load mode is manual mode (15), and tap the Set key to switch on/off the load under any main interface.
3.5 System Para meter Settings

flowchart
graph LR
    A["Battery type"] --> B["System voltage"]
    B --> C["Equalizing voltage"]
    C --> D["Boost voltage"]

    E["Over-discharge voltage"] --> F["Over-discharge return voltage"]
    F --> G["Floating charging voltage"]

    H["12V / 24V"] --> I["15.5 V"]
    J["1.0 V"] --> K["12.6 V"]
    L["13.8 V"] --> M["FLOAT"]
4.3 Abnormality Disp lay and Wa rnings
line
| Output power (W) | 20 Vmp | 40 Vmp | 60 Vmp | 75 Vmp | | ---------------- | ------ | ------ | ------ | ------ | | 550 | 93.8% | 93.5% | 93.2% | 93.3% | | 525 | 94.0% | 93.7% | 93.4% | 93.1% | | 500 | 94.2% | 93.9% | 93.6% | 92.8% | | 475 | 94.4% | 94.1% | 93.8% | 92.9% | | 450 | 94.6% | 94.3% | 94.0% | 93.0% | | 425 | 94.8% | 94.5% | 94.2% | 93.1% | | 400 | 95.0% | 94.7% | 94.4% | 93.2% | | 375 | 95.1% | 94.8% | 94.5% | 93.3% | | 350 | 95.2% | 94.9% | 94.6% | 93.4% | | 300 | 95.3% | 95.0% | 94.7% | 93.5% | | 250 | 95.4% | 95.1% | 94.8% | 93.6% | | 200 | 95.5% | 95.2% | 94.9% | 93.7% | | 150 | 95.6% | 95.3% | 95.0% | 93.8% | | 100 | 95.7% | 95.4% | 95.1% | 93.9% | | 50 | 95.8% | 95.5% | 95.2% | 94.0% |6.1 24V Syste m Conversion
MPPT 24V conversion efficiency (24V battery)

line
| Output power (W) | 40 Vmp | 50 Vmp | 60 Vmp | 75 Vmp | | ---------------- | ------ | ------ | ------ | ------ | | 1100 | 96% | 96% | 96% | 96% | | 1000 | 96% | 96% | 96% | 96% | | 900 | 96% | 96% | 96% | 96% | | 800 | 96% | 96% | 96% | 96% | | 600 | 96% | 96% | 96% | 96% | | 500 | 96% | 96% | 96% | 96% | | 300 | 96% | 96% | 96% | 96% | | 100 | 94% | 94% | 94% | 94% | | >100 | ~86% | ~86% | ~86% | ~86% |7. PRODUCT DIMENSIONS


ML2420
Product dimensions: 210*151*59.5mm
Hole positions: 154*131mm
Hole diameter: Φ3mm
Applicable wire: max. 8 AWG
8.APP CONTROL FUNCTION
Anaheim Place, Rancho Cucamonga, CA 91730
| EC | REP |
SHUNSHUN GmbH
Römeräcker 9 Z2021, 76351
Unit 5 Albert Edward House, The
Pavilions Preston, United Kingdom
Gemaakt in China
VEVOR®
TOUGH TOOLS, HALF PRICE
Technisch Ondersteuning en E-garantiecertificaat www.vevor.com/support
VEVOR®
TOUGH TOOLS, HALF PRICE
ML MAXIMUM POWER POINT TRACKING (MPPT)-SERIEN
ML2420 SOLAR CHARGE AND DISCHARGE CONTROLLER
ANVÄNDARMANUAL
We continue to be committed to provide you tools with competitive price. "Save Half", "Half Price" or any other similar expressions used by us only represent of savings you might benefit from buying certain tools with us compared top brands and does not necessarily mean to cover all categories of tools offered are kindly reminded to verify carefully when you are placing an order with us actually saving half in comparison with the top major brands.
VEVOR®
TOUGH TOOLS, HALF PRICE
ML MAXIMUM POWEF POINT TRACKING (MPPT
MODELL: ML2420

NEED HELP? CONTACT US!
Have product questions? Need technical support? Please feel fr contact us:
Technical Support and E-Warranty Certificate www.vevor.com/support
This is the original instruction, please read all manual instruction carefully before operating. VEVOR reserves a clear interpretation user manual. The appearance of the product shall be subject to product you received. Please forgive us that we won't inform you there are any technology or software updates on our product.
1. PRODUCT INTRODUCTION
1.1 Product Overview
1.2 Product Features
1.3 Exterior and Interface s

bar_line
| U (V) | I (A) - VP curve | I (A) - VI curve | P(W) | |-------|------------------|------------------|------| | 0.0 | 0.0 | 5.0 | 0.0 | | 2.8 | 0.5 | 4.9 | 13.5 | | 5.6 | 1.0 | 4.8 | 27.0 | | 8.4 | 1.5 | 4.7 | 40.5 | | 11.2 | 2.0 | 4.6 | 54.0 | | 14.0 | 2.5 | 4.5 | 67.5 | | 16.8 | 3.0 | 4.4 | 81.0 | | 19.6 | 3.5 | 4.3 | 94.5 | | 22.4 | 4.0 | 4.2 | 94.5 |Fig. 1-2 Solar panel output characteristic curve
Fig. 1-3 Relation between solar panel output characteristics and illumination

line
| Temperature (°C) | Open-circuit voltage (V) | Current (A) | | ---------------- | ------------------------ | ----------- | | 20 | High | ~1.0 | | 30 | Medium | ~0.8 | | 40 | Low | ~0.6 | | 50 | Very Low | ~0.4 | | 60 | Very Low | ~0.3 | | 70 | Low | ~0.2 |Fig. 1-4 Relation between solar panel output characteristics and temperature
1.5 Charging Stage Introd ucti ons
line
| Time | Charging Current (A) | Charging Current (B) | Charging Current (C) | | :--- | :--- | :--- | :--- | | Start | Fast charging | Sustaining charging | Bulk | | Peak | Equalizing charging voltage | Sustaining charging | Boost | | End | Free charging | Sustaining charging | Bulk | | Final | Fast charging | Sustaining charging | Bulk |
line
| Time Segment | Charging Current | |----------------------|------------------| | Max. current | 10 | | Duration: 2h (range: 10 to 600min) | 10 to 600 min | | Cumulative time: 3h | 3 |Fig. 1-5 SLD Battery charging stages diagram
Fig. 1-6 LI Battery charging stages diagram
a) Snabbladdning
2. PRODUCT INSTALLATION
2.1 Inst all ation Prec aut ion
2.3 Inst all ation and Wiring

Varning: explosionsrisk! Installera aldrig
Fig. 2.1 Installation and heat dissipation
Steg 1: välj installationsplats
natural_image
Simple line drawing of a rectangular frame with four corner handles and a central square (no text or symbols)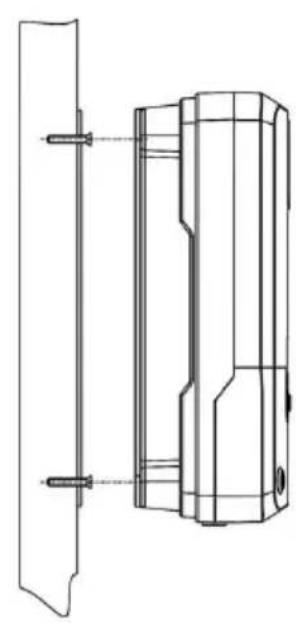
natural_image
Technical line drawing of a mechanical component with mounting holes and internal features (no text or symbols)Steg 4: tråd
3. PRODUCT OPERATION AND DISPLAY
3.1 LED Indic ator s
flowchart
graph TD
    A[" "] --> B[" "]
    B --> C[" "]
    C --> D[" "]
3.3 LCD Startup and Main Interface
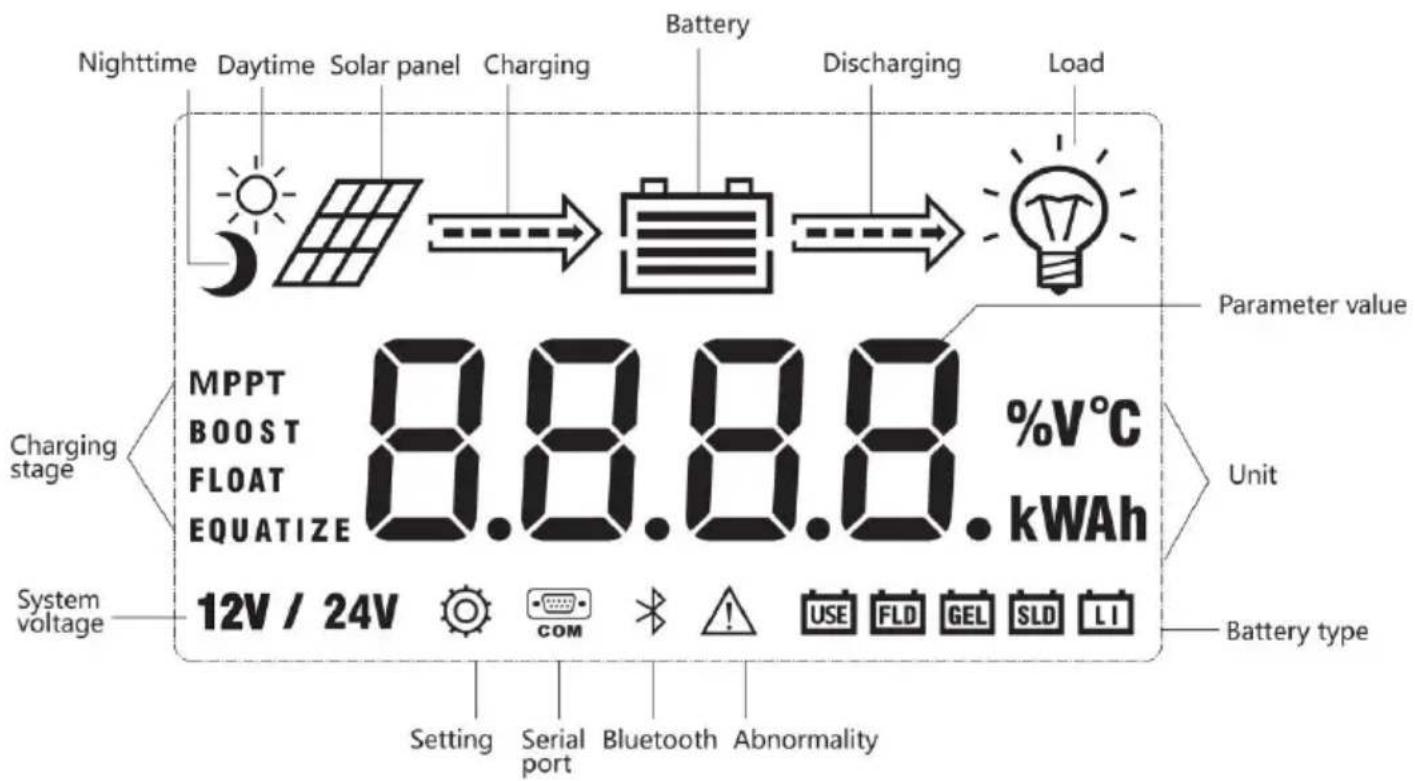
3.3.1 Startup interface

flowchart
graph TD
    A[" "] --> B[" "]
    B --> C[" "]
    C --> D[" "]
    D --> E[" "]
    E --> F[" "]
    F --> G[" "]
flowchart
graph LR
    A["Load mode 15"] --> B["Press and hold the Set key to enter 15"]
    B --> C["Tap the Up or Down key to set the mode 16"]
    C --> D["Press and hold the Set key to save and exit 16"]
    D --> E["Tap the Return key to exit without saving 15"]
3.4.3 Manual load on/ off page
Manual operation is effective only when the load mode is manual mode (15), and tap the Set key to switch on/off the load under any main interface.
3.5 System Para meter Settings

flowchart
graph LR
    A["Battery type"] --> B["System voltage"]
    B --> C["Equalizing voltage"]
    C --> D["Boost voltage"]

    E["Over-discharge voltage"] --> F["Over-discharge return voltage"]
    F --> G["Floating charging voltage"]

    H["12V / 24V"] --> I["15.5 V"]
    J["1.0 V"] --> K["12.6 V"]
    L["13.8 V"] --> M["FLOAT"]
Klassificering: IP32
4.3 Abnormality Disp lay and War nings
line
| Output power (W) | 20 Vmp | 40 Vmp | 60 Vmp | 75 Vmp | | ---------------- | ------ | ------ | ------ | ------ | | 550 | 93.8% | 93.5% | 93.2% | 93.3% | | 525 | 94.0% | 93.7% | 93.4% | 93.1% | | 500 | 94.2% | 93.9% | 93.6% | 92.9% | | 475 | 94.4% | 94.1% | 93.8% | 92.8% | | 450 | 94.6% | 94.3% | 94.0% | 92.7% | | 425 | 94.8% | 94.5% | 94.2% | 92.6% | | 400 | 95.0% | 94.7% | 94.4% | 92.5% | | 375 | 95.1% | 94.8% | 94.5% | 92.4% | | 350 | 95.2% | 94.9% | 94.6% | 92.3% | | 300 | 95.3% | 95.0% | 94.7% | 92.2% | | 250 | 95.4% | 95.1% | 94.8% | 92.1% | | 200 | 95.5% | 95.2% | 94.9% | 91.8% | | 150 | 95.6% | 95.3% | 95.0% | 91.5% | | 100 | 95.7% | 95.4% | 95.1% | 91.2% | | 50 | 95.8% | 95.5% | 95.2% | 91.0% |6.1 24V System Conversion
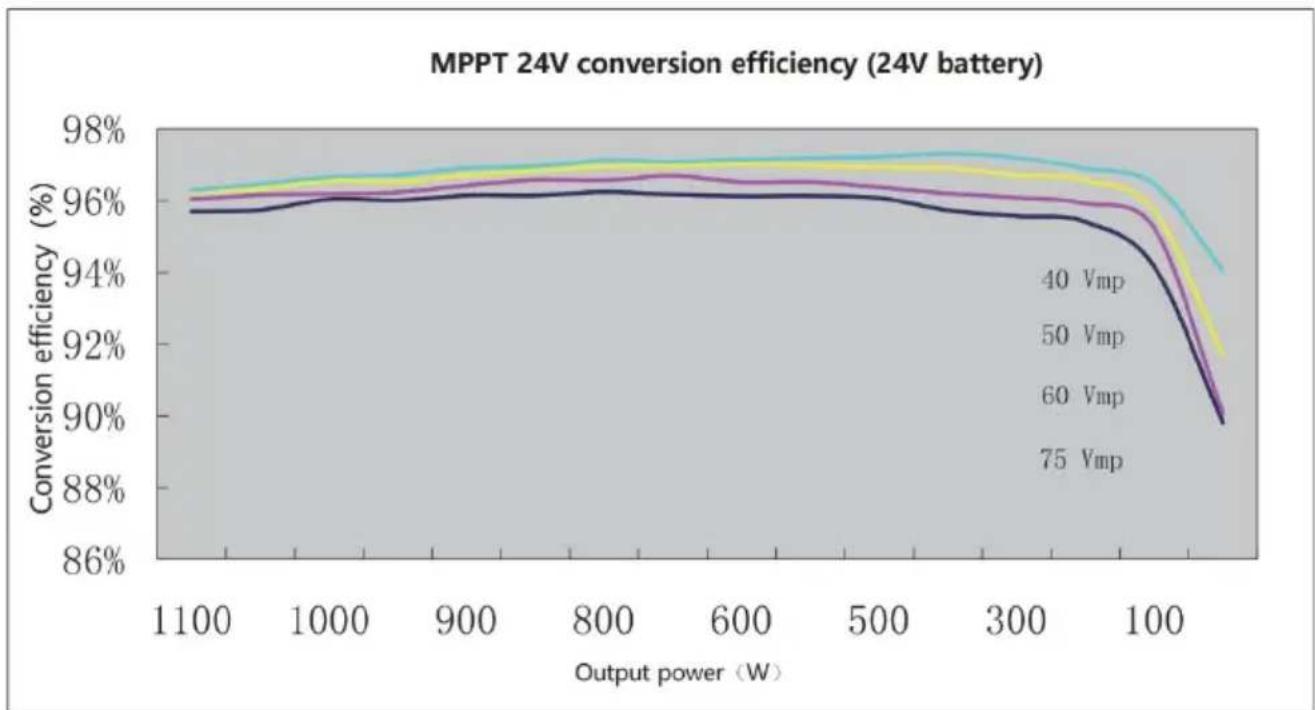
line
| Output power (W) | 40 Vmp | 50 Vmp | 60 Vmp | 75 Vmp | | ---------------- | ------ | ------ | ------ | ------ | | 1100 | 96% | 96% | 96% | 96% | | 1000 | 96% | 96% | 96% | 96% | | 900 | 96% | 96% | 96% | 96% | | 800 | 96% | 96% | 96% | 96% | | 600 | 96% | 96% | 96% | 96% | | 500 | 96% | 96% | 96% | 96% | | 300 | 96% | 96% | 96% | 96% | | 100 | 94% | 94% | 94% | 94% | | >100 | ~86% | ~86% | ~86% | ~86% |7. PRODUCT DIMENSIONS
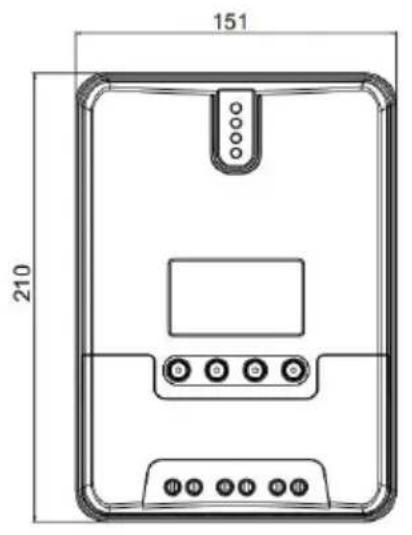
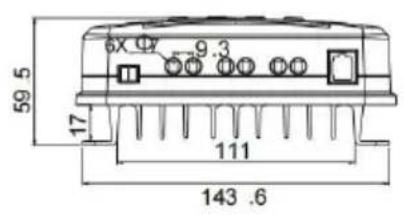
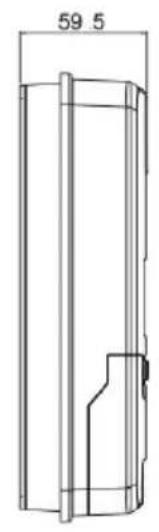
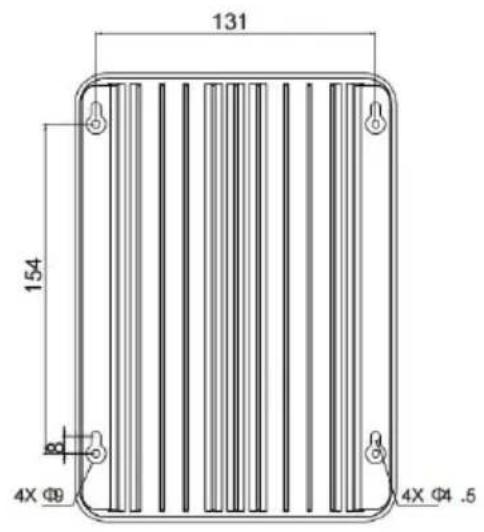
ML2420
Product dimensions: 210*151*59.5mm
Hole positions: 154*131mm
Hole diameter: Φ3mm
Applicable wire: max. 8 AWG
8.APP CONTROL FUNCTION
Unit 5 Albert Edward House, The
Pavilions Preston, United Kingdom
Tillverkad i Kina
VEVOR®
TOUGH TOOLS, HALF PRICE