DL53 - Measuring equipment MULTIMETRIX - Free user manual and instructions
Find the device manual for free DL53 MULTIMETRIX in PDF.

| Brand | Multimetrix |
| Model | DL53 |
| Product type | Data Logger |
| Power supply | Battery (type not specified, replace if necessary) |
| Communication interface | USB |
| Measured quantities | Temperature and Relative Humidity |
| Temperature units | Celsius or Fahrenheit (selectable) |
| Number of sampling points | Configurable (up to 50 by default) |
| Sampling rate | Adjustable (2 seconds by default) |
| LED blink cycle | Adjustable (10, 20 or 30 seconds) |
| Alarms | Programmable high and low for temperature and humidity |
| LED indication | Green (sampling) and red/yellow (alarm) |
| Start modes | Manual or instant |
| Provided software | Datalogger Graph Software on CD |
| Data export formats | .rec (proprietary), .txt, .xls, .bmp |
| System compatibility | Windows |
| Box contents | Data logger, software CD, user manual |
| Maintenance | Replace battery if discharged; do not leave connected to USB unnecessarily to save battery |
| Safety instructions | Use a new battery for important recordings; check charge level before use |
| Available spare parts | Battery (not supplied) |
Frequently Asked Questions - DL53 MULTIMETRIX
User questions about DL53 MULTIMETRIX
0 question about this device. Answer the ones you know or ask your own.
Ask a new question about this device
Download the instructions for your Measuring equipment in PDF format for free! Find your manual DL53 - MULTIMETRIX and take your electronic device back in hand. On this page are published all the documents necessary for the use of your device. DL53 by MULTIMETRIX.
USER MANUAL DL53 MULTIMETRIX
natural_image
Technical line drawing of a mechanical component with no visible text or symbolsFRANÇAIS ENGLISH DEUTSCH ITALIANO ESPAÑOL
For additional information refer to the user guide included on the supplied program disk.
CONTENTS
■ QUICK START GUIDE .... 14
■ INSTALLING GRAPH SOFTWARE 15
■ INSTALLING USB DRIVER 15
■ MENU BAR DESCRIPTION.... 15
■ LOGGER SETUP 16
■ LOGGING READINGS 18
■ DOWNLOAD READINGS TO PC 18
■ DATA GRAPH 20
■ SAVE AND OPEN DATA FILES 22
■ PRINT LOGGED DATA 23
QUICK START GUIDE
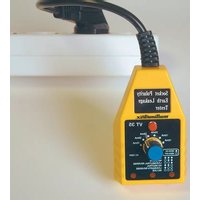
- Remove the semi-transparent cap from the Datalogger.
- Install the battery in the Datalogger. If battery has been installed, you'd better make sure the battery in the Datalogger is sufficient to finish your task. For more details, see USER'S GUIDE.
- Insert the Datalogger into a free USB port on your computer. The computer will automatically detect the presence of the Datalogger and start the hardware installation process.
- Double-click the Datalogger icon on your desktop to launch the graph software. You will see the Main Screen.
- Set up and start the Data Logger and follow the setup procedure:
-Select the Start Mode
-Enter the Logger Name
-Select the Sample Point
-Select the LED Flash Cycle
-Confirm whether LEDs flash when the logging exceed the configured alarm level.
-Select the Unit for Temperature.
-Enter Low Alarm and High Alarm for Temperature and Relative Humidity.
-Then click the Setup button
-
The summary screen will appear.
-
Remove the Logger from the computer and place it in the location where you want to measure temperature.
Notes: When the Logger is connected to the USB port, the battery inside the Data Logger is discharged at a higher rate than normal. To conserve battery life, do not leave the Logger connected to the USB port for a prolonged period of time.
INSTALLING GRAPH SOFTWARE
- Start Windows
- Insert the CD into the CD-drive of your computer.
- Run SETUP.EXE installation program on the CD, install it to the referred file directory.
- The datalogger icon will be built on your desktop.
INSTALLING USB DRIVER
- Insert the datalogger into a USB port on the computer.
- Then the Windows system will show finding a new hardware.
- Ensure the CD is in the CD-drive.
- Choose specific directory to the CD in the CD-Drive.
- The Windows system will start copying USB driver to your computer.
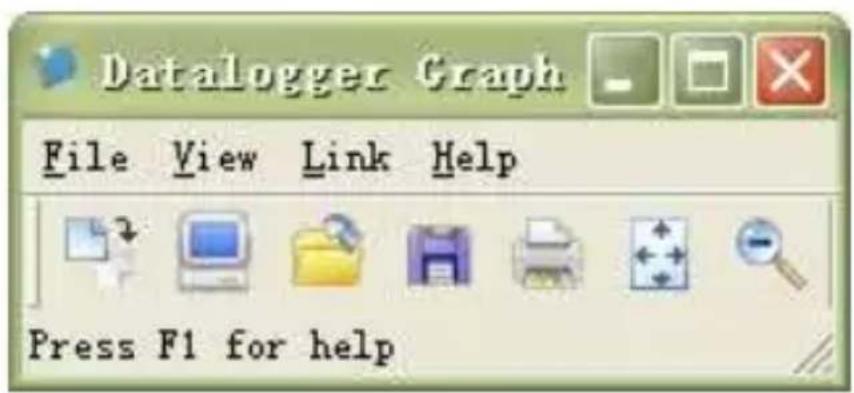
MENU BAR
text_image
Datalogger Graph File View Link Help Press F1 for helpFrom left to right the menu bar icons represent DATA DOWNLOAD, LOGGER SETUP, FILE OPEN, FILE SAVE-AS, FILE PRINT, VIEW ALL, and ZOOM. In addition, the FILE, VIEW, LINK, and HELP pull-down menus are available here. All will be discussed in the following paragraphs. Start by setting up the Logger as explained in the following section.
LOGGER SETUP
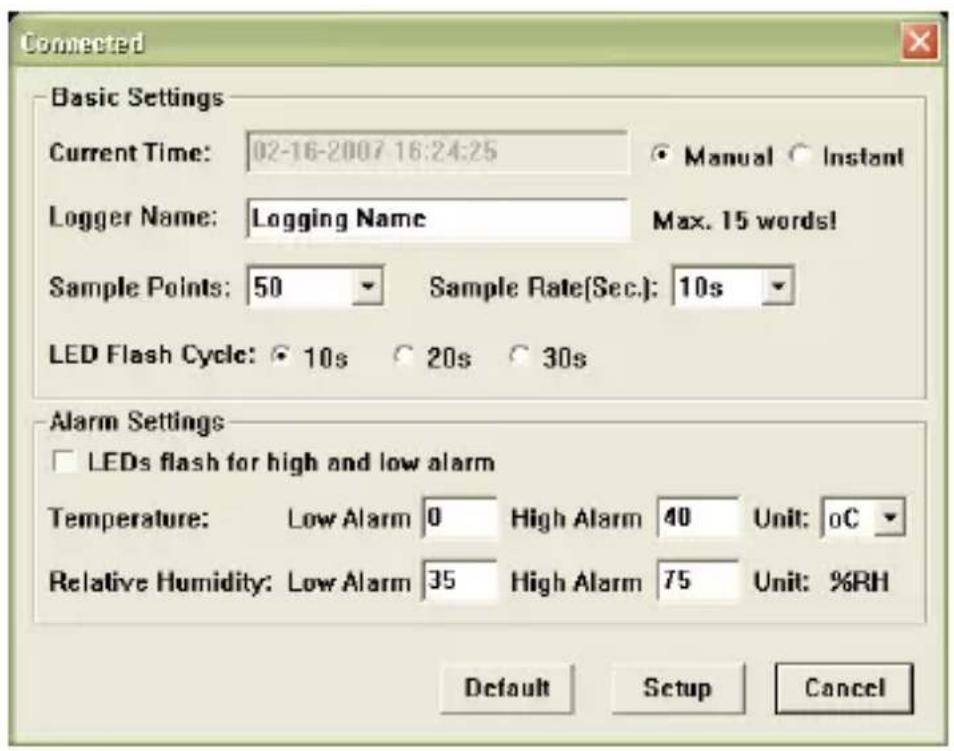
Click on the computer icon on the menu bar (2nd from left) or select LOGGER SET from the LINK pull-down menu. The Setup window will appear as shown below; descriptions for each field in the Setup window are listed directly below the illustration:
text_image
Connected Basic Settings Current Time: 02-16-2007 16:24:25 Logger Name: Logging Name Max. 15 words! Sample Points: 50 Sample Rate(Sec.): 10s LED Flash Cycle: 10s 20s 30s Alarm Settings □ LEDs flash for high and low alarm Temperature: Low Alarm 0 High Alarm 40 Unit: oC Relative Humidity: Low Alarm 35 High Alarm 75 Unit: %RH Default Setup Cancel■ The CURRENT TIME field will automatically synchronize with the PC date and time setting
■ The MANUAL and INSTANT select buttons allow the user to start datalogging immediately when the Setup window is exited (INSTANT) or at a later time (MANUAL). Explained in the LOGGING READINGS section
■ The LOGGER NAME field allows the user to select a unique name for the logger
■ The SAMPLE POINTS field instructs the logger to take a finite number of readings
■ The SAMPLE RATE pull-down menu instructs the logger to log readings at a specific rate
■ The LED Flash Cycle can be set by the user (the longer the time, the longer the battery life)
The ALARM SETTINGS portion of the SETUP window allows the user to set HIGH and LOW temperature/RH limits and disable the flashing of the Logger's LEDs thereby conserving battery energy
Click on the SETUP button to save changes. Press the DEFAULT button to set the Logger to factory default condition. Press the CANCEL button to abort the setup.
Notes: Any stored data will be permanently erased when Setup is finished. To enable you to save this data before it is lost, click Cancel and then you need to download data.
The battery will in all likelihood run out before logger will have finished specified sample points. Always ensure that the remaining charge in the battery is sufficient to last the complete duration of your logging exercise. If in doubt, we recommend that you always install a fresh battery before logging critical data.
LOGGING READINGS
If INSTANT was selected in the SETUP window, the Logger begins logging at the instant the SETUP button is pressed. If MANUAL was selected, the Logger must be manually started by pressing and holding the Logger's yellow button for approx. 3 seconds or until the two LEDs on the Logger flash at the same time.
Logging will continue at the programmed sample rate until the number of readings (sample points) specified in the Setup window is reached.
The green LED flashes once per sample point and the red or yellow LED flashes when user programmed alarm limits are exceeded. For details, see LED status guide.
DOWNLOAD READINGS TO PC
To transfer the readings stored in the Logger to the PC:
- Connect the Logger to the same USB port used when the Logger was initialised
- Open the Datalogger software program if it is not still running
- Click the Download icon (1 ^st on the left) or select Data Download from the LINK pull-down menu
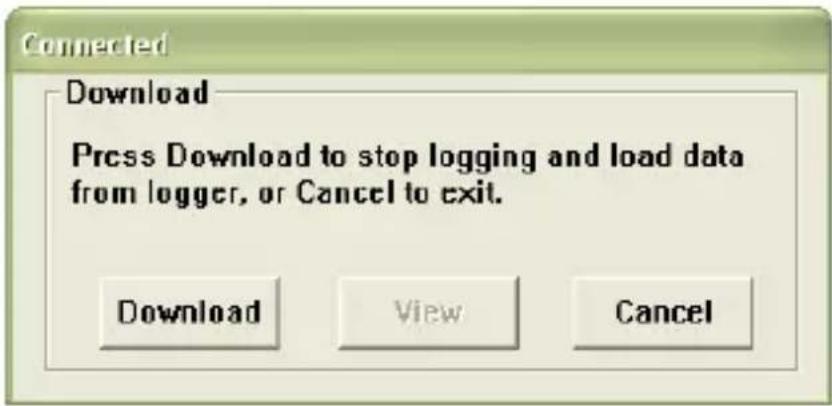
- The Window shown below will appear. Press DOWNLOAD to begin transferring readings
text_image
Connected Download Press Download to stop logging and load data from logger, or Cancel to exit. Download View CancelIf readings are successfully transferred, the VIEW screen and the SAVE screen (both shown below) will appear.
In the SAVE screen, name the file and save it to a convenient location. At a later time, the user can select SAVE-AS and save the data as an Excel, Text, or Bitmap file (explained in next section), however, the data in this case is saved as an .rec file for use in this program only.
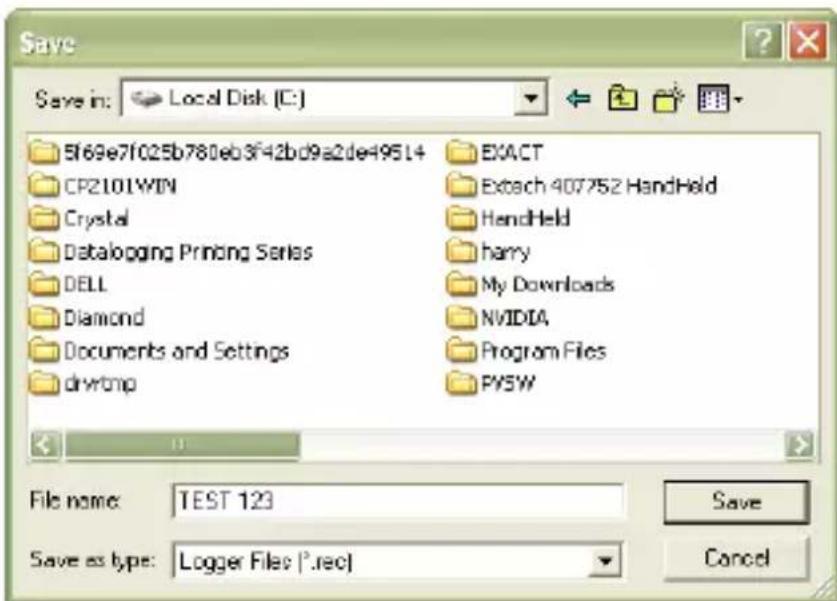
text_image
Save Save in: Local Disk (C:) SF69e7f025b780eb3f42bd9a2de49514 CP2101WIN Crystal Datalogging Printing Series DELL Diamond Documents and Settings drvrtnp EXACT Extech 407752 HandHeld HandHeld harry My Downloads NVIDIA Program Files PYSW File name: TEST 123 Save as type: Logger Files (*.rec) CancelIn the VIEW screen (below) press VIEW to see the data graphically. If there are no readings currently stored in the Logger, the program will let the user know via warning screen.
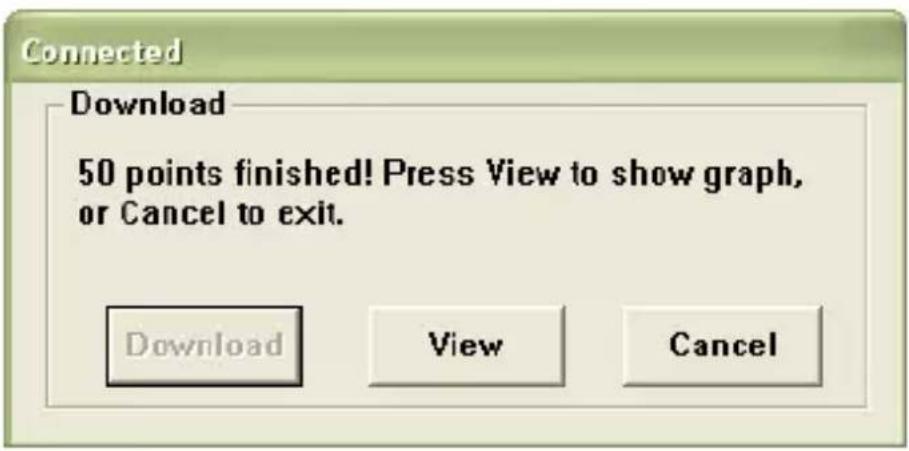
text_image
Connected Download 50 points finished! Press View to show graph, or Cancel to exit. Download View CancelWhen VIEW is pressed, the Data Graph window appears (pictured and discussed in the next section)
DATA GRAPH
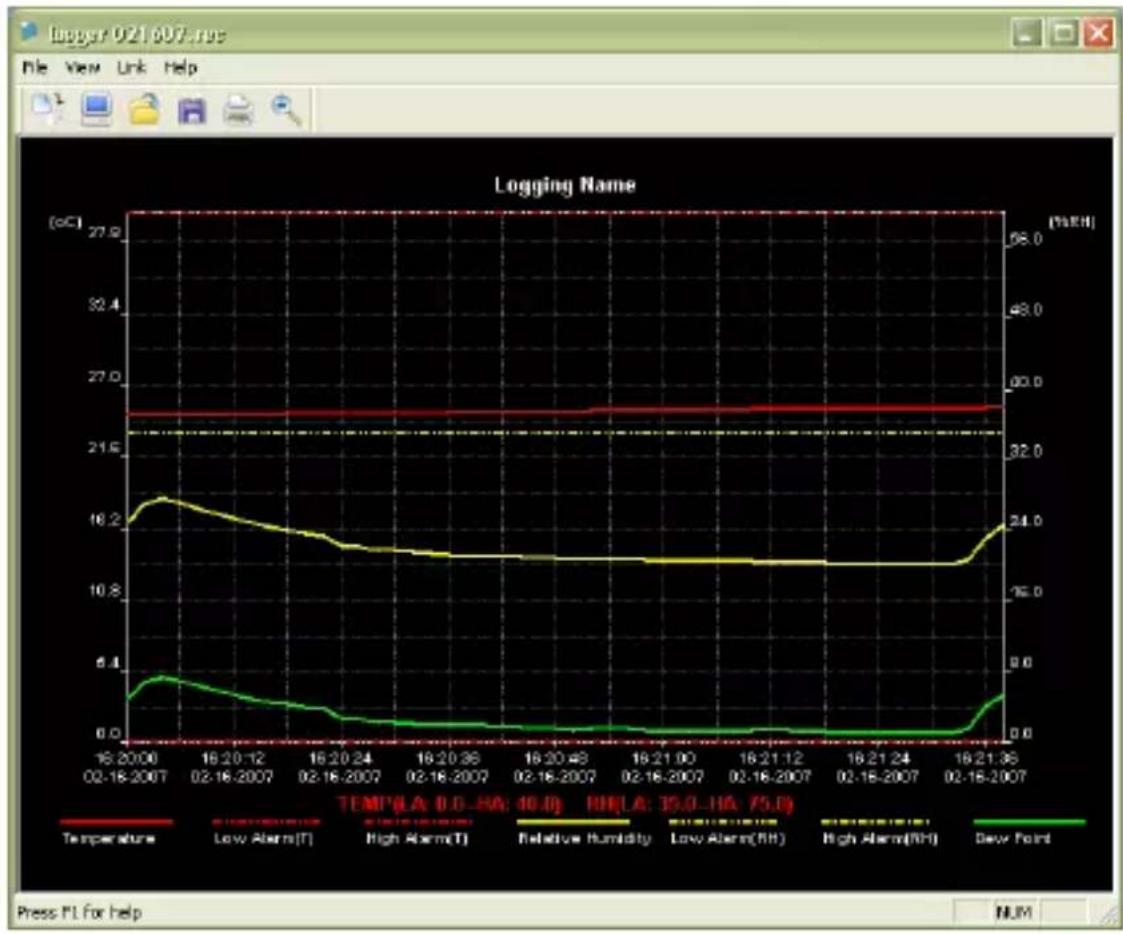
The Data Graph window presents the transferred data in x-y graph format with Date/Time represented on the horizontal axis and Temperature / %Relative Humidity / Dew Point / Alarm Limits represented on the y axis:
line
| Date | Temperature (°C) | High Alarm (T) | Relative Humidity (%) | Low Alarm (RH) | High Alarm (RH) | Dew Point | |------------|------------------|----------------|------------------------|----------------|-----------------|-----------| | 16.2007 | 27.5 | 18.2 | 24.0 | 32.0 | 21.5 | 0.0 | | 18.2136 | 27.5 | 18.2 | 24.0 | 32.0 | 21.5 | 0.0 |To zoom in and zoom out data regions, there are several approaches, these are:
- Use the mouse to click and drag a box around any data area to magnify the area selected.
- Click on the zoom magnifier icon tool on the menu bar
- Select VIEW ALL or ZOOM OUT from the VIEW pull-down menu.
In the example graph above, the Temperature is represented by the solid red line (the lines are known as ‘traces’), the Relative Humidity % by the solid yellow trace, and the Dew Point Temperature by the solid green trace. The low and high alarm values for temperature are represented by the dashed red trace, the low and high alarm values for Relative Humidity by the dashed yellow trace.
To customize the graph window select SHOW TRACES, BACKGROUND, GRID LINES, and MASK POINTS from the VIEW pull-down menu. These options provide the following features:
SHOW TRACES: Allows the user to select which data to view as a
trace (Temperature, RH, Dew Point, & Alarms).
BACKGROUND: Select background color scheme.
GRID LINES: Add or remove grid lines from x and y axes.
MASK POINTS: Places dots on the traces for the actual data points, breaking up the continuous nature of a trace.
Notes: The horizontal grid line will be aligned to specific values on the temperature axis, while any alignment with specific values on the relative humidity axis is merely coincidental.
SAVE AND OPEN DATA FILES
To save the transferred data in a format other than the proprietary .rec format, click the SAVE AS icon from the menu bar (4 ^th from right) or select SAVE AS from the FILE pull-down menu. The data can be saved in the following formats:
TEXT FILE (.txt)
EXCEL FILE (.xls)
BITMAP FILE (.bmp)
To open an existing data file for viewing on the data graph window, click on the FILE OPEN icon on the menu bar (3 from left) or select FILE OPEN from the FILE pull-down menu. When prompted, select a .rec file saved earlier.
PRINT DATA GRAPH
To print a data graph window to a line or network printer, click on the printer icon or select PRINT from the FILE pull-down menu. Note that color graph windows can be accurately printed on color printers.
CLEAR LOGGED DATA
The Logger retains data in its internal memory until the user begins a new logging session. Starting a new logging session clears all of the logger's stored readings; be sure to save data before starting a new logging session.