Spot-Pointer V2 - Remote control HAMA - Free user manual and instructions
Find the device manual for free Spot-Pointer V2 HAMA in PDF.
User questions about Spot-Pointer V2 HAMA
0 question about this device. Answer the ones you know or ask your own.
Ask a new question about this device
Download the instructions for your Remote control in PDF format for free! Find your manual Spot-Pointer V2 - HAMA and take your electronic device back in hand. On this page are published all the documents necessary for the use of your device. Spot-Pointer V2 by HAMA.
USER MANUAL Spot-Pointer V2 HAMA
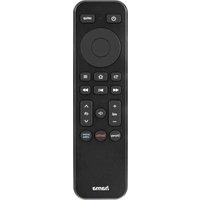
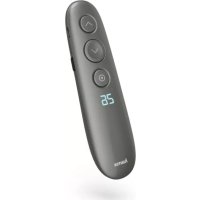
Wireless Laser Presenter

natural_image
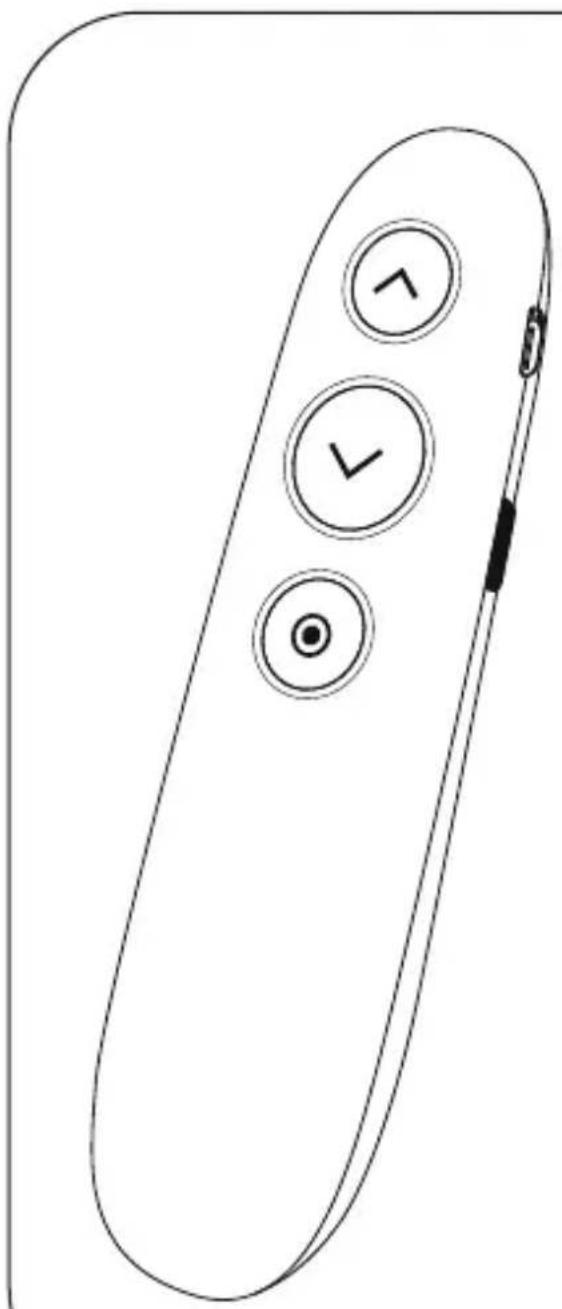
Simple line drawing of a device with three circular buttons and a pointer (no text or symbols)Operating Instruction
Bedienungsanleitung
Mode d'emploi
- "Back"button, w henthebuttonisheld:blackscreen
-
√ "Next" button, when the button is held: Play / Exit the PowerPoint
-
Button : Activation of hyperlinks - when the button is held: Sizechange Double-click: changeofthefunctiontypes, see"6. Function types".
-
Display: Timerdisplay- R emainingpresentationtime

5.USBconnection
-
Timer button: activate and display the preset timer - when thebuttonisheld:Timerdisplay Double-click:Starttimer
-
On/Offswitch
- Storage compartment for receiver(dongle)
- Micro-SDcard slot
Thank you for choosing a Hama product. Take your time and read the following instructions and information completely. Please keep these instructions in a safe place for future reference. If you sell the device, please pass these operating instructions on to the newowner.
1. Explanationofwarningsymbolsandnotes
Warning

This symbol is used to indicate safety instructions to draw your attention to specific hazards and risks.
Note

This symbol is used to indicate additional information or important notes.
2. Explanationofproductmarkingsymbols

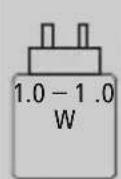
The power delivered by the charger must be between min 1.0 Watts required by theradio equipment, and max 1.0 Watts in order to achieve the maximum charging speed.
ThestandardisedUSBinterfacemeansthata chargerwitha higheroutputpowercanalso beused.
3. Package contents
- " Spot-PointerV2" WirelessDigitalPresenter
• U SBreceiver
• M icro-SDcard w ithsoftware
• U SBchargingcable - T ransportbag
• T heseoperatinginstructions
4. Safetyinstructions
• T heproductisintendedforprivate,non-commercialuseonly.
- D o n otusetheproductintheimmediatevicinityofheaters, otherheatsourcesorindirectsunlight.
- As with all electrical products, this device should be kept out of thereofchildren.
- D o n otdroptheproductanddonotexposeittoanymajor shocks.
- Do not operate the product outside the power limits specified in the technical data.
- D o n otusetheproductinareasinwhichelectronicproducts are n otpermitted.
- D on otopenthedeviceorcontinuetooperateitifitbecomes damaged.
- The battery is permanently installed and cannot be removed; dispose of the product as a whole in accordance with the statutory regulations.
- Keep the packaging material out of the reach of children due to theriskofsuffocation.
- Dispose of packaging material immediately in accordance with the locally applicable regulations.
- Do not modify the product in any way. Doing so voids the warranty.
• D o n otincineratethebatteryortheproduct. - Do not tamper with or damage/heat/disassemble the batteries/rechargeablebatteries.
• U setheproductforitsintendedpurposeonly. - Protect the product from dirt, moisture and overheating, and only useitina dry environment.
• U setheitemonlyinmoderateclimaticconditions. - Do not attempt to service or repair the product yourself. Leave anyandall s serviceworktoqualifiedexperts.
5.Operation
5.1ChargetheSpotlightPresenter
Ifthefollowingsymbolappearsonthedisplay:

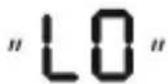
thebatterystatusislow. ConnectthesuppliedUSBchargingcable totheUSB-Cport(5).ConnectthefreeplugontheUSBcharging cabletoa suitableUSBcharger.
A completechargingcycletakesabout2 hours.
Warning-r echargeablebattery

- O nlyusesuitablechargingdevicesorUSBconnectionsto chargetheproduct.
- Do not use defective chargers or USB ports and do not attempttorepairthem.
- A voidstoring, charging and using in extreme temperatures and at extremely low atmospheric pressures (such as high altitudes).
- C hargeregularly(atleastquarterly)duringperiodsof prolongedstorage.
- Do not overcharge the product or allow the battery to completely discharge.
5.2Quickstart
- PlugthereceiverintoavailableUSBportonyourdevice.
- After automatic driver installation, theremovable datamedium opens

text_image
TFcard D o TF- Install the required Spot-Pointersoftware
4.SwitchthePresenteronfollowingsuccessfulinstallation(7).
Thefollowingsymbolnowappearsinthetaskbar:
hama

Note
If the Presenter is switched off, or if thereceiver is not connected to the computer, this will be indicated by a colourless symbol.
6.Functiontypes
1. Spotilluminationmode

text_image
Computer screen displaying a financial dashboard with charts, graphs, and data tables, overlaid with a circular diagram showing key metrics.2. Magnifying glass function

text_image
Computer screen displaying financial dashboard with charts, a magnified inset showing Australia's regional data visualization, and labeled sections 'n' and 'g'.3. Digitallaserpointer

text_image
SALADY & LADY Progress SALADY Progress SALADY Progress SALADY Progress SALADY Progress SALADY Progress SALADY Progress SALADY Progress SALADY Progress SALADY Progress SALADY Progress SALADY Progress SALADY Progress SALADY Progress SALADY Progress SALADY Progress SALADY Progress SALADY Progress- Pressing the o button (3) twice allows you to toggle between thefunctiontypes
-
By pressing and holding the o button (3), you can change the sizeofthelaserpointer, s potandmagnifyingglasswiththetwo functionkeys(1)and (2)
-
Softwarefunctions

text_image
Presenter setting English Preview effect Modus Normal Spot Digital Pointer Magnifier Background color Transparent Foreground color Transparent Spot size Magnification Timing set 5 min Set hama- Selectiontosetthefunctiontype
- Individual setting of the background shading when spot illumination mode is active
- Settingofthebackgroundtransparencywhenspot illuminationmodeisactive
- Individualsettingofthecolourofthedigitalpointer
- Setting of the transparency of the digital pointer
- Settingofthesizeofthemodesused
-
Settingofthemagnifyingglass'szoomfunction
-
Timer: Before the meeting, set a time for the vibration alarm (maximumalarmtime:199minutes). Thedisplayallowsyou tokeepaneyeyonthe p ressentationtime.
TACTILEFEEDBACK
Receive a silent alarm when using the timer and when the batterylevelislow.
- Software - 1 languageselection
8. Care and Maintenance
Clean this product only using a lint-free, slightly damp cloth and do not use any harsh cleaners. Take care to ensure that no water enterstheproduct.
9.WarrantyDisclaimer
HamaGmbH& C o K G a ssumesnoliabilityandprovidesno warrantyfordamageresultingfromimproperinstallation/mounting, improperuseoftheproductorfromfailure t o o bservetheoperating instructionsand/orsafetynotes.
10.Technicaldata
| ConnectionWireless,2.4GHzconnection | |
| Functionrange< 20 m * | |
| Battery | Li-Ion3.7V250mAh/ 0 .925WhBatteryUseTime(rechargeable):3 months* |
| ConnectionUSB-Casa chargingfunction | |
| Powersupply5V | ---240mA |
| Size130x22x35mm | |
| Weight40g | |
| System requirements | Windows10/8/7MacOSX 10 or higherRestrictedfunctionality(no software):ChromeOSTM,Linux®,AndroidTM |
*Dependingontheconditionsofuse
11. Declaration of Conformity
CE Hereby, Hama GmbH & Co KG declares that the radio equipmenttype[00139919]isincompliancewith Directive2014/53/EU.Thefull t extoftheEU
declarationofconformityisavailableatthefollowinginternet address:
https://uk.hama.com → 00139919Downloads
| Frequencyband(s)2402- 2 480MHz | |
| Maximumradio-frequency powertransmitted | -1.8dBme.i.r.p. |
Bedienelemente
text_image
Computer screen displaying a financial dashboard with charts, graphs, and a circular overlay showing data visualization.- Lupen-Funktion

text_image
Computer screen displaying financial dashboard with charts, a magnified inset showing Australia's data visualization, and labels 'n' and 'g' at the bottom.- DigitalerLaserpointer

text_image
SANY SEAIS Market 1.00 Aggregate 2024/06/28 mg Eurozone Global 35.00% Lower Value Share Analysis Market Share Market Share Volume (Million) Growth Rate CAGR Earnings EBITDA EPS EBITDA EBITDA Margin EPS Growth Rate EPS EPS Growth Rate EPS Shares Outstanding Shares Outstanding Shares Outstanding Shares Outstanding Shares Outstanding Shares Outstanding Shares Outstanding Shares Outstanding Shares Outstanding Shares Outstanding Shares Outstanding Shares Outstanding Shares Outstanding Shares Outstanding Shares Outstanding Shares Outstanding Shares Outstanding Shares Outstanding Shares Outstanding Shares Outstanding Shares Outstanding Shares Outstanding Shares Outstanding Shares Outstanding Shares Outstanding Shares Outstanding Shares Outstanding Shares Outstanding Shares Outstanding Shares Outstanding Shares Outstanding Shares Outstanding Shares Outstanding Shares Outstanding Shares Total Market Shares Shares Total Market Shares Shares Total Market Shares Shares Total Market Shares Shares Total Market Shares Shares Total Market Shares Shares Total Market Shares Shares Total Market Shares Shares Total Market Shares Shares Total Market Shares Shares Total Market Shares Shares Total Market Shares Shares Total Market Shares Shares Total Market Shares Shares Total Market Shares Shares Total Market Shares Shares Total Market Shares Shares Total Market Shares Shares Total Market Shares Shares Total Market Shares Shares Total Market Share Shares Total Market Share Shares Total Market Share Shares Total Market Share Shares Total Market Share Shares Total Market Share Shares Total Market Share Shares Total Market Share Shares Total Market Share Shares Total Market Share Shares Total Market Share Shares Total Market Share Shares Total Market Share Shares Total Market Share Shares Total Market Share Shares Total Market Share Shares Total Market Share Shares Total Market Share Shares Total Market Share Shares Total Market Share Shares Total Market Shares Shares Total Market Shares Shares Total Market Shares Shares Total Market Shares Shares Total Market Shares Shares Total Market Shares Shares Total Market Shares Shares Total Market Shares Shares Total Market Shares Shares Total Market Shares Shares Total Market Shares Shares Total Market Shares Shares Total Market Shares Shares Total Market Shares Shares Total Market Shares Shares Total Market Shares Shares Total Market Shares Shares Total Market Shares Shares Total Market Shares Shares Total Market sharestext_image
Computer screen displaying a financial dashboard with charts, graphs, and a circular overlay showing data visualization.2.Fonctionloupe

text_image
Computer screen displaying financial dashboard with charts, a magnified inset showing Australia's regional data visualizationtext_image
SANTOS SAADIMARK 2.00 August Volume 100000 mg Shares Analysis: 38.86% Lower Price Share Analysis Market Data Figure 1 5 Month 4 Month 1 Month 1 Month 1 Month 1 Month 1 Month 1 Month 1 Month 1 Month 1 Month 1 Month 1 Month 1 Month 1 Month 1 Month 1 Month 1 Month 1 Month 1 Month 1 Month 1 Month 1 Month 1 Month 1 Month 1 Month 1 Month 1 Month 1 Month 1 Month 1 Month 1 Month 1 Month 1 Month 1 Month 1 Monthly 1 Monthly 1 Monthly 1 Monthly 1 Monthly 1 Monthly 1 Monthly 1 Monthly 1 Monthly 1 Monthly 1 Monthly 1 Monthly 1 Monthly 1 Monthly 1 Monthly 1 Monthly 1 Monthly 1 Monthly 1 Monthly 1 Monthly 1 Monthly 1 Monthly 1 Monthly 1 Monthly 1 Monthly 1 Monthly 1 Monthly 1 Monthly 1 Monthly 1 Monthly 1 Monthly 1 Monthly 1 Monthly 1 Monthlytext_image
Computer screen displaying a financial dashboard with charts, graphs, and a highlighted circular overlay showing data visualization.- Funcióndelupa

text_image
Computer screen displaying a financial dashboard with charts, a magnified circular overlay highlighting Australia's data visualization.- Punteroláserdigital

text_image
Computer screen displaying a financial dashboard with charts, graphs, and a highlighted circular overlay showing data visualization.2.FunzioneLente

text_image
Computer screen displaying a financial dashboard with charts, graphs, and a magnified view of Australia's regional data.text_image
Screenshot of a financial dashboard displayed on a computer screen, featuring charts, pie chart, and a red circle highlighting a specific data point.text_image
Computer screen displaying a financial dashboard with charts, graphs, and a circular overlay highlighting key metrics like '2018' and '2019'.text_image
Computer screen displaying financial dashboard with charts, graphs, and a magnified view of Australia's regional data.- Digitalelaserpointer

text_image
SANY SEAIS GROWTH 2.05 August SANY SEAIS GROWTH 2.05 September SANY SEAIS GROWTH 2.05 October SANY SEAIS GROWTH 2.05 November SANY SEAIS GROWTH 2.05 December SANY SEAIS GROWTH 2.05 January SANY SEAIS GROWTH 2.05 February SANY SEAIS GROWTH 2.05 March SANY SEAIS GROWTH 2.05 April SANY SEAIS GROWTH 2.05 May SANY SEAIS GROWTH 2.05 June SANY SEAIS GROWTH 2.05 July SANY SEAIS GROWTH 2.05 August SANY SEAIS GROWTH 2.05 September SANY SEAIS GROWTH 2.05 October SANY SEAIS GROWTH 2.05 November SANY SEAIS GROWTH 2.05 December SANY SEAIS GROWTH 2.05 January SANY SEAIS GROWTH 1.99 September SANY SEAIS GROWTH 1.98 September SANY SEAIS GROWTH 1.97 September SANY SEAIS GROWTH 1.96 September SANY SEAIS GROWTH 1.95 September SANY SEAIS GROWTH 1.94 September SANY SEAIS GROWTH 1.93 September SANY SEAIS GROWTH 1.92 September SANY SEAIS GROWTH 1.91 September SANY SEAIS GROWTH 1.90 September SANY SEAIS GROWTH 1.89 September SANY SEAIS GROWTH 1.88 September SANY SEAIS GROWTH 1.87 September SANY SEAIS GROWTH 1.86 September SANY SEAIS GROWTH 1.85 September SANY SEAIS GROWTH 1.84 September SANY SEAIS GROWTH 1.83 September SANY SEAIS GROWTH 1.82 September SANY SEAIS GROWTH 1.81 September SANY SEAIS GROWTH 1.80 September SANY SEAIS GROWTH 1.79 September SANY SEAIS GROWTH 1.78 September SANY SEAIS GROWTH 1.77 September SANY SEAIS GROWTH 1.76 September SANY SEAIS GROWTH 1.75 September SANY SEAIS GROWTH 1.74 September SANY SEAIS GROWTH 1.73 September SANY SEAIS GROWTH 1.72 September SANY SEAIS GROWTH 1.71 September SANY SEAIS GROWTH 1.70 September SANY SEAIS GROWTH 1.69 September SANY SEAIS GROWTH 1.68 September SANY SEAIS GROWTH 1.67 September SANY SEAIS GROWTH 1.66 September SANY SEAIS GROWTH 1.65 September SANY SEAIS GROWTH 1.64 September SANY SEAIS GROWTH 1.63 September SANY SEAIS GROWTH 1.62 September SANY SEAIS GROWTH 1.61 September SANY SEAIS GROWTH 1.60 September SANY SEAIS GROWTH 1.59 September SANY SEAIS GROWTH 1.58 September SANY SEAIS GROWTH 1.57 September SANY SEAIS GROWTH 1.56 September SANY SEAIS GROWTH 1.55 September SANY SEAIS GROWTH 1.54 September SANY SEAIS GROWTH 1.53 September SANY SEAIS GROWTH 1.52 September SANY SEAIS GROWTH 1.51 September SANY SEAIS GROWTH 1.50 September SANY SEAIS GROWTH 1.49 September SANY SEAIS GROWTH 1.48 September SANY SEAIS GROWTH 1.47 September SANY SEAIS GROWTH 1.46 September SANY SEAIS GROWTH 1.45 September SANY SEAIS GROWTH 1.44 September SANY SEAIS GROWTH 1.43 September SANY SEAIS GROWTH 1.42 September SANY SEAIS GROWTH 1.41 September SANY SEAIS GROWTH 1.40 September SANY SEAIStext_image
Computer screen displaying a financial dashboard with charts, graphs, and data tables, overlaid with a circular diagram highlighting key metrics.2.Funkcjalupy

text_image
Computer screen displaying financial dashboard with charts, pie chart, and a magnified view of Australia's regional data.text_image
SANY SEAIS GROWTH 1.00% YoY GROWTH 2.00% YoY Growth Rate -50%+30%+10%+10% Year-2015 Growth Rate Volume (Millions) 1,000 1,000 1,000 1,000 1,000 1,000 1,000 1,000 1,000 1,000 1,000 1,000 1,000 1,000 1,000 1,000 1,000 1,047 1,468 2,969 3,469 3,969 4,469 4,969 5,469 5,969 6,469 6,969 7,469 7,969 8,469 8,969 9,469 9,969 10,469 11,069 11,569 12,169 12,669 13,269 13,769 14,369 14,869 15,469 15,969 16,469 16,969 17,469 17,969 18,469 18,969 19,469 19,969 20,469 20,969 21,469 21,969 22,469 22,969 23,469 23,969 24,469 24,969 25,469 25,969 26,469 26,969 27,469 27,969 28,469 28,969 29,469 29,969 30,469 30,969 31,469 31,969 32,469 32,969 33,469 33,969 34,469 34,969 35,469 35,969 36,469 36,969 37,469 37,969 38,469 38,969 39,469 39,969 40,469 40,969 41,469 41,969 42,469 42,969 43,469 43,969 44,469 44,969 45,469 45,969 46,469 46,969 47,469 47,969 48,469 48,969 49,469 49,969 50,469 50,969 51,469 51,969 52,469 52,969 53,469 53,969 54,469 54,969 55,469 55,969 56,469 56,969text_image
Computer screen displaying a financial dashboard with charts, graphs, and data tables, overlaid with a circular diagram highlighting key metrics.2.Nagyítás ü zemmód

text_image
Computer screen displaying financial dashboard with charts, graphs, and a magnified view of Australia's regional data.text_image
Screenshot of a financial dashboard displaying charts, pie charts, and data tables with a large red circle highlighting a key metric.text_image
Computer screen displaying a financial dashboard with charts, graphs, and a highlighted circular overlay showing data visualization.2.FunkceLupa

text_image
Computer screen displaying financial dashboard with charts, graphs, and a magnified view of Australia's regional data.text_image
Screenshot of a financial dashboard interface displaying charts, pie chart, and data tables with Chinese labelstext_image
Computer screen displaying a financial dashboard with charts, graphs, and a highlighted circular overlay showing data visualization.text_image
Computer screen displaying a financial dashboard with charts, a magnified inset showing Australia's regional data visualization.text_image
Screenshot of a financial dashboard interface displaying company metrics, data charts, and a red circle highlighting a key point.text_image
Computer screen displaying a financial dashboard with charts, graphs, and data tables, overlaid with a circular diagram highlighting key metrics.- Função d e l u p a

text_image
Computer screen displaying financial dashboard with charts, a magnified view of Australia's regional data, and a pie chart showing regional distribution.n
g
- Ponteirolaserdigital

text_image
Screenshot of a financial dashboard displaying stock market data, pie chart, and charts on computer screenAvertizare – Acumulator

text_image
Card T F TF D otext_image
Computer screen displaying a financial dashboard with charts, graphs, and a highlighted circular overlay showing data visualization.2. Funcțialupă

text_image
Computer screen displaying a financial dashboard with charts, a magnified globe highlighting Australia, and a list of data tables below.3. Indicatordigitalculaser

text_image
Screenshot of a financial dashboard displayed on a computer screen, featuring charts, pie chart, and a red circle highlighting a key data point.https://ro.hama.com → 00139919Dscărcări