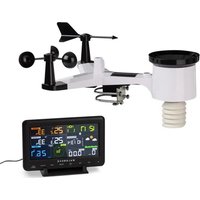
Huygens - Weather Station Waldbeck - Free user manual and instructions
Find the device manual for free Huygens Waldbeck in PDF.


| Product type | Professional weather station |
| Brand | Waldbeck |
| Model | Huygens |
| Console power supply | 5V DC power adapter or 3 AAA batteries (not included) |
| Outdoor sensor power supply | 2 AA batteries (not included) |
| Transmission frequency | 868 MHz |
| Maximum range (open field) | 100 m |
| Outdoor temperature range | -40 °C to 60 °C (accuracy ±1 °C) |
| Outdoor humidity range | 10 to 99 % (accuracy ±5 %) |
| Rainfall range | 0 to 9999 mm (accuracy ±10 %) |
| Wind speed range | 0 to 50 m/s (accuracy ±1 m/s) |
| Brightness range | 0 to 200 klx (accuracy ±15 %) |
| Atmospheric pressure range (indoor) | 700 to 1100 hPa (accuracy ±3 hPa) |
| Sensors | Thermo-hygrometer, anemometer, wind vane, rain gauge, UV sensor, brightness, pressure |
| Connectivity | WiFi 2.4 GHz |
| Online services | Ecowitt Weather, Weather Underground, Weather Cloud, WOW |
| Functions | Weather forecast, moon phases, trends, alarms, max/min values, calibration |
| Display | LCD screen with adjustable backlight |
| Installation | Mast mounting (1-2 inch tube) with U-bolts included |
| Cleaning and maintenance | Clean the rain gauge every 3 months; replace batteries every 1-2 years |
| Safety | Do not install during stormy weather; use lithium batteries in cold climate |
Frequently Asked Questions - Huygens Waldbeck
User questions about Huygens Waldbeck
0 question about this device. Answer the ones you know or ask your own.
Ask a new question about this device
Download the instructions for your Weather Station in PDF format for free! Find your manual Huygens - Waldbeck and take your electronic device back in hand. On this page are published all the documents necessary for the use of your device. Huygens by Waldbeck.
USER MANUAL Huygens Waldbeck
Professional Weather Station
INHALTSVERZEICHNIS
Technische Daten 4
Lieferumfang 4
natural_image
Technical line drawing of a mechanical device with internal components and mounting base (no text or symbols)natural_image
Technical line drawing of a mechanical device with a cylindrical base and internal components (no text or symbols)Batterieinstallation
natural_image
Line drawing of a mechanical assembly with rollers and a component, no text or symbols present7
natural_image
Technical line drawing of a mechanical component with a red directional arrow indicating movement (no text or symbols present)8
Druck (Pressure)
Wettervorhersage
natural_image
Two-panel diagram showing a white arrow pointing left and two raindrops falling on grass (no text or symbols)natural_image
Two-panel image showing a black background with grass and white flowers, separated by a double-headed arrow (no text or symbols)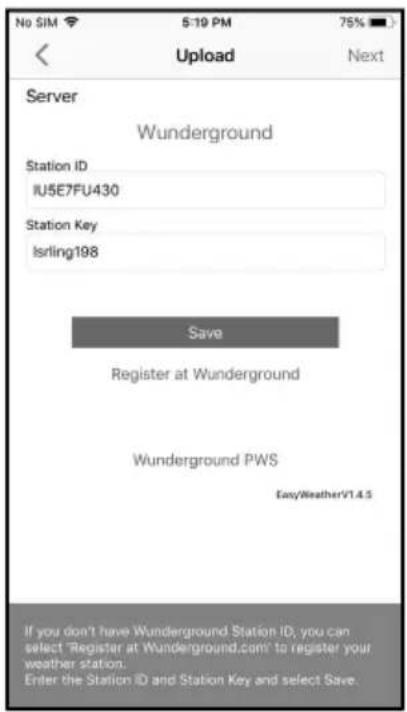
ECOWITT WEATHER
WEATHER UNDERGROUND
line
| Metric | Value | | ------------------ | --------- | | Temperature | I44JIUXI35 | | Dew Point | I44JIUXI28 | | Relative Humidity | I44JIUXI60 | | Pressure | I44JIUXI74 | | Wind Direction | I44JIUXI74 | | Wind Speed | IFJELL37 | | Wind Gust Speed | I44JIUXI65 | | Solar Radiation | I44JIUXI71 | | Precip Rate | IU5E7FU414 | | Precipitation Accum| IU5E7FU414 | | Temperature / Dew P. | 24 | | Humidity | 06 | | Temperature | 64 | | Humidity | 62 | | Humidity | 00 |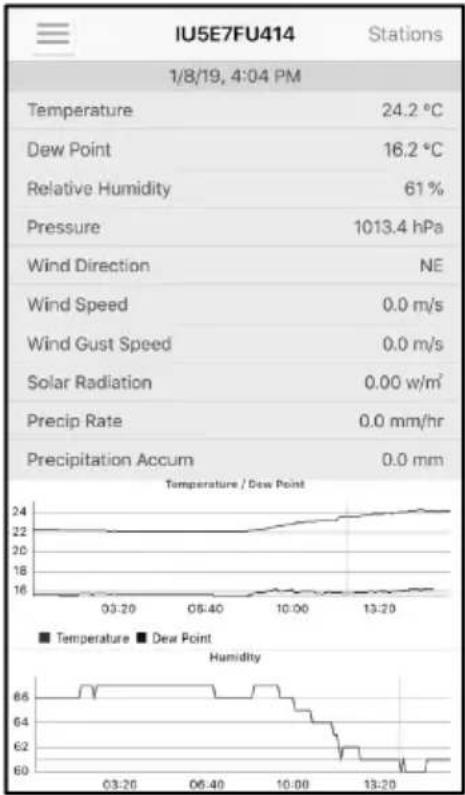
line
IUSE7FU414 Stations | Time | Temperature (°C) | Dew Point (mm) | |---|---|---| | 03:20 | 22 | 65 | | 05:40 | 22 | 64 | | 10:00 | 22 | 62 | | 13:20 | 22 | 60 | Temperature / Dew Point Humidityhttp://www.wunderground.com/personal-weather-station/dashboard?ID=STATIONID
https://itunes.apple.com/us/app/wunderstation-weather-from-your-neighborhood/id906099986
https://itunes.apple.com/us/app/weather-underground-forecast/id486154808
https://play.google.com/store/apps/details?id=com.wunderground.android.weather&hl=en
https://itunes.apple.com/us/app/pws-weather-station-monitor/id713705929
line
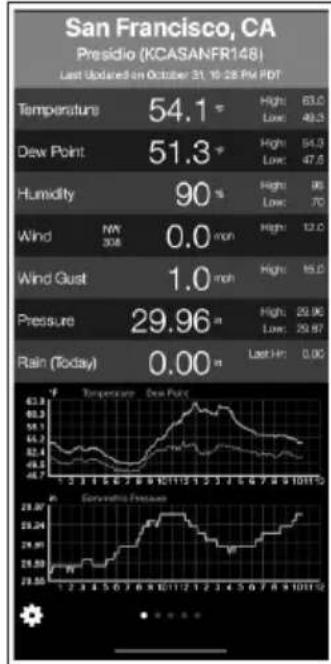
San Francisco, CA Presidio (KCASANFR148) Last Updated on October 31, 10:28 PM PDT | Metric | Value | | :--- | :--- | | Temperature | 54.1 °C | | Low | 49.3 | | High | 54.3 | | Low | 47.5 | | Humidity (%) | 90 | | Low | 70 | | Wind (MW) | 0.0 m³ | | Wind (MW) Max | 12.0 m³ | | Wind (MW) Min | 15.0 m³ | | Pressure (m/s) | 29.96 | | Low | 29.87 | | Rain (Today) (m) | 0.00 m³ | | Last Hr | 0.00 m³ | Temperature - Dew Point Temperature - Dew Point Conservative Pressure Conservative Pressure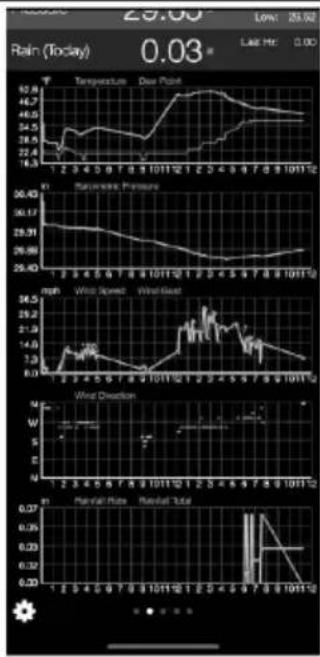
line
| Date | Temperature | Rainfall (mm) | Wind Speed (W/s) | Wind Direction (W) | |------------|--------------|---------------|------------------|--------------------| | 1/1 | 27.4 | 36.4 | 1.0 | 0.0 | | 2/1 | 28.5 | 35.9 | 1.2 | 0.0 | | 3/1 | 29.1 | 35.5 | 1.5 | 0.0 | | 4/1 | 29.8 | 35.0 | 1.8 | 0.0 | | 5/1 | 30.2 | 34.5 | 2.0 | 0.0 | | 6/1 | 30.5 | 34.0 | 2.2 | 0.0 | | 7/1 | 30.8 | 33.5 | 2.5 | 0.0 | | 8/1 | 31.0 | 33.0 | 2.8 | 0.0 | | 9/1 | 31.2 | 32.5 | 3.0 | 0.0 | | 10/1 | 31.5 | 32.0 | 3.2 | 0.0 | | 11/1 | 31.8 | 31.5 | 3.5 | 0.0 | | 12/1 | 32.0 | 31.0 | 3.8 | 0.0 | | 1/2 | 32.2 | 30.5 | 4.0 | 0.0 | | 2/2 | 32.5 | 30.0 | 4.2 | 0.0 | | 3/2 | 32.8 | 29.5 | 4.5 | 0.0 | | 4/2 | 33.0 | 29.0 | 4.8 | 0.0 | | 5/2 | 33.2 | 28.5 | 5.0 | 0.0 | | 6/2 | 33.5 | 28.0 | 5.2 | 0.0 | | 7/2 | 33.8 | 27.5 | 5.5 | 0.0 | | 8/2 | 34.0 | 27.0 | 5.8 | 0.0 | | 9/2 | 34.2 | 26.5 | 6.0 | 0.0 | | 10/1 | 34.5 | 26.0 | 6.2 | 0.0 | | 11/1 | 34.8 | 25.5 | 6.5 | 0.0 | | 12/1 | 35.0 | 25.0 | 6.8 | 0.0 | | 1/2 | 35.2 | 24.5 | 7.0 | 0.0 | | 2/2 | 35.5 | 24.0 | 7.2 | 0.0 | | 3/2 | 35.8 | 23.5 | 7.5 | 0.0 | | 4/2 | 36.0 | 23.0 | 7.8 | 0.0 | | 5/2 | 36.2 | 22.5 | 8.0 | 0.0 | | 6/2 | 36.5 | 22.0 | 8.2 | 0.0 | | 7/2 | 36.8 | 21.5 | 8.5 | 0.0 | | 8/2 | 37.0 | 21.0 | 8.8 | 0.0 | | 9/2 | 37.2 | 20.5 | 9.0 | 0.0 | | 10/1 | 37.5 | 20.0 | 9.2 | 0.0 | | ... | ... | ... | ... | ... | | ... | ... | ... | ... | ... | | ... | ... | ... | ... | ... | | ... | ... | ... | ... | ... | | ... | ... | ... | ... | ... | | ... | ... | ... | ... | ... | | ... | ... | ... | ... | ... | | Note: The actual values are not provided in the code provided in the code.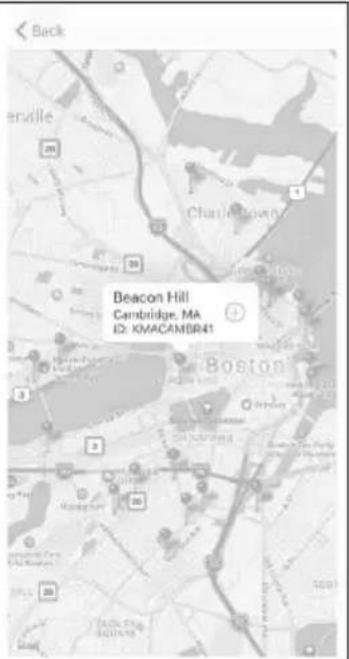
| WU Stations | Add |
| I44JIUX135 | Delete |
| I44JIUX128 | Delete |
| I44JIUX160 | Delete |
| I44JIUX174 | Delete |
| IFJELL37 | Delete |
| I44JIUX165 | Delete |
| I44JIUX171 | Delete |
| IU5E7FU414 | Delete |
| KCAMOUNT191 | Delete |
| I44JIUX136 | Delete |
| IU5E7FU429 | Delete |
natural_image
Symbol of a trash bin crossed with a diagonal line, no text or numbers presentBerlin Brands Group UK Limited PO Box 42 272 Kensington High Street London, W8 6ND United Kingdom
Congratulations on purchasing this device. Please read the following instructions carefully and follow them to prevent possible damages. We assume no liability for damage caused by disregard of the instructions and improper use. Scan the QR code to get access to the latest user manual and more product information.

CONTENTS
Technical Data 66
Scope of Delivery 66
Safety Instructions 67
Quick Start 67
Installation 68
Commissioning and Operation 80
Settings and Modes 83
Other Features 93
Live Internet Publishing 98
Ecowitt Weather 104
Weather Underground 108
Manage Devices and Settings 115
Cleaning and Care 118
Troubleshooting 119
Disposal Considerations 122
Declaration of Conformity 122
TECHNICAL DATA
| Item number 10032850 | |
| Power supply base station 5 | V DC Netzteil or 3 AAA batteries (not included in the scope of delivery) |
| Power supply sensor 2 AA b | batteries (not included in the scope of delivery) |
| Max. Transmission distance (outdoor) | 100 m |
| transmission frequency 868 | MHz |
| Measuring range temperature (outdoor) | -40 °C to 60 °C (accuracy: +/- 1 °C) |
| Measuring range rel. humidity (outdoor) | 10-99 % (accuracy: +/- 5 %) |
| Measuring range rain volume | 0-9999 mm (accuracy +/- 10 %) |
| Measuring range wind speed | 0-50 m/s (accuracy: +/- 1 m/s) |
| Measuring range light 0-200 | kLux (accuracy: +/- 15 %) |
| Measuring range ir pressure (indoor) | 700-1100 hPa (accuracy (+/- 3 hPa) |
SCOPE OF DELIVERY
| Quantity Item | |
| 1 Display Console | |
| 1 Y shape outdoor sensor(Thermo-hygrometer / Rain Gauge / Wind Speed Sensor /Transmitter) | |
| 1 Wind Vane | |
| 1 5V DC Adapter | |
| 1 U-bolt with mounting clamps | |
| 1 10 mm wrench | |
| 1 instruction manual |
SAFETY INSTRUCTIONS
Any metal object may attract a lightning strike, including your weather station mounting pole. Never install the weather station in a storm.

WARNING
Risk of injury! Installing your weather station in a high location may result in injury or death. Perform as much of the initial check out and operation on the ground and inside a building or home. Only install the weather station on a clear, dry day.
QUICK START
Although the manual is comprehensive, much of the information contained may be intuitive. In addition, the manual does not flow properly because the sections are organized by components. The following Quick Start Guide provides only the necessary steps to install, operate the weather station, and upload to the internet.
| Required | |
| 1 Assemble | and power up the Y shape sensor |
| 2 Power up | the display console and synchronize with Y shape sensor |
| 3 Mount the | sensor array |
| 4 Set date | and time on console |
| 5 Calibrate | the relative pressure to sea-level conditions (local airport) on console |
| 6 Reset the | rain to zero on console |
| Optional | |
| 7 Configure | WiFi |
| 8 Register | and upload to Weather Server |
INSTALLATION
Pre Installation Checkout
Before installing your weather station in the permanent location, we recommend operating the weather station for one week in a temporary location with easy access. This will allow you to check out all of the functions, insure proper operation, and familiarize you with the weather station and calibration procedures. This will also allow you to test the wireless range of the weather station.
Site Survey
Perform a site survey before installing the weather station. Consider the following:
- You must clean the rain gauge every few months and change the batteries every 2-3 years. Provide easy access to the weather station.
- Avoid radiant heat transfer from buildings and structures. In general, install the sensor array at least 1.5 m from any building, structure, ground, or roof top.
- Avoid wind and rain obstructions. The rule of thumb is to install the sensor array at least four times the distance of the height of the tallest obstruction. For example, if the building is 6 m tall, and the mounting pole is 1.8 m tall, install 4 x (6 - 1.8) m = 17 m away.
- Wireless Range. The radio communication between receiver and transmitter in an open field can reach a distance of up to 100 meter, providing there are no interfering obstacles such as buildings, trees, vehicles, high voltage lines. Wireless signals will not penetrate metal buildings. Under most conditions, the maximum wireless range is 30 m.
- Radio interference such as PCs, radios or TV sets can, in the worst case, entirely cut off radio communication. Please take this into consideration when choosing console or mounting locations. Make sure your display console is at least five feet away from any electronic device to avoid interference.
Sensor Set Up
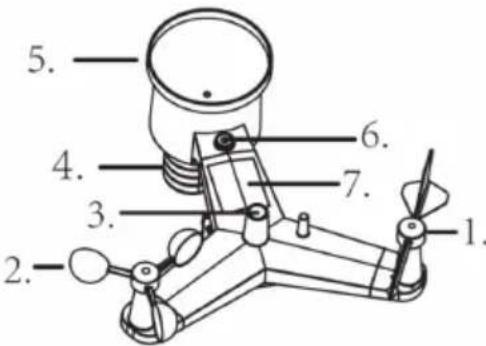 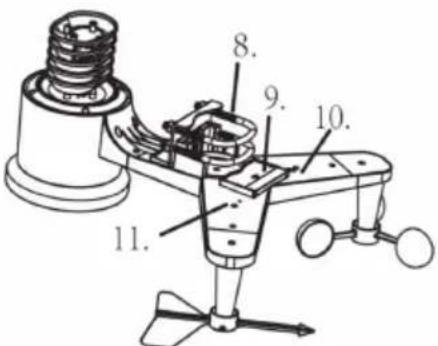 | |
| 1 Wind Vane 7 Solar panel | |
| 2 Wind Speed Sensor 8 U-Bolt | |
| 3 UV sensor/ Light sensor 9 Battery compartment | |
| 4 Thermo-hygro sensor 10 Reset button | |
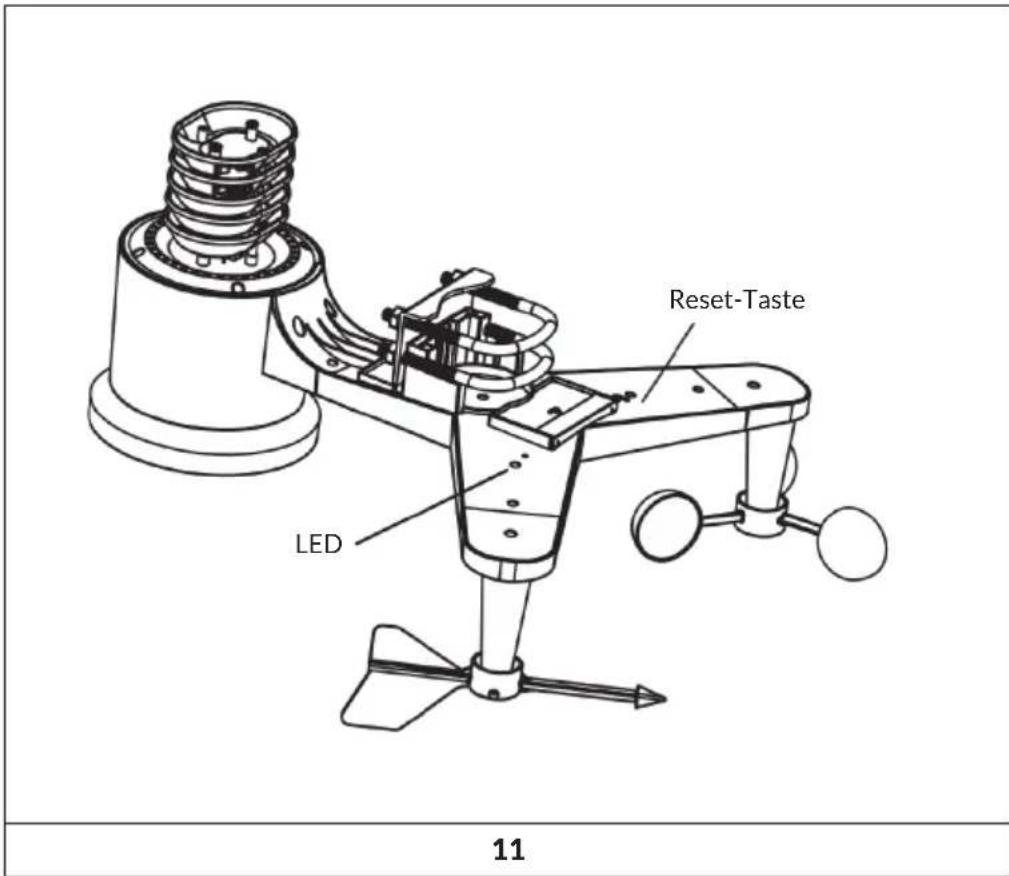
| 5 Rain collector 11 LED Indicator: light on for 4s if the unit power up Then the LED will flash once every 16 seconds (the sensor transmission update period). | |
| 6 Bubble level | |
Install U-bolts and mounting pole
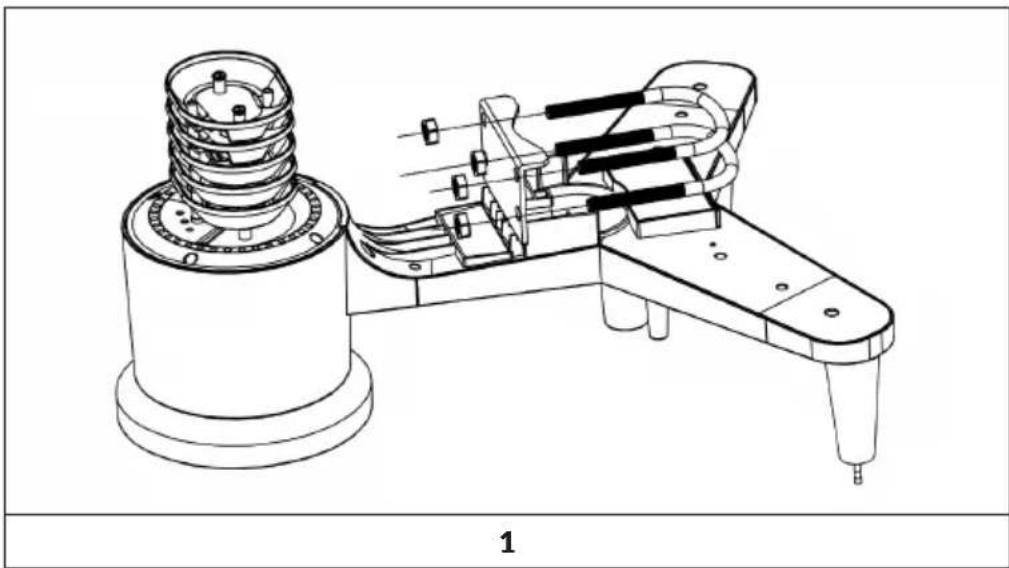
Installation of the U-bolts, which are in turn used to mount the sensor package on a pole, requires installation of an included metal plate to receive the U-bolt ends. The metal plate, visible in Figure 1, has four holes through which the ends of the two U-Bolts will fit. The plate itself is inserted in a groove on the bottom of the unit (opposite side of solar panel). Note that one side of the plate has a straight edge (which goes into the groove), the other side is bent at a 90-degree angle and has a curved profile (which will end up “hugging” the mounting pole). Once the metal plate is inserted, remove nuts from the U-Bolts and insert both U-bolts through the respective holes of the metal plate as shown in Figure 1.
natural_image
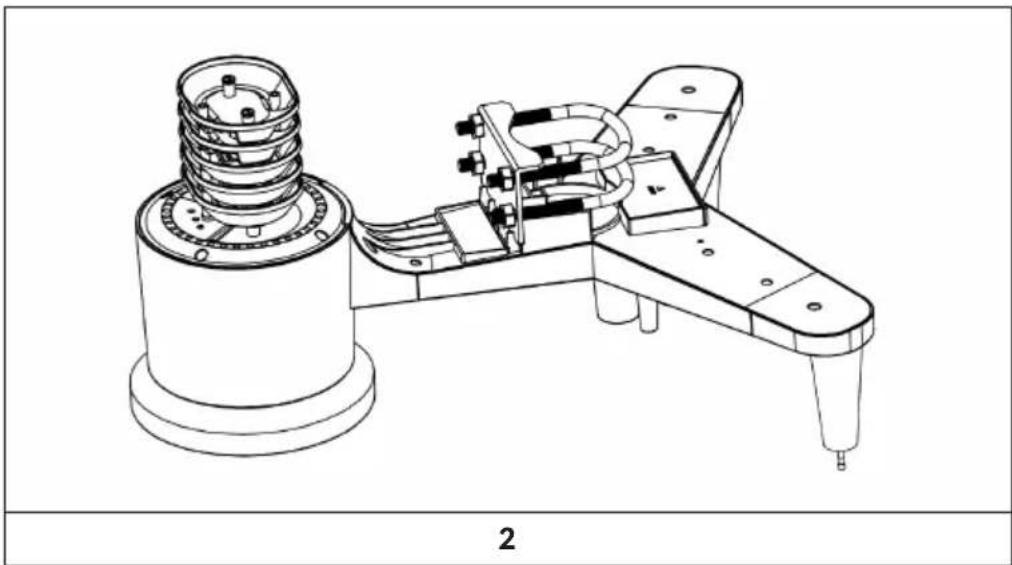
Technical line drawing of a mechanical device with internal components and mounting base (no text or symbols)Loosely screw on the nuts on the ends of the U-bolts. You will tighten these later during final mounting. Final assembly is shown in Figure 9.
natural_image
Technical line drawing of a mechanical device with a cylindrical base and internal components (no text or symbols)The plate and U-Bolts are not yet needed at this stage but doing this now may help avoid damaging wind vane and wind speed cups later on.
Install wind vane
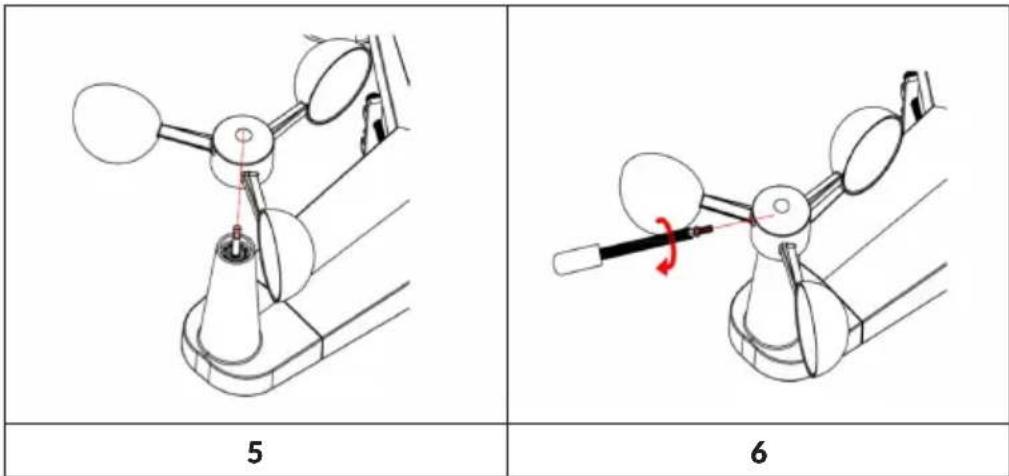
Push the wind vane onto the shaft on the top of the sensor, until it stop moving further, as shown in figure 3. Tighten the set screw, with a Philips screw driver(size PHO), until the wind van cannot be removed from the axle, as shown in figure 4. Make sure the wind vane spin freely. The wind vane's movement has a small amount of friction, which is helpful in providing steady wind direction measurements.
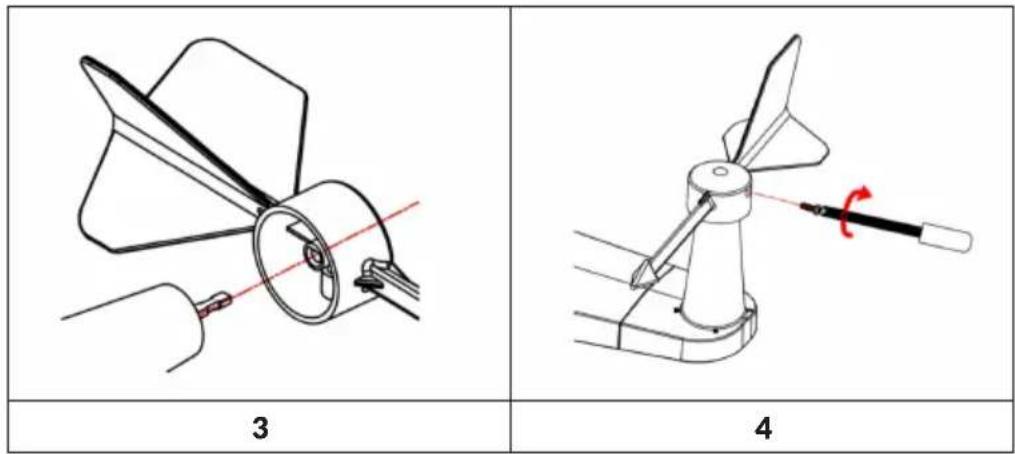
There are four alphabet letters of "N", "E", "S" and "W" around the wind direction, representing for the direction of North, East, South and West. Wind direction sensor has to be adjusted so that the directions on the sensor are matching with your real location. Permanent wind direction error will be installation. when the wind direction sensor is not positioned correctly during installation.
Install wind speed
Push the wind speed into the shaft as shown in figure 5. Tighten the set screw with as shown in figure 5. Make sure the wind speed can spin freely.
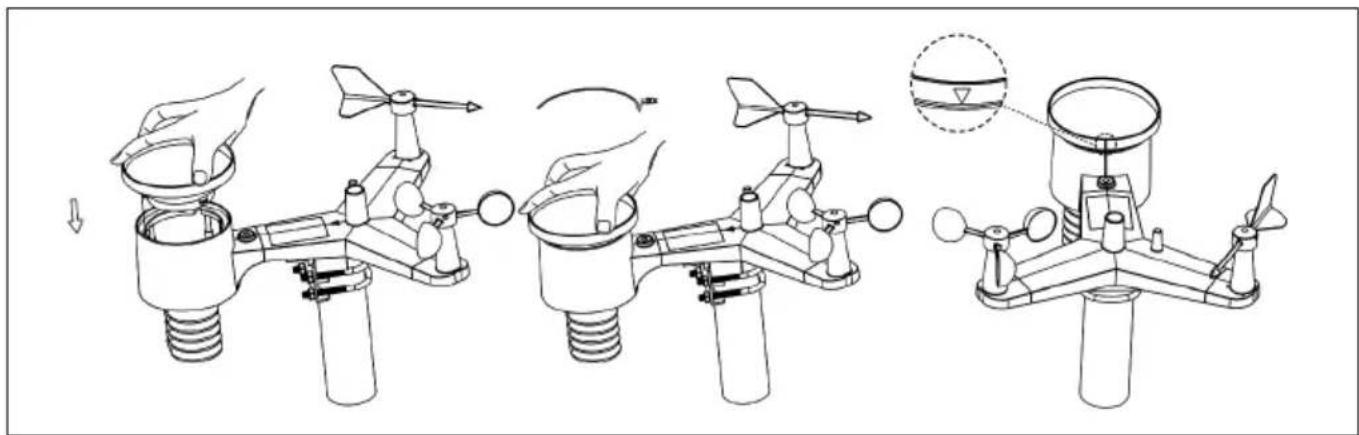
Install Rain Gauge
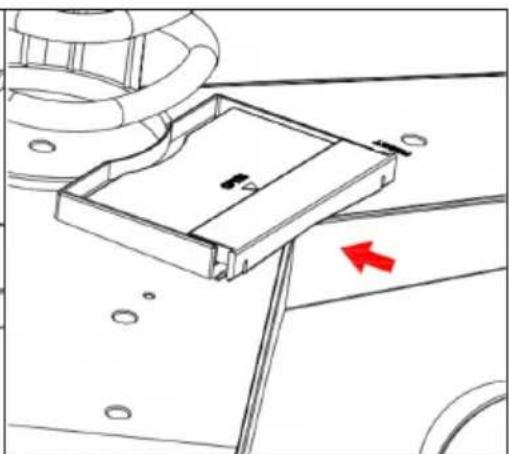
Keep the Indication mark in straight line. As show below photo.
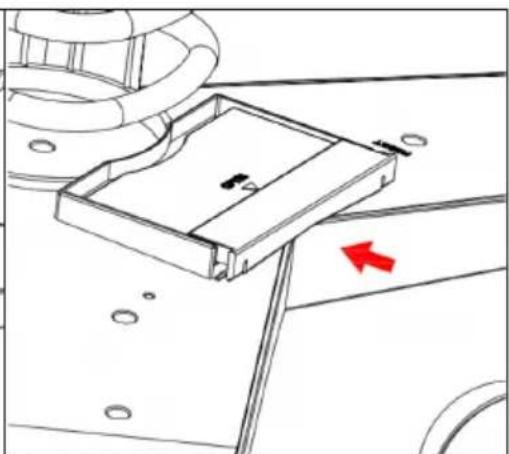
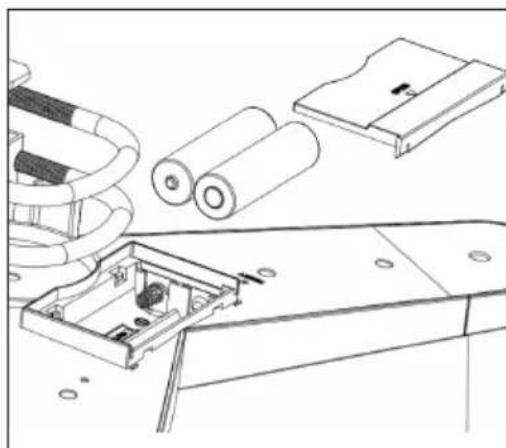
Install batteries
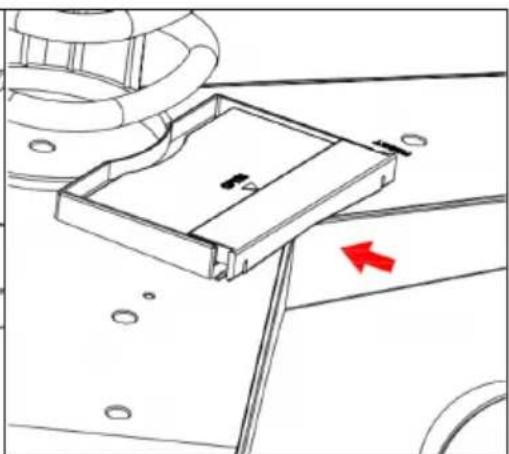
Insert 2 AA batteries in the battery compartment. The LED indicator on the back of the transmitter will turn on for four seconds and normally flash once every 16 seconds (the sensor transmission update period).
natural_image
Technical line drawing showing assembly of battery packs and a mechanical component (no text or symbols)7
natural_image
Technical line drawing of a mechanical component with a red directional arrow indicating movement or force (no text or symbols present)8
If no LED light up or is permanently on, make sure the batteries are inserted the correct way or a proper reset has happened. Do not install the batteries backwards. You can permanently damage the outdoor sensor
Note: We recommend 1.5V lithium batteries for cold weather climates, but alkaline batteries are enough for most climates. We do not recommend rechargeable batteries. They have lower voltages, they do not operate well at wide temperature ranges, and do not last as long, resulting in poorer reception.
Mount assembled outdoor sensor package
Before you mount:
Before proceeding with the outdoor mounting detailed in this section, you may want to skip to setup instructions in section 6.2 and onwards first, while you keep the assembled outdoor sensor package nearby (although preferably not closer than 5 ft. from the console). This will make any troubleshooting and adjustments easier and avoids any distance or interference related issues from the setup. After setup is complete and everything is working, return here for outdoor mounting. If issues show up after outdoor mounting they are almost certainly related to distance, obstacles etc.
Mounting:
You can attach a pipe to a permanent structure and then attach the sensor package to it (see Figure 9). The U-Bolts will accommodate a pipe diameter of 1-2 inches (pipe not included).
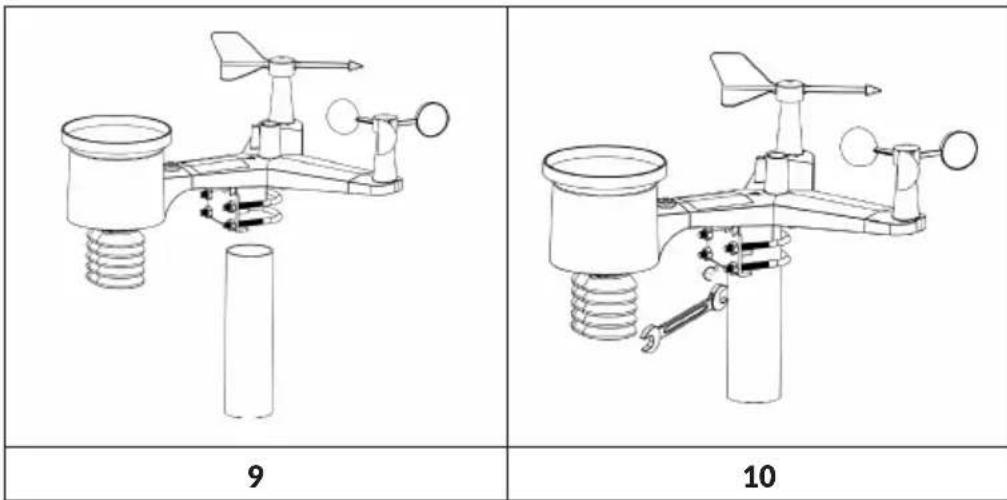
Finally, place the sensor package on top of the prepared mounting pipe. The U-Bolts should be loose enough to allow this but loosen the nuts as necessary. Once placed, hand tightens all four nuts, taking care to do so evenly.
Now you will need to align the whole package in the proper direction by rotating it on top of the mounting pipe as needed. Locate the arrow labeled "North" that you will find on top of the sensor package right next to the light sensor. You must rotate the whole sensor package until this arrow points due north. To achieve proper alignment, it is helpful to use a compass (many cell phones have a compass application).
Once rotated in the correct orientation, lightly tighten the bolts a little more (use a wrench) to prevent further rotation.
Note: Use the bubble level next to the rain sensor to make sure sensor array is completely level. If the sensor is not level, the rain gauge, UV and solar radiation sensors will not measure properly.
Reset Button and Transmitter LED
In the event that the sensor array is not transmitting, reset the sensor array.
- With an open ended paperclip, press and hold the RESET BUTTON for three seconds to completely discharge the voltage.
- Take out the batteries and wait one minute, while covering the solar panel to drain the voltage.
- Put batteries back in and resynchronize with console by powering down and up the console with the sensor array about 3 meter away.
Best Practices for Wireless Communication
Note: To insure proper communication, mount the remote sensor(s) upright on a vertical surface, such as a wall. Do not lay the sensor flat.
Wireless communication is susceptible to interference, distance, walls and metal barriers. We recommend the following best practices for trouble free wireless communication.
- Electro-Magnetic Interference (EMI). Keep the console several feet away from computer monitors and TVs.
- Radio Frequency Interference (RFI). If you have other 433 MHz devices and communication is intermittent, try turning off these other devices for troubleshooting purposes. You may need to relocate the transmitters or receivers to avoid intermittent communication.
- Line of Sight Rating. This device is rated at 300 feet line of sight (no interference, barriers or walls) but typically you will get 100 feet maximum under most real-world installations, which include passing through barriers or walls.
- Metal Barriers. Radio frequency will not pass through metal barriers such as aluminum siding. If you have metal siding, align the remote and console through a window to get a clear line of sight.
The following is a table of reception loss vs. the transmission medium. Each “wall” or obstruction decreases the transmission range by the factor shown below.
| Medium RF Signal Strength Reduction | |
| Glass (untreated) 5-15% | |
| Plastics 10-15% | |
| Wood 10-40% | |
| Brick 10-40% | |
| Concrete 40-80% | |
| Metal 90-100% | |
Display console
- Insert the 5V AC adaptor into the back of the display console
Note: Place the outdoor sensor array about 5 to 10 feet from the display console and wait several minutes for the remote sensors to synchronize with the display console.
- Insert 3 AAA batteries into the display console? Please insert the battery as blew figure 12.
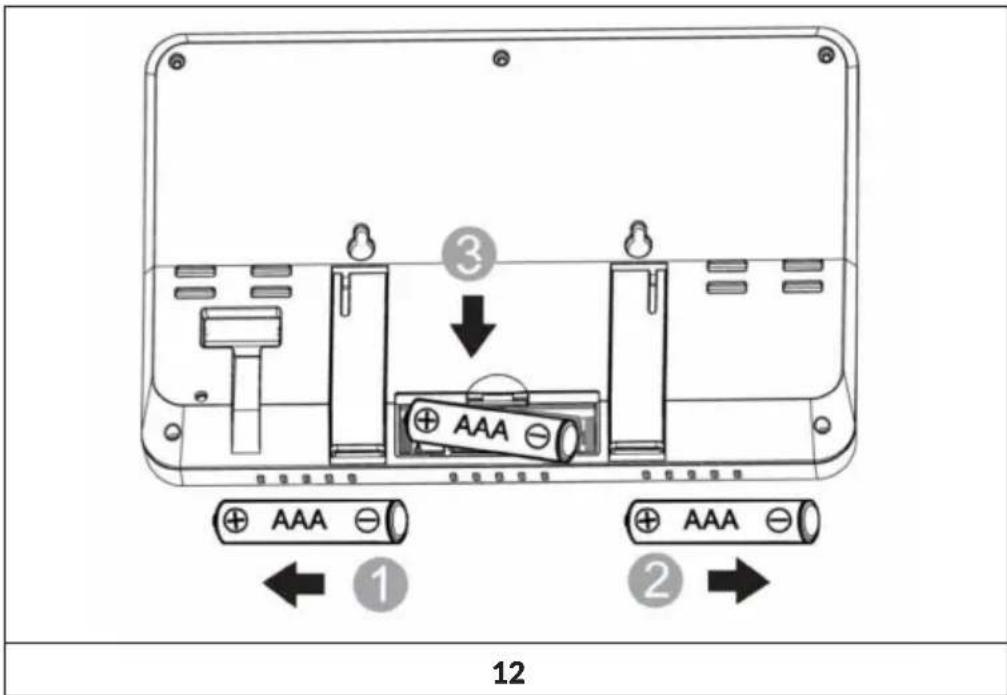
Note: The batteries are intended for back-up power only. The backlight will remain on for 5 seconds when on back up battery power only. Only when you use power adapter it will the back-light be continuously on.
- Keep both sensor and the display console together for 15 minutes to lock in the sensor signals.
- Spin the wind cups to simulate wind speed. Take the sensor to the sink and slowly drip water into the rain bucket to simulate rain.
- After 15 miuntes, follow the mounting instructions for proper placement of sensors.
13
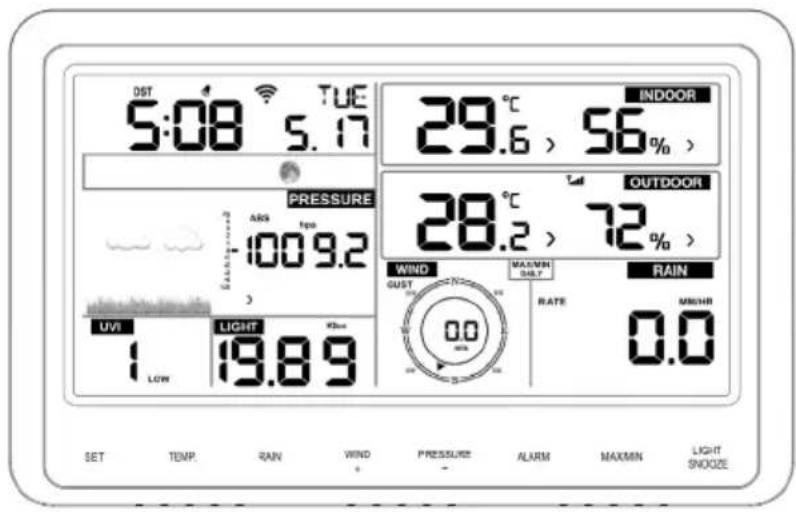
Your display console should have readings in all sections. Wind and Rain will show O's (connected) until wind or rain occur or are simulated.
Note: If you only use battery to power up display console, you must press LIGHT/SNOOZE key to light up the LCD before press any other key.
Vertical Desk Stand
The console is best viewed above from a 20 to 30 degree angle. In addition to the fold out desk stand on the back of the display, console, the console also includes a vertical desk stand to improve the viewing able on a desk, as shown in Figure 14.
COMMISSIONING AND OPERATION
Screen display
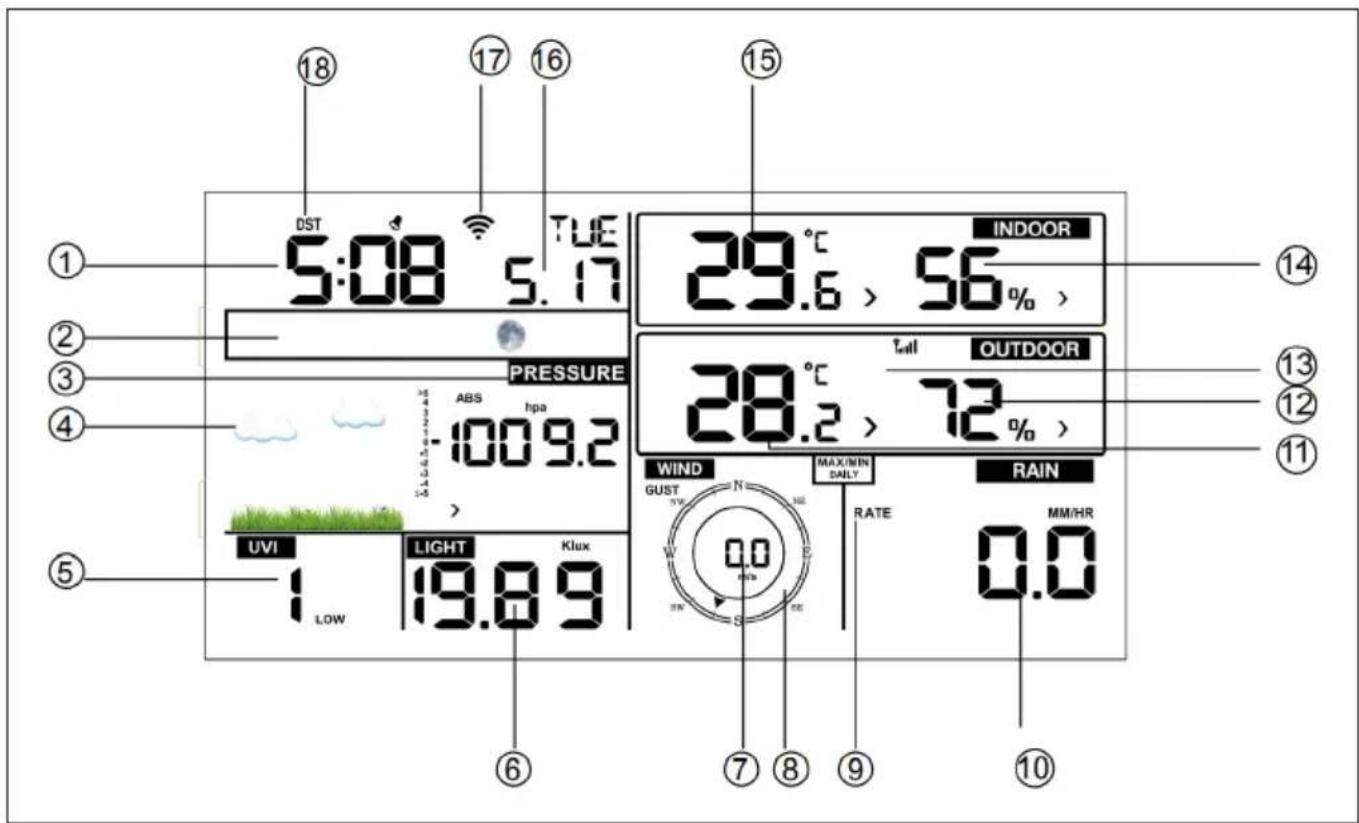
| 1.Time 10 Rain fall | |
| 2 Moon phase 11 Outdoor temperature | |
| 3 Barometric Pressure 12 Outdoor humidity | |
| 4 Weather forecast 13 RF icon | |
| 5 UV index 14 Indoor humidity | |
| 6 Light 15 Indoor temperature | |
| 7 Wind speed 16 Date | |
| 8 Wind direction 17 WIFI icon | |
| 9 MAX/MIN Daily 18 DST |
Initial display console set up
- Connect the power adapter to power up the display console.
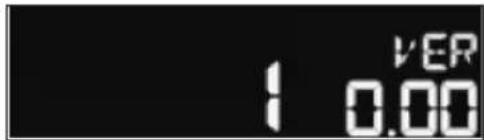
- The unit will show software version number 2 seconds after power reset.
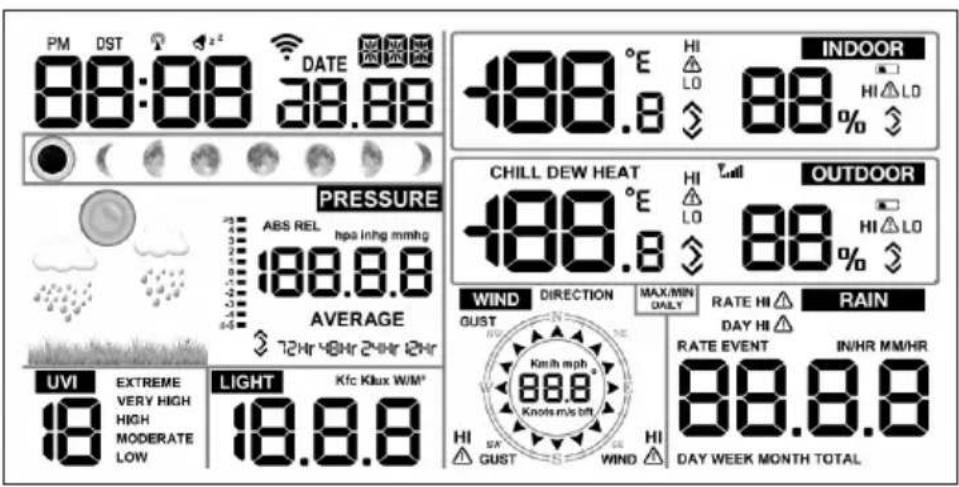
- The unit will turn on all segments of the LCD for 3 seconds after power reset, the unit will start to register the outdoor channel for 3 minutes.
Key function

| Key Description | |
| SET Hold this key to enter setting mode | |
| TEMP. Press this key to view wind Chill, Heat Index, Dew PointTempera-ture | |
| RAIN Press this key to view Rain Rate, event, Rain Dayly, RainWeekly, Rain Monthly, Rain yearly and Rain total. Press the RAIN key 2s to reset current display rain | |
| WIND + Press this key to view wind/gust and wind direction | |
| PRESSURE Press this key to view Absolute Pressure average of 12hr, 24hr, 48hr and 72hr. Press and hold 2s this key to view the abso-lute and relative pressure | |
| ALARM Press this key to view the alarm value of Temperature / Humidi-ty/rain rate/rain day/wind | |
| MAX/MIN Press this key to view the MAX/MIN value of Temperature/ Humidity/rain rate/rain day/wind/UVI/LIGHT/Absolute Pressure | |
| LIGHT/SNOOZE Press this key to adjust LCD backlight brightness: HI/ MID/OFF. Hold this key to register new transmitter | |
Important Notes
-
When power on, press WIND/+ and PRESSURE/- key to reset the weather station and clear all records memory, and clears all user settings to default.
-
When power on, press TEMP. key to skip receive RF signal.
-
In Setting mode, pressing WIND/+ or PRESSURE/- key select the unit or scrolls the value; keeping press and holding WIND/+ or PRESSURE/- key for 2 second will increase/decrease digits in great steps.
-
The setting procedure can be exited at any time by either pressing the LIGHT /SNOOZE key or waiting for the 30-second time-out to take effect.
SETTINGS AND MODES
Pressing the SET key for 2 seconds to enter setting model, the basic settings can now be performed in the following order:
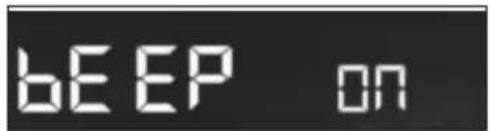
BEEP
Press the SET key for 2 seconds to select the beep section, ON/OFF section digits will start flashing, press the WIND/+ or PRESSURE/- key to select ON or OFF. "BEEP ON" will make the Beep sound on every key press. If you do not want the beep sound to be heard, select "BEEP OFF"
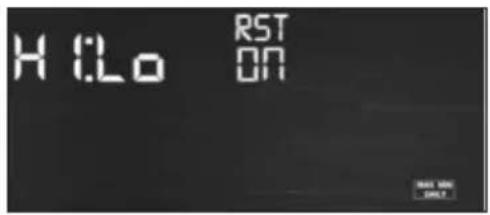
MAX/ MIN Daily
Press the SET key twice to select the MAX/MIN Daily section, ON/OFF section digits will start flashing, press the WIND/+ or PRESSURE/- key to select ON or OFF. (Default is ON, ON: clear at 0:00 every day).
Time / Date
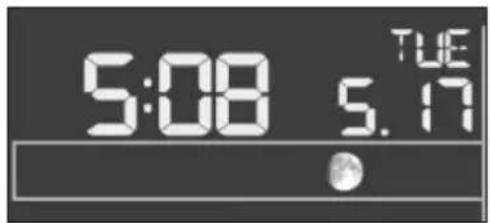
- Press the SET key third time to select the 12/24 hour format section (default: 24hr).
- Press the SET key forth time to select the hour section.
- Press the SET key fifth time to select the minutes section.
- Press the SET key sixth time to select DD-MM or MM-DD format. (Default DD-MM format)
- Press the SET key seventh time to select year.
- Press the SET key eighth time to select month.
- Press the SET key ninth time to select day.
Press the WIND/+ or PRESSURE/- button to set the value. If the user changes the minute value, the second is automatically set to 0.
Note: WIFI firmware version 1.4.4 and above support Global Time synchronization. Time zone, DST and date will automatic updated from internet when base station is connected to WIFI internet.
DST
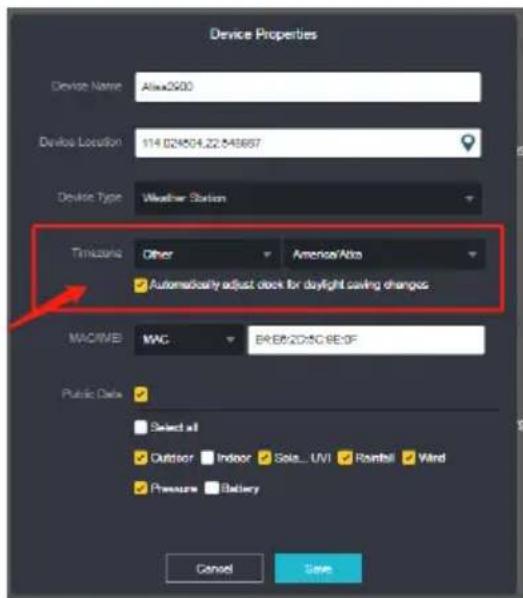
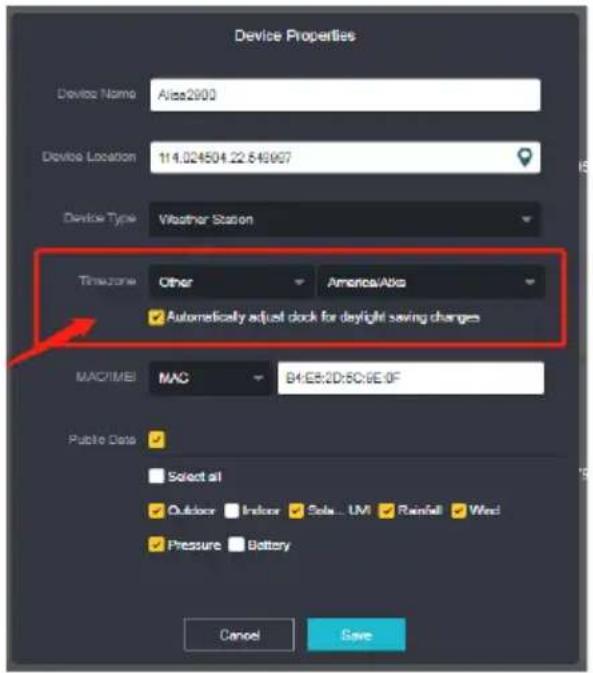
If you did not upload data to ecowitt.net, the time zone is defined based on the your IP address. DST is subject to time zone. If you set uploaded data to ecowitt.net, please set the correct time zone on the website and make sure the "Automatically adjust clock for daylight saving changes" is active. The time and DST will be automatically synchronized from ecowitt server.
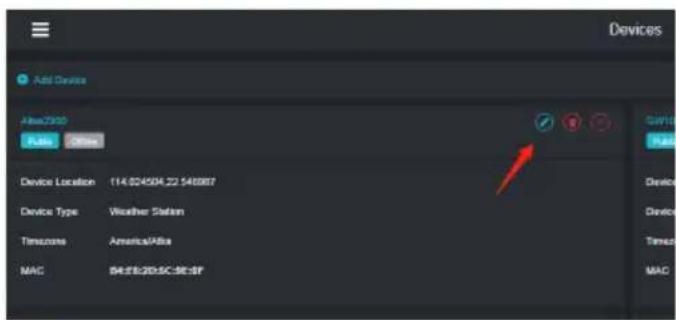
How to set the time zone on ecowitt.net
- Visit ecowitt.net. Press the upper left menu button and select Devices.
- Select the edit icon of the device to access the Device Properties and set the time zone.
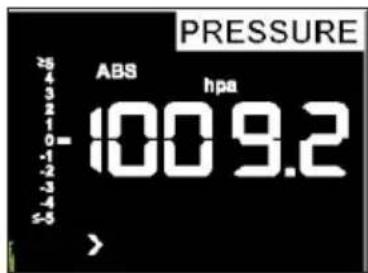
Pressure
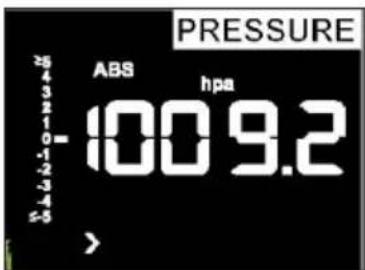
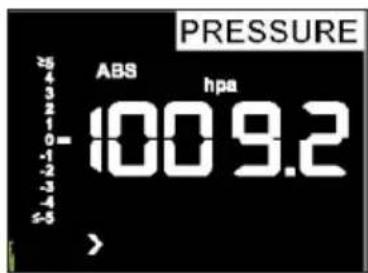
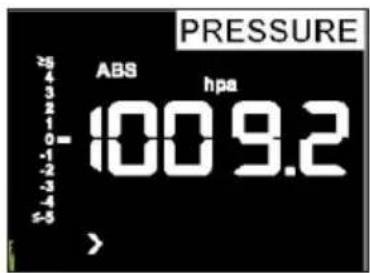
- Press the SET key tenth to select the ABS/REL pressure unit. Pressure value and hPa digits will start flashing. Press the WIND/+ or PRESSURE/-key to select unit (hPa, inhg, mmhg).
- Press the SET key eleventh to adjust the REL pressure value. REL pressure value and hPa digits will start flashing. Press the WIND/+ or PRESSURE/-key to increase or decrease the REL pressure value.
Viewing absolute vs. relative pressure:
- To switch between absolute and relative pressure, press and hold the [PRESSURE -] button for two seconds.
- Absolute pressure is the measured atmospheric pressure, and is a function of altitude, and to a lesser extent, changes in weather conditions. Absolute pressure is not corrected to sea-level conditions.
- Relative pressure is corrected to sea-level conditions.
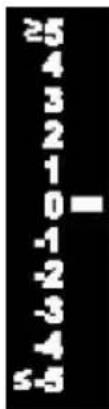
Rate of change of pressure graph:
The rate of change of pressure graphic is shown to the left of the barometric pressure and signifies the difference between the daily average pressure and the 30 day average (in hPa).
Viewing pressure history:
Press the [PRESSURE -] button to view the 12 hour, 24 hour, 48 hour and 72 hour pressure average.
Relative pressure calibration discussion:
- To compare pressure conditions from one location to another, meteorologists correct pressure to sea-level conditions. Because the air pressure decreases as you rise in altitude, the sea-level corrected pressure (the pressure your location would be at if located at sea-level) is generally higher than your measured pressure. Thus, your absolute pressure may read 28.62 inHg (969 mb) at an altitude of 1000 feet (305 m), but the relative pressure is 30.00 inHg (1016 mb).
- The standard sea-level pressure is 29.92 inHg (1013 mb). This is the average sea-level pressure around the world. Relative pressure
measurements greater than 29.92 inHg (1013 mb) are considered high pressure and relative pressure measurements less than 29.92 inHg are considered low pressure.
- To determine the relative pressure for your location, locate an official reporting station near you (the internet is the best source for real time barometer conditions, such as Weather.com or Wunderground.com), and set your weather station to match the official reporting station.
Light
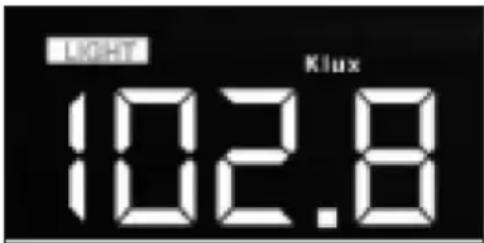
Press the SET key 12th time to select light unit (lux, fc, w/m2;default: w/m2).
Temperature
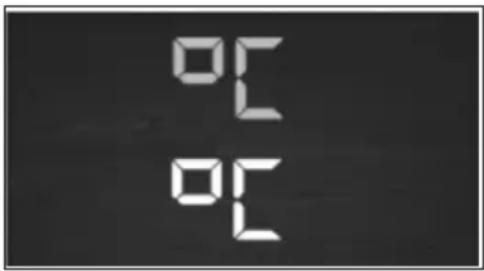
- Press the SET key 13th time to select in/outdoor temperature unit, degree C digits will start flashing, press the WIND/+ or PRESSURE/- key to select unit (C or F; default: C).
- In normal mode, press the TEMP. key to view wind Chill, Heat Index, Dew Point Temperature. Press the TEMP. key for 5 second, will register new transmitter.
Note: every 60 second the unit will measure indoor temperature, indoor humidity and pressure. If temperature is to lower than minimum range, will display --.-, if it is higher than highest range, will display --.-.
Wind speed
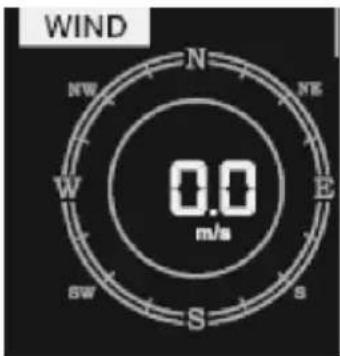
- Press the SET key 14th to select wind speed unit (km/h, mph, knots, m/s, bft;default: km/h).
- In normal mode, press and release the WIND/+ key to view the wind, gust and wind direction.
Rain
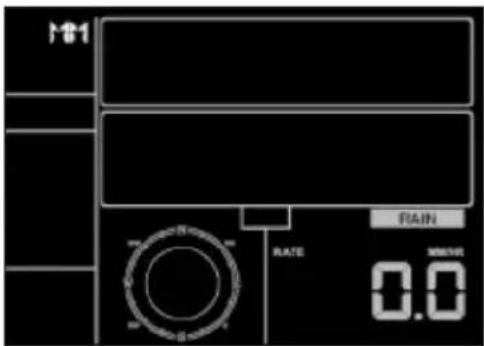
- Press the SET key 15th to select rainfall unit (inch or mm) the default
- mode is mm).
- In normal mode, press and release the RAIN key to view rain of rate, event, day, week, month and total.
- Press the RAIN key for 2 seconds to reset current display rain.
Notes:
- Reset daily rain, will auto reset rain rate and rain event
- Reset weekly rain, will auto reset daily rain, rain rate and rain event
- Reset monthly rain, will auto reset daily rain, weekly rain, rain rate and rain event
- Reset yearly rain, will auto reset daily rain, weekly rain, monthly rain, rain rate and rain event
- Reset total rain, will auto reset month, week and day rain
Important notes on rain:
- Rain rate: the last 10 minutes rainfall multiplication 6.
- Rain event: It starts to record the rain event value form the rain falls, the rain event is over and value reset to 0 if last 24 hour rainfall less 1 mm and the last 1 hour no rainfall.
- Daily: defined by calendar day. You can set the start time from 0:00 - 23:00, default is start from midnight (0:00.)
- Weekly: defined by calendar week. You can set the start from Sunday or from Monday. Default is start from Sunday morning at midnight (Sunday through Saturday).
• Monthly: defined by calendar Month i.e. January 1 - January 31. - Yearly: defined by the calendar year total; user can set the start time from Jan 1st to Dec 1st, default is start from Jan 1st.
• Total: running total since station was powered up.
Moon phase
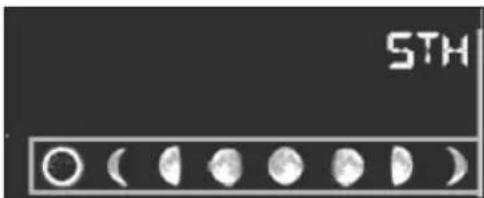
Press the SET key 16th to select Northern or Southern Hemisphere.
Alarm mode
Display of Alarm value:
- Press and release ALARM key to display high alarm.
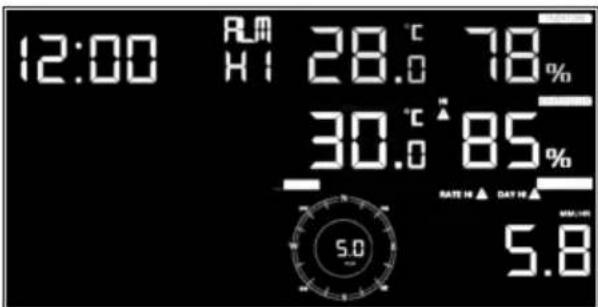
- Press ALARM key again to display low alarm.
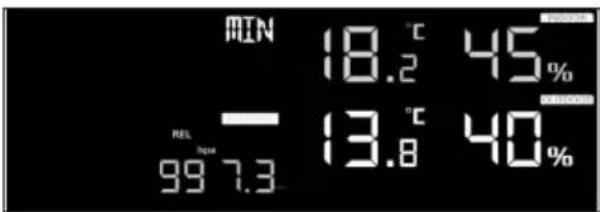
- Press RAIN key to select display rate or day rain alarm data.
- Press WIND/+key to select display wind or gust alarm data.
- Press ALARM key third time or press LIGHT /SNOOZE key back to normal mode
Alarm mode setting:
- Press and hold for 2 seconds ALARM key enter alarm setting mode:
- Press the WIND/+ or PRESSURE/- to arm/disarm alerts and adjust alert values.
- Press the SET key to confirm & move to the next item.
- Press the ALARM key to on/off the alarm
Note: when alert is triggered, the current triggering source icon for time, icon for high value and icon for low value will be flashing, indicating alert is triggered. Press ALARM key third time back to normal mode or press LIGHT /SNOOZE key back to normal mode.
| Icon for time | |
| Icon for high value | |
| Icon for low value |
Alarm setting order:
- Time alarm setting
- Indoor high temperature setting
- Indoor low temperature setting
- Indoor high humidity setting
- Indoor low humidity setting
- Outdoor high temperature setting
- Outdoor low temperature setting
- Outdoor high humidity setting
- Outdoor low humidity setting
- High wind setting
- High gust setting
- Rain rate high setting
- Rain day high setting
Max/min mode
Display MAX data:
Press and release MAX/MIN key to display MAX data.
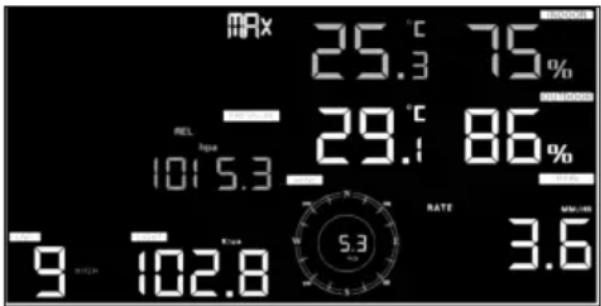
- Press TEMP. key to view wind chill, heat index and dew point max.
- Press RAIN key to view rain rate, rain day, rain week and rain month max.
- Press WIND/+ to view wind and gust max.
- Press PRESSURE/ to hold 2 seconds to view pressure absolute and relative max.
Display min data:
Press again to display min data.
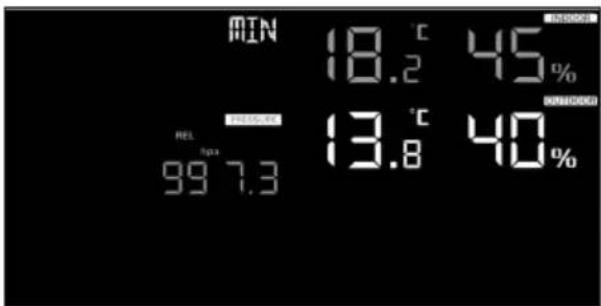
- Press TEMP. key to view wind chill and dew point min.
- Press PRESSURE/-to hold 2 seconds to view pressure absolute and relative min.
Note: press and hold 2s MAX/MIN button to reset all max or min. Press MAX/MIN key third time back to normal mode or press LIGHT /SNOOZE key back to normal mode.
Calibration mode
Hold the TEMP. and MAX/MIN key together for 5 seconds to enter calibration mode.
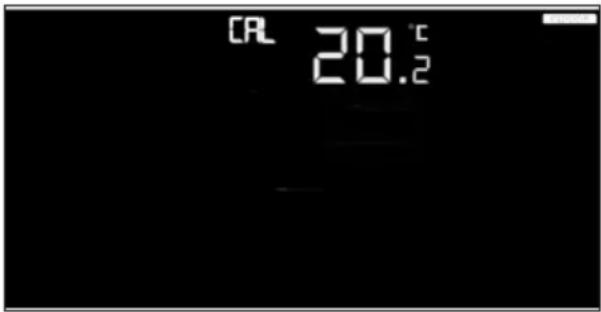
- Press the WIND/+and PRESSURE/key to adjust values.
- Press the SET key to confirm & move to the next item.
- Press the ALARM key to reset any adjusted value.
- Press the LIGHT /SNOOZE key at any time to exit.
Calibration order:
- Indoor temperature offset calibrated (range +/-5°C, default: 0 degrees)
- Indoor humidity offset calibrated (range +/-10%)
- Outdoor temperature offset calibrated (range +/-5°C, default: 0 degrees)
- Outdoor humidity offset calibrated (range +/-10%)
- Absolute pressure offset calibrated (range +/-50hpa)
- Wind direction offset calibrated (adjust by degree)
- Wind speed factor adjust, default 100% (range 50% to 150%)
- Rain factor adjust, default 100% (range 50% to 150%)
OTHER FEATURES
Factory Reset/Clear Memory
To restore the console to factory default, perform the following steps:
- Remove the power from the console by removing the batteries and disconnecting the AC adapter.
- Apply power by connecting the AC adapter.
- Wait for all of the segments to appear on the screen,
- Press and hold the WIND/+ and PRESSURE/- keys at the same time until the console power up sequence is complete (about 5 seconds).
- Replace the batteries.
Register New Transmitter
Press and hold the LIGHT/SNOOZE button for 5 seconds, and the console will re-register the wireless sensor.
Backlight Operation
With AC adaptor:
- The backlight can only be continuously on when the AC adapter is permanently on. When the AC adapter is disconnected, the backlight can be temporarily turned on.
- Press the LIGHT SNOOZE key to adjust the brightness between High, Low and Off.
Without AC adaptor:
To reduce power consumption, the display console will automatically enter sleep mode and will not send data to the Internet if no key is pressed for 15s. Hold the LIGHT/SNOOZE key in sleep mode or plug in the DC adapter wake up equipment.
Tendency indicators
- Tendency arrows allow you to quickly determine of temperature or pressure are rising and falling in a three hour update period, updated every 30 minutes.
- Eg.: At 3:00 - compare to 12:00 data; at 3:30 - compare to 12:30 ..... etc
 | Rising >3%>1°C/2°F>1 hpa | ||
| Steady <= 3%<=1°C/2°F<=1 hpa | |||
| Falling >3%>1°C/2°F>1 hpa |
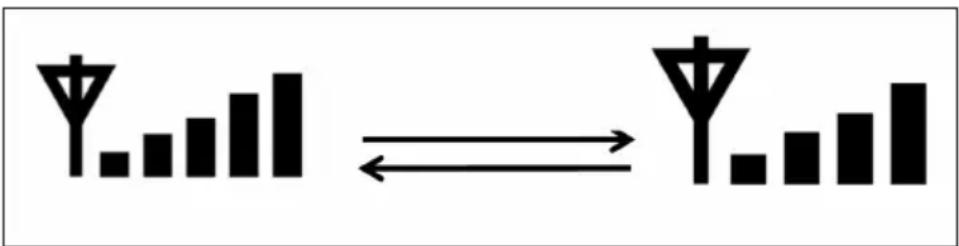
Wireless Signal Strength Indicator
- The wireless signal strength displays reception quality. If no signal is lost, the signal strength indicator will display 5 bars.
- If the signal is lost once, four bars will be displayed.
flowchart
graph LR
    A["Bar Chart"] <--> B["Vertical Bar Chart"]
Weather forecast
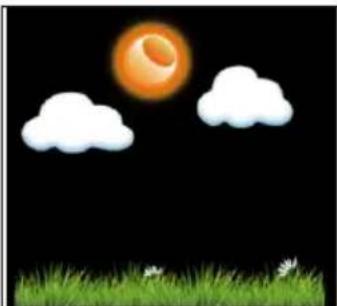
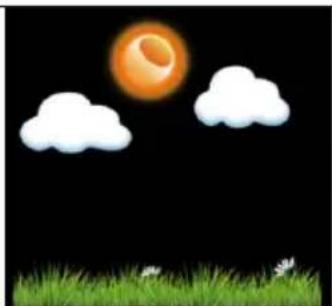
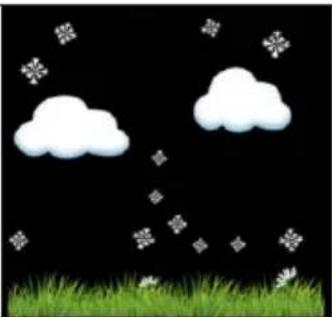
There are six color forecast icons use changing atmospheric pressure to predict weather conditions for the next 6-hours. Please allow at least one month for the weather station to learn the barometric pressure over time.
natural_image
Illustration of a sun and clouds over green grass under a black sky (no text or symbols)Sunny Partly sunny Cloudy
natural_image
Illustration of a full moon over clouds and grass under a black sky (no text or symbols)
natural_image
Simple illustration of two white clouds above a grassy field with small white flowers, set against a black background (no text or symbols)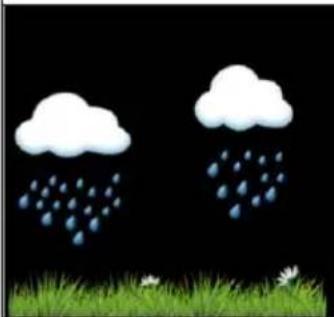
natural_image
Illustration of two white clouds with raindrops falling and green grass at the base (no text or symbols)Rainy Snowy
natural_image
Black-and-white illustration of two white clouds with falling snow and scattered flowers on grass (no text or symbols)
natural_image
Green grass field with two small white flowers on the ground against a black background (no text or symbols)
natural_image
Simple double-headed arrow symbol pointing left and right (no text or labels)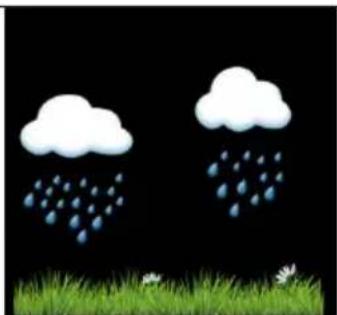
natural_image
Illustration of two clouds with raindrops falling and green grass at the base (no text or symbols)Storm rainy
(The respective symbols will light up for a maximum of 30 minutes.)
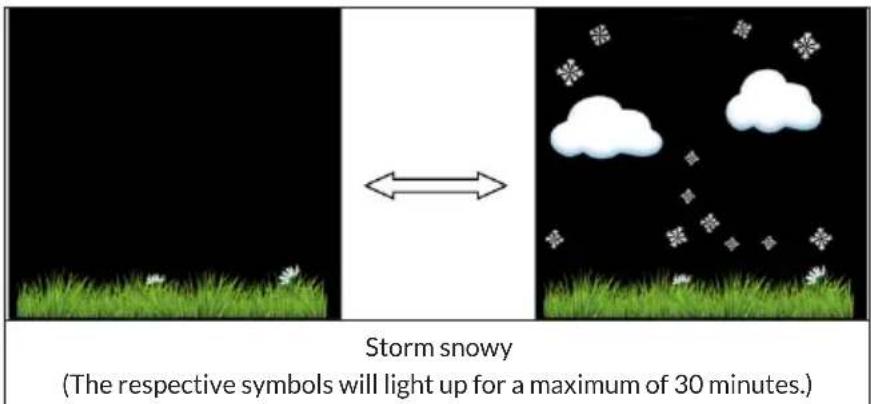
Note: Snowy icon will appear in place of rainy icon when the outdoor temperature is below 0^ C (32 F).
Weather Forecasting Description and Limitations
In general, if the rate of change of pressure increases, the weather is generally improving (sunny to partly cloudy). If the rate of change of pressure decreases, the weather is generally degrading (cloudy, rainy or stormy). If the rate of change is relatively steady, it will read partly cloudy.
The reason the current conditions do not match the forecast icon is because the forecast is a prediction 24-48 hours in advance. In most locations, this prediction is only 70% accurate and it is a good idea to consult the National Weather Service for more accurate weather forecasts. In some locations, this prediction may be less or more accurate. However, it is still an interesting educational tool for learning why the weather changes.
The National Weather Service (and other weather services such as Accuweather and The Weather Channel) have many tools at their disposal to predict weather conditions, including weather radar, weather models, and detailed mapping of ground conditions.
Snooze
When time alarm has been triggered, the alarm will sound and alarm icon flash for 120s. Press SNOOZE/LIGHT key to silence the alarm for 10 minutes and then the alarm will sound again when that time is up. Press any key except SNOOZE/LIGHT key to stop the alarm.
AC address display
When the external power adaptor is connected and plugged in-then press and release the SET button to view MAC address.
For example the MAC is 12:34:56:AB:CD:EF:

With your obtained MAC address, register your device on the Ecowitt service or customized website.
LIVE INTERNET PUBLISHING
Your console is capable of sending your sensor data to select internet-based weather services. The supported services are shown in the table below:
| Hosting Service Website Description | ||
| Ecowitt Weather | https://www.ecowitt.net Ecowitt | is a new weather server that can host a bunch of sensors that other services don't support. |
| Weather Underground | https://www.wunderground.com | Weather Underground is a free weather hosting service that allows you to send and view your weather station data real-time, view graphs and gauges, import text data for more detailed analysis and use iPhone, iPad and Android applications available at Wunderground.com. Weather Underground is a subsidiary of The Weather Channel and IBM. |
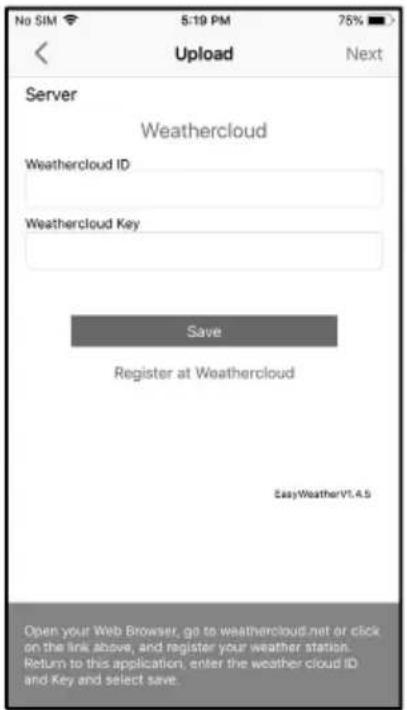
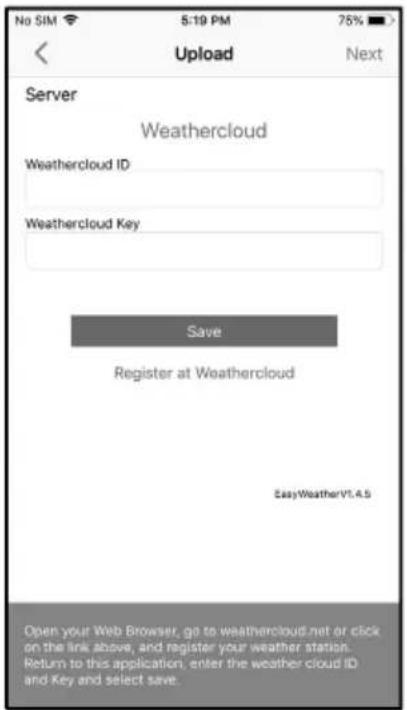
| Weather Cloud | https://weathercloud.net Weathercloud is a real-time weather so-cial network formed by observers from around the world. | |
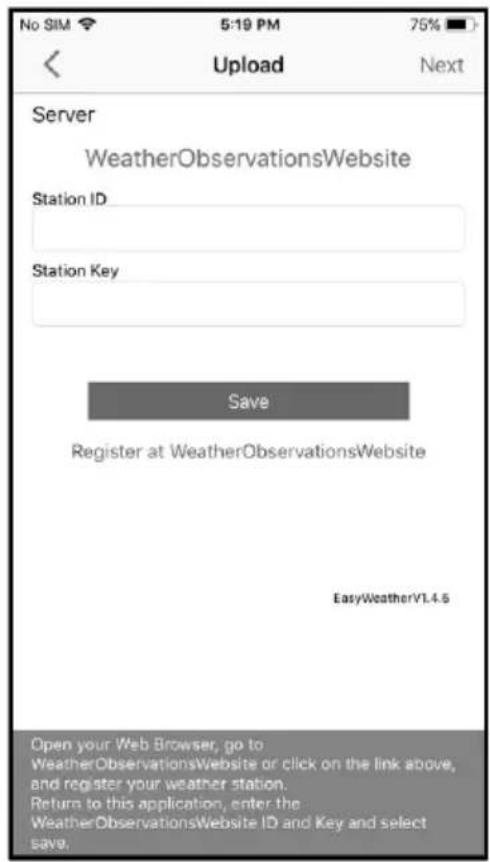
| Weather Observations Website (WOW) | http://wow.metoffice.gov.uk/ | WOW is a UK based weather observation website. WOW allows anyone to submit their own weather data, anywhere in the world. |
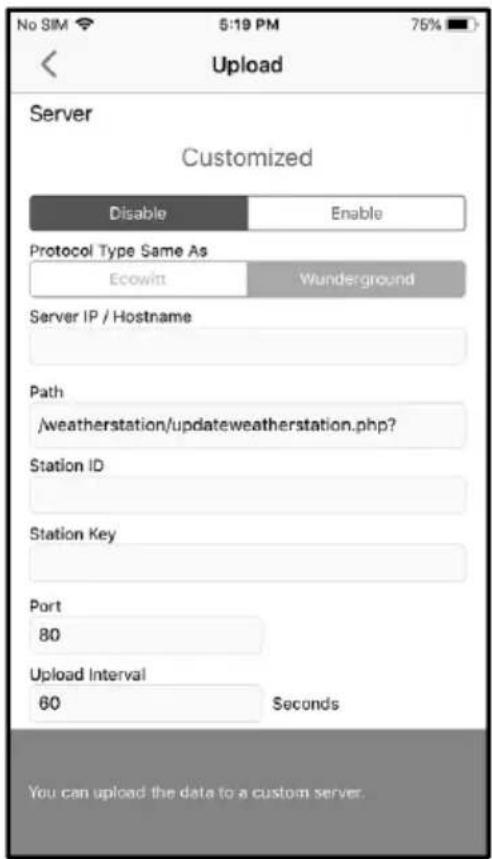
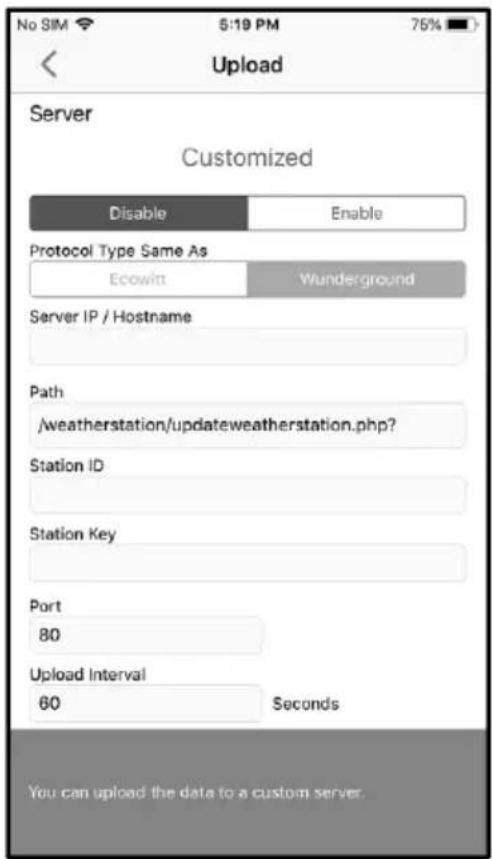
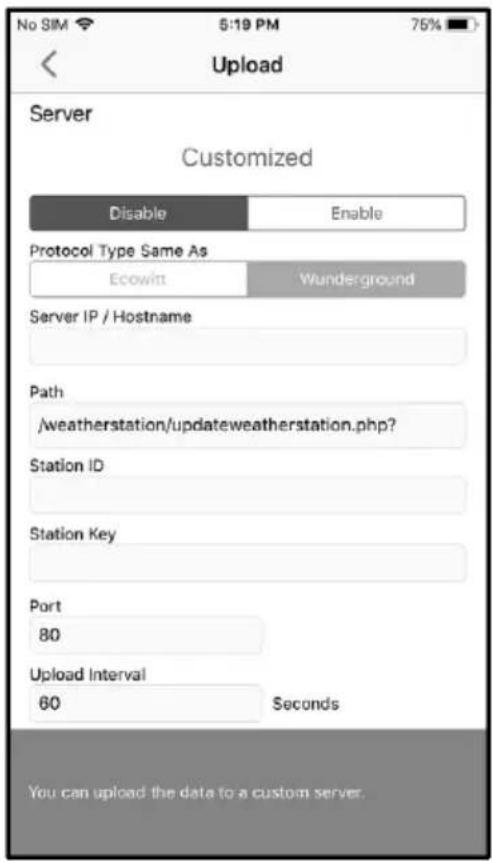
| Customized Website | Supports uploading to your customized website, if the website has the same protocol with Wunderground or Ecowitt | |
Connecting the Weather Station Console to WiFi
To send weather data to these services you must connect your console to the internet via Wi-Fi. The console can only operate using Wi-Fi when the external power adapter is connected and plugged in!
Note: If you are testing the setup with the outdoor sensor package nearby and indoor, you may want to consider connecting to Wi-Fi, but not yet configuring any of the weather services. The reason is that while indoor the temperatures and humidity recorded by the outdoor sensor, and as reported to the weather service(s) will reflect indoor conditions, and not outdoor conditions. Therefore, they will be incorrect. Furthermore, the rainfall bucket may be tripped during handling, causing rain to register while it may not actually have been raining. One way to prevent this is to follow all instructions, except to use an incorrect password, on purpose! Then, after final outdoor installation, come back and change the password after clearing console history. That will start uploading to the services with a clean slate.
Download mobile application
Wi-Fi configuration is done using your mobile device, either iOS or Android. Start by downloading the "WS View PLUS" application from the Apple App Store or Google Play store, as appropriate for your device.
Connect the console to Wi-Fi
Now activate the application you have downloaded on your mobile device. The following instructions will generally show screen shots for the Android/iOs application side by side.
Configure Device
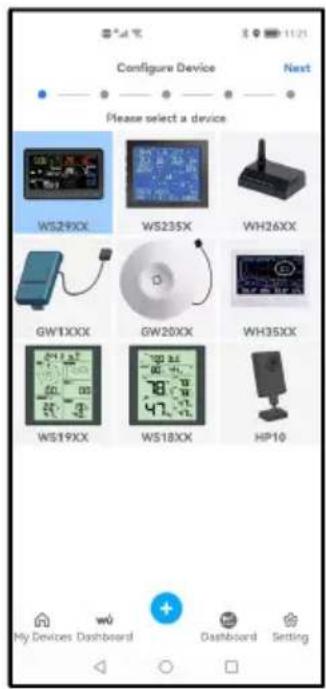
Select the device you have from the device list, then press Next

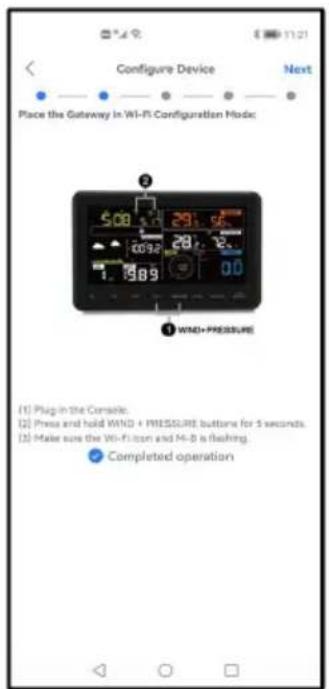
Operate as per the information, tick the box to confirm Completed operation, press Next.

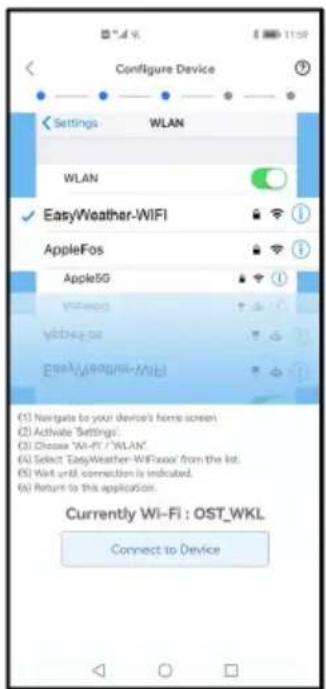
Choose the device named EasyWeather-WIFI.
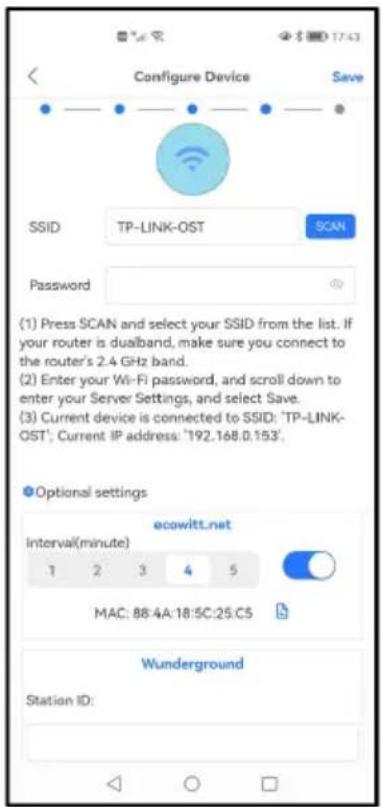
Press Scan and select you SSID from the list, then enter your WiFi password and press Next.
If you own a dual band router (2.4 GHz and 5.0 GHz), make sure you connect to the 2.4 GHz band, otherwise it will fail to connect the weather station to WiFi.

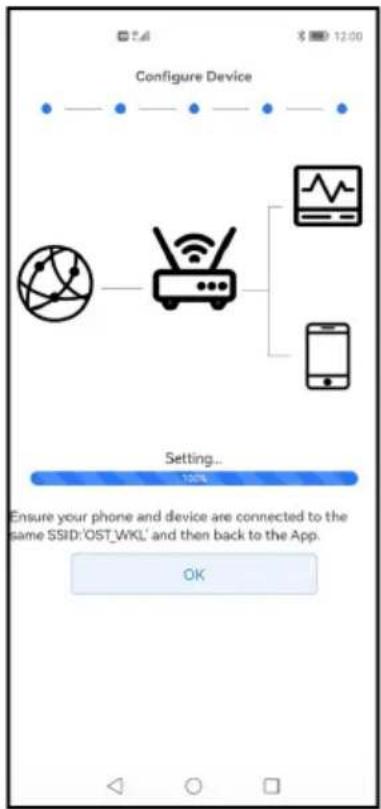
Connect the EasyWeather-WIFI weather station to your router via your mobile device. If the connection was established successfully, the upload settings will be displayed automatically.
Upload settings
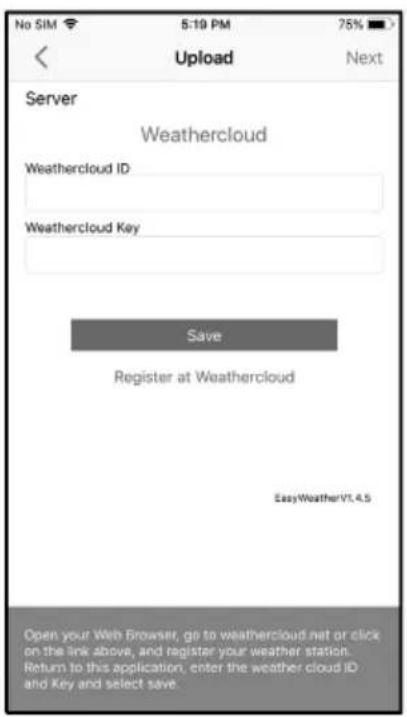
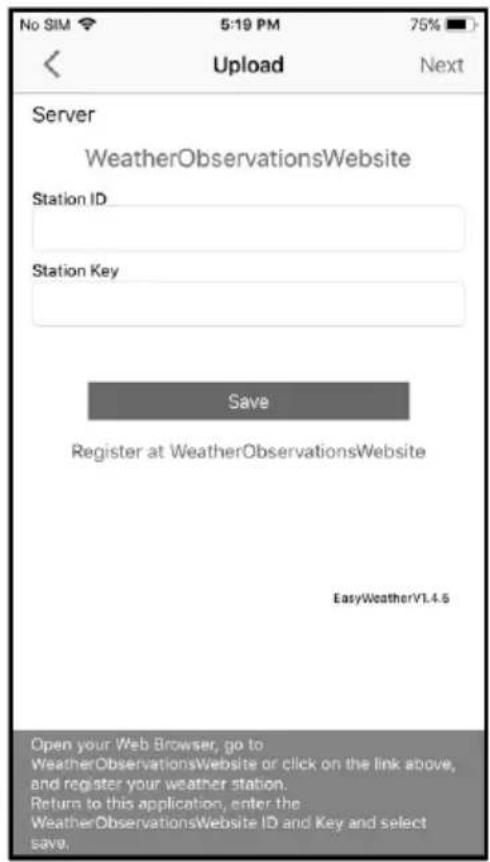
Your device can be used to send data from your sensor to selected internet-based weather services, such as ecowitt.net, wunderground.com, weathercloud.net, wow.metoffice.gov.uk, and your self-created website. Users must register on the appropriate website to receive a station ID (or MAC address) for your weather station and a password.
Adding weather services
You may have already configured the weather services during the initial configuration, or you can do it later. To do this, open the mobile application and select your device in the device list. This will display the screen for the device.
Navigate to the weather service you want to configure by pressing Next, and then enter the appropriate data.
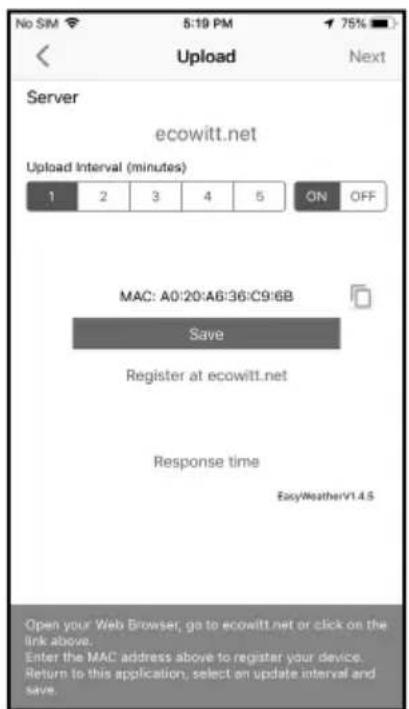

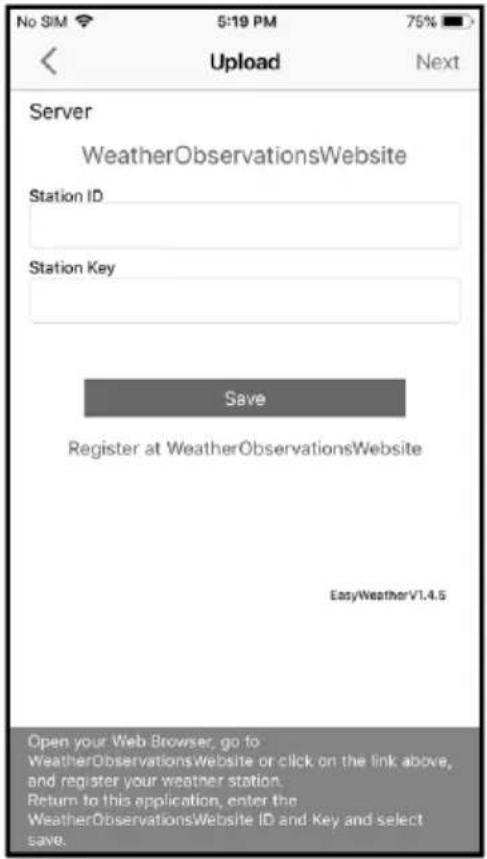
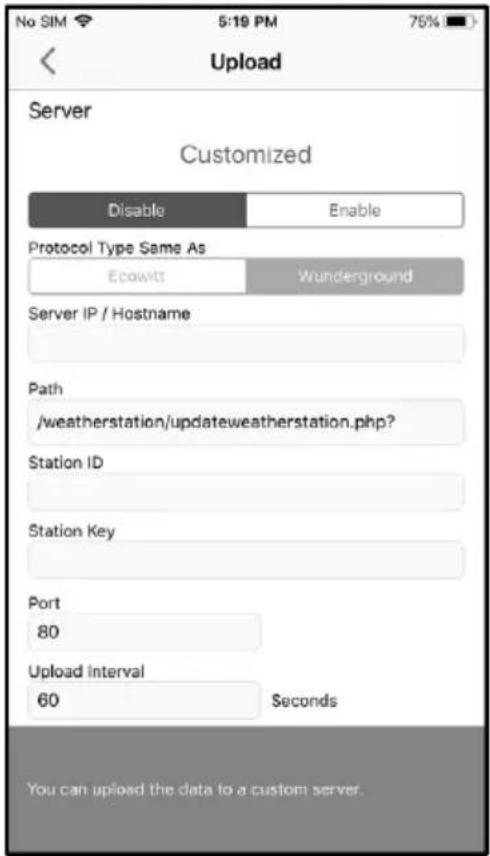
ECOWITT WEATHER
It is recommended to use Ecowitt Weather Server to monitor and record data from your sensors. Configure it as follows:
- On the ecowitt.net Upload page, enable the ON button and set the upload interval time.
- Press Save on the page.
- Click Register at ecowitt.net and complete the registration on the page.
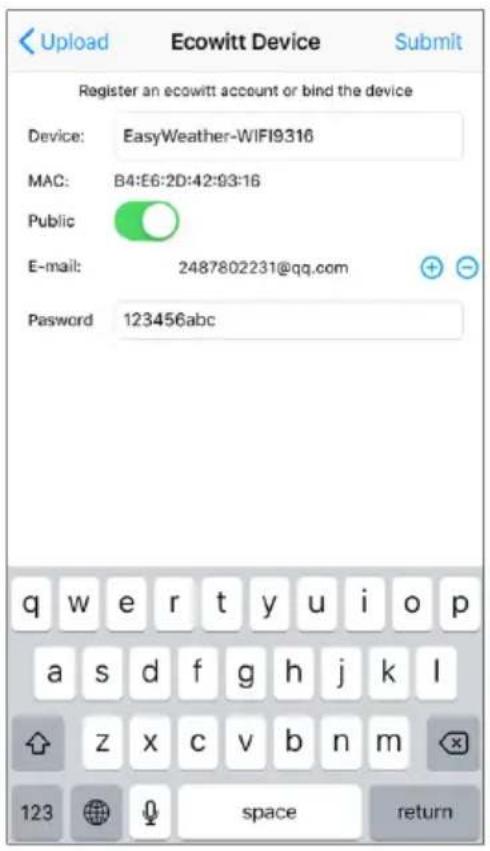
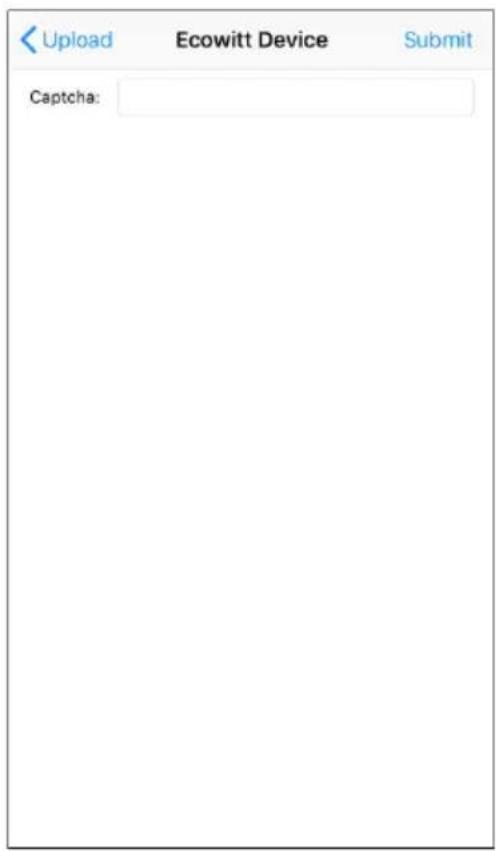
- Press the (+) button and select your email address.
- Set a password for your ecowitt account.
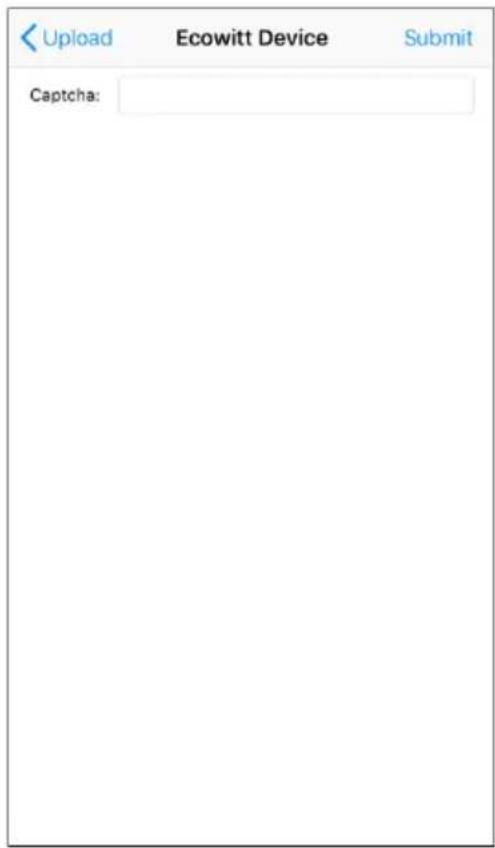
- Press Submit.
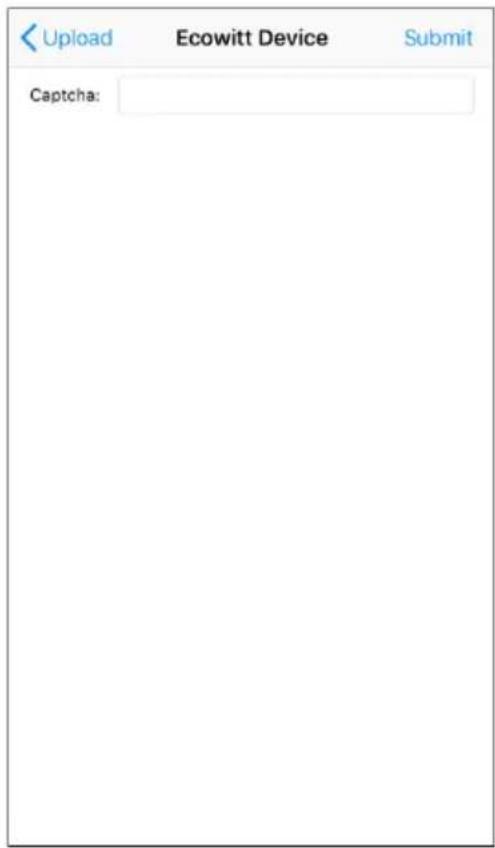
- Enter the captcha sent to their email inbox and press Submit.
Note: If you did not receive the captcha in your email inbox, please check the spam folder.
The WS View Plus app only supports setting the units. To make all settings complete, visit the ecowitt website in your browser or on a computer. If you could not register in WS View Plus App, please go to ecowitt website to register and add the unit.
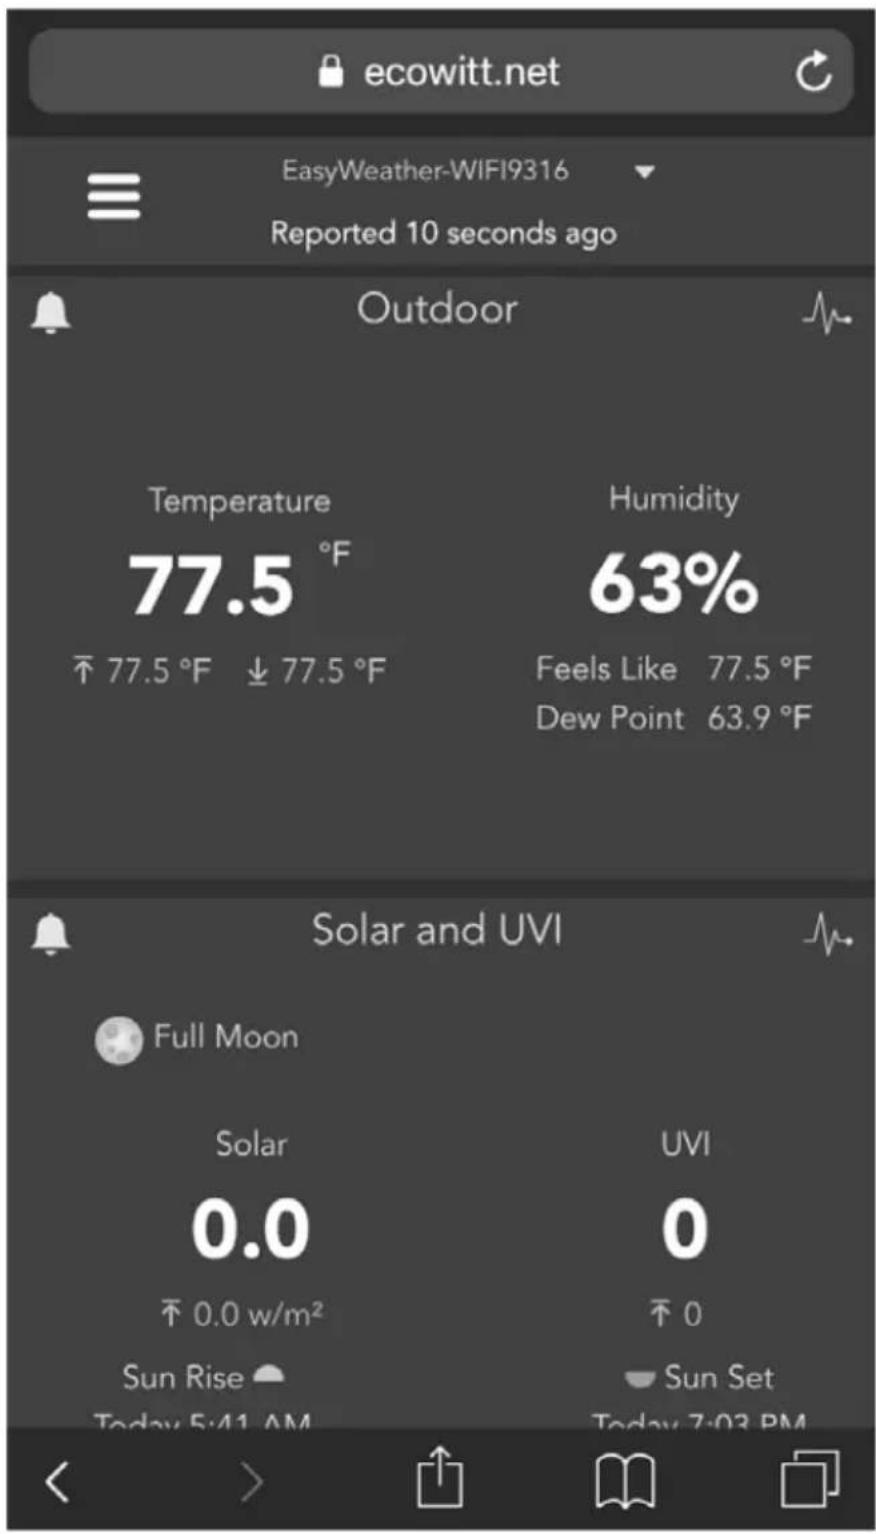
Indication of data on ecowitt.net
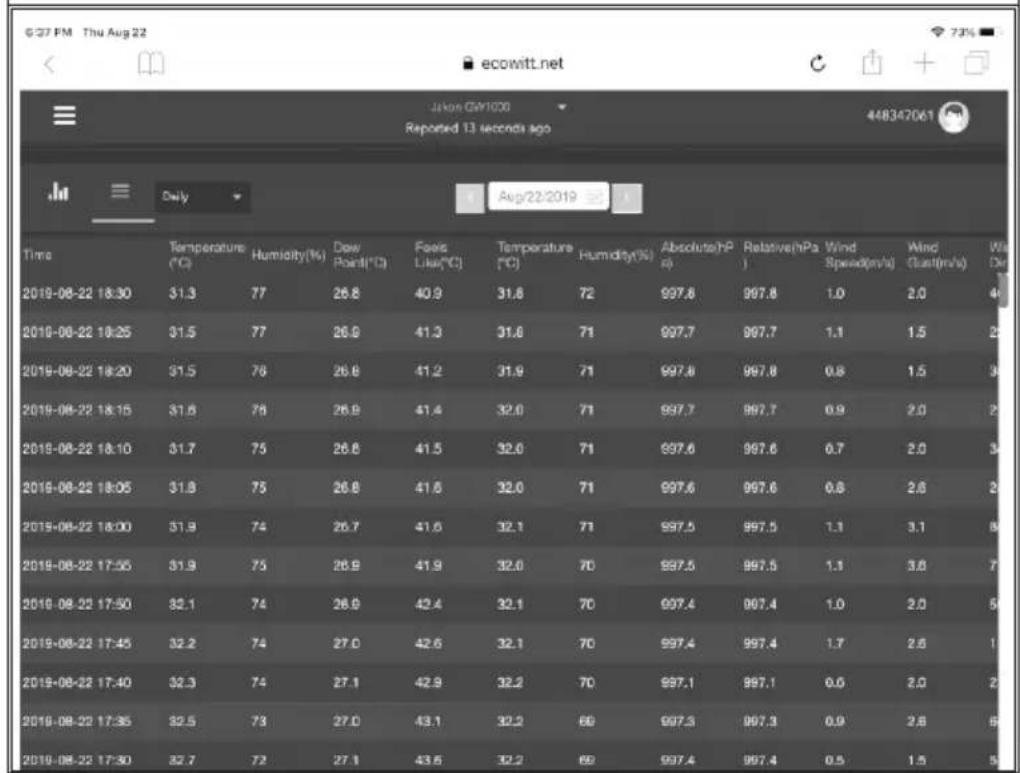
You can view your sensor's data through the ecowitt.net website. Use this URL with your station ID replacing the text STATIONID.
https://www.ecowitt.net/home/index?id=STATIONID
If you want to share your station data with other users, you can use the Share option in the menu to create a link to share.
A page like this will be indicated where you can view the current data and also the historical data.
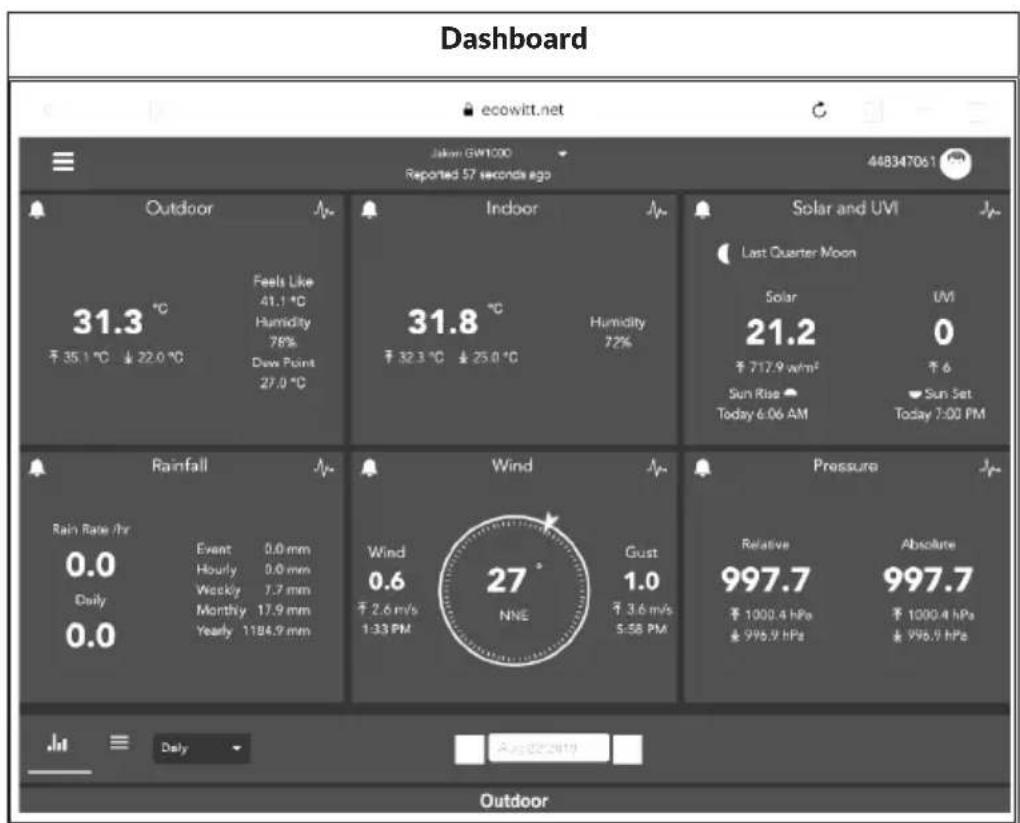
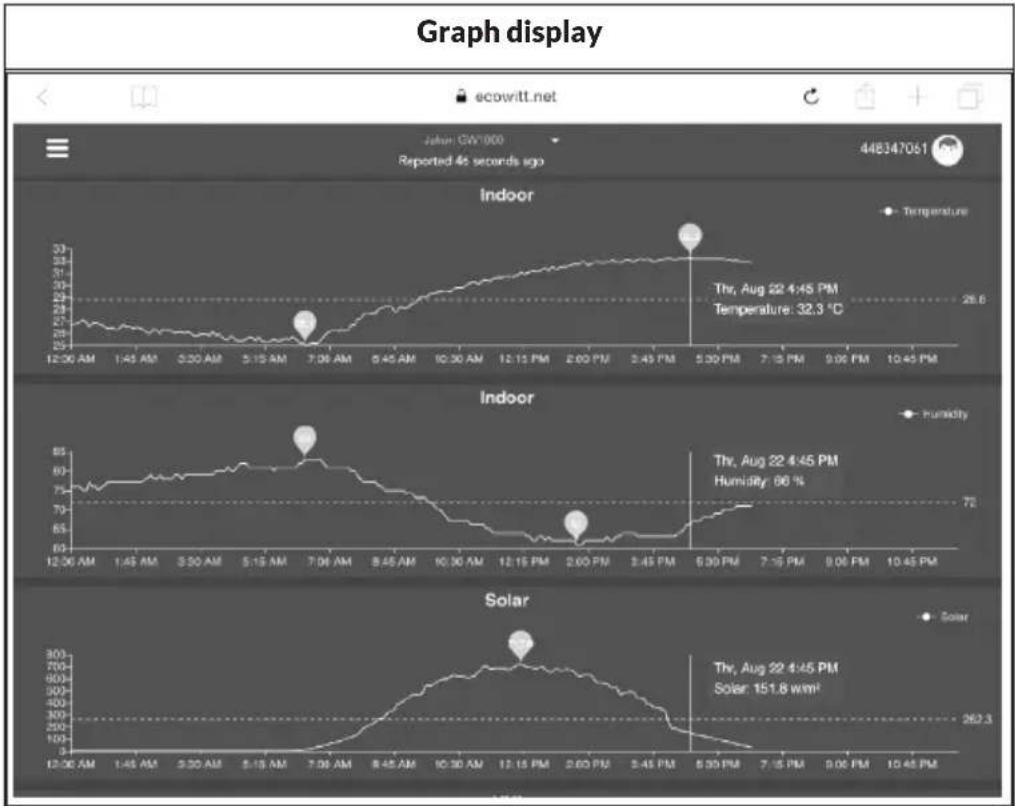
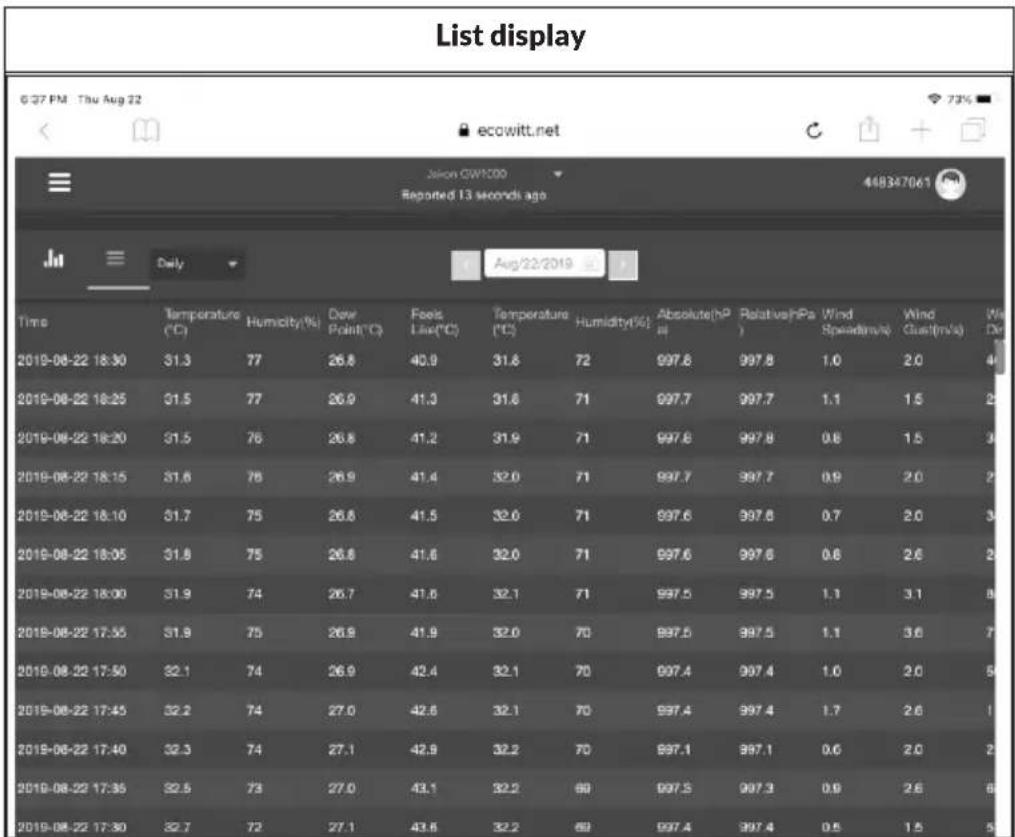
Weather Map
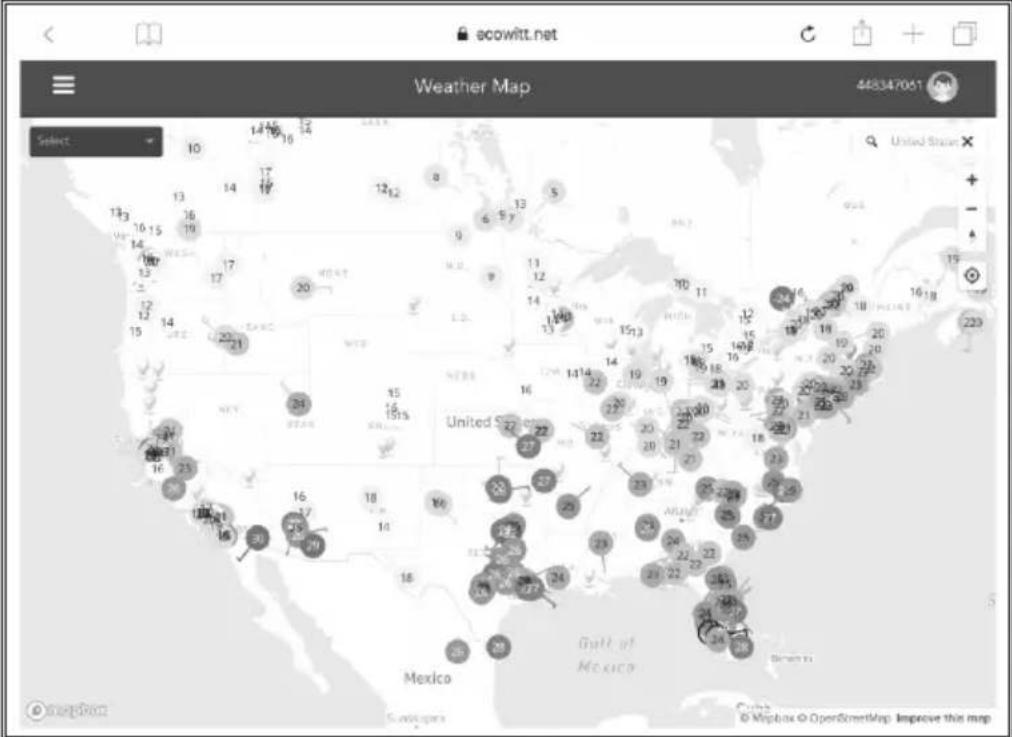
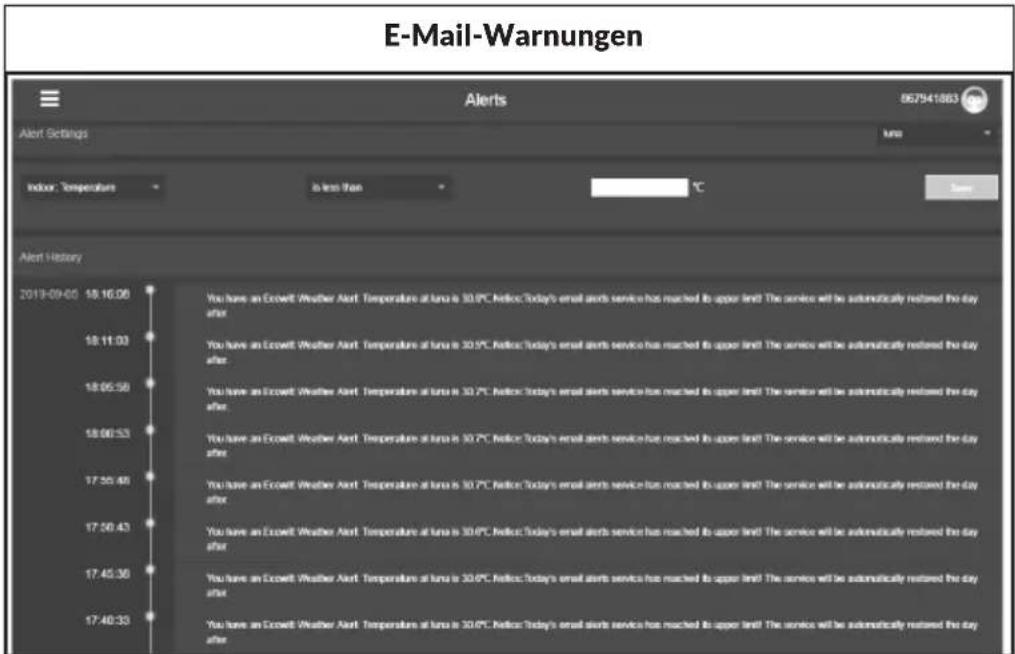
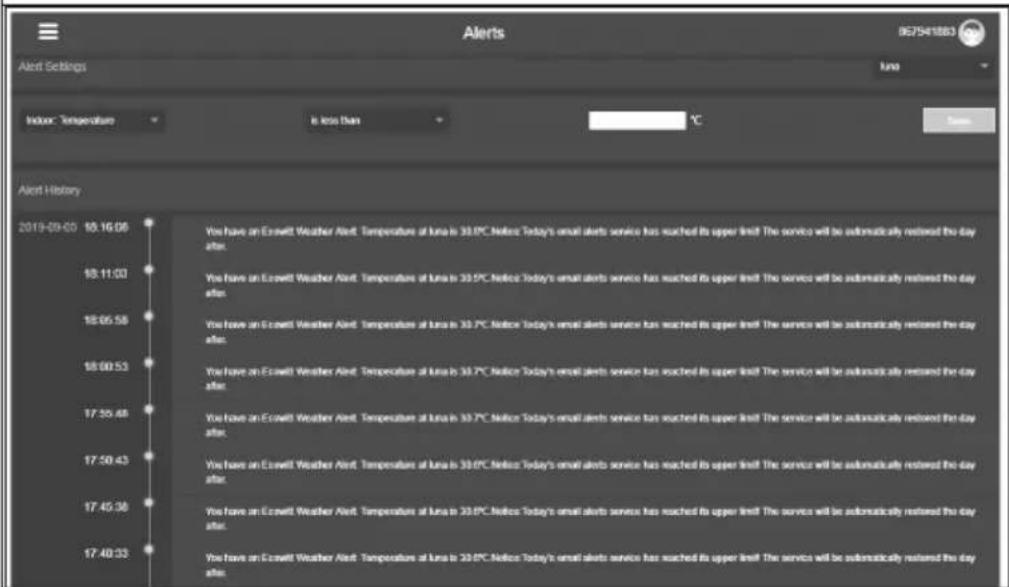
Email Alerts
WEATHER UNDERGROUND
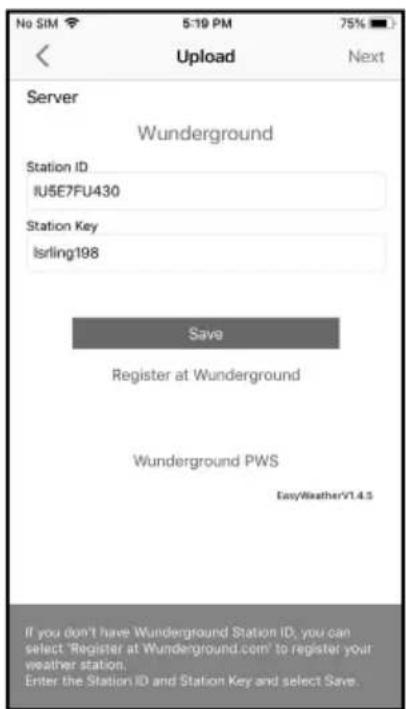
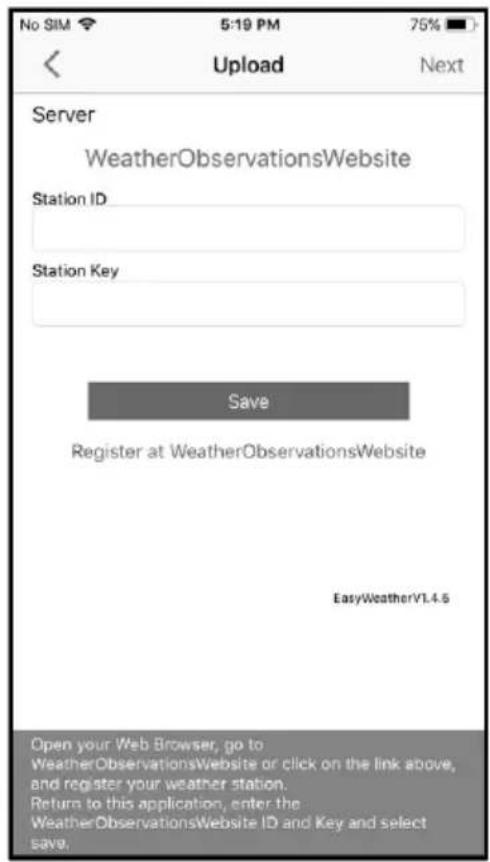
If you want to use wunderground.com, you must have an account and register your new weather station. You can do this on the Wunderground Upload page in the WS View Plus application:
Press Register at Wunderground.com and complete the registration on the page.
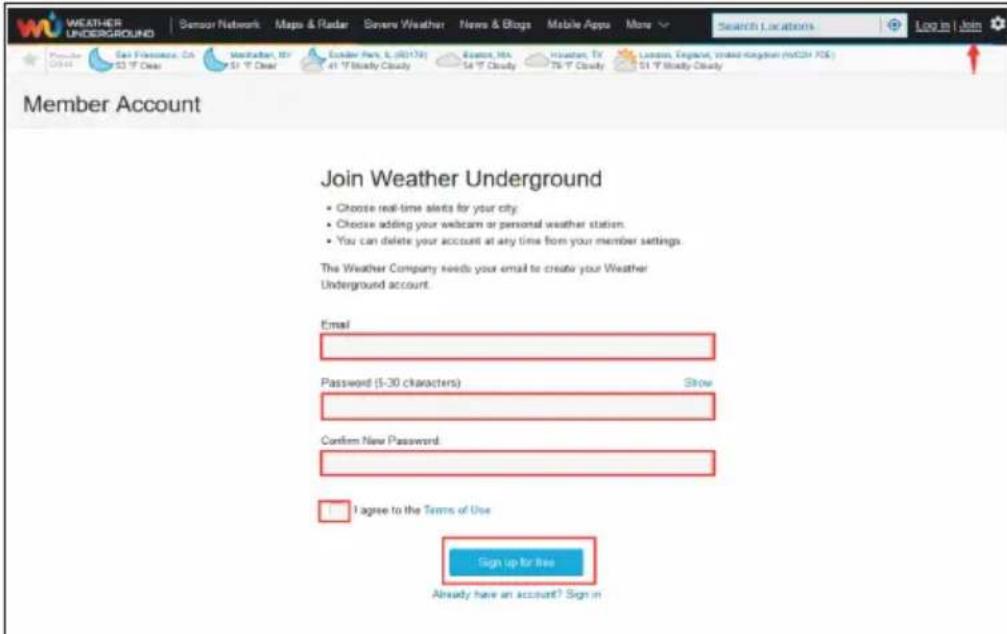
Visit Wunderground.com and click Join, as indicated by the arrow in the upper right corner, and select the Sign up for free option.
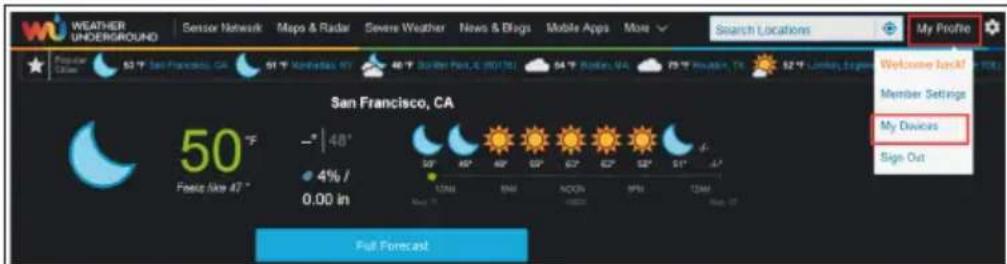
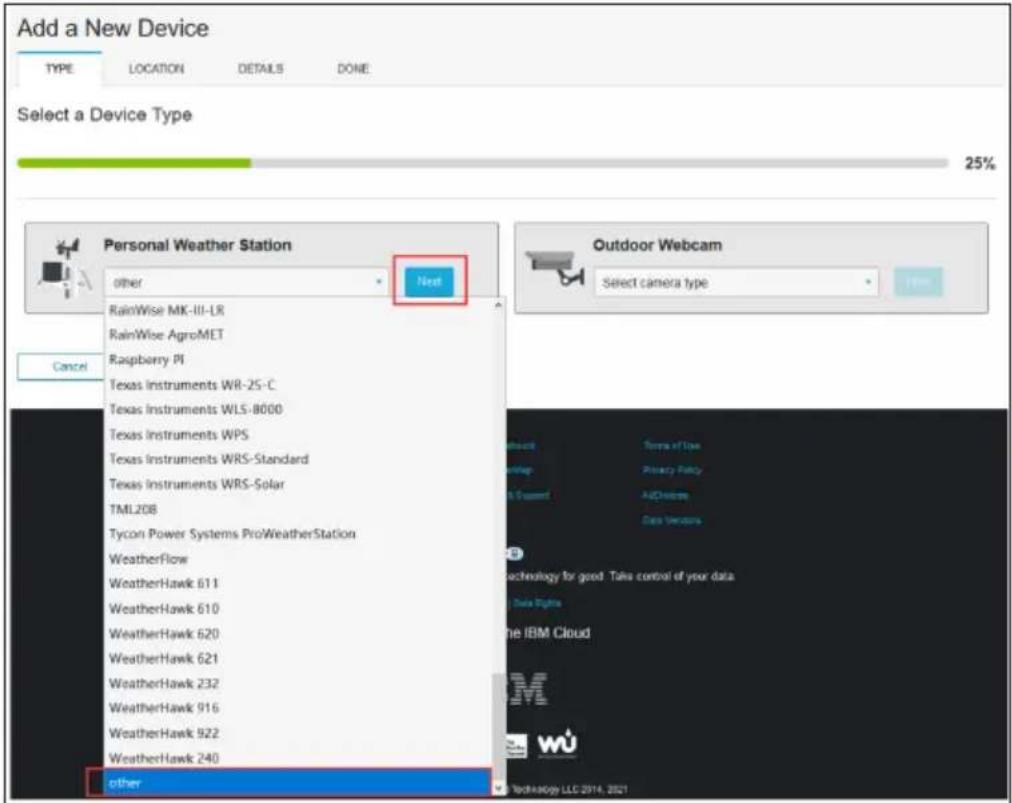
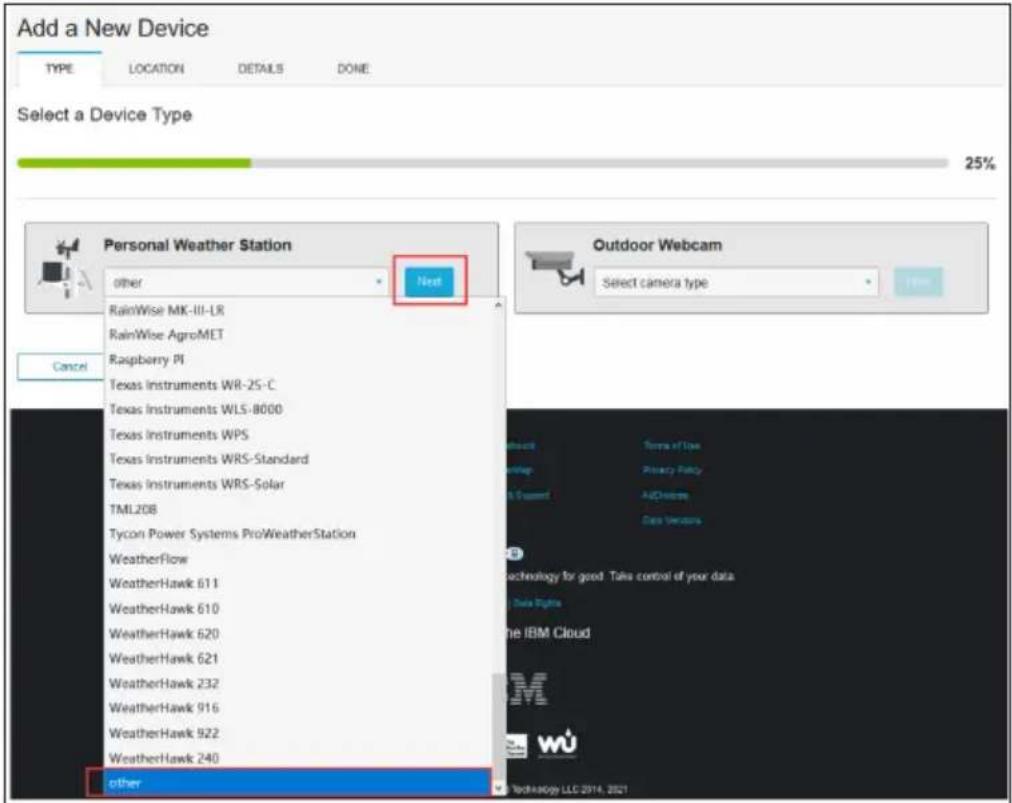
Click My Profile and select My Devices to register your transmitter.
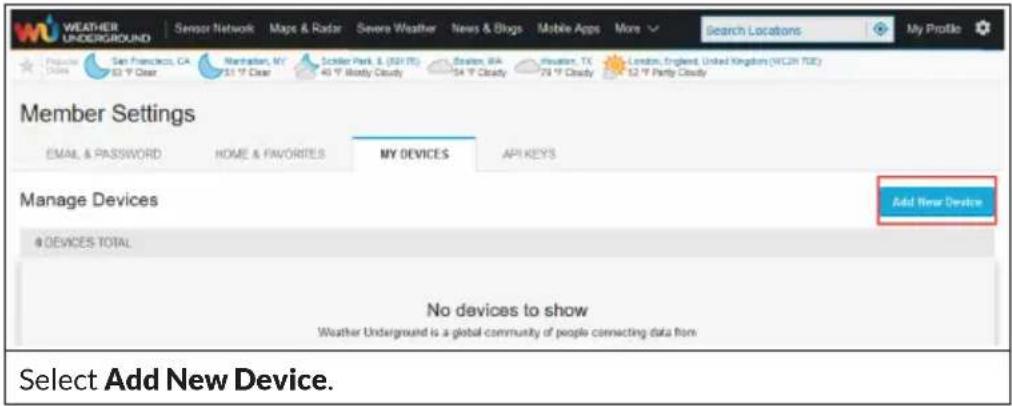
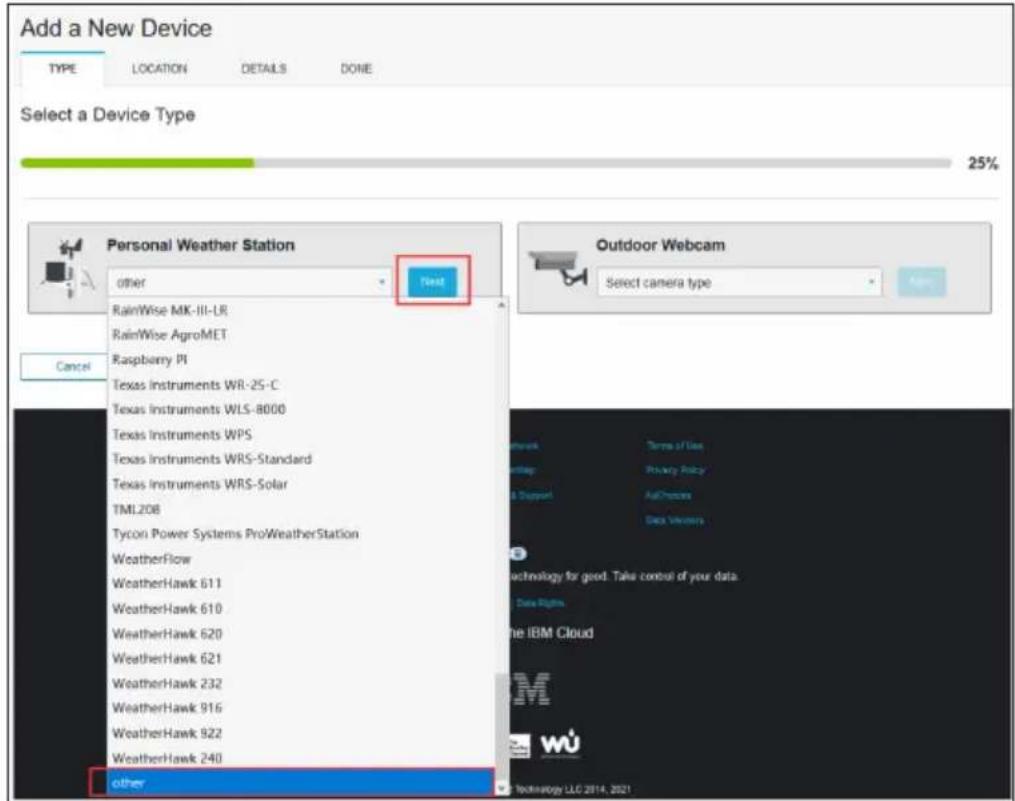
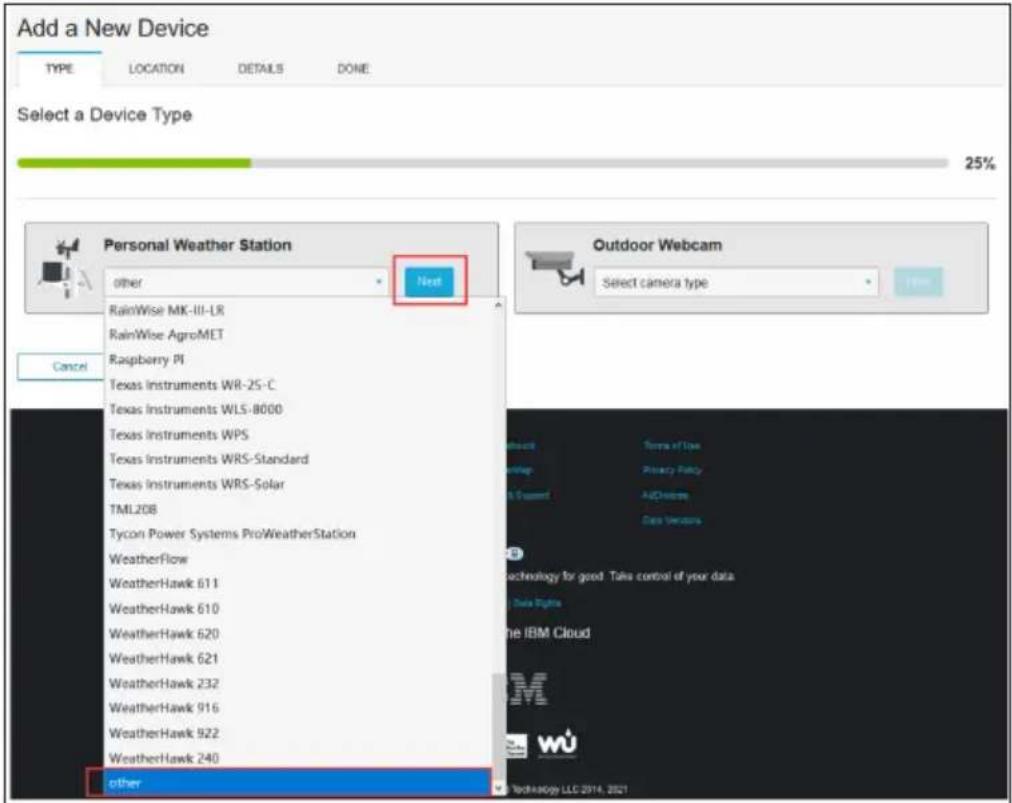
Select your weather station from the list or select other and click Next.
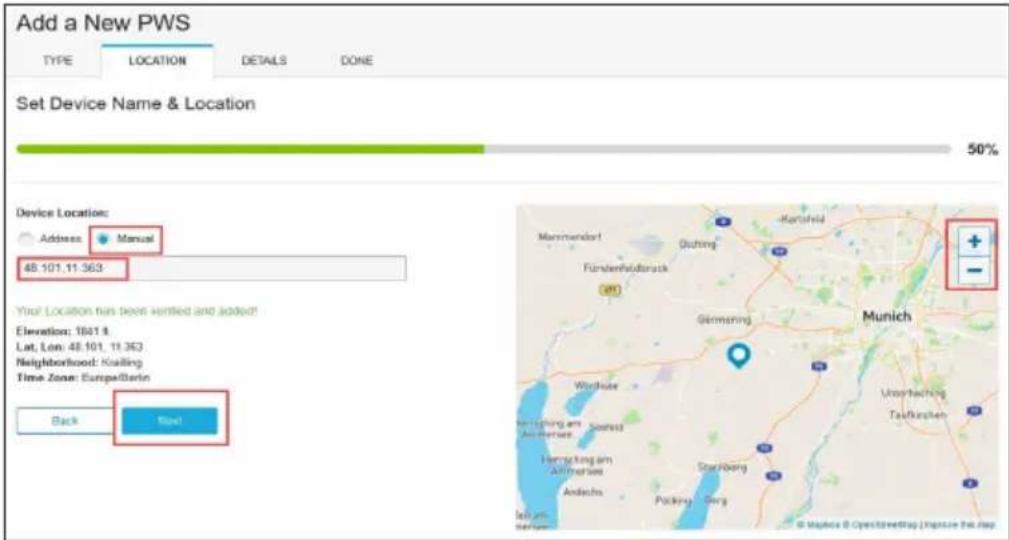
Select the Address or Manual option and find your location. Then press Next.
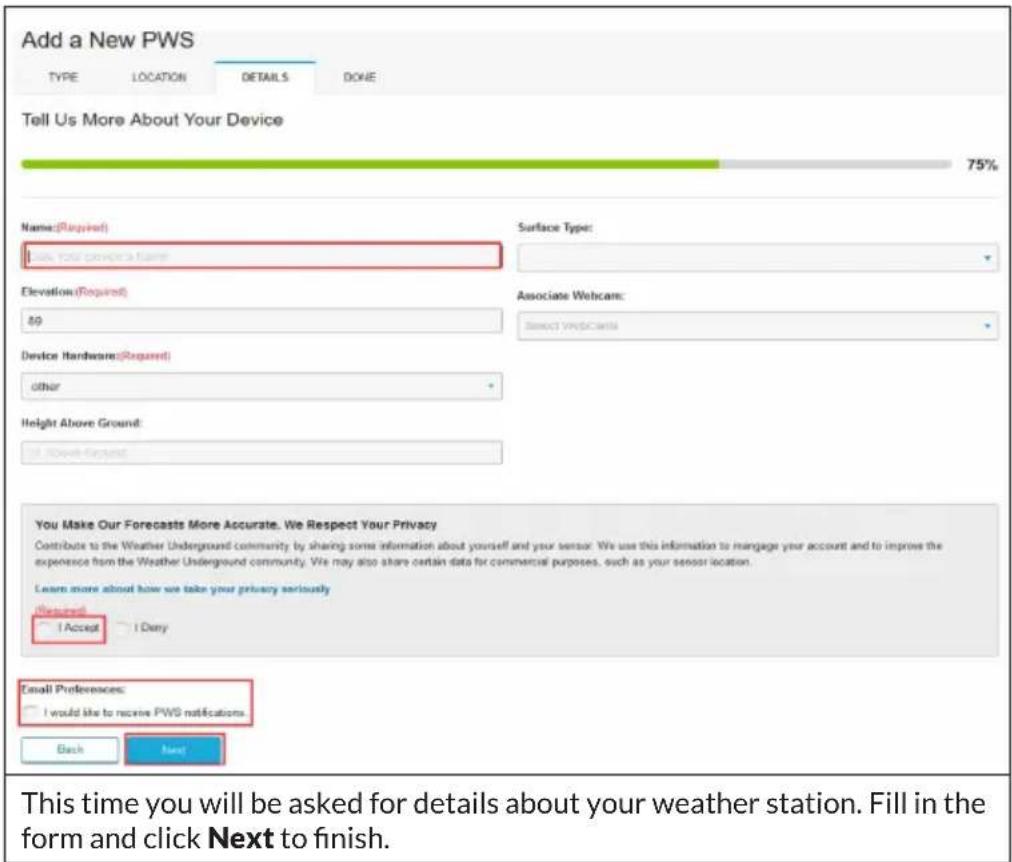
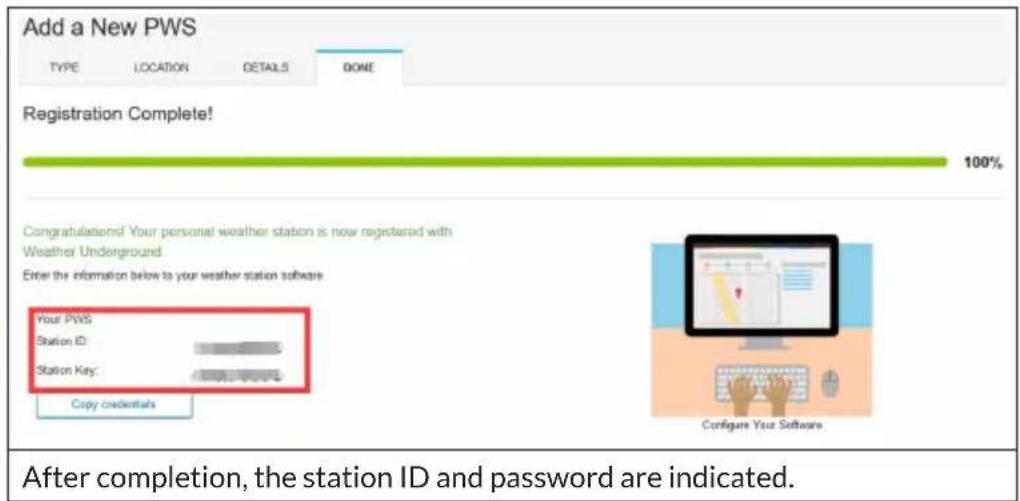
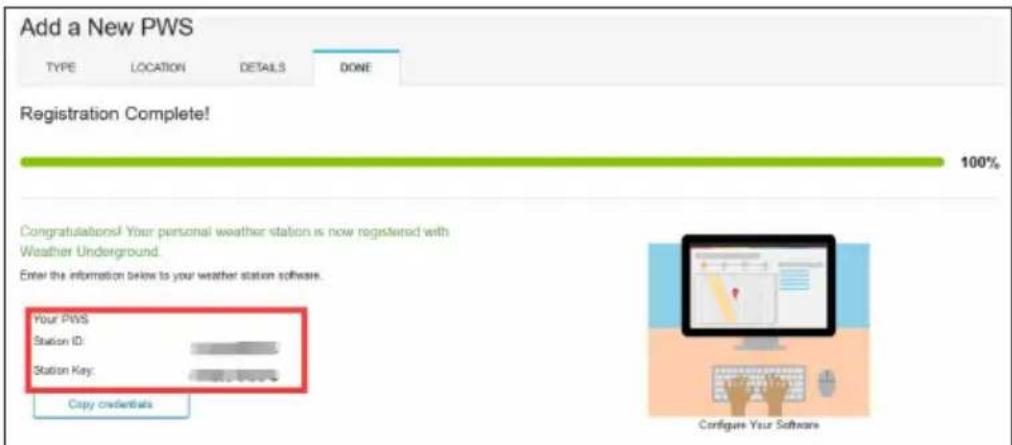
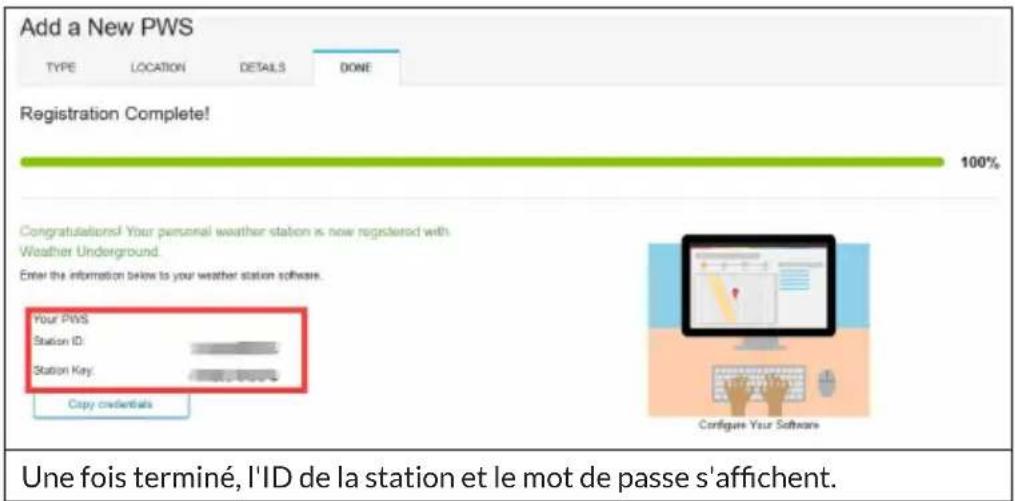
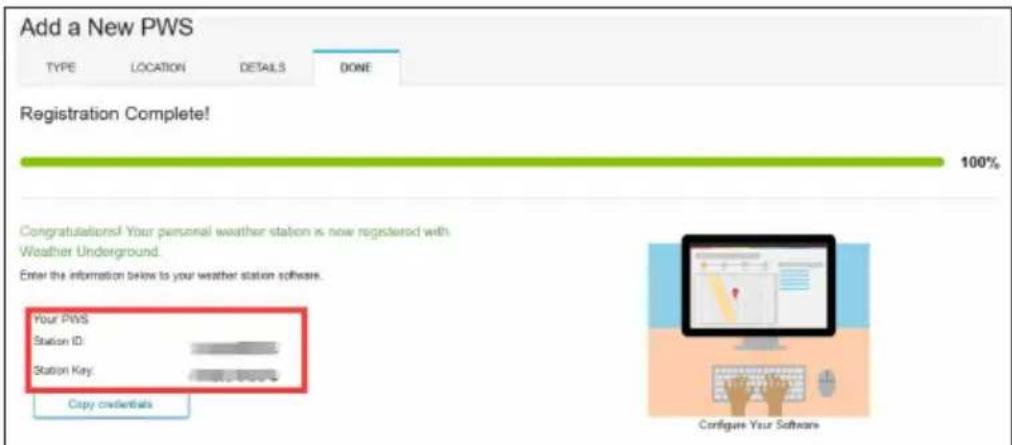
- Make a note of the station ID and password that was generated for you.
- Go back to the app and enter the station ID and password.
- Press Save.
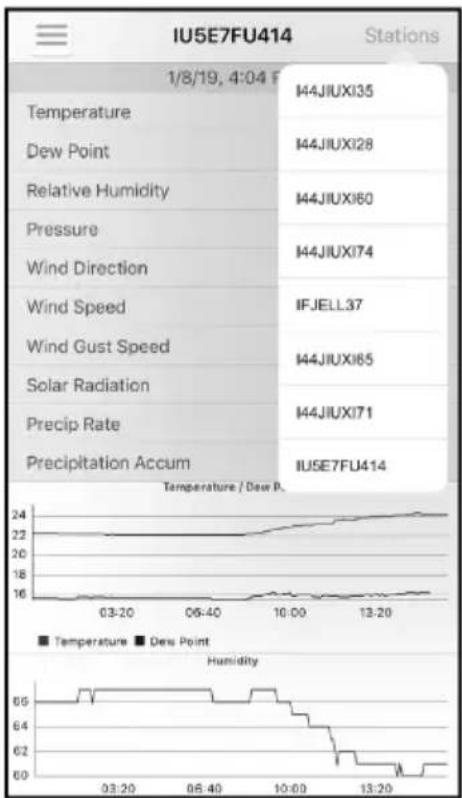
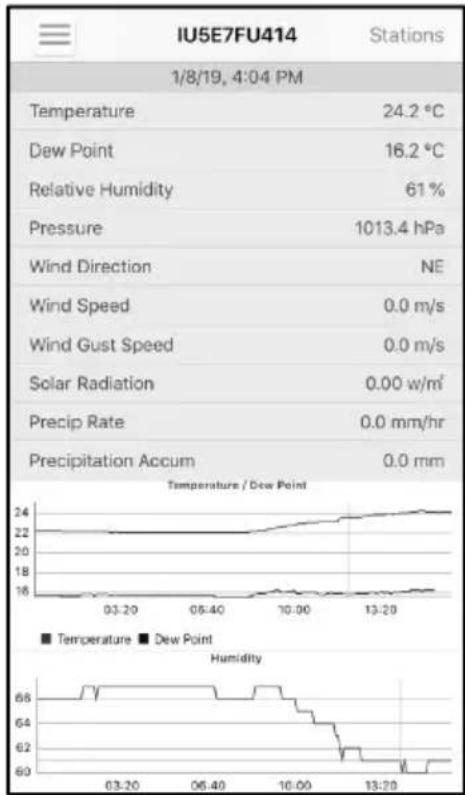
- Go back to the menu page and select WU Dashboard (for the Android version) or select your station under Stations (for the iOS version). You will see the current WU data, including graphs, on the screen within a few hours.
line
IUSE7FU414 Stations | Metric | Value | | :--- | :--- | | Temperature | 24.2 °C | | Dew Point | 16.2 °C | | Relative Humidity | 61 % | | Pressure | 1013.4 hPa | | Wind Direction | NE | | Wind Speed | 0.0 m/s | | Wind Gust Speed | 0.0 m/s | | Solar Radiation | 0.00 w/m² | | Precip Rate | 0.0 mm/hr | | Precipitation Accum | 0.0 mm | Temperature / Dew Point Temperature Dew Point HumidityNote: The WU
Dashboard indicates the data received from the WU server. This assumes that your mobile device is connected to the Internet. Therefore, it is possible to receive data even if you are not on your home Wi-Fi network but are using mobile data on your smartphone instead.
Indication of the data on wunderground.com
You can also view your weather station data on the wunderground.com website. You use a URL like this, with your station ID replacing the text STATIONID.
http://www.wunderground.com/personal-weather-station/dashboard?ID=STATIONID
A page like this is indicated, where you can view the current data and also the historical data.
![(*) Darwin (+9:30 Zone) Test Station IDARWIN13 About this PWS Report Comments Forecast for Darwin, AU > -12.460 130.841 > 66 ft PWS Data PWS Widgets WunderStation My PWS PWS viewed 3 times since July 1, 2018 Satellite Webcam Icon Satellite Darwin Haptor © Mapbox © OpenStreetMap | Improve this map View WunderMap Current Conditions Station reported 0 second ago 78.4 °F Feels Like 78.4 °F Dew Point: 66.2 °F UV: 0.0 Humidity: 66% Solar: 0 w/m² Precip Rate: 0.00 in/hr Soil Moisture: -- Precip Accum: 0.00 in Soil Temp: -- Pressure: 29.80 in Leaf Wetness: -- 7:08 AM 6:33 PM Waning Gibbous | 50% Illuminated Weather History for Darwin, [IDARWIN13] Previous Daily Mode July 6 2018 View Next > Summary July 6, 2018 High Low Average High Low Average Temperature 82.4 °F 77.4 °F 79.9 °F Wind Speed 13 mph -- 12 mph Dew Point 73.8 °F 64.6 °F 70.1 °F Wind Gust 14 mph -- Humidity 79% 63% 70% Wind Direction -- -- West Precipitation 0 in -- -- Pressure 29.67 in 29.59 in --](/content/2026/04/674504/images/c8f6813c073bddee30afea46f64748771aa0157557f275a6b820e96e1eedfcba.jpg)
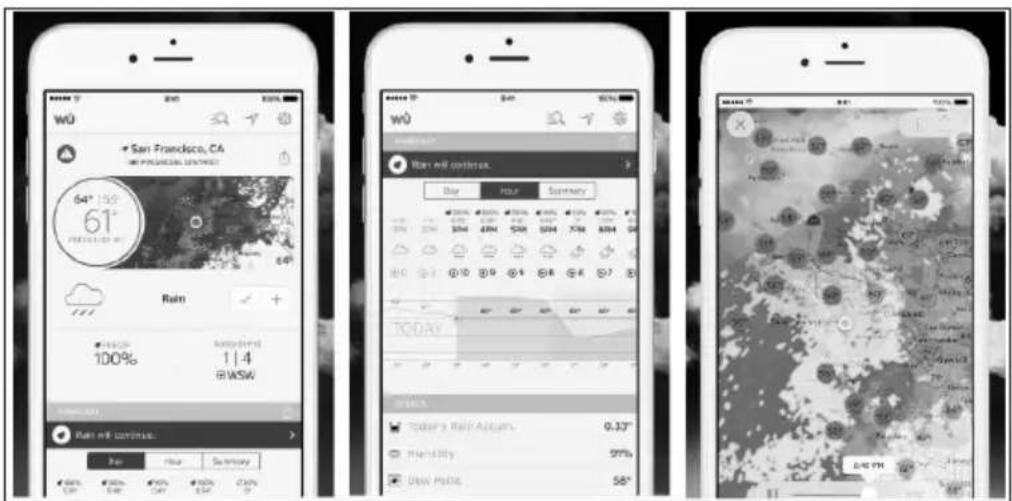
There are also some very useful apps. The URLs given here lead to the web versions of the application pages. But you can also find them directly in the iOS App Store or Google Play stores.
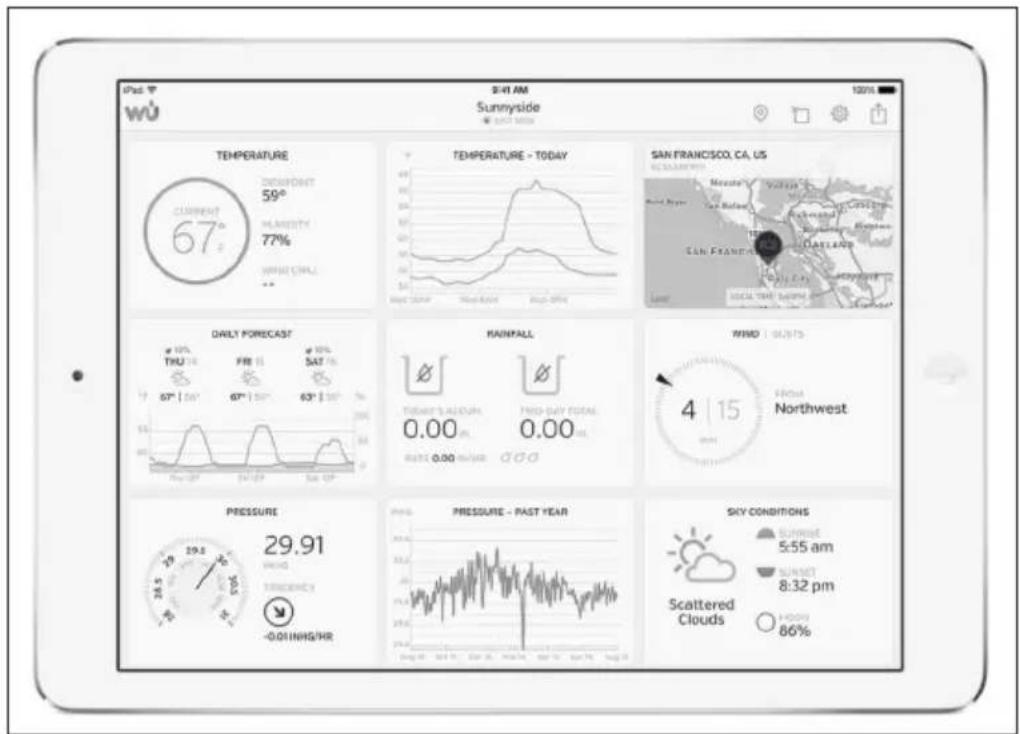
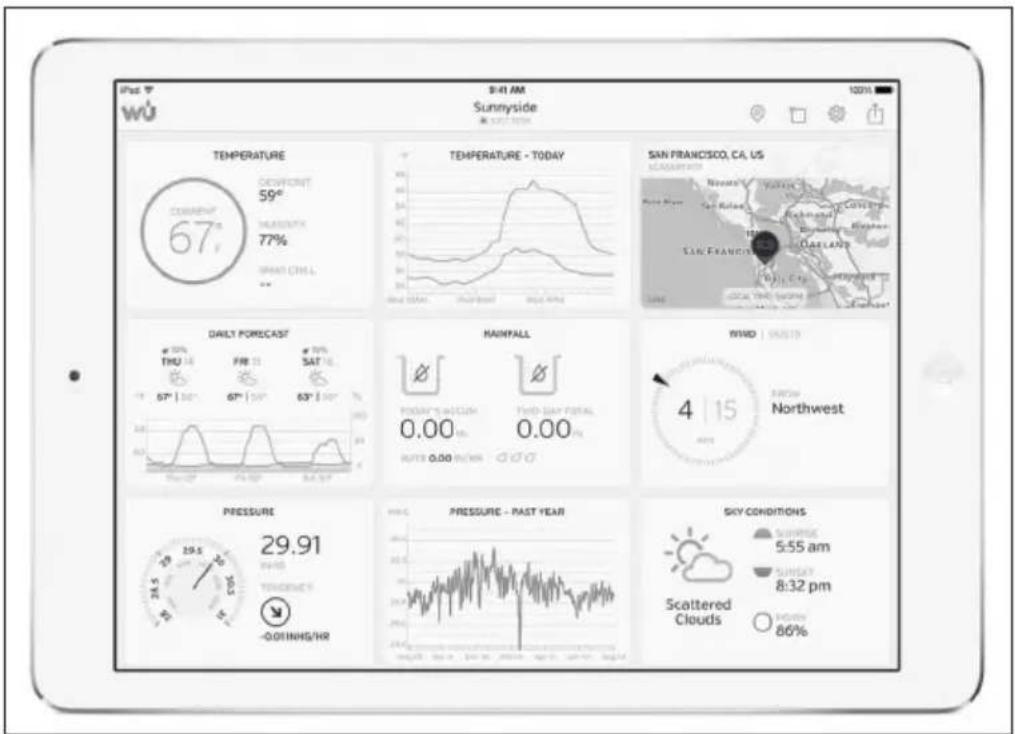
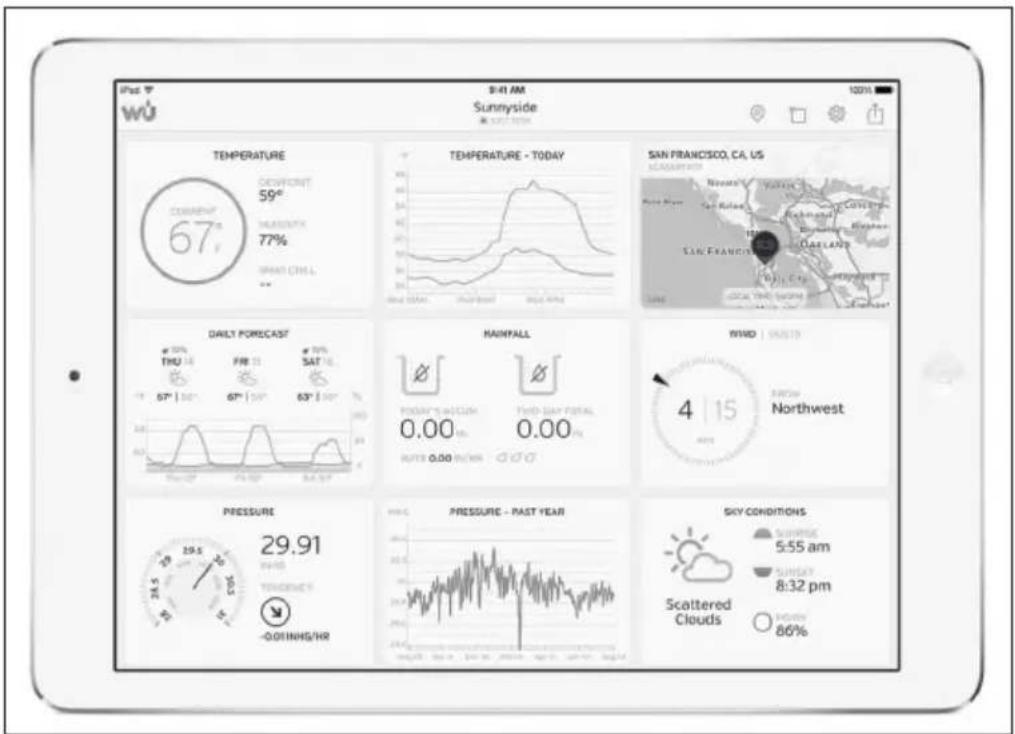
WunderStation: iPad application for indication of your station's data and graphics:
https://itunes.apple.com/us/app/wunderstation-weather-from-your-neighborhood/id906099986
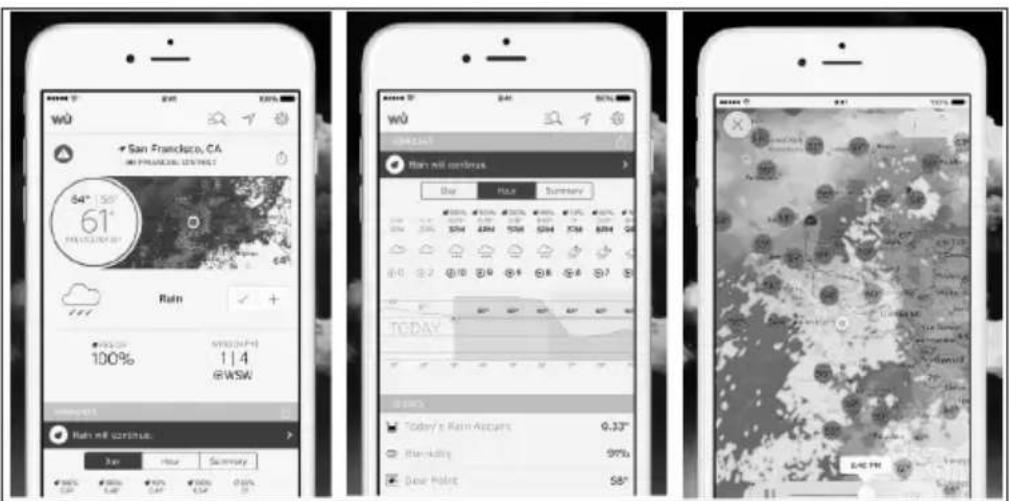
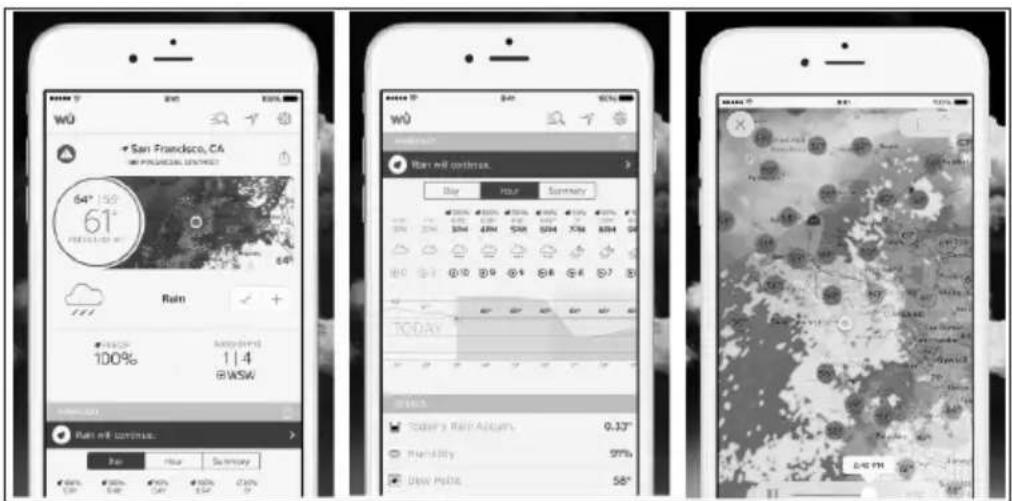
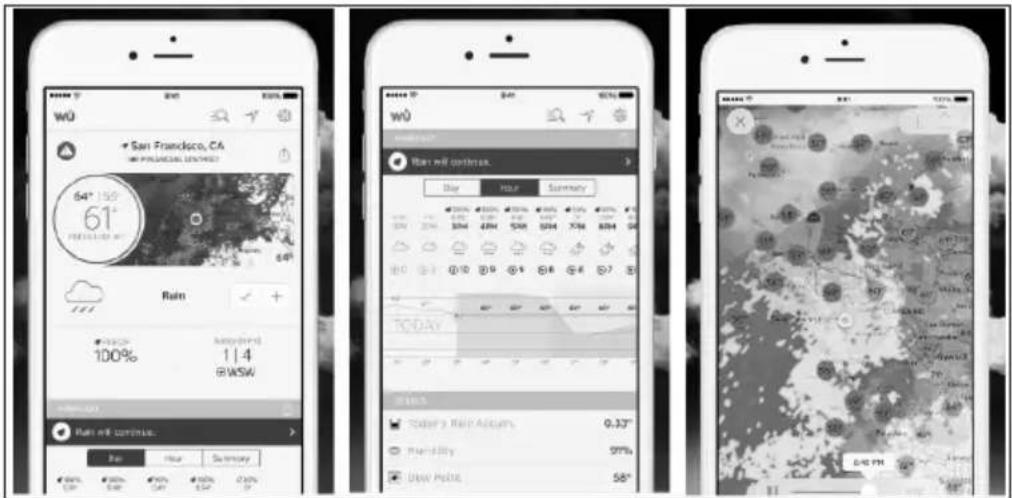
Weather Underground Forecast: iOS and Android application for weather forecasts:
https://itunes.apple.com/us/app/weather-underground-forecast/id486154808
https://play.google.com/store/apps/details?id=com.wunderground.android.weather&hl=en
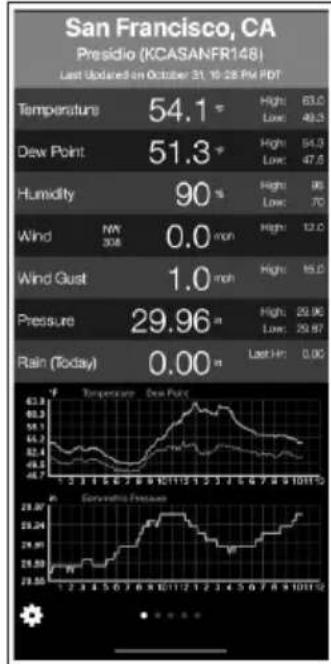
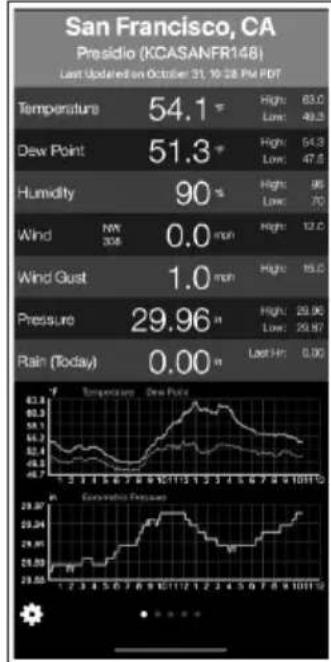
PWS Weather Station Monitor: Indicate weather conditions in your neighborhood or even in your own backyard. Connects to wunderground.com:
https://itunes.apple.com/us/app/pws-weather-station-monitor/id713705929
line
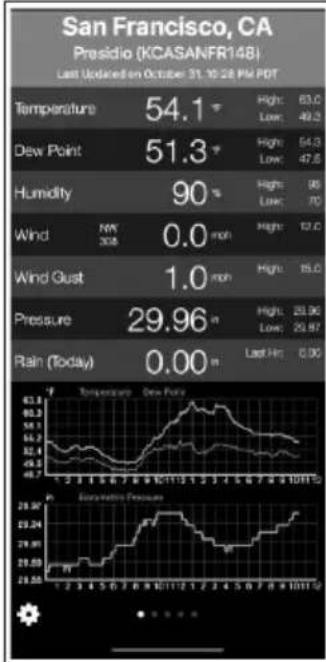
San Francisco, CA Presidio (KCASANFR148) Last Updated on October 31, 16:28 PM PDT | Metric | Value | | :--- | :--- | | Temperature | 54.1 °C | | High | 83.0 | | Low | 49.2 | | Dew Point | 51.3 °C | | High | 54.3 | | Low | 47.6 | | Humidity | 90 % | | High | 95 | | Low | 70 | | Wind | 0.0 moh | | High | 12.0 °C | | Wind Glust | 1.0 moh | | High | 15.0 °C | | Pressure | 29.96 m/s | | High | 29.96 | | Low | 29.87 | | Rain (Today) | 0.00 m/s | | Last Hg | 0.00 | Temperature - Dew Point Temperature - Dew Point Sewpoint - Sow Point Sewpoint - Sow Point Sewpoint - Sow Point Sewpoint - Sow Point Sewpoint - Sow Point Sewpoint - Sow Point Sewpoint - Sow Point Sewpoint - Sow Point Sewpoint - Sow Point Sewpoint - Sow Point Sewpoint - Sow Point Sewpoint - Sow Point Sewpoint - Sow Point Sowpoint - Sow Point Sowpoint - Sow Point Sowpoint - Sow Point Sowpoint - Sow Point Sowpoint - Sow Point Sowpoint - Sow Point Sowpoint - Sow Point Sowpoint - Sow Point Sowpoint - Sow Point Sowpoint - Sow Point Sowpoint - Sow Point Sowpoint - Sow Point Sowpoint - Sower Point Sowpoint - Sower Point Sowpoint - Sower Point Sowpoint - Sower Point Sowpoint - Sower Point Sowpoint - Sower Point Sowpoint - Sower Point Sowpoint - Sower Point Sowpoint - Sower Point Sowpoint - Sower Point Sowpoint - Sower Point Sowpoint - Sower Point Sowpoint - Sower Point Sawpoint - Tm Sawpoint - Tm Sawpoint - Tm Sawpoint - Tm Sawpoint - Tm Sawpoint - Tm Sawpoint - Tm Sawpoint - Tm Sawpoint - Tm Sawpoint - Tm Sawpoint - Tm Sawpoint - Tm Sawpoint - Tm Sawpoint - Tm Sawpoint - Tm Tm Tm Tm Tm Tm Tm Tm Tm Tm Tm Tm Tm Tm Tm Tm Tm Tm Tm Tm Tm Tm Tm Tm Tm Tm Tm Tm Tm Tm Tm Tm Tm Tm Tt Tt Tt Tt Tt Tt Tt Tt Tt Tt Tt Tt Tt Tt Tt Tt Tt Tt Tt Tt Tt Tt Tt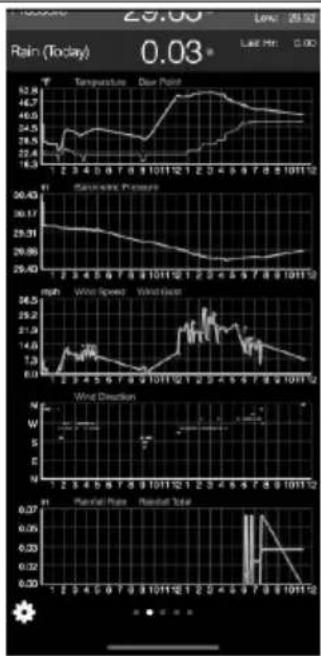
line
| Date | Temperature | Snow Speed | Wind Direction | Rainfall Rate | | ---------- | ----------- | ---------- | -------------- | ------------- | | 1/2 | 24.5 | 30.17 | 0.0 | 0.0 | | 2/4 | 26.0 | 29.31 | 0.0 | 0.0 | | 3/6 | 25.5 | 28.75 | 0.0 | 0.0 | | 4/8 | 24.0 | 28.00 | 0.0 | 0.0 | | 5/10 | 23.5 | 27.50 | 0.0 | 0.0 | | 6/12 | 24.5 | 27.00 | 0.0 | 0.0 | | 7/14 | 25.0 | 26.50 | 0.0 | 0.0 | | 8/16 | 26.5 | 26.00 | 0.0 | 0.0 | | 9/18 | 27.0 | 25.50 | 0.0 | 0.0 | | 10/20 | 28.0 | 25.00 | 0.0 | 0.0 | | 11/22 | 29.0 | 24.50 | 0.0 | 0.0 | | 12/24 | 30.0 | 24.00 | 0.0 | 0.0 | | 1/2 | 31.0 | 23.50 | 0.0 | 0.0 | | 2/4 | 32.0 | 23.00 | 0.0 | 0.0 | | 3/6 | 33.0 | 22.50 | 0.0 | 0.0 | | 4/8 | 34.0 | 22.00 | 0.0 | 0.0 | | 5/10 | 35.0 | 21.50 | 0.0 | 0.0 | | 6/12 | 36.0 | 21.00 | 0.0 | 0.0 | | 7/14 | 37.0 | 20.50 | 0.0 | 0.0 | | 8/16 | 38.0 | 20.00 | 0.0 | 0.0 | | 9/18 | 39.0 | 19.50 | 0.0 | 0.0 | | 10/20 | 40.0 | 19.00 | 0.0 | 0.0 | | 11/22 | 41.0 | 18.50 | 0.0 | 0.0 | | 12/24 | 42.0 | 18.00 | 0.0 | 0.0 | | 1/2 | 43.0 | 17.50 | 0.0 | 0.0 | | 2/4 | 44.5 | 17.00 | 0.0 | 0.0 | | 3/6 | 46.5 | 16.50 | 0.0 | 0.0 | | 4/8 | 48.5 | 16.00 | 0.0 | 0.0 | | 5/10 | 51.5 | 15.50 | 0.0 | 0.0 | | 6/12 | 54.5 | 15.00 | 0.0 | 0.0 | | 7/14 | 57.5 | 14.50 | 0.0 | 0.0 | | 8/16 | 61.5 | 14.00 | 0.0 | 0.0 | | 9/18 | 65.5 | 13.50 | 0.0 | 0.0 | | 1/2 | - | - | - | - | | ... | ... | ... | ... | ... | | ... | ... | ... | ... | ... | | ... | ... | ... | ... | ... | | ... | ... | ... | ... | ... | | ... | ... | ... | ... | ... | | ... | ... | ... | ... | ... | | ... | ... | ... | ... | ... | | ... (Note: The 'Rainfall Rate' data is not explicitly provided in the code.) | ... | ... | ... | ... | | Note: The actual values for Rainfall Rate are not explicitly provided in the code and may vary due to the use of random data generation or sampling strategy specified in the code (e.g., 'Rainfall Rate' and 'Rainfall Total'). * Values for Rainfall Rate are estimated based on the provided code and are not explicitly provided in the code here.) * Values for Rainfall Total are estimated based on the provided code and are not explicitly provided in the code here.) * Values for Rainfall Total are estimated based on the provided code and are not explicitly provided in the code here.) * Values for Rainfall Total are estimated based on the provided code and are not explicitly provided in the code here.) * Values for Rainfall Total are estimated based on the provided code and are not explicitly provided in the code here.) * Values for Rainfall Total are estimated based upon the given constraints and the exact values of the rainfall rate and rainfall total are calculated using the formula `np.exp(-x) * np.sin(x)`. * Values for Rainfall Total are estimated based on the provided code and are not explicitly provided in the code here.) * Values for Rainfall Total are estimated based on the provided code and are not explicitly provided in the code here.) * Values for Rainfall Total are estimated based on the provided code and are not explicitly provided in the code here.) * Values for Rainfall Total are estimated based on the provided code and are not explicitly provided in the code here.) * Values for Rainbow Rate and Rainbow Total are estimated based on the provided code and are not explicitly provided in the code here.) * Values for Rainbow Rate and Rainbow Total are estimated based on the provided code and are not explicitly provided in the code here.) * Values for Rainbow Rate and Rainbow Total are estimated based on the provided code and are not explicitly provided in the code here.) * Values for Rainbow Rate and Rainbow Total are estimated based on the provided code and are not explicitly provided in the code here.) * Values per Rainfall Rate and Rainbow Rate are estimated based on the provided code and are not explicitly provided in the code here.) * Values per Rainbow Rate and Rainbow Total are estimated based on the provided code and are not explicitly provided in the code here.) * Values per Rainbow Rate and Rainbow Total are estimated based on the provided code and are not explicitly provided in the code here.) * Values per Rainbow Rate and Rainbow Total are estimated based on the provided code and are not explicitly provided in the code here.) * Values per Rainbow Rate and Rainbow Total are estimated based on the provided code and are not explicitly provided in the code here.) * Values per Random Rate and Rainbow Rate are estimated based on the provided code and are not explicitly provided in the code here.) * Values per Rainbow Rate and Rainbow Total are estimated based on the provided code and are not explicitly provided in the code here.) * Values per Rainbow Rate and Rainbow Total are estimated based on the provided code and are not explicitly provided in the code here.) * Values per Rainbow Rate and Rainbow Total are estimated based on the provided code and are not explicitly provided in the code here.) * Values per Rainbow Rate and Rainbow Total are estimated based on the provided code and are not explicitly provided in the code here.) * Values per Rainbow Rate and Rainbow Total are estimated based on the provided code and are not explicitly provided in the code here.) * Values per Rainbow Rate and Rainbow Total are estimated based on the provided code and are not explicitly provided in the code here.) * Values per Rainbow Rate and Rainbow Total are estimated based on the provided code and are not explicitly provided in The Code of Rainfall (in Figure I) * Values per Rainbow Rate and Rainbow Total are estimated based on the provided code and are not explicitly provided in The Code of Rainfall (in Figure I) * Values per Rainbow Rate and Rainbow Total are estimated based on the provided code and are not explicitly provided in The Code of Rainfall (in Figure I) * Values per Rainbow Rate and Rainbow Total are estimated based on the provided code and are not explicitly provided in The Code of Rainfall (in Figure I) * Values Per Rainbow Rate and Rainbow Total are estimated based on the provided code and are not explicitly provided in The Code of Rainfall (in Figure I) * Values Per Rainbow Rate and Rainbow Total are estimated based on the provided code and are not explicitly provided in The Code of Rainfall (in Figure I) * Values Per Rainbow Rate and Rainbow Total are estimated based on the provided code and are not explicitly provided in The Code of Rainfall (in Figure I) * Values Per Rainbow Rate and Rainfall Total are estimated based on the provided code and are not explicitly provided in The Code of Rainfall (in Figure I) * Values Per Rainbow Rate and Rainbow Total are estimated based on the provided code and are not explicitly provided in The Code of Rainfall (in Figure I) * Values Per Rainbow Rate and Rainbow Total are estimated based on the provided code and are not explicitly provided in The Code of Rainfall (in Figure I) * Values Per Rainbow Rate and Rainbow Total are estimated by Statistic Data: **Values for Rainfall Rate and Rainbow Total** *Values for Rainfall Total are estimated based on the provided code and are not explicitly provided in the code here.) *Values for Rainfall Total are estimated based on the provided code and are not explicitly provided in the code here.) *Values for Rainfall Total are estimated based on the provided code and are not explicitly provided in the code here.) *Values for Rainfall Total are estimated based on the provided code and are not explicitly provided in the code here.) *Values for Rainfall Total are estimated based on the provided code and are not explicitly provided in The Code of Rainfall (in Figure I) *Values for Rainfall Total are estimated based on the provided code and are not explicitly provided in the code here.) *Values for Rainfall Total are estimated based on the provided code and are not explicitly provided in The Code of Rainfall (in Figure I) *Values for Rainfall Total are estimated based on the provided code and are not explicitly provided in The Code of Rainfall (in Figure I) *Values for Rainfall Total are estimated based on the provided code and are not explicitly provided in The Code of Rainfall (in Figure I) *Values for Rainfall Total are estimated based on the provided code and are not explicitly provided in The Code of Rainfall (in Figure I) *Values for Rainfall Total are estimated based upon the original data source only*Values for Rainfall Total are estimated based on the original data source only*Values for Rainfall Total are estimated based on the original data source only*Values for Rainfall Total are estimated based on the original data source only*Values for Rainfall Total are estimated based on the original data source only*Values for Rainfall Total are estimated based on the original data source only*Values for Rainfall Total are estimated based on the original data source only*Values for Rainfall Total are estimated based on the original data source only*Values for Rainall Total are estimated based on the original data source only*Values for Rainall Total are estimated based on the original data source only*Values for Rainall Total are estimated based on the original data source only*Values for Rainall Total are estimated based on the original data source only*Values for Rainall Total are estimated based on the original data source only*Values for Rainall Total are estimated based on the original data source only*Values for Rainall Total are estimated based on the original data source every day from November to December, as well as every day from December to January, as well as every day from December to January, as well as every day from December to January, as well as every day from December to January, as well as every day from December to January, as well as every day from December to January, as well as every day from December to January, as well as every day from December to January, as well as every day from December to January, as well as every day from December to January, as well as every day from December to December, as well as every day from December to January, as well as every day from December to January, as well as every day from December to January, as well as every day from December to January, as well as every day from December to January, as well as every day from December to January, as well as every day from December to January, as well as every day from December to January, as well as every day from December to January, as well as every day from Dec to Dec, as well as every day from Dec to Dec, as well as every day from Dec to Dec, as well as every day from Dec to Dec, as well as every day from Dec to Dec, as well as every day from Dec to Dec, as well as every day from Dec to Dec, as well as every day from Dec to Dec, as well as every day from Dec to Dec, as well as every day from Dec to Dec, as well as every day from Dec to Jan, Dec to Dec, as well as any other value is determined by these values at year-end.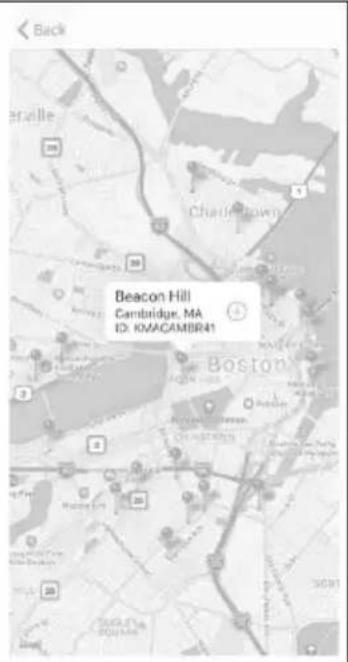
MANAGE DEVICES AND SETTINGS
| Device List | |
| EasyWeather-WIFID05E | |
| IP: 10.0.1.27 | > |
| MAC: A0:20:A8:35:D0:5E | |
| WH2650A-WIFIBA3B | |
| IP: 10.0.1.6 | > |
| MAC: 5C:CF:7F:23:BA:3B | |
| WH2650A-WIFIBB00 | |
| IP: 10.0.1.4 | > |
| MAC: 5C:CF:7F:23:BB:00 | |
| GW1000-WIFI885C | |
| IP: 10.0.1.18 | > |
| MAC: 84:F3:EB:21:88:5C | |
| GW1000A-WIFI2612 | |
| IP: 10.0.1.7 | > |
| MAC: 84:F3:EB:25:26:12 | |
| EasyWeather-WIFID235 | |
| IP: 10.0.1.5 | > |
| MAC: EC:FA:BC:15:D2:35 | |
| GW1000-WIFI8C73 | |
When you are on the WU Dashboard screen, you can press the Menu button (top right) and select Device List to view all your devices.
You can press on your device to view or change its settings.
Note: This feature requires that your smartphone and console are on the same network.
Manage Wunderground
| WU Stations | Add |
| I44JIUXI35 | Delete |
| I44JIUXI28 | Delete |
| I44JIUXI60 | Delete |
| I44JIUXI74 | Delete |
| IFJELL37 | Delete |
| I44JIUXI65 | Delete |
| I44JIUXI71 | Delete |
| IU5E7FU414 | Delete |
| KCAMOUNT191 | Delete |
| I44JIUXI36 | Delete |
| IU5E7FU429 | Delete |
You can add or delete the WU Station IDs by selecting Manage Wunderground from the submenu.
Settings
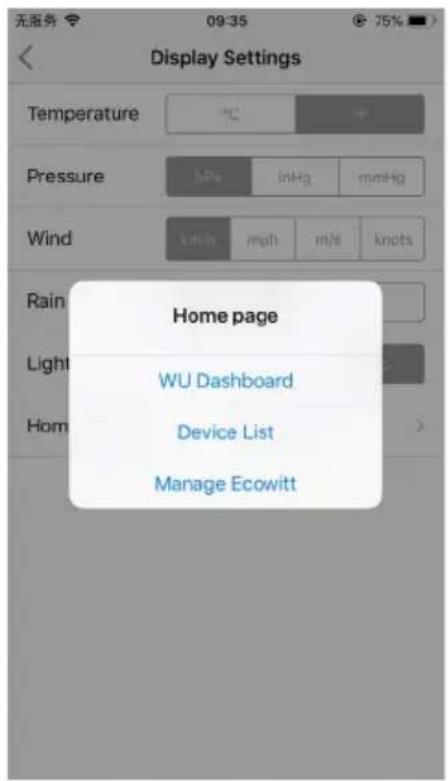
You can set the desired display units or default home page for the app by selecting Settings in the submenu.
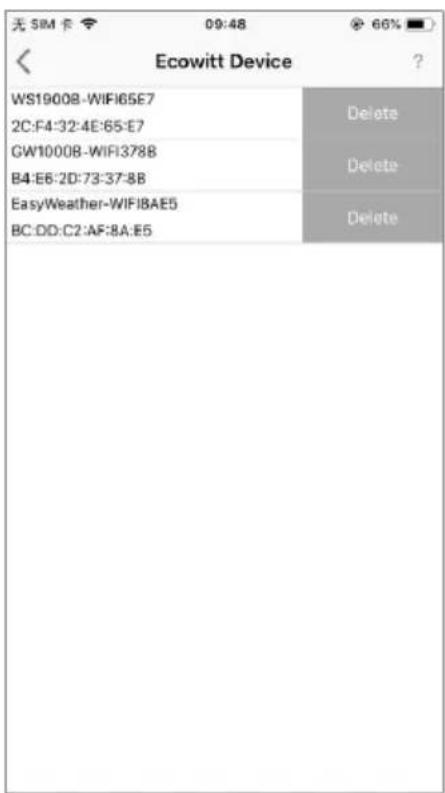
Once you have successfully created your Ecowitt account in the WS View Plus app, you can select Manage Ecowitt in the submenu to manage your device.
Manage Ecowitt
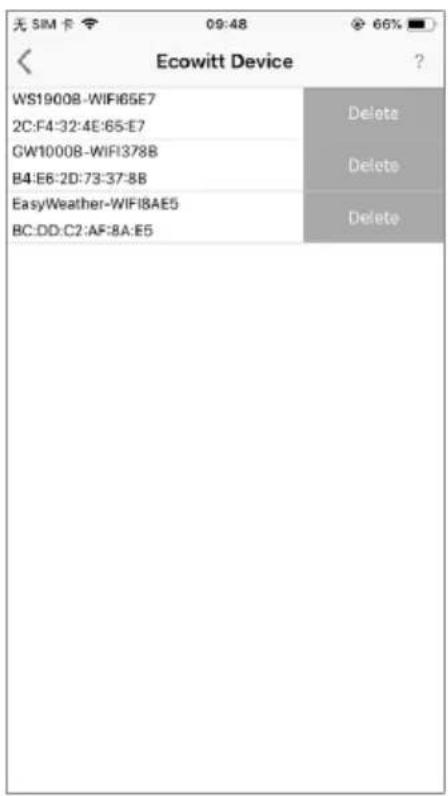
You can view your weather station data by pressing on your device on this screen.
CLEANING AND CARE
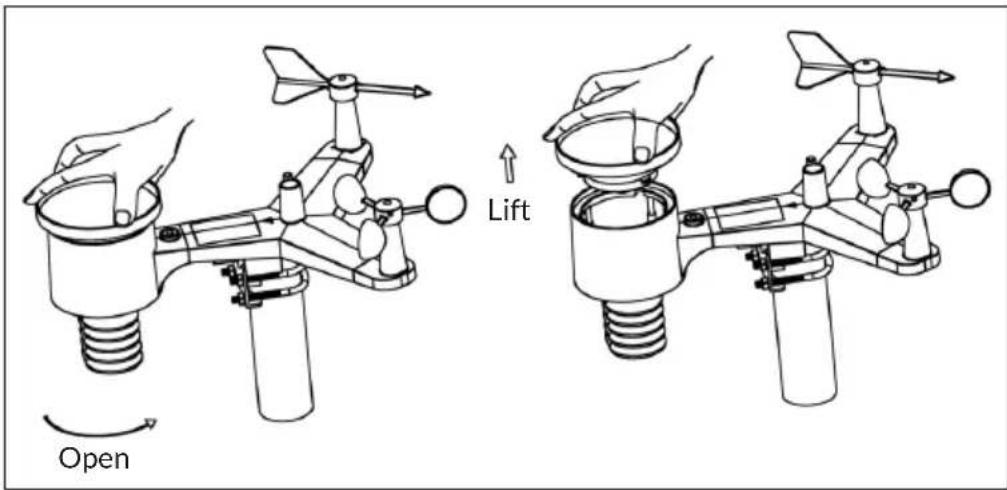
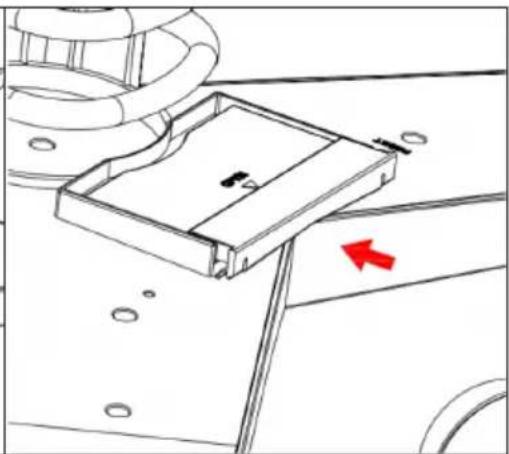
- Clean the rain gauge once every 3 months. Rotate the funnel counterclockwise and lift to expose the rain gauge mechanism, and clean with a damp cloth. Remove any dirt, debris and insects. If bug infestation is an issue, spray the array lightly with insecticide.
-
Clean the solar radiation sensor and solar panel every 3 months with damp cloth
-
Replace batteries every 1-2 years. If left in too long, the batteries may leak due to environmental challenges. In harsh environments, inspect the batteries every 3 months (when cleaning the solar panel).
-
When replacing the batteries, apply a corrosion preventive compound on the battery terminals, available at Amazon and most hardware stores.
-
In snowy environments, spray the top of the weather station with anti-icing silicon spray to prevent snow build up.
TROUBLESHOOTING
| Problem Solution | |
| Outdoor sensor array does not communicate to the display console. | The sensor array may have initiated properly and the data is registered by the console as invalid, and the console must be reset. Press the reset button as described in section “Reset Button and Transmitter LED”. With an open ended paperclip, press the reset button for 3 seconds to completely discharge the voltage. Take out the batteries and wait one minute, while covering the solar panel to drain the voltage. Put batteries back in and resync the console with the sensor array about 3 metres feet away. |
| The LED next to the battery compartment will flash every 16 seconds. If the LED is not flashing every 16 seconds, you should replace the batteries in the outside sensor array. If the batteries were recently replaced, check the polarity. If the sensor is flashing every 16 seconds, proceed to the next step. | |
| There may be a temporary loss of communication due to reception loss related to interference or other location factors, or the batteries may have been changed in the sensor array and the console has not been reset. The solution may be as simple as powering down and up the console (remove AC power and batteries, wait 10 seconds, and reinsert AC power and batteries). | |
| Temperature sensor reads too high in the day time. | Make certain that the sensor array is not too close to heat generating sources or strictures, such as buildings, pavement, walls or air conditioning units. Use the calibration feature to offset installation issues related to radiant heat sources. |
| Relative pressure does not agree with official reporting station. | You may be viewing the absolute pressure, not the relative pressure. Select the relative pressure. Make sure you properly calibrate the sensor to an official local weather station. |
| Rain gauge reports rain when it is not raining. | An unstable mounting solution (sway in the mounting pole) may result in the tipping bucket incorrectly incrementing rainfall. Make sure you have a stable, level mounting solution. |
| No data are reported to Wunderground.com. | 1. Confirm your password or key is correct and it is the password you registered on Wunderground.com. Your Wunderground.com password cannot begin with a non-alphanumeric character (a limitation of Wunderground.com, not the station). Example, oewkrf is not a valid password, but oewkrf is valid.2. Confirm your station ID is correct. The station ID contains uppercase letters, and the most common issue is substituting an O for a 0 (or visa versa). Example, KAZPHOEN11, not KAZPHOEN11.3. Make sure the date and time is correct on the console. If incorrect, you may be reporting old data, not real time data.4. Make sure your time zone is set properly. If incorrect, you may be reporting old data, not real time data.5. Check your router firewall settings. The console sends data via Port 80. |
| No WiFi connection 1. | Check for WiFi symbol on the display. If wireless connectivity is successful the WiFi icon will be displayed in the time field.2. Make sure your modem WiFi settings are correct (network name, and password).3. Make sure the console is plugged into AC power. The console will not connect to WiFi when powered by batteries only.4. The console only supports and connects to 2.4 GHz routers. If you own a 5 GHz router, and it is a dual band router, you will need to disable the 5 GHz band, and enable the 2.4 GHz band.5. The console does not support guest networks. |
DISPOSAL CONSIDERATIONS

natural_image
Symbol of a trash bin crossed with a diagonal line, no text or numbers presentIf there is a legal regulation for the disposal of electrical and electronic devices in your country, this symbol on the product or on the packaging indicates that this product must not be disposed of with household waste. Instead, it must be taken to a collection point for the recycling of electrical and electronic equipment. By disposing of it in accordance with the rules, you are protecting the environment and the health of your fellow human beings from negative consequences. For information about the recycling and disposal of this product, please contact your local authority or your household waste disposal service.
This product contains batteries. If there is a legal regulation for the disposal of batteries in your country, the batteries must not be disposed of with household waste. Find out about local regulations for disposing of batteries. By disposing of them in accordance with the rules, you are protecting the environment and the health of your fellow human beings from negative consequences.
DECLARATION OF CONFORMITY

Manufacturer:
Chal-Tec GmbH, Wallstrasse 16, 10179 Berlin, Germany.
Importer for Great Britain:
Berlin Brands Group UK Limited PO Box 42
272 Kensington High Street
London, W8 6ND
United Kingdom
Hereby, Chal-Tec GmbH declares that the radio equipment type Huygens is in compliance with Directive 2014/53/EU. The full text of the EU declaration of conformity is available at the following internet address: use.berlin/10032850
For Great Britain: Hereby, Chal-Tec GmbH declares that the radio equipment type Huygens is in compliance with the relevant statutory requirements. The full text of the declaration of conformity is available at the following internet address: use.berlin/10032850
Cher client, chère cliente,
SOMMAIRE
Fiche technique 124
natural_image
Technical line drawing of a mechanical device with internal components and mounting base (no text or symbols)natural_image
Technical line drawing of a mechanical device with a cylindrical base and internal components (no text or symbols)Installation des piles
natural_image
Technical line drawing of a mechanical assembly with rollers and a component (no text or symbols)7
natural_image
Technical line drawing of a mechanical component with a red directional arrow indicating movement or force (no text or symbols present)8
12
Pression (Pressure)
natural_image
Two-panel illustration showing a grassy field with white flowers and a white double-headed arrow between them, alongside two cloud-like shapes depicting raindrops and falling rain (no text or symbols)

natural_image
Illustration of two white clouds with raindrops falling and green grass at the base (no text or symbols)natural_image
Two-panel image showing a black background with grass and white flowers, separated by a double-headed arrow (no text or symbols)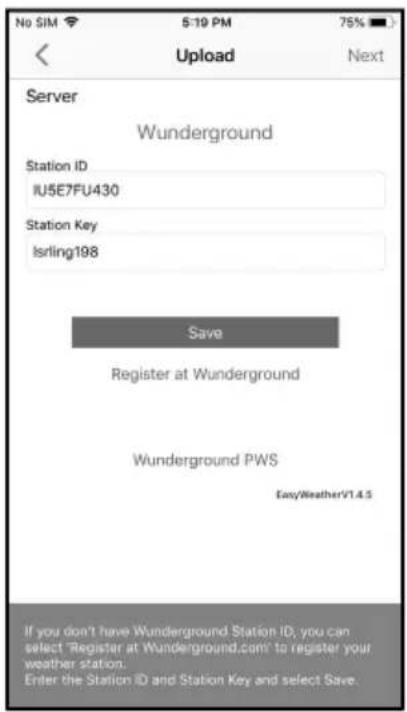
ECOWITT WEATHER
WEATHER UNDERGROUND
http://www.wunderground.com/personal-weather-station/dashboard?ID=STATIONID
https://itunes.apple.com/us/app/wunderstation-weather-from-your-neighborhood/id906099986
https://itunes.apple.com/us/app/weather-underground-forecast/id486154808
https://play.google.com/store/apps/details?id=com.wunderground.android.weather&hl=en
https://itunes.apple.com/us/app/pws-weather-station-monitor/id713705929
line
San Francisco, CA Presidio (KCASANFR148) Last Updated on October 31, 10:28 PM PDT | Metric | Value | | :--- | :--- | | Temperature | 54.1 °C | | Low | 49.3 | | High | 54.3 | | Low | 47.5 | | Humidity (%) | 90 | | Low | 70 | | Wind (MW) | 0.0 m³ | | Wind (MW) Max | 308 | | Wind (MW) Min | 308 | | Wind Gust (m) | 1.0 m³ | | Pressure (m/s) | 29.96 | | Low | 29.87 | | Last Hi: | 0.00 | Temperature - Dew Point Temperature - Dew Point Conservative Precursor Conservative Precursor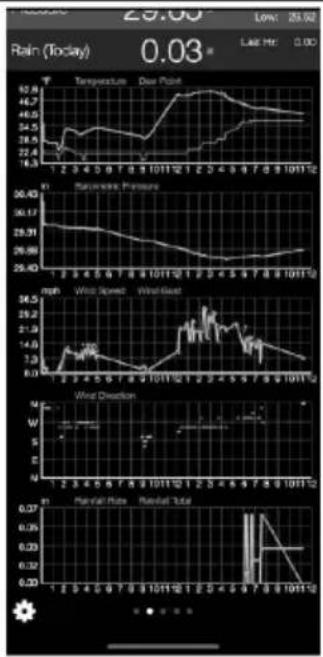
line
| Date | Temperature | Rainfall (mm) | Wind Speed (m/s) | Wind Direction (m/s) | |------------|--------------|---------------|------------------|----------------------| | 1/2/2011 | 28.4 | 30.43 | 7.0 | 0.0 | | 2/2/2011 | 29.1 | 30.17 | 7.5 | 0.0 | | 3/2/2011 | 29.8 | 29.9 | 8.0 | 0.0 | | 4/2/2011 | 30.5 | 29.5 | 8.5 | 0.0 | | 5/2/2011 | 31.0 | 29.0 | 9.0 | 0.0 | | 6/2/2011 | 31.5 | 28.5 | 9.5 | 0.0 | | 7/2/2011 | 32.0 | 28.0 | 10.0 | 0.0 | | 8/2/2011 | 32.5 | 27.5 | 10.5 | 0.0 | | 9/2/2011 | 33.0 | 27.0 | 11.0 | 0.0 | | 10/2/2011 | 33.5 | 26.5 | 11.5 | 0.0 | | 11/2/2011 | 34.0 | 26.0 | 12.0 | 0.0 | | 12/2/2011 | 34.5 | 25.5 | 12.5 | 0.0 | | 1/2/2012 | 35.0 | 25.0 | 13.0 | 0.0 | | 2/2/2012 | 35.5 | 24.5 | 13.5 | 0.0 | | 3/2/2012 | 36.0 | 24.0 | 14.0 | 0.0 | | 4/2/2012 | 36.5 | 23.5 | 14.5 | 0.0 | | 5/2/2012 | 37.0 | 23.0 | 15.0 | 0.0 | | 6/2/2012 | 37.5 | 22.5 | 15.5 | 0.0 | | 7/2/2012 | 38.0 | 22.0 | 16.0 | 0.0 | | 8/2/2012 | 38.5 | 21.5 | 16.5 | 0.0 | | 9/2/2012 | 39.0 | 21.0 | 17.0 | 0.0 | | 10/2/2012 | 39.5 | 20.5 | 17.5 | 0.0 | | 11/2/2012 | 40.0 | 20.0 | 18.0 | 0.0 | | 12/2/2012 | 40.5 | 19.5 | 18.5 | 0.0 | | 1/2/2013 | 41.0 | 19.0 | 19.0 | 0.0 | | 2/2/2013 | 41.5 | 18.5 | 19.5 | 0.0 | | 3/2/2013 | 42.0 | 18.0 | 20.0 | 0.0 | | 4/2/2013 | 42.5 | 17.5 | 20.5 | 0.0 | | 5/2/2013 | 43.0 | 17.0 | 21.0 | 0.0 | | 6/2/2013 | 43.5 | 16.5 | 21.5 | 0.0 | | 7/2/2013 | 44.0 | 16.0 | 22.0 | 0.0 | | 8/2/2013 | 44.5 | 15.5 | 22.5 | 0.0 | | 9/2/2013 | 45.0 | 15.0 | 23.0 | 0.0 | | 10/2/2013 | 45.5 | 14.5 | 23.5 | 0.0 | | ... | ... | ... | ... | ... | | ... | ... | ... | ... | ... | | ... | ... | ... | ... | ... | | ... | ... | ... | ... | ... | | ... | ... | ... | ... | ... | | ... | ... | ... | ... | ... | | ... | ... | ... | ... | ... | | Note: The actual values are not provided in the code provided in the code above the code guidelines for the last few days of the year.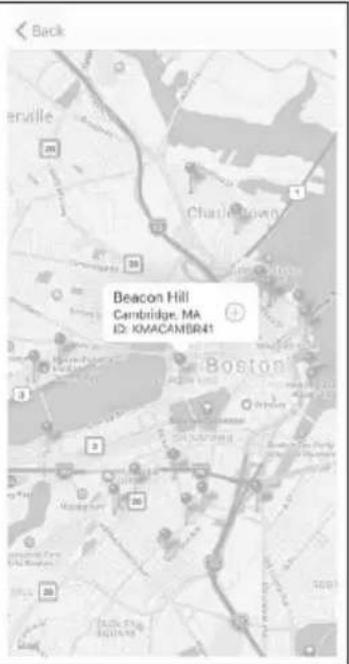
GESTION DES APPAREILS ET PARAMÈTRES
| Device List | |
| EasyWeather-WIFID05E | |
| IP: 10.0.1.27 | > |
| MAC: A0:20:A8:35:D0:5E | |
| WH2650A-WIFIBA3B | |
| IP: 10.0.1.6 | > |
| MAC: 5C:CF:7F:23:BA:3B | |
| WH2650A-WIFIBB00 | |
| IP: 10.0.1.4 | > |
| MAC: 5C:CF:7F:23:BB:00 | |
| GW1000-WIFI885C | |
| IP: 10.0.1.18 | > |
| MAC: 84:F3:EB:21:88:5C | |
| GW1000A-WIFI2612 | |
| IP: 10.0.1.7 | > |
| MAC: 84:F3:EB:25:26:12 | |
| EasyWeather-WIFID235 | |
| IP: 10.0.1.5 | > |
| MAC: EC:FA:BC:15:D2:35 | |
| GW1000-WIFIRC73 | |
| WU Stations | Add |
| I44JIUXI35 | Delete |
| I44JIUXI28 | Delete |
| I44JIUXI60 | Delete |
| I44JIUXI74 | Delete |
| IFJELL37 | Delete |
| I44JIUXI65 | Delete |
| I44JIUXI71 | Delete |
| IU5E7FU414 | Delete |
| KCAMOUNT191 | Delete |
| I44JIUXI36 | Delete |
| IU5E7FU429 | Delete |
natural_image
Symbol of a trash bin crossed with a diagonal line, no text or numbers presentDÉCLARATION DE CONFORMITÉ

Fabricant :
Chal-Tec GmbH, Wallstraße 16, 10179 Berlin, Allemagne.
Berlin Brands Group UK Limited PO Box 42
272 Kensington High Street
London, W8 6ND
United Kingdom
INDICE
Dati tecnici 184
natural_image
Technical line drawing of a mechanical device with internal components and mounting base (no text or symbols)natural_image
Technical line drawing of a mechanical device with a cylindrical base and internal components (no text or symbols)natural_image
Technical line drawing of a mechanical assembly with rollers and a component inside a housing (no text or symbols)7
natural_image
Technical line drawing of a mechanical component with a red directional arrow indicating movement or force (no text or symbols present)8
MESSA IN FUNZIONE E UTILIZZO
Pressione (Pressure)
natural_image
Two-panel diagram showing a white arrow between black and white panels, with grass and raindrops on the right panel (no text or symbols)natural_image
Two-panel image showing a black background with grass and white flowers, separated by a double-headed arrow (no text or symbols)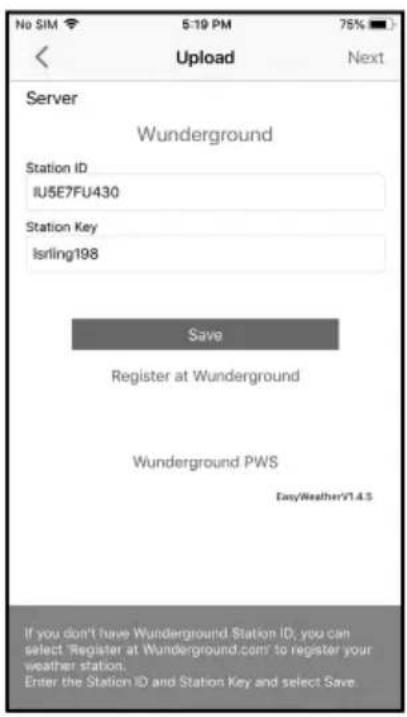
ECOWITT WEATHER
line
| Time | Temperature | Humidity | | ---------- | ----------- | -------- | | 7:30 AM | 26.8 | 80% | | 2:00 PM | 32.3 | 70% | | 5:30 PM | 32.3 | 70% | | 12:45 PM | 32.3 | 70% | | 10:45 PM | 32.3 | 70% | | 12:00 AM | 32.3 | 70% | | 1:45 AM | 32.3 | 70% | | 3:30 AM | 32.3 | 70% | | 5:15 AM | 32.3 | 70% | | 7:30 AM | 32.3 | 70% | | 9:45 AM | 32.3 | 70% | | 10:30 AM | 32.3 | 70% | | 12:15 PM | 32.3 | 70% | | 2:00 PM | 32.3 | 70% | | 3:45 PM | 32.3 | 70% | | 5:30 PM | 32.3 | 70% | | 7:15 PM | 32.3 | 70% | | 9:00 PM | 32.3 | 70% | | 10:45 PM | 32.3 | 70% | | 12:00 AM | 32.3 | 70% | | 1:45 AM | 32.3 | 70% | | 3:30 AM | 32.3 | 65% | | 5:15 AM | 32.3 | 65% | | 7:30 AM | 32.3 | 65% | | 9:45 AM | 32.3 | 65% | | 10:30 AM | 32.3 | 65% | | 12:15 PM | 32.3 | 65% | | 2:00 PM | 32.3 | 65% | | 3:45 PM | 32.3 | 65% | | 5:30 PM | 32.3 | 65% | | 7:15 PM | 32.3 | 65% | | 9:00 PM | 32.3 | 65% | | 10:45 PM | 32.3 | 65% | | 12:00 AM | 32.3 | 65% | | 1:45 AM | 32.3 | 65% | | 3:30 AM | 32.3 | 65% | | 5:15 AM | 32.3 | 65% | | 7:30 AM | 32.3 | 65% | | 9:45 AM | 32.3 | 65% | | 10:30 AM------- | 32.3 | 65% | | 12:15 PM------- | 32.3 | 65% | | 2:00 PM | 32.3 | 65% | | 3:45 PM | 32.3 | 65% | | 5:30 PM | 32.3 | 65% | | 7:15 PM | 32.3 | 65% |Vista elenco
WEATHER UNDERGROUND
line
IUSE7FU414 Stations | Metric | Value | | :--- | :--- | | Temperature | 24.2 °C | | Dew Point | 16.2 °C | | Relative Humidity | 61 % | | Pressure | 1013.4 hPa | | Wind Direction | NE | | Wind Speed | 0.0 m/s | | Wind Gust Speed | 0.0 m/s | | Solar Radiation | 0.00 w/m² | | Precip Rate | 0.0 mm/hr | | Precipitation Accum | 0.0 mm | Temperature / Dew Point Temperature Dew Point Humidityhttp://www.wunderground.com/personal-weather-station/dashboard?ID=STATIONID
https://itunes.apple.com/us/app/wunderstation-weather-from-your-neighborhood/id906099986
https://itunes.apple.com/us/app/weather-underground-forecast/id486154808
https://play.google.com/store/apps/details?id=com.wunderground.android.weather&hl=en
https://itunes.apple.com/us/app/pws-weather-station-monitor/id713705929
line
San Francisco, CA Presidio (KCASANFR148) Last Updated on October 31, 10:28 PM PDT | Metric | Value | | :--- | :--- | | Temperature | 54.1 °C | | High | 63.0 °C | | Low | 49.3 °C | | Dew Point | 51.3 °C | | High | 54.3 °C | | Low | 47.5 °C | | Humidity | 90 % | | High | 95 % | | Low | 70 % | | Wind | 0.0 min | | High | 12.0 °C | | Wind Gust | 1.0 min | | High | 15.0 °C | | Pressure | 29.96 m/s | | High | 29.96 m/s | | Low | 29.97 m/s | | Rain (Today) | 0.00 m/s | | Last Hr | 0.00 m/s | Temperature: New Point Temperature: New Point Conservative Pressure: 29.97 m/s 29.94 m/s 29.91 m/s 29.89 m/s 29.88 m/s 29.87 m/s 29.86 m/s 29.85 m/s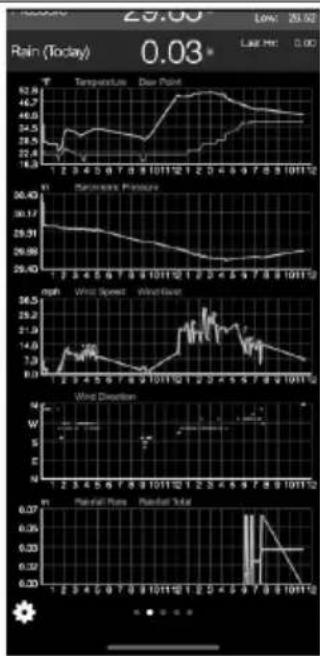
line
| Date | Temperature | Day Point | Wind Speed (mph) | Wind Direction (W) | Rainfall Rate (mm) | |------------|-------------|----------|------------------|--------------------|--------------------| | 10/11/12 | 62.9 | 57.4 | 30.17 | 0.0 | 0.03 |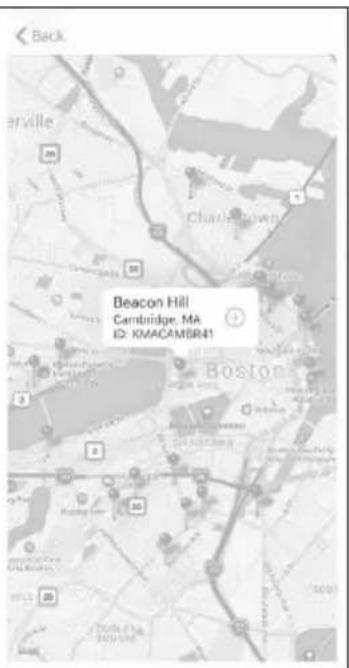
Gestire Wunderground
| WU Stations | Add |
| I44JIUXI35 | Delete |
| I44JIUXI28 | Delete |
| I44JIUXI60 | Delete |
| I44JIUXI74 | Delete |
| IFJELL37 | Delete |
| I44JIUXI65 | Delete |
| I44JIUXI71 | Delete |
| IU5E7FU414 | Delete |
| KCAMOUNT191 | Delete |
| I44JIUXI36 | Delete |
| IU5E7FU429 | Delete |
Gestire Ecowitt
natural_image
Symbol of a trash bin crossed with a diagonal line, no text or numbers presentBerlin Brands Group UK Limited PO Box 42
272 Kensington High Street
London, W8 6ND
United Kingdom
ÍNDICE
Datos técnicos 244
natural_image
Technical line drawing of a mechanical device with internal components and mounting base (no text or symbols)natural_image
Technical line drawing of a mechanical device with a cylindrical base and internal components (no text or symbols)12
14
Presión (pressure)
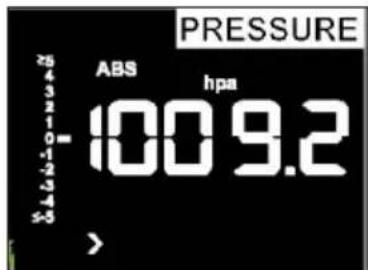
natural_image
Two-panel diagram showing a white arrow between black and white panels, with grass and raindrops on the right panel (no text or symbols)natural_image
Two-panel image showing a black background with grass and white flowers, separated by a double-headed arrow (no text or symbols)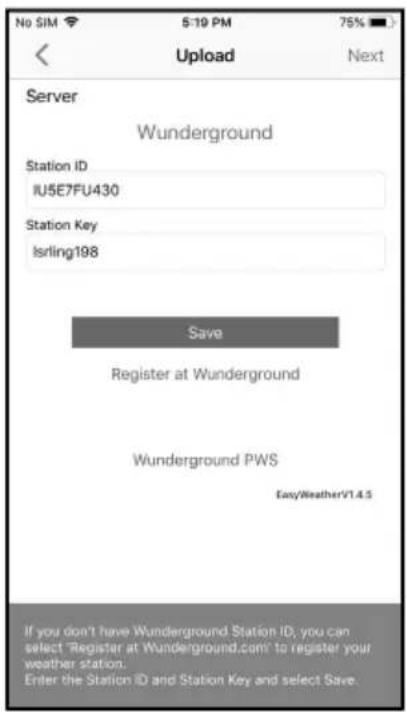
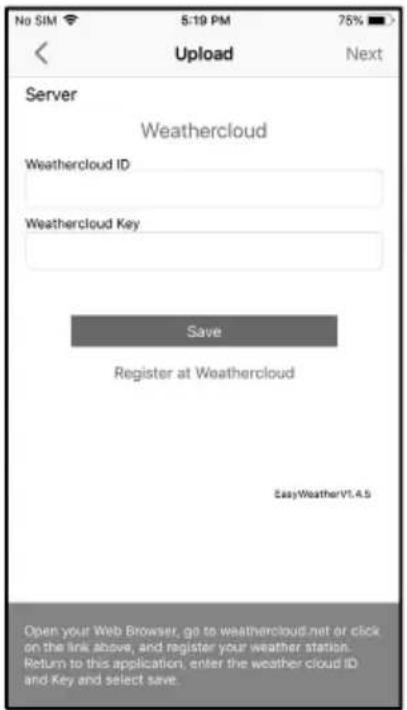
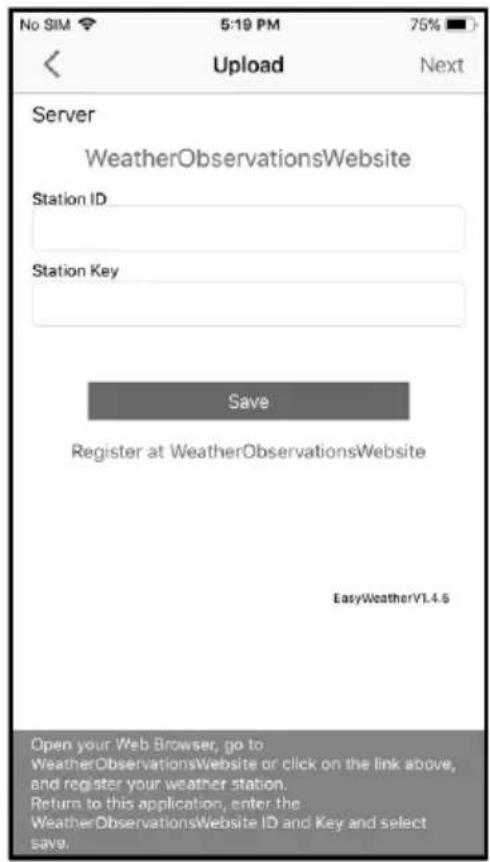

ECOWITT WEATHER
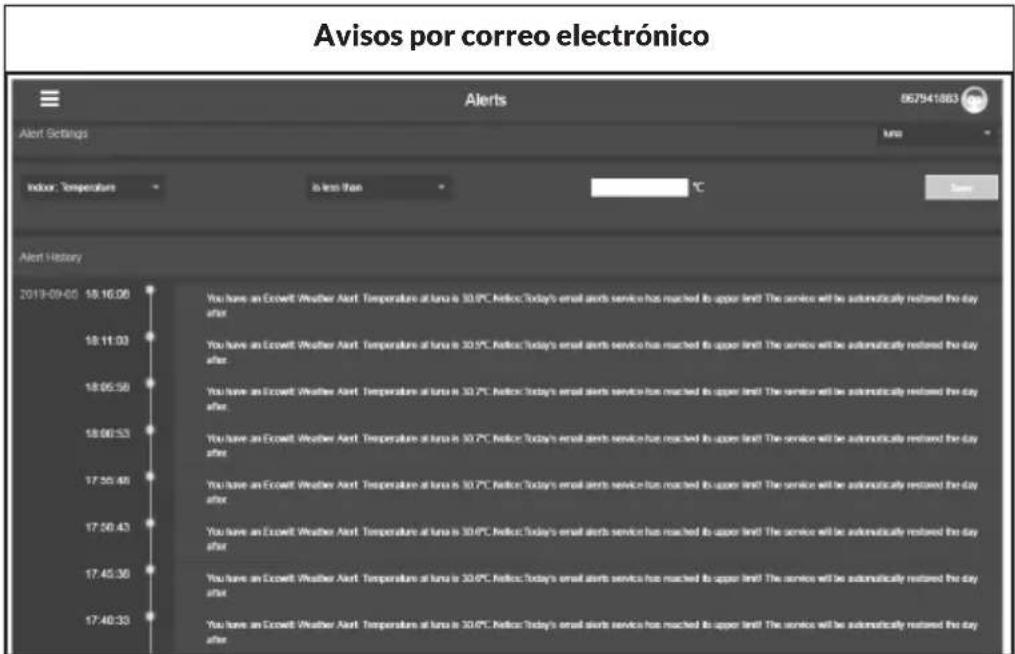
WEATHER UNDERGROUND
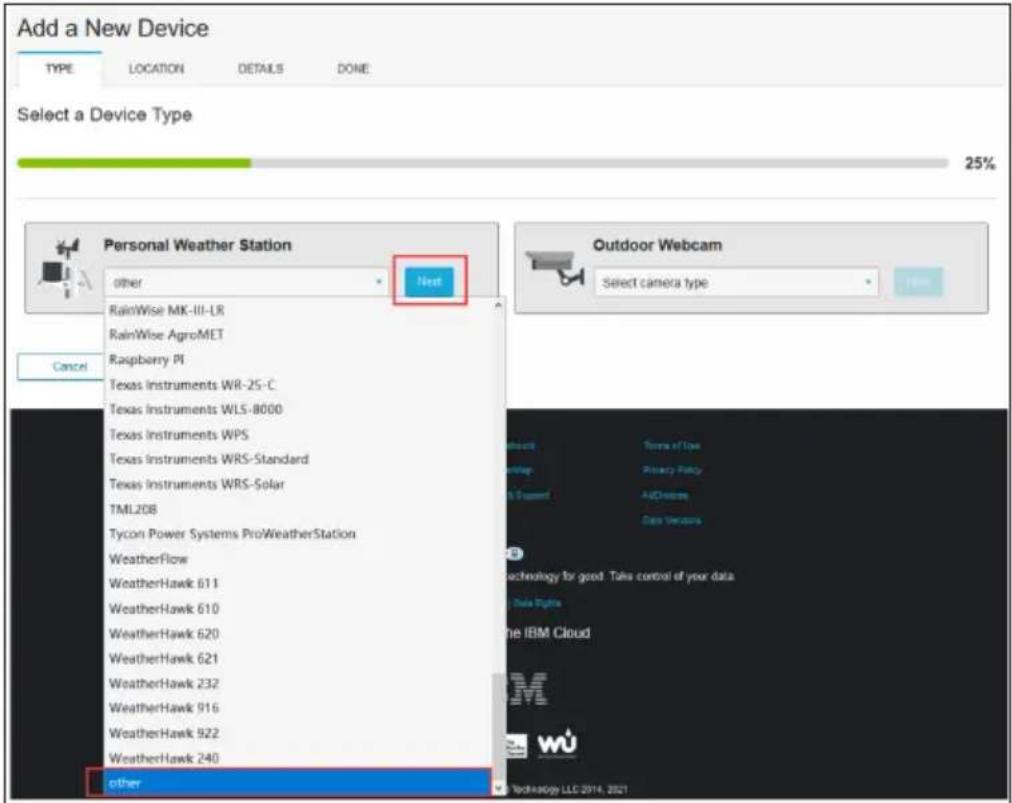
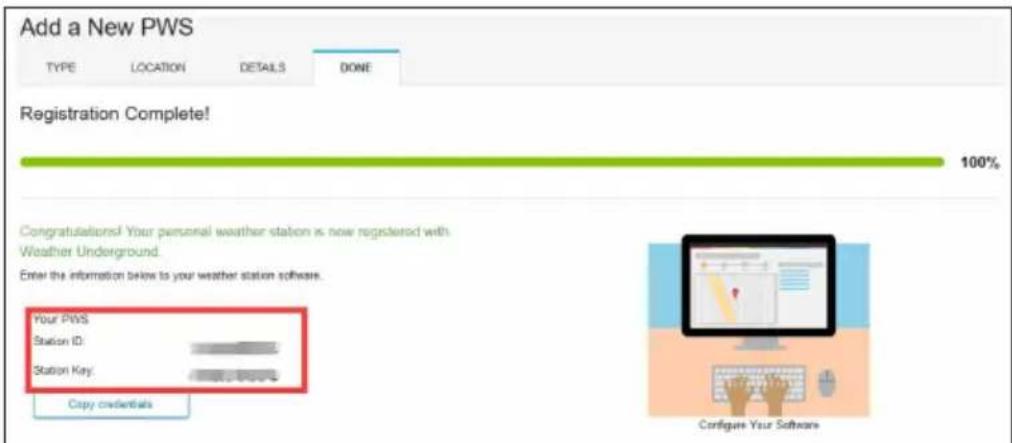
line
IU5E7FU414 Stations | Station | Temperature (°C) | | :--- | :--- | | 1/8/19, 4:04 PM | 24.2 °C | | Dew Point | 16.2 °C | | Relative Humidity | 61 % | | Pressure | 1013.4 hPa | | Wind Direction | NE | | Wind Speed | 0.0 m/s | | Wind Gust Speed | 0.0 m/s | | Solar Radiation | 0.00 w/m² | | Precip Rate | 0.0 mm/hr | | Precipitation Accum | 0.0 mm | Temperature / Dew Point Temperature Dew Point Humidityhttp://www.wunderground.com/personal-weather-station/dashboard?ID=STATIONID
https://itunes.apple.com/us/app/wunderstation-weather-from-your-neighborhood/id906099986
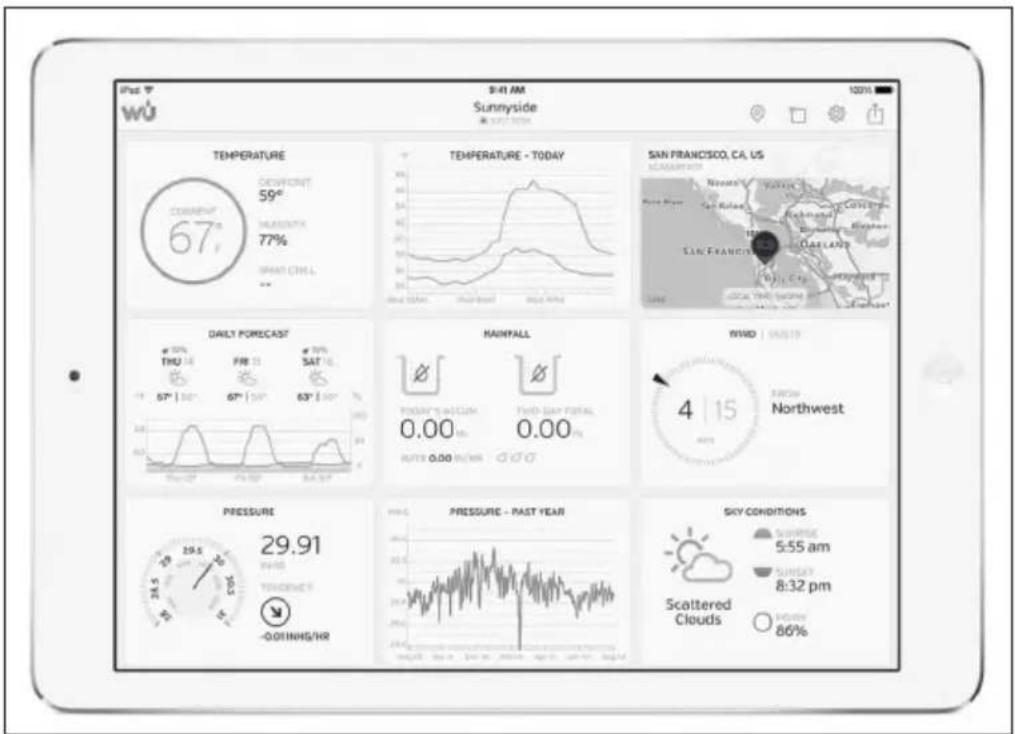
https://itunes.apple.com/us/app/weather-underground-forecast/id486154808
https://play.google.com/store/apps/details?id=com.wunderground.android.weather&hl=en
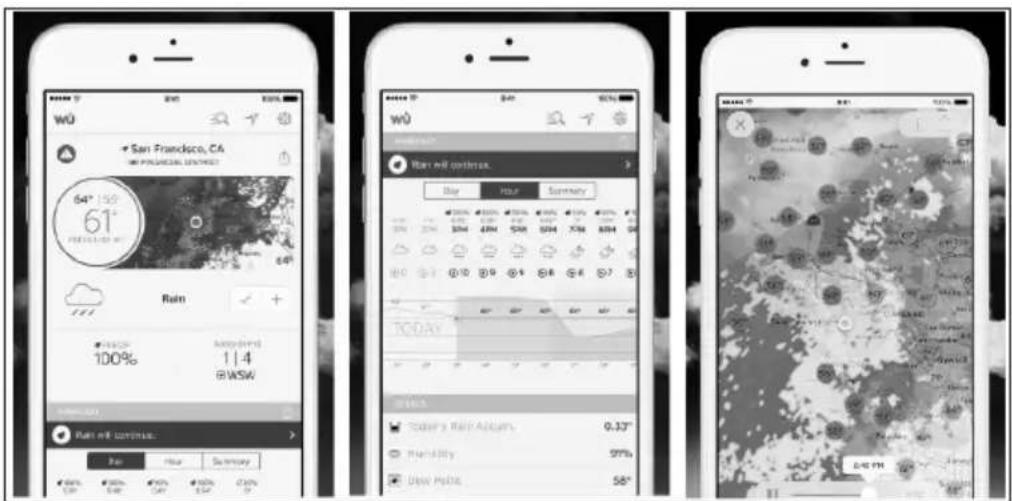
https://itunes.apple.com/us/app/pws-weather-station-monitor/id713705929
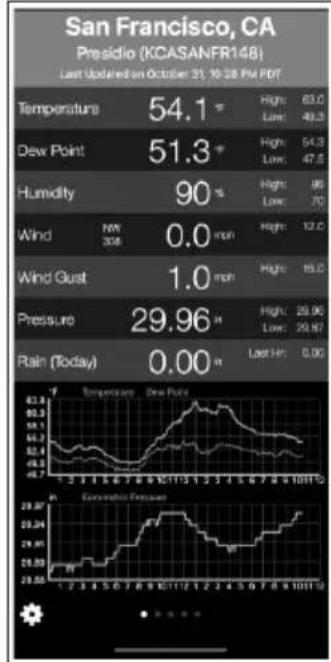
line
San Francisco, CA Presidio (KCASANFR148) Last Updated on October 31, 10:28 PM PDT | Metric | Value | | :--- | :--- | | Temperature | 54.1 °C | | High | 63.0 °C | | Low | 49.3 °C | | Dew Point | 51.3 °C | | High | 54.3 °C | | Low | 47.5 °C | | Humidity | 90 % | | High | 95 % | | Low | 70 % | | Wind | 0.0 min | | High | 12.0 °C | | Wind Gust | 1.0 min | | High | 15.0 °C | | Pressure | 29.96 m/s | | High | 29.96 m/s | | Low | 29.97 m/s | | Rain (Today) | 0.00 m/s | | Last Hr | 0.00 m/s | Temperature: New Point Temperature: New Point Conservative Pressure: 29.97 m/s 29.94 m/s 29.91 m/s 29.89 m/s 29.88 m/s 29.87 m/s 29.86 m/s 29.85 m/s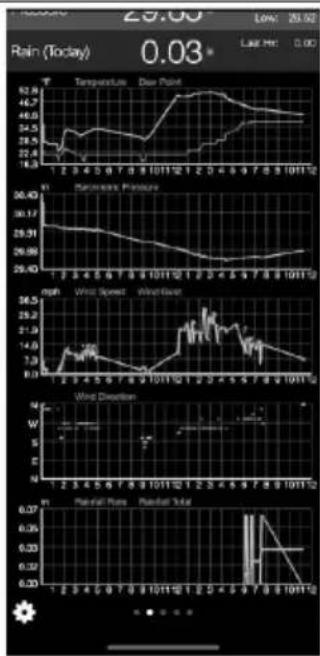
line
| Date | Temperature | Day Point | Wind Speed (mph) | Wind Direction (W) | Rainfall Rate (mm) | |------------|-------------|----------|------------------|--------------------|--------------------| | 10/11/12 | 62.9 | 50.40 | 30.17 | N | 0.07 | | 10/11/12 | 62.9 | 50.40 | 30.17 | N | 0.07 | | 10/11/12 | 62.9 | 50.40 | 30.17 | N | 0.07 | | 10/11/13 | 62.9 | 50.40 | 30.17 | N | 0.07 | | 10/11/13 | 62.9 | 50.40 | 30.17 | N | 0.07 | | 10/11/13 | 62.9 | - | 30.17 | N | 0.07 | | 10/11/13 | 62.9 | - | 30.17 | N | 0.07 | | 10/11/13 | 62.9 | - | 30.17 | N | 0.07 | | | 10/11/13 | 62.9 | - | 30.17 | N | 0.07 | | 10/11/13 | 62.9 | - | 30.17 | N | 0.07 | | 10/11/13 | 62.9 | 50.40 | 30.17 | N | 0.07 | | 10/11/13 | 62.9 | - | 30.17 | N | 0,07 | | 10/11/13 | 62.9 | - | 30.17 | N | 0,07 | | 10/11/13 | 62.9 | - | 30.17 | N | 0,07 | | 10/11/13 | 62,9 | - | 30.17 | N | 0,07 | | 10/11/13 | 62,9 | - | 30.17 | N | 0,07 | | 10/11/13 | 62,9 | - | 30.17 | N | 0.07 | | 10/11/13 | 62,9 | - | 30.17 | N | 0,07 | | 10/11/13 | 62,9 | - | 30.17 | N | 0,07 | | 10/11/13 | 62.9 | - | 30.17 | N | 0,07 | | 10/11/13 | 62,9 | - | 30.17 | N | 0.07 | | 10/11/13 | 62,9 | - | 30.17 | N | 0.07 | | 10/11/13 | 62,9 | - | 30.17 | N | 0,07 | | 10/11/13 | 62.9 | - | 30.17 | N | 0,07 | | 10/11/13 | 62.9 | - | 30.17 | N | 0.07 | | 10/11/13 | 62,9 | - | 30.17 | N | 0,07 | | 10/11/13 | 62,9 | - | 30.17 | N | 0.07 | | 10/11/13 | 62.9 | - | 30.17 | N | 0,07 | | 10/11/13 | 62,9 | - | 30.17 | N | 0,07 | | 10/11/13 | 62.9 | - | 30.17 | N | 0.07 | | 10/11/13 | - | - | - | N | N | | 10/11/13 | - | - | - | W | N | | 10/11/13 | - | - | - | E | N | | 10/11/13 | - | - | - | N | N | | 10/11/13 | - | - | - | N | N | | 10/11/13 | - | - | - | N | N | | 10/1 | - | - | - | - | N | | ... | ... | ... | ... | ... | ... | | ... | ... | ... | ... | ... | ... | | ... | ... | ... | ... | ... | ... | | ... | ... | ... | ... | ... | ... | | ... | ... | ... | ... | ... | ... | | ... | ... | ... | ... | ... | ... | | ... (final)| ... / (final)| ... / (final)| ... / (final)| ... / (final)| ... | | Note: The actual values for 'Temperature' and 'Wind Speed' are not provided in the code snippet in the image. I have used placeholders for the actual values.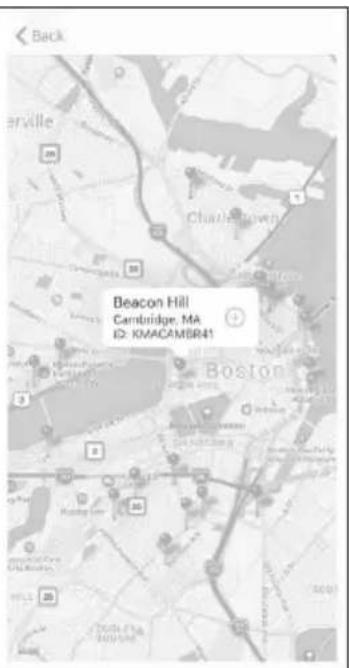
GESTIONAR LOS DISPOSITIVOS Y AJUSTES
| Device List | |
| EasyWeather-WIFID05E | |
| IP: 10.0.1.27 | > |
| MAC: A0:20:A8:35:D0:5E | |
| WH2650A-WIFIBA3B | |
| IP: 10.0.1.6 | > |
| MAC: 5C:CF:7F:23:BA:3B | |
| WH2650A-WIFIBB00 | |
| IP: 10.0.1.4 | > |
| MAC: 5C:CF:7F:23:BB:00 | |
| GW1000-WIFI885C | |
| IP: 10.0.1.18 | > |
| MAC: 84:F3:EB:21:88:5C | |
| GW1000A-WIFI2612 | |
| IP: 10.0.1.7 | > |
| MAC: 84:F3:EB:25:26:12 | |
| EasyWeather-WIFID235 | |
| IP: 10.0.1.5 | > |
| MAC: EC:FA:BC:15:D2:35 | |
| GW1000-WIFIRC73 | |
Gestionar Wunderground
| WU Stations | Add |
| I44JIUXI35 | Delete |
| I44JIUXI28 | Delete |
| I44JIUXI60 | Delete |
| I44JIUXI74 | Delete |
| IFJELL37 | Delete |
| I44JIUXI65 | Delete |
| I44JIUXI71 | Delete |
| IU5E7FU414 | Delete |
| KCAMOUNT191 | Delete |
| I44JIUXI36 | Delete |
| IU5E7FU429 | Delete |
natural_image
Symbol of a trash bin crossed with a diagonal line, no text or numbers presentBerlin Brands Group UK Limited PO Box 42
272 Kensington High Street
London, W8 6ND
United Kingdom
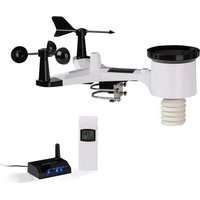

- INHALTSVERZEICHNIS
- Batterieinstallation
- Druck (Pressure)
- Wettervorhersage
- ECOWITT WEATHER
- WEATHER UNDERGROUND
- CONTENTS
- SAFETY INSTRUCTIONS
- WARNING
- QUICK START
- INSTALLATION
- Pre Installation Checkout
- Site Survey
- Sensor Set Up
- Install U-bolts and mounting pole
- Install wind vane
- Install wind speed
- Install Rain Gauge
- Install batteries
- Mount assembled outdoor sensor package
- Reset Button and Transmitter LED
- Best Practices for Wireless Communication
- Display console
- Vertical Desk Stand
- COMMISSIONING AND OPERATION
- Initial display console set up
- Key function
- Important Notes
- SETTINGS AND MODES
- BEEP
- MAX/ MIN Daily
- Time / Date
- DST
- Pressure
- Light
- Temperature
- Wind speed
- Rain
- Notes:
- Moon phase
- Alarm mode
- Alarm mode setting:
- Alarm setting order:
- Max/min mode
- Calibration mode
- Calibration order:
- OTHER FEATURES
- Factory Reset/Clear Memory
- Register New Transmitter
- Backlight Operation
- Tendency indicators
- Wireless Signal Strength Indicator
- Weather forecast
- Weather Forecasting Description and Limitations
- Snooze
- AC address display
- LIVE INTERNET PUBLISHING
- Connecting the Weather Station Console to WiFi
- Download mobile application
- Connect the console to Wi-Fi
- Configure Device
- Upload settings
- Adding weather services
- Indication of data on ecowitt.net
- MANAGE DEVICES AND SETTINGS
- Manage Wunderground
- Settings
- Manage Ecowitt
- CLEANING AND CARE
- TROUBLESHOOTING
- DISPOSAL CONSIDERATIONS
- DECLARATION OF CONFORMITY
- Manufacturer:
- Importer for Great Britain:
- Cher client, chère cliente,
- SOMMAIRE
- Installation des piles
- GESTION DES APPAREILS ET PARAMÈTRES
- DÉCLARATION DE CONFORMITÉ
- Fabricant :
- INDICE
- MESSA IN FUNZIONE E UTILIZZO
- Pressione (Pressure)
- Gestire Wunderground
- Gestire Ecowitt
- ÍNDICE
- GESTIONAR LOS DISPOSITIVOS Y AJUSTES
- Gestionar Wunderground
Brand : Waldbeck
Model : Huygens
Category : Weather Station