
ES-1528 - Network switch ZYXEL - Free user manual and instructions
Find the device manual for free ES-1528 ZYXEL in PDF.

| Product Type | Network Switch |
| Brand | ZYXEL |
| Model | ES-1528 |
| Number of Ports | 8 Ethernet ports 10/100 Mbps (RJ-45) |
| Port Type | Auto-MDI/MDIX, automatic cable detection |
| Transfer Rate | Up to 200 Mbps in full-duplex mode |
| Dimensions | 217 x 135 x 44 mm (L x D x H) |
| Weight | 0.8 kg |
| Power Supply | External power adapter 5V DC, 1A |
| Power Consumption | 5 W maximum |
| Operating Temperature | 0 °C to 45 °C |
| Operating Humidity | 10% to 90% RH (non-condensing) |
| LED Indicators | Power, per port status (Link/Activity, Duplex/Collision) |
| Mounting | Desktop, wall-mountable (mounting kit included) |
| Main Functions | Store-and-forward switching, IEEE 802.3x flow control, port-based QoS, port-based VLAN |
| Switching Method | Store-and-Forward |
| Supported Network Standards | IEEE 802.3 10BASE-T, IEEE 802.3u 100BASE-TX, IEEE 802.3x |
| Switching Capacity | 1.6 Gbps (non-blocking) |
| MAC Address Table | 8,000 entries |
| Maintenance and Cleaning | Unplug the power, clean the case with a soft dry cloth. Do not use chemicals. |
| Safety | Always unplug before cleaning. Avoid exposure to water and extreme temperatures. |
| Spare Parts and Repairability | No internal replaceable parts. In case of failure, contact authorized after-sales service. |
| General Information | 2-year warranty (subject to manufacturer conditions). Complies with Canadian NMB-003 standard (Class A). |
Frequently Asked Questions - ES-1528 ZYXEL
User questions about ES-1528 ZYXEL
0 question about this device. Answer the ones you know or ask your own.
Ask a new question about this device
Download the instructions for your Network switch in PDF format for free! Find your manual ES-1528 - ZYXEL and take your electronic device back in hand. On this page are published all the documents necessary for the use of your device. ES-1528 by ZYXEL.
USER MANUAL ES-1528 ZYXEL
About This User's Guide
Intended Audience
This manual is intended for people who want to configure the switch using the web configurator. You should have at least a basic knowledge of TCP/IP networking concepts and topology.
Related Documentation
- Quick Start Guide
The Quick Start Guide is designed to help you get up and running right away. It contains information on setting up your hardware connections.
• Web Configurator Online Help
Embedded web help for descriptions of individual screens and supplementary information.

It is recommended you use the web configurator to configure the switch.
- Supporting Disk
Refer to the included CD for support documents. - ZyXEL Web Site
Please refer to www.zyxel.com for additional support documentation and product certifications.
User Guide Feedback
Help us help you. Send all User Guide-related comments, questions or suggestions for improvement to the following address, or use e-mail instead. Thank you!
The Technical Writing Team,
ZyXEL Communications Corp.,
6 Innovation Road II,
Science-Based Industrial Park,
Hsinchu, 300, Taiwan.
E-mail: techwriters@zyxel.com.tw
Document Conventions
Warnings and Notes
These are how warnings and notes are shown in this User's Guide.

Warnings tell you about things that could harm you or your device.

Notes tell you other important information (for example, other things you may need to configure or helpful tips) or recommendations.
Syntax Conventions
- The ES-1528 may be referred to as the “switch”, the “device” or the “system” in this User’s Guide.
- Product labels, screen names, field labels and field choices are all in bold font.
- A key stroke is denoted by square brackets and uppercase text, for example, [ENTER] means the “enter” or “return” key on your keyboard.
- “Enter” means for you to type one or more characters and then press the [ENTER] key. “Select” or “choose” means for you to use one of the predefined choices.
- A right angle bracket (>) within a screen name denotes a mouse click. For example, Maintenance > Log > Log Setting means you first click Maintenance in the navigation panel, then the Log sub menu and finally the Log Setting tab to get to that screen.
- Units of measurement may denote the “metric” value or the “scientific” value. For example, “k” for kilo may denote “1000” or “1024”, “M” for mega may denote “1000000” or “1048576” and so on.
- “e.g.,” is a shorthand for “for instance”, and “i.e.,” means “that is” or “in other words”.
Icons Used in Figures
Figures in this User's Guide may use the following generic icons. The switch icon is not an exact representation of your device.
ES-1528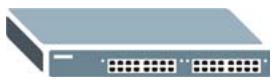 | Computer | Notebook computer |
Server | DSLAM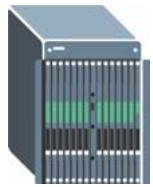 | Firewall |
Telephone | Switch | Router |
Safety Warnings

For your safety, be sure to read and follow all warning notices and instructions.
- Do NOT use this product near water, for example, in a wet basement or near a swimming pool.
- Do NOT expose your device to dampness, dust or corrosive liquids.
- Do NOT store things on the device.
- Do NOT install, use, or service this device during a thunderstorm. There is a remote risk of electric shock from lightning.
- Connect ONLY suitable accessories to the device.
- Do NOT open the device or unit. Opening or removing covers can expose you to dangerous high voltage points or other risks. ONLY qualified service personnel should service or disassemble this device. Please contact your vendor for further information.
- Make sure to connect the cables to the correct ports.
- Place connecting cables carefully so that no one will step on them or stumble over them.
• Always disconnect all cables from this device before servicing or disassembling. - Use ONLY an appropriate power adaptor or cord for your device.
- Connect the power adaptor or cord to the right supply voltage (for example, 110V AC in North America or 230V AC in Europe).
- Do NOT allow anything to rest on the power adaptor or cord and do NOT place the product where anyone can walk on the power adaptor or cord.
- Do NOT use the device if the power adaptor or cord is damaged as it might cause electrocution.
- If the power adaptor or cord is damaged, remove it from the power outlet.
- Do NOT attempt to repair the power adaptor or cord. Contact your local vendor to order a new one.
- Do not use the device outside, and make sure all the connections are indoors. There is a remote risk of electric shock from lightning.
- Do NOT obstruct the device ventilation slots, as insufficient airflow may harm your device.
This product is recyclable. Dispose of it properly.

Contents Overview
Introduction and Hardware Overview 25
Getting to Know Your Switch 27
Hardware Installation and Connection 31
Hardware Overview 35
Basic & Advanced Settings 41
The Web Configurator 43
System 49
Port Settings 55
System and Port Statistics 59
VLAN 63
Trunking 67
Mirroring 69
QoS 71
Port Rate Limit and Storm Control 79
Level 2 (L2) Management 83
Cable Diagnostics 87
Auto Denial of Service (DoS) 89
Auto VoIP 93
Management and Troubleshooting 95
Event Logging 97
SNMP 105
RMON-Lite 119
Dynamic ARP 133
Troubleshooting 137
Appendices and Index 145
Table of Contents
About This User's Guide .... 3
Document Conventions....4
Safety Warnings....6
Contents Overview 9
Table of Contents......11
List of Figures 17
List of Tables 21
Part I: Introduction and Hardware Overview 25
Chapter 1 Getting to Know Your Switch....27
1.1 Introduction ...... 27
1.1.1 Backbone Application 27
1.1.2 Bridging Example 28
1.1.3 High Performance Switching Example 28
1.1.4 IEEE 802.1Q VLAN Application Examples ...... 29
Chapter 2 Hardware Installation and Connection ....31
2.1 Freestanding Installation 31
2.2 Mounting the Switch on a Rack 32
2.2.1 Rack-mounted Installation Requirements 32
2.2.2 Attaching the Mounting Brackets to the Switch 32
2.2.3 Mounting the Switch on a Rack 33
Chapter 3 Hardware Overview......35
3.1 Panel Connections and the RESET Button 35
3.1.1 Ethernet Ports 35
3.1.2 Mini-GBIC Slots 36
3.2 The RESET Button 37
3.3 Rear Panel 38
3.3.1 Power Connector 38
3.4 LEDs 38
Part II: Basic & Advanced Settings 41
Chapter 4
The Web Configurator 43
4.1 Introduction ...... 43
4.2 System Login 43
4.3 The Status Screen 44
4.3.1 The LED Panel 45
4.3.2 The Navigation Panel 45
4.3.3 Change Your Password 47
4.4 Saving Your Configuration 47
4.5 Switch Lockout 47
4.6 Resetting the Switch 47
4.7 Logging Out of the Web Configurator 48
4.8 Help 48
Chapter 5
System 49
5.1 System Screen 49
5.1.1 Configure IP Address 50
5.1.2 Level 2 (L2) Table Aging .... 50
5.1.3 Backup Settings 51
5.1.4 Restore Settings 51
5.2 System: Change Password 52
5.3 Firmware Upgrade 52
5.3.1 System: Restart/Reset 53
Chapter 6
Port Settings....55
6.1 Port Status 55
6.2 Port Configuration 56
Chapter 7
System and Port Statistics....59
7.1 Overview 59
7.2 Statistics Summary 59
7.3 Port Statistics 60
Chapter 8
VLAN 63
8.1 Introduction to IEEE 802.1Q Tagged VLANs 63
8.1.1 Forwarding Tagged and Untagged Frames 63
8.2 Static VLAN 64
8.2.1 IEEE 802.1Q VLAN Screen 64
8.2.2 Create IEEE 802.1Q VLAN Screen 65
8.2.3 Edit IEEE 802.1Q VLAN Screen 65
Chapter 9
Trunking....67
9.1 Trunking Overview 67
9.1.1 Distribution Criterion 67
9.2 Trunk Setting Screen 67
Chapter 10
Mirroring 69
10.1 Port Mirroring Settings 69
Chapter 11
QoS....71
11.1 QoS Overview 71
11.1.1 Weighted Round Robin (WRR) 71
11.1.2 Strict Priority 71
11.2 QoS Enhancement 72
11.3 Configuring QoS 72
11.3.1 Change Number of Queues 73
11.4 Advanced QoS Settings 74
11.4.1 Port Based QoS 74
11.4.2 DSCP Based QoS 75
11.4.3 Differentiated Services Code Point (DSCP) Overview 75
11.4.4 DSCP Based QoS Screen 75
11.4.5 ToS Based QoS 76
11.4.6 IP Address Based QoS 77
Chapter 12
Port Rate Limit and Storm Control....79
12.1 Port Rate Screen 79
12.1.1 Rate Limit Screen 80
12.1.2 Broadcast Storm Control Setup 81
Chapter 13
Level 2 (L2) Management 83
13.1 Configuring L2 Management 83
13.1.1 Add a Static MAC Address Entry 84
13.2 Viewing the L2 Address Table 84
Chapter 14
Cable Diagnostics....87
14.1 Diagnostics Overview 87
Chapter 15
Auto Denial of Service (DoS) 89
15.1 About Denial of Service Attacks 89
15.1.1 DoS Attacks Summary 89
15.2 Global Auto DoS Attack Prevention 90
15.3 Advanced Auto DoS Attack Prevention 90
Chapter 16
Auto VoIP 93
16.1 About Auto VoIP 93
16.2 Auto VoIP Settings 93
Part III: Management and Troubleshooting 95
Chapter 17
Event Logging 97
17.1 Event Logging Overview 97
17.2 Logging Screen 97
17.3 Logging - Add Server 98
17.4 Viewing RAM and Flash Logs 99
17.5 Searching RAM and Flash Logs .... 100
17.5.1 Search Results ...... 102
Chapter 18
SNMP....105
18.1 About SNMP 105
18.1.1 Supported MIBs 106
18.1.2 SNMP v3 and Authentication 106
18.1.3 SNMP EngineID 107
18.2 SNMP Group 107
18.2.1 SNMP Group - Create 108
18.2.2 SNMP Group - Modify 109
18.3 SNMP User 109
18.3.1 SNMP User - Create 110
18.3.2 SNMP User - Modify 111
18.4 SNMP Community 112
18.4.1 SNMP Community - Create 113
18.4.2 SNMP Community - Modify 113
18.5 SNMP Notification 114
18.6 SNMP Trap Station 115
18.6.1 SNMP Trap Station - Create 116
18.6.2 SNMP Trap Station - Modify 116
Chapter 19
RMON-Lite 119
19.1 RMON-Lite Overview 119
19.2 RMON Statistics : Overview 119
19.3 RMON-Lite Statistics : Port 120
19.4 RMON-Lite History MIB 122
19.4.1 RMON History Control : Overview 122
19.4.2 RMON History Control : Modify 123
19.4.3 RMON History Statistics : Overview 124
19.4.4 RMON History Statistics: Control 125
19.5 RMON Alarm: Overview 126
19.5.1 RMON Alarm : Create New Alarm 127
19.6 RMON Event : Overview 128
19.6.1 RMON Event Configuration Screens 129
19.7 RMON Event Log : Overview 130
19.7.1 RMON Event Log : Event 130
Chapter 20
Dynamic ARP 133
20.1 ARP Table Overview 133
20.1.1 ARP Table Entries 133
20.1.2 How Dynamic ARP Works 133
20.2 Enabling Dynamic ARP 133
20.3 Viewing ARP Table Entries 134
20.4 Adding ARP Table Entries 135
Chapter 21
Troubleshooting....137
21.1 Problems Starting Up the Switch 137
21.2 Problems Accessing the Switch 137
21.2.1 Pop-up Windows, JavaScripts and Java Permissions 137
Part IV: Appendices and Index .... 145
Appendix A Product Specifications....147
Appendix B IP Addresses and Subnetting 151
Appendix C Legal Information 159
Appendix D Customer Support....163
Index....167
List of Figures
Figure 1 Backbone Application ...... 27
Figure 2 Bridging Application 28
Figure 3 High Performance Switched Workgroup Application 29
Figure 4 Shared Server Using VLAN Example 29
Figure 5 Attaching Rubber Feet 31
Figure 6 Attaching the Mounting Brackets ...... 32
Figure 7 Mounting the Switch on a Rack 33
Figure 8 Front Panel 35
Figure 9 Transceiver Installation Example 36
Figure 10 Installed Transceiver 37
Figure 11 Opening the Transceiver's Latch Example 37
Figure 12 Transceiver Removal Example 37
Figure 13 Rear Panel - AC Model 38
Figure 14 Web Configurator: Login 44
Figure 15 Web Configurator Home Screen (System) 44
Figure 16 LED Panel 45
Figure 17 Change Administrator Login Password 47
Figure 18 Web Configurator: Logout Link 48
Figure 19 System 49
Figure 20 Configure IP Address 50
Figure 21 Configure L2 Table Aging .... 51
Figure 22 Restore Settings 51
Figure 23 Restore Configuration Error 52
Figure 24 System: Password 52
Figure 25 Firmware Upgrade 53
Figure 26 System: Restart/Reset 53
Figure 27 Port Status 55
Figure 28 Port Configuration 56
Figure 29 Statistics 59
Figure 30 Status: Port Details 60
Figure 31 VLAN: VLAN Status 64
Figure 32 VLAN: Create VLAN 65
Figure 33 VLAN: Edit VLAN 66
Figure 34 Trunk Setting 68
Figure 35 Mirror Setting 69
Figure 36 QoS Setting 72
Figure 37 Change Number of Queues 73
Figure 38 Port Based QoS 74
Figure 39 DSCP Based QoS 76
Figure 40 ToS Based QoS 77
Figure 41 IP Address Based QoS 78
Figure 42 Port Rate Limit 79
Figure 43 Rate Limit Configuration 80
Figure 44 Broadcast Storm Control 81
Figure 45 L2 Management 83
Figure 46 Add a Static MAC Entry 84
Figure 47 Display L2 Address Table 85
Figure 48 Cable Diagnostic 87
Figure 49 Global Auto DoS Attack Prevention 90
Figure 50 Advanced Auto DoS Attack Prevention 91
Figure 51 Auto VoIP Settings 94
Figure 52 Logging 98
Figure 53 Logging - Add Server 99
Figure 54 Logging - RAM/Flash 99
Figure 55 Searching - RAM/Flash Logs 101
Figure 56 Logs: Search Results .... 102
Figure 57 SNMP Management Model 105
Figure 58 SNMP EngineID 107
Figure 59 SNMP Group 107
Figure 60 SNMP Group - Create 108
Figure 61 SNMP Group - Modify 109
Figure 62 SNMP User 110
Figure 63 SNMP User - Create 110
Figure 64 SNMP User - Modify 111
Figure 65 SNMP Community 112
Figure 66 SNMP Community - Create ....113
Figure 67 SNMP Community - Modify 113
Figure 68 SNMP Notification ....114
Figure 69 SNMP Trap Station ....115
Figure 70 SNMP Trap Station - Create ....116
Figure 71 SNMP Trap Station - Modify 117
Figure 72 RMON Statistics : Overview 120
Figure 73 RMON Statistics : Port 121
Figure 74 RMON History Control : Overview. 122
Figure 75 RMON History Control : Modify 123
Figure 76 RMON History Statistics : Overview. 124
Figure 77 RMON History Statistics: Control 125
Figure 78 RMON Alarm: Overview. 126
Figure 79 RMON Alarm : Create New Alarm .... 127
Figure 80 RMON Event : Overview. 128
Figure 81 RMON Event Configuration Screens 129
Figure 82 RMON Event Log : Overview. 130
Figure 83 RMON Event Log : Event 131
Figure 84 Dynamic ARP 134
Figure 85 Viewing ARP Table Entries 135
Figure 86 Viewing ARP Table Entries 135
Figure 87 Pop-up Blocker .... 138
Figure 88 Internet Options ...... 139
Figure 89 Internet Options ...... 140
Figure 90 Pop-up Blocker Settings .... 140
Figure 91 Internet Options ...... 141
Figure 92 Security Settings - Java Scripting 142
Figure 93 Security Settings - Java 142
Figure 94 Java (Sun) 143
Figure 95 Network Number and Host ID 152
Figure 96 Subnetting Example: Before Subnetting 154
Figure 97 Subnetting Example: After Subnetting 155
List of Tables
Table 1 Panel Connections ...... 35
Table 2 LEDs 38
Table 3 LED Panel 45
Table 4 Navigation Panel Links 45
Table 5 System 49
Table 6 Configure IP Address 50
Table 7 Change Password 52
Table 8 Port Status 55
Table 9 Port Configuration 56
Table 10 Statistics ....59
Table 11 Status: Port Details 60
Table 12 VLAN: VLAN Status 64
Table 13 VLAN: Create VLAN 65
Table 14 VLAN: Edit VLAN 66
Table 15 Trunking: Configuration 68
Table 16 Mirror Setting 69
Table 17 QoS Setting 73
Table 18 Port Based QoS 74
Table 19 DSCP Based QoS 76
Table 20 ToS Based QoS 77
Table 21 IP Address Based QoS 78
Table 22 Rate Limit and Storm Control ...... 79
Table 23 Rate Limit Configuration 80
Table 24 Broadcast Storm Control 82
Table 25 L2 Management 83
Table 26 Add a Static MAC Entry 84
Table 27 Display L2 Address Table 85
Table 28 Cable Diagnostic 87
Table 29 DoS Attack Summary 89
Table 30 Global Auto DoS Attack Prevention 90
Table 31 Advanced Auto DoS Attack Prevention 91
Table 32 Auto VoIP Settings 94
Table 33 Logging 98
Table 34 Logging - Add Server 99
Table 35 Logging - RAM/Flash 100
Table 36 Searching - RAM/Flash Logs 102
Table 37 Logs: Search Results ...... 102
Table 38 SNMP Commands .... 106
Table 39 SNMP EngineID 107
Table 40 SNMP Group 107
Table 41 SNMP Group - Create 108
Table 42 SNMP Group - Modify 109
Table 43 SNMP User ....110
Table 44 SNMP User - Create 111
Table 45 SNMP User - Modify 111
Table 46 SNMP Community 112
Table 47 SNMP Community - Create ....113
Table 48 SNMP Community - Modify ....114
Table 49 SNMP Notification ....115
Table 50 SNMP Trap Station 115
Table 51 SNMP Trap Station - Create ....116
Table 52 SNMP Trap Station - Modify 117
Table 53 RMON Statistics : Overview 120
Table 54 RMON Statistics : Port 121
Table 55 RMON History Control : Overview. 123
Table 56 RMON History Control : Modify 123
Table 57 RMON History Statistics : Overview 124
Table 58 RMON History Statistics: Control 125
Table 59 RMON Alarm: Overview 126
Table 60 RMON Alarm : Create New Alarm 127
Table 61 RMON Event : Overview 128
Table 62 RMON Event Configuration Screens 129
Table 63 RMON Event Log : Overview 130
Table 64 RMON Event Log : Event 131
Table 65 ARP Table 134
Table 66 ARP Table 135
Table 67 ARP Table 136
Table 68 Troubleshooting the Start-Up of Your Switch 137
Table 69 Troubleshooting Accessing the Switch 137
Table 70 Firmware Features 147
Table 71 General Product Specifications .... 148
Table 72 Management Specifications .... 149
Table 73 Physical and Environmental Specifications .... 149
Table 74 Subnet Mask Example 152
Table 75 Subnet Masks 153
Table 76 Maximum Host Numbers ...... 153
Table 77 Alternative Subnet Mask Notation ...... 153
Table 78 Subnet 1 155
Table 79 Subnet 2 .... 156
Table 80 Subnet 3 156
Table 81 Subnet 4 ...... 156
Table 82 Eight Subnets ...... 156
Table 83 24-bit Network Number Subnet Planning .... 157
Table 84 16-bit Network Number Subnet Planning .... 157
PART I
Introduction and
Hardware Overview
Getting to Know Your Switch (27)
Hardware Installation and Connection (31)
Hardware Overview (35)
Getting to Know Your Switch
This chapter introduces the main features and applications of the switch.
1.1 Introduction
The ES-1528 is an Ethernet switch with 24 10/100Mbps ports, two RJ-45 Gigabit ports for stacking and 2 mini-GBIC slots for fiber connections.
With its built-in web configurator, managing and configuring the switch is easy.
See Appendix A on page 147 for a full list of software features available on the switch.
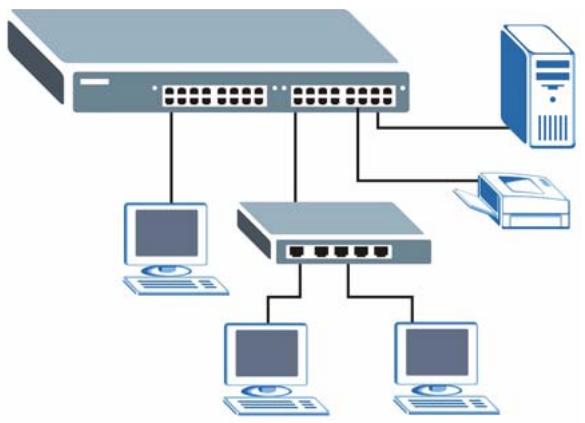
1.1.1 Backbone Application
The switch is an ideal solution for small networks where rapid growth can be expected in the near future. The switch can be used standalone for a group of heavy traffic users. You can connect computers and servers directly to the switch's port or connect other switches to the switch.
In this example, all computers can share high-speed applications on the server. To expand the network, simply add more networking devices such as switches, routers, computers, print servers etc.
Figure 1 Backbone Application
flowchart
graph TD
    A["Server"] --> B["Switch"]
    A --> C["Switch"]
    A --> D["Switch"]
    B --> E["Desktop"]
    C --> F["Desktop"]
    C --> G["Desktop"]
    D --> H["Desktop"]
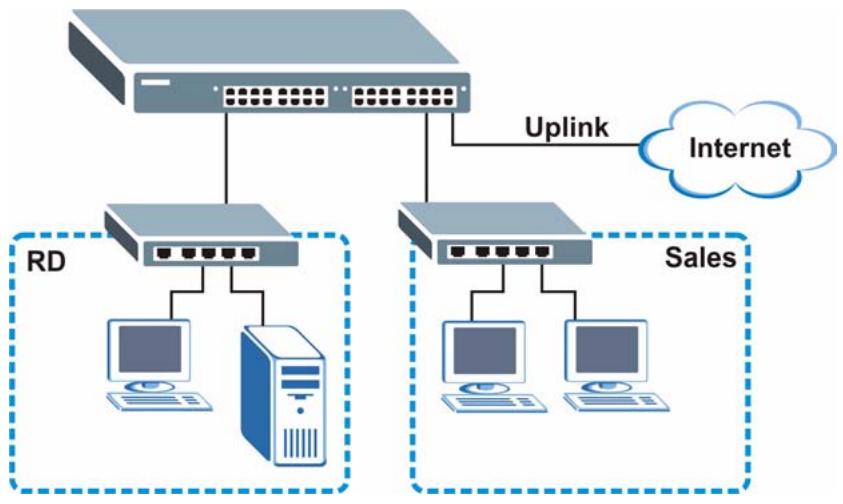
1.1.2 Bridging Example
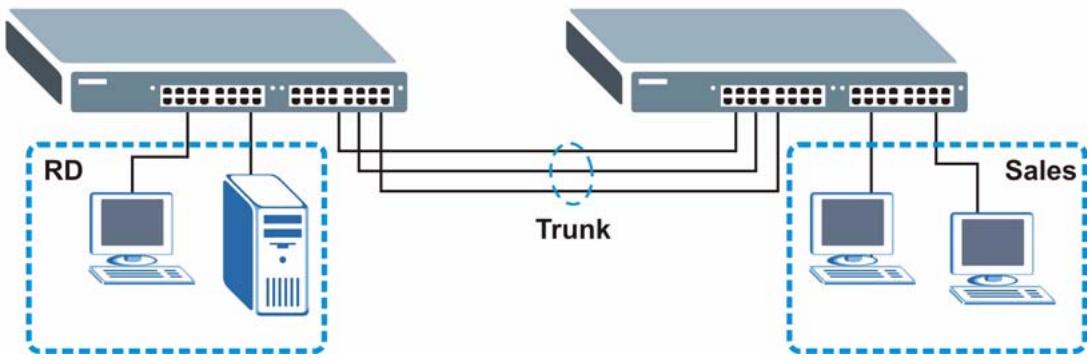
In this example application the switch connects different company departments (RD and Sales) to the corporate backbone. It can alleviate bandwidth contention and eliminate server and network bottlenecks. All users that need high bandwidth can connect to high-speed department servers via the switch. You can provide a super-fast uplink connection by using a Gigabit Ethernet/mini-GBIC port on the switch.
Moreover, the switch eases supervision and maintenance by allowing network managers to centralize multiple servers at a single location.
Figure 2 Bridging Application
flowchart
graph TD
    A["Router"] -->|Uplink| B["Internet"]
    C["Router"] -->|Uplink| B["Internet"]
    D["Desktop"] -->|RD| E["Computer 1"]
    D["Desktop"] -->|RD| F["Computer 2"]
    G["Desktop"] -->|Sales| H["Computer 1"]
    G["Desktop"] -->|Sales| I["Computer 2"]
1.1.3 High Performance Switching Example
The switch is ideal for connecting two networks that need high bandwidth. In the following example, use trunking to connect these two networks.
Switching to higher-speed LANs such as ATM (Asynchronous Transmission Mode) is not feasible for most people due to the expense of replacing all existing Ethernet cables and adapter cards, restructuring your network and complex maintenance. The switch can provide the same bandwidth as ATM at much lower cost while still being able to use existing adapters and switches. Moreover, the current LAN structure can be retained as all ports can freely communicate with each other.
Figure 3 High Performance Switched Workgroup Application
flowchart
graph TD
    A["Host 1"] -->|RD| B["Host 2"]
    B --> C["Trunk"]
    C --> D["Host 1"]
    D -->|Sales| E["Host 2"]
    E --> F["Trunk"]
    F --> G["Host 1"]
    G --> H["Host 2"]
    H --> I["Trunk"]
    I --> J["Host 1"]
    style A fill:#f9f,stroke:#333
    style B fill:#f9f,stroke:#333
    style C fill:#ccf,stroke:#333
    style D fill:#ccf,stroke:#333
    style E fill:#ccf,stroke:#333
    style F fill:#ccf,stroke:#333
    style G fill:#ccf,stroke:#333
    style H fill:#ccf,stroke:#333
    style I fill:#ccf,stroke:#333
    style J fill:#ccf,stroke:#333
1.1.4 IEEE 802.1Q VLAN Application Examples
A VLAN (Virtual Local Area Network) allows a physical network to be partitioned into multiple logical networks. Stations on a logical network belong to one group. A station can belong to more than one group. With VLAN, a station cannot directly talk to or hear from stations that are not in the same group(s) unless such traffic first goes through a router.
For more information on VLANs, refer to Chapter 8 on page 63.
1.1.4.1 Tag-based VLAN Example
Ports in the same VLAN group share the same frame broadcast domain thus increase network performance through reduced broadcast traffic. VLAN groups can be modified at any time by adding, moving or changing ports without any re-cabling.
Shared resources such as a server can be used by all ports in the same VLAN as the server. In the following figure only ports that need access to the server need to be part of VLAN 1. Ports can belong to other VLAN groups too.
Figure 4 Shared Server Using VLAN Example

flowchart
graph TD
    A["Server"] --> B["VLAN 1"]
    A --> C["VLAN 1"]
    A --> D["VLAN 1"]
    A --> E["VLAN 1"]
    A --> F["VLAN 1"]
    A --> G["VLAN 1"]
    A --> H["VLAN 1"]
    A --> I["VLAN 1"]
    A --> J["VLAN 1"]
    A --> K["VLAN 1"]
    A --> L["VLAN 1"]
    A --> M["VLAN 1"]
    A --> N["VLAN 1"]
    A --> O["VLAN 1"]
    A --> P["VLAN 1"]
    A --> Q["VLAN 1"]
    A --> R["VLAN 1"]
    A --> S["VLAN 1"]
    A --> T["VLAN 1"]
    A --> U["VLAN 1"]
    A --> V["VLAN 1"]
    A --> W["VLAN 1"]
    A --> X["VLAN 1"]
    A --> Y["VLAN 1"]
    A --> Z["VLAN 1"]
    A --> AA["VLAN 1"]
    A --> AB["VLAN 1"]
    A --> AC["VLAN 1"]
    A --> AD["VLAN 1"]
    A --> AE["VLAN 1"]
    A --> AF["VLAN 1"]
    A --> AG["VLAN 1"]
    A --> AH["VLAN 1"]
    A --> AI["VLAN 1"]
    A --> AJ["VLAN 1"]
    A --> AK["VLAN 1"]
    A --> AL["VLAN 1"]
    A --> AM["VLAN 1"]
    A --> AN["VLAN 1"]
    A --> AO["VLAN 1"]
    A --> AP["VLAN 1"]
    A --> AQ["VLAN 1"]
    A --> AR["VLAN 1"]
    A --> AS["VLAN 1"]
    A --> AT["VLAN 1"]
    A --> AU["VLAN 1"]
    A --> AV["VLAN 1"]
    A --> AW["VLAN 1"]
    A --> AX["VLAN 1"]
    A --> AY["VLAN 1"]
    A --> AZ["VLAN 1"]
Hardware Installation and Connection
This chapter shows you how to install and connect the switch.
2.1 Freestanding Installation
1 Make sure the switch is clean and dry.
2 Set the switch on a smooth, level surface strong enough to support the weight of the switch and the connected cables. Make sure there is a power outlet nearby.
3 Make sure there is enough clearance around the switch to allow air circulation and the attachment of cables and the power cord.
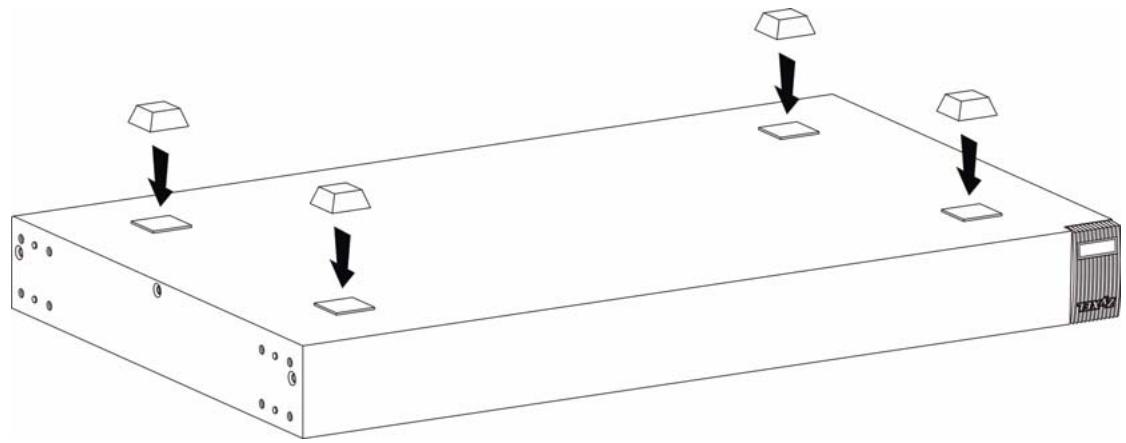
4 Remove the adhesive backing from the rubber feet.
5 Attach the rubber feet to each corner on the bottom of the switch. These rubber feet help protect the switch from shock or vibration and ensure space between devices when stacking.
Figure 5 Attaching Rubber Feet
natural_image
Isometric line drawing of a rectangular electronic device with four square components and downward arrows indicating flow or movement (no text or symbols)
Do NOT block the ventilation holes. Leave space between devices when stacking.
For proper ventilation, allow at least 4 inches (10 cm) of clearance at the front and 3.4 inches (8 cm) at the back of the switch. This is especially important for enclosed rack installations.
2.2 Mounting the Switch on a Rack
This section lists the rack mounting requirements and precautions and describes the installation steps.
2.2.1 Rack-mounted Installation Requirements
- Two mounting brackets.
- Eight M3 flat head screws and a #2 Philips screwdriver.
- Four M5 flat head screws and a #2 Philips screwdriver.

Failure to use the proper screws may damage the unit.
2.2.1.1 Precautions
- Make sure the rack will safely support the combined weight of all the equipment it contains.
- Make sure the position of the switch does not make the rack unstable or top-heavy. Take all necessary precautions to anchor the rack securely before installing the unit.
2.2.2 Attaching the Mounting Brackets to the Switch
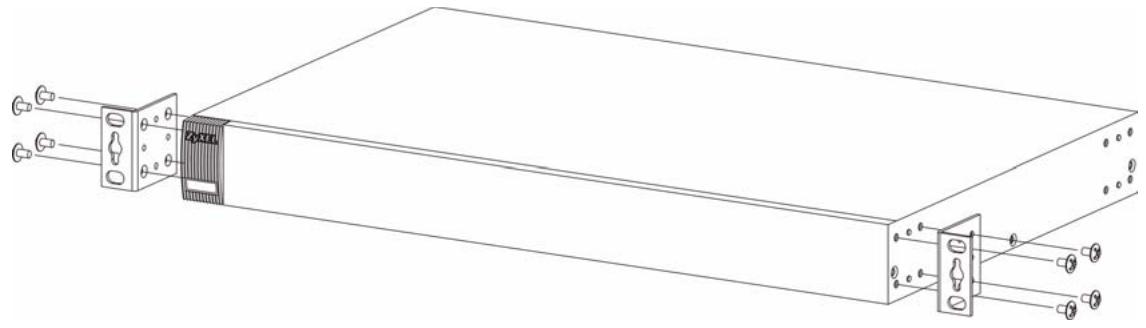
1 Position a mounting bracket on one side of the switch, lining up the four screw holes on the bracket with the screw holes on the side of the switch.
Figure 6 Attaching the Mounting Brackets
natural_image
Technical line drawing of a rectangular electronic device with two connectors and three terminal ports (no text or symbols)2 Using a #2 Philips screwdriver, install the M3 flat head screws through the mounting bracket holes into the switch.
3 Repeat steps 1 and 2 to install the second mounting bracket on the other side of the switch.
4 You may now mount the switch on a rack. Proceed to the next section.
2.2.3 Mounting the Switch on a Rack
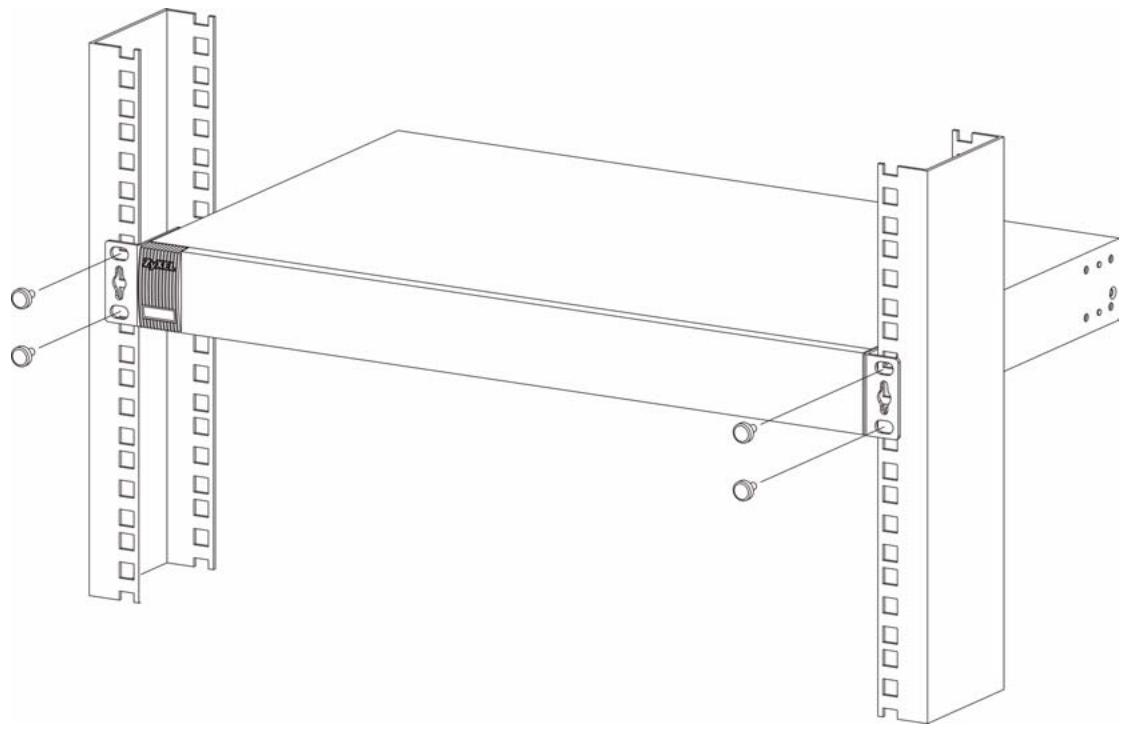
1 Position a mounting bracket (that is already attached to the switch) on one side of the rack, lining up the two screw holes on the bracket with the screw holes on the side of the rack.
Figure 7 Mounting the Switch on a Rack
natural_image
Technical line drawing of a server rack with two vertical panels and a central connector (no text or symbols)2 Using a #2 Philips screwdriver, install the M5 flat head screws through the mounting bracket holes into the rack.
3 Repeat steps 1 and 2 to attach the second mounting bracket on the other side of the rack.
Hardware Overview
This chapter describes the front panel and rear panel of the switch and shows you how to make the hardware connections.
3.1 Panel Connections and the RESET Button
The figure below shows the front panel of the switch.
Figure 8 Front Panel
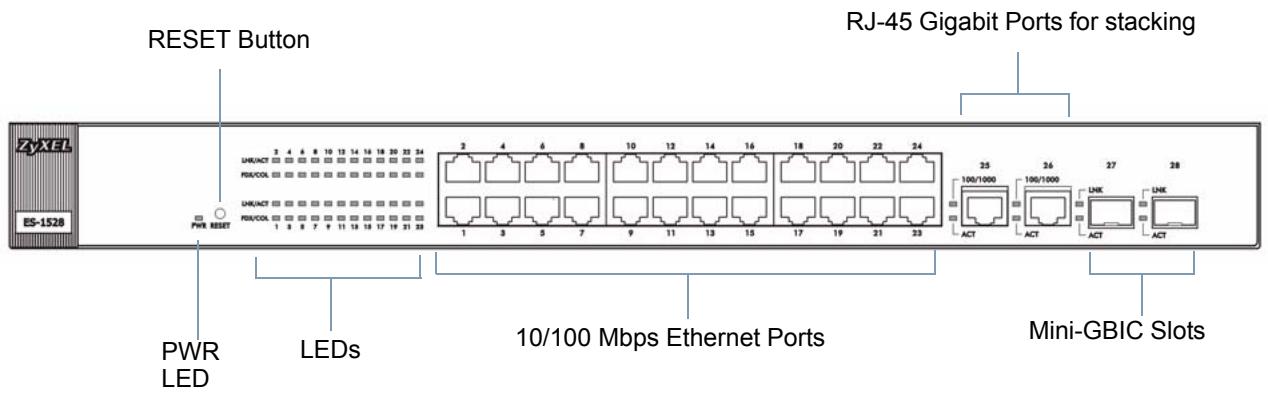
The following table describes the ports on the panels.
Table 1 Panel Connections
| CONNECTOR | DESCRIPTION |
| 24 10/100 Mbps RJ-45 Ethernet Ports | Connect these ports to a computer, a hub, an Ethernet switch or router. |
| Two 100/1000 Mbps RJ-45 Gigabit Ports | Connect these Gigabit Ethernet ports to high-bandwidth backbone network Ethernet switches or use them to daisy-chain other switches. |
| 2 Mini-GBIC Slots | Use mini-GBIC transceivers in these slots for fiber-optic connections to backbone Ethernet switches. |
3.1.1 Ethernet Ports
The switch has 24 10/100Mbps auto-negotiating, auto-crossover Ethernet ports. In 10/100Mbps Fast Ethernet, the speed can be 10Mbps or 100Mbps and the duplex mode can be half duplex or full duplex.
There are two Gigabit Ethernet ports. The speed of the Gigabit Ethernet ports can be 10 Mbps, 100Mbps or 1000Mbps and the duplex mode can be half duplex (at 100 Mbps) or full duplex.
An auto-negotiating port can detect and adjust to the optimum Ethernet speed (100/1000Mpbs) and duplex mode (full duplex or half duplex) of the connected device.
An auto-crossover (auto-MDI/MDI-X) port automatically works with a straight-through or crossover Ethernet cable.
3.1.1.1 Default Ethernet Settings
The factory default negotiation settings for the Ethernet ports on the switch are:
- Speed: Auto
- Duplex: Auto
- Flow control: Off
3.1.2 Mini-GBIC Slots
There are two mini-GBIC (Gigabit Interface Converter) slots for mini-GBIC transceivers. A transceiver is a single unit that houses a transmitter and a receiver. The switch does not come with transceivers. You must use transceivers that comply with the SFP Transceiver MultiSource Agreement (MSA). See the SFF committee's INF-8074i specification Rev 1.0 for details.
You can change transceivers while the switch is operating. You can use different transceivers to connect to Ethernet switches with different types of fiber-optic connectors.
• Type: SFP connection interface
- Connection speed: 1 Gigabit per second (Gbps)

To avoid possible eye injury, do not look into an operating fiber-optic module's connectors.
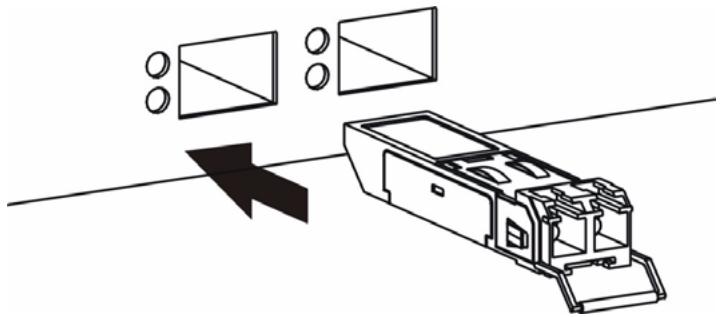
3.1.2.1 Transceiver Installation
Use the following steps to install a mini GBIC transceiver (SFP module).
1 Insert the transceiver into the slot with the exposed section of PCB board facing down.
Figure 9 Transceiver Installation Example
natural_image
Diagram of a device with circular components and an arrow indicating direction (no text or symbols)2 Press the transceiver firmly until it clicks into place.
3 The switch automatically detects the installed transceiver. Check the LEDs to verify that it is functioning properly.
Figure 10 Installed Transceiver

natural_image
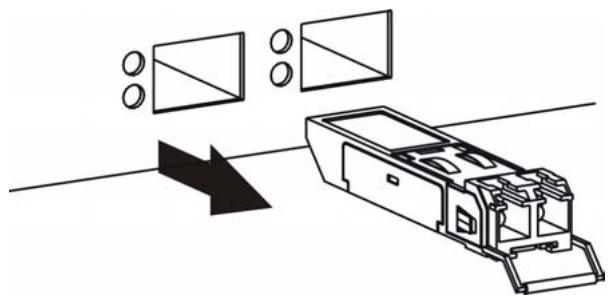
Technical line drawing of a mechanical assembly with circular components and a rectangular component (no text or symbols)3.1.2.2 Transceiver Removal
Use the following steps to remove a mini GBIC transceiver (SFP module).
1 Open the transceiver's latch (latch styles vary).
Figure 11 Opening the Transceiver's Latch Example

natural_image
Diagram of a mechanical device with a curved arrow indicating motion or force, no text or symbols present2 Pull the transceiver out of the slot.
Figure 12 Transceiver Removal Example
natural_image
Diagram showing a device with circular components and an arrow indicating direction (no text or symbols)3.2 The RESET Button
The switch allows you to reset the switch to its factory default configuration via the RESET button. Press the RESET button for one second and release. The switch automatically reboots and reloads its factory default configuration file.

When you use the RESET button all of your configuration settings will be lost. Use the default IP address (192.168.1.1) and user name (admin) and password (admin) to log back into the switch. It may take up to 2 minutes for the switch to restart when you reload the default configuration file.
3.3 Rear Panel
The following figures show the rear panels of the AC power input model switch. The rear panel contains a connector for the power receptacle.
Figure 13 Rear Panel - AC Model
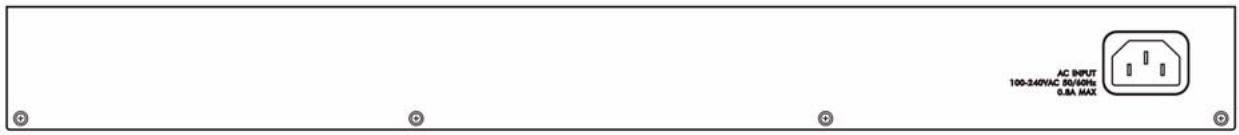
3.3.1 Power Connector
Make sure you are using the correct power source as shown on the panel.
To connect the power to the switch, insert the female end of power cord to the power receptacle on the rear panel. Connect the other end of the supplied power cord to a 100\~240V AC, 1.5A power outlet.
3.4 LEDs
The following table describes the LEDs.
Table 2 LEDs
| LED | COLOR | STATUS | DESCRIPTION |
| PWR | Green | On | The system is turned on. |
| Off | The system is off. | ||
| 10/100 Mbps Ethernet Ports | |||
| LNK/ACT | Amber | Blinking | The system is transmitting/receiving to/from a 10/100 Mbps Ethernet network. |
| On | The link to a 10/100 Mbps Ethernet network is up. | ||
| Off | The link to an Ethernet network is down. | ||
| FDX/COL | Amber | On | The Ethernet port is negotiating in full-duplex mode. |
| Blinking | The switch is detecting collisions on the Ethernet port. | ||
| Off | The Ethernet port is negotiating in half-duplex mode. | ||
| Gigabit Ethernet Ports | |||
| 100/1000 | Green | On | The link to a 10/1000 Mbps Ethernet network is up. |
| Amber | On | The link to a 100 Mbps Ethernet network is up. | |
| Off | The link to an Ethernet network is down. | ||
| ACT | Green | On | The link to an Ethernet network is up. |
| Blinking | The Ethernet port is transmitting/receiving data. | ||
| Off | The link to an Ethernet network is down. | ||
| GBIC Slots | |||
| LNK | Green | On | The port has a successful connection. |
| Off | No Ethernet device is connected to this port. | ||
| ACT | Green | Blinking | The port is receiving or transmitting data. |
PART II
Basic & Advanced Settings
The Web Configurator (43)
System (49)
Port Settings (55)
System and Port Statistics (59)
VLAN (63)
Trunking (67)
Mirroring (69)
QoS (71)
Port Rate Limit and Storm Control (79)
Level 2 (L2) Management (83)
Cable Diagnostics (87)
Auto Denial of Service (DoS) (89)
Auto VoIP (93)
The Web Configurator
This section introduces the configuration and functions of the web configurator.
4.1 Introduction
The web configurator is an HTML-based management interface that allows easy switch setup and management via Internet browser. Use Internet Explorer 6.0 and later or Netscape Navigator 7.0 and later versions. The recommended screen resolution is 1024 by 768 pixels.
In order to use the web configurator you need to allow:
- Web browser pop-up windows from your device. Web pop-up blocking is enabled by default in Windows XP SP (Service Pack) 2.
- JavaScript (enabled by default).
- Java permissions (enabled by default).
4.2 System Login
1 Start your web browser.
2 Type “http://” and the IP address of the switch (for example, the default is 192.168.1.1) in the Location or Address field. Press [ENTER].
3 The login screen appears. The default username is admin and associated default password is admin.
Figure 14 Web Configurator: Login
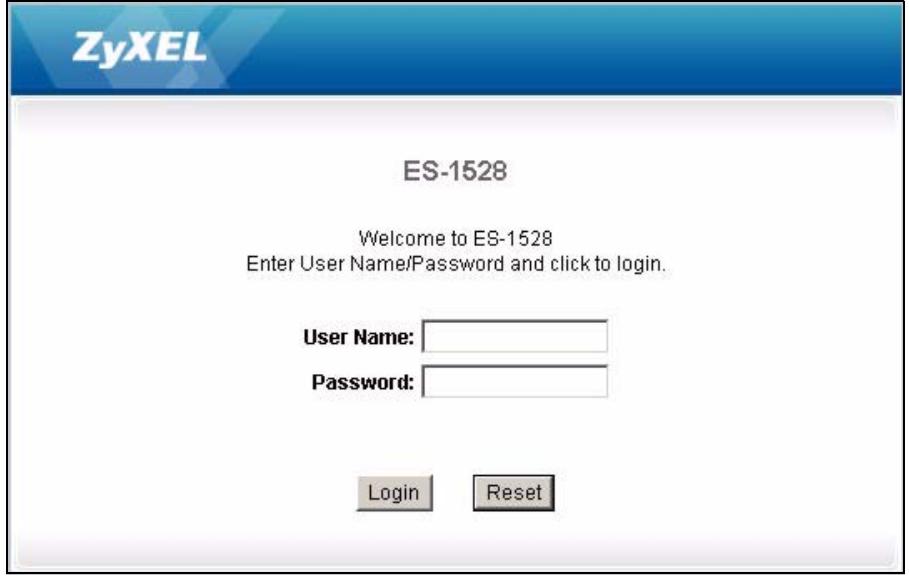
4 Click LOGIN to view the first web configurator screen.
4.3 The Status Screen
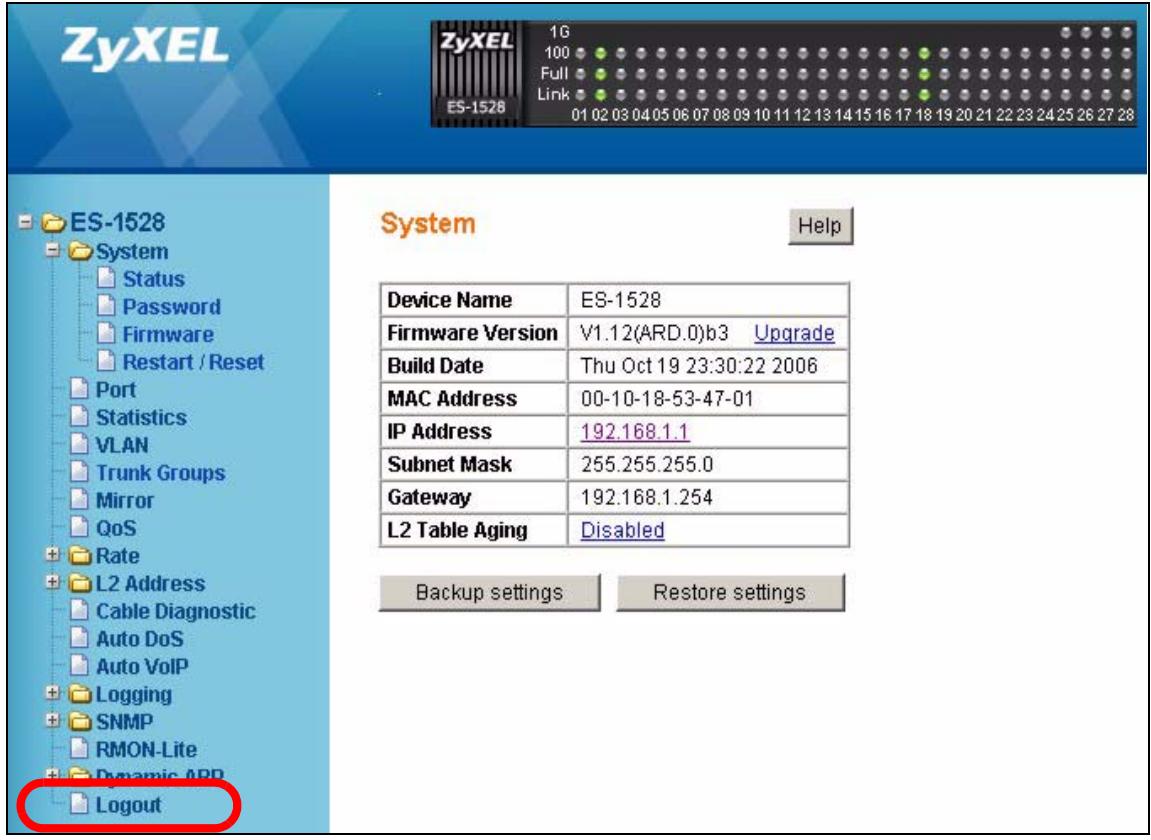
The System screen is the first screen that displays when you access the web configurator. The following figure shows the navigating components of the web configurator screen.
Figure 15 Web Configurator Home Screen (System)
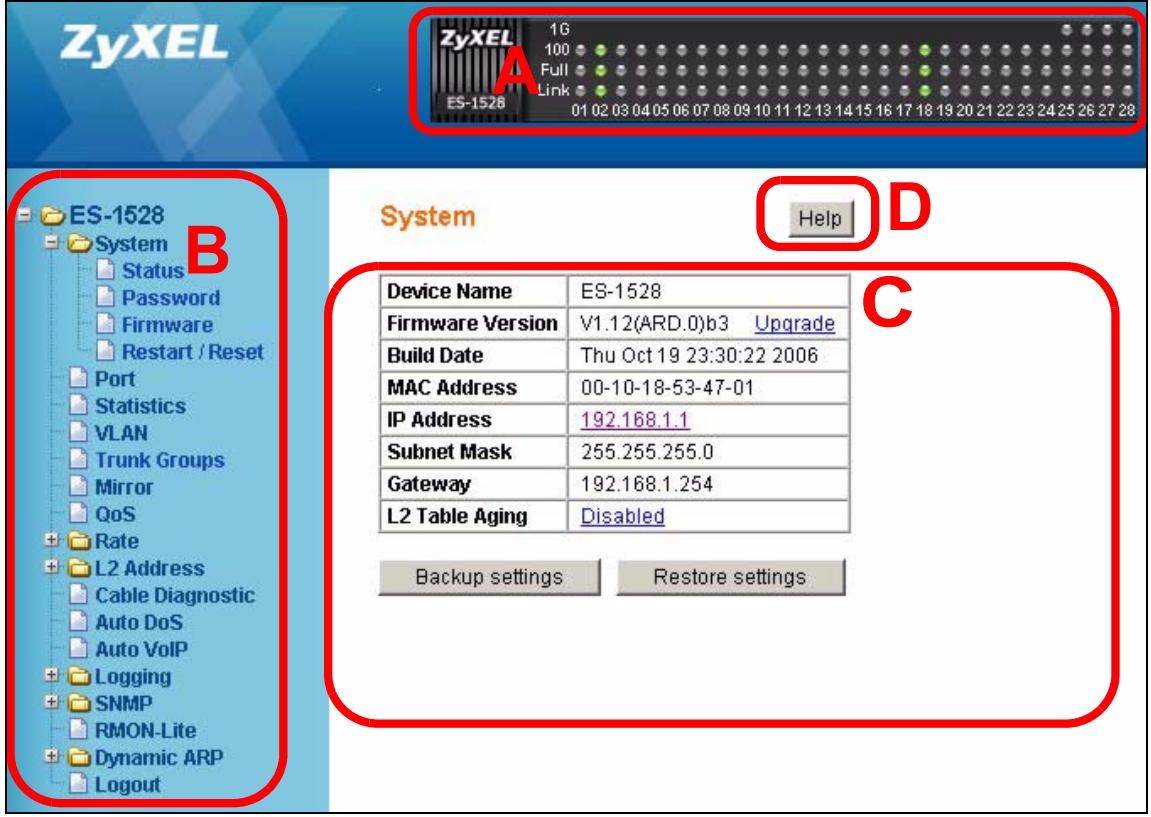
A - The LED panel displays the port status.
B - The navigation panel has links to screens that let you configure the switch features.
C - The function frame allows you to view and edit individual feature settings.
D - Use the Help link to find out more information about the fields in the screen you are configuring.
4.3.1 The LED Panel
Use the LED panel to view the status of the individual ports. The LED panel in the web configurator updates automatically every 5 seconds.
Figure 16 LED Panel
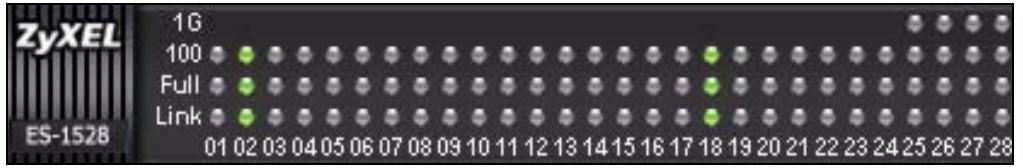
The following table describes the labels in this screen.
Table 3 LED Panel
| LABEL | DESCRIPTION |
| 1G | This LED is green if the corresponding port has a 1 Gbps connection. |
| 100 | This LED is green if the corresponding port has a 100 Mbps connection. |
| Full | This LED is green if the corresponding port is transmitting in full duplex mode. |
| Link | This LED is green if the corresponding port has an Ethernet connection. It is orange if the port has been disabled. |
| 1...28 | This number indicates the port number on the switch. |
4.3.2 The Navigation Panel
Navigate to individual feature configuration screens from the navigation panel.
The following table describes the links in the navigation panel.
Table 4 Navigation Panel Links
| LINK | DESCRIPTION |
| System | Use these screens to view general system information such as firmware version, IP address and so on. You can also use this screen to backup and restore your configuration. |
| Status | Use this screen to view general system and hardware monitoring information. |
| Password | Use this screen to change the system login password |
| Firmware | Use this screen to perform firmware upgrades |
| Restart/Reset | Use this screen to reboot the switch or to restore the default configuration of the switch. |
| Port | Use these screens to view the status and configure settings for individual ports on the switch. |
| Statistics | Use these screen to view system statistics such as the number of packets received on the switch, collisions and errors and to view statistics for individual ports on the switch. |
| VLAN | Use these screens to create new IEEE 802.1Q VLANs as well as view the status and edit existing IEEE 802.1Q VLANs on the switch. |
| Trunk Groups | Use these screens to create trunk groups and add/remove ports from existing trunk groups. |
| Mirror | Use this screen to copy traffic from one port or ports to another port in order that you can examine the traffic from the first port without interference. |
| QoS | Use these screens to configure queuing with associated queue weights for the switch. |
| Rate | Use these screens to specify bandwidth limits and storm control limits for the switch. |
| Port Rate | Use this screen to cap the maximum bandwidth allowed from specified source(s) to specified destination(s). |
| Storm Control | Use this screen to cap the rate of broadcast, multicast and unknown unicast packets the switch will allow on individual ports. |
| L2 Address | Use these screens to view and manage the MAC address table. |
| Management | Use this screen to add, delete or look up MAC addresses in the MAC address table. |
| Display | Use this screen to view the entries in the MAC address table. |
| Cable Diagnostic | Use this screen to perform cable testing on individual ports. |
| Auto DoS | Use these screens to activate security features against Denial of Service (DoS) attacks. |
| Auto VoIP | Use these screens to configure settings that automatically give higher priority to Voice over Internet Protocol (VoIP) traffic. |
| Logging | Use these screens to configure log settings and view system logs. |
| Settings | Use this screen to configure which events the switch should log. |
| RAM Logs | Use this screen to configure logs which are saved to volatile memory. These logs are cleared when the switch is rebooted. |
| Flash Logs | Use this screen to configure logs which are saved to non-volatile memory. You can view these logs even after a switch is rebooted. |
| SNMP | Use these screens to configure SNMP management settings. |
| Engine ID | Use this screen to configure SNMP engine ID. |
| Group | Use this screen to configure groups with different access rights for SNMP management. |
| User | Use this screen to create users and assign them to pre-defined SNMP groups. |
| Community | Use this screen to define security parameters for SNMP v1 and SNMP v2c. |
| Trap Station | Use this screen to configure settings that define when notifications are sent to an external management station. |
| RMON-Lite | Use this screen to configure Remote Network Monitoring Management Information Base (RMON MIB) settings. |
| Dynamic ARP | Use these screens to enable and configure ARP table settings. |
| Settings | Use this screen to configure ARP table settings. |
| ARP Entries | Use this screen to enter and view MAC address to IP address mappings. |
| Logout | Click this to logout of the web configurator. |
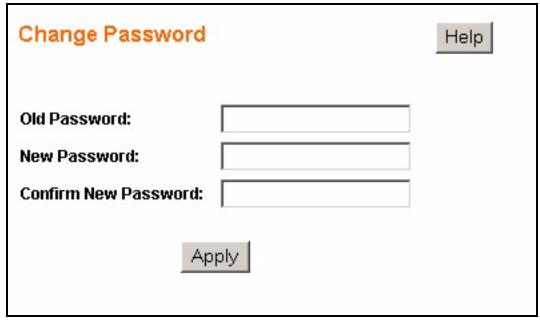
4.3.3 Change Your Password
After you log in for the first time, it is recommended you change the default administrator password. Click System, Password to display the next screen.
Figure 17 Change Administrator Login Password
4.4 Saving Your Configuration
When you are done modifying the settings in a screen, click Apply to save your changes back to the switch.
4.5 Switch Lockout
You could block yourself (and all others) from using the web configurator if you:
1 Remove all the ports from the default VLAN (default is VLAN 1) when no other VLANs exist.
2 Disable all ports.
3 Forget the password and/or IP address.
4 Enable Dynamic ARP without entering the proper MAC to IP address binding.
4.6 Resetting the Switch
If you lock yourself (and others) from the switch or forget the administrator password, you will need to reset the switch back to the factory defaults.
Use the RESET button on the front panel of the switch to reset the switch back to factory defaults. Press and hold the RESET button for one second. The switch will reload its factory defaults.
The switch is now reinitialized with a default configuration file including the default administrator username (admin) and password (admin). The IP address of the switch also reverts to the default 192.168.1.1.
4.7 Logging Out of the Web Configurator
Click Logout in the navigation panel to exit the web configurator. You have to log in with your password again after you log out. This is recommended after you finish a management session for security reasons.
Figure 18 Web Configurator: Logout Link
4.8 Help
The web configurator's online help has descriptions of individual screens and some supplementary information.
Click the Help link from a web configurator screen to view an online help description of that screen.
This chapter describes the system screens.
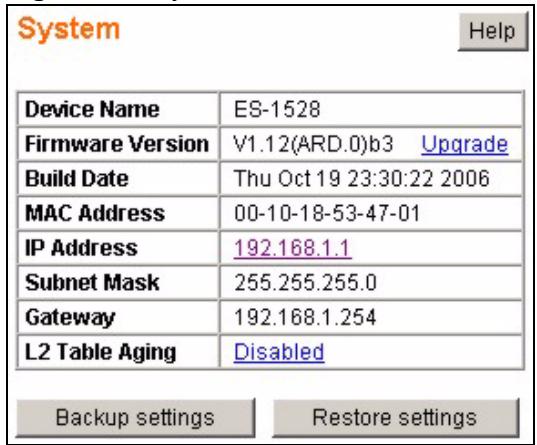
5.1 System Screen
The home screen of the web configurator displays general system information and allows you to perform system maintenance. Click System > Status in the navigation panel to view device specific information such as system name, firmware version and so on.
Figure 19 System
The following table describes the labels in this screen.
Table 5 System
| LABEL | DESCRIPTION |
| Device Name | This read-only field displays the name of your switch. |
| Firmware Version | This field displays the version number of the switch 's current firmware. Click Upgrade to go to the firmware upgrade screen. See Section 5.3 on page 52. |
| Build Date | This field displays the date of the currently installed firmware. |
| MAC Address | This field displays the MAC address of the switch. |
| IP Address | This field indicates the IP address of the switch.Note: You can click the existing IP address to change it. See Section 5.1.1 on page 50. |
| Subnet Mask | This field indicates the subnet mask of the switch. |
| Gateway | This field indicates the IP address of the default gateway. |
| L2 Table Aging | This field displays whether the L2 Table Aging is enabled or disabled. Click Enabled/Disabled to change the L2 Table Aging settings. |
| Backup settings | Click this link to create and save a backup configuration file. See Section 5.1.3 on page 51. |
| Restore settings | Click this link to upload an existing configuration file to the switch. See Section 5.1.4 on page 51. |
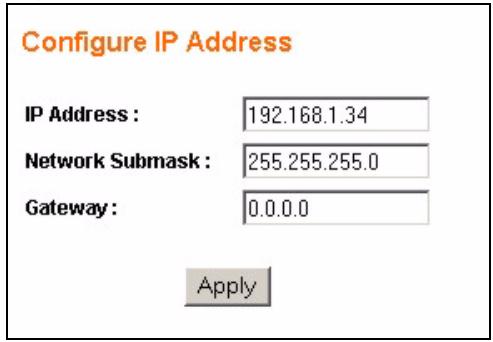
5.1.1 Configure IP Address
Use the Configure IP Address screen to set up the IP address manually. The following screen appears when you click the existing IP address in the System > Status screen.
Figure 20 Configure IP Address
The following table describes the labels in this screen.
Table 6 Configure IP Address
| LABEL | DESCRIPTION |
| IP Address | Enter the IP address of your switch in dotted decimal notation. For example, 192.168.1.1. |
| Network Submask | Enter the IP subnet mask of your switch in dotted decimal notation for example 255.255.255.0. |
| Gateway | Enter the IP address of the default outgoing gateway in dotted decimal notation, for example 192.168.1.5. |
5.1.2 Level 2 (L2) Table Aging
L2 Table Aging defines the aging time of the Address Resolution Logic (ARL) table. This table learns and remembers MAC addresses of devices sending information through it. See Chapter 13 on page 83 for more background information. Click the link in the L2 Table Aging field to see the screen as shown next.
Figure 21 Configure L2 Table Aging
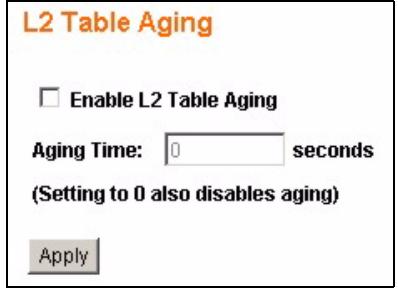
Select the Enable L2 Table Aging checkbox and enter the amount of time in seconds (up to 1048575) that the switch remembers MAC address entries. Select “0” to disable L2 table aging. Click Apply to save your configuration changes.
5.1.3 Backup Settings
Backing up your switch configurations allows you to create various “snap shots” of your device from which you may restore at a later date.
Back up your current switch configuration to a computer using the Backup Settings link.
Follow the steps below to back up the current switch configuration.
1 Click Backup.
2 Click Save to display the Save As screen.
3 Choose a location to save the file on your computer from the Save in drop-down list box and type a descriptive name for it in the File name list box. Click Save to save the configuration file to your computer.
Restore a previously saved configuration from your computer to the switch using the Restore Settings screen.
Figure 22 Restore Settings
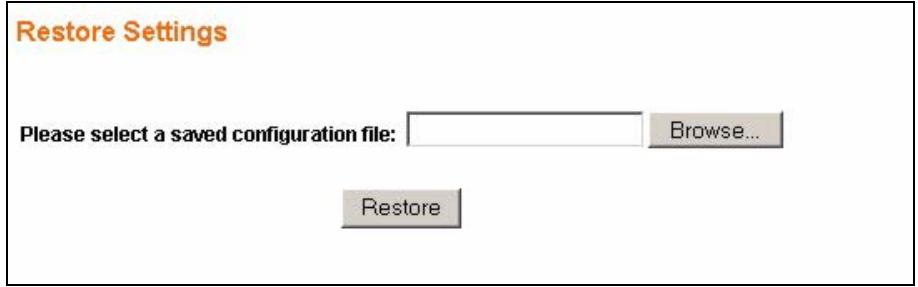
Type the path and file name of the configuration file you wish to restore in the Please select a saved configuration file text box or click Browse to display the Choose File screen from which you can locate it. After you have specified the file, click Restore.
Make sure you are using the proper configuration when you are restoring your configuration. The file name extension should be “.cfg”. If you attempt to restore a wrong configuration file the following error message appears.
Figure 23 Restore Configuration Error
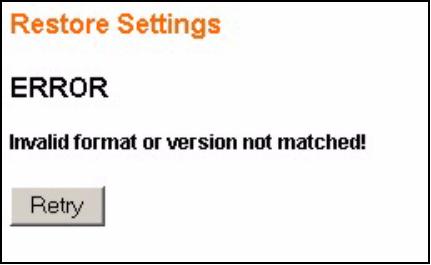
You can click Retry to locate the proper configuration file.
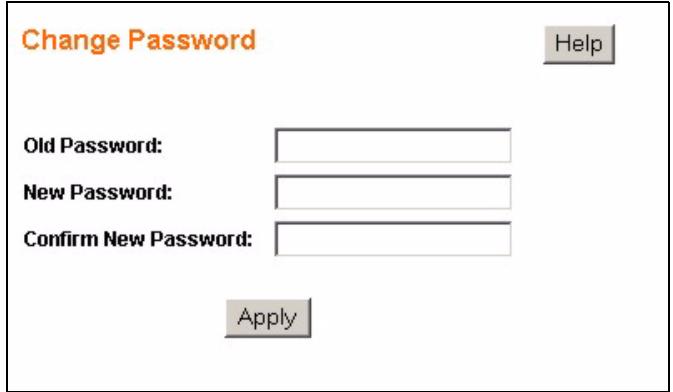
5.2 System: Change Password
Use the Change Password screen to change the administrator username and password for the switch. Click System > Password to view the screen as shown.
Figure 24 System: Password
The following table describes the labels in this screen.
Table 7 Change Password
| LABEL | DESCRIPTION |
| Old Password | Type the existing system password (admin is the default password when shipped). |
| New Password | Enter your new system password. Enter up to 15 alpha-numeric characters; spaces are allowed. |
| Confirm New Password | Retype your new system password for confirmation |
5.3 Firmware Upgrade
Make sure you have downloaded (and unzipped) the correct model firmware and version to your computer before uploading to the device.

Be sure to upload the correct model firmware as uploading the wrong model firmware may damage your device.
From the System screen, click Upgrade in the Firmware Version field to display the screen as shown next.
Figure 25 Firmware Upgrade
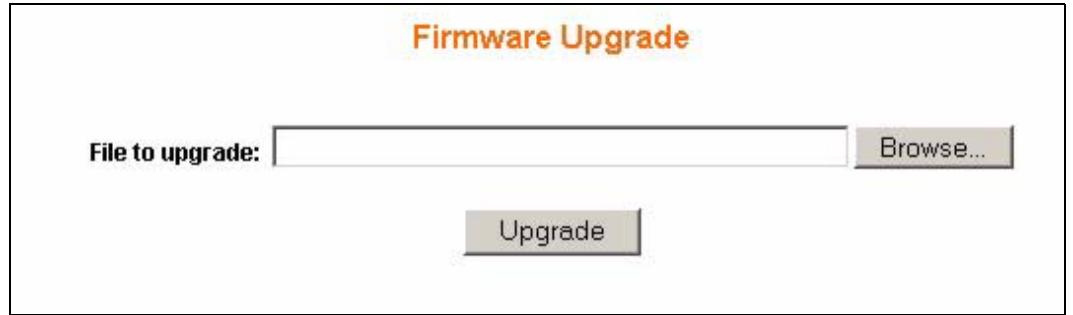
Type the path and file name of the firmware file you wish to upload to the switch in the File Path text box or click Browse to locate it. After you have specified the file, click Upgrade.
After the firmware upgrade process is complete, see the System > Status screen to verify your current firmware version number.
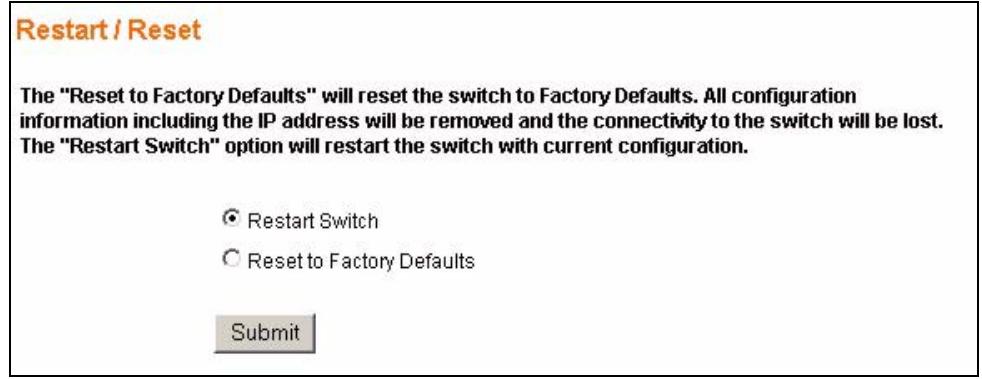
Click System > Restart/Reset to perform a system restart (keep current configuration) or a system reset (restore the switch's default configuration settings). Follow the instructions in the screen below to reset or restart the switch.
Figure 26 System: Restart/Reset
Port Settings
This chapter describes how to view and configure the port settings on the switch.
6.1 Port Status
Use this screen to view switch port settings. Click System > Port in the navigation panel to display the Port Status screen.
Figure 27 Port Status
| Port | Link Status | Speed Duplex | Flow Control | PVID | Port | Link Status | Speed Duplex | Flow Control | PVID |
| 01 | Down | - | - | 1 | 15 | Down | - | - | 1 |
| 02 | Up | 100Mbps Full | Disabled | 1 | 16 | Down | - | - | 1 |
| 03 | Down | - | - | 1 | 17 | Down | - | - | 1 |
| 04 | Down | - | - | 1 | 18 | Down | - | - | 1 |
| 05 | Down | - | - | 1 | 19 | Down | - | - | 1 |
| 06 | Down | - | - | 1 | 20 | Down | - | - | 1 |
| 07 | Down | - | - | 1 | 21 | Down | - | - | 1 |
| 08 | Down | - | - | 1 | 22 | Down | - | - | 1 |
| 09 | Down | - | - | 1 | 23 | Down | - | - | 1 |
| 10 | Down | - | - | 1 | 24 | Down | - | - | 1 |
| 11 | Down | - | - | 1 | 25 | Down | - | - | 1 |
| 12 | Down | - | - | 1 | 26 | Down | - | - | 1 |
| 13 | Down | - | - | 1 | 27 | Down | - | - | 1 |
| 14 | Down | - | - | 1 | 28 | Down | - | - | 1 |
The following table describes the labels in this screen.
Table 8 Port Status
| LABEL | DESCRIPTION |
| Refresh | Click this to update the PORT Status screen. |
| Port | This identifies the Ethernet port. Click a port number to display the Port Configuration screen (refer to Section 6.2 on page 56.) |
| Link Status | This field displays the link status of the port. Up, if the port is enabled and active or Down, if the port is disabled or not connected to any device. |
| Speed Duplex | This field displays the speed either 10Mbps, 100Mbps or 1000Mbps and the duplex mode Full or Half. |
| Flow Control | Enables access to buffering resources for the port thus ensuring lossless operation across network switches. This field displays either Enabled or Disabled. |
| PVID | The PVID field specifies what tag the incoming untagged frames receive on that port so that the frames are forwarded to the VLAN group that the tag defines. |
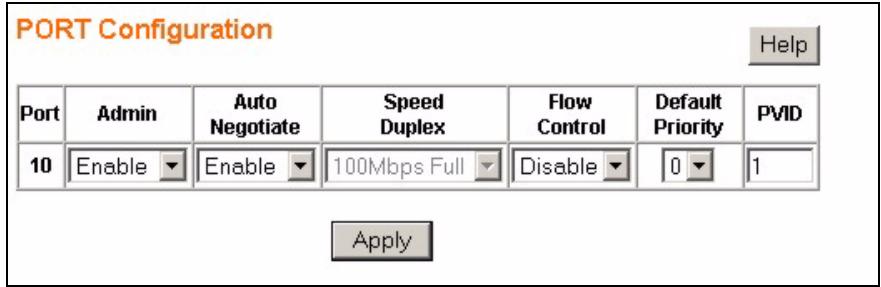
6.2 Port Configuration
Use this screen to configure individual port settings.Click a port number in the Port Status screen to access this screen.
Figure 28 Port Configuration
The following table describes the labels in this screen.
Table 9 Port Configuration
| LABEL | DESCRIPTION |
| Port | This is the port index number. |
| Admin | Select Enable to activate the port or Disable to deactivate the port. |
| Auto Negotiate | Select Enable and the port will negotiate the speed, duplex mode and flow control settings with the peer port. If the peer port does not support auto-negotiation or turns off this feature, the switch determines the connection speed by detecting the signal on the cable and using half duplex mode.Select Disable to configure the port settings manually. When the switch's auto-negotiation is turned off, a port uses the pre-configured speed and duplex mode when making a connection, thus requiring you to make sure that the settings of the peer port are the same in order to connect. |
| Speed Duplex | Select the speed and the duplex mode of the Ethernet connection on this port.Choices are 10Mbps Half, 10Mbps Full, 100Mbps Half, 100Mbps Full and 1000Mbps Full (for Gigabit ports only). |
| Flow Control | A concentration of traffic on a port decreases port bandwidth and overflows buffer memory causing packet discards and frame losses. Flow Control is used to regulate transmission of signals to match the bandwidth of the receiving port.The switch uses IEEE802.3x flow control in full duplex mode and backpressure flow control in half duplex mode.IEEE802.3x flow control is used in full duplex mode to send a pause signal to the sending port, causing it to temporarily stop sending signals when the receiving port memory buffers fill.Back Pressure flow control is typically used in half duplex mode to send a "collision" signal to the sending port (mimicking a state of packet collision) causing the sending port to temporarily stop sending signals and resend later. Select Enable to turn this feature on or select Disable to turn it off. |
| Default Priority | This priority value is added to incoming frames without a priority queue tag. |
| PVID | Enter a number identifying an existing VLAN. The switch tags the incoming untagged frames on that port so that the frames are forwarded to the VLAN group that the tag defines. |
| Apply | Click Apply to save your changes to the switch. |
System and Port Statistics
This chapter describes the overview and individual port statistics screens.
7.1 Overview
The statistics screen of the web configurator displays a port statistical summary with links to each port showing statistical details.
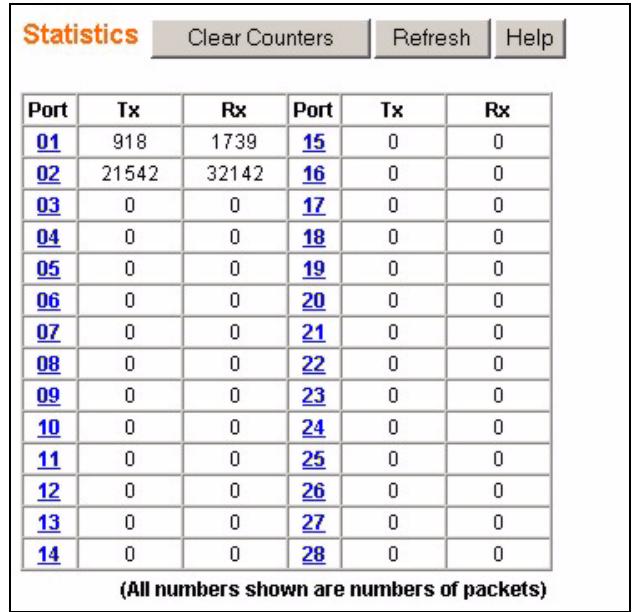
7.2 Statistics Summary
Click Statistics in the navigation panel to view the screen as shown. Use this screen to view the traffic counters for the switch.
Figure 29 Statistics
The following table describes the labels in this screen.
Table 10 Statistics
| LABEL | DESCRIPTION |
| Clear Counters | Click this to reset all counters to zero. |
| Refresh | Click this to retrieve the current information from the switch and update this screen. |
| Port | This identifies the Ethernet port. Click a port number to display the Port Details screen (refer to Figure 30 on page 60). |
| Tx | This field shows the number of transmitted frames on this port. |
| Rx | This field shows the number of received frames on this port. |
7.3 Port Statistics
Click a number in the Port column in the Statistics screen to display individual port statistics. Use this screen to check status and detailed performance data about an individual port on the switch.
Figure 30 Status: Port Details
| Port | 01 | ||
| TX | |||
| Octets | 233808 | UnicastPkts | 918 |
| NonUnicastPkts | 0 | Discards | 0 |
| Errors | 0 | QLength | -- |
| RX | |||
| Octets | 217656 | UnicastPkts | 1280 |
| NonUnicastPkts | 459 | Discards | 0 |
| Errors | 0 | UnkonwnProtos | 0 |
| Summary | |||
| DropEvents | 0 | MulticastPkts | 4 |
| BROADCASTPkts | 455 | UndersizePkts | 0 |
| OversizePkts | 0 | ||
| Fragments | 0 | Jabbers | 0 |
| Collisions | 0 | CRCAlignErr | 0 |
| TotalOctets | 217656 | TotalPkts | 1739 |
| 64 BytePkts | 1112 | 65-127 BytePkts | 293 |
| 128-255 BytePkts | 135 | 256-511 BytePkts | 97 |
| 512-1023 BytePkts | 93 | 1024-1518 BytePkts | 9 |
The following table describes the labels in this screen.
Table 11 Status: Port Details
| LABEL | DESCRIPTION |
| Refresh | Click this to retrieve the current information from the switch and update this screen. |
| Port | This field displays the port number you are viewing. |
| TXThe following fields display detailed information about packets transmitted. | |
| Octets | This field shows the number of octets transmitted. |
| UnicastPkts | This field shows the number unicast packets transmitted. |
| NonUnicastPkts | This field shows the number of nonunicast packets transmitted. |
| Discards | This field shows the number discarded (dropped) packets. |
| Errors | This field shows the number of packets for which transmission failed because of excessive collision. |
| QLength | This field shows the number of packets currently buffered. |
| RXThe following fields display detailed information about packets received. | |
| Octets | This field shows the number of octets received. |
| UnicastPkts | This field shows the number unicast packets received. |
| NonUnicastPkts | This field shows the number of nonunicast packets received. |
| Discards | This field shows the number discarded (dropped) packets. |
| Errors | This field shows the number of undersize, oversize, fragmented or FCS error packets received. |
| UnknownProtos | This field shows the number of packets received with unknown protocols. |
| SummaryThe following fields display a summary of types of errors and size of packets transmitted/received. | |
| Drop Events | This is a count of dropped packets due to GBP or backpressure (buffer overflow). |
| MulticastPkts | This is a count of transmitted/received multicast packets. |
| BroadcastPkts | This is a count of transmitted/received broadcast packets. |
| UndersizePkts | This is a count of transmitted/received packets with length less than the minimum packet size. |
| OversizePkts | This is a count of transmitted/received packets with length more than the maximum packet size. |
| Fragments | This is a count of transmitted/received packets that were too short (shorter than 64 octets) with invalid FCS or alignment errors. |
| Jabbers | This is a count of transmitted/received packets that which exceeded maximum size to receive frame length. |
| Collision | This is a count of transmitted collision packets. |
| CRCAlignErr | This is a count of transmitted/received packets that were too short (shorter than 64 octets) with invalid FCS or alignment errors. |
| TotalOctets | This is a count of all transmitted/received packets that which exceeded maximum size to receive frame length. |
| TotalPkts | This is a count of transmitted/received packets (including bad packets, all unicast, broadcast, multicast and MAC control packets). |
| 64 BytePkts | This field shows the number of packets (including bad packets) received that were 64 octets in length. |
| 65-127 BytePkts | This field shows the number of packets (including bad packets) received that were between 65 and 127 octets in length. |
| 128-255BytePkts | This field shows the number of packets (including bad packets) received that were between 128 and 255 octets in length. |
| 256-511BytePkts | This field shows the number of packets (including bad packets) received that were between 256 and 511 octets in length. |
| 512-1023BytePkts | This field shows the number of packets (including bad packets) received that were between 512 and 1023 octets in length. |
| 1024-1518BytePkts | This field shows the number of packets (including bad packets) received that were between 1024 and 1522 octets in length. |
This chapter shows you how to configure IEEE 802.1Q tagged VLANs.
8.1 Introduction to IEEE 802.1Q Tagged VLANs
A tagged VLAN uses an explicit tag (VLAN ID) in the MAC header to identify the VLAN membership of a frame across bridges - they are not confined to the switch on which they were created. The VLANs can be created statically by hand or dynamically through GVRP. The VLAN ID associates a frame with a specific VLAN and provides the information that switches need to process the frame across the network. A tagged frame is four bytes longer than an untagged frame and contains two bytes of TPID (Tag Protocol Identifier, residing within the type/length field of the Ethernet frame) and two bytes of TCI (Tag Control Information, starts after the source address field of the Ethernet frame).
The CFI (Canonical Format Indicator) is a single-bit flag, always set to zero for Ethernet switches. If a frame received at an Ethernet port has a CFI set to 1, then that frame should not be forwarded as it is to an untagged port. The remaining twelve bits define the VLAN ID, giving a possible maximum number of 4,096 VLANs. Note that user priority and VLAN ID are independent of each other. A frame with VID (VLAN Identifier) of null (0) is called a priority frame, meaning that only the priority level is significant and the default VID of the ingress port is given as the VID of the frame. Of the 4096 possible VIDs, a VID of 0 is used to identify priority frames and value 4095 (FFF) is reserved, so the maximum possible VLAN configurations are 4,094.
| TPID2 Bytes | User Priority3 Bits | CFI1 Bit | VLAN ID12 bits |
8.1.1 Forwarding Tagged and Untagged Frames
Each port on the switch is capable of passing tagged or untagged frames. To forward a frame from an 802.1Q VLAN-aware switch to an 802.1Q VLAN-unaware switch, the switch first decides where to forward the frame and then strips off the VLAN tag. To forward a frame from an 802.1Q VLAN-unaware switch to an 802.1Q VLAN-aware switch, the switch first decides where to forward the frame, and then inserts a VLAN tag reflecting the ingress port's default VID. The default PVID is VLAN 1 for all ports, but this can be changed.
A broadcast frame (or a multicast frame for a multicast group that is known by the system) is duplicated only on ports that are members of the VID (except the ingress port itself), thus confining the broadcast to a specific domain.
8.2 Static VLAN
Use a IEEE 802.1Q VLAN to decide whether an incoming frame on a port should be
- sent to a VLAN group as normal depending on its VLAN tag.
- sent to a group whether it has a VLAN tag or not.
You can also tag all outgoing frames (that were previously untagged) from a port with the specified VID.
8.2.1 IEEE 802.1Q VLAN Screen
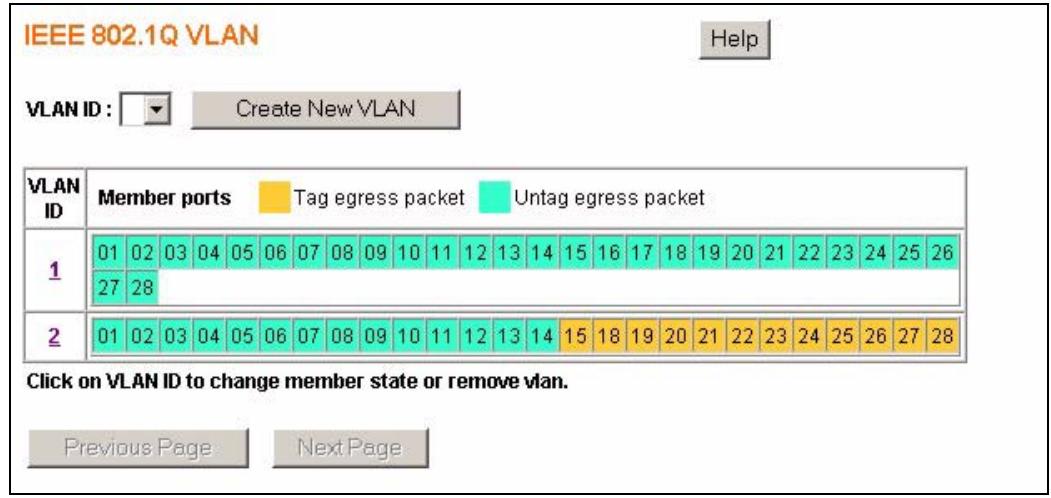
See Section 8.1 on page 63 for more information on VLANs. Click VLAN in the navigation panel to display the IEEE 802.1Q VLAN screen as shown next.
Figure 31 VLAN: VLAN Status
The following table describes the labels in this screen.
Table 12 VLAN: VLAN Status
| LABEL | DESCRIPTION |
| VLAN ID | Select which VLAN you want to configure or click Create New VLAN to go to the new VLAN configuration screen. |
| VLAN Status Table | This table shows you the existing VLANs and their configurations. |
| VLAN ID | Click on the VLAN ID to go to the VLAN edit screen. |
| Member Ports | All the ports participating in the VLAN are listed here. The ports show up in two different colors: (Orange) When the packet leaves this member port, the VLAN tag is added. (Turquoise) When the packet leaves this member port, the VLAN tag is removed. |
| Previous Page | Click this button to view VLANs with lower identification numbers. This field is only active if you there are more VLANs than can be displayed on one screen. |
| Next Page | Click this button to view VLANs with higher identification numbers. This field is only active if there are more VLANs than can be displayed on one screen. |
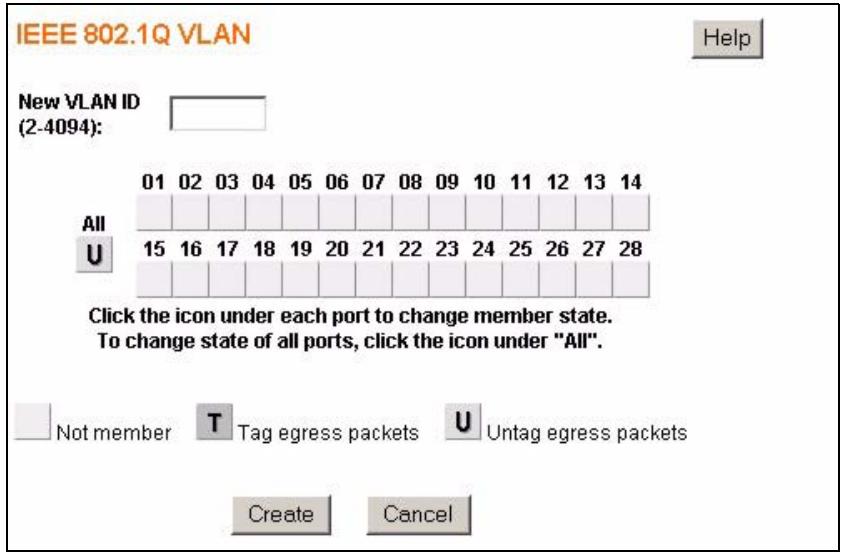
8.2.2 Create IEEE 802.1Q VLAN Screen
See Section 8.1 on page 63 for more information on VLANs. Click VLAN in the navigation panel to display the IEEE 802.1Q VLAN screen as shown next.
Figure 32 VLAN: Create VLAN
The following table describes the labels in this screen.
Table 13 VLAN: Create VLAN
| LABEL | DESCRIPTION |
| New VLAN ID | Enter the VLAN ID of the VLAN you want to create. |
| ALL | This button allows you to configure all the ports at once. Click this button to change the state of all the ports at once. The possible states are:empty - This indicates that the port is not part of the VLAN.T - This indicates that this port is a member of the VLAN. When the packet leaves the member port, the VLAN tag is added.U - This indicates that this port is a member of the VLAN. When the packet leaves the member port, the VLAN tag is removed. |
| 1...28 | These buttons allow you to specify whether the individual ports are members of this VLAN. Click the buttons below the numbers to change the state of the ports. The possible states are:empty - This indicates that the port is not part of the VLAN.T - This indicates that this port is a member of the VLAN. When the packet leaves the member port, the VLAN tag is added.U - This indicates that this port is a member of the VLAN. When the packet leaves the member port, the VLAN tag is removed. |
| Create | Click Create to add this VLAN to the switch. |
| Cancel | Click Cancel to return to the VLAN status screen without making any changes. |
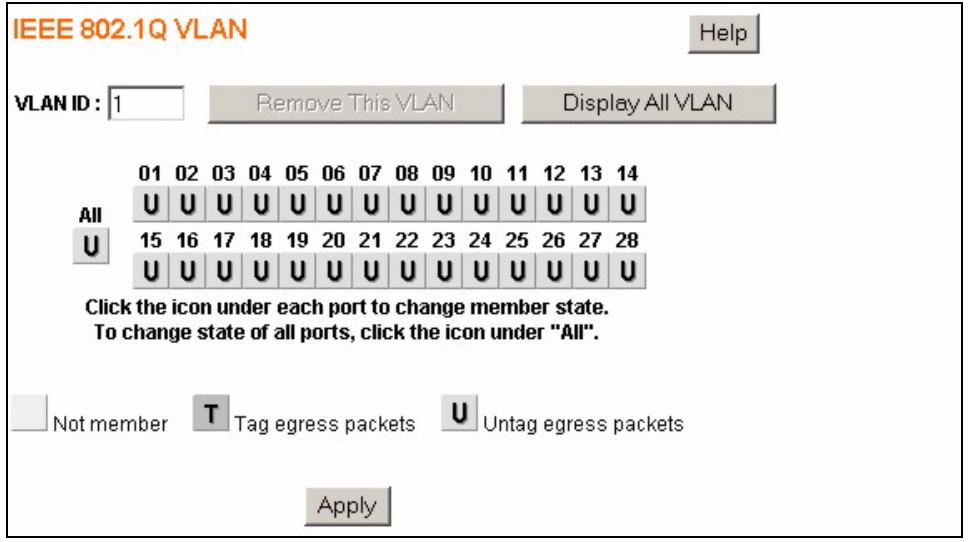
8.2.3 Edit IEEE 802.1Q VLAN Screen
See Section 8.1 on page 63 for more information on VLANs. Click VLAN in the navigation panel to display the IEEE 802.1Q VLAN screen as shown next.
Figure 33 VLAN: Edit VLAN
The following table describes the labels in this screen.
Table 14 VLAN: Edit VLAN
| LABEL | DESCRIPTION |
| VLAN ID | Select which VLAN you want to configure. Click Remove This VLAN to remove this VLAN from the switch. |
| Display All VLAN | Click this button to go back to the VLAN status screen. |
| ALL | This button allows you to configure all the ports at once. Click this button to change the state of all the ports at once. The possible states are:empty - This indicates that the port is not part of the VLAN.T - This indicates that this port is a member of the VLAN. When the packet leaves the member port, the VLAN tag is added.U - This indicates that this port is a member of the VLAN. When the packet leaves the member port, the VLAN tag is removed. |
| 1...28 | These buttons allow you to specify whether the individual ports are members of this VLAN. Click the buttons below the numbers to change the state of the port. The possible states are:empty - This indicates that the port is not part of the VLAN.T - This indicates that this port is a member of the VLAN. When the packet leaves the member port, the VLAN tag is added.U - This indicates that this port is a member of the VLAN. When the packet leaves the member port, the VLAN tag is removed. |
| Apply | Click Apply to create the VLAN or update the VLAN's configuration. |
Trunking
This chapter shows you how to logically aggregate physical links to form one logical, higher-bandwidth link.
9.1 Trunking Overview
Trunking is the grouping of physical ports into one logical higher-capacity link. You may want to trunk ports if for example, it is cheaper to use multiple lower-speed links than to under-utilize a high-speed, but more costly, single-port link.
However, the more ports you aggregate then the fewer available ports you have. A trunk group is one logical link containing multiple ports.
9.1.1 Distribution Criterion
The switch uses a traffic distribution algorithm to balance traffic between trunk members. The switch allows you to specify what criteria it should use to calculate the most efficient distribution of traffic. The choices are Source MAC Address (SA), Destination MAC Address (DA) or both (SA + DA). The best choice of distribution criteria depends on your specific network environment.
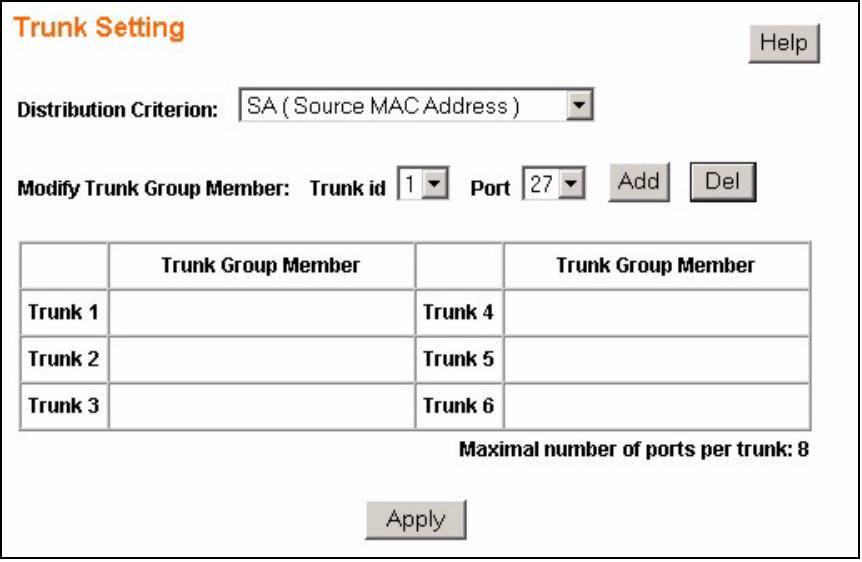
9.2 Trunk Setting Screen
Use this screen to aggregate groups of physical ports into one higher capacity link. Click Trunk Groups in the navigation panel to display the Trunk Setting screen.
Figure 34 Trunk Setting
The following table describes the labels in this screen.
Table 15 Trunking: Configuration
| LABEL | DESCRIPTION |
| Distribution Criterion | Trunking uses a distribution algorithm to balance traffic between trunk members. Select the traffic distribution algorithm between trunk member ports. Your choices are: • SA (Source MAC Address) • DA (Destination MAC Address) • SA + DA |
| Modify Trunk Group Member | Configure the following settings to create and modify trunk groups. |
| Trunk id | Select the trunk you want to modify or select a trunk id which is not yet configured to create a new trunk group. |
| Port | Select the port you want to add or delete. |
| Add | Click this to add the port to the trunk group you selected in the Trunk id field. |
| Del | Click this to delete the port from the trunk group you selected in the Trunk id field. |
| Trunk 1 ... Trunk 6 | This summary table lists all the trunks. Trunk Group Member column indicates which ports are members of the trunk group. |
| Apply | Click Apply to save your changes to the switch. |
This chapter discusses port mirroring.
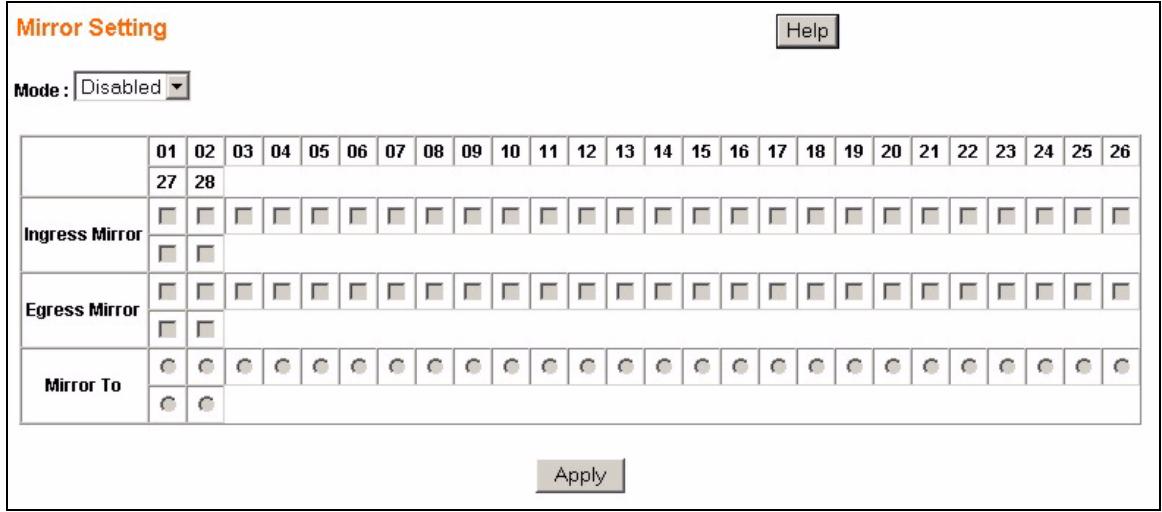
10.1 Port Mirroring Settings
Port mirroring allows you to copy traffic flow to a monitor port (the port you copy the traffic to) in order that you can examine the traffic from the mirrored port without interference.
Click Mirror in the navigation panel to display the Mirror Setting screen. Use this screen to select a monitor port and specify the traffic flow to be copied to the monitor port.
Figure 35 Mirror Setting
The following table describes the labels in this screen.
Table 16 Mirror Setting
| LABEL | DESCRIPTION |
| Mode | Select Enabled to turn on port mirroring or select Disabled to turn it off. |
| Ingress Mirror | Select the ports for which you want to monitor the ingress (incoming) traffic. |
| Egress Mirror | Select the ports for which you want to monitor the egress (outgoing) traffic. |
| Mirror To | The Mirror To (monitor) port is the port you copy the traffic to in order to examine it in more detail without interfering with the traffic flow on the original port(s). Select the monitor port. |
| Apply | Click Apply to save your changes to the switch. |
This chapter introduces the quality of service (QoS) parameters you can configure on the switch.
11.1 QoS Overview
QoS is used to help solve performance degradation when there is network congestion. Use the QoS Setting screen to configure queuing algorithms for outgoing traffic.
Queuing algorithms allow switches to maintain separate queues for packets from each individual source or flow and prevent a source from monopolizing the bandwidth.
11.1.1 Weighted Round Robin (WRR)
Round Robin scheduling services queues on a rotating basis and is activated only when a port has more traffic than it can handle. A queue is given an amount of bandwidth irrespective of the incoming traffic on that port. This queue then moves to the back of the list. The next queue is given an equal amount of bandwidth, and then moves to the end of the list; and so on, depending on the number of queues being used. This works in a looping fashion until a queue is empty.
Weighted Round Robin (WRR) scheduling uses the same algorithm as round robin scheduling, but services queues based on their priority and queue weight (the number you configure in the queue Weight field) rather than a fixed amount of bandwidth. WRR is activated only when a port has more traffic than it can handle. Queues with larger weights get more service than queues with smaller weights. This queuing mechanism is highly efficient in that it divides any available bandwidth across the different traffic queues and returns to queues that have not yet emptied.
11.1.2 Strict Priority
Strict priority scheduling singles out the highest priority queue and ensures all queued traffic in this queue is transmitted before servicing the lower priority queues. Strict priority scheduling services the remaining queues using WRR. As traffic comes into the switch, traffic on the highest priority queue, Queue 3 is transmitted first. Only when that queue empties, traffic on the lower priority queues is transmitted using WRR scheduling.
11.2 QoS Enhancement
You can configure the switch to prioritize traffic even if the incoming packets are not marked with IEEE 802.1p priority tags or change the existing priority tags based on the criteria you select. The switch allows you to choose one of the following methods for assigning priority to incoming packets on the switch:
Port Based QoS - Assign priority to packets based on the incoming port on the switch. See Section 11.4.1 on page 74.
DSCP Based QoS - Assign priority to packets based on their Differentiated Services Code Points (DSCPs). See Section 11.4.2 on page 75.
ToS Based QoS - Assign priority to packets based on their Type of Service (ToS) tagging. See Section 11.4.5 on page 76.
IP Address Based QoS - Assign priority to packets based on their source IP address. See Section 11.4.6 on page 77.
You can choose one of these ways to alter the way incoming packets are prioritized or you can choose not to use any QoS enhancement setting on the switch.
11.3 Configuring QoS
Use the QoS Setting screen to specify a queuing method and configure queue weights for the switch. Click QoS in the navigation panel to view the following screen.
Figure 36 QoS Setting
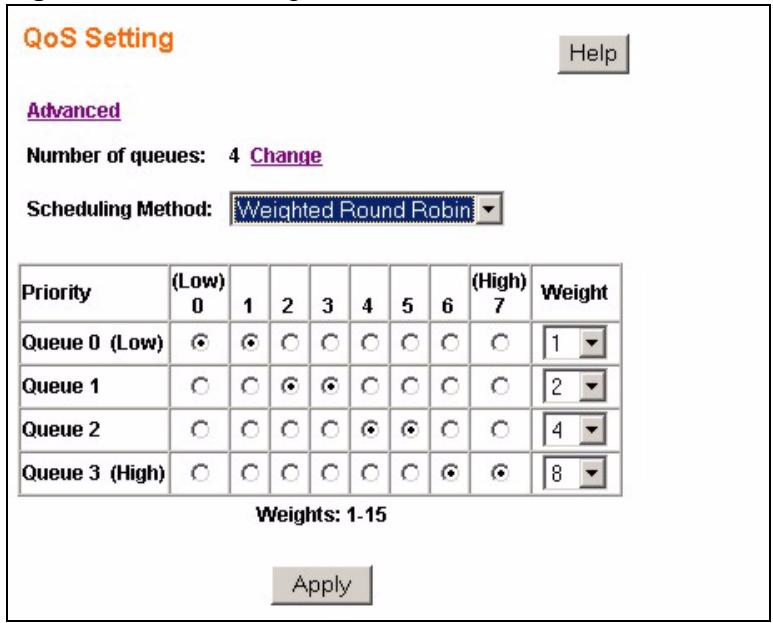
The following table describes the labels in this screen.
Table 17 QoS Setting
| LABEL | DESCRIPTION |
| Advanced | Click this link to configure QoS settings based on port number, IP address or configure DSCP or ToS priority to 802.1p priority mappings. |
| Number of queues | This field displays the number of queues configurable on the switch. Click Change to edit the number of queues on the switch. |
| Scheduling Method | Select Strict Priority or Weighted Round Robin.Strict Priority scheduling singles out the highest priority queue and ensures all queued traffic in this queue is transmitted before servicing the lower priority queues. Strict Priority scheduling services the remaining queues using WRR.Note: Queue weights can only be changed when Weighted Round Robin is selected.Weighted Round Robin scheduling services queues on a rotating basis based on their queue weight (the number you configure in the queue Weight field). Queues with larger weights get more service than queues with smaller weights. |
| Priority | This value indicates packet priority and is retrieved from the priority tag field of incoming packets. The values range from 0 (lowest priority) to 7 (highest priority). Click the options below the priority values to send packets of a specific priority to a particular queue. You can also set this priority based on criteria you configure in the Advanced QoS screens. See the sections later in this chapter for more information. |
| Queue 0 ... Queue 3 | This field indicates which Queue (0 to 3) you are configuring. Queue 0 has the lowest priority and Queue 3 the highest priority. |
| Weight | You can only configure the queue weights when Weighted Round Robin is selected. Bandwidth is divided across the different traffic queues according to their weights.Note: If you want to use Strict Priority but want to change the weights for the queues, configure them with Weighted Round Robin selected first and then change the scheduling method to Strict Priority. |
| Apply | Click Apply to save your changes to the switch. |
11.3.1 Change Number of Queues
Use the Change Number of Queues screen to edit the number of queues on the switch. Click Change in the QoS Setting screen to view the following screen.
Figure 37 Change Number of Queues
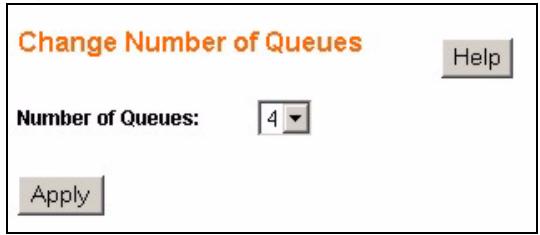
Select the number of queues from the Number of Queues drop down list box and click Apply to save your settings to the switch.
11.4 Advanced QoS Settings
The following sections describe additional methods for setting priority for incoming packets on the ports. The switch allows you to choose one of the following methods:
Port Based QoS, DSCP Based QoS, ToS Based QoS or IP Address Based QoS.
11.4.1 Port Based QoS
You can configure the switch to assign a IEEE 802.1p priority to packets based on the ingress (incoming) port of the packet. Select Port Based QoS in the QoS Enhancement Setting screen to view the following screen.
Figure 38 Port Based QoS
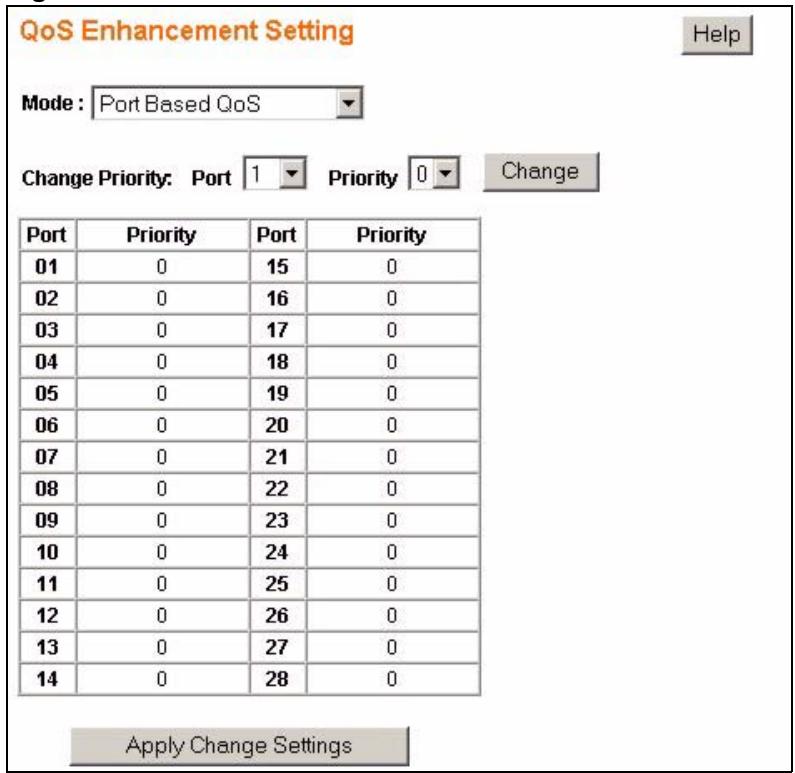
The following table describes the labels in this screen.
Table 18 Port Based QoS
| LABEL | DESCRIPTION |
| Mode | SelectPort Based QoSto specify priority rules based on the port of incoming packets. |
| Change Priority | Configure the following:•Port- Select the number of the port for which you want to assign IEEE 802.1p priority to incoming frames.•Priority- Select the IEEE 802.1p priority you want to assign to the packets coming into the switch on the port specified in thePortfield.Click Changeto view your changed settings.Note:The changes are not applied until you click Apply Change Settings. |
| Port, Priority | This is a summary table of your port to IEEE 802.1p priority mappings. The Port column indicates the port number of the incoming packets and the Priority column indicates what IEEE 802.1p priority gets assigned to those packets. |
| Apply Change Settings | Click this when you have reviewed the changes you want to make and you want to save them to the switch’s memory. |
11.4.2 DSCP Based QoS
The switch allows you to create a mapping table between Differentiated Services Code Points (DSCPs) tags and IEEE 802.1p priority tags.
11.4.3 Differentiated Services Code Point (DSCP) Overview
Differentiated Services (DiffServ) is a class of service (CoS) model that marks packets so that they receive specific per-hop treatment at DiffServ-compliant network devices along the route based on the application types and traffic flow. Packets are marked with DiffServ Code Points (DSCPs) indicating the level of service desired. This allows the intermediary DiffServ-compliant network devices to handle the packets differently depending on the code points without the need to negotiate paths or remember state information for every flow. In addition, applications do not have to request a particular service or give advanced notice of where the traffic is going.
DiffServ defines a new DS (Differentiated Services) field to replace the Type of Service (ToS) field in the IP header. The DS field contains a 2-bit unused field and a 6-bit DSCP field which can define up to 64 service levels.
You can configure the DSCP to IEEE 802.1p mapping to allow the switch to prioritize all traffic based on the incoming DSCP value according to the DiffServ to IEEE 802.1p mapping table.
11.4.4 DSCP Based QoS Screen
You can configure the switch to assign a IEEE 802.1p priority to packets coming into the switch with DSCPs assigned to them. Select DSCP Based QoS in the QoS Enhancement Setting screen to view the following screen.
Figure 39 DSCP Based QoS
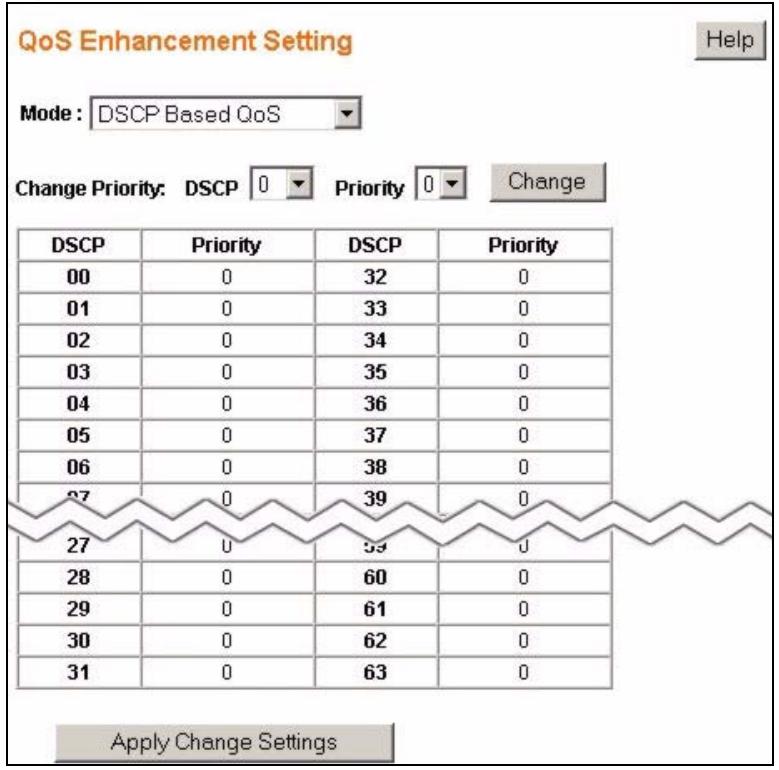
The following table describes the labels in this screen.
Table 19 DSCP Based QoS
| LABEL | DESCRIPTION |
| Mode | Select DSCP Based QoS to specify mapping rules between DSCP priority and IEEE 802.1p priority for incoming packets on the switch. |
| Change Priority | Configure the following:• DSCP - Select the DSCP priority for which you want to change a priority mapping.• Priority - Select the IEEE 802.1p priority you want to assign to the packets with the DSCP priority you specified in the DSCP field.Click Change to view your changed settings.Note: The changes are not applied until you click Apply Change Settings. |
| DSCP, Priority | This is a summary table of your DSCP to IEEE 802.1p priority mappings. The DSCP column indicates the DSCP values of the incoming packets and the Priority column indicates what IEEE 802.1p priority gets assigned to those packets. |
| Apply Change Settings | Click this when you have reviewed the changes you want to make and you want to save them to the switch’s memory. |
11.4.5 ToS Based QoS
You can configure the switch to assign a IEEE 802.1p priority to packets coming into the switch with Type of Service (ToS) priority assigned to them. Select ToS Based QoS in the QoS Enhancement Setting screen to view the following screen.
Figure 40 ToS Based QoS
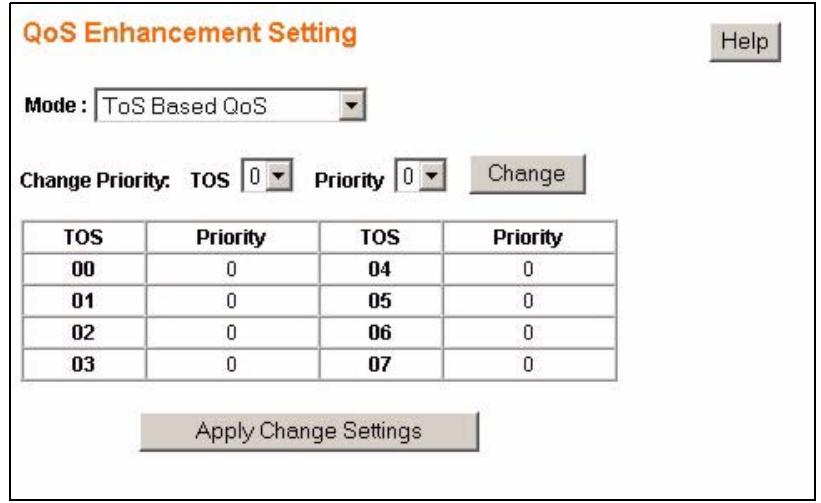
The following table describes the labels in this screen.
Table 20 ToS Based QoS
| LABEL | DESCRIPTION |
| Mode | Select ToS Based QoS to specify mapping rules between ToS priority and IEEE 802.1p priority for incoming packets on the switch. |
| Change Priority | Configure the following:• TOS - Select the ToS priority for which you want to change a priority mapping.• Priority - Select the IEEE 802.1p priority you want to assign to the packets with the ToS priority you specified in the TOS field.Click Change to view your changed settings.Note: The changes are not applied until you click Apply Change Settings. |
| TOS, Priority | This is a summary table of your ToS priority to IEEE 802.1p priority mappings. The TOS column indicates the ToS priority of the incoming packets and the Priority column indicates what IEEE 802.1p priority gets assigned to those packets. |
| Apply Change Settings | Click this when you have reviewed the changes you want to make and you want to save them to the switch’s memory. |
11.4.6 IP Address Based QoS
You can configure the switch to assign a higher priority to packets coming into the switch from specific IP addresses. Select IP Address Based QoS in the QoS Enhancement Setting screen to view the following screen.
Figure 41 IP Address Based QoS
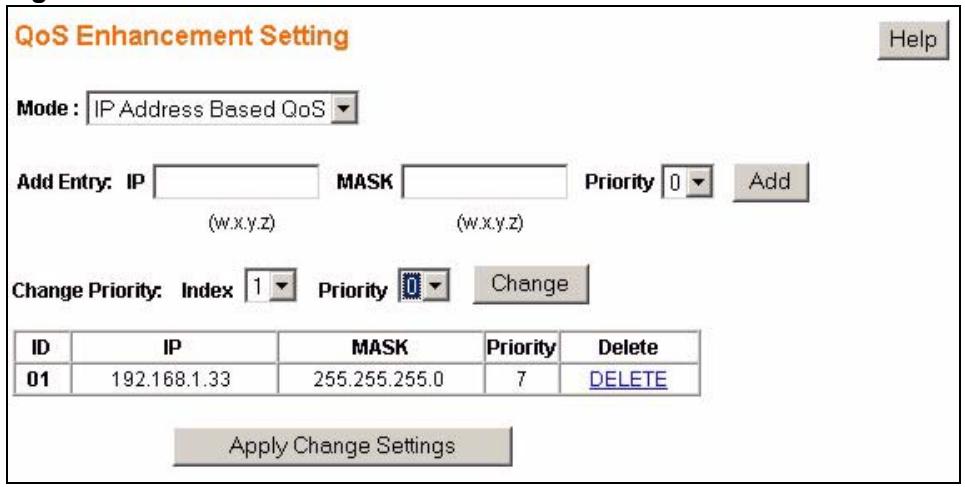
The following table describes the labels in this screen.
Table 21 IP Address Based QoS
| LABEL | DESCRIPTION |
| Mode | Select IP Address Based QoS to give higher or lower priority to packets coming into the switch from a specified source IP address. |
| Add Entry | Enter the IP address and the subnet mask of the source whose traffic you want to assign a priority to in the IP and MASK fields respectively. Select the Priority value and click Add. |
| Change Priority | Use these fields to edit existing IP address based QoS entries. Select the index of an existing IP address based QoS entry. (This is the same value as listed in the ID column of this screen.) Select the Priority you want to assign to this entry. Click Change to view your changed settings.Note: The changes are not applied until you click Apply Change Settings. |
| ID, IP, MASK, Priority, Delete | This is a summary table of your IP address based QoS settings. This table updates when you click the Change button in this screen. Click DELETE in the Delete column to remove this IP address based QoS entry from the switch. |
| Apply Change Settings | Click this when you have reviewed the changes you want to make and you want to save them to the switch's memory. |
Port Rate Limit and Storm Control
This chapter shows you how you can manage bandwidth on each port and set up broadcast storm control settings using the Port Rate and Storm Control screens.
12.1 Port Rate Screen
Rate control means defining a maximum allowable bandwidth for incoming and/or out-going traffic flows on a port. Click Rate > Port Rate in the navigation panel to bring up the screen as shown next.
Figure 42 Port Rate Limit
| Port | Ingress Rate | Egress Rate | Port | Ingress Rate | Egress Rate |
| 01 | No Limit | No Limit | 15 | No Limit | No Limit |
| 02 | No Limit | No Limit | 16 | No Limit | No Limit |
| 03 | No Limit | No Limit | 17 | No Limit | No Limit |
| 04 | No Limit | No Limit | 18 | No Limit | No Limit |
| 05 | No Limit | No Limit | 19 | No Limit | No Limit |
| 06 | No Limit | No Limit | 20 | No Limit | No Limit |
| 07 | No Limit | No Limit | 21 | No Limit | No Limit |
| 08 | No Limit | No Limit | 22 | No Limit | No Limit |
| 09 | No Limit | No Limit | 23 | No Limit | No Limit |
| 10 | No Limit | No Limit | 24 | No Limit | No Limit |
| 11 | No Limit | No Limit | 25 | No Limit | No Limit |
| 12 | No Limit | No Limit | 26 | No Limit | No Limit |
| 13 | No Limit | No Limit | 27 | No Limit | No Limit |
| 14 | No Limit | No Limit | 28 | No Limit | No Limit |
The following table describes the related labels in this screen.
Table 22 Rate Limit and Storm Control
| LABEL | DESCRIPTION |
| Port | This field displays the port number. Click on an individual port number to configure rate limits on that port. |
| Ingress Rate | Displays the maximum bandwidth allowed in kilobits per second (Kbps) for the incoming traffic flow on a port. |
| Egress Rate | Displays the maximum bandwidth allowed in kilobits per second (Kbps) for the outgoing traffic flow on a port. |
12.1.1 Rate Limit Screen
Click a port number in the Port Rate screen to bring up the screen as shown next.
Figure 43 Rate Limit Configuration
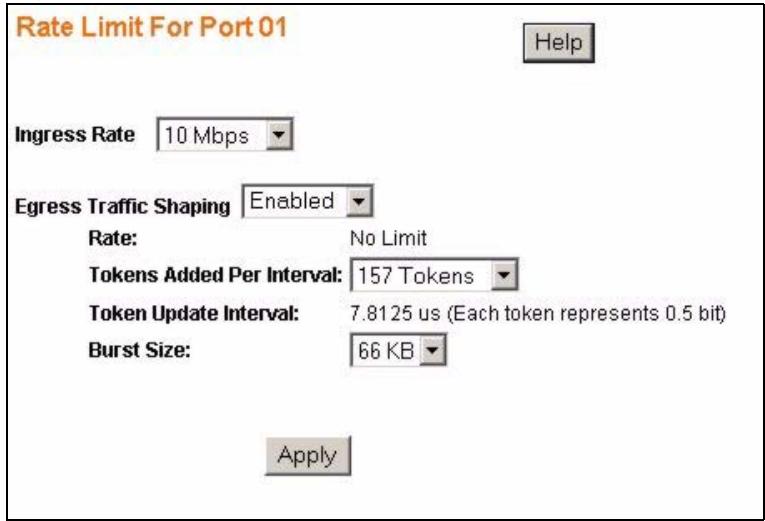
The following table describes the related labels in this screen.
Table 23 Rate Limit Configuration
| LABEL | DESCRIPTION |
| Ingress Rate | Specify the maximum bandwidth allowed in kilobits per second (Kbps) for the incoming traffic flow on a port. |
| Egress Traffic Shaping | Select Disabled to not have any bandwidth limits for outgoing traffic on the port or select Enabled to enable bandwidth limits for outgoing traffic on the port. |
| Rate | This is a read only field indicating the rate limit of outgoing traffic on the port in Kbps. This value changes depending on the number of Tokens Added Per Interval. |
| Tokens Added Per Interval | The switch uses a “Token Bucket” algorithm to limit the outgoing rate on the ports and to limit the largest amount of packets that can leave the port in any one instance.In this algorithm each “token” represents an allowed amount of bandwidth to be sent out on the port.The “bucket” holds the tokens. In other words, the number of tokens in the bucket represents the maximum allowed bandwidth to go out on the port. The size of the bucket is specified by the “burst size” (see below).Every time traffic goes out on the port, tokens (representing used up bandwidth) are removed from the bucket, thus limiting the amount of traffic allowed to go out on the port. Tokens are also added to the bucket every Token Update Interval, thus resetting the amount of bandwidth allowed to go out. If the bucket is empty, the data packets are dropped until more tokens are added to the bucket.Select the number of tokens that should be added to the bucket per Token Update Interval. Each token represents .5 bit in bandwidth allowed to go out on the port. |
| Burst Size | The burst size specifies the maximum amount of traffic that can be allowed out the port at any one instance. In the “Token Bucket” algorithm this is referred to as the size of the bucket as this value limits the number of tokens that can accumulate in the bucket. |
| Apply | Click this to save your changes to the switch. |
12.1.2 Broadcast Storm Control Setup
Broadcast storm control limits the number of broadcast, multicast and unknown unicast (also referred to as Destination Lookup Failure or DLF) packets the switch receives per second on the ports. When the maximum number of allowable broadcast, multicast and unknown unicast packets is reached per second, the subsequent packets are discarded. Enable this feature to reduce broadcast, multicast and unknown unicast packets in your network.
Click Rate > Storm Control in the navigation panel to display the screen as shown next.
Figure 44 Broadcast Storm Control
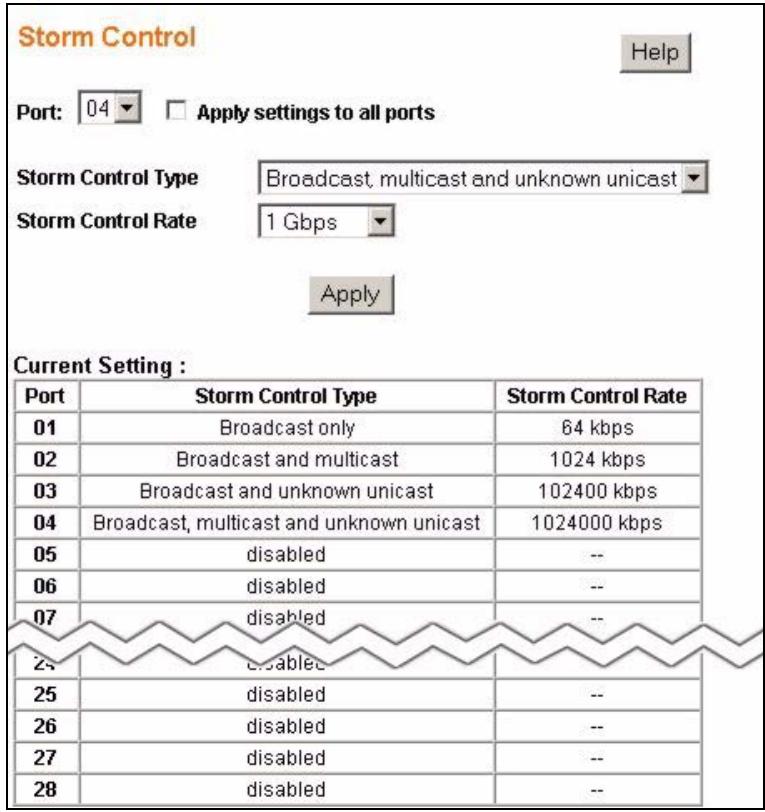
The following table describes the labels in this screen.
Table 24 Broadcast Storm Control
| LABEL | DESCRIPTION |
| Port | Select the port number for which you want to configure storm control settings or selectApplysettings to all portsto configure all the ports at once. |
| Storm Control Type | SelectDisabled- to turn off this feature.Broadcast only- to only specify a limit for the amount of broadcast packets received per second.Broadcast and multicast- to specify a limit for the amount of broadcast and multicast packets received per second.Broadcast and unknown unicast- to specify a limit for the amount of broadcast and DLF packets received per second.Broadcast, multicast and unknown unicast- to specify a limit for the amount of broadcast, multicast and DLF (Destination Lookup Failure) packets received per second. |
| Storm Control Rate | Select the number of packets (of the type specified in theStorm Control Type field) per second the switch can receive per second. |
| Apply | ClickApplyto save your changes to the switch. |
Level 2 (L2) Management
Use these screens to add, delete and view entries in the Level 2 (L2) address table.
13.1 Configuring L2 Management
Level 2 (L2) management refers to management based on the Media Access Control (MAC) address of networking devices. A static Media Access Control (MAC) address is an address that has been manually entered in the MAC address table. Static MAC addresses do not age out. When you set up static MAC address rules, you are setting static MAC addresses for a port. This may reduce the need for broadcasting.
Click L2 Address > Management in the navigation panel to display the configuration screen as shown.
Figure 45 L2 Management
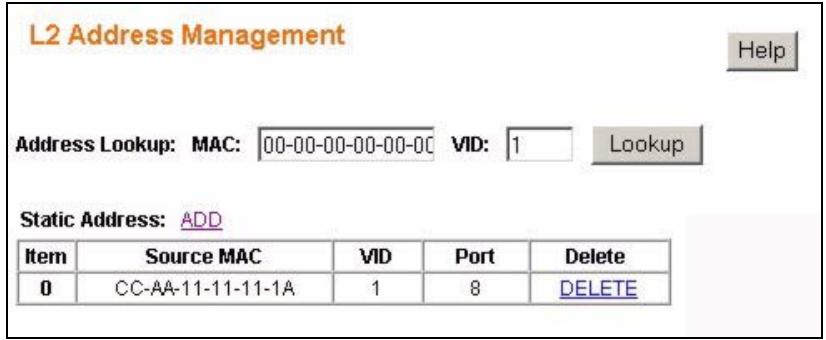
The following table describes the labels in this screen.
Table 25 L2 Management
| LABEL | DESCRIPTION |
| Address Lookup: | Enter the MAC address and the corresponding Vlan ID in the MAC and VID fields respectively. Click Lookup to search for the MAC address entry in the MAC address table. |
| Static Address: | This section allows you to add or delete static MAC address entries. |
| ADD | Click this to add a static MAC address entry to the MAC address table. |
| Item | This is the index number of the static MAC address entry. |
| Source MAC | This field displays the MAC address of a manually entered MAC address entry. |
| VID | This field displays the VID of a manually entered MAC address entry. |
| Port | This field displays the port number of a manually entered MAC address entry. |
| Delete | Click DELETE to remove this manually entered MAC address entry from the MAC address table. |
13.1.1 Add a Static MAC Address Entry
Click Add in the L2 Address Management screen to display the configuration screen as shown.
Figure 46 Add a Static MAC Entry
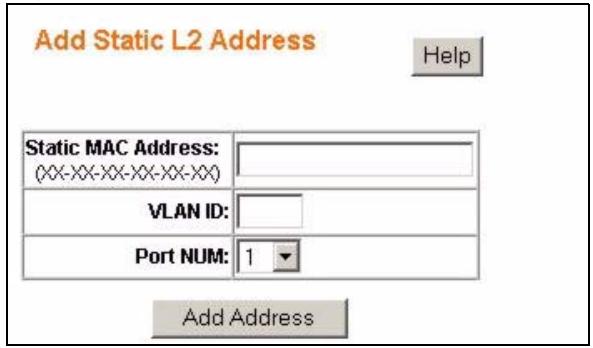
The following table describes the labels in this screen.
Table 26 Add a Static MAC Entry
| LABEL | DESCRIPTION |
| MAC Address | Enter the MAC address in valid MAC address format, that is, six hexadecimal character pairs.Note: Static MAC addresses do not age out. |
| VID | Enter the VLAN identification number. |
| Port | Select the port where the traffic with the destination MAC address entered in the MAC Address field will be automatically forwarded. |
| Add Address | Click this to add this entry into the MAC address table. |
13.2 Viewing the L2 Address Table
Use the L2 Address Table screen to view entries in the MAC address table. Click L2 Address > Display in the navigation panel to display the screen as shown.
Figure 47 Display L2 Address Table
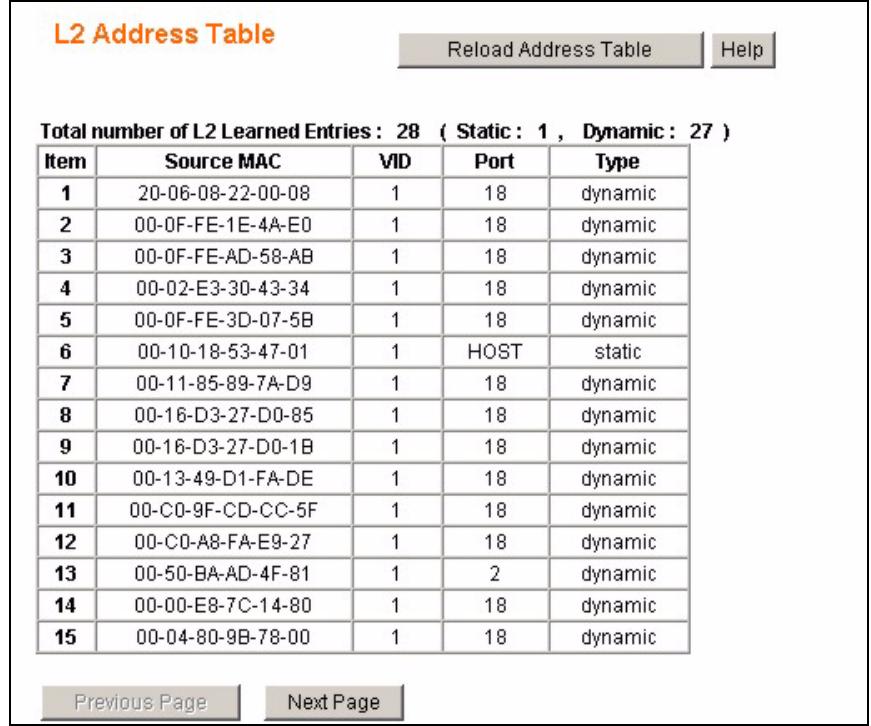
The following table describes the labels in this screen.
Table 27 Display L2 Address Table
| LABEL | DESCRIPTION |
| Reload Address Table | Click this to update all the fields in the L2 Address table. |
| Item | This is the index number of the MAC address entry. |
| Source MAC | This field displays the MAC address. |
| VID | This field displays the VID of a manually entered MAC address entry. |
| Port | This field displays the port number of a MAC address entry or it displaysHOSTif its the entry for the switch itself. |
| Type | This field displays whether this entry was entered manually into the L2 address table -staticor whether it was learned by the switch -dynamic. |
Cable Diagnostics
This chapter explains the Cable Diagnostics screen.
14.1 Diagnostics Overview
The cable diagnostics function works with systems using CAT-5 twisted-pair cables.
The switch can perform basic cable diagnostics. Click Cable Diagnostic in the navigation panel to view the screen as shown.
Figure 48 Cable Diagnostic
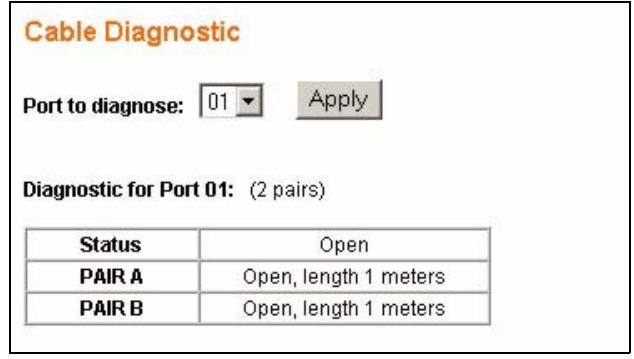
The following table describes the labels in this screen.
Table 28 Cable Diagnostic
| LABEL | DESCRIPTION |
| Port to diagnose | Select the port you want to test. |
| Apply | Click this to perform cable testing on the specified port. |
| Status | This field displays the results of the test:Ok - the cable is working properly.Open - there is no cable connected to the port or the cable is damaged.Short - there is a short along the cable.Short-between-pair - there is a short between two twisted pairs of cable. |
| Pair A .. Pair D | This field displays the whether the twisted pair has a good connection - Ok, or it displays the type of fault the switch has detected: Open, Short or Short-between-pair. It also displays the length of total twisted pair length or the distance to the detected fault depending whether the cable tested Ok or a fault was found. |
Auto Denial of Service (DoS)
This chapter shows you how to configure automatic Denial of Service prevention on the switch.
15.1 About Denial of Service Attacks
Denial of Service (DoS) attacks try to disable a device or network so users no longer have access to network resources. The switch has features which automatically detect and thwart currently known DoS attacks.
15.1.1 DoS Attacks Summary
The following table summarizes the types of attacks the switch can prevent.
Table 29 DoS Attack Summary
| ATTACK | DESCRIPTION |
| Land Attacks | These attacks result from sending a specially crafted packet to a machine where the source host IP address is the same as the destination host IP address. The system attempts to reply to itself, resulting in system lockup. |
| Blat Attacks | These attacks result from sending a specially crafted packet to a machine where the source host port is the same as the destination host port. The system attempts to reply to itself, resulting in system lockup. |
| SYNFIN scans | SYNchronization (SYN), ACKnowledgment (ACK) and FINish (FIN) packets are used to initiate, acknowledge and conclude TCP/IP communication sessions. The following scans exploit weaknesses in the TCP/IP specification and try to illicit a response from a host to identify ports for an attack:Scan SYNFIN - SYN and FIN bits are set in the packet.Xmascan - TCP sequence number is zero and the FIN, URG and PSH bits are set.NULL Scan - TCP sequence number is zero and all control bits are zeroes.SYN with port < 1024 - SYN packets with source port less than 1024. |
| Smurf Attacks | This attack uses Internet Control Message Protocol (ICMP) echo requests packets (pings) to cause network congestion or outages. |
| Ping Flooding | This attack floods the target network with ICMP packets. |
| SYN/SYN-ACK Flooding | This attack floods the target network with SYN or SYN/ACK packets. |
15.2 Global Auto DoS Attack Prevention
Use the Global Auto DoS Attack Prevention screen to configure DoS attack prevention settings for the switch. Click Auto DoS in the navigation panel to open the following screen.
Figure 49 Global Auto DoS Attack Prevention
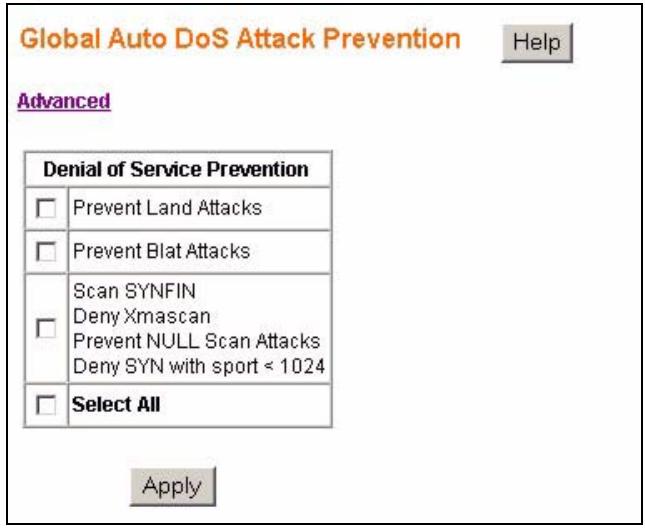
The following table describes the labels in this screen.
Table 30 Global Auto DoS Attack Prevention
| LABEL | DESCRIPTION |
| Advanced | Click this link to configure advance Auto DoS settings. |
| Denial of Service Prevention | Select the types of attacks you want to prevent or choose Select All to prevent all types of attacks and scans supported by the switch. See Section 15.1.1 on page 89 for more information on specific types of attacks. |
| Apply | Click Apply to save your changes to the switch. |
15.3 Advanced Auto DoS Attack Prevention
Use the Advanced Auto DoS Attack Prevention screen to configure DoS attack prevention settings for individual ports. Click the Advanced link in the Global Auto DoS Attack Prevention screen to view the following screen.
Figure 50 Advanced Auto DoS Attack Prevention
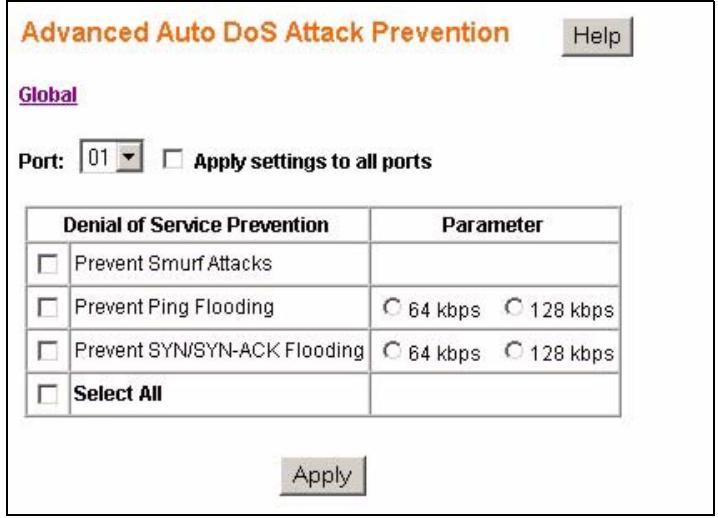
The following table describes the labels in this screen.
Table 31 Advanced Auto DoS Attack Prevention
| LABEL | DESCRIPTION |
| Global | Click this link to view the Global Auto DoS Attack Prevention screen. |
| Port | Select the port you want to configure or select Apply settings to all ports to configure all the ports on the switch. |
| Denial of Service Prevention | Select the types of attacks you want to prevent or choose Select All to prevent all types of attacks and scans supported by the switch. See Section 15.1.1 on page 89 for more information on specific types of attacks. |
| Parameter | For Ping and SYN/SYN-ACK Flooding attacks you can specify thresholds for triggering the dropping of packets by the switch. Select:64 kbps - the switch will drop packets when the rate of incoming Ping or SYN/SYN-ACK packets reaches this limit.128 kbps - the switch will drop packets when the rate of incoming Ping or SYN/SYN-ACK packets reaches this limit. |
| Apply | Click Apply to save your changes to the switch. |
Auto VoIP
This chapter shows you how to give higher priority to Voice over Internet Protocol (VoIP) packets over other data packets as they pass through the switch.
16.1 About Auto VoIP
Voice over Internet Protocol (VoIP) allows telephone calls to be made over a data network like the Internet. With the increased prominence of delay-sensitive applications (voice, video, and other multimedia applications) deployed in networks today, proper QoS configuration ensures high-quality application performance.
The Auto VoIP feature is intended to provide an easy classification mechanism for voice packets so that they can be given high priority in order to provide better transmission resulting in higher sound quality for the end users.
The AutoVoIP feature explicitly matches VoIP packets in Ethernet switches and provides them with the highest class of service. The AutoVoIP feature provides the capability to assign the highest priority for the following VoIP packets:
- SIP – Session Initiation Protocol is an internationally recognized standard for implementing VoIP. SIP is an application-layer control (signaling) protocol that handles the setting up, altering and tearing down of voice and multimedia sessions over the Internet.
- MGCP – Media Gateway Control Protocol is a control and signal standard for the conversion of audio signals carried on telephone circuits (PSTN) to data packets carried over the Internet or other packet networks.
- SCCP – Skinny Client Control Protocol is a Cisco proprietary protocol used between call managers and VoIP phones.
16.2 Auto VoIP Settings
Use the Auto VoIP Settings enable automatic assignment of high priority to VoIP packets passing through the switch. Click Auto VoIP in the navigation panel to view the following screen.
Figure 51 Auto VoIP Settings
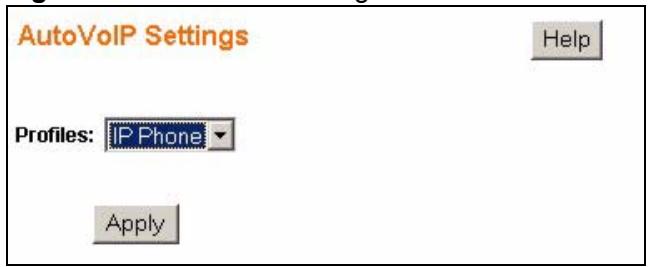
The following table describes the labels in this screen.
Table 32 Auto VoIP Settings
| LABEL | DESCRIPTION |
| Profiles | Select Disable if you don’t want to give higher priority to VoIP traffic or select IP Phone to give the highest priority to SIP, MGCP and SCCP packets passing through the switch. |
| Apply | Click Apply to save your changes to the switch. |
PART III
Management and Troubleshooting
Event Logging (97)
SNMP (105)
RMON-Lite (119)
Dynamic ARP (133)
Troubleshooting (137)
Event Logging
This chapter shows you different ways to inspect logs and how to configure an external log server.
17.1 Event Logging Overview
You can configure the switch to save specific events in four different log targets:
RAM - This log is saved into the switch's volatile memory. The logs are cleared when the switch is rebooted.
Flash - This log is saved into the switch's non-volatile memory. You can view the logs even after the switch is rebooted. Due to the space limitations on the switch the oldest log entries are overwritten as new events are recorded.
Server - You can configure syslog servers to store system events from the switch. The switch uses UDP protocol to send log messages to the remote servers. The syslog servers must be Berkeley Software Distribution (BSD) syslog protocol compliant.
17.2 Logging Screen
Use this screen to specify which system events should be recorded and where the log messages should be saved. Click Logging > Settings in the navigation panel to view the screen as shown.
Figure 52 Logging
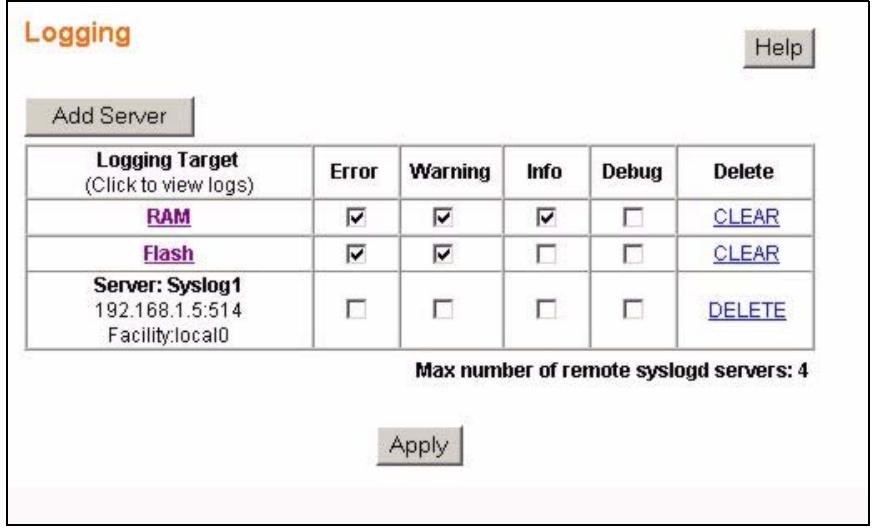
The following table describes the labels in this screen.
Table 33 Logging
| LABEL | DESCRIPTION |
| Add Server | Click this to configure a new syslog server. |
| Logging Target | Click the RAM or Flash links to view the logs stored on the switch.Use the columns on the right to select the types of system events each logging target should record. Select:Error- to record system failures, such as events which will cause the switch to malfunction and events such as invalid user input in the web configurator.Warning- to record non critical errors on the switch. The switch will continue to function when warnings are recorded.Info- to record regular system events, such as configuration changes or logins.Debug- to record events which can be helpful for engineering debugging of the switch's function. This field is not recommended to track as it creates many messages not helpful to typical users.For RAM and Flash logs you can also hit Clear to delete all log entries.For each Server log you configured you can hit Delete to remove this syslog server from logging system events for the switch. |
| Apply | Click Apply to save your changes to the switch. |
17.3 Logging - Add Server
Use this screen to configure a new syslog entry. Click Add Server in the Logging screen to view the screen as shown.
Figure 53 Logging - Add Server
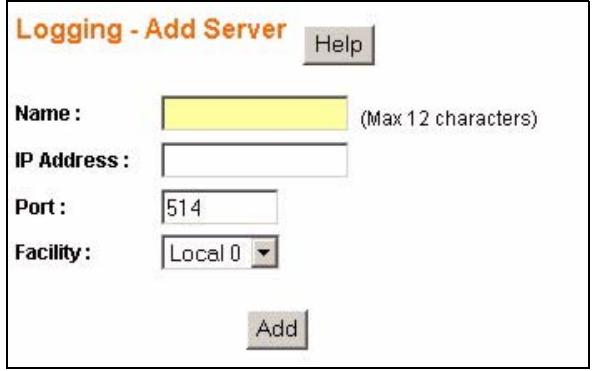
The following table describes the labels in this screen.
Table 34 Logging - Add Server
| LABEL | DESCRIPTION |
| Name | Enter a short descriptive name for identifying this server. |
| IP Address | Enter the IP address in dotted decimal notation of the syslog server you want to add. |
| Port | Specify the UDP port for sending log messages to this server. Typically port 514 is used with syslog. |
| Facility | The log facility allows you to send logs to different files in the syslog server. Refer to the documentation of your syslog server for more details. |
| Add | Click Add to save this entry to the switch and return to the Logging screen. |
17.4 Viewing RAM and Flash Logs
Use these screens to view or export RAM or Flash logs. Click the RAM or Flash link in the Logging screen to view the following screen (Logs - RAM is shown here).
Figure 54 Logging - RAM/Flash
| No. | Index | Level | Category | Time | Message |
| 1 | 88 | INFO | RMON | 2006/5/1 1:30:03 | Reclaiming set ageltid=1,row_id=1 |
| 2 | 87 | INFO | RMON | 2006/5/1 1:30:03 | Reclaiming set ageltid=1,row_id=1 |
| 3 | 86 | INFO | PERSISTENCE | 2006/5/1 1:27:34 | Current settings for group 0x2000000 saved |
| 4 | 85 | INFO | RMON | 2006/5/1 1:19:38 | Alarm table entry created, index=1 |
| 5 | 84 | INFO | PERSISTENCE | 2006/5/1 1:18:11 | Current settings for item 'rmon' saved |
| 6 | 97 | INFO | RON | 2006/5/1 1:17:44 | Event table entry created index=1 |
| 47 | 43 | INFO | PERSISTENCE | 2006/5/1 1:17:00 | Start DHCP process with network interface eth1 |
| 48 | 42 | INFO | NETWORK | 2006/5/1 0:16:59 | |
| 49 | 41 | INFO | WEB | 2006/5/1 0:16:53 | User admin logged from 192.168.0.236 |
| 49 | 40 | INFO | PORT | 2006/5/1 0:15:00 | WSS: Link change UP, port 2, 100Mb Full Duplex. |
| 50 | 39 | INFO | PORT | 2006/5/1 0:15:00 | WSS: Link change UP, port 14, 100Mb Full Duplex. |
The following table describes the labels in this screen.
Table 35 Logging - RAM/Flash
| LABEL | DESCRIPTION |
| Search | Click this to search for specific log entries. |
| Export | Click this to export (save) the log. The logs default name is “events.csv”. A .csv (Comma Separated Values) file can be viewed by most spreadsheet software such as Microsoft’s Excel. |
| No. | This is the number of the log entry. The log entries with the lowest numerical value are the most recent. |
| Index | This field indicates the index number of the log. This number doesn’t change even if some logs are deleted from the switch due to memory limits. The index number increments by one for each recorded event. The largest number represents the most recent log event. |
| Level | This field displays the severity level of the log event. The possible severity levels are:Error- to record system failures, such as events which will cause the switch to malfunction and events such as invalid user input in the web configurator.Warning- to record non critical errors on the switch. The switch will continue to function when warnings are recorded.Info- to record regular system events, such as configuration changes or logins.Debug- to record events which can be helpful for engineering debugging of the switch’s function. This field is not recommended to track as it creates many messages not helpful to typical users. |
| Category | This field displays what category the log entry fits. The categories are based on software and hardware features of the switch. For example the category AUTODOS records events which deal with the Auto Denial of Service features you set up and the category SYSTEM records events which deal with the overall operation of the switch. |
| Time | This field specifies the time when the switch recorded the log event. The switch resets its internal clock when it is restarted. |
| Message | This field displays an explanation for the log entry. |
| Goto page | Click Next, Previous or click on a page number to browse through the log pages. |
17.5 Searching RAM and Flash Logs
Use these screens to search RAM or Flash logs based on level and category. Click the Search link in the Logs - RAM or Logs - Flash screen to view the following screen.
Figure 55 Searching - RAM/Flash Logs
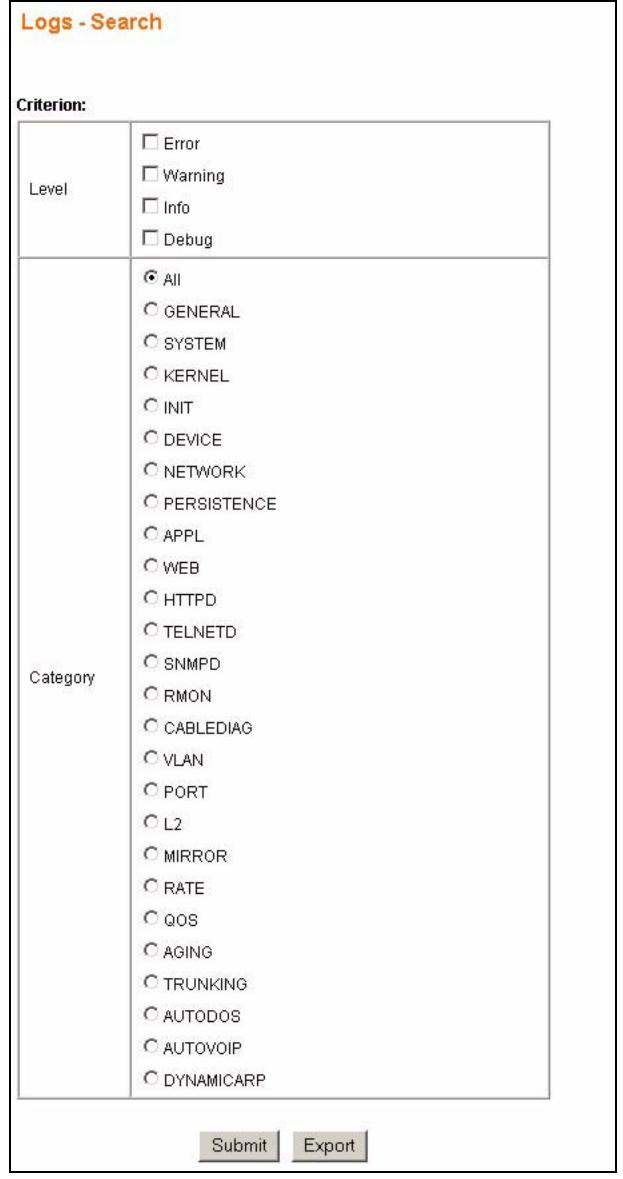
The following table describes the labels in this screen.
Table 36 Searching - RAM/Flash Logs
| LABEL | DESCRIPTION |
| Level | Select the severity level(s) of the log events you want to find. The possible severity levels are:Error- to search system failures, such as events which will cause the switch to malfunction and events such as invalid user input in the web configurator.Warning- to search non critical errors on the switch. The switch will continue to function when warnings are recorded.Info- to search regular system events, such as configuration changes or logins.Debug- to search events which can be helpful for engineering debugging of the switch's function. This field is not recommended to track as it creates many messages not helpful to typical users. |
| Category | Select All to search all categories or specify the individual categories you want to search.The categories are based on software and hardware features of the switch. For example the category AUTODOS records events which deal with the Auto Denial of Service features you set up and the category SYSTEM records events which deal with the overall operation of the switch. |
| Submit | Click this to perform the search and view the results in the search results screen.See Section 17.5.1 on page 102. |
| Export | Click this to export (save) the search results. The logs default name is “events.csv”. A .csv (Comma Separated Values) file can be viewed by most spreadsheet software such as Microsoft's Excel. |
17.5.1 Search Results
The Search Results - RAM/Flash screen displays the results of your log query. Click Submit in the Logs - Search screen to view the logs which match your search criteria.
Figure 56 Logs: Search Results
| Index | Level | Category | Time | Message |
| 97 | INFO | WEB | 2006/5/1 17:21:26 | User admin logined from 192.168.1.33 |
| 45 | INFO | WEB | 2006/5/1 0:18:15 | User admin logined from 192.168.1.33 |
| 41 | INFO | WEB | 2006/5/1 0:16:53 | User admin logined from 192.168.0.236 |
| Index | Level | Category | Time | Message |
| 97 | INFO | WEB | 2006/ 5/ 1 17:21:26 | User admin logined from 192.168.1.33 |
| 45 | INFO | WEB | 2006/ 5/ 1 0:18:15 | User admin logined from 192.168.1.33 |
| 41 | INFO | WEB | 2006/ 5/ 1 0:16:53 | User admin logined from 192.168.0.236 |
The following table describes the labels in this screen.
Table 37 Logs: Search Results
| LABEL | DESCRIPTION |
| Index | This field indicates the index number of the log. This number doesn’t change even if some logs are deleted from the switch due to memory limits. The index number increments by one for each recorded event. The largest number represents the most recent log event. |
| Level | This field displays the severity level of the log event. The possible severity levels are, Error, Warning, Info and Debug. |
| Category | This field displays what category the log entry fits. The categories are based on software and hardware features of the switch. For example the category AUTODOS records events which deal with the Auto Denial of Service features you set up and the category SYSTEM records events which deal with the overall operation of the switch. |
| Time | This field specifies the time when the switch recorded the log event. The switch resets its internal clock when it is restarted to 2006/5/1 00:00:00. |
| Message | This field displays an explanation for the log entry. |
This chapter describes how to user Simple Network Management Protocol (SNMP) to manage and monitor the switch.
18.1 About SNMP
Simple Network Management Protocol (SNMP) is an application layer protocol used to manage and monitor TCP/IP-based devices. SNMP is used to exchange management information between the network management system (NMS) and a network element (NE). A manager station can manage and monitor the switch through the network via SNMP version one (SNMPv1), SNMP version 2c or SNMP version 3. The next figure illustrates an SNMP management operation. SNMP is only available if TCP/IP is configured.
Figure 57 SNMP Management Model
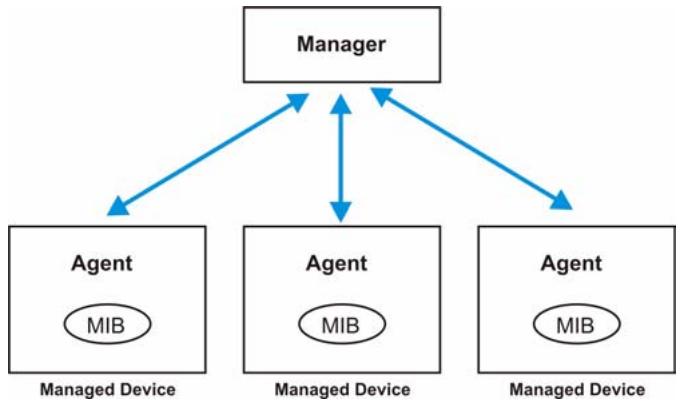
flowchart
graph TD
    A["Manager"] --> B["Agent MIB"]
    A --> C["Agent MIB"]
    A --> D["Agent MIB"]
    B <--> C
    C <--> D
    style A fill:#f9f,stroke:#333
    style B fill:#ccf,stroke:#333
    style C fill:#ccf,stroke:#333
    style D fill:#ccf,stroke:#333
An SNMP managed network consists of two main components: agents and a manager.
An agent is a management software module that resides in a managed switch (the switch). An agent translates the local management information from the managed switch into a form compatible with SNMP. The manager is the console through which network administrators perform network management functions. It executes applications that control and monitor managed devices.
The managed devices contain object variables/managed objects that define each piece of information to be collected about a switch. Examples of variables include such as number of packets received, node port status etc. A Management Information Base (MIB) is a collection of managed objects. SNMP allows a manager and agents to communicate for the purpose of accessing these objects.
SNMP itself is a simple request/response protocol based on the manager/agent model. The manager issues a request and the agent returns responses using the following protocol operations:
Table 38 SNMP Commands
| COMMAND | DESCRIPTION |
| Get | Allows the manager to retrieve an object variable from the agent. |
| GetNext | Allows the manager to retrieve the next object variable from a table or list within an agent. In SNMPv1, when a manager wants to retrieve all elements of a table from an agent, it initiates a Get operation, followed by a series of GetNext operations. |
| Set | Allows the manager to set values for object variables within an agent. |
| Trap | Used by the agent to inform the manager of some events. |
18.1.1 Supported MIBs
MIBs let administrators collect statistics and monitor status and performance.
The switch supports the following MIBs:
• RFC 1213 SNMP MIB II
- MIB II - System
- MIB II - Interface
• RFC 1398 MIB - Ether-like
- RFC 1157 SNMP v1
- RFC 1155 SMI
• RFC 2674 SNMPv2, SNMPv2c
- RFC 2819 RMON
- Group 1 (Statistics)
- Group 2 (History)
- Group 3 (Alarm)
- Gropu 4 (Event)
18.1.2 SNMP v3 and Authentication
SNMP v3 adds the use of groups and users to enhance security for SNMP management. Groups are assigned access rights to SNMP objects. Users are members of groups and are therefore limited to the access rights the group has. In addition users can also be required to authenticate before conducting SNMP management sessions.

SNMP v3 is enabled by creating SNMP groups and users. Once SNMP v3 is enabled, SNMP community should be configured for SNMP v1 and/or v2c access.
18.1.3 SNMP EngineID
The Engine ID is a unique identifier in SNMP environment. The switch automatically generates a unique Engine ID based on the MAC address of the switch. The Engine ID can also be changed. Use the SNMP EngineID screen to specify the Engine ID for the switch.
Click SNMP > EngineID in the navigation panel to view the screen as shown.
Figure 58 SNMP EngineID
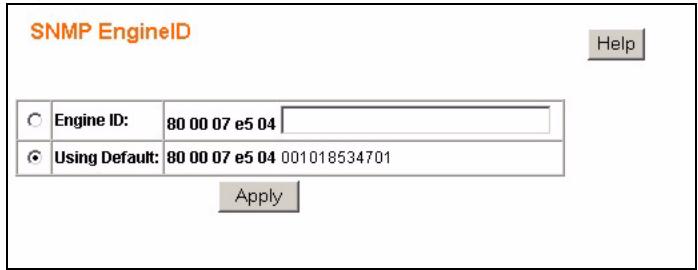
The following table describes the labels in this screen.
Table 39 SNMP EngineID
| LABEL | DESCRIPTION |
| Engine ID | Select this radio button and enter a unique Engine ID for the switch. The format is limited to hexadecimal characters (0~9 and a~f) and the maximum length is 27 octets (each octet is made up of a pair of hexadecimal characters). |
| Using Default | Select this radio button to use the default Engine ID (based on the MAC address of the switch) for SNMP. |
| Apply | Click this to save your changes to the switch. |
18.2 SNMP Group
SNMP groups are used to categorize SNMP managers with respect to access rights. Use the SNMP Group screen to create SNMP groups with different levels of access to the switch. Click SNMP > Group to view the screen as shown.
Figure 59 SNMP Group
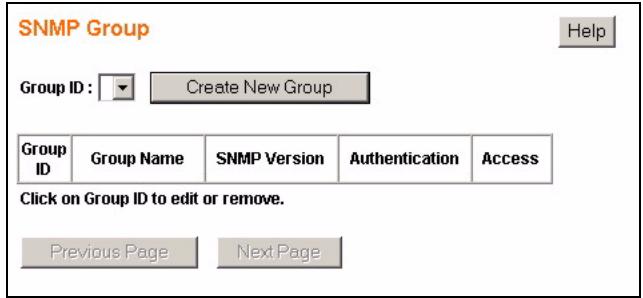
The following table describes the labels in this screen.
Table 40 SNMP Group
| LABEL | DESCRIPTION |
| Group ID | Select the SNMP group you want to edit. |
| Create New Group | Click this to configure a new SNMP group. |
| Group ID | This field indicates the group number. It is used for identification only. Click on the individual group number to edit the group settings. |
| Group Name | This field displays the name of the SNMP group. |
| SNMP Version | This field indicates which SNMP version this group uses to manage the switch. |
| Authentication | This field indicates whether authentication is required for members of this group. Authentication can only be configured for SNMP v3. |
| Access | This field indicates the rights this group has for SNMP management. “R” indicates that this group has read rights and “W” indicates that this group has write rights on the switch. |
| Previous Page/Next Page | Use these navigation links to browse all of your SNMP groups. |
18.2.1 SNMP Group - Create
Click on the Create New Group link in the SNMP Group screen to add an SNMP group. The screen displays as shown.
Figure 60 SNMP Group - Create
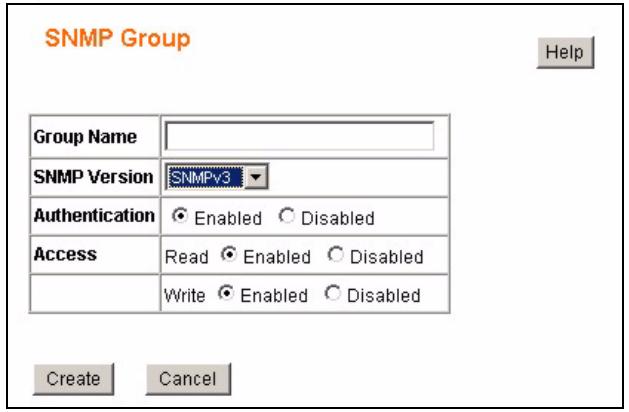
The following table describes the labels in this screen.
Table 41 SNMP Group - Create
| LABEL | DESCRIPTION |
| Group Name | Specify the name for this SNMP group. |
| SNMP Version | Specify the SNMP version this group uses to manage the switch. |
| Authentication | This field is only editable if you select SNMPv3 in the SNMP Version field. Select Enabled to force SNMP v3 groups to authenticate with the switch or select Disabled to deactivate authentication for the SNMP v3 groups. For SNMP v1 and SNMP v2c authentication is always disabled. |
| Access | Read - select Enabled to allow this group to collect information from this switch.Write - select Enabled to allow this group to create or edit SNMP objects. |
| Create | Click this to add this SNMP group to the switch.Note: A maximum of ten groups can be created on the switch. |
| Cancel | Click this to go back to the main SNMP Group screen without saving your changes. |
18.2.2 SNMP Group - Modify
Click on the Group ID number or select a Group ID from the Group ID drop down list box in the SNMP Group screen to modify the settings of an existing group.
Figure 61 SNMP Group - Modify
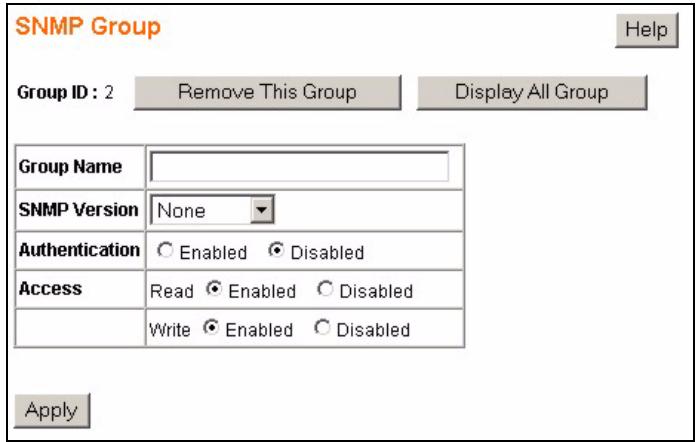
The following table describes the labels in this screen.
Table 42 SNMP Group - Modify
| LABEL | DESCRIPTION |
| Group ID | This field indicates which group you are modifying.Click onRemove This Groupto delete this group configuration from the switch.Click onDisplay All Groupto view the mainSNMP Groupscreen. |
| Group Name | Edit the name for this SNMP group. |
| SNMP Version | Specify the SNMP version this group uses to manage the switch. |
| Authentication | This field is only editable if you selectSNMPv3in theSNMP Versionfield. SelectEnabledto force SNMP v3 groups to authenticate with the switch or selectDisabledto deactivate authentication for the SNMP v3 groups. For SNMP v1 and SNMP v2c authentication is always disabled. |
| Access | Read - select Enabled to allow this group to collect information from this switch.Write - select Enabled to allow this group to create or edit SNMP objects. |
| Apply | Click this to save your settings to the switch. |
18.3 SNMP User
SNMP users are used to define the security parameters of SNMP clients in an SNMP v3 environment. Each SNMP user is a member of a predefined SNMP group. SNMP managers must use the proper SNMP user and group credentials to gain access to and manage the switch. Use the SNMP User screen to create SNMP users and associate them to SNMP groups. Click SNMP >User to view the screen as shown.
Figure 62 SNMP User
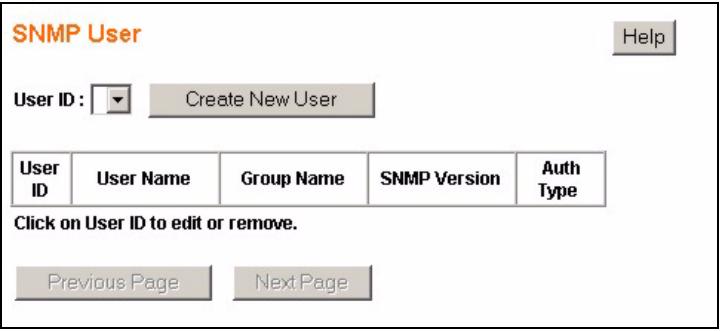
The following table describes the labels in this screen.
Table 43 SNMP User
| LABEL | DESCRIPTION |
| User ID | Select the SNMP user you want to edit. |
| Create New User | Click this to configure a new SNMP user. |
| User ID | This field indicates the user number. It is used for identification only. Click on the individual user number to edit the user settings. |
| User Name | This field displays the name of the SNMP user. |
| Group Name | This field displays the name of the SNMP group the user belongs to. |
| SNMP Version | This field indicates which SNMP version this user uses to manage the switch. |
| Auth Type | This field indicates whether authentication is required for this user. Authentication can only be configured for SNMP v3. This field displays None if no authentication is required for this user or it displays MD5 if Message Digest authentication is enabled. |
| Previous Page/Next Page | Use these navigation links to browse all of your SNMP groups. |
18.3.1 SNMP User - Create
Click on the Create New User link in the SNMP User screen to add an SNMP user. The screen displays as shown.
Figure 63 SNMP User - Create
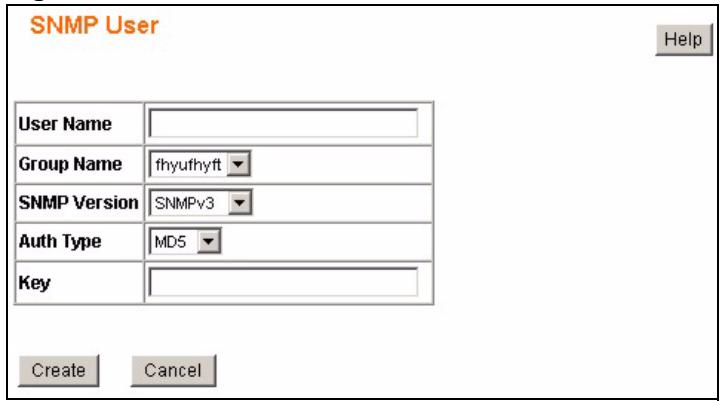
The following table describes the labels in this screen.
Table 44 SNMP User - Create
| LABEL | DESCRIPTION |
| User Name | Specify the name for this SNMP user. |
| Group Name | Specify the SNMP group this user belongs to. |
| SNMP Version | Specify the SNMP version this group uses to manage the switch. |
| Auth Type | Authentication can only be configured for SNMP v3.Select None to allow this user to manage the switch without authentication or select MD5 and configure the Key field to force this user to authenticate with the switch. |
| Key | Enter the MD5 key this user must use to authenticate with the switch. |
| Create | Click this to add this SNMP user to the switch. |
| Cancel | Click this to go back to the main SNMP Group screen without saving your changes. |
18.3.2 SNMP User - Modify
Click on the User ID number or select a User ID from the User ID drop down list box in the SNMP User screen to modify the settings of an existing user.
Figure 64 SNMP User - Modify
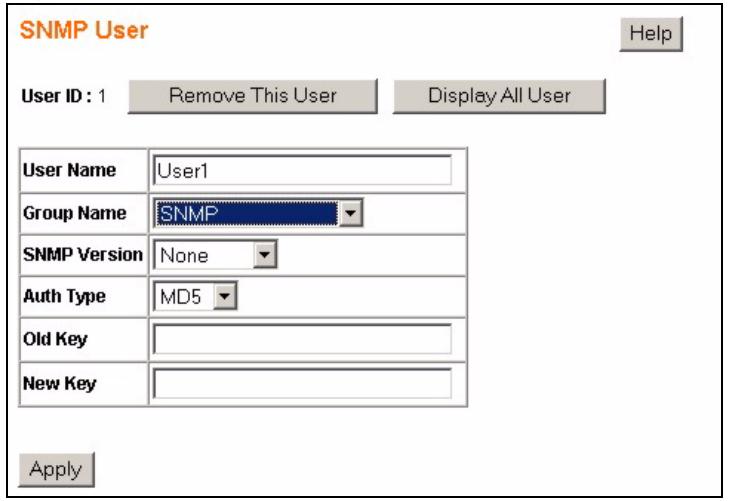
The following table describes the labels in this screen.
Table 45 SNMP User - Modify
| LABEL | DESCRIPTION |
| User ID | This field indicates which user you are modifying.Click onRemove This Userto delete this user configuration from the switch.Click onDisplay All Userto view the mainSNMP Userscreen. |
| User Name | Edit the name for this SNMP user. |
| Group Name | Select the SNMP group this user should belong to. |
| SNMP Version | Specify the SNMP version this group uses to manage the switch. |
| Auth Type | Authentication can only be configured for SNMP v3.Select Noneto allow this user to manage the switch without authentication or select MD5and configure thenew Keyfield to force this user to authenticate with the switch. |
| Old Key | Enter the old MD5 key this user used for authentication, if you are setting up the key for the first time, leave this field blank. |
| New Key | Enter the new MD5 key this user must use to authenticate with the switch. |
| Apply | Click this to save your settings to the switch. |
18.4 SNMP Community
SNMP communities are used to define the security parameters of SNMP clients in an SNMP v1 and SNMP v2c environments. The default SNMP community is “public” for both SNMP v1 and SNMP v2c before SNMP v3 is enabled. Once SNMP v3 is enabled, the communities of SNMP v1 and v2c have to be unique and cannot be shared. Use the SNMP Community screen to create SNMP communities and associate SNMP groups to them. Click SNMP > Community to view the screen as shown.
Figure 65 SNMP Community
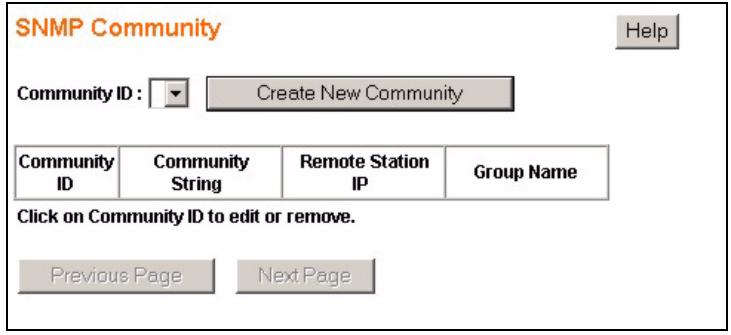
The following table describes the labels in this screen.
Table 46 SNMP Community
| LABEL | DESCRIPTION |
| Community ID | Select the SNMP community you want to edit. |
| Create New Community | Click this to configure a new SNMP community. |
| Community ID | This field indicates the community number. It is used for identification only. Click on the individual community number to edit the community settings. |
| Community String | This field indicates the SNMP community string.An SNMP community string is a text string that acts as a password. It is used to authenticate messages that are sent between the management station (the SNMP manager) and the device (the SNMP agent). The community string is included in every packet that is transmitted between the SNMP manager and the SNMP agent. |
| Remote Station IP | This field displays the IP address of the remote SNMP management station. |
| Group Name | This field indicates the group which is part of this SNMP community. |
| Previous Page/Next Page | Use these navigation links to browse all of your SNMP groups. |
18.4.1 SNMP Community - Create
Click on the Create New Community link in the SNMP Community screen to add an SNMP community. The screen displays as shown.
Figure 66 SNMP Community - Create
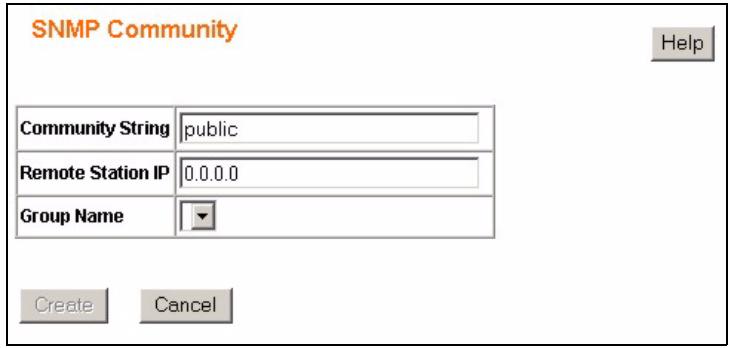
The following table describes the labels in this screen.
Table 47 SNMP Community - Create
| LABEL | DESCRIPTION |
| Community String | An SNMP community string is a text string that acts as a password. It is used to authenticate messages that are sent between the management station (the SNMP manager) and the device (the SNMP agent). The community string is included in every packet that is transmitted between the SNMP manager and the SNMP agent. Type the community string for this community. |
| Remote Station IP | Specify the IP address of the remote SNMP management station in dotted decimal notation. |
| Group Name | Select the SNMP group you want to belong to this community. |
| Create | Click this to add this SNMP community to the switch. |
| Cancel | Click this to go back to the main SNMP Community screen without saving your changes. |
18.4.2 SNMP Community - Modify
Click on the Community ID number or select a Community ID from the Community ID drop down list box in the SNMP Community screen to modify the settings of an existing community.
Figure 67 SNMP Community - Modify
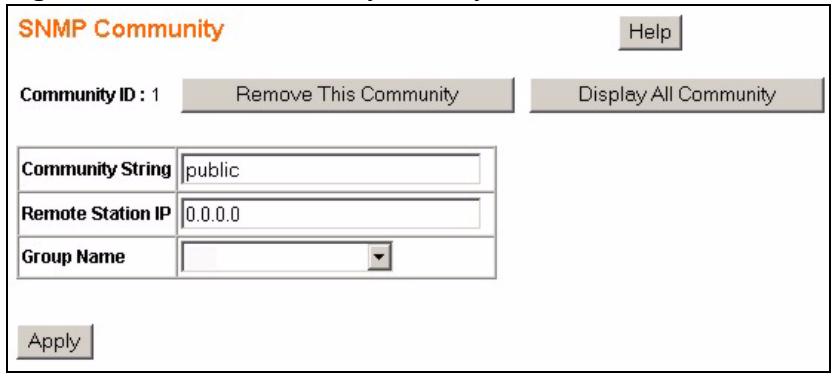
The following table describes the labels in this screen.
Table 48 SNMP Community - Modify
| LABEL | DESCRIPTION |
| User ID | This field indicates which community you are modifying.Click onRemove This Communityto delete this user configuration from the switch.Click onDisplay All Communityto view the mainSNMP Communityscreen. |
| Community String | An SNMP community string is a text string that acts as a password. It is used to authenticate messages that are sent between the management station (the SNMP manager) and the device (the SNMP agent). The community string is included in every packet that is transmitted between the SNMP manager and the SNMP agent.Type the community string for this community. |
| Remote Station IP | Specify the IP address of the remote SNMP management station in dotted decimal notation. |
| Group Name | Select the SNMP group you want to belong to this community. |
| Apply | Click this to save your settings to the switch. |
18.5 SNMP Notification
SNMP supports a notification mechanism to alert SNMP managers when events occur. There are two types of notification mechanisms supported by the switch.
- SNMP Notification - SNMP traps are sent to external SNMP management stations.
- Authentication Notification - Failed authentication attempts are logged by the switch.
Use the SNMP Notification section of the SNMP Trap Station screen to enable the notification mechanisms. Click SNMP > Trap Station to view the screen as shown.
Figure 68 SNMP Notification
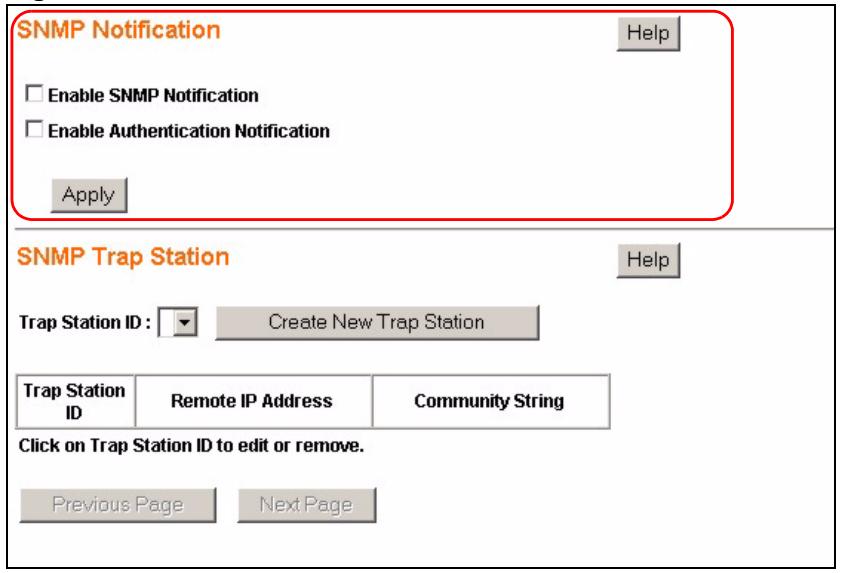
The following table describes the labels in this screen.
Table 49 SNMP Notification
| LABEL | DESCRIPTION |
| Enable SNMP Notification | Select this to enable the sending of SNMP traps to a remote SNMP management station. |
| Enable Authentication Notification | Select this to enable logging of failed authentication attempts. |
| Apply | Click this to save your settings to the switch. |
18.6 SNMP Trap Station
SNMP traps are used to send out SNMP notifications of urgent or normal events in the system to external management stations. Use the SNMP Trap Station screen to enable the sending of SNMP traps to a remote SNMP management station(s). Click SNMP > Trap Station to view the screen as shown.
Figure 69 SNMP Trap Station
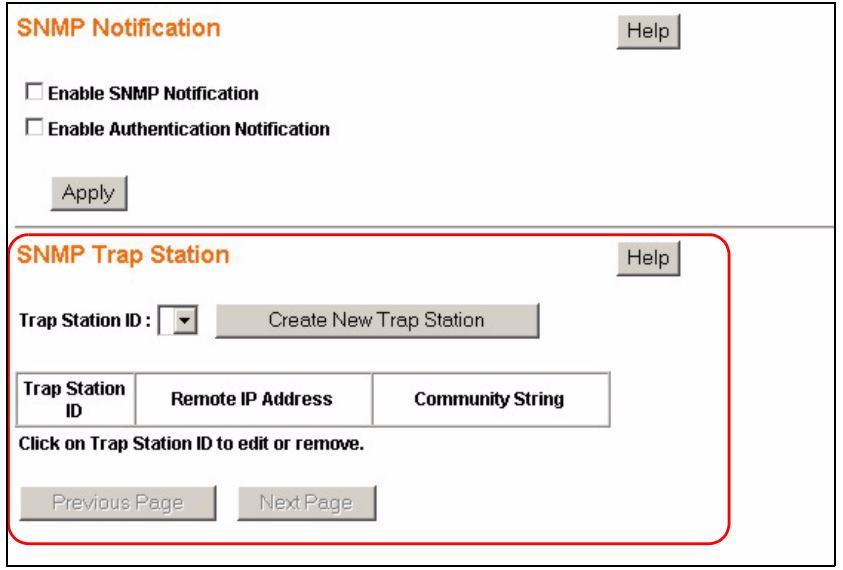
The following table describes the labels in this screen.
Table 50 SNMP Trap Station
| LABEL | DESCRIPTION |
| Trap Station ID | Select the SNMP trap station you want to edit. |
| Create New Trap Station | Click this to configure a new SNMP Trap Station. |
| Trap Station ID | This field indicates the trap station number. It is used for identification only. Click on the individual trap station number to edit the trap station settings. |
| Remote IP Address | This field displays the IP address of the remote SNMP management station. |
| Community String | An SNMP community string is a text string that acts as a password. It is used to authenticate messages that are sent between the management station (the SNMP manager) and the device (the SNMP agent). The community string is included in every packet that is transmitted between the SNMP manager and the SNMP agent. This field displays the community string of this remote trap station. |
| Previous Page/Next Page | Use these navigation links to browse all of your SNMP groups. |
18.6.1 SNMP Trap Station - Create
Click on the Create New Trap Station link in the SNMP Trap Station screen to add an SNMP Trap Station. The screen displays as shown.
Figure 70 SNMP Trap Station - Create
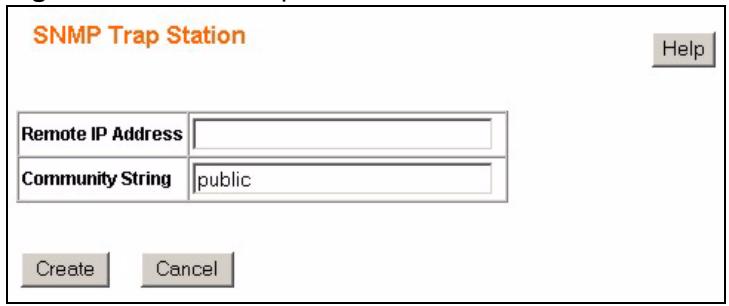
The following table describes the labels in this screen.
Table 51 SNMP Trap Station - Create
| LABEL | DESCRIPTION |
| Remote IP Address | Enter the IP address of the remote trap station in dotted decimal notation. |
| Community String | Specify the community string used with this remote trap station. |
| Create | Click this to add this SNMP user to the switch. |
| Cancel | Click this to go back to the main SNMP Group screen without saving your changes. |
18.6.2 SNMP Trap Station - Modify
Click on the Trap Station ID number or select a Trap Station ID from the Trap Station ID drop down list box in the SNMP Trap Station screen to modify the settings of an existing trap station.
Figure 71 SNMP Trap Station - Modify
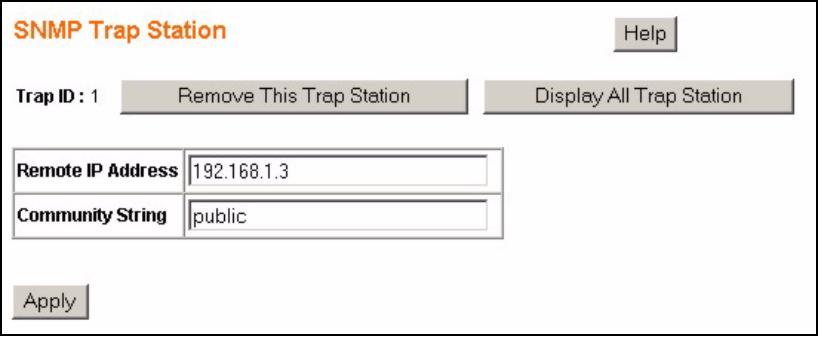
The following table describes the labels in this screen.
Table 52 SNMP Trap Station - Modify
| LABEL | DESCRIPTION |
| Trap ID | This field indicates which trap station you are modifying.Click onRemove This Trap Stationto delete this trap station configuration from the switch.Click onDisplay All Trap Stationto view the mainSNMP Trap Stationscreen. |
| Remote IP Address | Enter the IP address of the remote trap station in dotted decimal notation. |
| Community String | Specify the community string used with this remote trap station. |
| Apply | Click this to save your settings to the switch. |
This chapter explains how to configure the RMON-Lite screens.
19.1 RMON-Lite Overview
The Remote Network Monitoring Management Information Base (RMON MIB) defines objects for managing remote network monitoring devices. The remote network monitoring devices, referred to as monitors or probes, are usually stand-alone devices and devote significant internal resources for the purposes of managing a network. There are a total of nine RMON MIB groups defined in RFC 2819. The switch supports four of the RMON MIB groups:
- Group 1 (Statistics)
- Group 2 (History)
- Group 3 (Alarm)
- Group 9 (Event)
The switch's implementation is therefore referred to as RMON-Lite. The following sections describe how to configure the RMON-Lite settings on the switch. Refer to RFC 2819 for more information on RMON MIBs.
19.2 RMON Statistics : Overview
Click RMON-Lite in the navigation panel to open the RMON Statistics : Overview screen. Use this screen to look at and configure settings for gathering statistics for the Ethernet ports on the switch.
Figure 72 RMON Statistics : Overview
![RMON-Lite RMON MIB Table: [1] Statistics Apply Help RMON Statistics : Overview Refresh Help Data Source Owner Status Data Source Owner Status Port 01 monitor Disabled Port 15 monitor Disabled Port 02 monitor Disabled Port 16 monitor Disabled Port 03 monitor Disabled Port 17 monitor Disabled Port 04 monitor Disabled Port 18 monitor Disabled Port 05 monitor Disabled Port 19 monitor Disabled Port 06 monitor Disabled Port 20 monitor Disabled Port 07 monitor Disabled Port 21 monitor Disabled Port 08 monitor Disabled Port 22 monitor Disabled Port 09 monitor Disabled Port 23 monitor Disabled Port 10 monitor Disabled Port 24 monitor Disabled Port 11 monitor Disabled Port 25 monitor Disabled Port 12 monitor Disabled Port 26 monitor Disabled Port 13 monitor Disabled Port 27 monitor Disabled Port 14 monitor Disabled Port 28 monitor Disabled (Click the DataSource ID to get the detail)](/content/2025/01/165147/images/b084cad523536a7c158850a4d314ff03414e374df3beb66fc7178f2e330bf2ad.jpg)
The following table describes the labels in this screen.
Table 53 RMON Statistics : Overview
| LABEL | DESCRIPTION |
| RMON MIB Table: | Use this drop down list box to select the MIB table you want to view. Click Apply to refresh the screen to the selected MIB table view. |
| Refresh | Click this to update all the fields in the RMON-Lite Statistics : Overview screen. |
| Data Source | This field displays the ports on the switch. Click on the port number to configure the settings for that port. |
| Owner | This field displays the entry creator. It displays monitor if the entry was created by the switch itself. |
| Status | This field displays Enabled, if statistics are being collected on this port. It displays Disabled, if statistics are not being collected on this port. |
19.3 RMON-Lite Statistics : Port
Use this screen to enable statistics gathering and view the statistics for individual ports. Click on a port number in the RMON Statistics: Overview screen to view the screen as shown.
Figure 73 RMON Statistics : Port
![RMON-Lite RMON MIB Table: [1] Statistics Apply Help RMON Statistics : Port 01, Disabled Set Enable Clear Refresh Help RMON MIB Object Value RMON MIB Object Value StatsDropEvents 0 StatsJabbers 0 StatsOctets 0 StatsCollisions 0 StatsPkts 0 StatsPkts640ctets 0 StatsBroadcastPkts 0 StatsPkts65to1270ctets 0 StatsMulticastPkts 0 StatsPkts128to2550ctets 0 StatsCRCAlignErrors 0 StatsPkts256to5110ctets 0 StatsUndersizePkts 0 StatsPkts512to10230ctets 0 StatsOversizePkts 0 StatsPkts1024to15180ctets 0 StatsFragments 0 -- Statistics Overview](/content/2025/01/165147/images/564a78f707f4db22348508b835158e3be54e3383e96e03e488b74364b9307fce.jpg)
The following table describes the labels in this screen.
Table 54 RMON Statistics : Port
| LABEL | DESCRIPTION |
| RMON MIB Table: | Use this drop down list box to select the MIB table you want to view. Click Apply to refresh the screen to the selected MIB table view. |
| Set Enable | Click this to activate statistics gathering for this port. |
| Clear | Click this to reset all statistics values to “0”. |
| Refresh | Click this to update all the fields in the RMON Statistics : Port screen. |
| RMON MIB Object | This column displays all types of statistics gathered for this port. It displays the results in the Value column. |
| StatsDropEvents | This field displays the total number of packets that were dropped. |
| StatsOctets | This field displays the total number of octets received. |
| StatsPkts | This field displays the total number of all good packets received. |
| StatsBroadcastPkts | This field displays the total number of good broadcast packets received. |
| StatsMulticastPkts | This field displays the total number of good multicast packets received. |
| StatsCRCAignErrors | This field displays the number of packets (between 64 ~ 1518 octets long) dropped because they either had bad Frame Check Sequence (FCS) or non-integral number of octets (alignment error). |
| StatsUndersizePkts | This field displays the number of packets (including bad packets) received that were between 0 and 64 octets in length. |
| StatsOversizePkts | This field displays the number of untagged packets (including bad packets) received that were greater than 1518 octets in length. |
| StatsFragments | This field displays the number of frames dropped because they were less than 64 octets long, and contained an invalid FCS, including non-integral and integral lengths. |
| StatsJabbers | This field displays the number of frames dropped because they were longer than 1518 octets and contained an invalid FCS, including alignment errors. |
| StatsCollisions | This field displays the total number of collisions occurred. |
| StatsPkts64Octets | This field displays the number of packets (including bad packets) received that were 64 octets in length. |
| StatsPkts65to127Octets | This field displays the number of packets (including bad packets) received that were between 65 and 127 octets in length. |
| StatsPkts128to255Octets | This field displays the number of packets (including bad packets) received that were between 128 and 255 octets in length. |
| StatsPkts256to511Octets | This field displays the number of packets (including bad packets) received that were between 256 and 511 octets in length. |
| StatsPkts512to1023Octets | This field displays the number of packets (including bad packets) received that were between 512 and 1023 octets in length. |
| StatsPkts1024to1518Octets | This field displays the number of untagged packets (including bad packets) received that were between 1024 and 1518 octets in length. This number also includes tagged packets received that were 1522 octets in size. |
19.4 RMON-Lite History MIB
RMON-Lite History MIB configuration is divided into two parts: [2] History Control and [2] History Statistics.
- Use the [2] History Control screens to view and define the statistical sampling of data from activity in your network. Statistical sampling is controlled by defining the interface (port), polling period and the number of samples to be taken per polling period.
- Use the [2] History Statistics screens to view the results of statistical sampling on the ports.
19.4.1 RMON History Control : Overview
Click RMON-Lite in the navigation panel and select [2] History Control to open the RMON History Control: Overview screen. Use this screen to view and configure RMON history configuration settings.
Figure 74 RMON History Control : Overview.
![RMON-Lite RMON MIB Table: [2] History Control Apply Help RMON History Control : Overview Refresh Help Index Data Source Bucket Requested Bucket Granted Interval (Sec.) Owner Status 1 Port 01 50 50 1800 monitor Disabled 2 Port 02 50 50 1800 monitor Disabled 3 Port 03 50 50 1800 monitor Disabled 4 Port 04 50 50 1800 monitor Disabled 5 Port 05 50 50 1800 monitor Disabled 6 Port 06 50 50 1800 monitor Disabled 7 Port 07 50 50 1800](/content/2025/01/165147/images/23c7517aa9144bd51eb9b3f23a304fdf72c72b8a51c4467a5b26ad1c9cbb8d2c.jpg)
The following table describes the labels in this screen.
Table 55 RMON History Control : Overview.
| LABEL | DESCRIPTION |
| RMON MIB Table: | Use this drop down list box to select the MIB table you want to view. ClickApplyto refresh the screen to the selected MIB table view. |
| Refresh | Click this to update all the fields in the RMON History Control : Overview screen. |
| Index | This field displays the configuration index number. |
| Data Source | This is the port of the switch polled for data. |
| Bucket Requested | This field displays the number of data samplings the network manager requests the probe to store. |
| Bucket Granted | This field displays the number of data samplings the probe allows to store. |
| Interval (sec) | This field displays the time between data samplings. |
| Owner | This field displays the entry creator. It displays “monitor” if the entry was created by the switch itself. |
| Status | This field displaysEnabledif historical polling is activated on the port. It displaysDisabledif historical polling is not activated on the port. |
19.4.2 RMON History Control : Modify
Use the RMON History Control : Modify screen to define the statistical sampling of data from activity in your network. Click an index number in the RMON History Control :
Overview screen to see the screen as shown.
Figure 75 RMON History Control : Modify
![RMON-Lite RMON MIB Table: [2] History Control Apply Help RMON History Control : Modify - Index 1, Disabled Help Index : 1 DataSource : Port 01 BucketRequested : 50 Interval(Sec.) : 1800 Owner : monitor Status : ○ Enable ◆ Disable Apply History Control Overview](/content/2025/01/165147/images/6ba2feb8f62bf930d16403148521d10847d7473f13e8092a49200851b97a9e64.jpg)
The following table describes the labels in this screen.
Table 56 RMON History Control : Modify
| LABEL | DESCRIPTION |
| RMON MIB Table: | Use this drop down list box to select the MIB table you want to view. ClickApplyto refresh the screen to the selected MIB table view. |
| Index | This field displays the entry index number. |
| Data Source | This field displays the port number associated with theIndexentry. |
| BucketRequested | This field displays the number of samplings the Owner of the entry requests. |
| Interval | Enter the time (in seconds) between data samplings. |
| Owner | Enter a descriptive name of the application that creates this entry. You can use 1-64 printable characters. Spaces are not allowed. |
| Status | Select Enable/Disable to activate or deactivate statistical sampling on the port. |
| Apply | Click this to save the settings on the switch. |
| History Control Overview | Click this to go back to the RMON History Control : Overview screen. |
19.4.3 RMON History Statistics : Overview
Use the RMON History Statistics : Overview screen to view the results of statistical sampling on the ports. Select [2] History Statistics from the RMON MIB Table: drop down listbox in the RMON-Lite screen to view the screen as shown.
Figure 76 RMON History Statistics : Overview.
![RMON-Lite RMON MIB Table: [2] History Statistics Apply Help RMON History Statistics : Overview Refresh Help History Control Index Data Source Bucket Granted Interval Owner 1 Port 01 50 1800 monitor](/content/2025/01/165147/images/00ac2fd4d6654ae871ac0e5fd68f53a16cd59be12e2fb326cb12cfc15128adeb.jpg)
The following table describes the labels in this screen.
Table 57 RMON History Statistics : Overview
| LABEL | DESCRIPTION |
| RMON MIB Table: | Use this drop down list box to select the MIB table you want to view. ClickApplyto refresh the screen to the selected MIB table view. |
| Refresh | Click this to update all the fields in the RMON History Statistics : Overviewscreen. |
| History Control Index | This field displays the configuration index number. Click on the index number to view the details for this entry. |
| Data Source | This is the port of the switch polled for data. |
| Bucket Granted | This field displays the number of data samplings the probe allows to store. |
| Interval | This field displays the time between data samplings in seconds. |
| Owner | This field displays the creator of this entry. |
19.4.4 RMON History Statistics: Control
Use the RMON History Statistics: Control screen to view the details of each polling sample collected for the history control index entries you configured. Click on an individual History Control Index entry in the RMON History Statistics: Overview screen to view the screen as shown.
Figure 77 RMON History Statistics: Control
![RMON-Lite RMON MIB Table: [2] History Statistics ▼ Apply Help RMON History Statistics: Control Index (14) Refresh Help Sample Drop Index Events Octects Packets Broadcast Multicast CRCAlign Undersize Oversize Fragments Jabbers Collisions Utilization 1 0 0 0 0 0 0 0 0 0 0 0 0 2 0 0 0 0 0 0 0 0 0 0 0 0 3 0 0 0 0 0 0 0 0 0 0 0 0 History Statistics Overview](/content/2025/01/165147/images/8156c9b447ca639513f257237ab4531658221685df7632d59d8131d110aee330.jpg)
The following table describes the labels in this screen.
Table 58 RMON History Statistics: Control
| LABEL | DESCRIPTION |
| RMON MIB Table: | Use this drop down list box to select the MIB table you want to view. Click Apply to refresh the screen to the selected MIB table view. |
| Refresh | Click this to update all the fields in the RMON History Statistics : Control Index screen. |
| Sample Index | This field displays the index number of the polling sample collected on the port. |
| Drop Events | This field displays the total number of packets that were dropped in this polling sample. |
| Octets | This field displays the total number of octets received in this polling sample. |
| Packets | This field displays the total number of all good packets received in this polling sample. |
| Broadcast Packets | This field displays the total number of good broadcast packets received in this polling sample. |
| Multicast Packets | This field displays the total number of good multicast packets received in this polling sample. |
| CRCAlign Errors | This field displays the number of packets (between 64 ~ 1518 octets long) dropped in this polling sample because they either had bad Frame Check Sequence (FCS) or non-integral number of octets (alignment error). |
| Undersize Packets | This field displays the number of packets (including bad packets) received in this polling sample that were between 0 and 64 octets in length. |
| Oversize Packets | This field displays the number of untagged packets (including bad packets) received in this polling sample that were greater than 1518 octets in length. |
| Fragments | This field displays the number of frames dropped in this polling sample because they were less than 64 octets long, and contained an invalid FCS, including non-integral and integral lengths. |
| Jabbers | This field displays the number of frames dropped in this polling sample because they were longer than 1518 octets and contained an invalid FCS, including alignment errors. |
| Collisions | This field displays the total number of collisions that occurred in this polling sample. |
| Utilization (%) | This field displays the utilization as a percentage of maximum utilization allowed on the port in this polling sample. |
| History Statistics Overview | Click this to go back to the RMON History Statistics: Overview screen. |
19.5 RMON Alarm: Overview
Use the RMON Alarm: Overview screen to view configured alarms that occur when the sampled data exceeds the specified threshold. To open this screen select [3] Alarm in the RMON MIB Table: drop down list box in the RMON-Lite screen.
Figure 78 RMON Alarm: Overview.
![RMON-Lite RMON MIB Table: [3] Alarm Apply Help RMON Alarm : Overview Refresh Help Create new Alarm Index Interval (Sec.) Variable Sample Type Value Startup Alarm Rising Threshold Falling Threshold Rising Event Index Falling Event Index Owner Delete](/content/2025/01/165147/images/09705b4c9f7609bb1762e550330189f9a64d17f239ffd63ffbeac89c901869da.jpg)
The following table describes the labels in this screen.
Table 59 RMON Alarm: Overview
| LABEL | DESCRIPTION |
| RMON MIB Table: | Use this drop down list box to select the MIB table you want to view. ClickApplyto refresh the screen to the selected MIB table view. |
| Refresh | Click this to update all the fields in the RMON Alarm:Overviewscreen. |
| Create new Alarm | Click this to view the RMON Alarm: Create New Alarm screen where you can configure the parameters for an alarm. |
| Index | This field displays the alarm configuration index number. Click this number to edit the alarm entry. |
| Interval (sec) | This field displays the time interval (in seconds) between data samplings. |
| Variable | This field displays the name of the MIB field whose data is to be sampled. |
| Sample Type | This field displays the method of obtaining the sample value (absoluteValueordeltaValue). |
| Value | This field displays the value of the statistic during the last sampling period. This value is for comparing against the RisingThresholdandFallingThresholdvalues. |
| Startup Alarm | This field displays the alarm type (1:rising, 2:falling, or 3:risingOrFallingAlarm) that can be sent when this alarm is first activated. |
| RisingThreshold | This field displays the rising threshold value set up for this alarm. |
| FallingThreshold | This field displays the falling threshold value set up for this alarm. |
| Rising Event Index | This field indicates the index number of the event entry which corresponds to the time when the alarm threshold was crossed. |
| Falling Event Index | This field indicates the index number of the event entry which corresponds to the time when the alarm threshold was crossed. |
| Owner | This field displays the name of the creator of this entry. |
| Delete | Click this to remove the selected alarm entry. |
19.5.1 RMON Alarm : Create New Alarm
Use the RMON Alarm : Create New Alarm screen to configure RMON alarms. Click Create new Alarm or click on an existing alarm index entry in the RMON Alarm : Overview screen to view the screen as shown.
Figure 79 RMON Alarm : Create New Alarm
![RMON-Lite RMON MIB Table: [3] Alarm Apply Help RMON Alarm : Create New Alarm Help Index : 1 Interval(Sec.) : 0 Interface : (Unassigned) Counter : (Unassigned) Sample Type : Absolute Startup Alarm : Rising Threshold Rising Threshold : 0 Falling Threshold : 0 Rising Event : 0:None(Unassigned) Falling Event : 0:None(Unassigned) Owner : Apply Alarm Overview](/content/2025/01/165147/images/bd724cce72a7766045c0708733328f079bed1eb04a6a507fa8cc4716439e4e21.jpg)
The following table describes the labels in this screen.
Table 60 RMON Alarm : Create New Alarm
| LABEL | DESCRIPTION |
| RMON MIB Table: | Use this drop down list box to select the MIB table you want to view. ClickApplyto refresh the screen to the selected MIB table view. |
| Index | This field displays the index number of this alarm entry. |
| Interface | Select the port which is monitored for this alarm. |
| Counter | Select the data which is used to test if this alarm is triggered, the choices areDrop Events, Octets, Packetsand so on. |
| Sample Type | Select the method of obtaining the sample value. Choices areAbsoluteand Value. |
| Startup Alarm | Select the startup alarm type (Rising Threshold, Falling Threshold, Rising Or Falling Threshold). |
| Rising Threshold | Specify a rising threshold (between 0 and 2147483647). When a value is greater or equal to this threshold, the probe triggers an alarm. |
| Falling Threshold | Specify the falling threshold (between 0 and 2147483647). When a value is smaller or equal to this threshold, the probe triggers an alarm. |
| Rising Event | Select an index number of a rising event. |
| Falling Event | Select an index number of a falling event. |
| Owner | Enter a descriptive name of the application that creates this entry. You can use 1-64 printable ASCII characters. Spaces are not allowed. |
| Apply | Click this to save the settings to the switch. |
| Alarm Overview | Click this to go back to the RMON Alarm : Overview screen. |
19.6 RMON Event : Overview
Use the RMON Event : Overview screen to view and delete event entries configured on the switch. Select [9] Event from the RMON MIB Table: drop down listbox in the RMON-Lite screen to view the screen as shown.
Figure 80 RMON Event : Overview.
![RMON-Lite RMON MIB Table: [9] Event Apply Help RMON Event : Overview Refresh Help Create new Event Index Description Type Community Last Time Sent Owner Delete 1 Fire 1:None one 0D: 0H: 0M: 0S monitor DELETE](/content/2025/01/165147/images/2cc02a17294e919caa2c45b90e3c0a4ba77d56fea7732a222ae32617e43ac07e.jpg)
The following table describes the labels in this screen.
Table 61 RMON Event : Overview
| LABEL | DESCRIPTION |
| RMON MIB Table: | Use this drop down list box to select the MIB table you want to view. ClickApplyto refresh the screen to the selected MIB table view. |
| Refresh | Click this to update all the fields in the RMON Event : Overview screen. |
| Create new Event | Click this to configure new events on the switch. |
| Index | This field displays an event index number. Click this number to edit the event entry. |
| Description | This field displays a description of the event. |
| Type | This field displays the event type (1:None, 2:Log, 3:SNMP-Trap, 4:Log-and-Trap). |
| Community | This field displays the community or SNMP trap. |
| Last Time Sent | This field indicates the value of system up time on the switch when this event was last generated. It appears in the following format “XXD: XXH: XXM: XXS”, where “XX” stands for a number and “D” stands for days, “H” for hours, “M” for minutes and “S” for seconds. |
| Owner | This field displays the name of the creator of this entry. |
| Delete | Click this to remove the selected event configuration. |
19.6.1 RMON Event Configuration Screens
Use the RMON Event: Create and the RMON Event: Modify screens to configure RMON events. Click Create new Event in the RMON Event : Overview screen to view the screen as shown. You can also click an event index number in the RMON Event : Overview screen to edit an existing event configuration. Only the RMON Event : Create screen is shown as the modify screen contains the same fields.
Figure 81 RMON Event Configuration Screens
![RMON-Lite RMON MIB Table: [9] Event Apply Help RMON Event : Create New Event Help Index: 2 Description: Type: None Log SNMP-Trap Log and Trap Community: Owner: Apply Event Overview](/content/2025/01/165147/images/8031bce4d0959aac7bac1c30e137eae9b6e3872ccfa38f9e4e051deaf840752c.jpg)
The following table describes the labels in this screen.
Table 62 RMON Event Configuration Screens
| LABEL | DESCRIPTION |
| RMON MIB Table: | Use this drop down list box to select the MIB table you want to view. ClickApplyto refresh the screen to the selected MIB table view. |
| Index | This field displays the index number of the event entry. |
| Description | Enter a description of the event. You can use 1-127 printable ASCII characters. Spaces are allowed. You can also leave this field blank. |
| Type | Select an event type:None to do nothing.Log to generate a log when an associated alarm is generated.Trap to generate a trap when an associated alarm is generated.Log and Trap to generate a log entry and trap when an associated alarm is generated. |
| Community | This field displays the community (or password). You can use 1-31 printable ASCII characters. Spaces are not allowed. |
| Owner | Enter a descriptive name of the application that creates this entry. You can use 1-64 printable ASCII characters. Spaces are not allowed. |
| Apply | Click this to save the settings to the switch. |
| Event Overview | Click this to go to the RMON Event : Overview screen. |
19.7 RMON Event Log : Overview
Use the RMON Event Log : Overview screen to view the event log entries generated on the switch. All the entries in this table are generated by the RMON-Lite probe when the event value meets the risingEventThreshold or fallingEventThreshold assigned in the RMON Alarm screens.
Select [9] Event Log in the RMON MIB Table: drop down list box in any RMON Lite screen to view the screen as shown.
Figure 82 RMON Event Log : Overview.
![RMON-Lite RMON MIB Table: [9] Event Log Apply Help RMON Event Log : Overview Refresh Help Event Index Event Type Last Time Sent Owner 1 None 0D: 0H: 0M: 0S monitor](/content/2025/01/165147/images/67658ffdb436a5f1f5adf316241696d05e1866c330f8881ebc1bc8858d3dc738.jpg)
The following table describes the labels in this screen.
Table 63 RMON Event Log : Overview
| LABEL | DESCRIPTION |
| RMON MIB Table: | Use this drop down list box to select the MIB table you want to view. ClickApplyto refresh the screen to the selected MIB table view. |
| Refresh | Click this to update all the fields in the RMON Event Log : Overview screen. |
| Event Index | This field displays an event index number. |
| Event Type | This field displays the action taken when this event occurred: None, Log, Trap, or Log and Trap. |
| Last Time Sent | This field indicates the value of system up time on the switch when this event was last generated. It appears in the following format “XXD: XXH: XXM: XXS”, where “XX” stands for a number and “D” stands for days, “H” for hours, “M” for minutes and “S” for seconds. |
| Owner | This field displays the entry creator. It displays “monitor” if the entry was created by the switch itself. |
19.7.1 RMON Event Log : Event
Use the RMON Event Log : Event screen to view the details of existing RMON event log entries. Click on the specific Event Index numbers in the RMON Event Log : Overview screen to view the screen as shown.
Figure 83 RMON Event Log : Event
![RMON-Lite RMON MIB Table: [9] Event Log Apply Help RMON Event Log : Event Index (1) Log Index Log Time Log Description Event Log Overview Refresh Help](/content/2025/01/165147/images/df87133aef9c74ba628d63a0284ed756b8792b42f02176c461f7e8dadc8b9032.jpg)
The following table describes the labels in this screen.
Table 64 RMON Event Log : Event
| LABEL | DESCRIPTION |
| RMON MIB Table: | Use this drop down list box to select the MIB table you want to view. ClickApplyto refresh the screen to the selected MIB table view. |
| Refresh | Click this to update all the fields in the RMON Event Log : Event Index screen. |
| Log Index | This field displays a log index number. |
| Log Time | This field displays the time a log was generated. |
| Log Description | This field displays an implementation dependent description of the event that activated this log entry. |
| Event Log Overview | Click this to view the RMON Event Log : Overview screen. |
Dynamic ARP
This chapter describes how to activate dynamic Address Resolution Protocol (ARP) learning and how to enter static ARP table entries.
20.1 ARP Table Overview
Address Resolution Protocol (ARP) is a protocol for mapping an Internet Protocol address (IP address) to a physical machine address, also known as a Media Access Control or MAC address, on the local area network.
An IP (version 4) address is 32 bits long. In an Ethernet LAN, MAC addresses are 48 bits long. The ARP table maintains an association between each MAC address and its corresponding IP address.
20.1.1 ARP Table Entries
The ARP table is populated with MAC and corresponding IP address mappings in two different ways.
- DHCP Snooping - The switch listens to traffic from a DHCP server on a trusted port and learns IP-to-MAC address bindings by parsing DHCP ACK packets.
- Static Entries - The switch administrator can enter static IP-to-MAC address mappings via the web configurator.
20.1.2 How Dynamic ARP Works
When an incoming ARP packet destined for a host device on a local area network arrives at the switch, the switch's ARP program looks in the ARP table and, if it finds the address, sends it to the device.
If no entry is found for the IP address, dynamic ARP discards the ARP packet.
20.2 Enabling Dynamic ARP
Click Dynamic ARP > Settings in the navigation panel to open the following screen. Use the Dynamic ARP screen to configure ARP filtering on the specified VLANs.
Figure 84 Dynamic ARP
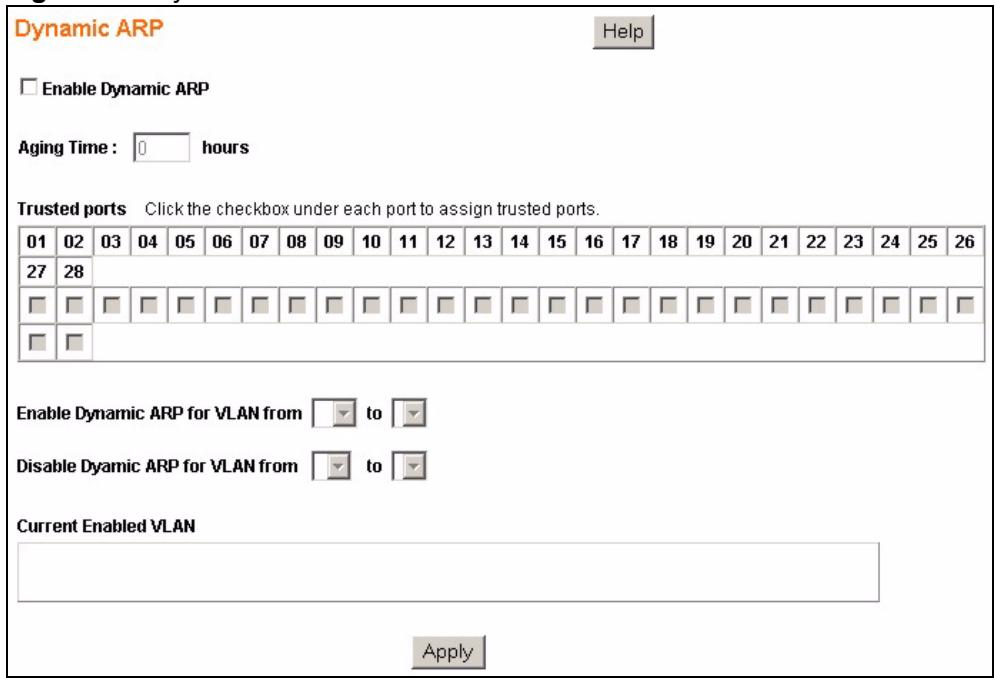
The following table describes the labels in this screen.
Table 65 ARP Table
| LABEL | DESCRIPTION |
| Enable Dynamic ARP | Select or deselect this to activate or deactivate Dynamic ARP on the switch. |
| Aging Time | Specify how long (in hours) the switch remembers the learned ARP table entries. Specify “0” to have the switch remember the ARP table entries for an unlimited time period. |
| Trusted ports | Packets arriving on trusted ports bypass all Dynamic ARP validation checks, and those arriving on untrusted ports undergo the validation process. Default state of all ports is untrusted.Select the trusted ports for each Dynamic ARP configuration you set up. |
| Enable Dynamic ARP for VLAN from .. to .. | Select the range of VLANs you want to perform validation checks based on the ARP entries in the ARP table. |
| Disable Dynamic ARP for VLAN from .. to .. | Select the range of VLANs you want to bypass validation checks based on the ARP entries in the ARP table. |
| Current Enabled VLAN | This field shows the VLANs for which Dynamic ARP validation is enabled. |
| Apply | Click this to save your settings to the switch. |
20.3 Viewing ARP Table Entries
Click Dynamic ARP > ARP Entries in the navigation panel to open the following screen. Use this screen to view and add entries to the ARP table.
Figure 85 Viewing ARP Table Entries
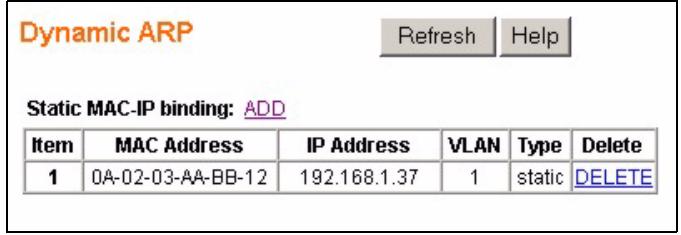
The following table describes the labels in this screen.
Table 66 ARP Table
| LABEL | DESCRIPTION |
| Static MAC-IP binding: ADD | This field is only available when you enable dynamic ARP in the Dynamic ARP > Settings screen. Click ADD to add a static entry to the ARP table. See Section 20.4 on page 135. |
| Item | This is the ARP table entry number. |
| MAC Address | This is the MAC address of the device connected to the switch with the corresponding IP address below. |
| IP Address | This is the learned IP address of a device connected to a switch port with corresponding MAC address above. |
| VLAN | This is the VLAN number of the device connected to the switch. |
| Type | This shows whether the MAC address is dynamic (learned by the switch) or static (manually entered in the Add Static MAC-IP binding screen). |
| DELETE | Click this to remove this ARP table entry. |
20.4 Adding ARP Table Entries
Click ADD in the Dynamic ARP > ARP Entries screen to open the Add Static MAC-IP binding screen. Use this screen to add entries to the ARP table.

You must first enable dynamic ARP in the Dynamic ARP > Settings screen before you can add static ARP table entries.
Figure 86 Viewing ARP Table Entries
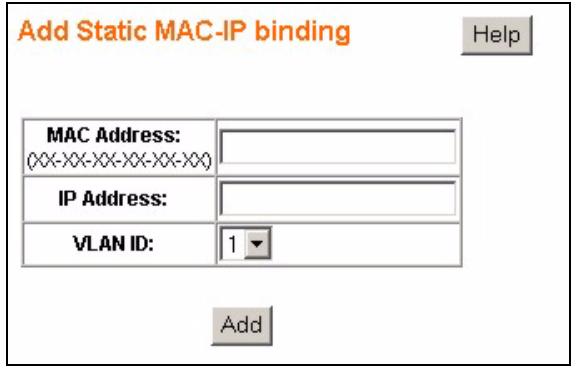
The following table describes the labels in this screen.
Table 67 ARP Table
| LABEL | DESCRIPTION |
| MAC Address (XX-XX-XX-XX-XX-XX) | Enter the MAC address in 6 pair hexadecimal format of the network device you want to be allowed to communicate via the switch. An example entry of a MAC address is “0a-b1-c2-d3-e4-f5”. |
| IP Address | Enter the corresponding IP address (in dotted decimal notation, ex 192.168.1.5) of the network device you want to be allowed to communicate via the switch. |
| VLAN ID | Select the VLAN ID for this ARP entry. |
| Add | Click this to save this entry to the ARP table and view the Dynamic ARP screen. |
Troubleshooting
This chapter covers potential problems and possible remedies.
21.1 Problems Starting Up the Switch
Table 68 Troubleshooting the Start-Up of Your Switch
| PROBLEM | CORRECTIVE ACTION |
| None of the LEDs turn on when you turn on the switch. | Check the power connection and make sure the power source is turned on. |
| If the error persists, you may have a hardware problem. In this case, you should contact your vendor. |
21.2 Problems Accessing the Switch
Table 69 Troubleshooting Accessing the Switch
| PROBLEM | CORRECTIVE ACTION |
| I cannot access the web configurator. | The administrator username is “admin”. The default administrator password is “admin”. The username and password are case-sensitive. Make sure that you enter the correct password and username using the proper casing. If you have changed the password and have now forgotten it, you will need to reset the switch to its factory defaults. Press the RESET button on the front panel of the switch for one second and the switch automatically reloads its default configuration file. The IP address of the switch reverts to “192.168.1.1”.Your computer’s and the switch’s IP addresses must be on the same subnet.See the following section to check that pop-up windows, JavaScripts and Java permissions are allowed. |
21.2.1 Pop-up Windows, JavaScripts and Java Permissions
In order to use the web configurator you need to allow:
- Web browser pop-up windows from your device.
- JavaScripts (enabled by default).
- Java permissions (enabled by default).

Internet Explorer 6 screens are used here. Screens for other Internet Explorer versions may vary.
21.2.1.1 Internet Explorer Pop-up Blockers
You may have to disable pop-up blocking to log into your device.
Either disable pop-up blocking (enabled by default in Windows XP SP (Service Pack) 2) or allow pop-up blocking and create an exception for your device's IP address.
21.2.1.1.1 Disable pop-up Blockers
1 In Internet Explorer, select Tools, Pop-up Blocker and then select Turn Off Pop-up Blocker.
Figure 87 Pop-up Blocker
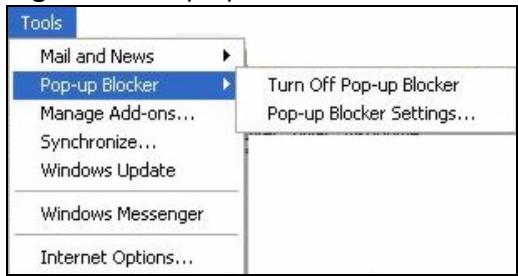
You can also check if pop-up blocking is disabled in the Pop-up Blocker section in the Privacy tab.
1 In Internet Explorer, select Tools, Internet Options, Privacy.
2 Clear the Block pop-ups check box in the Pop-up Blocker section of the screen. This disables any web pop-up blockers you may have enabled.
Figure 88 Internet Options
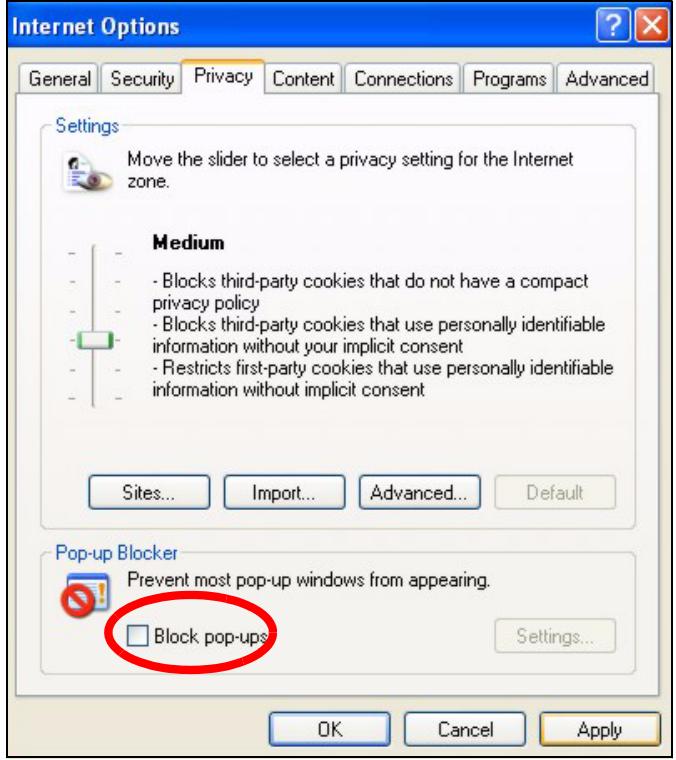
3 Click Apply to save this setting.
21.2.1.1.2 Enable pop-up Blockers with Exceptions
Alternatively, if you only want to allow pop-up windows from your device, see the following steps.
1 In Internet Explorer, select Tools, Internet Options and then the Privacy tab.
2 Select Settings...to open the Pop-up Blocker Settings screen.
Figure 89 Internet Options
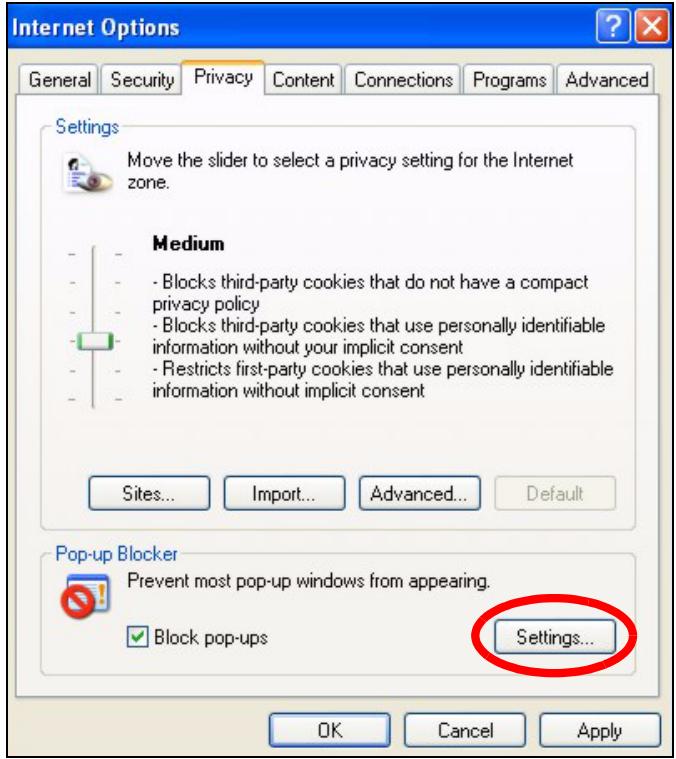
3 Type the IP address of your device (the web page that you do not want to have blocked) with the prefix "http://". For example, http://192.168.1.1.
4 Click Add to move the IP address to the list of Allowed sites.
Figure 90 Pop-up Blocker Settings
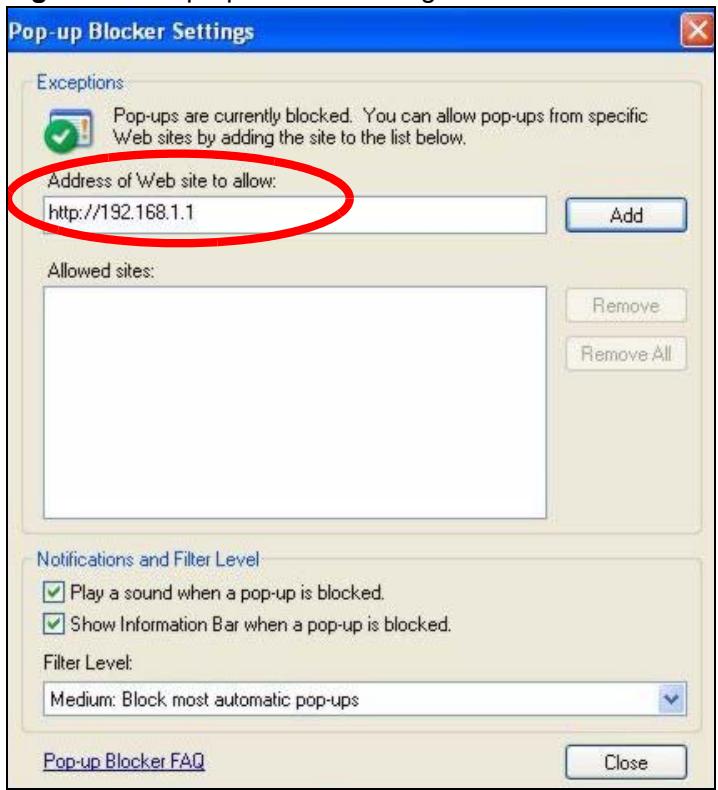
5 Click Close to return to the Privacy screen.
6 Click Apply to save this setting.
21.2.1.2 JavaScripts
If pages of the web configurator do not display properly in Internet Explorer, check that JavaScripts are allowed.
1 In Internet Explorer, click Tools, Internet Options and then the Security tab.
Figure 91 Internet Options
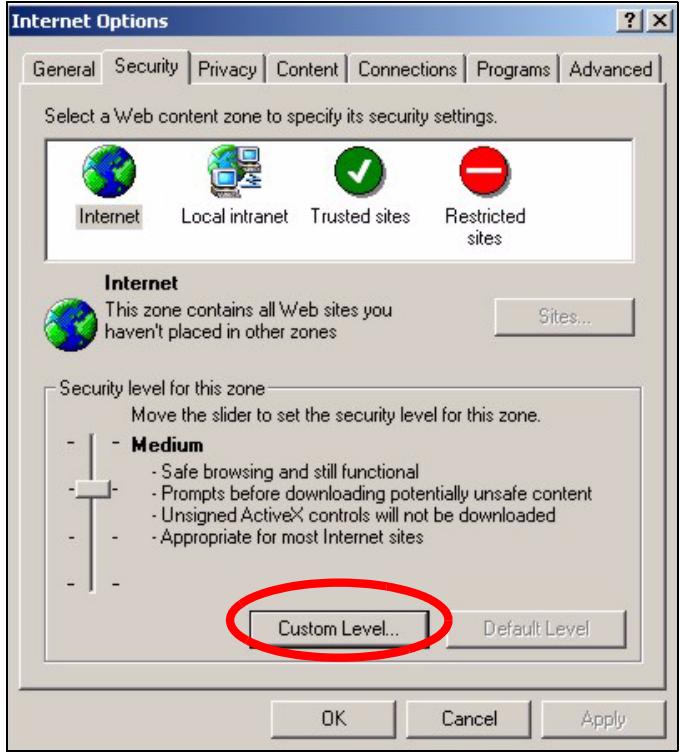
2 Click the Custom Level... button.
3 Scroll down to Scripting.
4 Under Active scripting make sure that Enable is selected (the default).
5 Under Scripting of Java applets make sure that Enable is selected (the default).
6 Click OK to close the window.
Figure 92 Security Settings - Java Scripting
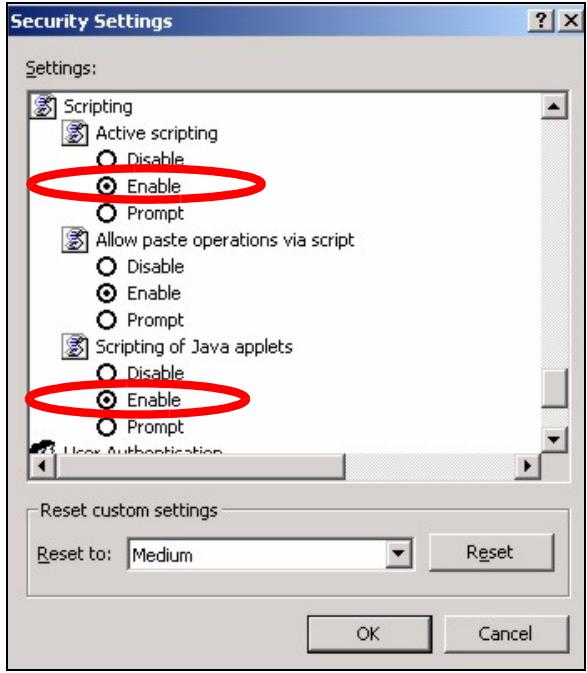
21.2.1.3 Java Permissions
1 From Internet Explorer, click Tools, Internet Options and then the Security tab.
2 Click the Custom Level... button.
3 Scroll down to Microsoft VM.
4 Under Java permissions make sure that a safety level is selected.
5 Click OK to close the window.
Figure 93 Security Settings - Java
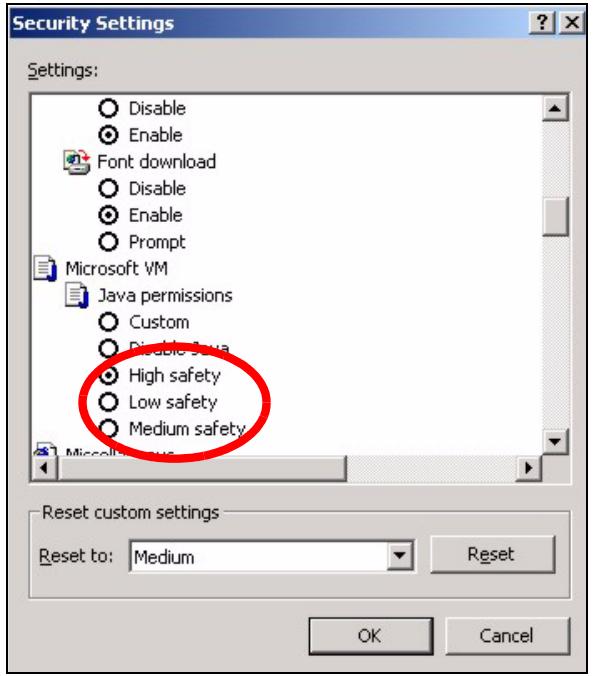
21.2.1.3.1 JAVA (Sun)
1 From Internet Explorer, click Tools, Internet Options and then the Advanced tab.
2 make sure that Use Java 2 for
Figure 94 Java (Sun)
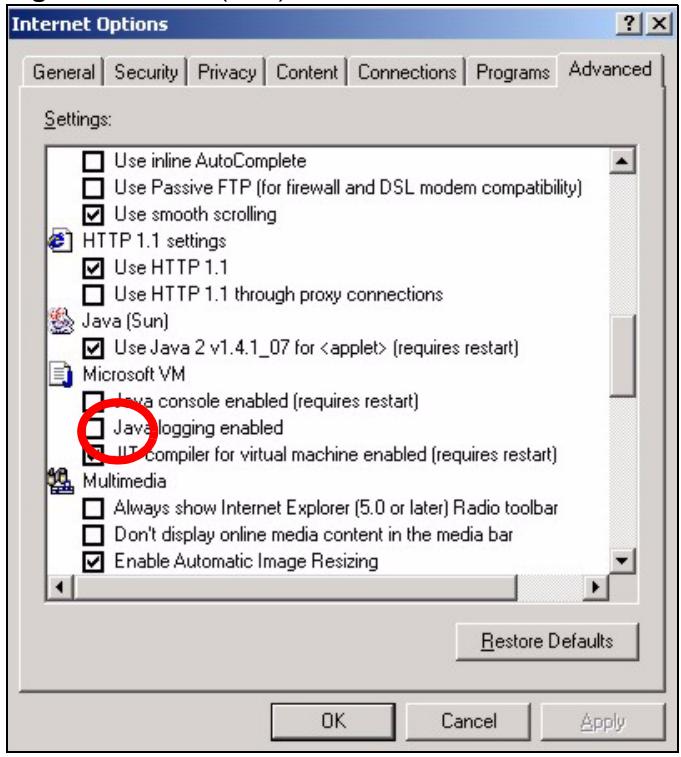
PART IV
Appendices and Index
This part contains the following chapters.
• Product Specifications (147)
• IP Addresses and Subnetting (151)
• Legal Information (159)
- Customer Support (163)
- Index (167)
Product Specifications
This section describes the general software features of the switch.
Table 70 Firmware Features
| FEATURE | DESCRIPTION |
| VLAN | A VLAN (Virtual Local Area Network) allows a physical network to be partitioned into multiple logical networks. Devices on a logical network belong to one group. A device can belong to more than one group. With VLAN, a device cannot directly talk to or hear from devices that are not in the same group(s); the traffic must first go through a router. |
| Level 2 Management | Forward traffic based on the destination MAC address and VLAN group (ID). |
| QoS | Queuing is used to help solve performance degradation when there is network congestion. Two scheduling services are supported: Strict Priority (SP) and Weighted Round Robin (WRR). This allows the switch to maintain separate queues for packets from each individual source or flow and prevent a source from monopolizing the bandwidth. |
| Rate Control | Rate control is a combination of bandwidth management and broadcast storm control. This feature allows you to set limits for incoming and outgoing traffic on the ports. The broadcast storm control feature helps prevent broadcast, multicast or unknown unicast traffic from flooding your network. |
| Port Mirroring | Port mirroring allows you to copy traffic going from one or all ports to another or all ports in order that you can examine the traffic from the mirror port (the port you copy the traffic to) without interference. |
| Link Aggregation | Link aggregation (trunking) is the grouping of physical ports into one logical higher-capacity link. You may want to trunk ports if for example, it is cheaper to use multiple lower-speed links than to under-utilize a high-speed, but more costly, single-port link. |
| Device Management | Use the web configurator to easily configure the rich range of features on the switch. |
| Firmware Upgrade | Download new firmware (when available) from the ZyXEL web site and use the web configurator to put it on the switch.Note: Only upload firmware for your specific model! |
| Configuration Backup & Restoration | Make a copy of the switch's configuration and put it back on the switch later if you decide you want to revert back to an earlier configuration. |
| Auto DoS | The Automatic Denial of Service (DoS) attack detection and prevention feature helps protect you from hackers trying to disrupt or shut down your network. |
| Auto VoIP | The Automatic VoIP feature grants the highest priority to VoIP traffic ensuring better sound quality and reliability for end users. |
Table 70 Firmware Features
| FEATURE | DESCRIPTION |
| Dynamic ARP | Dynamic ARP allows you to filter incoming traffic based on the MAC to IP address mapping. The switch can be configured to only allow trusted devices to communicate via its ports. |
| RMON-Lite | Remote Network Monitoring Management (RMON) allows you to gather information about the switch's performance, view statistics and create alarms. |
| Cable Diagnostics | Use this feature to inspect the Ethernet cables connected to the switch for shorts, open faults or shorts-between-pairs. |
| Logging | The switch allows you to specify what information should be logged and where it should be stored. It supports internal logging as well as external logging via a syslog server. |
The following tables list the product specifications.
Table 71 General Product Specifications
| Interface | 24 10/100 Base-Tx ports2 Mini GBIC ports (Small Form-Factor Pluggable (SFP) fiber ports).Two 10/100/1000 Base-Tx portsAuto-negotiationAuto-MDIXCompliant with IEEE 802.3ad/u/xBack pressure flow control for half duplexFlow control for full duplex (IEEE 802.3x) | |
| Layer 2 Features | Bridging | 8K MAC addressesStatic MAC address forwarding by destination - 8 static entriesBroadcast storm controlStatic MAC address forwarding |
| Switching | Switching fabric: 12.8Gbps, non-blockingMax. Frame size: 1522 bytesForwarding frame: IEEE 802.3, IEEE 802.1q, Ethernet II, PPPoEPrevent the forwarding of corrupted packets | |
| QoS | IEEE 802.1p4 priority queues per portPort-based egress traffic shapingDSCP to IEEE 802.1p mappingToS to IEEE 802.1p mappingSource IP-based prioritization of traffic | |
| VLAN | Tag-based (IEEE 802.1Q) VLANNumber of VLAN: 4K, 256 static maximum | |
| Port Aggregation | Supports static port trunkingSix groups (up to 8 ports each) | |
| Port mirroring | All ports support port mirroring | |
| Rate control | Supports rate limiting from 64 Kbps to 1 Gbps on a port by port basis for incoming trafficSupports egress traffic shaping via the “bucket - token” algorithm | |
| Security | Static MAC address filteringDynamic ARP filtering - 16 Static Entries | |
Table 72 Management Specifications
| System Control | Alarm/Status surveillanceLED indication for power statusPerformance monitoringLine speedFour RMON groups (history, statistics, alarms, and events)Throughput monitoringPort mirroring and aggregationFirmware upgrade and download through HTTPFLASH memoryReset to default button |
| Network Management | Web-based managementSNMP v1, v2c and v3; 10 Trap Stations supportedRMON groups (history, statistics, alarms and events)4 Logging servers supported |
| MIB | RFC1213 MIB II - SystemRFC1213 MIB II - InterfaceRFC 1398 MIB - Ether-likeRFC2819 Four groups of RMON (history, statistics, alarms and events) |
Table 73 Physical and Environmental Specifications
| LEDs | Main switch: PWRPer Gigabit port: ACT, 100/1000Per mini-GBIC port: LNK, ACTPer 100 Mbps Ethernet port: LNK/ACT, FDX/COL |
| Dimension | Standard 19" rack mountable441 mm (W) x 130mm (D) x 44 mm (H) |
| Weight | 2 Kg |
| Temperature | Operating: 0°C ~ 45°C (32°F ~ 113°F)Storage: -10°C ~ 70°C (13°F ~ 158°F) |
| Humidity | 10 ~ 90% (non-condensing) |
| Power Supply | AC: 100 - 240V 50/60Hz 1.5A max internal universal power supply |
| Wire Gauge Specifications | |
| Ground Wire | 18 AWG or larger |
| Power Wire | 18 AWG or larger |
| Safety | CSA 60950-1EN 60950-1IEC 60950-1 |
| EMC | FCC Part 15 (Class A)CE EMC (Class A) |
IP Addresses and Subnetting
This appendix introduces IP addresses and subnet masks.
IP addresses identify individual devices on a network. Every networking device (including computers, servers, routers, printers, etc.) needs an IP address to communicate across the network. These networking devices are also known as hosts.
Subnet masks determine the maximum number of possible hosts on a network. You can also use subnet masks to divide one network into multiple sub-networks.
Introduction to IP Addresses
One part of the IP address is the network number, and the other part is the host ID. In the same way that houses on a street share a common street name, the hosts on a network share a common network number. Similarly, as each house has its own house number, each host on the network has its own unique identifying number - the host ID. Routers use the network number to send packets to the correct network, while the host ID determines to which host on the network the packets are delivered.
Structure
An IP address is made up of four parts, written in dotted decimal notation (for example, 192.168.1.1). Each of these four parts is known as an octet. An octet is an eight-digit binary number (for example 11000000, which is 192 in decimal notation).
Therefore, each octet has a possible range of 00000000 to 11111111 in binary, or 0 to 255 in decimal.
The following figure shows an example IP address in which the first three octets (192.168.1) are the network number, and the fourth octet (16) is the host ID.
Figure 95 Network Number and Host ID
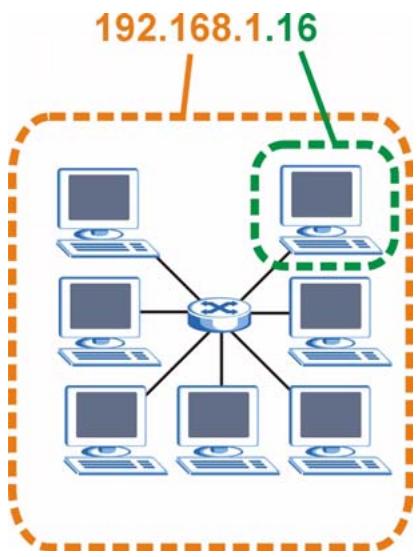
flowchart
graph TD
    A["Router"] --> B["Client 1"]
    A --> C["Client 2"]
    A --> D["Client 3"]
    A --> E["Client 4"]
    A --> F["Client 5"]
    A --> G["Client 6"]
    A --> H["Client 7"]
    A --> I["Client 8"]
    A --> J["Client 9"]
    A --> K["Client 10"]
    A --> L["Client 11"]
    A --> M["Client 12"]
    A --> N["Client 13"]
    A --> O["Client 14"]
    A --> P["Client 15"]
    A --> Q["Client 16"]
    style A fill:#f9f,stroke:#333
    style B fill:#ccf,stroke:#333
    style C fill:#ccf,stroke:#333
    style D fill:#ccf,stroke:#333
    style E fill:#ccf,stroke:#333
    style F fill:#ccf,stroke:#333
    style G fill:#ccf,stroke:#333
    style H fill:#ccf,stroke:#333
    style I fill:#ccf,stroke:#333
    style J fill:#ccf,stroke:#333
    style K fill:#ccf,stroke:#333
    style L fill:#ccf,stroke:#333
    style M fill:#ccf,stroke:#333
    style N fill:#ccf,stroke:#333
    style O fill:#ccf,stroke:#333
    style P fill:#ccf,stroke:#333
    style Q fill:#ccf,stroke:#333
    style R fill:#ccf,stroke:#333
    style S fill:#ccf,stroke:#333
    style T fill:#ccf,stroke:#333
    style U fill:#ccf,stroke:#333
    style V fill:#ccf,stroke:#333
    style W fill:#ccf,stroke:#333
    style X fill:#ccf,stroke:#333
    style Y fill:#ccf,stroke:#333
    style Z fill:#ccf,stroke:#333
How much of the IP address is the network number and how much is the host ID varies according to the subnet mask.
Subnet Masks
A subnet mask is used to determine which bits are part of the network number, and which bits are part of the host ID (using a logical AND operation). The term “subnet” is short for “sub-network”.
A subnet mask has 32 bits. If a bit in the subnet mask is a “1” then the corresponding bit in the IP address is part of the network number. If a bit in the subnet mask is “0” then the corresponding bit in the IP address is part of the host ID.
The following example shows a subnet mask identifying the network number (in bold text) and host ID of an IP address (192.168.1.2 in decimal).
Table 74 Subnet Mask Example
| 1ST OCTET: (192) | 2ND OCTET: (168) | 3RD OCTET: (1) | 4TH OCTET (2) | |
| IP Address (Binary) | 11000000 | 10101000 | 00000001 | 00000010 |
| Subnet Mask (Binary) | 11111111 | 11111111 | 11111111 | 00000000 |
| Network Number | 11000000 | 10101000 | 00000001 | |
| Host ID | 00000010 |
By convention, subnet masks always consist of a continuous sequence of ones beginning from the leftmost bit of the mask, followed by a continuous sequence of zeros, for a total number of 32 bits.
Subnet masks can be referred to by the size of the network number part (the bits with a “1” value). For example, an “8-bit mask” means that the first 8 bits of the mask are ones and the remaining 24 bits are zeroes.
Subnet masks are expressed in dotted decimal notation just like IP addresses. The following examples show the binary and decimal notation for 8-bit, 16-bit, 24-bit and 29-bit subnet masks.
Table 75 Subnet Masks
| BINARY | DECIMAL | ||||
| 1ST OCTET | 2ND OCTET | 3RD OCTET | 4TH OCTET | ||
| 8-bit mask | 11111111 | 00000000 | 00000000 | 00000000 | 255.0.0.0 |
| 16-bit mask | 11111111 | 11111111 | 00000000 | 00000000 | 255.255.0.0 |
| 24-bit mask | 11111111 | 11111111 | 11111111 | 00000000 | 255.255.255.0 |
| 29-bit mask | 11111111 | 11111111 | 11111111 | 11111000 | 255.255.255.248 |
Network Size
The size of the network number determines the maximum number of possible hosts you can have on your network. The larger the number of network number bits, the smaller the number of remaining host ID bits.
An IP address with host IDs of all zeros is the IP address of the network (192.168.1.0 with a 24-bit subnet mask, for example). An IP address with host IDs of all ones is the broadcast address for that network (192.168.1.255 with a 24-bit subnet mask, for example).
As these two IP addresses cannot be used for individual hosts, calculate the maximum number of possible hosts in a network as follows:
Table 76 Maximum Host Numbers
| SUBNET MASK | HOST ID SIZE | MAXIMUM NUMBER OF HOSTS | ||
| 8 bits | 255.0.0.0 | 24 bits | 2^24 - 2 | 16777214 |
| 16 bits | 255.255.0.0 | 16 bits | 2^16 - 2 | 65534 |
| 24 bits | 255.255.255.0 | 8 bits | 2^8 - 2 | 254 |
| 29 bits | 255.255.255.248 | 3 bits | 2^3 - 2 | 6 |
Notation
Since the mask is always a continuous number of ones beginning from the left, followed by a continuous number of zeros for the remainder of the 32 bit mask, you can simply specify the number of ones instead of writing the value of each octet. This is usually specified by writing a “/” followed by the number of bits in the mask after the address.
For example, 192.1.1.0 /25 is equivalent to saying 192.1.1.0 with subnet mask 255.255.255.128.
The following table shows some possible subnet masks using both notations.
Table 77 Alternative Subnet Mask Notation
| SUBNET MASK | ALTERNATIVE NOTATION | LAST OCTET (BINARY) | LAST OCTET (DECIMAL) |
| 255.255.255.0 | /24 | 0000 0000 | 0 |
| 255.255.255.128 | /25 | 1000 0000 | 128 |
| 255.255.255.192 | /26 | 1100 0000 | 192 |
| 255.255.255.224 | /27 | 1110 0000 | 224 |
| 255.255.255.240 | /28 | 1111 0000 | 240 |
| 255.255.255.248 | /29 | 1111 1000 | 248 |
| 255.255.255.252 | /30 | 1111 1100 | 252 |
Subnetting
You can use subnetting to divide one network into multiple sub-networks. In the following example a network administrator creates two sub-networks to isolate a group of servers from the rest of the company network for security reasons.
In this example, the company network address is 192.168.1.0. The first three octets of the address (192.168.1) are the network number, and the remaining octet is the host ID, allowing a maximum of 2^8 - 2 or 254 possible hosts.
The following figure shows the company network before subnetting.
Figure 96 Subnetting Example: Before Subnetting
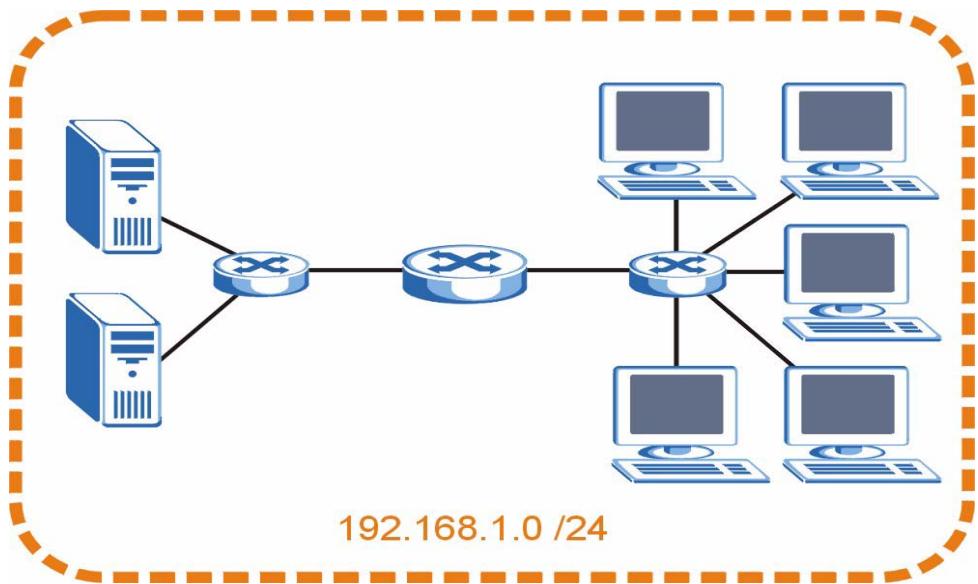
flowchart
graph TD
    A["Server"] --> C["Switch"]
    B["Server"] --> C["Switch"]
    C --> D["Computer"]
    C --> E["Computer"]
    C --> F["Computer"]
    C --> G["Computer"]
    D --> H["Computer"]
    E --> I["Computer"]
    F --> J["Computer"]
    G --> K["Computer"]
    style A fill:#333,stroke:#fff,color:#fff
    style B fill:#333,stroke:#fff,color:#fff
    style C fill:#333,stroke:#fff,color:#fff
    style D fill:#333,stroke:#fff,color:#fff
    style E fill:#333,stroke:#fff,color:#fff
    style F fill:#333,stroke:#fff,color:#fff
    style G fill:#333,stroke:#fff,color:#fff
    style H fill:#333,stroke:#fff,color:#fff
    style I fill:#333,stroke:#fff,color:#fff
    style J fill:#333,stroke:#fff,color:#fff
    style K fill:#333,stroke:#fff,color:#fff
    note right of A "192.168.1.0 /24"
You can “borrow” one of the host ID bits to divide the network 192.168.1.0 into two separate sub-networks. The subnet mask is now 25 bits (255.255.255.128 or /25).
The “borrowed” host ID bit can have a value of either 0 or 1, allowing two subnets; 192.168.1.0 /25 and 192.168.1.128 /25.
The following figure shows the company network after subnetting. There are now two sub-networks, A and B.
Figure 97 Subnetting Example: After Subnetting
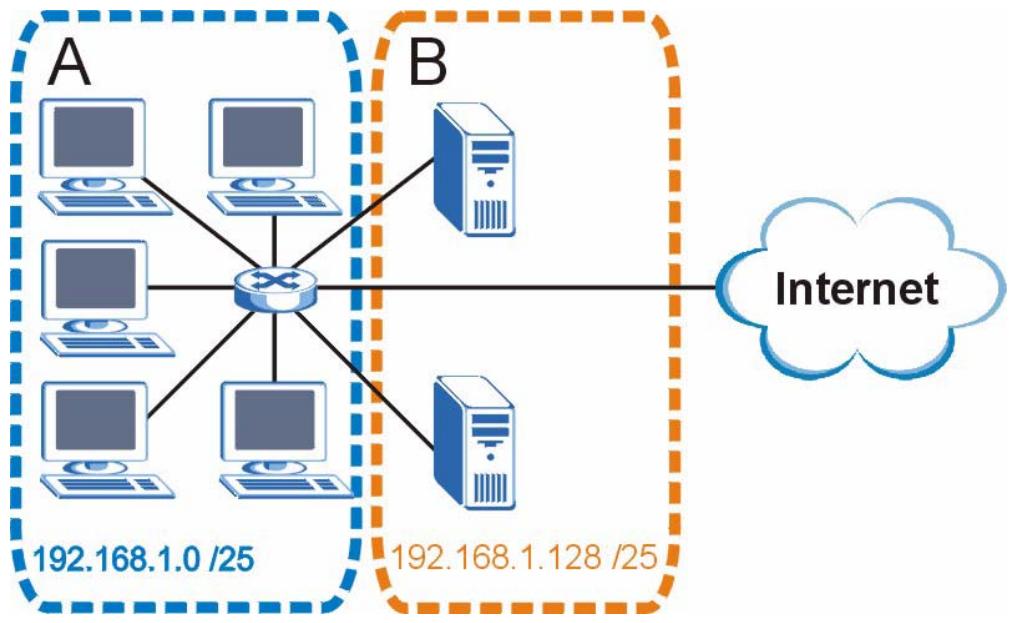
flowchart
graph TD
    subgraph A
        A1["Computer 1"] --> A2["Computer 2"]
        A3["Computer 3"] --> A4["Computer 4"]
        A5["Computer 5"] --> A6["Computer 6"]
        A7["Computer 7"] --> A8["Computer 8"]
    end
    subgraph B
        B1["Server 1"] --> B2["Server 2"]
        B3["Server 3"] --> B4["Server 4"]
        B5["Server 5"] --> B6["Server 6"]
    end
    A1 --> A2
    A2 --> A3
    A3 --> A4
    A4 --> A5
    A5 --> A6
    A6 --> A7
    B1 --> B2
    B2 --> B3
    B3 --> B4
    B4 --> B5
    B5 --> B6
    style A fill:#f9f,stroke:#333
    style B fill:#bbf,stroke:#333
    note right of B: "Internet"
    note left of A: "192.168.1.0 /25"
    note right of B: "192.168.1.128 /25"
In a 25-bit subnet the host ID has 7 bits, so each sub-network has a maximum of 2^7 - 2 or 126 possible hosts (a host ID of all zeroes is the subnet's address itself, all ones is the subnet's broadcast address).
192.168.1.0 with mask 255.255.255.128 is subnet A itself, and 192.168.1.127 with mask 255.255.255.128 is its broadcast address. Therefore, the lowest IP address that can be assigned to an actual host for subnet A is 192.168.1.1 and the highest is 192.168.1.126.
Similarly, the host ID range for subnet B is 192.168.1.129 to 192.168.1.254.
Example: Four Subnets
The previous example illustrated using a 25-bit subnet mask to divide a 24-bit address into two subnets. Similarly, to divide a 24-bit address into four subnets, you need to “borrow” two host ID bits to give four possible combinations (00, 01, 10 and 11). The subnet mask is 26 bits (11111111.11111111.11111111.11000000) or 255.255.255.192.
Each subnet contains 6 host ID bits, giving 2^6 - 2 or 62 hosts for each subnet (a host ID of all zeroes is the subnet itself, all ones is the subnet's broadcast address).
Table 78 Subnet 1
| IP/SUBNET MASK | NETWORK NUMBER | LAST OCTET BIT VALUE |
| IP Address (Decimal) | 192.168.1. | 0 |
| IP Address (Binary) | 11000000.10101000.00000001. | 00000000 |
| Subnet Mask (Binary) | 11111111.11111111.11111111. | 11000000 |
| Subnet Address: 192.168.1.0 | Lowest Host ID: 192.168.1.1 | |
| Broadcast Address: 192.168.1.63 | Highest Host ID: 192.168.1.62 | |
Table 79 Subnet 2
| IP/SUBNET MASK | NETWORK NUMBER | LAST OCTET BIT VALUE |
| IP Address | 192.168.1. | 64 |
| IP Address (Binary) | 11000000.10101000.00000001. | 01000000 |
| Subnet Mask (Binary) | 11111111.11111111.11111111. | 11000000 |
| Subnet Address: 192.168.1.64 | Lowest Host ID: 192.168.1.65 | |
| Broadcast Address: 192.168.1.127 | Highest Host ID: 192.168.1.126 | |
Table 80 Subnet 3
| IP/SUBNET MASK | NETWORK NUMBER | LAST OCTET BIT VALUE |
| IP Address | 192.168.1. | 128 |
| IP Address (Binary) | 11000000.10101000.00000001. | 10000000 |
| Subnet Mask (Binary) | 11111111.11111111.11111111. | 11000000 |
| Subnet Address: 192.168.1.128 | Lowest Host ID: 192.168.1.129 | |
| Broadcast Address: 192.168.1.191 | Highest Host ID: 192.168.1.190 | |
Table 81 Subnet 4
| IP/SUBNET MASK | NETWORK NUMBER | LAST OCTET BIT VALUE |
| IP Address | 192.168.1. | 192 |
| IP Address (Binary) | 11000000.10101000.00000001. | 11000000 |
| Subnet Mask (Binary) | 11111111.11111111.11111111. | 11000000 |
| Subnet Address: 192.168.1.192 | Lowest Host ID: 192.168.1.193 | |
| Broadcast Address: 192.168.1.255 | Highest Host ID: 192.168.1.254 | |
Example: Eight Subnets
Similarly, use a 27-bit mask to create eight subnets (000, 001, 010, 011, 100, 101, 110 and 111).
The following table shows IP address last octet values for each subnet.
Table 82 Eight Subnets
| SUBNET | SUBNET ADDRESS | FIRST ADDRESS | LAST ADDRESS | BROADCAST ADDRESS |
| 1 | 0 | 1 | 30 | 31 |
| 2 | 32 | 33 | 62 | 63 |
| 3 | 64 | 65 | 94 | 95 |
| 4 | 96 | 97 | 126 | 127 |
| 5 | 128 | 129 | 158 | 159 |
| 6 | 160 | 161 | 190 | 191 |
| 7 | 192 | 193 | 222 | 223 |
| 8 | 224 | 225 | 254 | 255 |
Subnet Planning
The following table is a summary for subnet planning on a network with a 24-bit network number.
Table 83 24-bit Network Number Subnet Planning
| NO. “BORROWED”HOST BITS | SUBNET MASK | NO. SUBNETS | NO. HOSTS PERSUBNET |
| 1 | 255.255.255.128 (/25) | 2 | 126 |
| 2 | 255.255.255.192 (/26) | 4 | 62 |
| 3 | 255.255.255.224 (/27) | 8 | 30 |
| 4 | 255.255.255.240 (/28) | 16 | 14 |
| 5 | 255.255.255.248 (/29) | 32 | 6 |
| 6 | 255.255.255.252 (/30) | 64 | 2 |
| 7 | 255.255.255.254 (/31) | 128 | 1 |
The following table is a summary for subnet planning on a network with a 16-bit network number.
Table 84 16-bit Network Number Subnet Planning
| NO. “BORROWED”HOST BITS | SUBNET MASK | NO. SUBNETS | NO. HOSTS PERSUBNET |
| 1 | 255.255.128.0 (/17) | 2 | 32766 |
| 2 | 255.255.192.0 (/18) | 4 | 16382 |
| 3 | 255.255.224.0 (/19) | 8 | 8190 |
| 4 | 255.255.240.0 (/20) | 16 | 4094 |
| 5 | 255.255.248.0 (/21) | 32 | 2046 |
| 6 | 255.255.252.0 (/22) | 64 | 1022 |
| 7 | 255.255.254.0 (/23) | 128 | 510 |
| 8 | 255.255.255.0 (/24) | 256 | 254 |
| 9 | 255.255.255.128 (/25) | 512 | 126 |
| 10 | 255.255.255.192 (/26) | 1024 | 62 |
| 11 | 255.255.255.224 (/27) | 2048 | 30 |
| 12 | 255.255.255.240 (/28) | 4096 | 14 |
| 13 | 255.255.255.248 (/29) | 8192 | 6 |
| 14 | 255.255.255.252 (/30) | 16384 | 2 |
| 15 | 255.255.255.254 (/31) | 32768 | 1 |
Configuring IP Addresses
Where you obtain your network number depends on your particular situation. If the ISP or your network administrator assigns you a block of registered IP addresses, follow their instructions in selecting the IP addresses and the subnet mask.
If the ISP did not explicitly give you an IP network number, then most likely you have a single user account and the ISP will assign you a dynamic IP address when the connection is established. If this is the case, it is recommended that you select a network number from 192.168.0.0 to 192.168.255.0. The Internet Assigned Number Authority (IANA) reserved this block of addresses specifically for private use; please do not use any other number unless you are told otherwise. You must also enable Network Address Translation (NAT) on the switch.
Once you have decided on the network number, pick an IP address for your switch that is easy to remember (for instance, 192.168.1.1) but make sure that no other device on your network is using that IP address.
The subnet mask specifies the network number portion of an IP address. Your switch will compute the subnet mask automatically based on the IP address that you entered. You don't need to change the subnet mask computed by the switch unless you are instructed to do otherwise.
Private IP Addresses
Every machine on the Internet must have a unique address. If your networks are isolated from the Internet (running only between two branch offices, for example) you can assign any IP addresses to the hosts without problems. However, the Internet Assigned Numbers Authority (IANA) has reserved the following three blocks of IP addresses specifically for private networks:
• 10.0.0.0 — 10.255.255.255
• 172.16.0.0 — 172.31.255.255
• 192.168.0.0 — 192.168.255.255
You can obtain your IP address from the IANA, from an ISP, or it can be assigned from a private network. If you belong to a small organization and your Internet access is through an ISP, the ISP can provide you with the Internet addresses for your local networks. On the other hand, if you are part of a much larger organization, you should consult your network administrator for the appropriate IP addresses.
Regardless of your particular situation, do not create an arbitrary IP address; always follow the guidelines above. For more information on address assignment, please refer to RFC 1597, Address Allocation for Private Internets and RFC 1466, Guidelines for Management of IP Address Space.
Legal Information
Copyright
Copyright © 2006 by ZyXEL Communications Corporation.
The contents of this publication may not be reproduced in any part or as a whole, transcribed, stored in a retrieval system, translated into any language, or transmitted in any form or by any means, electronic, mechanical, magnetic, optical, chemical, photocopying, manual, or otherwise, without the prior written permission of ZyXEL Communications Corporation.
Published by ZyXEL Communications Corporation. All rights reserved.
Disclaimer
ZyXEL does not assume any liability arising out of the application or use of any products, or software described herein. Neither does it convey any license under its patent rights nor the patent rights of others. ZyXEL further reserves the right to make changes in any products described herein without notice. This publication is subject to change without notice.
Trademarks
ZyNOS (ZyXEL Network Operating System) is a registered trademark of ZyXEL Communications, Inc. Other trademarks mentioned in this publication are used for identification purposes only and may be properties of their respective owners.
Certifications
Federal Communications Commission (FCC) Interference Statement
This device complies with Part 15 of FCC rules. Operation is subject to the following two conditions:
- This device may not cause harmful interference.
- This device must accept any interference received, including interference that may cause undesired operations.
FCC Warning
This device has been tested and found to comply with the limits for a Class A digital switch, pursuant to Part 15 of the FCC Rules. These limits are designed to provide reasonable protection against harmful interference in a commercial environment. This device generates, uses, and can radiate radio frequency energy and, if not installed and used in accordance with the instruction manual, may cause harmful interference to radio communications. Operation of this device in a residential area is likely to cause harmful interference in which case the user will be required to correct the interference at his own expense.
CE Mark Warning:
This is a class A product. In a domestic environment this product may cause radio interference in which case the user may be required to take adequate measures.
Taiwanese BSMI (Bureau of Standards, Metrology and Inspection) A Warning:
警告使用者
Changes or modifications not expressly approved by the party responsible for compliance could void the user's authority to operate the equipment.
This Class A digital apparatus complies with Canadian ICES-003.
CLASS 1 LASER PRODUCT
APPAREIL A LASER DE CLASS 1
PRODUCT COMPLIES WITH 21 CFR 1040.10 AND 1040.11.
PRODUIT CONFORME SELON 21 CFR 1040.10 ET 1040.11.
Viewing Certifications
1 Go to http://www.zyxel.com.
2 Select your product on the ZyXEL home page to go to that product's page.
3 Select the certification you wish to view from this page.
ZyXEL Limited Warranty
ZyXEL warrants to the original end user (purchaser) that this product is free from any defects in materials or workmanship for a period of up to two years from the date of purchase. During the warranty period, and upon proof of purchase, should the product have indications of failure due to faulty workmanship and/or materials, ZyXEL will, at its discretion, repair or replace the defective products or components without charge for either parts or labor, and to whatever extent it shall deem necessary to restore the product or components to proper operating
condition. Any replacement will consist of a new or re-manufactured functionally equivalent product of equal or higher value, and will be solely at the discretion of ZyXEL. This warranty shall not apply if the product has been modified, misused, tampered with, damaged by an act of God, or subjected to abnormal working conditions.
Note
Repair or replacement, as provided under this warranty, is the exclusive remedy of the purchaser. This warranty is in lieu of all other warranties, express or implied, including any implied warranty of merchantability or fitness for a particular use or purpose. ZyXEL shall in no event be held liable for indirect or consequential damages of any kind to the purchaser.
To obtain the services of this warranty, contact ZyXEL's Service Center for your Return Material Authorization number (RMA). Products must be returned Postage Prepaid. It is recommended that the unit be insured when shipped. Any returned products without proof of purchase or those with an out-dated warranty will be repaired or replaced (at the discretion of ZyXEL) and the customer will be billed for parts and labor. All repaired or replaced products will be shipped by ZyXEL to the corresponding return address, Postage Paid. This warranty gives you specific legal rights, and you may also have other rights that vary from country to country.
Registration
Register your product online to receive e-mail notices of firmware upgrades and information at www.zyxel.com for global products, or at www.us.zyxel.com for North American products.
Customer Support
Please have the following information ready when you contact customer support.
Required Information
• Product model and serial number.
- Warranty Information.
- Date that you received your device.
- Brief description of the problem and the steps you took to solve it.
Corporate Headquarters (Worldwide)
• Support E-mail: support@zyxel.com.tw
• Sales E-mail: sales@zyxel.com.tw
• Telephone: +886-3-578-3942
• Fax: +886-3-578-2439
- Web Site: www.zyxel.com, www.europe.zyxel.com
- FTP Site: ftp.zyxel.com, ftp.europe.zyxel.com
- Regular Mail: ZyXEL Communications Corp., 6 Innovation Road II, Science Park, Hsinchu 300, Taiwan
Costa Rica
• Support E-mail: soporte@zyxel.co.cr
• Sales E-mail: sales@zyxel.co.cr
• Telephone: +506-2017878
• Fax: +506-2015098
• Web Site: www.zyxel.co.cr
- FTP Site: ftp.zyxel.co.cr
- Regular Mail: ZyXEL Costa Rica, Plaza Roble Escazú, Etapa El Patio, Tercer Piso, San José, Costa Rica
Czech Republic
• E-mail: info@cz.zyxel.com
• Telephone: +420-241-091-350
• Fax: +420-241-091-359
• Web Site: www.zyxel.cz
- Regular Mail: ZyXEL Communications, Czech s.r.o., Modranská 621, 143 01 Praha 4 - Modrany, Ceská Republika
Denmark
• Support E-mail: support@zyxel.dk
• Sales E-mail: sales@zyxel.dk
• Telephone: +45-39-55-07-00
• Fax: +45-39-55-07-07
- Web Site: www.zyxel.dk
- Regular Mail: ZyXEL Communications A/S, Columbusvej, 2860 Soeborg, Denmark
Finland
• Support E-mail: support@zyxel.fi
• Sales E-mail: sales@zyxel.fi
• Telephone: +358-9-4780-8411
• Fax: +358-9-4780 8448
- Web Site: www.zyxel.fi
- Regular Mail: ZyXEL Communications Oy, Malminkaari 10, 00700 Helsinki, Finland
France
• E-mail: info@zyxel.fr
• Telephone: +33-4-72-52-97-97
• Fax: +33-4-72-52-19-20
- Web Site: www.zyxel.fr
- Regular Mail: ZyXEL France, 1 rue des Vergers, Bat. 1 / C, 69760 Limonest, France
Germany
• Support E-mail: support@zyxel.de
• Sales E-mail: sales@zyxel.de
• Telephone: +49-2405-6909-0
• Fax: +49-2405-6909-99
- Web Site: www.zyxel.de
- Regular Mail: ZyXEL Deutschland GmbH., Adenauerstr. 20/A2 D-52146, Wuerselen, Germany
Hungary
• Support E-mail: support@zyxel.hu
• Sales E-mail: info@zyxel.hu
• Telephone: +36-1-3361649
- Fax: +36-1-3259100
• Web Site: www.zyxel.hu
• Regular Mail: ZyXEL Hungary, 48, Zoldlomb Str., H-1025, Budapest, Hungary
Kazakhstan
• Support: http://zyxel.kz/support
• Sales E-mail: sales@zyxel.kz
• Telephone: +7-3272-590-698
• Fax: +7-3272-590-689
• Web Site: www.zyxel.kz
- Regular Mail: ZyXEL Kazakhstan, 43, Dostyk ave., Office 414, Dostyk Business Centre, 050010, Almaty, Republic of Kazakhstan
North America
• Support E-mail: support@zyxel.com
• Sales E-mail: sales@zyxel.com
• Telephone: +1-800-255-4101, +1-714-632-0882
• Fax: +1-714-632-0858
• Web Site: www.us.zyxel.com
- FTP Site: ftp.us.zyxel.com
- Regular Mail: ZyXEL Communications Inc., 1130 N. Miller St., Anaheim, CA 92806-2001, U.S.A.
Norway
• Support E-mail: support@zyxel.no
• Sales E-mail: sales@zyxel.no
• Telephone: +47-22-80-61-80
• Fax: +47-22-80-61-81
• Web Site: www.zyxel.no
• Regular Mail: ZyXEL Communications A/S, Nils Hansens vei 13, 0667 Oslo, Norway
Poland
• E-mail: info@pl.zyxel.com
• Telephone: +48 (22) 333 8250
• Fax: +48 (22) 333 8251
• Web Site: www.pl.zyxel.com
- Regular Mail: ZyXEL Communications, ul. Okrzei 1A, 03-715 Warszawa, Poland
Russia
• Support: http://zyxel.ru/support
• Sales E-mail: sales@zyxel.ru
• Telephone: +7-095-542-89-29
• Fax: +7-095-542-89-25
• Web Site: www.zyxel.ru
- Regular Mail: ZyXEL Russia, Ostrovityanova 37a Str., Moscow, 117279, Russia
Spain
• Support E-mail: support@zyxel.es
• Sales E-mail: sales@zyxel.es
• Telephone: +34-902-195-420
• Fax: +34-913-005-345
- Web Site: www.zyxel.es
- Regular Mail: ZyXEL Communications, Arte, 21 5^a planta, 28033 Madrid, Spain
Sweden
• Support E-mail: support@zyxel.se
• Sales E-mail: sales@zyxel.se
• Telephone: +46-31-744-7700
• Fax: +46-31-744-7701
• Web Site: www.zyxel.se
- Regular Mail: ZyXEL Communications A/S, Sjöporten 4, 41764 Göteborg, Sweden
Ukraine
• Support E-mail: support@ua.zyxel.com
• Sales E-mail: sales@ua.zyxel.com
• Telephone: +380-44-247-69-78
• Fax: +380-44-494-49-32
• Web Site: www.ua.zyxel.com
- Regular Mail: ZyXEL Ukraine, 13, Pimonenko Str., Kiev, 04050, Ukraine
United Kingdom
• Support E-mail: support@zyxel.co.uk
• Sales E-mail: sales@zyxel.co.uk
• Telephone: +44-1344 303044, 08707 555779 (UK only)
• Fax: +44-1344 303034
• Web Site: www.zyxel.co.uk
- FTP Site: ftp.zyxel.co.uk
- Regular Mail: ZyXEL Communications UK, Ltd.,11 The Courtyard, Eastern Road, Bracknell, Berkshire, RG12 2XB, United Kingdom (UK)
“+” is the (prefix) number you dial to make an international telephone call.
Index
A
adding VLANs 65
Address Resolution Logic (ARL) table 50
Address Resolution Protocol (ARP) 133
allowing pop-up windows 137
alternative subnet mask notation 153
applications
backbone 27
bridging 28
IEEE 802.1Q VLAN 29
switched workgroup 28
ARL (Address Resolution Logic) table 50
ARP
how it works 133
viewing 133, 134, 135
ARP (Address Resolution Protocol) 133
auto DoS prevention 90
configuration 90
auto VoIP
configuration 94
feature explained 93
auto-crossover ports 36
automatic Denial of Service (DoS) prevention 89
auto-negotiating ports 36
B
back up, configuration file 51
bandwidth control 148
bridging 148
browser configuration 137
C
cable diagnostics 87
types of faults 87
categories of events 100
certifications 159
notices 160
viewing 160
CFI (Canonical Format Indicator) 63
changing the password 47
Class of Service (CoS) 75
configuration file
backup 51
restore 51
configuration, saving 47
contact information 163
copyright 159
customer support 163
D
default configuration
and the reset button 37
DHCP Snooping 133
DiffServ
DS field 75
DSCP 75
dimensions 149
disclaimer 159
distribution criterion, and trunking 67
DS (Differentiated Services) 75
DSCP (DiffServ Code Point) 75
duplex modes 35
dynamic ARP
how it works 133
E
egress mirror 69
Ethernet ports 35
default settings 36
external logs 97
F
FCC interference statement 159
firmware 49
upgrade 52
firmware version 49
Flash logs 97
flow control 56
back pressure 56
IEEE802.3x 56
forwarding based on MAC 84
front panel 35
G
general features 148
getting help 48
H
hardware installation 31
mounting 32
hardware overview 35
help, web configurator 48
|
IANA 158
ingress mirror 69
installation
freestanding 31
precautions 32
rack-mounting 32
Internet
setting up your browser 140
Internet Assigned Numbers AuthoritySee IANA 158
introduction 27
IP address 49
IP address setup 50
J
Java permissions 142
L
L2 (Level 2) table aging 50
L2 management 83
configuration 84
layer 2 features 148
LEDs 38
link aggregation 67
lockout 47
login 43
password 47
logs 97
adding external syslog 99
categories 100
configuration 98
external 97
Flash 97
overview 97
RAM 97
searching 100
types of events 98
viewing 99
M
MAC address 133
MAC address learning 83
MAC address table 50, 84
maintenance
configuration backup 51
firmware 52
restoring configuration 51
Management Information Base (MIB) 105
Media Gateway Control Protocol (MGCP) 93
MGCP (Media Gateway Control Protocol) 93
MIB
and SNMP 105
supported MIBs 106
MIB (Management Information Base) 105
MIBs 149
mini-GBIC slots 36
connection speed 36
connector type 36
transceiver installation 36
transceiver removal 37
mirroring ports 69
monitor port 69
mounting brackets 32
MSA (MultiSource Agreement) 36
N
NAT 158
network management 149
network management system (NMS) 105
0
open, cable fault 87
P
password 47
pop-up Windows, allowing 137
port details 60
port mirroring 69, 148
port security 89
overview 89
port settings 55, 56
port statistics 59
ports
mirroring 69
speed/duplex 56
power connector 38
power supply specifications 149
prioritizing VoIP traffic 93
product registration 161
product specification 148
PVID 63
PVID (Priority Frame) 63
Q
QoS 148
QoS (Quality of Service) 71
Quality of Service, see QoS 71
queue weight 71
queuing 71
SP 71
WRR 71
queuing method 71
R
RAM logs 97
registration
product 161
related documentation 3
Remote Network Monitoring Management Information Base (RMON MIB) 119
reset 53
reset button 35, 47
default configuration 37
resetting 47
restart 53
restoring configuration 47, 51
RMON
alarm group 126
event group 128
history group 122
statistics group 119
RMON-Lite 119
Round Robin Scheduling 71
rubber feet 31
S
safety certifications 149
safety warnings 6
save configuration 47
SCCP (Skinny Client Control Protocol) 93
Session Initiation Protocol (SIP) 93
short, cable fault 87
Simple Network Management Protocol (SNMP) 105
Simple Network Management Protocol, see SNMP
SIP (Session Initiation Protocol) 93
Skinny Client Control Protocol (SCCP) 93
SNMP 105
agent 105
and MIB 105
authentication 109
group 108
management model 105
manager 105
MIB 106
network components 105
object variables 105
protocol operations 106
setup 107
user 109
versions supported 105
SNMP (Simple Network Management Protocol) 105
SP (Strict Priority) queuing 71
start-up problems 137
static MAC address 83
static MAC forwarding 83, 84
status 44
LED 38
port details 53, 60
VLAN 64, 66
subnet 151
subnet mask 152
subnetting 154
switch lockout 47
switch reset 47
switching 148
syntax conventions 4
system control 149
system status 49
T
tagged VLAN 63
trademarks 159
transceiver
installation 36
removal 37
troubleshooting 137
start-up 137
trunk group 67
trunking 28, 67, 148
configuration 68
distribution criterion 67
Type of Service (ToS) 75
V
ventilation holes 32
VID 63
number of possible VIDs 63
priority frame 63
VID (VLAN Identifier) 63
viewing MAC entries 84
VLAN 63, 148
create 65
editing 66
ID 63
status 64
tagged 63
tagged and untagged 65
W
warranty 160
note 161
web configurator 43
getting help 48
home 44, 49
LED panel 45
login 43
logout 48
navigation 44, 45
weight of the switch 149
weight, queuing 71
Weighted Round Robin scheduling (WRR) 71
WRR (Weighted Round Robin) scheduling 71
- About This User's Guide
- Intended Audience
- Related Documentation
- It is recommended you use the web configurator to configure the switch.
- User Guide Feedback
- Document Conventions
- Warnings and Notes
- Syntax Conventions
- Icons Used in Figures
- Safety Warnings
- For your safety, be sure to read and follow all warning notices and instructions.
- Contents Overview
- Introduction and Hardware Overview 25
- Basic & Advanced Settings 41
- Management and Troubleshooting 95
- Appendices and Index 145
- Table of Contents
- Part II: Basic & Advanced Settings 41
- Chapter 4
- The Web Configurator 43
- Chapter 5
- System 49
- Chapter 6
- Port Settings....55
- Chapter 7
- System and Port Statistics....59
- Chapter 8
- VLAN 63
- Chapter 9
- Trunking....67
- Chapter 10
- Mirroring 69
- Chapter 11
- QoS....71
- Chapter 12
- Port Rate Limit and Storm Control....79
- Chapter 13
- Level 2 (L2) Management 83
- Chapter 14
- Cable Diagnostics....87
- Chapter 15
- Auto Denial of Service (DoS) 89
- Chapter 16
- Auto VoIP 93
- Part III: Management and Troubleshooting 95
- Chapter 17
- Event Logging 97
- Chapter 18
- SNMP....105
- Chapter 19
- RMON-Lite 119
- Chapter 20
- Dynamic ARP 133
- Chapter 21
- Troubleshooting....137
- Part IV: Appendices and Index .... 145
- List of Figures
- List of Tables
- PART I
- Introduction and
- Hardware Overview
- Getting to Know Your Switch
- Introduction
- Backbone Application
- Bridging Example
- High Performance Switching Example
- IEEE 802.1Q VLAN Application Examples
- Tag-based VLAN Example
- Hardware Installation and Connection
- Freestanding Installation
- Do NOT block the ventilation holes. Leave space between devices when stacking.
- Mounting the Switch on a Rack
- Rack-mounted Installation Requirements
- Failure to use the proper screws may damage the unit.
- Precautions
- Attaching the Mounting Brackets to the Switch
- Mounting the Switch on a Rack
- Panel Connections and the RESET Button
- Ethernet Ports
- Default Ethernet Settings
- Mini-GBIC Slots
- Transceiver Installation
- Transceiver Removal
- The RESET Button
- Rear Panel
- Power Connector
- LEDs
- PART II
- Basic & Advanced Settings
- The Web Configurator
- Introduction
- System Login
- The Status Screen
- The LED Panel
- The Navigation Panel
- Change Your Password
- Saving Your Configuration
- Switch Lockout
- Resetting the Switch
- Logging Out of the Web Configurator
- Help
- System Screen
- Configure IP Address
- Level 2 (L2) Table Aging
- Backup Settings
- System: Change Password
- Firmware Upgrade
- Port Settings
- Port Status
- Port Configuration
- System and Port Statistics
- Overview
- Statistics Summary
- Port Statistics
- Introduction to IEEE 802.1Q Tagged VLANs
- Forwarding Tagged and Untagged Frames
- Static VLAN
- IEEE 802.1Q VLAN Screen
- Create IEEE 802.1Q VLAN Screen
- Edit IEEE 802.1Q VLAN Screen
- Trunking
- Trunking Overview
- Distribution Criterion
- Trunk Setting Screen
- Port Mirroring Settings
- QoS Overview
- Weighted Round Robin (WRR)
- Strict Priority
- QoS Enhancement
- Configuring QoS
- Change Number of Queues
- Advanced QoS Settings
- Port Based QoS
- DSCP Based QoS
- Differentiated Services Code Point (DSCP) Overview
- DSCP Based QoS Screen
- ToS Based QoS
- IP Address Based QoS
- Port Rate Limit and Storm Control
- Port Rate Screen
- Rate Limit Screen
- Broadcast Storm Control Setup
- Level 2 (L2) Management
- Configuring L2 Management
- Add a Static MAC Address Entry
- Viewing the L2 Address Table
- Cable Diagnostics
- Diagnostics Overview
- Auto Denial of Service (DoS)
- About Denial of Service Attacks
- DoS Attacks Summary
- Global Auto DoS Attack Prevention
- Advanced Auto DoS Attack Prevention
- Auto VoIP
- About Auto VoIP
- Auto VoIP Settings
- PART III
- Management and Troubleshooting
- Event Logging
- Event Logging Overview
- Logging Screen
- Logging - Add Server
- Viewing RAM and Flash Logs
- Searching RAM and Flash Logs
- Search Results
- About SNMP
- Supported MIBs
- SNMP v3 and Authentication
- SNMP EngineID
- SNMP Group
- SNMP Group - Create
- SNMP Group - Modify
- SNMP User
- SNMP User - Create
- SNMP User - Modify
- SNMP Community
- SNMP Community - Create
- SNMP Community - Modify
- SNMP Notification
- SNMP Trap Station
- SNMP Trap Station - Create
- SNMP Trap Station - Modify
- RMON-Lite Overview
- RMON Statistics : Overview
- RMON-Lite Statistics : Port
- RMON-Lite History MIB
- RMON History Control : Overview
- RMON History Control : Modify
- RMON History Statistics : Overview
- RMON History Statistics: Control
- RMON Alarm: Overview
- RMON Alarm : Create New Alarm
- RMON Event : Overview
- RMON Event Configuration Screens
- RMON Event Log : Overview
- RMON Event Log : Event
- Dynamic ARP
- ARP Table Overview
- ARP Table Entries
- How Dynamic ARP Works
- Enabling Dynamic ARP
- Viewing ARP Table Entries
- Adding ARP Table Entries
- Troubleshooting
- Problems Starting Up the Switch
- Problems Accessing the Switch
- Pop-up Windows, JavaScripts and Java Permissions
- Internet Explorer 6 screens are used here. Screens for other Internet Explorer versions may vary.
- Internet Explorer Pop-up Blockers
- Disable pop-up Blockers
- Enable pop-up Blockers with Exceptions
- Click Apply to save this setting.
- JavaScripts
- Java Permissions
- JAVA (Sun)
- PART IV
- Appendices and Index
- Product Specifications
- IP Addresses and Subnetting
- Introduction to IP Addresses
- Structure
- Subnet Masks
- Network Size
- Notation
- Subnetting
- Example: Four Subnets
- Example: Eight Subnets
- Subnet Planning
- Configuring IP Addresses
- Private IP Addresses
- Legal Information
- Copyright
- Disclaimer
- Trademarks
- Certifications
- Federal Communications Commission (FCC) Interference Statement
- FCC Warning
- CE Mark Warning:
- Taiwanese BSMI (Bureau of Standards, Metrology and Inspection) A Warning:
- Viewing Certifications
- ZyXEL Limited Warranty
- Note
- Registration
- Customer Support
- Required Information
- Corporate Headquarters (Worldwide)
- Costa Rica
- Czech Republic
- Denmark
- Finland
- France
- Germany
- Hungary
- Kazakhstan
- North America
- Norway
- Poland
- Russia
- Spain
- Sweden
- Ukraine
- United Kingdom
- Index
- A
- B
- C
- D
- E
- F
- G
- H
- |
- J
- L
- M
- N
- 0
- P
- Q
- R
- S
- T
- V
- W
Brand : ZYXEL
Model : ES-1528
Category : Network switch