
SU0502 - Flow sensor IFM - Free user manual and instructions
Find the device manual for free SU0502 IFM in PDF.
| Product type | Ultrasonic flow sensor |
| Brand | IFM |
| Model | SU0502 |
| Measurement range (flow) | 0.0 ... 40.0 L/min (display up to 48.0 L/min) |
| Display units | L/min, GAL/min, L/h, GPH, m³/h |
| Supply voltage | 20 ... 28 V DC |
| Switching outputs | 2 PNP or NPN outputs (configurable), short-circuit protected |
| Analog output (output 2) | 4 ... 20 mA or 0 ... 10 V (configurable) |
| Switching functions | Hysteresis (NO/NC), window function (NO/NC) |
| Display | Digital, 3 digits, backlit, can be deactivated |
| Fluid temperature | +5 ... +80 °C |
| Ambient temperature | +10 ... +60 °C |
| Maximum pressure | 16 bar |
| Measurement error | < ±3% of the measured value |
| Response time | 1 ... 3 s |
| Availability delay | Approx. 10 s |
| Adjustable start-up delay | 0 ... 50 s |
| Protection class | IP65 / III |
| Materials in contact with fluid | Bronze, V4A, PPR, EPDM, PES, CuZn39Pb3, Centellen 200 |
| Housing material | CuZn39Pb3, ABS, PA |
| Process connection | G½ (thread) |
| Electrical connection | M12 connector, 4-pin |
| Installation | In-line, observe flow direction, straight distance min. 5× pipe diameter |
| Programming | Via two buttons (Mode/Enter and Set) |
| Additional functions | Customer calibration (CGA), max/min flow memory, start-up delay, locking |
Frequently Asked Questions - SU0502 IFM
User questions about SU0502 IFM
0 question about this device. Answer the ones you know or ask your own.
Ask a new question about this device
Download the instructions for your Flow sensor in PDF format for free! Find your manual SU0502 - IFM and take your electronic device back in hand. On this page are published all the documents necessary for the use of your device. SU0502 by IFM.
USER MANUAL SU0502 IFM
Ultrasonics flow rate sensor
flowchart
graph TD
    A["Mode/Enter"] --> B["Set"]
    B --> C["SP1"]
Werte bestätigen Acknowledgement of values Confirmer la valeur
Then the cycle starts again at the minimum setting value.
Select the display unit before setting the switch points (SPx, rPx) or the limits for the analog output signal (ASP, AEP). This avoids rounding errors generated internally during the conversion of the units and enables exact setting of the values.
Schritt 2

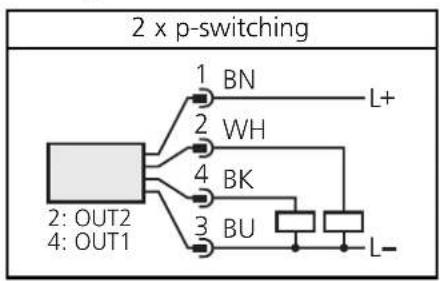
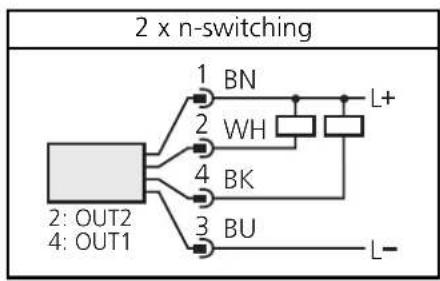
1 = BN (braun), 2 = WH (weiß), 3 = BU (blau), 4 = BK (schwarz)
Programmieren
line
| t | Q | | ---- | ----- | | 0 | 0 | | 1 | 1 | | 2 | 1 | | 3 | 1 | | 4 | 1 | | 5 | 1 | | 6 | 1 | | 7 | 1 | | 8 | 1 | | 9 | 1 | | 10 | 1 | | 11 | 1 | | 12 | 1 | | 13 | 1 | | 14 | 1 | | 15 | 1 | | 16 | 1 | | 17 | 1 | | 18 | 1 | | 19 | 1 | | 20 | 1 | | 21 | 1 | | 22 | 1 | | 23 | 1 | | 24 | 1 | | 25 | 1 | | 26 | 1 | | 27 | 1 | | 28 | 1 | | 29 | 1 | | 30 | 1 | | 31 | 1 | | 32 | 1 | | 33 | 1 | | 34 | 1 | | 35 | 1 | | 36 | 1 | | 37 | 1 | | 38 | 1 | | 39 | 1 | | 40 | 1 | | 41 | 1 | | 42 | 1 | | 43 | 1 | | 44 | 1 | | 45 | 1 | | 46 | 1 | | 47 | 1 | | 48 | 1 | | 49 | 1 | | 50 | 1 | | 51 | 1 | | 52 | 1 | | 53 | 1 | | 54 | 1 | | 55 | 1 | | 56 | 1 | | 57 | 1 | | 58 | 1 | | 59 | 1 | | 60 | 1 | | 61 | 1 | | 62 | 1 | | 63 | 1 | | 64 | 1 | | 65 | 1 | | 66 | 1 | | 67 | 1 | | 68 | 1 | | 69 | 1 | | 70 | 1 | | 71 | 1 | | 72 | 1 | | 73 | 1 | | 74 | 1 | | 75 | 1 | | 76 | 1 | | 77 | 1 | | 78 | 1 | | 79 | 1 | | 80 | 1 | | 81 | 1 | | 82 | 1 | | 83 | 1 | | 84 | 1 | | 85 | 1 | | 86 | 1 | | 87 | 1 | | 88 | 1 | | 89 | 1 | | 90 | 1 | | 91 | 1 | | 92 | 1 | | 93 | 1 | | 94 | 1 | | 95 | 1 | | 96 | 1 | | 97 | 1 | | 98 | 1 | | 99 | 1 | | Hno | High (approx)| | Hnc | High (approx)| The chart displays a single line graph with 'SP' and 'rP' as labels on the y-axis. The x-axis is labeled 't'. The legend indicates 'Hysterese' and 'Hno'. The values for 'SP' are marked as 'SP' and 'rP' as 'rP'.Fensterfunktion
line
| t | Q | rP | | ---- | ----- | ---- | | 0 | 0 | 0 | | 1 | 0 | 0 | | 2 | 0 | 0 | | 3 | 0 | 0 | | 4 | 0 | 0 | | 5 | 0 | 0 | | 6 | 0 | 0 | | 7 | 0 | 0 | | 8 | 0 | 0 | | 9 | 0 | 0 | | 10 | 0 | 0 | | 11 | 0 | 0 | | 12 | 0 | 0 | | 13 | 0 | 0 | | 14 | 0 | 0 | | 15 | 0 | 0 | | 16 | 0 | 0 | | 17 | 0 | 0 | | 18 | 0 | 0 | | 19 | 0 | 0 | | 20 | 0 | 0 | | 21 | 0 | 0 | | 22 | 0 | 0 | | 23 | 0 | 0 | | 24 | 0 | 0 | | 25 | 0 | 0 | | 26 | 0 | 0 | | 27 | 0 | 0 | | 28 | 0 | 0 | | 29 | 0 | 0 | | 30 | 0 | 0 | | 31 | 0 | 0 | | 32 | 0 | 0 | | 33 | 0 | 0 | | 34 | 0 | 0 | | 35 | 0 | 0 | | 36 | 0 | 0 | | 37 | 0 | 0 | | 38 | 0 | 0 | | 39 | 0 | 0 | | 40 | 0 | 0 | | 41 | 0 | 0 | | 42 | 0 | 0 | | 43 | 0 | 0 | | 44 | 0 | 0 | | 45 | 0 | 0 | | 46 | 0 | 0 | | 47 | 0 | 0 | | 48 | 0 | 0 | | 49 | 0 | 0 | | 50 | 0 | 0 | | 51 | 0 | 0 | | 52 | 0 | 0 | | 53 | 0 | 0 | | 54 | 0 | 0 | | 55 | 0 | 0 | | 56 | 0 | 0 | | 57 | 0 | 0 | | 58 | 0 | 0 | | 59 | 0 | 0 | | 60 | 0 | 0 | | Note: The data is extracted from the code and presented in CSV format as requested. The 'Gutbereich' label above the chart indicates it is part of the original table structure. The 'Fno' and 'Fnc' labels are not present in the image. The 'rP' label is not present in the image but likely represents a mathematical or physical formula.line
| Point | SP | rP | |-------|------|------| | ① | 2.5% | 2.5% | | ② | 3.5% | 3.5% | | ③ | 4.0% | 4.0% | | ④ | 3.8% | 3.8% | | ⑤ | 3.0% | 3.0% | | ⑥ | 2.0% | 2.0% | | ⑦ | 2.5% | 2.5% | | ⑧ | 3.5% | 3.5% |Controls and visual indication
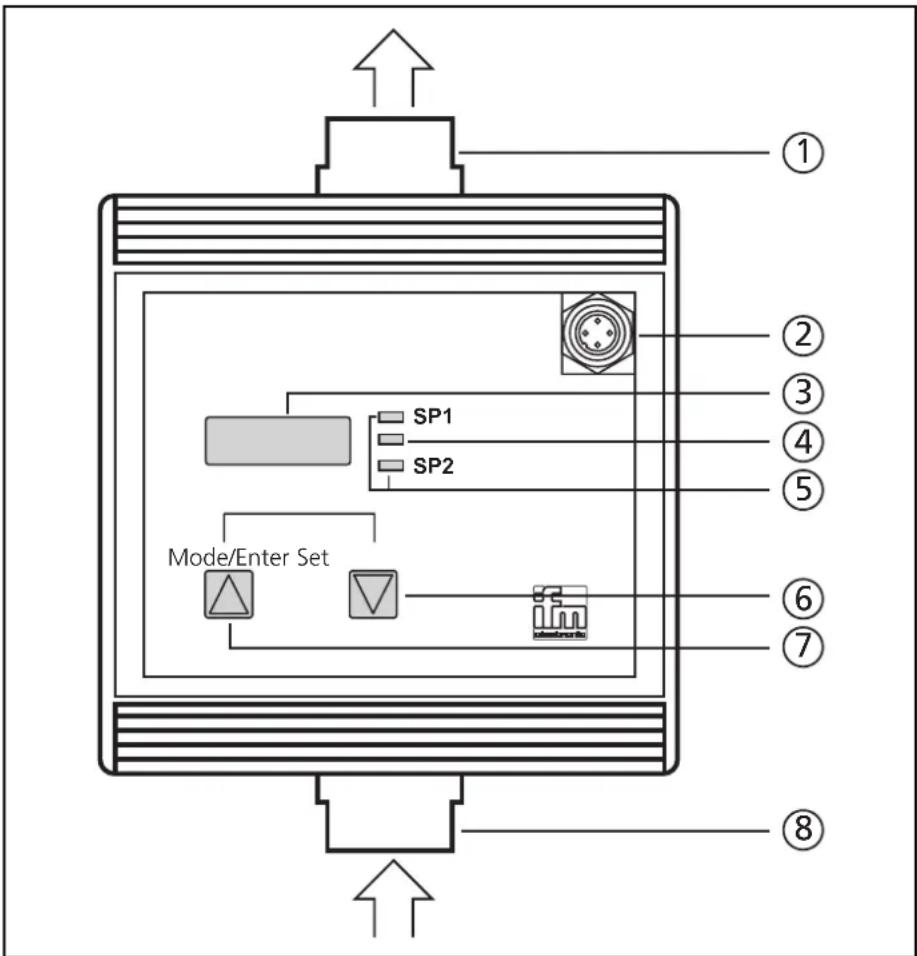
| 1 | process connection G 12 / downstream | |
| 2 | M12 connector | |
| 3 | 7-segment display | display of the current flow velocity ^1) ,display of parameters and parameter values |
| 4 | Calibration indicator | LED lights if customer-specific calibrationhas been carried out |
| 5 | 2 x LED yellow | switching status; lights if output I / II has switched |
| 6 | Set button | setting of the parameter values(scrolling by holding pressed;incremental by pressing briefly) |
| 7 | Mode / Enter button | selection of the parametersand acknowledgement of the parameter values |
| 8 | process connection G 12 / upstream | |
^1) LPH (litre/hour) value = displayed value ×10
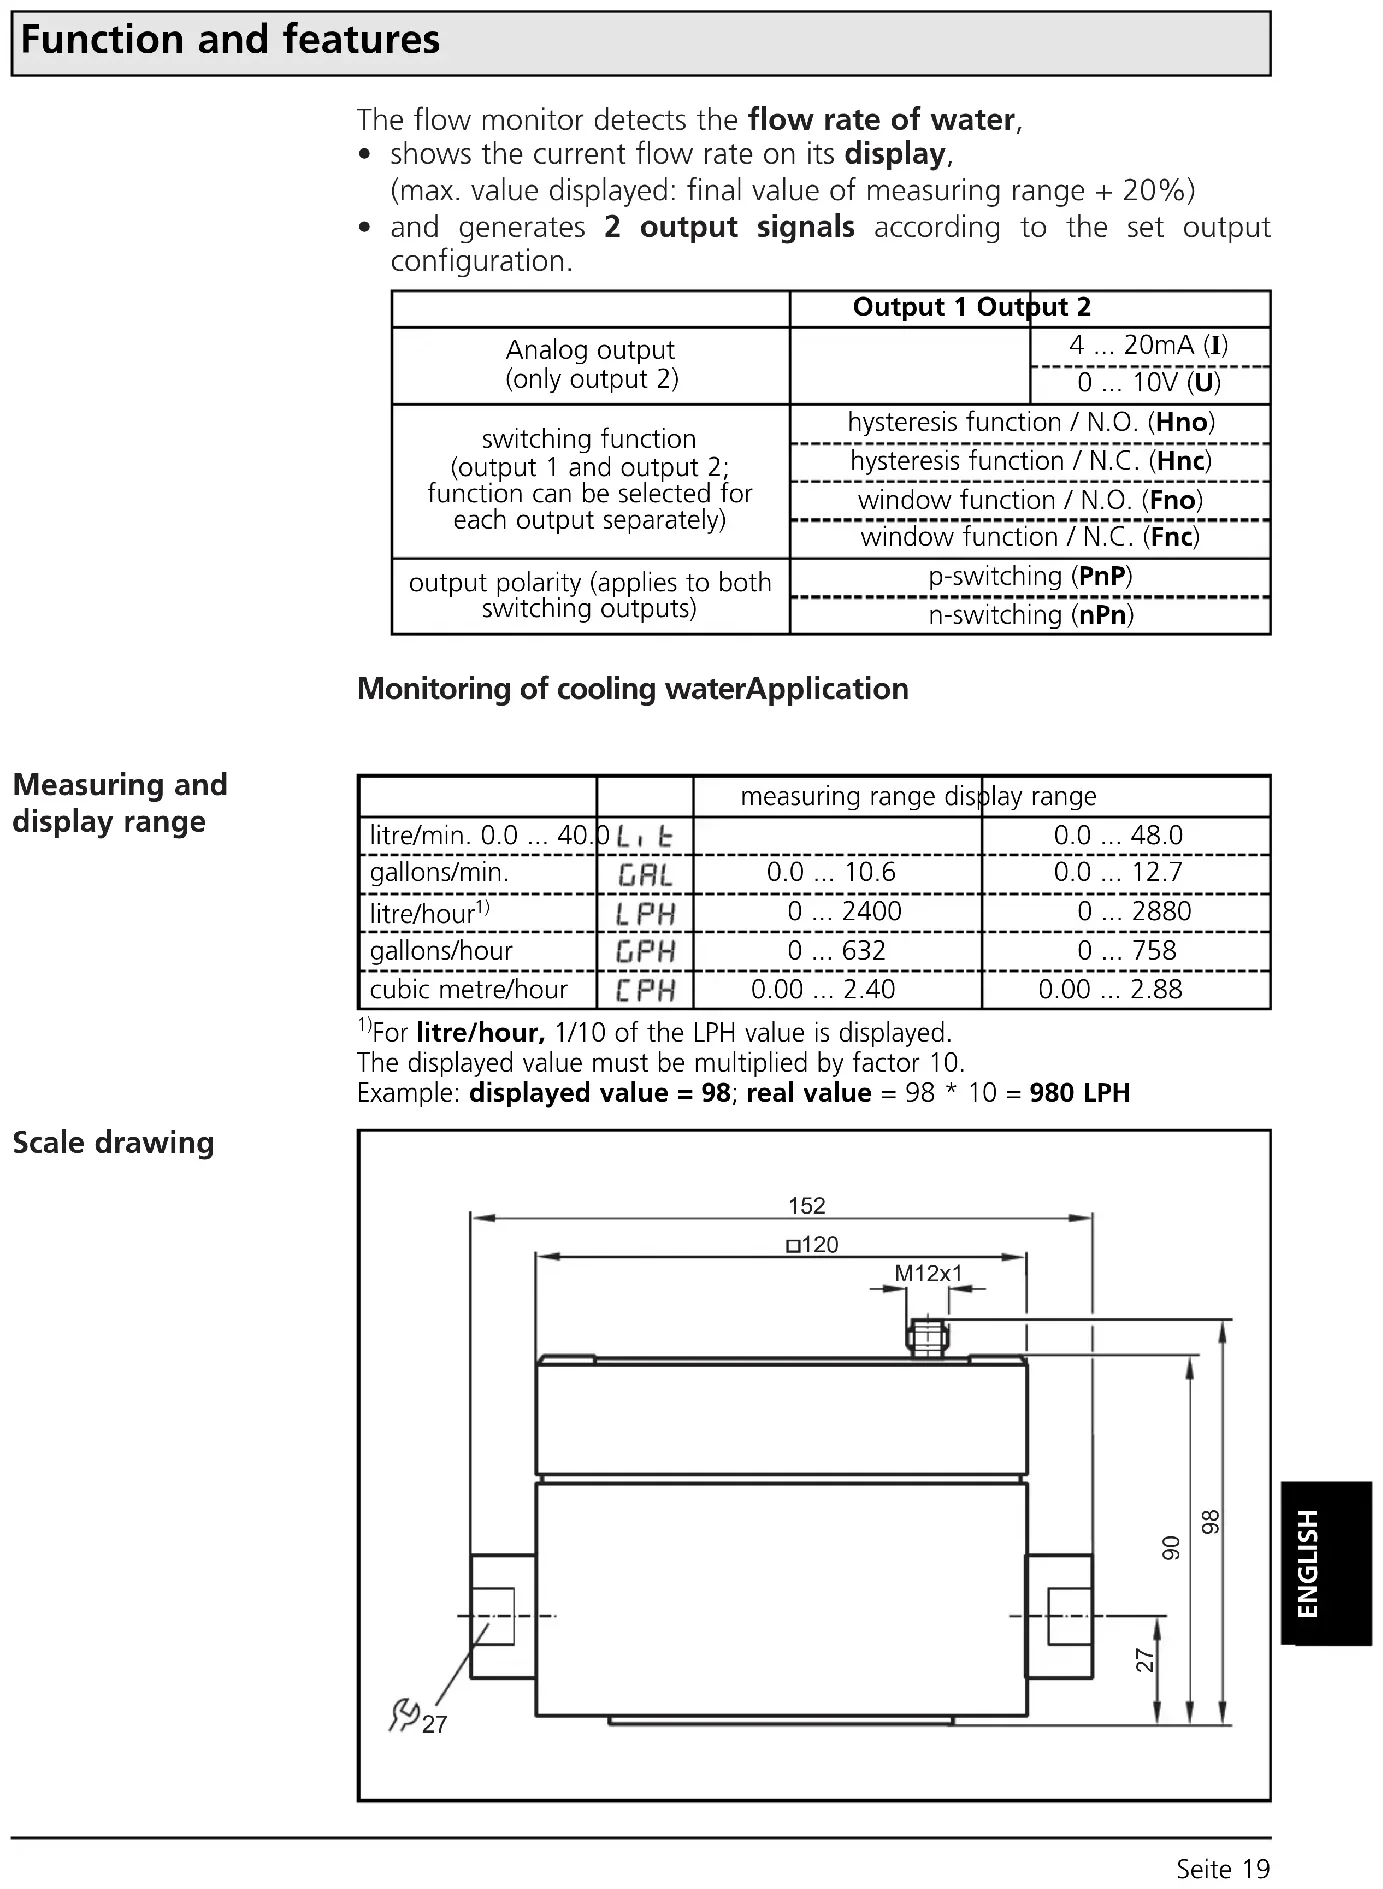
Function and features
The flow monitor detects the flow rate of water,
• shows the current flow rate on its display,
(max. value displayed: final value of measuring range + 20%)
- and generates 2 output signals according to the set output configuration.
| Output 1 Output 2 | ||
| Analog output(only output 2) | 4 ... 20mA (I) | |
| 0 ... 10V (U) | ||
| switching function(output 1 and output 2;function can be selected for each output separately) | hysteresis function / N.O. (Hno) | |
| hysteresis function / N.C. (Hnc) | ||
| window function / N.O. (Fno) | ||
| window function / N.C. (Fnc) | ||
| output polarity (applies to both switching outputs) | p-switching (PnP) | |
| n-switching (nPn) | ||
Monitoring of cooling waterApplication
Measuring and display range
| measuring range display range | |||
| litre/min. 0.0 ... 40.0 | L, E | 0.0 ... 48.0 | |
| gallons/min. | GAL | 0.0 ... 10.6 | 0.0 ... 12.7 |
| litre/hour^1) | LPH | 0 ... 2400 | 0 ... 2880 |
| gallons/hour | GPH | 0 ... 632 | 0 ... 758 |
| cubic metre/hour | CPH | 0.00 ... 2.40 | 0.00 ... 2.88 |
^1) For litre/hour, 1/10 of the LPH value is displayed.
The displayed value must be multiplied by factor 10.
Example: displayed value = 98; real value = 98 * 10 = 980 LPH
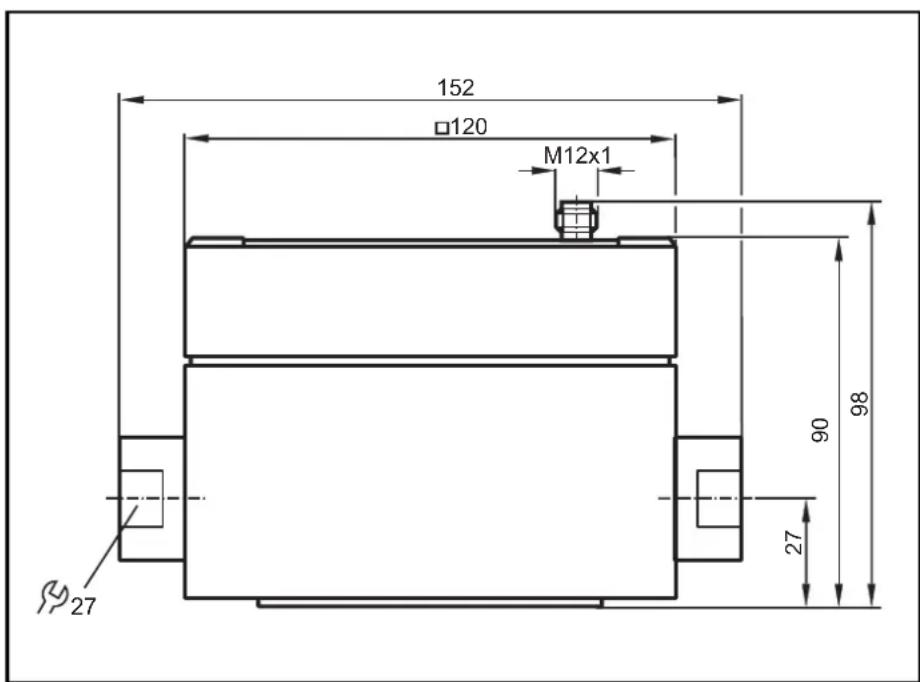
Scale drawing
Operating modes
Run mode
Normal operating mode
With power on and the power-on delay time elapsed* (approx. 10s) the unit is in the Run mode. It monitors and generates output signals according to the set parameters.
The display indicates the current flow (can be deactivated, → page 25).
The yellow LEDs indicate the switching state of the outputs.
*During the power-on delay time the most important parameter values are displayed briefly, then the current measured value is indicated. Even if the display is deactivated (diS = OFF), the most important parameter values are indicated, then the current measured value is indicated for 15s, then the display goes out.
Both outputs are switched according to the programming: ON with the NO function (Hno/Fno) and OFF with the NC function (Hnc/Fnc).
Note: When the hysteresis function is active, the outputs remain in this switching state after the power-on delay time has elapsed if the flow is between SPx and rPx.
If output 2 is configured as analog output, the output signal is 20mA or 10V.
Display mode
Indication of parameters and the set parameter values
When the "Mode/Enter" button is pressed briefly, the unit passes to the Display mode which allows parameter values to be read. The internal sensing, processing and output functions of the unit continue as if in Run mode.
- The parameter names are scrolled with each pressing of the "Mode/Enter" button.
- When the "Set" button is pressed briefly, the corresponding parameter value is displayed for 15s. After another 15s the unit returns to the Run mode.
Programming mode
Setting of the parameter values
While viewing a parameter value pressing the "Set" button for more than 5s causes the unit to enter the programming mode. You can alter the parameter value by pressing the "Set" button and confirm the new value by pressing the "Mode/Enter" button. The internal sensing, processing and output functions of the unit continue as if in Run mode with the original parameter values unless a new value is confirmed. The unit returns to the Run mode when no button has been pressed for 15s.
Installation
Step 1
Seal the pipe threads (A) with liquid seal.
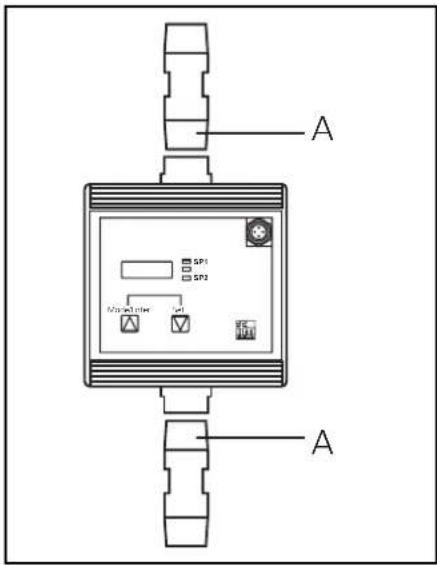
Step 2

Mount the unit in direction of the flow (arrow)*. Screw the pipes into the adapters (B) and tighten them. Tightening torque: 30Nm. Block the adapters by means of a spanner. Do not turn the 2 adapters (B). This would lead to a faulty sealing inside the housing.
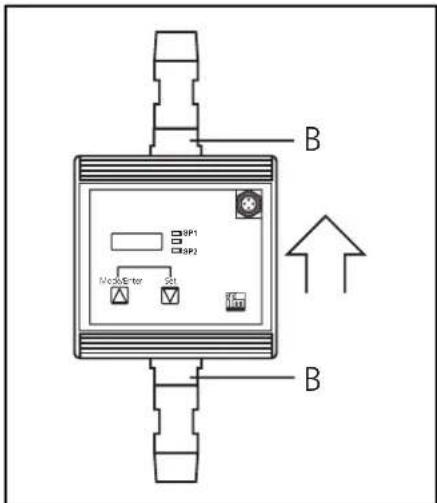
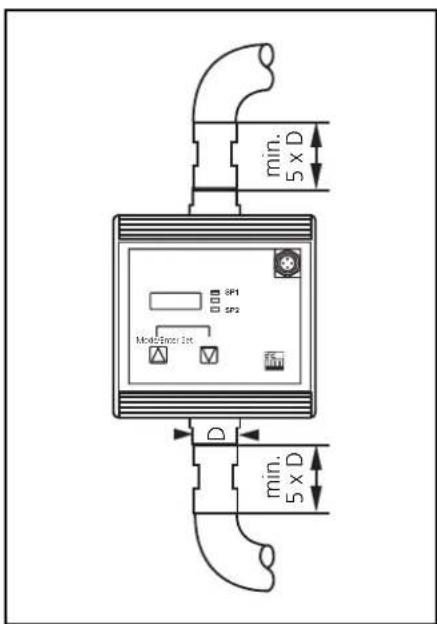
Minimum distance
To avoid malfunction a minimum distance (5 x pipe diameter) between the flow monitor and bends, valves, changes in cross-section or such like must be observed (This information refers to laminar flow).
*For certain mounting positions (unit vertical, flow direction horizontal) air bubbles in the system can affect the measurement after mounting. Briefly rinse the system after mounting (rinse flow rate > 3l/min.).
Electrical connection

The unit must only be connected by an electrician.
The national and international regulations for the installation of electrical equipment must be observed.
Voltage supply to EN50178, SELV, PELV.
Disconnect power before connecting the unit.
Wiring:
flowchart
graph TD
    A["2: OUT2"] --> B["1: BN"]
    A --> C["2: WH"]
    A --> D["4: BK"]
    A --> E["3: BU"]
    F["4: OUT1"] --> G["2: OUT2"]
    F --> H["4: OUT1"]
    I["L+"] --> J["L-"]
    K["L+"] --> L["BU"]
flowchart
graph TD
    A["2: OUT2\n4: OUT1"] --> B["1: BN"]
    A --> C["2: WH"]
    A --> D["3: BU"]
    A --> E["4: BK"]
    B --> F["L+"]
    C --> G["L-"]
    D --> H["L+"]
    E --> I["L-"]
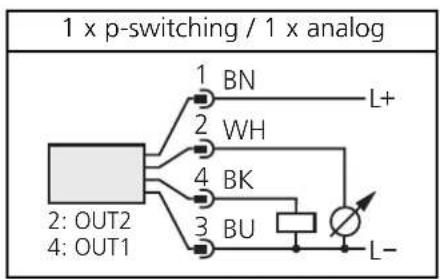
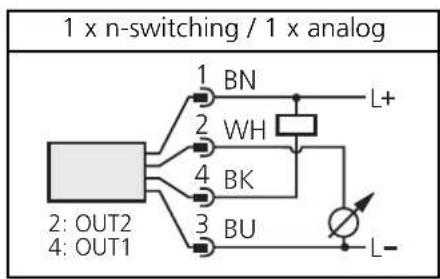
Core colours of ifm sockets:
1 = BN (brown), 2 = WH (white), 3 = BU (blue), 4 = BK (black).
Programming
Adjustable parameters
→ page 24
Menu structur
→ page 3
| 1 | 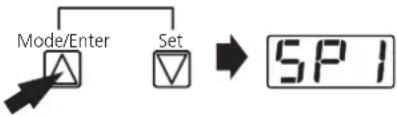 | Press the Mode/Enter button several times until the respective parameter is displayed. |
| 2 | 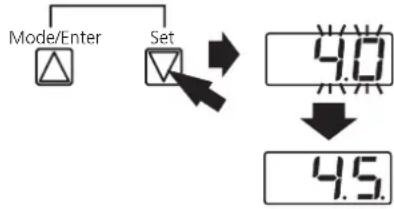 | Press the Set button and keep it pressed. The current parameter value flashes for 5s, then the value is increased* (incremental by pressing briefly or scrolling by holding pressed). |
| 3 | 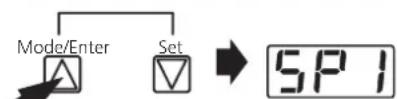 | Press the Mode/Enter button briefly (= acknowledgement). The parameter is displayed again, the set parameter value becomes effective. |
| 4 | Change more parameters: Start again with step 1. | Finish programming: Wait for 15s or press the Mode/Enter button until the current measured value is indicated again. |
*Decrease the value: Let the display of the parameter value move to the maximum setting value. Then the cycle starts again at the minimum setting value.
Timeout
If no button is pressed for 15s during the setting procedure, the unit returns to the Run mode with unchanged values.
Locking / Unlocking
The unit can be electronically locked to prevent unwanted adjustment of the set parameters: Press (in Run mode) both pushbuttons for 10s. As soon as the indication goes out the unit is locked or unlocked. Units are delivered from the factory in the unlocked state.
With the unit in the locked state is indicated briefly when you try to change parameter values.
Operation
After mounting, wiring and setting check whether the unit operates correctly.
Failure indication
| OL | excess flow (flow > 120% of the final value of the measuring range) |
| ULO | flashing: supply voltage too low (< 19V); the switching outputs are reset, the analog signal is reset to 0V / 0mA. |
| SC1 | flashing: short circuit of the switching output 1 |
| SC2 | flashing: short circuit of the switching output 2 |
| SC | flashing: short circuit of both switching outputs |
Technical information / Functioning / Parameters
Adjustable parameters
Menu structure → page 3
| SP1SP2 | Switch-on point 1 / 2:Upper limit value at which the output changes its switching status.SP2 is active only if OU2 = Hno, Hnc, Fno or Fnc. | ||||
| rP1rP2 | Switch-off point 1 / 2:Lower limit value at which the output changes its switching status.rPx is always lower than SPx. The unit only accepts values which are lower than SPx.Changing the switch-on point also changes the switch-off point (the distance between SPx and rPx remains constant).If the distance is higher than the new switch point, it is automatically reduced: rPx is set to the minimum setting value (0.0).rP2 is active only if OU2 = Hno, Hnc, Fno or Fnc. | ||||
| Setting range | SP1 / SP2 rP1 / | P2 in steps of | |||
| litre/min. | L, E | 0.4 ... 48.0 | 0.0 ... 47.6 0.1 | ||
| gallons/min | GAL | 0.1 ... 12.7 0.0 | ... 12.6 0.1 | ||
| litre/hour1) | LPH | 20 ... 2880 0 ... | 2860 10 | ||
| gallons/hour | GPH | 6 ... 758 0 ... | 752 1 | ||
| cubic metre/hour | CPH | 0.02 ... 2.88 0.00 | ... 2.86 0.01 | ||
| OU1 | Configuration of output 14 switching functions can be set:- Hno = hysteresis / normally open- Hnc = hysteresis / normally closed- Fno = window function / normally open- Fnc = window function / normally closed | ||||
| OU2 | Configuration of output 24 switching functions and 2 analog signals can be set:- Hno = hysteresis / normally open- Hnc = hysteresis / normally closed- Fno = window function / normally open- Fnc = window function / normally closed- I = analog output 4 ... 20mA- U = analog output 0 ... 10V | ||||
| ASP | Lower end of analog output (Explanation → page 27)Measured value for which the output signal is 4mA / 0V.ASP is active only if OU2 = I or U. | ||||
| REP | Upper end of analog output (Explanation → page 27)Measured value for which the output signal is 20mA / 10V.Minimum distance between ASP and AEP = 40% of the value of the measuring range.AEP is active only if OU2 = I or U. | ||||
| Setting range | ASP | AEP in steps of | |||
| litre/min. | L, E | 0.0 ... 32.0 | 16.0 ... 48.0 0.1 | ||
| gallons/min | GAL | 0.0 ... 8.5 4.2 ... | 12.7 0.1 | ||
| litre/hour1) | LPH | 0 ... 1920 | 960 ... 2880 | 10 | |
| gallons/hour | GPH | 0 ... 506 253 | ... 758 | 1 | |
| cubic metre/hour | CPH | 0.00 ... 1.92 | 0.96 ... 2.88 | 0.01 | |
| d1A | Inside pipe diameterSetting the flow monitor to the selected pipe size.Not implemented for this unit version (the preset value is displayed). | ||||
^1) LPH (litre/hour) value = displayed value ×10
Technical information / Functioning / Parameters
| EF | Enhanced functionsThis menu item contains a submenu with additional parameters. You can access these parameters by pressing the SET button briefly. |
| HILO | Min-Max memory for flow rate:HI: displays the highest measured flow rangeLO: displays the lowest measured flow rangeErase the memory:- Press the "Mode/Enter" button until HI or LO is displayed.- Press the "Set" button and keep it pressed until "-" - - - " is displayed.- Then press the "Mode/Enter" button briefly.It is recommended to erase the memory as soon as the unit starts working under normal operating conditions. |
| CGA | Customer-specific calibration (Explanation →page 26)If the function is active, the current flow value is displayed.- Press the SET button to set the requested value(scrolling by holding pressed; incremental by pressing briefly).- Acknowledge with the Mode/Enter button.After calibration the LED "calibration indicator" is lit.Calibration is only possible for values >25% of the final value of the measuring range. For smaller values LO is displayed, the setting of the parameter is disabled.Setting range: -40% ...+40% of the final value of the measuring range;max. value displayed: final value of the measuring range + 20%. |
| CAr | Calibration reset- Press the "Mode/Enter" button until CAR is displayed.- Press the "Set" button and keep it pressed until "-" - - - " is displayed.- Then press the "Mode/Enter" button briefly.The calibration set by CGA is reset; the LED "calibration indicator" no longer lights. |
| dSt | Start-up delayDuring this time special conditions apply to the switching of the outputs(Explanation →page 28)adjustable in steps of 1s. setting range: 0 ... 50s (0 = start-up delay not active).The time applies to both outputs. |
| P-n | Output polarity2 options can be selected:- PnP = positive switching-nPn = negative switchingThis setting applies to both switching outputs. |
| d15 | Setting of the display2 options can be selected:d3 = normal displayOFF = The display is deactivated in the Run mode.When one of the buttons is pressed the current measured value is displayed for 15s.When the Mode/Enter button is then pressed, the display mode is opened.The LEDs indicating the switching state and the calibration indicator remain active even if the display is deactivated. |
| Uni | Display unit5 options can be selected:Lit = litre/min.; GAL = gallons/min.; LPH = litre/hour; GPH = gallons/hour;CPH = cubic metre/hourLabels for the different units of display are enclosed with the unit. Stick the respective label on the sensor or fill in the blank label.Select the display unit before setting the switch points (SPx, rPx) or the limits for the analog output signal (ASP, AEP). This avoids rounding errors generated internally during the conversion of the units and enables exact setting of the values. |
Technical information / Functioning / Parameters
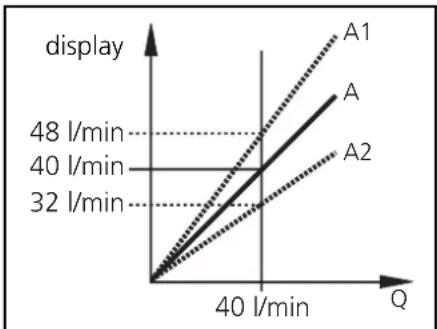
Customer-specific calibration (CGA)
This calibration changes the slope of the curve of measured values. It influences the display and the analog output.
Calibration is only possible for values > 25% of the final value of the measuring range.
It can be reset ( menu item CAr).
line
| Q | display (l/min) | | ---- | --------------- | | 40 | 32 | | 40 | 40 | | 40 | 48 |A = curve of measured values without calibration
A1, A2 = curve of measured values after calibration
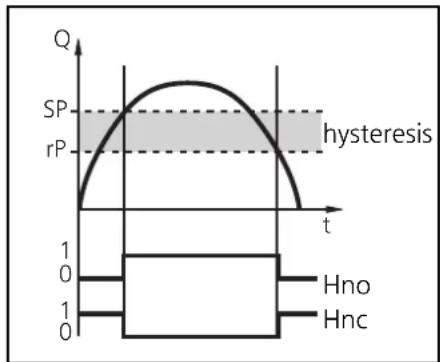
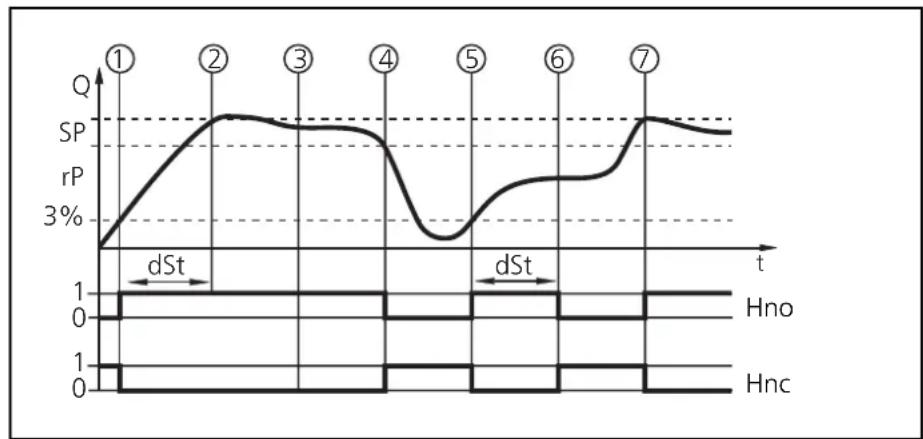
Hysteresis
The hysteresis keeps the switching state of the output stable if the flow varies about the preset value.
When the flow is rising, the output switches when the switch-on point has been reached (SPx). When the flow is falling again, the output switches back when the switch-off point (rPx) has been reached.
The hysteresis can be adjusted: First the switch-on point is set, then the switch-off point with the requested difference.
line
| t | Q | | ---- | ----- | | 0 | 0 | | 1 | 1 | | 2 | 1 | | 3 | 1 | | 4 | 1 | | 5 | 1 | | 6 | 1 | | 7 | 1 | | 8 | 1 | | 9 | 1 | | 10 | 1 | | 11 | 1 | | 12 | 1 | | 13 | 1 | | 14 | 1 | | 15 | 1 | | 16 | 1 | | 17 | 1 | | 18 | 1 | | 19 | 1 | | 20 | 1 | | 21 | 1 | | 22 | 1 | | 23 | 1 | | 24 | 1 | | 25 | 1 | | 26 | 1 | | 27 | 1 | | 28 | 1 | | 29 | 1 | | 30 | 1 | | 31 | 1 | | 32 | 1 | | 33 | 1 | | 34 | 1 | | 35 | 1 | | 36 | 1 | | 37 | 1 | | 38 | 1 | | 39 | 1 | | 40 | 1 | | 41 | 1 | | 42 | 1 | | 43 | 1 | | 44 | 1 | | 45 | 1 | | 46 | 1 | | 47 | 1 | | 48 | 1 | | 49 | 1 | | 50 | 1 | | 51 | 1 | | 52 | 1 | | 53 | 1 | | 54 | 1 | | 55 | 1 | | 56 | 1 | | 57 | 1 | | 58 | 1 | | 59 | 1 | | 60 | 1 | | 61 | 1 | | 62 | 1 | | 63 | 1 | | 64 | 1 | | 65 | 1 | | 66 | 1 | | 67 | 1 | | 68 | 1 | | 69 | 1 | | 70 | 1 | | 71 | 1 | | 72 | 1 | | 73 | 1 | | 74 | 1 | | 75 | 1 | | 76 | 1 | | 77 | 1 | | 78 | 1 | | 79 | 1 | | 80 | 1 | | 81 | 1 | | 82 | 1 | | 83 | 1 | | 84 | 1 | | 85 | 1 | | 86 | 1 | | 87 | 1 | | 88 | 1 | | 89 | 1 | | 90 | 1 | | 91 | 1 | | 92 | 1 | | 93 | 1 | | 94 | 1 | | 95 | 1 | | 96 | 1 | | 97 | 1 | | 98 | 1 | | 99 | 1 | | Note: The data is extracted from the code and presented in CSV format as requested. The 'SP' and 'rP' values are calculated based on the formula 'SP' and 'rP' respectively. The 'hysteresis' label above the plot is not used in the chart.Window function
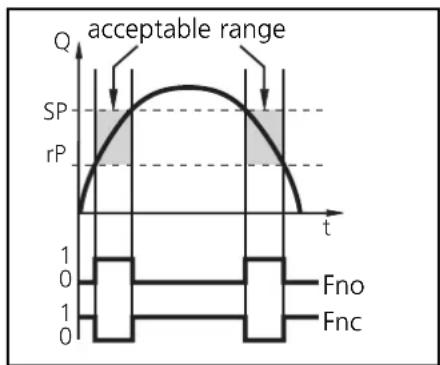
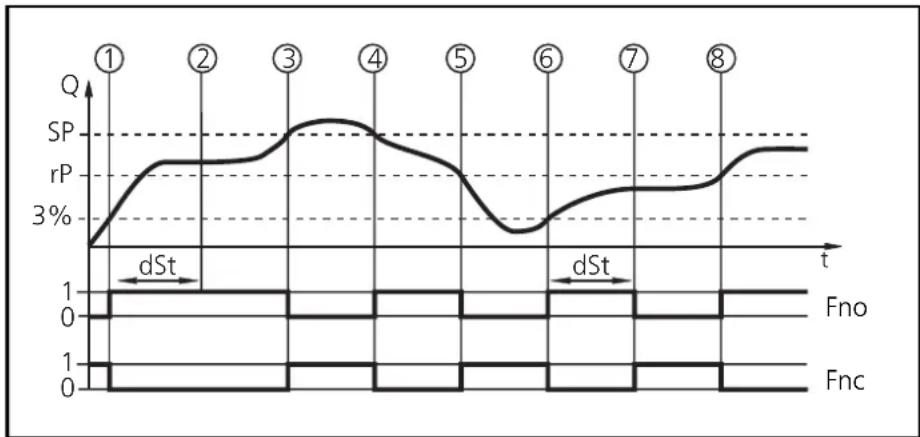
The window function enables the monitoring of a defined acceptable range. When the flow varies between the switch-on point (SPx) and the switch-off point (rPx), the output is switched (window function/NO) or not switched (window function/NC).
line
| t | Q | | ---- | ----- | | 0 | 0 | | 1 | 1 | | 2 | 0 |Technical information / Functioning / Parameters
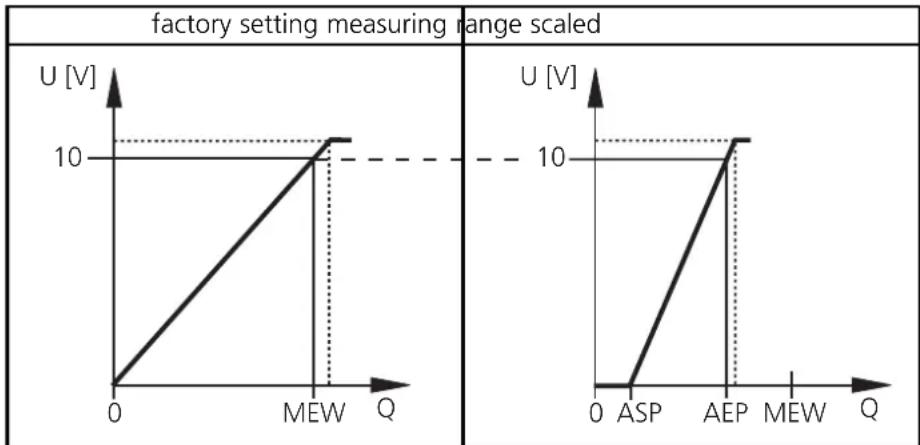
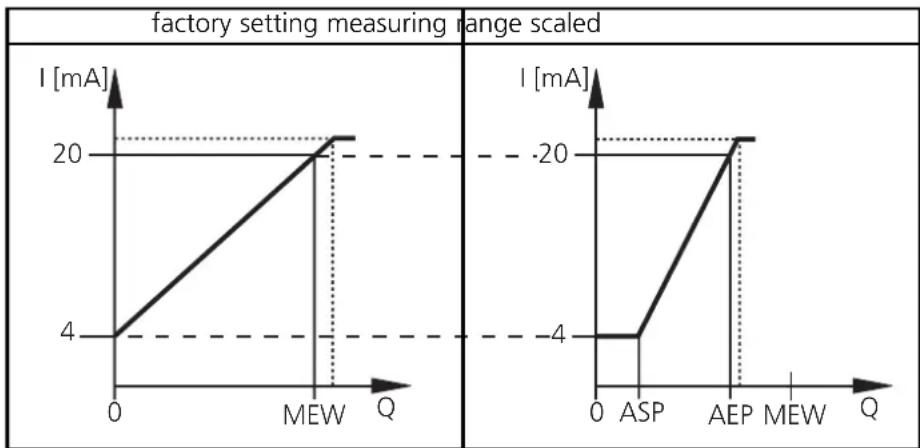
Scaling the measuring range (analog output)
With the parameter "Lower end of analog output" (ASP) you can select the measuring value for which the output signal is 4mA or 0V. With the parameter "Upper end of analog output" (AEP) you can select the measuring value for which the output signal is 20mA or 10V.
Minimum distance between ASP and AEP = 40% of the final value of the measuring range.
Voltage output 0 ... 10V
line
| Q | U [V] | | ---- | ----- | | 0 | 0 | | MEW | 10 | | ASP | 10 | | AEP | 10 | | MEW | 10 |MEW = value of measuring range
The output signal is between 0 and 10V in the set measuring range. It is also indicated:
Flow above the measuring range: output signal > 10V.
Current output 4 ... 20mA
line
| Q | I [mA] | | ---- | ------ | | 0 | 4 | | MEW | 20 | | Q | -20 | | ASP | -4 | | AEP | -20 | | MEW | -20 |MEW = value of measuring range
The output signal is between 4 and 20mA in the set measuring range. It is also indicated:
Flow above the measuring range: output signal > 20mA.
Technical information / Functioning / Parameters
Start-up delay (dSt)
If the start-up delay is active (dSt > 0), the following conditions apply: As soon as the flow has reached the value 3% of the final value (FV)
• the start-up delay starts and
- the outputs are switched according to the programming: ON with the NO function (Hno / Fno), OFF with the NC function (Hnc / Fnc).
During the start-up delay 2 cases are possible:
- fast increase of flow, switch point / acceptable range are reached within dSt → outputs remain active.
- slow increase of flow, switch point / acceptable range are not reached (or flow falls below 3%) within dSt → outputs are reset.
Example dSt with hysteresis function:
line
| t | SP | rP | |---|------|-----| | ① | 3% | 3% | | ② | 6% | 6% | | ③ | 5% | 5% | | ④ | 4% | 4% | | ⑤ | 2% | 2% | | ⑥ | 3% | 3% | | ⑦ | 6% | 6% || 1 | flow reaches 3% of the final value (FV) → dSt starts, the output becomes active |
| 2 | dSt has elapsed, flow has reached SP → the output remains active |
| 3 | flow falls below SP but remains above rP →the output remains active |
| 4 | flow falls below rP →the output is reset |
| 5 | flow reaches 3% of the final value again → dSt starts, the output becomes active |
| 6 | dSt has elapsed, flow has not reached SP → the output is reset |
| 7 | flow reaches SP →the output becomes active |
Technical information / Functioning / Parameters
Example: dSt with window function:
line
| t | SP | rP | |---|------|------| | ① | 2.5% | 2.5% | | ② | 4.0% | 3.0% | | ③ | 5.0% | 3.5% | | ④ | 4.5% | 3.0% | | ⑤ | 3.5% | 2.5% | | ⑥ | 2.0% | 2.0% | | ⑦ | 3.0% | 2.5% | | ⑧ | 4.0% | 3.0% || 1 | flow reaches 3% of the final value (FV) → dSt starts, the output becomes active |
| 2 | dSt has elapsed, flow has reached the acceptable range → the output remains active |
| 3 | flow exceeds SP (leaves the acceptable range) → the output is reset |
| 4 | flow falls below SP again → the output becomes active again |
| 5 | flow falls below rP (leaves the acceptable range) → the output is reset again |
| 6 | flow reaches 3% of the final value again → dSt starts, the output becomes active |
| 7 | dSt has elapsed, flow has not reached the acceptable range → the output is reset |
| 8 | flow reaches acceptable range →the output becomes active |
Technical data
| Application . . . . . . . . . . . . . . . . . . . . . . . . . . . . . . . . . . . . . . . . . . . . . . . . . . . . . . . . . . . . . . . . . . . . . . . . . . . . . . . . . . . . . . . . . . . . . . . . . . . . monitoring of cooling water |
| Operating voltage [V] . . . . . . . . . . . . . . . . . . . . . . . . . . . . . . . . . . . . . . . . . . . . . . . . . . . . . . . . . . . . . . . . . . . . . . . . . . . . . . . . . . . . . . . . . . . . . . . . . . . 20 ... 28 DCCurrent rating [mA] . . . . . . . . . . . . . . . . . . . . . . . . . . . . . . . . . . . . . . . . . . . . . . . . . . . . . . . . . . . . . . . . . . . . . . . . . . . . . . . . . . . . . . . . . . . . . . . . . . short-circuit prot., reverse polarity / overload prot.Voltage drop [V]. . . . . . . . . . . . . . . . . . . . . . . . . . . . . . . . . . . . . . . . . . . . . . . . . . . . . . . . . . . . . . . . . . . . . . . . . . . . . . . . . . < 2Current consumption [mA] . . . . . . . . . . . . . . . . . . . . . . . . . . . . . . . . . . . . . . . . . . . . . . . . . . . . . . . . . . . . . . . . . . . . . . . . . . . . . . . . . . . . Analog output . . . . . . . . . . . . . . . . . . . . . . . . . . . . . . . . . . . . . . . . . . . . . . . . . . . . . . . . . . . . . . . . . . . . . . . . . . . . . . . . . . . . . . . . . . . . . . . . . . . Measuring range scalableMax. load current output [Ω] 500Min. load with voltage output [Ω] . . . . . . . . . . . . . . . . . . . . . . . . . . . . . . . . . . . . . . . . . . . . . . . . . . 2000 |
| Medium temperature [°C] +5 ... +80Operating temperature [°C] +10 ... +60Pressure rating [bar] . . . . . . . . . . . . . . . . . . . . . . . . . . . . . . . . . . . . . . . . . . . . . . . . . . . . . . . . . . . . . . . . . . . . . . . . . . . . . . . . . . . . . . . . . . . . . . . . . . 16Measurement error [% of measured value]. . . . . . . . . . . . . . . . . . . . . . . . . . . . . . . . . . . . . . . . . . . Power-on delay time [s] . . . . . . . . . . . . . . . . . . . . . . . . . . . . . . Start-up delay [s] . . . . . . . . . . . . . . . . . . . Response time [s] . . . . . . . . . . . . . . . . . . . . . 1 ... 3 |
| Protection IP 65 / IIIMaterials (wetted parts) . gunmetal (2.1096.01), stainless steel (316L), PPR.(Hostalen); EPDM 80 shore; PES (Ultrason 2010); CuZn39Pb3; Centellen 200Housing material CuZn39Pb3, ABS, PA |
^1) For litre/h. 1/10 of the LPH value is displayed.
The displayed value must be multiplied by factor 10.
Example: displayed value = 98; real value = 98 * 10 = 980 LPH
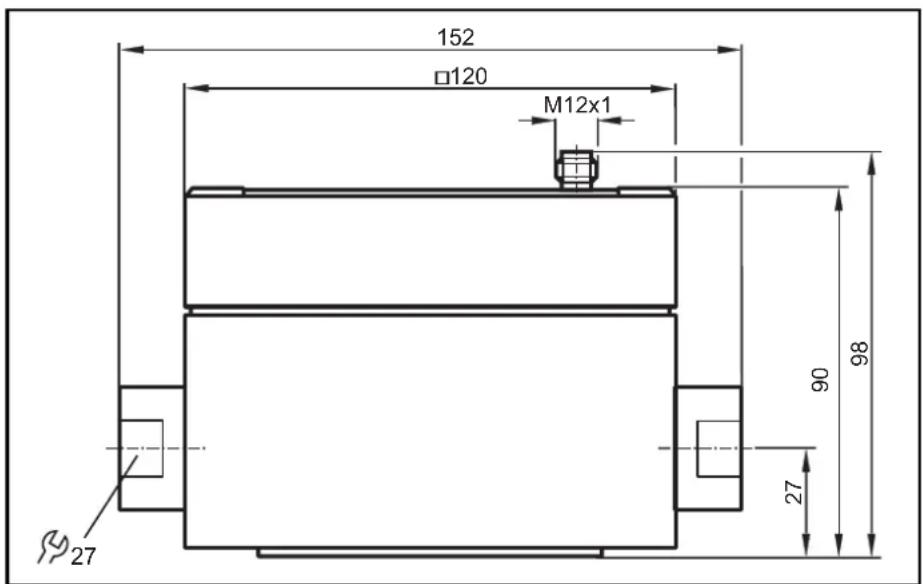
Dimensions
Pas 2

1 = BN (brun), 2 = WH (blanc), 3 = BU (bleu), 4 = BK (noir).
Programmation
line
| t | Q | SP | rP | | ---- | ----- | ----- | ---- | | 0 | 0 | 0 | 0 | | 1 | 1 | SP | SP | | ∞ | 0 | 0 | 0 |line
| t | SP | rP | |---|------|------| | 1 | 0 | 0 | | 2 | SP | 3% | | 3 | SP | 3% | | 4 | SP | 3% | | 5 | 0 | 0 | | 6 | SP | 3% | | 7 | SP | 3% |line
| t | SP | rP | |---|------|------| | ① | 2.5% | 2.5% | | ② | 4.0% | 3.0% | | ③ | 5.0% | 3.5% | | ④ | 4.5% | 3.0% | | ⑤ | 3.5% | 2.5% | | ⑥ | 2.0% | 2.0% | | ⑦ | 3.0% | 2.5% | | ⑧ | 4.0% | 3.0% |
- Schritt 2
- Programmieren
- Fensterfunktion
- Controls and visual indication
- Function and features
- Monitoring of cooling waterApplication
- Operating modes
- Run mode
- Display mode
- Programming mode
- Installation
- Step 1
- Step 2
- Minimum distance
- Electrical connection
- Programming
- Timeout
- Locking / Unlocking
- Operation
- Failure indication
- Technical information / Functioning / Parameters
- Adjustable parameters
- Customer-specific calibration (CGA)
- Hysteresis
- Window function
- Start-up delay (dSt)
- Technical data
- Pas 2
- Programmation
Brand : IFM
Model : SU0502
Category : Flow sensor