
PlantVisorPRO - Air Conditioning Carel - Free user manual and instructions
Find the device manual for free PlantVisorPRO Carel in PDF.


| Product type | Supervisor expansion module for refrigeration and air conditioning units |
| Brand | Carel |
| Model | PlantVisorPRO |
| Dimensions (L x W x H) | 200 x 150 x 50 mm (estimated) |
| Weight | 0.5 kg (estimated) |
| Power supply | 24 VAC/VDC (estimated) |
| Main functions | Supervision of refrigeration installations, floating suction pressure regulation, operating cycle management (Smooth lines/Duty cycle), rack and installation pairing, energy optimization |
| Communication interfaces | Modbus, CAREL protocol, network supervision |
| Number of managed racks | Multiple (configuration via graphical interface) |
| Compatible installation types | MPXPRO, MPXone, IR33, and other CAREL controllers |
| Configurable parameters | Superheat setpoint (P3), control differential, time window, number of samples, color thresholds (green/yellow/orange/red) |
| Operating mode | Smooth lines (with expansion valve modulation) or Duty cycle (ON/OFF cycle) |
| Maintenance and cleaning | Clean with a dry, lint-free cloth. Periodically check connections and cable condition. |
| Safety | Built-in overvoltage protection, electrical insulation compliant with CE standards. Use only in dry environment. |
| Spare parts and repairability | Communication modules and connectors available. Repair by manufacturer or authorized technician. |
| General information | Manual available in multiple languages (FR, DE, EN, ES, IT). Firmware update via supervision. |
Frequently Asked Questions - PlantVisorPRO Carel
User questions about PlantVisorPRO Carel
0 question about this device. Answer the ones you know or ask your own.
Ask a new question about this device
Download the instructions for your Air Conditioning in PDF format for free! Find your manual PlantVisorPRO - Carel and take your electronic device back in hand. On this page are published all the documents necessary for the use of your device. PlantVisorPRO by Carel.
USER MANUAL PlantVisorPRO Carel
Floating suction & Smooth lines
Function for pRack application, Boss/PVPRO
natural_image
Digital network interface setup with monitor, keyboard, and network device (no readable text or symbols)ITA Manuale d'uso
ENG User manual
FRE Mode d'emploi
line
| Metric | Value | |--------|-------| | Regulation temperature | Peak | | Regulation setpoint | Horizontal line | | PHS = max superheat offset | Max superheat offset | | TSH = superheat threshold | Threshold | | Cooling request | 1 | | Smooth line status | 1 | | FSt = average time window (min) | 0 to 1 |Fig. 1.b
flowchart
graph TD
    A["C. Compressors"] --> B["a. Line 1"]
    B --> C["d. Energy saving"]
Fig. 1.c
Fig. 1.d Fig. 1.e
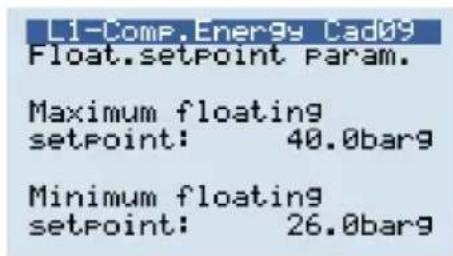
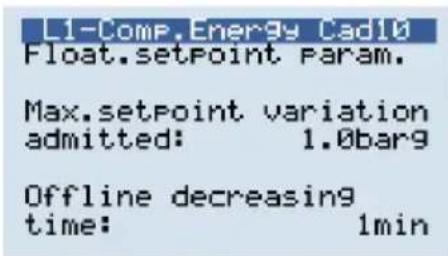
Fig. 1.f Fig. 1.g
flowchart
graph TD
    A["MPXPRO* MPXone**"] --> B["Floating suction on supervisor with Smoot line flag"]
    C["Mix di MPX* and other utilities"] --> D["Floating suction on supervisor without Smooth line flag"]
    E["Other than MPX* utilities only"] --> F["Floating suction on PVPRO without Smooth line flag"]
    B --> G["Enable Smooth line on MPXPRO"]
    D --> H["Disable Smooth line on MPXPRO"]
    F --> I["End"]
Fig. 1.j
Fig. 2.a
BOSS

Fig. 2.e
BOSS
gauge
| Metric | Value | | --- | --- | | Maximum setpoint | 27.6 | | Minimum setpoint | 12.5 | | Actual set | 14 |Fig. 2.f
Fig. 2.g
BOSS
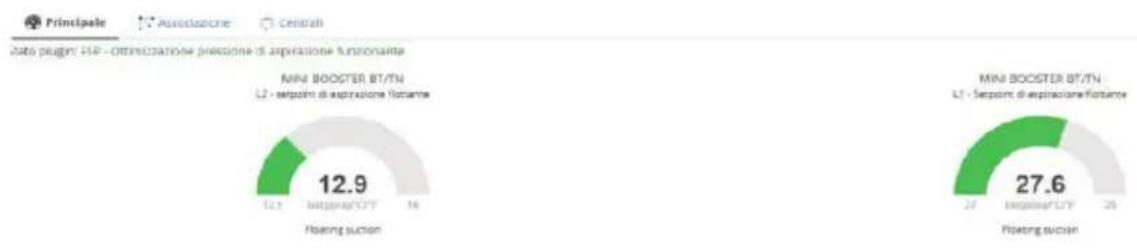
Fig. 2.k
CAREL
ITA
| Number of utilities blocking FS | |||
| Yellow | Orange | Red | |
| Online | 1 | 0 | 1 |
| Offline | 0 | 1 | 0 |
Fig. 2.s
BOSS
Fig. 2.u
BOSS
gauge
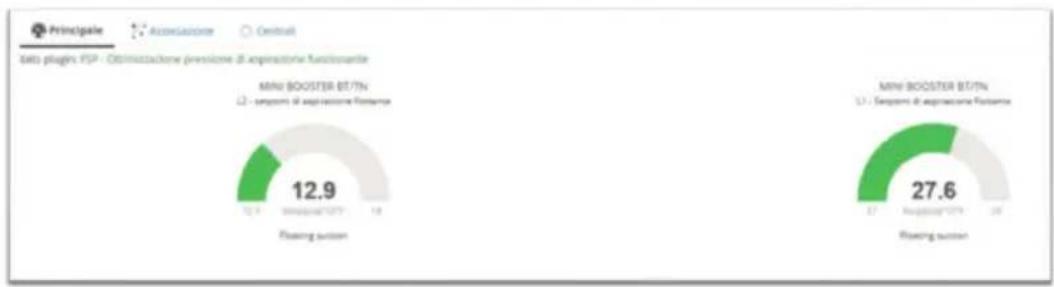
| Metric | Mini BOOSTER BT/TN | Mini BOOSTER BT/TN | | --- | --- | --- | | Segment A | 12.9 | 27.6 | | Segment B | 10.5 | 17.0 |Fig. 2.v
| Information | ||||||||
| Unitar | DC Impostata | DC corrente | Max DC reglucata | Min DC reglucata | Reset | |||
| Current setpoint | 28.2 barg/psig/°C/F | |||||||
| Minimum setpoint | 26.8 barg/psig/°C/F | 70% | 8% | 3% | 5% | — | ||
| Maximum setpoint | 28.8 barg/psig/°C/F | 70% | 10% | 31% | 13% | — | ||
| Gradient | 0.2 barg/psig/°C/F | 70% | 16% | 39% | 12% | — | ||
| Number of configured devices | 32 | 70% | 25% | 31% | 19% | — | ||
| Time window for DC calculation | 30 min | 70% | 18% | 15% | 10% | — | ||
| Frequency for DC calculation | 10 min | 70% | 31% | 35% | 22% | — | ||
| Maximum offline time | 30 % | 70% | 15% | 15% | 10% | — | ||
| Maximum number of offline devices | 3 | 70% | 35% | 30% | 1% | — | ||
| 70% | 5% | 25% | 5% | — | ||||
Fig. 2.z
Content
1. INTRODUCTION 5
1.1 Smooth lines: how it works....5
1.2 Smooth lines on MPXone* MPXpro: configuration....6
1.3 Floating suction on pRack....7
1.4 Floating suction on the supervisor....8
2.1 Rack selection....10
2.2 Rack association....11
2.3 Dashboard: main view....12
2.4 Configuration with Smooth lines....13
2.5 Operating details with Smooth lines....15
2.6 Configuration without Smooth lines (Duty cycle) 17
2.7 Operating details (without Smooth lines)....19
1. INTRODUCTION
flowchart
graph TD
    A["RFID Device"] --> B["RFID Display"]
    B --> C["Sensor 20"]
    C --> D["Display Interface"]
    D --> E["Signal Processing"]
    E --> F["Electronic Display"]
Fig. 1.a
1.1 Smooth lines: how it works
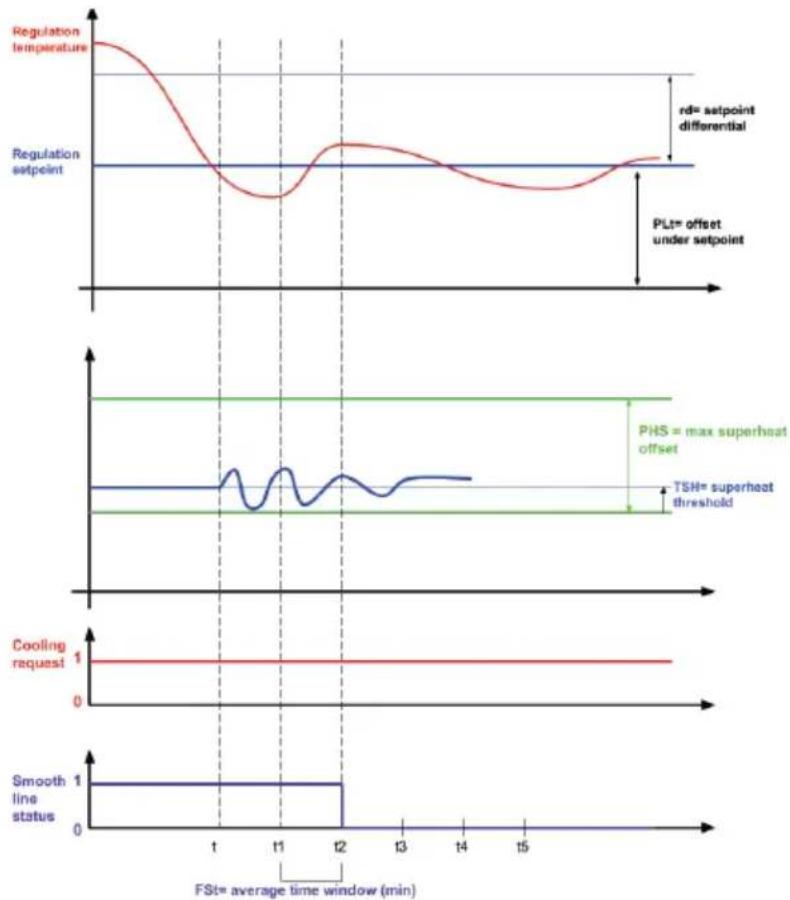
The main target of the Smooth lines function is to keep the control temperature very stable around the set point, avoiding frequent ON/OFF cooling request cycles, controlling the valve by changing the superheat set point (P3). The parameters involved in the Smooth lines configuration are listed in the following table:
| Parameter | Menu Description | Visibility | |
| St CtL Control set point Supervisor & user interface | |||
| rd CtL Control differential Supervisor & user interface | |||
| P3 Eud Superheat set point Supervisor & user interface | |||
| PHS Eud Positive SH off set Supervisor, UI, Applica | |||
| PLt | Eud | Offset below set point for cut-off | Supervisor, UI, Applica |
| PSI | Eud Integral time Supervisor, UI, Applica | ||
| PSM | Eud Enable function Supervisor, UI, Applica | ||
| PSP | Eud | Proportional coefficient | Supervisor, UI, Applica |
| PSd | - | Derivative time | Supervisor |
| TSH | - | Superheat threshold | Supervisor |
| FSt | - | Superheat averaging time window | Supervisor |
Tab. 1.a
The function operates as follows: when the control temperature reaches the set point, the refrigeration cycle is not stopped, rather the expansion valve opening is modulated. Modulation is achieved by changing the superheat set point based on a specific PID algorithm. The calculated superheat set point will be between the values P3 and P3+PHS, and consequently the valve will open or close based on the required control temperature, while staying close to the set point.
The algorithm remains active until the control temperature falls below the threshold St-PLt; control in any case stops below this threshold.
When the Smooth lines function is enabled, a variable tells the supervisor whether the MPXPRO (MPXPRO/MPXone Medium + EVDice/mini and MPXone Advanced) is operating with a certain margin, i.e., the suction pressure set point on the corresponding line can be increased without jeopardising control. In detail, superheat set point is higher than P3 + THS. The average is calculated inside the time window FSt.
line
| Metric | Value | |--------|-------| | Regulation temperature | Peak | | Regulation setpoint | Baseline | | PHS = max superheat offset | Max | | TSH = superheat threshold | Threshold | | Cooling request | 1 | | Smooth line status | 1 |Fig. 1.b
1.2 Smooth lines on MPXone\* MPXpro: configuration
Smooth lines is available on MPXone* and on MPXPRO from version 3.2 and higher.
The Smooth lines configuration parameters are listed in Table 1a.
The basic settings are listed below, with the parameter name and default value:
-
enable function, default value is PSM = 0 (disabled);
-
set maximum superheat off set, default value is PHS = 15 (K).
This parameter prevents the calculated superheat set point from rising too high
- set compressor cut-off offset, default value is PL t = 2 (K).
This parameter prevents the control temperature from dropping too far below the set point, stopping the cooling request when the temperature falls below this safety threshold.
- set main control differential, default value is rd = 2 (K);
if smooth lines is enabled, the suggested value is rd = 4 (K).
1.3 Floating suction on pRack
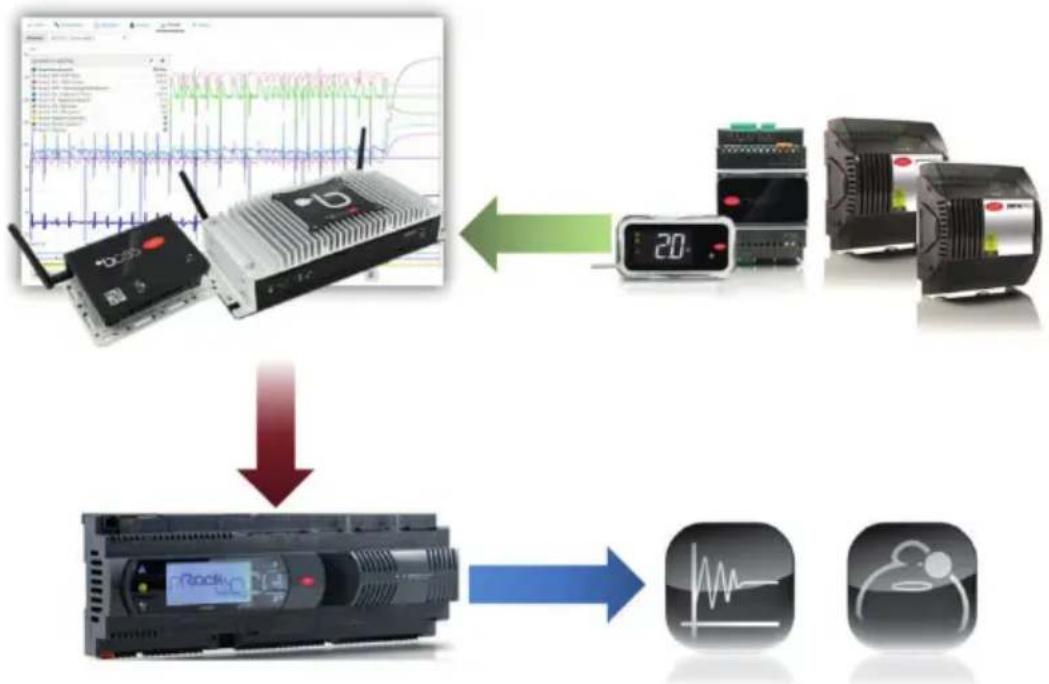
The pRack application features the Floating suction function, allowing the supervisor (PVPRO/Boss) plug-in to increase the suction pressure set point when the unit operating conditions are favourable. In practice, the supervisor, by monitoring the units connected to the rack, verifies that these are able to reach the set temperatures, and only in this case enables the rack to increase the suction pressure. Increasing the suction set point allows the system to operate more efficiently, wasting less energy.
The configuration path is as follows :

flowchart
graph TD
    A["C. Compressors"] --> B["a. Line 1"]
    B --> C["d. Energy saving"]
Fig. 1.c
This path refers to suction Line 1, Line 2 is configured in the same way. If the rack manages one suction line only, the path will be: C.Compressors → d.Energy saving
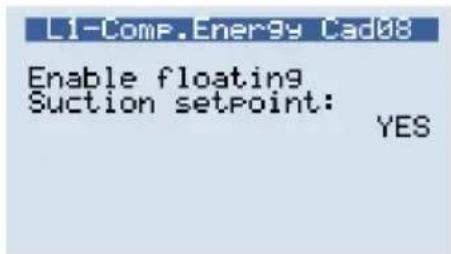
Fig. 1.d Fig. 1.e
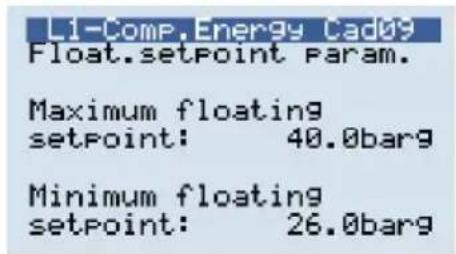
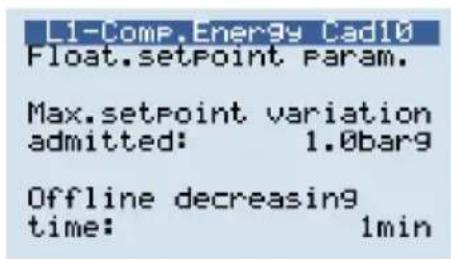
Fig. 1.f Fig. 1.g
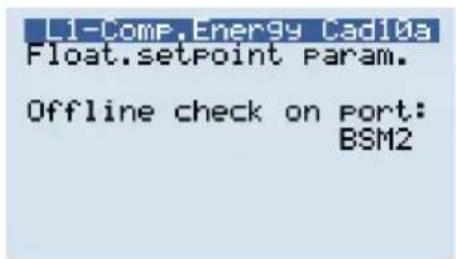
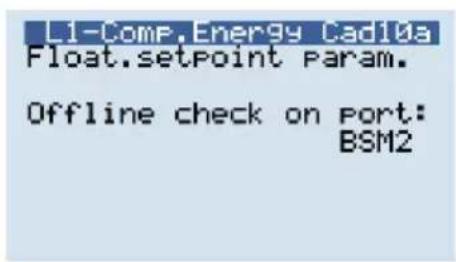
Once having entered the configuration menu, screen Cad08 is used to enable the Floating suction function.
- Screen Cad09 defines the range in which the set point can be changed by the Floating suction plug-in.
- Screen Cad10 defines the maximum variation for increasing or decreasing the set point for each request from the plug-in, and the time it takes for the rack to decrease the set point if communication with the supervisor is lost.
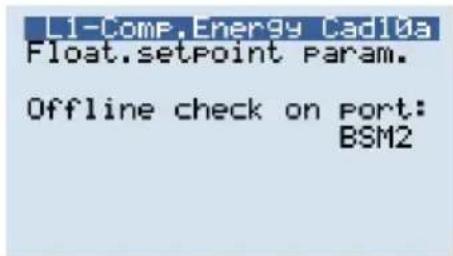
- Screen Cad10a defines which communication port on pRack is used for the supervisor.
1.4 Floating suction on the supervisor
The PVPRO and Boss supervisors include the Floating suction function, which can be enabled and configured via a special menu. The supervisor must be able to identify which units are connected to the specific rack, so as to monitor them and safely enable the increase in the suction set point
On the PVPRO supervisor, this can be activated by clicking "Suction Pressure Optimisation" in the "Energy" menu.

Fig. 1.h
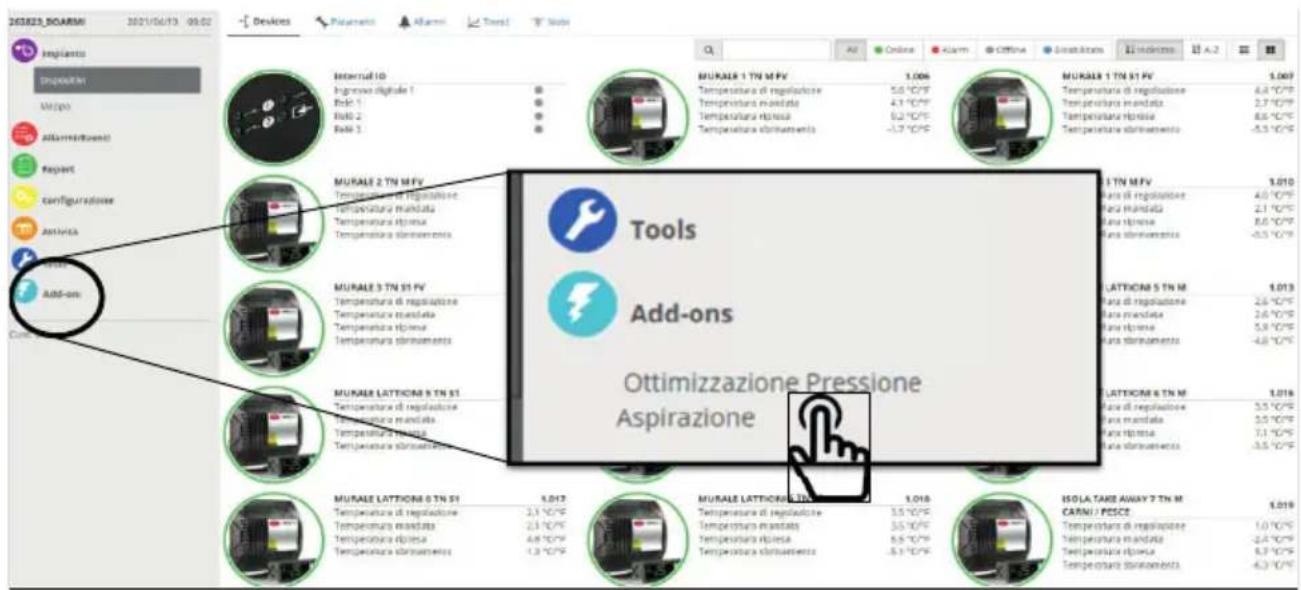
On the Boss supervisor, select "Suction Pressure Optimisation" from the Add-ons menu on the left side of the screen.
The "fl oating suction" algorithm can be used both on units with the Smooth lines algorithm or without this function (e.g. IR33, MPXPRO version < 3.2). If all of the units have the Smooth lines function available and activated, the algorithm can be optimised by checking a specific flag in the plug-in.
For devices that do not manage the "Smooth lines" function, the supervisor can estimate whether the cooling capacity delivered is adequate, evaluating the ON/OFF times for each unit (Duty cycle mode).
This guideline helps choose the most suitable option:
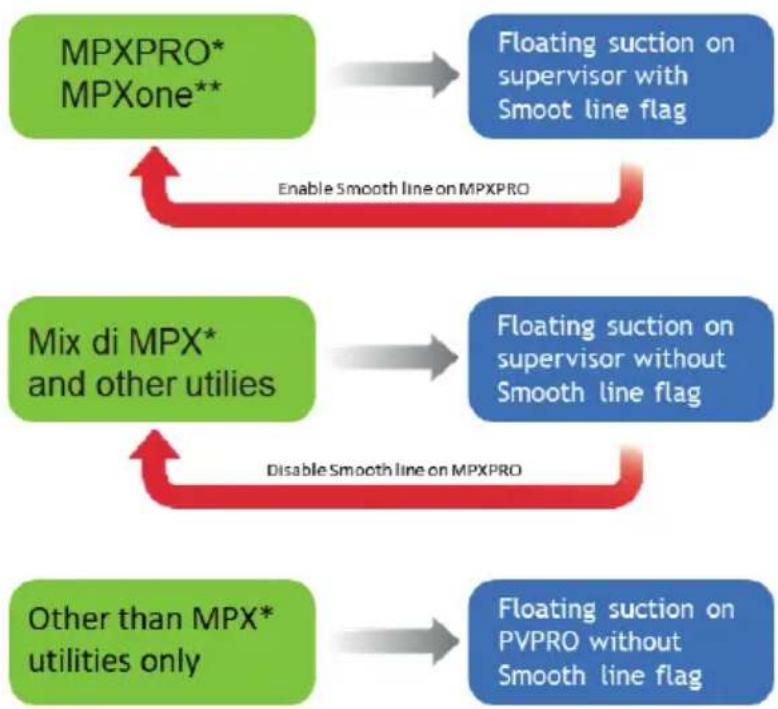
flowchart
graph TD
    A["MPXPRO* MPXone**"] --> B["Floating suction on supervisor with Smooth line flag"]
    C["Mix di MPX* and other utilities"] --> D["Floating suction on supervisor without Smooth line flag"]
    E["Other than MPX* utilities only"] --> F["Floating suction on PVPRO without Smooth line flag"]
    B --> G["Enable Smooth line on MPXPRO"]
    D --> H["Disable Smooth line on MPXPRO"]
    F --> I["End"]
Fig. 1.j
* MPXPRO ver. 3.2 or later
**For MPXone Medium + EVDice/mini and MPXone Advanced
Once having entered the Floating Suction Pressure menu, in the "Energy" section, the plug-in is configured in three steps, as listed below:
- pRack selection
- Associate units with the selected pRack
- Configure plug-in (Duty cycle or Smooth lines)
Below is a detailed description of the steps and an overview of the main information on the plug-in.
2.1 Rack selection
In the "Racks" tab, choose which racks to enable for the floating suction function. On the selected pRack units, the suction pressure will be gradually increased, if the cabinet operating conditions allow. Conf i guration procedure:
- Step 1 check the box relating to the devices involved.
- Step 2 click "Save" in the top right corner.
PVPRO

Fig. 2.a
BOSS

2.2 Rack association
If there is at least one rack selected for the Floating suction function, a number of units can then be associated with the rack. Each rack can have more than one unit associated; each unit however can only be associated with one rack.
In the "Association" tab, proceed as follows:
- double click a compressor rack; the name will be shown in the "Selected rack" fi eld;
- Step 2 select the devices from the list on the left;
- Step 3 check the "Smooth lines function" box only if all the devices are equipped with this function;
- click the "right" arrow to associate the units with the rack;
- Step 4 click "Save" in the top right corner.
PVPRO
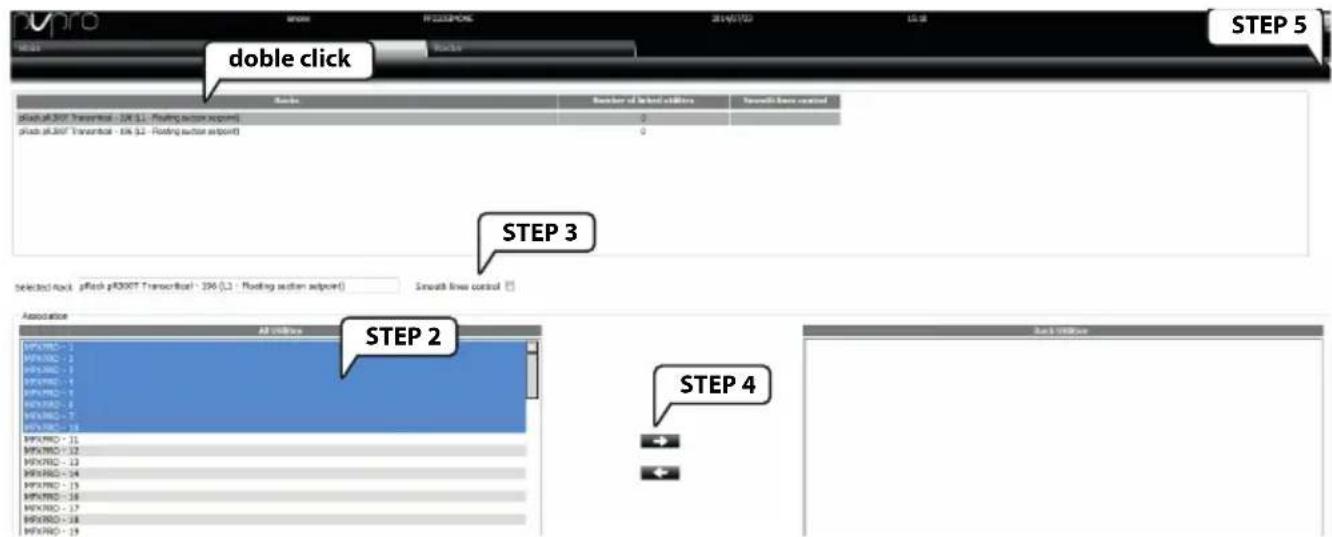
Fig. 2.c
BOSS
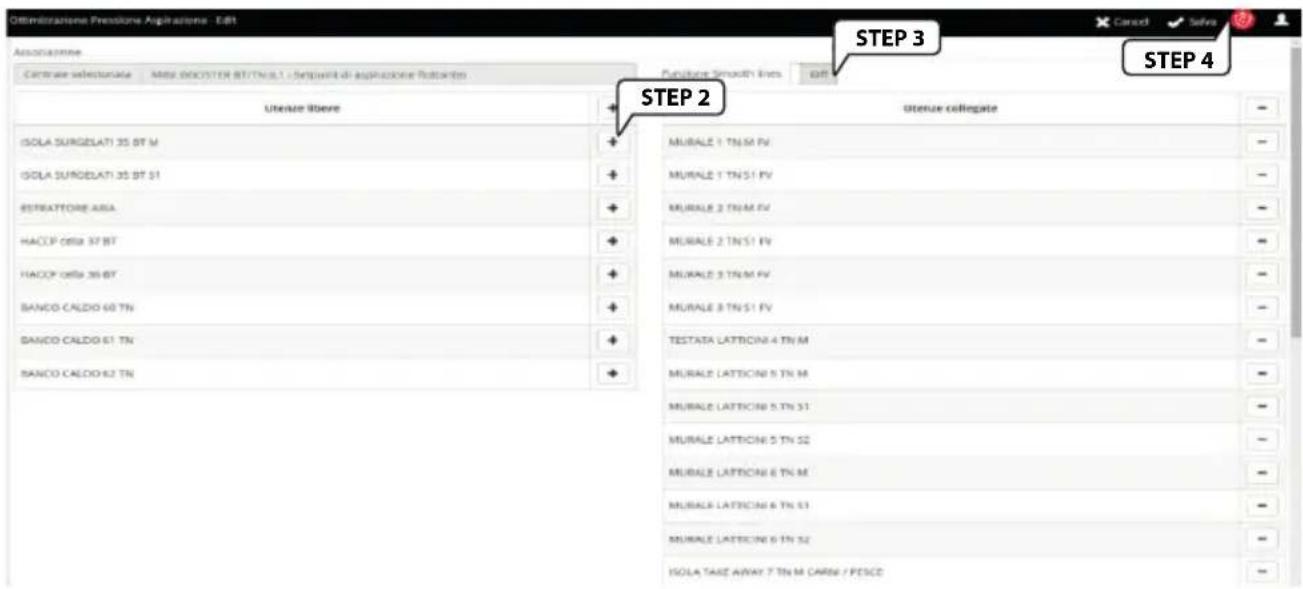
Fig. 2.d
2.3 Dashboard: main view
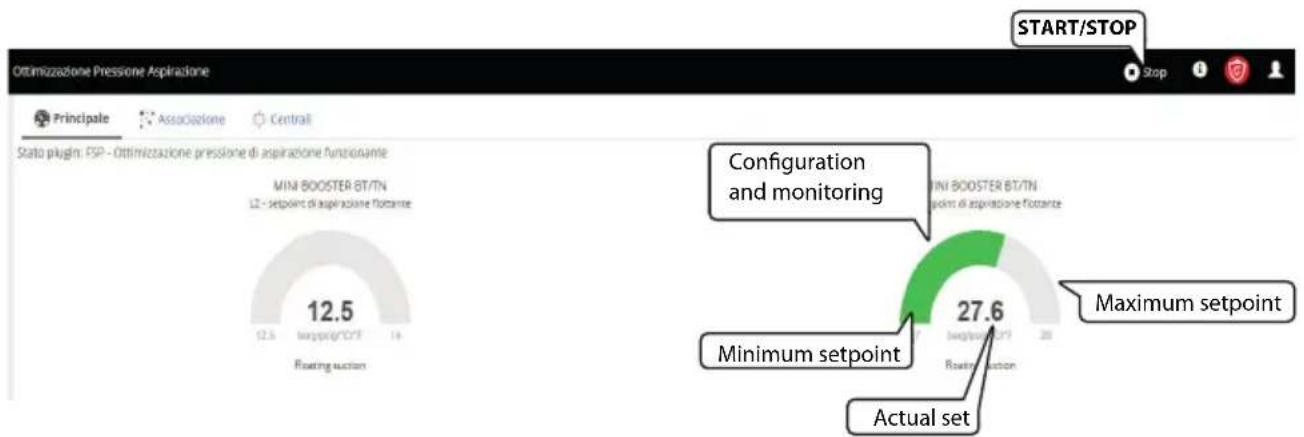
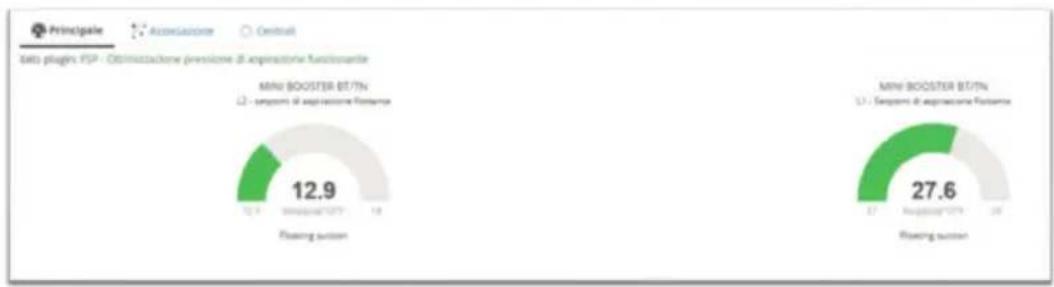
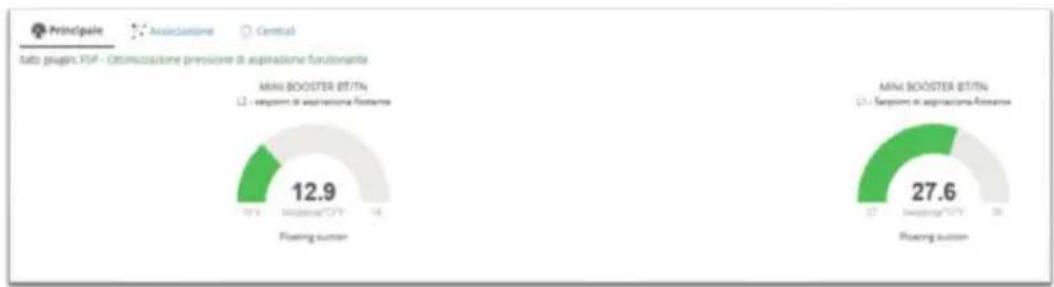
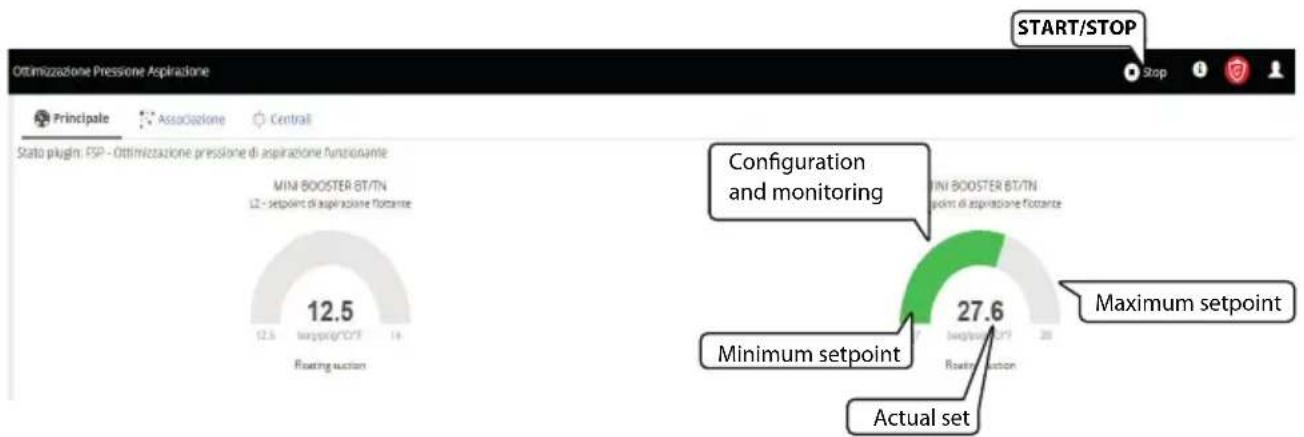
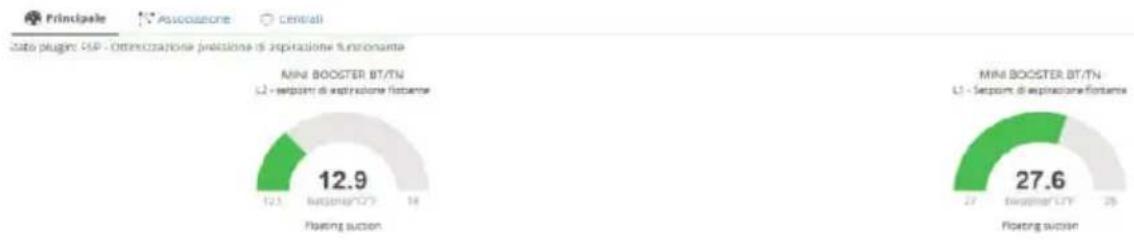
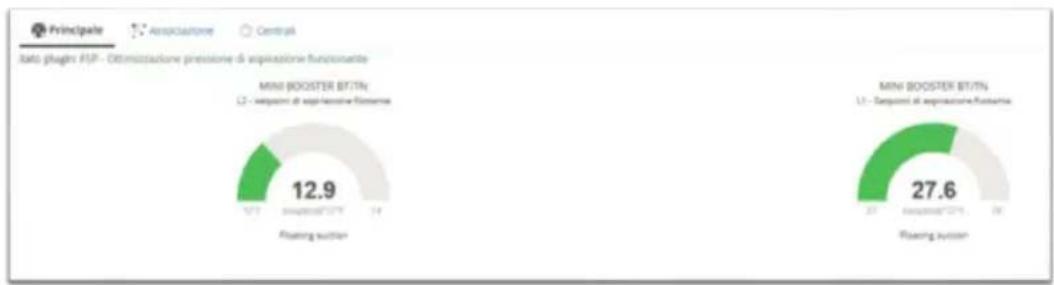
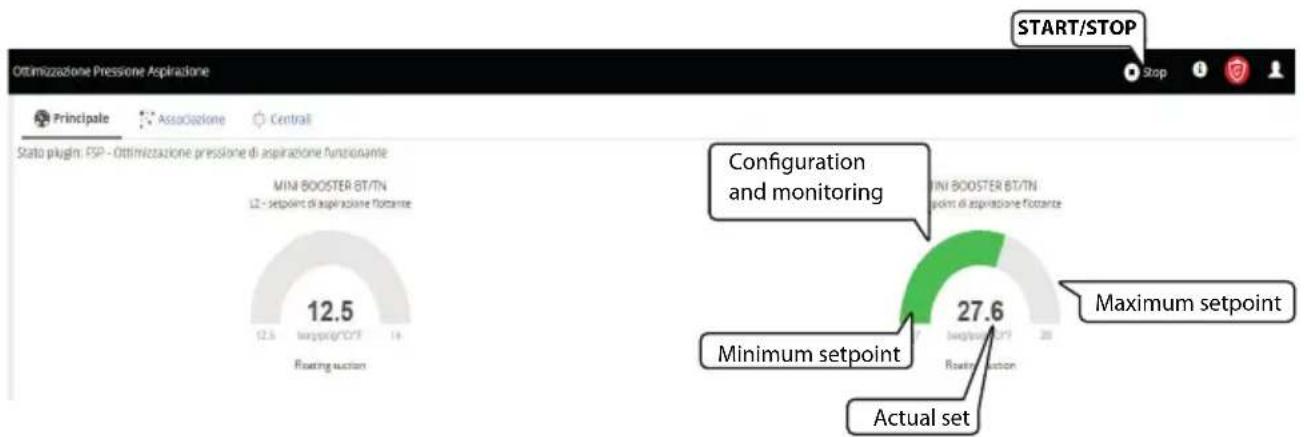
The "Main" tab shows all the compressor racks selected for the floating suction function. The status of set point modification is shown by a triangle on PVPRO or an arc on BOSS, from the minimum to the maximum value. In this tab, users can:
- enable or disable the plug-in;
- access the configuration page and the monitoring page for each rack.
PVPRO
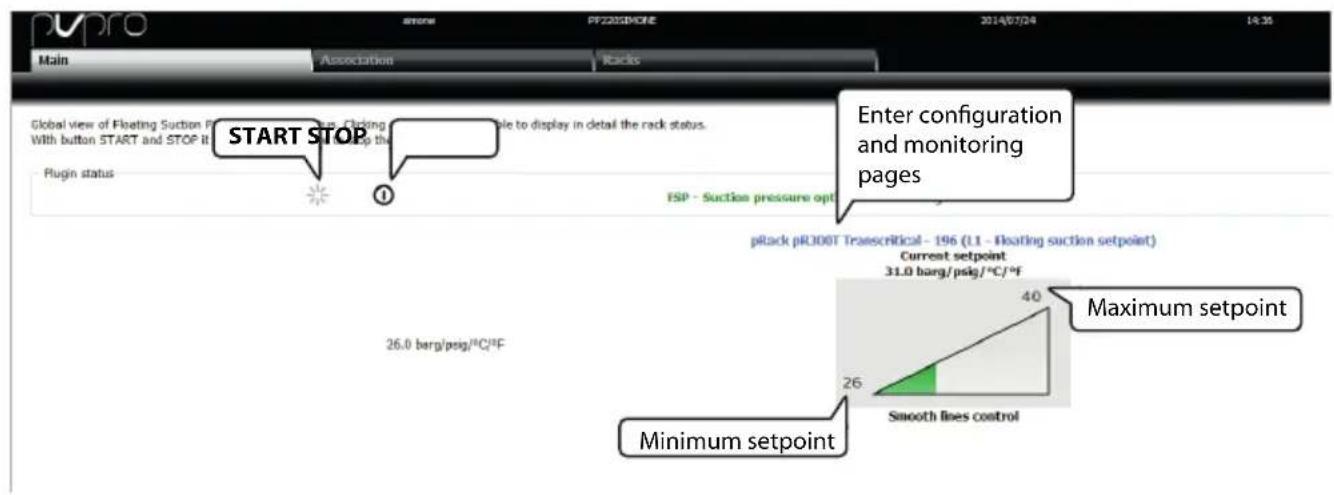
Fig. 2.e
BOSS
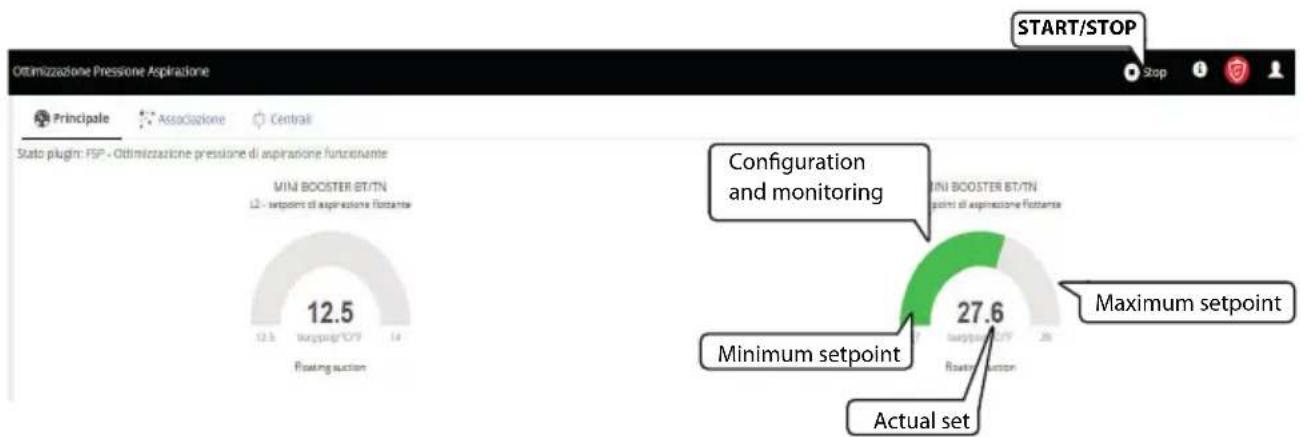
Fig. 2.f
From the "Dashboard", clicking on the pRack description (blue), users can access the configuration and monitoring view of the plug-in.
These two screens are displayed differently, depending on whether the associated units feature the Smooth lines function, i.e., whether or not the association has been created with the Smooth lines flag checked (see paragraph 2.2 for details).
If the units are not equipped with the Smooth lines function, or no association with the Smooth lines function has been created, the plug-in will work in "duty cycle" mode.
The following chapters show the details and configuration of the plug-in, based on the mode activated, Smooth lines or Duty cycle.
2.4 Configuration with Smooth lines
From the main screen, to access the configuration view, click the pRack description in blue in PVPRO, or select the graph in BOSS.
PVPRO
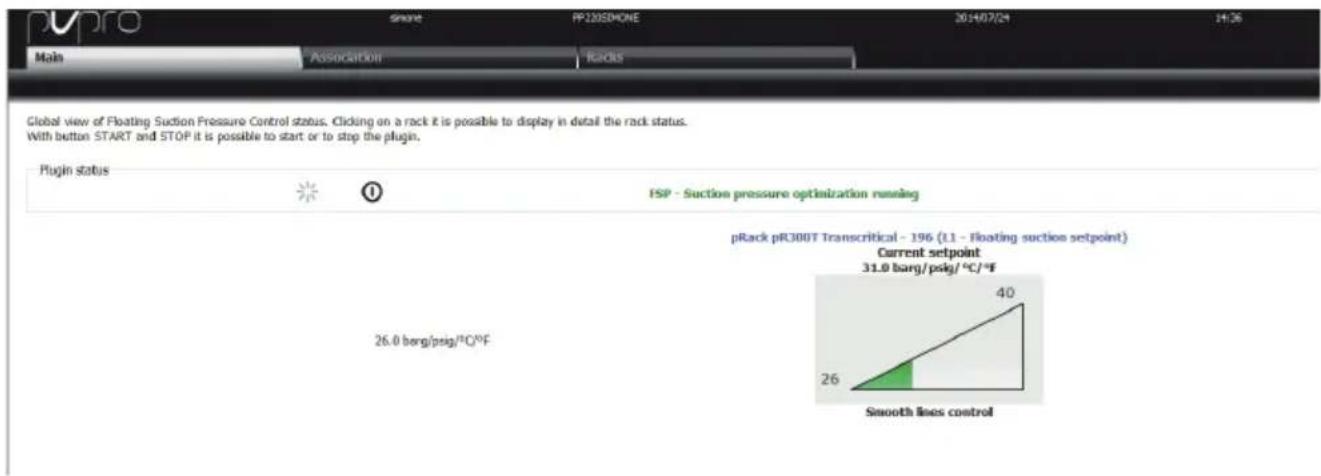
Fig. 2.g
BOSS
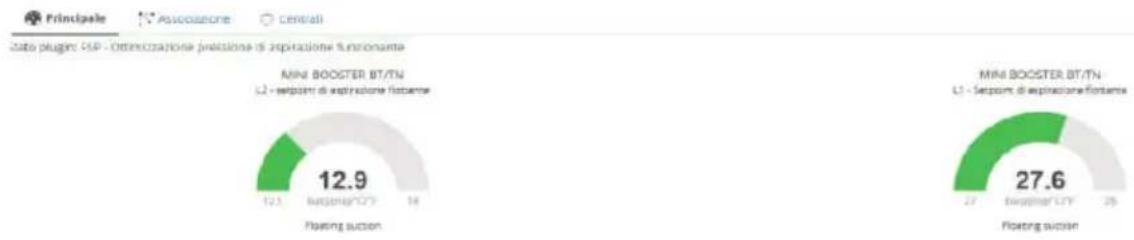
The plug-in settings can be changed in the "Parameters" tab, in turn divided into two main tabs:
Configuration
The configuration section shows the values of the parameters set on pRack. The following can be set here:
- the minimum and maximum rack working set point, within which the plug-in will calculate the optimal set point.
• The gradient between set point increase/decrease steps
• The time interval between samples (minimum time 10 minutes) - The maximum number of units, divided by colour (operating conditions), for which the plug-in will calculate the rack set point
Units
The units section shows the list of devices associated with the rack and involved in the calculation of the optimal set point, the line they belong to and the corresponding serial address.
This screen can be used to set parameter TSH (default 2K), the offset to be added to parameter P3 (superheat set point).
PVPRO
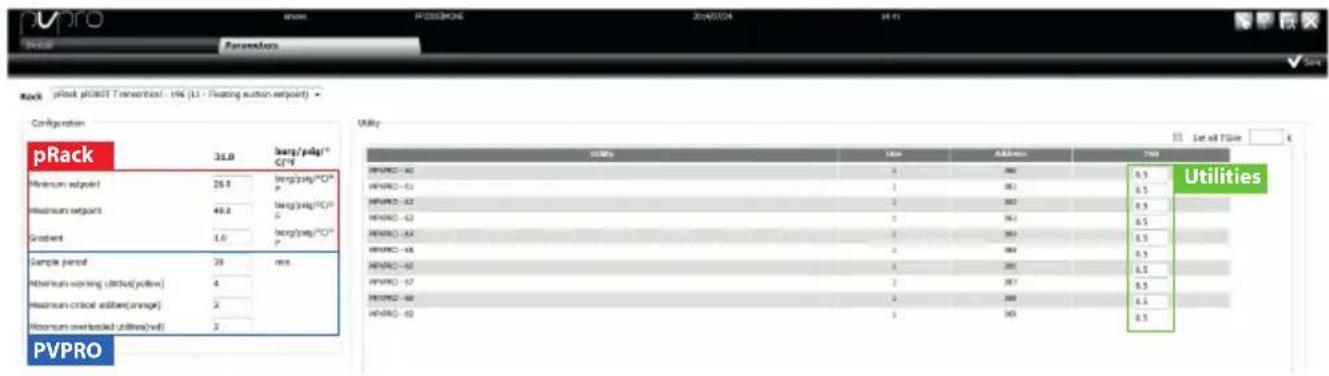
Fig. 2.i
BOSS
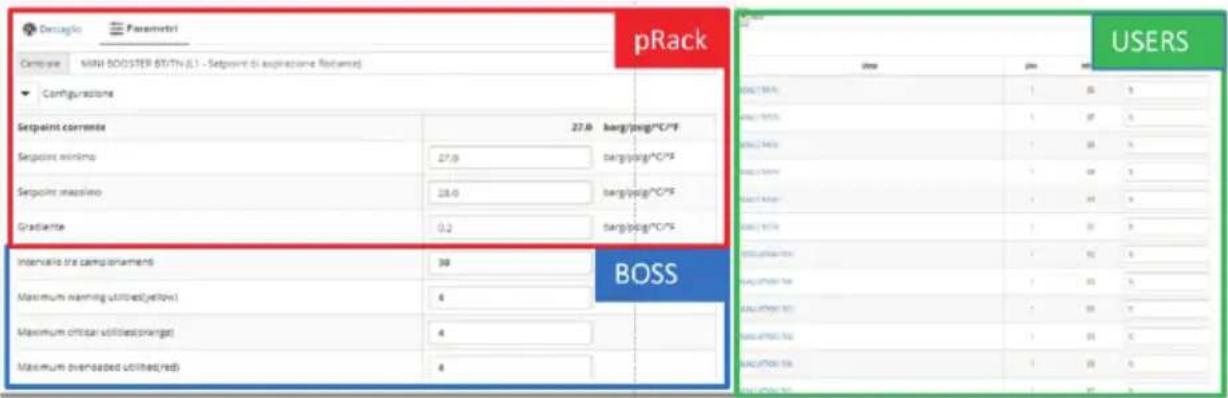
Fig. 2.j
There are four thresholds, associated with different colours, referring to device operating conditions:
- Green
- Yellow
- Orange
- Red
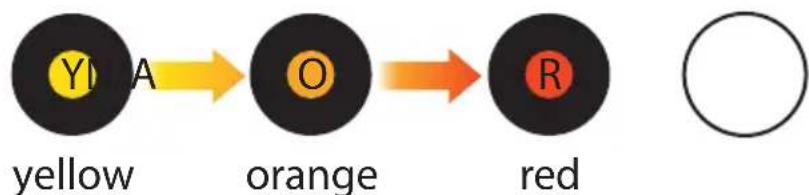
The first colour, green, indicates units where the average set point value is higher than P3 + TSH; this means the suction pressure set point can be increased. The status (colour) of the units is evaluated after each sampling interval. The rules that define monitoring are illustrated in Figure 2.f. The following table shows the criteria followed to adjust the rack set point based on the number of units with the same colour:
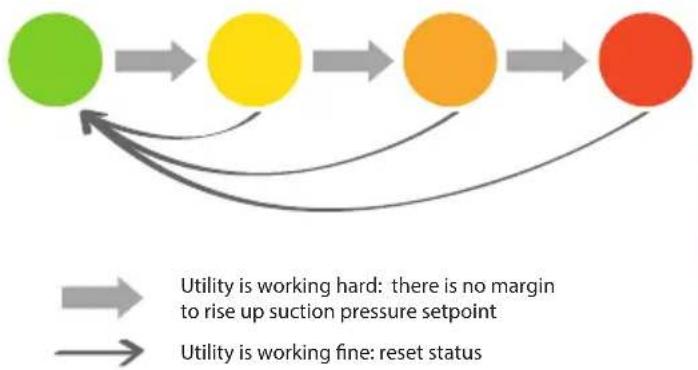
flowchart
graph TD
    A["Green Node"] --> B["Yellow Node"]
    B --> C["Orange Node"]
    C --> D["Red Node"]
    style A fill:#fff,stroke:#000
    style B fill:#fff,stroke:#000
    style C fill:#fff,stroke:#000
    style D fill:#fff,stroke:#000
    note1["Utility is working hard: there is no margin to rise up suction pressure setpoint"]
    note2["Utility is working fine: reset status"]
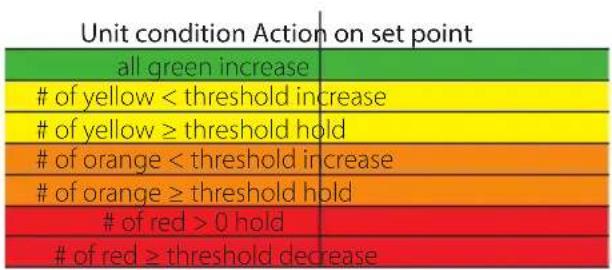
Fig. 2.k
When the Smooth lines flag is checked, any units that are either offline or do not feature the Smooth lines function but that are in any case associated with the plug-in, are managed specifically.
If a unit is not available (offline) after the sampling time, this will be shown in black and considered unavailable for the pressure set point increase. This unit is considered as if it were yellow, orange or red, depending on how many times it has been declared offline.
If a unit without Smooth lines is associated with the plug-in, the supervisor will not monitor its operating conditions and will show it as N/A (not available). As the increase in rack suction pressure can affect the behaviour of the unit, the plug-in will restore the set point to the minimum value. These two specific scenarios are illustrated in Figure 2.g.
flowchart
graph LR
    A["Yellow"] -->|A| B["Orange"]
    B -->|→| C["Red"]
if a unit is shown as N/A, it means it doesn't feature the Smooth lines function and any increases in the set point will be reset.
Fig. 2.1
2.5 Operating details with Smooth lines
The "Details" tab offers users a detailed review, divided into four groups, of the plug-in configuration and operating status.
The "information" section shows a summary of the settings, both relating to the supervisor and the pRack, in particular:
• The time of the last sampling performed by the plug-in;
• The set point corresponding to the last sampling;
• A summary of the current configuration.
PVPRO BOSS
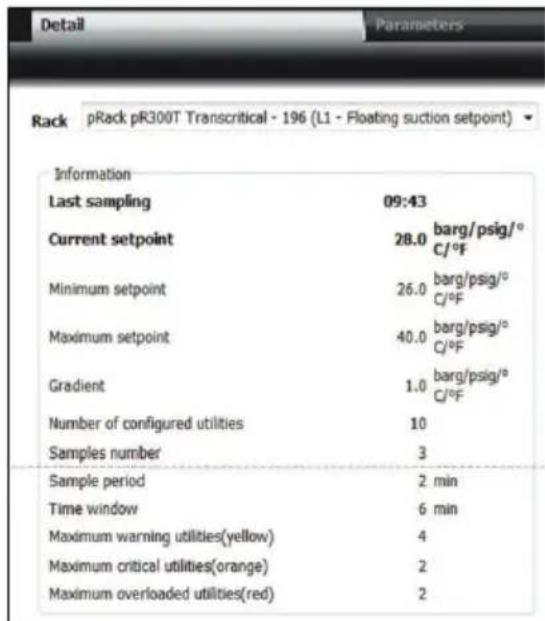
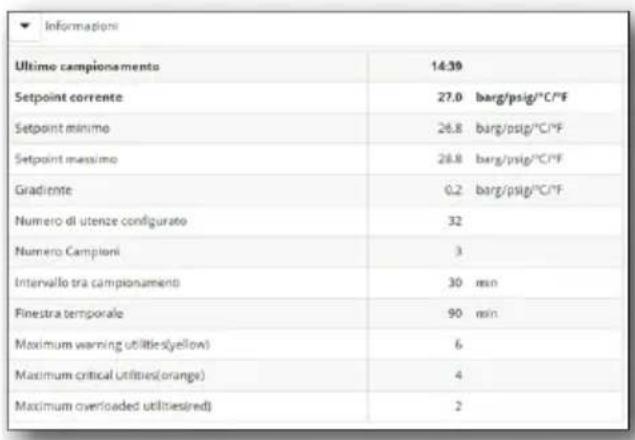
Fig. 2.m Fig. 2.n
The "Racks" section shows the current set point, as well as some historical samples useful for understanding the pressure trend over a period of time.
PVPRO
Racks
| SetPoint | T | T-1 | T-2 |
| L1 - Floating suction setpoint | 28.0 | 28.0 | 27.0 |
Fig. 2.0
BOSS
| SetPoint | T | T-1 | T-2 | T-3 | T-4 | T-5 | T-6 | T-7 | T-8 | T-9 |
| L1 - Setpoint di aspirazione flottante | 26.8 | 26.8 | 26.8 | 27.0 | 27.2 | 27.4 | 27.6 | 27.8 | 28.0 | 28.2 |
Fig. 2.p
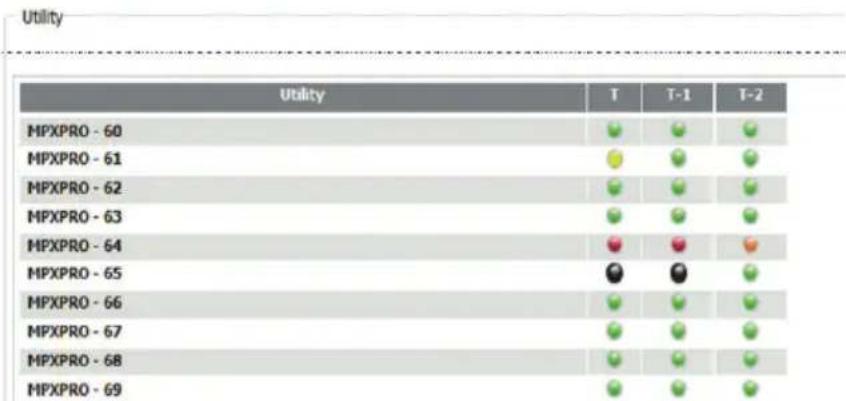
The "Units" section provides an overview of the instant status of all units, as well as the trend over the previous periods. This screen is useful for understanding which units are working in more critical conditions.
PVPRO
other
Utility | Utility | T | T-1 | T-2 | |---|---|---|---| | MPXPRO - 60 | ● | ● | ● | | MPXPRO - 61 | ● | ● | ● | | MPXPRO - 62 | ● | ● | ● | | MPXPRO - 63 | ● | ● | ● | | MPXPRO - 64 | ● | ● | ● | | MPXPRO - 65 | ● | ● | ● | | MPXPRO - 66 | ● | ● | ● | | MPXPRO - 67 | ● | ● | ● | | MPXPRO - 68 | ● | ● | ● | | MPXPRO - 69 | ● | ● | ● |Fig. 2.q
BOSS
Notice: in the table, the columns marked "T-*" correspond to the time interval between samplings (min. 10 min.)
The final section summarises the number of units for each colour, divided between online and offline.
| Number of utilities blocking FS | |||
| Yellow | Orange | Red | |
| Online | 1 | 0 | 1 |
| Offline | 0 | 1 | 0 |
Fig. 2.s
BOSS
2.6 Conf i guration without Smooth lines (Duty cycle)
From the main screen, to access the configuration view, click the pRack description in blue in PVPRO, or select the graph in BOSS.
PVPRO
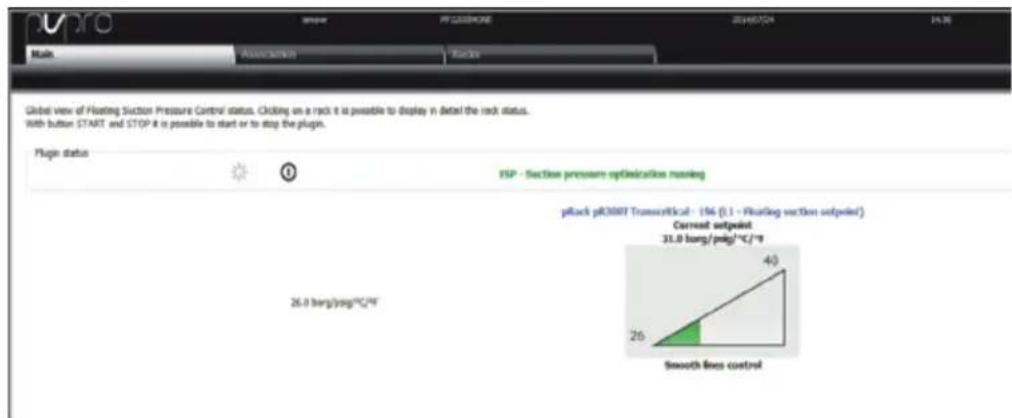
Fig. 2.u
BOSS
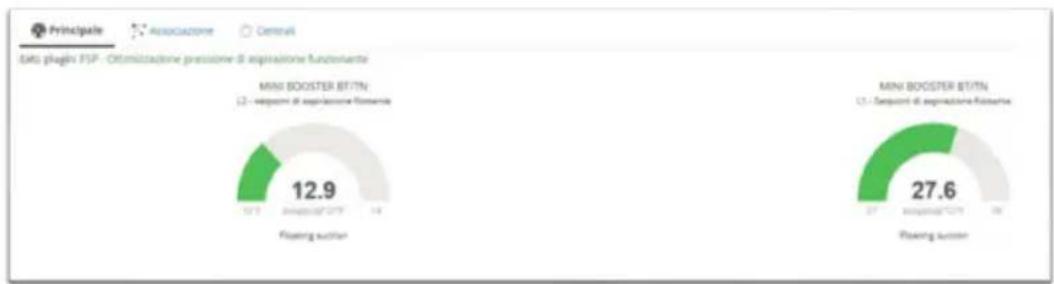
The plug-in settings can be changed in the "Parameters" tab, in turn divided into two main tabs:
Configuration
The configuration section is divided into two parts; the first is used to set some parameters relating to the pRack, such as:
- the minimum and maximum rack working set point, within which the plug-in will calculate the optimal set point.
• the gradient between set point increase/decrease steps
• the time interval between samples (minimum time 10 minutes)
The second part is used to set the parameters relating to the plug-in, such as:
• Time frame for calculating the Duty Cycle
• Frequency for calculating the Duty Cycle
• Percentage of maximum connection failure time
• Maximum number of units not connected
Units
The units section shows the list of devices associated with the rack and involved in the calculation of the optimal set point, the line they belong to and the corresponding serial address.
This screen is used to set the cabinet operating percentage, which by default is set to 70%
PVPRO
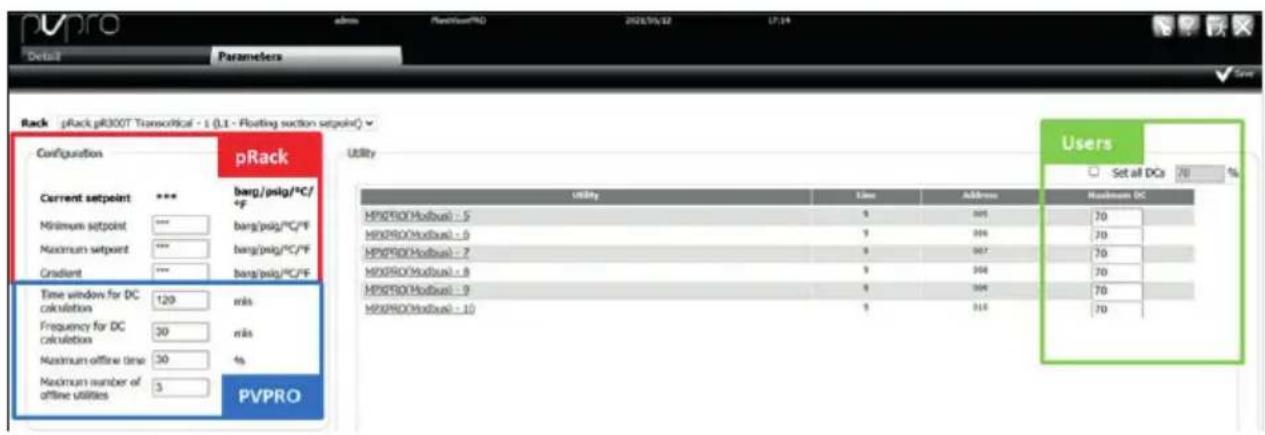
Fig. 2.w
BOSS
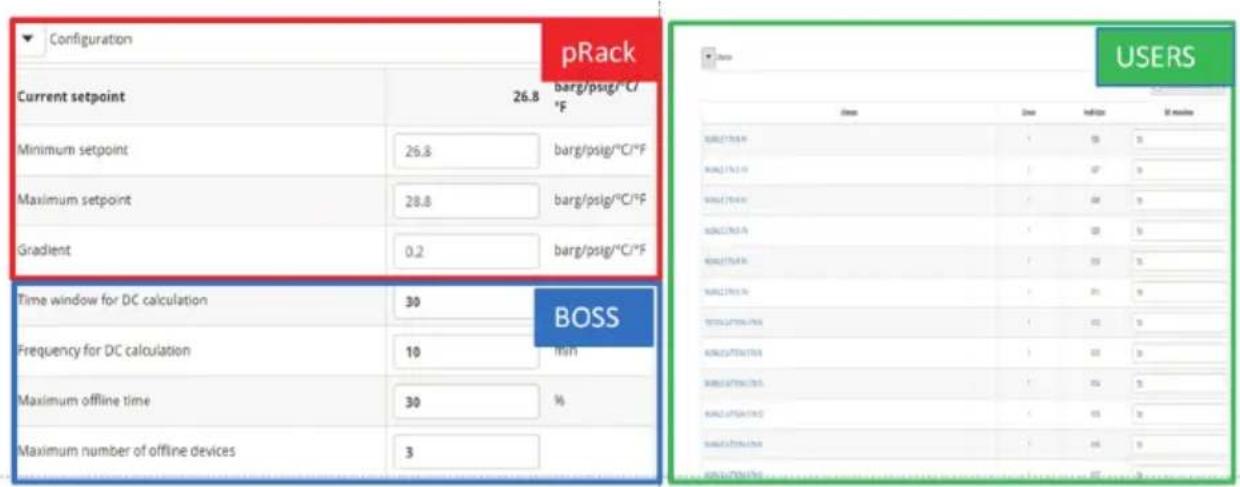
Fig. 2.x
CAREL
In this case, as the units do not feature smooth lines logic, the plug-in checks the cabinet activation percentage over a specified period of time. If the operating percentage measured is greater than the set threshold, it is assumed that the cabinet has no operating margin and consequently the rack suction pressure set point cannot be increased. The threshold is defined by entering a percentage for each unit in the "Maximum Duty Cycle" column.
The following table shows the meaning of the settings and the corresponding default values.
Parameter Description Default value
| Time frame for calculating the DC T | The unit duty cycle will be calculated within this time frame. The value can range from 10 to 180 minutes. | 120 minutes |
| Frequency for calculating the DC Th | This specifies the frequency of the potential action on the set point: at the end of each period, the calculated duty cycle will be compared against the threshold for increasing or decreasing the set point. The value can range from 10 to 180 minutes. | 30 minutes |
| Maximum connection failure time M | Maximum percentage of failed measurements for each unit associated with the rack. If this value is exceeded, the unit is considered off line. | 30% |
| Maximum number of units not connected | If the number of off line units exceeds this number, the suction pressure set point will not be changed. | 3 |
Tab. 1.a
2.7 Operating details (without Smooth lines)
The "Details" tab offers users a summary of the plug-in configuration and operating status.
The "information" section shows a summary of the settings, such as:
- the minimum and maximum rack working set point, within which the plug-in will calculate the optimal set point.
• The gradient between set point increase/decrease steps
• the time interval between samples (minimum time 10 minutes)
• Sampling frequency
• Number of configured devices
• Maximum number of offline devices and percentage of cycle time before considering units offline (above which the rack set point is decreased)
The "Units" tab offers an overview of the instant operating status, the current, minimum and maximum duty cycle and shows which units are decreasing the rack set point.
PVPRO
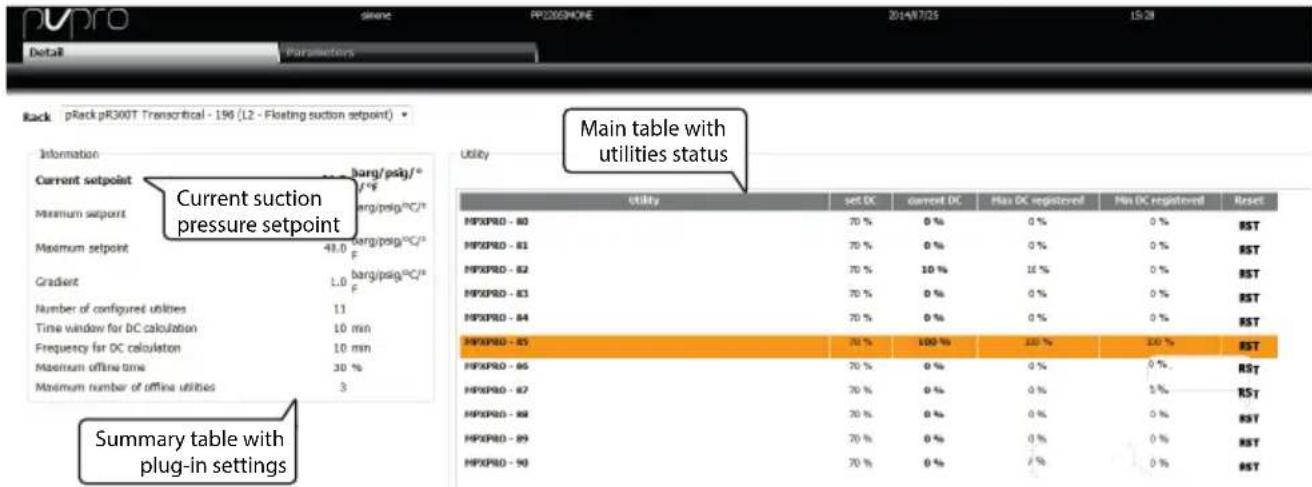
Fig. 2.y
BOSS
| Information | |
| Current setpoint | 28.2 barg/psig/°C/F |
| Minimum setpoint | 26.8 barg/psig/°C/F |
| Maximum setpoint | 28.8 barg/psig/°C/F |
| Gradient | 0.2 barg/psig/°C/F |
| Number of configured devices | 32 |
| Time window for DC calculation | 30 min |
| Frequency for DC calculation | 10 min |
| Maximum offline time | 30 - % |
| Maximum number of offline devices | 3 |
| Deltaglio | Etematric | |||||
| Uterice | DC Impostata | DC correnta | Max DC reglucrata | Min DC reglucrata | ||
| BANCO SIRAYO GASTRONOMA 15 TIN M | 70 % | 8 % | 3 % | 0 % | — | |
| GALLA TACE ARAY GASTRONOMA 11 TIN M | 70 % | 10 % | 31 % | 12 % | — | |
| GALLA TACE ARAY GASTRONOMA 12 TIN M | 70 % | 16 % | 39 % | 12 % | — | |
| BANCO SIRAYO GASTRONOMA 12 TIN M | 70 % | 25 % | 31 % | 10 % | — | |
| BANCO SIRAYO GASTRONOMA 13 TIN M | 70 % | 18 % | 15 % | 10 % | — | |
| RETROMANED GASTRONOMA 14 TIN M | 70 % | 31 % | 25 % | 22 % | — | |
| BANCO SIRAYO ALESTORIA 16 TIN M | 70 % | 15 % | 15 % | 10 % | — | |
| CELLA DISTRATUTA 15 TIN | 70 % | 20 % | 40 % | 11 % | — | |
| CELLA CAMP 21 TIN | 70 % | 3 % | 25 % | 11 % | — | |
Fig. 2.z
Index
1. INTRODUCTION 5
1.1 «Smooth lines»: fonctionnement....5
1.2 «Smooth lines» sur MPXone* MPXpro: configuration....6
1.3 «Floating suction» sur pRack....7
1.4 Fonction «Floating suction» dans le superviseur....8
2. CONFIGURATION DE FS SUR PVPRO 10
line
| Metric | Value | |--------|-------| | Regulation temperature | Peak | | Regulation setpoint | Horizontal line | | PHS = max superheat offset | Green horizontal line | | TSH = superheat threshold | Horizontal line | | Cooling request | Red horizontal line | | Smooth line status | Blue horizontal line |Fig. 1.b
1.2 «Smooth lines» sur MPXone\* MPXpro: configuration
Fig. 1.d Fig. 1.e
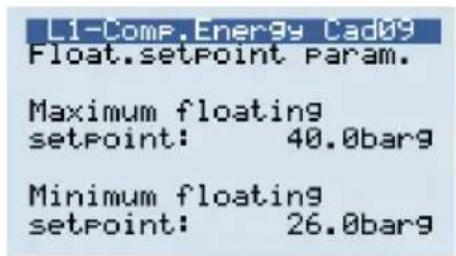
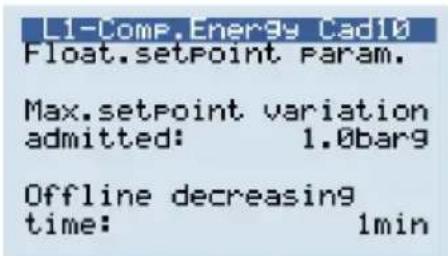
Fig. 1.f Fig. 1.g
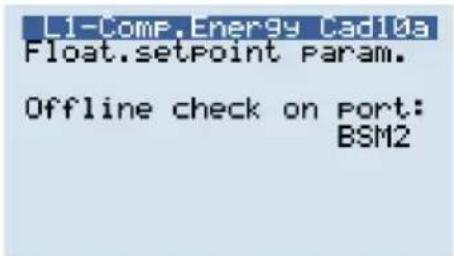
Fig. 1.h
flowchart
graph TD
    A["MPXPRO* MPXone**"] --> B["Floating suction on supervisor with Smooth line flag"]
    C["Mix di MPX* and other utilities"] --> D["Floating suction on supervisor without Smooth line flag"]
    E["Other than MPX* utilities only"] --> F["Floating suction on PVPRO without Smooth line flag"]
    B -->|Enable Smooth line on MPXPRO| C
    D -->|Disable Smooth line on MPXPRO| E
Fig. 1.j
* MPXPRO ver. 3.2 ou successive
**Pour MPXone Medium + EVDice/mini et MPXone Advanced
2. CONFIGURATION DE FS SUR PVPRO
Fig. 2.e
BOSS
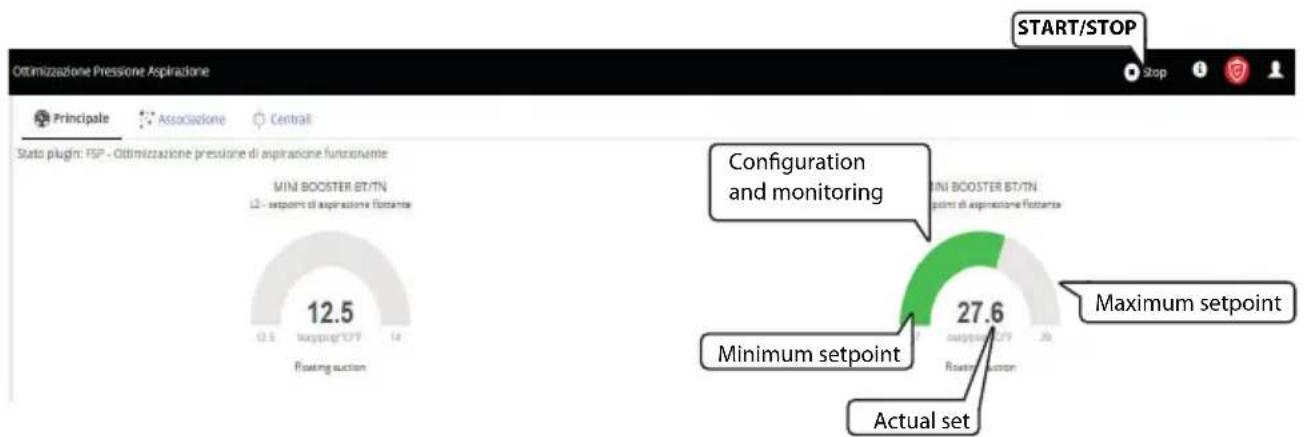
Fig. 2.g
BOSS
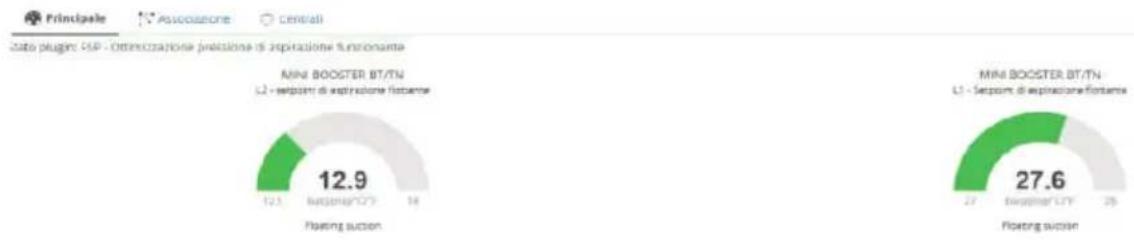
Fig. 2.i
BOSS
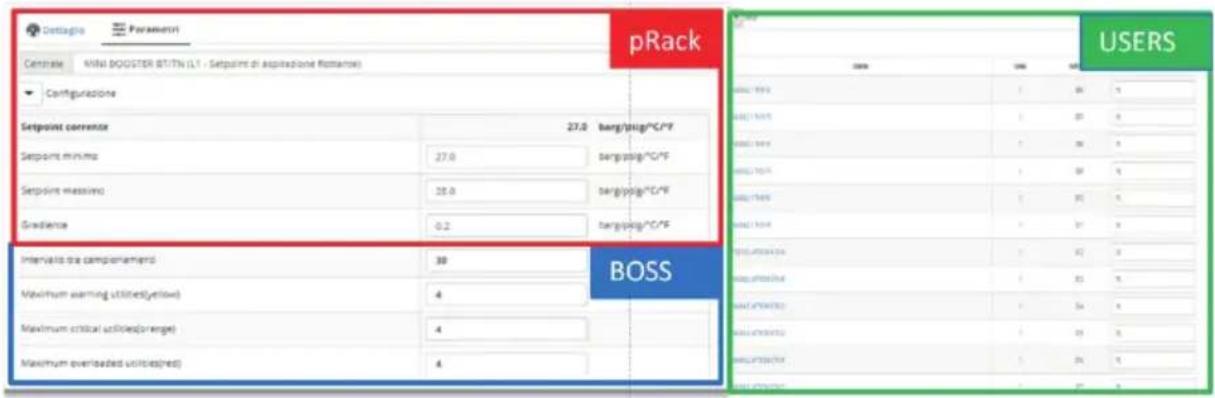
Fig. 2.j
flowchart
graph TD
    A["Green Node"] --> B["Yellow Node"]
    B --> C["Orange Node"]
    C --> D["Red Node"]
    style A fill:#fff,stroke:#000
    style B fill:#fff,stroke:#000
    style C fill:#fff,stroke:#000
    style D fill:#fff,stroke:#000
    note1["Utility is working hard: there is no margin to rise up suction pressure setpoint"]
    note2["Utility is working fine: reset status"]
Fig. 2.k
Unit condition Action on set point
| all green increase | |
| # of yellow < threshold increase | |
| # of yellow ≥ threshold hold | |
| # of orange < threshold increase | |
| # of orange ≥ threshold hold | |
| # of red > 0 hold | |
| # of red ≥ threshold decrease | |
CAREL
FRE
flowchart
graph LR
    A["Yellow Y"] -->|A| B["Orange O"]
    B --> C["Red R"]
| Uttena | T | T-1 | T-2 | T-3 | T-4 | T-5 | T-6 | T-7 | T-8 | T-9 |
| MURALE 1 TN M PV | ● | ● | ● | ● | ● | ● | ● | ● | ● | ● |
| MURALE 1 TN ST PV | ● | ● | ● | ● | ● | ● | ● | ● | ● | ● |
| MURALE 2 TN M PV | ● | ● | ● | ● | ● | ● | ● | ● | ● | ● |
| MURALE 2 TN ST PV | ● | ● | ● | ● | ● | ● | ● | ● | ● | ● |
| MURALE 3 TN M PV | ● | ● | ● | ● | ● | ● | ● | ● | ● | ● |
| MURALE 2 TN ST PV | ● | ● | ● | ● | ● | ● | ● | ● | ● | ● |
| TESTATE LATTICIN 4 TN M | ● | ● | ● | ● | ● | ● | ● | ● | ● | ● |
| MURALE LATTICIN 5 TN M | ● | ● | ● | ● | ● | ● | ● | ● | ● | ● |
| MURALE LATTICIN 6 TN SI | ● | ● | ● | ● | ● | ● | ● | ● | ● | ● |
| MURALE LATTICIN 6 TN G2 | ● | ● | ● | ● | ● | ● | ● | ● | ● | ● |
| MURALE LATTICIN 9 TN M | ● | ● | ● | ● | ● | ● | ● | ● | ● | ● |
| MURALE LATTICIN 6 TN SI.1.0.1.2.3.4.5.6.7.8.9.10.11.12.13.14.15.16.17.18.19.20.21.22.23.24.25.26.27.28.29.30.31.32.33.34.35.36.37.38.39.40.41.42.43.44.45.46.47.48.49.50.51.52.53.54.55.56.57.58.59.60.61.62.63.64.65.66.67.68.69.70.71.72.73.74.75.76.77.78.79.80.81.82.83.84.85.86.87.88.89.90.91.92.93.94.95.96.97.98.99.100. |
Fig. 2.r
| Number of utilities blocking FS | |||
| Yellow | Orange | Red | |
| Online | 1 | 0 | 1 |
| Offline | 0 | 1 | 0 |
Fig. 2.s
BOSS
2.6 Conf i guration sans Smooth lines (Duty cycle)
Fig. 2.u
BOSS
gauge
| Segment | Value | |---------|-------| | Floating success | 12.9 | | Floating success | 27.6 |Fig. 2.v
| Information | |
| Current setpoint | 28.2 barg/psig/°C/P |
| Minimum setpoint | 26.8 barg/psig/°C/P |
| Maximum setpoint | 28.8 barg/psig/°C/P |
| Gradient | 0.2 barg/psig/°C/P |
| Number of configured devices | 32 |
| Time window for DC calculation | 30 min |
| Frequency for DC calculation | 10 min |
| Maximum offline time | 30 % |
| Maximum number of offline devices | 3 |
| Delegible | Parameter | ||||||
| Uterice | DC Impulsora | DC converter | Max DC reglucrata | Min DC reglucrata | Reset | ||
| BANCO BERNITO GASTRONOMA 15 TH/M | 70 % | 1% | 3 % | 0 % | — | ||
| GOLA TACE ARAY GASTRONOMA 11 TH/M | 70 % | 10 % | 31 % | 13 % | — | ||
| GOLA TACE ARAY GASTRONOMA 12 TH/M | 70 % | 16 % | 39 % | 12 % | — | ||
| BANCO BERNITO GASTRONOMA 12 TH/M | 70 % | 25 % | 31 % | 10 % | — | ||
| BANCO BERNITO GASTRONOMA 13 TH/M | 70 % | 18 % | 15 % | 10 % | — | ||
| METROBANITO GASTRONOMA 14 TH/M | 70 % | 31 % | 25 % | 22 % | — | ||
| BANCO BERNITO PABLOZOMA 16 TH/M | 70 % | 15 % | 15 % | 10 % | — | ||
| CELLA CORTEBRUTTA 12 TH | 31 % | 26 % | 40 % | 11 % | — | ||
| CELLA CABB 21 TH | 70 % | 1 % | 25 % | 1 % | — | ||
Fig. 2.z
Index
1. EINFÜHRUNG 5
line
| Metric | Value | |--------|-------| | Regulation temperature | Peak | | Regulation setpoint | Horizontal line | | PHS = max superheat offset | Max superheat offset | | TSH = superheat threshold | Threshold | | Cooling request | 1 | | Smooth line status | 1 |Fig. 1.b
flowchart
graph TD
    A["C. Compressors"] --> B["a. Line 1"]
    B --> C["d. Energy saving"]
Fig. 1.c
Fig. 1.d Fig. 1.e
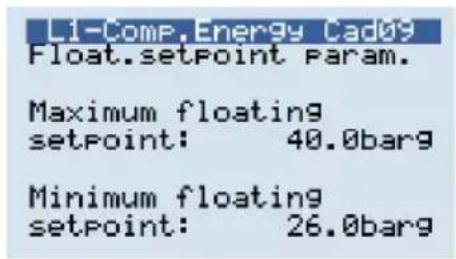
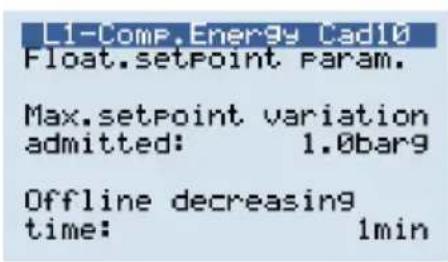
Fig. 1.f Fig. 1.g
flowchart
graph TD
    A["MPXPRO* MPXone**"] --> B["Floating suction on supervisor with Smoot line flag"]
    C["Mix di MPX* and other utilities"] --> D["Floating suction on supervisor without Smooth line flag"]
    E["Other than MPX* utilities only"] --> F["Floating suction on PVPRO without Smooth line flag"]
    B --> G["Enable Smooth line on MPXPRO"]
    D --> H["Disable Smooth line on MPXPRO"]
    F --> I["End"]
Fig. 1.j
Fig. 2.a
BOSS

Fig. 2.e
BOSS
gauge
| Metric | Value | | --- | --- | | Maximum setpoint | 27.6 | | Minimum setpoint | 12.5 | | Actual set | 14 |Fig. 2.f
Fig. 2.g
BOSS
flowchart
graph TD
    A["Green Node"] --> B["Yellow Node"]
    B --> C["Orange Node"]
    C --> D["Red Node"]
    style A fill:#90EE90,stroke:#333
    style B fill:#FFD700,stroke:#333
    style C fill:#FFA500,stroke:#333
    style D fill:#FF66B4,stroke:#333
    note1["Utility is working hard: there is no margin to rise up suction pressure setpoint"]
    note2["Utility is working fine: reset status"]
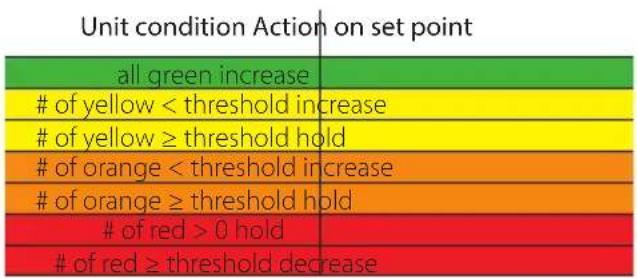
Fig. 2.k
CAREL
GER
| Ultimo campionamento | 14:39 | |
| Setpoint corrente | 27.0 | barg/psig/°C/°F |
| Setpoint minimo | 26.8 | barg/psig/°C/°F |
| Setpoint massimo | 28.8 | barg/psig/°C/°F |
| Gradiente | 0.2 | barg/psig/°C/°F |
| Numero di utenze configurato | 32 | |
| Numero Campioni | 3 | |
| Intervallo tra campionamento | 30 | min |
| Finestra temporale | 90 | min |
| Maximum warning utilities(yellow) | 6 | |
| Maximum critical utilities(orange) | 4 | |
| Maximum overloaded utilities(red) | 2 | |
Fig. 2.m Fig. 2.n
other
| Utility | T | T-1 | T-2 | |---|---|---|---| | MPXPRO - 60 | ● | ● | ● | | MPXPRO - 61 | ● | ● | ● | | MPXPRO - 62 | ● | ● | ● | | MPXPRO - 63 | ● | ● | ● | | MPXPRO - 64 | ● | ● | ● | | MPXPRO - 65 | ● | ● | ● | | MPXPRO - 66 | ● | ● | ● | | MPXPRO - 67 | ● | ● | ● | | MPXPRO - 68 | ● | ● | ● | | MPXPRO - 69 | ● | ● | ● |Fig. 2.q
BOSS
| Utama | T | T-1 | T-2 | T-3 | T-4 | T-5 | T-6 | T-7 | T-8 | T-9 |
| MURALE 1 TN M FV | ● | ● | ● | ● | ● | ● | ● | ● | ● | ● |
| MURALE 1 TN S1 FV | ● | ● | ● | ● | ● | ● | ● | ● | ● | ● |
| MURALE 2 TN M FV | ● | ● | ● | ● | ● | ● | ● | ● | ● | ● |
| MURALE 2 TN S1 FV | ● | ● | ● | ● | ● | ● | ● | ● | ● | ● |
| MURALE 3 TN M FV | ● | ● | ● | ● | ● | ● | ● | ● | ● | ● |
| MURALE 3 TN S1 FV | ● | ● | ● | ● | ● | ? | ● | ● | ● | ● |
| TESTATA LATTICINI 4 TN M | ● | ● | ● | ● | ● | ● | ● | ● | ● | |
| MURALE LATTICINI 5 TN M | ● | ● | ● | ● | ● | ● | ● | ● | ● | |
| MURALE LATTICINI 5 TN S1 | ● | ● | ● | ● | ● | |||||
| MURALE LATTICINI 5 TN S2 | ||||||||||
| MURALE LATTICINI 6 TN M | ||||||||||
| MURALE LATTICINI 6 TN S1 | ||||||||||
| MURALE LATTICINI 6 TN S2 | ||||||||||
| ISOLATARE AWAY 7 TN M CARM / RESCE | ||||||||||
| MURALE CARM 6 TN M | ||||||||||
| MURALE CARM 6 TN S1 |
Fig. 2.r
| Number of utilities blocking FS | |||
| Yellow | Orange | Red | |
| Online | 1 | 0 | 1 |
| Offline | 0 | 1 | 0 |
Fig. 2.s
BOSS
Fig. 2.u
BOSS
gauge
| Metric | Value | | --- | --- | | Mini BOOSTER BT/TSN (L2 - not present) | 12.9 | | Mini BOOSTER BT/TSN (L1 - not present) | 27.6 |Fig. 2.v
Fig. 2.x
CAREL
| Information | |||||||
| Umsat | DC Impostata | DC current | Min DC registrata | Min DC registrata | Resct. | ||
| Current setpoint | 28.2 barg/psig/°C/F | ||||||
| Minimum setpoint | 26.8 barg/psig/°C/F | 70% | 5% | 5% | 5% | - | |
| Maximum setpoint | 28.8 barg/psig/°C/F | 70% | 10% | 21% | 13% | - | |
| Gradient | 0.2 barg/psig/°C/F | 70% | 14% | 19% | 12% | - | |
| Number of configured devices | 32 | 70% | 26% | 21% | 18% | - | |
| Time window for DC calculation | 30 min | 70% | 18% | 15% | 10% | - | |
| Frequency for DC calculation | 10 min | 70% | 31% | 38% | 22% | - | |
| Maximum offline time | 30 % | 70% | 18% | 15% | 10% | - | |
| Maximum number of offline devices | 3 | 70% | 46% | 41% | 5% | - | |
| 70% | 5% | 25% | 5% | - | |||
Fig. 2.z
Índice
1. INTRODUCCIÓN 5
1.1 Smooth lines: funcionamiento 5
1.2 Smooth lines en MPXone* MPXpro: configuración....6
1.3 Floating suction en pRack....7
1.4 Floating suction en el Supervisor....8
line
| Metric | Value | | --- | --- | | Regulation temperature | ~0.8 | | Regulation setpoint | ~0.5 | | PHS = max superheat offset | ~0.5 | | TSH = superheat threshold | ~0.5 | | Cooling request | 1 | | Smooth line status | 1 |Fig. 1.b
1.2 Smooth lines en MPXone\* MPXpro: confi guración
flowchart
graph TD
    A["C. Compressors"] --> B["a. Line 1"]
    B --> C["d. Energy saving"]
Fig. 1.c
Fig. 1.d Fig. 1.e
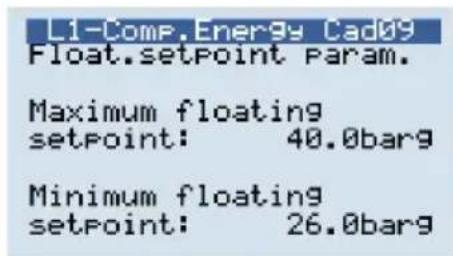
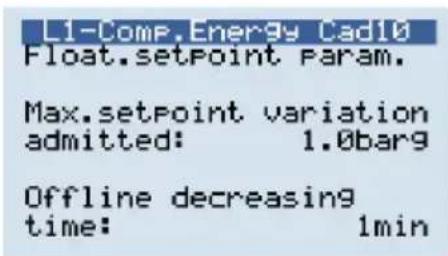
Fig. 1.f Fig. 1.g
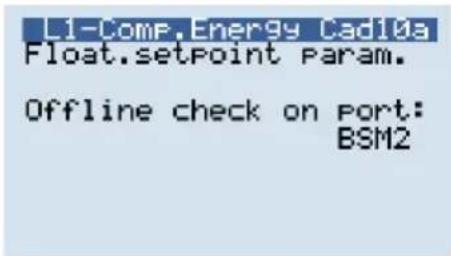
Fig. 1.h
flowchart
graph TD
    A["MPXPRO* MPXone**"] --> B["Floating suction on supervisor with Smoot line flag"]
    C["Mix di MPX* and other utilities"] --> D["Floating suction on supervisor without Smooth line flag"]
    E["Other than MPX* utilities only"] --> F["Floating suction on PVPRO without Smooth line flag"]
    B --> G["Enable Smooth line on MPXPRO"]
    D --> H["Disable Smooth line on MPXPRO"]
    F --> I["End"]
Fig. 1.j
Fig. 2.a
BOSS

Fig. 2.e
BOSS
gauge
| Metric | Value | | --- | --- | | Maximum setpoint | 27.6 | | Minimum setpoint | 12.5 | | Actual set | 14 |Fig. 2.f
Fig. 2.g
BOSS
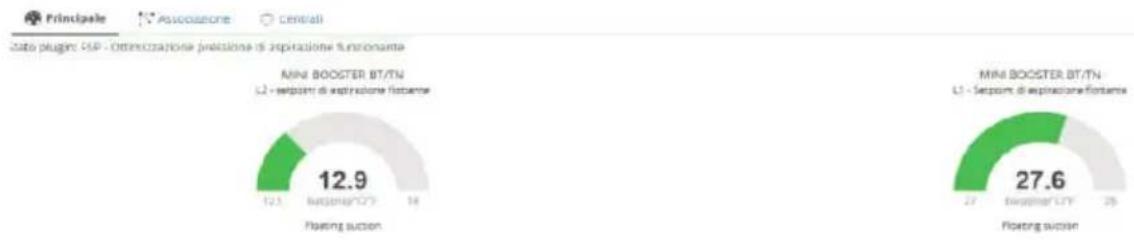
Fig. 2.i
BOSS
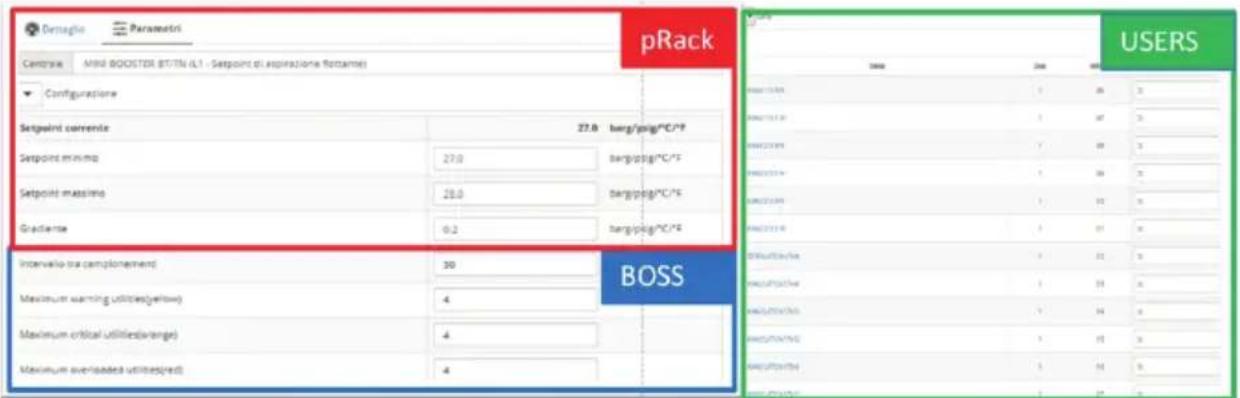
Fig. 2.j
flowchart
graph TD
    A["Green Circle"] --> B["Yellow Circle"]
    B --> C["Orange Circle"]
    C --> D["Red Circle"]
    D --> E["Gray Arrow to Green"]
    style A fill:#90EE90,stroke:#333
    style B fill:#FFD700,stroke:#333
    style C fill:#FFA500,stroke:#333
    style D fill:#FF6347,stroke:#333
    note1["Utility is working hard: there is no margin to rise up suction pressure setpoint"]
    note2["Utility is working fine: reset status"]
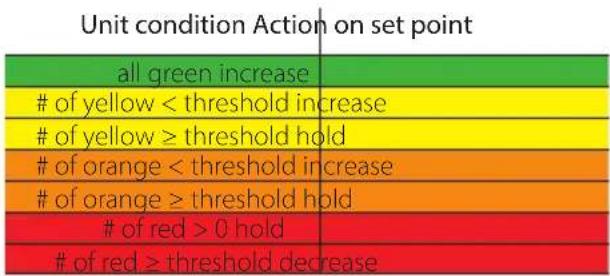
Fig. 2.k
CAREL
SPA
flowchart
graph LR
    A["Yellow Y"] -->|A| B["Orange O"]
    B --> C["Red R"]
other
Utility | Utility | T | T-1 | T-2 | |---|---|---|---| | MPXPRO - 60 | ● | ● | ● | | MPXPRO - 61 | ● | ● | ● | | MPXPRO - 62 | ● | ● | ● | | MPXPRO - 63 | ● | ● | ● | | MPXPRO - 64 | ● | ● | ● | | MPXPRO - 65 | ● | ● | ● | | MPXPRO - 66 | ● | ● | ● | | MPXPRO - 67 | ● | ● | ● | | MPXPRO - 68 | ● | ● | ● | | MPXPRO - 69 | ● | ● | ● |Fig. 2.q
BOSS
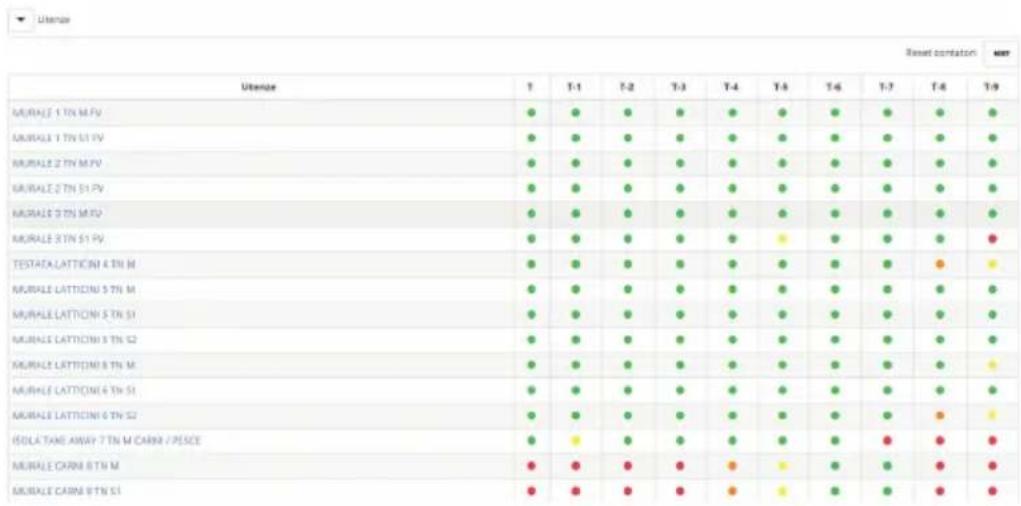
Fig. 2.r
| Number of utilities blocking FS | |||
| Yellow | Orange | Red | |
| Online | 1 | 0 | 1 |
| Offline | 0 | 1 | 0 |
Fig. 2.s
BOSS
Fig. 2.u
BOSS
gauge
| Metric | Mini BOOSTER BT/TN | Mini BOOSTER BT/TN | | --- | --- | --- | | Segment A | 12.9 | 27.6 | | Segment B | 10.5 | 17.0 |Fig. 2.v
Fig. 2.x
CAREL
| Information | |
| Current setpoint | 28.2 barg/psig/°C/F |
| Minimum setpoint | 26.8 barg/psig/°C/F |
| Maximum setpoint | 28.8 barg/psig/°C/F |
| Gradient | 0.2 barg/psig/°C/F |
| Number of configured devices | 32 |
| Time window for DC calculation | 30 min |
| Frequency for DC calculation | 10 min |
| Maximum offline time | 30 - % |
| Maximum number of offline devices | 3 |
| Deltaglio | Etematric | |||||
| Uterice | DC Impostata | DC correnta | Max DC reglucrata | Min DC reglucrata | ||
| BANCO SIRAYO GASTRONOMA 15 TIN M | 70 % | 8 % | 3 % | 0 % | — | |
| GALLA TACE ARAY GASTRONOMA 11 TIN M | 70 % | 10 % | 31 % | 12 % | — | |
| GALLA TACE ARAY GASTRONOMA 12 TIN M | 70 % | 16 % | 39 % | 12 % | — | |
| BANCO SIRAYO GASTRONOMA 12 TIN M | 70 % | 25 % | 31 % | 10 % | — | |
| BANCO SIRAYO GASTRONOMA 13 TIN M | 70 % | 18 % | 15 % | 10 % | — | |
| RETROMANED GASTRONOMA 14 TIN M | 70 % | 31 % | 25 % | 22 % | — | |
| BANCO SIRAYO ALESTORIA 16 TIN M | 70 % | 15 % | 15 % | 10 % | — | |
| CELLA DISTRATUTA 15 TIN | 70 % | 20 % | 40 % | 11 % | — | |
| CELLA CAMP 21 TIN | 70 % | 3 % | 25 % | 11 % | — | |
Fig. 2.z
CAREL
CAREL INDUSTRIES HQs
- Floating suction & Smooth lines
- of yellow < threshold increase
- of yellow ≥ threshold hold
- of orange < threshold increase
- of orange ≥ threshold hold
- of red > 0 hold
- of red ≥ threshold decrease
- CAREL
- ITA
- Content
- INTRODUCTION 5
- INTRODUCTION
- Smooth lines: how it works
- Smooth lines on MPXone\* MPXpro: configuration
- Floating suction on pRack
- Floating suction on the supervisor
- Rack selection
- Rack association
- Dashboard: main view
- Configuration with Smooth lines
- Configuration
- Units
- PVPRO
- BOSS
- Operating details with Smooth lines
- Conf i guration without Smooth lines (Duty cycle)
- Operating details (without Smooth lines)
- Index
- CONFIGURATION DE FS SUR PVPRO 10
- «Smooth lines» sur MPXone\* MPXpro: configuration
- CONFIGURATION DE FS SUR PVPRO
- FRE
- Conf i guration sans Smooth lines (Duty cycle)
- EINFÜHRUNG 5
- GER
- Índice
- INTRODUCCIÓN 5
- Smooth lines en MPXone\* MPXpro: confi guración
- SPA
- CAREL INDUSTRIES HQs
Brand : Carel
Model : PlantVisorPRO
Category : Air Conditioning