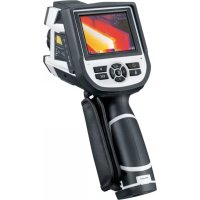
ThermoXplorer Pro - Surveillance Camera Laserliner - Free user manual and instructions
Find the device manual for free ThermoXplorer Pro Laserliner in PDF.


| Product Type | Thermal Imaging Camera |
| Brand | Laserliner |
| Model | ThermoXplorer Pro |
| Category | Surveillance Camera |
| Dimensions (L x W x H) | 298 mm x 104 mm x 149 mm |
| Weight | 1.1 kg (batteries included) |
| Power Supply | Li-ion battery pack 7.4 V / 2.0 Ah |
| Charge Time | Approximately 7 hours |
| Battery Life | Approximately 3 hours |
| Display | 3.5-inch TFT color touch screen |
| Infrared Sensor | Uncooled microbolometer 160 x 120 pixels, 8-14 μm |
| Temperature Measurement Range | -20 °C to 350 °C |
| Measurement Accuracy | ± 2 °C or ± 2% of the measured value |
| Thermal Sensitivity | 0.1 °C (100 mK NETD) |
| IR Optics | Interchangeable germanium lens, field of view 25° x 19°, manual focus |
| Digital Camera | Resolution 640 x 480 pixels |
| Storage | Micro SD card up to 16 GB |
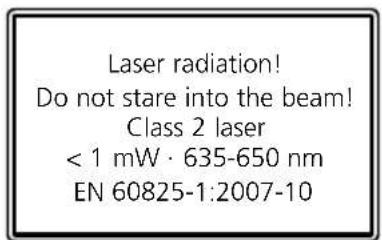
| Target Laser | Class 2, < 1 mW, 635-650 nm |
| Connectivity | USB, video output, micro SD |
| Protection Rating | IP54 |
| Main Functions | Non-contact temperature measurement, temperature alarm, isotherms, measurement points, lines, areas, hotspot/coldspot, image recording, digital zoom 1-2x, self-calibration |
| Maintenance and Cleaning | Clean with a soft, dry cloth. Do not touch the lens. Turn off the device and remove the battery before cleaning. |
| Safety | Do not look directly into the laser beam. Class 2 laser device. Keep out of reach of children. |
| Spare Parts and Repairability | Removable and replaceable Li-ion battery pack. No other user-serviceable parts. |
Frequently Asked Questions - ThermoXplorer Pro Laserliner
User questions about ThermoXplorer Pro Laserliner
0 question about this device. Answer the ones you know or ask your own.
Ask a new question about this device
Download the instructions for your Surveillance Camera in PDF format for free! Find your manual ThermoXplorer Pro - Laserliner and take your electronic device back in hand. On this page are published all the documents necessary for the use of your device. ThermoXplorer Pro by Laserliner.
USER MANUAL ThermoXplorer Pro Laserliner
natural_image
Medical endoscopy device with thermal imaging display and control buttons (no visible text or symbols)

DYNAMIC TEMPERA-TURE CURVE
IR-SENSOR
160 x 120 px
50 FRAMES PER SECOND
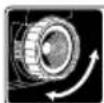
FOCUSABLE LENS
TARGET LASER


natural_image
Diagram of a device with a lock and directional arrow, showing internal components without any text or symbols.natural_image
Diagram of a door panel with buttons and an arrow pointing to the control panel (no text or symbols present)5 Hauptmenü
natural_image
Thermal imaging view of a room interior with blue walls, yellow walls, and red heat signatures (no readable text or symbols)IR-Bild Digitalbild
natural_image
Interior view of a modern bathroom with bathtub, toilet, and large window (no visible text or symbols)
24 Zoom
natural_image
Thermal imaging view of a room interior with blue and yellow lighting (no visible text or symbols)
25 Kamerafokus
natural_image
Technical line drawing of a handheld device with a circular component and directional arrow (no text or symbols)26.0 Mediengalerie / Wiedergabemodus
natural_image
Diagram showing a laptop connected to a CD with an arrow indicating data transfer (no text or symbols present)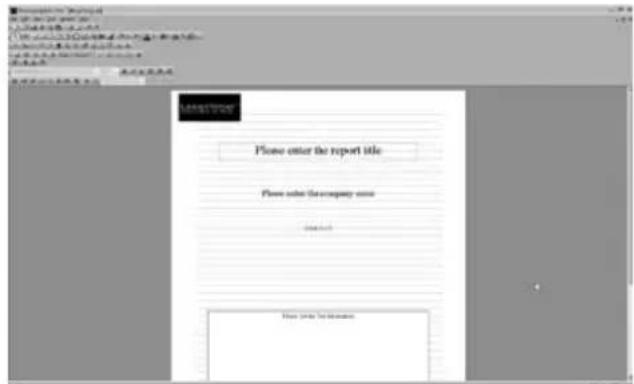
natural_image
Diagram of a computer monitor with an attached cable showing the cable connector (no text or symbols present)Read the operating instructions and the enclosed brochure „Guarantee and additional notices“ completely. Follow the instructions they contain. Safely keep these documents for future reference.
Function / Application
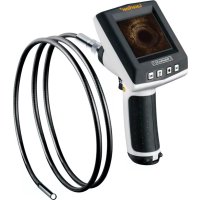
This thermographics camera allows for non-contact temperature measurement on surfaces by means of radiation in the infrared wavelength range via the integrated non-chilled microbolometer. The imaging technology of the sensor provides a visual image of the temperatures surrounding the inspected object. The temperature differences can be visualised by colour-coding the individual temperatures in a thermogram with false colour display. At the same time, the additional digital camera can capture images of the inspection area, which can then either documented later in the device or processed further using the included software. Possible application options include detecting thermal bridges and insulation flaws, locating overheating spots in electrical or mechanical building elements, finding heating pipes in walls or floors, detecting leaks, locating defective solar cells in PV modules etc.
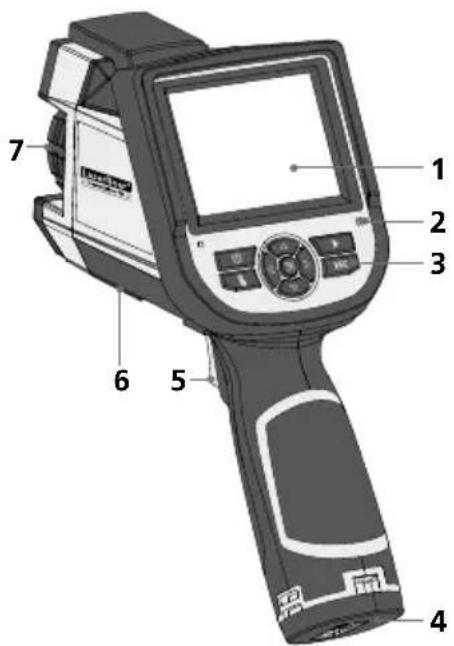
1 3.5" TFT colour display
2 Integrated microphone
3 Hot keys
4 Battery compartment
5 Trigger: Save
IR/CCD
Laser
Spot temperature
Area temperature
6 1/4" tripod connection
7 Lens
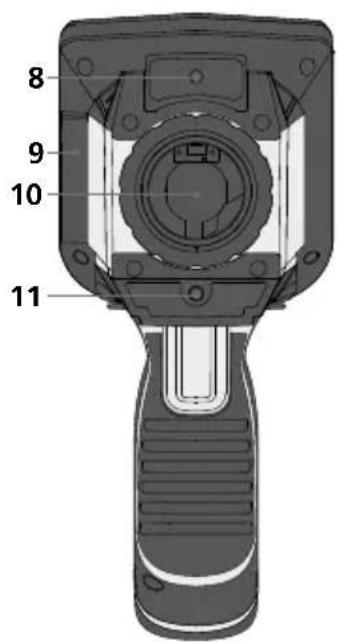
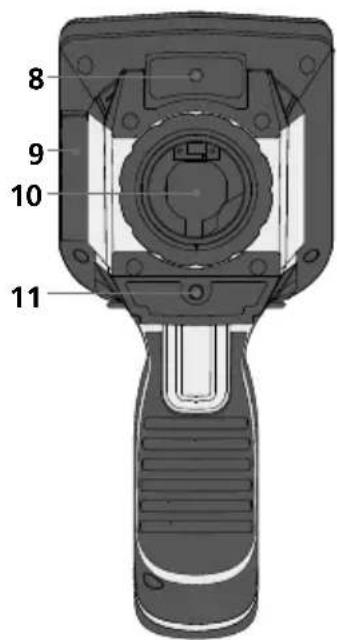
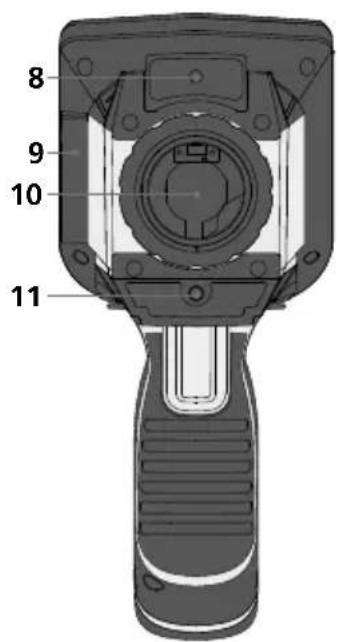
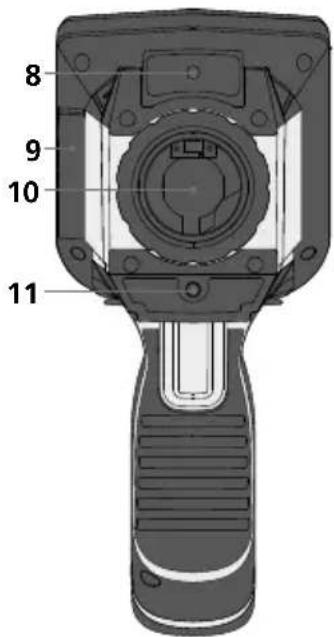
8 Camera
9 Shaft
10 Infrared camera lens
11 Laser output
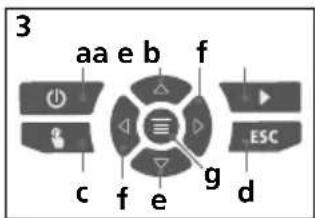
a ON/OFF
b Media gallery
c Select target objects
d Cancel
e Control menu / Zoom on/off
f Control menu / IR/digital image changeover
g Main menu
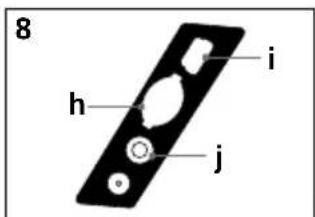
h Micro-SD card slot
i USB interface
j Video output
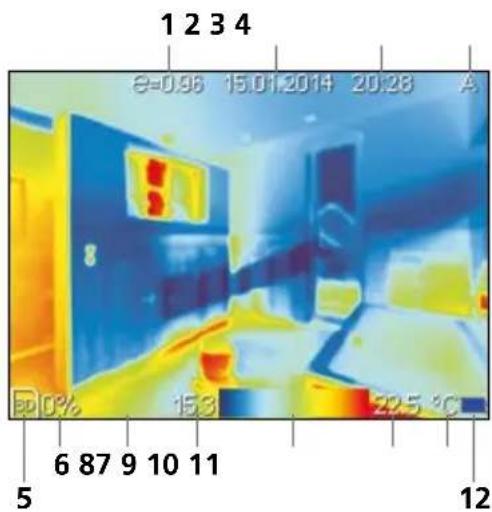
Standard measurement view
1 Set emissivity coefficient
2 Date
3 Time
4 Determine temperature mode (man./auto..)
5 Micro-SD card inserted
6 Used memory space (Micro-SD card)
7 Thermography image
8 Min. temperature
9 Colour spectrum with temperature range
10 Max. temperature
11 Temperature unit
12 Battery charge indicator
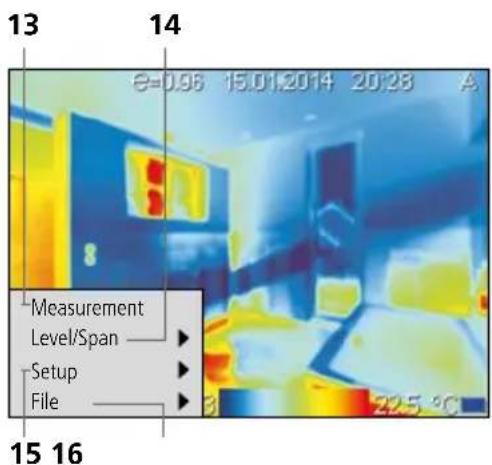
Main menu
13 Add measurement points, lines and areas
14 Temperature range automatic / manual
15 General and measurement-specific settings
16 Media gallery
1 ON / OFF
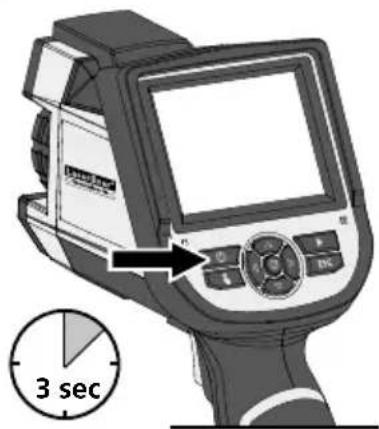
2 Charging the li-ion battery
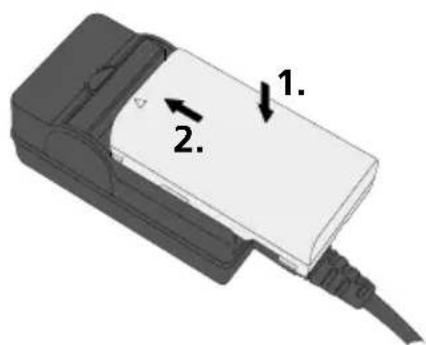
3 Replace li-ion battery
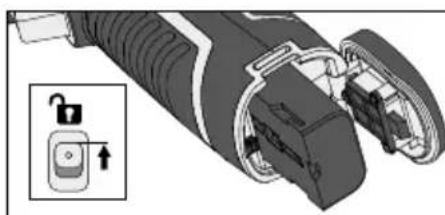
To replace the li-ion battery, unlock the handle (see image on right). Remove the battery pack, insert the new battery pack and lock the compartment again.
natural_image
Diagram of a handheld device with internal components and an open lock icon, showing no text or symbols.! Store the battery packs in the holders in the case when transporting the camera or when the camera is not used for longer periods.
4 Inserting micro-SD card
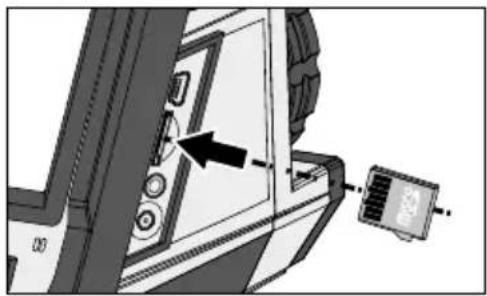
To insert a micro-SD card, first open the rubber cover and then insert the memory card as illustrated. You cannot record anything without a storage medium.
natural_image
Diagram of a door panel with control buttons and an attached sensor device (no text or symbols visible)5 Main menu
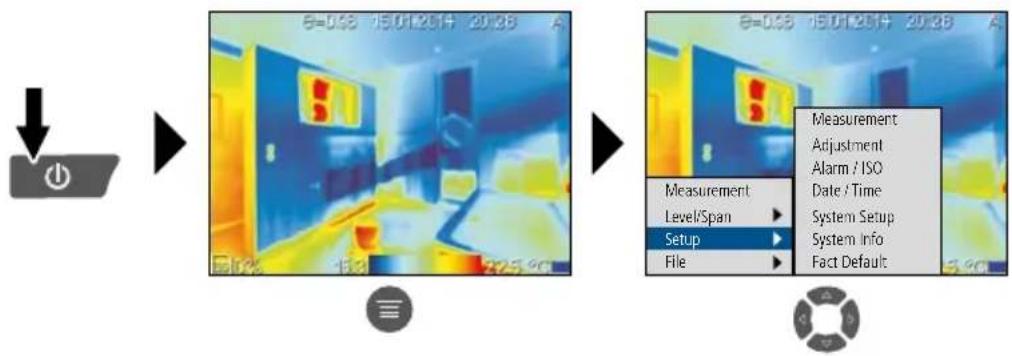
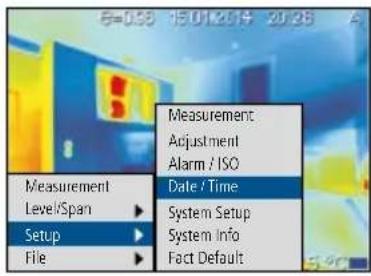
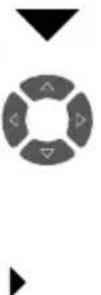
General and measurement-specific settings can be made in the main menu. The menu is controlled with the four arrow buttons.
flowchart
graph LR
    A["Input"] --> B["Thermal Imaging"]
    B --> C["Setup"]
    C --> D["Measurement"]
    D --> E["Adjustment"]
    D --> F["Alarm / ISO"]
    D --> G["Date / Time"]
    D --> H["System Setup"]
    D --> I["System Info"]
    D --> J["Fact Default"]
Inputs must be confirmed by pressing the Menu button (g). You can also use the Trigger button (4) if it is set to „Save”.
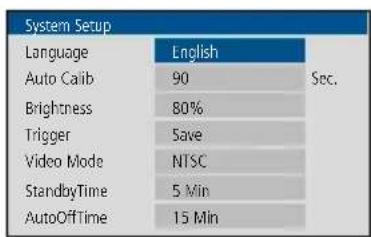
6.0 General settings: System settings
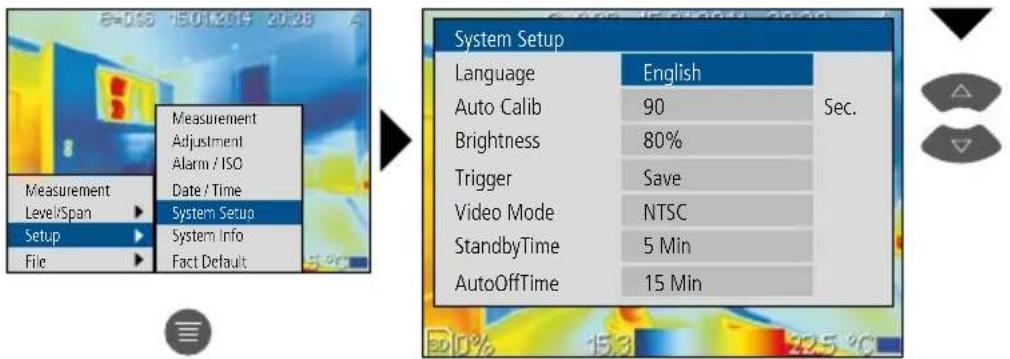
6.1 To set menu language DE / GB / FR / ES / IT / PT / RU
Italiano Português русский English Español Francais Deutsch
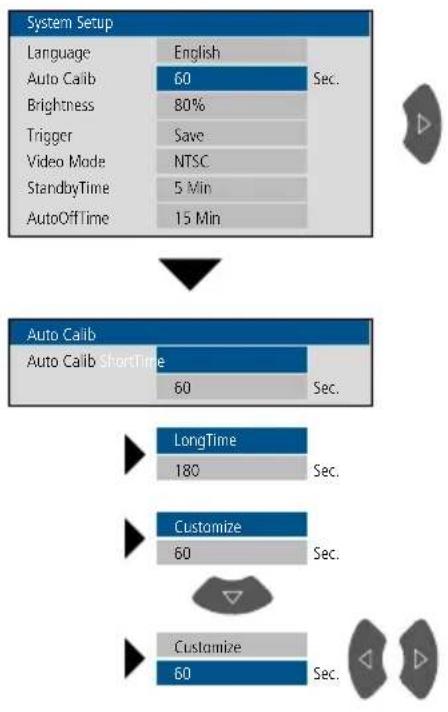
6.2 Autocalibration
flowchart
graph TD
    A["System Setup"] --> B["Language: English, 60%"]
    A --> C["Brightness: 80%, Save, NTSC, 5 Min, 15 Min"]
    A --> D["Trigger: Save"]
    A --> E["Video Mode: NTSC"]
    A --> F["StandbyTime: 5 Min"]
    A --> G["AutoOffTime: 15 Min"]

    H["Auto Calib"] --> I["Auto Calib ShortTime: 60%"]
    I --> J["LongTime: 180%"]
    I --> K["Customize: 60%"]
    I --> L["Customize: 60%"]

The input is increased or decreased by 10 seconds by pressing and holding the arrow buttons.
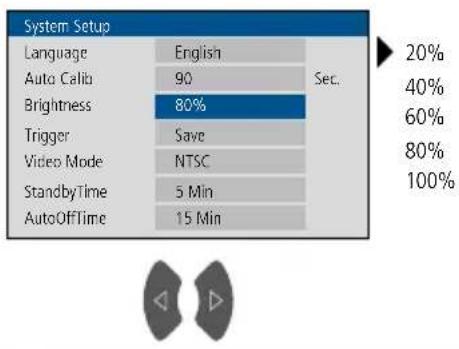
6.3 Display brightness
6.4 Trigger
The following functions can be assigned to the Trigger button:
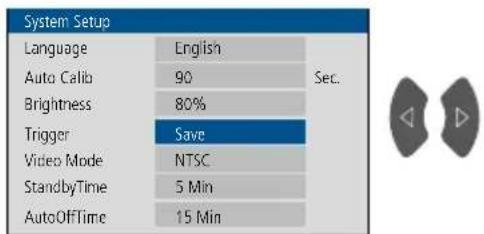
Save Save IR/digital image
IR-/Digital Change from IR to digital image
Laser Activate laser
Spot Temp Add / remove spot
Area Temp Add / remove area
6.5 Video output mode Auto display
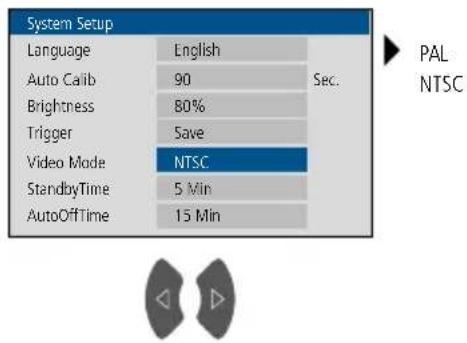
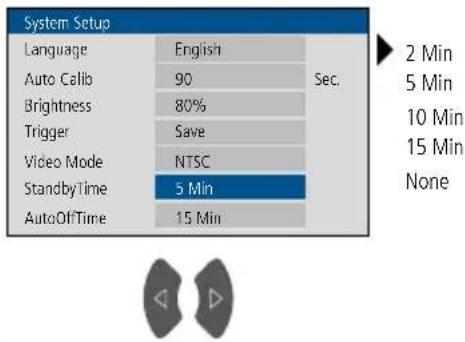
The display switches off automatically after a set period of inactivity.
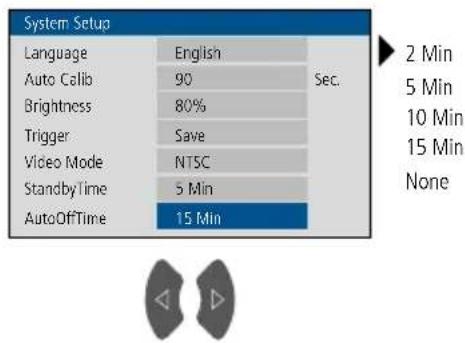
6.7 Auto power off
The device switches off automatically after a set period of inactivity.
7 General settings: Date / Time


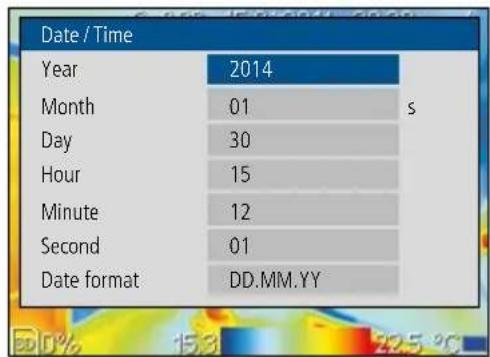
Selecting
date format
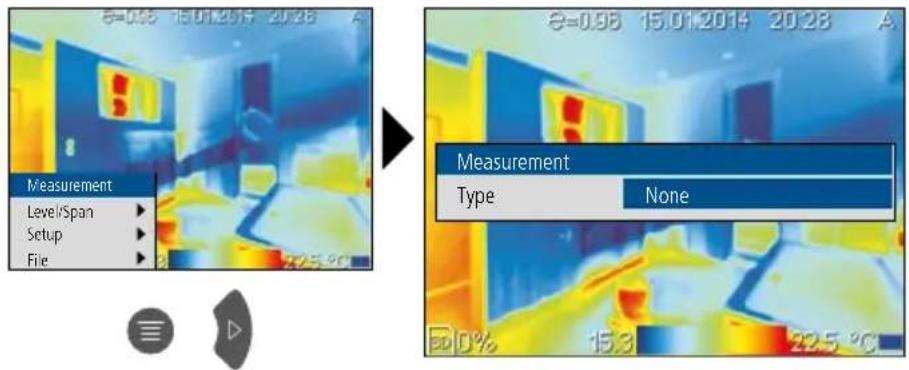
8 Measurement-specific settings: Measurement
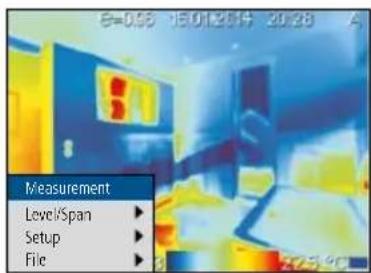


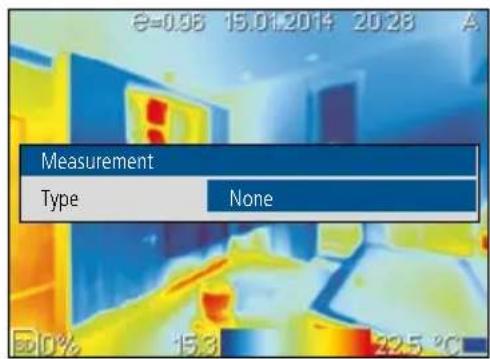

Add measurement points
Two measurement points (S1 and S2) can be added.
Add Hot Spot
Hot spot (SH) shows the hottest point.
Add Cold Spot
Cold spot (SC) shows the coldest point.
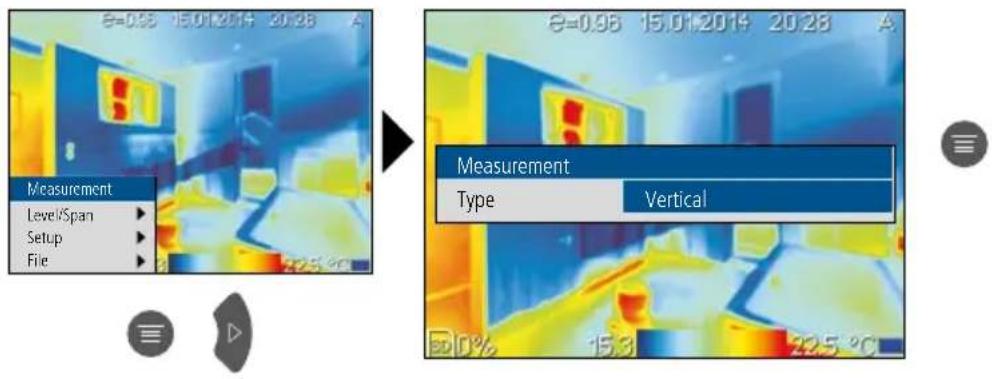
Activate horizontal line measurement (LH)
Activate vertical line measurement (LV)
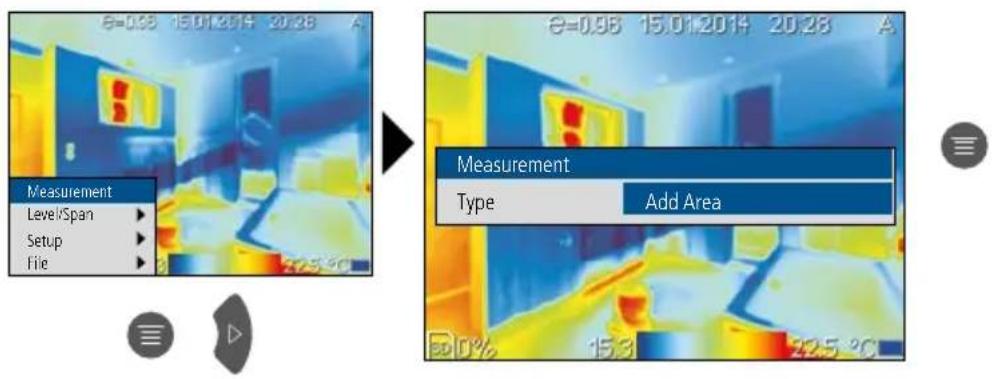
Add measurement areas
Three measurement areas (T1 to T3) can be added.
Measurement
Type Add Spot
Measurement
Type Add Hot Spot
Measurement
Type Add Cold Spot
Measurement
Type Horizontal
Measurement
Type Vertical
Measurement
Type Add Area

All added measurement points, lines and areas are removed by selecting „None“.
Refer to Section 16 ff to 20 f
9 Measurement-specific settings: Temperature range A / M
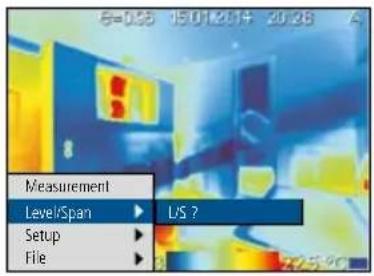

Auto?
Temperature range / Auto (A)
This setting is used to adjust the temperature range of the IR image and the resulting distribution of the colour spectrum of the infrared image. The colour spectrum of the measured IR image is determined in relation to the temperature range and colour scale.
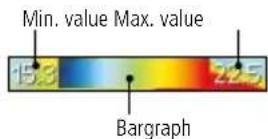
The colour distribution of the IR image is automatically and dynamically adjusted in the bargraph based on the measured min./max. values.
LIS?
Temperature range / manual (M)
In manual settings mode, the temperature range is no longer set automatically based on the measured min./max. values but rather determined on the basis of manual values. The user must define the temperature range and span. Refer to Section 21.
10.0 Measurement-specific settings: Measurement settings


natural_image
Thermal imaging view showing temperature distribution with color scale (no text or symbols)
bar
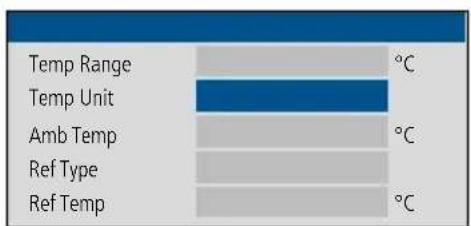
| Category | Value (°C) | |---|---| | Temp Range | | | Temp Unit | | | Amb Temp | | | Ref Type | | | Ref Temp | |
°C (Celsius)
°F (Fahrenheit)
K (Kelvin)
10.21 Ambient temperature Temperature
bar
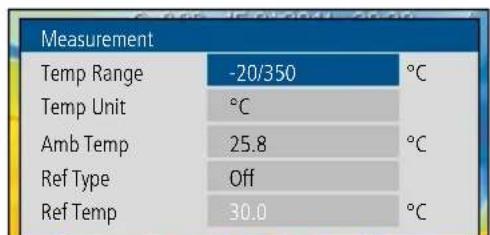
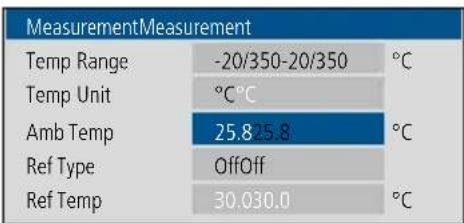
MeasurementMeasurement | Measurement | Value (°C) | | :--- | :--- | | Temp Range | -20/350-20/350 | | Temp Unit | °C°C | | Amb Temp | 25.8-25.8 | | Ref Type | OffOff | | Ref Temp | 30.030.0 |
10.3 To set reference temperature
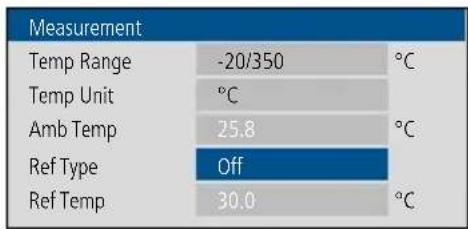
bar
Measurement | Measurement | Value | Temperature (°C) | | :--- | :--- | :--- | | Temp Range | -20/350 | | | Temp Unit | | | | Amb Temp | 25.8 | | | Ref Type | Off | | | Ref Temp | 30.0 | |
Ref Temp
Spot 1
Spot 2
Hotspot
Coldspot
Area 1
Area 2
Area 3
Off
The reference temperature shows the temperature difference between the set reference temperature and the measurement points, lines and areas.
Example:
R = 30.0^
S1 = 35.9 °C
S1 is displayed with the temperature difference of 5.9 °C.
11.0 Measurement-specific settings: Setup
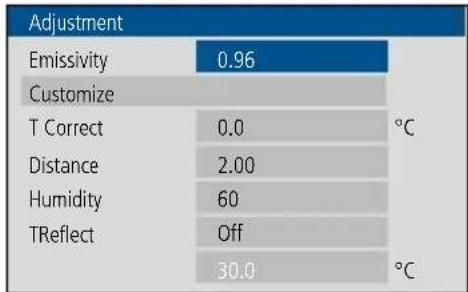
Before each use, check the settings for infrared measurement and adjust them to the respective measuring situation to ensure accurate measurements. In doing so, please pay particular attention to the general parameters with respect to emissivity coefficient, distance to target and ambient conditions.
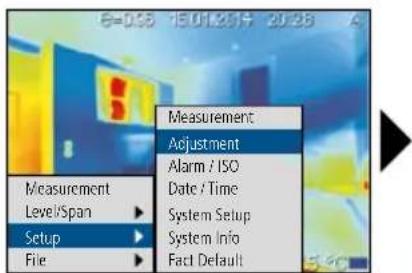

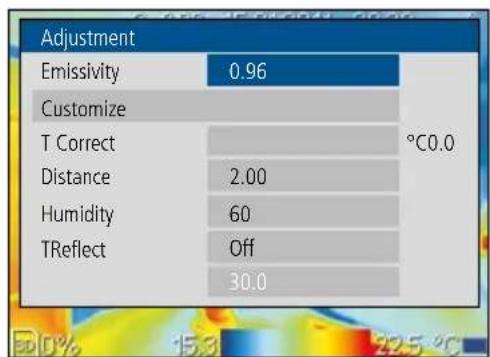
bar
| Parameter | Value | |---|---| | Emissivity | 0.96 | | Customize | | T Correct | | Distance | 2.00 | | Humidity | 60 | | TReflect | Off | | | 30.0 | °C0.0
11.1 Emissivity coefficient
The level of infrared emissions given off by everything depends on the specific material and surface. This factor is determined by the emissivity coefficient (0.10 ... 1.0). For accurate measurements, it is absolutely essential that the emissivity coefficient is set first. The emissivity coefficient can either be custom set or selected based on the predefined emissivity coefficients from the material list.
To set individual emissivity
other
Adjustment | Parameter | Value | Temperature (°C) | | :--- | :--- | :--- | | Emissivity | 0.96 | | | Customize | | | | T Correct | 0.0 | | | Distance | 2.00 | | | Humidity | 60 | | | TReflect | Off | | | | 30.0 | | The chart is a table with the 'Adjustment' column as the first value and 'Temperature' column as the second value. The 'Temperature' values are explicitly labeled on the table above each bar.

The input is increased or decreased by 10 seconds by pressing and holding the arrow buttons.
Emissivity table (reference values with tolerances)
Metals
| Aluminium | Iron | Steel | |||
| Oxidised | 0,30 | Oxidised | 0,75 | Alloy (8% nickel, 18% chromium) | 0,35 |
| Polished | 0,05 | With rust | 0,60 | Galvanised | 0,28 |
| Alloy A3003 | Iron, cast | Oxidised | 0,80 | ||
| Oxidised | 0,20 | Non-oxidised | 0,20 | Heavily oxidised | 0,88 |
| Roughened | 0,20 | Molten mass | 0,25 | Freshly rolled | 0,24 |
| Brass | Iron, forged | Rough, flat surface | 0,96 | ||
| Polished | 0,30 | Matt | 0,90 | Rusty, red | 0,69 |
| Oxidised | 0,50 | Lead | Sheet, nickel plated | 0,11 | |
| Chromium oxide | 0,81 | Rough | 0,40 | Sheet, rolled | 0,56 |
| Copper | Platinum | Stainless steel | 0,45 | ||
| Oxidised | 0,72 | Black | 0,90 | Zinc | |
| Copper oxide | 0,78 | Steel | Oxidised | 0,10 | |
| Inconel | Cold rolled | 0,80 | |||
| Oxidised | 0,83 | Ground plate | 0,50 | ||
| Electropolished | 0,15 | Polished plate | 0,10 |
Nonmetals
| Asbestos 0,93 | Gravel 0,95 | PaperAll colours | 0,96 | ||
| Asphalt 0,95 | Grit 0,95 | ||||
| Basalt 0,70 | Gypsum 0,88 | PlasticTranslucentPE, P, PVC | 0,950,94 | ||
| Brick, red 0,93 | Gypsum cardboard | 0,95 | |||
| Carborundum 0,90 | Heat sinkBlack, anodized | 0,98 | Quartz glass | 0,93 | |
| Cement 0,95 | Human skin | 0,98 | RubberHardSoft, grey | 0,940,89 | |
| CeramicsEarthenware, matt | 0,950,93 | IceClearWith heavy frost | 0,970,98 | Sand | 0,95 |
| ChinaUntreatedBeech, planed | 0,730,92 | Laminate | 0,90 | Screed | 0,93 |
| Clay 0,95 | Lime | 0,35 | Snow | 0,80 | |
| CoalNon-oxidised | 0,85 | Lime malm brick | 0,95 | Soil | 0,94 |
| Limestone | 0,98 | Tar | 0,82 | ||
| Concrete, plaster,mortar | 0,93 | MarbleBlack, dull finishGreyish, polished | 0,940,93 | Tar paper 0,92 | |
| Cotton 0,77 | Transformer paint | 0,94 | |||
| Fabric 0,95 | Masonry 0,93 | Wallpaper,light-coloured | 0,89 | ||
| Glass 0,90 | PaintBlack, mattHeat-resistantWhite | 0,970,920,90 | Water | 0,93 | |
| Glass wool 0,95 | WoodUntreatedBeech, planed | 0,880,94 | |||
| Graphite 0,75 |
To select emissivity from material list
| Adjustment | |
| Emissivity | 0.96 |
| Customize | |
| T Correct | 0.0 |
| Distance | 2.00 |
| Humidity | 60 |
| TReflect | Off |
| 30.0 | |
Selection from 44 preset materials
11.2 T Correct
| Adjustment | |
| Emissivity | 0.96 |
| Customize | |
| T Correct | 0.0 °C |
| Distance | 2.00 |
| Humidity | 60 |
| TReflect | Off |
| 30.0 °C | |
Correction of ambient climatic conditions
The following measurement-specific settings must be adjusted to the climatic conditions before starting measurements. Starting from 10 m distances, the atmospheric influences of the air must always be taken into account.
11.3
| Adjustment | |
| Emissivity | 0.96 |
| Customize | |
| T Correct | 0.0 |
| Distance | 2.00 |
| Humidity | 60 |
| TReflect | 30.0 |
11.4 HumidityDistance
| Adjustment | |
| Emissivity | 0.96 |
| Customize | |
| T Correct | 0.0 |
| Distance | 2.00 |
| Humidity | 60 |
| TReflect OffOff | |
| 30.0 | |
11.5 TReflect
| Adjustment | ||
| 0.96 | ||
| Customize | ||
| T Correct | 0.0 | °C |
| Distance | 2.00 | |
| Humidity | 60 | |
| TReflect | Off | °C |
| 30.0 | ||


| Adjustment | ||
| Emissivity | 0.96 | |
| Customize | ||
| T Correct | 0.0 | °C |
| Distance | 2.00 | |
| Humidity | 60 | |
| TReflect On | °C | |
| 30.0 | ||

Setting the required temperature
Reflection temperature
Infrared measurements of specific objects can be affected by reflection from other objects nearby or even from the ambient air because the measured object cannot be fully isolated. The reflection temperature setting can help compensate for the interference. The reflection temperature is generally the same as the ambient temperature. However, if larger objects with significantly different temperatures (approx. >20 °C) are in close proximity to the measured area, its effects must be taken into account. For this purpose, follow these steps:
- Set emissivity coefficient to 1.0
- Blur the object out of focus (Refer to Section 25)
- Aim the camera in the opposite direction of the actual measured object
- Determine the average temperature
- Set the average temperature as the reflection temperature
12.0 Measurement-specific settings: Alarm / ISO
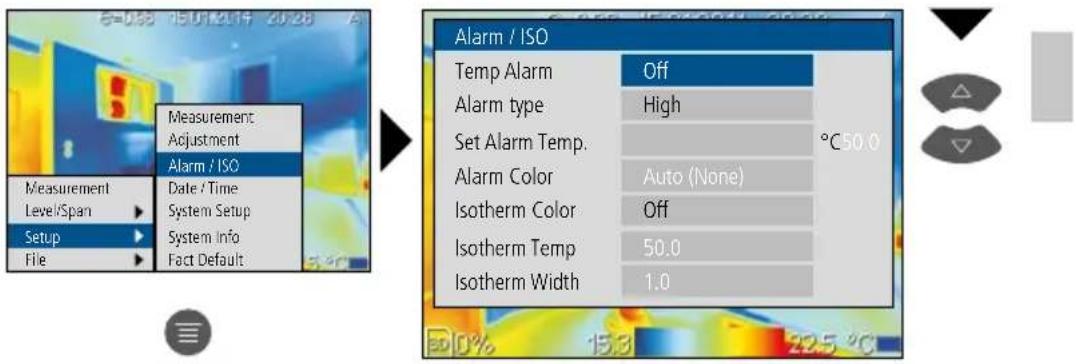
12.1 Temperature alarm
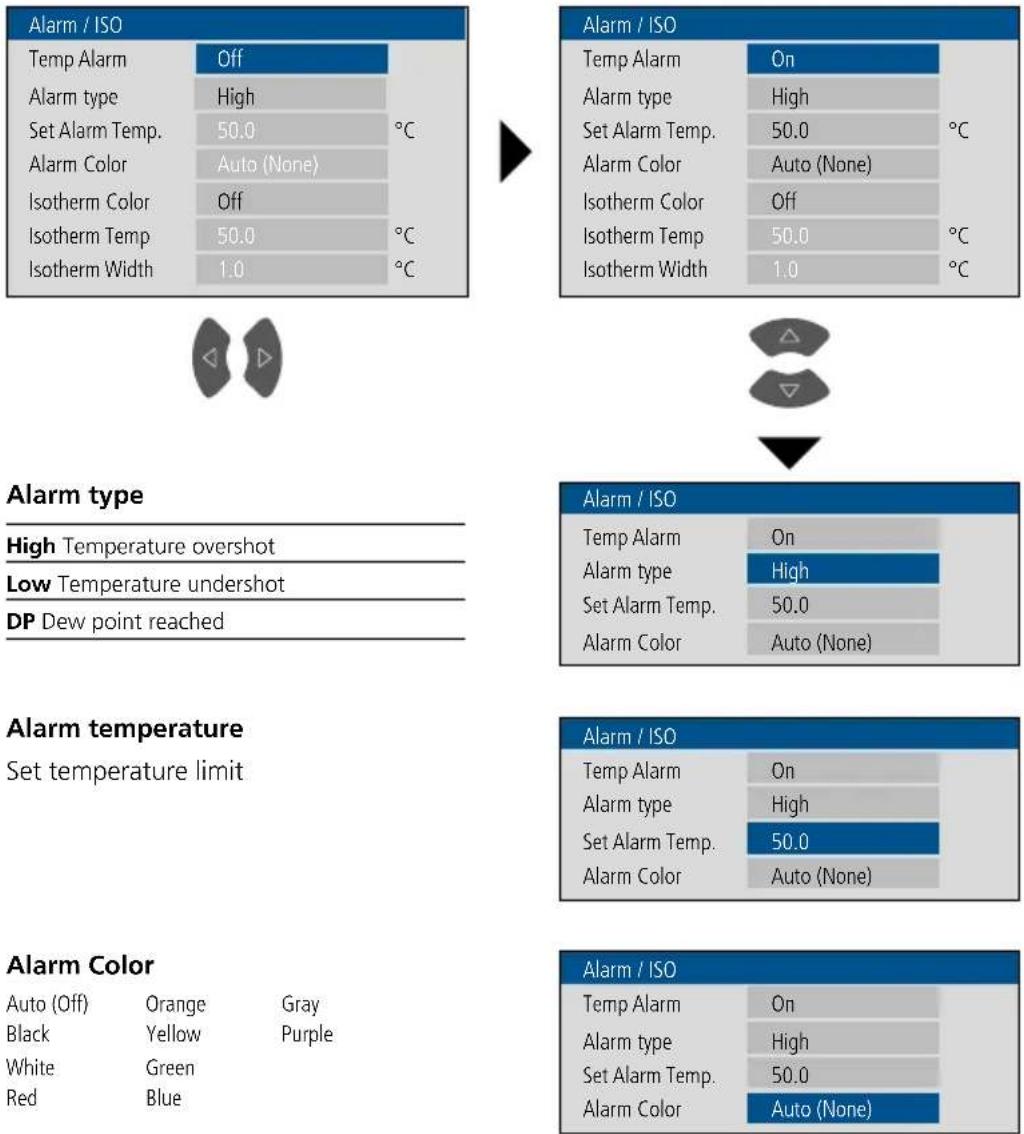
An alarm tone signals whether the set temperature range is overshot or undershot and whether the dew point is reached. The dew point is calculated automatically.

A measurement point, a measurement area or a horizontal/vertical line is required to use the alarm function.
flowchart
graph TD
    A["Alarm / ISO"] --> B["Alarm / ISO"]
    B --> C["Alarm / ISO"]
    C --> D["Alarm / ISO"]
    D --> E["Alarm / ISO"]
    E --> F["Alarm / ISO"]
    F --> G["Alarm / ISO"]
    G --> H["Alarm / ISO"]
    H --> I["Alarm / ISO"]
    I --> J["Alarm / ISO"]
    J --> K["Alarm / ISO"]
    K --> L["Alarm / ISO"]
    L --> M["Alarm / ISO"]
    M --> N["Alarm / ISO"]
    N --> O["Alarm / ISO"]
    O --> P["Alarm / ISO"]
    P --> Q["Alarm / ISO"]
    Q --> R["Alarm / ISO"]
    R --> S["Alarm / ISO"]
    S --> T["Alarm / ISO"]
    T --> U["Alarm / ISO"]
    U --> V["Alarm / ISO"]
    V --> W["Alarm / ISO"]
    W --> X["Alarm / ISO"]
    X --> Y["Alarm / ISO"]
    Y --> Z["Alarm / ISO"]
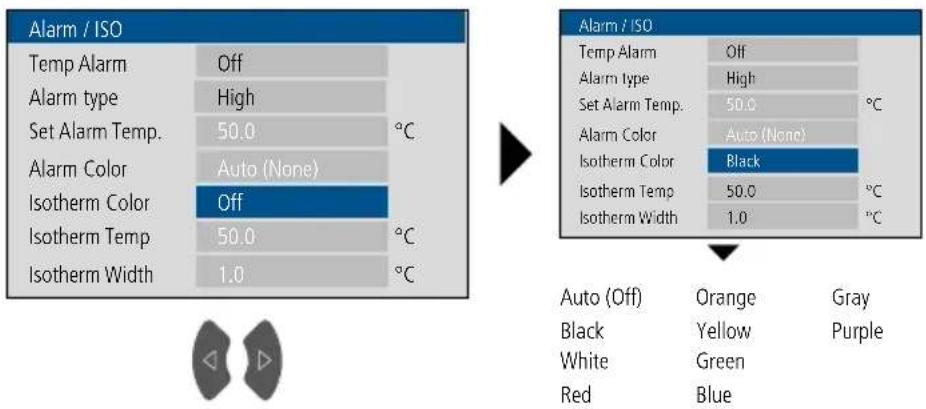
12.2 Isothermal function
The isothermal function can display definable temperature ranges with the same colour scheme, similar to a filter. This allows the particularly relevant temperature ranges to be made visible. Using specific parameters, the isothermal function must be set for each specific measurement task. The settings parameters resemble a „if-then“ function. If the predefined condition is met, the temperature range is displayed as determined.
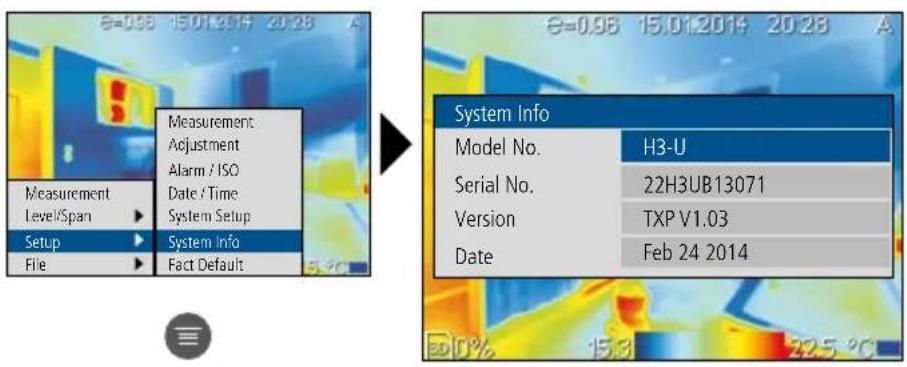
13 System Info
14 Fact Default
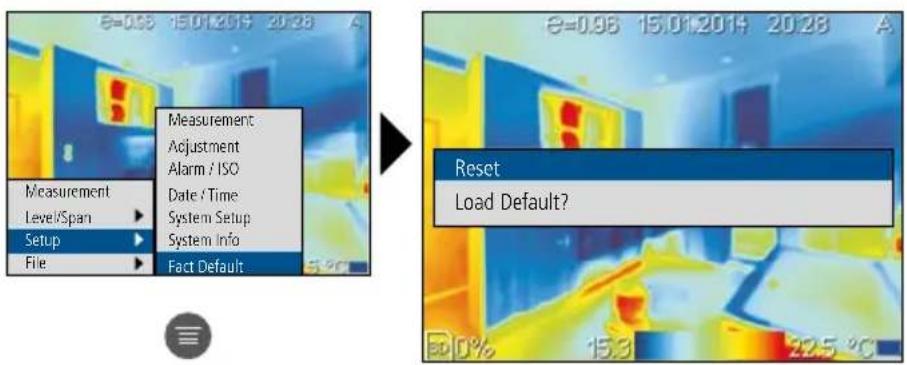

All settings will be lost.
15 To select target objects
Added measurement points, measurement fields, measurement areas as well as the bar graph and the Min/Max temperatures are selected one after the other by pressing the „Select Image Objects“ button c. The selected area is highlighted yellow and can be adapted after pressing the „Main Menu“ button d.
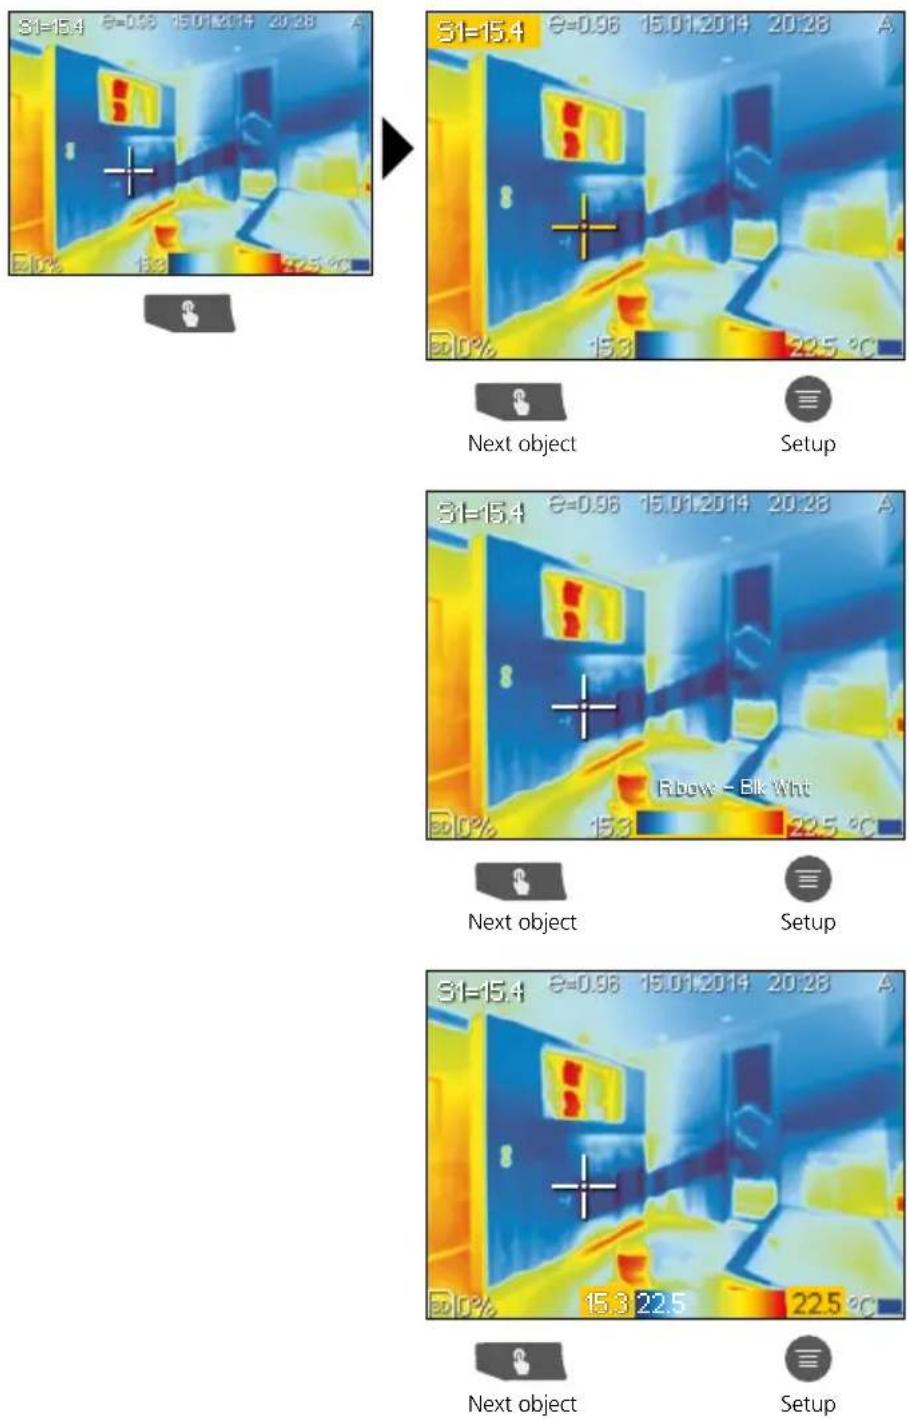
The selection is cancelled automatically after a short time.
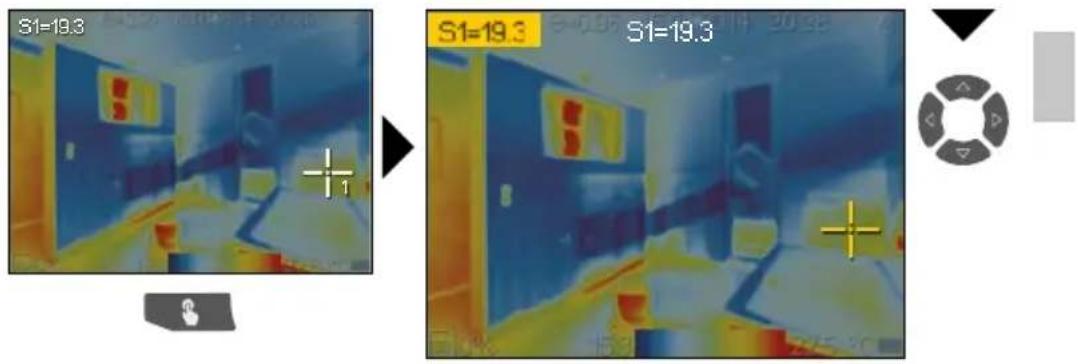
16.0 Activate / deactivate measurement points
Up to two measurement points can be set at one time. They can be assigned measurement-specific parameters as well as the following properties: maximum temperature, minimum temperature, manual positioning.
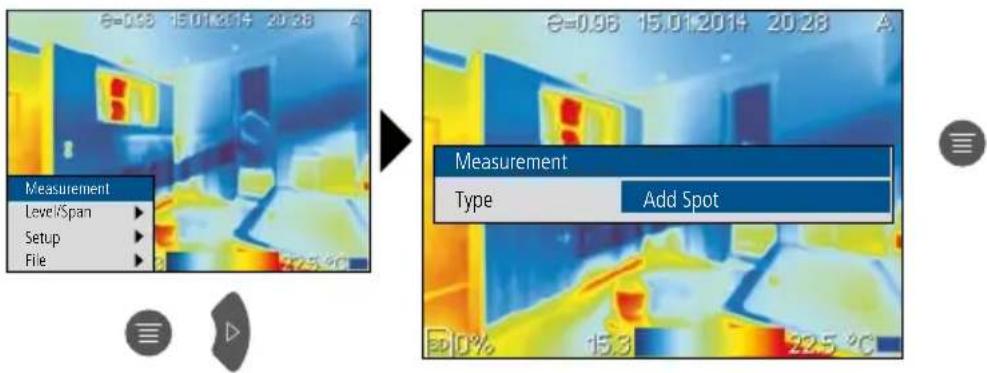

All added measurement points, lines and areas are removed by selecting „None“.
16.1 Measurement points / parameters
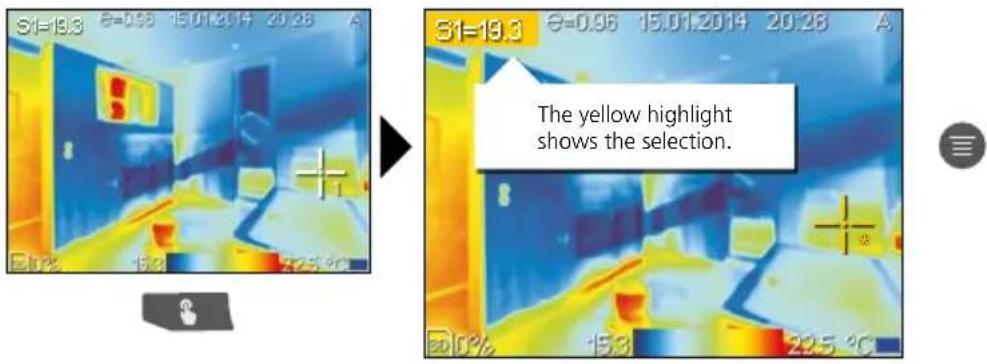
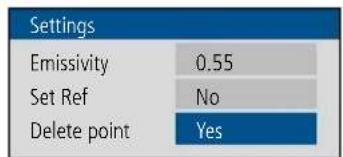
Emissivity
Set emissivity for point 1 (S1). Refer to Section 11.1.
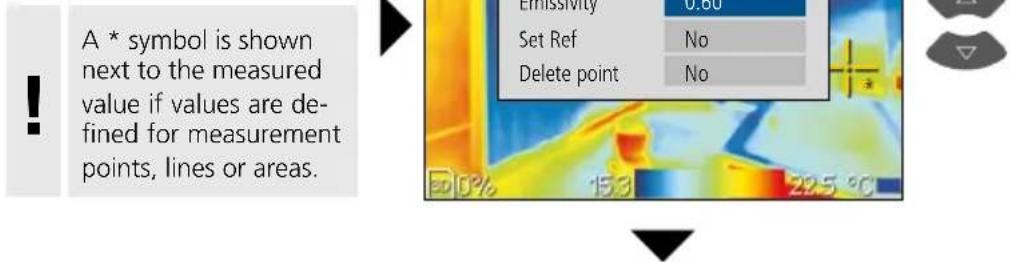
Set Ref
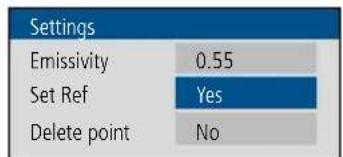
The temperature of point 1 (S1) shows the reference temperature (R). Refer to Section 10.2.
Delete point
The point is deleted.


16.2 Measurement points / position manual measurement point
17 Hot spot and cold spot
In terms of function and operation, the hot spot and cold spot correspond to the measurement points (see Section 16 ff) and are to be used in the same way.
Add Hot spot
Hot spot (SH) shows the hottest point.
Add Cold spot
Cold spot (SC) shows the coldest point.


18.0 Activate / deactivate horizontal line measurement
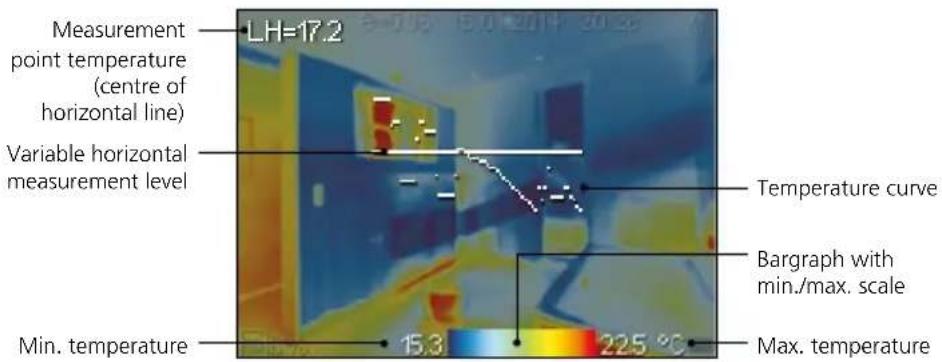
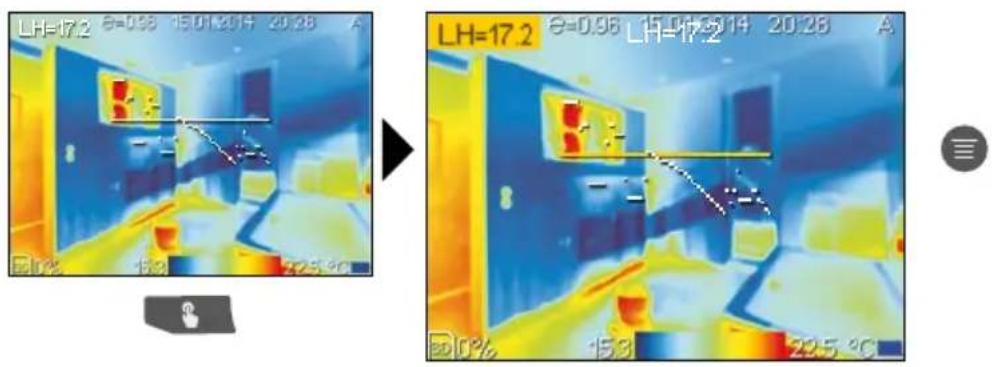
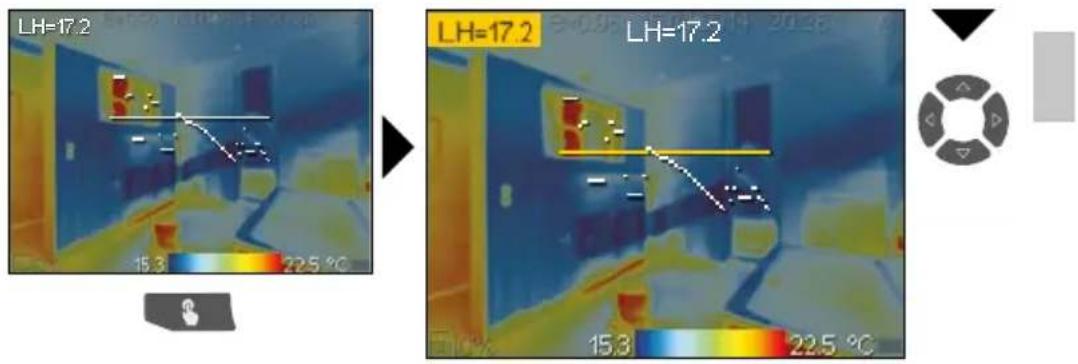
Horizontal line measurement determines the temperature of an object along a flexible horizontal line on the display. It graphically displays particularly small temperature differences by means of a graph when the colour nuances of the IR image cannot be sufficiently distinguished.
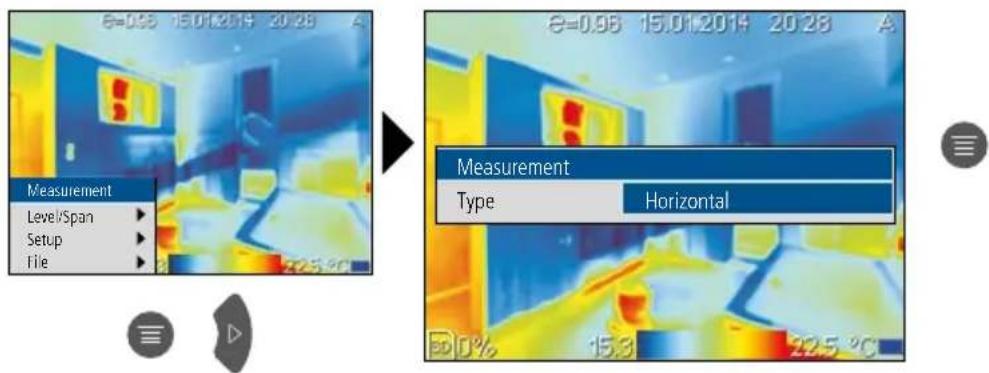

All added measurement points, lines and areas are removed by selecting „None“.
18.1 Horizontal line measurement / arrangement
The horizontal line is at 120 (display 240 lines). The bargraph defines the limits of the set min./max. temperature range (see chapter 21). The dynamic temperature curve visualises even the smallest changes in temperature within that temperature range, especially if the colours of the IR image do not provide sufficient differentiation. The temperature curve only covers the min./max. temperatures shown in the bargraph.
18.2 Horizontal line measurement / parameters
Emissivity
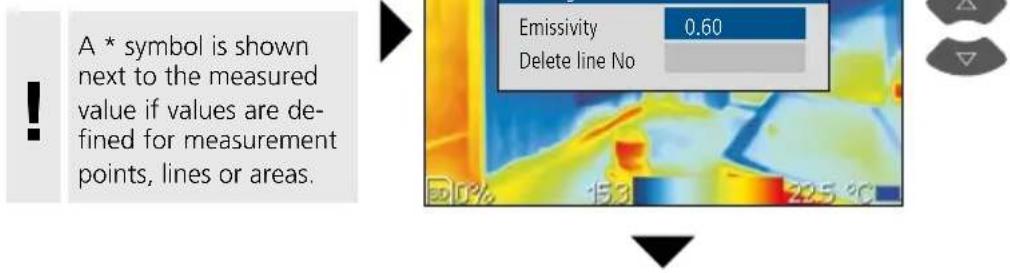
Set emissivity for the horizontal line (LH). Refer to Section 11.1.
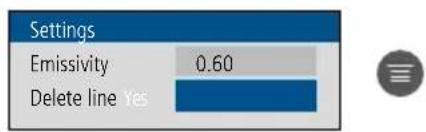
Delete line
The line is deleted.
18.3 To position horizontal lines
19 Activate / deactivate vertical line measurement
Vertical line measurement works just like horizontal line measurement (see chapter 18 ff.) and is used in the same manner.

All added measurement points, lines and areas are removed by selecting „None“.
20.0 Activate / deactivate area measurement
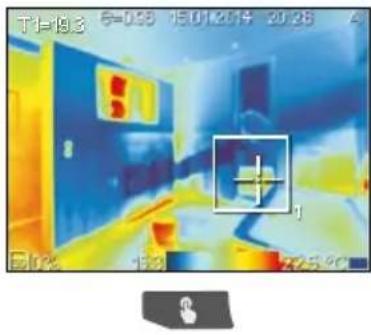
Up to three measuring surfaces can be set at one time. They can be assigned measurement-specific parameters as well as the following properties: maximum temperature, minimum temperature, average temperature.

All added measurement points, lines and areas are removed by selecting „None“.
20.1 Area measurement / parameters

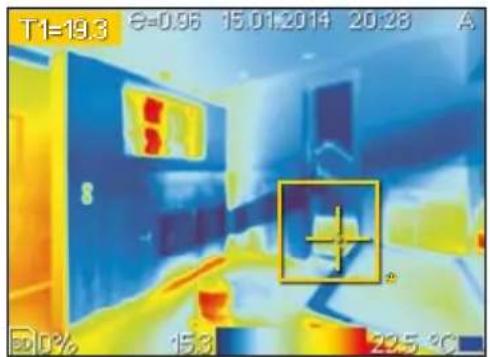

Emissivity
Set emissivity for area 1 (T1). Refer to Section 11.1.

A * symbol is shown next to the measured value if values are defined for measurement points, lines or areas.

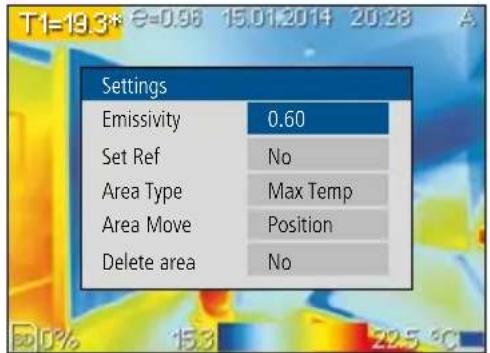


Set Ref
The temperature of area 1 (T1) shows the reference temperature (R). Refer to Section 10.2.
| Settings | |
| Emissivity | 0.60 |
| Set Ref | Yes |
| Area Type | Max Temp |
| Area Move | Position |
| Delete area | No |

Area Type
Max Temp Highest temperature within the measurement area
Min Temp Lowest temperature within the measurement area
Avg Temp Average temperature within the measurement area
| Settings | |
| Emissivity | 0.60 |
| Set Ref | No |
| Area Type | Max Temp |
| Area Move | Position |
| Delete area | No |

Area Move
Position The position can be moved with the arrow buttons
Size The size of the field can be changed with the arrow buttons
| Settings | |
| Emissivity | 0.60 |
| Set Ref | No |
| Area Type | Max Temp |
| Area Move | Position |
| Delete area | No |

Delete area
The area is deleted.
| Settings | |
| Emissivity | 0.60 |
| Set Ref | No |
| Area Type | Max Temp |
| Area Move | Position |
| Delete area | Yes |

21 Manual temperature range
In manual settings mode, the temperature range is no longer set automatically based on the measured min./max. values but rather determined on the basis of manual values. Switch auto / man, see Section 9
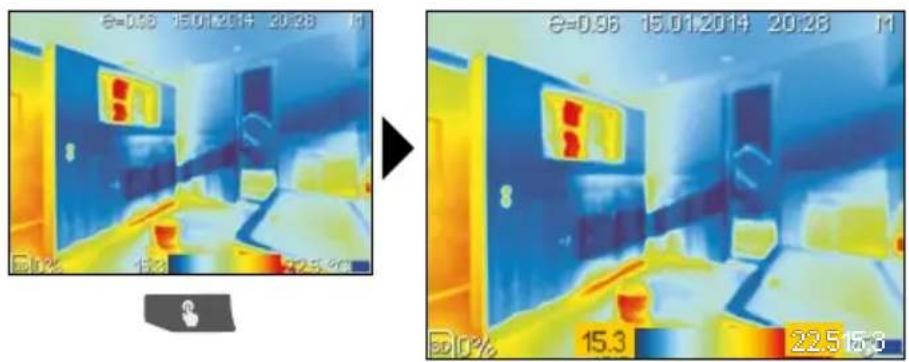
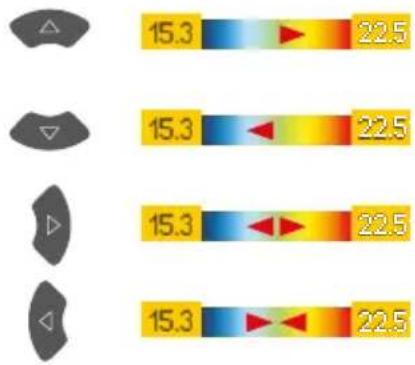
The min/max values (level) are increased simultaneously.
The min/max values (level) are decreased simultaneously.
The min/max temperature range (span) is increased.
The min/max temperature range (span) is decreased.
bar
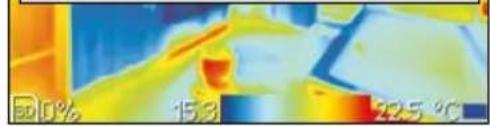
| Category | Value | |---|---| | Top Left | 15.3 | | Top Right | 22.5 | | Bottom Left | 15.3 | | Bottom Right | 22.5 | | Bottom Right | 15.3 |22 Colour ranges IR image
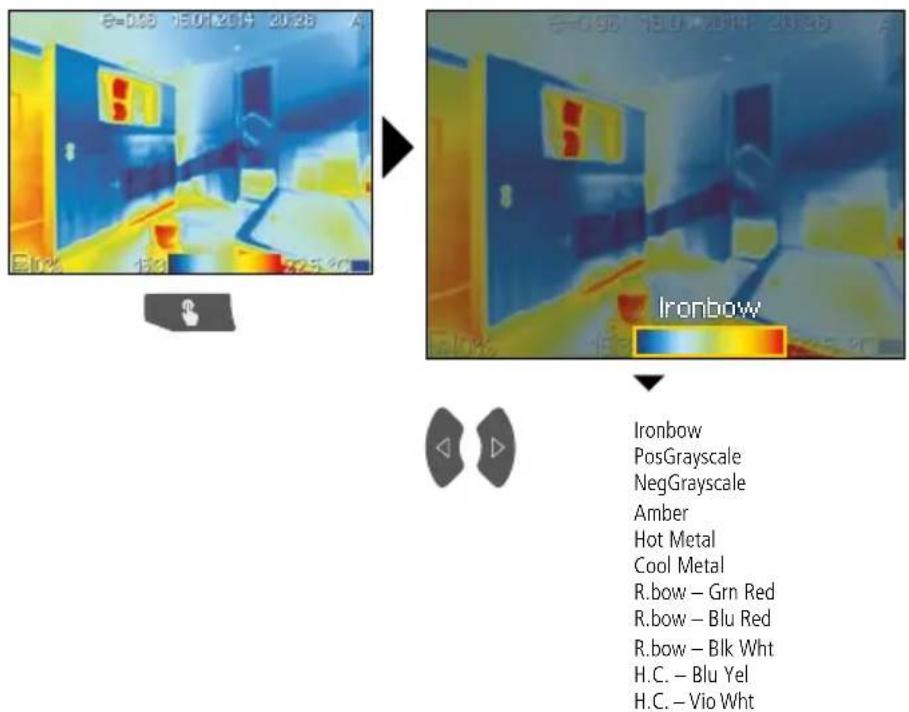
You can choose from several standard colour ranges to represent the measured infrared temperatures. Depending on the colour palette, the measured temperatures are adjusted within the current image section and displayed in the respective colour space. The bargraph for the respective minimum/maximum temperatures of the entire image serves as a reference for the corresponding temperature/colour mapping.
23 Image modes
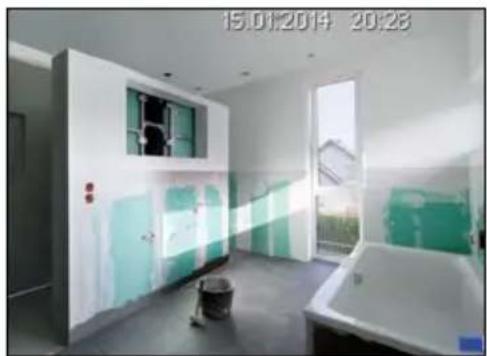
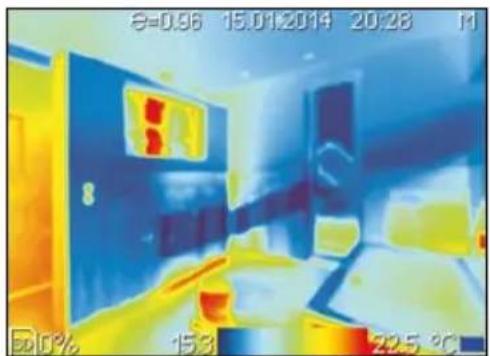
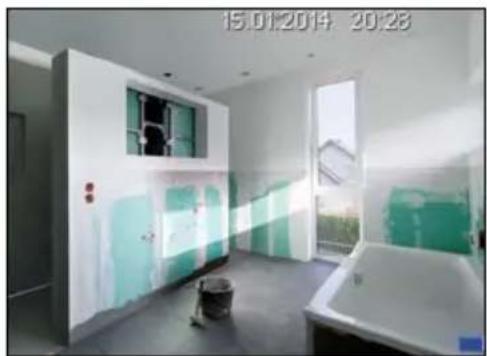
There are 2 image modes to choose from.
natural_image
Thermal imaging view of a room interior with heat signatures and temperature scale (no readable text or symbols)IR image Digital image
natural_image
Interior view of a modern bathroom with bathtub, toilet, and wall-mounted{(no visible text or symbols)
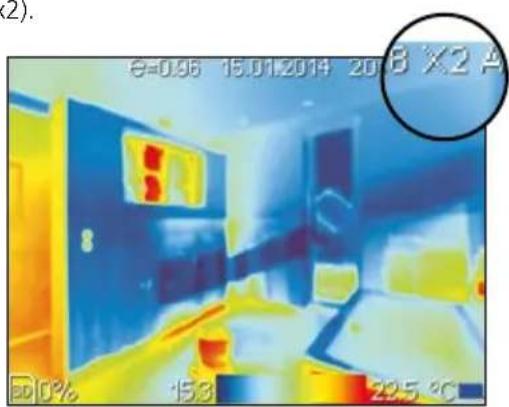
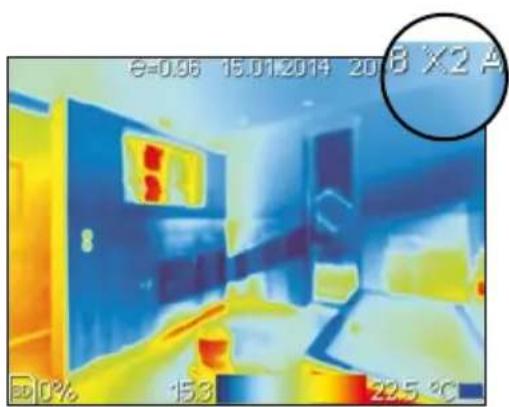
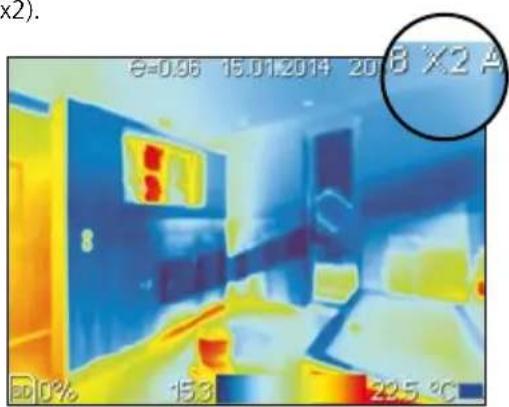
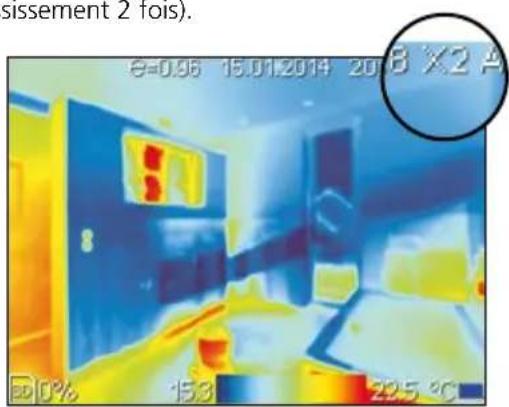
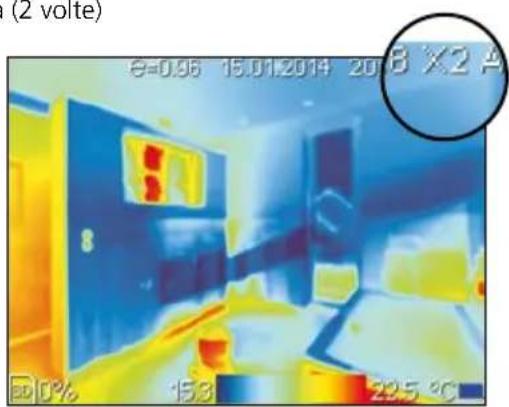
24 Zoom
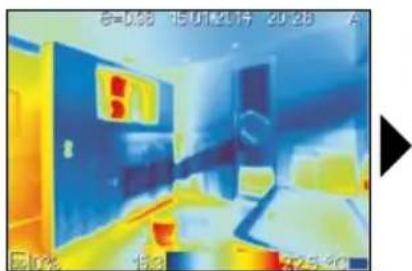
The view can be zoomed (x2).
natural_image
Thermal imaging view of a room interior with heat signatures and furniture (no readable text or symbols)
25 Camera focus
In addition to the basic settings in the measuring tool, the camera focus and the shutter function (image calibration) play an essential role in achieving high-quality thermography results. You should focus on the measured object as well as possible so that the outlines and contours are clearly visible on the display.
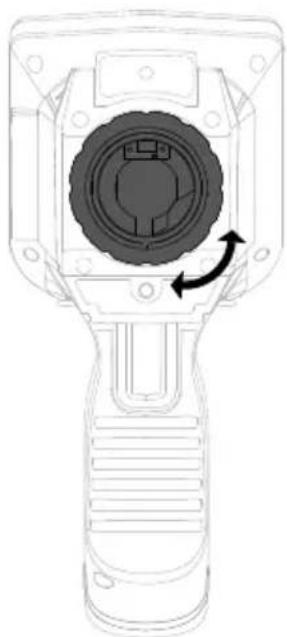
natural_image
Technical line drawing of a handheld device with a circular component and directional arrow (no text or symbols)26.0 Media gallery / playback mode
In the media gallery, you can access all image data recorded with the thermal camera. You can access the media gallery either via the menu or via hot key. To close the media gallery, press the „ESC“ hot key.
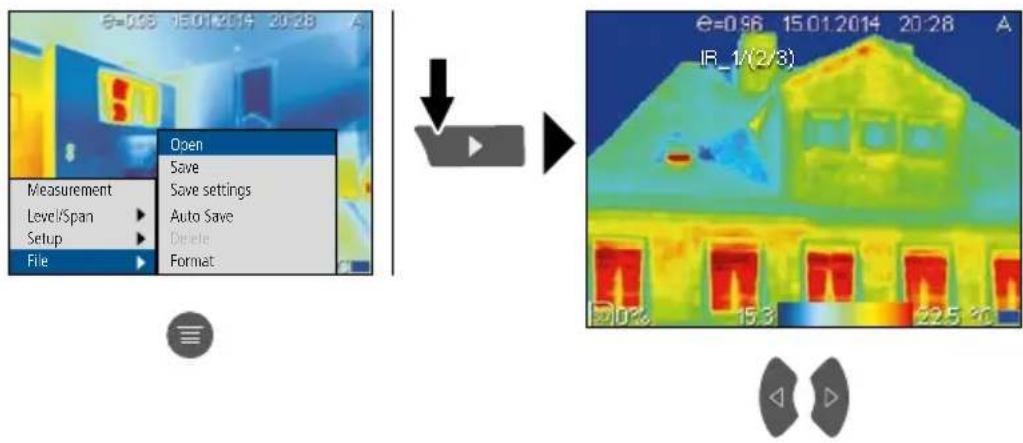
If the „Trigger" button is set to „IR/Digital", you can use it to switch between the IR and the corresponding digital image in playback mode. The display will remain blank if no IR or digital image is available and „No IR Image" or „No Digital Image" will be shown.
26.1 Image recording
Image recordings of any measurement situation can be created for subsequent documentation in the menu or with the „Trigger“ button.
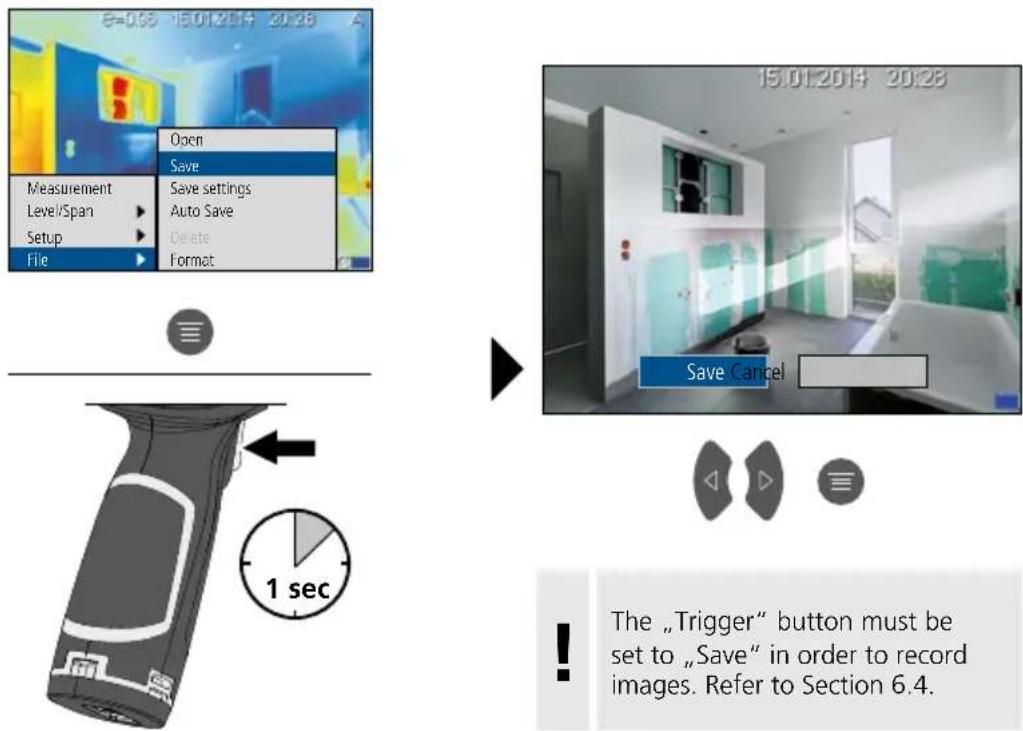
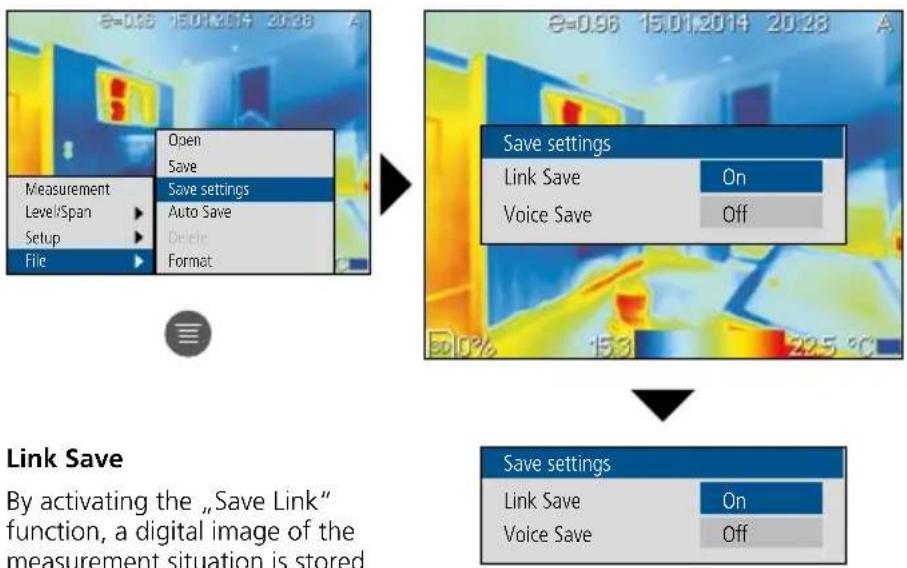
26.2 Recording settings
flowchart
graph TD
    A["Start"] --> B["Measurement"]
    B --> C["Level/Span"]
    C --> D["Setup"]
    D --> E["File"]
    E --> F["Open"]
    E --> G["Save"]
    E --> H["Save settings"]
    H --> I["Auto Save"]
    H --> J["Delete"]
    H --> K["Format"]
    L["Start"] --> M["Save settings"]
    M --> N["Link Save"]
    M --> O["Voice Save"]
    M --> P["On"]
    M --> Q["Off"]
    R["End"] --> S["Save settings"]
    S --> T["Link Save"]
    S --> U["Voice Save"]
    S --> V["On"]
    S --> W["Off"]
Link Save
By activating the „Save Link“ function, a digital image of the measurement situation is stored together with an IR recording.
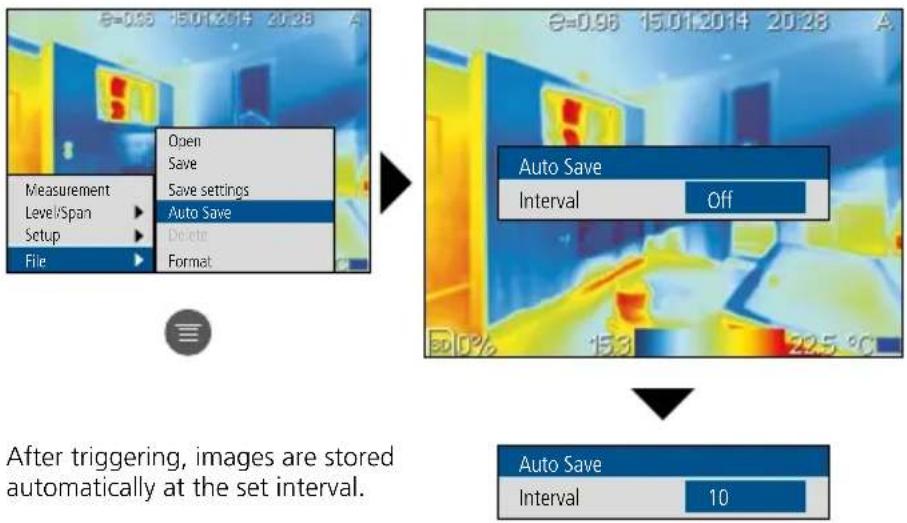
26.4 Automatic recording
flowchart
graph TD
    A["Before Triggering Images"] --> B["After Setting: Images are stored automatically at the set interval."]
    B --> C["Auto Save Interval Off"]
    C --> D["After Setup: File, Measurement, Level/Span, Setup, File"]
After triggering, images are stored automatically at the set interval.
26.5 To delete recording
Images can only be deleted in playback mode. Refer to Section 26.0.
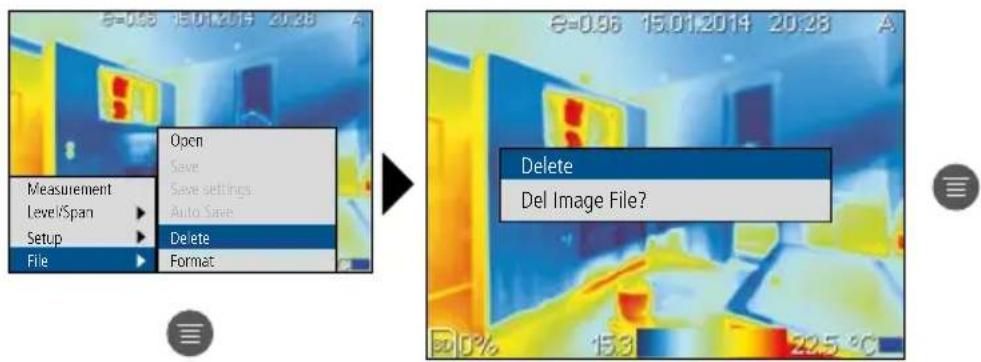

Press the „ESC“ button to cancel.
26.6 To format SD card
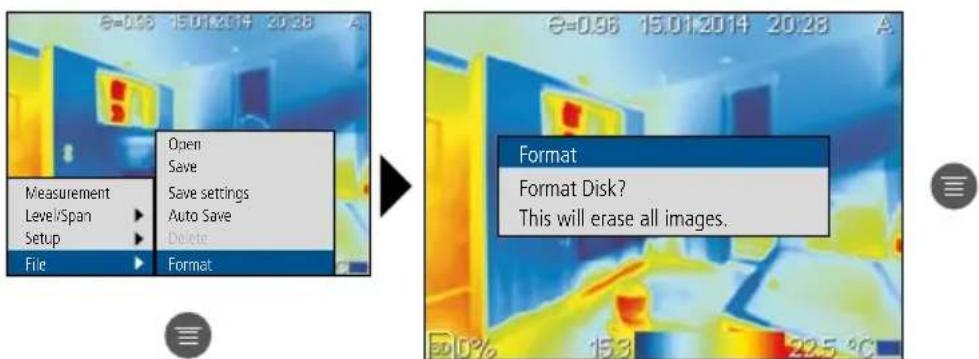

Press the „ESC“ button to cancel.
27 Target laser
The target laser makes area-specific measurements easier by facilitating pinpointing. The target laser can be assigned to the „Trigger“ button in the menu.
28 USB connection
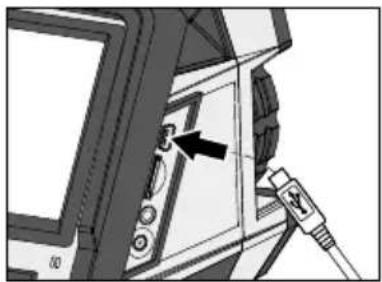
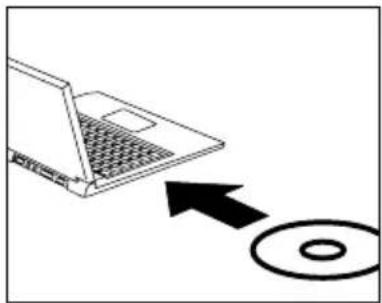
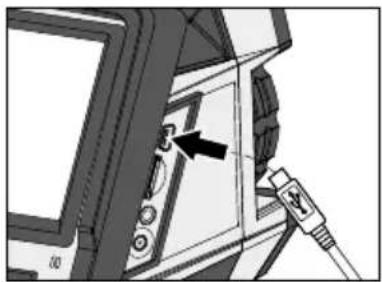
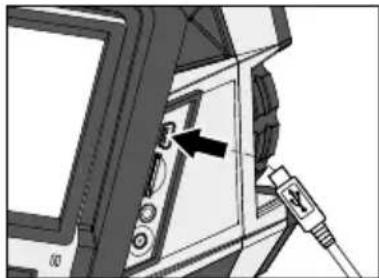
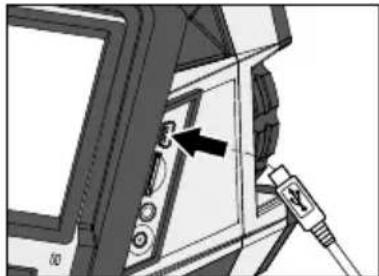
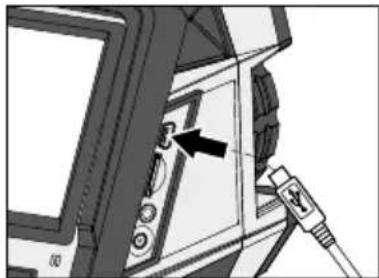
With the software provided on the CD it is possible to transfer the recorded data to a PC and to use the data for further processing and documentation. Load the CD in the drive and follow the installation routine. After successful installation, start the application. Connect one end of the supplied USB cable to the mini-USB port of the device and the other end to a free USB port on your computer. For further information on how to use the software, refer to the Help function that contains a detailed description of the functions.
It is not necessary to install a driver. The software operates under Windows XP / 7 and 8.
natural_image
Line drawing of a laptop with an arrow pointing to a CD/DVD (no text or symbols present)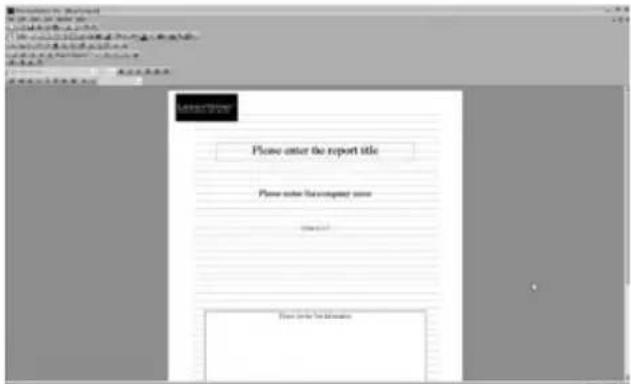
natural_image
Close-up of a computer monitor with an attached cable showing a switch (no text or symbols visible)29 Instructions for maintenance
- Perform the task at a location that is clean and free of dust and water
- Switch off the camera, remove the battery
– Earth to protect from static charges - Do not touch the lens
– Warranty expires in the case of improper handling
| Technical data Subject to technical alterations. 01.14 | |
| IR sensor 160 x 120 pixel resolution; | uncooled microbolometer 8-14 μm |
| IR optics Germanium interchangeable lens25° x 19° FOV,2,73 mrad IFOVmanual focus 0.4 m min. | |
| Thermal sensitivity 0,1 °C, 100 mK NETD | |
| Precision ± 2°C or ± 2% of measured value | |
| Measurement range -20 °C ... 350 °C | |
| Display 3,5" colour TFT display | |
| Image modes Infrared, Digital | |
| Image function 1-2x digital zoom | |
| Digital camera Resolution: 640 x 480 pixels | |
| Format JPEG format, max. 640 x 480 pixels | |
| Memory function Micro-SD card up to 16 GB | |
| Target Laser Laser class 2, < 1 mW, 635-650 nm | |
| Ports USB, micro-SD, video | |
| Protection class IP54, drop test 2 m, | Impact 25g (IEC60068-2-29)Vibration 2g (IEC60068-2-6) |
| Power supply / charging time /Operating time | Li-lon pack battery 7.4V / 2.0Ah /approx. 7 hours / approx. 3 hours per battery |
| Dimensions 298 mm x 104 mm x 149 mm | |
| Weight | 1,1 kg (incl. battery pack) |
General safety instructions
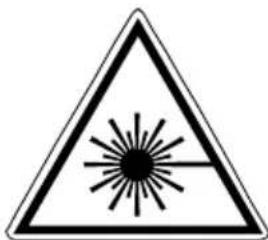
Caution: Do not look directly into the beam. Lasers must be kept out of reach of children. Never intentionally aim the device at people.
EU directives and disposal
This device complies with all necessary standards for the free movement of goods within the EU.
This product is an electric device and must be collected separately for disposal according to the European Directive on waste electrical and electronic equipment.
Further safety and supplementary notices at:
www.laserliner.com/info

3 Li-ion-occupack vervangen
natural_image
Diagram of a device with a lock icon and directional arrow, showing internal components without any text or symbols.natural_image
Diagram of a door panel with control buttons and an attached sensor device (no text or symbols visible)5 Hoofdmenu
$$ R = 3 0. 0 ^ {\circ} C $$
$$ S 1 = 3 5. 9 ^ {\circ} \mathrm{C} $$
natural_image
Thermal imaging view of a room interior with heat signatures and temperature scale (no readable text or symbols)natural_image
Interior view of a modern bathroom with bathtub, toilet, and window (no visible text or symbols)
24 Zoom
natural_image
Thermal imaging view of a room interior with heat signatures and furniture (no readable text or symbols)
25 Camerafocus
natural_image
Technical line drawing of a handheld device with a circular component and directional arrow (no text or symbols)26.0 Mediagalerij / weergavemodus
natural_image
Diagram showing a laptop connected to a CD/DVD drive (no text or symbols present)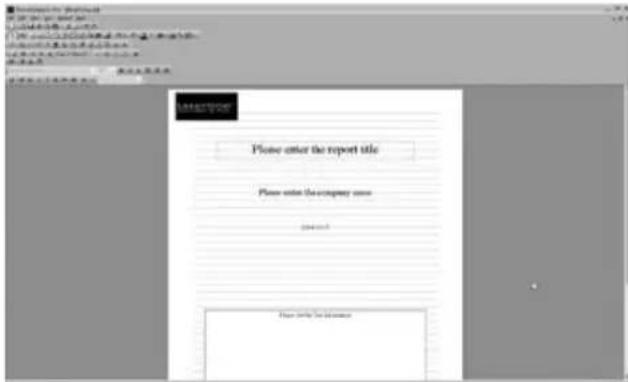
natural_image
Diagram of a computer monitor with an attached cable showing the cable connector (no text or symbols present)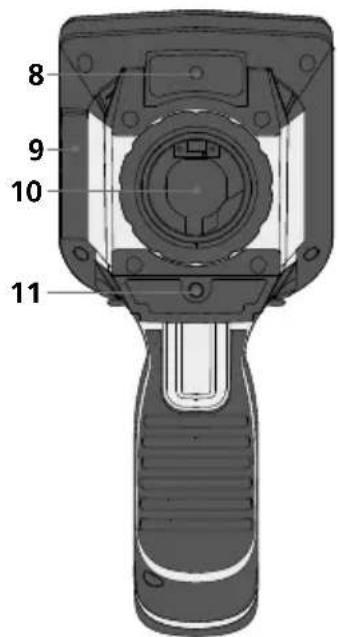
natural_image
Diagram of a handheld device with internal components and an open lock icon, showing no text or symbols.
natural_image
Diagram of a door panel with control buttons and an attached sensor device (no text or symbols visible)5 Menu principal


natural_image
Thermal imaging view of a room interior with heat signatures and temperature scale (no readable text or symbols)natural_image
Interior view of a modern bathroom with bathtub, toilet, and window (no visible text or symbols)
24 Zoom
natural_image
Thermal imaging view of a room interior with heat signatures and furniture (no readable text or symbols)
natural_image
Technical line drawing of a handheld device with a circular component and directional arrow (no text or symbols)natural_image
Diagram showing a laptop connected to a CD/DVD drive (no text or symbols present)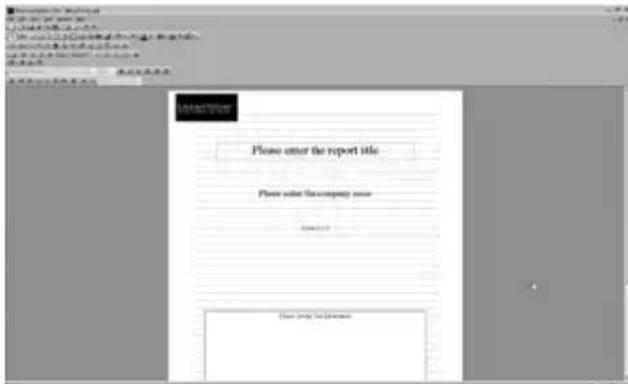
natural_image
Close-up of a computer monitor with an attached cable and a black arrow pointing to the switch (no text or symbols visible)natural_image
Warning symbol with a triangular triangle containing a central sunburst pattern (no text or numbers)Rayonnement laser!
natural_image
Diagram of a handheld device with internal components and an open lock icon, showing no text or symbols.natural_image
Diagram of a door panel with control buttons and an attached sensor device (no text or symbols visible)5 Menu principale
17 Hot spot e Cold spot
bar
| Category | Value | |---|---| | Top Left | 15.3 | | Top Right | 22.5 | | Bottom Left | 15.3 | | Bottom Right | 22.5 | | Bottom Right | 15.3 | | Bottom Left (Right) | 22.5 |natural_image
Thermal imaging view of a room interior with heat signatures and temperature scale (no readable text or symbols)natural_image
Interior view of a modern bathroom with bathtub, toilet, and window (no visible text or symbols)
24 Zoom
natural_image
Thermal imaging view of a room interior with heat signatures and furniture (no readable text or symbols)
25 Fuoco telecamera
natural_image
Technical line drawing of a handheld device with a circular component and directional arrow (no text or symbols)natural_image
Diagram showing a laptop connected to a CD with an arrow indicating data transfer (no text or symbols present)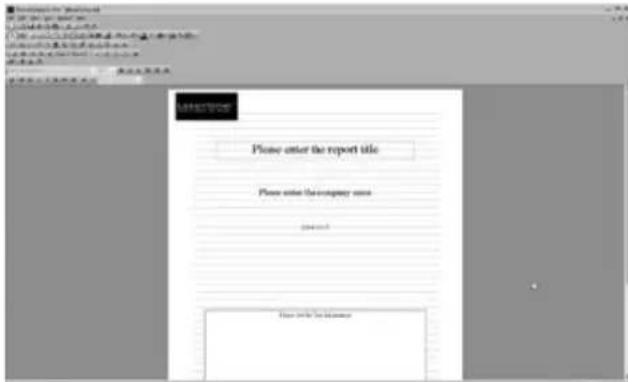
natural_image
Diagram of a computer monitor with an attached cable showing the cable connector (no text or symbols present)natural_image
Illustration of a laser microscope device with a colorful thermal display on screen, set against a blurred background (no text or symbols visible)SERVICE
Umarex GmbH & Co. KG
- Laserliner -
- Hauptmenü
- Zoom
- Kamerafokus
- Mediengalerie / Wiedergabemodus
- Function / Application
- Standard measurement view
- Main menu
- Replace li-ion battery
- Inserting micro-SD card
- Main menu
- General settings: System settings
- To set menu language DE / GB / FR / ES / IT / PT / RU
- Trigger
- Auto power off
- General settings: Date / Time
- Measurement-specific settings: Measurement
- Add measurement points
- Add Hot Spot
- Add Cold Spot
- Activate horizontal line measurement (LH)
- Activate vertical line measurement (LV)
- Add measurement areas
- Measurement-specific settings: Temperature range A / M
- Auto?
- Temperature range / Auto (A)
- LIS?
- Temperature range / manual (M)
- Measurement-specific settings: Measurement settings
- Ambient temperature Temperature
- To set reference temperature
- Measurement-specific settings: Setup
- Emissivity coefficient
- To set individual emissivity
- T Correct
- Correction of ambient climatic conditions
- 11.3
- HumidityDistance
- TReflect
- Reflection temperature
- Temperature alarm
- Isothermal function
- System Info
- Fact Default
- To select target objects
- Activate / deactivate measurement points
- Measurement points / parameters
- Emissivity
- Set Ref
- Delete point
- Measurement points / position manual measurement point
- Hot spot and cold spot
- Activate / deactivate horizontal line measurement
- Horizontal line measurement / arrangement
- Horizontal line measurement / parameters
- Delete line
- To position horizontal lines
- Activate / deactivate vertical line measurement
- Activate / deactivate area measurement
- Area measurement / parameters
- Area Type
- Area Move
- Delete area
- Manual temperature range
- Colour ranges IR image
- Image modes
- Camera focus
- Media gallery / playback mode
- Image recording
- Link Save
- To delete recording
- Target laser
- USB connection
- Instructions for maintenance
- General safety instructions
- EU directives and disposal
- Li-ion-occupack vervangen
- Hoofdmenu
- Camerafocus
- Mediagalerij / weergavemodus
- Menu principal
- Menu principale
- Hot spot e Cold spot
- Fuoco telecamera
Brand : Laserliner
Model : ThermoXplorer Pro
Category : Surveillance Camera