
PCSU200 - Oscilloscope VELLEMAN - Free user manual and instructions
Find the device manual for free PCSU200 VELLEMAN in PDF.
| Product type | USB oscilloscope |
| Brand | Velleman |
| Model | PCSU200 |
| Dimensions | 100 x 100 x 35 mm |
| Weight | Approx. 200 g |
| Power supply | USB port (500 mA) |
| Bandwidth | 2 channels, DC to 12 MHz ± 3 dB |
| Input impedance | 1 MΩ / 30 pF |
| Max input voltage | 30 V (AC + DC) |
| Resolution | 8 bits |
| Sampling frequency | 250 Hz to 25 MHz |
| Recording length | 4,000 samples/channel |
| Time base | 0.1 µs to 500 ms/div |
| Input range | 10 mV to 3 V/div |
| Function generator | Sine 0.005 Hz to 1 MHz, square/triangular 0.005 Hz to 500 kHz, amplitude 100 mVpp to 10 Vpp |
| Spectrum analyzer | FFT 2048 lines, range 0-120 Hz to 12 MHz |
| Software | PcLab200 (Windows XP/Vista/7 32/64-bit) |
| Connectivity | USB 1.1 or 2.0 |
| Safety | Use an isolation transformer if necessary; max voltage between probe and ground: 30 V |
| Maintenance | Clean with a dry cloth; avoid moisture |
| Included accessories | USB cable, probe (standard) |
Frequently Asked Questions - PCSU200 VELLEMAN
User questions about PCSU200 VELLEMAN
0 question about this device. Answer the ones you know or ask your own.
Ask a new question about this device
Download the instructions for your Oscilloscope in PDF format for free! Find your manual PCSU200 - VELLEMAN and take your electronic device back in hand. On this page are published all the documents necessary for the use of your device. PCSU200 by VELLEMAN.
USER MANUAL PCSU200 VELLEMAN
CH1 CH2on LED
CH1
on LED CH2

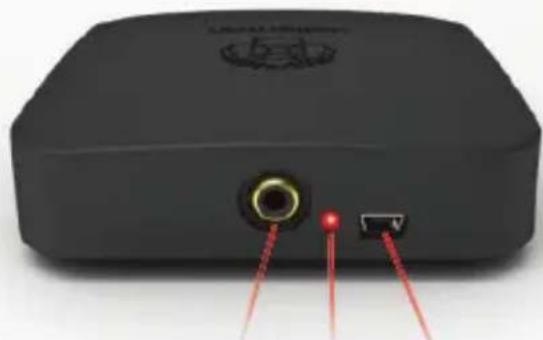
Out USB LED
English :
Welcome....4
Safety and warnings....5
Install the software....5
Hardware connection & Starting the software 6
The Function generator module 7
The Oscilloscope module 8
The Spectrum analyser module....9
The Transient recorder module 10
Bode plot module....11
Français:
Introduction....12
For the PCSU200 unit, a complete USB-powered lab-in-a-box!
Feature-packed PCLab200 software for two channel oscilloscope, spectrum analyzer, recorder, function generator and Bode plotter. Integrated signal wave editor and automated sequence generator, using file or external input.
The hardware is not necessary to evaluate the software in Demo mode.
General information
markers for amplitude/voltage and frequency/time input coupling: DC, AC and GND 8 bit resolution storage of display and data supply from USB port (500mA)* dimensions: 100x100x35mm / 3,9x3,9x1.4"
Spectrum analyser:
frequency range: 0 .. 120Hz to 12MHz linear or logarithmic timescale operating principle: FFT (Fast Fourier Transform) FFT resolution: 2048 lines FFT input channel: CH1 or CH2 zoom function
Transient recorder:
• timescale: 20ms/Div to 2000s/Div
• max record time: 9.4hour/screen
• automatic storage of data
• automatic recording for more than 1 year
• max. number of samples: 100/s
• min. number of samples: 1 sample/20s
Function generator
• frequency range: sine from 0.5Hz to 1MHz
- square and triangle from 0.5Hz to 500kHz extended waveform library
- amplitude range: 200mVpp to 8Vpp @ 1KHz// output impedance: 50ohm
Oscilloscope
• bandwidth: two channels DC to 12 MHz ±3dB
- input impedance: 1 Mohm / 30pF
• maximum input voltage: 30V (AC + DC)
• time base: 0.1μs to 500ms per division
- input range: 10mV to 3V/division
- readouts: True RMS, dBV, dBm, p to p, Duty cycle, Frequency...
• record length: 4K samples / channel
• sampling frequency: 250Hz to 25MHz
• sample history and digital grab function
Bode plotter
- Automated sync between oscilloscope and generator
• Frequency range: 1kHz, 10kHz, 100kHz, 1MHz
• Frequency start: 1Hz, 10Hz, 100Hz, 1kHz, 10kHz
* NOTE: it is NOT recommended to use an USB - HUB device, this can cause the software to stop working. SPECIFICATIONS ARE SUBJECT TO MODIFICATIONS - DLL available for own development - www.velleman.eu
SAFETY & WARNINGS

Instruments grounds are interconnected and connected to PC ground. Max. voltage between probe tip and ground: 30V AC+DC at all times! Before performing any measurement, make sure that the circuit is galvanically separated from the AC power (mains)! If necessary, use a safety isolation transformer.
How to install PC-LAB200 SOFTWARE?
Minimum system requirements :
Windows™XP/Vista/7 (*) 32 or 64bit•
VGA display card (1024x768 recommended)•
10MB free hard disk space.
Mouse or pointing device.
Free USB port (1.1 or 2.0)
Download the latest software version from www.velleman.eu
Type PCSU200 in the search box and check the download section.
- Download the PcLAB200_setup.zip file Unzip the fi les in a folder on your drive • Double click the "setup.exe" fi le An install wizard will guide you trough the complete installation procedure. Shortcuts to the Pc-Lab200 software can be installed.
(*) Note: You will need local Administrator privileges to successfully complete the installation, contact your system administrator for assistance. See also the "ReadME" file in the installed folder.
*Microsoft Windows™ XP/VISTA/7 (*) are registered trademarks

HARDWARE SET-UP
(CLOSE ALL PROGRAMS BEFORE CONTINUING)
USB driver install:
Connect your PCSU200 unit to a free USB port•
Follow the on screen driver installation procedure.
If Windows asks for Windows Update, select "not at this time"
- Install the driver from a specific location, then browse your drive and select the folder "PCSU200Driver". (press "next")
If Windows indicate "has not passed Windows logo testing..." select "Continue Anyway".
• After finishing, you can check the driver installation in the Device Manager list.
It is possible that the PC asks to "restart" for proper installation.
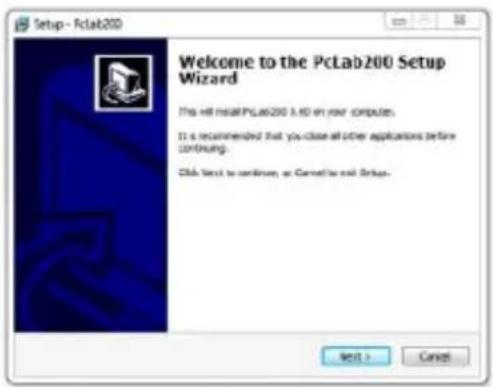
Starting the software :
Locate the Pc-Lab200 software shortcuts (programs.. Pc-Lab200 ...)

Click the icon to start the main program. "loading, please wait" should appear. Then the channel indicator LEDs must go ON. (*)
The main program automatically launches the Oscilloscope and generator screen, which is shown on the next pages. Should you receive an error (ex. If no unit is detected), disconnect and reconnect the USB cable and try again or, if you want to access the demo mode (no unit is needed):
- Click the Options menu, and select 'Hardware Setup' > demo mode
Note:
- At first time power-up, the oscilloscope will calibrate itself automatically. The actual screens can differ from the one shown in this manual.
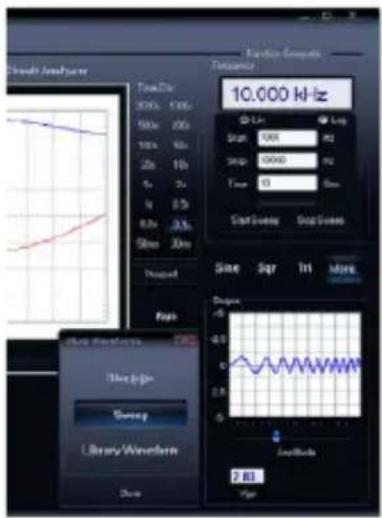
THE FUNCTION GENERATOR MODULE :
What? :
Most common wave-forms are accessible at the touch of a button. A library with special functions is provided, as well as a Wave Editor, to create virtually any kind of waveform.
How ? :
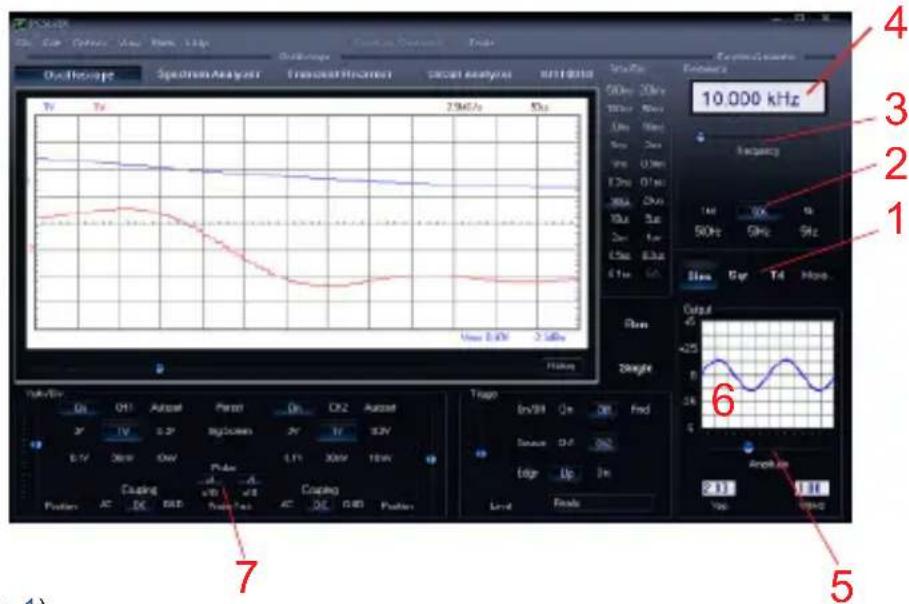
Click on the desired waveform (• 1).
- Select the desired frequency range (2).
- Set the exact frequency by sliding (3) or click the frequency readout (4) and enter a value. Adjust the amplitude (• 5)
• (6) shows a simulated preview of the output waveform
The 'More Functions'- button :
The 'More Functions'-button gives access to special purpose waveforms such as arbitrary waveforms, and frequency sweeps. It also gives access to the waveform library.
Note: The Probe test button (7) makes the generator output a signal, suitable for your scope probe calibration at X10 setting.
THE OSCILLOSCOPE MODULE :
What ? : The Oscilloscope module offers a feature-packed, easy to use digital storage oscilloscope.
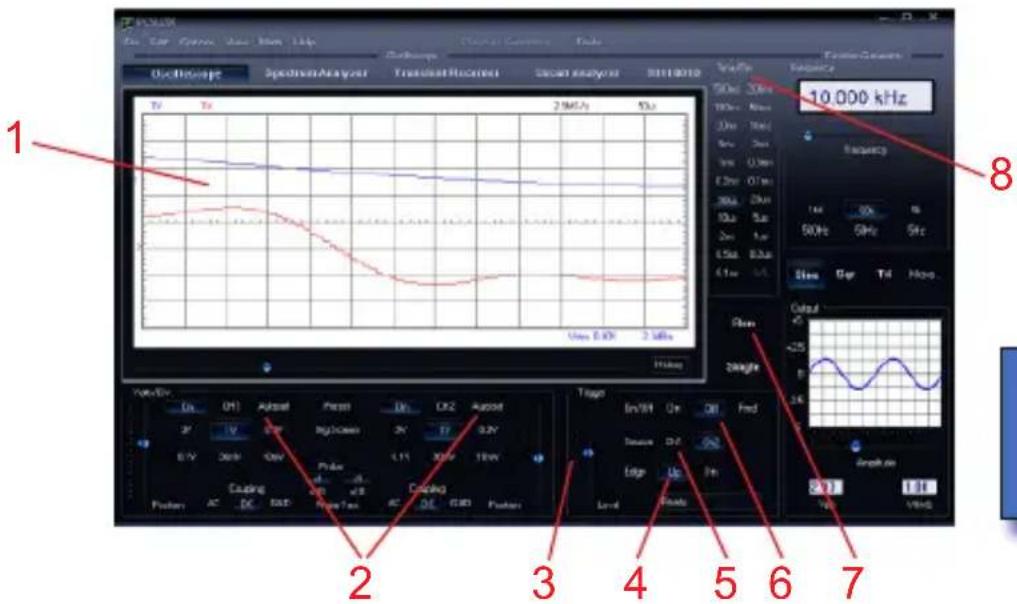
Channel On / Off and generator output are indicated by a LED on the unit.
How ? :
- Connect the circuit under test to the scope input (observe the max. input rating of the scope!) or connect to the generator output.
Start measuring with "trigger off" (• 6)
Press 'RUN' (• 7)
- Choose the desired channel and volts/div setting or press "Auto-set" (2)
- Choose the appropriate time/div setting (8)
To enable triggering :
Select trigger channel (• 5)
Select trigger edge (• 4)
Set trigger to 'ON' (• 6)
- Set trigger level by sliding (3). The trigger mark is displayed on the left hand side of the signal display (1)
THE SPECTRUM ANALYSER MODULE :
What ? : Powerful feature which allows visualization of the frequency spectrum of a signal, using FFT (Fast Fourier Transform) analysis.
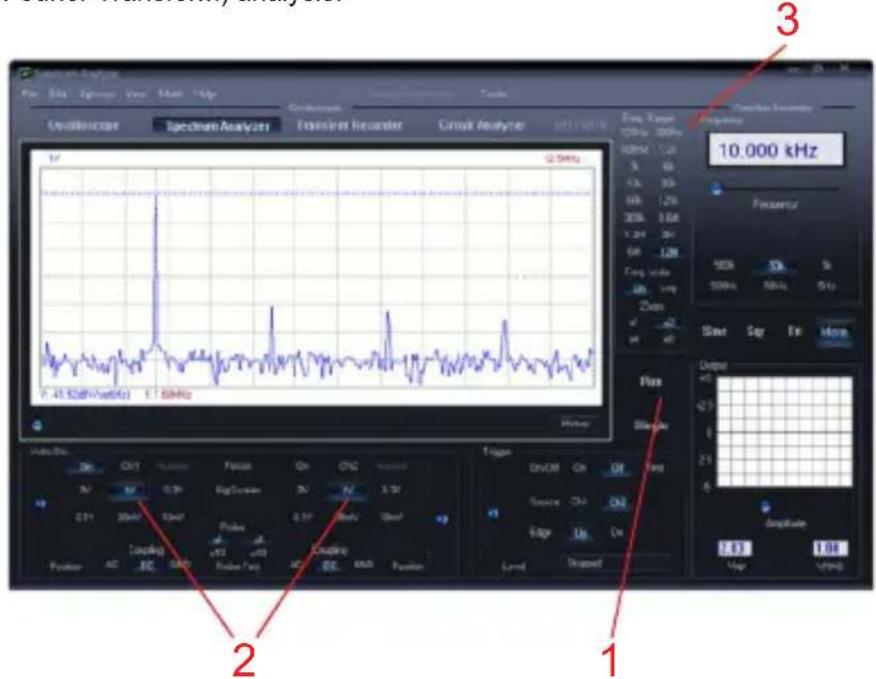
How ? :
- Connect the scope input to the circuit under test. (observe the max. input rating of the scope!) Or use the internal generator output.
First observe the signal on the scope screen (see previous page).
Check that the signal is not over the maximum of the screen.
Start the spectrum analyzer.
Press 'RUN' (• 1)
- Select the appropriate frequency range. Make sure your setting will capture any signal change of interest (3).
- If wanted set the appropriate channel and volts/div setting (2)
THE TRANSIENT RECORDER MODULE :
What? : Record occasional events and log slow changing processes automatically, e.g. battery charge cycles, temperature changes,... or track intermittent faults in electronic circuits. Automatic data storage allows over one year of continuous recording!
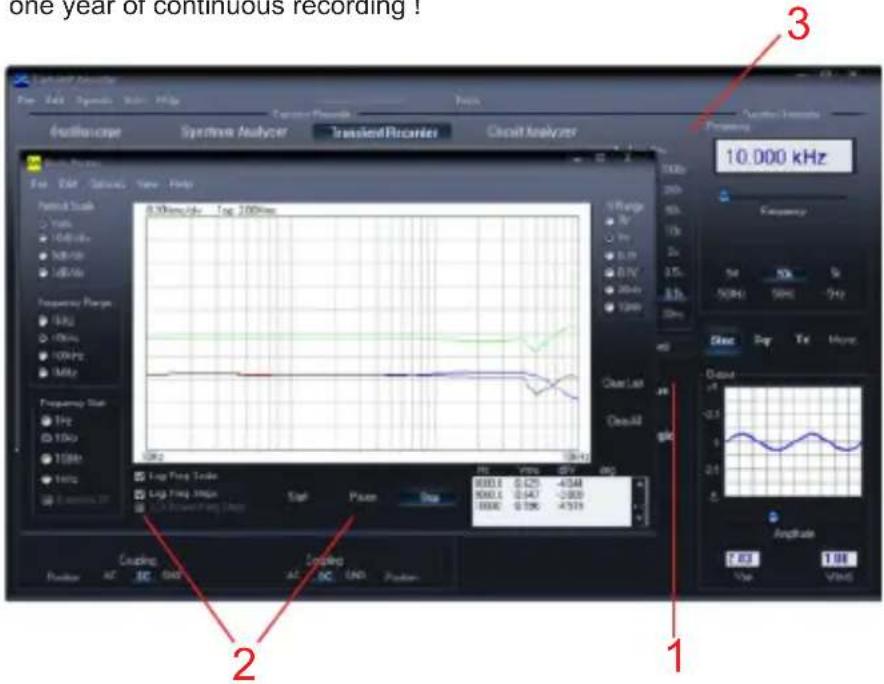
How ? :
- Connect the scope input to the circuit under test. (or the internal generator at a low frequency)
- Select the appropriate channel and volts/div (or volt range) setting (1).
- Select the appropriate time/division setting (3).
Press RUN (• 2) to start recording.
Press RUN again, to stop the measurement, or use the "Single" button to make a single screen measurement.
For continuous recording with auto-save to your HD, select 'AutoSave Data' from the 'File'-menu.
Notes:
During recording the screen can differ from the actual measurement.
Events happening between two sample acquisitions will be missed if a too slow time/div is set.
THE BODE PLOTTER MODULE :
What ? : Due to the unique scope and generator combination, an automated Bode plot function is possible. This results in a powerful tool for amplifier or filter measurements.
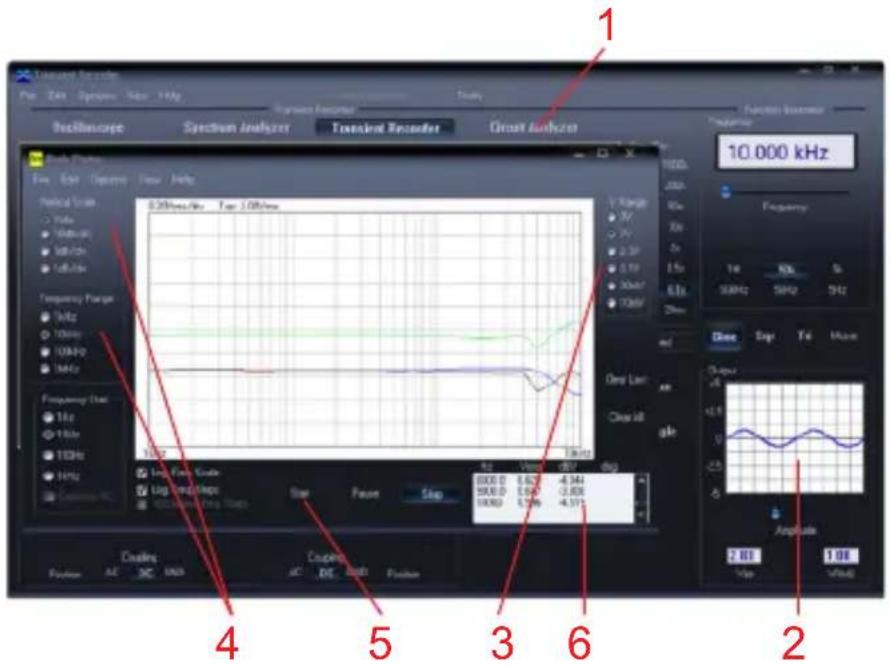
How ? :
Enable the Circuit Analyser window (• 1)
Connect the scope CH1 input to the output of the circuit or unit under test.
Connect the generator output to the input of the circuit or unit.
- Adjust the generator output (2) to a suitable level.
- Adjust the setting of the Bode plot module like Volt range (3) Volt scale, frequency start and stop range (4)...
- Press 'Start' (5) and observe the screen and measurement window (6) If the signal is out of the screen range, adjust the Voltage range or generator output level.
INTRODUCTION : LE MONDE DU Pc-LAB200
Abmessungen: 100x100x35mm•
Spektrumanalysator
- ENGLISH
- FRANÇAIS
- GENERAL INFORMATION
- SPECTRUM ANALYSER
- TRANSIENT RECORDER
- FUNCTION GENERATOR
- OSCILLOSCOPE
- BODE PLOTTER
- SAFETY & WARNINGS
- HOW TO INSTALL PC-LAB200 SOFTWARE
- MINIMUM SYSTEM REQUIREMENTS
- TYPE PCSU200 IN THE SEARCH BOX AND CHECK THE DOWNLOAD SECTION
- HARDWARE SET-UP
- (CLOSE ALL PROGRAMS BEFORE CONTINUING)
- USB DRIVER INSTALL
- STARTING THE SOFTWARE
- NOTE
- THE FUNCTION GENERATOR MODULE
- WHAT
- HOW
- THE 'MORE FUNCTIONS'- BUTTON
- THE OSCILLOSCOPE MODULE
- TO ENABLE TRIGGERING
- THE SPECTRUM ANALYSER MODULE
- THE TRANSIENT RECORDER MODULE
- NOTES
- THE BODE PLOTTER MODULE
- INTRODUCTION : LE MONDE DU PC-LAB200
- SPEKTRUMANALYSATOR
Brand : VELLEMAN
Model : PCSU200
Category : Oscilloscope