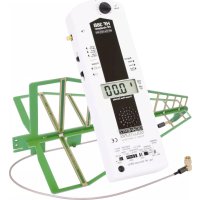
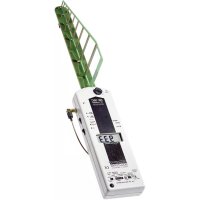
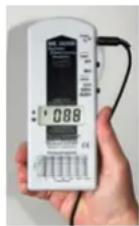
MK10 - Detector Gigahertz Solutions - Free user manual and instructions
Find the device manual for free MK10 Gigahertz Solutions in PDF.
User questions about MK10 Gigahertz Solutions
0 question about this device. Answer the ones you know or ask your own.
Ask a new question about this device
Download the instructions for your Detector in PDF format for free! Find your manual MK10 - Gigahertz Solutions and take your electronic device back in hand. On this page are published all the documents necessary for the use of your device. MK10 by Gigahertz Solutions.
USER MANUAL MK10 Gigahertz Solutions
Rev. 2.0 - 1010 / DRU00189
Danke!
We thank you for the confidence you have shown in buying this product. It allows for a qualified evaluation of the exposure caused by AC electric and AC magnetic fields according to the internationally recognized TCO guideline and the recommendations of the building biology.
In addition to this manual you can watch the tutorial videos on our website concerning the use of this meter.
Please read this manual carefully prior to using the meter. It contains important information concerning the safety, usage and maintenance of this meter.
Grazie!
natural_image
Two-panel image showing a person using a handheld device on a wall and a red table with a mounted device (no visible text or symbols)natural_image
Person using a handheld device to clean or install a digital kitchen appliance (no visible text or symbols)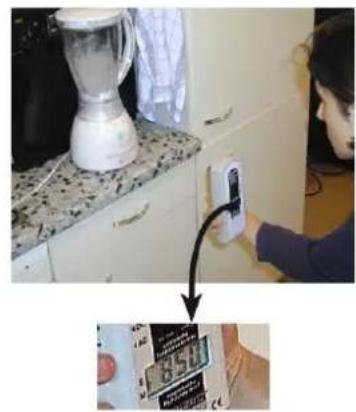
natural_image
Person installing a wall-mounted device on a kitchen appliance (no visible text or symbols)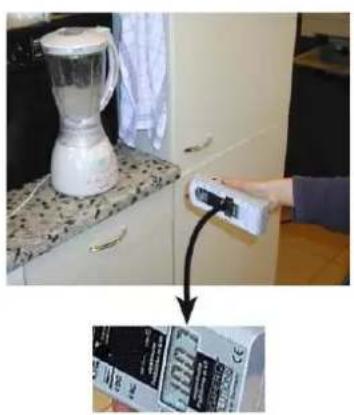
natural_image
Kitchen interior with a blender and a hand holding a control panel, showing a close-up of a product packaging (no visible text or symbols)
General Hints for Measuring
As the field strength increases when coming closer to sources of EMF pollution, it is possible to locate these by following the higher readings until reaching the emitting source. The tone signal provided facilitates this process. As fields (especially magnetic fields) can penetrate even massive construction material, the sources might even be located outside the building, e.g. high-tension power lines, electrified railway trails, transformers as well as neighbouring houses and apartments.
Ideally, all measurements are to be repeated during various times of the day and on different days of the week in order to identify fluctuations.
Measurement Instructions – Electric Fields
According to relevant guidelines (TCO etc.), the field meter should be connected to ground potential in order to obtain reliable, reproducible testing results.
Grounding the Field Meter:
Insert the plug of the enclosed grounding cable into the dedicated socket of the meter 1= and run the cable along the side of the case to the back (see picture). Make sure that neither the grounding cable nor the user's hand is in the front of the meter (falsifies the reading!).
Unvarnished metal piping for water, gas or heating is especially adequate for grounding with the grounding cable, if need be a small blank wire will help making the contact. A large nail in the wet ground of the garden is fine, too. Professionals can also use the earth contact of a wall socket.
Turn on the field meter and set it to "E" (ME 3840B: Set the filter to "50 Hz"). Keep the meter close to your body. The further away from the body it is held, or if it is even put down, the more the testing results tend to become distorted into the higher range. During testing please make sure that the person performing the survey, as well as anybody else present, is located behind the meter. Proceed as follows:
- Move slowly through the room to be measured. Stop frequently and take measurements pointing to all directions including ceiling and floor.
- Move into the direction of the highest reading in order to identify the field source.
- In places where people spend substantial amounts of time, such as in bed or at a workplace, check all directions as mentioned above until you have reached the maximum reading at the spot, where the body of the person would be located.
An EMR survey of sleeping areas should be conducted under "sleep conditions," with all electrical equipment turned on or off as you have it at night. Under certain circumstances the electric field strength might even be higher if these items are switched off!
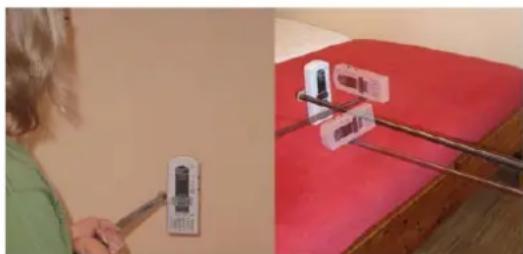
Some guidelines recommend the so-called "potential-free" measurement of electric fields, i.e. without needing to ground the meter. A potential-free measurement is, in principle, very adequate for the measurement of the total pollution. However, in order to obtain valid results, this method requires a great deal of know how, the use of a non-conductive holder (e.g. the PM2 by Gigahertz Solutions), three measurements in the three dimensional axes XYZ (see figure on the left) and the vectorial addition ^2 of their results.
natural_image
Two-panel image showing a person using a tool on a wall and another with a red tablecloth displaying a device (no visible text or symbols)Far more adequate for the most important task,
which is the identification of the sources of pollution, would be an earthed measurement, though, which is why this procedure is especially recommended for the private use. For more background information to potential-free measurements please see our website.
Recommended Exposure Limit AC Electric Field: Below 10 V/m, preferably below 1 V/m
(at 50/60 Hz for grounded measurement)
For potential-free measurement: below 1.5 pref. 0.3 V/m
Measurement Instructions – Magnetic Field:
Turn on the field meter and set the switch "Field Type" to "M" for AC magnetic field. (ME 3840B only: Turn the knob for the frequency filter to "50/60 Hz"). The field meter does not need to be grounded, persons present do not affect the testing results and there is no need to hold the meter close to your body. Proceed as follows:
- Move slowly through the room to be measured with special regard to the sleeping or working place.
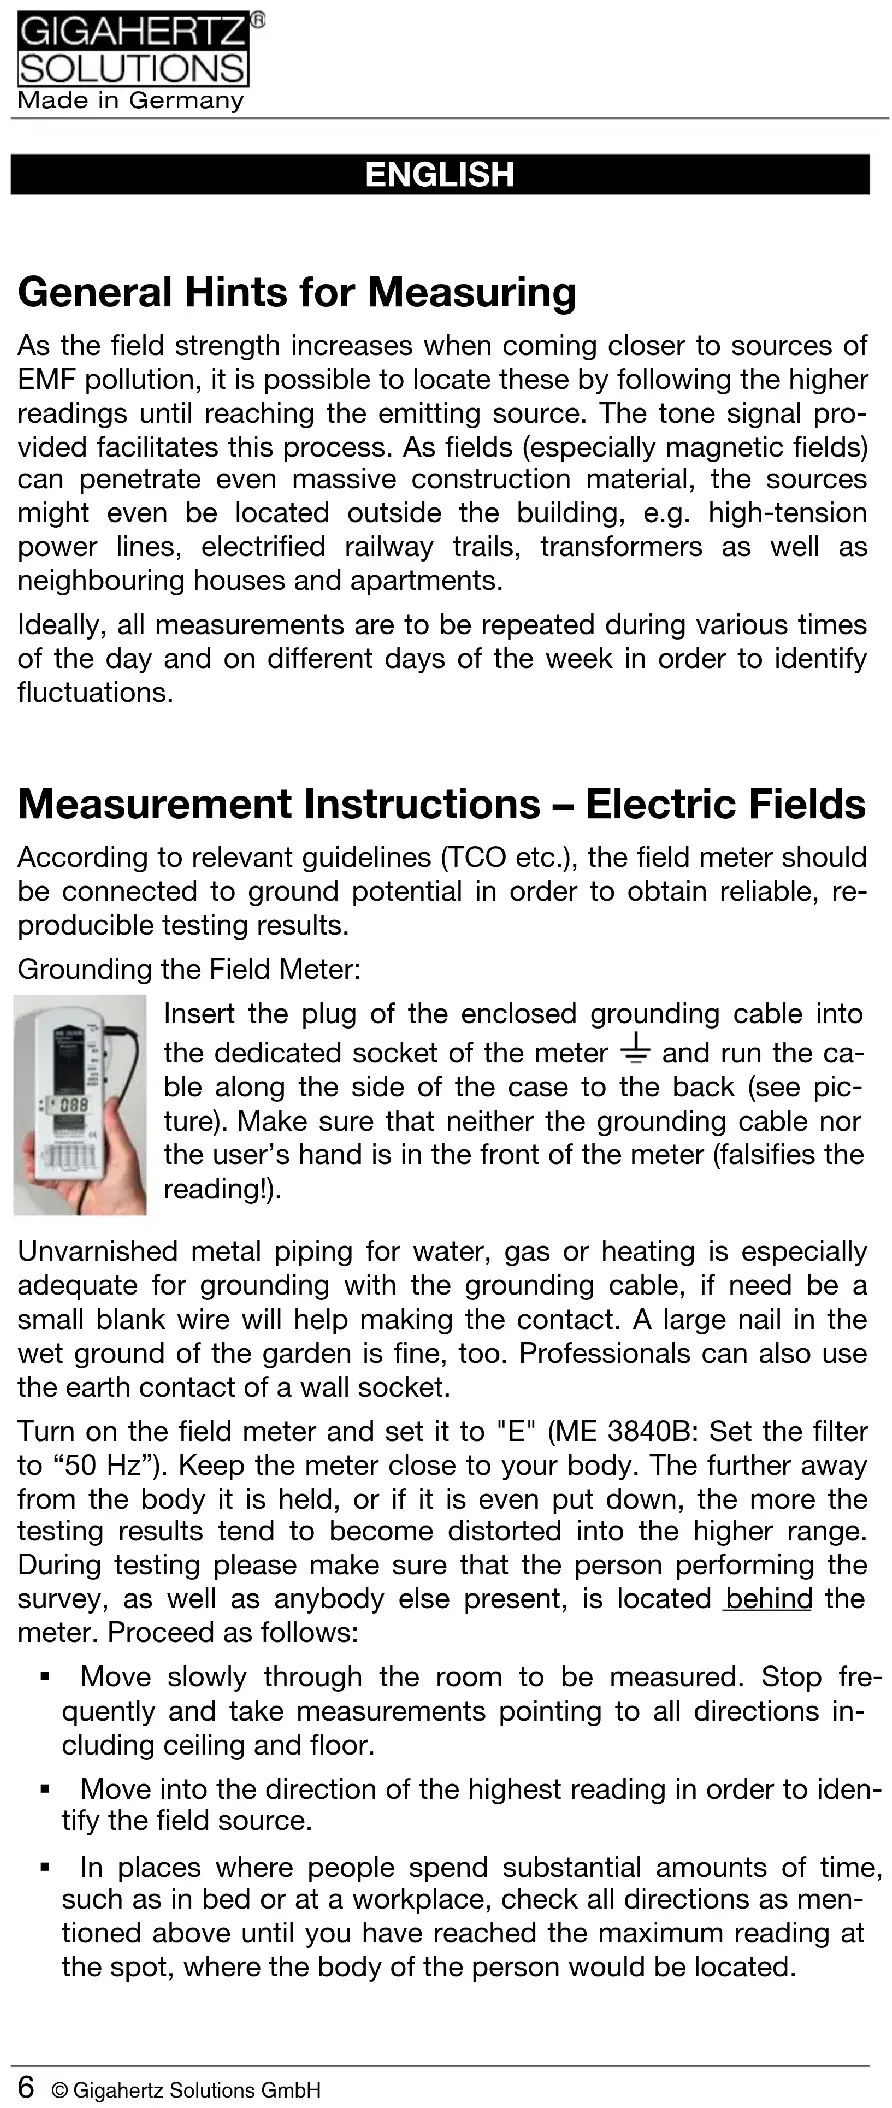
- There is no need to turn the meter into different directions like for the E-field, instead check all three orientations from time to time as shown in the following pictures.
- In practice it is usually sufficient to "rotate" the meter out of your wrist until you have the position / direction of the highest reading (fourth picture below). In this direction the meter shows the so-called "resulting" field strength resp. magnetic flux density.
natural_image
Kitchen appliance with a blender and a control panel, showing a close-up of its product (no visible text or symbols)
natural_image
Person using a power adapter on a kitchen appliance (no visible text or symbols)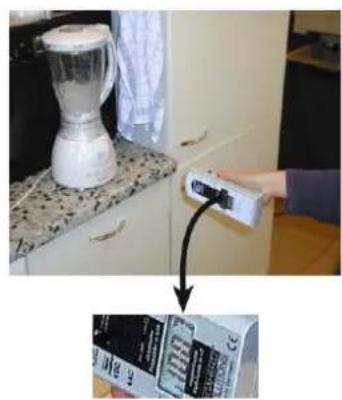
natural_image
Kitchen kitchen scene with a blender and a hand holding a control panel, showing a close-up of the food item (no visible text or symbols)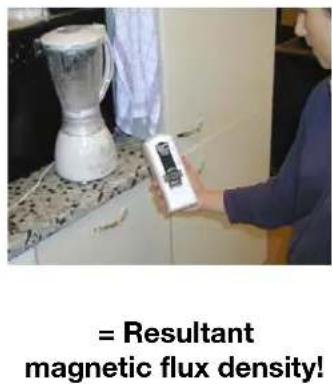
Please note:
- Quick movements induce short peaks of pseudo readings that have nothing to do with actual fields (due to the earth's static magnetic field)
- Let the display settle for 2 seconds after every change of direction.
Recommended Exposure Limit AC Magnetic Field: Below 200 nT, preferably below 20 nT
(Magnetic flux density at 50/60 Hz).
(Conversion nT to mG (Milligauss): 200 nT = 2 mG)
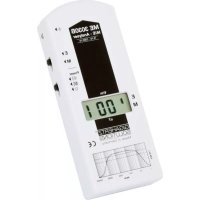
ME 3840B only: Frequency Analysis
AC fields are not only defined by their field strength, but also by the frequency with which the polarity of the field changes. The ME3840 B can separate the following common frequencies and frequency bands:
1) 5 Hz to 100 kHz Good for overall considerations.
2) 16.7 Hz Overhead railway wires in Germany, France, Norway, Austria, Sweden and Switzerland.
3) 50 Hz to 100 kHz Electric power grid and its harmonics.
4) 2 kHz to 100 kHz "Artificial harmonics" above 2 kHz (e.g. from many AC-adaptors, energy-saving bulbs, TV-sets). Corresponds to band 2 of the Swedish TCO guideline. A factor 10 lower safe limits are recommended for this range!
Battery, Auto-Power-Off, Low batt.
The meter is powered by a 9 V battery, situated in the battery compartment on the back of the meter.
The meter will automatically be shut off after 40 minutes of continuous use in order to save battery capacity.
When "Low. Batt." appears in the centre of the display, the field meter will be turned off after 3 min. in order to avoid measurement errors.
Possibilities of Remediation
If possible, increase the distance to the source of pollution
Correct "Plugging":
Switch the meter to "E" and place it between e.g. the bedside light and the pillow. Switch off light. Reverse direction of plug by 180^ and re-insert it. Logical: leave plug in the direction of lowest readings. This trick works best for an inline cable-switch of e.g. the lamp.
Use shielded socket-lines with two pole switch and shielded connection cables (for available versions check our website).
Install an automated “demand switch” in the house fuse box which cuts out electricity as soon as the last load is switched off and automatically reconnects as soon as electricity is needed again. As long as everything is switched off, there is no tension on the line and hence no pollution in the room. This is the most comfortable and effective measure you can take. Check www.gigahertz-solutions.com for most sophisticated and well reputed models.
It's easy to check for yourself whether a demand switch is a good investment for you (easiest in pairs):
- One person reads the meter on the bed to be inspected. Switch the meter to "E".
- The other person switches off the relevant fuses (one by one and different combinations)
- Install the demand switch into those circuits which show the highest reduction of field strength.
Further hints, literature and contact information regarding professional “building biologists” can be found on our website.
Italiano
natural_image
Two-panel image showing a person holding a wall-mounted switch and a red table with a mounted device (no visible text or symbols)natural_image
Person using a handheld device on a wall, with red table background showing a red table (no visible text or symbols)natural_image
Kitchen appliance with a blender and a control panel, showing a close-up of the food item (no visible text or symbols)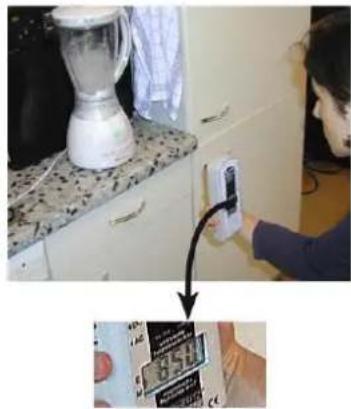
natural_image
Person installing a smartphone on a kitchen appliance (no visible text or symbols)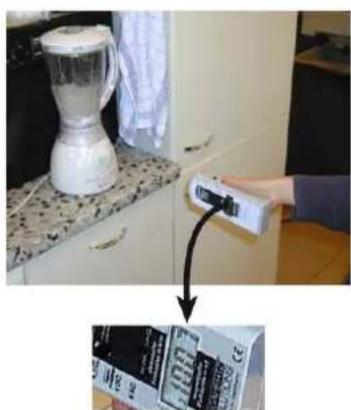
natural_image
Kitchen kitchen scene with a blender on a counter and a hand holding a remote control (no visible text or symbols)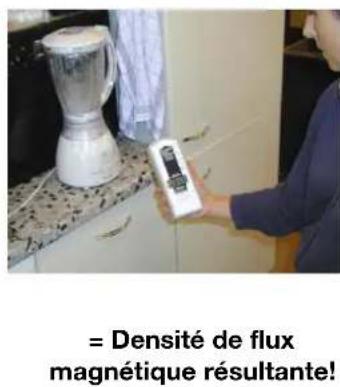
natural_image
Two-panel image showing a person using a handheld device on the left and a close-up of a red table with a mounted device on the right (no visible text or symbols)natural_image
Kitchen appliance with a blender and digital thermometer, showing a close-up of its screen (no visible text or symbols)
natural_image
Person installing a wall-mounted device on a kitchen appliance (no visible text or symbols)
natural_image
Kitchen appliance with blender and microwave oven connected to a wall-mounted control panel (no visible text or symbols)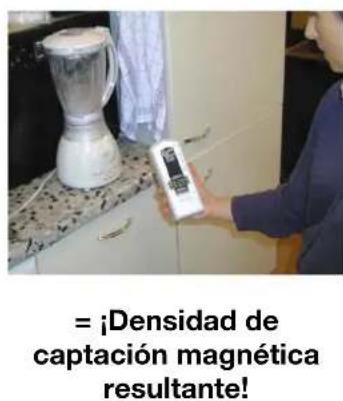
Rev. 1.5 - 1010 / DRU0190
Danke!
We thank you for the confidence you have shown in buying a Gigahertz Solutions product. It allows for an easy evaluation of your exposure to high-frequency ("HF") radiation according to the recommendations of the building biology.
In addition to this manual you can watch the tutorial videos on our website concerning the use of this instrument.
Please read this manual carefully prior to using the instrument. It contains important information concerning the safety, usage and maintenance of this meter.
Grazie!
Connecting socket for antenna cable. The antenna is inserted into the "cross like" opening at the front tip of the instrument. Important: Do not bend the cable too sharply or overtighten the connector screw!
„Power“
On/Off switch (◀▶ Off")
„Signal“
For building biological assessment use „peak“ (= factory setting in the HF32D). „Peak hold“ simplifies the measurement (HF38B only).
„Range“
Set the sensitivity according to the level of radiation (HF35C and HF38B only).
Attenuator knob for audio analysis of digital HF services (HF35C and HF38B only; the HF32D has a "Geiger counter" effect proportional to the signal)
All meters include an Auto-Power-Off-feature.
When the "Low Batt" indicator appears in the centre of the display, measurement values are not reliable anymore. In this case the battery needs to be changed. If there is nothing displayed at all upon switching the analyzer on, check the connections of the battery or change battery. (See „Changing the Battery“)
Introduction to Properties of HF Radiation and Consequences for their Measurement
Permeation of many materials
In particular for measurements inside of buildings it is important to know that construction materials are permeable for HF radiation to a varying degree. Some part of the radiation will also be reflected or absorbed. Wood, drywall, and wooden window frames, for example, are usually rather transparent spots in a house. More information can be found on our website.
Polarisation
Most High Frequency radiation (“waves”) is vertically or horizontally polarised. With the antenna attached the meter measures the vertically polarised component, if the display is positioned horizontally. By rotating the meter around its longitudinal axis you will be able to pick up any polarisation plane.
Fluctuations with regard to space and time
Reflexions can cause highly localised amplifications or cancellations of the high frequency radiation, in particular inside buildings. This is why one should stick to the step-by-step procedure in the next chapter.
In addition, most transmitters and cellular phones emit with considerably varying power during a given day and in the long term, depending on local reception and load. Therefore repeat meas-
urements at different times of the day on working days and at weekends. In addition it may be advisable to repeat them occasionally over the year, as the situation can change over night. As an example, a transmitter only needs to be tilted down by a few degrees in order to cause major changes in exposure levels (e.g. during installation or repair of cellular phone base stations). Most of all it is the enormous speed with which the cellular phone network expands every day that causes changes in the exposure levels.
Minimum distance 2 meters
Due to the physics of wave generation it is not possible to reliably measure the customary "power density" (W/m²) in the close vicinity of the source of radiation. For the instruments described here, the distance should be in excess of 2 meters.
The nature of HF radiation requires a specific approach for each
■ the determination of the total exposure to it and
■ the identification of the source or leaks for the pollution.
Step-by-Step Procedure to Measure the Total Exposure
When testing for HF exposure levels in an apartment, home or property, it is always recommended to record individual measurements on a data sheet. Later this will allow you to get a better idea of the complete situation.
Preliminary Notes Concerning the Antenna
As the LogPer Antenna provided with this instrument is shielded against ground influences one should “aim” about 10 degrees below the emitting source one wants to measure to avoid distortions in the area of sensitivity transition (aim horizontally for moderately elevated targets like masts of transponders).
The analyser suppresses frequencies below 800 MHz to avoid the readings being disturbed by lower frequency sources. In order to measure frequencies below 800 MHz down to 27 MHz the instruments HFE35C and HFE59B are available from Gigahertz Solutions. They come with an active horizontally isotropic ultra broad band antenna from 27 MHz up to beyond 3 GHz, the UBB27.
Settings of the Analyser
The HF32D comes with ,Range' and ,Signal' already set to values typical for the assessment of the impact of the HF radiation by building biology standards.
The HF35C and HF38B feature additional settings as described below:
At first set "Range" to "1999 μW/m²" resp. "19.99 mW/m²". Only if there are constantly very small readings, switch to the next finer
range ^6 . The basic rule is: as coarse as necessary, as fine as possible. In the rare case of power densities beyond the designed range of the analyser (“1” displayed on the left hand side even in the coarsest range) they can still be measured by inserting the attenuator DG20, available as an optional accessory, which makes the instrument less sensitive (by a factor of 100).
Setting Signal Evaluation (“Signal”): The peak HF radiation value, not the average value, is regarded as the measurement of critical “biological effects” affecting the organism and to be compared to recommended safety limits.
The average value ("RMS") of pulsed signals is often only a very small fraction of the peak value. Nonetheless it forms the basis of most of the "official" safety limits regulations. Building biologists consider this a trivialization.
„Peak hold“ (HF38B only) simplifies measurements of the total exposure by retaining the highest readings for some time (it slowly drops). Note of caution: Switch on "softly" to avoid switching peaks, which then will be retained for some time simulating unrealistic power densities. If peaks are very short and very high the holding capacity needs an instant until it is fully charged.
How to execute the measurements
Hold the HF analyzer with a slightly outstretched arm, your hand at the rear of the instrument.
For a rough first overview it is sufficient to probe for areas of higher levels of radiation simply by following the audio signals walking through the rooms of interest, directing the analyser everywhere and rotating it.
Having identified the area of interest for a closer evaluation, change the positioning of the instrument in order to analyse the actual power flux density. This is done
- by pointing in all directions including upwards and downwards in flats to establish the main direction of the incoming radiation,
- by rotating the instrument around its longitudinal axis by up to 90^ to also find the plane of polarisation, and
- by shifting the instrument in order to find the point of maximum exposure and to avoid being trapped by local cancellation effects.
It is generally accepted to use the highest reading in the room for comparison with limit or recommended values.
To be on the safe side in this comparison you may multiply the measurement by 4 and use the result as base value for the comparison. This is often done to make safe recommendations even in case of readings on the low side despite still being within the tolerance band. One has to consider, however, that this may also lead to higher values than actually existent.
The ratio of minimum to maximum load of a cellular phone base station usually is 1 to 4. At the time of measurement one does not know the exact load. One way to overcome this is to measure during low load periods (in the very early morning hours, e.g. from 3 to 5 am) and multiply the measurement by 4.
Special case: UMTS/3G and DVB-T: Measure 1 to 2 minutes ^7 in their incoming direction tilting the instrument slightly around it. These special types of signals can sometimes be undervalued by a factor of 5 by the analysers described here.
Special case: Radar for aviation and navigation. Radar beams are emitted by slowly rotating antennas. Therefore they are only measurable and “audio-analysed” every few seconds for milliseconds. This necessitates a special approach:
- Set "Signal" to "peak". After a couple of radar beam passes read out the highest number displayed. Because of the slow repetition rate of the display necessary for all other measurements, the numbers will vary considerably and will only be displayed for a very short period of time. When using the HF38B set the switch to "Peak-hold" and allow for several beam passes to establish the equilibrium of charging and drooping, which may take a few minutes.
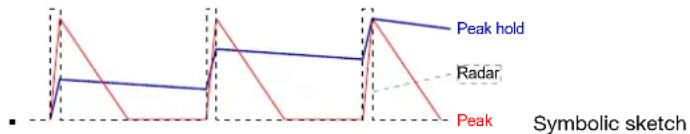
- In most cases the measurement will be at the lower tolerance band or in the extreme case even up to a factor of 10 too low ^8 .
For a simplified measurement of UMTS/3G-, DVB-T and Radar without correction factors, Gigahertz Solutions offers the professional HF-Analysers HF58B-r and HF59B.
Limiting values, recommendations and precautions
The "Standard der baubiologischen Messtechnik" (Standard for Building Biology Measurements), SBM 2008, classifies measurements (per radio communication service), with a note of caution "pulsed signals to be taken more seriously than continuous ones", as follows:
Building Biology Recommendations as per SBM-2008
| Peak measurements | un-conspicuous | moderatelyconspicuous | veryconspicuous | extremelyconspicuous |
| < 0.1 0.1 - | 10 10 - 1000 > | 1000 |
© Baubiologie Maes / IBN
In fall 2008 the "Bund für Umwelt und Naturschutz Deutschland e.V." (BUND) (environmental NGO) recommended a limiting value of 1 W/m^2 even for outdoor situations.
The Landessanitätsdirektion Salzburg (Austrian health authority) proposed already in 2002 to lower the present "Salzburger Vorsorgewert" (precautionary value) to 1 W/m ^2 for indoor situations.
Limiting values imposed by governments are mostly considerably higher. There are indications of rethinking, though. The Internet provides large collections of recommendations and data.
Note for users of cellular phones: Even below 0.01 W/m^2 communication is fully unimpaired.
Identification of the sources of pollution
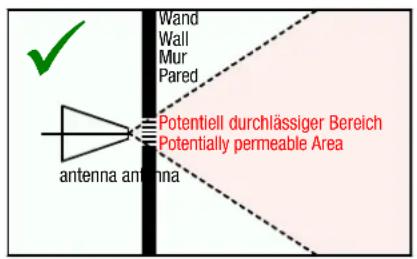
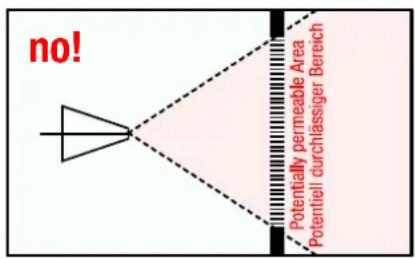
After determination of the total exposure the next step is to find out where the radiation enters the examined room. As a first step eliminate sources from within the same room (e.g. cordless phones, wireless routers, etc.) Once this is completed, the remaining radiation will originate from outside. For remedial shielding it is important to identify those areas of all walls (including doors, windows and window frames!), of ceiling and floor, which are penetrated by the radiation. To do this one should not stand in the centre of the room, measuring in all directions from there, but monitor the permeable areas with the antenna (LogPer) directed and positioned close to the wall/ceiling/floor ^9 . The reason for this is that the antenna lobe widens with increasing frequency. In addition reflections and cancellations inside rooms make it impossible to locate the “leaks” accurately. See the illustrating sketch below!
For the definition and installation of shielding measures as well as surveying their effect, professional advice is recommendable. Anyway, the area covered by shielding material should be much larger than the leak itself.
Audio Frequency Analysis (HF35C / HF38B only)
Many different frequencies within the frequency band between 800 MHz and 2.5 GHz, are being used by many different services.
The audio analysis ^10 of the modulated portion of the HF signal helps to identify the source of a given HF radiation signal.
Sounds and signals are very difficult to describe in writing. The best way to learn the signals is to approach known HF sources very closely and listen to their specific signal patterns. Without detailed knowledge, the characteristic signal patterns of the following HF sources can be easily identified: 2.4 GHz telephones (DECT phones, incl. base station and handset) as well as cellular phones, the signal patterns of which can be divided into “a live connected phone call”, “stand-by mode” and, especially important for cellular phones, the “establishing of a connection”. The typical signal patterns of a cellular phone base station can also be identified this way. For comparison reasons you are well advised to take measurements during high-traffic times, as well as some times during the night, in order to familiarize yourself with the different noises.
"Marking" of unpulsed signals:
Un-pulsed signals by their very nature are not audible in the audio analysis and therefore easily missed. For that reason they are marked by a uniform “rattling” tone, with its volume proportional to its contents of the total signal. This “marking” has a frequency of 16 Hz, and an audio sample can also be downloaded as an MP3 file from our website.
On our home page you will find a link to some typical samples of audio analyses as MP3-files. Furthermore, the audio analysis can be significantly simplified by the filters we offer.
For more in-depth analyses
Gigahertz Solutions offers:
- Attenuators for expanding the designed range of the analysers upwards for strong sources of pollution.
- Frequency filters for a more precise separation of different radio frequency service bands.
- Instruments for lower HF: For measurement of signal frequencies above 27 MHz (including: CB radioing, analogue and digital TV and radio TETRA etc.) we offer the instruments HFE35C and HFE59B.
- Instruments for HF up to 6 GHz / 10 GHz For analyses for yet higher frequencies (up to abt. 6 GHz, including WLAN, WIMAX and some directional radio sources and aviation radar), we offer the HFW35C (2.4-6 GHz). A new broad band analyser for 2.4-10 GHz is under development (HFW59B).
- Instruments for low frequencies: Electrosmog is not limited to the Radio Frequency range! Also for the low frequency range such as power (distribution and domestic installations) and rail-
ways including their higher harmonics we offer a broad range of affordably priced instruments with high professional standards.
Please refer to our homepage for comprehensive coverage.
Power Supply
Changing the Battery
The battery compartment is at the back of the analyzer. To remove the lid, press on the grooved arrow and pull the cap off. The foam pad inserted pushes the battery against the lid preventing the heavy battery from rattling. This is the reason for the lid's resistance during opening.
Auto-Power-Off:
This feature conserves energy and extends the total operating time.
-
In case you have forgotten to turn OFF the HF analyzer or it has been turned ON accidentally during transport, it will shut off automatically after 40 minutes of continuous use.
-
If "LOW BATT" appears vertically between the digits in the centre of the display, the HF analyzer will turn OFF after 2 to 3 min in order to avoid unreliable measurements. It reminds you to change the battery as soon as possible.
Shielding done by an expert is a dependable remedy
The effectiveness of shielding done by an experienced craftsman can be verified by measurement. He has quite a number of options at his disposal. There is no “best method”, however, befitting for all problems – shielding always has to be adapted to the specific situation.
Shielding, too, is covered comprehensively on our homepage which also contains further links on this issue
Warranty
We provide a two year warranty on factory defects of the HF analyzer, the antenna and accessories.
Antenna
Even though the antenna appears to be rather delicate, it is made of a highly durable FR4 base material that can easily withstand a fall from table height.
HF Analyzer
The analyzer itself is not impact proof, due to the comparatively heavy battery and the large number of wired components. Any damage as a result of misuse is excluded from this warranty.
Italiano
Gigahertz Solutions offre: