RFEXPLORER3 - Spectrum Analyzer Monacor - Free user manual and instructions
Find the device manual for free RFEXPLORER3 Monacor in PDF.

| Product Type | Portable HF Spectrum Analyzer |
| Brand | Monacor |
| Model | RFEXPLORER3 |
| Measurement Range | 15 MHz - 2.7 GHz (two antenna inputs: 240-960 MHz and 15-2700 MHz) |
| Amplitude Resolution | 0.5 dBm |
| Dynamic Range | -120 dBm to 0 dBm |
| Average Noise Level | -115 dBm (typical) |
| Frequency Stability and Accuracy | ±10 ppm (typical) ≤ 0.001% |
| Frequency Resolution | 1 kHz |
| Resolution Bandwidth (RBW) | Automatic 2.6 - 600 kHz |
| Antenna Connections | SMA 50 Ω, two connectors |
| Display | LCD 128 x 64 pixels, backlit, adjustable contrast |
| Power Supply | Internal rechargeable battery via mini USB port |
| Battery Life | Approximately 16 hours |
| Main Functions | Spectrum analyzer with Max, Average, Max Hold, Normal modes; WiFi analyzer (2.4 GHz channels); center frequency and span settings; automatic or manual marker; DSP calculation modes (Fast/Filter/Auto) |
| Maintenance | Clean with a soft dry cloth; do not use chemicals or water |
| Safety | Maximum input level: +5 dBm (240-960 MHz) / +30 dBm (15-2700 MHz); avoid electrostatic discharge; use in dry and temperate environment (0-40°C) |
| PC Software | Windows software available on Monacor website (requires .NET Framework 4 Client Profile) |
Frequently Asked Questions - RFEXPLORER3 Monacor
User questions about RFEXPLORER3 Monacor
0 question about this device. Answer the ones you know or ask your own.
Ask a new question about this device
Download the instructions for your Spectrum Analyzer in PDF format for free! Find your manual RFEXPLORER3 - Monacor and take your electronic device back in hand. On this page are published all the documents necessary for the use of your device. RFEXPLORER3 by Monacor.
USER MANUAL RFEXPLORER3 Monacor
These instructions are intended for users with basic knowledge in RF technology. Please read the instructions carefully prior to operation and keep them for later reference.
1 Safety Notes
The unit corresponds to all relevant directives of the EU and is therefore marked with
Caution with high EM radiation The RF EXPLORER allows to measure very small signals down to -120dBm Therefore, the antenna inputs are very sensitive and may be damaged by an excessive radiation even with the unit switched off. The maximum input level of +5dBm must not be exceeded. This level results e.g. at a distance of approx. 1m to a micro wave oven or at a distance o approx. 10cm to a mobile phone.
It is also absolutely necessary to prevent static discharging via the antennas. For instance, firmly seize the metal housing by one hand prior to attaching or touching an antenna by the other hand.
For storage or transport, keep the unit in a metal box and / or remove the antennas.
-
In areas of very high RF radiation, connect one SMA plug each with a 50 Ω terminating resistor to the antenna jacks (e.g. the item SMA-150AW from MONACOR).
-
The unit is suitable for indoor use only. Protect it against dripping water, splash water and high air humidity. The admissible ambient temperature range is 0 - 40 °C.
For cleaning only use a dry, soft cloth, never use chemicals or water.
No guarantee claims for the unit and no liability for any resulting personal damage or material damage will be accepted if the unit is used for other purposes than originally intended, if it is not correctly operated or not repaired in an expert way.
If the unit is to be put out of operation definitively, take it to a local recycling plant for a disposal which is not harmful to the environment. Do not put defective rechargeable batteries into the household waste but take them to a special waste disposal (e.g. collective container at your retailer).
2 Overview
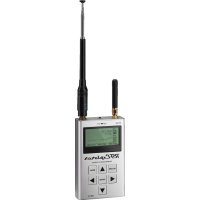
The RF EXPLORER has been designed to be intuitive and easy to use. There is no need to read comprehensive user manuals to take full advantage of its advanced functionality. Most of the complexity inherent to the spectrum analyser is simplified by the firmware. For instance, you do not need to adjust the resolution bandwidth (RBW) each time you select a different frequency span. Actually, you do not even need to know what RBW is.
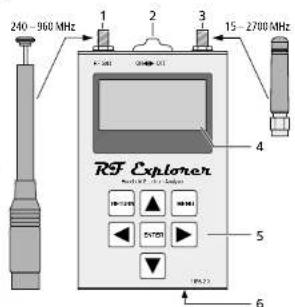
Fig.1 Connections and operating elements
1 Antenna jack for the range 240 - 960 MHz
2 On/off switch
3 Antenna jack for the range 15 MHz - 2.7 GHz
4 Display
5 Keypad
6 Mini USB port to charge the battery (for this purpose, set the on/off switch to position ON) and for operation via a PC.
3 Spectrum Analyser Mode Recharging the battery
After switching on the RF EXPLORER, the display successively shows menus with information:
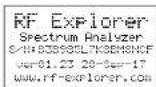
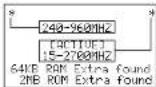
Fig.2 Start menus
Then the spectrum analyser mode is started automatically:
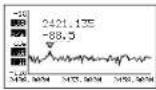
Fig.3 Spectrum display
The display shows an X axis and a Y axis.
X for the frequency in MHz and
Y for power in dBm
Fig. 3 shows the frequency range from 2.408 GHz to 2.458GHz and the amplitude (dynamic range) from -10dBm to -120dBm
Configuration settings such as amplitude reference and frequency span are preserved between sessions. The display shows a small marker v which indicates the peak amplitude in the current frequency span. The first value states the frequency at this point and the second value the amplitude.
The display also shows a symbol [USB] for the USB port (in case of connection to a PC) or a battery symbol (when the on/off switch is set to ON). To recharge the internal battery, connect the RF-EXPLORER / 6 to a USB port; the on/off switch (2) must be in the position ON! Then the USB symbol and the battery symbol are displayed alternately.
4 Menus
The unit is operated via several menus which are successively called with the button MENU. The button RETURN allows to return from each menu to the spectrum display.
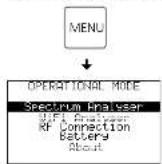
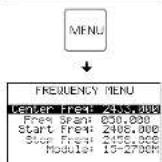
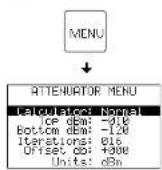
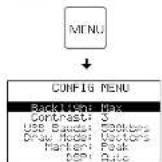

Fig.4Menu structure
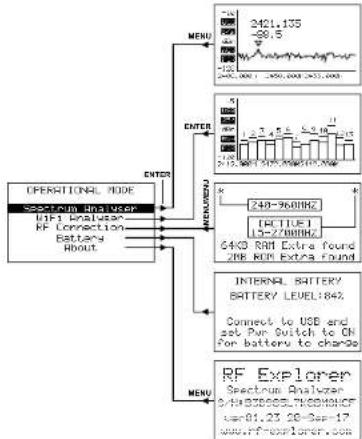
4.1 Menu operation mode
Fig.5 Menu operational mode
To call the menu OPERATIONAL MODE, press the button MENU (repeatedly). Select the desired function using the button or and press the button ENTER to call the function.
Spectrum Analyser: spectrum analyser mode (chapters 4.2-4.4)
WiFi Analyser: WiFi analyser mode (chapter 5) This menu line is only available if the frequency range "15 - 2700M" has been selected in the bottom line "Module" of the frequency menu (chapter 4.2).
RF Connection: indication of the activated frequency range (240 - 960MHz or 15 - 2700MHz; chapter 4.2) with the antenna jacks used and indication of memory size
Battery: battery status indication
About: Indication of information relating to the unit, e. g. serial number and firmware version
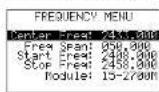
4.2 Frequency menu
Fig.6 Frequency menu
This menu which allows to change frequency settings is probably the menu most used.
When, after switching on the RF EXPLORER, the spectrum is displayed and the button MENU is pressed twice, the frequency menu appears. However, this procedure is changed in the following. Each time the button MENU is pressed while the spectrum is displayed, the last menu called appears. Thus, time is saved as it is not necessary to navigate through all menus to return to the previous one.
There are two different methods to change the frequency range shown in the spectrum display:
- Center Freq and Freq Span
This is the usual spectrum analyser adjustment all experts are familiar with. The center frequency (Center Freq) of the frequency band to be analysed is adjusted and then the bandwidth (Freq Span).
2.Start Freq and Stop Freq
Only a few spectrum analysers offer this user-friendly method. The lower frequency (Start Freq) and the higher frequency (Stop Freq) of the frequency range to be analysed are adjusted.
When Center Freq and Freq Span are adjusted, Start Freq and Stop Freq are changed accordingly and vice versa. In general, Center Freq / Freq Span are adjusted when the frequency is known and Start / Stop Freq to check a certain range.
To go to an option, use the buttons and . Then press the button ENTER to be able to edit the option. Go to the position to be changed with the button or. Adjust the desired value with the button or and confirm the adjustment with the button ENTER or cancel it with the button RETURN.
In the line Module, use the button ENTER to select the frequency range to be analysed (240 - 960 MHz, 15 - 2700MHz). After selection, the display will briefly indicate the activated frequency range with the antenna jacks used:
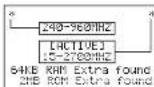
Fig. 7 Indication of the activated frequency range (in this example: 15 - 2700MHz
Then the display will automatically return to the frequency menu.
Notes: The bandwidth can be adjusted between 0.112MHz and 600 MHz. The lowest and the highest frequency to be adjusted depend on the settings in the menu lines "Freq Span" and Module".
Example of a change of bandwidth from 9MHz to 6.5MHz; the lower and the higher frequency will be updated automatically:
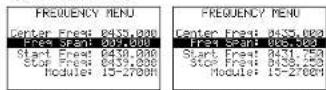
Fig. 8 Reducing the bandwidth from 9 MHz to 6.5 MHz
Exit the menu with the button RETURN and return to the spectrum display.
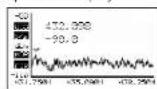
Fig. 9 Spectrum display with bandwidth 6.5MHz
The now frequency range is adjusted. As a further example, repeat the procedure to change the bandwidth to 2.5 MHz. For this purpose press the button MENU again: The previous menu option (Freq Spain) is selected. Change the value to 2.5 MHz and confirm with the button ENTER. Then press the button RETURN to return to the spectrum display.
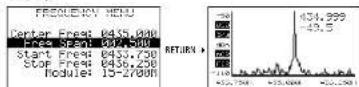
Fig.10 The bandwidth is changed to 2.5MHz
The new frequency range is adjusted but what is interesting now is that the center frequency can also be changed with no need to call the frequency menu. For this purpose press the button or (repeatedly) when the spectrum is displayed: Each time the center frequency is reduced or increased by % of the bandwidth, i.e. at a bandwidth of
2.5 MHz by 0.3125 MHz by just pressing a key. This direct method is especially useful with a narrow bandwidth.
During the spectrum display the measuring values and the measuring curve can be frozen by pressing the button ENTER. This facilitates the reading for values rapidly changing. In this case, the indication HEL next to the Y axis is flashing. To return to the present values, press the button ENTER again.
The frequencies of the scan range are indicated at the X axis. Alternatively to this, the bandwidth SP, the centre frequency C and the resolution bandwidth RBW can be indicated. To switch over, press the button RETURN. When the button or is now pressed (repeatedly), it is not the centre frequency which is changed but the bandwidth. Thus, the bandwidth can also rapidly be changed without calling the menu.
4.3 Attenuator menu
This menu allows to change the level display in the Y axis. To call the menu, press the button MENU repeatedly until the menu is displayed.
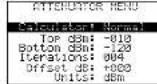
Fig.11 Alternator menu
This menu has some interesting options:
Calculate: offers five modes for the level display. To change the mode, press the button ENTER.
Max: The peak values of the last frequency band scan iterations [sweeps] (see menu option below) are used, in this case the peak values of the last 4 scans. This is the standard mode by which rapidly changing RF signals may be detected or the channel assignment can be found in difficult cases. (The selected mode is shown in the spectrum display on the left of the Y axis, for this mode with [B])
Average: The arithmetic media average during the last scan iterations is calculated. This mode is especially suitable to find the average of the noise floor and to display signals with constant frequency and amplitude (Continuous Wave).
(This mode is shown in the spectrum display with 100 Overwrt: Higher level values overwrite lower values until the button RETURN is pressed or the center frequency is changed with the button or (This mode is shown with 100
RF-EXPLORER/3
English
ELECTRONICS FOR SPECIALISTS ELECTRONICS FOR SPECIALISTS ELECTRONICS FOR SPECIALISTS ELECTRONICS FOR SPECIALISTS ELECTRONICS FOR SPECIALISTS ELECTRONICS
Max Hold: Simultaneous display of the present levels and the maximum levels.
(This mode is shown with I
Normal: No calculation, continuous display of the current levels.
(This mode is shown with
Top/BottomBm: Herewith the measuring range of the level is adjusted. "Top dBm" for the upper measured value of the Y axis and "Bottom dBm" for the lower value. The difference between the two values cannot be inferior to 10 dBm.
Iterations: indicates the number of scan sweeps to calculate the peak values (calculator: max) or the average values (calculator: average), adjustable from 1 to 16. The higher the iteration value, the more exact the calculation, but the slower the display.
Offset dB: Moves the measured level by the value adjusted (± 100dB)
Example: A level of -76 dB is measured at a certain frequency at a place in the room. With an offset of +76 dB the RF-EXPLORER shows 0 dB in this case. For measurements at other places in the room, the level deviation to the place of reference is directly shown in dB.
Units: The unit dBm or dBpV can be selected for the Y axis with the button ENTER. In the spectrum display, the selected unit is shown by "dBm" or "dBV" on the left next to the Y axis.
For a simple test change the upper dBm value to -70dBm . Then press the button RETURN to return to the spectrum display. The level range indicated is now smaller and thus the signal on the display is higher, especially the noise floor.
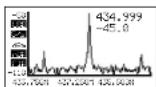
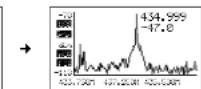
Fig.12 Upper dBm value reduced by 20 dB As the upper dBm value is very frequently changed, this value can be increased by 5 dBm with the button and be reduced by 5 dBm with the button when the spectrum is displayed. Together with the buttons and to change the center frequency, these shortcuts are very useful for configuration adjustments in real time as there is no need to call a menu.
4.4 Configuration menu
RF EXPLORER offers some configuration facilities to adjust the unit as desired or according to application. Press the button ENTER repeatedly until the configuration menu is displayed.
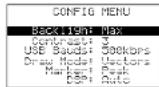
Fig.13 Configuration menu
The options in this menu can be selected with the buttons and and be adjusted by pressing the button ENTER repeatedly.
Backlight: Backlight for the display: OFF, Low, Med, High, Max. The RF EXPLORER offers good visibility indoors and outdoors, even in direct sunlight. With a low backlight the battery is preserved.
Contrast: 10 contrast levels for the display are available. USBauds: The presetting is 500 kbits / s which is all recommended. When problems occur during data transfer to the PC which is quite rare, change to the slower speed of 2.4 kbits / s. However, this is not recommende as the connection becomes very slow. The speed of data transfer of the RF EXPLORER must match the speed of the PC to obtain a correct connection.
Draw Mode: In case of the adjustment "Vectors" a level curve for the scanned frequency range is displayed, in case of the adjustment "Fill" individual columns show the level.
Marker: Place a marker to read frequency and level at this point.
None: no marker
Peak: automatic marking of the frequency with the highest level
Manual: The marker can be moved in the scan range with the buttons and .
DSP: The digital signal processor of the RF-EXPLORER is equipped with a subprogram which filters unwanted signals occurring in case of signal processing (e.g. image frequencies). However, for an extensive filtering, the measuring process will become slower and short wanted signals (e.g. WiFi signals) cannot be recognized due to the high calculating effort.
To measure short wanted signals, the adjustment Fast should be selected (is shown by [PST] in the spectrum display) and for exact measurements free of interference select the adjustment Filter (indication [TID]) In the setting Auto, the unit will automatically select the most suitable measuring method (FESI or [FIS]).
5WiFiAnalyserMode
This mode serves to display the 13 WLAN channels in the 2.4Ghz range. To be able to switch on the mode, the frequency range "15 - 2700M" must be selected in the line "Module" of the frequency menu (chapter 4.2).
To switch on, press the button MENU repeatedly until the menu OPERATIONAL MODE (fig. 5) ap pears. Select the line "WiFi Analyzer" with the button or . Then
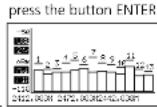
Fig.14 WiF Analyser mode
6 PC Software
On our homepage you will find a software for Windows which allows to operate the RF EXPLORER from your computer. At the same time you also receive a software for possible firmware updating (RF Explorer Firmware Update Loader).
http://www.monacor.com
RF-EXPLORER/3 Services DOWNLODADS
(Pleases note that "Microsoft" .NET Framework v4Client Profile" must be installed.)
Windows is a registered trademark of the Microsoft Corporation in the USA and other countries.
Licence
The firmware included in the RF EXPLORER is protected by copyright © by Ariel Rocholl, 2010 - 2013.
RF Explorer PC Client is a free software under GPL v3, therefore you are free to modify, distribute and use it according to GPL terms.
7 Specifications
Display: high contrast LCD display with backlight, 128× 64 pixels
Measuring ranges: 15-2700 MHz
Amplitude resolution: 0.5dBm
Dynamic range: -120 dBm to 0 dBm
Absolute max. input power
left antenna jack
(240-960MHz)5dBm
right antenna jack
(15-2700MHz):.,.,+30dBm
Medium noise level: -115 dBm (typical)
Frequency stability
and accuracy: . . . . . . . . . . . . . . . . . . . . . . . . . . . . . . . . . . . . . . . . . . . . . . . . . . . . . . . . . . . . . . . . . . . . . . . . . . . . . . . . . . . . . . . . .
Amplitude stability
and accuracy: . . . . . . ±3 dBm (typical)
Frequency resolution: 1 kHz
Resolution bandwidth (RBW): automatic 2.6-600 kHz
Antenna connections: .SMA.50Ω
matching calibrated
50Ω antennas supplied
Power supply: rechargeable Lithium polymer battery, 1000 mAh, operating time approx. 16h, rechargeable via the USB port
Dimensions: 71x122x25mm
Weight: 210g

- Start Freq at Stop Freq
Alimentation: accumulatour lithium polymere,
1000 mAh,
rechargeable via port USB
Dimensions: 71 × 122 × 25 ~mm
Poids 210g
Copyright by MONACOR INTERNATIONAL. All rights reserved. A-1409.99.04.2018


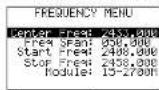
Fig.6 Menu frequency
- Center Freq e Freq Span