
CLL 1 - Measurement PCE - Free user manual and instructions
Find the device manual for free CLL 1 PCE in PDF.


| Product Type | Digital Clamp Meter |
| Model | CLL 1 |
| Brand | PCE Instruments |
| Measurement Category | AC/DC Current, AC/DC Voltage, Resistance, Capacitance, Frequency, Temperature, Diode Test, Continuity |
| AC Current Range | 0.1 A to 600 A |
| DC Current Range | 0.1 A to 600 A |
| AC Voltage Range | 0.1 V to 600 V |
| DC Voltage Range | 0.1 V to 600 V |
| Resistance Range | 0.1 Ω to 60 MΩ |
| Capacitance Range | 0.1 nF to 60 mF |
| Frequency Range | 0.1 Hz to 10 MHz |
| Temperature Measurement | -50°C to 1000°C (with type K thermocouple) |
| Display Type | Digital LCD with backlight |
| Max Display Count | 6000 counts |
| Auto Ranging | Yes |
| Data Hold | Yes |
| Peak Hold | Yes |
| Relative Measurement | Yes |
| Auto Power Off | Yes (adjustable) |
| Safety Rating | CAT III 600V, CAT II 1000V |
| Power Supply | 2 x AAA batteries (1.5V) |
| Dimensions | 200 x 75 x 40 mm |
| Weight | Approx. 250 g (including batteries) |
| Jaw Opening | 30 mm |
| Operating Temperature | 0°C to 40°C |
| Storage Temperature | -10°C to 60°C |
| Humidity | ≤ 75% RH (non-condensing) |
| Accessories Included | Test leads, type K thermocouple, carrying case, batteries, manual |
| Maintenance | Clean with a dry cloth; do not use solvents. Calibrate annually. |
| Safety Precautions | Do not exceed rated voltage/current; wear protective gear when measuring high energy circuits. |
| Spare Parts / Reparability | Batteries and fuses are user-replaceable; other repairs by qualified personnel only. |
Frequently Asked Questions - CLL 1 PCE
User questions about CLL 1 PCE
0 question about this device. Answer the ones you know or ask your own.
Ask a new question about this device
Download the instructions for your Measurement in PDF format for free! Find your manual CLL 1 - PCE and take your electronic device back in hand. On this page are published all the documents necessary for the use of your device. CLL 1 by PCE.
USER MANUAL CLL 1 PCE
Southpoint Business Park
Ensign way
Hampshire / Southampton
United Kingdom, SO31 4RF
From outside UK: +44
Tel: (0) 2380 98703 0
Fax: (0) 2380 98703 9
info@pce-instruments.com
www.pce-instruments.com/english
www.pce-instruments.com
Manual
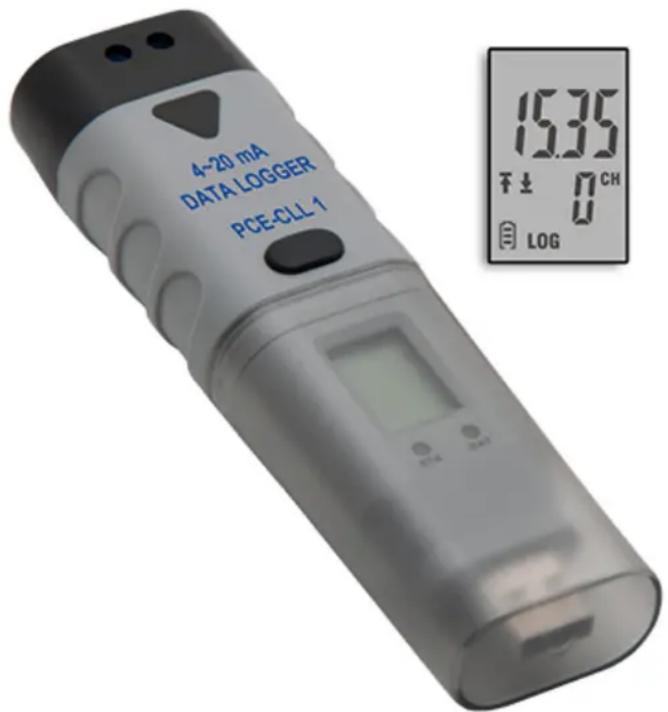
Data Logger
PCE-CLL 1
QUICK START GUIDE FOR DATA LOGGERS
natural_image
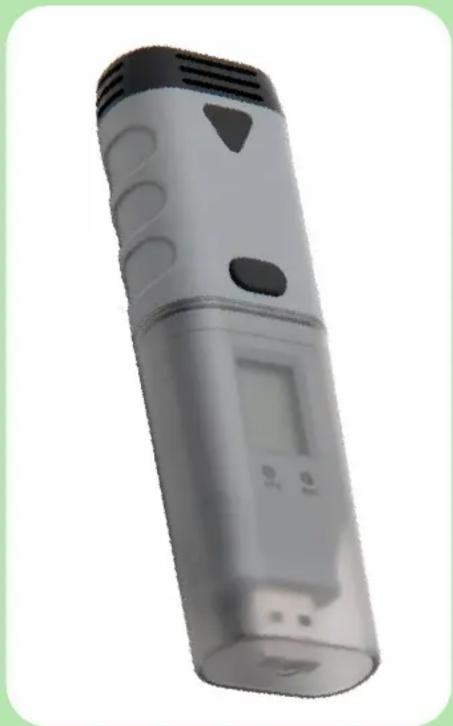
3D rendered image of a handheld electronic device with a display and control panel (no visible text or symbols)WELCOME
This series of Direct-USB-Connection data loggers are designed to use very easily. This Quick Start Guide covers preparation and use to assist you in getting the best results from your data logger. Now follow this guide to start.

IMPORT NOTES
This series of data loggers offer a variety of different models and measurement parameters, so in the sensor location, there will be different sensor extensions for different models that you purchased, but this guide always can be suitable for the whole series of data loggers.
The product range is constantly being updated and new models added, and related information is liable to change without notice. So if necessary, consult your supplier to get the latest information and news.
Appearance of a product color is subject to actual purchase of product, and all the pictures mentioned in this guide is only for reference.
To install the software and USB driver, you must have an administrator rights on the host computer.
When the data logger is connected to the USB port, the battery inside the data logger is discharged at a higher rate than normal. To conserve battery life, do not leave the data logger connected to the USB port for a prolonged period of time.
GETTING STARTED
All you need to prepare are a PC running under Windows XP/ Vista/ 7/8(32 bit or 64 bit) with USB port and CD-ROM drive, the CD including Data Logger Graph software and driver, the data logger itself and a 3.6V 1/2AA battery.
BATTERY INSTALLATION
Before using the data logger, you will need to install the 3.6V 1/2AA battery included in the data logger standard kit. Besides, replacement batteries available from your supplier. Following instructions left page to operate.
1

natural_image
3D rendered image of a cylindrical device with a green arrow indicating direction (no text or symbols)
natural_image
3D diagram of a mechanical component with green arrows indicating direction, no text or symbols present
natural_image
3D mechanical component with green arrow indicating a specific part, no visible text or symbols
natural_image
3D rendering of a metallic cylindrical object with a green arrow pointing to its tip (no text or symbols)NOTE: Make sure to align this connector with its other side when install the part.

natural_image
3D rendering of a gray cylindrical device with internal components and a green arrow indicating direction (no text or symbols)SOFTWARE INSTALLATION
Install the Data Logger Graph software by placing the CD in the PC CD-ROM drive. If setup program does not automatically run and start, double click the "setup.exe" file included on the CD->Setup directory to start installing. Follow the on-screen prompts to complete installation. You will see a new icon Data Logger Graph on your desktop. For further information on the software, you can access the help menu on the software interface. Please note that you must install the USB driver after completing the software installation to use the data logger.
DRIVER INSTALLATION
After completing the software installation, make sure the CD is in your PC CD-ROM drive. Double click the "USBXpressInstaller.exe" file included on the CD->Driver directory to start installing. Follow the on-screen prompts to complete installation. You can now plug the data logger to an available USB port on the PC, and a few minutes later, your computer will appear successful message on the bottom right of the screen. If the driver for this data logger device has been installed normally.
Now, you have successfully installed the necessary software and driver for your data logger. Please continue to refer to next section of this document for a guide on how to use the data logger for a task.
2
SETUP AND START
To use the data logger, take the following steps:
1. Make sure the battery is correctly installed, or if you use USB port to power the data logger directly, you must not remove data logger from USB port when the data logger is logging.
2. Insert the data logger into an available USB port of a PC which has installed the Data Logger Graph software and driver.
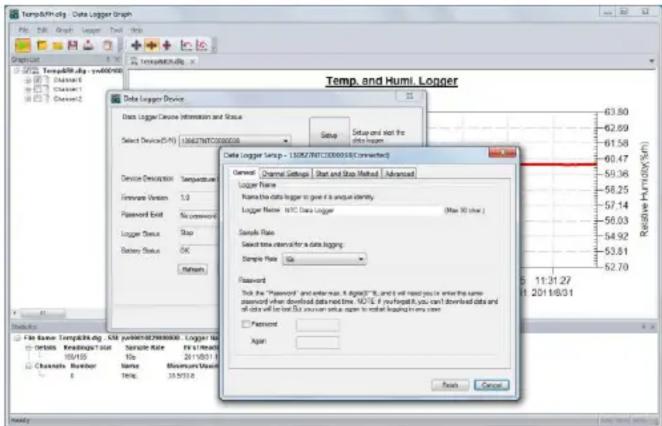
3. Double click on the "Data Logger Graph" icon on your Windows desktop. This will load the Data Logger Graph software. On the left top of the software, you can see "Start" button and click on it. This will open "Data Logger Device" dialog.
4. Select data logger device that will be set(or default). Here you can check the firmware version, status, etc. of the selected data logger device.
5. Click on the "Setup" button to load "Data Logger Setup" dialog. Here you can follow the screen instructions and setup the data logger. On the "General", you can set logger name and sample rate. On the "Channel Settings", you can set high/low limit, enable/disable alarm, and enable/disable alarm hold. On the "Start and Stop Method", you can select how to start and stop logging. Or all settings can be factory default if first attempts.
6. Click on the "Finished" button. The data logger will start according to your settings.
7. Remove the data logger from PC USB port except USB port will be used as power supply as your required.
DATA DOWNLOAD
-
When a task is finished, you can download data to PC. Do according to step 2 to 4 of "SETUP AND START" firstly, and then click on the "Download" button on the "Data Logger Device" dialog. Here you can follow the screen instructions to download and save the data to PC. Please note that you need to input correct password to operate this step if the data logger has been set a password before(No for factory default).
-
After downloading finished, a "Downloading Finished" dialog will be shown, user can click the "Open" button to graph the downloaded data.
3
GRAPH
-
Double click on the "Data Logger Graph" icon on your Windows desktop. This will load the Data Logger Graph software.
-
User can open a data logger file (*.dlg, *.mdlg) via the menu "File->Open", and the graph will be shown.
-
Zoom in: Use the mouse to click and drag a box around any graph area to magnify the area selected. Zoom out: Click on the "Undo Last" or "Undo All" button on tool bar to show last graph area or the original graph area.
-
Pan: Press and hold the mid-button of the mouse at any graph location, and move the mouse to pan the graph area.
-
Zoom and Pan Method. Auto: Zoom and pan in any direction. Horizontal: Zoom and pan only in horizontal direction. Vertical: Zoom and pan only in vertical direction. Manually: Set the start time and end time for horizontal axis, and set the scale for the vertical axis.
-
Mark Data Points: Click right-button on graph area to show the pop-up menu below, Click "Mark Data Points" to show marks on all sample point locations.
-
Graph Settings: Click right-button on graph area to show the pop-up menu below, click "Graph Settings" to show a dialog. User can set color, font, line size and unit for the graph.
FILE EXPORT
The software save and open the *.dlg or *.mdlg file type in default. User can click "File->Save As" to save the *.dlg or *.mdlg as other file types, including *.txt, *.csv, *.xls, *.bmp, and *.jpg.
To print the graph, statistics and data table, click on the printer icon on standard toolbar or select "Print" from the "File" pull-down menu.
User can also click the "File->Print and Export Options" select the printed contents in the following dialog.


BUTTON
There is only one button on the housing of the data logger, pressing the button has a different outcome depending on what the logger is doing at the time the button is pressed:
- If user selects Start by Button as start method via the Data Logger Setup dialog in the Data Logger Graph software, after a setup is finished, user can press and hold the button until the green LED lights to start the logging task.
- If user select Overwrite When Full as stop method via the Data Logger Setup dialog in the Data Logger Graph software, user can press and hold the button until the green LED lights to stop the logging task.
- If Confirm and Clear LED Alarm by Button is enabled via the Data Logger Setup dialog in the Data Logger Graph software, when red LED flashes for alarm, user can press and hold the button until the red LED lights to clear and reset the LED alarm.
HOW TO GET RIGHT RESULTS
- Check the battery capacity before beginning your logging task. If you want to use the USB interface to supply power for data logger, this can be skipped.
- Observe the IP rating, measurement range and operating range. Allow it to be located in a place with a right environment.
- Some sensors will age and drift inevitbaly, and if necessary, you can consult your supplier to get help on recalibration.
- See the related product datasheet carefully if have any other questions.
RELATED DOCUMENTS
All helpful documents include:
Quick Start Guide DGraph Software Guide Product Datasheet Product Selection Guide
These documents can be found on the supplied CD disk
ENVIRONMENTAL DISPOSAL
WEEE This product may contain substances that can be hazardous to the environment if not disposed of properly. Electrical and electronic equipment should never be disposed of with general house hold waste but must be separately collected for their proper treatment and recovery. The crossed-out bin symbol, placed on the product, reminds you of the need to dispose of the product correctly at the end of its life. In this way you will assist in the recovery, recycling and re-use of many of the materials used in this product. At the end of the life of your product please contact your distributor for information on collection arrangements.
BATTERY Most batteries end up in landfill where their hazardous material can leach into the soil and cause harm. It is much more environmentally friendly to recycle batteries in a safe, correct manner. Follow applicable country, state, and local regulations for disposal/recycling of the 1/2AA battery supplied with your data logger. RoHS The Restriction of Hazardous Substances (RoHS) Directive 2002/95/EC of the European Parliament stipulates that certain hazardous substances must not be present above defined levels in products. This data logging product is manufactured to be RoHS compliant.

IP67
CE


LED INDICATION GUIDE
| Not any LEDs flashData logger is idle, battery is exhausted or no battery is fitted.1 | |
| Green single flash every 10sThe data logger is currently logging. | |
| Green double flash every 10sThe data logger will Start at user set date and time, or remind user to Start by Button.2Green double flash every 60sThe data logger has finished user set logging task and stopped. | |
| Red single flash every 10sThe data logger is currently logging. Alarm (High, low or both) on at least one channel.4 | |
| Red double flash every 60sThe data logger has finished user set logging task and stopped.Alarm (High, low or both)on at least one channel.NOTE: This only occur when Alarm Hold is enabled.5 | |
| Yellow single flash every 60sLow battery indication. The logging task continues, and you need to check battery capacity and replace it timely.Yellow single flash every 1sIndicate that USB connection is normal. | |
| Yellow and Green single flash one by oneBattery is installing and power on OK. | |
| Yellow and red single flash one by oneBattery is installing and power on failed. |
^1 Battery Status can be checked via the Data Logger Device dialog in the Data Logger Graph software. Even if the battery is exhausted, the logged data won't lose.
^2 Start and Stop Method can be set via the Data Logger Setup dialog in the Data Logger Graph software.
^3 Red LED Alarm for each channel and Green LED Status Indication can be disabled via the Data Logger Setup dialog in the Data Logger Graph software for save power.
^4 All channels share the red and green LED for this series of data loggers.
^5 If Alarm Hold is enabled, the red LED will flash when any channels being measured has exceeded the alarm limit, and also when the channels being measured go back the normal range. This ensures that you always know whether the alarm limit has been exceeded.

LCD DISPLAY
User can press the button once to activate the LCD display and switch the displayed channel and functions. The LCD display will be closed automatically if not any button operations within 30 seconds.

- The real-time readings.
- LOG symbol shown when Logging mode. LOG symbol not shown when other modes.
- Up arrow shown when Logging mode or Finished mode: Some logged readings exceed the high limit.
- Down arrow shown when Logging mode or Finished mode: Some logged readings exceed the low limit.
NOTE: The LCD can't work at below -10 Celsius degree, and it will not display normally at the environment conditions.
For further information on the software, you can access the help menu on the software interface or other documents on the CD.



- Manual
- Data Logger
- PCE-CLL 1
- QUICK START GUIDE FOR DATA LOGGERS
- WELCOME
- IMPORT NOTES
- GETTING STARTED
- BATTERY INSTALLATION
- SOFTWARE INSTALLATION
- DRIVER INSTALLATION
- SETUP AND START
- DATA DOWNLOAD
- GRAPH
- FILE EXPORT
- BUTTON
- HOW TO GET RIGHT RESULTS
- RELATED DOCUMENTS
- ENVIRONMENTAL DISPOSAL
- LCD DISPLAY
Brand : PCE
Model : CLL 1
Category : Measurement