
PTP 820E - Network Equipment Cambium Networks - Free user manual and instructions
Find the device manual for free PTP 820E Cambium Networks in PDF.


| Product Type | Split-Mount Microwave Radio System (Indoor Unit IDU + Outdoor RFU) |
| Brand | Cambium Networks |
| Model | PTP 820E (with IDU variants PTP 820F/PTP 820G) |
| Dimensions (IDU) | Approx. 1U high, 19-inch rack mount (typical) |
| Weight (IDU) | Approx. 5-7 kg (varies by model) |
| Power Supply | DC input: -40 to -60 VDC (typical -48 VDC) with dual feed support |
| Power Consumption | ~70 W max (IDU only; RFU adds ~30 W) |
| Ethernet Interfaces | 4x Gigabit Ethernet (combo copper/SFP) + 2x management FE |
| Radio Interfaces | Up to 4 RFU ports (depending on IDU variant) |
| TDM Interfaces | Optional: up to 16 E1/DS1 ports |
| Frequency Bands | 6-38 GHz (depending on RFU) |
| Modulation | Adaptive Coding and Modulation (ACM) up to 4096 QAM |
| Capacity | Up to 2.5 Gbps aggregate (with multi-carrier) |
| Encryption | AES-256 payload encryption |
| Management | Web EMS, CLI (SSH/Telnet), SNMP v3, FTP/SFTP |
| Synchronization | IEEE 1588v2 TC/BC, SyncE, external timing |
| Redundancy | 1+1 HSB, unit redundancy, LAG, XPIC |
| Operating Temperature (IDU) | -5°C to +55°C |
| Operating Temperature (RFU) | -33°C to +55°C (varies by RFU) |
| Maintenance | Regularly check software updates; clean air filters; follow safety warnings |
| Safety Certifications | ETSI EN 300 019, FCC Part 101, CE; FIPS 140-2 optional |
| Spare Parts & Repairability | Field-replaceable SM card; RFU units; contact Cambium support |
Frequently Asked Questions - PTP 820E Cambium Networks
User questions about PTP 820E Cambium Networks
0 question about this device. Answer the ones you know or ask your own.
Ask a new question about this device
Download the instructions for your Network Equipment in PDF format for free! Find your manual PTP 820E - Cambium Networks and take your electronic device back in hand. On this page are published all the documents necessary for the use of your device. PTP 820E by Cambium Networks.
USER MANUAL PTP 820E Cambium Networks
natural_image
Street view with multiple surveillance cameras mounted on an elevated highway, blurred traffic and buildings in background (no visible text or symbols)
Cambium Networks™

natural_image
Aerial night view of a town nestled in a rocky valley with a river and hills in the background (no visible text or symbols)
natural_image
Young girl in blue shirt using tablet in classroom setting (no visible text or symbols)
natural_image
Overhead view of a group of people sitting at a table in an indoor setting, engaged in discussion or activity (no visible text or symbols)
natural_image
Scenic view of a small building with a tall tower in a desert landscape under a dramatic cloudy sky (no visible text or symbols)User Guide
PTP 820 Split-Mount System Release 11.3

natural_image
Two-panel image: top shows a coastal town with ships and greenery, bottom shows a man working at a desk with a laptop (no visible text or symbols)Accuracy
While reasonable efforts have been made to assure the accuracy of this document, Cambium Networks assumes no liability resulting from any inaccuracies or omissions in this document, or from use of the information obtained herein. Cambium reserves the right to make changes to any products described herein to improve reliability, function, or design, and reserves the right to revise this document and to make changes from time to time in content hereof with no obligation to notify any person of revisions or changes. Cambium does not assume any liability arising out of the application or use of any product, software, or circuit described herein; neither does it convey license under its patent rights or the rights of others. It is possible that this publication may contain references to, or information about Cambium products (machines and programs), programming, or services that are not announced in your country. Such references or information must not be construed to mean that Cambium intends to announce such Cambium products, programming, or services in your country.
Copyrights
This document, Cambium products, and 3 ^rd Party software products described in this document may include or describe copyrighted Cambium and other 3 ^rd Party supplied computer programs stored in semiconductor memories or other media. Laws in the United States and other countries preserve for Cambium, its licensors, and other 3 ^rd Party supplied software certain exclusive rights for copyrighted material, including the exclusive right to copy, reproduce in any form, distribute and make derivative works of the copyrighted material. Accordingly, any copyrighted material of Cambium, its licensors, or the 3 ^rd Party software supplied material contained in the Cambium products described in this document may not be copied, reproduced, reverse engineered, distributed, merged or modified in any manner without the express written permission of Cambium. Furthermore, the purchase of Cambium products shall not be deemed to grant either directly or by implication, estoppel, or otherwise, any license under the copyrights, patents or patent applications of Cambium or other 3rd Party supplied software, except for the normal non-exclusive, royalty free license to use that arises by operation of law in the sale of a product.
Restrictions
Software and documentation are copyrighted materials. Making unauthorized copies is prohibited by law. No part of the software or documentation may be reproduced, transmitted, transcribed, stored in a retrieval system, or translated into any language or computer language, in any form or by any means, without prior written permission of Cambium.
License Agreements
The software described in this document is the property of Cambium and its licensors. It is furnished by express license agreement only and may be used only in accordance with the terms of such an agreement.
High Risk Materials
Cambium and its supplier(s) specifically disclaim any express or implied warranty of fitness for any high risk activities or uses of its products including, but not limited to, the operation of nuclear facilities, aircraft navigation or aircraft communication systems, air traffic control, life support, or weapons systems ("High Risk Use"). Any High Risk is unauthorized, is made at your own risk and you shall be responsible for any and all losses, damage or claims arising out of any High Risk Use.
© 2019 Cambium Networks Limited. All Rights Reserved.
phn-3965_012v000
Contents
About This User Guide .... 1
Contacting Cambium Networks 2
Purpose 3
Cross references....3
Feedback 3
Problems and warranty....4
Reporting problems....4
Repair and service 4
Hardware warranty 4
Security advice .... 5
Warnings, cautions, and notes 6
Warnings 6
Cautions....6
Notes 6
Caring for the environment 7
In EU countries 7
In non-EU countries....7
Chapter 1: Introduction.... 1-1
Configuration Tips.... 1-2
System Overview 1-4
PTP 820F 1-4
PTP 820G 1-4
Assured Platform.... 1-5
PTP 820F IDU Hardware Architecture.... 1-6
Front Panel Description 1-7
Ethernet Traffic interfaces.... 1-8
Ethernet Management interfaces 1-8
Radio Interfaces.... 1-9
Power Interface 1-10
Synchronization Interface 1-10
Terminal Interface 1-10
External Alarms 1-10
Storage Memory Card 1-10
PTP 820G IDU Hardware Architecture 1-12
Front Panel Description 1-13
Ethernet Traffic Interfaces 1-14
Ethernet Management Interfaces 1-14
E1/DS1 Interface (Optional) 1-15
Radio Interfaces.... 1-15
Power Interface 1-15
Synchronization Interface 1-15
Terminal Interface 1-15
External Alarms 1-16
Storage Memory Card 1-16
RFU Overview 1-17
RFU's used with PTP 820F 1-17
IDU-RFU Connection and Power Supply for PTP 820F....1-17
IDU-RFU Connection and Power Supply for PTP 820G....1-18
The Web-Based Element Management System 1-19
Introduction to the Web EMS 1-19
Web EMS Page Layout.... 1-20
The Unit Summary Page 1-23
The Radio Summary Page 1-24
The Security Summary Page.... 1-25
Reference Guide to Web EMS Menu Structure 1-28
Chapter 2: Getting Started 2-1
Assigning IP Addresses in the Network.... 2-2
Establishing a Connection 2-3
Connecting to the Unit with a Serial Connection 2-3
Connecting to the Unit with a LAN Connection 2-4
Logging On 2-6
Changing Your Password.... 2-7
Applying a Pre-Defined Configuration File.... 2-8
Performing Quick Platform Setup 2-11
Configuring In-Band Management.... 2-15
Changing the Management IP Address.... 2-16
Configuring Unit Redundancy for the PTP 820G.... 2-17
Unit Redundancy Overview 2-17
Configuring Unit Redundancy 2-18
Cabling Requirements for Unit Redundancy 2-21
Configuring Ethernet Interface Protection 2-22
Enabling Unit Redundancy 2-23
Changing the Configuration after Enabling Unit Redundancy.... 2-25
Viewing the Configuration of the Standby Unit 2-25
Viewing Link and Protection Status and Activity 2-26
Switchover.... 2-26
Performing Lockout 2-27
Disabling Unit Redundancy 2-27
Determining ETSI or ANSI (FCC) TDM Mode 2-29
Configuring the Activation Key 2-30
Viewing the Activation Key Status Parameters 2-30
Entering the Activation Key.... 2-32
Activating a Demo Activation Key 2-32
Activation Key Reclaim 2-32
Displaying a List of Activation-Key-Enabled Features 2-33
Setting the Time and Date (Optional).... 2-38
Enabling the Interfaces (Interface Manager).... 2-40
Enabling the Second Management Interface 2-42
Configuring RFU3/SFP5,RFU3/2.5GE5 as an Ethernet or RFU Interface(PTP 820F only)....2-43
Configuring Cascading Interfaces (Optional) 2-45
Configuring the Radio Parameters.... 2-47
Enabling Link ID Mismatch Security 2-49
Entering Radio View (CLI) 2-50
Muting and Unmuting the Radio (CLI).... 2-51
Configuring the Transmit (TX) Frequency (CLI) 2-51
Configuring the Transmit (TX) Level (CLI) 2-52
Configuring the Radio (MRMC) Script(s) 2-53
Enabling ACM with Adaptive Transmit Power 2-61
Operating in FIPS Mode 2-62
Requirements for FIPS Compliance 2-62
Encrypting the External Protection Link.... 2-64
Initial Configuration of FIPS-Compliant Unit Redundancy Configuration 2-64
Replacing a Unit in a FIPS-Compliant Unit Redundancy Configuration.... 2-65
Configuring Grouping (Optional) 2-66
Creating Service(s) for Traffic 2-67
Chapter 3: Configuration Guide.... 3-1
System Configurations.... 3-2
Radio Configurations 3-2
TDM Configurations 3-3
Configuring a Link Using the Quick Configuration Wizard 3-5
Configuring a 1+0 Link Using the Quick Configuration Wizard.... 3-5
Configuring a 1+0 (Repeater) Link Using the Quick Configuration Wizard.... 3-10
Configuring a 1+1 HSB Link Using the Quick Configuration Wizard 3-14
Configuring a 1+1 HSB-SD Link Using the Quick Configuration Wizard.... 3-18
Configuring an N+0 Multi-Carrier ABC Link Using the Quick Configuration Wizard.... 3-22
Configuring a 1+0 Link.... 3-32
Configuring Multi-Carrier ABC 3-33
Multi-Carrier ABC Overview 3-33
Configuring a Multi-Carrier ABC Group.... 3-33
Configuring the Multi-Carrier ABC Minimum Bandwidth Override Option 3-36
Deleting a Multi-Carrier ABC Group 3-38
Configuring Link Aggregation (LAG) and LACP 3-39
LAG Overview 3-39
Configuring a LAG Group.... 3-40
Enabling and Disabling LAG Group Shutdown in case of Degradation Event 3-44
Configuring Enhanced LAG Distribution 3-45
Deleting a LAG Group 3-46
Displaying LACP Parameters and Statistics 3-46
Displaying LACP Aggregation Status Parameters 3-46
Displaying LACP Port Status Parameters 3-47
Displaying LACP Port Statistics 3-50
Displaying LACP Port Debug Statistics 3-51
Configuring XPIC 3-53
Prerequisites for XPIC 3-53
Configuring the Carriers 3-53
Creating an XPIC Group 3-54
Performing Antenna Alignment for XPIC.... 3-56
Deleting an XPIC Group 3-57
Configuring HSB Radio Protection 3-58
HSB Radio Protection Overview 3-58
Configuring 1+1 HSB without Space Diversity 3-58
Configuring 1+1 HSB with Space Diversity 3-61
Copying Configuration to Mate 3-63
Revertive Mode 3-65
Switchovers and Lockout.... 3-66
Deleting an HSB Radio Protection Group without Space Diversity 3-67
Deleting an HSB Radio Protection Group with Space Diversity.... 3-67
Configuring IF Combining 3-68
Chapter 4: Unit Management.... 4-1
Defining the IP Protocol Version for Initiating Communications.... 4-2
Configuring the Remote Unit's IP Address.... 4-3
Configuration SNMP 4-6
Configuring Trap Managers 4-9
Configuring the Internal Ports for FTP or SFTP 4-11
Installing and Configuring an FTP or SFTP Server 4-12
Upgrading the Software 4-15
Viewing Current Software Versions 4-15
Software Upgrade Overview 4-17
Downloading and Installing Software 4-18
Configuring a Timed Installation 4-25
Installing RFU Software 4-26
Backing Up and Restoring Configurations.... 4-27
Configuration Management Overview 4-27
Viewing Current Backup Files 4-27
Setting the FTP/SFTP Configuration Management Parameters 4-28
Exporting a Configuration File 4-31
Importing a Configuration File 4-31
Deleting a Configuration File.... 4-32
Backing Up the Current Configuration 4-32
Restoring a Saved Configuration 4-33
Setting the Unit to the Factory Default Configuration.... 4-34
Performing a Hard (Cold) Reset 4-35
Configuring Unit Parameters 4-36
Configuring NTP 4-38
Displaying Unit Inventory 4-42
Defining a Login Banner.... 4-43
Chapter 5: Radio Configuration .... 5-1
Viewing the Radio Status and Settings 5-2
Configuring the IDU-RFU Connection (PTP 820F only) 5-5
Configuring the Remote Radio Parameters 5-8
Displaying Communication Status with Remote Radio (CLI) 5-10
Displaying Remote Radio's Link ID and Location (CLI) 5-10
Muting and Unmuting the Remote Radio (CLI) 5-10
Displaying the Remote Radio's RX Level (CLI) 5-11
Configuring the Remote Radio's TX Level (CLI) 5-11
Configuring Remote ATPC (CLI) 5-11
Configuring ATPC and Override Timer 5-12
Configuring Header De-Duplication 5-15
Configuring Frame Cut-Through 5-17
Viewing Header De-Duplication and Frame Cut-Through Counters 5-19
Configuring AES-256 Payload Encryption 5-22
Configuring and Viewing Radio PMs and Statistics 5-26
Configuring BER Thresholds and Displaying Current BER.... 5-26
Displaying MRMC Status 5-28
Displaying MRMC PMs 5-29
Displaying Defective Block Counters 5-31
Displaying Signal Level PMs and Configuring Signal Level PM Thresholds 5-32
Displaying PMs for the Combined IF Combining Signal.... 5-36
Displaying Modem BER (Aggregate) PMs 5-37
Displaying MSE PMs and Configuring MSE PM Thresholds 5-40
Displaying XPI PMs and Configuring XPI PM Thresholds 5-41
Displaying Traffic PMs 5-43
Chapter 6: Ethernet Services and Interfaces ...... 6-1
Configuring Ethernet Service(s) 6-2
Ethernet Services Overview 6-2
General Guidelines for Provisioning Ethernet Services....6-2
The Ethernet Services Page 6-3
Adding an Ethernet Service 6-4
Editing a Service 6-6
Deleting a Service 6-6
Enabling, Disabling, or Deleting Multiple Services 6-6
Viewing Service Details 6-7
Configuring Service Points....6-8
Setting the MRU Size and the S-VLAN Ethertype.... 6-22
Configuring Ethernet Interfaces.... 6-24
Configuring Automatic State Propagation and Link Loss Forwarding.... 6-27
Viewing Ethernet PMs and Statistics 6-31
RMON Statistics.... 6-31
Egress CoS Statistics 6-32
Port TX Statistics.... 6-35
Port RX Statistics 6-38
Chapter 7: Quality of Service (QoS) 7-1
QoS Overview 7-2
Configuring Classification.... 7-4
Classification Overview 7-4
Configuring Ingress Path Classification on a Logical Interface 7-5
Modifying the C-VLAN 802.1Q UP and CFI Bit Classification Table 7-8
Modifying the S-VLAN 802.1 UP and DEI Bit Classification Table....7-9
Modifying the DSCP Classification Table 7-10
Modifying the MPLS EXP Bit Classification Table 7-12
Configuring Policers (Rate Metering).... 7-16
Policer (Rate Metering) Overview 7-16
Configuring Policer Profiles 7-16
Assigning Policers to Interfaces.... 7-19
Configuring the Ingress and Egress Byte Compensation....7-22
Configuring Marking 7-23
Marking Overview 7-23
Enabling Marking....7-23
Modifying the 802.1Q Marking Table 7-23
Modifying the 802.1AD Marking Table 7-25
Configuring WRED.... 7-26
WRED Overview 7-26
Configuring WRED Profiles 7-26
Assigning WRED Profiles to Queues 7-29
Configuring Egress Shaping....7-30
Egress Shaping Overview.... 7-30
Configuring Queue Shaper Profiles 7-30
Configuring Service Bundle Shaper Profiles 7-33
Assigning a Queue Shaper Profile to a Queue.... 7-34
Assigning a Service Bundle Shaper Profile to a Service Bundle.... 7-37
Configuring Scheduling 7-39
Scheduling Overview 7-39
Configuring Priority Profiles 7-39
Configuring WFQ Profiles 7-43
Assigning a Priority Profile to an Interface.... 7-45
Assigning a WFQ Profile to an Interface.... 7-45
Configuring and Displaying Queue-Level PMs 7-47
Chapter 8: Ethernet Protocols 8-1
Configuring G.8032 8-2
G.8032 Overview 8-2
Configuring the Destination MAC Address.... 8-3
Adding ERPIs....8-4
Configuring the RPL Owner 8-8
Configuring Timers 8-9
Viewing the ERPI Configuration and Status Parameters 8-9
Viewing ERPI State Information 8-11
Initiating a Manual or Forced Switch and Clearing the Switch or Initiating Reversion 8-12
Blocking or Unblocking R-APS Messages on a Service Point 8-12
Viewing ERPI Statistics....8-12
Configuring MSTP 8-14
MSTP Overview 8-15
Mapping Ethernet Services to MSTP instances (MSTIs) 8-15
Configuring the MSTP Bridge Parameters.... 8-17
Configuring the MSTP Port Parameters 8-27
Configuring LLDP 8-36
LLDP Overview....8-36
Displaying Peer Status 8-36
Configuring the General LLDP Parameters.... 8-37
Configuring the LLDP Port Parameters.... 8-39
Displaying the Unit's Management Parameters.... 8-41
Displaying Peer Unit's Management Parameters.... 8-44
Displaying the Local Unit's Parameters.... 8-45
Displaying LLDP Statistics 8-50
Chapter 9: TDM Services and Interfaces 9-1
TDM Overview 9-2
Configuring the E1/DS1 Interface 9-3
Configuring Native TDM Trails 9-7
Native TDM Trail Configuration Overview 9-7
General Guidelines for Provisioning TDM Services 9-9
Viewing TDM Trails....9-9
Configuring the Revertive Timer 9-10
Adding TDM Trails 9-10
Editing TDM Trails 9-19
Deleting TDM Trails 9-21
Limitations on Available Endpoints 9-21
Configuring TDM Pseudowire Services 9-22
TDM Pseudowire Services Configuration Overview 9-23
General Guidelines for Provisioning TDM Pseudowire Services 9-23
Viewing TDM Pseudowire Services 9-24
Configuring the Revertive Timer 9-26
Adding TDM Pseudowire Services.... 9-26
Editing TDM Pseudowire Services 9-36
Deleting TDM Pseudowire Services.... 9-38
Limitations on Available Endpoints 9-38
Configuring Advanced Pseudowire Parameters 9-39
Configuring Pseudowire Card Parameters 9-39
Configuring OEM for Pseudowire Services.... 9-41
Configuring Pseudowire Tunnels and Tunnel Groups 9-47
Configuring Pseudowire Profiles 9-56
Configuring Pseudowire TDM Services Manually 9-60
Displaying TDM PMs 9-66
Displaying E1/DS1 PMs 9-66
Displaying Native TDM Service PMs 9-68
Displaying Pseudowire Service PMs 9-69
Chapter 10: Synchronization....10-1
Configuring the Sync Source 10-2
Viewing the Sync Source Status 10-2
Adding a Sync Source 10-3
Editing a Sync Source.... 10-4
Deleting a Sync Source 10-5
Configuring the Outgoing Clock and SSM Messages 10-6
Configuring 1588 Transparent Clock.... 10-9
Configuring 1588 Boundary Clock.... 10-12
Enabling Boundary Clock.... 10-12
Displaying and Setting the Boundary Clock Default Parameters 10-15
Displaying the Boundary Clock Advanced Parameters.... 10-16
Displaying the Boundary Clock Port Parameters.... 10-18
Displaying the Boundary Clock Port Statistics.... 10-19
Disabling 1588 PTP 10-20
Chapter 11: Access Management and Security....11-1
Quick Security Configuration 11-2
Quick Security Configuration – General Parameters Page 11-2
Quick Security Configuration – Protocols Page 11-3
Quick Security Configuration – RSA Key & Certificate Page 11-5
Configuring the General Access Control Parameters.... 11-6
Configuring the Password Security Parameters.... 11-8
Configuring the Session Timeout 11-9
Configuring Users.... 11-10
User Configuration Overview 11-10
Configuring User Profiles.... 11-10
Configuring Users Accounts 11-13
Configuring RADIUS 11-16
RADIUS Overview 11-16
Activating RADIUS Authentication 11-16
Configuring the RADIUS Server Attributes 11-17
Viewing RADIUS User Permissions and Connectivity 11-18
Configuring a RADIUS Server 11-20
Configuring X.509 CSR Certificates and HTTPS 11-39
Generating a Certificate Signing Request (CSR) File.... 11-39
Downloading a Certificate.... 11-42
Blocking Telnet Access 11-44
Uploading the Security Log 11-45
Uploading the Configuration Log 11-48
Chapter 12: Alarm Management and Troubleshooting....12-1
Viewing Current Alarms 12-2
Viewing Alarm Statistics.... 12-4
Viewing the Event Log.... 12-5
Editing Alarm Text and Severity 12-7
Displaying Alarm Information 12-7
Viewing the Probable Cause and Corrective Actions for an Alarm Type.... 12-8
Editing an Alarm Type 12-8
Setting Alarms to their Default Values 12-9
Configuring External Alarms 12-10
Configuring Input Alarms 12-10
Configuring Voltage Alarm Thresholds and Masking Undervoltage Alarms 12-12
Configuring the Output Alarm.... 12-14
Uploading Unit Info.... 12-16
Uploading a Unit Info File Via HTTP or HTTPS 12-17
Uploading a Unit Info File Via FTP or SFTP 12-18
Performing Diagnostics.... 12-20
Performing Radio Loopback 12-20
Performing Ethernet Loopback 12-22
Performing TDM Diagnostics.... 12-24
Configuring Service OAM (SOAM) Fault Management (FM) 12-26
Chapter 13: Web EMS Utilities....13-1
Restarting the HTTP Server 13-2
Calculating an ifIndex.... 13-3
Displaying, Searching, and Saving a list of MIB Entities 13-4
Chapter 14: Getting Started (CLI)....14-1
Establishing a Connection (CLI) 14-2
Logging On (CLI) 14-3
General CLI Commands.... 14-4
Changing Your Password (CLI) 14-5
Configuring In-Band Management (CLI).... 14-6
Changing the Management IP Address (CLI).... 14-7
Configuring Unit Redundancy for the PTP 820 Split Mount (CLI) 14-9
Configuring Unit Redundancy (CLI) 14-9
Configuring Ethernet Interface Protection (CLI).... 14-10
Enabling Unit Redundancy (CLI) 14-11
Changing the Configuration after Enabling Unit Redundancy (CLI) 14-12
Running Commands in the Standby Unit (CLI) 14-12
Viewing Link and Protection Status and Activity (CLI).... 14-13
Switchover (CLI) 14-13
Performing Lockout (CLI).... 14-14
Disabling Unit Redundancy (CLI) 14-14
Configuring the Activation Key (CLI) 14-16
Activation Key Overview (CLI) 14-16
Installing an Activation Key (CLI) 14-17
Displaying Activation Key Information (CLI) 14-17
Activating an Activation Key (CLI).... 14-17
Setting the Time and Date (Optional) (CLI).... 14-19
Enabling the Interfaces (Interface Manager) (CLI) 14-22
Enabling the Second Management Interface (CLI).... 14-23
Configuring Cascading Interfaces (Optional) (CLI) 14-24
Entering Radio View (CLI).... 14-25
Unmuting a Radio (CLI) 14-26
Configuring the Transmit (TX) Level (CLI).... 14-27
Configuring the Transmit (TX) Frequency (CLI) 14-28
Configuring the Radio (MRMC) Script(s) (CLI).... 14-29
Displaying Available MRMC Scripts (CLI).... 14-29
Assigning an MRMC Script to a Radio Carrier (CLI) 14-31
Enabling ACM with Adaptive Transmit Power (CLI) 14-33
Configuring the RSL Threshold Alarm (CLI) 14-34
Operating in FIPS Mode (CLI) 14-35
Requirements for FIPS Compliance (CLI).... 14-35
For a full list of FIPS requirements, refer to the Cambium PTP 820 FIPS 140-2 Security Policy, available upon request. It is the responsibility of the customer to ensure that these requirements are met..... 14-35
PTP 820G unit redundancy configurations can be configured to be FIPS 140-2-compliant. This requires encryption of the protection link between the two units. See Encrypting the External Protection Link (CLI). 14-35
For details on hardware requirements for operating in FIPS mode, see Requirements for FIPS Compliance. 14-35
Enabling FIPS Mode (CLI) 14-35
Chapter 15: Configuration Guide (CLI)....15-1
System Configurations (CLI) 15-2
Radio Configurations (CLI) 15-2
TDM Configurations 15-3
Configuring a 1+0 Link (CLI) 15-4
Configuring Multi-Carrier ABC (CLI) 15-5
Multi-Carrier ABC Overview (CLI) 15-5
Configuring a Multi-Carrier ABC Group (CLI).... 15-5
Removing Members from a Multi-Carrier ABC Group (CLI) 15-7
Deleting a Multi-Carrier ABC Group (CLI) 15-7
Configuring Link Aggregation (LAG) and LACP (CLI).... 15-9
LAG Overview (CLI) 15-9
Configuring a LAG Group (CLI).... 15-10
Configuring LACP (CLI) 15-12
Enabling and Disabling the LAG Group Shutdown in case of Degradation Event Option (CLI) 15-12
Configuring Enhanced LAG Distribution (CLI) 15-14
Deleting a LAG Group (CLI) 15-15
Displaying LACP Parameters and Statistics (CLI) 15-15
Configuring XPIC (CLI) 15-20
Prerequisites for XPIC (CLI).... 15-20
Configuring the Carriers (CLI) 15-20
Creating an XPIC Group (CLI) 15-21
Performing Antenna Alignment for XPIC (CLI).... 15-21
Deleting an XPIC Group (CLI) 15-22
Configuring HSB Radio Protection (CLI) 15-23
HSB Radio Protection Overview (CLI) 15-23
Configuring 1+1 HSB without Space Diversity (CLI).... 15-23
Configuring 1+1 HSB with Space Diversity (CLI) 15-24
Copying Configuration to Mate (CLI) 15-25
Revertive Mode (CLI) 15-25
Switchovers and Lockout (CLI).... 15-26
Deleting an HSB Radio Protection Group (CLI) without Space Diversity 15-27
Deleting an HSB Radio Protection Group with Space Diversity (CLI).... 15-27
Chapter 16: Unit Management (CLI)....16-1
Defining the IP Protocol Version for Initiating Communications (CLI)....16-2
Configuring the Remote Unit's IP Address (CLI).... 16-3
Configuring the Remote Radio's IP Address in IPv4 format (CLI) 16-3
Configuring the Remote Radio's IP Address in IPv6 format (CLI) 16-4
Configuring SNMP (CLI) 16-6
Configuring SNMP (CLI) 16-6
Defining the SNMP Parameters (CLI).... 16-6
Displaying the SNMP Settings (CLI) 16-8
Configuring Trap Managers (CLI).... 16-8
Configuring the Internal Ports for FTP or SFTP (CLI) 16-9
Upgrading the Software (CLI).... 16-10
Software Upgrade Overview (CLI) 16-10
Displaying Current Software Versions (CLI).... 16-11
Configuring a Software Download (CLI) 16-12
Downloading a Software Package (CLI).... 16-13
Installing and Upgrading Software (CLI) 16-14
Installing and Upgrading Software in the RFU (CLI) 16-14
Backing Up and Restoring Configurations (CLI) 16-17
Configuration Management Overview (CLI).... 16-17
Setting the Configuration Management Parameters (CLI).... 16-17
Backing up a Configuration File (CLI).... 16-19
Importing and Restoring a Configuration File (CLI) 16-22
Editing CLI Scripts (CLI).... 16-24
Setting the Unit to the Factory Default Configuration (CLI).... 16-25
Performing a Hard (Cold) Reset (CLI) 16-26
Configuring Unit Parameters (CLI) 16-27
Configuring NTP (CLI) 16-29
Displaying Unit Inventory (CLI) 16-31
Chapter 17: Radio Configuration (CLI)....17-1
Viewing the Radio Status and Settings (CLI) 17-2
Configuring the Remote Radio Parameters (CLI) 17-4
Displaying Communication Status with the Remote Radio (CLI).... 17-4
Displaying the Remote Radio's Link ID and Location (CLI) 17-4
Muting and Unmuting the Remote Radio (CLI) 17-4
Displaying the Remote Radio's RX Level (CLI) 17-5
Configuring the Remote Radio's TX Level (CLI) 17-5
Configuring Remote ATPC (CLI) 17-5
Configuring ATPC and Override Timer (CLI) 17-7
Configuring Header De-Duplication (CLI) 17-10
Displaying Header De-Duplication Information (CLI) 17-11
Configuring Frame Cut-Through (CLI) 17-13
Configuring AES-256 Payload Encryption (CLI) 17-14
Configuring and Viewing Radio PMs and Statistics (CLI).... 17-18
Displaying General Modem Status and Defective Block PMs(CLI) 17-18
Displaying Excessive BER (Aggregate) PMs (CLI) 17-19
Displaying BER Level and Configuring the Excessive BER Thresholds (CLI) 17-21
Configuring RSL Thresholds (CLI).... 17-22
Configuring TSL Thresholds (CLI) 17-23
Displaying RSL and TSL Levels (CLI).... 17-23
Configuring the Signal Level Threshold (CLI) 17-24
Configuring the MSE Thresholds and Displaying the MSE PMs (CLI).... 17-25
Displaying ACM PMs (CLI).... 17-27
Configuring the XPI Thresholds and Displaying the XPI PMs (CLI).... 17-28
Chapter 18: Ethernet Services and Interfaces (CLI)....18-1
Configuring Ethernet Services (CLI).... 18-2
Ethernet Services Overview (CLI) 18-2
General Guidelines for Provisioning Ethernet Services (CLI).... 18-2
Defining Services (CLI) 18-3
Configuring Service Points (CLI).... 18-10
Defining the MAC Address Forwarding Table for a Service (CLI).... 18-26
Setting the MRU Size and the S-VLAN Ethertype (CLI).... 18-30
Configuring the S-VLAN Ethertype (CLI) 18-30
Configuring the C-VLAN Ethertype (CLI).... 18-31
Configuring the MRU (CLI).... 18-31
Configuring Ethernet Interfaces (CLI).... 18-32
Entering Interface View (CLI).... 18-32
Displaying the Operational State of the Interfaces in the Unit (CLI) 18-33
Viewing Interface Attributes (CLI) 18-34
Configuring an Interface's Media Type (CLI) 18-34
Configuring an Interface's Speed and Duplex State (CLI).... 18-34
Configuring an Interface's Auto Negotiation State (CLI) 18-35
Configuring an Interface's IFG (CLI) 18-36
Configuring an Interface's Preamble (CLI).... 18-36
Adding a Description for the Interface (CLI).... 18-36
Configuring Automatic State Propagation and Link Loss Forwarding (CLI).... 18-38
Configuring Automatic State Propagation to an Ethernet Port (CLI) 18-38
Viewing Ethernet PMs and Statistics (CLI) 18-41
Displaying RMON Statistics (CLI) 18-41
Configuring Ethernet Port PMs and PM Thresholds (CLI) 18-42
Displaying Ethernet Port PMs (CLI) 18-42
Clearing Ethernet Port PMs (CLI).... 18-45
Chapter 19: Quality of Service (QoS) (CLI) ......19-1
Configuring Classification (CLI).... 19-2
Classification Overview (CLI) 19-2
Configuring Ingress Path Classification on a Logical Interface (CLI) 19-2
Configuring VLAN Classification and Override (CLI) 19-3
Configuring 802.1p Classification (CLI)....19-4
Configuring DSCP Classification (CLI).... 19-8
Configuring MPLS Classification (CLI) 19-11
Configuring a Default CoS (CLI) 19-12
Configuring Ingress Path Classification on a Service Point (CLI).... 19-13
Configuring Ingress Path Classification on a Service (CLI).... 19-13
Configuring Policers (Rate Metering) (CLI).... 19-14
Overview of Rate Metering (Policing) (CLI) 19-14
Configuring Rate Meter (Policer) Profiles (CLI) 19-14
Displaying Rate Meter Profiles (CLI) 19-16
Deleting a Rate Meter Profile (CLI).... 19-16
Attaching a Rate Meter (Policer) to an Interface (CLI) 19-17
Configuring the Line Compensation Value for a Rate Meter (Policer) (CLI) 19-21
Displaying Rate Meter Statistics for an Interface (CLI).... 19-24
Configuring Marking (CLI) 19-26
Marking Overview (CLI) 19-26
Configuring Marking Mode on a Service Point (CLI).... 19-26
Marking Table for C-VLAN UP Bits (CLI).... 19-27
Marking Table for S-VLAN UP Bits (CLI) 19-29
Configuring WRED (CLI).... 19-31
WRED Overview (CLI) 19-31
Configuring WRED Profiles (CLI) 19-31
Assigning a WRED Profile to a Queue (CLI) 19-33
Configuring Shapers (CLI).... 19-35
Overview of Egress Shaping (CLI) 19-35
Configuring Service Bundle Shapers (CLI).... 19-38
Configuring Egress Line Compensation for Shaping (CLI).... 19-41
Configuring Scheduling (CLI) 19-42
Overview of Egress Scheduling (CLI).... 19-42
Configuring Queue Priority (CLI).... 19-42
Configuring Interface Priority Profiles (CLI).... 19-43
Attaching a Priority Profile to an Interface (CLI) 19-46
Configuring Weighted Fair Queuing (WFQ) (CLI) 19-46
Displaying Egress Statistics (CLI) 19-51
Displaying Queue-Level PMs (CLI) 19-51
Configuring and Displaying Queue-Level PMs (CLI).... 19-52
Displaying Service Bundle-Level PMs (CLI) 19-57
Chapter 20: Ethernet Protocols (CLI)....20-1
Configuring G.8032 (CLI) 20-2
Configuring the Destination MAC Address (CLI).... 20-2
Configuring ERPIs (CLI) 20-2
Configuring the RPL Owner (CLI) 20-4
Configuring Timers (CLI) 20-5
Initiating a Manual or Forced Switch and Clearing the Switch or Initiating Reversion (CLI) 20-6
Blocking or Unblocking R-APS Messages on a Service Point (CLI) 20-7
Displaying the ERPI Attributes (CLI).... 20-8
Configuring MSTP (CLI) 20-14
Configuring the MSTP Bridge Parameters (CLI).... 20-14
Configuring the MSTP Port Parameters (CLI) 20-22
Configuring LLDP (CLI) 20-28
Configuring the General LLDP Parameters (CLI) 20-28
Displaying the General LLDP Parameters (CLI) 20-29
Configuring LLDP Port Parameters (CLI) 20-30
Displaying the LLDP Local System Parameters (CLI) 20-31
Displaying the LLDP Remote System Parameters (CLI) 20-34
Displaying LLDP Statistics (CLI) 20-37
Chapter 21: TDM Services and Interfaces (CLI) 21-1
TDM Overview (CLI) 21-2
Configuring the Unit to Operate in ANSI Mode (CLI) 21-3
Configuring TDM Cards and Interfaces (CLI) 21-4
Configuring the E1/DS1 Interface (CLI).... 21-4
Configuring the E1/DS1 Parameters (CLI) 21-4
Configuring Native TDM Trails (CLI) 21-8
Configuring TDM Pseudowire Services (CLI) 21-9
Configuring Pseudowire Tunnels (CLI) 21-9
Configuring Pseudowire Profiles (CLI) 21-12
Configuring Ethernet Services for TDM Traffic (CLI).... 21-12
Configuring Pseudowire Path Protection and Dual Homing (CLI) 21-13
Manually Configuring Pseudowire Services (CLI) 21-21
Displaying TDM PMs (CLI) 21-25
Chapter 22: Synchronization (CLI)....22-1
Configuring the Sync Source (CLI) 22-2
Configuring an Ethernet Interface as a Synchronization Source (CLI).... 22-2
Configuring a Radio Interface as a Synchronization Source (CLI) 22-4
Clearing All Sync Sources (CLI).... 22-5
Configuring the Outgoing Clock (CLI) 22-6
Configuring SSM Messages (CLI) 22-8
Configuring the Revertive Timer (CLI).... 22-9
Displaying Synchronization Status and Parameters (CLI).... 22-10
Configuring 1588 Transparent Clock (CLI).... 22-12
Configuring 1588 Boundary Clock (CLI)....22-15
Enabling Boundary Clock (CLI) 22-15
Displaying and Setting the Boundary Clock Default Parameters (CLI) 22-18
Displaying the Boundary Clock Advanced Parameters (CLI).... 22-20
Displaying the Boundary Clock Port Parameters (CLI).... 22-22
Displaying the Boundary Clock Port Statistics (CLI) 22-23
Disabling Boundary Clock (CLI) 22-25
Chapter 23: Access Management and Security (CLI)....23-1
Configuring the General Access Control Parameters (CLI).... 23-2
Configuring the Inactivity Timeout Period (CLI) 23-2
Configuring Blocking Upon Login Failure (CLI) 23-2
Configuring Blocking of Unused Accounts (CLI) 23-3
Configuring the Password Security Parameters (CLI) 23-5
Configuring Password Aging (CLI) 23-5
Configuring Password Strength Enforcement (CLI) 23-5
Forcing Password Change Upon First Login (CLI) 23-6
Displaying the System Password Settings (CLI) 23-6
Configuring Users (CLI) 23-7
User Configuration Overview (CLI) 23-7
Configuring User Profiles (CLI) 23-8
Configuring User Accounts (CLI) 23-9
Configuring RADIUS (CLI) 23-11
RADIUS Overview (CLI) 23-11
Activating RADIUS Authentication (CLI) 23-11
Configuring the RADIUS Server Attributes (CLI) 23-11
Viewing RADIUS Access Control and Server Attributes (CLI).... 23-12
Viewing RADIUS User Permissions and Connectivity (CLI) 23-12
Configuring X.509 CSR Certificates and HTTPS (CLI) 23-14
Generating a Certificate Signing Request (CSR) File (CLI).... 23-14
Downloading a Certificate (CLI) 23-16
Enabling HTTPS (CLI) 23-18
Configuring HTTPS Cipher Hardening (CLI) 23-19
Blocking Telnet Access (CLI) 23-19
Uploading the Security Log (CLI) 23-20
Uploading the Configuration Log (CLI).... 23-22
Chapter 24: Alarm Management and Troubleshooting (CLI) 24-1
Viewing Current Alarms (CLI) 24-2
Viewing the Event Log (CLI) 24-3
Editing Alarm Text and Severity (CLI).... 24-4
Displaying Alarm Information (CLI) 24-4
Editing an Alarm Type (CLI) 24-4
Setting Alarms to their Default Values (CLI) 24-5
Configuring a Timeout for Trap Generation (CLI) 24-6
Disabling Alarms and Events (CLI) 24-7
Configuring Voltage Alarm Thresholds and Displaying Voltage Threshold PMs (CLI) 24-8
Uploading Unit Info (CLI) 24-9
Activating the Radio Logger (CLI) 24-11
Performing Diagnostics (CLI) 24-12
Performing Radio Loopback (CLI) 24-12
Performing Ethernet Loopback (CLI) 24-13
Performing TDM Diagnostics (CLI).... 24-14
Configuring Service OAM (SOAM) Fault Management (FM) (CLI) 24-15
Working in CW Mode (Single or Dual Tone) (CLI) 24-30
Chapter 25: Fault Finding....25-1
Temperature Ranges 25-2
Troubleshooting Tips 25-3
Chapter 26: Replacing an IDU or SM card....26-1
Replacing an IDU or SM-Card on an PTP 820F IDU.... 26-1
Replacing an IDU or SM-Card on an PTP 820G IDU 26-3
Chapter 27: Pin-Outs and LEDs – PTP 820G ......27-1
Ethernet Pin-Outs and LEDs – PTP 820G.... 27-2
Ethernet Traffic Interface Pin-Outs 27-2
Ethernet Traffic Interface LEDs.... 27-2
Ethernet Management Interface Pin-Outs 27-4
Ethernet Management Interface LEDs 27-4
E1/DS1 Pin-Outs and LEDs – PTP 820G 27-6
E1/DS1 Interface Pin-Outs 27-6
E1/DS1 Interface LEDs 27-8
Radio Interface LEDs – PTP 820G 27-9
Synchronization Interface Pin-Outs and LEDs – PTP 820G.... 27-10
Synchronization Interface Pin-Outs 27-10
Synchronization Interface LEDs.... 27-10
Power Interface LEDs – PTP 820G.... 27-12
Terminal Interface Pin-Outs – PTP 820G.... 27-13
External Alarms – PTP 820G.... 27-14
External Alarm Pin-Outs 27-14
Unit/ACT LED PTP 820G 27-15
Chapter 28: Pin-Outs and LEDs – PTP 820F ......28-16
Ethernet LEDs and Pin-Outs – PTP 820F 28-17
Ethernet Traffic Interface Pin-Outs 28-17
Ethernet Traffic Interface LEDs.... 28-17
Management Interface Pin-Outs 28-19
Management Interface LEDs 28-19
E1/DS1 Interface LEDs and Pin-Outs – PTP 820F 28-20
E1/DS1 Interface Pin-Outs 28-20
E1/DS1 Interface LEDs 28-22
Radio Interface LEDs and Pin-Outs – PTP 820F 28-24
Radio RJ-45 Interface Pin-Outs 28-24
Radio Interface LEDs.... 28-24
Power Interface LEDs – PTP 820-F 28-26
Synchronization Interface LEDs and Pin-Outs – PTP 820F 28-27
Synchronization Interface Pin-Outs.... 28-27
Synchronization Interface LEDs.... 28-27
Terminal Interface Pin-Outs – PTP 820F 28-29
External Alarm Pin-Outs – PTP 820F 28-30
Unit/ACT LED – PTP 820F 28-31
Chapter 29: Alarms List....29-1
Glossary....
List of Figures
Figure 1 PTP 820F Front Panel and Interface 1-7
Figure 2 GbE Combo Interface Numbering....1-8
Figure 3 RFU3/ SFP5-6 Interfaces 1-8
Figure 4 Management Interface Pin Connections 1-9
Figure 5 SM Card and Cover 1-11
Figure 6 PTP 820G Front Panel and Interfaces 1-13
Figure 7 Management Interface Pin Connections 1-14
Figure 8 Main Web EMS Page.... 1-20
Figure 9 Displaying a Representation of the Front Panel 1-21
Figure 10 Main Web EMS Page with Representation of the Front Panel- PTP 820F....1-21
Figure 11 Main Web EMS Page with Representation of the Front Panel- PTP 820G 1-21
Figure 12 Related Pages Drop-Down List.... 1-22
Figure 13 Unit Summary Page 1-23
Figure 14 Unit Summary Page – Customizing collums.... 1-24
Figure 15 Radio Summary Page 1-24
Figure 16 Unit & Radio Summary Page – Customizing Columns .... 1-25
Figure 16 Security Summary Page 1-25
Figure 16 Security Summary Page – FIPS Security Warnings.... 1-26
Figure 16 Security Summary Page – Customizing Columns.... 1-27
Figure 17 Terminal Interface on Front Panel – PTP 820F 2-3
Figure 18 Terminal Interface on Front Panel – PTP 820G.... 2-3
Figure 19 Management Interface on Front Panel PTP 820F.... 2-4
Figure 20 Management Interface on Front Panel PTP 820G 2-4
Figure 21 Login Page.... 2-6
Figure 22 Change User Password Page.... 2-7
Figure 22 Change User Password Page.... 2-9
Figure 22 Quick Configuration – From File Page – Configuration File Loaded.... 2-9
Figure 23 Quick Configuration – Platform Setup Page 2-12
Figure 24 Quick Configuration – Platform Setup Summary Page 2-14
Figure 25 Local Networking Configuration Page.... 2-16
Figure 26 PTP 820G with Unit Redundancy – Protection and Management Splitter Connection.... 2-22
Figure 27 Logical Interfaces – Edit Page 2-23
Figure 28 Unit Redundancy Page.... 2-24
Figure 29 Standby Tab of Unit Redundancy Page.... 2-26
Figure 30 Activation Key Configuration Page 2-31
Figure 31 Activation Key Overview Page 2-33
Figure 32 Time Services Page.... 2-38
Figure 33 Interface Manager Page PTP 820F.... 2-41
Figure 34 Interface Manager Page – PTP 820G 2-41
Figure 35 Interface Manager – Edit Page.... 2-42
Figure 36 Multiple Selection Operation Section (Interface Manager Page)....2-42
Figure 37 Cascading Interfaces Page 2-45
Figure 38 Cascading Port Configuration Table – Edit Page.... 2-46
Figure 39 Radio Parameters Page....2-47
Figure 40 Radio Parameters Configuration Page.... 2-48
Figure 41 MRMC Symmetrical Scripts Page (ETSI) – PTP 820F 2-53
Figure 42 MRMC Symmetrical Scripts Page (ETSI) – PTP 820G.... 2-54
Figure 43 MRMC Symmetrical Scripts Page (ANSI)....2-54
Figure 44 MRMC Symmetrical Scripts Page (Configuration) – PTP 820F.... 2-55
Figure 45 MRMC Symmetrical Scripts Page (Configuration) - PTP 820G 2-55
Figure 46 MRMC Symmetrical Scripts Page (Configuration – Adaptive Mode) – PTP 820F ...... 2-56
Figure 47 MRMC Symmetrical Scripts Page (Configuration – Adaptive Mode) PTP 820G....2-57
Figure 48 Security General Configuration Page....2-63
Figure 48 Unit Redundancy Page....2-64
Figure 49 1+0 Quick Configuration Wizard (PTP 820G) – Page 1 .... 3-6
Figure 50 1+0 Quick Configuration Wizard (PTP 820F) – Page 1 .... 3-6
Figure 51 1+0 Quick Configuration Wizard (PTP 820G) – Page 2 ...... 3-7
Figure 52 1+0 Quick Configuration Wizard (PTP 820F) – Page 2 3-7
Figure 53 1+0 Quick Configuration Wizard (PTP 820G) – Page 3 ...... 3-8
Figure 54 1+0 Quick Configuration Wizard (PTP 820F) – Page 3 .... 3-8
Figure 55 1+0 Quick Configuration Wizard (PTP 820G) – Page 4 .... 3-9
Figure 56 1+0 Quick Configuration Wizard (PTP 820F) – Page 4 .... 3-9
Figure 57 1+0 Quick Configuration Wizard – Page 5 (Summary Page).... 3-10
Figure 58 1+0 Repeater Quick Configuration Wizard (PTP 820G) – Page 1.... 3-10
Figure 59 1+0 Repeater Quick Configuration Wizard (PTP 820G) – Page 2....3-11
Figure 60 1+0 Repeater Quick Configuration Wizard (PTP 820G) – Page 3.... 3-11
Figure 61 1+0 Repeater Quick Configuration Wizard (PTP 820G) – Page 4....3-12
Figure 62 1+0 Repeater Quick Configuration Wizard (PTP 820G) – Page 5.... 3-13
Figure 63 1+0 Repeater Quick Configuration Wizard – Page 6 (Summary Page) ...... 3-13
Figure 64 1+1 HSB Quick Configuration Wizard (PTP 820G) – Page 1....3-14
Figure 65 1+1 HSB Quick Configuration Wizard (PTP 820G) – Page 2 ...... 3-15
Figure 66 1+1 HSB Quick Configuration Wizard (PTP 820G) – Page 3.... 3-15
Figure 67 1+1 HSB Quick Configuration Wizard (PTP 820G) – Page 4....3-16
Figure 68 1+1 HSB Quick Configuration Wizard (PTP 820G) – Page 5....3-17
Figure 69 1+1 HSB Quick Configuration Wizard – Page 6 (Summary Page) ...... 3-17
Figure 70 1+1 Multi Carrier ABC HSB-SD Quick Configuration Wizard – Page 1 .... 3-18
Figure 71 1+1 Multi Carrier ABC HSB-SD Quick Configuration Wizard – Page 2 ...... 3-19
Figure 72 1+1 Multi Carrier ABC HSB-SD Quick Configuration Wizard – Page 3 ...... 3-19
Figure 73 1+1 Multi Carrier ABC HSB-SD Quick Configuration Wizard – Page 4 ...... 3-20
Figure 74 1+1 Multi Carrier ABC HSB-SD Quick Configuration Wizard – Page 5 .... 3-21
Figure 75 1+1 Multi Carrier ABC HSB-SD Quick Configuration Wizard – Page 6 (summary page) ...... 3-21
Figure 76 N + 0 Multi Carrier ABC Quick Configuration Wizard (PTP 820G) – Page 1....3-22
Figure 77 N + 0 Multi Carrier ABC Quick Configuration Wizard (PTP 820F) – Page 1....3-23
Figure 78 N + 0 Multi Carrier ABC Quick Configuration Wizard – Radio #2 Selection Page – PTP 820G ...... 3-24
Figure 79 N + 0 Multi Carrier ABC Quick Configuration Wizard – Radio #2 Selection Page – PTP 820F ...... 3-24
Figure 80 N + 0 Multi Carrier ABC Quick Configuration Wizard – Radio XPIC Configuration Page – PTP 820G..... 3-25
Figure 81 N + 0 Multi Carrier ABC Quick Configuration Wizard – Radio XPIC Configuration Page – PTP 820F ..... 3-25
Figure 82 N + 0 Multi Carrier ABC Quick Configuration Wizard – Radio Parameters Configuration Page – PTP 820G 3-26
Figure 83 N + 0 Multi Carrier ABC Quick Configuration Wizard – Radio Parameters Configuration Page – PTP 820F3-26
Figure 84 N + 0 Multi Carrier ABC Quick Configuration Wizard – Radio Parameters Configuration Page (XPIC) – PTP 820G 3-27
Figure 85 N + 0 Multi Carrier ABC Quick Configuration Wizard – Radio Parameters Configuration Page (XPIC) – PTP 820F 3-27
Figure 86 N + 0 Multi Carrier ABC Quick Configuration Wizard – Radio MRMC Script Configuration Page – PTP 820G 3-28
Figure 87 N + 0 Multi Carrier ABC Quick Configuration Wizard – Radio MRMC Script Configuration Page – PTP 820F 3-29
Figure 88 N + 0 Multi Carrier ABC Quick Configuration Wizard – Radio MRMC Script Configuration Page (XPIC) – PTP 820G 3-29
Figure 89 N + 0 Multi Carrier ABC Quick Configuration Wizard – Management Configuration Page – PTP 820G. 3-30
Figure 90 N + 0 Multi Carrier ABC Quick Configuration Wizard – Management Configuration Page – PTP 820F.. 3-30
Figure 91 N + 0 Multi Carrier ABC Quick Configuration Wizard – Summary Page – PTP 820G ...... 3-31
Figure 92 N + 0 Multi Carrier ABC Quick Configuration Wizard – Summary Page – PTP 820F ...... 3-31
Figure 93 Multi-Carrier ABC Group Page (Empty) 3-34
Figure 94 Create ABC Group Wizard – First Page 3-34
Figure 95 Create ABC Group Wizard – Second Page.... 3-35
Figure 96 Create ABC Group Wizard – Finish Page.... 3-35
Figure 97 Multi Carrier ABC Group - Add/Remove Members Page 3-36
Figure 98 LAG Page (Empty) 3-40
Figure 99 Create LAG Group Page 3-41
Figure 100 Create LAG Group – Finish Page 3-41
Figure 101 LAG Page (Populated) 3-43
Figure 102 Link Aggregation - Edit Page 3-43
Figure 103 LAG Distribution Function (DF) Page 3-45
Figure 104 LACP Aggregation Page 3-47
Figure 105 LACP Port Status Page.... 3-48
Figure 106 LACP Port Status – View Page.... 3-49
Figure 107 LACP Port Statistics Page 3-51
Figure 108 LACP Port Debug Page 3-52
Figure 109 XPIC Configuration Page (Empty).... 3-54
Figure 110 Create XPIC Group Page.... 3-54
Figure 111 Create XPIC Group Finish Page 3-55
Figure 112 XPIC Page (Populated) 3-55
Figure 113 XPIC Edit Page 3-56
Figure 114 Radio Protection Page (Empty).... 3-59
Figure 115 Create Radio Protection Group Page.... 3-59
Figure 116 Create Radio Protection Group Page – Member 1 3-60
Figure 117 Create Radio Protection Group Finish Page.... 3-60
Figure 118 Multi Carrier ABC Group – Edit Page – Enabling Protection.... 3-61
Figure 119 Create Radio Protection Group Page (Space Diversity Group Selected) 3-62
Figure 120 Create Radio Protection Group Page – Member 1 (Space Diversity Group Selected).... 3-62
Figure 121 Create Radio Protection Group Finish Page (Space Diversity Group Selected)....3-62
Figure 122 Radio Protection Page (Populated).... 3-64
Figure 123 Radio Protection Groups – Edit Page.... 3-64
Figure 124 Radio Protection Groups – Edit Page (Copy to Mate).... 3-65
Figure 125 IF Combining Page 3-68
Figure 126 IF Combining – Edit Page 3-69
Figure 127 Remote Networking Configuration Page.... 4-3
Figure 128 Remote Networking Configuration – Edit Page.... 4-4
Figure 129 SNMP Parameters Page 4-6
Figure 130 V3 Users Page 4-7
Figure 131 V3 Users - Add Page.... 4-8
Figure 132 Trap Managers Page 4-9
Figure 133 Trap Managers - Edit Page.... 4-10
Figure 134 FTP Port Page.... 4-11
Figure 135 FileZilla Server User Configuration 4-13
Figure 136 FileZilla Server Shared Folder Setup 4-14
Figure 137 Versions Page.... 4-15
Figure 138 Download & Install Page – HTTP/ HTTPS Download – No File Selected. 4-19
Figure 139 Download & Install Page – HTTP/HTTPS Download –File Selected 4-20
Figure 140 Download & Install Page.... 4-21
Figure 141 FTP Parameters Page 4-21
Figure 142 Install Parameters Page 4-22
Figure 143 Install Parameters page 4-25
Figure 144 Timer Parameters - Software Installation Page 4-25
Figure 145 Backup Files Page.... 4-28
Figure 146 Configuration Management Page – FTP/SFTP 4-29
Figure 147 FTP Parameters Page (Configuration Management).... 4-30
Figure 148 Set to Factory Default Page 4-34
Figure 149 Reset Page 4-35
Figure 150 Unit Parameters Page 4-36
Figure 151 NTP Configuration Page....4-38
Figure 152 Inventory Page....4-42
Figure 152 Login Banner Page 4-43
Figure 153 Radio Parameters Page.... 5-2
Figure 154 Radio Parameters Page Per Carrier .... 5-2
Figure 155 RFU1 Radio Interfaces on PTP 820F....5-5
Figure 156 Radio Unit Page (PTP 820F) 5-6
Figure 157 Remote Radio Parameters Page 5-8
Figure 158 Remote Radio Parameters – Edit Page 5-8
Figure 159: Remote Radio Parameters Page Per Carrier – PTP 820G .... 5-9
Figure 160 ATPC Page 5-12
Figure 161 ATPC – Edit Page.... 5-13
Figure 162 Radio Ethernet Interface Configuration Page.... 5-15
Figure 163 Radio Ethernet Interface Configuration – Edit Page.... 5-16
Figure 164 Radio Ethernet Interface Configuration Page....5-17
Figure 165 Radio Ethernet Interface Configuration – Edit Page.... 5-18
Figure 166 Radio Ethernet Interface Counters Page 5-19
Figure 167 Radio Ethernet Interface Counters – View Page 5-20
Figure 168 Payload Encryption Page 5-23
Figure 169 Payload Encryption – Edit Page 5-23
Figure 170 Payload Encryption – Edit Page with Master Key Displayed .... 5-24
Figure 171 Radio BER Thresholds Page 5-27
Figure 172 Radio BER Thresholds – Edit Page 5-27
Figure 173 MRMC Status Page 5-28
Figure 174 MRMC PM Report Page 5-29
Figure 175 Counters Page.... 5-32
Figure 176 Signal Level PM Report Page 5-33
Figure 177 Signal level Thresholds Configuration – Edit Page 5-34
Figure 178 Combined PM Graph Page.... 5-36
Figure 179 Aggregate PM Report Page.... 5-38
Figure 180 MSE PM Report Page 5-40
Figure 181 Modem MSE Thresholds Configuration – Edit Page.... 5-41
Figure 182 XPI PM Report Page 5-41
Figure 183 XPI Thresholds Configuration – Edit Page.... 5-43
Figure 184 Capacity PM Report Page 5-44
Figure 185: Ethernet Radio Capacity and Throughput Threshold Page.... 5-44
Figure 186 Utilization PM Report Page.... 5-45
Figure 187 Ethernet Radio Utilization Threshold Page 5-46
Figure 188 Frame Error PM Report Page....5-47
Figure 189 Ethernet Services Page 6-3
Figure 190 Ethernet Services - Add page....6-5
Figure 191 Multiple Selection Operation Section (Ethernet Services) 6-7
Figure 192 Ethernet Service Points Page 6-8
Figure 193 Ethernet Service Points Page – Ingress Attributes.... 6-12
Figure 194 Ethernet Service Points Page – Egress Attributes.... 6-14
Figure 195 Ethernet Service Points - Add Page 6-17
Figure 196 Attached VLAN List Page.... 6-19
Figure 197 Attached VLAN List - Add Page 6-20
Figure 198 Ethernet General Configuration Page....6-22
Figure 199 Physical Interfaces Page 6-24
Figure 200 Physical Interfaces - Edit Page 6-25
Figure 201: Automatic State Propagation Page.... 6-28
Figure 202: Automatic State Propagation - Add Page 6-28
Figure 203 RMON Page....6-31
Figure 204 RMON Page – Hiding and Displaying Columns 6-32
Figure 205: Egress CoS Statistics Page....6-33
Figure 206: Egress CoS Statistics – Edit Page.... 6-33
Figure 207 Ethernet Port TX PM Report Page 6-35
Figure 208 Ethernet PM Port Admin Page....6-37
Figure 209: Ethernet Port Tx Threshold Page....6-37
Figure 210 Ethernet Port RX PM Report Page 6-38
Figure 211 Ethernet PM Port Admin Page....6-40
Figure 212 Ethernet Port Rx Threshold Page....6-40
Figure 213 QoS Block Diagram 7-2
Figure 214 Logical Interfaces Page 7-5
Figure 215 Logical Interfaces - Edit Page 7-6
Figure 216 802.1Q Classification Page....7-8
Figure 217 802.1Q Classification - Edit Page 7-8
Figure 218 802.1AD Classification Page....7-9
Figure 219 802.1Q Classification - Edit Page 7-9
Figure 220 DSCP Classification Page 7-10
Figure 221 DSCP Classification - Edit Page....7-11
Figure 222 MPLS Classification Page 7-12
Figure 223 MPLS Classification - Edit Page 7-13
Figure 223 MAC DA Classification Page....7-13
Figure 223 MAC DA Classification – Add Page....7-14
Figure 223 MAC DA Classification – Edit Page....7-14
Figure 224 Policer Profile Page....7-17
Figure 225 Policer Profile - Add Page 7-17
Figure 226 Logical Interfaces – Policers Page – Unicast Policer (Default) 7-19
Figure 227 Logical Interfaces – Policers Page – Multicast Policer .... 7-20
Figure 228 Logical Interfaces – Policers Page – Broadcast Policer .... 7-21
Figure 229 Logical Interfaces – Policers Page – Ethertype Policer .... 7-21
Figure 230 802.1Q Marking Page 7-24
Figure 231 802.1Q Marking - Edit Page 7-24
Figure 232 802.1AD Marking Page 7-25
Figure 233 802.1AD Marking - Edit Page 7-25
Figure 234 WRED Profile Page....7-26
Figure 235 WRED Profile - Add Page 7-27
Figure 236 Logical Interfaces – WRED Page 7-29
Figure 237 Logical Interfaces – WRED - Edit Page 7-29
Figure 238 Queue Shaper Profile Page 7-31
Figure 239 Queue Shaper Profile – Add Page 7-31
Figure 240 Service Bundle Shaper Profile Page....7-33
Figure 241 Service Bundle Shaper Profile – Add Page.... 7-33
Figure 242 Logical Interfaces – Shaper – Egress Queue Shaper 7-34
Figure 243 Logical Interfaces – Egress Queue Shaper Configuration – Add Page 7-35
Figure 244 Logical Interfaces – Shaper – Egress Service Bundle Shaper 7-37
Figure 245 Logical Interfaces – Egress Service Bundle Shaper Configuration – Add Page 7-38
Figure 246 Scheduler Priority Profile Page 7-39
Figure 247 Scheduler Priority Profile – Add Page.... 7-41
Figure 248 Scheduler WFQ Profile Page 7-43
Figure 249 Scheduler WFQ Profile – Add Page....7-44
Figure 250 Logical Interfaces – Scheduler – Egress Port Scheduling Priority 7-45
Figure 251 Logical Interfaces – Scheduler – Egress Port Scheduling WFQ....7-45
Figure 251 Egress CoS PM Configuration Page....7-47
Figure 251 Egress CoS PM Configuration – Add Page.... 7-48
Figure 251 Egress CoS PM Page....7-49
Figure 252 G.8032 General Attribute Page....8-3
Figure 253 G.8032 ERPI Attribute Page 8-4
Figure 254 G.8032 ERPI Attribute Wizard – Page 1 8-4
Figure 255 G.8032 ERPI Attribute Wizard – Page 2 8-5
Figure 256 G.8032 ERPI Attribute Wizard – Page 3 8-6
Figure 257 G.8032 ERPI Attribute Wizard – Page 4 8-6
Figure 258 G.8032 ERPI Attribute Wizard – Submit.... 8-7
Figure 259 G.8032 ERPI Attribute – Edit Page 8-8
Figure 260 G.8032 ERPI Attribute – State Page 8-11
Figure 261 G.8032 ERPI Attribute – Statistics Page 8-12
Figure 262 Instance Per Service Mapping – Edit Page....8-16
Figure 263 MSTP Bridge General Attributes Page 8-17
Figure 264 MSTP Bridge Configuration ID Page....8-19
Figure 265 MSTP Bridge Spanning Tree Page....8-20
Figure 266 MSTP Bridge CIST Page 8-23
Figure 267 MSTP Bridge MSTI Page 8-24
Figure 268 MSTP Bridge MSTI – Edit Page 8-25
Figure 269 MSTP Bridge VLAN Page 8-26
Figure 270 MSTP Port Spanning Tree Page 8-27
Figure 271 MSTP Port Spanning Tree – Edit Page 8-28
Figure 272 MSTP Port CIST Page....8-29
Figure 273 MSTP Port CIST – Edit Page....8-29
Figure 274 MSTP Port MSTI Page 8-31
Figure 275 MSTP Port MSTI – Edit Page 8-32
Figure 276 MSTP Port BDPU Counters Page 8-35
Figure 277 LLDP Remote System Management Page....8-37
Figure 278 LLDP Configuration Parameters Page 8-37
Figure 279 LLDP Port Configuration Page....8-40
Figure 280 LLDP Port Configuration - Edit Page 8-40
Figure 281 LLDP Destination Address Table Page 8-42
Figure 282 LLDP Management TLV Configuration Page 8-43
Figure 283 LLDP Remote System Management Page 8-44
Figure 284 LLDP Remote System Table Page....8-45
Figure 285 LLDP Local System Parameters Page 8-46
Figure 286 LLDP Local System Port Page 8-48
Figure287 LLDP Local System Management Page 8-49
Figure 288 LLDP Local System Management – View Page 8-49
Figure 289 LLDP Statistic Page 8-50
Figure 290 LLDP Port TX Statistic Page 8-51
Figure 291 LLDP Port RX Statistic Page 8-52
Figure 292 E1/DS1 Interfaces Page....9-3
Figure 293 E1/DS1 Interfaces – Edit Page.... 9-4
Figure 294 Native TDM Services Page 9-8
Figure 295 TDM Service Revertive Timer Configuration Page.... 9-10
Figure 296 Native TDM Service Creation – Interface #1 E1/DS1....9-11
Figure 297 Native TDM Service Creation – Interface #1 Radio 9-12
Figure 298 Native TDM Service Creation – Trail Selection Page (Radio-TDM)....9-13
Figure 299 Native TDM Service Creation – Protecting Interface Selection Page 9-14
Figure 300 Native TDM Service Creation – Working Trail Selection Page....9-14
Figure 301 Native TDM Service Creation – Selection Summary Page (Radio-TDM)....9-15
Figure 302 Native TDM Service Creation – Interface #1 (Radio/Cascading) 9-17
Figure 303 Native TDM Service Creation – Interface #2 (Radio/Cascading) 9-17
Figure 304 Native TDM Service Creation – Trail Selection Page (Radio/Cascading) 9-18
Figure 305 Native TDM Service Creation – Selection Summary (Radio/Cascading)....9-19
Figure 306 Native TDM Services – Edit Page 9-20
Figure 307 Native TDM Services Edit Page – Multiple Selection Operation....9-21
Figure 308 TDM PseudoWire Services Page 9-23
Figure 309 TDM Service Revertive Timer Configuration Page.... 9-26
Figure 310: Pseudowire Service Creation – Interface #1 E1/DS1 9-27
Figure 311 Pseudowire Service Creation – Interface #1 Radio/Ethernet/Cascading 9-28
Figure 312 Pseudowire Service Creation – EC ID Selection Page (Radio/Ethernet/Cascading - TDM)....9-30
Figure 313 Pseudowire Service Creation – Protecting Interface Selection Page....9-32
Figure 314 Pseudowire Service Creation – Working EC ID Selection Page....9-32
Figure 315 Pseudowire Service Creation – Selection Summary Page (Radio/Ethernet/Cascading - TDM) ...... 9-33
Figure 316 Pseudowire Service Creation – Interface #1 (Radio/Ethernet/Cascading) 9-34
Figure 317 Pseudowire Service Creation – Interface #2 (Radio/Cascading)....9-35
Figure 318 Pseudowire Service Creation – Service Selection Page (Radio/Ethernet/Cascading)....9-35
Figure 319 Pseudowire Service Creation – Selection Summary (Radio/Ethernet/Cascading) 9-36
Figure 320 TDM PseudoWire Services – Edit Page 9-37
Figure 321 Pseudowire Services Edit Page – Multiple Selection Operation....9-38
Figure 322 PseudoWire Card Configuration Page 9-39
Figure 323 PseudoWire Card Configuration – Edit Page 9-39
Figure 324 Service OAM Maintenance Domain Page....9-41
Figure 325 Service OAM Maintenance Domain – Add Page.... 9-42
Figure 326 Service OAM Maintenance Association Page....9-44
Figure 327 Service OAM Maintenance Association – Add Page....9-46
Figure 328 Pseudowire PSN Tunnels Page....9-48
Figure 329 PseudoWire PSN Tunnels—Add Page 9-49
Figure 330 PseudoWire PSN Tunnels- Status Page....9-51
Figure 331 Pseudowire Tunnel Groups Page 9-52
Figure 332 PseudoWire Tunnel Groups – Add Page....9-54
Figure 333 PseudoWire Profiles Page....9-56
Figure 334 PseudoWire Profiles – Add Page 9-58
Figure 335 PseudoWire Services Page....9-60
Figure 336 PseudoWire Services – Add Page 9-63
Figure 337 PseudoWire Services – Information Page....9-64
Figure 338 E1/DS1 PM Page 9-66
Figure 339 E1/DS1 PM Page – Graph Format.... 9-67
Figure 340 Services PM Page (Native TDM Services) 9-68
Figure 341 Native TDM Services Page – Graph Format....9-69
Figure 342 Services PM Page (Pseudowire TDM Services) 9-69
Figure 343 Pseudowire TDM Services Page – Graph Format 9-70
- Select Sync > Sync Source. The Sync Source page opens. Figure 344 Sync Source Page 10-2
Figure 345 Sync Source – Add Page.... 10-4
Figure 346 Outgoing Clock Page....10-7
Figure 347 Outgoing Clock – Edit Page....10-7
Figure 348 1588-TC Page 10-10
Figure 349 1588-TC – Edit Page.... 10-10
Figure 350 1588 Boundary Clock – Port Parameters Page 10-13
Figure 351 1588 Boundary Clock – Port Parameters – Edit Page ...... 10-14
Figure 352 1588 Boundary Clock – Clock Default Parameters Page 10-15
Figure 353 1588 Boundary Clock – Clock Advanced Parameters Page.... 10-17
Figure 354 1588 Boundary Clock – Port Statistics Page.... 10-19
Figure 354 Quick Configuration Security General Parameters Page 11-2
Figure 354 Quick Configuration Security Protocols Page 11-3
Figure 354 Quick Configuration Security Access Control Page.... 11-4
Figure 354 Quick Configuration Security RSA Key & Certificate Page 11-5
Figure 355 Access Control General Configuration Page 11-6
Figure 356 Access Control User Accounts - Edit Page 11-7
Figure 357 Access Control Password Management Page.... 11-8
Figure 358 Protocols Control Page 11-9
Figure 359 Access Control User Profiles Page 11-11
Figure 360 Access Control User Profiles - Add Page 11-12
Figure 361 Access Control User Accounts Page.... 11-13
Figure 362 Access Control User Accounts - Add Page 11-14
Figure 363 Radius Configuration Page.... 11-17
Figure 364 Radius Configuration – Edit Page.... 11-18
Figure 365 Radius Users Page.... 11-18
Figure 366 Radius Users Page – Expanded....11-20
Figure 367 Server Manager – Creating User Groups.... 11-21
Figure 368 Server Manager – Creating Users.... 11-22
Figure 369 Server Manager – Creating a RADIUS Client.... 11-23
Figure 370 Create Network Policy – Specify Name and Connection Type 11-24
Figure 371 Create Network Policy – Select Condition.... 11-25
Figure 372 Create Network Policy – User Group added to Policy's Conditions 11-26
Figure 373 Create Network Policy – Specifying Access Permission.... 11-27
Figure 374 Create Network Policy – Configuring Authentication Methods 11-28
Figure 375 Create Network Policy – Insecure Authentication Method Query.... 11-28
Figure 376 Create Network Policy – Configuring Constraints ...... 11-29
Figure 377 Create Network Policy – Configuring Settings.... 11-30
Figure 378 Create Network Policy – Adding Vendor Specific Attributes.... 11-31
Figure 379 Create Network Policy – Selecting to Add Attribute Information .... 11-31
Figure 380 Create Network Policy – Specifying the Vendor.... 11-32
Figure 381 Create Network Policy – Configuring Vendor-Specific Attribute Information.... 11-33
Figure 382 Create Network Policy – Example of Vendor-Specific Attribute Configuration .... 11-34
Figure 383 Create Network Policy – Stopping/Starting NPS Services 11-35
Figure 384 Security Certificate Request Page....11-40
Figure 385 FTP Parameters Page (Security Certificate Request) 11-41
Figure 386 Security Certification Download and Install Page....11-42
Figure 387 FTP Parameters Page (Security Certificate Download & Install).... 11-42
Figure 388 Protocols Control Page 11-44
Figure 389 Security Log Upload Page 11-46
Figure 390 FTP Parameters Page (Security Upload Page).... 11-46
Figure 391 Configuration Log Upload Page 11-48
Figure 392 FTP Parameters Page (Configuration Log Upload).... 11-48
Figure 393 Current Alarms Page.... 12-2
Figure 394 Current Alarms - View Page....12-2
Figure 395 Alarm Statistics Page 12-4
Figure 396 Event Log 12-5
Figure 397 Alarm Configuration Page.... 12-7
Figure 398 Alarm Configuration Page – Expanded 12-8
Figure 399 Alarm Configuration - Edit Page 12-9
Figure 400 External Alarms Input Page 12-11
Figure 401 External Alarms Input – Edit Page 12-11
Figure 461: Voltage Alarm Configuration Page 12-13
Figure 462: Voltage Alarm Configuration – Edit Page 12-13
Figure 512: Unit Info Page – HTTP/HTTPS Upload.... 12-17
Figure 403 Unit Info Page 12-18
Figure 404 Radio Loopbacks Page – PTP 820F.... 12-20
Figure 405 Radio Loopbacks Page – PTP 820G 12-21
Figure 406 Radio Loopbacks – Edit Page 12-21
Figure 407 Logical Interfaces – Loopback Page 12-23
Figure 408 PDH Loopback Page 12-24
Figure 409 PDH Loopback – Edit Page 12-25
Figure 410 SOAM MD Page 12-27
Figure 411 SOAM MD Page 12-28
Figure 412 SOAM MA/MEG Page 12-29
Figure 413 SOAM MA/MEG – Add Page.... 12-29
Figure 414 MEP List Page.... 12-32
Figure 415 Add MEP Page.... 12-32
Figure 416 SOAM MEP Page.... 12-33
Figure 417 Add SOAM MEP Wizard – Page 1.... 12-33
Figure 418 Add SOAM MEP Wizard – Page 2.... 12-34
Figure 419 Add SOAM MEP Wizard – Summary Page 12-34
Figure 420 SOAM MEP - Edit Page.... 12-36
Figure 421 SOAM MEP DB Table 12-37
Figure 422 MEP Last Invalid CCMS Page....12-38
Figure 423 SOAM MEP Loopback Page.... 12-40
Figure 424 Restart HTTP Page 13-2
Figure 425 ifIndex Calculator Page 13-3
Figure 426 MIB Reference Table Page....13-4
Figure 427 1588 Boundary Clock – Current Configuration Sample Display (CLI).... 22-18
Figure 428 1588 Boundary Clock – Default Parameters Sample Display (CLI).... 22-19
Figure 429 1588 Boundary Clock – Advanced (General) Parameters Sample Display (CLI).... 22-20
Figure 430 1588 Boundary Clock – Parent Clock Parameters Sample Display (CLI) 22-21
Figure 431 1588 Boundary Clock – Time Parameters Sample Display (CLI)....22-21
Figure 432 1588 Boundary Clock Port Parameters (CLI).... 22-23
Figure 433 1588 Boundary Clock Statistics (CLI)....22-24
Figure 434 Removing the SM-Card Cover of a PTP 820F.... 26-1
Figure 435 Checking the Sockets for Foreign Matter 26-2
Figure 436 Removing the PTP 820G SM-Card Cover 26-3
Figure 437 Checking the Sockets for Foreign Matter 26-4
Figure 438 Electrical GE Interface LEDs 27-3
Figure 439 Optical GE Interface LED....27-3
Figure 440 Management FE Interface LEDs.... 27-5
Figure 441 TDM Interface LEDs 27-8
Figure 442 Radio Interface LEDs 27-9
Figure 443 Power Interface LEDs.... 27-12
Green – Power is on. Figure 444 Unit/ACT LED 27-15
Figure 445 Electrical Ethernet Interface LEDs.... 28-18
Figure 446 Optical Ethernet Interface LEDs – SFP1 through SFP4.... 28-18
Figure 447 Management FE Interface LEDs.... 28-19
Figure 448 E1/DS1 Interface LEDs 28-23
Figure 449 Optical Interface LEDs.... 28-24
Figure 450 Electrical Interface LEDs.... 28-25
Figure 451 Power Interface LEDs.... 28-26
Figure 452 Sync Interface LEDs.... 28-28
Figure 453 Unit/ACT LED 28-31
List of Tables
Table 1 PTP 820F Interfaces.... 1-7
Table 2 2 x FE Splitter Cable Model Number....1-9
Table 3 PTP 820 Interfaces 1-13
Table 4 2 x FE Splitter Cable Model Number 1-14
Table 5 IDU-RFU Cable connection for PTP 820F....1-18
Table 6 Web EMS Menu Hierarchy – Platform Menu 1-28
Table 7 Web EMS Menu Hierarchy – Faults Menu.... 1-31
Table 8 Web EMS Menu Hierarchy – TDM Menu....1-31
Table 9 Web EMS Menu Hierarchy – Radio Menu 1-32
Table 10 PTP 820G Web EMS Menu Hierarchy – Ethernet Menu.... 1-33
Table 11 PTP 820G Web EMS Menu Hierarchy – Cascading Menu.... 1-36
Table 12 PTP 820G Web EMS Menu Hierarchy – Sync Menu.... 1-36
Table 13 Web EMS Menu Hierarchy – Quick Configuration Menu 1-36
Table 14 Web EMS Menu Hierarchy – Utilities Menu 1-37
Table 15 Y-Cable for Electrical Splitter Mode FE Traffic Interface Protection....2-21
Table 16 Y-Cable for E1/DS1 Protection....2-21
Table 17 Splitter Cable for Protection and Management.... 2-21
Table 18 Activation Key Status Parameters.... 2-31
Table 19 Activation Key Status Parameters.... 2-33
Table 19 Activation Key-Enabled-Features Description ...... 2-33
Table 20 Time Services Parameters.... 2-39
Table 20 PTP 820F: Radio Interfaces in Interface Manager.... 2-40
Table 144: Radio Mute/Unmute CLI Parameters.... 2-51
Table 145: Transmit (TX) Frequency CLI Parameters.... 2-52
Table 21 PTP 820G Radio Profiles for Fixed Interfaces and RMC-B.... 2-58
Table 22 PTP 820F Radio Profiles for Microwave RFU's 2-58
Table 23 PTP 820F Radio Profiles for RFU-E 2-59
Table 24 MRMC Symmetrical Scripts Page Parameters 2-59
Table 25 PTP 820F Radio Configurations.... 3-2
Table 26 PTP 820G Radio Configurations 3-2
Table 27 TDM Configurations.... 3-3
Table 28 LACP Port Status Page.... 3-47
Table 29 LACP Port Status Parameters.... 3-49
Table 30 LACP Port Statistics Parameters.... 3-51
Table 31 LACP Port Debug Statistics.... 3-52
Table 32 IF Combining parameters.... 3-69
Table 33 Remote Networking Configuration Parameters 4-4
Table 34 SNMP V3 Authentication Parameters.... 4-8
Table 35 Trap Manager Parameters.... 4-10
Table 36 Versions Page Columns.... 4-16
Table 37 Download & Install Status Parameters 4-24
Table 38 Backup Files Page Columns....4-28
Table 39 Unit Parameters....4-36
Table 40 NTP Status Parameters 4-39
Table 41 Radio Status Parameters....5-3
Table 42 Radio Unit Parameters 5-6
.Table 43 Remote Radio Parameters....5-9
Table 167: Remote Radio Mute and Unmute CLI Parameters.... 5-10
Table 168: Remote Radio TX Level CLI Parameters 5-11
Table 169: Remote Radio ATPC CLI Parameters....5-11
Table 44 Radio Ethernet Interface Counters Fields....5-20
Table 45 MRMC Status Parameters.... 5-29
Table 46 MRMC PMs 5-30
Table 47 Signal Level PMs....5-33
Table 48 Signal Level Thresholds.... 5-34
Table 49 Combined PMs....5-37
Table 50 Modem BER (Aggregate) PMs.... 5-38
Table 51 Modem MSE PMs.... 5-40
Table 52 XPI PMs 5-42
Table 53 Capacity/Throughput PMs.... 5-45
Table 54 Utilization PMs.... 5-47
Table 55 Frame Error Rate PMs.... 5-48
Table 56 Ethernet Services Page Parameters.... 6-4
Table 57 General Service Point Attributes ...... 6-9
Table 58 Attached Interface Types....6-11
Table 59 Service Point Ingress Attributes....6-12
Table 60 Service Point Egress Attributes.... 6-14
Table 61 VLAN Classification Parameters.... 6-20
Table 62 Physical Interface Status Parameters 6-26
Table 63 Ethernet TX Port PMs.... 6-36
Table 64 Ethernet RX Port PMs 6-38
Table 65 Logical Interface Classification Parameters 7-6
Table 66 Policer Profile Parameters 7-18
Table 67 Attached Interface Types....8-9
Table 68 ERPI Configuration Parameters.... 8-10
Table 69 ERPI State Parameters 8-11
Table 70 ERPI Statistics....8-13
Table 71 MSTP Bridge Configuration ID Parameters 8-19
Table 72 MSTP Bridge Spanning Tree Status Parameters 8-20
Table 73 MSTP Bridge Spanning Tree Configuration Parameters 8-21
Table 74 MSTP Bridge CIST Status Parameters....8-24
Table 75 MSTP Bridge MSTI Status Parameters 8-25
Table 76 MSTP Port Spanning Tree Status Parameters....8-28
Table 77 MSTP Port CIST Status Parameters....8-30
Table 78 MSTP Port MSTI Status Parameters....8-33
Table 79 MSTP BPDU Counters 8-35
Table 80 LLDP Remote System Management Parameters....8-37
Table 81 LLDP Read-Only Configuration Parameters 8-38
Table 82 LLDP Configurable Configuration Parameters 8-39
Table 83 LLDP Port Configuration Status Parameters 8-41
Table 84 LLDP Management TLV Parameters.... 8-43
Table 85 LLDP Remote System Management Parameters....8-44
Table 86 LLDP Remote System Table Parameters.... 8-45
Table 87 LLDP Local System Parameters.... 8-46
Table 88 LLDP Local System Port Parameters 8-48
Table 89 LLDP Local System Management Parameters.... 8-50
Table 90 LLDP Statistics 8-51
Table 91 LLDP Port TX Statistics....8-51
Table 92 LLDP Port RX Statistics 8-53
Table 93 E1/DS1 Interface Configuration Parameters.... 9-5
Table 94 E1/DS1 Interface Parameters ...... 9-6
Table 95 Native TDM Service Parameters....9-9
Table 96 TDM Pseudowire Service Parameters.... 9-25
Table 97 Pseudowire Card Configuration Parameters 9-40
Table 98 Pseudowire Maintenance Domain Parameters 9-42
Table 99 Pseudowire Maintenance Association Parameters 9-44
Table 100 Pseudowire PSN Tunnels Parameters....9-48
Table 101 Pseudowire Tunnel Status Parameters....9-51
Table 102 Pseudowire Tunnel Group Parameters....9-53
Table 103 Pseudowire Profile Parameters 9-56
Table 104 Pseudowire TDM Service Parameters....9-61
Table 105 Pseudowire TDM Service Status Parameters....9-64
Table 106 E1/DS1 PMs....9-66
Table 107 Native TDM Service PMs....9-68
Table 108 Pseudowire TDM Service PMs 9-69
Table 109 Sync Source Parameters ...... 10-3
Table 110 Boundary Clock Default Parameters.... 10-16
Table 111 Boundary Clock Advanced Parameters.... 10-17
Table 112 Boundary Clock Port Parameters.... 10-19
Table 113 Boundary Clock Port Statistics 10-20
Table 114 Alarm Information .... 12-3
Table 115 Event Log Information 12-5
Table 116 Alarm Configuration Page Parameters ...... 12-7
Table 117 External Alarms Interface Pin-Outs.... 12-10
Table 118 SOAM MA/MEG Configuration Parameters.... 12-30
Table 119 SOAM MA/MEG Status Parameters.... 12-31
Table 120 SOAM MEP Parameters ...... 12-35
Table 121 SOAM MEP DB Table Parameters.... 12-37
Table 122 IP Address (IPv4) CLI Parameters.... 14-7
Table 123 IP Address (IPv6) CLI Parameters.... 14-8
Table 124 Local Time Configuration CLI Parameters.... 14-19
Table 125 Daylight Savings Time CLI Parameters 14-20
Table 126 Interface Configuration CLI Parameters.... 14-22
Table 127 Cascading Interface CLI Parameters 14-24
Table 128 Radio Mute/Unmute CLI Parameters 14-26
Table 129 Radio Transmit (TX) Level CLI Parameters 14-27
Table 130 Radio Transmit (TX) Frequency CLI Parameters.... 14-28
Table 131 MRMC Script CLI Parameters.... 14-29
Table 132 MRMC Script Assignation to Radio Carrier CLI Parameters.... 14-31
Table 133 Radio Configuration PTP 820F.... 15-2
Table 134 Radio Configurations PTP 820G 15-2
Table 135 TDM Configurations.... 15-3
Table 136 LACP aggregation status parameters.... 15-15
Table 137 LACP port status parameters 15-17
Table 138 LACP port statistics.... 15-19
Table 139 XPIC Configuration CLI Parameters.... 15-21
Table 140 1+1 HSB CLI Parameters.... 15-23
Table 141 HSB Revertive Mode CLI Parameters.... 15-26
Table 142 Remote Unit IP Address (IPv4) CLI Parameters.... 16-3
Table 143 Remote Unit IP Address (IPv6) CLI Parameters.... 16-4
Table 144 SNMPv3 CLI Parameters ...... 16-7
Table 145 Software Download CLI Parameters.... 16-13
Table 146 RFU Software Upgrade CLI Parameters 16-14
Table 147 Configuration Management CLI Parameters ...... 16-18
Table 148 Configuration Management CLI Parameters ...... 16-21
Table 149 Configuration Import and Restore CLI Parameters.... 16-23
Table 150 Unit Parameters CLI Parameters.... 16-28
Table 151 NTP CLI Parameters ...... 16-29
Table 152 Remote Radio Mute/Unmute CLI Parameters.... 17-5
Table 153 Remote Radio TX Level CLI Parameters 17-5
Table 154 Remote Radio ATPC CLI Parameters.... 17-5
Table 155 Radio ATPC CLI Parameters.... 17-8
Table 156 Header De-Duplication CLI Parameters ...... 17-11
Table 157 Frame Cut-Through CLI Parameters.... 17-13
Table 158 Aggregate PMs (CLI).... 17-21
Table 159 Excessive BER CLI Parameters.... 17-22
Table 160 Excessive BER Threshold Parameters (CLI) 17-22
Table 161 RSL Thresholds CLI Parameters.... 17-23
Table 162 TSL Thresholds CLI Parameters.... 17-23
Table 163 RSL and TSL PMs (CLI) 17-24
Table 164 Signal Level Threshold CLI Parameters 17-25
Table 165 MSE CLI Parameters.... 17-25
Table 166 MSE PMs (CLI) 17-27
Table 167 ACM PMs (CLI) 17-28
Table 168 XPI Threshold CLI Parameters.... 17-29
Table 169 XPI PMs (CLI) 17-30
Table 170 Adding Ethernet Service CLI Parameters 18-3
Table 171 Displaying Ethernet Service Details CLI Parameters.... 18-5
Table 172 Ethernet Service Operational State CLI Parameters 18-6
Table 173 Ethernet Service CoS Mode CLI Parameters 18-7
Table 174 Ethernet Service Default CoS CLI Parameters.... 18-8
Table 175 Ethernet Service EVC CLI Parameters 18-8
Table 176 Ethernet Service EVC Description CLI Parameters.... 18-9
Table 177 Service Points per Service Type 18-10
Table 178 shows which service point types can co-exist on the same interface. Table 178 Service Point Types per Interface 18-10
Table 179 Legal Service Point – Interface Type Combinations per Interface – SAP and SNP 18-12
Table 180 Legal Service Point – Interface Type Combinations per Interface – Pipe and MNG.... 18-13
Table 181 Add Service Point CLI Parameters.... 18-14
Table 182 Enable/Disable Broadcast Frames CLI Parameters.... 18-18
Table 183 Service Point CoS Preservation CLI Parameters.... 18-19
Table 184 Service Point Default CoS CLI Parameters 18-19
Table 185 Service Point Enable/Disable Flooding CLI Parameters 18-20
Table 186 C-VLAN CoS Preservation Mode CLI Parameters 18-21
Table 187 C-VLAN Preservation CLI Parameters.... 18-22
Table 188 S-VLAN CoS Preservation CLI Parameters.... 18-23
Table 189 Service Bundle CLI Parameters.... 18-24
Table 190 VLAN Bundle to Service Point CLI Parameters.... 18-24
Table 191 Display Service Point Attributes CLI Parameters .... 18-25
Table 192 MAC Address Forwarding Table Maximum Size CLI Parameters.... 18-27
Table 193 MAC Address Forwarding Table Aging Time CLI Parameters.... 18-27
Table 194 Adding Static Address to MAC Address Forwarding Table CLI Parameters.... 18-28
Table 195 Enabling MAC Address Learning CLI Parameters.... 18-29
Table 196 Configure S-VLAN Ethertype CLI Parameters.... 18-30
Table 197 Configure MRU CLI Parameters.... 18-31
Table 198 Entering Interface View CLI Parameters.... 18-33
Table 199 Interface Media Type CLI Parameters.... 18-34
Table 200 Interface Speed and Duplex State CLI Parameters 18-35
Table 201 Interface Auto Negotiation State CLI Parameters.... 18-35
Table 202 Interface IFG CLI Parameters 18-36
Table 203 Interface Preamble CLI Parameters....18-36
Table 204 Interface Description CLI Parameters....18-37
Table 205 Automatic State Propagation to an Ethernet Port CLI Parameters .... 18-39
Table 206 RMON Statistics CLI Parameters....18-41
Table 207 Port PM Thresholds CLI Parameters 18-42
Table 208 Ethernet Port PMs 18-44
Table 209 VLAN Classification and Override CLI Parameters....19-3
Table 210 802.1p Trust Mode CLI Parameters 19-5
Table 211 C-VLAN 802.1 UP and CFI Bit Classification Table Default Values.... 19-5
Table 212 C-VLAN 802.1 UP and CFI Bit Classification Table CLI Parameters.... 19-6
Table 213 S-VLAN 802.1 UP and DEI Bit Classification Table Default Values ...... 19-7
Table 214 S-VLAN 802.1 UP and DEI Bit Classification Table CLI Parameters.... 19-7
Table 215 Trust Mode for DSCP CLI Parameters 19-8
Table 216 DSCP Classification Table Default Values.... 19-9
Table 217 Modify DSCP Classification Table CLI Parameters.... 19-10
Table 218 Trust Mode for MPLS CLI Parameters.... 19-11
Table 219 MPLS EXP Bit Classification Table Default Values 19-12
Table 220 MPLS EXP Bit Classification Table Modification CLI Parameters.... 19-12
Table 221 Default CoS CLI Parameters.... 19-13
Table 222 Rate Meter Profile CLI Parameters 19-15
Table 223 Assigning Rate Meter for Unicast Traffic CLI Parameters....19-17
Table 224 Assigning Rate Meter for Multicast Traffic CLI Parameters.... 19-18
Table 225 Assigning Rate Meter for Broadcast Traffic CLI Parameters.... 19-19
Table 226 Assigning Rate Meter per Ethertype CLI Parameters.... 19-20
Table 227 Assigning Line Compensation Value for Rate Meter CLI Parameters....19-22
Table 228 Displaying Rate Meter Statistics CLI Parameters 19-24
Table 229 Marking Mode on Service Point CLI Parameters 19-27
Table 230 Marking Table for C-VLAN UP Bits 19-28
Table 231 802.1q CoS and Color to UP and CFI Bit Mapping Table CLI Parameters.... 19-28
Table 232 802.1ad UP Marking Table (S-VLAN).... 19-29
Table 233 802.1ad UP Marking Table (S-VLAN) CLI Parameters 19-30
Table 234 WRED Profile CLI Parameters.... 19-32
Table 235 Assigning WRED Profile to Queue CLI Parameters ...... 19-33
Table 236 Queue Shaper Profiles CLI Parameters....19-36
Table 237 Attaching Shaper Profile to Queue CLI Parameters.... 19-37
Table 238 Service Bundle Shaper Profiles CLI Parameters....19-39
Table 239 Attaching Shaper Profile to Service Bundle CLI Parameters.... 19-40
Table 240 Egress Line Compensation for Shaping CLI Parameters.... 19-41
Table 241 Interface Priority Profile Example.... 19-43
Table 242 Interface Priority Profile CLI Parameters 19-44
Table 243 Interface Priority Sample Profile Parameters....19-45
Table 244 Attaching Priority Profile to Interface CLI Parameters.... 19-46
Table 245 WFQ Profile Example 19-47
Table 246 WFQ Profile CLI Parameters.... 19-48
Table 247 WFQ Sample Profile Parameters ...... 19-48
Table 248 Attaching WFQ Profile to Interface CLI Parameters 19-49
Table 249 Egress Queue Level PMs CLI Parameters.... 19-51
Table 250 Egress Service Bundle Level PMs CLI Parameters.... 19-58
Table 251 G.8032 Destination MAC Address CLI Parameters 20-2
Table 252 G.8032 ERPI Configuration CLI Parameters 20-3
Table 253 G.8032 RPL Owner CLI Parameters.... 20-5
Table 254 G.8032 Timer Configuration CLI Parameters 20-5
Table 255 G.8032 Switching and Reversion CLI Parameters.... 20-7
Table 256 G.8032 Switching and Reversion CLI Parameters.... 20-7
Table 257 G.8032 ERPI Display Command Input Parameters.... 20-9
Table 258 G.8032 ERPI Display Command Output Parameters.... 20-10
Table 259 G.8032 Service Point Display Command Output Parameters.... 20-12
Table 260 Defining Number of MSTIs CLI Parameters.... 20-15
Table 261 BPDU Destination MAC Address CLI Parameters.... 20-16
Table 262 MSTP Signal Degrade Failure CLI Parameters.... 20-17
Table 263 MSTP Configuration ID CLI Parameters 20-17
Table 264 MSTP Service to MSTI Mapping CLI Parameters.... 20-18
Table 265 MSTP Bridge Level Spanning Tree CLI Parameters 20-19
Table 266 Bridge Level MSTI CLI Parameters 20-20
Table 267 CIST Port CLI Parameters 20-22
Table 268 MSTI Port CLI Parameters 20-25
Table 269 Port BPDU Counters CLI Parameters.... 20-27
Table 270 General LLDP CLI Parameters.... 20-29
Table 271 LLDP Port CLI Parameters 20-30
Table 272 LLDP Local System CLI Parameters 20-36
Table 273 TDM Slot Configuration CLI Parameters.... 21-4
Table 274 E1/DS1 Configuration CLI Parameters 21-5
Table 275 Pseudowire Tunnel CLI Parameters 21-10
Table 276 Pseudowire Profile CLI Parameters.... 21-12
Table 277 Pseudowire OEM MD CLI Parameters 21-14
Table 278 Pseudowire OEM MA CLI Parameters.... 21-15
Table 279 Pseudowire OEM CCM Messages CLI Parameters.... 21-17
Table 280 Assigning MA to TDM Tunnel CLI Parameters 21-17
Table 281 Pseudowire Tunnel Group CLI Parameters.... 21-18
Table 282 Pseudowire Tunnel Group Display CLI Parameters.... 21-20
Table 283 Network Edge Node for Dual Homing CLI Parameters 21-21
Table 284 Pseudowire Service CLI Parameters.... 21-22
Table 285 E1/DS1 PMs CLI Parameters 21-25
Table 286 Sync Source Ethernet CLI Parameters.... 22-3
Table 287 Sync Source Radio CLI Parameters.... 22-4
Table 288 Outgoing Clock CLI Parameters.... 22-6
Table 289 Synchronization Revertive Timer CLI Parameters.... 22-9
Table 290 1588 Transparent Clock CLI Parameters 22-13
Table 291 Boundary Clock Configuration CLI Parameters.... 22-16
Table 292 Boundary Clock Default Settings – CLI Parameters.... 22-19
Table 293 Boundary Clock Default Parameters.... 22-19
Table 294 Boundary Clock Advanced Parameters (CLI).... 22-21
Table 295 Boundary Clock Port Parameters (CLI).... 22-23
Table 296 Boundary Clock Configuration CLI Parameters.... 22-23
Table 297 Boundary Clock Port Statistics (CLI) 22-24
Table 298 Inactivity Timeout Period CLI Parameters 23-2
Table 299 Blocking Upon Login Failure CLI Parameters 23-3
Table 300 Blocking Unused Accounts CLI Parameters.... 23-4
Table 301 Password Aging CLI Parameters.... 23-5
Table 302 Password Strength Enforcement CLI Parameters.... 23-6
Table 303 Force Password Change on First Time Login CLI Parameters 23-6
Table 304 User Profile CLI Parameters.... 23-8
Table 305 User Profile Access Protocols CLI Parameters 23-9
Table 306 User Accounts CLI Parameters.... 23-10
Table 307 Activate RADIUS CLI Parameters.... 23-11
Table 308 RADIUS Server CLI Parameters.... 23-12
Table 309 CSR Generation and Upload CLI Parameters 23-15
Table 310 Certificate Download and Install CLI Parameters 23-16
Table 311 Security Log CLI Parameters 23-20
Table 312 Configuration Log CLI Parameters 23-22
Table 313 Editing Alarm Text and Severity CLI Parameters.... 24-4
Table 314 Restoring Alarms to Default CLI Parameters 24-5
Table 315 Uploading Unit Info CLI Parameters 24-10
Table 316 Radio Loopback CLI Parameters.... 24-12
Table 317 Ethernet Loopback CLI Parameters.... 24-13
Table 318 E1/DS1 Loopback CLI Parameters.... 24-14
Table 319 Maintenance Domain CLI Parameters 24-16
Table 320 SOAM MEG CLI Configuration Parameters 24-18
Table 321 MEP CLI Configuration Parameters.... 24-21
Table 322 MEP and Remote MEP Status Parameters (CLI) 24-23
Table 323 Loopback CLI Parameters.... 24-28
Table 324 CW Mode CLI Parameters.... 24-30
Table 325 Fault Finding Checklist 25-1
Table 326 GbE Interface Pin-Out Diagram (GbE1, GbE2, GbE3, GbE4) 27-2
Table 327 Management Interface Pin-Out Diagram (MGMT).... 27-4
Table 328 E1/DS1 Interface Pin-Out Diagram (E1/DS1 1-16) 27-6
Table 329 Synchronization Interface Pin-Out Diagram 27-10
Table 330 Sync Interface LEDs.... 27-11
Table 331 Terminal Interface Pin-Out Diagram....27-13
Table 332 External Alarm Interface Pin-Out Diagram 27-14
Table 333 GbE Interface Pin-Out Diagram (GbE1, GbE2, GbE3, GbE4, 2.5GE5, 2.5GE6).... 28-17
Table 334 Management Interface Pin-Out Diagram (MGMT)....28-19
Table 335 E1/DS1 Interface Pin-Out Diagram (E1/DS1 1-16) 28-20
Table 336 Radio Interface Pin-Out Diagram (RFU1, RFU2, RFU3) 28-24
Table 337 Synchronization Interface Pin-Out Diagram 28-27
Table 338 Terminal Interface Pin-Out Diagram 28-29
Table 339 External Alarm Interface Pin-Out Diagram.... 28-30
About This User Guide
This document explains how to configure and operate a PTP 820 Split-Mountsystem. This document applies to system release 11.3
The PTP Split-Mount system is a modular system with a wide variety of configuration options. Not all configurations are described in this manual.
This guide contains the following Chapters:
- Introduction
Chapter 1: Introduction
• Web EMS configuration
Chapter 2: Getting Started
Chapter 3: Configuration Guide
Chapter 4: Unit Management
Chapter 5: Radio Configuration
Chapter 6: Ethernet Services and Interfaces
Chapter 7: Quality of Service (QoS)
Chapter 8: Ethernet Protocols
Chapter 9: TDM Services and Interfaces
Chapter 10: Synchronization
Chapter 11: Access Management and Security
Chapter 12: Alarm Management and Troubleshooting
Chapter 13: Web EMS Utilities
- CLI Configuration
Chapter 14: Getting Started (CLI)
Chapter 15: Configuration Guide (CLI)
Chapter 16: Unit Management (CLI)
Chapter 17: Radio Configuration (CLI)
Chapter 18: Ethernet Services and Interfaces (CLI)
Chapter 19: Quality of Service (QoS) (CLI)
Chapter 20: Ethernet Protocols (CLI)
Chapter 21: TDM Services and Interfaces (CLI)
Chapter 22: Synchronization (CLI)
Chapter 23: Access Management and Security (CLI)
Chapter 24: Alarm Management and Troubleshooting (CLI)
- Maintenance
Chapter 25: Fault Finding
Chapter 26: Replacing an IDU or SM card
Chapter 27: Pin-Outs and LEDs
- Appendices
Chapter 29: Alarms List
Contacting Cambium Networks
Support website: http://www.cambiumnetworks.com/support
Main website: http://www.cambiumnetworks.com
Sales enquiries:
solutions@cambiumnetworks.com
Support enquiries:
support@cambiumnetworks.com
Repair enquiries rma@cambiumnetworks.com
Telephone number list:
http://www.cambiumnetworks.com/support/contact-support
Address:
Cambium Networks Limited,
Global Headquarters
3800 Golf Road,
Suite 360
Rolling Meadows,
IL 60008 USA
Purpose
Cambium Networks Point-To-Point (PTP) documents are intended to instruct and assist personnel in the operation, installation and maintenance of the Cambium PTP equipment and ancillary devices. It is recommended that all personnel engaged in such activities be properly trained.
Cambium disclaims all liability whatsoever, implied or express, for any risk of damage, loss or reduction in system performance arising directly or indirectly out of the failure of the customer, or anyone acting on the customer's behalf, to abide by the instructions, system parameters, or recommendations made in this document.
Cross references
References to external publications are shown in italics. Other cross references, emphasized in blue text in electronic versions, are active links to the references.
This document is divided into numbered chapters that are divided into sections. Sections are not numbered, but are individually named at the top of each page, and are listed in the table of contents.
Feedback
We appreciate feedback from the users of our documents. This includes feedback on the structure, content, accuracy, or completeness of our documents. Send feedback to support@cambiumnetworks.com.
Problems and warranty
Reporting problems
If any problems are encountered when installing or operating this equipment, follow this procedure to investigate and report:
1 Search this document and the software release notes of supported releases.
2 Visit the support website.
3 Ask for assistance from the Cambium product supplier.
4 Gather information from affected units, such as any available diagnostic downloads.
5 Escalate the problem by emailing or telephoning support.
Repair and service
If unit failure is suspected, obtain details of the Return Material Authorization (RMA) process from the support website.
Hardware warranty
Cambium's standard hardware warranty is for one (1) year from date of shipment from Cambium Networks or a Cambium distributor. Cambium Networks warrants that hardware will conform to the relevant published specifications and will be free from material defects in material and workmanship under normal use and service. Cambium shall within this time, at its own option, either repair or replace the defective product within thirty (30) days of receipt of the defective product. Repaired or replaced product will be subject to the original warranty period but not less than thirty (30) days.
To register PTP products or activate warranties, visit the support website. For warranty assistance, contact the reseller or distributor.

Caution
Using non-Cambium parts for repair could damage the equipment or void warranty. Contact Cambium for service and repair instructions.
Portions of Cambium equipment may be damaged from exposure to electrostatic discharge. Use precautions to prevent damage.
Security advice
Cambium Networks systems and equipment provide security parameters that can be configured by the operator based on their particular operating environment. Cambium recommends setting and using these parameters following industry recognized security practices. Security aspects to be considered are protecting the confidentiality, integrity, and availability of information and assets. Assets include the ability to communicate, information about the nature of the communications, and information about the parties involved.
In certain instances Cambium makes specific recommendations regarding security practices, however the implementation of these recommendations and final responsibility for the security of the system lies with the operator of the system.
Warnings, cautions, and notes
The following describes how warnings and cautions are used in this document and in all documents of the Cambium Networks document set.
Warnings
Warnings precede instructions that contain potentially hazardous situations. Warnings are used to alert the reader to possible hazards that could cause loss of life or physical injury. A warning has the following format:

Warning
Warning text and consequence for not following the instructions in the warning.
Cautions
Cautions precede instructions and are used when there is a possibility of damage to systems, software, or individual items of equipment within a system. However, this damage presents no danger to personnel. A caution has the following format:

Caution
Caution text and consequence for not following the instructions in the caution.
Notes
A note means that there is a possibility of an undesirable situation or provides additional information to help the reader understand a topic or concept. A note has the following format:

Note
Note text.
Caring for the environment
The following information describes national or regional requirements for the disposal of Cambium Networks supplied equipment and for the approved disposal of surplus packaging.
In EU countries
The following information is provided to enable regulatory compliance with the European Union (EU) directives identified and any amendments made to these directives when using Cambium equipment in EU countries.

Disposal of Cambium equipment
European Union (EU) Directive 2002/96/EC Waste Electrical and Electronic Equipment (WEEE)
Do not dispose of Cambium equipment in landfill sites. For disposal instructions, refer to
http://www.cambiumnetworks.com/support
Disposal of surplus packaging
Do not dispose of surplus packaging in landfill sites. In the EU, it is the individual recipient's responsibility to ensure that packaging materials are collected and recycled according to the requirements of EU environmental law.
In non-EU countries
In non-EU countries, dispose of Cambium equipment and all surplus packaging in accordance with national and regional regulations.
Chapter 1: Introduction
This section includes:
- Configuration Tips
- System Overview
• PTP 820F IDU Hardware Architecture
• PTP 820G IDU Hardware Architecture - Front Panel Description
RFU Overview
• The Web-Based Element Management System
• Reference Guide to Web EMS Menu Structure
Configuration Tips
This section describes common issues and how to avoid them.
Ethernet Port Configuration
For RJ-45 ports, it is recommended to enable Auto-Negotiation for both the local port and its peer in order to obtain optimal performance.
For SFP ports, it is recommended to disable Auto-Negotiation.
For Ethernet interfaces 5 and 6 in the PTP 820F, Auto-Negotiation is supported on the RJ-45 interfaces (2.5GE5/2.5GE6), but not on the SFP interfaces (SFP5/SFP6). On SFP5 and SFP6, Auto-Negotiation must be set to Off. In addition, Auto-Negotiation must be set to Off on the Ethernet ports to which SFP5 and SFP6 are connected.
For instructions, see Configuring Ethernet interfaces.
Admin Status of Second Radio Interface
If the PTP 820F is connected to a single-carrier RFU, or if the second carrier of a MultiCore RFU is not in use, you should set the Admin status field of the second Radio interface (Port 2 or Port 4) to Down to disable the Radio interface and prevent unnecessary alarms. See Enabling the Interfaces (Interface Manager)
SyncE Interface Configuration
When configuring a Sync source or outgoing clock on an Ethernet interface, the Media Type of the interface must be RJ-45 or SFP, not Auto-Type. See Synchronization.
In-Band Management
It is strongly recommended not to configure ASP on an Ethernet interface that carries in-band management traffic. If you do need to use ASP on this interface, it is recommended to use it in ASP Management Safe (CSF) mode to avoid loss of management in the event that ASP is triggered. See Configuring Automatic State Propagation and Link Loss Forwarding.
When inband management is being transmitted via a LAG configuration, it is recommended to enable LACP to overcome uni-directional failures. See Configuring a LAG Group.
If you are using 1588 Transparent Clock, make sure the Transparent Clock settings are symmetrical; that is, make sure Transparent Clock is either enabled or disabled on both sides of the link. To avoid loss of management, make sure to configure Transparent Clock on the remote side of the link first, then on the local side. See Configuring 1588 Transparent Clock.
To avoid loss of management when configuring Multi-Carrier ABC, make sure to add or remove members on the remote side of the link first, then on the local side. See Configuring Multi-Carrier ABC.
In order to use in-band management with an external switch, it must be supported on the external switch.
When configuring in-band management, be sure to tag the management traffic to avoid overflow of the CPU.
It is strongly recommended to assign the management service (1025) a System Release of 7 to ensure that management packets receive high priority and are not discarded in instances of network congestion. See Configuring Ethernet Services.
For instructions on configuring in-band management on the PTP 820, see Configuring In-Band Management.
If you are configuring LAG with an external switch, the switch must support LAG. For instructions on configuring LAG, see Configuring Link Aggregation (LAG) and LACP.
When using IEEE 1588 PTP synchronization across a LAG link, follow the recommendations set forth in ITU-T standard G.8275.1, Annex 6 in order to prevent PTP packets from following different paths between the devices, which can lead to asymmetric delay. For instructions on configuring LAG, see Configuring Link Aggregation (LAG) and LACP.
Software Upgrade
When upgrading software via HTTP, make sure the software package is not unzipped. For instructions, see Upgrading the Software.
Configuration Management and Backup Restoration
Configuration files can only be copied to the same PTP 820 hardware type with the same part number as the unit from which they were originally saved. For example, an PTP 820G configuration file can only be restored to an PTP 820G with the same part number as the unit from which it was saved. See Backing Up and Restoring Configurations.
System Overview
This section provides a brief overview of the PTP 820 systems described in this document. A separate Technical Description is available for each product, providing a full description of the individual system and its specifications
PTP 820F
PTP 820F is a split-mount edge node that delivers multi-Gbps radio capacity to the transport network. It provides operators with the simplicity that comes with deploying a very compact, fixed configuration node, helping operators to meet their operational efficiency targets.
PTP 820F contains up to six Ethernet interfaces and up to three RFU interfaces, as detailed in PTP 820F IDU Hardware Architecture
For TDM traffic, PTP 820F includes a 16 x E1/DS1 interface
PTP 820F is based on a passive cooling design that does not require fans, for improved operational efficiency.
An PTP 820F consists of an indoor unit (IDU) and up to three radio frequency units (RFUs). PTP 820F can be used with MultiCore RFU-D and single-carrier RFU-S.
PTP 820G
PTP 820G is a compact, split-mount hauling solution for ring nodes. Its fixed configuration and low power consumption make it simple to install and maintain. Hosting the common capabilities of the PTP 820 platform, it provides a cost-effective, reliable, and flexible hauling solution.
PTP 820G can also include the following optional features:
• Multi-carrier package including two radio channels and radio interfaces.
• 16 x E1/DS1E1/DS1E1/DS1 interfaces, with advanced support for TDM services.
• Dual-feed power option for power redundancy.
PTP 820G is built specifically for tail/edge sites deployments.
The following interfaces are supported:
- 6 x 1 GbE interfaces total
- 2 x dual mode GbE electrical or cascading interfaces (RJ-45)
○ 2 x GbE electrical interfaces (RJ-45)
○ 2x GbE optical interfaces (SFP)
• Optional: 16 x E1/DS1 interfaces
- Single or dual radio interfaces (TNC)
• Single power-feeds (-48v)
- Sync in/out interface
• Management interfaces
o Terminal – RS232 (RJ-45)
- 2x FE electrical interfaces (RJ-45)
• External alarms interface
PTP 820G is based on a passive cooling design that does not require fans, for improved operational efficiency.
A PTP 820G consists of an indoor unit (IDU) and one or two radio frequency units (RFUs). PTP 820G can be used with RFU-C, 1500HP/RFU-HP, and RFU-A.
Assured Platform
PTP 820 Assured platform enhances network reliability and security, ensuring that mission-critical networks maintain availability, and protecting the confidentiality and integrity of their users' data.
The PTP 820 Assured platform is compliant with FIPS 140-2, including:
• Compliance with FIPS 140-2 specifications for cryptography module.
• FIPS 140-2 Level 2 physical security.
• AES-256 encryption (FIPS 197) over radio links.
The PTP 820 Assured platform also provides:
• Secured communication and protocols for management interface.
• Centralized user authentication management via RADIUS.
- Advanced identity management and password policy enforcement.
• Security events log.
- Secure product architecture and development.
The PTP 820G supports Assured platform.

Note
Release 11.3 cannot be used in PTP 820 Assured platforms. For PTP 820 Assured, use release 11.1. or 8.3. Support for T3 input and T4 output is planned for future release.
PTP 820F IDU Hardware Architecture
PTP 820F is a compact unit that fits in a single rack unit, with a passive cooling system that eliminates the need for fans. A PTP 820F system consists of an PTP 820F indoor unit (IDU) and up to three radio frequency units (RFUs).
The IDU is connected to each RFU via CAT-5e or CAT-6/6a cables or optical fibers. When using CAT-5e or CAT-6/6a cables, power can be provided to the RFUs via PoE over the CAT-5e or CAT-6/6a cables. When using optical fibers, power can be provided to the RFUs via PoE (power only) or via an external DC power source.
RFU-D-HP units must be fed power via an external DC cable.
For details, see IDU-RFU connection.
An PTP 820F IDU contains:
• 4 x 1 GbE combo interfaces (GbE 1-4/SFP 1-4)
• 1 x 2.5/1 GbE combo interface (2.5GE6/SFP6)
• Two combo (RJ-45 or SFP) radio interfaces (RFU1 and RFU 2)
• 1 x radio or 2.5/1 GbE combo interface (RFU3/SFP5, RFU3/2.5GE5)

Note
In System Release 10.0, only one radio interface (RFU1) can be used per PTP 820F unit. When used with a MultiCore RFU (RFU-D or RFU-D-HP), this interface can support two radio carriers. However, the second carrier must part of a Multi-Carrier ABC group in order to be utilized.
Also, in System Release 10.0, only four Ethernet interfaces (GbE 1-4/SFP 1-4) can be used. GbE 1/SFP 1 and GbE 2/SFP 2 can be configured as normal Ethernet traffic interfaces or as cascading interfaces.
For TDM traffic, an PTP 820F IDU includes a 16 x E1/DS1 interface.
The IDU also includes two FE management interfaces, a DB9 dry contact external alarms interface, and an RJ-45 terminal console interface for connection to a local craft terminal. Optionally, one of the FE management interfaces can be used as an RJ-45 synchronization interface.
PTP 820F receives an external supply of -48V, with a dual-feed option for power redundancy.
Front Panel Description
This section describes the PTP 820F's front panel. The following sections provide detailed descriptions of the PTP 820F's interfaces and LEDs.
Figure 1 PTP 820F Front Panel and Interface

Table 1 PTP 820F Interfaces
| Interface | For Further Information |
| 16 x E1s E1/DS1 Interface | |
| External Alarms (DB9) | External Alarms |
| Terminal Interface (RJ-45) | Terminal Interface |
| 2 x FE Management Interfaces (RJ-45) | Ethernet Management Interfaces |
| Sync Interface In/Out (RJ-45) | Synchronization Interface |
| 4 x 1 GbE Combo Interfaces (GbE 1-4/SFP 1-4) | Ethernet Traffic Interfaces |
| 1 x 2.5/1 GbE Combo Interface (2.5GE6/SFP6) ^1 | Ethernet Traffic Interfaces |
| 2 x Electrical/Optical RFU Interfaces (RFU1/RFU2) | Radio Interfaces |
| 1 x Optional RFU or 2.5/1 GbE Combo Interface (RFU3/SFP5, RFU3/2.5GE5) ^1 | Ethernet Traffic Interfaces |
| Power Interface -48V | Power Interface |
Ethernet Traffic interfaces
The front panel of the PTP 820F contains 4 x GbE combo interfaces (electrical or optical) for Ethernet traffic. These interfaces are numbered as shown in the following figure.
Figure 2 GbE Combo Interface Numbering

GbE 3 GbE 4
SFP 3 SFP 4
GbE 1/SFP 1 and GbE 2/SFP 2 can be configured as normal Ethernet traffic interfaces or as cascading interfaces. When operating in cascading mode, these interfaces can handle hybrid Ethernet and Native TDM traffic, enabling operators to create links among multiple PTP 820 units in a node for multi-directional applications based on hybrid Ethernet and Native or pseudowire TDM services..
In addition, two pairs of electrical and optical interfaces towards the right of the front panel can be used to provide either two Ethernet interfaces or one Ethernet interface and one radio interface:
- RFU3/SFP5 and RFU3/2.5GE5 – A combo interface that can be used as either an SFP or RJ-45 RFU interface or an SFP or RJ-45 Ethernet interface.
- SFP6/2.5GE6 – A combo interface (SFP or RJ-45) for Ethernet.
Figure 3 RFU3/ SFP5-6 Interfaces
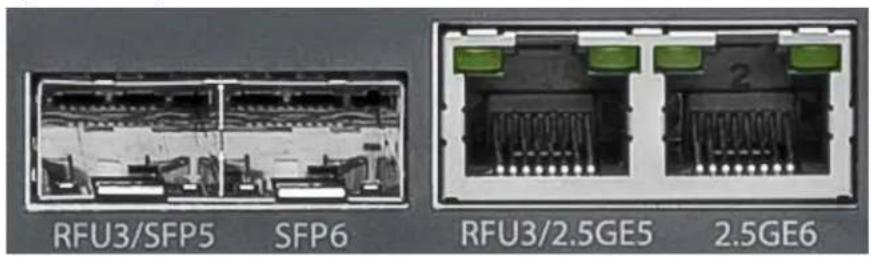
Ethernet Management interfaces
PTP 820F contains two FE management interfaces, which connect to a single RJ-45 physical connector on the front panel. The RJ-45 connector is the upper RJ-45 interface in a pair of interfaces labeled MGMT/SYNC.
Figure 4 Management Interface Pin Connections

flowchart
graph LR
    subgraph Management Switch
        A["Port 1"] --> B["TX+"]
        A --> C["TX-"]
        A --> D["RX+"]
        A --> E["RX-"]
    end

    subgraph RJ-45 Connector (female)
        F["Port 2"] --> G["TX+"]
        F --> H["TX-"]
        F --> I["RX+"]
        F --> J["RX-"]
    end

    B --> K["1"]
    C --> L["2"]
    D --> M["3"]
    E --> N["4"]
    G --> O["5"]
    H --> P["6"]
    I --> Q["7"]
    J --> R["8"]
If the user only needs to use a single management interface, a standard Cat5 RJ-45 cable (straight or cross) can be connected to the MGMT interface.
To access both management interfaces, a special 2 x FE splitter cable can be ordered from Cambium.
Table 2 2 x FE Splitter Cable Model Number
| Model Number | Description |
| N000082L122A | PTP820 Ethernet split cable for Management |
E1/DS1 Interface
PTP 820F includes an MDR69 connector in which 16 E1/DS1 interfaces are available (ports 1 through 16).
Radio Interfaces
PTP 820F includes two combo radio interfaces (electrical or optical, RFU1 and RFU2). A third interface can also be used as a combo radio interface (electrical or optical, RFU3). See Ethernet Traffic Interfaces.
RFU1 and RFU2 can each be used with a 1+0 or, with a MultiCore RFU, 2+0 configuration.
RFU3 can only be used with 1+0 configurations.
RFU-E using 500 MHz channel bandwidth must use radio interfaces RFU1 or RFU2.

Note
Only RFU1 is available for use in System Release 10.0.
For some RFUs, PoE power can be supplied directly from the IDU via an RJ-45 radio interface.
Power Interface
PTP 820F receives an external supply of -48V current via a dual-feed power interface, which can be connected to two separate power sources for power redundancy. The PTP 820F monitors the power supply for under-voltage and includes reverse polarity protection, so that if the positive (+) and negative (-) inputs are mixed up, the system remains shut down.
The allowed power input range for the PTP 820F is -40V to -60V. An under voltage alarm is triggered if the power goes below the allowed range, and an over voltage alarm is triggered if the power goes above the allowed range.
Synchronization Interface
PTP 820F includes an RJ-45 synchronization interface for T3 clock input and T4 clock output. The interface is the lower RJ-45 interface in a pair of interfaces labeled MGMT/SYNC.
Terminal Interface
PTP 820F includes an RJ-45 terminal interface (RS-232). A local craft terminal can be connected to the terminal interface for local CLI management of the unit.
External Alarms
PTP 820F includes a DB9 dry contact external alarms interface. The external alarms interface supports five input alarms and a single output alarm.
The input alarms are configurable according to:
1 Intermediate
2 Critical
3 Major
4 Minor
5 Warning
The output alarm is configured according to predefined categories.
Storage Memory Card
Each PTP 820F unit includes a Storage Memory card (SM card). The SM card holds the configuration and software for the IDU. The SM card is embedded in the SM card cover. In the event of IDU replacement, re-using the existing SM card cover is necessary to ensure that the unit's software and configuration is maintained.
An SM card is pre-installed inside eachPTP 820F unit. It can also be ordered as a separate item (e.g., as a spare unit).
Figure 5 SM Card and Cover

natural_image
Technical line drawing of a rack-mounted server or network device with multiple slots and connectors (no text or symbols)PTP 820G IDU Hardware Architecture
PTP 820G is a compact unit that fits in a single rack unit, with a passive cooling system that eliminates the need for fans. A PTP 820G system consists of a PTP 820G indoor unit (IDU) and one or two radio frequency units (RFUs). A coaxial cable connects the IDU to each RFU, transmits traffic and management data between the IDU and the RFU, and provides -48V DC power to the RFU.
A PTP 820G IDU contains six Ethernet interfaces, one or two radio interfaces depending on the hardware configuration, and optionally a 16 x E1/DS1 interface.
The IDU includes two FE management interfaces, a DB9 dry contact external alarms interface, an RJ-45 synchronization interface, and an RJ-45 terminal console interface for connection to a local craft terminal.
PTP 820G receives an external supply of -48V, with a dual-feed option for power redundancy.
The following hardware assembly options are available for the PTP 820G IDU:
• One or two radio interfaces
• One or two power interfaces
• With or without 16 xDS1 interfaces
Front Panel Description
This section describes the PTP 820G front panel. The following sections provide detailed descriptions of the PTP 820G interfaces and LEDs.
Figure 6 PTP 820G Front Panel and Interfaces

Table 3 PTP 820 Interfaces
| Interface For Further Information | |
| 16 x E1/DS1s (optional) | E1/DS1 Interface (Optional) |
| External Alarms (DB9) | External Alarms |
| TDM Sync Interface In/Out (RJ-45) | Synchronization Interface |
| 2 x FE Management Interfaces (RJ-45) | Ethernet Management Interfaces |
| Terminal Interface (RJ-45) | Terminal Interface |
| 2 x GbE Dual Mode GbE Electrical or Cascading Interfaces (RJ-45) | Ethernet Traffic Interfaces |
| 2 x GbE Electrical Interfaces (RJ-45) | Ethernet Traffic Interfaces |
| 2 x GbE Optical Interfaces (SFP) | Ethernet Traffic Interfaces |
| Radio Interfaces (TNC) Radio Interfaces | |
| Power Interface -48V | Power Interface |
Ethernet Traffic Interfaces
The front panel of the PTP 820G contains four electrical and two optical GbE Ethernet traffic interfaces:
- 2 x GbE dual mode electrical or cascading interfaces (RJ-45) – GbE1/CS1, GbE2/CS2
• 2 x GbE electrical interfaces (RJ-45) – GbE3, GbE4
• 2 x GbE optical interfaces (SFP) – SFP5, SFP6
GbE1/CS1 and GbE2/CS2 can be configured as normal GbE traffic interfaces or as cascading interfaces. When operating in cascading mode, these interfaces can handle hybrid Ethernet and Native TDM traffic, enabling operators to create links among multiple PTP 820G units in a node for multi-carrier and multi-directional applications based on hybrid Ethernet and TDM (Native or pseudowire) services.
Ethernet Management Interfaces
PTP 820G contains two FE management interfaces, which connect to a single RJ-45 physical connector on the front panel (MGMT).
Figure 7 Management Interface Pin Connections

flowchart
graph LR
    subgraph_ManagementSwitch["Management Switch"]
        A1["TX+"] --> B1["1"]
        A2["TX-"] --> B2["2"]
        A3["RX+"] --> B3["3"]
        A4["RX-"] --> B4["4"]
    end
    subgraph_RJ-45Connector["(RJ-45 Connector (female))"]
        C1["TX+"] --> D1["5"]
        C2["TX-"] --> D2["6"]
        C3["RX+"] --> D3["7"]
        C4["RX-"] --> D4["8"]
    end
    A1 --> C1
    A2 --> C2
    A3 --> C3
    A4 --> C4
    C1 --> D1
    C2 --> D2
    C3 --> D3
    C4 --> D4
If the user only needs to use a single management interface, a standard Cat5 RJ-45 cable (straight or cross) can be connected to the MGMT interface.
To access both management interfaces, a special 2 x FE splitter cable can be ordered from Cambium.
Table 4 2 x FE Splitter Cable Model Number
| Model Number | Description |
| N000082L122A | PTP820 Ethernet split cable for Management |
E1/DS1 Interface (Optional)
Optionally, PTP 820G can be ordered with an MDR69 connector in which 16 E1/DS1 interfaces are available (ports 1 through 16).
Radio Interfaces
PTP 820G includes one or two radio interfaces, depending on the hardware assembly option that was selected. Each radio interface uses a TNC connector type. Each radio interface is connected to an RFU via coaxial cable. This connection is used for traffic between the RFU and the IDU. It is also used to provide -48V DC power from the IDU to the RFU, as well as for management and configuration of the RFU.
The radio interfaces are labeled Radio 1 and, if there is a second radio interface, Radio 2.
Power Interface
PTP 820G receives an external supply of -48V current via a power interface. The PTP 820G monitors the power supply for under-voltage and includes reverse polarity protection, so that if the positive (+) and negative (-) inputs are mixed up, the system remains shut down.
The allowed power input range for the PTP 820G is -40V to -60V. An under voltage alarm is triggered if the power goes below the allowed range, and an over voltage alarm is triggered if the power goes above the allowed range.
Synchronization Interface
PTP 820G includes an RJ-45 synchronization interface for T3 clock input and T4 clock output. The interface is labeled SYNC.

Note
T3 is only supported when the unit is operating in ETSI mode
Terminal Interface
PTP 820G includes an RJ-45 terminal interface (RS-232). A local craft terminal can be connected to the terminal interface for local CLI management of the unit.
External Alarms
PTP 820G includes a DB9 dry contact external alarms interface. The external alarms interface supports five input alarms and a single output alarm.
The input alarms are configurable according to:
1 Intermediate
2 Critical
3 Major
4 Minor
5 Warning
The output alarm is configured according to predefined categories.
Storage Memory Card
Each PTP 820G unit includes a Storage Memory card (SM card). The SM card holds the configuration and software for the IDU. The SM card is embedded in the SM card cover. In the event of IDU replacement, re-using the existing SM card cover is necessary to ensure that the unit's software and configuration is maintained.
An SM card is pre-installed inside each PTP 820G unit. It can also be ordered as a separate item (e.g., as a spare unit).
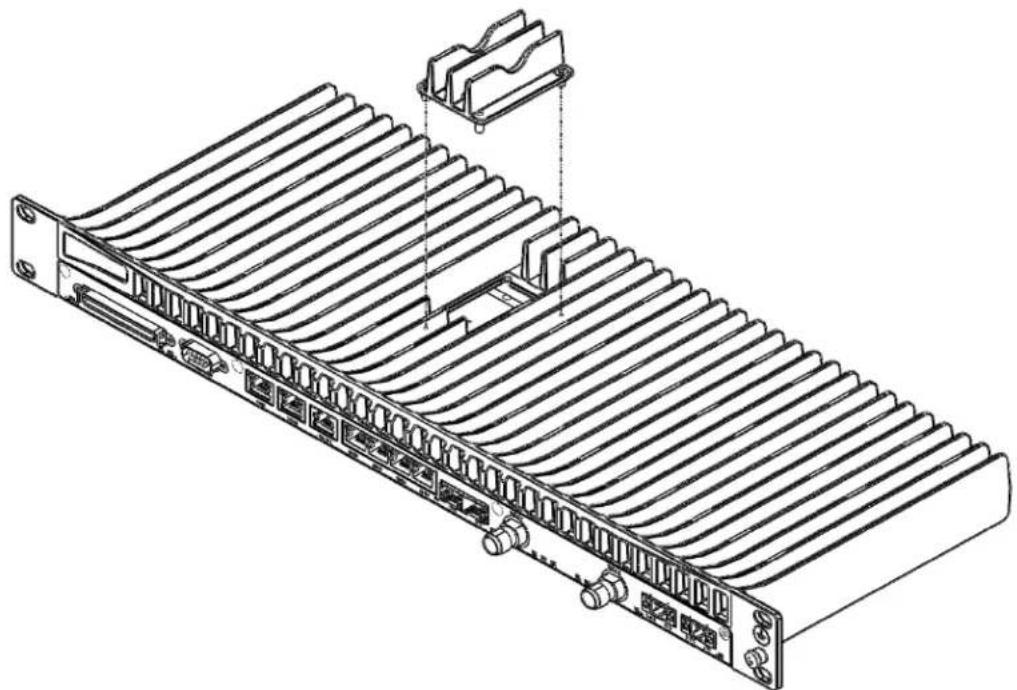
natural_image
Technical line drawing of a heat exchanger or cooling unit with cooling fins and connectors (no text or symbols)Figure 8: SM Card and Cover
RFU Overview
Radio Frequency Units (RFUs) were designed with sturdiness, power, simplicity, and compatibility in mind. These advanced systems provide high-power transmission for short and long distances and can be assembled and installed quickly and easily. RFU's used with PTP 820F.
The following RFUs can be used with PTP 820F:
- RFU-D – MultiCore that operates in the 6-42 GHz frequency range, supporting channel bandwidth of 14-112 MHz and modulations of BSPK to 4096 QAM.
- RFU-D-HP – High-Power MultiCore RFU that operates in the 4-11 GHz frequency range, supporting channel bandwidth of 14-112 MHz and modulations of BSPK to 4096 QAM.
- RFU-E –Operates in the E-band frequency range, supporting 71-76 GHz and 81-86 GHz frequencies, channel bandwidth of 14, 28, 62.5, 125, and 250 MHz, and modulations of BSPK to 1024 QAM.
- RFU-S – Operates in the 6-42 GHz frequency range, supporting channel bandwidth of 14-112 MHz and modulations of BSPK to 4096 QAM.
RFU's used with PTP 820F
The following RFUs can be used with PTP 820G:
- RFU-C –A state-of-the-art RFU designed for a broad range of interfaces and capacities from 10 Mbps up to 500 Mbps. RFU-C operates in a wide range of spectrum bands, from 6 to 42 GHz. The premium version, RFU-Ce, provides a range of modulations from QPSK to 2048 QAM. RFU-C and RFU-Ce require RFU SW version: 2.17.
- 1500HP/RFU-HP –1500HP and RFU-HP are high transmit power RFUs designed for long haul applications with multiple carrier traffic. Together with their unique branching design, 1500HP and RFU-HP can chain up to five carriers per single antenna port and 10 carriers for dual port, making them ideal for trunk or multi carrier applications. The 1500HP and RFU-HP can be installed in either indoor or outdoor configurations. RFU-HP requires RFU SW version: 5.14. 1500HP requires RFU SW version 8.13a2.
- RFU-A (including RFU-Ae/Aep) –RFU-A is a high transmit power RFU designed for compact long-haul applications. RFU-A offers a low scale trunk solution with up to four radio carriers and operates in the frequency range of 6, 7, 8, and 11 GHz. ^2 RFU-A requires RFU SW version: 5.14.
IDU-RFU Connection and Power Supply for PTP 820F
An RFU-D, RFU-D-HP, RFU-E, and RFU-S can be connected to anPTP 820F via a standard CAT-5e or preferably CAT-6/6a cable, with RJ-45 connectors on the RFU and an RJ-45 connector on thePTP 820F. They can also be connected to the PTP 820F over optical fiber cables via the optical (SFP) RFU connection on the PTP 820F.
For an RFU-D, RFU-E, or RFU-S connecting to an electrical RFU interface, the cable can carry both the data and the DC power required for the RFU. For configuration instructions, see Configuring the IDU-RFU Connection (PTP 820F only).
For an RFU-D, RFU-E, or RFU-S connecting to an optical RFU interface, and for an RFU-D-HP connecting to either an electrical or an optical RFU interface, an external DC power cable is required to supply power to the RFU.
Table 5 IDU-RFU Cable connection for PTP 820F
| RFU | Interface | Cable Type | Maximum Length | |
| 6-11 GHz | 13-42 GHz | |||
| RFU-D Optical Fiber 300m | ||||
| Electrical | CAT-5e (24 AWG) | 65m | 130m | |
| CAT-6a (22 AWG) | 100m | 150m | ||
| DC Power DC (18 AWG) 100m | ||||
| RFU-E/RFU-S | Optical | Fiber | 300m | |
| Electrical | CAT-5e (24 AWG) | 150m | ||
| CAT-6a (22 AWG) | 150m | |||
| DC Power | DC (18 AWG) | 150m | ||
| DC (14 AWG) | 151m-300m | |||
| RFU-D-HP | Optical | Fiber | 300m | |
| Electrical | CAT-5e (24 AWG) | 150m | ||
| CAT-6a (22 AWG) | 150m | |||
| DC Power | DC (14 AWG) | 100m | ||
| DC (10 AWG) | 101m-200m | |||
| DC (8 AWG) | 201m-300m | |||
IDU-RFU Connection and Power Supply for PTP 820G
RFU-C, RFU-HP/1500HP, and RFU-A RFUs are connected to the IDU by a coaxial cable RG-223 (up to 100 m/300 ft), Belden 9914/RG-8 (up to 300 m/1000 ft) or equivalent, with an N-type connector (male) on the RFU and a TNC connector on thePTP 820. These RFUs are powered via this cable.
The Web-Based Element Management System
This section includes:
• Introduction to the Web EMS
• Web EMS Page Layout
• The Unit Summary Page
• The Radio Summary Page
• The Security Summary Page
Introduction to the Web EMS
The Element Management System (Web EMS) is an HTTP web-based element manager that enables the operator to perform configuration operations and obtain statistical and performance information related to the system, including:
- Configuration Management – Enables you to view and define configuration data.
- Fault Monitoring – Enables you to view active alarms.
- Performance Monitoring – Enables you to view and clear performance monitoring values and counters.
• Diagnostics and Maintenance – Enables you to define and perform loop back tests and software updates. - Security Configuration – Enables you to configure security features.
- User Management – Enables you to define users and user groups.
The Web EMS opens to a page that summarizes the key unit parameters. The next page, when scrolling down the Web EMS main menu, summarizes the key radio parameters. Next is a page that summarizes the key security-related parameters of the unit. See The Unit Summary page and The Radio Summary page.

Note
The Security Summary page is available only in System Release 11.1.
A Web-Based EMS connection to the PTP 820G can be opened using a web browser (Internet Explorer, Mozilla Firefox, or Google Chrome). The Web-Based EMS uses a graphical interface.

Note
For optimal Web EMS performance, it is recommended to ensure that the network speed is at least 100 Kbps for most operations, and at least 5 Mbps for software download operations.
The Web-Based EMS shows the actual unit configuration and provides easy access to any interface. A wide range of configuration, testing, and system monitoring tasks can be performed through the Web EMS.

Note
The alarms and system configuration details shown in this manual do not necessarily represent actual parameters and values on a fully operating PTP 820G system. Some of the pages and tasks described in this Manual may not be available to all users, based on the actual system configuration, activation key, and other details.
Web EMS Page Layout
Each Web EMS page includes the following sections:
• The left section of the page displays the Web EMS menu tree:
- Click ▷ to display the sub-options under a menu item.
- Click ▲ to hide the sub-options under a menu item.
• The main section of the page provides the page's basic functionality.
Figure 8 Main Web EMS Page
![Logout - V Connection Admin Filter Unit Parameters Description: 94-2000X VRL 2-rates, 6 GB, 16 TSM dual feed System up time: 37 minutes, 33 seconds Local date and time: 08-02-2005 22:46:42 Running Version: 01.0.0.6.103 Unit Temperature: 30°C, 98°F Voltage Input(Volt): 0V Partnumber: 2H-0009-1A Serial number: 83999000075 Current alarms Time Severit's ▲ Description Origin Alarm id 08-02-2000 22:11:11 ● Radio rate of frame Radio Slot 1, Port 2 883 08-02-2000 22:11:32 ● 1588-BC performance is degraded due to loss of system clock reference 0 5046 08-02-2000 22:10:16 ● LAD operational state is down LAG Grid# #1 101 08-02-2000 22:10:16 ● LAD operational state is down LAG Grid# #2 101 08-02-2000 22:11:53 ● Cable team Radio Slot 1, Port 2 1701 08-02-2000 22:11:15 ● Under voltage RDC #1 1702 08-02-2000 22:11:34 ● 1588TCs not operational Radio Slot 1, Port 2 5016 08-02-2000 22:11:13 ○ RFU communication failure Radio Slot 1, Port 2 1753 08-02-2000 22:11:53 ○ RFU TXA/Uve Radio Slot 1, Port 2 1735 08-02-2000 22:10:33 ○ Demo mode is active Sot 1 991 CDU Inventory Radio Location Type Part Number Serae-Number Running Software Version Radio Slot 1, Port 1 Unknown - Radio Slot 1, Port 2 Unknown - Page Refresh: Internal (second) [MIME] LAB LUXE 14.23.99 > Refining](/content/2026/05/985471/images/72eb73edc72022b102fa48706d217bfac3c9f54215b09ca4f73f272940ff3ea0.jpg)
Front Panel Representation
Optionally, you can display a representation of the PTP 820G front panel by clicking either the arrow in the center or the arrow at the right of the bottom toolbar.
Figure 9 Displaying a Representation of the Front Panel

Figure 10 Main Web EMS Page with Representation of the Front Panel- PTP 820F

Figure 11 Main Web EMS Page with Representation of the Front Panel- PTP 820G
![Logat / Connection Admin Microvisual radio Unit Summary Link Parameters Description: IP-35C MHz/2kHz A GPE, 14 TBM, B####t# Serial up line: Minutes, #7 secuence Local data and time: 06-01-2009-09:28:53 Running version: 3.240.3.378 Unit Temperature: 39.0, 84% Voltage signal (VDD): 07 Part number: 24-0009-14 Total number: 200000.0075 Current Assets Time Count Description Other AlarmId 00:00:2000 22:11:51 ● Radio loss of frame Radio Set1, Port2 400 00:00:2000 22:11:52 ● 1561 BC performance is degraded due to loss of system clock reference 0 5340 00:00:2000 22:11:53 ● LAS operational clock is down RAG Group#1 139 00:00:2000 22:11:54 ● LAC operational clock is down RAG Group#2 139 00:00:2000 22:11:55 ● GEM-DM Radio Set1, Port2 1735 00:00:2000 22:11:56 ● Under-voltage RDC m 1752 00:00:2000 22:11:57 ● 1847D is not operational Radio Set1, Port2 5913 00:00:2000 22:11:58 ● XPU CONVERGICUT MULCE Radio Set1, Port2 1735 00:00:2000 22:11:59 ● RFU TX MUs Radio Set1, Port2 1735 00:00:2000 22:11:60 ● Dene mode is active Set 1 998 CDU Inventory Radio Location Type Port Number Serial Number Running software Version Radio Set1, Port1 Unknown - Radio Set1, Port2 Unknown - Page Refresh Interval (Seconds) [None] Last Loaded 14:23:00 Refresh Actual Report](/content/2026/05/985471/images/c8d89591db475f8246ea295c4714fe4ff4255c93dcdef182688028e2eb2b8f4a.jpg)
Related Pages Drop-Down List
Certain pages include a Related Pages drop-down list on the upper right of the main section of the page. You can navigate to a page related to the current page by selecting the page from this list.
Figure 12 Related Pages Drop-Down List

The Unit Summary Page
The Unit Summary page is the first page that appears when you log into the Web EMS. It gathers the unit parameters, current alarms, and unit inventory information on a single page for quick viewing.
Figure 13 Unit Summary Page
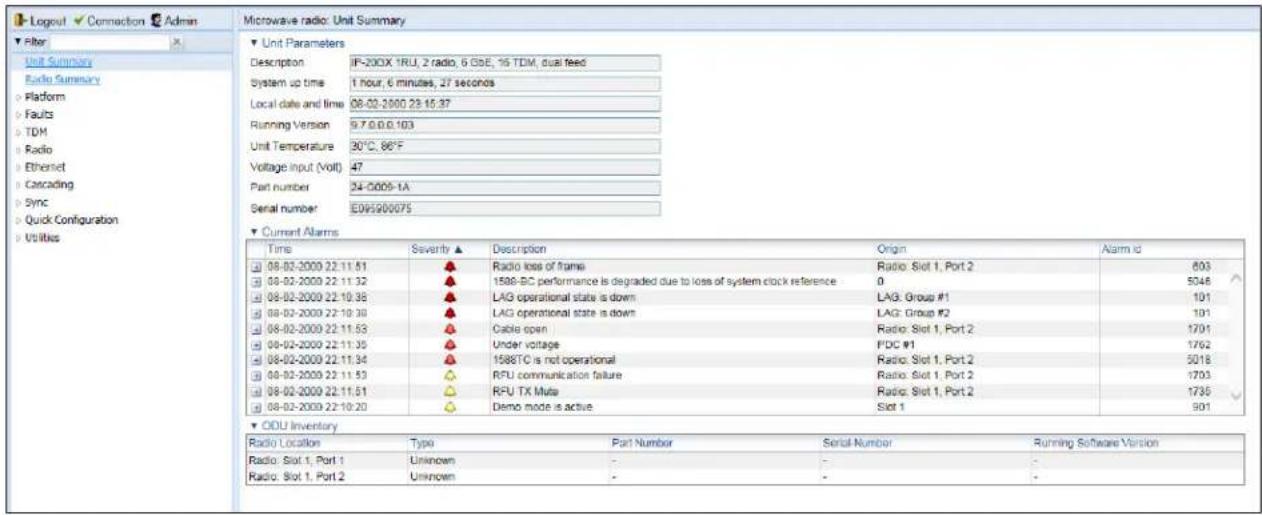
The Unit Summary page includes:
- Unit Parameters – Basic unit parameters such as the current software version, unit temperature, and voltage input level. For additional information, see Configuring Unit Parameters.
- Current Alarms – All alarms currently raised on the unit. For additional information, see Viewing Current Alarms.
- IDU Inventory – The hardware components of the IDU, including the part number and serial number of each component. For additional information, see Displaying Unit Inventory.
- ODU Inventory – The RFU used by each radio carrier, including the part number and serial number of each RFU and the software version running on each RFU. For additional information, see Configuring the Radio Parameters.
The Unit Summary page can be customized to include only specific columns and tables. This enables you to hide information you do not need in order to focus on the information that is most relevant.
To hide a specific section of the Unit Summary page, click the section title. To display a section that has been hidden, click the section title again.
To customize which columns appear in a section, click ▼ next to the section title. A list of columns is displayed. Select only the columns you want to display and click ▼ again.

Note
When one or more columns are hidden, the ▼ icon turns white (▽).
Figure 14 Unit Summary Page – Customizing collums

The Radio Summary Page
The Radio Summary page gathers the key link and radio parameters on a single page for quick viewing. To display the Radio Summary page, select Radio Summary from the Web EMS main menu.
Figure 15 Radio Summary Page

The Radio Summary age includes:
- Link Status – Link status per radio carrier, including whether or not the link is Up, groups to which the link is assigned (such as LAG, XPIC, protection, and/or Multi-Carrier ABC), and the IP address (both IPv4 and IPv6) of the remote carrier. For additional information, see Configuring the Radio Parameters.
- Radio Information – The TX and RX frequencies, frequency separation, and channel bandwidth on which the link is operating. For additional information, see Configuring the Radio Parameters.
- Remote Radio Parameters – Key information about the status of the remote carrier. For additional information, see Configuring the Remote Radio Parameters.
- Radio Transmitter – Mute status, maximum and operational TX level, modulation, and bit rate. For additional information, see Configuring the Radio Parameters.
- Radio Receiver – Receiver PMs and statistics, including defective blocks, modem MSE, and RX level, modulation, and bit rate. For additional information, see Configuring the Radio Parameters and Configuring the Radio (MRMC) Script(s).
The Radio Summary page can be customized to include only specific columns and tables. This enables you to hide information you do not need in order to focus on the information that is most relevant.
To hide a specific section of the Unit& Radio Summary page, click the section title. To display a section that has been hidden, click the section title again.
To customize which columns appear in a section, click ▼ next to the section title. A list of columns is displayed. Select only the columns you want to display and click ▼ again.

Note
When one or more columns are hidden, the ▼ icon turns white (▽).
Figure 16 Unit & Radio Summary Page – Customizing Columns
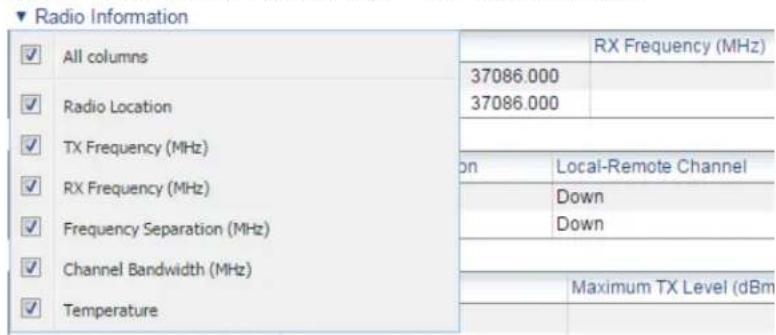
The Security Summary Page

Note
The Security Summary page is only available in System Release 11.1.
The Security Summary page gathers a number of important security-related parameters on a single page for quick viewing. To display the Security Summary page, select Security Summary from the Web EMS main menu.
Figure 17 Security Summary Page
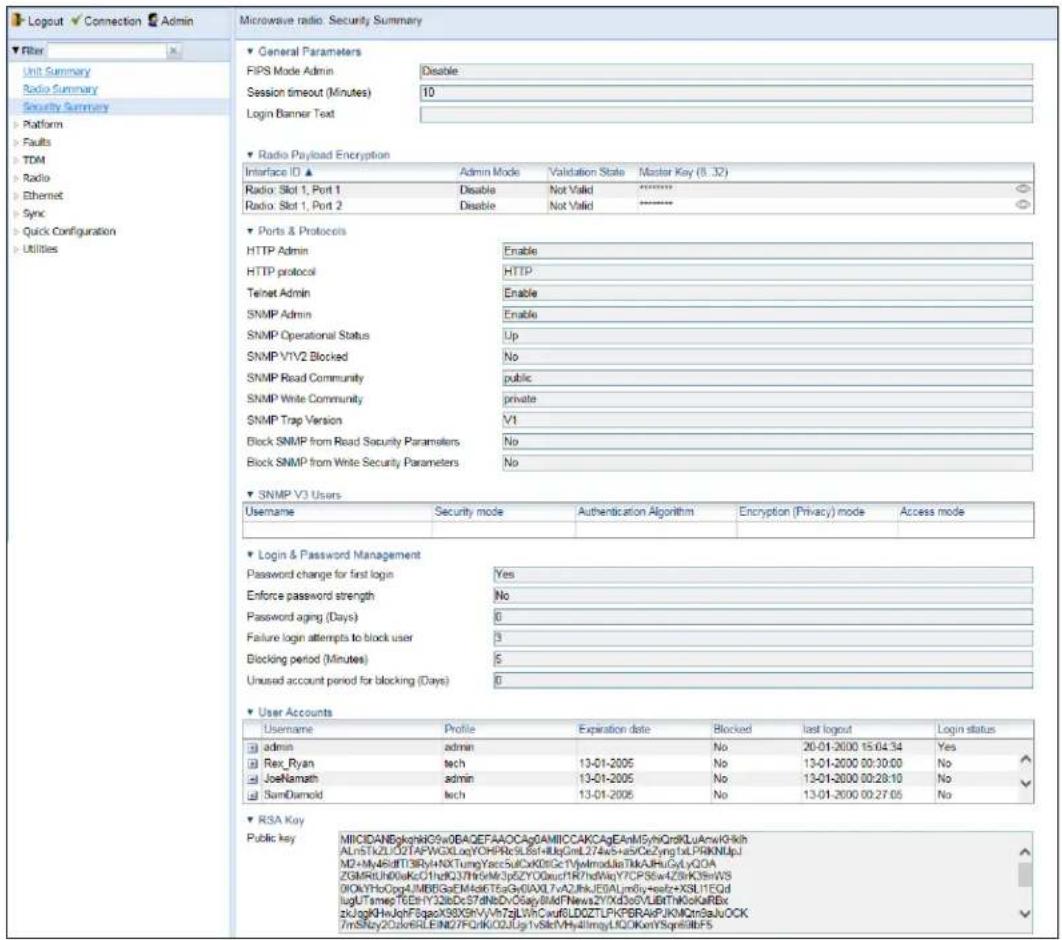
If FIPS mode is enabled, a yellow Warning icon may appear next to certain items. These items indicate fields for which the current security settings are not appropriate for FIPS mode. Hover over an item to display a tooltip explaining the warning.
Figure 18 Security Summary Page – FIPS Security Warnings
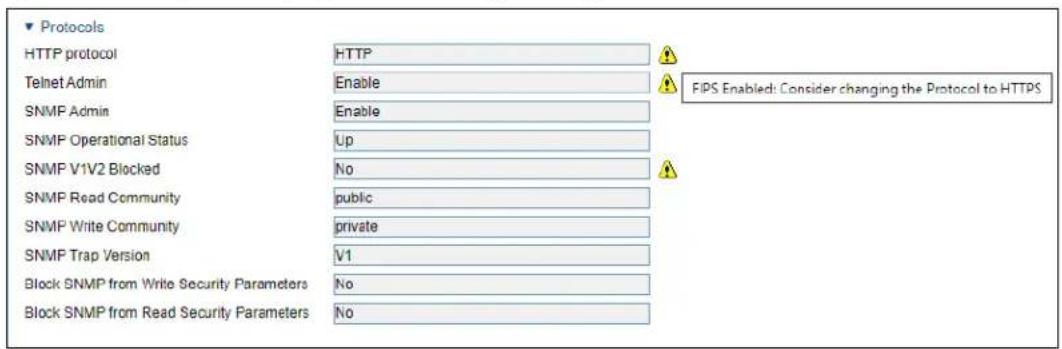
The Security Summary page includes:
- General Parameters – Includes the following fields:
- FIPS Mode Admin – See Operating in FIPS Mode.
- Session Timeout (Minutes) – See Configuring the Session Timeout.
○ Login Banner Text – See Defining a Login Banner.
- Radio Payload Encryption – For each radio interface, displays whether AES-256 payload encryption is enabled and its validation state.
For radio interfaces on which AES-256 payload encryption is enabled, you can display the master key by hovering the mouse over the icon to the right of the Master Key field.
▼ Radio Payload Encryption
| Interface ID | Admin Mode | Validation State | Master Key (8.32) ▲ |
| Radio: Slot 1, Port 1 | AES-256 | Not Valid | t_WS',*5*L@kS#,Y9',2&|ZQNL09|^qV9o |
| Radio: Slot 1, Port 2 | Disable | Not Valid | ***** |
For additional information, see Configuring AES-256 Payload Encryption.
- Ports & Protocols – Displays information about the current configuration of the following protocols used for communicating with the device:
- HTTP – See Configuring X.509 CSR Certificates and HTTPS.
- Telnet – See Blocking Telnet Access.
-
SNMP – See Configuring SNMP.
-
SNMP V3 Users – Displays a list of SNMP V3 users configured on the device. For additional information, see Configuring SNMP.
- Login & Password Management – Displays login and password security parameters configured on the device. See Configuring the General Access Control Parameters and Configuring the Password Security Parameters.
- User Accounts – Displays a list of users configured for the device and their parameters. See Configuring Users.
- RSA Key – Displays the public RSA key currently configured on the device. See Downloading and Installing an RSA Key.
The Security Summary page can be customized to include only specific columns and tables. This enables you to hide information you do not need in order to focus on the information that is most relevant.
To hide a specific section of the Radio Summary page, click the section title. To display a section that has been hidden, click the section title again.
To customize which columns appear in a section, click ▼ next to the section title. A list of columns is displayed. Select only the columns you want to display and click ▼ again.

Note
When one or more columns are hidden, the ▼ icon turns white (▽).
Figure 19 Security Summary Page – Customizing Columns

Reference Guide to Web EMS Menu Structure
The following table shows the Web EMS menu hierarchy, with links to the sections in this document that provide instructions for the relevant menu item.

Note
Some menu items are only available if the relevant activation key or feature is enabled.
Table 6 Web EMS Menu Hierarchy – Platform Menu
| Sub-Menus For Further Information | |
| Management > Unit Parameters | Configuring Unit Parameters. |
| Management > NTP Configuration | Configuring NTP |
| Management > Time Services | Setting the Time and Date (Optional) |
| Management > Interface Manager | Enabling the Interfaces (Interface Manager) |
| Management > Inventory | Displaying Unit Inventory |
| Management > Unit Info | Uploading Unit Info |
| Management > Reset | Performing a Hard (Cold) Reset |
| Management > Set to Factory Default | Setting the Unit to the Factory Default Configuration |
| Management > External Alarms > External Alarms Input | Configuring External Alarms |
| Management > External Alarms > External Alarms Output | Configuring External Alarms |
| Management > Networking > Local | Changing the Management IP AddressDefining the IP Protocol Version for Initiating Communications |
| Management > Networking > Remote | Configuring the Remote Unit's IP Address |
| Management > SNMP > SNMP Parameters | Configuration SNMP |
| Management > SNMP > Trap Managers | Configuring Trap Managers |
| Management > SNMP > V3 Users | Configuration SNMP |
| Software > Timer Parameters | Configuring a Timed Installation |
| Software > Versions | Viewing Current Software Versions |
| Software > Download & Install | Downloading and Installing Software |
| Configuration > Timer Parameters | Reserved for future use. |
| Configuration > Backup Files | Viewing Current Backup Files |
| Configuration > Configuration Management | Backing Up and Restoring Configurations |
| Activation Key > Activation Key Configuration | Configuring the Activation Key. |
| Activation Key > Activation Key Overview | Displaying a List of Activation-Key-Enabled Features |
| Security > General > Configuration | Operating in FIPS Mode |
| Security > General > Security Log Upload | Uploading the Security Log |
| Security > General > Configuration Log Upload | Uploading the Configuration Log |
| Security > X.509 Certificate > CSR | Configuring X.509 CSR Certificates and HTTPS |
| Security > X.509 Certificate > Download & Install | Configuring X.509 CSR Certificates and HTTPS |
| Security > Access Control > General | Configuring the General Access Control Parameters |
| Security > Access Control > User Profiles | Configuring User Profiles |
| Security > Access Control > User Accounts | Configuring Users Accounts |
| Security > Access Control > Password Management | Configuring the Password Security Parameters |
| Security > Access Control > Change Password | Changing Your Password |
| Security > Access Control > Radius > Radius Configuration | Activating RADIUS AuthenticationConfiguring the RADIUS Server Attributes |
| Security > Access Control > Radius > Radius Users | Viewing RADIUS User Permissions and Connectivity |
| Security > Protocols Control | Configuring the Session TimeoutBlocking Telnet Access |
| Security > RSA Key | Downloading and Installing an RSA Key |
| Security > Protocols Control | Configuring the Session TimeoutBlocking Telnet Access |
| PM & Statistics > Voltage | Configuring Voltage Alarm Thresholds, Masking Undervoltage Alarms, and Displaying Voltage PMs |
Table 7 Web EMS Menu Hierarchy – Faults Menu
| Sub-Menus | For Further Information |
| Current Alarms | Viewing Current Alarms |
| Alarm Statistics | Viewing Alarm Statistics |
| Event Log | Viewing and Saving the Event Log |
| Alarm Configuration | Editing Alarm Text and Severity |
| Voltage Alarm Configuration | Configuring Voltage Alarm Thresholds, Masking Undervoltage Alarms |
| External Alarms > External Alarms Input | Configuring External Alarms |
| External Alarms > External Alarms Output | Configuring External Alarms |
Table 8 Web EMS Menu Hierarchy – TDM Menu
| Sub-Menus For Further Information | |
| Native TDM Services | Configuring Native TDM Trails |
| TDM PseudoWire > Services | Configuring TDM Pseudowire Services |
| TDM PseudoWire > Advanced > Configuration | Configuring Pseudowire Card Parameters |
| TDM PseudoWire > Advanced > DS0 Bundles | Reserved for future use. |
| TDM PseudoWire > Advanced > Service OAM > Maintenance Domain | Configuring Pseudowire Maintenance Domains (MDs) |
| TDM PseudoWire > Advanced > Service OAM > Maintenance Association | Configuring Pseudowire Maintenance Associations (MAs) |
| TDM PseudoWire > Advanced > Service OAM > Loopback | Reserved for future use. |
| TDM PseudoWire > Advanced > Service OAM > Link Trace | Reserved for future use. |
| TDM PseudoWire > Advanced > PSN Tunnels > PSN Tunnels | Configuring Pseudowire Tunnels and Tunnel Groups |
| TDM PseudoWire > Advanced > PSN Tunnels > Tunnel Groups | Configuring Pseudowire Tunnels and Tunnel Groups |
| TDM PseudoWire > Advanced > Profiles | Configuring Pseudowire Profiles |
| TDM PseudoWire > Advanced > Services | Configuring Pseudowire TDM Services Manually |
| TDM PseudoWire > Advanced > PM > Service | Displaying Pseudowire Service PMs |
| TDM > Interfaces > E1/DS1 | Configuring the E1/DS1 Parameters (CLI). |
| TDM > Diagnostics > PDH Loopback | Performing Loopback on E1/DS1s |
| TDM > PM & Statistics > E1/DS1 | Displaying E1/DS1 PMs |
| TDM > PM & Statistics > Service | Displaying Native TDM Service PMs |
Table 9 Web EMS Menu Hierarchy – Radio Menu
| Sub-Menus For Further Information | |
| Radio Parameters | Configuring the Radio ParametersViewing the Radio Status and Settings |
| Radio Unit (PTP 820F only) | Configuring the IDU-RFU Connection (PTP 820F only) |
| Remote Radio Parameters | Configuring the Remote Radio Parameters |
| Radio BER Thresholds | Configuring BER Thresholds and Displaying current BER |
| ATPC | Configuring ATPC and OverrideTimerConfiguring ATPC |
| Payload Encryption (PTP 820G only) | Configuring AES-256 Payload Encryption |
| Ethernet Interface >Configuration | Configuring Frame Cut-ThroughConfiguring Header De-Duplication |
| Ethernet Interface >Counters | Viewing Header De-Duplication and Frame Cut-Through Counters |
| MRMC >Symmetrical Scripts >ETSI | Configuring the Radio (MRMC) Script(s) |
| MRMC >Symmetrical Scripts >FCC | Configuring the Radio (MRMC) Script(s) |
| MRMC >MRMC Status | Displaying MRMC Status |
| PM & Statistics >Counters | Displaying Defective Block Counters |
| PM & Statistics >Signal Level | Displaying Signal Level PMs and Configuring Signal Level PM Thresholds |
| PM & Statistics >Combined | Displaying PMs for the Combined IF Combining Signal |
| PM & Statistics >Aggregate | Displaying Modem BER (Aggregate) PMs |
| PM & Statistics >MSE | Displaying MSE PMs and Configuring MSE PM Thresholds |
| PM & Statistics > XPI | Displaying XPI PMs and configuring XPI PM Thresholds |
| PM & Statistics > MRMC | Displaying MRMC PMsDisplaying MRMC PMs and Configuring ACM Profile Thresholds |
| PM & Statistics > Traffic > Capacity/Throughput | Displaying Capacity and Throughput PMs |
| PM & Statistics > Traffic > Utilization | Displaying Utilization PMs and Configuring Utilization Thresholds |
| PM & Statistics > Traffic > Frame error rate | Displaying Frame Error Rate PMs |
| Diagnostics > Loopback | Performing Radio Loopback |
| Groups > Radio Protection (PTP 820G only) | Configuring HSB Radio Protection |
| Groups > XPIC | Configuring XPIC |
| Groups > Multi Carrier ABC | Configuring Multi-Carrier ABC |
Table 10 PTP 820G Web EMS Menu Hierarchy – Ethernet Menu
| Sub-Menus For Further Information | |
| General Configuration | Setting the MRU Size and the S-VLAN EthertypeMapping Ethernet Services to MSTP instances (MSTIs) |
| Services | Configuring Ethernet Services |
| Interfaces > Physical Interfaces | Configuring Ethernet Interfaces |
| Interfaces > Logical Interfaces | Configuring Ingress Path Classification on a Logical InterfaceAssigning Policers to InterfacesConfiguring the Ingress and Egress Byte CompensationAssigning WRED Profiles to QueuesAssigning a Queue Shaper Profile to a QueueAssigning a Service Bundle Shaper Profile to a Service BundleAssigning a Priority Profile to an InterfaceAssigning a WFQ Profile to an InterfacePerforming Ethernet Loopback |
| Interfaces > ASP & LLF | Configuring Automatic State Propagation and Link Loss Forwarding |
| Interfaces > Groups > LAG | Configuring Link Aggregation (LAG) and LACP. |
| PM & Statistics > RMON | RMON Statistics |
| PM & Statistics > Egress CoS Statistics | Egress CoS Statistics |
| PM & Statistics > Port TX | Port TX Statistics |
| PM & Statistics > Port RX | Port RX Statistics |
| QoS > Classification > 802.1Q | Modifying the C-VLAN 802.1Q UP and CFI Bit Classification Table |
| QoS > Classification > 802.1AD | Modifying the S-VLAN 802.1 UP and DEI Bit Classification Table |
| QoS > Classification > DSCP | Modifying the DSCP Classification Table |
| QoS > Classification > MPLS | Modifying the MPLS EXP Bit Classification Table |
| QoS > Policer > Policer Profile | Configuring Policer Profiles |
| QoS > Marking > 802.1Q | Modifying the 802.1Q Marking Table |
| QoS > Marking > 802.1AD | Modifying the 802.1AD Marking Table |
| QoS > WRED > WRED Profile | Configuring WRED |
| QoS > Shaper > Queue Profiles | Configuring Queue Shaper Profiles |
| QoS > Shaper > Service Bundle Profiles | Configuring Service Bundle Shaper Profiles |
| QoS > Scheduler > Priority Profiles | Configuring Priority Profiles |
| QoS > Scheduler > WFQ Profiles | Configuring WFQ Profiles |
| Protocols > G.8032 > General Attribute | Configuring the Destination MAC Address |
| Protocols > G.8032 > ERPI Attribute | Adding ERPIs through Viewing ERPI Statistics |
| Protocols > MSTP > Bridge > General Attributes | Enabling MSTP and Configuring the MSTP Bridge General Attributes |
| Protocols > MSTP > Bridge > Configuration ID | Viewing and Configuring the MSTP Bridge Configuration ID |
| Protocols > MSTP > Bridge > Spanning Tree | Viewing and Configuring the MSTP Bridge Spanning Tree |
| Protocols > MSTP > Bridge > CIST | Viewing and Configuring the MSTP Bridge CIST Parameters |
| Protocols > MSTP > Bridge > MSTI | Viewing and Configuring the MSTP Bridge MSTI Parameters |
| Protocols > MSTP > Bridge > VLAN | Viewing the MSTP VLAN Parameters |
| Protocols > MSTP > Port > Spanning Tree | Viewing and Configuring the MSTP Port Spanning Tree |
| Protocols > MSTP > Port > CIST | Viewing and Configuring the MSTP Port CIST Parameters |
| Protocols > MSTP > Port > MSTI | Viewing and Configuring the MSTP Port MSTI Parameters |
| Protocols > MSTP > Port > BPDU Counters | Viewing and Resetting the BPDU Counters |
| Protocols > LLDP > Remote Management | Displaying Peer Status |
| Protocols > LLDP > Advanced > Configuration > Parameters | Configuring the General LLDP Parameters |
| Protocols > LLDP > Advanced > Configuration > Port Configuration | Configuring the LLDP Port Parameters |
| Protocols > LLDP > Advanced > Configuration > Destination Address | Displaying the Unit's Management Parameters |
| Protocols > LLDP > Advanced > Configuration > Management TLV | Displaying the Unit's Management Parameters |
| Protocols > LLDP > Advanced > Remote System > Management | Displaying Peer Unit's Management Parameters |
| Protocols > LLDP > Advanced > Remote System > Remote Table | Displaying Peer Unit's Management Parameters |
| Protocols > LLDP > Advanced > Local System > Parameters | Displaying the Local Unit's Parameters |
| Protocols > LLDP > Advanced > Local System > Port | Displaying the Local Unit's Parameters |
| Protocols > LLDP > Advanced > Local System > Management | Displaying the Local Unit's Parameters |
| Protocols > LLDP > Advanced > Statistic > General | Displaying LLDP Statistics |
| Protocols > LLDP > Advanced > Statistic > Port TX | Displaying LLDP Statistics |
| Protocols > LLDP > Advanced > Statistic > Port RX | Displaying LLDP Statistics |
| Protocols > SOAM > MD | Configuring Service OAM (SOAM) Fault Management (FM) |
| Protocols > SOAM > MA/MEG | Configuring Service OAM (SOAM) Fault Management (FM) |
| Protocols > SOAM > MEP | Configuring Service OAM (SOAM) Fault Management (FM) |
| Protocols > LACP > Aggregation | Displaying LACP Aggregation Status Parameters |
| Protocols > LACP > Port > Status | Displaying LACP Port Status Parameters |
| Protocols > LACP > Port > Statistics | Displaying LACP Port Statistics |
| Protocols > LACP > Port > Debug | Displaying LACP Port Debug Statistics |
Table 11 PTP 820G Web EMS Menu Hierarchy – Cascading Menu
| Sub-Menus For Further Information | |
| Interfaces | Configuring Cascading Interfaces (Optional) |
Table 12 PTP 820G Web EMS Menu Hierarchy – Sync Menu
| Sub-Menus | For Further Information |
| Sync Source | Configuring the Sync Source |
| Outgoing Clock | Configuring the Outgoing Clock and SSM Messages |
| 1588 > General Configuration | Configuring 1588 Transparent ClockConfiguring 1588 Boundary Clock |
| 1588 > Transparent Clock | Configuring 1588 Transparent Clock |
| 1588 > Boundary Clock > Clock Parameters > Default | Configuring 1588 Boundary Clock |
| 1588 > Boundary Clock > Clock Parameters > Advanced | Configuring 1588 Boundary Clock |
| 1588 > Boundary Clock > Port Parameters | Configuring 1588 Boundary Clock |
| 1588 > Boundary Clock > Port Statistics | Configuring 1588 Boundary Clock |
Table 13 Web EMS Menu Hierarchy – Quick Configuration Menu
| Sub-Menus For Further Information | |
| PIPE > Single Carrier > 1+0 | Configuring a 1+0 Link Using the Quick Configuration Wizard |
Sub-Menus For Further Information
| PIPE > Single Carrier > 1+0 (Repeater) | Configuring a 1+0 (Repeater) Link Using the Quick Configuration Wizard |
| PIPE > Single Carrier > 1+1 (HSB) | Configuring a 1+1 HSB Link Using the Quick Configuration Wizard |
| PIPE > Multi Carrier ABC > 1+1 (HSB-SD) | Configuring a 1+1 HSB-SD Link Using the Quick Configuration Wizard |
| PIPE > Multi Carrier ABC > N+0 | Configuring an N+0 Multi-Carrier ABC Link Using the Quick Configuration Wizard |
Table 14 Web EMS Menu Hierarchy – Utilities Menu
Sub-Menus For Further Information
| Restart HTTP | Restarting the HTTP Server |
| ifIndex Calculator | Calculating an ifIndex |
| MIB Reference Guide | Displaying, Searching, and Saving a list of MIB Entities |
Chapter 2: Getting Started
This section includes:
• Assigning IP Addresses in the Network
• Establishing a Connection
- Logging On
- Changing Your Password
• Performing Quick Platform Setup
- Configuring In-Band Management
• Changing the Management IP Address
- Configuring Unit Redundancy for the PTP 820G
• Determining ETSI or ANSI (FCC) TDM Mode
- Configuring the Activation Key
• Setting the Time and Date (Optional)
• Enabling the Interfaces (Interface Manager)
- Configuring Cascading Interfaces (Optional)
- Configuring the Radio Parameters
- Configuring the Radio (MRMC) Script(s)
• Enabling ACM with Adaptive Transmit Power
- Operating in FIPS Mode
- Configuring Grouping (Optional)
- Creating Service(s) for Traffic
Assigning IP Addresses in the Network
Before connection over the radio hop is established, it is of high importance that you assign each network element a dedicated IP address, according to an IP plan for the total network. See Changing the Management IP Address.
By default all elements have the same IP settings:
• IP address: 192.168.1.1
- Subnet mask: 255.255.255.0

Caution
If the connection over the link is established with identical IP addresses, an IP address conflict will occur and remote connection to the element on the other side of the link may be lost.
Establishing a Connection
You can connect to the PTP 820G or PTP 820F unit via a serial or a LAN connection.
Connecting to the Unit with a Serial Connection
1 Connect a serial RS-232 cable with an RJ-45 interface from the laptop or PC you are using to configure the unit, to the Terminal Interface on the front panel.
Figure 20 Terminal Interface on Front Panel – PTP 820F
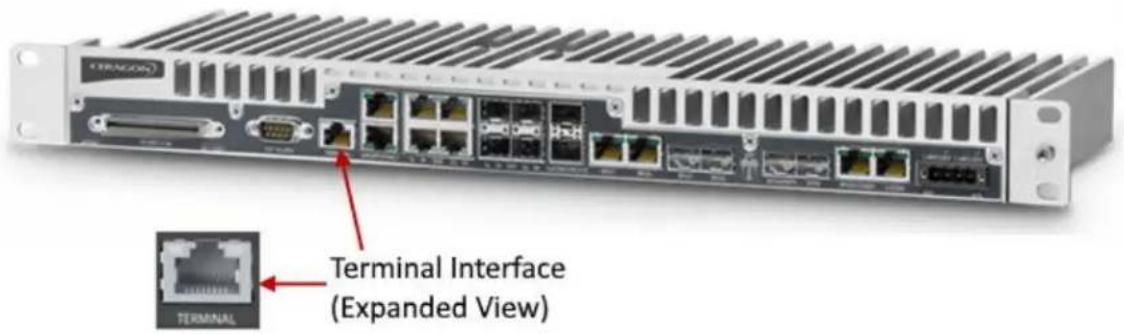
Figure 21 Terminal Interface on Front Panel – PTP 820G
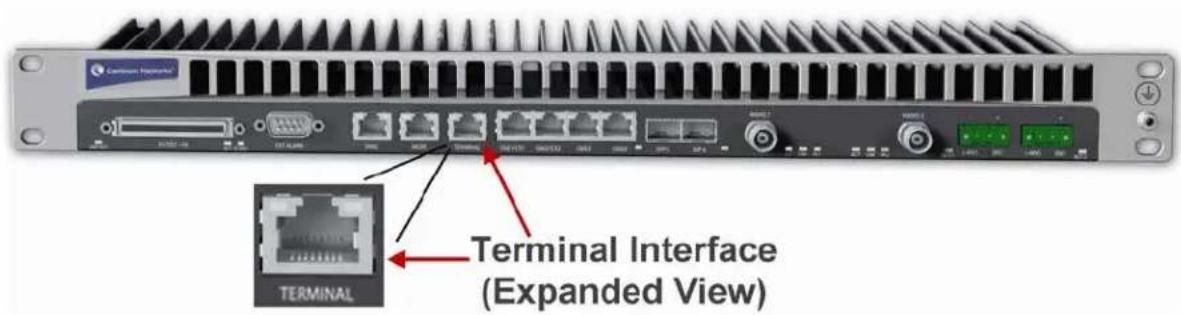
2 Configure the following settings for the COM port you are using on your PC or laptop:
- Bits per Second – 115,200
○ Data Bits - 8
○ Parity – None - Stop Bits - 1
○ Flow Control - None
Connecting to the Unit with a LAN Connection
PTP 820G and PTP 820F contain two FE management interfaces, which connect to a single RJ-45 physical connector on the front panel (MGMT). For details on which type of cable to use to utilize either one or both management interfaces, see Ethernet Management Interfaces.
Connect the cable to the Management interface (MGMT) on the PTP 820G or PTP 820F front panel, and to the LAN port on the PC.
Figure 22 Management Interface on Front Panel PTP 820F

Figure 23 Management Interface on Front Panel PTP 820G
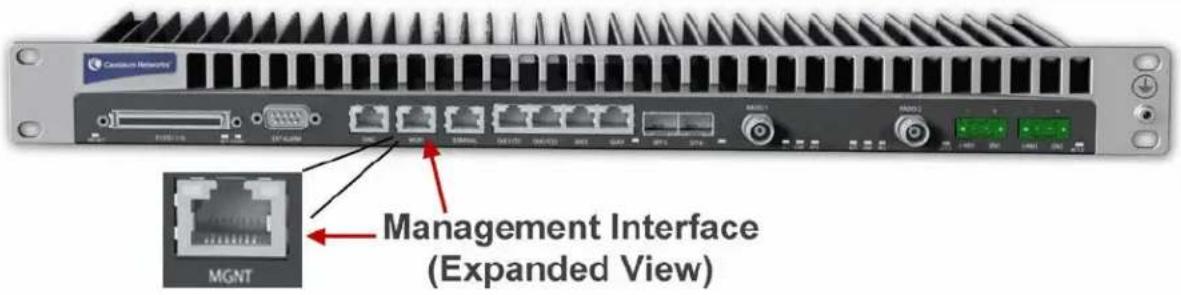
To establish a connection with the PTP 820G or PTP 820F unit, it is necessary to configure an IP address on the PC or laptop within the same subnet as the PTP 820G or PTP 820F unit. The default chassis IP address is 192.168.1.1. For example, you can set the PC or laptop address to 192.168.1.10 and the subnet mask to 255.255.255.0. Note the initial settings before changing.

Note
The chassis IP address, as well as password, should be changed before operating the system. See Changing the Management IP Address and Changing Your Password.
1 Select Control Panel > All Control Panel Items > Network and Sharing Center.
2 Click Change adapter settings.
3 Select Local Area Connection > Properties> Internet Protocol Version 4 (TCP/IP) and set the following parameters:
- IP address: 192.168.1.10
○ Subnet mask 255.255.255.0
o No default gateway
4 Click OK to apply the settings.
Logging On
1 Open an Internet browser (Internet Explorer, Mozilla Firefox, or Google Chrome).
2 Enter the default IP address "192.168.1.1" in the Address Bar. The Login page opens.
Figure 24 Login Page

3 Enter the following values:
- User Name: admin
- Password: admin
4 Click Apply.
Changing Your Password
It is recommended to change the default Admin password as soon as you have logged into the system.
In addition to the Admin password, there is an additional password protected user account, "root user", which is configured in the system. The root user password and instructions for changing this password are available from Cambium Networks Customer Support. It is strongly recommended to change this password.
To change your password:
- Select Platform > Security > Access Control > Change Password. The Change User Password page opens.
Figure 25 Change User Password Page

- In the Old password field, enter the current password. For example, upon initial login, enter the default password (admin).
-
In the New password field, enter a new password. If Enforce Password Strength is activated (see Configuring the Password Security Parameters), the password must meet the following criteria:
-
Password length must be at least eight characters.
- Password must include characters of at least three of the following character types: lower case letters, upper case letters, digits, and special characters. For purposes of meeting this requirement, upper case letters at the beginning of the password and digits at the end of the password are not counted.
- The last five passwords you used cannot be reused
- Click Apply.
Applying a Pre-Defined Configuration File
PTP 820 units can be configured from the Web EMS in a single step by applying a pre-defined configuration file. A pre-defined configuration file can be prepared for multiple PTP 820 units, with the relevant configuration details specified and differentiated per-unit.
Pre-defined configuration files can include all the parameters necessary to configure basic links, including:
- Platform parameters:
- ETSI to ANSI conversion
o General unit parameters, such as unit name, location, and contact person
○ Activation Key (or Demo mode) configuration - IP configuration (IPv4 and IPv6)
- NTP configuration
- Basic SNMP Parameters (Enable/Disable, Read and Write Communities)
- Time services configuration
- Interface configuration:
○ Radio
o Ethernet
○ LAG
- Radio protection
o Multi-Carrier ABC groups
• Advanced radio configuration
○ XPIC
• Services configuration
- Management
- Point-to-Point
o Multipoint
The pre-defined configuration file is generated by Cambium Global Services and provided as a service.
The pre-defined configuration file must be compatible with the System Release version the PTP 820 device is running. Configuration files created for System Release 9.2 cannot be used with System Release 9.2.6 or higher. Configuration files must also be compatible with the type of PTP 820 device. For example, a configuration file created for PTP 820C cannot be applied to an PTP 820G device.
For PTP 820F, if you need to change the IDU-RFU connection settings from the default settings of RJ-45 with PoE, you must do so manually after applying the pre-defined configuration file. See Configuring the IDU-RFU Connection (PTP 820F only).
For further information on the creation of pre-defined configurations, consult your Cambium representative.
To apply a pre-defined configuration file:
1 Select Quick Configuration > From File. The Quick Configuration – From File page appears.
Figure 26 Change User Password Page

2 Click Browse, and select the configuration file for your unit.
Figure 27 Quick Configuration – From File Page – Configuration File Loaded

3 In the Device List field, select the PTP 820 unit you are configuring.

Note
Although the configuration file may contain parameters for multiple types of devices, only devices of the same product type as the unit you are configuring are displayed in this field.
4 Optionally, click View file to display the configuration file (read-only).
5 To initiate the configuration, click Submit. Progress is updated in the Quick Configuration – From File page.
After the configuration is complete, the unit reboots.
If the configuration file includes changing from ETSI to ANSI mode, the unit reboots at that point in the configuration. After the reboot, you must return to the Quick Configuration – From File page and re-initiate the configuration.

Note
If the pre-defined configuration file included a new IP address for the unit, make sure to configure an IP address on the PC or laptop you are using to perform the configuration within the same subnet as the PTP 820 unit's new IP address.
Performing Quick Platform Setup
The Platform Setup page in the Web EMS centralizes the main configurable items from several Web EMS pages in a single location:
• Unit Parameters (Name, Contact Person, Location, Longitude, and Latitude)
• IPv4 Address, Subnet Mask, and Default Gateway
- NTP Enable/Disable
• Demo Activation Key Enable/Disable
- SNMP Parameters
These items enable you to configure the basic platform parameters quickly, in a single Web EMS page. Combined with the quick link configuration wizards, this enables you to configure a new link in the field quickly and efficiently, to the point where the link is up and functioning and any necessary advanced configurations can be performed remotely without the need to physically access the PTP 820 unit.
To use the Platform Setup page:
- Select Quick Configuration > Platform Setup. The Quick Configuration – Platform Setup page opens.
Figure 28 Quick Configuration – Platform Setup Page

- The Unit Parameters section is optional. For details on each field, see Configuring Unit Parameters.
- In the IPv4 Address section, configure the unit's management IP address, subnet mask, and, optionally, a default gateway. If you want to use an IPv6 address, see Changing the Management IP Address.
- In the Date & Time section, you can enable Network Time Protocol (NTP). NTP distributes Coordinated Universal Time (UTC) throughout the system, using a jitter buffer to neutralize the effects of variable latency.
If you select Enable, the NTP version and NTP server IP address fields are also displayed, enabling you to configure the NTP parameters. For details on these fields, Configuring NTP.

Note
You can configure additional NTP servers, up to four, in the NTP Configuration page. See Configuring NTP.

- In the Activation Key section, you can enable or disable Demo mode in the Demo admin field. Demo mode enables all features for 60 days. When demo mode expires, the most recent valid activation key goes into effect. The 60-day period is only counted when the system is powered up. 10 days before demo mode expires, an alarm is raised indicating that demo mode is about to expire.
If you set Demo admin to Disable, the Activation Key field is displayed. Enter a valid activation key in this field. For a full explanation of activation keys, see Configuring the Activation Key.

- In the SNMP Parameters section, you can set whether to enable or disable SNMP monitoring in the Admin field, and set the SNMP Read Community and SNMP Write Community. For a full explanation of SNMP parameters, see Configuring SNMP (CLI).

- Click Finish. The Selection Summary page opens. To go back and change any of the parameters, click Back. To implement the new parameters, click Submit.
Figure 29 Quick Configuration – Platform Setup Summary Page

Configuring In-Band Management
You can configure in-band management in order to manage the unit remotely via its radio and/or Ethernet interfaces.

Note
Before configuring in-band management, it is recommended to review the configuration recommendations for in-band management listed in Configuration Tips.
Each PTP 820G or PTP 820F unit includes a pre-defined management service with Service ID 1025. The management service is a multipoint service that connects the two local management ports and the network element host CPU in a single service. In order to enable in-band management, you must add at least one service point to the management service, in the direction of the remote site or sites from which you want to access the unit for management. For instructions on adding service points, see Configuring Service Points.

Note
In order to use in-band management, it must be supported on the external switch.
Changing the Management IP Address
Related Topics:
• Defining the IP Protocol Version for Initiating Communications
- Configuring the Remote Unit's IP Address
To change the management IP address of the local unit:
1 Select Platform > Management > Networking > Local. The Local Networking Configuration page opens.
Figure 30 Local Networking Configuration Page

2 Optionally, in the Name field, enter a name for the unit.
3 Optionally, in the Description field, enter descriptive information about the unit.
4 In the IPv4 address field, enter an IP address for the unit. You can enter the address in IPv4 format in this field, and/or in IPv6 format in the IPv6 Address field. The unit will receive communications whether they are sent to its IPv4 address or its IPv6 address.
5 If you enter an IPv4 address In the IPv4 Subnet mask field, enter the subnet mask.
6 Optionally, in the IPv4 Default gateway field, enter the default gateway address.
7 Optionally, in the IPv6 Address field, enter an IPv6 address for the unit. You can enter the address in IPv6 format in this field, and/or in IPv4 format in the IPv4 IP Address field. The unit will receive communications whether they are sent to its IPv4 address or its IPv6 address.
8 If you entered an IPv6 address, enter the IPv6 prefix length in the IPv6 Prefix-Length field.
9 Optionally, if you entered an IPv6 address, enter the default gateway in IPv6 format in the IPv6Default Gateway field.
10 Click Apply.
Configuring Unit Redundancy for the PTP 820G
This section explains how to configure unit redundancy for the PTP 820G, and includes the following topics:
• Unit Redundancy Overview
- Configuring Unit Redundancy
• Cabling Requirements for Unit Redundancy
- Configuring Ethernet Interface Protection
• Enabling Unit Redundancy
• Changing the Configuration after Enabling Unit Redundancy
• Viewing the Configuration of the Standby Unit
• Viewing Link and Protection Status and Activity
- Switchover
- Performing Lockout
• Disabling Unit Redundancy
Unit Redundancy Overview

Note
The following protocols cannot be used with unit redundancy:
G.8032
- MSTP
- LLDP
• Service OAM (SOAM)
Unit redundancy utilizes two PTP 820G units, with a single antenna, to provide hardware protection for the PTP 820G IDU and RFU, including protection for Ethernet, radio, and TDM interfaces. One PTP 820G operates in active mode and the other operates in standby mode. If a protection switchover occurs, the roles are switched. The standby unit is managed by the active unit. The standby unit's transmitter is muted, but the standby unit's receiver is kept on in order to monitor the link. However, the received signal is terminated at the switch level.
There are three modes for Ethernet interface protection with PTP 820G unit redundancy:
- Line Protection Mode – Traffic is routed to the Ethernet interfaces via two interfaces on an external switch. LACP protocol is used to determine which PTP 820G port is active and which port is standby, and traffic is only forwarded to the active port. Line Protection mode can be used with optical and electrical Ethernet interfaces.

Note
- The external switch must support LACP. PTP 820G supports LACP for purposes of line protection only. PTP 820G supports a special LACP implementation for purposes of line protection only. This LACP implementation is configured on the logical interface level, as described in Configuring Ethernet Interface Protection. Regular LACP is configured as part of the LAG configuration, and is not supported with unit redundancy. See Configuring Link Aggregation (LAG).
- Optical Splitter Mode – An optical splitter cable is used to connect both the active and the standby Ethernet ports. Optical Splitter mode can be used with optical Ethernet interfaces only.
- Electrical Splitter Mode – A Y-cable is used to connect to both the active and the standby Ethernet ports. With Electrical Splitter mode, interface protection is only supported for speeds up to 100 Mbps (Fast Ethernet). Electrical Splitter Mode can be used with electrical Ethernet interfaces only.

Note
When using the Y-cable with Electrical Splitter mode and Auto Negotiation enabled, there is a traffic disruption of approximately two seconds upon switchover for Ethernet traffic passing through this cable.
PTP 820G unit redundancy can be used with the following radio configurations:
- 2 x 1+0 – PTP 820G unit with a 1+0 configuration protecting another PTP 820G unit with a 1+0 configuration.
- 2 x 2+0 – PTP 820G unit with a 2+0 configuration protecting another PTP 820G unit with a 2+0 configuration.
To configure 2 x 2+0 protection, simply configure the two radios according to your network requirements, then configure unit redundancy according to the instructions in this section.
To configure unit redundancy, you must perform the following steps:
- Verify that the proper cables for unit redundancy are connected to the units. See Cabling Requirements for Unit Redundancy.
- Configure Ethernet interface protection. See Configuring Ethernet Interface Protection.
- Enable unit redundancy. See Enabling Unit.
The Unit ACT LED on each unit indicates whether the unit is Active (Green) or Standby (Orange). See Unit/ACT LED.
Configuring Unit Redundancy
Before configuring unit redundancy, verify that both units have the same hardware part number (see Displaying Unit Inventory) and the same software version (see Viewing Current Software Versions). If the units do not have the same software version, upgrade each unit to the most recent software release.

Note
For FIPS configurations, the external protection link must be encrypted using IPsec. This encrypts all IP packets that pass between the management ports of the two PTP 820G units. For instructions, see Encrypting the External Protection Link.
To configure unit redundancy, you must perform the following steps:
o Verify that the PC or laptop being used to configure the devices is directly connected to the management port of the unit that will be the active unit.
o Configure the unit that will be the active unit so that it will have a working radio link by performing all necessary radio configurations, such as configuring the MRMC scripts, setting the frequency, unmuting the radio, and setting up radio groups such as XPIC or Multi-Carrier ABC (Multi-Radio).
○ Perform all necessary Ethernet and TDM configurations on the unit that will be the active unit, such as defining Ethernet and TDM services.
o Resolve any alarms in the unit that will be the active unit, so that there are no active alarms raised.
o Configure Ethernet interface protection on the unit that will be the active unit. See Configuring Ethernet Interface Protection. Power up the unit that will be the standby unit.
- Connect the management PC or laptop to the management port of the standby unit.
○ Enable unit redundancy on the unit that will be the standby unit. See Enabling Unit Redundancy.
- Connect the PC or laptop again to the management port of the unit that will be the active unit.
○ Enable unit redundancy on the unit that will be the active unit. See Enabling Unit Redundancy.
o Verify that the proper cables for unit redundancy are connected to the units. See Cabling Requirements for Unit Redundancy. Note that the first unit you configured should automatically be assigned by the system to be the active unit because it will have no alarms. In contrast, the second unit will have at least one alarm since you have not yet changed its settings from the default settings.
On the active unit, verify that the connection to the standby unit is up. To do this, go to the Unit Redundancy page and verify that:
- The Protection Operation State is Up.
- The Protection Link to Mate Status is Connected.
- Go to the Unit Redundancy page in the active unit, and click Copy to Mate to copy the configuration of the active unit to the standby unit. Confirm the action in the confirmation window that appears.
Once the standby unit comes back online, perform final checks to verify that unit redundancy has been configured properly:
- Check the port status on the standby unit.
- Check the radio link status on the standby unit.
o Verify that there is no Configuration Mismatch alarm. See Changing the Configuration after Enabling Unit Redundancy.
o Verify that no other alarms are raised on either unit.
Cabling Requirements for Unit Redundancy
Cabling for Ethernet Interfaces
For Ethernet Splitter Mode, the following Y-cable must be connected to the relevant interfaces on the active and standby units:
Table 15 Y-Cable for Electrical Splitter Mode FE Traffic Interface Protection
| Part Number Description | |
| C000082L153A | PTP 820G Fast Ethernet Protection Y-cable, 1.34m, Cat5E |
No special cabling is required for other Ethernet protection modes.
Cabling for E1/DS1 Interfaces
If the E1/DS1 interfaces are being used, a Y-cable is used to connect the active and standby E1/DS1 interfaces. The following table shows the Part Number and Marketing Model of the Y-cable required for E1/DS1 protection.
Table 16 Y-Cable for E1/DS1 Protection
| Part Number Description | |
| C000082L154A | PTP 820G TDM Protecftion Y cable, 0.6m,120 ohm |
Cabling for T3 Synchronization
If T3 synchronization input is being used, a Y cable is used to connect to the active and standby Sync interfaces.
Inter-IDU Protection Connectivity and Management
PTP 820G units in a redundancy configuration must have their CPUs interconnected in order to synchronize their protection status. The same IP address is used for both PTP 820G units, to ensure that management is not lost in the event of switchover. A special cable is required to enable this connectivity.
Table 17 Splitter Cable for Protection and Management
| Part Number Description | |
| C000082L155A | PTP820G Splitter cable for protection and management, 1.34m,CAT5E |
The protection and management splitter cable must be connected to the management interfaces of the two PTP 820G units using the RJ-45 plug-ends. The third end of the protection splitter cable (RJ-45 socket) is connected to an external management station.
Figure 31 PTP 820G with Unit Redundancy – Protection and Management Splitter Connection

The local management connection uses PTP 820G management interface 1. The LED on the upper left of the MGMT port is Green when the interface is enabled and the link is operational. See Ethernet Management Interface LEDs.
The inter-unit protection connection uses PTP 820G management interface 2. The LED on the upper right of the MGMT port is Green when the interface is enabled and the link between the IDUs is operational. See Ethernet Management Interface LEDs.
Configuring Ethernet Interface Protection
No special software configuration is required for Optical Splitter and Electrical Splitter modes.
For Line Protection mode, you must perform the following steps:
- Configure the GbE ports on the external switch in LACP mode. The external switch must support LACP.
- Connect a GbE port on the external switch to a GbE port on each of the PTP 820G units.
- Enable LACP on the GbE ports on the PTP 820G that are connected to the external switch:
i. Select Ethernet > Interfaces > Logical Interfaces. The Logical Interfaces page opens (Figure 214).
ii. Select the interface and click Edit. The Logical Interfaces – Edit page opens.
Figure 32 Logical Interfaces – Edit Page

iii. In the Interface Mode field, select LACP.
iv. Click Apply, then Close.
v. Reset the unit. See Performing a Hard (Cold) Reset (CLI).

Note
Because a unit reset is required when changing the Interface Mode to or from LACP, it is recommended to perform copy-to-mate immediately after changing the Interface Mode to or from LACP, then to reset the active unit only after the standby unit is back up after the copy-to-mate operation.
Enabling Unit Redundancy
To enable unit redundancy:
- Select Platform > Management > Unit Redundancy. The Unit Redundancy page opens.
Figure 33 Unit Redundancy Page
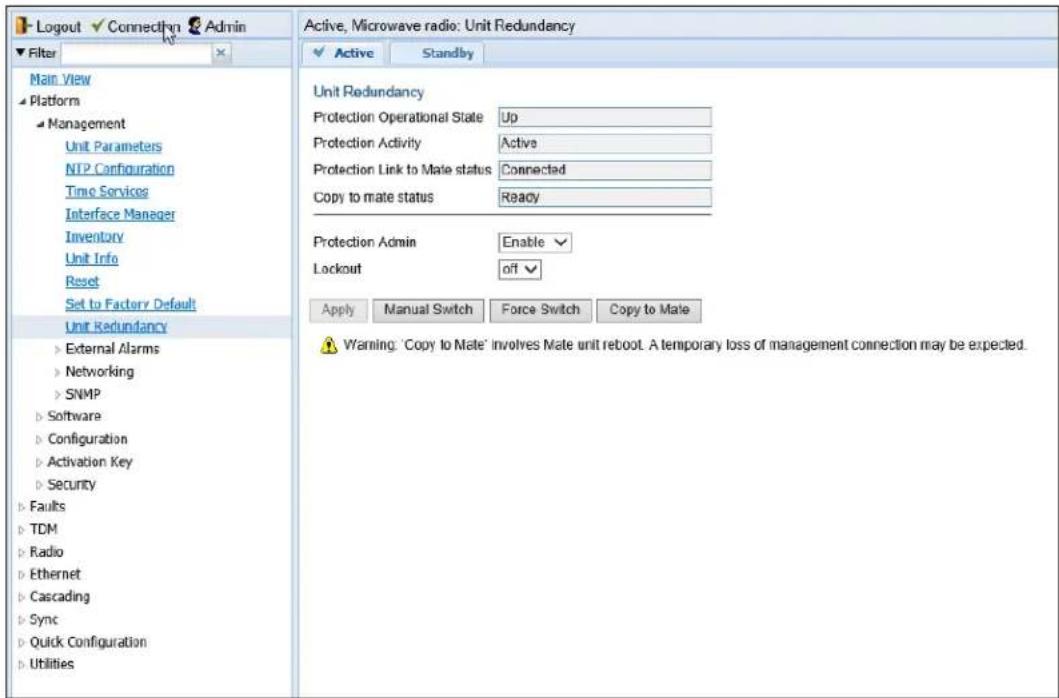
-
In the Protection Admin field, select Enable.
-
Click Apply.
The system configures itself for unit redundancy:
- The system determines which unit is the Active unit based on a number of pre-defined criteria. To see which unit is the active unit, look at the traffic interface LEDs; only the interfaces on the active unit should be indicated by their LEDs as active and functioning.
- When the system returns online, all management must be performed via the Active unit using the IP address you defined for that unit.
- The IP address you defined for the unit which is now the Standby unit is no longer valid, and the management port of the Standby unit becomes non-operational. Note, however, that if switchover takes place before you perform copy-to-mate (Step 5-v), the original IP of the Standby unit, now the Active unit, becomes the working IP for management of both units.
- Management of the Standby unit is performed via the Active unit, via the protection cable. Protection communications are transmitted via Management port 2 in each unit, which is no longer usable or configurable as a management port.

Note
An PTP 820G unit on which (i) unit redundancy is enabled, (ii) there is no radio link, and (iii) no mate unit is connected, will automatically be selected as a standby unit when booting up. As a result, management to the unit will be lost.
In additional, almost every Web EMS page will now include two tabs on top of the main section of the page.
• Active – Enables you to configure the Active unit.
- Standby – In most cases, this tab is read-only and enables you to display Standby unit parameters. Even when a switchover occurs, the unit displayed in the Web EMS is always the currently Active unit.
Changing the Configuration after Enabling Unit Redundancy
To keep the Standby unit up-to-date, after any change to the configuration of the Active unit click Copy to Mate to copy the configuration to the Standby unit.
If you change the configuration of the Active unit but do not perform Copy to Mate, a Configuration Mismatch alarm appears in the Faults > Current Alarms page.

Note
You can use the following CLI command to display a list of mismatched parameters:
root> platform management protection show mismatch details
The following items must be configured separately for the Standby unit, and are not copied via copy-to-mate:
- Setting the Unit Name – See Configuring Unit Parameters.
- Disabling/enabling Radio TX mute –See Configuring the Radio Parameters.
- Clearing the Radio and RMON counters – See Configuring and Viewing Radio PMs and Statistics and Viewing Ethernet PMs and Statistics.
- Configuring the activation key—See Configuring the Activation Key.
When configuring MRMC scripts after enabling unit redundancy, it should be done in the following order. It is important to use this order because if the changes are not performed in the correct order, the connection to the remote units will be lost:
- Change the MRMC script on the standby unit of the remote pair.
- Change the MRMC script on the active unit of the remote pair. This will cause the local-remote link to be lost.
- Change the MRMC script on the active unit of the local pair. When the unit reboots, the local-remote link will be restored.
- Perform copy-to-mate on the active unit of the local pair.
Viewing the Configuration of the Standby Unit
You can view the settings of the standby unit any time. To view the settings of the standby unit, click the Standby tab of the desired page. The following is an example of the Standby tab of the Unit Redundancy page after Protection Admin has been enabled.
Figure 34 Standby Tab of Unit Redundancy Page

Viewing Link and Protection Status and Activity
You can view link and protection status and activity any time.
To view link and protection status and activity:
1 Select Platform > Management > Unit Redundancy. The Unit Redundancy page opens (Figure 32).
The following information is displayed:
- Protection Operational State – Indicates whether unit redundancy is functional. Radio protection is not functional if the management connection to the mate is down.
- Protection Activity – The activity state of the device: Active or Standby.
- Protection Link to Mate – Indicates whether the two units (the Active and the Standby) are physically connected.
- Copy to mate status – Indicates the status of the last copy-to-mate operation
- Protection Admin – Indicates whether unit redundancy is enabled or disabled.
- Lockout – Indicates whether lockout is enabled or disabled.
Switchover
The following events trigger switchover for unit redundancy according to their priority, with the highest priority triggers listed first.
- Loss of active unit
-
Force switch
-
Lockout
- Radio Loss of Frame (LOF) on active unit
- Change request from the remote unit. This takes place in the event of radio LOF on both units; a change request is sent to the active unit on the other side of the link.
- Loss of Carrier (LOC) in any of the Ethernet interfaces or Loss of Signal (LOS) in any of the TDM interfaces
- Manual switch
LOC takes place if the Admin status of the interface is Enabled and the Operational status is Down. If the interface is closed as a result of ASP, the interface is not considered to be in LOC state, and switchover is not triggered.
Following switchover triggered by LOC, there is an automatic timeout of one minute before any further switchover can take place due to LOC.
At any point, you can manually switch to the standby unit, provided that the highest protection fault level in the standby unit is no higher than the highest protection fault level on the active unit.
You can also perform a force switch to the standby unit, even if the protection fault level is higher in the standby unit. Force switch also implements lockout.
To perform a manual switch or force switch:
- Select Platform > Management > Unit Redundancy. The Unit Redundancy page opens.
- Click Manual Switch or Force Switch.
- Confirm the action in the confirmation window that appears.
Performing Lockout
At any point, you can perform lockout, which prevents switchover to the standby unit in all cases other than a force switch.
To perform lockout:
- Select Platform > Management > Unit Redundancy. The Unit Redundancy page opens.
- In the Lockout field, select on.
- Click Apply.
To release lockout, select off in the Lockout field and then click Apply.
Disabling Unit Redundancy
You can disable unit redundancy at any time.
To disable protection:
- Select Platform > Management > Unit Redundancy. The Unit Redundancy page opens.
- Select Disable in the Protection Admin field.
- Click Apply.
If in-band management is being used, unit redundancy must be disabled in the following order to ensure that management is not lost:
-
Disable unit redundancy in the active unit of the remote pair. The link remains up and no switchover takes place.
-
Change the IP address of the active remote unit.
- Disable all active traffic interfaces on the active remote unit. This should be performed in a single action by selecting all of the relevant interfaces in the Interface Manager page and selecting Down > Apply in the Multiple Selection Operation box. See Enabling the Interfaces (Interface Manager). This causes switchover on the remote pair.
- Disable unit redundancy in the active unit of the local pair. The link remains up and no switchover takes place.
- Change the IP address of the active local unit.
- Disable all active traffic interfaces on the active local unit. This should be performed in a single action by selecting all of the relevant interfaces in the Interface Manager page and selecting Down > Apply in the Multiple Selection Operation box. See Enabling the Interfaces (Interface Manager). This causes switchover on the local pair.
- Disable unit redundancy on the both the remote and the local units that were the standby units and have now become the active units.

Note
On some occasions, in links with TDM traffic, if you disable unit redundancy then re-enable unit redundancy later, a TDM-LIC configuration mismatch alarm may be raised (Alarm ID 2002). If this happens, you must reset the unit with the alarm, then perform copy-to-mate.
Determining ETSI or ANSI (FCC) TDM Mode
By default, the TDM interfaces in a PTP 820G or PTP 820F unit are set to operate according to the ETSI standard, in E1 mode. For instructions on configuring the system to operate according to the ANSI (FCC) standard (DS1), see Configuring the Unit to Operate in ANSI Mode (CLI).
If you must change the system to ANSI mode, you should do so before performing any other configuration, because changing to ANSI mode resets the system and restores the default configuration.
Configuring the Activation Key
PTP 820G and PTP 820F offers a pay as-you-grow concept in which future capacity growth and additional functionality can be enabled with activation keys. For purposes of the activation keys, each PTP 820G/F unit is considered a distinct device. Each device contains a single unified activation key cipher.
New PTP 820G and PTP 820F units are delivered with a default activation key that enables you to manage and configure the unit. Additional feature and capacity support requires you to enter an activation key cipher in the Activation Key Configuration page. Contact your vendor to obtain your activation key cipher.

Note
To obtain an activation key cipher, you may need to provide the unit's serial number. You can display the serial number in the Web EMS Inventory page. See Displaying Unit Inventory.
Each required feature and capacity should be purchased with an appropriate activation key. It is not permitted to enable features that are not covered by a valid activation key. In the event that the activation-key-enabled capacity and feature set is exceeded, an Activation Key Violation alarm occurs and the Web EMS displays a yellow background and an activation key violation warning. After a 48-hour grace period, all other alarms are hidden until the capacity and features in use are brought within the activation key's capacity and feature set.
In order to clear the alarm, you must configure the system to comply with the activation key that has been loaded in the system. The system automatically checks the configuration to ensure that it complies with the activation-key-enabled features and capacities. If no violation is detected, the alarm is cleared.
A demo activation key is available that enables all features for 60 days. When the demo activation key expires, the most recent valid activation key goes into effect. The 60-day period is only counted when the system is powered up. 10 days before the demo activation key expires, an alarm is raised indicating that the demo activation key is about to expire.
Viewing the Activation Key Status Parameters
To display the current activation key status parameters:
1 Select Platform > Activation Key > Activation Key Configuration. The Activation Key Configuration page opens.
Figure 35 Activation Key Configuration Page
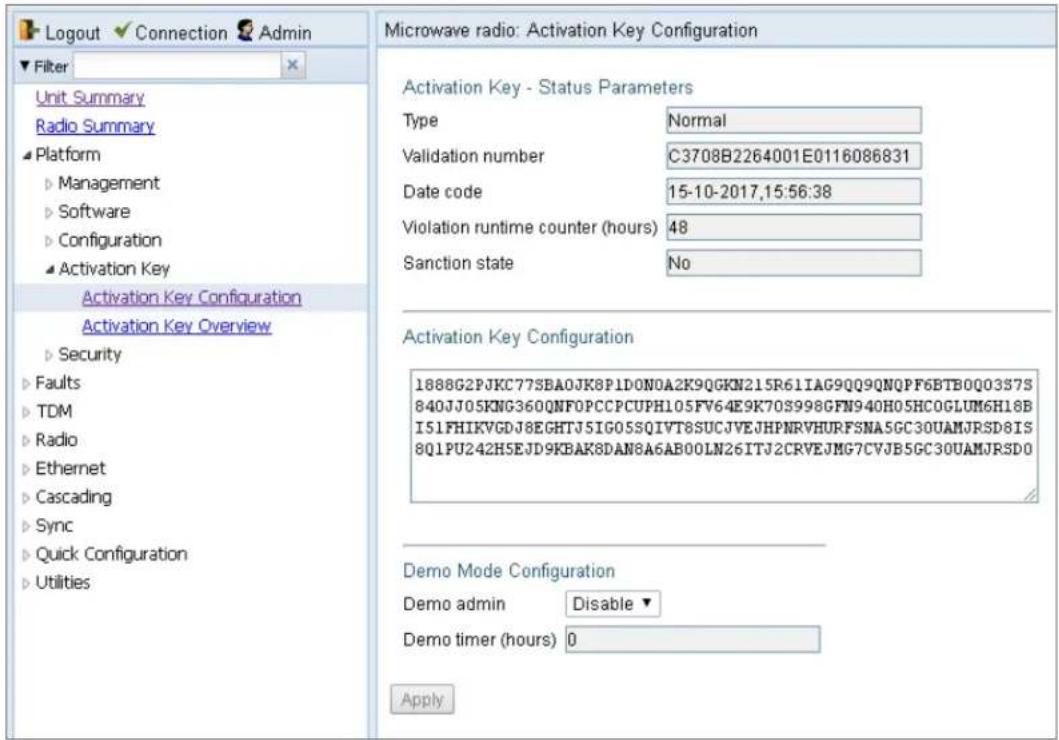
Table 18 Activation Key Status Parameters
| Parameter Definition | |
| Type | Displays the current activation key type. |
| Validation number | Displays a random, system-generated validation number. |
| Date code | Displays a date code used for validation of the current activation key cipher. |
| Violation runtime counter (hours) | In the event of an Activation Key Violation alarm, this field displays the number of hours remaining in the 48-hour activation key violation grace period. |
| Sanction state | If an Activation Key Violation alarm has occurred, and the 48-hour activation key violation grace period has expired without the system having been brought into conformance with the activation-key-enabled capacity and feature set, Yes appears in this field to indicate that the system is in an Activation Key Violation sanction state. All other alarms are hidden until the capacity and features in use are brought within the activation-key-enabled capacity and feature set. |
Entering the Activation Key
To enter a new activation key:
1 Select Platform > Activation Key > Activation Key Configuration. The Activation Key Configuration page opens (Figure 30).
2 Enter the activation key cipher you have received from the vendor in the Activation Key field. The activation key cipher is a string that enables all features and capacities that have been purchased for the unit.
3 Click Apply.
If the activation key cipher is not legal (e.g., a typing mistake or an invalid serial number), an Activation Key Loading Failure event is sent to the Event Log. When a legal activation key cipher is entered, an Activation Key Loaded Successfully event is sent to the Event Log.
Activating a Demo Activation Key
To activate a demo activation key:
1 Select Platform > Activation Key > Activation Key Configuration. The Activation Key Configuration page opens (Figure 30).
2 In the Demo admin field, select Enable.
3 Click Apply.
The Demo timer field displays the number of hours that remain before the demo activation key expires.
Activation Key Reclaim
If it is necessary to deactivate an PTP 820 device, whether to return it for repairs or for any other reason, the device's activation key can be reclaimed for a credit that can be applied to activation keys for other devices.

Note
Activation key reclaim is only available for PTP 820 devices running System Release 9.2 or later.
A composite type activation key provides free activation keys when certain activation keys are purchased. For example, if a customer purchases an activation key for one GB ethernet port, two FE ethernet port activation keys are also provided. If the customer reclaims the activation key, the customer only gets credit for the original activation key, not for the composite items.
Where the customer has purchased upgrade activation keys, credit is given for the full feature or capacity, not for each individual upgrade. For example, if the customer purchased two capacity activation keys for 300M and later purchased one upgrade activation key to 350M, credit is given as if the customer had purchased one activation key for 350M and one activation key for 300M.
For instructions on how to reclaim an activation key, refer to the User Guide for the Cambium Activation Key Management System, Rev A.15 or later, Reclaiming an Activation Key.
Displaying a List of Activation-Key-Enabled Features
To display the status of activation key coverage for features and capacities in the PTP 820G:
1 Select Platform > Activation Key > Activation Key Overview. The Activation Key Overview page opens.
Figure 36 Activation Key Overview Page
| Logout Connection Adms | |||||||
| Filter | |||||||
| Unit Summary Radio Summary | # Feature Id ▲ | Feature name | Feature description | Activation key-enabled feature usage | Activation key-enabled feature Proof | Activation key Violation status | |
| 1 | 10 | Per Usage | Post paid model for the activation key | Disable | Disable | OK | |
| 2 | 100 | Services Mode | Service mode: Smart Pipe, Edge-CET-Node, Agg-Lvl-1-CET-Node, Agg-Lvl-2-CET-Node | Not used | Edge-CET-Node | OK | |
| 3 | 200 | Number of Services | Number of allowed Ethernet services | 0 | 8 | OK | |
| 4 | 300 | H-QoS | Hierarchical QoS (Quality of Service) | Not used | Allowed | OK | |
| 5 | 500 | Network Resiliency | Network resiliency protocols (Smart-TDM Path Protection, G.8002) | Not used | Not allowed | OK | |
| 6 | 600 | Ethernet OAM - Fault Management | Enables Connectivity Fault Management (FM) per Y.1731/802 tag and 892.San (CET mode only) | Not used | Allowed | OK | |
| 7 | 650 | Ethernet OAM - Performance Monitoring | Ethernet OAM (Operation Administration and Maintenance) Performance Monitoring (FM) - Y.1731 | Not used | Allowed | OK | |
| 8 | 600 | LACP | Link Aggregation Control Protocol (LACP) | Not used | Allowed | OK | |
| 9 | 1100 | Sync Unit | ITU-T G.8262 SyncE and ITU-T G.8284 ESMC (Ethernet Synchronization Massage Control) | Not used | Not allowed | OK | |
| 10 | 1202 | IEEE1588 Transparent Clock | Synchronization over Packet | Not used | Not allowed | OK | |
| 11 | 1309 | IEEE1588 Ordinary Clock (quantity) | The allowed number of IEEE1588v2 (PTP - Precision Time Protocol) Ordinary Clocks (OC) | Not used | 0 | OK | |
| 12 | 1400 | IEEE1588 Boundary Clock | IEEE1588v2 (PTP - Precision Time Protocol) Boundary Clocks (BC) | Not used | Not allowed | OK | |
| 13 | 1600 | Main card redundancy | Redundancy of the main card | Not used | Allowed | OK | |
| 14 | 1700 | TDM Pseudowire | TDM Pseudowire support | Not used | Allowed | OK | |
| 15 | 1800 | Frame cut-through | Frame cut-through capability | Not used | Allowed | OK | |
| 16 | 2100 | Secured Management | Secured protocols: SSH, SFTP, HTTPB, RADIUS, SNMPv3 | Not used | Not allowed | OK | |
| 17 | 2200 | FE traffic ports (quantity) | The allowed number of FE (Fast Ethernet) ports | 0 | 11 | OK | |
| 18 | 2300 | GbE traffic ports (quantity) | The allowed number of GbE (Gigabit Ethernet) ports | 0 | 13 | OK | |
| 19 | 2400 | IGHS traffic ports quantity | The allowed number of IGHS (IGHS Ethernet) ports. | 0.0.0.0.0.0.0.0.0.0.0.0.0.0.0.0.0.0.0.0.0.0.0.0.0.0.0.0.0.0.0.0.0.0.0.0.0.0.0.0.0.0.0.0.0.0.0.0.0.0.0. | |||
The Activation Key Overview page displays the activation-key-enabled features and capacities for the PTP 820G or PTP 820F, and indicates the activation key status of each feature according to the activation key currently implemented in the unit.

Note
Some of the features listed in the Activation Key Overview page may not be supported in the currently installed software version. For details on feature support, refer to the Release Notes or Technical Description for the PTP 820 product and System Release you are using.
Table 19 Activation Key Status Parameters
| Parameter Definition | |
| Feature ID A unique ID that identifies the feature. | |
| Feature name The name of the feature. | |
| Feature Description | A description of the feature. |
| Activation key-enabled feature usage | Indicates whether the activation-key-enabled feature is actually being used. |
| Activation key-enabled feature credit | Indicates whether the feature is allowed under the activation key that is currently installed in the unit. |
| Activation key violation status | Indicates whether the system configuration violates the currently installed activation key with respect to this feature. |
| Activation Key Name Description | |
| Services Mode | Enables a number of Ethernet services, depending on the type of activation key:Smart-Pipe –Smart Pipe (L1) services only (unlimited) and a single management service, with MSTP.Edge-CET Node – Up to 8 services (all supported service types).Agg-Lvl-1-CET-Node – Up to 64 services (all supported service types).Agg-Lvl-2-CET-Node – Up to 1024 services (all supported service types).Any CET activation key also enables the following:A GbE traffic port in addition to the port provided by the default activation key, for a total of 2 GbE traffic ports.Network resiliency (MSTP/RSTP) for all services.Full QoS for all services including basic queue buffer management (fixed queues buffer size limit, tail-drop only) and eight queues per port. |
| Number of Services | Indicates how many services are allowed according to the Services Mode activation key, and how many are actually configured on the device. |
| H-QoS | Not relevant for PTP 820 products. |
| Network Resiliency | Enables the following network resiliency protocols:G.8032TDM Services 1:1/1+1 path protection |
| Ethernet OAM – Fault Management | Enables Connectivity Fault Management (FM) per Y.1731 (CET mode only). |
| Ethernet OAM – Performance Monitoring | Not relevant in the current System Release release. |
| LACP | Enables Link Aggregation Control Protocol (LACP). |
| Sync Unit | Enables the G.8262 synchronization unit. This activation key is required in order to provide end-to-end synchronization distribution on the physical layer. This activation key is also required to use SyncE. |
| IEEE 1588 Transparent Clock | Enables IEEE-1588 Transparent Clock. |
| IEEE 1588 Ordinary Clock (quantity) | Not relevant in the current System Release release. |
| IEEE 1588 Boundary Clock | Enables IEEE-1588 Boundary Clock. |
| Main Card Redundancy | Not relevant for PTP 820F and PTP 820G. |
| TDM Pseudowire | Enables TDM pseudowire services on units with TDM interfaces. Without this activation key, only native TDM services are supported. |
| Frame cut-through | Enables Frame Cut-Through. |
| Secured Management | Enables secure management protocols (SSH, HTTPS, SFTP, SNMPv3, and RADIUS). |
| FE traffic ports (quantity) | Displays the number of FE traffic ports allowed under the current activation key. |
| GbE traffic ports (quantity) | Displays the number of GbE traffic ports allowed under the current activation key. |
| 10GbE traffic ports (quantity) | Not relevant for PTP 820F and PTP820G. |
| ACM (quantity) | Displays the number of radio carriers that are allowed to use ACM under the current activation key. |
| Narrow CHBW 1.75MHz script (quantity) | Displays the number of radio carriers that are allowed to use MRMC script 1075 (1.75 MHz). No other capacity activation key is required for carriers using this script. Note that this script can only be used with PTP 820G devices. |
| Header De-Duplication (quantity) | Displays the number of radio carriers that are allowed to use Header De-Duplication. |
| XPIC (quantity) | Displays the number of radio carriers that are allowed to use XPIC. Each carrier in the XPIC pair requires an XPIC activation key. |
| Multi-Carrier ABC (quantity) | Displays the number of radio carriers that are allowed to use Multi-Carrier ABC. Each carrier in the Multi-Carrier ABC group requires a Multi-Carrier ABC activation key. |
| MIMO | Not relevant for split-mount devices. |
| SD | Not relevant for PTP 820F and PTP 820G. |
| ASD | Not relevant for split-mount devices. |
| AFR 1+0 (quantity) | Not relevant for split-mount devices. |
| Payload Encryption AES-256 (quantity) | Displays the number of radio carriers that can use of AES-256 encryption Note that:If no AES activation key is configured for the unit and the user attempts to enable AES on a radio carrier, in addition to an Activation Key Violation alarm the feature will remain inactive and no encryption will be performed.After entering an AES activation key, the user must reset the unit before AES can be activated. Unit reset is only necessary for the first AES activation key. If AES activation keys are acquired later for additional radio carriers, unit reset is not necessary. |
| Second core activation | Not relevant for split-mount devices. |
| Second RX core activation for for RFU-D/RFU-D-HP | Displays the number of RFU-D RFUs for which there is permission to use their second core (carrier). |
| Second core activation for HP | Displays the number of RFU-D-HP RFUs for which there is permission to use their second core (carrier). |
| Second modem activation | Enables the use of a second modem on a PTP 20G. |
| RFU port activation key | Not relevant in the current sytem release. |
| Radio capacity level 1 | Displays the number of radio carriers for which there is permission to use up to 10 Mbps. This is the default level, so every radio carrier on the device has this capacity level. |
| Radio capacity level 2 | Displays the number of radio carriers for which there is permission to use up to 50 Mbps. |
| Radio capacity level 3 | Displays the number of radio carriers for which there is permission to use up to 100 Mbps. |
| Radio capacity level 4 | Displays the number of radio carriers for which there is permission to use up to 150 Mbps. |
| Radio capacity level 5 | Displays the number of radio carriers for which there is permission to use up to 200 Mbps. |
| Radio capacity level 6 | Displays the number of radio carriers for which there is permission to use up to 225 Mbps. |
| Radio capacity level 7 | Displays the number of radio carriers for which there is permission to use up to 250 Mbps. |
| Radio capacity level 8 | Displays the number of radio carriers for which there is permission to use up to 300 Mbps. |
| Radio capacity level 9 | Displays the number of radio carriers for which there is permission to use up to 350 Mbps. |
| Radio capacity level 10 | Displays the number of radio carriers for which there is permission to use up to 400 Mbps. |
| Radio capacity level 11 | Displays the number of radio carriers for which there is permission to use up to 450 Mbps. |
| Radio capacity level 12 | Displays the number of radio carriers for which there is permission to use up to 500 Mbps. |
| Radio capacity level 13 | Displays the number of radio carriers for which there is permission to use up to 650 Mbps. |
| Radio capacity level 14 | Displays the number of radio carriers for which there is permission to use up to 1000 Mbps. |
| Radio capacity level 15 | Displays the number of radio carriers for which there is permission to use up to 1600 Mbps. |
| Radio capacity level 16 | Displays the number of radio carriers for which there is permission to use up to 2000 Mbps. |
| Radio capacity level 17 | Displays the number of radio carriers for which there is permission to use up to 2500 Mbps. |
| Auto State Propagation and LLF | Enables the use of Link Loss Forwarding (LLF) with Automatic State Propagation (ASP). Without the activation key, only one LLF ID can be configured. This means that only one ASP pair can be configured per radio interface or radio group. |
| Enhanced Multi-Carrier ABC (quantity) | Not relevant for split-mount products. |
Table 20 Activation Key-Enabled-Features Description
Setting the Time and Date (Optional)
Related Topics:
- Configuring NTP
PTP 820G/F uses the Universal Time Coordinated (UTC) standard for time and date configuration. UTC is a more updated and accurate method of date coordination than the earlier date standard, Greenwich Mean Time (GMT).
Every PTP 820G/F unit holds the UTC offset and daylight savings time information for the location of the unit. Each management unit presenting the information uses its own UTC offset to present the information with the correct time.

Note
If the unit is powered down, the time and date are saved for 96 hours (four days). If the unit remains powered down for longer, the time and date may need to be reconfigured.
To display and configure the UTC parameters:
1 Select Platform > Management > Time Services. The Time Services page opens.
Figure 37 Time Services Page

2 Configure the fields listed in Table 20.
3 Click Apply.
Table 21 Time Services Parameters
| Parameter Definition | ||
| Date and Time Configuration | UTC date and time | The UTC date and time. |
| Local date and time | The calculated local date and time, based on the local clock, Universal Time Coordinated (UTC), and Daylight Savings Time (DST) configurations. | |
| Offset from GMT | UTC offset hours | The required hours offset (positive or negative) relative to GMT. This is used to offset the clock relative to GMT, according to the global meridian location. |
| UTC offset minutes | The required minutes offset (positive or negative) relative to GMT. This is used to offset the clock relative to GMT, according to the global meridian location. | |
| Daylight Saving Start Time | Month The month when Daylight Savings Time begins. | |
| Day The date in the month when Daylight Savings Time begins. | ||
| Daylight Saving End Time | Month The month when Daylight Savings Time ends. | |
| Day The date in the month when Daylight Savings Time ends. | ||
| DST offset | The required offset, in hours, for Daylight Savings Time. Only positive offset is supported. | |
Enabling the Interfaces (Interface Manager)
The following are the default settings for fixed interfaces on PTP 820G and PTP 820F unit's:
- Ethernet traffic interfaces, the second management interface, and the Synchronization interface are disabled, and must be manually enabled as described below.
• Radio interfaces, the first management interface, and the TDM interface (optional) are automatically enabled. - PTP 820F supports both single-carrier and MultiCore RFUs. If the PTP 820F is connected to a single-carrier RFU, the radio interface is displayed in the Web EMS as Radio Slot 1 Port 1. If the PTP 820F is connected to a MultiCore RFU, the radio interfaces are displayed in the Web EMS as Radio Slot 1 Port 1 and Radio Slot 1 Port 2, where Port 1 represents the first radio carrier on the MultiCore RFU, and Port 2 represents the second radio carrier on the MultiCore RFU. The MAC address of the MultiCore RFU is presented in the Port 1 row.
Table 22 PTP 820F: Radio Interfaces in Interface Manager
| RFU Interface | RFU Carrier | Interface Manager Display |
| RFU1 | Carrier 1 | Radio: Slot 1, Port 1 |
| RFU1 | Carrier 2 | Radio: Slot 1, Port 2 |
| RFU2 | Carrier 1 | Radio: Slot 1, Port 3 |
| RFU2 | Carrier 2 | Radio: Slot 1, Port 4 |
| RFU3 | Carrier 1 | Radio: Slot 1, Port 5 |

Note
Radio Slot 1 Port 2 and Radio Slot 1 Port 4 always appear, even if the RFU interface is connected to a single-carrier RFU such as RFU-S. If the interface is connected to a single-carrier RFU, or if the second carrier of a MultiCore RFU is not in use, you should set the Admin status field of Port 2 or Port 4 to Down to disable the radio interface and prevent unnecessary alarms.
To enable and disable interfaces:
1 Select Platform > Management > Interface Manager. The Interface Manager page opens.
Figure 38 Interface Manager Page PTP 820F

Figure 39 Interface Manager Page – PTP 820G

To enable or disable an individual interface:
1 Select the interface in the Interface Manager table.
2 Click Edit. The Interface Manager – Edit page opens.
Figure 40 Interface Manager – Edit Page

3 In the Admin status field, select Up to enable the interface or Down to disable the interface.
4 Click Apply, then Close.
To enable or disable multiple interfaces:
1 Select the interfaces in the Interface Manager table or select all the interfaces by selecting the check box in the top row.
2 In the Multiple Selection Operation section underneath the Interface Manager Table, select Admin status - Up or Admin status – Down.
Figure 41 Multiple Selection Operation Section (Interface Manager Page)

3 Click Apply.

Note
The Operational Status field displays the current, actual operational state of the interface (Up or Down).
Enabling the Second Management Interface
To enable the second management interface, you must use the CLI. Enter the following command in root view to enable the interface:
root> platform management local-mngt admin state set enable port mng2
To disable the second management interface, enter the following command in root view:
root> platform management local-mngt admin state set disable port mng2
To display the status of both management interfaces, enter the following command in root view:
root> platform management local-mngt admin state show port all
Configuring RFU3/SFP5,RFU3/2.5GE5 as an Ethernet or RFU Interface(PTP 820F only)
On PTP 820F, the combo port labelled RFU3/SFP5 (SFP) and RFU3/2.5GE5 (RJ-45) can be configured as either an RFU interface (RFU3) or an Ethernet interface (Eth3). By default, this port is an RFU interface.

Figure: RFU3/SFP5 and RFU3/2.5GE5 Combo Port
To change the port's use from RFU to Ethernet or Ethernet to RFU:
1 Set the port's admin state to Down in the Interface Manager.
- If the port is currently configured as an RFU port, it is listed as Radio: Slot 1, Port 5 in the Interface Manager.
- If the port is currently configured as an Ethernet port, it is listed as Ethernet: Slot 1, Port 5 in the Interface Manager.
See Enabling the Interfaces (Interface Manager).
2 In the Radio Unit page, set the Admin status of Radio Unit: Slot 1, Port 3 to Down.
3 If there are any service points attached to the port, remove them.
4 If the port is configured as a Sync source, delete the port as a Sync source.
5 If the port belongs to any interface groups, such as LAG, remove the port from the group.
6 Select Platform > Interfaces > RFU/Ethernet. The RFU/Ethernet Interface Configuration page opens.

Figure: RFU/Ethernet Interface Configuration Page
7 Select Radio Unit: Slot 1, Port 3 and click Edit. The RFU/Ethernet Interface Configuration – Edit page opens.
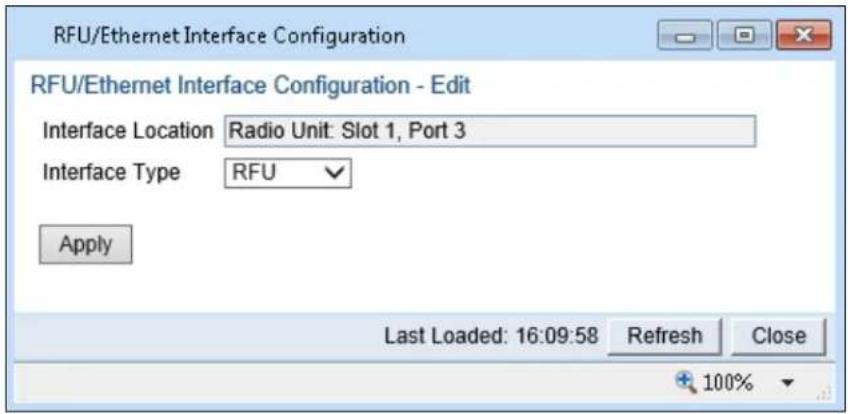
Figure: RFU/Ethernet Interface Configuration – Edit Page
8 In the Interface Type field, select RFU or Ethernet.
9 Click Apply, then Close.
10 If you configured the port as an Ethernet interface, you must set the port's admin state to Up in the Interface Manager. See Enabling the Interfaces (Interface Manager). If you configured the port as an RFU interface, its admin state is Up automatically.
If you configured the port as an Ethernet interface, the port takes the following parameters:
- Port speed: 1 GE
• Media Type: RJ45
• Auto Negotiation: On
To change these parameters, go to the Physical Interfaces page. See Configuring Ethernet Interfaces.

Note
Both Eth5 and Eth6 can be configured to either 1 GE or 2.5 GE. The other PTP 820F Ethernet ports support 1 GE only.
If you configured the port as an RFU interface, make sure to set the Radio Unit parameters as necessary.
Configuring Cascading Interfaces (Optional)
In PTP 820F, GbE 1/SFP 1 and GbE 2/SFP 2 can be configured as normal GE traffic interfaces or as cascading interfaces. In PTP 820G, GbE1/CS1 and GbE2/CS2 can be configured as normal GE traffic interfaces or as cascading interfaces. When operating in cascading mode, these interfaces can handle hybrid Ethernet and Native TDM traffic, enabling operators to create links among multiple [Product Series] units in a node for multi-directional applications based on hybrid Ethernet and Native or pseudowire TDM services. To configure an interface as a cascading interface:
1 Select Cascading > Interfaces. The Cascading Interface Configuration page opens.
Figure 42 Cascading Interfaces Page

2 Select the interface you want to configure and click Edit. The Cascading Interface Configuration – Edit page opens.
Figure 43 Cascading Port Configuration Table – Edit Page

3 In the Interface Type field, select Cascading.
4 Click Apply, then Close.

Note
You cannot change the status of an interface (Cascading or Ethernet) if a service point is configured on the interface.
You cannot change the status of an interface (Cascading or Ethernet) if the interface belongs to a LAG.
Configuring the Radio Parameters
In order to establish a radio link, you must:
- Unmute the radio carrier.
- Configure the radio frequencies.
- Configure the TX level.
You can do these tasks, perform other radio configuration tasks, and display the radio parameters in the Radio Parameters page.
To configure the radio parameters:
1 Select Radio > Radio Parameters. The Radio Parameters page opens.
Figure 44 Radio Parameters Page

2 In the Radio table, select the radio you want to configure and click Edit. A separate configuration page opens.
Figure 45 Radio Parameters Configuration Page

3 Set the radio frequency in the Frequency control (Local) section:
In the TX Frequency (MHz) field, set the transmission radio frequency in MHz.
ii In the RX Frequency (MHz) field, set the received radio frequency in MHz.
iii Click Apply. The system automatically calculates and displays the frequency separation in the TX to RX frequency separation (MHz) field, based on the configured TX and RX frequencies.
iv Optionally, select Set also remote unit to apply the frequency settings to the remote unit as well as the local unit.
4 Set the other radio parameters in the Configuration parameters section:
In the TX Level (dBm) field, enter the desired TX signal level (TSL). The range of values depends on the frequency and RFU type.
ii To mute the TX output of the RFU, select On in the TX mute field. To unmute the TX output of the RFU, select Off.
iii In the Link ID field, enter a unique link identifier from 1 to 65535. The Link ID identifies the link, in order to distinguish it from other links. If the Link ID is not the same at both sides of the link, a Link ID Mismatch alarm is raised. If Link ID Mismatch Security is enabled, traffic is also blocked on the link. See Enabling Link ID Mismatch Security.
iv In the RSL degradation alarm admin field, select Enable if you want the unit to generate an alarm in the event that the RSL falls beneath the threshold defined in the RSL degradation threshold field. The range of values is -99 to 0. By default, the alarm is disabled, with a default degradation threshold of 68 dBm. The RSL degradation alarm is alarm ID 1610, Radio Receive Signal Level is below the configured threshold.
The alarm is cleared when the RSL goes above the configured threshold. The alarm is masked if the radio interface is disabled, the radio does not exist, or a communication-failure alarm (Alarm ID #1703) is raised.

Note
For instructions on the Adaptive TX power admin field, see Enabling ACM with Adaptive Transmit Power.
The RSL Connector Source field is reserved for future use.
For a description of the read-only parameters in the Status parameters section, see Viewing the Radio Status and Settings.
Enabling Link ID Mismatch Security
You can configure the unit to block all Ethernet and TDM traffic over the radio link in the event of a Link ID mismatch by enabling Link ID Mismatch Security. When Link ID Mismatch Security is enabled and a Link ID mismatch occurs:
• All Ethernet and TDM traffic over the link is blocked.
• The operational status of the radio is set to Down.
• Automatic State Propagation is triggered.
- You cannot change the Link ID of the remote radio, but the local-remote channel remains open for other remote configurations.
• In-band management is lost. Once the mismatch is cleared, in-band management is automatically restored.
• The relevant interfaces are treated as being Down for purposes of MSTP and G.8032.
Link ID Mismatch Security must be enabled and disabled via CLI.
To enable Link ID Mismatch Security, enter the following command in root view:
root> platform security link-id mismatch security set admin enable
To disable Link ID Mismatch Security, enter the following command in root view:
root> platform security link-id mismatch security set admin disable
To display the current Link ID Mismatch Security setting, enter the following command in root view:
root> platform security link-id mismatch security show admin
By default, Link ID Mismatch Security is disabled.
Entering Radio View (CLI)
To view and configure radio parameters, you must first enter the radio's view level in the CLI.
Use the following command to enter a radio's view level:
root> radio slot <slot> port <port>
The following command enters radio view for fixed radio interface 1:
root> radio slot 1 port 1
The following prompt appears:
radio[1/1]>
The following command enters radio view for fixed radio interface 2:
root> radio slot 1 port 2
The following prompt appears:
radio[1/2]>
The following command enters radio view for an RMC in expansion slot 3:
root> radio slot 3 port 1
The following prompt appears:
radio[3/1]>
Muting and Unmuting the Radio (CLI)
To mute or unmute the radio, enter the following command in radio view:
radio[x/x]>rf mute set admin <admin>
To configure a timed mute, enter the following command in radio view:
radio[x/x]> rf mute set admin on-with-timer timeout-value <1-1440>
When the timer expires, the radio is automatically unmuted. A timed mute provides a fail-safe mechanism for maintenance operations that eliminates the possibility of accidentally leaving the radio muted after the maintenance has been completed. By default, the timer is 10 minutes.
Note: In contrast to an ordinary mute, a timed mute is not persistent. This means that if the unit is reset, the radio is not muted when the unit comes back online, even if the timer had not expired. Also, in unit and radio protection configurations, a timed mute is not copied to the mate unit or radio, and no mismatch alarm is raised if a timed mute is configured on only one radio in the protection pair.
To display the mute status of a radio, enter the following command in radio view:
radio[x/x]>rf mute show status
Table 23: Radio Mute/Unmute CLI Parameters
| Parameter | Input Type | Permitted Values | Description |
| admin | Variable | on off | Mutes (on) or unmutes (off) the radio. |
The following command mutes fixed radio interface 1:
radio[1/1]>rf mute set admin on
The following command mutes the RMC in expansion slot 2:
radio[2/1]>rf mute set admin on
The following command configures a timed mute on fixed radio interface 1. This mute will automatically expire in 30 minutes.
radio[1/1]> rf mute set admin on-with-timer timeout-value 30
The following command unmutes fixed radio interface 2:
radio[1/2]>rf mute set admin off
Configuring the Transmit (TX) Frequency (CLI)
To set the transmit (TX) frequency of a radio, enter the following command in radio view. This command automatically sets the remote RX frequency in parallel, unless you set the local-remote attribute to disable:
radio[x/x]>rf set tx-frequency <tx-frequency> local-remote <local-remote>
Note: If the carrier belongs to an XPIC group, you must disable the group before changing the TX or RX frequency.
Table 24: Transmit (TX) Frequency CLI Parameters
| Parameter Input | Type | Permitted Values | Description |
| tx-frequency | Number | Depends on the MRMC script and RFU type. | The desired TX frequency (in KHz) and, ifis set to enable, the desired RX frequency of the remote unit. |
| local-remote | Variable | enable disable | Optional. Determines whether to apply the configured TX frequency value to the RX frequency of the remote unit. By default, the configured TX frequency value is applied to the RX frequency of the remote unit. |
The following command sets the TX frequency of fixed radio interface 1 to 12900000 KHz, and sets the RX frequency of the remote unit to the same value.
radio[1/1]>rf set tx-frequency 12900000
The following command sets the TX frequency of fixed radio interface 2 to 12900000 KHz, but does not set the RX frequency of the remote unit.
radio[1/2]>rf set rx-frequency 12900000 local-remote disable
Configuring the Transmit (TX) Level (CLI)
To set the transmit (TX) level of a radio, enter the following command in radio view:
radio[x/x]>rf set tx-level <tx-level>
To display the maximum transmit (TX) level of a radio, enter the following command in radio view:
radio[x/x]>rf show max-tx-level
Table: Transmit (TX) Level CLI Parameters
| Parameter | Input Type | Permitted Values | Description |
| tx-level | Number | -50-34 | The desired TX signal level (TSL), in dBm. |
The following command sets the TX level of fixed radio interface 1 to 10 dBm:
radio[1/1]>rf set tx-level 10
Configuring the Radio (MRMC) Script(s)
Related Topics:
• Displaying MRMC Status
Multi-Rate Multi-Constellation (MRMC) radio scripts define how the radio utilizes its available capacity. Each script is a pre-defined collection of configuration settings that specify the radio's transmit and receive levels, link modulation, channel spacing, and bit rate. Scripts apply uniform transmit and receive rates that remain constant regardless of environmental impact on radio operation.

Note
The list of available scripts reflects activation-key-enabled features. Only scripts within your activation-key-enabled capacity will be displayed.
To display the MRMC scripts and their basic parameters and select a script:
1 Select one of the following, depending on the regulatory framework in which you are operating:
To display ETSI scripts, select Radio > MRMC > Symmetrical Scripts > ETSI.
To display ANSI (FCC) scripts, select Radio > MRMC > Symmetrical Scripts > FCC.
The MRMC Symmetrical Scripts page opens. For a description of the parameters displayed in the MRMC Symmetrical Scripts page, see Table 24 MRMC Symmetrical Scripts Page Parameters.
Figure 46 MRMC Symmetrical Scripts Page (ETSI) – PTP 820F

Figure 47 MRMC Symmetrical Scripts Page (ETSI) – PTP 820G

Figure 48 MRMC Symmetrical Scripts Page (ANSI)
![Logout Admin Connection Filter Main View Platform Faults TDM Radio Radio Parameters Remote Radio Parameters Radio Thresholds ATEC Ethernet Interface MRMC Symmetrical Scripts ETSI ECC MRMC Status PM & Statistics Diagnostics Groups Ethernet Cascading Sync Microwave radio: MRMC Symmetrical FCC Scripts [Radio: Slot 1, port 1] Select Radio interface Slot 1 (Radio #1) MRMC script attribute table (Symmetrical FCC Scripts) Script ID Channel bandwidth Occupied Bandwidth Script Name ACM Support Supported QAM Bit Rate (Mbps) 1005 30.000 28.000 mdN_A2828N_130_1005 Yes 4.2048 43.389..261.357 1006 60.000 55.700 mdN_A5656N_129_1006 Yes 4.2048 87.122..529.505 1007 40.000 37.400 mdN_A4040N_119_1007 Yes 4.2048 58.224..349.341 1010 50.000 47.200 mdN_A5050N_111_1010 Yes 4.2048 70.683..445.020 1020 10.000 9.110 mdN_A1010N_100_1020 You 4.2048 13.635..78.319 1021 20.000 18.570 mdN_A2020N_100_1021 Yes 4.2048 28.520..165.740 1205 30.000 28.000 mdN_A2828X_111_1205 Yes 4.2048 42.365..257.391 1206 60.000 55.000 mdN_A5656X_101_1206 Yes 4.2048 85.317..506.204 1207 40.000 37.600 mdN_A4040X_109_1207 Yes 4.2048 56.608..344.163 1210 50.000 46.000 mdN_A5050X_104_1210 Yes 4.2048 72.265..428.910 1217 40.000 33.500 mdN_A4040X_102_1217 Yes 4.2048 51.104..310.488 1222 25.000 23.400 mdN_A2525X_103_1222 Yes 4.2048 35.223..214.059 Configure script Refresh Note: ✓ Indicates the current configured script](/content/2026/05/985471/images/55c607f631344d45c0b3a77ccebbb247474a226154afd2b7e3b200ca456a03cd.jpg)
2 In the Select Radio Interface field, select the slot for which you want to configure the script.
3 Select the script you want to assign to the radio. The currently-assigned script is marked by a check mark (Script ID's 4505 and 1004 in the images above).
4 Click Configure Script. A separate MRMC Symmetrical Scripts page opens.
Figure 49 MRMC Symmetrical Scripts Page (Configuration) – PTP 820F
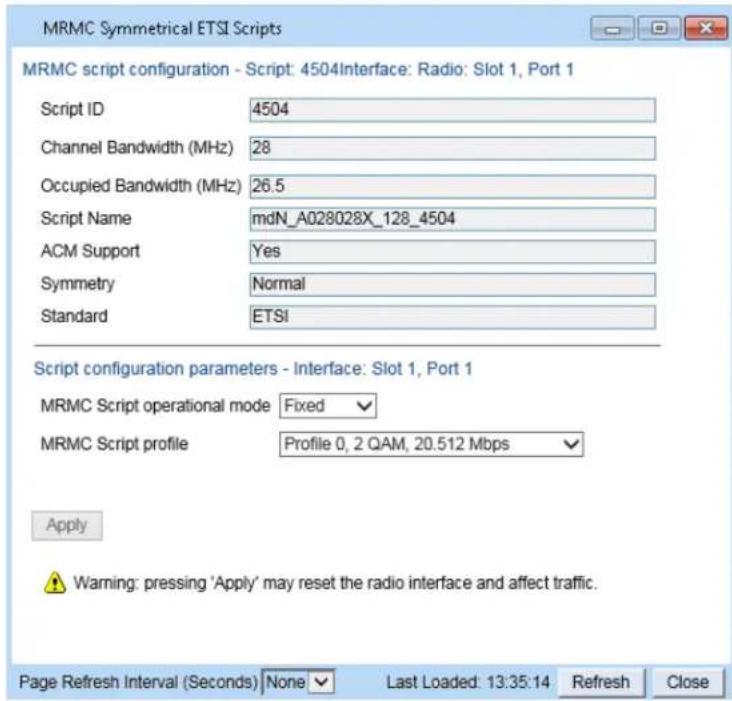
Figure 50 MRMC Symmetrical Scripts Page (Configuration) - PTP 820G

5 In the MRMC Script operational mode field, select the ACM mode: Fixed or Adaptive.
- Fixed ACM mode applies constant TX and RX rates. However, unlike regular scripts, with a Fixed ACM script you can specify a maximum profile to inhibit inefficient transmission levels.
In Adaptive ACM mode, TX and RX rates are dynamic. An ACM-enabled radio system automatically chooses which profile to use according to the channel fading conditions. If you select Adaptive, two fields are displayed enabling you to select minimum and maximum ACM profiles.
Figure 51 MRMC Symmetrical Scripts Page (Configuration – Adaptive Mode) – PTP 820F
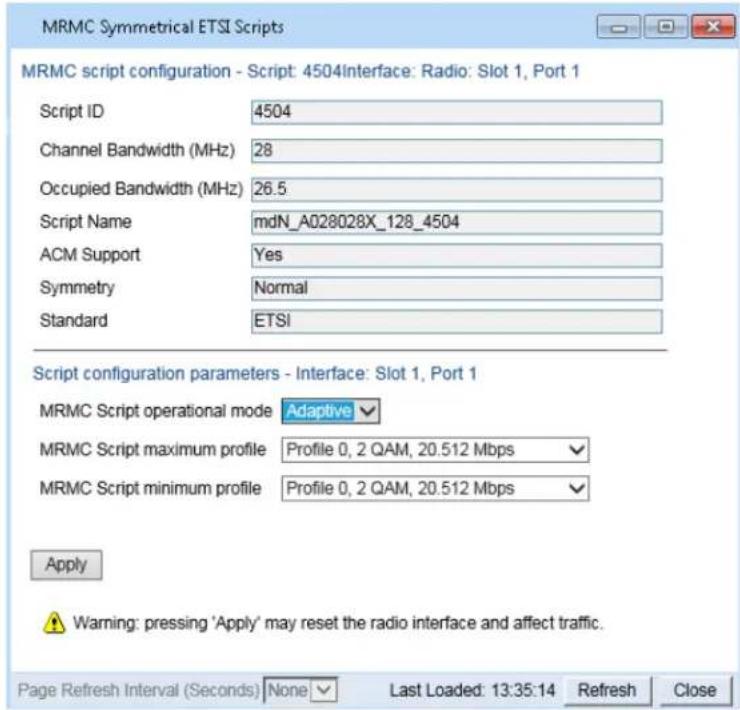
Figure 52 MRMC Symmetrical Scripts Page (Configuration – Adaptive Mode) PTP 820G

6 Define the script profile or profiles:
- If you selected Fixed ACM mode, select the ACM profile in the MRMC Script profile field.
If you selected Adaptive ACM mode, select the maximum and minimum ACM profiles in the MRMC Script maximum profile and the MRMC Script minimum profile fields.
See Table 25 PTP 820F Radio Configurations. The number of profiles depends on the type of unit you are configuring. For PT 820G, it also depends on whether you are configuring the MRMC script for a fixed interface. For PTP 820F, it depends on whether you are using a Microwave RFU (RFU-D and RFU-S) or an E-Band RFU (RFU-E).
o PTP 820G: For fixed interfaces and RMC-B, up to 11 profiles (0-10) are available.
- PTP 820F: For Microwave RFUs, up to 13 profiles (0-12) are available.
o PTP 820F: For RFU-E, up to 10 profiles (0-9) are available.

Note
Supported profiles differ per script and also may differ based on whether the script is configured for Fixed or Adaptive mode. For details, refer to the Release Notes for the System Version you are using.
7 Click Apply.

Note
Changing the script resets the radio interface and affects traffic. Changing the maximum or minimum profile does not reset the radio interface.
Table 25 PTP 820G Radio Profiles for Fixed Interfaces and RMC-B
| Profile Modulation |
| Profile 0 4 QAM |
| Profile 1 8 QAM |
| Profile 2 16 QAM |
| Profile 3 32 QAM |
| Profile 4 64 QAM |
| Profile 5 128 QAM |
| Profile 6 256 QAM |
| Profile 7 512 QAM |
| Profile 8 1024 QAM (Strong FEC) |
| Profile 9 1024 QAM (Light FEC) |
| Profile 10 2048 QAM |
Table 26 PTP 820F Radio Profiles for Microwave RFU's
| Profile Modulation | |
| Profile 0 BPSK | |
| Profile 1 QPSK | |
| Profile 2 8 PSK | |
| Profile 3 16 QAM | |
| Profile 4 32 QAM | |
| Profile 5 64 QAM | |
| Profile 6 128 QAM | |
| Profile 7 256 QAM | |
| Profile 8 512 QAM | |
| Profile 9 1024 QAM (Strong FEC) | |
| Profile 10 1024 QAM (Light FEC) | |
| Profile 11 2048 QAM | |
| Profile 12 4096 QAM |
Table 27 PTP 820F Radio Profiles for RFU-E
| Profile Modulation |
| Profile 0 BPSK |
| Profile 1 QPSK |
| Profile 2 8 PSK |
| Profile 3 16 QAM |
| Profile 4 32 QAM |
| Profile 5 64 QAM |
| Profile 6 128 QAM |
| Profile 7 256 QAM |
| Profile 8 512 QAM |
| Profile 9 1024 QAM |
Table 24 describes the MRMC Symmetrical Scripts page parameters.
Table 28 MRMC Symmetrical Scripts Page Parameters
| Profile Modulation | |
| Script ID | A unique ID assigned to the script in the system. |
| Channel bandwidth (MHz) | The script's channel bandwidth (channel spacing). |
| Occupied bandwidth (MHz) | The script's occupied bandwidth. |
| Script Name The script's name. | |
| ACM Support | Indicates whether the script supports Adaptive Coding Modulation (ACM). In ACM mode, a range of profiles determines Tx and Rx rates. This allows the radio to modify its transmit and receive levels in response to environmental conditions. |
| Symmetry | Indicates that the script is symmetrical (Normal). Only symmetrical scripts are supported in the current release. |
| Standard | Indicates whether the script is compatible with ETSI or FCC (ANSI) standards, or both. |
Profile Modulation
| MRMC Script operational mode | The ACM mode: Fixed or Adaptive.Fixed ACM mode applies constant TX and RX rates.However, unlike regular scripts, with a Fixed ACM script you can specify a maximum profile to inhibit inefficient transmission levels.In Adaptive ACM mode, TX and RX rates are dynamic. An ACM-enabled radio system automatically chooses which profile to use according to the channel fading conditions. |
| MRMC Script profile | Fixed ACM mode only: The profile in which the system will operate. |
| MRMC Script maximum profile | Adaptive ACM mode only: The maximum profile for the script. For example, if you select a maximum profile of 5, the system will not climb above profile 5, even if channel fading conditions allow it. |
| MRMC Script minimum profile | Adaptive ACM mode only: The minimum profile for the script. For example, if you select a minimum profile of 3, the system will not go below profile 3 regardless of the channel fading conditions. The minimum profile cannot be greater than the maximum profile, but it can be equal to it. |
Enabling ACM with Adaptive Transmit Power
This feature requires:
- ACM script
- When working with RFU-C, requires RFU software version 2.17 or above
When planning ACM-based radio links, the radio planner attempts to apply the lowest transmit power that will perform satisfactorily at the highest level of modulation. During fade conditions requiring a modulation drop, most radio systems cannot increase transmit power to compensate for the signal degradation, resulting in a deeper reduction in capacity. The PTP 820G is capable of adjusting power on the fly, and optimizing the available capacity at every modulation point.
To enable ACM with adaptive transmit power:
1 Select Radio > Radio Parameters. The Radio Parameters page opens (Figure 39).
2 Select the carrier in the Radio table and click Edit. A separate configuration page opens (Figure 40).
3 In the Adaptive TX power admin field, select Enable.
4 Click Apply, then Close. When you open the configuration page again, the Adaptive TX power operational status field should now indicate Up to indicate that the feature is fully functional.

Note
Adaptive TX Power only operates when the MRMC scriptis configured to Adaptive mode. If the script is configured to Fixed mode (or Adaptive mode with the Minimum and Maximum Profile set to the same value), you can set Adaptive TX Power to Enable, but the Adaptive TX power operational status field will indicate Down.
Operating in FIPS Mode
PTP 820G can be configured to be FIPS 140-2-compliant in specific hardware and software configurations, as described in this section.

Note
FIPS 140-2 compliance is only available with the PTP 820 Assured platform. ^3
FIPS validation by NIST can be found from below link:
http://csrc.nist.gov/groups/STM/cmvp/documents/140-1/140val-all.htm (Certificate #2752).
Requirements for FIPS Compliance
It is the responsibility of the customer to ensure that these requirements are met.
For PTP 820G node to be FIPS-compliant, the chassis must be FIPS-compliant.

Note
To display the part numbers of the hardware components of PTP 820 unit, see Displaying Unit Inventory.
PTP 820G unit redundancy configurations can be configured to be FIPS 140-2 compliant. This requires encryption of the protection link between the two units. See Encrypting the External ProtectionLink.
Special labels must be affixed to a FIPS-compliant PTP 820G unit. These labels are tamper-evident and must be applied in such a way that it is not possible to open the chassis. These labels must be replaced whenever components are added to or removed from the unit. Replacement labels can be ordered from Cambium Networks. Tamper-evident labels should be inspected for integrity at least once every six months. For further details, refer to the PTP 820G Installation Guide.
Enabling FIPS ModeTo set the unit to operate in FIPS mode:
1 Select Platform > Security > General > Configuration. The Security General Configuration page opens.
Figure 53 Security General Configuration Page
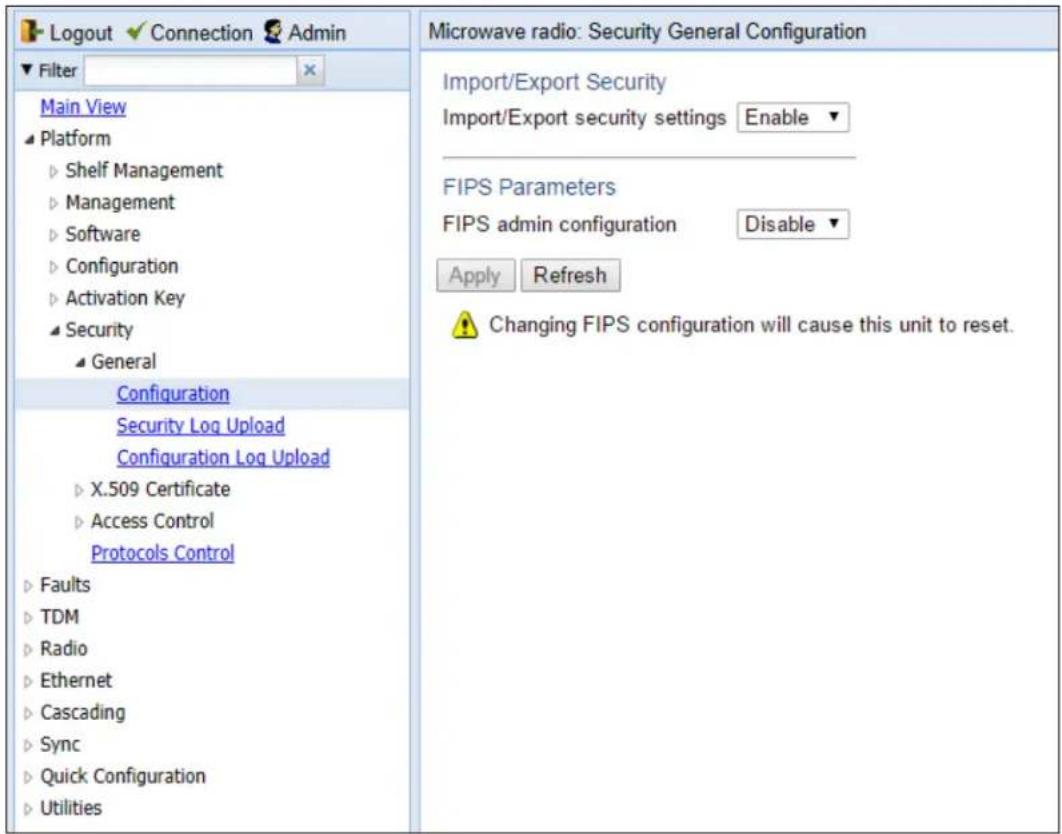
2 The Import/Export security settings field determines whether security configurations are included in configuration backup files. To enhance unit security, it is recommended to select Enable in this field, so that security configurations will not be included in backup files. When you are finished, click Apply.
3 In the FIPS admin configuration field, select Enable.
4 Click Apply.

Note
Changing the FIPS configuration causes a unit reset..
After enabling FIPS:
• The MD5 option for SNMPv3 is blocked.
- After any system reset, the length of time before users can log back into the system is longer than usual due to FIPS-related self-testing.
For a full list of FIPS requirements, including software configuration requirements, refer to the Cambium PTP 820 FIPS 140-2 Security Policy, available upon request.
Encrypting the External Protection Link
For PTP 820G unit redundancy configurations, the external protection link must be encrypted using IPsec. This encrypts all IP packets that pass between the management ports of the two PTP 820G units.
IPsec uses a 32-character pre-shared key. The pre-shared key is a 32-byte symmetric encryption key. The same pre-shared key must be configured on both ends of the encrypted link.
IPsec encryption is automatically enabled when FIPS mode is enabled. However, it is enabled with a default value: protectionpresharedkey0123456789.
If this default value is not changed, the following alarm is triggered:
• 5113 – Protection Pre-Shared-Key has the default value
Initial Configuration of FIPS-Compliant Unit Redundancy Configuration
To set up an PTP 820G unit redundancy configuration that is FIPS 140-2-compliant, you must follow these steps:
1 Configure and enable unit redundancy on both units. See Configuring Unit Redundancy for the PTP 820G.
2 Enable FIPS on both PTP 820G units. See Enabling FIPS Mode.
When you enable FIPS mode, IPsec encryption will automatically be enabled on the protection link, using the default protection pre-shared key. Alarm 5113 will be raised.
3 Verify that there is no Configuration Mismatch alarm by checking in the Faults > Current Alarms page. If a Configuration Mismatch alarm is present, you must clear the alarm before configuring a new pre-shared key. Otherwise, the key will not be copied to the Standby unit.

Note
You can use the following CLI command to display a list of mismatched parameters:
root> platform management protection show mismatch details.
4 Configure a new pre-shared key on the active unit. To configure a protection key:
i Verify that the web interface protocol for accessing the unit is configured to HTTPS. See Configuring X.509 CSR Certificates and HTTPS.
ii Select Platform > Unit Redundancy. The Unit Redundancy page opens.
Figure 54 Unit Redundancy Page
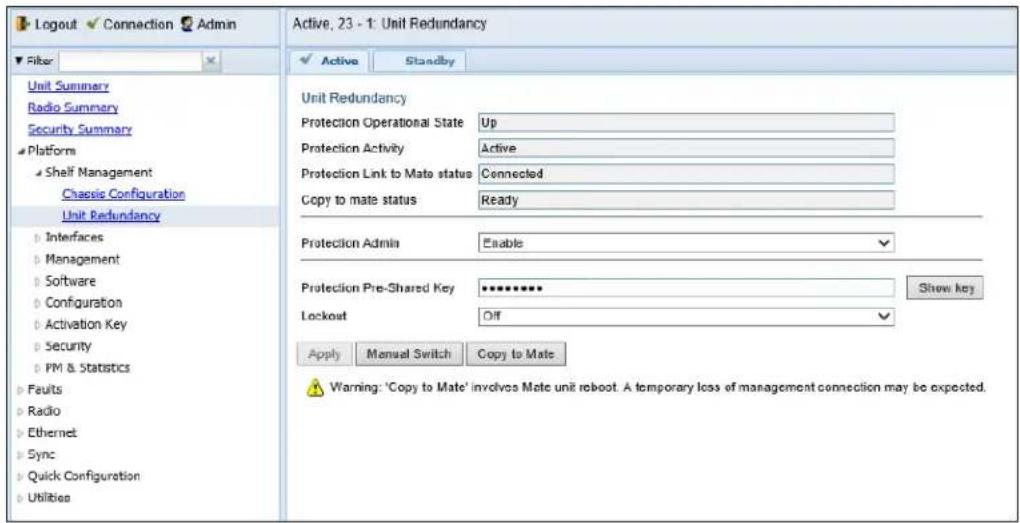
iii In the Protection Pre-Shared Key field, enter a 32-character key. The key must be exactly 32 characters.
iv Click Apply. The key is automatically copied to the standby unit.

Note
Communication with the standby unit may be lost for a few seconds while the key is being copied.
To clear the user-defined protection pre-shared key and restore it to its default value, enter the following CLI command in root view:
root> platform management protection clear pre-shared-key.
Replacing a Unit in a FIPS-Compliant Unit Redundancy Configuration
If it becomes necessary to replace a unit in a FIPS 140-2-compliant unit redundancy configuration, you must preconfigure the replacement unit as follows:
1 Enable FIPS on the replacement unit. See Enabling FIPS Mode.
2 Configure the protection pre-shared key on the replacement unit. See Initial Configuration of FIPS-Compliant Unit Redundancy Configuration, Step 3.
3 Configure and enable unit redundancy on the replacement unit. See Configuring Unit Redundancy for the PTP 820G.
4 Perform copy-to-mate. See Configuring Unit Redundancy.
Configuring Grouping (Optional)
At this point in the configuration process, you should configure any interface groups that need to be set up according to your network plan. For details on available grouping and other configuration options, as well as configuration instructions, see System Configurations.
Creating Service(s) for Traffic
In order to pass traffic through the PTP 820G, and PTP 820F you must configure Ethernet and/or TDM traffic services. For configuration instructions, see:
- Configuring Ethernet Service(s)
- Configuring Native TDM Trails
- Configuring TDM Pseudowire Services
Chapter 3: Configuration Guide
This section includes:
- System Configurations
- Configuring a 1+0 Link
- Configuring Multi-Carrier ABC
- Configuring Link Aggregation (LAG)
- Configuring XPIC
- Configuring HSB Radio Protection
System Configurations
This section lists basic system configurations and their prerequisites, with links to configuration instructions.
This section includes:
- Radio Configurations
• TDM Configurations

Note
For an up-to-date description of feature and configuration limitations, refer to the Release Notes for the version that you are using.
Radio Configurations
A PTP 820G or PTP 820F system can be used in the following radio configurations.

Note
One Multi-Carrier ABC group can be configured per unit.
PTP 820F Radio Configurations
Table 29 PTP 820F Radio Configurations
| Configuration | Supported Products | Link to Configuration Instructions |
| 1+0 | Configuring a 1+0 LinkConfiguring a Link Using the Quick Configuration Wizard | |
| 2+0 Single Polarization | Requires Multi-Carrier ABC or LAG | Configuring Multi-Carrier ABCConfiguring Link Aggregation (LAG) and LACP. |
| 2+0 Dual Polarization (XPIC) | Requires Multi-Carrier ABC or LAG | Configuring XPICConfiguring Multi-Carrier ABCConfiguring XPIC Configuring Link Aggregation (LAG) and LACP. |
Table 30 PTP 820G Radio Configurations
| Configuration | Supported Products | Link to Configuration Instructions |
| 1+0 | Configuring a 1+0 LinkConfiguring a Link Using the QuickConfiguration Wizard | |
| 1+0 IF Combining | Requires 1500HP | Configuring IF Combining |
| 2+0 Single Polarization | Requires Multi-Carrier ABC or LAG | Configuring Multi-Carrier ABC. Configuring Link Aggregation (LAG) and LACP. |
| 2+0 Dual Polarization (XPIC) | Requires Multi-Carrier ABC or LAG | Configuring XPIC.Configuring Multi-Carrier ABC. Configuring Link Aggregation (LAG) and LACP. |
| 1+1 HSB Protection | Configuring HSB Radio ProtectionConfiguring a Link Using the QuickConfiguration Wizard | |
| 1+1 HSB Protection with BBS Space Diversity | Requires Multi-Carrier ABC | Configuring HSB Radio ProtectionConfiguring Multi-Carrier ABC. |
TDM Configurations
PTP 820G/ PTP 820F provide integrated support for transportation of TDM (E1/DS1) services with integrated E1/DS1 interfaces.
Two types of TDM services are supported using the same hardware:
- Native TDM trails.
• TDM Pseudowire services (enabling interoperability with third party packet/PW equipment).
PTP 820G and PTP 820F also offer hybrid Ethernet and TDM services. Hybrid services can utilize either Native TDM or pseudowire.
PTP 820G and PTP 820F offer a variety of path protection options.
Table 27 lists the basic TDM configuration options, with links to configuration instructions.
Table 31 TDM Configurations
| Configuration Special Requirements | Link to Configuration Instructions | |
| Native TDM Services | Requires fixed E1/DS1 interface. | Configuring Native TDM Trails |
| Native TDM Services with Path Protection | Requires fixed E1/DS1 interface. | Configuring Native TDM Trails |
| Pseudowire TDM Services | Requires fixed E1/DS1 interface. | Configuring TDM Pseudowire Services |
| Pseudowire TDM Services with Path Protection | Requires fixed E1/DS1 interface. | Configuring TDM Pseudowire Services |
Configuring a Link Using the Quick Configuration Wizard
The Web EMS provides wizards to configure radio links. The wizards guide you through configuration of the basic radio parameters and services necessary to establish a working pipe link. The following link types can be configured with the Quick Configuration wizard:
- 1+0 – Configures a 1+0 radio link consisting of a user-selected Ethernet (or LAG) and radio interface connected. This link passes traffic between the radio and Ethernet interfaces via a point-to-point pipe service. See Configuring a 1+0 Link Using the Quick Configuration Wizard.
- 1+0 Repeater – Configures a 1+0 radio link that passes traffic between two user-selected radios via a point-to-point pipe service. This type of link is used to configure a node that functions as a repeater, passing traffic between two other nodes. See Configuring a 1+0 (Repeater) Link Using the Quick Configuration Wizard.
- 1+1 HSB – PTP 820G only. Configures a 1+1 HSB radio link consisting of a user-selected Ethernet interface or LAG and two radio interfaces in a 1+1 HSB configuration, one active and one standby. This link passes traffic between the active radio interface and the Ethernet interface via a point-to-point pipe service. See Configuring a 1+1 HSB Link Using the Quick Configuration Wizard. For a detailed explanation of 1+1 HSB and its requirements, see Configuring HSB Radio Protection.
- 1+1 HSB-SD – PTP 820G only. Configures a 1+1 HSB radio link with Space Diversity, consisting of a user-selected Ethernet interface or LAG and two radio interfaces in a 1+1 HSB configuration, one primary/active and one diversity/standby. This link passes traffic between the radio interfaces and the Ethernet interface via a point-to-point pipe service. See Configuring a 1+1 HSB-SD Link Using the Quick Configuration Wizard. For a detailed explanation of 1+1 HSB-SD and its requirements, see Configuring HSB Radio Protection.
- N+0 Multi-Carrier ABC – Configures a 2 + 0 Multi-Carrier ABC group consisting of an Ethernet interface or LAG and the two radio interfaces. See Configuring an N+0 Multi-Carrier ABC Link Using the Quick Configuration Wizard. For a detailed explanation of Multi-Carrier ABC and its requirements, see Configuring Multi-Carrier ABC.
You can also use this wizard to configure XPIC between the radios within the Multi-Carrier ABC group. For a detailed explanation of XPIC and its requirements, see Configuring XPIC.
Because the Quick Configuration wizard creates Pipe links, you cannot add an interface to a link using the Quick Configuration wizard if any service points are attached to the interface prior to configuring the link. See Deleting a Service Point.
Configuring a 1+0 Link Using the Quick Configuration Wizard
To configure a 1+0 link using the Quick Configuration wizard:
1 Select Quick Configuration > PIPE > Single Carrier > 1+0. Page 1 of the 1+0 Quick Configuration wizard opens.
Figure 55 1+0 Quick Configuration Wizard (PTP 820G) – Page 1
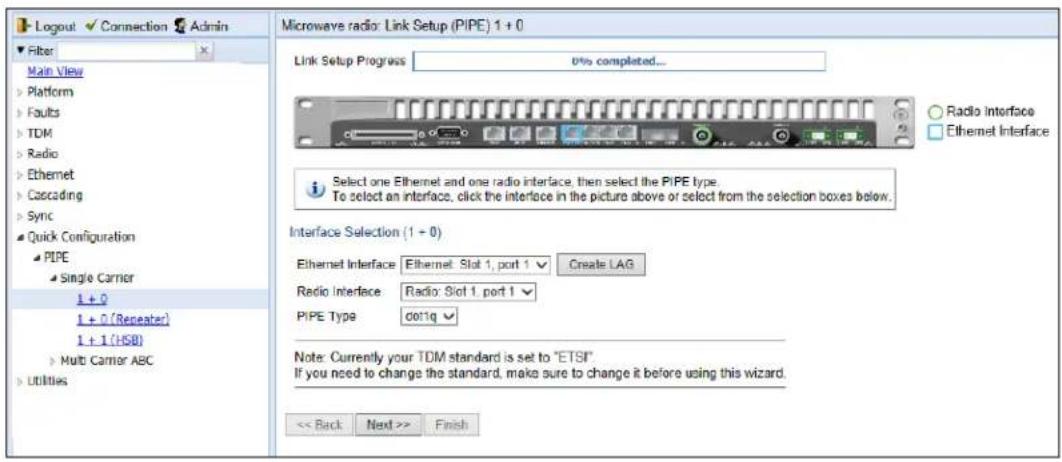
Figure 56 1+0 Quick Configuration Wizard (PTP 820F) – Page 1
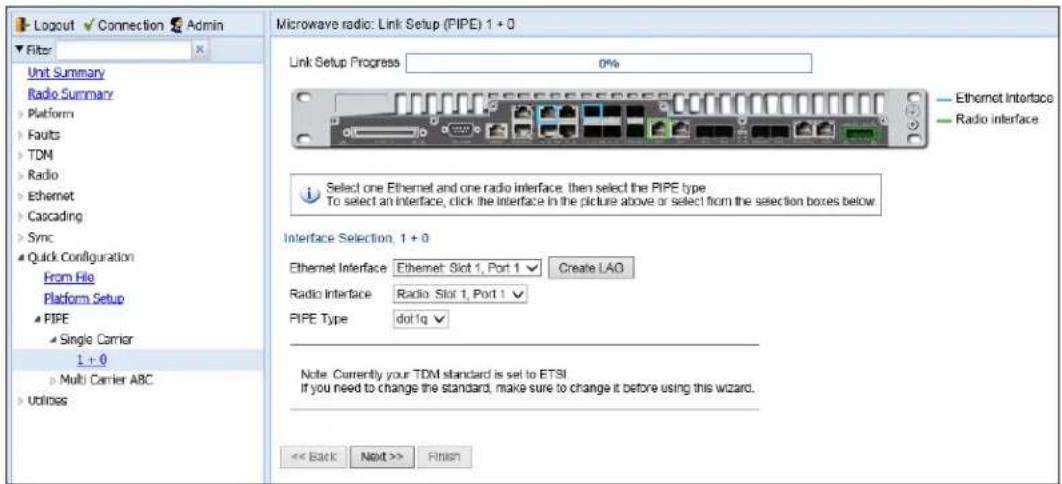
2 In the Ethernet Interface field, select an Ethernet interface or a LAG for the link. Alternatively, click the interface in the graphical representation of the unit. The selected interface is surrounded by a blue square, as shown in Figure 49 and Figure 50

Note
To create a LAG, click Create LAG. The Create LAG Group page opens. For instructions on creating LAG groups, see Configuring Link Aggregation (LAG) and LACP
3 In the Radio Interface field, select a radio interface for the link. Alternatively, click the interface in the graphical representation of the unit. The selected interface is surrounded by a green circle, as shown in Figure 49 and Figure 50
4 In the Pipe Type field, select the Attached Interface type for the service that will connect the radio and Ethernet interfaces. Options are:
- s-tag – A single S-VLAN is classified into the service points.
- dot1q - A single C-VLAN is classified into the service points.

Note
For a full explanation of Ethernet Services, service types, and attached interface types, see Configuring Ethernet Service(s).
5 Click Next. Page 2 of the 1+0 Quick Configuration wizard opens.
Figure 57 1+0 Quick Configuration Wizard (PTP 820G) – Page 2

Figure 58 1+0 Quick Configuration Wizard (PTP 820F) – Page 2

6 In the TX Frequency (MHz) field, set the transmission radio frequency in MHz.
7 In the RX Frequency (MHz) field, set the received radio frequency in MHz.
8 In the TX Level (dBm) field, enter the desired TX signal level (TSL). The range of values depends on the frequency and RFU type.
9 To mute the TX output of the RFU, select Mute in the TX mute field. To unmute the TX output of the RFU, select Unmute. To configure a timed mute, select Mute with Timer.
If you select Mute with Timer, an additional field appears: Mute timeout (minutes). This field defines a timer for the mute, in minutes (1-1440). When the timer expires, themute automatically ends. This provides a fail-safe mechanism for maintenance operations that eliminates the possibility of accidentally leaving the radio muted after the maintenance has been completed. By default, the timer is 10 minutes.
Configuration Parameters
TX Mute
Mute With Timer ▼
Mute timeout (minutes)
10 ▼

Note
In contrast to an ordinary mute, a timed mute is not persistent. This means that if the unit is reset, the radio is not muted when the unit comes back online, even if the timer had not expired. Also, in unit and radio protection configurations, a timed mute is not copied to the mate unit or radio, and no mismatch alarm is raised if a timed mute is configured on only one radio in the protection pair.
10 Click Next. Page 3 of the 1+0 Quick Configuration wizard opens.
Figure 59 1+0 Quick Configuration Wizard (PTP 820G) – Page 3

Figure 60 1+0 Quick Configuration Wizard (PTP 820F) – Page 3
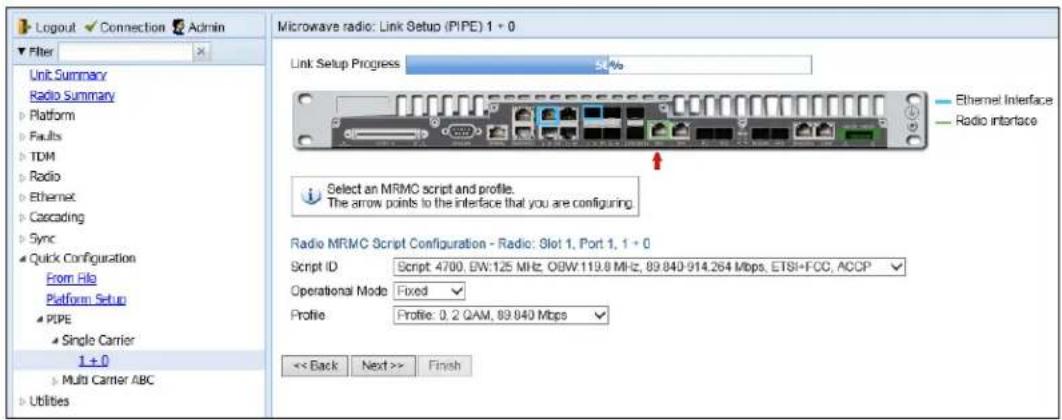
11 In the Script ID field, select the MRMC script you want to assign to the radio. For a full explanation of choosing an MRMC script, see Configuring the Radio (MRMC) Script(s).
12 In the Operational Mode field, select the ACM mode: Fixed or Adaptive.
Fixed ACM mode applies constant TX and RX rates. However, unlike regular scripts, with a Fixed ACM script you can specify a maximum profile to inhibit inefficient transmission levels.
In Adaptive ACM mode, TX and RX rates are dynamic. An ACM-enabled radio system automatically chooses which profile to use according to the channel fading conditions.
13 Do one of the following:
- If you selected Fixed in the Operational Mode field, the next field is Profile. Select the ACM profile for the radio in the Profile field.
• If you selected Adaptive in the Operational Mode field, the following two fields are displayed:
o Maximum profile – Enter the maximum profile for the script. See Configuring the Radio (MRMC) Script(s).
o Minimum profile – Enter the minimum profile for the script. See Configuring the Radio (MRMC) Script(s).
14 Click Next. Page 4 of the 1+0 Quick Configuration wizard opens.
Figure 61 1+0 Quick Configuration Wizard (PTP 820G) – Page 4

Figure 62 1+0 Quick Configuration Wizard (PTP 820F) – Page 4
15 In the In Band Management field, select Yes to configure in-band management, or No if you do not need in-band management. If you select Yes, the Management VLAN field appears.
16 If you selected Yes in the In Band Management field, select the management VLAN in the Management VLAN field.
17 If you want to use the Ethernet interface as well as the radio interface for in-band management, select In Band includes Ethernet interface.
18 Click Finish. Page 5 of the 1+0 Quick Configuration wizard opens. This page displays the parameters you have selected for the link.
Figure 63 1+0 Quick Configuration Wizard – Page 5 (Summary Page)

19 To complete configuration of the link, click Submit. If you want to go back and change any of the parameters, click Back. After you click Submit, the unit is reset.
Configuring a 1+0 (Repeater) Link Using the Quick Configuration Wizard
To configure a 1+0 repeater (radio-to-radio) link using the Quick Configuration wizard:
- Select Quick Configuration > PIPE > Single Carrier > 1+0 (Repeater). Page 1 of the 1+0 Repeater Quick Configuration wizard opens.
Figure 64 1+0 Repeater Quick Configuration Wizard (PTP 820G) – Page 1
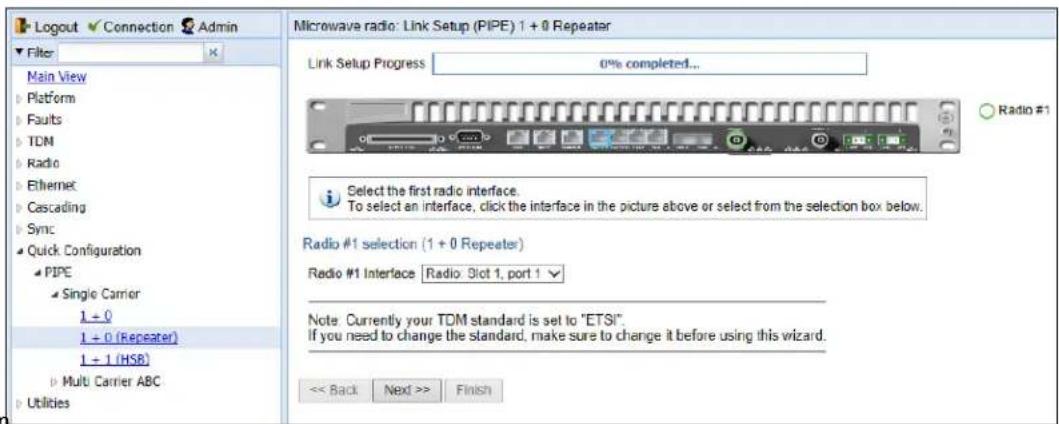
2.
the Radio #1 Interface field, select the first radio interface for the link. Alternatively, click the interface in the graphical representation of the unit. The selected interface is surrounded by a green circle, as shown in Figure 58.
- Click Next. Page 2 of the 1+0 Repeater Quick Configuration wizard opens.
Figure 65 1+0 Repeater Quick Configuration Wizard (PTP 820G) – Page 2

- In the Radio #2 Interface field, select the second radio interface for the link. Alternatively, click the interface in the graphical representation of the unit. The selected interface is surrounded by a blue circle, as shown in Figure 59.
- In the Pipe Type field, select the Attached Interface type for the service that will connect the radios. Options are:
- s-tag – All S-VLANs and untagged frames are classified into the service.
- dot1q - All C-VLANs and untagged frames are classified into the service.

Note
For a full explanation of Ethernet Services, service types, and attached interface types, see Configuring Ethernet Service(s).
- Click Next. Page 3 of the 1+0 Repeater Quick Configuration wizard opens.
Figure 66 1+0 Repeater Quick Configuration Wizard (PTP 820G) – Page 3

-
For each interface, configure the following radio parameters. The red arrow points to the interface you are configuring. For example, in Figure 60, the user is configuring Radio 1
-
In the TX Frequency (MHz) field, set the transmission radio frequency for the first radio in MHz.
-
In the RX Frequency (MHz) field, set the received radio frequency for the first radio in MHz.
-
In the TX Level (dBm) field, enter the desired TX signal level (TSL) for the first radio. The range of values depends on the frequency and RFU type.
-
To mute the TX output of the RFU, select On in the TX mute field. To unmute the TX output of the RFU, select Off.
-
Click Next. Page 4 of the 1+0 Repeater Quick Configuration wizard opens.
Figure 67 1+0 Repeater Quick Configuration Wizard (PTP 820G) – Page 4

-
For each interface, configure the following MRMC script parameters. The red arrow points to the interface you are configuring. For example, in Figure 62, the user is configuring Radio 2.
-
In the Script ID field, select the MRMC script you want to assign to the first radio. For a full explanation of choosing an MRMC script, see Configuring the Radio (MRMC) Script(s).
-
In the Operational Mode field, select the ACM mode for the first radio: Fixed or Adaptive.
- Fixed ACM mode applies constant TX and RX rates. However, unlike regular scripts, with a Fixed ACM script you can specify a maximum profile to inhibit inefficient transmission levels.
- In Adaptive ACM mode, TX and RX rates are dynamic. An ACM-enabled radio system automatically chooses which profile to use according to the channel fading conditions.
- Do one of the following:
- If you selected Fixed in the Operational Mode field, the next field is Profile. Select the ACM profile for the radio in the Profile field.
- If you selected Adaptive in the Operational Mode field, following two fields are displayed:
- Maximum profile – Enter the maximum profile for the script. See Configuring the Radio (MRMC) Script(s).
- Minimum profile – Enter the minimum profile for the script. See Configuring the Radio (MRMC) Script(s).
- Click Next. Page 5 of the 1+0 Repeater Quick Configuration wizard opens.
Figure 68 1+0 Repeater Quick Configuration Wizard (PTP 820G) – Page 5
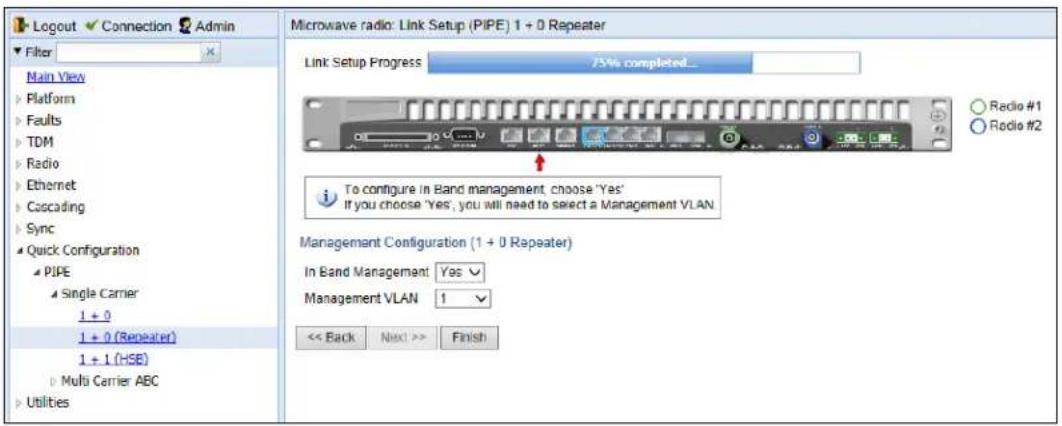
-
In the In Band Management field, select Yes to configure in-band management, or No if you do not need in-band management. If you select Yes, the Management VLAN field appears.
-
If you selected Yes in the In Band Management field, select the management VLAN in the Management VLAN field. Management will be available through both radio interfaces.
-
Click Finish. Page 6 of the 1+0 Repeater Quick Configuration wizard opens. This page displays the parameters you have selected for the link.
Figure 69 1+0 Repeater Quick Configuration Wizard – Page 6 (Summary Page)

- To complete configuration of the link, click Submit. If you want to go back and change any of the parameters, click Back. After you click Submit, the unit is reset.
Configuring a 1+1 HSB Link Using the Quick Configuration Wizard

Note
PTP 820G only.
To configure a 1+1 HSB link using the Quick Configuration wizard:
1 Select Quick Configuration > PIPE > Single Carrier > 1+1 (HSB). Page 1 of the 1+1 Quick Configuration wizard opens.
Figure 70 1+1 HSB Quick Configuration Wizard (PTP 820G) – Page 1

2 In the Ethernet Interface field, select an Ethernet interface or a LAG for the link. Alternatively, click the interface in the graphical representation of the unit. The selected interface is surrounded by a blue square, as shown in Figure 64.

Note
To create a LAG, click Create LAG. The Create LAG Group page opens. For instructions on creating LAG groups, see Configuring Link Aggregation (LAG) and LACP.
3 In the Radio #1 Interface field, select a radio interface for the link. Alternatively, click the interface in the graphical representation of the unit. The selected interface is surrounded by a green circle, as shown in Figure 64. This interface will be the Active radio in the protection group.
4 In the Pipe Type field, select the Attached Interface type for the service that will connect the radio and Ethernet interfaces. Options are:
o s-tag – All S-VLANs and untagged frames are classified into the service.
- dot1q - All C-VLANs and untagged frames are classified into the service.

Note
For a full explanation of Ethernet Services, service types, and attached interface types, see Configuring Ethernet Service(s).
5 Click Next. Page 2 of the 1+1 HSB Quick Configuration wizard opens.
Figure 71 1+1 HSB Quick Configuration Wizard (PTP 820G) – Page 2
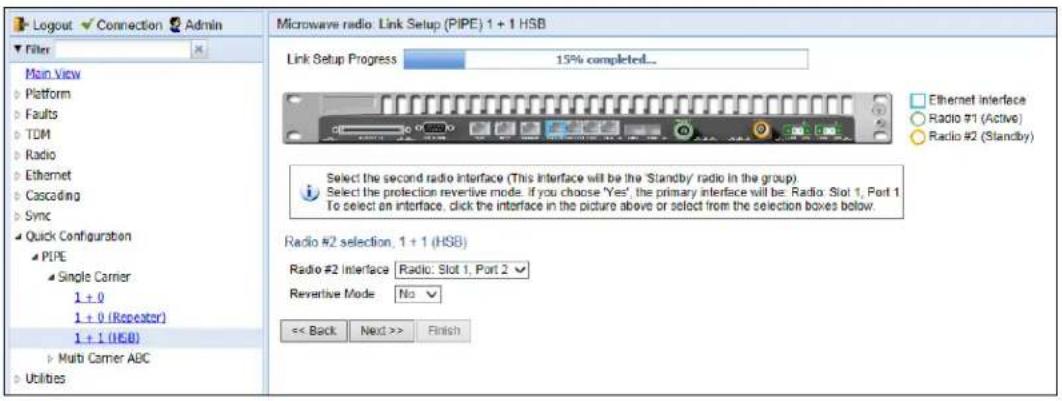
6 In the Radio #2 Interface field, select the Standby radio interface for the link. Alternatively, click the interface in the graphical representation of the unit. The selected interface is surrounded by an orange circle, as shown in Figure 65. This interface will be the Standby radio in the protection group.
7 In the Revertive Mode field, select Yes or No to determine whether or not the HSB radio protection group will operate in revertive mode. When revertive mode is enabled, following a switchover the system initiates a revertive protection switchover back to the original receiver ten minutes after proper link and/or equipment conditions are restored. This ensures that the primary path is used whenever possible.
8 Click Next. Page 3 of the 1+1 HSB Quick Configuration wizard opens.
Figure 72 1+1 HSB Quick Configuration Wizard (PTP 820G) – Page 3
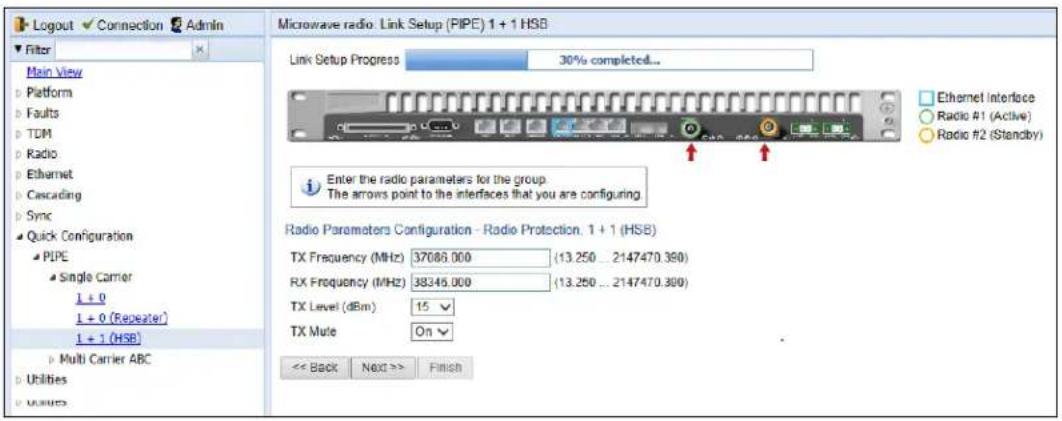
9 In the TX Frequency (MHz) field, set the transmission radio frequency in MHz.
10 In the RX Frequency (MHz) field, set the received radio frequency in MHz.
11 In the TX Level (dBm) field, enter the desired TX signal level (TSL). The range of values depends on the frequency and RFU type.
12 To mute the TX output of the RFU, select On in the TX mute field. To unmute the TX output of the RFU, select Off.

Note
The frequency settings are applied to both the Active and the Standby radios. However, the TX Level and Mute settings are applied only to the Active radio. You must manually set the TX Level and unmute the Standby radio in order for 1+1 protection to function. See Configuring the Radio Parameters.
13 Click Next. Page 4 of the 1+1 HSB Quick Configuration wizard opens.
Figure 73 1+1 HSB Quick Configuration Wizard (PTP 820G) – Page 4

14 In the Script ID field, select the MRMC script you want to assign to the radios. For a full explanation of choosing an MRMC script, see Configuring the Radio (MRMC) Script(s).
15 In the Operational Mode field, select the ACM mode: Fixed or Adaptive.
- Fixed ACM mode applies constant TX and RX rates. However, unlike regular scripts, with a Fixed ACM script you can specify a maximum profile to inhibit inefficient transmission levels.
In Adaptive ACM mode, TX and RX rates are dynamic. An ACM-enabled radio system automatically chooses which profile to use according to the channel fading conditions.
16 Do one of the following:
If you selected Fixed in the Operational Mode field, the next field is Profile. Select the ACM profile for the radio in the Profile field.
- If you selected Adaptive in the Operational Mode field, following fields are displayed:
- Maximum Profile - Enter the maximum profile for the script. See Configuring the Radio (MRMC) Script(s).
- Minimum Profile - Enter the minimum profile for the script. See Configuring the Radio (MRMC) Script(s)
17 Click Next. Page 5 of the 1+1 HSB Quick Configuration wizard opens.
Figure 74 1+1 HSB Quick Configuration Wizard (PTP 820G) – Page 5

18 In the In Band Management field, select Yes to configure in-band management, or No if you do not need in-band management. If you select Yes, the Management VLAN field appears.
19 If you selected Yes in the In Band Management field, select the management VLAN in the Management VLAN field.
20 If you want to use the Ethernet interface as well as the radio interface for in-band management, select In Band includes Ethernet interface.
21 Click Next. Page 6 of the 1+1 HSB Quick Configuration wizard opens. This page displays the parameters you have selected for the link.
Figure 75 1+1 HSB Quick Configuration Wizard – Page 6 (Summary Page)

22 To complete configuration of the link, click Submit. If you want to go back and change any of the parameters, click Back. After you click Submit, the unit is reset.
Configuring a 1+1 HSB-SD Link Using the Quick Configuration Wizard

Note
1+1 HSB-SD configurations are only available for PTP 820G units.
To configure a 1+1 HSB-SD link using the Quick Configuration wizard:
1 Select Quick Configuration > PIPE > Multi Carrier ABC > 1+1 (HSB-SD). Page 1 of the 1+1 Multi Carrier ABC HSB-SD Quick Configuration wizard opens.
Figure 76 1+1 Multi Carrier ABC HSB-SD Quick Configuration Wizard – Page 1
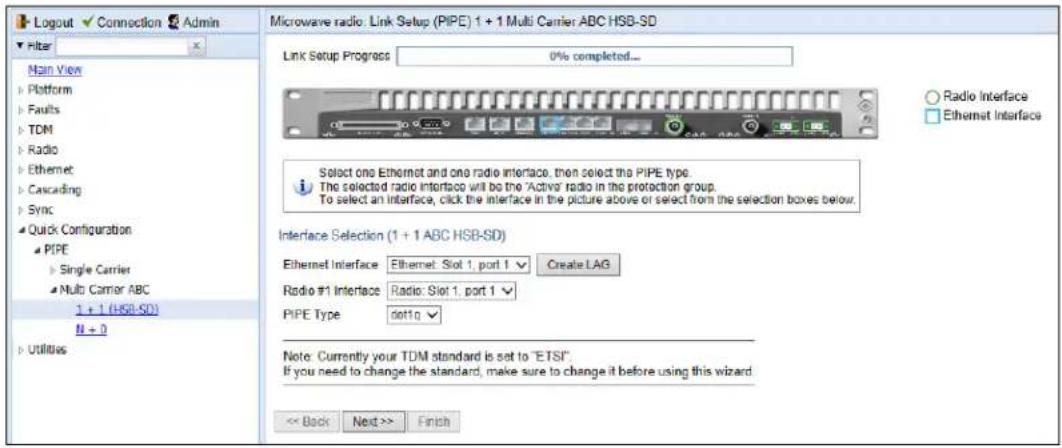
2 In the Ethernet Interface field, select an Ethernet interface or a LAG for the link. Alternatively, click the interface in the graphical representation of the unit. The selected interface is surrounded by a blue square, as shown in Figure 70.

Note
To create a LAG, click Create LAG. The Create LAG Group page opens. For instructions on creating LAG groups, see Configuring Link Aggregation (LAG) and LACP.
3 In the Radio #1 Interface field, select a radio interface for the link. Alternatively, click the interface in the graphical representation of the unit. The selected interface is surrounded by a green circle, as shown in Figure 70. This interface will be the Active radio in the protection group.
4 In the Pipe Type field, select the Attached Interface type for the service that will connect the radio and Ethernet interfaces. Options are:
- s-tag – All S-VLANs and untagged frames are classified into the service.
- dot1q - All C-VLANs and untagged frames are classified into the service.

Note
For a full explanation of Ethernet Services, service types, and attached interface types, see Configuring Ethernet Service(s).
5 Click Next. Page 2 of the 1+1 Multi Carrier ABC HSB-SD Quick Configuration wizard opens.
Figure 77 1+1 Multi Carrier ABC HSB-SD Quick Configuration Wizard – Page 2
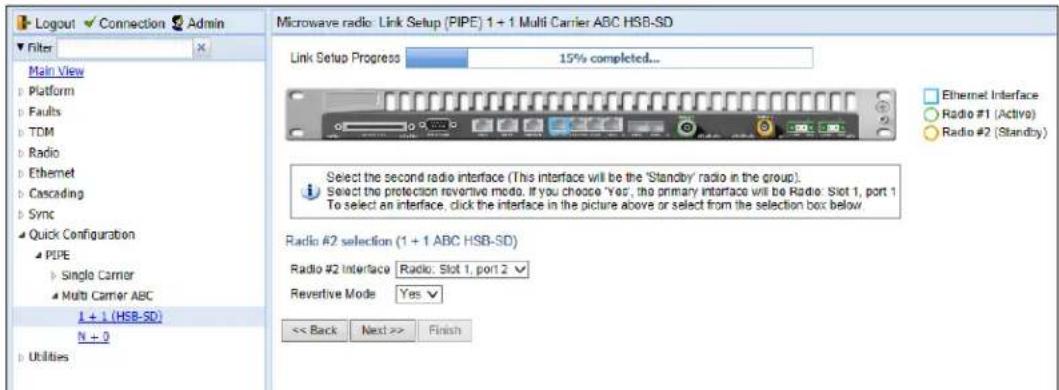
6 In the Radio #2 Interface field, select the Standby radio interface for the link. Alternatively, click the interface in the graphical representation of the unit. The selected interface is surrounded by an orange circle, as shown in Figure 71. This interface will be the Standby radio in the protection group.
7 In the Revertive Mode field, select Yes or No to determine whether or not the HSB radio protection group will operate in revertive mode. When revertive mode is enabled, following a switchover the system initiates a revertive protection switchover back to the original receiver ten minutes after proper link and/or equipment conditions are restored. This ensures that the primary path is used whenever possible.
8 Click Next. Page 3 of the 1+1 Multi Carrier ABC HSB-SD Quick Configuration wizard opens.
Figure 78 1+1 Multi Carrier ABC HSB-SD Quick Configuration Wizard – Page 3

9 In the TX Frequency (MHz) field, set the transmission radio frequency in MHz.
10 In the RX Frequency (MHz) field, set the received radio frequency in MHz.
11 In the TX Level (dBm) field, enter the desired TX signal level (TSL). The range of values depends on the frequency and RFU type.
12 To mute the TX output of the RFU, select Mute in the TX mutefield. To unmute the TX output of the RFU, select Unmute. To configure a timed mute, select Mute with Timer.
If you select Mute with Timer, an additional field appears: Mute timeout (minutes). This field defines a timer for the mute, in minutes (1-1440). When the timer expires, the mute automatically ends. This provides a fail-safe mechanism for maintenance operations that eliminates the possibility of accidentally leaving the radio muted after the maintenance has been completed. By default, the timer is 10 minutes.


Note
In contrast to an ordinary mute, a timed mute is not persistent. This means that if the unit is reset, the radio is not muted when the unit comes back online, even if the timer had not expired. Also, in unit and radio protection configurations, a timed mute is not copied to the mate unit or radio, and no mismatch alarm is raised if a timed mute is configured on only one radio in the protection pair.
13 Click Next. Page 4 of the 1+1 Multi Carrier ABC HSB-SD Quick Configuration wizard opens.
Figure 79 1+1 Multi Carrier ABC HSB-SD Quick Configuration Wizard – Page 4

14 In the Script ID field, select the MRMC script you want to assign to the radios. For a full explanation of choosing an MRMC script, see Configuring the Radio (MRMC) Script(s).
15 In the Operational Mode field, select the ACM mode: Fixed or Adaptive.
- Fixed ACM mode applies constant TX and RX rates. However, unlike regular scripts, with a Fixed ACM script you can specify a maximum profile to inhibit inefficient transmission levels.
○ In Adaptive ACM mode, TX and RX rates are dynamic. An ACM-enabled radio system automatically chooses which profile to use according to the channel fading conditions.
16 Do one of the following:
- If you selected Fixed in the Operational Mode field, the next field is Profile. Select the ACM profile for the radio in the Profile field.
- If you selected Adaptive in the Operational Mode field, following two fields are displayed:
- Maximum Profile - Enter the maximum profile for the script. See Configuring the Radio (MRMC) Script(s).
- Minimum Profile - Enter the minimum profile for the script. See Configuring the Radio (MRMC) Script(s)
17 Click Next. Page 5 of the 1+1 Multi Carrier ABC HSB-SD Quick Configuration wizard opens.
Figure 80 1+1 Multi Carrier ABC HSB-SD Quick Configuration Wizard – Page 5
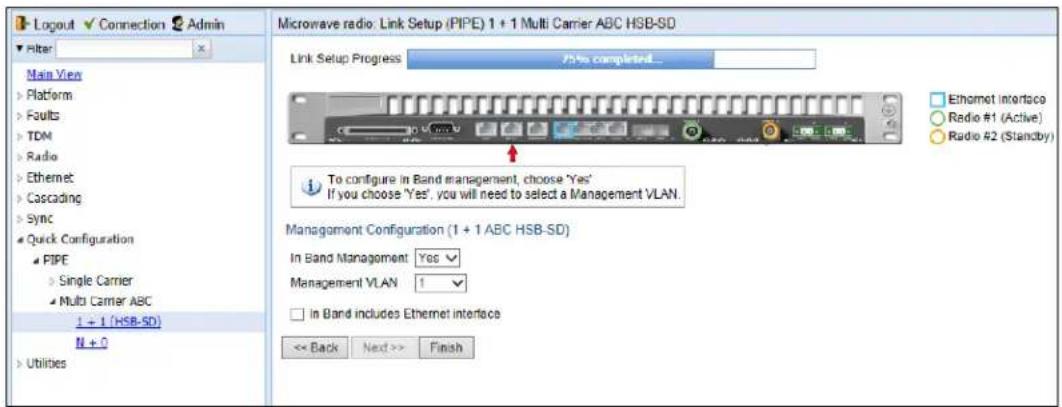
18 In the In Band Management field, select Yes to configure in-band management, or No if you do not need in-band management. If you select Yes, the Management VLAN field appears.
19 If you selected Yes in the In Band Management field, select the management VLAN in the Management VLAN field.
20 If you want to use the Ethernet interface as well as the radio interface for in-band management, select In Band includes Ethernet interface.
21 Click Finish. Page 6 of the 1+1 Multi Carrier ABC HSB-SD Quick Configuration wizard opens. This page displays the parameters you have selected for the link.
Figure 81 1+1 Multi Carrier ABC HSB-SD Quick Configuration Wizard – Page 6 (summary page)

22 To complete configuration of the link, click Submit. If you want to go back and change any of the parameters, click Back. After you click Submit, the unit is reset.
Configuring an N+0 Multi-Carrier ABC Link Using the Quick Configuration Wizard

Note
For PTP 820F, Multi-Carrier ABC requires a MultiCore RFU-D and can only be configured between the two radio carriers of the same RFU.
To configure an N+0 Multi-Carrier ABC link using the Quick Configuration wizard:
- Select Quick Configuration > PIPE > Multi Carrier ABC > N+0. Page 1 of the N + 0 Multi Carrier ABC Quick Configuration wizard opens.
Figure 82 N + 0 Multi Carrier ABC Quick Configuration Wizard (PTP 820G) – Page 1

Figure 83 N + 0 Multi Carrier ABC Quick Configuration Wizard (PTP 820F) – Page 1

- In the Ethernet Interface field, select an Ethernet interface or a LAG for the group. Alternatively, click the interface in the graphical representation of the unit. The selected interface is surrounded by a blue square, as shown in Figure 76.

Note
To create a LAG, click Create LAG. The Create LAG Group page opens. For instructions on creating LAG groups, see Configuring Link Aggregation (LAG) and LACP.
- In the Radio #1 Interface field, select the first radio interface for the group. Alternatively, click the interface in the graphical representation of the unit. The selected interface is surrounded by a blue circle, as shown in Figure 76.

Note
The Number of Radio Interfaces field is read-only.
-
In the Pipe Type field, select the Attached Interface type for the service that will connect the radio and Ethernet interfaces. Options are:
-
s-tag - All S-VLANs and untagged frames are classified into the service.
- dot1q - All C-VLANs and untagged frames are classified into the service.

Note
For a full explanation of Ethernet Services, service types, and attached interface types, see Configuring Ethernet Service(s).
- Click Next. The Radio #2 Selection page opens.
Figure 84 N + 0 Multi Carrier ABC Quick Configuration Wizard – Radio #2 Selection Page – PTP 820G

Figure 85 N + 0 Multi Carrier ABC Quick Configuration Wizard – Radio #2 Selection Page – PTP 820F

- In the Radio #2 Interface field, select the second radio interface for the group. For PTP 820F, the second radio interface must be the second radio carrier of an RFU-D or RFU-D-HP.
For PTP 820G, you can click the interface in the graphical representation of the unit. The selected interface is surrounded by a blue circle and the previously selected interface is surrounded by a green circle, as shown in Figure 78. - Click Next. The Radio XPIC Configuration page opens. If you want to set up an XPIC configuration, select the radio pair. For full instructions on configuring XPIC, including antenna alignment instructions, see Configuring XPIC.
Figure 86 N + 0 Multi Carrier ABC Quick Configuration Wizard – Radio XPIC Configuration Page – PTP 820G

Figure 87 N + 0 Multi Carrier ABC Quick Configuration Wizard – Radio XPIC Configuration Page – PTP 820F

- Click Next. The Radio Parameters Configuration page opens. You can configure the basic radio parameters for each radio carrier. If you selected XPIC in the Radio XPIC Configuration page, you configure the parameters for the group rather than the individual carriers.
Figure 88 N + 0 Multi Carrier ABC Quick Configuration Wizard – Radio Parameters Configuration Page – PTP 820G

Figure 89 N + O Multi Carrier ABC Quick Configuration Wizard – Radio Parameters Configuration Page – PTP 820F

Figure 90 N + 0 Multi Carrier ABC Quick Configuration Wizard – Radio Parameters Configuration Page (XPIC) – PTP 820G

Figure 91 N + 0 Multi Carrier ABC Quick Configuration Wizard – Radio Parameters Configuration Page (XPIC) – PTP 820F
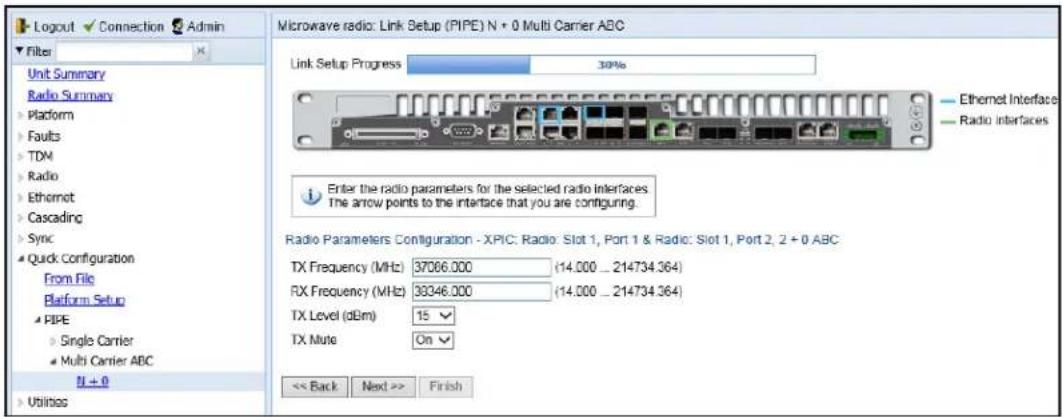
- For each radio carrier or XPIC group, configure the following radio parameters:
In the TX Frequency (MHz) field, set the transmission radio frequency in MHz.
ii In the RX Frequency (MHz) field, set the received radio frequency in MHz.
iii In the TX Level (dBm) field, enter the desired TX signal level (TSL). The range of values depends on the frequency and RFU type.
iv To mute the TX output of the radio carrier, select Mute in the TX mute field. To unmute the TX output of the radio carrier, select Unmute. To configure a timed mute, select Mute with Timer.
If you select Mute with Timer, an additional field appears: Mute timeout (minutes). This field defines a timer for the mute, in minutes (1-1440). When the timer expires, the mute automatically ends. This provides a fail-safe mechanism for maintenance operations that eliminates the possibility of accidentally leaving the radio muted after the maintenance has been completed. By default, the timer is 10 minutes.


Note
In contrast to an ordinary mute, a timed mute is not persistent. This means that if the unit is reset, the radio is not muted when the unit comes back online, even if the timer had not expired. Also, in unit and radio protection configurations, a timed mute is not copied to the mate unit or radio, and no mismatch alarm is raised if a timed mute is configured on only one radio in the protection pair.
- Click Next. The Radio MRMC Script Configuration page opens. You can configure the MRMC script parameters for each interface. For an XPIC group, you configure the parameters for the group rather than the individual interfaces.
Figure 92 N + 0 Multi Carrier ABC Quick Configuration Wizard – Radio MRMC Script Configuration Page – PTP 820G

Figure 93 N + O Multi Carrier ABC Quick Configuration Wizard – Radio MRMC Script Configuration Page – PTP 820F

Figure 94 N + 0 Multi Carrier ABC Quick Configuration Wizard – Radio MRMC Script Configuration Page (XPIC) – PTP 820G

- For each interface or XPIC group, configure the following MRMC script parameters:
- In the Script ID field, select the MRMC script you want to assign to the radio or XPIC group. For a full explanation of choosing an MRMC script, see Configuring the Radio (MRMC) Script(s).
- In the Operational Mode field, select the ACM mode: Fixed or Adaptive.
o Fixed ACM mode applies constant TX and RX rates. However, unlike regular scripts, with a Fixed ACM script you can specify a maximum profile to inhibit inefficient transmission levels.
○ In Adaptive ACM mode, TX and RX rates are dynamic. An ACM-enabled radio system automatically chooses which profile to use according to the channel fading conditions.
-
Do one of the following:
-
If you selected Fixed in the Operational Mode field, the next field is Profile. Select the ACM profile for the radio in the Profile field.
-
If you selected Adaptive in the Operational Mode field, following two fields are displayed:
-
Maximum Profile - Enter the maximum profile for the script. See Configuring the Radio (MRMC) Script(s).
-
Minimum Profile - Enter the minimum profile for the script. See Configuring the Radio (MRMC) Script(s).
-
Click Next. The Management Configuration page opens.
Figure 95 N + 0 Multi Carrier ABC Quick Configuration Wizard – Management Configuration Page – PTP 820G
![Logout ✓ Connection Admin Filter Main View Platform Faults TDM Radio Ethernet Cascading Sync Quick Configuration PIPE Single Carrier Multi Carrier ABC 1 + 1 [HSB-SD] N + 0 Utilities Microwave radio: Link Setup (PIPE) N + 0 Multi Carrier ABC Link Setup Progress 75% completed... To configure in Band management, choose 'Yes' If you choose 'Yes', you will need to select a Management VLAN. Management Configuration (2 + 0 ABC) In Band Management Yes Management VLAN 1 In Band Includes Ethernet interface << Back Next >> Finish](/content/2026/05/985471/images/1b08d4f1d8cd1d14af3d7ef90926f4eb06c57037b9715d93066868fa9c02557a.jpg)
Figure 96 N + 0 Multi Carrier ABC Quick Configuration Wizard – Management Configuration Page – PTP 820F

- In the In Band Management field, select Yes to configure in-band management, or No if you do not need in-band management. If you select Yes, the Management VLAN field appears.
- If you selected Yes in the In Band Management field, select the management VLAN in the Management VLAN field.
- If you want to use the Ethernet interface as well as the radio interface for in-band management, select In Band includes Ethernet interface.
- Click Finish. The Summary page opens. This page displays the parameters you have selected for the group.
Figure 97 N + 0 Multi Carrier ABC Quick Configuration Wizard – Summary Page – PTP 820G

Figure 98 N + 0 Multi Carrier ABC Quick Configuration Wizard – Summary Page – PTP 820F

- To complete configuration of the Multi-Carrier ABC group, click Submit. If you want to go back and change any of the parameters, click Back. After you click Submit, the unit is reset.
Configuring a 1+0 Link
To configure a 1+0 link, you must perform the following steps:
- If you are using an RMC in an expansion slot rather than a fixed radio interface, enable the RMC.
- Unmute the radio. See Configuring the Radio Parameters.
- Configure the radio's TX level. See Configuring the Radio Parameters.
- Configure the radio's frequency. See Configuring the Radio Parameters.
- Configure the radio's MRMC script. See Configuring the Radio (MRMC) Script(s).

Note
You can also use the Quick Configuration wizard to configure a 1+0 Pipe link. See Configuring a Link Using the Quick Configuration Wizard.
Configuring Multi-Carrier ABC

Note
For PTP 820F, Multi-Carrier ABC requires a MultiCore RFU-D. Multi-Carrier ABC can only be configured for RFUs connected to radio interface RFU1 or RFU2.
This section includes:
• Multi-Carrier ABC Overview
- Configuring a Multi-Carrier ABC Group
• Deleting a Multi-Carrier ABC Group
Multi-Carrier ABC Overview
Multi-Carrier Adaptive Bandwidth Control (ABC) enables multiple separate radio carriers to be shared by a single Ethernet port. This provides an Ethernet link over the radio with the total sum of the capacity of all the radios in the group, while still behaving as a single Ethernet interface. In Multi-Carrier ABC mode, traffic is dynamically divided among the carriers, at the Layer 1 level, without requiring Ethernet Link Aggregation.
Load balancing is performed regardless of the number of MAC addresses or the number of traffic flows. During fading events which cause ACM modulation changes, each carrier fluctuates independently with hitless switchovers between modulations, increasing capacity over a given bandwidth and maximizing spectrum utilization. The result is 100% utilization of radio resources in which traffic load is balanced based on instantaneous radio capacity per carrier.

Note
If the modulation of a radio carrier in the Multi-Carrier ABC group drops to Profile 0, that carrier is removed from the group until modulation returns to Profile 1 or higher.
In this version, one Multi-Carrier ABC group that includes both radio carriers can be configured per unit. The MRMC scripts for both radio carriers must be identical.
Configuring a Multi-Carrier ABC Group
To configure a Multi-Carrier ABC group:
- Select Radio > Groups > Multi Carrier ABC. The Multi Carrier ABC page opens.

Note
You can also use the Quick Configuration wizard to configure a Multi-Carrier ABC group. See Configuring a Link Using the Quick Configuration Wizard.
Figure 99 Multi-Carrier ABC Group Page (Empty)

- Click Create Group. The first page of the Create ABC Group wizard opens.
Figure 100 Create ABC Group Wizard – First Page

- In the Group ID field, select an ID for the Multi-Carrier ABC group.

Note
For PTP 820F, you must use Group #1 for radio interfaces Slot 1 Port 1 and Slot 1 port 2, which correspond to the two radio interfaces of the RFU connected to IDU port RFU1. You must use Group #2 for radio interfaces Slot 1 Port 3 and Slot 1 port 4, which correspond to the two radio interfaces of the RFU connected to IDU port RFU2.
- Optionally, enter a descriptive name for the group in the Group Name field.
-
In the Minimum bandwidth field, select Enable to enable Minimum Bandwidth Override or Disable to disable Minimum Bandwidth Override.
-
In the Minimum bandwidth threshold field, enter the minimum bandwidth override threshold (in Mbps). The threshold can be between 0 – 20000 Mbps, with a resolution of 1 Mbps. If the group's bandwidth capacity falls beneath this threshold, the group is automatically placed in Down state until the bandwidth capacity exceeds this threshold.

Note
For an explanation of Multi-Carrier ABC Minimum Bandwidth Override, see Configuring the Multi-Carrier ABC Minimum Bandwidth Override Option.
- Click Next. The next page of the Create Group wizard opens.
Figure 101 Create ABC Group Wizard – Second Page
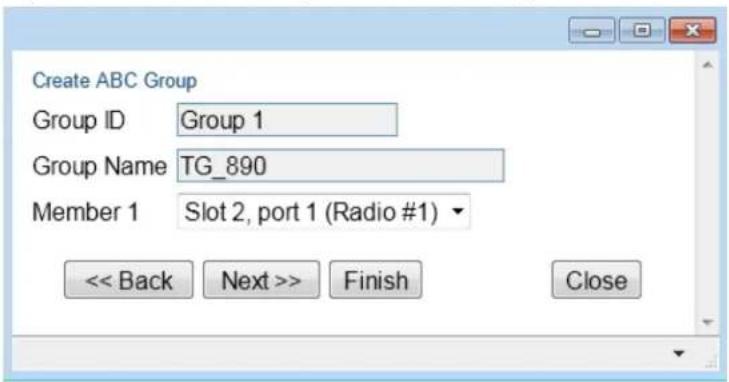
- In the Member 1 field, select a radio carrier.
- Click Next. The next page of the Create Group wizard opens.
- In the Member 2 field, select a radio carrier.
- Click Next. A summary page opens.
Figure 102 Create ABC Group Wizard – Finish Page

-
Click Submit, A message appears indicating whether or not the operation was successful.
-
Click Close to close the Create Group wizard. You must click Submit before clicking Close, or the selections you made will be discarded and the process cancelled.
Adding and Removing Group Members
You can add and removeradio carriers from the group after creating the group. This is relevant, for example, if you are configuring 1+1 HSB-SD, where you must first create an empty Multi-Carrier ABC group, then later add the 1+1 HSB-SD group to the empty Multi-Carrier ABC group. This is also relevant if you want to delete a Multi-Carrier ABC group, since you must remove the members individually before deleting the group.
To add interfaces:
- Select the group in the Multi-Carrier ABC table and click Add/Remove Members. The Multi Carrier ABC - Add/Remove Members page opens.
Figure 103 Multi Carrier ABC Group - Add/Remove Members Page

-
Select a member from the Add Member drop-down list.
-
Click Apply.
To remove interfaces:
1 Select a member in the Remove Member field.
2 Click Apply.
3 Repeat these steps to remove additional members from the group.
Configuring the Multi-Carrier ABC Minimum Bandwidth Override Option
A multi-carrier ABC group can be configured to be placed in Operational State Down if the group's capacity falls beneath a user-defined threshold.
By default, the Multi-Carrier ABC minimum bandwidth override option is disabled. When enabled, the Multi-Carrier ABC group is automatically placed in a Operational State Down in the event that the group's aggregated capacity falls beneath the user-configured threshold. The group is returned to Operational State Up when its aggregated capacity goes above the threshold.
In order to use Multi-Carrier ABC Minimum Bandwidth Override, an ASP group must be configured on the PTP 820 unit in which the Monitored Interface is the Multi-Carrier ABC group and the Controlled Interface is the Ethernet interface that faces the upstream PTP 820 unit. See Configuring Automatic State Propagation.
An alarm is also raised when this feature is enabled and the group's aggregated capacity falls beneath the threshold:
- Alarm ID - 2201
- Alarm Description – Multi Carrier ABC bandwidth is below the threshold
This option is used in conjunction with the LAG group shutdown in case of degradation event option (see Enabling and Disabling LAG Group Shutdown in case of Degradation Event) in cases where the operator wants to re-route traffic from an upstream switch connected to an another PTP 820 unit whenever the link is providing less than a certain capacity. To set up a configuration in which a drop in the capacity of the Multi-Carrier ABC group closes the Ethernet port in the upstream FibeAir PTP 820 unit, you must perform all of the following steps:
- Enable the Multi-Carrier ABC minimum bandwidth option and set a threshold on the downstream PTP 820 unit, as described below.
- Enable an ASP group on the downstream PTP 820 unit, where the Monitored Interface is the Multi-Carrier ABC group and the Controlled Interface is the Ethernet interface that faces the upstream PTP 820 unit. See Configuring Automatic State Propagation.
- Enable the LAG group shutdown in case of degradation event option on the upstream PTP 820 unit.

Note
When using in-band management, management is lost in the event of radio failure and returns when the radio link is restored.
The minimum bandwidth threshold is based on the capacity of the Multi-Carrier ABC group, not the combined capacities of the group's members. The group's aggregated capacity is displayed in the Multi-Carrier ABC Group – Edit Group page.
The Multi-Carrier ABC minimum bandwidth override option cannot be used with HSB radio protection or PTP 820G unit redundancy.
You can configure Multi-Carrier ABC Minimum Bandwidth Override when creating the group. See Configuring a Multi-Carrier ABC Group.
To configure Multi-Carrier ABC Minimum Bandwidth Override after the group has been created:
1 Select the group in the Multi-Carrier ABC table and click Edit Group. The Edit Group page opens (Figure 137).
2 In the Minimum bandwidth field, select Enable to enable Minimum Bandwidth Override or Disable to disable Minimum Bandwidth Override.
3 In the Minimum bandwidth threshold field, enter the minimum bandwidth override threshold (in Mbps). If the group's bandwidth capacity falls beneath this threshold, the group is automatically placed in Operational State Down until the bandwidth capacity exceeds this threshold.
4 Click Apply.
Deleting a Multi-Carrier ABC Group

Note
For instructions on deleting a Multi-Carrier ABC/HSB-SD group, see Deleting an HSB Radio Protection Group with Space Diversity.
To delete a Multi-Carrier ABC group:
- Select Radio > Groups > Multi Carrier ABC. The Multi Carrier ABC page opens (Figure 93).
- Select the group in the Multi-Carrier ABC table and click Add/Remove Members. The Multi Carrier ABC – Add/Remove Members page opens (Figure 95).
- Remove each member of the group. See Adding and Removing Group Members.
- Click Close to close the Multi Carrier ABC – Add/Remove Members page.
- Select the group and click Delete.
Configuring Link Aggregation (LAG) and LACP
Link aggregation (LAG) enables you to group several physical Ethernet or radio interfaces into a single logical interface bound to a single MAC address. This logical interface is known as a LAG group. Traffic sent to the interfaces in a LAG group is distributed by means of a load balancing function. PTP 820G uses a distribution function of up to Layer 4 in order to generate the most efficient distribution among the LAG physical ports.
This section explains how to configure LAG and includes the following topics:
- LAG Overview
- Configuring a LAG Group
• Enabling and Disabling LAG Group Shutdown in case of Degradation Event - Configuring Enhanced LAG Distribution
- Deleting a LAG Group
- Displaying LACP Parameters and Statistics.
LAG Overview
LAG can be used to provide interface redundancy. LAG can also be used to aggregate several interfaces in order to create a wider (aggregate) link. For example, LAG can be used to create a 4 Gbps channel.
You can create up to four LAG groups. The following restrictions exist with respect to LAG groups:
- Only physical interfaces (including radio interfaces), not logical interfaces, can belong to a LAG group.
- Cascading interfaces cannot belong to a LAG group. See Configuring Cascading Interfaces (Optional).
- Interfaces can only be added to the LAG group if no services or service points are attached to the interface.
- Any classification rules defined for the interface are overridden by the classification rules defined for the LAG group.
- When removing an interface from a LAG group, the removed interface is assigned the default interface values.
There are no restrictions on the number of interfaces that can be included in a LAG. It is recommended, but not required, that each interface in the LAG have the same parameters (e.g., speed, duplex mode).

Note
To add or remove an Ethernet interface to a LAG group, the interface must be in an administrative state of "down". This restriction does not apply to radio interfaces. For instructions on setting the administrative state of an interface, see Enabling the Interfaces (Interface Manager).
PTP 820 supports LACP, which expands the capabilities of static LAG and provides interoperability with third-party equipment that uses LACP. LACP improves the communication between LAG members. This improves error detection capabilities in situations such as improper LAG configuration or improper cabling. It also enables the LAG to detect uni-directional failure and remove the link from the LAG, preventing packet loss.
LACP is enabled as part of the LAG configuration process. It should only be used if the LAG is in a link with another LACP-enabled LAG.

Note
LACP is not supported with unit redundancy. For unit redundancy, a special, limited implementation is configured on the logical interface level. See Configuring Unit Redundancy for PTP 820G.
LACP can only be used with Ethernet interfaces.
LACP cannot be used with Enhanced LAG Distribution or with the LAG Group Shutdown in Case of Degradation Event feature..
Configuring a LAG Group
Creating a LAG Group
To create a LAG group:
- Select Ethernet > Interfaces > Groups > LAG. The LAG page opens.
Figure 104 LAG Page (Empty)

- Click Create Group underneath the Link Aggregation table. The Create LAG page opens.
Figure 105 Create LAG Group Page

- In the Group ID field, select a LAG Group ID. Only LAG IDs that are not already assigned to a LAG group appear in the dropdown list.
- In the LACP field, select Enable to enable LACP on the LAG or Disable to disable LACP on the LAG. The default value is Disable.
- In the LAG Member 1 field, select an interface to assign to the LAG group. Only interfaces not already assigned to a LAG group appear in the dropdown list.
- Click Next. A new Create LAG Group page opens.
- In the Member 2 field, select an additional interface to assign to the LAG Group.
- To add additional interfaces to the LAG group, repeat steps 6 and 7.
- When you have finished adding interfaces to the LAG group, click Finish. A new LAG page opens displaying all the interfaces you have selected to include in the LAG group.
Figure 106 Create LAG Group – Finish Page
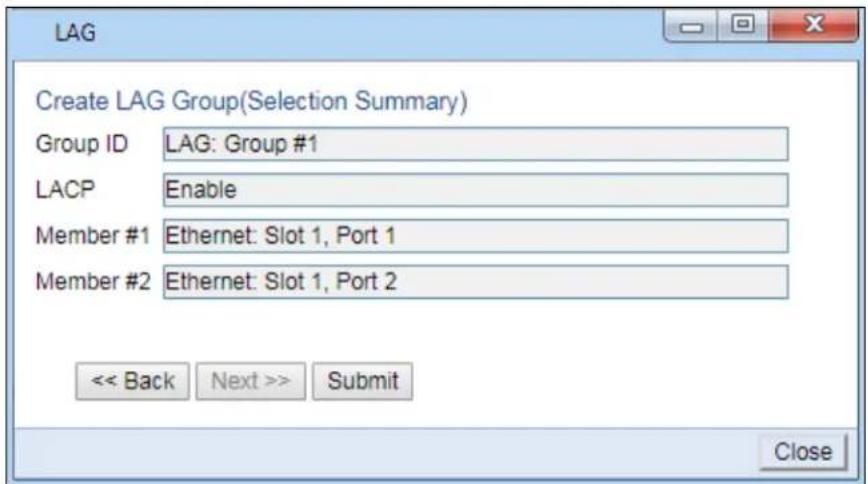
- Click Submit. If all the interfaces meet the criteria listed above, a message appears that the LAG group has been successfully created. If not, a message appears indicating that the LAG group was not created and giving the reason.
Editing a LAG Group
To edit an existing LAG group:
- Select the LAG group you want to edit in the Link Aggregation table of the LAG page
Figure 107 LAG Page (Populated)

- Click Edit underneath the Link Aggregation table. The Link Aggregation - Edit page opens.
Figure 108 Link Aggregation - Edit Page

- Do one or both of the following:
To enable or disable LACP, select Enable or Disable in the LACP field. See LAG Overview for restrictions.
To enable or disable LAG Group Shutdown in case of Degradation Event, select Enable or Disable in the LAG degrade field. See Enabling and Disabling LAG Group Shutdown in case of Degradation Event for restrictions.
To remove an interface from the LAG Group, select the interface in the Remove Member field.
To add an interface to the LAG Group, select the interface in the Add Member field.
- Click Apply.
- To remove or add additional interfaces, repeat steps 4 and 5.
- When you are finished, click Close to close the Link Aggregation – Edit page.

Note
When removing an interface from a LAG group, the removed interface is assigned the default interface values.
For information about the LAG degrade field, see Enabling and Disabling LAG Group Shutdown in case of Degradation Event.
Enabling and Disabling LAG Group Shutdown in case of Degradation Event

Note
LAG Group Shutdown in Case of Degradation Event cannot be used with LACP.
A LAG group can be configured to be automatically closed in the event of LAG degradation. This option is used if you want traffic from the switch to be re-routed during such time as the link is providing less than a certain capacity.
By default, the LAG group shutdown in case of degradation event option is disabled. When enabled, the LAG is automatically closed in the event that any one or more ports in the LAG fail. When all ports in the LAG are again operational, the LAG is automatically re-opened.

Note
Failure of a port in the LAG also triggers a lag-degraded alarm, Alarm ID 100.
- To enable or disable the LAG group shutdown in case of degradation event option:
- Select Ethernet > Interfaces > Groups > LAG to open the LAG page.
- Select the LAG group in the Link Aggregation table.
- Click Edit underneath the Link Aggregation table. The Link Aggregation - Edit page opens (Figure 102).
- In the LAG degrade field, select Enable to enable the LAG group shutdown in case of degradation event option or Disable to disable the LAG group shutdown in case of degradation event option.
- Click Apply.
Configuring Enhanced LAG Distribution
You can change the distribution function by selecting from ten pre-defined LAG distribution schemes. The feature includes a display of the TX throughput for each interface in the LAG, to help you identify the best LAG distribution scheme for the specific link.

Note
Enhanced LAG distribution is only available for LAG groups that consist of exactly two interfaces. It cannot be used with LACP.
To configure enhanced LAG distribution:
- Select Ethernet > Interfaces > Groups > LAG. The LAG page opens (Figure 101).
- Click LAG DF underneath the Link Aggregation table. The LAG Distribution Function (DF) page opens.
Figure 109 LAG Distribution Function (DF) Page
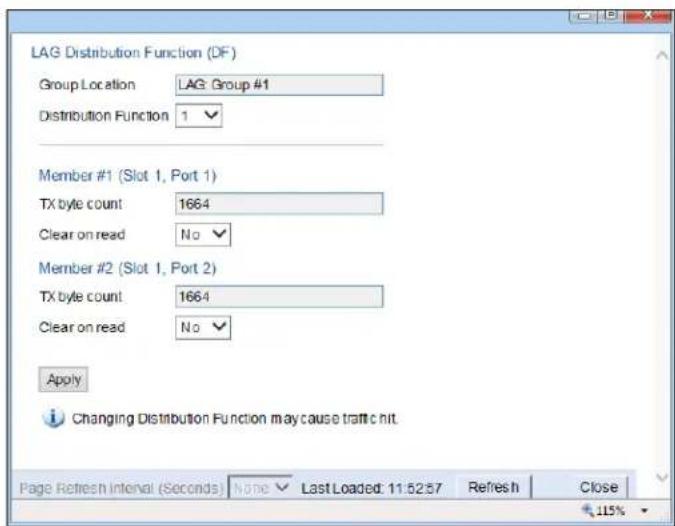
- In the Distribution Function field, select a pre-set distribution scheme, from 1 to 10. It is recommended to experiment with the various schemes, monitoring the TX byte count fields for each interface to determine the efficiency of each distribution scheme for the link. The default distribution scheme is 1.
- To clear the TX byte counts, select Clear on read for one or both interfaces. The byte counts will be cleared when you close the LAG Distribution Function (DF) page or click Refresh.

Note
This counter will also be cleared for the members of the LAG in the Port RMON Statistics page.
- Click Apply to apply the selected distribution scheme.
Deleting a LAG Group
In order to delete a LAG group, you must first make sure that no service points are attached to the LAG group group and that all members of the LAG group are set to Admin= Down.
To delete a LAG group:
- Select Ethernet > Interfaces > Groups > LAG. The LAG page opens.
- Select the LAG group you want to delete in the Link Aggregation table.
- Click Delete underneath the Link Aggregation table. The LAG group is deleted.
To delete multiple LAG groups:
- Select the LAG groups in the Link Aggregation table or select all the LAG groups by selecting the check box in the top row.
- Click Delete underneath the Link Aggregation table.
Displaying LACP Parameters and Statistics
You can display the following LACP parameters and statistics:
• LACP Aggregation (per LAG)
- LACP Port Status
• LACP Port Statistics
• LACP Port Debug Statistics

Note
PTP 820 does not support any LACP write parameters.
Displaying LACP Aggregation Status Parameters
To display LACP aggregation status parameters:
- Select Ethernet > Protocols > LACP > Aggregation to open the LACP Aggregation page.
Figure 110 LACP Aggregation Page

Table 32 LACP Port Status Page
| Parameter Definition | |
| LAG Interface Location | Identifies the LAG group. |
| Administrative Key | The current administrative value of the key for the Aggregator. |
| Aggregator MAC Address | The individual MAC address assigned to the Aggregator. |
| Aggregate or Individual | Indicates whether the Aggregator represents an aggregate or an individual link. |
| Frame Collector Maximum Delay | The maximum delay, in tens of microseconds. |
| Actor System ID | The MAC address value used as a unique identifier for the system that contains this Aggregator. |
| Actor System Priority | The priority value associated with the Actor's System ID. |
| Actor Operational Key | The current operational value of the Key for the Aggregator. |
| Partner System ID | The MAC address value consisting of the unique identifier for the current protocol Partner of this Aggregator. |
| Partner System Priority | The priority value associated with the Partner's System ID. |
| Partner Operational Key | The current operational value of the Key for the Aggregator's current Protocol partner. |
Displaying LACP Port Status Parameters
To display LACP port status parameters:
- Select Ethernet > Protocols > LACP > Port > Status to open the LACP Port Status page.
Figure 111 LACP Port Status Page

- The LACP Port Status page displays the major port status parameters, per port. To display all the available LACP port status parameters, select a port and click View. The LACP Port Status – View page is displayed.
Figure 112 LACP Port Status – View Page

Table 33 LACP Port Status Parameters
| Parameter Definition | |
| Port Interface Location The location of the port. | |
| Selected Aggregator ID | The identifier value of the Aggregator that this Aggregation port has currently selected. |
| Attached Aggregator ID | The identifier value of the Aggregator that this Aggregation port is currently attached to. |
| Aggregate or Individual | Indicates whether the Aggregation Port is able to aggregate or is only able to operate as an individual link. |
| Actor System ID | The MAC Address value that defines the value of the System ID for the system that contains this Aggregation Port. |
| Actor System Priority | The priority value associated with the Actor's System ID. |
| Actor Port | The port number locally assigned to the Aggregation Port. |
| Actor Port Priority | The priority value assigned to this Aggregation Port. |
| Actor Administrative Key | The current administrative value of the Key for the Aggregation Port. |
| Actor Administrative State | The administrative values of the Actor's state as transmitted by the Actor via LACPDUs. |
| Actor Operational Key | The current operational value of the Key for the Aggregation Port. |
| Actor Operational State | The current operational values of the Actor's state as transmitted by the Actor via LACPDUs. |
| Partner Operational Key | The current operational value of the Key for the protocol Partner. |
| Partner Operational State | The current values of Actor State in the most recently received LACPDU transmitted by the protocol Partner. |
| Partner Operational System ID | The MAC Address value representing the current value of the Aggregation Port's protocol Partner's System ID. |
| Partner Operational System Priority | The operational value of priority associated with the Partner's System ID. |
| Partner Operational Port | The operational port number assigned to this Aggregation port by the Aggregation port's port Partner. |
| Partner Operational Port Priority | The Priority value assigned to this Aggregation port by the Partner. |
| Partner Administrative Key | The current administrative value of the Key for the protocol Partner. |
| Partner Administrative State | The current administrative value of Actor state for the protocol Partner. |
| Partner Administrative System ID | The MAC Address value representing the administrative value of the Aggregation Port's Protocol partner's System ID. |
| Partner Administrative System Priority | The administrative priority value associated with the Partner's System ID. |
| Partner Administrative Port | The current administrative value of the port number for the protocol partner. |
| Partner Administrative Port Priority | The current administrative value of the port priority for the protocol partner. |
Displaying LACP Port Statistics
To display LACP port statistics:
- Select Ethernet > Protocols > LACP > Port > Statistics to open the LACP Port Statistics page.
Figure 113 LACP Port Statistics Page

Table 34 LACP Port Statistics Parameters
| Parameter Definition | |
| Port Interface Location The location of the port. | |
| Selected Aggregator ID | The identifier value of the Aggregator that this Aggregation port has currently selected. |
| LACPDUs TX | The number of LACPDUs that this port has transmitted. |
| LACPDUs RX | The number of LACPDUs that this port has received. |
| Unknown RX | The number of unknown protocol frames that this port has received. |
| Illegal RX | The number of illegal protocol frames that this port has received. |
Displaying LACP Port Debug Statistics
To display LACP port debug statistics:
- Select Ethernet > Protocols > LACP > Port > Debug to open the LACP Port Debug page.
Figure 114 LACP Port Debug Page

Table 35 LACP Port Debug Statistics
| Parameter Definition | |
| Port Interface Location The location of the port. | |
| Selected Aggregator ID | The identifier value of the Aggregator that this Aggregation port has currently selected. |
| Debug RX State | The state of the receive state machine for the Aggregation port. Possible values are:Current – An LACPDU was received before expiration of the most recent timeout period.Expired – No LACPDU was received before expiration of the most recent timeout period.Defaulted – No LACPDU was received during the two most recent timeout periods. |
| Debug Last RX Time | The value of a TimeSinceSystemReset (F.2.1) when the last LACPDU was received by this Aggregation port. |
| Debug Mux State | The state of the Mux state machine for the Aggregation port. Possible values are Collecting, Distributing, Attached, and Detached. |
| Debug Mux Reason | A text string indicating the reason for the most reason change in the state of the Mux machine. |
Configuring XPIC
Cross Polarization Interference Canceller (XPIC) is a feature that enables two radio carriers to use the same frequency with a polarity separation between them. Since they will never be completely orthogonal, some signal cancellation is required.
In addition, XPIC includes an automatic recovery mechanism that ensures that if one carrier fails, or a false signal is received, the mate carrier will not be affected. This mechanism also assures that when the failure is cleared, both carriers will be operational.
This section includes:
• Prerequisites for XPIC
- Configuring the Carriers
- Creating an XPIC Group
• Performing Antenna Alignment for XPIC
- Deleting an XPIC Group
Related topics:
- Displaying XPI PMs
Prerequisites for XPIC
- For PTP 820F, XPIC requires a Multicore RFU-D. XPIC can only be configured for RFUs connected to radio interface RFU1 or RFU2.
- For PTP 820G, Each radio interface must be connected to the same type of RFU.
- For PTP 820G, XPIC requires a hardware model with two radio interfaces.
- Each radio carrier must be assigned the same script. The script must be an XPIC script. The letter X (XPIC) or N (Non-XPIC) in the script name indicates whether or not the script supports XPIC. For example:
- The script mdN_A2828X_102_1205 supports XPIC.
- The script mdN_A2828N_123-1005 does not support XPIC.

Note
For a list of XPIC support-enabled scripts, refer to the most recent PTP 820G Release Notes.
Configuring the Carriers
To configure the radio carriers:
- Configure the carriers on both ends of the link to the desired frequency channel. Both carriers must be configured to the same frequency channel.
-
Assign an XPIC (CCDP operational mode) support-enabled script to the carriers on both ends of the link. Each carrier must be assigned the same script. For details, refer to Configuring the Radio (MRMC) Script(s).
-
In the XPIC page, create an XPIC group that consists of the two RMCs that will be in the XPIC group. See Creating an XPIC Group.
Creating an XPIC Group
To create an XPIC group:
- Select Radio > Groups > XPIC. The XPIC page opens.
Figure 115 XPIC Configuration Page (Empty)

- Click Create Group. The Create XPIC Group page opens.
Figure 116 Create XPIC Group Page
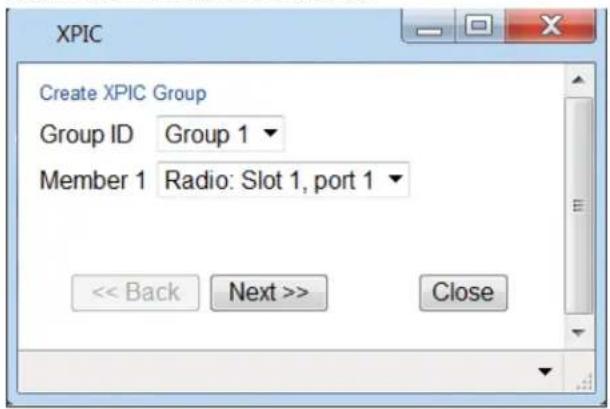
- In the Group ID field, select an ID to identify the XPIC group.
- In the Member 1 field, select the first radio in the XPIC group.
- Click Next. A new Create XPIC Group page opens.
-
In the Member 2 field, select the second radio in the XPIC pair.
-
Click Next. A new Create XPIC Group page opens displaying the radios you have selected to include in the XPIC group.
Figure 117 Create XPIC Group Finish Page

- To create the group with the parameters displayed, click Submit. To go back and change any of the parameters, click Back. If the XPIC group is successfully created, a confirmation page opens.
After you create an XPIC group, you must enable the group. To enable an XPIC group:
- Select the XPIC group in the XPIC table.
Figure 118 XPIC Page (Populated)

- Click Edit. The XPIC Groups - Edit page opens.
Figure 119 XPIC Edit Page

- In the Admin state field, select Enable.
- Click Apply, then Close. The XPIC group is enabled.
Performing Antenna Alignment for XPIC
- Align the antennas for the first carrier. While you are aligning these antennas, mute the second carrier. See Configuring the Radio Parameters.
- Adjust the antenna alignment until you achieve the maximum RSL for the first-carrier link (the "RSL wanted "). This RSL should be no more than +/-2 dB from the expected level. Record the RSL of the first carrier as the RSL wanted .
- Measure the RSL of the second carrier and record it as the "RSL_unwanted".
- Determine the XPI, using either of the following two methods:
To calculate the XPI, subtract the RSLunwanted from the RSLwanted.
- Read the XPI from the Modem XPI field of the Radio Parameters page in the Web EMS. See Viewing the Radio Status and Settings.
- The XPI should be between 25dB and 30dB. If it is not, you should adjust the OMT assembly on the back of the antenna at one side of the link until you achieve the highest XPI, which should be no less than 25dB. Adjust the OMT very slowly in a right-left direction. OMT adjustment requires very fine movements and it may take several minutes to achieve the best possible XPI.

Note
As an extra step, to check the veracity of the initial measurements, you can mute the first carrier and unmute the second carrier on the upper carriers on both sides of the link. Then measure the RSL of the second carrier link (the "RSL wanted "), measure the RSL of the first carrier (the "RSL unwanted ") and determine the XPI. The XPI should match the XPI with the second carriers muted.
- Unmute all the carriers and check the RSL levels of all the carriers on both sides of the link. The RSL of the horizontal carrier of the local unit should match the RSL of the vertical carrier of the remote unit, within ±2dB . The RSL of the vertical carrier of the local unit should match the RSL of the horizontal carrier of the remote unit, within ±2dB .
- Check the XPI levels of both carriers on both sides of the link by checking the Modem XPI field of the Radio Parameters page in the Web EMS. See Viewing the Radio Status and Settings. All four carriers should have approximately the same XPI value. Do not adjust the XPI at the remote side of the link, as this may cause the XPI at the local side of the link to deteriorate.

Note
In some cases, the XPI might not exceed the required 25dB minimum due to adverse atmospheric conditions. If you believe this to be the case, you can leave the configuration at the lower values, but be sure to monitor the XPI to make sure it subsequently exceeds 25dB. A normal XPI level in clear sky conditions is between 25 and 30dB.
Deleting an XPIC Group
In order to delete an XPIC group, you must first disable the group:
- Select the XPIC group in the XPIC page (Figure 112).
- Click Edit. The XPIC Groups - Edit page opens (Figure 113).
- In the Admin state field, select Disable.
- Click Apply. The XPIC group is disabled.
Once the XPIC group is disabled, you can delete the group by selecting the group in the XPIC page and clicking Delete. You must then assign non-XPIC MRMC scripts to the radio carriers that were included in the XPIC pair.
Configuring HSB Radio Protection

Note
This section is only relevant for PTP 820G.
This section explains how to configure HSB radio protection and includes the following topics:
• HSB Radio Protection Overview
- Configuring 1+1 HSB without Space Diversity
- Configuring 1+1 HSB with Space Diversity
- Copying Configuration to Mate
- Revertive Mode
- Switchovers and Lockout
• Deleting an HSB Radio Protection Group without Space Diversity
• Deleting an HSB Radio Protection Group with Space Diversity
- Configuring IF combining
HSB Radio Protection Overview

Note
You can also use the Quick Configuration wizard to configure a 1+1 HSB Pipe link. See Configuring a Link Using the Quick Configuration Wizard.
In dual-carrier systems, PTP 820G offers 1+1 HSB radio protection. With Multi-Carrier ABC, you can also configure 1+1 HSB radio protection with BBS Space Diversity.
You can configure the two fix radio interfaces as a protection group, which protects against hardware failure in the RFU. The CPU monitors the radio interfaces and initiates switchover upon indication of a hardware or signal failure.
The radios in a protected pair operate in active and standby mode. If there is a failure in the active radio, the standby radio switches to active mode.
Configuring 1+1 HSB without Space Diversity
To create a 1+1 HSB radio protection group without Space Diversity, Multi-Carrier ABC may not be configured on the unit.
To create a protection group:
- Select Radio > Groups > Radio Protection. The Radio Protection page opens.
Figure 120 Radio Protection Page (Empty)
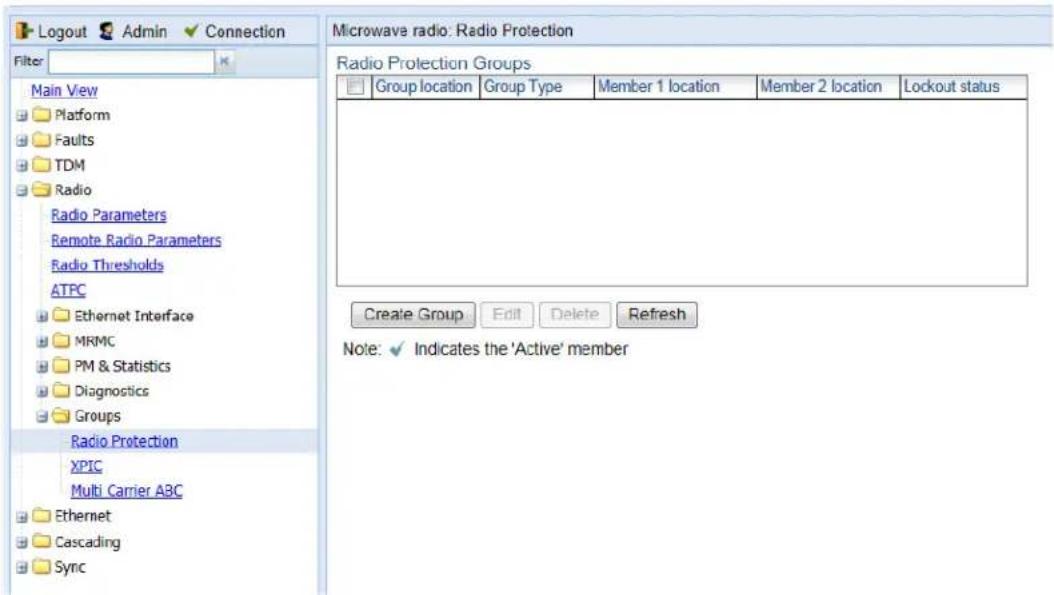
- Click Create Group. The Create Radio Protection Group page opens.
Figure 121 Create Radio Protection Group Page

- In the Group Type field, select 1+1-HSB and click Next. A new Create Radio Protection Group page opens.
Figure 122 Create Radio Protection Group Page – Member 1

- In the Group ID field, select an ID to identify the protection group.
- In the Member 1 field, select the first radio carrier in the protection pair.
- Click Next. A new Create Radio Protection Group page opens.
- In the Member 2 field, select the second radio carrier in the protection pair.
- Click Next. A new Create Radio Protection Group page opens displaying the RMCs you have selected to include in the group.
Figure 123 Create Radio Protection Group Finish Page

- To create the group with the parameters displayed, click Submit. To go back and change any of the parameters, click Back. If the protection group is successfully created, a confirmation page opens.

Note
Radio interface 1 will automatically be the active radio carrier.
-
Configure the active radio interface and perform a copy-to-mate command to ensure that the radio carriers in the HSB pair have the same configuration. See Copying Configuration to Mate.
-
When you have finished configuring the 1+1 HSB group, unmute both radio carriers on both sides of the link. See Configuring the Radio Parameters.
- Optionally, you can enable revertive mode so that following a switchover, the system initiates a revertive protection switchover back to the original receiver once proper link and/or equipment conditions are restored. See Revertive Mode.
Configuring 1+1 HSB with Space Diversity
- Create a Multi-Carrier ABC group with no members. For instructions, see Configuring a Multi-Carrier ABC Group.
- Enable protection for the Multi-Carrier ABC group:
i Select Radio > Groups > Multi Carrier ABC. The Multi Carrier ABC page opens (Figure 93).
ii Select the group in the Multi-Carrier ABC table and click Edit Group. The Multi Carrier ABC - Edit page opens.
Figure 124 Multi Carrier ABC Group – Edit Page – Enabling Protection

iii In the Protection field, select Enable.
iv Click Apply, then Close.
- Create a 1+1 HSB-SD protection group:
i Select Radio > Groups > Radio Protection. The Radio Protection page opens (Figure 114).
ii Click Create Group. The Create Radio Protection Group page opens.
Figure 125 Create Radio Protection Group Page (Space Diversity Group Selected)
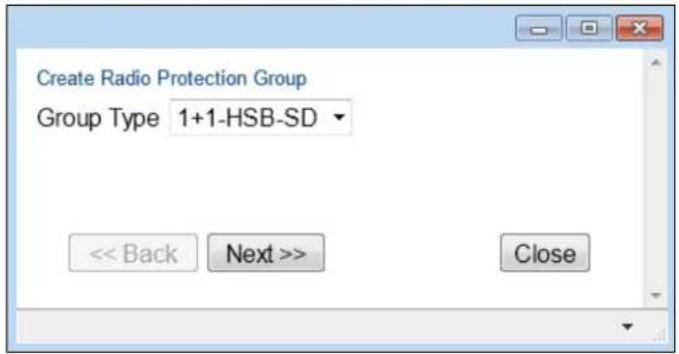
iii In the Group Type field, select 1+1-HSB-SD and click Next. The next page of the Create Radio Protection Group wizard opens.
Figure 126 Create Radio Protection Group Page – Member 1 (Space Diversity Group Selected)
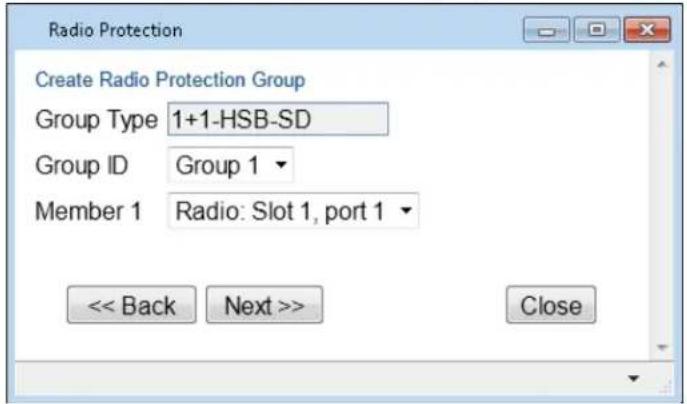
iv In the Group ID field, select an ID to identify the protection group.
v In the Member 1 field, select one of the radio interfaces.
vi Click Next. The next page of the Create Radio Protection Group wizard opens.
vii In the Member 2 field, select the other radio interface.
viii Click Next. The Create Radio Protection Group wizard displays the parameters you have selected.
Figure 127 Create Radio Protection Group Finish Page (Space Diversity Group Selected)

ix To create the group with the parameters displayed, click Submit. To go back and change any of the parameters, click Back. If the protection group is successfully created, a confirmation page opens.

Note
Interface 1 is automatically the active radio carrier.
- When you have finished configuring the 1+1 HSB group, unmute both radio carriers on both sides of the link. See Configuring the Radio Parameters.
- Configure the active interface and perform a copy-to-mate command to ensure that the radios have the same configuration. See Copying Configuration to Mate.
-
Optionally, you can enable revertive mode so that following a switchover, the system initiates a revertive protection switchover back to the original receiver ten minutes after proper link and/or equipment conditions are restored. See Revertive Mode.
-
Add the 1+1 HSB-SD group to the Multi-Carrier ABC group:
i Select Radio > Groups > Multi Carrier ABC. The Multi Carrier ABC page opens (Figure 93).
ii Select the group in the Multi-Carrier ABC table and click Add/Remove Members. The Multi Carrier ABC - Add/Remove Members page opens (Figure 97).
iii In the Add Member field, select Radio Protection: Group #1 and click Apply.
iv Click Close.
Copying Configuration to Mate
In a 1+1 HSB configuration, it is necessary for both radio carriers to have the same configuration. PTP 820G includes a mismatch mechanism that detects if there is a mismatch between the radio configurations of the local and mate carriers. This mechanism is activated by the system periodically and independently of other protection mechanisms, at fixed intervals. It is activated asynchronously for both the active and the standby radio. Once the mismatch mechanism detects a configuration mismatch, it raises a Mate Configuration Mismatch alarm. When the configuration of the active and standby radios is changed to be identical, the mechanism clears the Mate Configuration Mismatch alarm.

Note
The TX Level and Mute settings are not copied to the Standby radio. Therefore, you must manually set the TX Level and unmute the Standby radio in order for 1+1 protection to function. See Configuring the Radio Parameters.
In order to align the configuration between the active and standby radios, you must verify that at least one of the radios is properly configured, and then perform a copy to mate command. This command copies the entire configuration from a selected radio in the protection pair to the other radio in the pair to achieve full configuration alignment between the radio in the pair. The command also initiates a reset of the radio to which the configuration is copied. As soon as the radio to which the confirmation was copied is up and running, its configuration is aligned to the configuration of the other radio. This operation has no effect on the source radio.
To perform a copy-to-mate command:
- Select Radio > Groups > Radio Protection.
The Radio Protection page appears.
Figure 128 Radio Protection Page (Populated)

- Select the protection group.
- Click Edit.
The Radio Protection Groups - Edit page appears.
Figure 129 Radio Protection Groups – Edit Page

- In the Copy to mate source radio location field, select the radio you want to use as the source.
- Click Apply. The Edit page is refreshed, and a Copy to Mate option appears on the bottom of the page.
Figure 130 Radio Protection Groups – Edit Page (Copy to Mate)

-
Click Copy to Mate. The configuration of the selected radio is copied to the other radio in the protected pair.
-
Click Close to close the Radio Protection Groups – Edit page.
Revertive Mode
When revertive mode is enabled, following a switchover the system initiates a revertive protection switchover back to the original receiver ten minutes after proper link and/or equipment conditions are restored. This ensures that the primary path is used whenever possible.
For HSB-SD groups, an additional revertive mode option enables you to configure revertive mode for diversity. If a diversity switchover takes place and revertive mode is enabled for diversity, the system initiates a revertive diversity switchover back to the original receiver ten minutes after a proper signal is restored on the primary receiver.
To configure revertive mode:
- Select Radio > Groups > Radio Protection. The Radio Protection page opens (Figure 122).
- Select the protection group.
- Click Edit. The Radio Protection Groups - Edit page opens (Figure 123).
- In the Revertive mode admin field, select Enable to enable revertive protection or Disable to disable revertive protection.
- In the Revertive Rx mode admin field, select Enable to enable revertive diversity or Disable to disable revertive diversity.

Note
The Revertive Rx mode admin field does not appear if the group is a 1+1 HSB group without Space Diversity.
6. Click Apply.
Switchovers and Lockout
The following events trigger switchover for 1+1 HSB protection according to their priority, with the highest priority triggers listed first.
1 Card missing
2 Lockout
3 Force switch
4 Traffic failures
5 Manual switch
To initiate a protection switchover or a lockout:
- Select Radio > Groups > Radio Protection. The Radio Protection page opens (Figure 122).
- Select the protection group.
- Click Edit. The Radio Protection Groups - Edit page opens (Figure 123).
-
In the Radio protection command field, select one of the following options:
-
Clear – Clears an existing lockout condition.
- Manual switch – Initiates a switchover, provided that the standby carrier is working correctly. Following a manual switch, the protection group operates normally, and a subsequent switchover will occur if any switchover trigger occurs.
- Force switch – Forces a switchover, even if the standby carrier is in an LOF state. Following a force switch, the protection mechanism enters a lockout state. A lockout alarm and a Force Switch event are raised, and no further switchover will take place until another Force Switch is performed, or the user unlocks the lockout mode, or a cold reset is performed.
-
Lockout – Places the protection pair in a lockout state. To end the lockout state, select Clear.
-
Click Apply.
Deleting an HSB Radio Protection Group without Space Diversity

Note
Before deleting an HSB radio protection group, both members of the group must be unmuted. See Configuring the Radio Parameters.
To delete a radio protection group:
- Select Radio > Groups > Radio Protection. The Radio Protection page opens (Figure 122).
- Select the protection group.
- Click Delete. The protection group is deleted.
Deleting an HSB Radio Protection Group with Space Diversity

Note
Before deleting an HSB radio protection group, both members of the group must be unmuted. See Configuring the Radio Parameters.
To delete an HSB-SD radio protection group:
- Remove the HSB-SD group from the Multi-Carrier ABC group:
i Select Radio > Groups > Multi Carrier ABC. The Multi Carrier ABC page opens (Figure 93).
ii Select the group in the Multi-Carrier ABC table and click Add/Remove Members. The Multi Carrier ABC - Add/Remove Members page opens (Figure 97).
iii Select the HSB-SD group and click Apply, then Close.
- Disable protection for the Multi-Carrier ABC group:
i Select Radio > Groups > Multi Carrier ABC. The Multi Carrier ABC page opens (Figure 93).
ii Select the group in the Multi-Carrier ABC table and click Edit Group. The Multi Carrier ABC - Edit page opens (Figure 118).
iii In the Protection field, select Disable.
iv Click Apply, then Close.
- Delete the HSB-SD group. See Deleting an HSB Radio Protection Group.
- Delete the Multi-Carrier ABC group. See Deleting a Multi-Carrier ABC Group.
Configuring IF Combining

Note
This section is only relevant for PTP 820G.
IF Combining is a space diversity configuration in which the RFU receives and processes two signals and combines them into a single, optimized signal. IF Combining requires the use of a 1500HP dual-receiver RFU.

Note
1500HP does not support IF Combining with 56 MHz channels. For 56 MHz channels, BBS can be used for space diversity applications. See Configuring 1+1 HSB with Space Diversity.
To configure IF Combining:
- Radio > IF Combining. The IF Combining page opens.
Figure 131 IF Combining Page


Note
The IF Combining option only appears if the system includes at least one RFU that supports IF Combining.
- Select the radio you want to configure and click Edit. The IF Combining – Edit page opens.
Figure 132 IF Combining – Edit Page
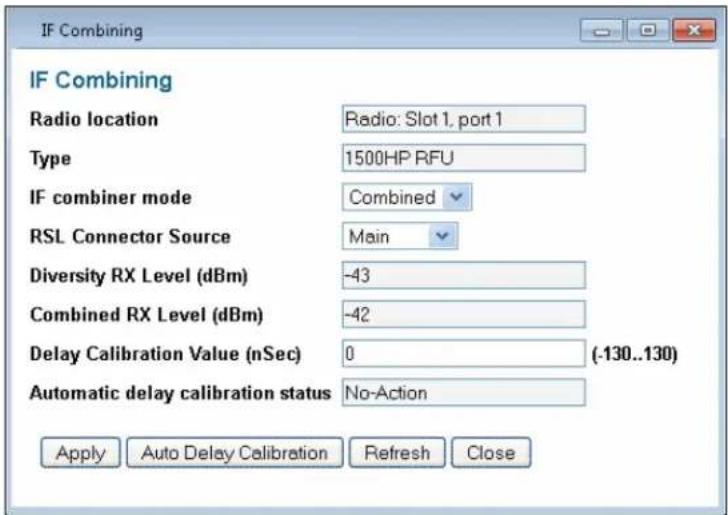
- Configure the fields listed in the table below.
- Click Apply.
Table 36 IF Combining parameters
| Parameter Definition | |
| Radio location | Read-only. Identifies the radio carrier. |
| Type | Read-only. The type of RFU. |
| IF combiner mode Select which radio signal to use:Main – Only the Main antenna signal is selected.Diversity – Only the Diversity antenna signal is selected.Combined – The combined signal from both antennas is selected.To configure IF Combining, select Combined. | |
| RSL Connector Source | Determines the signal source of the RSL connector for purposes of testing RSL output during setup or maintenance. Options are:Main – RSL is taken from the Main radio interface.Diversity – RSL is taken from the Diversity radio interface.Note: PHY1 and PHY2 are not relevant for this version. |
| Diversity RX Level (dBm) | Read-only. Displays the RX signal level (RSL) of the Diversity radio interface, in dBm.Note: The RX signal level (RSL) of the Main radio interface is displayed in the RX Level field of the Radio Parameters page. |
| Combined RX Level (dBm) | Read-only. Displays the signal level (RSL) of the Combined signal, in dBm.Note: The RX signal level (RSL) of the Main radio interface is displayed in the RX Level field of the Radio Parameters page. |
| Delay Calibration Value (nSec) | For manual delay calibration, in the Delay Calibration Value field, enter the number of nanoseconds to delay between the main and diversity signals.Note: Manual delay calibration is only utilized for Combined mode. |
| Automatic delay calibration status | For automatic delay calibration, click Auto Delay Calibration at the bottom of the IF Combining - Edit page. The system automatically calibrates the required delay between the signals from the main and diversity antennas. The Automatic Delay Calibration Status field displays the system status of the Automatic Delay Calibration feature. Possible values status values are:Success – Indicates that the system has successfully calibrated the signal delayFailure – Indicates that the system cannot automatically calibrate the signal delay.No-Action – Indicates that the system has not performed an automatic delay calibration.Note: Automatic delay calibration can only be performed when the system is error-free and there are no negative weather conditions. In an XPIC link, disable XPIC and mute the mate unit at the remote side of the link before performing automatic delay calibration. |

Note
You can display detailed PMs for the diversity interface and the combined signal. See Displaying PMs for the Combined IF Combining Signal.
Chapter 4: Unit Management
This section includes:
• Defining the IP Protocol Version for Initiating Communications
- Configuring the Remote Unit's IP Address
- Configuration SNMP
- Configuring Trap Managers
- Configuring the Internal Ports for FTP or SFTP
• Installing and Configuring an FTP or SFTP Server
• Upgrading the Software
• Backing Up and Restoring Configurations
- Setting the Unit to the Factory Default Configuration
• Performing a Hard (Cold) Reset
- Configuring Unit Parameters
- Configuring NTP
- Displaying Unit Inventory
- Defining a Login Banner
Related topics:
• Setting the Time and Date (Optional)
• Enabling the Interfaces (Interface Manager)
- Uploading Unit Info
- Configuring External Alarms
• Changing the Management IP Address
Defining the IP Protocol Version for Initiating Communications
You can specify which IP protocol the unit will use when initiating communications, such as downloading software, sending traps, pinging, or exporting configurations:
- Select Platform > Management > Networking > Local. The Local Networking Configuration page opens (Figure 25).
- From the IP Address Family drop-down list, select IPv4 or IPv6. The default value is IPv4.
- Click Apply.
Configuring the Remote Unit's IP Address
To configure the IP address of a remote unit:
- Select Platform > Management > Networking > Remote. The Remote Networking Configuration page opens.
Figure 133 Remote Networking Configuration Page

- Select the radio on the local side of the link in which you want to configure the remote radio.

Note
To access the Web EMS of the remote unit, click the unit's IP address in the Remote IP Address column.
- Click Edit. The Remote Networking Configuration – Edit page opens.
Figure 134 Remote Networking Configuration – Edit Page
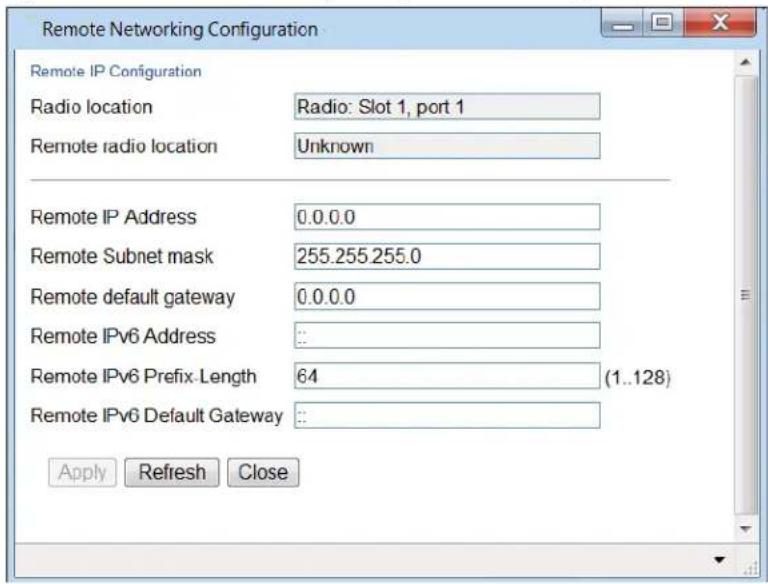
- Configure the IP parameters of the remote radio, as described in Table 33.
- Click Apply, then Close.

Note
To change the Remote IP Address to a different subnet, you must first change the address of the Remote Default Gateway to 0.0.0.0 and click Apply; then set the Remote IP Address as desired, and the Remote Default Gateway as desired.
Similarly, to change the Remote IPv6 Address to a different subnet, you must first change the address of the Remote IPv6 Default Gateway to 0:0:0:0:0:0:0 and click Apply; then set the Remote IPv6 Address as desired, and the Remote IPv6 Default Gateway as desired
Table 37 Remote Networking Configuration Parameters
| Parameter Definition | |
| Radio location | Read-only. Identifies the radio on the local side of the link. |
| Remote radio location | Read-only. Identifies the radio on the remote side of the link. |
| Remote IPv4 Address | Enter an IP address for the remote radio. You can enter the address in IPv4 format in this field, and/or in IPv6 format in the Remote IPv6 Address field. The unit will receive communications whether they are sent to its IPv4 address or its IPv6 address. |
| Remote Subnet mask | If you entered an IPv4 address, Enter the subnet mask of the remote radio. |
| Remote default gateway | Enter a default gateway for the remote radio (optional). |
| Remote IPv6 Address | Enter an IPv6 address for the remote radio. You can enter the address in IPv6 format in this field, and/or in IPv4 format in the Remote IP Address field. The unit will receive communications whether they are sent to its IPv4 address or its IPv6 address. |
| Remote IPv6 Prefix-Length | Enter the IPv6 prefix length for the remote radio if you entered an IPv6 address. |
| Remote IPv6 Default Gateway | Enter a default IPv6 gateway address for the remote radio (optional). |
Configuration SNMP
PTP 820F and PTP 820G supports SNMP v1, v2c, and v3. You can set community strings for access to IDUs.
PTP 820F and PTP 820G supports the following MIBs:
• RFC-1213 (MIB II).
- RMON MIB.
- Proprietary MIB.
To configure SNMP:
- Select Platform > Management > SNMP > SNMP Parameters. The SNMP Parameters page opens.
Figure 135 SNMP Parameters Page

- In the Admin field, select Enable to enable SNMP monitoring, or Disable to disable SNMP monitoring.

Note
The Operational Status field indicates whether SNMP monitoring is currently active (Up) or inactive (Down).
- In the SNMP Read Community field, enter the community string for the SNMP read community.
- In the SNMP Write Community field, enter the community string for the SNMP write community
- In the SNMP Trap Version field, select V1, V2, or V3 to specify the SNMP version.

Note
The SNMP MIB Version field displays the current SNMP MIB version the unit is using.
-
In the V1V2 Blocked field, select Yes if you want to block SNMPv1 and SNMPv2 access so that only SNMPv3 access will be enabled.
-
Click Apply.

Note
Additional security parameters can be configured in the Quick Configuration Security Protocols page. See Quick Security Configuration – Protocols Page, Step 4.
If you are using SNMPv3, you must also configure SNMPv3 users. SNMPv3 security parameters are configured per SNMPv3 user.
To add an SNMP user:
- Select Platform > Management SNMP > V3 Users. The V3 Users page opens.
Figure 136 V3 Users Page

- Click Add. The V3 Users - Add page opens.
Figure 137 V3 Users - Add Page
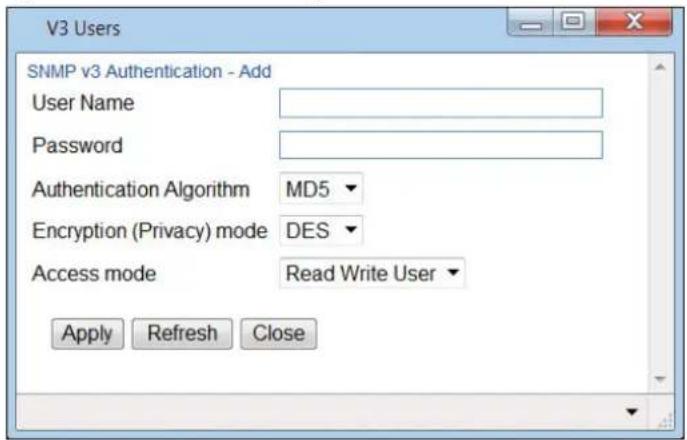
-
Configure the SNMP V3 Authentication parameters, as described below.
-
Click Apply, then Close.
Table 38 SNMP V3 Authentication Parameters
| Parameter Definition | |
| User Name | Enter the SNMPv3 user name. |
| Password | Enter a password for SNMPv3 authentication. The password must be at least eight characters. |
| Authentication Algorithm | Select an authentication algorithm for the user. Options are:NoneSHAMD5 |
| Encryption (Privacy) Mode | Select an encryption (privacy) protocol for the user. Options are:NoneDESAES |
| Access Mode | Select an access permission level for the user. Options are:Read Write UserRead Only User |
Configuring Trap Managers
You can configure trap forwarding parameters by editing the Trap Managers table. Each line in the Trap Managers table displays the setup for a manager defined in the system.
To configure trap managers:
- Select Platform > Management SNMP > Trap Managers. The Trap Managers page opens.
Figure 138 Trap Managers Page

- Select a trap manager and click Edit. The Trap Managers Edit page opens.
Figure 139 Trap Managers - Edit Page
- Configure the trap manager parameters, as described in Table 35 Trap Manager Parameters.
- Click Apply, then Close.
Table 39 Trap Manager Parameters
| Parameter Definition | |
| IPv4 Address | If the IP address family is configured to be IPv4, enter the destination IPv4 address. Traps will be sent to this IP address. See Defining the IP Protocol Version for Initiating Communications. |
| IPv6 Address | If the IP address family is configured to be IPv6, enter the destination IPv6 address. Traps will be sent to this IP address. See Defining the IP Protocol Version for Initiating Communications. |
| Description | Enter a description of the trap manager (optional). |
| Admin | Select Enable or Disable to enable or disable the selected trap manager. |
| Community | Enter the community string for the SNMP read community. |
| Port | Enter the number of the port through which traps will be sent. |
| Heartbeat Period | Enter the interval, in minutes, between each heartbeat trap. |
| CLLI | Enter a Common Language Location Identifier (CLLI). The CLLI is free text that will be sent with the trap. You can enter up to 100 characters. |
| V3 User Name | If the SNMP Trap version selected in Figure 129 SNMP Parameters Page page is V3, enter the name of a V3 user defined in the system.To view or define a V3 user, use the Figure 130 V3 Users Page page.Note: Make sure that an identical V3 user is also defined on the manager's side. |
Configuring the Internal Ports for FTP or SFTP
By default, the following PTP 820 ports are used for FTP and SFTP when the PTP 820 unit is acting as an FTP or SFTP client (e.g., software downloads, configuration file backup and restore operations):
- FTP - 21
- SFTP - 22
You can change either or both of these ports from the following pages:
• Platform > Management > Unit Info
• Platform > Software > Download & Intall
- Platform > Configuration > Configuration Management
• Platform > Security > General > Security Log Upload
- Platform > Security > General > Configuration Log Upload
• Platform > Security > X.509 Certificate > CSR
- Platform > Security > X.509 Certificate > Download & Install
• Platform > Security > RSA Key
From any of these pages, click FTP Port. The FTP Port page opens.
Figure 140 FTP Port Page

Edit the File transfer port number for FTP and or SFTP and click Apply.
Installing and Configuring an FTP or SFTP Server
Several tasks, such as software upgrade and configuration backup, export, and import, require the use of FTP or SFTP. The PTP 820G and PTP 820F can function as an FTP or SFTP client. to use the PTP 820F and PTP 820G as an FTP/SFTP client, you must install FTP/SFTP server software on the PC or laptop you are using.

Note
For FTP, it is recommended to use FileZilla_Server software that can be downloaded from the web (freeware).
For SFTP, it is recommended to use SolarWinds SFTP/SFCP server (freeware).
If you are using IPv6 to perform the operation, make sure to use FileZilla version 0.9.38 or higher to ensure IPv6 support. If you are using another type of FTP or SFTP server, make sure the application version supports IPv6.
To install and configure FTP or SFTP server software on the PC or laptop:
- Create a user and (optional) password on the FTP/SFTP server. For example, in FileZilla Server, perform the following:
I. From the Edit menu, select Users.
II. In the Users window, click Add.
III. In the Add user account window, enter a user name and click OK.
IV. In the Users window, select Enable account and, optionally, select Password and enter a password.
V. In the Users window, click OK.
Figure 141 FileZilla Server User Configuration
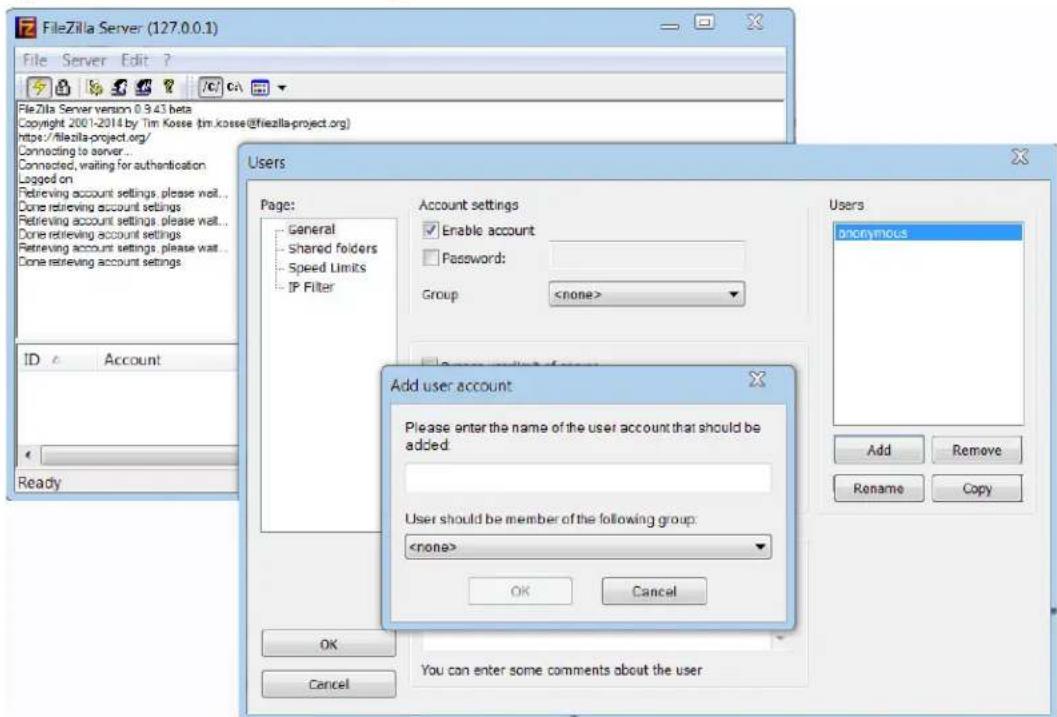
- Create a shared FTP/SFTP folder on the PC or laptop you are using to perform the FTP/SFTP operation (for example, C:\FTPServer).
-
In the FTP/SFTP server, set up the permissions for the shared FTP/SFTP folder. For example, in FileZilla Server:
-
From the Edit menu, select Users.
II. In the Users window, select Shared folders.
III. Underneath the Shared folders section, click Add and browse for your shared FTP folder.
IV. Select the folder and click OK.
V. In the Shared folders section, select your shared FTP folder.
VI. In the Files and Directories sections, select all of the permissions.
VII. Click OK to close the Users window.
Figure 142 FileZilla Server Shared Folder Setup

Upgrading the Software
PTP 820G and PTP 820F software and firmware releases are provided in a single bundle that includes software and firmware for all components and card types supported by the system, including RFURFURFUs. Software is first downloaded to the system, then installed. After installation, a reset is automatically performed on all components whose software was upgraded. RFU software must be installed separately, via the CLI.

Note
Make sure to use the original release software file, without any modification. Otherwise the software download process fails.
This section includes:
• Viewing Current Software Versions
- Software Upgrade Overview
• Downloading and Installing Software
- Configuring a Timed Installation
Viewing Current Software Versions
To display the software version running and downloaded on the unit::
1 Select Platform > Software > Versions. The Versions page opens, displaying the following:
- Running Version – The software version currently running on the unit.
- Downloaded Version – The version, if any, that has been downloaded from the server but not yet installed. Upon installation and reset, this version will become the Running Version.
For a description of the information provided in the Versions page, see Table 36 Versions Page Columns.
Figure 143 Versions Page

2 To display more detailed information about software component versions, select Show Detailed Information. The Software Versions table opens in the Versions page. For a description of the information provided in the Software Versions table, see Table 42: Software Versions Table Columns.
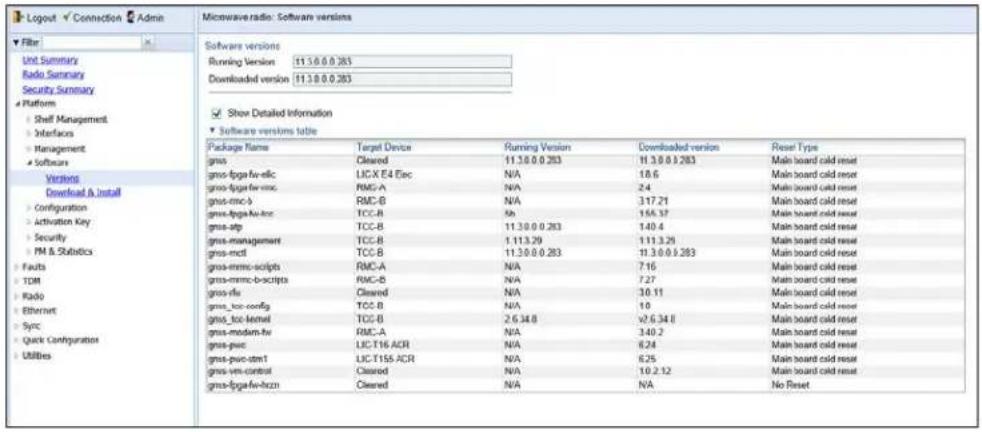
Table 40 Versions Page Columns
| Parameter Definition | |
| Package Name | The name of the software package. |
| Target Device | The specific component on which the software runs. |
| Running Version | The software version currently running on the component. |
| Installed Version | The software version currently installed for the component. If the installed version is not already the running version, it will become the running version after the next reset takes place. |
| Downloaded Version | The version, if any, that has been downloaded from the server but not yet installed. Upon installation, this version will become the Running Version. |
Parameter Definition
Reset Type
The level of reset required by the component in order for the Installed Version to become the Active Version. A cold (hard) reset powers down and powers back up the component. A warm (soft) reset simply reboots the software or firmware in the component.
Software Upgrade Overview
The PTP 820 software installation process includes the following steps:
- Download – The files required for the installation or upgrade are downloaded from a remote server.
- Installation – The downloaded software and firmware files are installed in all modules and components of the PTP 820 that are currently running an older version.
- Reset – The PTP 820G and PTP 820F is restarted in order to boot the new software and firmware versions.
Software and firmware releases are provided in a single bundle that includes software and firmware for all components and card types supported by the system, including RFUs. When you download a software bundle, the system verifies the validity of the bundle. The system also compares the files in the bundle to the files currently installed in the PTP 820G/F and its components, so that only files that need to be updated are actually downloaded. A message is displayed for each file that is actually downloaded.

Note
When downloading an older version, all files in the bundle may be downloaded, including files that are already installed.
Software bundles can be downloaded via FTP or SFTP. After the software download is complete, you can initiate the installation.
Although [RFU] RFU software is included in the standard installation bundle, the current software version is not automatically updated in the [RFU] RFU when an installation is performed. To upgrade the software in an RFU, you must perform the upgrade manually, per slot. This enables you to manage IDU and [RFU] RFU software versions separately.

Note
Before performing a software upgrade, it is important to verify that the system date and time are correct. See Setting the Time and Date (Optional).
Downloading and Installing Software

Note
For HTTPS and SFTP downloads, be aware that only certain ciphers are supported in some operation modes. For a list of supported ciphers, including an indication of which ciphers are supported in HTTPS strong mode and FIPS mode, refer to Annex A – Supported Ciphers for Secured Communication Protocols in the Release Notes for the product and system release version you are using.
You can download software using HTTP, HTTPS, FTP, or SFTP.
When downloading software via HTTP or HTTPS, the PTP 820G or PTP 820F functions as the server, and you can download the software directly to the PTP 820G or PTP 820F unit.

Note
HTTP and HTTPS can only be used to download files for software version 9.5 and later. If there is a requirement to downgrade to a version earlier than software version 9.5 using HTTP or HTTPS, contact Cambium Customer Support for assistance..
When downloading software, the PTP 820G/ F functions as an FTP or SFTP client. You must install FTP or SFTP server software on the PC or laptop you are using to perform the software upgrade. For details, see Configuring the Internal Ports for FTP or SFTP
Downloading software Via HTTP and HTTPS
To download and install a new software version using HTTP or HTTPS:
- Before performing a software upgrade, it is important to verify that the system date and time are correct. See Setting the Time and Date (Optional).
- In the PTP 820G or PTPT 820F's Web EMS, select Platform > Software > Download & Install. The Download & Install page opens.
Figure 144 Download & Install Page – HTTP/ HTTPS Download – No File Selected.
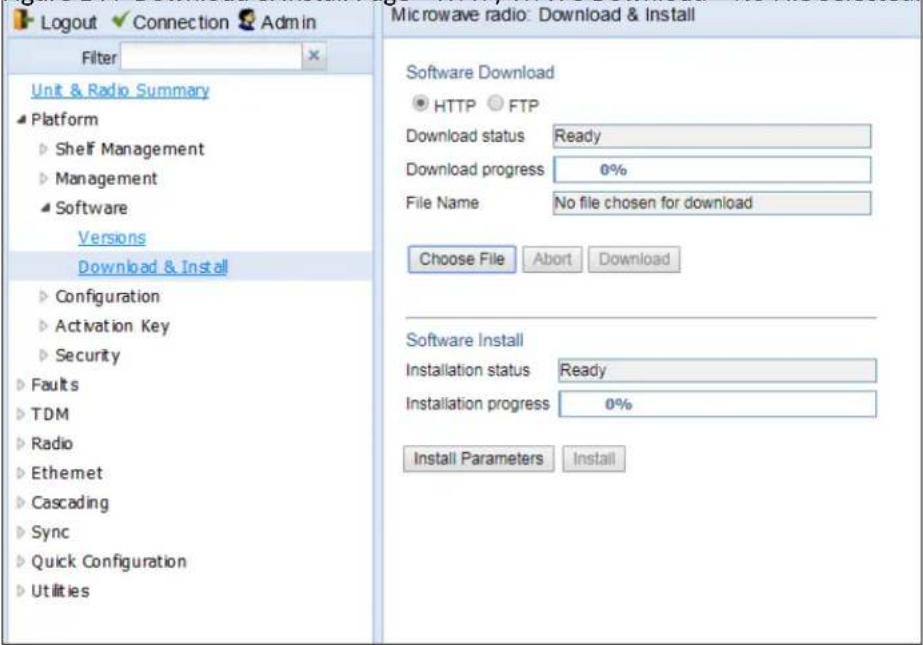
- Select HTTP.
- Click Choose File. A browse window opens.
- Navigate to the directory in which the software file is located and select the file. The selected file must be a ZIP file.
- Click Open. The file name of the selected file appears in the File Name field.
Figure 145 Download & Install Page – HTTP/HTTPS Download –File Selected

- Click Download. The download begins. You can view the status of the download in the Download Status field.

Note
To discontinue the download process, click Abort.
- Once the download has been completed, verify that the version you want to install has been downloaded. You can check the downloaded version for each component by viewing the Downloaded Version column in the Versions page. See Viewing Current Software Versions.
Downloading Software Via FTP or SFTP
Installing and Configuring an FTP or SFTP Server.
To download and install a new software version:
- Before performing a software upgrade, it is important to verify that the system date and time are correct. See Setting the Time and Date (Optional).
- Install and configure FTP or SFTP server software on the PC or laptop you are using to perform the software upgrade, as described in Installing and Configuring an FTP or SFTP Server.
- Unzip the new software package for PTP 820G/ F into your shared FTP or SFTP folder.
- In the PTP 820's Web EMS, select Platform > Software > Download & Install. The Download & Install page opens.
- Select FTP.
Figure 146 Download & Install Page

- Click FTP Parameters to display the FTP Parameters page.
Figure 147 FTP Parameters Page

- In the File Transfer Protocol field, select the file transfer protocol you want to use (FTP or SFTP).
- In the Username field, enter the user name you configured in the FTP server.
-
In the Password field, enter the password you configured in the FTP server. If you did not configure a password for your FTP/SFTP user, simply leave this field blank.
-
If the IP address family is configured to be IPv4, enter the IPv4 address of the PC or laptop you are using as the FTP/SFTP server in the Server IPV4 address field. See Defining the IP Protocol Version for Initiating Communications.
- If the IP address family is configured to be IPv6, enter the IPv6 address of the PC or laptop you are using as the FTP/SFTP server in the Server IPv6 Address field. See Defining the IP Protocol Version for Initiating Communications.
- In the Path field, enter the directory path from which you are downloading the files. Enter the path relative to the FTP user's home directory, not the absolute path. If the location is the home directory, it should be left empty. If the location is a sub-folder under the home directory, specify the folder name. If the shared folder is "C:\", this parameter can be left empty or populated with ///.
- Click Apply to save your settings, then Close to close the FTP Parameters page.
Figure 148 Install Parameters Page

- Click Download. The download begins. You can view the status of the download in the Download Status field. See Table 37 Download & Install Status Parameters.
- Once the download has been completed, verify that the version you want to install has been downloaded. You can check the downloaded version for each component by viewing the Downloaded Version column in the Versions page. See Viewing Current Software Versions.

Caution
If upgrading from version 7.9 or earlier:
Before you proceed to install the software, repeat the download process even if Download Success is displayed in the Download status field, until the unit displays the message No new software modules found.
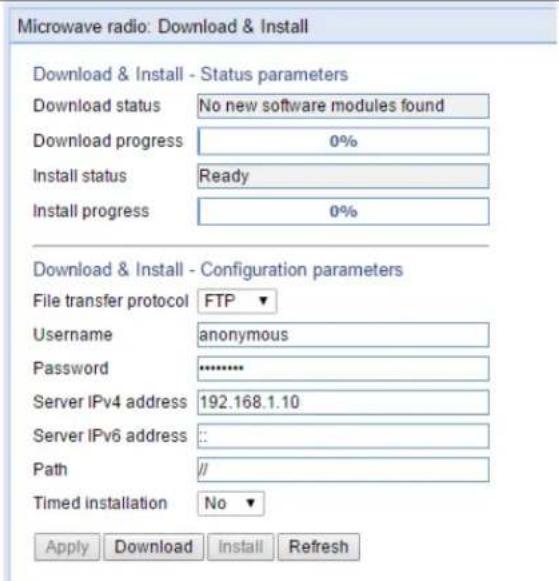
In case of failure, wait at least 30 minutes and repeat the software download.
- Click Install. The installation begins. You can view the status of the installation in the Download & Install - Status Parameters section of the Installation Status field. See Table 37 Download & Install Status Parameters.
Installing Software

Note
For instructions how to configure a timed installation, see Configuring a Timed Installation.
To install software:
- Download the software version you want to install. See Dowloading and Installing Software.
- Select Platform > Software > Download & Install. The Download & Install page opens.
- Click Install. The installation begins. You can view the status of the installation in the Installation Status field. See Table 37 Download & Install Status Parameters.

Note
RFU software must be installed separately. See Installing RFU Software.
Upon completion of the installation, the system performs an automatic reset.

Note
- DO NOT reboot the unit during the software installation process. As soon as the process is successfully completed, the unit will reboot itself.
• Sometimes the installation process can take up to 30 minutes. - Only in the event that software installation was not successfully finished and more than 30 minutes have passed can the unit be rebooted.
Table 41 Download & Install Status Parameters
| Parameter Definition | |
| Download Status | The status of any pending software download. Possible values are:Ready– The default value, which appears when no download is in progress.Verifying download files– The system is verifying the files to be downloaded.Download in progress– The download files have been verified, and the download is in progress.If an error occurs during the download, an appropriate error message is displayed in this field.When the download is complete, one of the following status indications appears:Download SuccessDownload FailureAll components already found in the systemWhen the system is reset, the Download Status returns to Ready. |
| Download Percentage | Displays the progress of the current software download. |
| Install Status | The status of any pending software installation. Possible values are:Ready– The default value, which appears when no installation is in progress.Verifying installation files– The system is verifying the files to be installed.Installation in progress– The installation files have been verified, and the installation is in progress.If an error occurs during the installation, an appropriate error message is displayed in this field.When the installation is complete, one of the following status indications appears:Installation SuccessInstallation Partial SuccessInstallation Failureincomplete-sw-versionWhen the system is reset, the Installation Status returns to Ready. |
| Install Percentage | Displays the progress of the current software installation. |
Configuring a Timed Installation
You can schedule a timed (deferred) software installation to take place at any time within 24 hours after you configure the installation.
To schedule a timed software installation:
- Download the software version you want to install. See Downloading and Installing Software.
- Select Platform > Software > Timer Parameters. The Timer Parameters – Software Installation page opens.
- Click Install Parameters. The Install Parameters page opens.
Figure 149 Install Parameters page
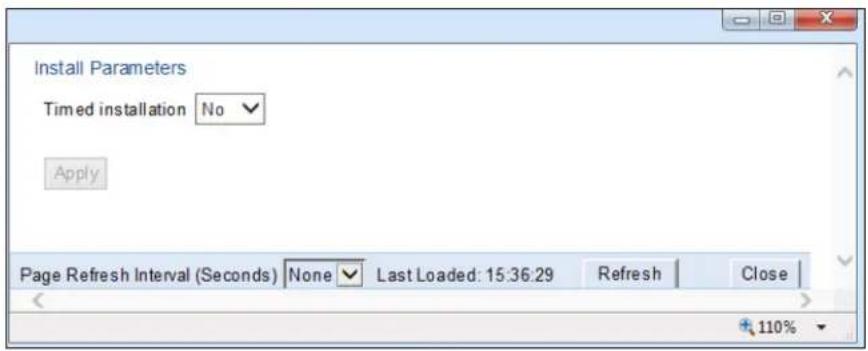
- Select Yes in the Timed installation field.
- Click Apply. The Software management timer field appears.
Figure 150 Timer Parameters - Software Installation Page
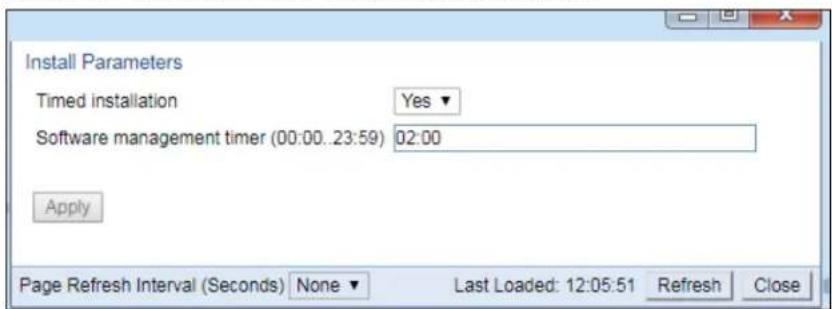
- In the Software management timer field, enter the amount of time, in hours and minutes, you want to defer the installation. For example, in Figure 144, the timer is set for two hours after the timer was configured (02:00).
- Click Apply, the close to close the Install Parameters Page.
Installing RFU Software
Although RFU software is included in the standard installation bundle, the current software version is not automatically updated in the RFU when an installation is performed. To upgrade the software in an RFU you must perform the upgrade manually, per slot. This enables you to manage IDU and RFU[RFU]software versions separately.
In this version, you must use the Command Line Interface (CLI) to upgrade RFU software. For instructions, refer to Installing and Upgrading Software in the RFU (CLI).
Backing Up and Restoring Configurations
You can import and export PTP 820G and PTP 820-F configuration files. This enables you to copy the system configuration to multiple PTP 820G and PTP 820F units. You can also backup and save configuration files.
Importing and exporting configuration files can be done using HTTP, HTTPS, FTP, or SFTP.
This section includes:
- Configuration Management Overview
• Viewing Current Backup Files - Setting the FTP/SFTP Configuration Management Parameters
- Exporting a Configuration File
- Importing a Configuration File
- Deleting a Configuration File
• Backing Up the Current Configuration
• Restoring a Saved Configuration
Configuration Management Overview
System configuration files consist of a zip file that contains three components:
- A binary configuration file used by the system to restore the configuration.
- A text file which enables users to examine the system configuration in a readable format. The file includes the value of all system parameters at the time of creation of the backup file.
- An additional text file which enables you to write CLI scripts in order to make desired changes in the backed-up configuration. This file is executed by the system after restoring the configuration.
The system provides three restore points to manage different configuration files. Each restore point contains a single configuration file. Files can be added to the restore points by creating backups of the current system state or by importing them from an external server. For example, you may want to use one restore point to keep a last good configuration, another to import changes from an external server, and the third to store the current configuration.
You can apply a configuration file to the system from any of the restore points.
Viewing Current Backup Files
The system provides three restore points to manage different configuration files. Each restore point contains a single configuration file. Files can be added to the restore points by creating backups of the current system state or by importing them from an external server. For example, you may want to use one restore point to keep a last good configuration, another to import changes from an external server, and the third to store the current configuration.
To display the configuration files currently saved at the system restore points:
- Select Platform > Configuration > Backup Files. The Backup Files page opens. For a description of the information provided in the Backup Files page, see Table 38 Backup Files Page Columns.
Figure 151 Backup Files Page
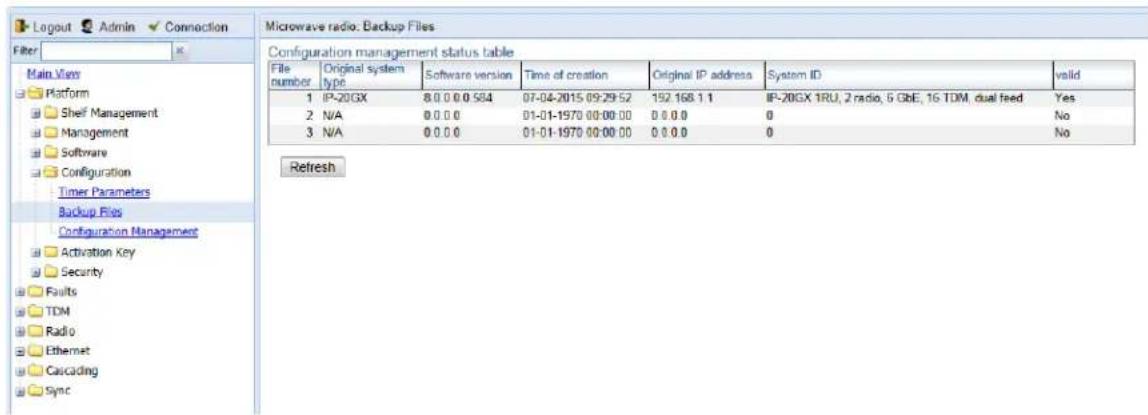
Table 42 Backup Files Page Columns
| Parameter Definition | |
| File number | A number from 1 to 3 that identifies the restore point. |
| Original system type | The type of unit from which the backup configuration file was created. |
| Software version | The software version of the unit from which the backup configuration file was created. |
| Time of creation | The time and date on which the configuration file was created. |
| Original IP address | The IP address of the unit from which the configuration file was created. |
| System ID | The System ID, if any, of the unit from which the configuration file was created. This is taken from the Name field in the Unit Parameters page.See Configuring Unit Parameters. |
| Valid Reserved for future use. | |
Setting the FTP/SFTP Configuration Management Parameters
When importing and exporting configuration files, the PTP 820G/F functions as an FTP or SFTP client. You must install FTP or SFTP server software on the PC or laptop you are using to perform the import or export. For details, see Configuring the Internal Ports for FTP or SFTP
Installing and Configuring an FTP or SFTP Server.
Before importing or exporting a configuration file, you must perform the following steps:
- Verify that the system date and time are correct. See Setting the Time and Date (Optional).
- Install and configure an FTP server on the PC or laptop you are using to perform the import or export. See Configuring the Internal Ports for FTP or SFTP.
- In the PTP 820G's Web EMS, select Platform > Configuration > Configuration Management. The Configuration Management page opens.
- In the Configuration Management page, select FTP.
Figure 152 Configuration Management Page – FTP/SFTP

- Click FTP Parameters to display the FTP Parameters page.
Figure 153 FTP Parameters Page (Configuration Management)

- In the File transfer protocol field, select the file transfer protocol you want to use (FTP or SFTP).
- In the Username field, enter the user name you configured in the FTP server.
- In the Password field, enter the password you configured in the FTP server. If you did not configure a password for your FTP user, simply leave this field blank.
- If the IP address family is configured to be IPv4, enter the IPv4 address of the PC or laptop you are using as the FTP server in the Server IP address field. See Defining the IP Protocol Version for Initiating Communications.
- If the IP address family is configured to be IPv6, enter the IPv6 address of the PC or laptop you are using as the FTP server in the Server IPv6 address field. See Defining the IP Protocol Version for Initiating Communications.
- In the Path field, enter the location of the file you are downloading or uploading. If the location is the root shared folder, it should be left empty. If the location is a sub-folder under the root shared folder, specify the folder name. If the shared folder is "C:\", this parameter can be left empty or populated with "//".
- Click Apply, then Close, to save the FTP parameters and return to the Configuration Management page.
- In the File name field, enter the name of the file you are importing, or the name you want to give the file you are exporting.

Note
You must add the suffix .zip to the file name. Otherwise, the file import may fail. You can export the file using any name, then add the suffix .zip manually.
- Click Apply, then Close, to save the FTP parameters and return to the Configuration Management page.
- In the File number field, select from three system restore points:
When you import a configuration file, the file is saved to the selected restore point, and overwrites whichever file was previously held in that restore point.
- When you export a configuration file, the file is exported from the selected restore point.
When you back up the current configuration, the backup configuration file is saved to the selected restore point, and overwrites whichever file was previously held in that restore point.
When you restore a configuration, the configuration file in the selected restore point is the file that is restored.

Note
The Timed installation field is reserved for future use.
- Click Apply to save your settings.
Exporting a Configuration File
You can export a saved configuration file from one of the system's three restore points to a PC or laptop. You can use FTP, SFTP, HTTP, or HTTPS to export a configuration file.
Exporting a Configuration File Via HTTP or HTTPS
To export a configuration file:
- Verify that you have followed all the steps in Setting the Configuration Management Parameters.
- Select Platform > Configuration > Configuration Management. The Configuration Management page opens (Figure 146).
- In the File Number field, select the restore point from which you want to export the file.
- Click Apply to save your settings.
-
Click Export. The export begins. You can view the status of the export in the File Transfer status field in the Export/Import file status section. Possible values are:
-
Ready – The default value, which appears when no import or export is in progress.
- File-in-Transfer – The file export is in progress.
- If an error occurs during the import or export, an appropriate error message is displayed in this field.
When the import or export is complete, one of the following status indications appears:
○ Succeeded
○ Failure
The next time the system is reset, the File Transfer status field returns to Ready.
Importing a Configuration File
You can import a saved configuration file from a PC or laptop to one of the system's three restore points. You can use FTP, SFTP, HTTP, or HTTPS to export a configuration file.
To import a configuration file:
- Verify that you have followed all the steps in Setting the Configuration Management Parameters.
- Select Platform > Configuration > Configuration Management. The Configuration Management page opens (Figure 146).
- In the File Number field, select the restore point to which you want to import the file.
-
Click Apply to save your settings.
-
Click Import. The import begins. You can view the status of the import in the File Transfer status field in the Export/Import file status section. Possible values are:
-
Ready – The default value, which appears when no import or export is in progress.
- File-in-Transfer – The file import is in progress.
- If an error occurs during the import or export, an appropriate error message is displayed in this field.
When the import or export is complete, one of the following status indications appears:
○ Succeeded
○ Failure
The next time the system is reset, the File Transfer status field returns to Ready.
After importing the configuration file, you can apply the configuration by restoring the file from the restore point to which you saved it. See Restoring a Saved Configuration.
Deleting a Configuration File
You can delete a saved configuration file from any of the system's three restore points:
To delete a configuration file:
- Select Platform > Configuration > Configuration Management. The Configuration Management page opens (Figure 146).
- In the File Number field, select the restore point that holds the configuration file you want to delete.
- Click Delete. The file is deleted.
Backing Up the Current Configuration
You can back up the current configuration file to one of the system's three restore points.
To back up a configuration file:
- Select Platform > Configuration > Configuration Management. The Configuration Management page opens (Figure 146).
- In the File Number field, select the restore point to which you want to back up the file. If another configuration file is already saved to that restore point, it will be overwritten by the file you back up.
-
Click Backup. The backup begins. You can view the status of the backup in the Backup file creation status field. Possible values in the status field are:
-
Ready – The default value, which appears when no backup is in progress.
- Generating file – The system is verifying the files to be backed up.
If an error occurs during the backup, an appropriate error message is displayed in this field.
When the backup is complete, one of the following status indications appears:
○ Succeeded
○ Failure
The next time the system is reset, the Backup file creation status field returns to Ready.
Restoring a Saved Configuration
You can replace the current configuration with any configuration file saved to one of the system's three restore points by restoring the configuration file from the restore point.
To restore a configuration file:
- Select Platform > Configuration > Configuration Management. The Configuration Management page opens (Figure 146 Configuration Management Page).
- In the File Number field, select the restore point that holds the configuration you want to restore.
- Click Restore. The configuration restoration begins. You can view the status of the restoration in the Configuration restore status field.

Note
While a configuration restoration is taking place, no user can make any changes to the configuration. All system configuration parameters are read-only during the configuration restoration.
Setting the Unit to the Factory Default Configuration
To restore the factory default settings:
- Select Platform > Management > Set to Factory Default. The Set to Factory Default page opens.
Figure 154 Set to Factory Default Page

- Click Set to Factory Default. The unit is restored to its factory default settings. This does not change the unit's IP address.
Performing a Hard (Cold) Reset
To initiate a hard (cold) reset on the unit:
-
Select Platform > Management > Reset. The Reset page opens.
-
Click Reset. The unit is reset.
Figure 155 Reset Page
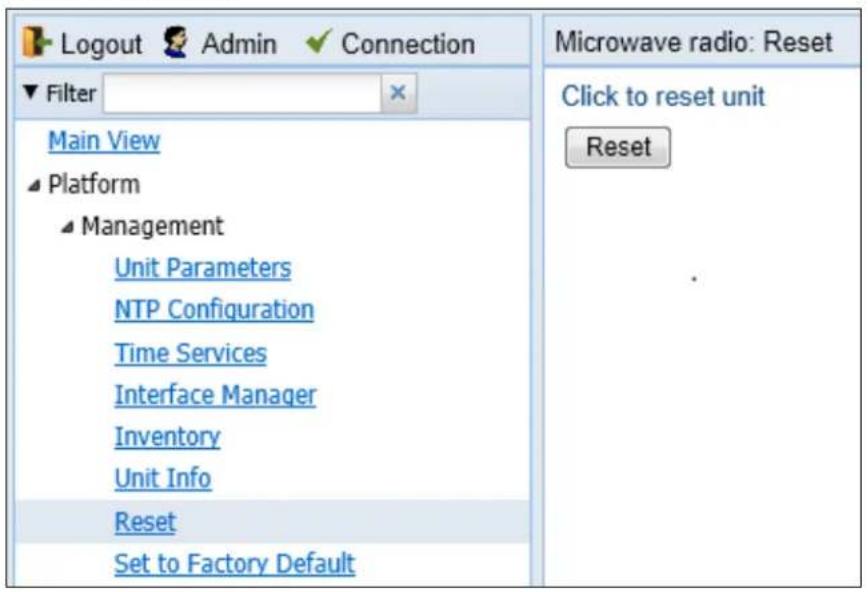
Configuring Unit Parameters
To view and configure system information:
- Select Platform > Management > Unit Parameters. The Unit Parameters page opens.
Table 39 describes the fields in the Unit Parameters page.
Figure 156 Unit Parameters Page
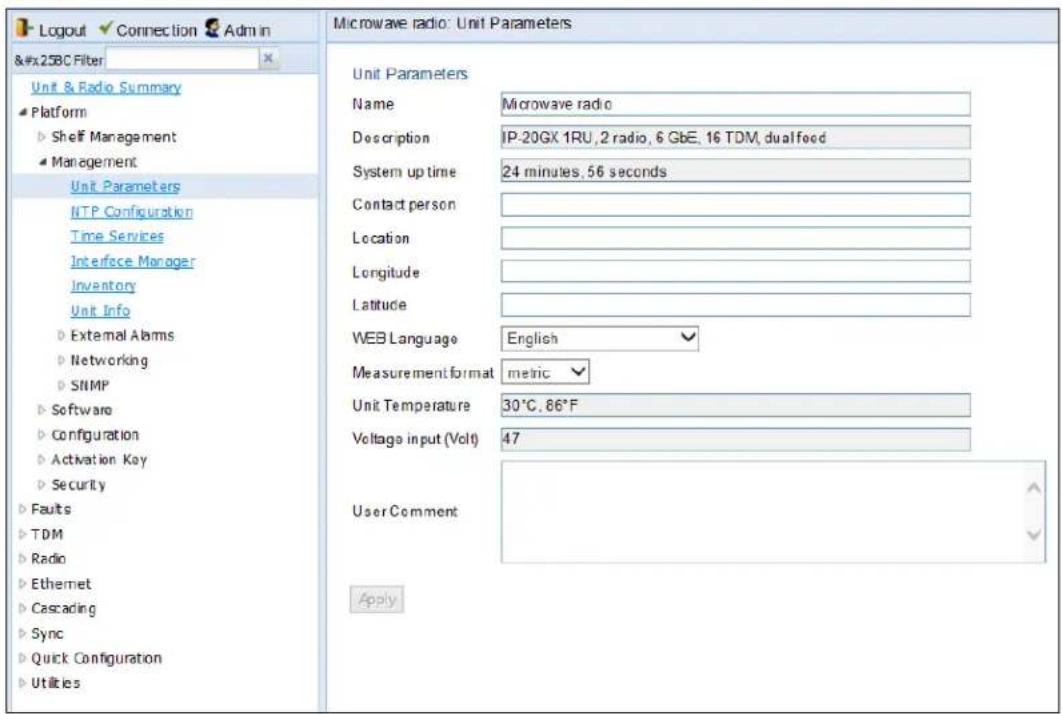
Table 43 Unit Parameters
| Parameter Definition | |
| Name | A name for the unit (optional, up to 128 characters). This name appears at the top of every Web EMS page. |
| Description | Descriptive information about the unit. This information is used for debugging, and should include information such as the chassis type. |
| System up time | The time since the system was last reinitialized. |
| Contact person | The name of the person to be contacted if and when a problem with the system occurs (optional). |
| Location | The actual physical location of the node or agent (optional). |
| Longitude The unit's longitude coordinates. | |
Parameter Definition
| Latitude The unit's latitude coordinates. | |
| WEB Language | Enables you to select the language in which the Web EMS is displayed. In release 11.3, the following languages are available:• English (default)• Russian |
| Measurement format | The type of measurement you want the system to use: Metric or Imperial. |
| Unit Temperature The current temperature of the unit. | |
| Voltage input (Volt) | The voltage input of the unit. |
Configuring NTP
PTP 820G and PTP 820F support Network Time Protocol (NTP). NTP distributes Coordinated Universal Time (UTC) throughout the system, using a jitter buffer to neutralize the effects of variable latency.
You can configure up to four NTP servers. Each server can be configured using IPv4 or IPv6. When multiple servers are configured, the unit chooses the best server according to the implementation of Version 4.2.6p1 of the NTPD (Network Time Protocol Daemon). The servers are continually polled. The polling interval is determined by the NTPD, to achieve maximum accuracy consistent with minimum network overhead.
To view and configure the NTP Parameters:
- Select Platform > Management > NTP Configuration. The NTP Configuration page opens.
Figure 157 NTP Configuration Page

- Select a row in the NTP Configuration table and click Edit. The NTP Configuration Edit page opens.

IP Configuration
IPv4 ○ IPv6
NTP server IPv4 address 0.0.0.0
Apply
Page Refresh Interval (Seconds) None Last Loaded: 14:36:35 Refresh Close
- In the NTP Admin field, select Enable.
- In the NTP version field, select the NTP version you want to use. Options are NTPv3 and NTPv4. NTPv4 provides interoperability with NTPv3 and with SNTP.
- Select IPv4 or IPv6.

Note
For each NTP server, you can define an IPv4 address or an IPv6 address but not both.
- In the NTP server IPv4 address or NTP server IPv6 address field, enter the IP address of the NTP server.
- Click Apply Once you click Apply, the NTP Status Parameters appear. Table 46 describes the NTP Status Parameters.
Table 40 describes the status parameters that appear in the NTP Configuration page.
Table 44 NTP Status Parameters
| Parameter Definition | |
| Poll interval | Displays the interval used by the NTP client to maintain synchronization with the current NTP server. |
| Sync on NTP server IP address | Displays the IP address of the remote NTP server on which the NTP client is currently locked. |
| Client lock status | Indicates if the NTP client is locked on a remote NTP server. Possible values are:LOCK– The NTP client is locked on the remote server.LOCAL– The NTP client is locked on the local system clock (free running clock).N/A– The NTP client is not locked on any clock. |
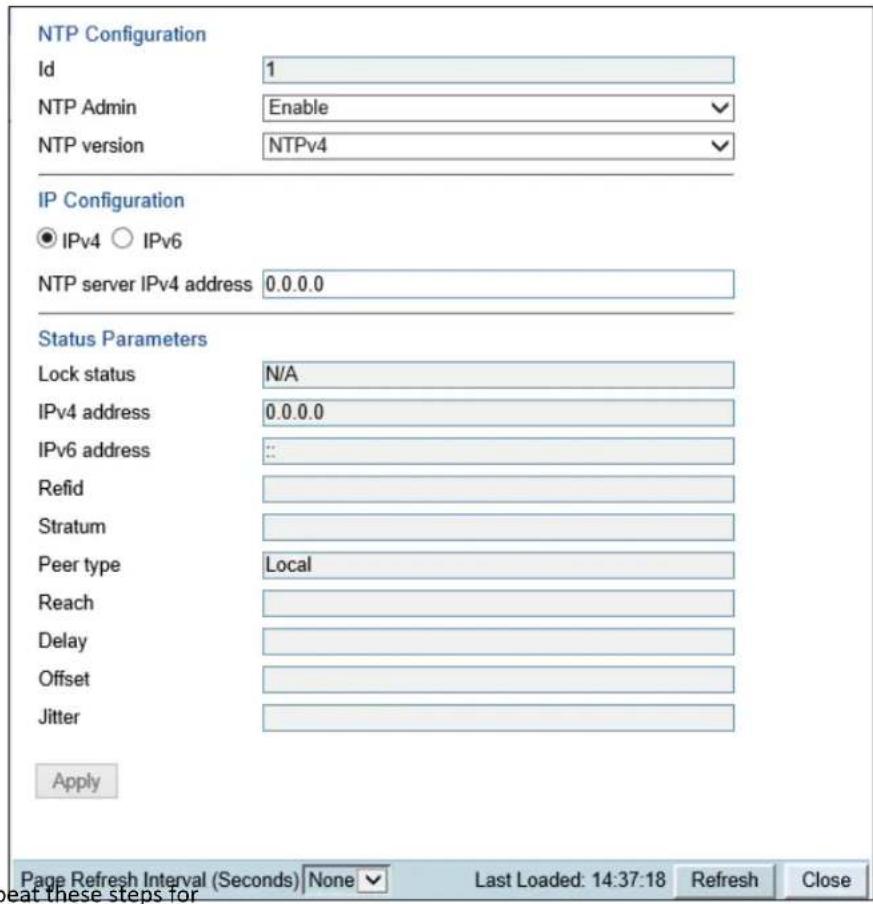
- Repeat these steps for each NTP server you want to configure, up to four servers.
| Parameter Definition | |
| Lock status | Indicates the NTP status of the unit. Possible values are:LOCK– The NTP client is locked on a remote server.LOCAL– The NTP client is locked on the local system clock (free running clock).CANDIDATE– The server is next in line to be selected if the currently locked server is discarded.N/A– The NTP client is not locked on any clock or NTP is disabled. |
| IPv4 address | The IPv4 address of the NTP server (if configured). |
| IPv6 address | The IPv6 address of the NTP server (if configured). |
| Refid The NTP client time server. | |
| Stratum The NTP client statum. | |
| Peer type The server peer type. | |
Parameter Definition
| Reach | The result of the last 8 polls in octal form. |
| Delay | The round trip delay to peer in milliseconds. |
| Offset Offset to the client in milliseconds. | |
| Jitter | Variance in latency on the network. |
Displaying Unit Inventory
To view the unit's part number and serial number:
- Select Platform > Management > Inventory. The Inventory page opens, showing the unit's part number and serial number.
Figure 158 Inventory Page

Defining a Login Banner
You can define a login banner of up to 2,000 bytes. This banner will appear every time a user establishes a connection with the Web EMS. The banner appears before the login prompt, so that users will always see the login banner and must manually close the banner before logging in to the Web EMS.
To define a login banner:
- Select Platform > Management > Login Banner.
The Login Banner page appears.
Figure 159 Login Banner Page
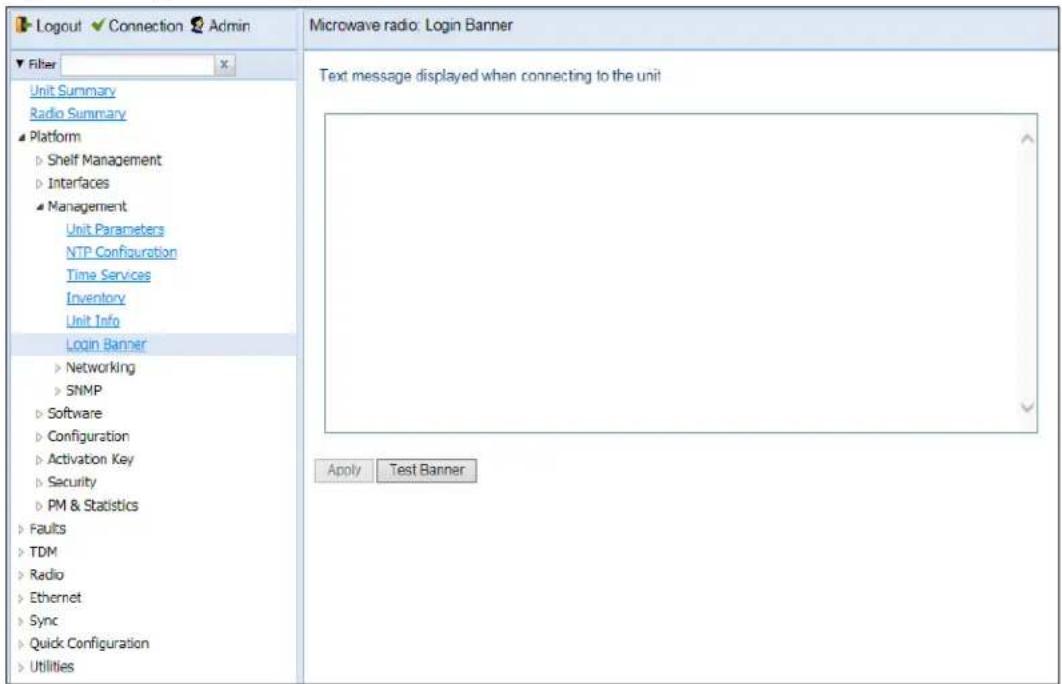
- Enter a text message of up to 2,000 bytes.
- To display a test banner as it will appear to users, click Test Banner.
- Click Apply.
Chapter 5: Radio Configuration
This section includes:
• Viewing the Radio Status and Settings
- Configuring the IDU-RFU Connection (PTP 820F only)
- Configuring the Remote Radio Parameters
- Configuring ATPC and Override TimerConfiguring ATPC
- Configuring Header De-Duplication
- Configuring Frame Cut-Through
• Viewing Header De-Duplication and Frame Cut-Through Counters
- Configuring AES-256 Payload Encryption
- Configuring and Viewing Radio PMs and Statistics
Related topics:
- RFU Overview
- Configuring the Radio Parameters
- Configuring the Radio (MRMC) Script(s)
- Radio Configurations
- Configuring Multi-Carrier ABC
- Configuring XPIC
- Configuring HSB Radio Protection
• Performing Radio Loopback
Viewing the Radio Status and Settings
You can configure the radios and display the radio parameters in the Radio Parameters page.

Note
For instructions how to configure the radio parameters, see Configuring the Radio Parameters.
To display the radio parameters:
- Select Radio > Radio Parameters. The Radio Parameters page opens.
Figure 160 Radio Parameters Page
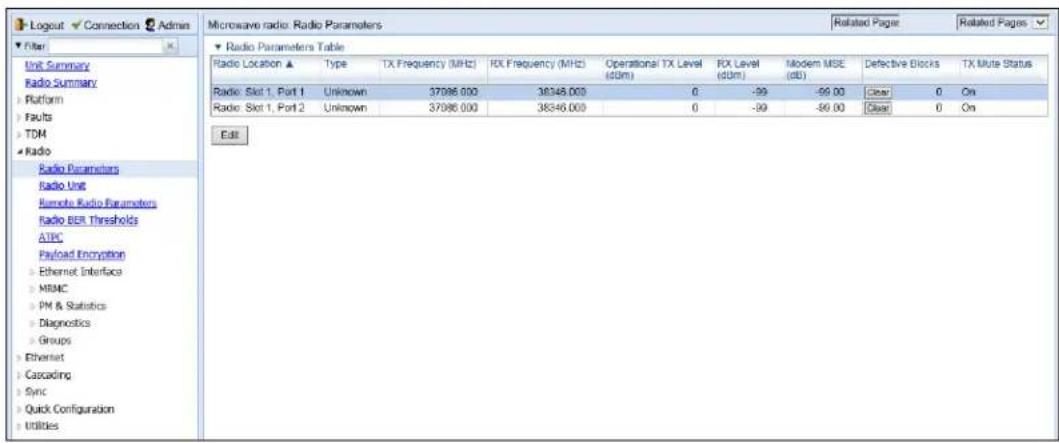

Note
For PTP 820G, the fixed radio interfaces are identified as Slot 1 Port 1 and Slot 1 Port 2.
For PTP 820F, Port 2 represents the second radio carrier in a Multi-Carrier RFU.
- To display detailed status parameters of a specific radio, select the radio in the Radio table and click Edit. A separate configuration page opens.
Figure 161 Radio Parameters Page Per Carrier

Table 41 lists and describes the parameters in the Radio table of the Radio Parameters page and the Status parameters section of the Radio Parameters configuration page.
Table 45 Radio Status Parameters
| Parameter Definition | |
| Radio location | Identifies the radio interface (Slot 1, port 1 or Slot 1, port 2). |
| Type | The type of RFU connected to the radio interface. |
| TX Frequency | The configured TX radio frequency. The TX radio frequency is configured in the Frequency control (Local) section of the Radio Parameters page.See Configuring the Radio Parameters. |
| RX Frequency | The configured RX radio frequency. The RX radio frequency is configured in the Frequency control (Local) section of the Radio Parameters page. See Configuring the Radio Parameters. |
| Part Number | The part number of the RFU connected to the radio interface. |
| Serial-Number | The serial number of the RFU connected to the radio interface. |
| Running Software Version | The software version currently running on the RFU connected to the radio interface. |
| XPIC support | Indicates whether the RFU supports Cross Polarization Interference Canceller (XPIC). For instructions on configuring XPIC, see Configuring XPIC. |
| Radio interface operational status | Indicates whether the radio is operational (Up) or not operational (Down). |
| Operational TX Level (dBm) | The actual TX signal level (TSL) of the RFU (in dBm). |
| RX Level (dBm) | The actual measured RX signal level (RSL) of the RFU (in dBm). |
| Modem MSE (dB) | The MSE (Mean Square Error) of the RX signal, measured in dB. A value of -9900 (-99.00 dB) means that the modem is not locked. |
| Modem XPI (dB) | The current XPI (Cross Polar Interference) level. The value is valid only when the modem is locked on a signal. |
| Defective Blocks | The number of defective radio blocks that have been counted. Click Clear Counter to reset this counter. |
| TX Mute Status | Indicates whether radio transmission is muted. |
| Temperature | The current temperature of the RFU. |
Configuring the IDU-RFU Connection (PTP 820F only)
For PTP 820F, you must configure the following IDU-RFU connection parameters:
- PoE Power – Certain RFU types can receive PoE power from the IDU when they are connected to the IDU via the PTP 820F RJ-45 RFU interface. See IDU-RFU Connection and Power Supply. By default, the Power Admin field in the Radio Unit page is set to Enable. If PoE power is being supplied to the RFU, this default setting should be kept. If power is being supplied to the RFU from an external power source, the Power Admin field should be set to Disable to avoid unnecessary alarms.
- Media Type – In System Release 10.0, you can use only one PTP 820F combo radio interface (RFU1), but you can choose between the electrical (RJ-45) RFU1 interface or the optical SFP RFU1 interface. The Media Type parameter must match the interface type actually being used on the IDU. The default value is RJ45. If you are using an SFP interface, you must set this parameter to SFP.

Note
If the port RFU3/2.5GE5 is used for Ethernet traffic but the Power Admin field is mistakenly set to its default setting of Enable, the Power Status will remain in Detecting mode. Although no damage will be caused to external devices, Power Admin should be set to Disable.
Figure 162 RFU1 Radio Interfaces on PTP 820F
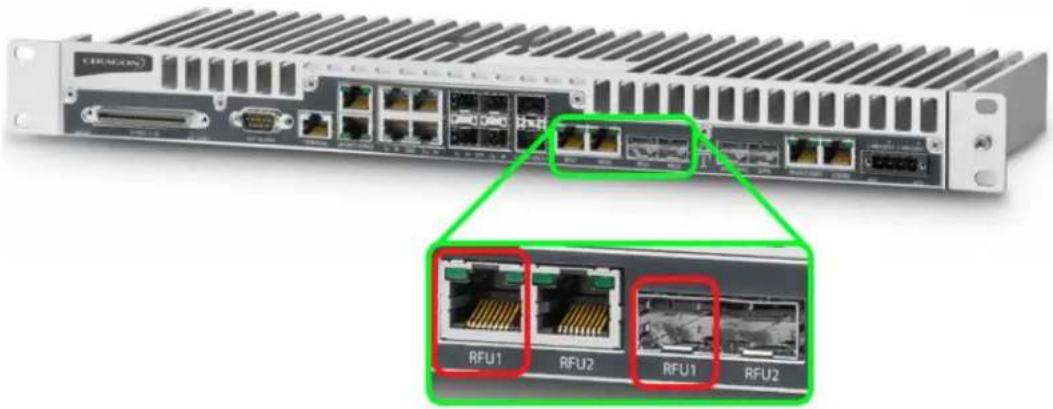
To view or configure the PTP 820F's IDU-RFU connection parameters:
- Select Radio > Radio Unit. The Radio Unit page opens.
Note that in the Radio Unit page, each RFU interface is listed as Slot 1. The Port number indicates the number of the RFU port:
- RFU2 – Radio Unit Slot 1, Port 2
- RFU3 – Radio Unit Slot 1, Port3
Figure 163 Radio Unit Page (PTP 820F)

- Select the radio unit you want to configure and click Edit. The Radio Unit – Edit page opens.

- By default, the Admin Status is set to Enable. To disable the RFU, select Disable in the Admin Status field.
- By default, the Power Admin field is set to Enable. If PoE power is not being used for the RFU connected to this PTP 820F, select Disable in the Power Admin field.
- By default, the Media Type field is set to RJ45. If the RFU is connected to the PTP 820F via the PTP 820F optical (SFP) port, select SFP in the Media Type field.
- Click Apply.
For a full description of the parameters on the page, see the following table.
Table 46 Radio Unit Parameters
| Parameter Definition | |
| Operational Status | The current status of the IDU-RFU connection. |
| Power Status | Read-only. Indicates whether the IDU is supplying PoE power to the RFU. Possible values are:Supplying – PoE power is being supplied to the RFU via the PTP 820FDetecting – Usually, this indicates a transient state immediately after connecting the RFU to the IDU. If it lasts for more than about one second, it indicates that there is no power consumption, usually because the RFU is not properly connected to the IDU.Fault – PoE power to the RFU is disabled due to a hardware failure, usually a short circuit.Disable – The Power Admin field is set to Disable. |
| Admin Status | The configured status of the RFU connected to the PTP 820F. By default, the status is Enabled. |
| Power Admin | Determines whether the IDU supplies PoE power to the RFU. By default, Power Admin is Enabled. |
| Media Type | The interface type on the PTP 820F connected to the RFU. The default value is RJ45. |
Configuring the Remote Radio Parameters
To view and configure the parameters of the carrier or carriers at the remote side of the link:
To display the remote radio parameters:
- Select Radio > Remote Radio Parameters. The Remote Radio Parameters page opens.
Figure 164 Remote Radio Parameters Page

- Select the radio the remote radio of which you want to configure and click Edit. The Remote Radio Parameters – Edit page opens.
Figure 165 Remote Radio Parameters – Edit Page

-
Configure the remote radio parameters. For a description of these parameters, see Table 43 Remote Radio Parameters.
-
Click Apply.
Figure 166: Remote Radio Parameters Page Per Carrier – PTP 820G

You can also reset the remote radio or the entire remote unit from the Remote Radio Parameters – Edit page:
• To reset the remote radio, click Reset remote Slot.
• To reset the entire remote unit, click Reset Remote Unit.
.Table 47 Remote Radio Parameters
| Parameter Definition | |
| Radio Location | Identifies the radio interface (Slot 1, port 1 or Slot 1, port 2). |
| Remote Radio Location | Read-only. Identifies the location of the remote radio. |
| Local Remote Channel Operational Status | Read-only. The operational status of the active (in a protection configuration) remote channel. |
| Remote Receiver Signal Level | Read-only. The Rx level of the remote radio, in dBm. |
| Remote Most Severe Alarm | Read-only. The level of the most severe alarm currently active on the remote unit. |
| Remote Tx Output Level | The remote unit's Tx output level, if the remote unit has been configured to operate at a fixed Tx level (in dBm). |
| Remote Radio Mute | To mute the TX output of the remote radio, select On. To unmute the TX output of the remote radio, select Off. |
| Remote IP Address | The IPv4 IP address of the remote unit. |
| Remote IPv6 Address | The IPv6 IP address of the remote unit. |
Displaying Communication Status with Remote Radio (CLI)
To display the communication status with the remote radio, enter the following command in radio view:
radio[x/x]>remote-unit communication status show
Displaying Remote Radio's Link ID and Location (CLI)
To display the remote radio's Link ID, enter the following command in radio view:
radio[x/x]>remote-unit show link-id
To display the remote radio's slot ID (location in the chassis), enter the following command in radio view:
radio[x/x]>remote-unit show slot-id
Muting and Unmuting the Remote Radio (CLI)
To mute or unmute the remote radio, enter the following command in radio view:
radio[x/x]>remote-unit mute set admin <admin>
To display the mute status of the remote radio, enter the following command in radio view:
radio[x/x]>remote-unit mute show status
Table 48: Remote Radio Mute and Unmute CLI Parameters
| Parameter | Input Type | Permitted Values | Description |
| admin Variable | on off | Mutes (on) or unmutes (off) the remote unit. |
The following command mutes the remote radio connected to fixed radio interface 2:
radio[1/2]>remote-unit mute set admin on
The following command unmutes the remote radio connected to fixed radio interface 1:
radio[1/1]>remote-unit mute set admin off
Displaying the Remote Radio's RX Level (CLI)
To display the remote radio's RX level, enter the following command in radio view:
radio[x/x]>remote-unit show rx-level
Configuring the Remote Radio's TX Level (CLI)
To set the transmit (TX) level of the remote radio, enter the following command in radio view:
radio[x/x]>remote-unit set tx-level
To display the transmit (TX) level of the remote radio, enter the following command in radio view:
radio[x/x]>remote-unit show tx-level
Table 49: Remote Radio TX Level CLI Parameters
| Parameter | Input Type | Permitted Values Description | |
| tx-level | Number | Depends on the frequency and RFU type. | The desired TX signal level (TSL), in dBm. |
The following command sets the TX level of the remote radio connected to fixed radio interface 1 to 10dBm :
radio[1/1]>remote-unit set tx-level 10
Configuring Remote ATPC (CLI)
To set the RX reference level for ATPC on the remote radio, enter the following command in radio view:
radio[x/x]>remote-unit atpc set ref-level
To display the RX reference level for ATPC on the remote radio, enter the following command in radio view:
radio[x/x]>remote-unit atpc show ref-level
Table 50: Remote Radio ATPC CLI Parameters
| Parameter | Input Type | Permitted Values | Description |
| ref-level | Number | -70 - -30 | The RX reference level for the ATPC mechanism. |
Configuring ATPC and Override Timer
ATPC is a closed-loop mechanism by which each carrier changes the TX power according to the indication received across the link, in order to achieve a desired RSL on the other side of the link.
With ATPC, if the radio increases its TX power up to the configured TX power, it can lead to a period of sustained transmission at maximum power, resulting in unacceptable interference with other systems.
In order to minimize interference, PTP 820G and PTP 820F provides an ATPC override mechanism. When ATPC override is enabled, a timer begins when ATPC raises the TX power to its maximum. When the timer expires, the radio enters ATPC override state. In ATPC override state, the radio transmits no higher than the pre-determined ATPC override TX level, and an ATPC override alarm is raised. The radio remains in ATPC override state until the ATPC override state is manually cancelled by the user (or until the unit is reset). The radio then returns to normal ATPC operation.
In a configuration with unit redundancy or radio protection, the ATPC override state is propagated to the standby unit or radio in the event of switchover.

Note
When canceling an ATPC override state, you should ensure that the underlying problem has been corrected. Otherwise, ATPC may be overridden again.
To enable and configure ATPC and display the ATPC settings:
- Select Radio >ATPC. The ATPC page opens.
Figure 167 ATPC Page

- In the ATPC table, select the radio you want to configure and click Edit. The ATPC – Edit page opens.
Figure 168 ATPC – Edit Page

- In the ATPC Admin field, select Enable to enable ATPC or Disable to disable ATPC.
- Click Apply. If you selected ATPC -Admin – Enable, the Reference RX Level (dBm) and ATPC Override Admin fields are now displayed.
- In the Reference RX Level (dBm) field, enter a number between -70 and -30 as the reference value for the ATPC mechanism. When ATPC is enabled, it adjusts the TX power dynamically to preserve this RSL level. The range of values depends on the frequency, MRMC script, and RFU type
- In the ATPC Override Admin field, select Enable to enable ATPC override or Disable to disable ATPC override. You can only enable ATPC override if ATPC itself is enabled.

Note
Make sure to set an appropriate value in the Override Timeout field before enabling ATPC override. Failure to do so can lead to unexpected reduction of the TX power with corresponding loss of capacity if TX override is enabled with the timer set to a lower-than-desired value.
- Click Apply. If you selected ATPC Override Admin – Enable, the ATPC Override State, Override TX Level, and ATPC Override Admin fields are now displayed.
- In the Override TX Level field, select the TX power, in dBm, to be used when the unit is in an ATPC override state. The range of values depends on the frequency, MRMC script, and RFU type.
- In the Override Timeout field, select the amount of time, in seconds, the timer counts from the moment the radio reaches its maximum configured TX power until ATPC override goes into effect. You can select from 0 to 1800 seconds.
-
In the Remote ATPC Admin field, select Enable to enable ATPC or Disable to disable ATPC on the remote radio carrier.
-
Click Apply. If you selected Remote ATPC Admin - Enable the Remote Reference RX Level (dBm) field is now displayed.
- In the Remote Reference RX Level (dBm) field, enter a number between -70 and -30 as the reference value for the ATPC mechanism on the remote radio carrier.
- Click Apply.
To cancel an ATPC override state on the local unit, click Cancel Override.
Configuring Header De-Duplication
Header De-Duplication enables operators to significantly improve Ethernet throughout over the radio link without affecting user traffic. Header De-Duplication can be configured to operate on various layers of the protocol stack, saving bandwidth by reducing unnecessary header overhead. Header De-duplication is also sometimes known as header compression.

Note
The Header De-Duplication configuration must be identical on both sides of the link.
To configure Header De-Duplication:
- Select Radio > Ethernet Interface > Configuration. The Radio Ethernet Interface Configuration page opens.
Figure 169 Radio Ethernet Interface Configuration Page
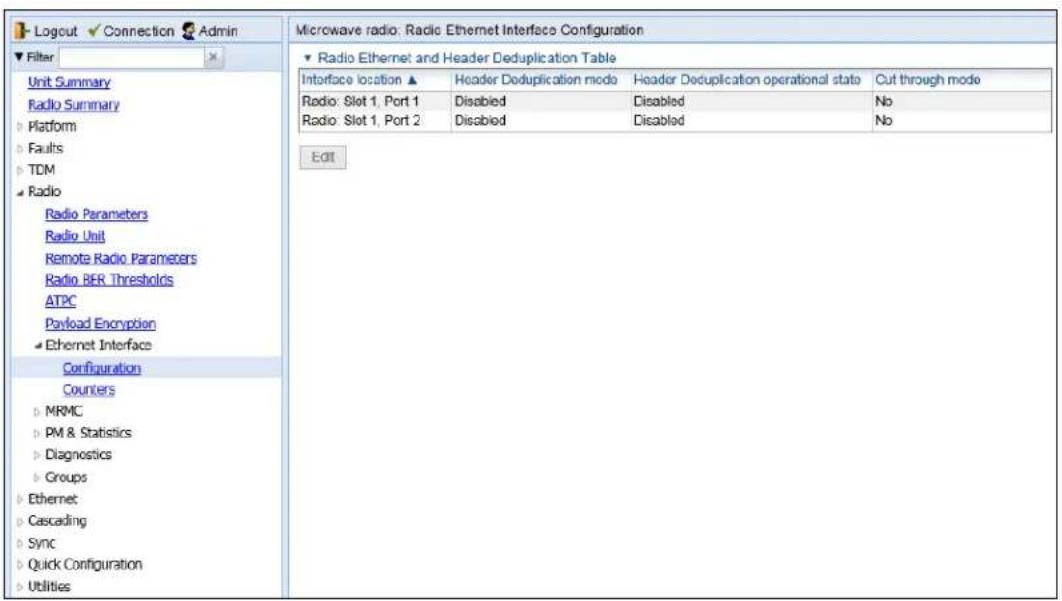
- Select the carrier and click Edit. The Radio Ethernet Interface Configuration – Edit page opens.
Figure 170 Radio Ethernet Interface Configuration – Edit Page

-
In the Header Deduplication mode field, select from the following options:
-
Disabled – Header De-Duplication is disabled.
- Layer2 – Header De-Duplication operates on the Ethernet level.
- MPLS – Header De-Duplication operates on the Ethernet and MPLS levels.
- Layer3 – Header De-Duplication operates on the Ethernet and IP levels.
- Layer4 – Header De-Duplication operates on all supported layers up to Layer 4.
- Tunnel – Header De-Duplication operates on Layer 2, Layer 3, and on the Tunnel layer for packets carrying GTP or GRE frames.
- Tunnel-Layer3 – Header De-Duplication operates on Layer 2, Layer 3, and on the Tunnel and T-3 layers for packets carrying GTP or GRE frames.
-
Tunnel-Layer4 – Header De-Duplication operates on Layer 2, Layer 3, and on the Tunnel, T-3, and T-4 layers for packets carrying GTP or GRE frames.
-
Click Apply, then Close.

Note
The Utilization threshold field is not applicable.
Configuring Frame Cut-Through
Using the Frame Cut-Through feature, frames assigned to queues with 4th priority pre-empt frames already in transmission over the radio from other queues. After the 4th queue frames have been transmitted, transmission of the pre-empted frames resumes.

Note
The Frame Cut-Through configuration must be identical on both sides of the link.
If Frame Cut-Through is used together with 1588 Transparent Clock, the 1588 packets must be given a CoS that is not assigned to the fourth priority queue.
To configure Frame Cut-Through:
- Select Radio > Ethernet Interface > Configuration. The Radio Ethernet Interface Configuration page opens.
Figure 171 Radio Ethernet Interface Configuration Page
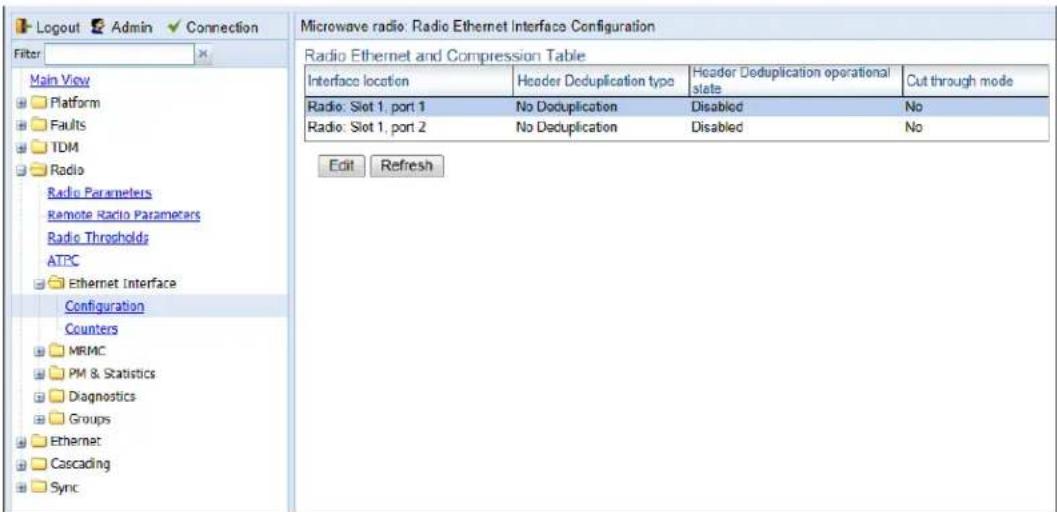
- In the Radio Ethernet and Compression table, select the radio you want to configure.
- Click Edit. The Radio Ethernet Interface Configuration – Edit page opens.
Figure 172 Radio Ethernet Interface Configuration – Edit Page

- In the Cut through mode field, select Yes to enable Frame Cut-Through or No to disable Frame Cut-Through.
- Click Apply, then Close.

Note
The other fields in the Ethernet Interface Configuration – Edit page relate to Header De-Duplication, a feature which is planned for future release. The Radio Ethernet Interface Counters page is also reserved for future use.
Viewing Header De-Duplication and Frame Cut-Through Counters
You can view PMs on the usage of Header De-Duplication.
To view Header De-Duplication counters:
- Select Radio > Ethernet Interface > Counters. The Radio Ethernet Interface Counters page opens.
Figure 173 Radio Ethernet Interface Counters Page

- Select the carrier and click View. The Radio Ethernet Interface Counters- View page opens.
Figure 174 Radio Ethernet Interface Counters – View Page
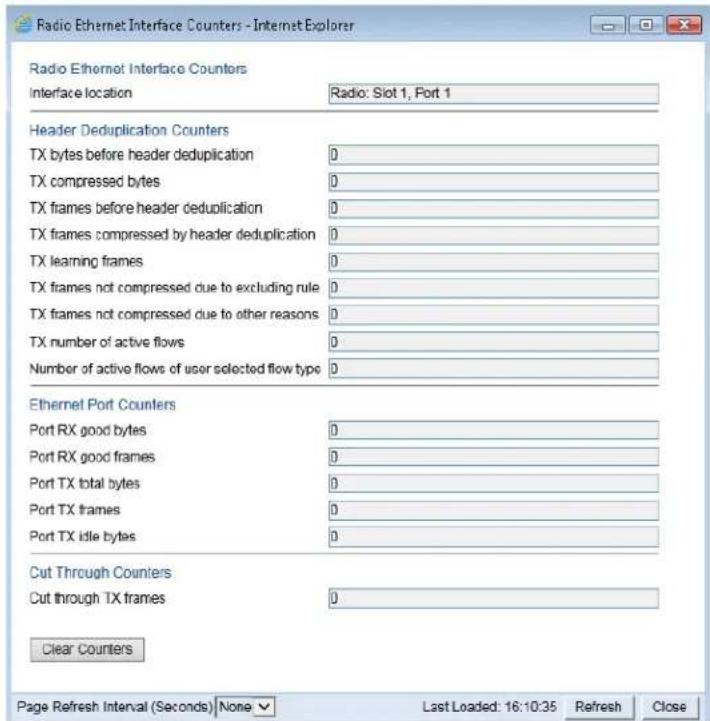
Table 44 lists and describes the fields in the Radio Ethernet Interface Counters page.
Table 51 Radio Ethernet Interface Counters Fields
| Parameter Definition | |
| Interface Location Identifies the radio interface. | |
| Header Compression Counters | |
| TX bytes before header deduplication | Bytes on the TX side before Header De-Duplication. |
| TX compressed bytes | Bytes on the TX side that were compressed by Header De-Duplication. |
| TX frames before header deduplication | Frames on the TX side before Header De-Duplication. |
| TX frames compressed by header deduplication | Frames on the TX side that were compressed by Header De-Duplication. |
| TX learning frames | The number of frames that have been used to learn unique data flows.Once a particular flow type has been learned, subsequent frames with that flow type are compressed by Header De-Duplication. |
| TX frames not compressed due to excluding rule | Frames on the TX side that were not compressed due to exclusion rules.Note: The use of exclusion rules for Header De-Duplication is planned for future release. |
| TX frames not compressed due to other reasons | Frames on the TX side that were not compressed for reasons other than the use of exclusion rules. |
| TX number of active flows | The number of Header De-Duplication flows that are active on the TX side. |
| Number of active flows of user selected flow type | Not supported. |
| Ethernet Port Counters | |
| Port RX good bytes | The number of good bytes received on the port since the last time the Radio Ethernet Interface counters were cleared. |
| Port RX good frames | The number of good frames received on the port since the last time the Radio Ethernet Interface counters were cleared. |
| Port TX total bytes | The number of bytes transmitted since the last time the Radio Ethernet Interface counters were cleared. |
| Port TX frames | The number of frames transmitted since the last time the Radio Ethernet Interface counters were cleared. |
| Port TX idle bytes | The number of idle bytes transmitted since the last time the Radio Ethernet Interface counters were cleared. |
| Cut Through Counters | |
| TX frames | The number of frames that have been transmitted via Frame Cut-Through since the last time the Radio Ethernet Interface counters were cleared. |
Configuring AES-256 Payload Encryption

Note
AES-256 is not supported with PTP 820F
This feature requires:
- Requires an activation key. If no valid AES activation key has been applied to the unit, AES will not operate on the unit. See Configuring the Activation Key.

Note
In order for the AES activation key to become active, you must reset the unit after configuring a valid AES activation key. Until the unit is reset, an alarm will be present if you enable AES. This is not the case for other activation keys.
PTP 820G supports AES-256 payload encryption. AES is enabled and configured separately for each radio carrier. PTP 820 uses a dual-key encryption mechanism for AES:
- The user provides a master key. The master key can also be generated by the system upon user command. The master key is a 32-byte symmetric encryption key. The same master key must be manually configured on both ends of the encrypted link.
- The session key is a 32-byte symmetric encryption key used to encrypt the actual data. Each link uses two session keys, one for each direction. For each direction, the session key is generated by the transmit side unit and propagated automatically, via a Key Exchange Protocol, to the other side of the link. The Key Exchange Protocol exchanges session keys by encrypting them with the master key, using the AES-256 encryption algorithm. Session keys are regenerated at user-configured intervals.
The first KEP exchange that takes place after a new master key is configured causes traffic to be blocked for up to one minute, until the Crypto Validation State becomes Valid. Subsequent KEP exchanges that take place when a session key expires do not affect traffic. KEP exchanges have no effect upon ACM, RSL, and MSE.
To configure payload encryption:
- Verify that both the local and remote units are running with no alarms. If any alarm is present, take corrective actions to clear the alarms before proceeding.
- If the link is using in-band management, identify which unit is local and which unit is remote from the management point of view.
- In a link with radio protection, enable protection lockout, first on the remote and then on the local unit. See Switchovers and Lockout.
- On the remote unit, Select Radio > Payload Encryption. The Payload Encryption page opens.
Figure 175 Payload Encryption Page
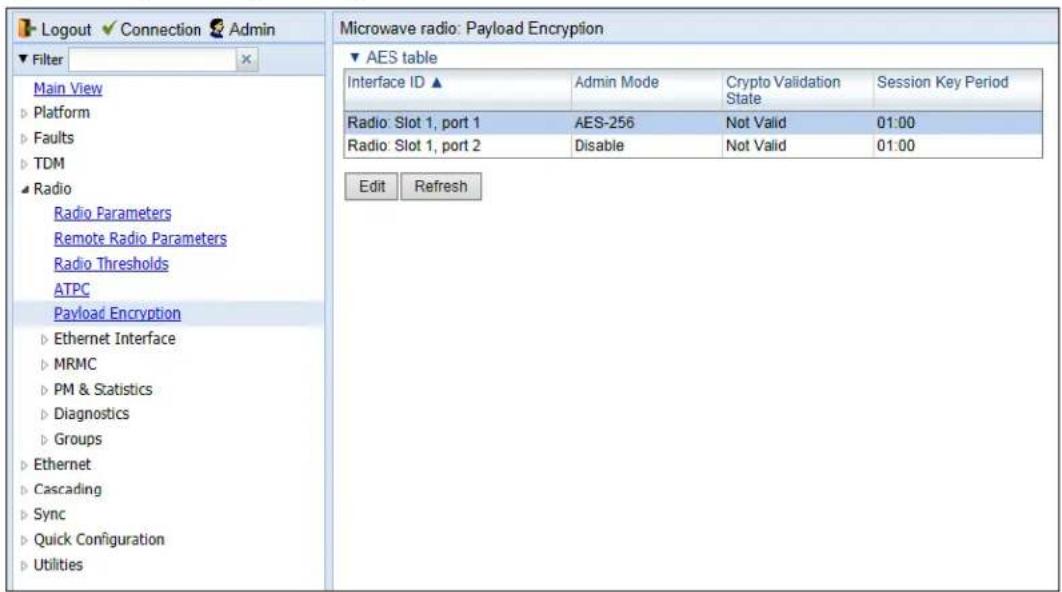
- Select the carrier you want to configure and click Edit. The Payload Encryption – Edit page opens.
Figure 176 Payload Encryption – Edit Page

-
Configure the master key by doing one of the following:
-
Enter a master key in the Master Key field. You must enter between 8 and 32 ASCII characters.
- Click Generate key to generate a master key automatically.
You must use the same master key on both sides of the link. This means that if you generate a master key automatically on one side of the link, you must copy that key and for use on the other side of the link. Once payload encryption has been enabled on both sides of the link, the Key Exchange Protocol periodically verifies that both ends of the link have the same master key. If a mismatch is detected, an alarm is raised and traffic transmission is stopped for the mismatched carrier at both sides of the link. The link becomes non-valid and traffic stops being forwarded.
When you enter a master key, or when the master key is automatically generated, the key is hidden behind dots. To copy the master key, you must display the key. To display the master key, click Show Key. A new Master key field appears, displaying the master key. You can copy the key to the clipboard from this field.
Figure 177 Payload Encryption – Edit Page with Master Key Displayed

- Record and save the master key generated in Step 6.
- On the local unit, follow Steps Error! Reference source not found. through 6 to configure the same master key configured on the remote unit also on the local unit.
- Enable payload encryption on the remote unit:
i In the Admin Mode field, select AES-256 to enable payload encryption.
ii In the Session Key Period field, configure a time interval in hours and minutes (HH:MM). This is the interval at which the session key is automatically regenerated. The Session Key Period can be from 3 minutes (00:03) to 12 hours (12:00)..

Note
The Session Key Period must be the same on both sides of the link.
iii When you are finished, click Apply.
This step will cause the link status to be Down until payload encryption is successfully enabled on the local unit. However, the RSL measured on the link should remain at an acceptable level.
-
1 Enable payload encryption on the local unit by following the procedure described in Step Error! Reference source not found.. Verify that on both the local and remote active units, the link status returns to Up and user traffic is restored. In links using in-band management, verify also that in-band management returns.
-
2 In a protected link, perform copy-to-mate, first on the remote and then on the local unit. See Copying Configuration to Mate. After the copy-to-mate operation, wait for both standby units to re-boot and verify that there are no alarms.

Note
The standby unit may have a payload encryption failure alarm for up to about one minute after the unit is up and running.
-
3 In a protected link, remove the protection lockout, first on the remote and then on the local unit. See Switchovers and Lockout.
-
4 Verify that there are no alarms on the link.

Note
Any time payload encryption fails, the Operational status of the link is Down until payload encryption is successfully restored.
Configuring and Viewing Radio PMs and Statistics
This section includes:
- Configuring BER Thresholds and Displaying current BER
• Displaying MRMC Status - Displaying MRMC PMs
• Displaying Defective Block Counters
• Displaying Signal Level PMs and Configuring Signal Level PM Thresholds
• Displaying PMs for the Combined IF Combining Signal
• Displaying Modem BER (Aggregate) PMs
• Displaying MSE PMs and Configuring MSE PM Thresholds - Displaying XPI PMs and Configuring XPI PM ThresholdsDisplaying Signal Level PMs
- Displaying Traffic PMs
Configuring BER Thresholds and Displaying Current BER
You can configure PM thresholds, BER thresholds, and Excessive BER Administration. This enables you to define the levels at which certain PMs are counted, such as the number of seconds in which the configured threshold RX and TX levels are exceeded. This also enables you to define the levels at which certain alarms are triggered.
- Signal level PM thresholds, such as RX and TX level thresholds, are configured from the Signal Level PM Report page. See Displaying Signal Level PMs and Configuring Signal Level PM Thresholds.
- MSE PM thresholds are configured from the MSE PM Report page. See Displaying MSE PMs and Configuring MSE PM Thresholds.
- XPI PM thresholds are configured from the XPI PM Report page. See Displaying XPI PMs and Configuring XPI PM Thresholds.
You can also display the current BER level.
To configure the BER thresholds and Excessive BER Administration, and display current BER levels:
- Select Radio > Radio BER Thresholds. The Radio BER Thresholds page opens. The current BER level is displayed, per radio, in the Radio BER column.
Figure 178 Radio BER Thresholds Page

- In the Excessive BER admin field, select Enable to enable excessive BER administration or Disable to disable excessive BER administration. Excessive BER administration determines whether or not excessive BER is propagated as a fault and considered a system event. For example, if excessive BER administration is enabled, excessive BER can trigger a protection switchover and can cause a synchronization source to go into a failure status. Excessive BER administration is enabled or disabled for the entire unit rather than for specific radios.
- In the Thresholds table, select the radio for which you want to configure thresholds.
- Click Edit. The Radio BER Thresholds – Edit page opens.
Figure 179 Radio BER Thresholds – Edit Page

- In the Excessive BER Threshold field, select the level above which an excessive BER alarm is issued for errors detected over the radio link.
- In the Signal Degrade BER Threshold field, select the level above which a Signal Degrade alarm is issued for errors detected over the radio link.
- Click Apply, then Close.
Displaying MRMC Status
Related Topics:
- Configuring the Radio (MRMC) Script(s)
To display the current modulation and bit rate per radio:
- Select Radio > MRMC > MRMC Status. The MRMC Status page opens.
Figure 180 MRMC Status Page
Table 45 describes the MRMC status parameters.

Note
To display the same parameters for an individual radio in a separate page, select the radio in the MRMC script status table and clickEdit. You can configure Adaptive TX Power from the MRMC Status – Edit page. See Enabling ACM with Adaptive Transmit Power.
Table 52 MRMC Status Parameters
| Parameter Definition | |
| Radio Location | Identifies the carrier (Slot 2, port 1 or Slot 2, port 2). |
| Configured MRMC Script | The current MRMC script. |
| TX profile The current TX profile. | |
| TX QAM The current TX modulation. | |
| TX bit-rate | The current TX bit-rate. |
| RX profile The current RX profile. | |
| RX QAM The current RX modulation. | |
| RX bit-rate | The current RX bit-rate. |
Displaying MRMC PMs and Configuring ACM Profile Thresholds
Related Topics:
- Configuring the Radio (MRMC) Script(s)
For each radio carrier, you can display the minimum and maximum ACM profile and the minimum and maximum bitrate (throughput) per 15-minute or daily intervals.
You can also define two ACM profile thresholds for each radio carrier, and display the number of seconds per interval that the radio's ACM profile was below each of these thresholds. These thresholds trigger the following alarms:
- Threshold 1 – When the ACM profile goes beneath this threshold, Alarm ID 1313 (Major) is raised. The alarm is cleared when the ACM profile is at or above this threshold.
- Threshold 2 – When the ACM profile goes beneath this threshold, Alarm ID 1314 (Critical) is raised. The alarm is cleared when the ACM profile is at or above this threshold.
To display Multi-Rate Multi-Constellation PMs, including information on ACM profile fluctuations per interval per radio:
- Select Radio > PM & Statistics > MRMC. The MRMC PM Report page opens.
Figure 181 MRMC PM Report Page

- In the Port field, select the port that holds the radio for which you want to display PMs.
- In the Interval Type field:
To display reports in 15-minute intervals, select 15 minutes.
To display reports in daily intervals, select 24 hours.
Table 46 describes the MRMC PMs.

Note
To display the same parameters for a specific interval in a separate page, select the interval in the MRMC PM table and click View.
Table 53 MRMC PMs
| Parameter Definition | |
| PM Interval | The length of the interval for which the PMs were measured (15 Minutes or 24 Hours). |
| Interval | For 24-hour intervals, displays the date of the interval. For 15-minute intervals, displays the date and ending time of the interval. |
| Min profile | Displays the minimum ACM profile that was measured during the interval. |
| Max profile | Displays the maximum ACM profile that was measured during the interval. |
| Min bitrate | Displays the minimum total radio throughput (Mbps) delivered during the interval. |
| Max bitrate | Displays the maximum total radio throughput (Mbps) delivered during the interval. |
| Seconds above Threshold 1 | Displays the number of seconds the radio was above both ACM profile thresholds during the interval. |
| Seconds below Threshold 1 | Displays the number of seconds the radio was below ACM profile threshold 1 during the interval. |
| Seconds below Threshold 2 | Displays the number of seconds the radio was below ACM profile threshold 2 during the interval. |
| Integrity | Indicates whether the values received at the time and date of the measured interval are reliable. An x in the column indicates that the values are not reliable due to a possible power surge or power failure that occurred at that time. |
Displaying Defective Block Counters
The Counters page displays the number of blocks in which errors were detected. The larger the amount, the poorer the radio link quality.
To display the number of blocks in which errors were detected per radio:
- Select Radio > PM & Statistics > Counters. The Counters page opens.
Figure 182 Counters Page


Note
To display the same parameters for an individual radio in a separate page, select the radio in the Radio table and click View. To clear the PMs, click Clear Counters.
Displaying Signal Level PMs and Configuring Signal Level PM Thresholds
To display signal level PMs per radio:
- Select Radio > PM & Statistics > Signal Level. The Signal Level PM report page opens.
Figure 183 Signal Level PM Report Page

-
In the Interface field, select the radio interface for which you want to display PMs.
-
In the Interval Type field:
-
To display reports in 15-minute intervals, select 15 minutes.
- To display reports in daily intervals, select 24 hours.
Table 47 describes the Signal Level PMs.

Note
To display the same parameters for a specific interval in a separate page, select the interval in the RF PM table and click View.
Table 54 Signal Level PMs
| Parameter Definition | |
| Interval | For 24-hour intervals, displays the date of the interval. For 15-minute intervals, displays the date and ending time of the interval. |
| Max TSL (dBm) | The maximum TSL (Transmit Signal Level) that was measured during the interval. |
| Min TSL (dBm) | The minimum TSL (Transmit Signal Level) that was measured during the interval. |
| Max RSL (dBm) | The maximum RSL (Received Signal Level) that was measured during the interval. |
| Min RSL (dBm) | The minimum RSL (Received Signal Level) that was measured during the interval. |
| TSL exceed threshold seconds | The number of seconds the measured TSL exceeded the threshold during the interval. TSL thresholds are configured in the Radio Thresholds page. See Configuring BER Thresholdsand Displaying Current BER. |
| RSL exceed threshold1 seconds | The number of seconds the measured RSL exceeded RSL threshold 1 during the interval. RSL thresholds are configured in the Radio Thresholds page. See Configuring BER Thresholdsand Displaying Current BER.. |
| RSL exceed threshold2 seconds | The number of seconds the measured RSL exceeded RSL threshold 2 during the interval. RSL thresholds are configured in the Radio Thresholds page. See Configuring BER Thresholdsand Displaying Current BER.. |
| Integrity | Indicates whether the values received at the time and date of the measured interval are reliable. An x in the column indicates that the values are not reliable due to a possible power surge or power failure that occurred at that time. |
To set the Signal Level PM thresholds, click Thresholds. The Signal Level Thresholds Configuration – Edit Page opens. Set the thresholds, described in Table 48, and click Apply.
Figure 184 Signal level Thresholds Configuration – Edit Page

Table 55 Signal Level Thresholds
| Parameter Definition | |
| RX Level Threshold 1 (dBm) | Specify the threshold for counting exceeded seconds if the RSL is below this level. |
| RX Level Threshold 2 (dBm) | Specify a second threshold for counting exceeded seconds if the RSL is below this level. |
| TX Level Threshold (dBm) | Specify the threshold for counting exceeded seconds if the TSL is below this level. |
Displaying PMs for the Combined IF Combining Signal

Note
This section is only relevant for PTP 820G.
Related Topics:
• Displaying PMs for the Combined IF Combining Signal
IF Combining is a space diversity configuration in which the RFU receives and processes two signals and combines them into a single, optimized signal. You can display RSL (Received Signal Level) PMs for the combined signal, as well as for the Diversity interface.
Note: RSL PMs for the Main interface are displayed in the standard RSL fields of the Signal Level PM report page. See Displaying Signal Level PMs and Configuring Signal Level PM Thresholds.
To display combined RSL PMs per radio:
- Select Radio > PM & Statistics > Combined. The Combined PM graph page opens.
Figure 185 Combined PM Graph Page
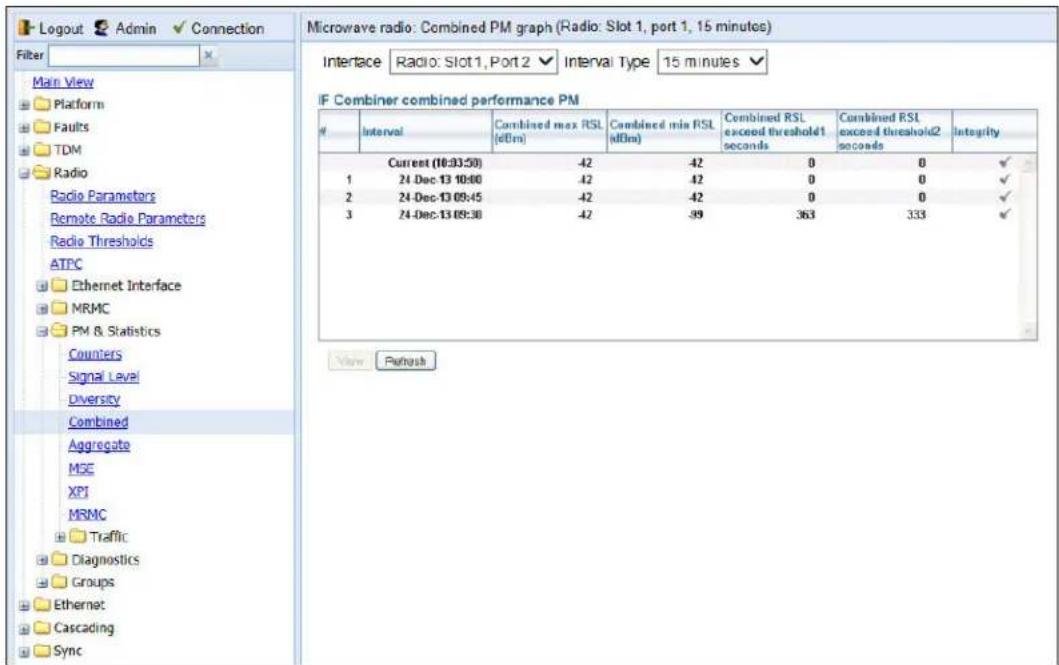
-
In the Interface field, select the radio interface for which you want to display PMs.
-
In the Interval Type field:
• To display reports in 15-minute intervals, select 15 minutes.
• To display reports in daily intervals, select 24 hours.
Table 49 describes the Combined PMs.

Note
To display the same parameters for a specific interval in a separate page, select the interval in the IF Combiner combined performance PM table and click View.
Table 56 Combined PMs
| Parameter Definition | |
| Interval | For 24-hour intervals, displays the date of the interval. For 15-minute intervals, displays the date and ending time of the interval. |
| Combined Max RSL (dBm) | The maximum combined RSL that was measured during the interval. |
| Combined Min RSL (dBm) | The minimum combined RSL that was measured during the interval. |
| Combined RSL exceed threshold1 seconds | The number of seconds the combined RSL exceeded RSL threshold 1 during the interval. RSL thresholds are configured in the Radio Thresholds page. See Configuring BER Thresholds and Displaying Current BER. |
| Combined RSL exceed threshold2 seconds | The number of seconds the combined RSL exceeded RSL threshold 2 during the interval. RSL thresholds are configured in the Radio Thresholds page. See Configuring BER Thresholds and Displaying Current BER.. |
| Integrity | Indicates whether the values received at time and date of the measured interval are reliable. An x in the column indicates that the values are not reliable due to a possible power surge or power failure that occurred at that time. |
Displaying Modem BER (Aggregate) PMs
To display modem BER (Bit Error Ratio) PMs per radio:
- Select Radio > PM & Statistics > Aggregate. The Aggregate PM report page opens.
Figure 186 Aggregate PM Report Page

- In the Port field, select the port that holds the radio for which you want to display PMs.

Note
The Slot field always displays Slot #1
- In the Interval Type field:
To display reports in 15-minute intervals, select 15 minutes.
- To display reports in daily intervals, select 24 hours.
Table 50 describes the Modem BER (Aggregate) PMs.

Note
To display the same parameters for a specific interval in a separate page, select the interval in the Modem BER PM table and click View.
Table 57 Modem BER (Aggregate) PMs
| Parameter Definition | |
| Interval | For 24-hour intervals, displays the date of the interval. For 15-minute intervals, displays the date and ending time of the interval. |
| ES | Displays the number of seconds in the measuring interval during which errors occurred. |
| SES | Displays the number of severe error seconds in the measuring interval. |
| UAS | Displays the Unavailable Seconds value of the measured interval. The value can be between 0 and 900 seconds (15 minutes). |
| BBE | Displays the number of background block errors during the measured interval. |
| Integrity | Indicates whether the values received at the time and date of the measured interval are reliable. An x in the column indicates that the values are not reliable due to a possible power surge or power failure that occurred at that time. |
Displaying MSE PMs and Configuring MSE PM Thresholds
To display modem MSE (Minimum Square Error) PMs per radio:
- Select Radio > PM & Statistics > MSE. The MSE PM report page opens.
Figure 187 MSE PM Report Page
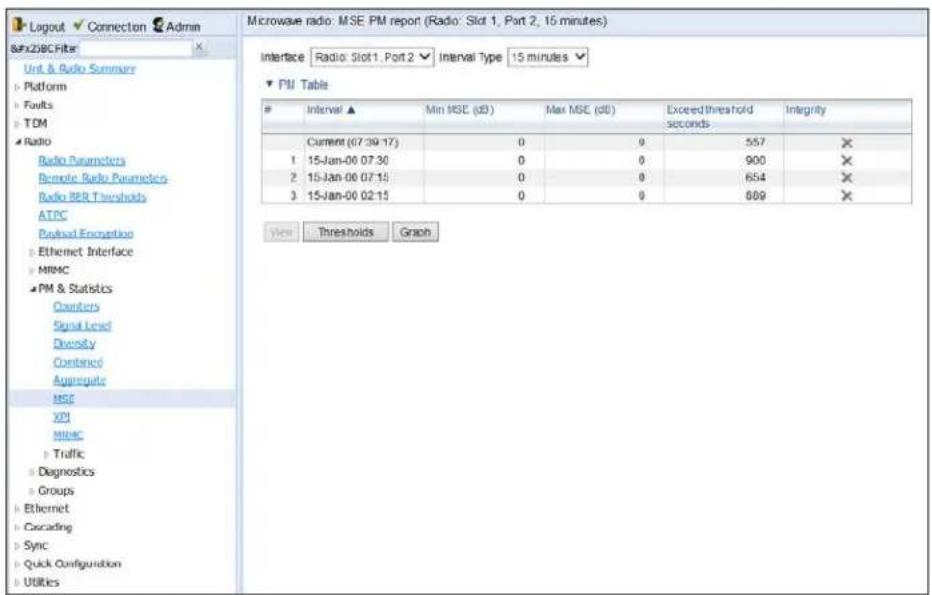
- In the Interface field, select the interface that holds the radio for which you want to display PMs.
- In the Interval Type field:
To display reports in 15-minute intervals, select 15 minutes.
- To display reports in daily intervals, select 24 hours.
Table 51 describes the Modem MSE PMs.

Note
To display the same parameters for a specific interval in a separate page, select the interval in the Modem MSE PM table and click View.
Table 58 Modem MSE PMs
| Parameter Definition | |
| Interval | For 24-hour intervals, displays the date of the interval. For 15-minute intervals, displays the date and ending time of the interval. |
| Min MSE (dB) | Displays the minimum MSE in dB, measured during the interval. |
| Max MSE (dB) | Displays the maximum MSE in dB, measured during the interval. |
| Exceed threshold seconds | Displays the number of seconds the MSE exceeded the MSE PM threshold during the interval. The MSE PM is configured in the Radio Thresholds page. See Configuring BER Thresholds and Displaying Current BER. |
| Integrity | Indicates whether the values received at the time and date of the measured interval are reliable. An x in the column indicates that the values are not reliable due to a possible power surge or power failure that occurred at that time. |
To set the Modem MSE PM thresholds, click Thresholds. The Modem MSE Thresholds Configuration—Edit Page opens. For each radio, specify the modem MSE (Mean Square Error) threshold for calculating MSE Exceed Threshold seconds, and click Apply.
Figure 188 Modem MSE Thresholds Configuration – Edit Page

Displaying XPI PMs and Configuring XPI PM Thresholds
Related topics:
- Configuring XPIC
To display XPI (Cross Polarization Interface) PMs per radio:
- Select Radio > PM & Statistics > XPI. The XPI PM report page opens.

Note
The XPI page only appears if XPIC is configured on the unit.
Figure 189 XPI PM Report Page
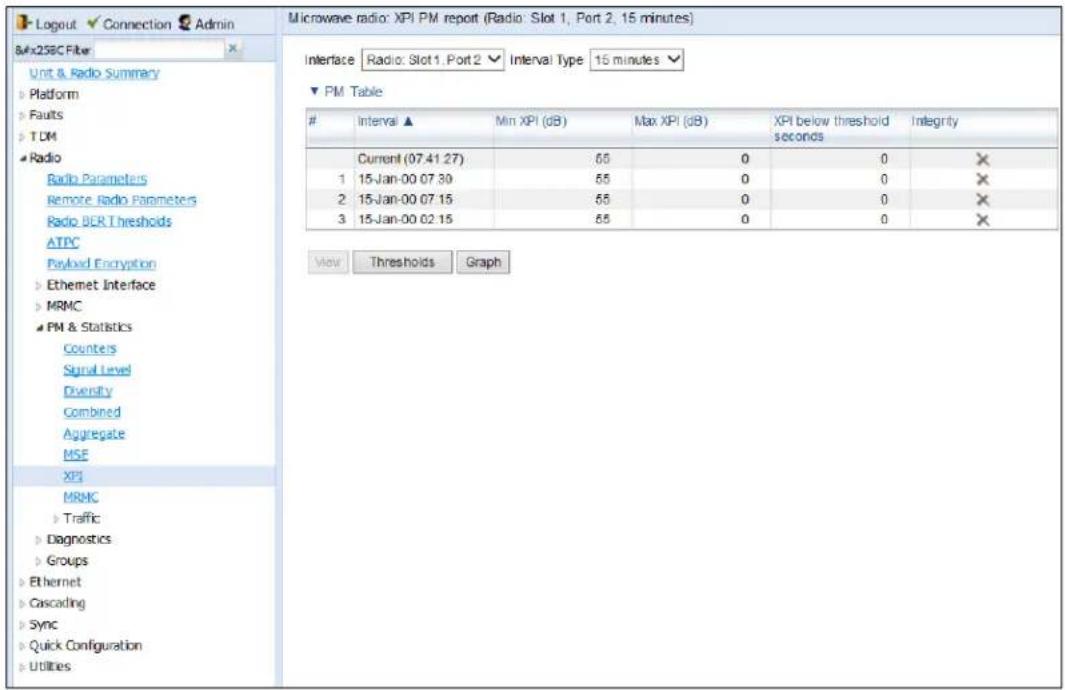
- In the Interface field, select the radio interface for which you want to display PMs.
- In the Interval Type field:
To display reports in 15-minute intervals, select 15 minutes.
- To display reports in daily intervals, select 24 hours.
Table 52 describes the XPI PMs.

Note
To display the same parameters for a specific interval in a separate page, select the interval in the Modem XPI PM table and click View.
Table 59 XPI PMs
| Parameter Definition | |
| Interval | For 24-hour intervals, displays the date of the interval. For 15-minute intervals, displays the date and ending time of the interval. |
| Min XPI (dB) | The minimum XPI level that was measured during the interval. |
| Max XPI (dB) | The maximum XPI level that was measured during the interval. |
| XPI below threshold seconds | The number of seconds the measured XPI level was below the threshold during the interval. XPI thresholds are configured in the Radio Thresholds page. See Configuring BER Thresholds and Displaying Current BER. |
Parameter Definition
| Integrity | Indicates whether the values received at the time and date of the measured interval are reliable. An x in the column indicates that the values are not reliable due to a possible power surge or power failure that occurred at that time. |
To set the XPI PM thresholds, click Thresholds. The XPI Thresholds Configuration—Edit Page opens. For each radio, specify the modem XPI threshold for calculating XPI Exceed Threshold seconds, and click Apply.
Figure 190 XPI Thresholds Configuration – Edit Page
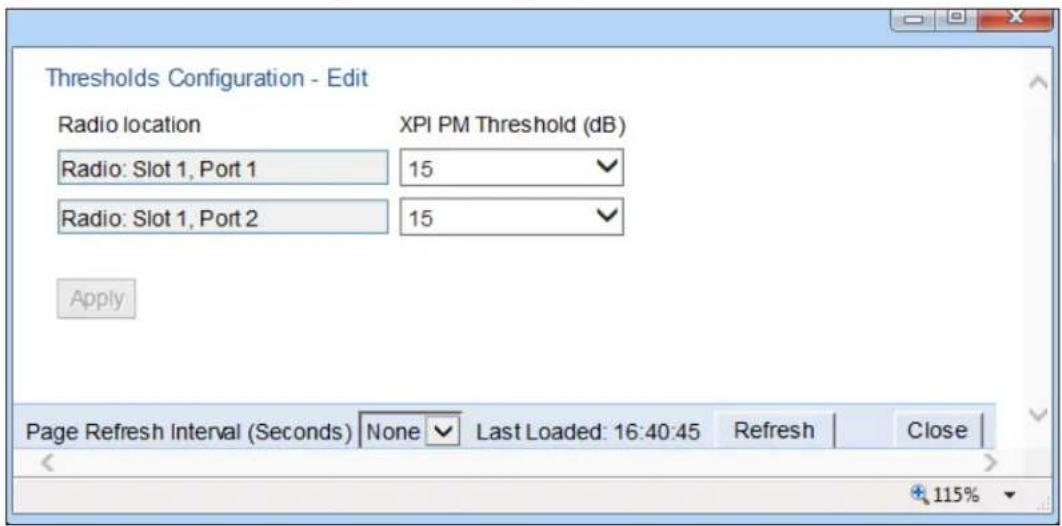
Displaying Traffic PMs
This section includes:
• Displaying Capacity and Throughput PMs
• Displaying Utilization PMs and Configuring Utilization Thresholds
• Displaying Frame Error Rate PMs
Displaying Capacity and Throughput PMs
You can display PMs for capacity and throughput for a radio, based on:
• The total Layer 1 bandwidth (payload plus overheads) sent through the radio (Mbps).
• The total effective Layer 2 traffic sent through the radio.
You can also configure thresholds for capacity and throughput PMs. The number of seconds during which these thresholds are exceeded are among the displayed PMs.
To display capacity and throughput PMs per radio:
- Select Radio > PM & Statistics > Traffic > Capacity/Throughput. The Capacity PM report page opens.
Figure 191 Capacity PM Report Page
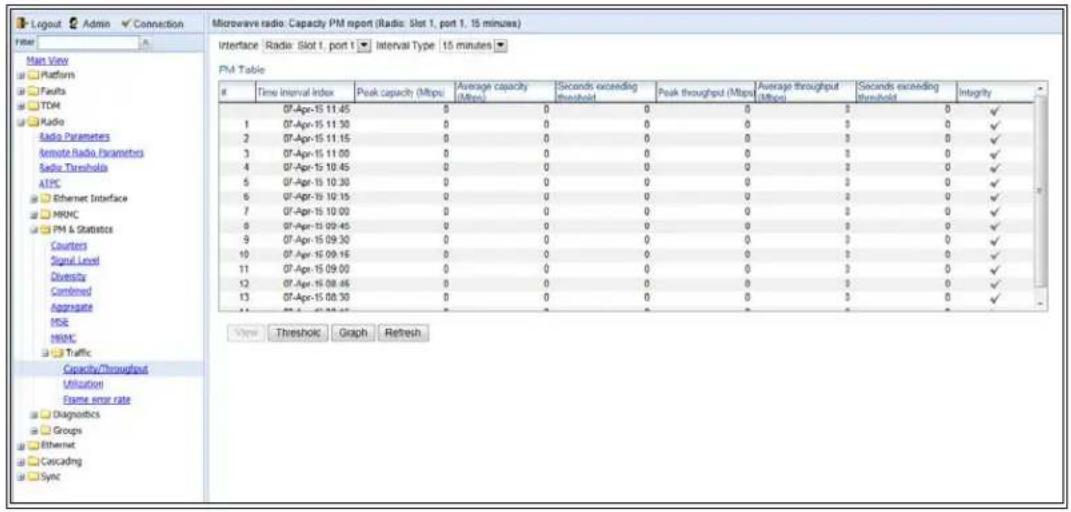
-
In the Interface field, select the interface that holds the radio for which you want to display PMs.
-
In the Interval Type field:
To display reports in 15-minute intervals, select 15 minutes.
To display reports in daily intervals, select 24 hours.
To set the thresholds for capacity and throughput PMs:
- Select Threshold. The Ethernet Radio Capacity & Throughput Threshold page opens.
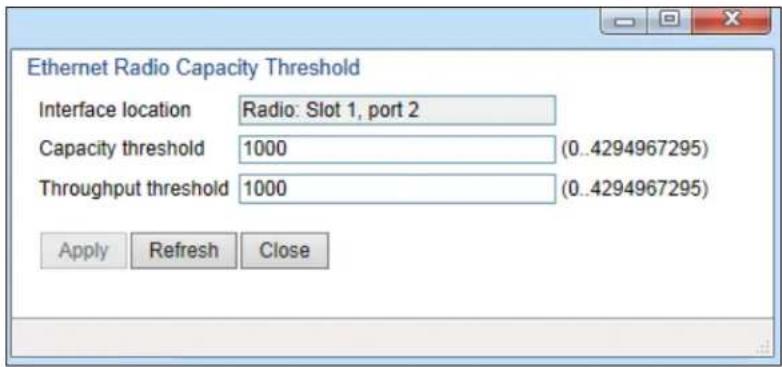
Figure 192: Ethernet Radio Capacity and Throughput Threshold Page
- Enter the capacity and throughput thresholds you want, in Mbps. The range of values is 0 to 4294967295. The default value for is 1000.
- Click Apply, then Close.
Table 53 describes the capacity and throughput PMs.

Note
To display the same parameters for a specific interval in a separate page, select the interval in the PM table and click View.
Table 60 Capacity/Throughput PMs
| Parameter Definition | |
| Time interval index | For 24-hour intervals, displays the date of the interval. For 15-minute intervals, displays the date and ending time of the interval. |
| Peak capacity (Mbps) | Displays the highest L1 bandwidth, in Mbps, sent through the selected radio during the measured time interval. |
| Average capacity (Mbps) | Displays the average L1 bandwidth, in Mbps, during the measured time interval. |
| Seconds exceeding Threshold | Displays the number of seconds during the measured time interval during which the L1 bandwidth exceeded 0. |
| Peak throughput (Mbps) | Displays the highest throughput, in Mbps, that occurred for the selected radio during the measured time interval. |
| Average throughput (Mbps) | Displays the average throughput, in Mbps, for the selected radio during the measured time interval. |
| Seconds exceeding Threshold | Displays the number of seconds during the measured time interval during which the throughput exceeded 0. |
| Integrity | Indicates whether the values received at the time and date of the measured interval are reliable. An x in the column indicates that the values are not reliable due to a possible power surge or power failure that occurred at that time. |
Displaying Utilization PMs and Configuring Utilization Thresholds
You can configure three radio capacity utilization thresholds, in percentage. The Utilization PM Report displays, for each radio carrier and Multi-Carrier ABC group, the number of seconds in which the radio or group exceeded each threshold in each interval. It also displays the peak and average utilization, in percentage, per interval.
To display radio capacity utilization PMs per radio:
- Select Radio > PM & Statistics > Traffic > Utilization. The Utilization PM report page opens.
Figure 193 Utilization PM Report Page

- In the Interface field, select the radio interface that holds the radio for which you want to display PMs, or select a Multi-Carrier ABC group.
- In the Interval Type field:
To display reports in 15-minute intervals, select 15 minutes. - To display reports in daily intervals, select 24 hours.
To set the thresholds for utilization PMs:
- Select Threshold. The Utilization Threshold page opens.
Figure 194 Ethernet Radio Utilization Threshold Page

- For each radio and Multi-Carrier ABC group, you can enter three thresholds, in % (1-100). Utilization Threshold 1 should be the highest and Utilization Threshold 3 should be the lowest. The default value for Threshold 1 is 100%. The default value for Threshold 2 and Threshold 3 is 0%..
- Click Apply, then Close.
Table 54 describes the capacity and throughput PMs.

Note
To display the same parameters for a specific interval in a separate page, select the interval in the PM table and click View.
Table 61 Utilization PMs
| Parameter Definition | |
| Time interval index | For 24-hour intervals, displays the date of the interval. For 15-minute intervals, displays the date and ending time of the interval. |
| Peak capacity (Mbps) | Displays the highest L1 bandwidth, in Mbps, sent through the selected radio during the measured time interval. |
| Average capacity (Mbps) | Displays the average L1 bandwidth, in Mbps, during the measured time interval. |
| Seconds exceeding Threshold | Displays the number of seconds during the measured time interval during which the L1 bandwidth exceeded 0. |
| Peak throughput (Mbps) | Displays the highest throughput, in Mbps, that occurred for the selected radio during the measured time interval. |
| Average throughput (Mbps) | Displays the average throughput, in Mbps, for the selected radio during the measured time interval. |
| Seconds exceeding Threshold | Displays the number of seconds during the measured time interval during which the L1 bandwidth exceeded the configured utilization threshold. |
| Integrity | Indicates whether the values received at the time and date of the measured interval are reliable. An x in the column indicates that the values are not reliable due to a possible power surge or power failure that occurred at that time. |
Displaying Frame Error Rate PMs
To display frame error rate PMs per radio or Multi-Carrier ABC group:
- Select Radio > PM & Statistics > Traffic > Frame error rate. The Frame error rate PM report page opens.
Figure 195 Frame Error PM Report Page

- In the Interface field, select the radio interface that holds the radio for which you want to display PMs.
-
In the Interval Type field:
-
To display reports in 15-minute intervals, select 15 minutes.
- To display reports in daily intervals, select 24 hours.
Table 55 describes the capacity and throughput PMs.

Note
To display the same parameters for a specific interval in a separate page, select the interval in the PM table and click View.
Table 62 Frame Error Rate PMs
| Parameter Definition | |
| Time interval index | For 24-hour intervals, displays the date of the interval. For 15-minute intervals, displays the date and ending time of the interval. |
| FER | Displays the frame error rate (%) during the measured time interval. |
| Integrity | Indicates whether the values received at the time and date of the measured interval are reliable. An x in the column indicates that the values are not reliable due to a possible power surge or power failure that occurred at that time. |
Chapter 6: Ethernet Services and Interfaces
This section includes:
- Configuring Ethernet Service(s)
- Setting the MRU Size and the S-VLAN Ethertype
- Configuring Ethernet Interfaces
- Configuring Automatic State Propagation
• Viewing Ethernet PMs and Statistics
Related topics:
- Configuring Link Aggregation (LAG) and LACP
• Quality of Service (QoS) - Ethernet Protocols
• Performing Ethernet Loopback - Ethernet Traffic Interfaces
• Ethernet Management Interfaces - Ethernet Pin-Outs and LEDs
Configuring Ethernet Service(s)
This section includes:
• Ethernet Services Overview
• General Guidelines for Provisioning Ethernet Services
• The Ethernet Services Page
- Adding an Ethernet Service
- Editing a Service
- Deleting a Service
• Enabling, Disabling, or Deleting Multiple Services
• Viewing Service Details
- Configuring Service Points
Ethernet Services Overview
Users can define up to 64 Ethernet services. Each service constitutes a virtual bridge that defines the connectivity between logical ports in the PTP 820G or PTP 820F network element.
This version of PTP 820G and PTP 820F supports the following service types:
- Multipoint (MP)
- Point-to-Point (P2P)
- Management (MNG)
In addition to user-defined services, PTP 820G and PTP 820F contains a pre-defined management service (Service ID 1025). By default, this service is operational.

Note
You can use the management service for in-band management. For instructions on configuring in-band management, see Configuring In-Band Management.
A service point is a logical entity attached to a physical or logical interface. Service points define the movement of frames through the service. Each service point includes both ingress and egress attributes. A Point-to-Point or Multipoint service can hold up to 32 service points. A Management service can hold up 30 service points.
For a more detailed overview of PTP 820's service-oriented Ethernet switching engine, refer to the Technical Description for the product you are using.
General Guidelines for Provisioning Ethernet Services
When provisioning Ethernet services, it is recommended to follow these guidelines:
• Use the same Service ID for all service fragments along the path of the service.
- Do not re-use the same Service ID within the same region. A region is defined as consisting of all devices having Ethernet connectivity between them.
• Use meaningful EVC IDs.
- Give the same EVC ID (service name) to all service fragments along the path of the service.
- Do not reuse the same EVC ID within the same region.
It is recommended to follow these guidelines for creating service points:
• Always use SNP service points on NNI ports and SAP service points on UNI ports.
- For each logical interface associated with a specific service, there should never be more than a single service point.
- The transport VLAN ID should be unique per service within a single region. That is, no two services should use the same transport VLAN ID.
The Ethernet Services Page
The Ethernet Services page is the starting point for defining Ethernet services on the PTP 820G and PTP 820F.
To open the Ethernet Services page:
- Select Ethernet > Services. The Ethernet Services page opens.
Figure 196 Ethernet Services Page

Table 56 describes the parameters displayed in the Ethernet Services page.
Table 63 Ethernet Services Page Parameters
| Parameter Definition | |
| Services ID | A unique ID for the service. |
| Service Type The service type:MP – MultipointP2P – Point-to-PointMNG – Management | |
| Service sub type | Indicates the type of service (Ethernet). |
| EVC ID | The Ethernet Virtual Connection (EVC) ID. This parameter does not affect the network element’s behavior, but is used by the NMS for topology management. |
| EVC description | The Ethernet Virtual Connection (EVC) description. This parameter does not affect the network element’s behavior, but is used by the NMS for topology management. |
| Admin | Indicates whether the service is enabled (Operational) or disabled (Reserved). You can configure services for later use by defining the service as Reserved. In Reserved mode, the service occupies system resources but is unable to transmit and receive data. |
Adding an Ethernet Service
To add an Ethernet service:
- Select Ethernet > Services. The Ethernet Services page opens (Figure 189).
- In the Ethernet Services page, click Add. The Ethernet Services – Add page opens.
Figure 197 Ethernet Services - Add page

- In the Service ID field, select a unique ID for the service. You can choose from any unused value from 1 to 1024. Once you have added the service, you cannot change the Service ID. Service ID 1025 is reserved for a pre-defined management service.
-
In the Service Type field, select the service type:
-
MP-Multipoint
○ MNG – Management
○ P2P – Point-to-Point -
Optionally, in the EVC ID field, enter an Ethernet Virtual Connection (EVC) ID (up to 20 characters). This parameter does not affect the network element's behavior, but is used by the NMS for topology management.
- Optionally, in the EVC Description field, enter a text description of the service (up to 64 characters). This parameter does not affect the network element's behavior, but is used by the NMS for topology management.
-
In the Admin field, select one of the following options:
-
Operational - The service is functional.
Reserved - The service is disabled until this parameter is changed to Operational. In this mode, the service occupies system resources but is unable to receive and transmit data. -
In the MAC table size field, enter the maximum MAC address table size for the service. The MAC address table is a source MAC address learning table used to forward frames from one service point to another. You can select a value from 16 to 131,072, in multiples of 16. This maximum only applies to dynamic, not static, MAC address table entries.

Note
Additional configuration of the MAC address table can be performed via the CLI. See Defining the MAC Address Forwarding Table for a Service.
- In the Default CoS field, enter a default Class of Service (CoS) value (0-7). This value is assigned to frames at the service level if CoS Mode is set to Default-CoS. Otherwise, this value is not used, and frames retain whatever CoS value they were assigned at the service point or logical interface level.
- In the CoS Mode field, select one of the following options. This parameter determines whether or not frames passing through the service have their CoS modified at the service level. The CoS determines the priority queue to which frames are assigned.
Default CoS – Frames passing through the service are assigned the default CoS defined above. This CoS value overrides whatever CoS may have been assigned at the service point or interface level.
o Preserve-SP-COS-Decision – The CoS of frames passing through the service is not modified by the service's default CoS.
- Click Apply, then Close to close the Ethernet Services - Add page.
- Add service points. You must add service points to the service in order for the service to carry traffic. See Configuring Service Points.
Editing a Service
To edit a service:
- Select Ethernet > Services. The Ethernet Services page opens (Figure 189).
- Select the service in the Service Configuration Table.
- In the Ethernet Services page, click Edit. The Ethernet Services - Edit page opens.
- This page is identical to the Ethernet Services - Add page (Figure 190). You can edit any parameter that can be configured in the Add page, except the Service ID.
Deleting a Service
Before deleting a service, you must first delete any service points attached to the service. See Deleting a Service Point.
To delete a service:
- Select Ethernet > Services. The Ethernet Services page opens (Figure 189).
- Select the service in the Ethernet Service Configuration Table.
- Click Delete. The service is deleted.
Enabling, Disabling, or Deleting Multiple Services
To enable, disable, or delete multiple services:
-
Select Ethernet > Services. The Ethernet Services page opens (Figure 189).
-
Select the services in the Ethernet Services Configuration table, or select all the services by selecting the check box in the top row.
To enable the selected services, in the Multiple Selection Operation section underneath the Ethernet Services Configuration Table, select Operational and click Apply.
To disable the selected services, in the Multiple Selection Operation section underneath the Ethernet Services Configuration Table, select Reserved and click Apply.
To delete the selected services, select Delete underneath the Ethernet Services Configuration Table. Before deleting a service, you must delete any service points attached to the service, as described in Deleting a Service Point.
Figure 198 Multiple Selection Operation Section (Ethernet Services)


Note
When setting multiple services to Reserve state, make sure to avoid setting the management service to Reserve state.
Viewing Service Details
To view the full service parameters:
- Select Ethernet > Services. The Ethernet Services page opens (Figure 189).
- Select the service in the Ethernet Services Configuration table.
- In the Ethernet Services page, click Service Details. The Ethernet Services – Service Details page opens. The Service Details page contains the same fields as the Add page (Figure 189). However, in the Service Details page, these fields are read-only.
Configuring Service Points
This section includes:
• Ethernet Services Points Overview
• The Ethernet Service Points Page
- Adding a Service Point
• Editing a Service Point
• Deleting a Service Point
- Attaching VLANs
Ethernet Services Points Overview
Service points are logical interfaces within a service. A service point is a logical entity attached to a physical or logical interface. Service points define the movement of frames through the service. Each service point includes both ingress and egress attributes.
Each service point for a Point-to-Point or Multipoint service can be either a Service Access Point (SAP) or a Service Network Point (SNP). A Point-to-Point service can also use Pipe service points.
- An SAP is equivalent to a UNI in MEF terminology and defines the connection of the user network with its access points. SAPs are used for Point-to-Point and Multipoint traffic services.
- An SNP is equivalent to an NNI or E-NNI in MEF terminology and defines the connection between the network elements in the user network. SNPs are used for Point-to-Point and Multipoint traffic services.
- A Pipe service point is used to create traffic connectivity between two ports in a port-based manner (Smart Pipe). In other words, all the traffic from one port passes to the other port.
Management services utilize Management (MNG) service points.
A Point-to-Point or Multipoint service can hold up to 32 service points. A management service can hold up to 30 service points.
The Ethernet Service Points Page
The Ethernet Service Points page is the starting point for configuring Ethernet service points.
To open the Ethernet Service Points page:
- Select Ethernet > Services. The Ethernet Services page opens (Figure 189).
- Select the relevant service in the Ethernet Services Configuration table.
- Click Service Points. The Ethernet Service Points page opens.
Figure 199 Ethernet Service Points Page
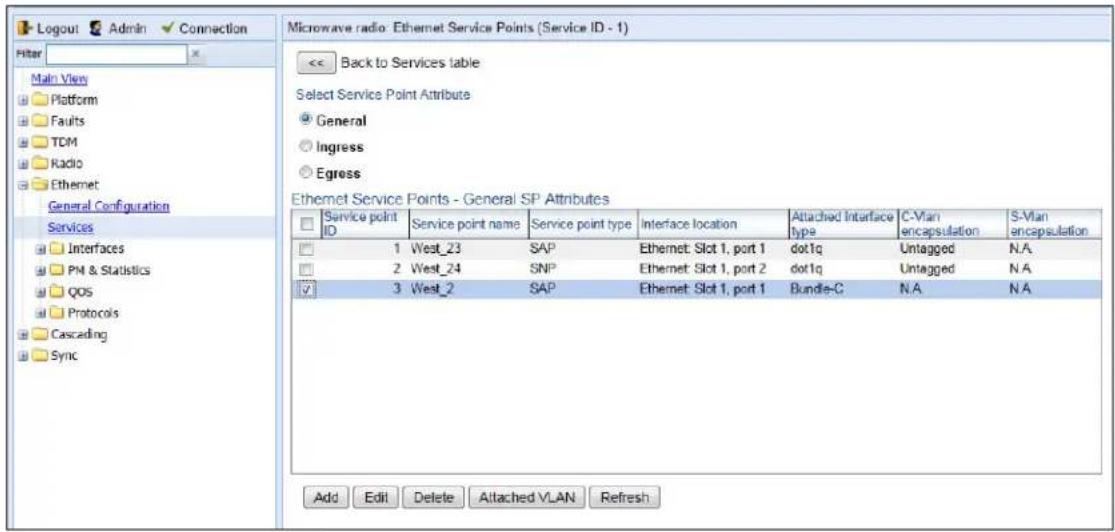
You can choose to display the following sets of attributes by selecting the appropriate button above the SP Attributes table:
- General – See Ethernet Service Points – General SP Attributes Table
- Ingress – See Ethernet Service Points – Ingress Attributes
• Egress – See Ethernet Service Points – Egress Attributes
To return to the Ethernet Services page at any time, click Back to Services table at the top of the Ethernet Service Points page.
a. Ethernet Service Points – General SP Attributes Table
The General SP Attributes table is shown in Figure 192 Ethernet Service Points Page. Table 57 describes the parameters displayed in the General SP Attributes table.
Table 64 General Service Point Attributes
| Parameter Definition | |
| Service point ID | This ID is unique within the service. For Point-to-Point and Multipoint services, the range of values is 1-32. For Management services, the range of values is 1-30.When adding a service point, you can select a service point ID from the available options in the Service point ID drop-down list in the Ethernet Service Points – Add page. Once you have added the service point, you cannot change the service point ID. |
| Service point name | A descriptive name for the service point (optional). The Service Point Name can be up to 20 characters. |
Parameter Definition
| Service point type | The service point type. Options are:SAP – Service Access Point.SNP – Service Network Point.MNG – Management service point.PIPE – Pipe service point.The following rules apply to the mixing of different types of service points on a single logical interface:You cannot configure both SAPs and SNPs on the same logical interface.You can configure both SAPs or SNPs on the same logical interface as a MNG service point.If you configure a Pipe service point on an interface, you cannot configure an SAP, SNP, or another Pipe service point on the same interface. You can, however, configure an MNG service point on the same interface.You cannot configure more than one MNG service point on a single logical interface.Once you have added the service point, you cannot change this parameter. |
| Interface location | The physical or logical interface on which the service point is located.Once you have added the service point, you cannot change this parameter. |
| Attached interface type | The encapsulation type (Ethertype) for frames entering the service point.Once you have added the service point, you cannot change this parameter.The Attached Interface Type determines which frames enter the service via this service point, based on the frame’s VLAN tagging. Since more than one service point may be associated with a single interface, frames are assigned to the earliest defined service point in case of conflict.For a list of available Attached Interface Types, the types of frames to which each one applies, and the service point types for which each one is available, see Table 58. |
| C-Vlan encapsulation | The C-VLAN classified into the service point. Options are 1-4094,Untagged, or N.A. (Not Applicable). Once you have added the service point, you cannot change this parameter.If you selected Bundle-C in the Attached Interface Type field, select Untagged or N.A. You can then add multiple C-VLANs via the Attach VLAN option. See Attaching VLANs. |
Parameter Definition
| S-Vlan encapsulation | The S-VLAN classified into the service point. Options are 1-4094, Untagged, or N.A. (Not Applicable). Once you have added the service point, you cannot change this parameter.If you selectedBundle-Sin theAttached Interface Typefield, select the S-VLAN value to classify into the service point (1-4094), or selectUntagged.You can then add multiple C-VLANs via theAttach VLANoption. See Attaching VLANs. |
Table 58 describes the available Attached Interface Types.
Table 65 Attached Interface Types
| Attached Interface Type | Types of Frames | Available for Service Point Types |
| dot1q | A single C-VLAN is classified into the service point. | All |
| s-tag | A single S-VLAN is classified into the service point. | SNP, PIPE, and MNG |
| Bundle-C | A set of C-VLANs is classified into the service point. | SAP |
| Bundle-S | A single S-VLAN and a set of C-VLANs are classified into the service point. | SAP |
| All-to-One | All C-VLANs and untagged frames that enter the interface are classified into the service point. | SAP |
| Q-in-Q | A single S-VLAN and C-VLAN combination is classified into the service point. | SAP and MNG |
b. Ethernet Service Points – Ingress Attributes
Select Ingress in the Ethernet Service Points page to display the Ethernet Service Points – Ingress Attributes table. Table 59 describes the parameters displayed in the Ingress SP Attributes table.
Figure 200 Ethernet Service Points Page – Ingress Attributes

Table 66 Service Point Ingress Attributes
| Parameter Definition | |
| Service point ID | This ID is unique within the service. For Point-to-Point and Multipoint services, the range of values is 1-32. For Management services, the range of values is 1-30. |
| Service point name | A descriptive name for the service point (optional). The Service Point Name can be up to 20 characters. |
| Service point type The service point type. Options are: | |
| SAP – Service Access Point.SNP – Service Network Point.MNG – Management service point.PIPE – Pipe service point. | |
| Learning admin | Determines whether MAC address learning for incoming frames is enabled (Enable) or disabled (Disable). When enabled, the service point learns the source MAC addresses of incoming frames and adds them to a MAC address forwarding table. |
| Allow flooding | Determines whether incoming frames with unknown MAC addresses are forwarded to other service points via flooding. Select Allow to allow flooding or Disable to disable flooding. |
| Allow broadcast | Indicates whether frames with a broadcast destination MAC address are allowed to ingress the service via this service point.. Select Allow to allow broadcast or Disable to disable broadcast. |
| CoS Mode | Indicates how the service point handles the CoS of frames that pass through the service point. Options are:sp-def-cos – The service point re-defines the CoS of frames that pass through the service point, according to the Default CoS (below). This decision can be overwritten on the service level.Interface-Decision – The service point preserves the CoS decision made at the interface level. The decision can still be overwritten at the service level.PCL – Reserved for future use.TCAM – Reserved for future use. |
| Default CoS | The default CoS. If the CoS Mode is sp-def-cos, this is the CoS assigned to frames that pass through the service point. This decision can be overwritten at the service level. Possible values are 0 to 7. |
Split horizon group Reserved for future use.
c. Ethernet Service Points – Egress Attributes
Select Egress in the Ethernet Service Points page to display the Ethernet Service Points – Egress Attributes table.

Table 60 `describes the parameters displayed in the General SP Attributes table.
Figure 201 Ethernet Service Points Page – Egress Attributes

Table 67 Service Point Egress Attributes
| Parameter Definition | |
| Service point ID | This ID is unique within the service. For Point-to-Point and Multipoint services, the range of values is 1-32. For Management services, the range of values is 1-30. |
| Service point name | A descriptive name for the service point (optional). The Service Point Name can be up to 20 characters. |
| Service point type The service point type. Options are: | |
| SAP – Service Access Point.SNP – Service Network Point.MNG – Management service point.PIPE – Pipe service point. | |
| C-Vlan CoS preservation | Determines whether the original C-VLAN CoS value is preserved or restored for frames egressing from the service point.If C-VLAN CoS preservation is enabled, the C-VLAN CoS value of frames egressing the service point is the same as the value when the frame entered the service.If C-VLAN CoS preservation is disabled, the C-VLAN CoS value of frames egressing the service point is set at whatever value might have been re-assigned by the interface, service point, or service, or whatever value results from marking. |
| C-Vlan preservation | Determines whether the original C-VLAN ID is preserved or restored for frames egressing from the service point.If C-VLAN preservation is enabled, the C-VLAN ID of frames egressing the service point is the same as the C-VLAN ID when the frame entered the service.If C-VLAN preservation is disabled, the C-VLAN ID of frames egressing the service point is set at whatever value might have been re-assigned by the interface, service point, or service, or whatever value results from marking |
| S-Vlan CoS preservation | Determines whether the original S-VLAN CoS value is preserved or restored for frames egressing from the service point.If S-VLAN CoS preservation is enabled, the S-VLAN CoS value of frames egressing the service point is the same as the value when the frame entered the service.If S-VLAN CoS preservation is disabled, the C-VLAN CoS value of frames egressing the service point is set at whatever value might have been re-assigned by the interface, service point, or service, or whatever value results from marking |
| S-Vlan preservation | Read-only. Indicates whether the original S-VLAN ID is preserved or restored for frames egressing from the service point.If S-VLAN preservation is enabled, the S-VLAN ID of frames egressing the service point is the same as the S-VLAN ID when the frame entered the service.If S-VLAN preservation is disabled, the S-VLAN ID of frames egressing the service point is set at whatever value might have been re-assigned by the interface, service point, or service, or whatever value results from marking |
| Marking admin | Determines whether re-marking of the outer VLAN (C-VLAN or S-VLAN) of tagged frames that pass through the service point is enabled.IfMarking adminis set to Enable, and CoS preservation for the relevant outer VLAN is set to Disable, the SAP re-marks the C-VLAN or S-VLAN 802.1p UP bits of egress frames according to the calculated CoS and Color, and the user-configurable 802.1Q and 802.1AD marking tables. You can configure these tables by selectingEthernet > QoS > Markingfrom the menu on the left side of the Web EMS.IfMarking adminand CoS preservation for the relevant outer VLAN are both set to Enable, re-marking is not performed.IfMarking adminand CoS preservation for the relevant outer VLAN are both set to Disable, re-marking is applied, but only according to the values defined for Green frames in the 802.1Q and 802.1AD marking tables. |
Parameter Definition
Service Bundle ID 1 is the only supported value
Adding a Service Point
To add a service point:
- Select Ethernet > Services. The Ethernet Services page opens (Figure 189).
- Select the relevant service in the Ethernet Services Configuration table.
- Click Service Points. The Ethernet Service Points page opens (Figure 192).
- Select the relevant service point in the Ethernet Services Points – General SP Attributes table.
- Click Add. The Ethernet Service Points – Add page opens.
Figure 202 Ethernet Service Points - Add Page

- Configure the service point attributes, as described above.

Note
Optionally, you can select from a list of pre-defined service point options in the Pre defined options field at the top of the Ethernet Service Points - Add page. The system automatically populates the remaining service point parameters according to the system-defined parameters. However, you can manually change these parameter values. The pre-defined options are customized to the type of service to which you are adding the service point.
7. Click Apply, then Close.
Editing a Service Point
To edit a service point:
- Select Ethernet > Services. The Ethernet Services page opens (Figure 189).
- Select the relevant service in the Ethernet Services Configuration table.
- Click Service Points. The Ethernet Service Points page opens (Figure 192).
- Select the relevant service point in the Ethernet Services Points – General SP Attributes table.
- Click Edit. The Ethernet Service Points—Edit page opens. The Ethernet Service Points—Edit page is similar to the Ethernet Service Points - Add page (Figure 195). You can edit any parameter that can be configured in the Add Service Point page, except Service Point ID, Service Point Type, and the General SP Attributes.
- Edit the service point attributes, as described in Table 57, Table 59, and Table 60.
- Click Apply, then Close.
Deleting a Service Point
You can only delete a service point with an Attached Interface Type of Bundle-C or Bundle-S if no VLANs are attached to the service point. See Attaching VLANs.
To delete a service point:
- Select Ethernet > Services. The Ethernet Services page opens (Figure 189).
- Select the relevant service in the Ethernet Services Configuration table.
- Click Service Points. The Ethernet Service Points page opens (Figure 192).
- Select the relevant service point in the Ethernet Services Points – General SP Attributes table.
- Click Delete. The service point is deleted.
Attaching VLANs
When the Attached Interface Type for a service point is set to Bundle-C or Bundle-S, you can add multiple C-VLANs to the service point.
To add multiple C-VLANs:
- Select Ethernet > Services. The Ethernet Services page opens (Figure 189).
- Select the relevant service in the Ethernet Services Configuration table.
-
Click Service Points. The Ethernet Service Points page opens (Figure 192).
-
Select the relevant service point in the Ethernet Services Points – General SP Attributes table.
- Click Attached VLAN. The Attached VLAN List page opens.
Figure 203 Attached VLAN List Page

- Click Add. The Attached VLAN List - Add page opens.
Figure 204 Attached VLAN List - Add Page
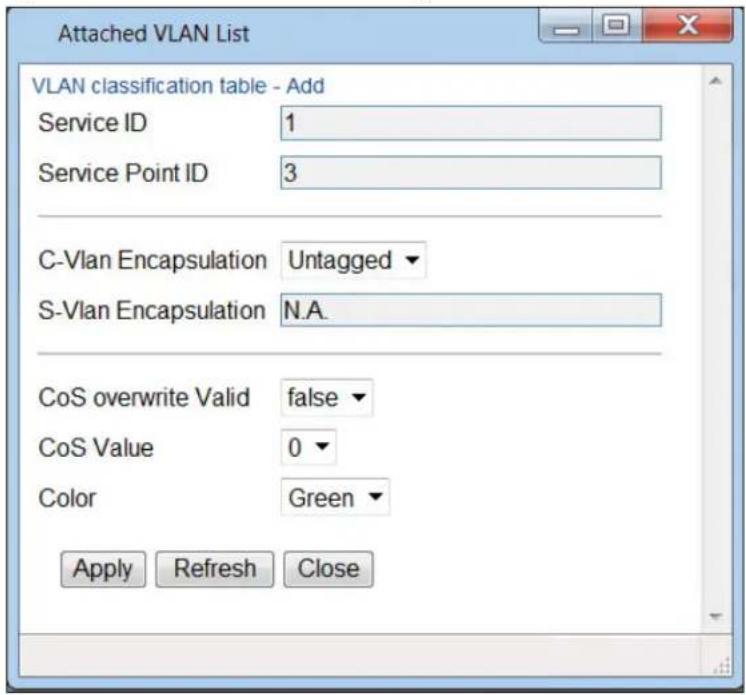
- Configure the VLAN Classification parameters, described in Table 61.
- Click Apply, then Close.
Table 68 VLAN Classification Parameters
| Parameter Definition | |
| Interface Location | Read-only. The physical or logical interface on which the service point is located. |
| Service ID | Read-only. The ID of the service to which the service point belongs. |
| Service Point ID | Read-only. The ID of the service point. |
| C-Vlan Encapsulation | Select the C-VLAN you want to add to the service point. |
| S-Vlan Encapsulation | Read-only.If the Attached Interface Type for the service point is Bundle-S, this field displays the S-VLAN encapsulation selected when the service point was created.If the Attached Interface Type for the service point is Bundle-C, this field is inactive. |
| CoS Overwrite Valid | If you want to assign a specific CoS and Color to frames with the C-VLAN or S-VLAN defined in the C-VLAN Encapsulation field, select true. This CoS and Color values defined below override the CoS and Color decisions made at the interface level. However, if the service point or service are configured to apply their own CoS and Color decisions, those decisions override the decision made here. |
| CoS Value | If CoS Overwrite Valid is set to true, the CoS value defined in this field is applied to frames with the C-VLAN defined in the C-VLAN Encapsulation field. This CoS overrides the CoS decision made at the interface level. However, if the service point or service are configured to apply their own CoS, that decision overrides the decision made here.If CoS Overwrite Valid is set to false, this parameter has no effect. |
| Color | If CoS Overwrite Valid is set to true, the Color value defined in this field is applied to frames with the C-VLAN defined in the C-VLAN Encapsulation field. This Color overrides the Color decision made at the interface level. However, if the service point or service are configured to apply their own Color, that decision overrides the decision made here.If CoS Overwrite Valid is set to false, this parameter has no effect. |
To edit a VLAN Classification table entry, select the entry in the VLAN Classification table and click Edit. You can edit all the fields that can be configured in the Attached VLAN List – Add page, except the C-VLAN Encapsulation field.
To delete a VLAN Classification table entry, select the entry in the VLAN Classification table and click Delete.
Setting the MRU Size and the S-VLAN Ethertype
To configure the size of the MRU (Maximum Receive Unit) and the S-VLAN Ethertype:
- Select Ethernet > General Configuration. The Ethernet General Configuration page opens.
Figure 205 Ethernet General Configuration Page
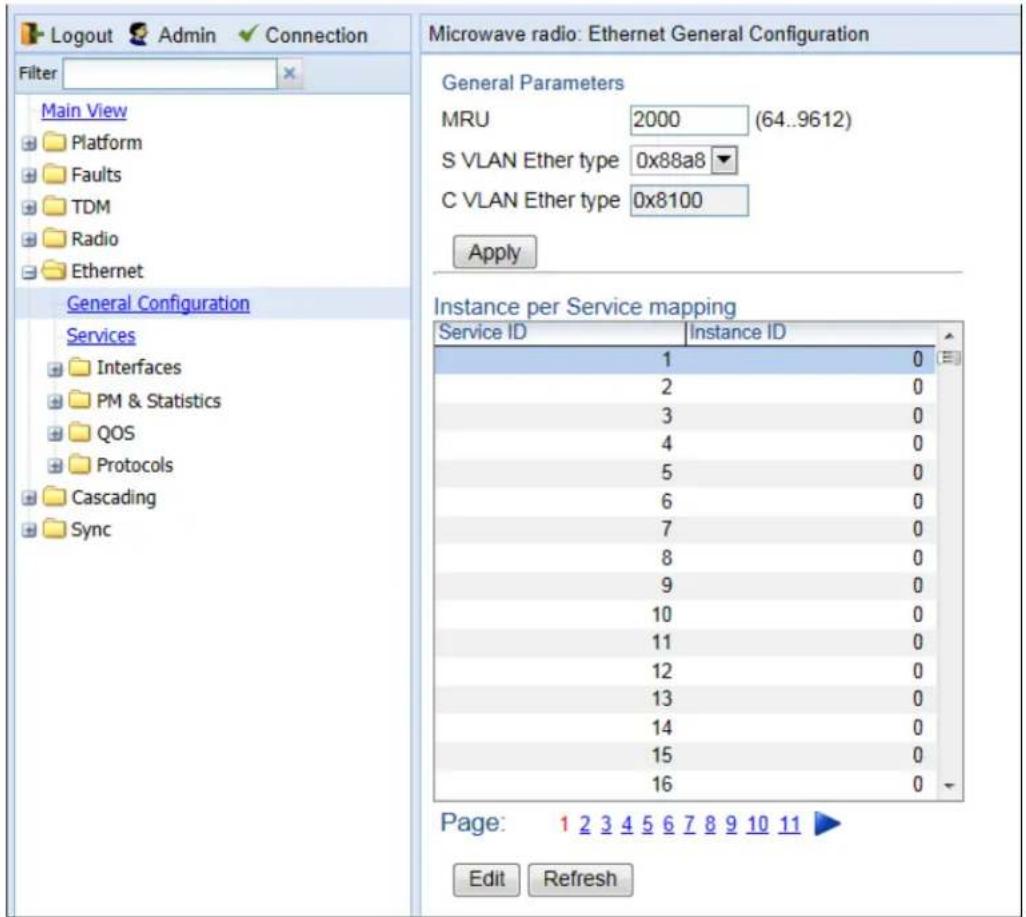
- In the MRU field, enter the global size (in bytes) of the Maximum Receive Unit (MRU). Permitted values are 64 to 9612. The default value is 2000. Frames that are larger than the global MRU will be discarded.
- In the S VLAN Ether type field, select the S-VLAN Ethertype. This defines the ethertype recognized by the system as the S-VLAN ethertype. Options are: 0x8100, 0x88A8, 0x9100, and 0x9200. The default value is 0x88A8.

Note
The C-VLAN Ethertype is set at 0x8100 and cannot be modified.
- Click Apply.

Note
You can also map Ethernet services to MSTP instances (MSTIs) in the Ethernet General Configuration page. See Mapping Ethernet Services to MSTP instances (MSTIs).
Configuring Ethernet Interfaces
Related Topics:
• Enabling the Interfaces (Interface Manager)
• Performing Ethernet Loopback
- Configuring Ethernet Service(s)
• Quality of Service (QoS)
The PTP 820F and PTP 820G's switching fabric distinguishes between physical interfaces and logical interfaces. Physical and logical interfaces serve different purposes in the switching fabric. In some cases, a physical interface corresponds to a logical interface on a one-to-one basis. For some features, such as LAG, a group of physical interfaces can be joined into a single logical interface.
The basic interface characteristics, such as media type, port speed, duplex, and auto-negotiation, are configured for the physical interface via the Physical Interfaces page. Ethernet services, QoS, and OAM characteristics are configured on the logical interface level.
To configure the physical interface parameters:
- Select Ethernet > Interfaces > Physical Interfaces. The Physical Interfaces page opens.
Figure 206 Physical Interfaces Page

- Select the interface you want to configure and click Edit. The Physical Interfaces - Edit page opens.
Figure 207 Physical Interfaces - Edit Page

- Optionally, in the Description field, enter a description of the interface.
- In the Media type field, select the physical interface layer 1 media type. Options are:
○ Auto-Type – NA.

Note
Auto-Type is not supported for Ethernet interfaces 5 and 6. These interfaces must be defined as RJ45 or SFP. The default is RJ45.
- RJ45 – An electrical (RJ-45) Ethernet interface.
o SFP – An optical (SFP) Ethernet interface. -
Radio – A radio interface.
-
In the Auto negotiation field, select On to enable or Off to disable Auto-Negotiation. When the Media-Type is Radio, Auto Negotiation is always Off.

Note
For Ethernet interfaces 5 and 6 in the PTP 820F, Auto-Negotiation is supported on the RJ-45 interfaces (2.5GE5/2.5GE6), but not on the SFP interfaces (SFP5/SFP6). On SFP5 and SFP6, Auto-Negotiation must be set to Off. In addition, Auto-Negotiation must be set to Off on the Ethernet ports to which SFP5 and SFP6 are connected.
-
In the Speed field, select the maximum speed of the interface, in Mbps. Options are:
-
Ethernet RJ-45 interfaces – 100 and 1000.
- Ethernet SFP interfaces – Only 1000 is supported.
-
Radio interfaces – The parameter is read-only and set by the system to 1000.
-
In the Duplex field, select the interface's duplex setting (Full-Duplex or Half-Duplex). Only Full-Duplex is available in this release.
-
Click Apply, then Close.
Table 62 describes the status parameters that appear in the Physical Interfaces page.
Table 69 Physical Interface Status Parameters
| Parameter Definition | |
| Interface location The location of the interface. | |
| Operational Status | Indicates whether the interface is currently operational (Up) or non-operational (Down). |
| Admin Status | Indicates whether the interface is currently enabled (Up) or disabled (Down). You can enable or disable an interface from the Interface Manager page. See Enabling the Interfaces (Interface Manager). |
| Actual port speed | Displays the actual speed of the interface for the link as agreed by the two sides of the link after the auto negotiation process. |
| Actual port duplex | Displays the actual duplex status of the interface for the link as agreed by the two sides of the link after the auto negotiation process. |
Configuring Automatic State Propagation and Link Loss Forwarding
Automatic state propagation enables propagation of radio failures back to the Ethernet port. You can also configure Automatic State Propagation to close the Ethernet port based on a radio failure at the remote carrier.
Automatic state propagation is configured as pairs of interfaces. Each interface pair includes one Monitored Interface and one Controlled Interface. You can create multiple pairs using the same Monitored Interface and multiple Controlled Interfaces.
The Monitored Interface is a radio interface, a radio protection group, or a Multi-Carrier ABC group. The Controlled Interface is an Ethernet interface or LAG. An Ethernet interface can only be assigned to one Monitored interface.

Note
A radio interface that belongs to a LAG group cannot be used as a monitored interface.
Each Controlled Interface is assigned an LLF ID. If ASP trigger by remote fault is enabled on the remote side of the link, the ASP state of the Controlled Interface is propagated to the Controlled Interface with the same LLF ID at the remote side of the link. This means if ASP is triggered locally, it is propagated to the remote side of the link, but only to Controlled Interfaces with LLF IDs that match the LLF IDs of the affected Controlled Interfaces on the local side of the link.

Note
It is recommended to configure both ends of the link to the same Automatic State Propagation configuration.
LLF requires an activation key (PTP 820-SL-LLF). Without this activation key, only LLF ID 1 is available. See Configuring the Activation Key (CLI).
The following events in the Monitored Interface trigger ASP:
- Radio LOF
• Radio Excessive BER - Remote Radio LOF
- Remote Excessive BER
- Remove LOC
The user can also configure the ASP pair so that Radio LOF, Radio Excessive BER, or loss of the Ethernet connection at the remote side of the link will also trigger ASP.
In addition, ASP is triggered if the Controlled Interface is a LAG, and the physical interfaces that belong to the LAG are set to Admin = Down in the Interface Manager.
When a triggering event takes place:
- If the Controlled Interface is an electrical GbE port, the port is closed.
- If the Controlled Interface is an optical GbE port, the port is muted.
Each Controlled Interface remains closed or muted until all triggering events are cleared.
In addition, when a local triggering event takes place, the ASP mechanism sends an indication to the remote side of the link. Even when no triggering event has taken place, the ASP mechanism sends periodic update messages indicating that no triggering event has taken place.
A trigger delay time can be configured, so that when a triggering event takes place, the ASP mechanism does not propagate the event until this delay time has elapsed. A trigger delay from 0 to 10,000 ms can be set per LLD ID.
The delay time must be configured via CLI. See Configuring Automatic State Propogation and Link Loss Forwarding.
To configure an Automatic State Propagation interface pair:
- Select Ethernet > Interfaces > ASP & LLF. The Automatic State Propagation page opens.
Figure 208: Automatic State Propagation Page

- Click Add. The Automatic State Propagation - Add page opens.
Figure 209: Automatic State Propagation - Add Page

- In the Controlled Ethernet interface field, select the interface that will be disabled upon failure of the Monitored Radio Interface, defined below.
- In the Monitored Radio interface field, select the Monitored Radio Interface. The Controlled Ethernet Interface, defined above, is disabled upon a failure indication on the Monitored Radio Interface. You can select a radio or TDM interface, or a radio protection or Multi-Carrier ABC group, as the Monitored Radio Interface.
- In the ASP admin field, select Enable to enable Automatic State Propagation on the interface pair, or Disable to disable Automatic State Propagation on the pair.
- Optionally, in the ASP trigger by remote fault field, select Enable if you want to configure the system to disable the Controlled Ethernet Interface upon a radio failure at the remote side of the link from the Monitored Radio Interface. ASP events will only be propagated to Controlled Interfaces with LLF IDs that match LLF IDs of affected Controlled Interfaces at the other side of the link.
- Optionally, in the ASP Management Safe mode admin field, select Enable or Disable to enable or disable ASP Management Safe mode (CSF mode).. In ASP Management Safe mode, the ASP mechanism does not physically shut down the Controlled Interface when ASP is triggered. Instead, the ASP mechanism sends a failure indication message(CSF PDU).. The CSF message is used to propagate the failure indication to external equipment.
When ASP Management Safe mode (CSF) is configured, the peer unit must be configured to receive CSF PDUs. CSF receive must be enabled in order for G.8032ERPI topology changes to be initiated upon receipt of a CSF PDU. This must be configured via the CLI. For details, see Configuring Receipt of CSF PDUs (CLI). - In the ASP LLF ID field, select an ID for Link Loss Forwarding (LLF). When ASP trigger by remote fault is set to Enable, ASP events at the other side of the link are propagated to Controlled Interfaces with LLF IDs that match the LLF IDs of affected Controlled Interfaces at the other side of the link. LLF IDs are unique per Monitored Interface. That is, if LLF ID 1 has been used for a Controlled Interface that is grouped with fixed radio interface 1, that ID cannot be used again for another Controlled Interface grouped with fixed radio interface 1. However, it can be used for Controlled Interface grouped with fixed radio interface 2. You can select an LLF ID between 1 and 30.
- this procedure to assign additional Controlled Interfaces to the Monitored Interface, or to set up additional ASP pair with other interfaces. Controlled Interfaces can only be assigned to one ASP pair. Monitored Interfaces can be assigned to multiple ASP pairs.
To edit an Automatic State Propagation interface pair:
- Select the interface pair in the Automatic state propagation configuration table.
- Click Edit. The Automatic State Propagation – Edit page opens. The Edit page is similar to the Add page (Figure 202), but the Controlled Ethernet Interface and Monitored Radio Interface parameters are read-only.
To delete an Automatic State Propagation interface pair:
- Select the interface pair in the Automatic state propagation configuration table.
- Click Delete. The interface pair is removed from the Automatic state propagation configuration table.
To delete multiple interface pairs:
- Select the interface pairs in the Automatic state propagation configuration table or select all the interfaces by selecting the check box in the top row.
- Click Delete. The interface pairs are removed from the Automatic state propagation configuration table.
Viewing Ethernet PMs and Statistics
PTP 820G and PTP 820F stores and displays statistics in accordance with RMON and RMON2 standards. You can display various peak TX and RX rates (in seconds) and average TX and RX rates (in seconds), both in bytes and in packets, for each measured time interval. You can also display the number of seconds in the interval during which TX and RX rates exceeded the configured threshold.
This section includes:
• RMON Statistics
- Port TX Statistics
- Port RX Statistics
RMON Statistics
To view and reset RMON statistics:
- Select Ethernet > PM & Statistics > RMON. The RMON page opens.
Figure 210 RMON Page

• To clear the statistics, click Clear All at the bottom of the page.
• To refresh the statistics, click Refresh at the bottom of the page.
Each column in the RMON page displays RMON statistics for one of the unit's interfaces. To hide or display columns:
- In the header row, select the arrow next to any of the columns.
- Select Columns.
- Mark the interfaces you want to display and clear the interfaces you do not want to display.
Figure 211 RMON Page – Hiding and Displaying Columns
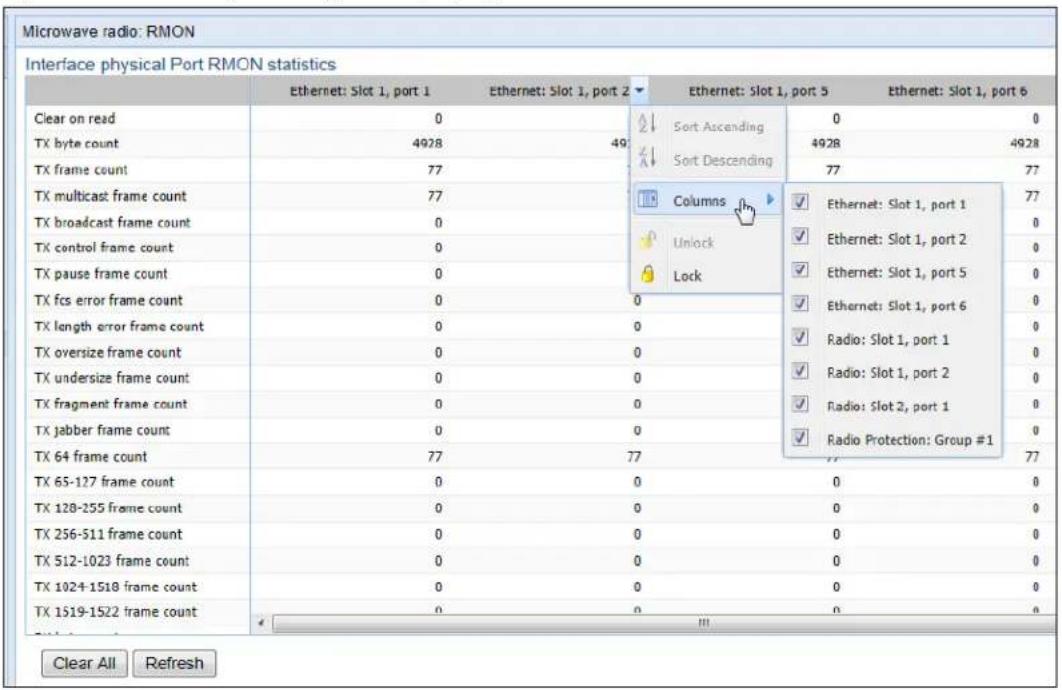
Egress CoS Statistics
You can display packet egress statistics per CoS value. For each CoS value, the following statistics are displayed per Color (Green and Yellow):
• Number of packets transmitted
• Number of packets dropped
• Number of bytes transmitted
• Number of bytes dropped

Note
Transmitted bits per second are not supported in the current release.
To display egress CoS statistics:
- Select Ethernet > PM & Statistics > Egress CoS Statistics. The Egress CoS Statistics page opens.
Figure 212: Egress CoS Statistics Page
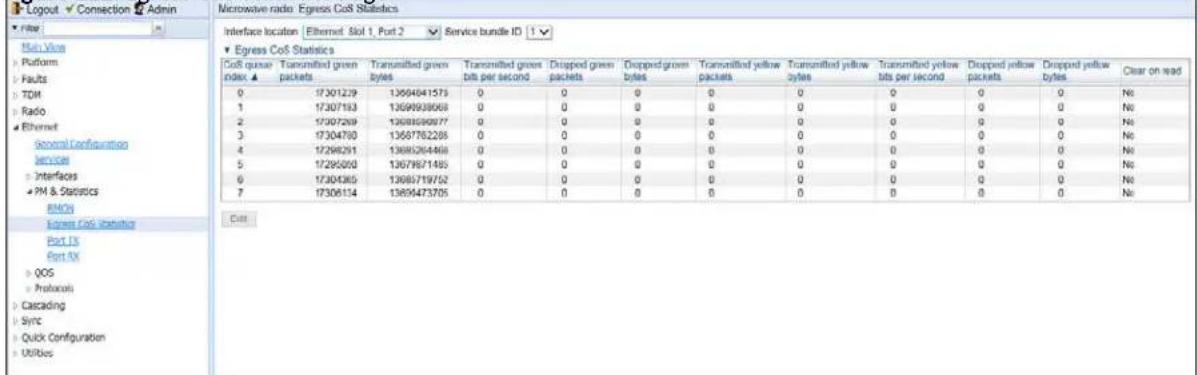
2. In the Show Service bundle ID field, select 1.

Note
Service Bundles are bundles of queues, grouped together in order to configure common egress characteristics for specific services. In the current release, only Service Bundle 1 is supported.
By default, the egress CoS statistics are cumulative. That is, they are not automatically cleared. You can set each individual CoS number to be cleared whenever the Egress CoS Statistics page is opened by changing the Clear on read value to Yes.
- To change the clear on read value, select the CoS number in the CoS queue index column and click Edit. The Egress CoS Statistics – Edit page opens.
Figure 213: Egress CoS Statistics – Edit Page
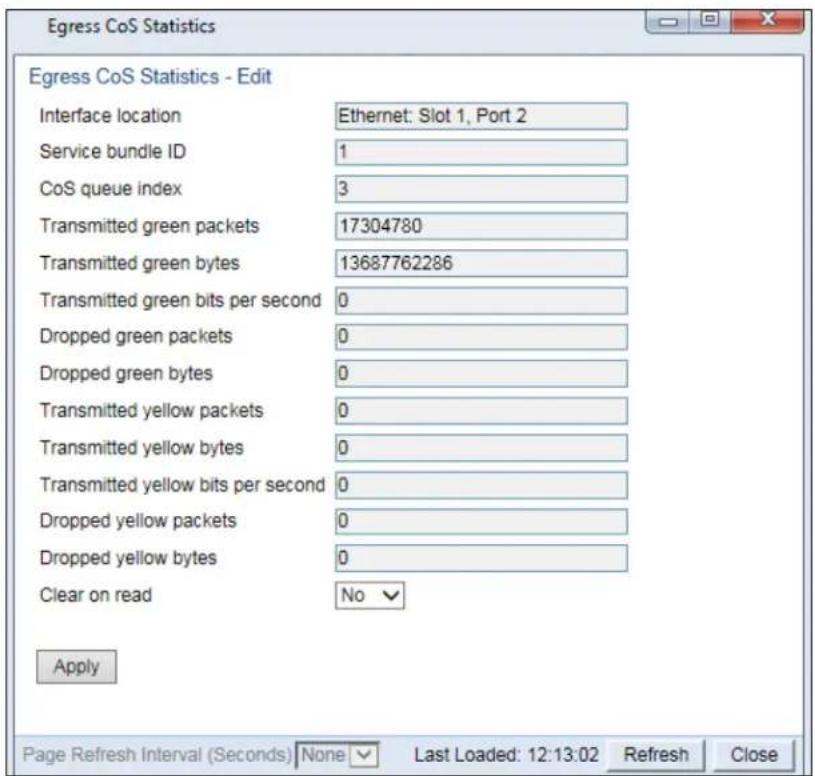
- In the Clear on read field, select Yes to have statistics for the CoS value cleared every time you open the page.
- Click Apply.
Port TX Statistics
The Ethernet Port TX PM report page displays PMs that measure various peak transmission rates (in seconds) and average transmission rates (in seconds), both in bytes and in packets, for each measured time interval.
The page also displays the number of seconds in the interval during which transmission rates exceeded the configured threshold.
This section includes:
• Displaying Ethernet Port TX PMs
• Enabling or Disabling Gathering of Port TX PM Statistics per Interface
• Setting the Ethernet Port TX Threshold
Displaying Ethernet Port TX PMs
To display Ethernet Port TX PMs:
- Select Ethernet > PM & Statistics > Port TX. The Ethernet Port TX PM Report page opens.
Figure 214 Ethernet Port TX PM Report Page

- In the Interface field, select the interface for which you want to display PMs.
- In the Interval Type field:
To display reports for the past 24 hours, in 15 minute intervals, select 15 minutes.
To display reports for the past month, in daily intervals, select 24 hours.
Table 63 describes the Ethernet TX port PMs.
Table 70 Ethernet TX Port PMs
| Parameter Definition | |
| Interval | For 24-hour intervals, displays the date of the interval. For 15-minute intervals, displays the date and ending time of the interval. |
| Peak... Average... bytes... Packets... | Various peak transmission rates (in seconds) and average transmission rates (in seconds), both in bytes and in packets, for each measured time interval. |
| TX bytes Layer 1 exceed threshold (sec) | The number of seconds the TX bytes exceeded the specified threshold during the interval. For instructions on setting the threshold, see Setting the Ethernet Port TX Threshold. |
| Invalid data flag | Indicates whether the values received during the measured interval are valid. An x in the column indicates that the values are not valid (for example, because of a power surge or power failure that occurred during the interval). |
To clear the PMs, click Clear All.
Enabling or Disabling Gathering of Port TX PM Statistics per Interface
To select the interfaces for which to gather and display Port TX PMs:
- In the Ethernet Port TX PM Report page, click PM Admin. The Ethernet PM Port Admin page opens.
Figure 215 Ethernet PM Port Admin Page

- Select the interface.
- Click Enable Port PM or Disable Port PM to enable or disable the gathering of Port TX PMs on the selected interface.
- Click Close.
Setting the Ethernet Port TX Threshold
The TX bytes Layer 1 exceed threshold (sec) column shows, for each interval, the number of seconds the TX bytes exceeded the specified threshold during the interval:
To view and set this threshold:
- In the Ethernet Port TX PM Report page, click Threshold. The Ethernet Port Tx Threshold page opens.
Figure 216: Ethernet Port Tx Threshold Page

- Enter a threshold, between 0 and 4294967295.
- Click Apply, then Close.
6.
Port RX Statistics
The Ethernet Port RX PM report page displays PMs that measure various peak transmission rates (in seconds) and average RX rates (in seconds), both in bytes and in packets, for each measured time interval.
The page also displays the number of seconds in the interval during which RX rates exceeded the configured threshold.
This section includes:
• Displaying Ethernet Port RX PMs
• Enabling or Disabling Gathering of Port RX PM Statistics per Interface
• Setting the Ethernet Port RX Threshold
Displaying Ethernet Port RX PMs
To display Ethernet Port RX PMs:
- Select Ethernet > PM & Statistics > Port RX. The Ethernet Port RX PM Report page opens.
Figure 217 Ethernet Port RX PM Report Page
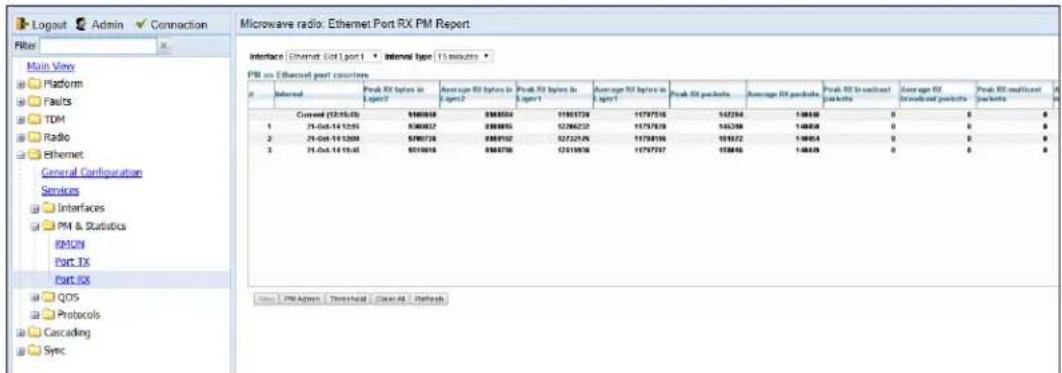
- In the Interface field, select the interface for which you want to display PMs.
- In the Interval Type field:
To display reports for the past 24 hours, in 15 minute intervals, select 15 minutes.
To display reports for the past month, in daily intervals, select 24 hours.
Table 64 describes the Ethernet RX port PMs.
Table 71 Ethernet RX Port PMs
| Parameter Definition | |
| Interval | For 24-hour intervals, displays the date of the interval. For 15-minute intervals, displays the date and ending time of the interval. |
| Peak... Average... bytes... Packets... | Various peak transmission rates (per second) and average RX rates (per second), both in bytes and in packets, for each measured time interval. |
Parameter Definition
| RX bytes Layer 1 exceed threshold (sec) | The number of seconds the RX bytes exceeded the specified threshold during the interval. For instructions on setting the threshold, see Setting the Ethernet Port RX Threshold. |
| Invalid data flag | Indicates whether the values received during the measured interval are valid. An x in the column indicates that the values are not valid (for example, because of a power surge or power failure that occurred during the interval). |
To clear the PMs, click Clear All.
Enabling or Disabling Gathering of Port RX PM Statistics per Interface
To select the interfaces for which to gather and display Port RX PMs:
- In the Ethernet Port RX PM Report page, click PM Admin. The Ethernet PM Port Admin page opens.
Figure 218 Ethernet PM Port Admin Page
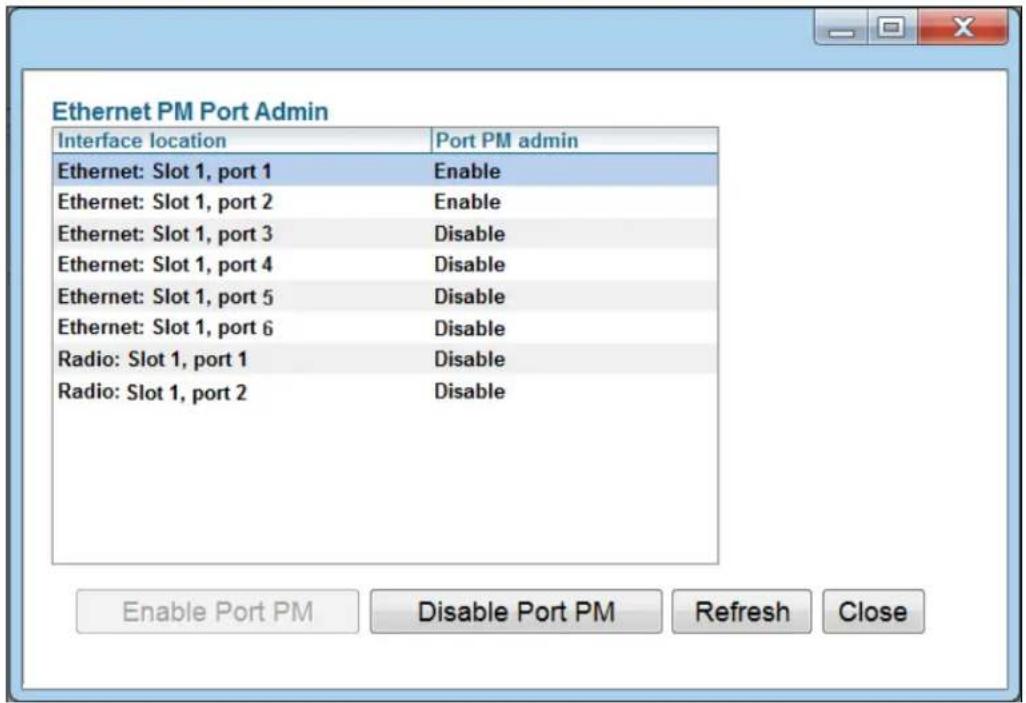
- Select the interface.
- Click Enable Port PM or Disable Port PM to enable or disable the gathering of Port RX PMs on the selected interface.
- Click Close.
Setting the Ethernet Port RX Threshold
The RX bytes Layer 1 exceed threshold (sec) column shows for each interval, the number of seconds the RX bytes exceeded the specified threshold during the interval:
To view and set this threshold:
- In the Ethernet Port RX PM Report page, click Threshold. The Ethernet Port Rx Threshold page opens.
Figure 219 Ethernet Port Rx Threshold Page
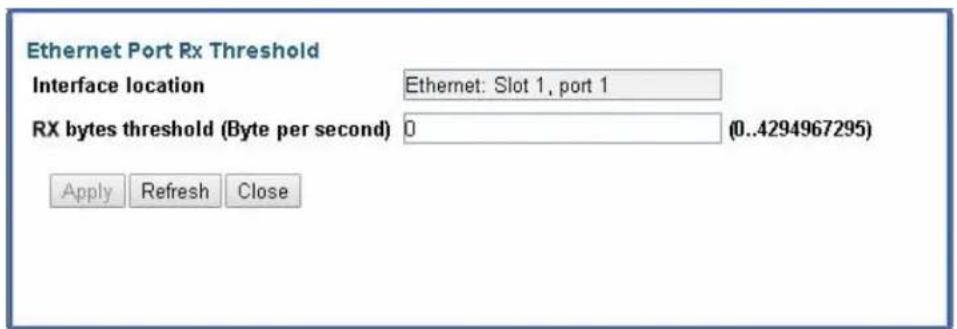
- Enter a threshold, between 0 and 4294967295.
- Click Apply, then Close.
Chapter 7: Quality of Service (QoS)
This section includes:
- QoS Overview
- Configuring Classification
• Configuring Policers (Rate Metering) - Configuring Marking
- Configuring WRED
- Configuring Egress Shaping
- Configuring Scheduling
- Configuring and Displaying Queue-Level PMs

Note
You can display additional QoS egress statistics, but only via CLI. For information, see Displaying Egress Statistics (CLI).
QoS Overview
Quality of Service (QoS) deals with the way frames are handled within the switching fabric. QoS is required in order to deal with many different network scenarios, such as traffic congestion, packet availability, and delay restrictions.
PTP 820G and PTP 820F's personalized QoS enables operators to handle a wide and diverse range of scenarios. PTP 820G and PTP 820F's smart QoS mechanism operates from the frame's ingress into the switching fabric until the moment the frame egresses via the destination port.
QoS capability is very important due to the diverse topologies that exist in today's network scenarios. These can include, for example, streams from two different ports that egress via single port, or a port-to-port connection that holds hundreds of services. In each topology, a customized approach to handling QoS will provide the best results.
Figure 213 shows the basic flow of PTP 820G and PTP 820F's QoS mechanism. Traffic ingresses (left to right) via the Ethernet or radio interfaces, on the "ingress path." Based on the services model, the system determines how to route the traffic. Traffic is then directed to the most appropriate output queue via the "egress path."
Figure 220 QoS Block Diagram

flowchart
graph LR
    A["GE/Radio"] --> B["Port"]
    B --> C["Ingress"]
    C --> D["Classifier"]
    D --> E["Rate Limit (Policing)"]
    E --> F["(Optional)"]
    F --> G["CET/Pipe Services"]
    H["GE/Radio"] --> I["Port"]
    I --> J["Ingress"]
    J --> K["Classifier"]
    K --> L["Rate Limit (Policing)"]
    L --> M["(Optional)"]
    M --> N["CET/Pipe Services"]
    O["GE/Radio"] --> P["Port"]
    P --> Q["Ingress"]
    Q --> R["Classifier"]
    R --> S["Rate Limit (Policing)"]
    S --> T["(Optional)"]
    T --> U["CET/Pipe Services"]
    V["GE/Radio"] --> W["Port"]
    W --> X["Ingress"]
    X --> Y["Classifier"]
    Y --> Z["Rate Limit (Policing)"]
    Z --> AA["(Optional)"]
    AA --> AB["CET/Pipe Services"]
    AC["GE/Radio"] --> AD["Port"]
    AD --> AE["Ingress"]
    AE --> AF["Classifier"]
    AF --> AG["Rate Limit (Policing)"]
    AG --> AH["(Optional)"]
    AH --> AI["CET/Pipe Services"]
    AJ["GE/Radio"] --> AK["Port"]
    AK --> AL["Ingress"]
    AL --> AM["Classifier"]
    AM --> AN["Rate Limit (Policing)"]
    AN --> AO["(Optional)"]
    AO --> AP["CET/Pipe Services"]
    AQ["GE/Radio"] --> AR["Port"]
    AR --> AS["Ingress"]
    AS --> AT["Classifier"]
    AT --> AU["Rate Limit (Policing)"]
    AU --> AV["(Optional)"]
    AV --> AW["CET/Pipe Services"]
    AX["GE/Radio"] --> AY["Port"]
    AY --> AZ["Ingress"]
    AZ --> BA["Classifier"]
    BA --> BB["Rate Limit (Policing)"]
    BB --> BC["(Optional)"]
    BC --> BD["CET/Pipe Services"]
    BE["GE/Radio"] --> BF["Port"]
    BF --> BG["Ingress"]
    BG --> BH["Classifier"]
    BH --> BI["Rate Limit (Policing)"]
    BI --> BJ["(Optional)"]
    BJ --> BK["CET/Pipe Services"]
    BL["GE/Radio"] --> BM["Port"]
    BM --> BN["Ingress"]
    BN --> BO["Classifier"]
    BO --> BP["Rate Limit (Policing)"]
    BP --> BQ["(Optional)"]
    BQ --> BR["CET/Pipe Services"]
    BS["GE/Radio"] --> BT["Port"]
    BT --> BU["Ingress"]
    BU --> BV["Classifier"]
    BV --> BW["Rate Limit (Policing)"]
    BW --> BX["(Optional)"]
    BX --> BY["CET/Pipe Services"]
    CA["GE/Radio"] --> CB["Port"]
    CB --> CC["Ingress"]
    CC --> CD["Classifier"]
    CD --> CE["Rate Limit (Policing)"]
    CE --> CF["(Optional)"]
    CF --> CG["CET/Pipe Services"]
    CH["GE/Radio"] --> CI["Port"]
    CI --> CJ["Ingress"]
    CJ --> CK["Classifier"]
    CK --> CR["Rate Limit (Policing)"]
    CR --> CS["(Optional)"]
    CS --> CT["CET/Pipe Services"]
    DU["GE/Radio"] --> DV["Port"]
    DV --> DW["Ingress"]
    DW --> DX["Classifier"]
    DX --> DY["Rate Limit (Policing)"]
    DY --> DWY["(Optional)"]
    DWY --> Z["CET/Pipe Services"]
The ingress path consists of the following QoS building blocks:
- Ingress Classifier – A hierarchical mechanism that deals with ingress traffic on three different levels: interface, service point, and service. The classifier determines the exact traffic stream and associates it with the appropriate service. It also calculates an ingress frame CoS and Color. CoS and Color classification can be performed on three levels, according to the user's configuration.
- Ingress Rate Metering – A hierarchical mechanism that deals with ingress traffic on three different levels: interface, service point, and service point CoS. The rate metering mechanism enables the system to measure the incoming frame rate on different levels using a TrTCM standard MEF rate meter, and to determine whether to modify the color calculated during the classification stage.
The egress path consists of the following QoS building blocks:
- Queue Manager – This is the mechanism responsible for managing the transmission queues, utilizing smart WRED per queue and per packet color (Green or Yellow).
- Scheduling and Shaping – A hierarchical mechanism that is responsible for scheduling the transmission of frames from the transmission queues, based on priority among queues, Weighted Fair Queuing (WFQ) in bytes per each transmission queue, and eligibility to transmit based on required shaping on several different levels (per queue, per service bundle, and per port).
- Marker – This mechanism provides the ability to modify priority bits in frames based on the calculated CoS and Color.
For a more detailed description of QoS in the PTP 820G or PTP 820F, refer to the Technical Description for the product you are using.
Configuring Classification
The hierarchical classifier consists of the following levels:
• Logical interface-level classification
• Service point-level classification
• Service level classification
This section explains how to configure classification at the logical interface level.
- For instructions how to configure classification at the service point level, see Ethernet Service Points – Ingress Attributes.
- For instructions how to configure classification at the service level, see Adding an Ethernet Service.
This section includes:
• Classification Overview
- Configuring Ingress Path Classification on a Logical Interface
• Modifying the C-VLAN 802.1Q UP and CFI Bit Classification Table
• Modifying the S-VLAN 802.1 UP and DEI Bit Classification Table
• Modifying the DSCP Classification Table
• Modifying the MPLS EXP Bit Classification Table
• Modifying the MAC DA Classification Table
In addition to the procedures described in this section, you can specify a specific CoS and Color for a specific VLAN ID. This is the highest classification priority on the logical interface level, and overrides any other classification criteria at the logical interface level. Classification by VLAN ID can only be configured via CLI. See Configuring VLAN Classification and Override (CLI).
Classification Overview
PTP 820G and PTP 820F supports a hierarchical classification mechanism. The classification mechanism examines incoming frames and determines their CoS and Color. The benefit of hierarchical classification is that it provides the ability to “zoom in” or “zoom out”, enabling classification at higher or lower levels of the hierarchy. The nature of each traffic stream defines which level of the hierarchical classifier to apply, or whether to use several levels of the classification hierarchy in parallel.
Classification takes place on the logical interface level according to the following priorities:
- VLAN ID (CLI-only – see Configuring VLAN Classification and Override (CLI))
- 802.1p bits
- DSCP bits
- MPLS EXP field
- Default interface CoS
PTP 820G and PTP 820F performs the classification on each frame ingressing the system via the logical interface. Classification is performed step by step from the highest priority to the lowest priority classification method. Once a match is found, the classifier determines the CoS and Color decision for the frame for the logical interface-level.
For example, if the frame is an untagged IP Ethernet frame, a match will not be found until the third priority level (DSCP). The CoS and Color values defined for the frame's DSCP value will be applied to the frame.
You can disable some of these classification methods by configuring them as un-trusted. For example, if 802.1p classification is configured as un-trusted for a specific interface, the classification mechanism does not perform classification by UP bits. This is useful, for example, if classification is based on DSCP priority bits.
If no match is found at the logical interface level, the default CoS is applied to incoming frames at this level. In this case, the Color of the frame is assumed to be Green.
Classification may also be performed by Destination MAC Address (MAC DA) at the service point level. When MAC DA classification is enabled on a service point, the classification mechanism checks each frame ingressing the interface on which the service point is defined against a list of user-defined MAC DAs. If there is a match, the mechanism applies to the frame the release and Color defined for that MAC DA. Classification by MAC DA overrides the other classification criteria at the service point level.
Up to 64 MAC addresses can be defined per device, including four predefined MAC addresses. You can assign each of these MAC addresses a CoS value and a Color.
The following MAC addresses are predefined, with a high priority (CoS=7, Color=Green). You can edit or delete these MAC addresses:
• 09:00:2B:00:00:04
• 09:00:2B:00:00:05
• 01:80:C2:00:00:14
• 01:80:C2:00:00:15
These are protocol MAC addresses used to transport IS-IS frames as defined in ISO 9542 and ISO/IEC 10589.
Configuring Ingress Path Classification on a Logical Interface
This section explains how to configure the classification criteria per each logical interface. The following sections explain how to modify the classification tables per bit type.
To configure the classification criteria for a logical interface:
- Select Ethernet > Interfaces > Logical Interfaces. The Logical Interfaces page opens.
Figure 221 Logical Interfaces Page

- Select the interface you want to configure and click Edit. The Logical Interfaces - Edit page opens.
Figure 222 Logical Interfaces - Edit Page

- Configure the parameters described in Table 65.
- Click Apply, then Close.

Note
The Edge mode field is reserved for future use. The Ingress byte compensation and Egress byte compensation fields are described in Configuring the Ingress and Egress Byte Compensation.
Table 72 Logical Interface Classification Parameters
| Parameter Definition | |
| Trust VLAN UP bits | Select the interface's trust mode for user priority (UP) bits:Trust– The interface performs QoS and color classification according to UP and CFI/DEI bits according to user-configurable tables for 802.1q UP bits (C-VLAN frames) or 802.1AD UP bits (S-VLAN frames). VLAN UP bit classification has priority over DSCP and MPLS classification, so that if a match is found with the UP bit of the ingressing frame, DSCP values and MPLS bits are not considered.Un-Trust– The interface does not consider 802.1 UP bits during classification. |
| Trust DSCP | Select the interface's trust mode for DSCP:Trust– The interface performs QoS and color classification according to a user-configurable table for DSCP to CoS and color classification. DSCP classification has priority over MPLS classification, so that if a match is found with the DSCP value of the ingressing frame, MPLS bits are not considered.Un-Trust– The interface does not consider DSCP during classification. |
| Trust MPLS | Select the interface's trust mode for MPLS bits:Trust– The interface performs QoS and color classification according to a user-configurable table for MPLS EXP to CoS and color classification.Un-Trust– The interface does not consider MPLS bits during classification. |
| Default port CoS | Select the default CoS value for frames passing through the interface (0 to 7). This value can be overwritten on the service point and service level. |
Modifying the C-VLAN 802.1Q UP and CFI Bit Classification Table
To modify the classification criteria for 802.1Q User Priority (UP) bits:
- Select Ethernet > QoS > Classification > 802.1Q. The 802.1Q Classification page opens.
Figure 223 802.1Q Classification Page

- Select the row you want to modify and click Edit. The 802.1Q Classification – Edit page opens.
Figure 224 802.1Q Classification - Edit Page

-
Modify the parameters you want to change:
-
802.1Q UP – Read-only. The User Priority (UP) bit to be mapped.
- 802.1Q CFI – Read-only. The CFI bit to be mapped.
- 802.1Q CoS – The CoS assigned to frames with the designated UP and CFI.
-
802.1Q Color – The Color assigned to frames with the designated UP and CFI.
-
Click Apply, then Close.
Modifying the S-VLAN 802.1 UP and DEI Bit Classification Table
To modify the classification criteria for 802.1AD User Priority (UP) bits:
- Select Ethernet > QoS > Classification > 802.1AD. The 802.1AD Classification page opens.
Figure 225 802.1AD Classification Page
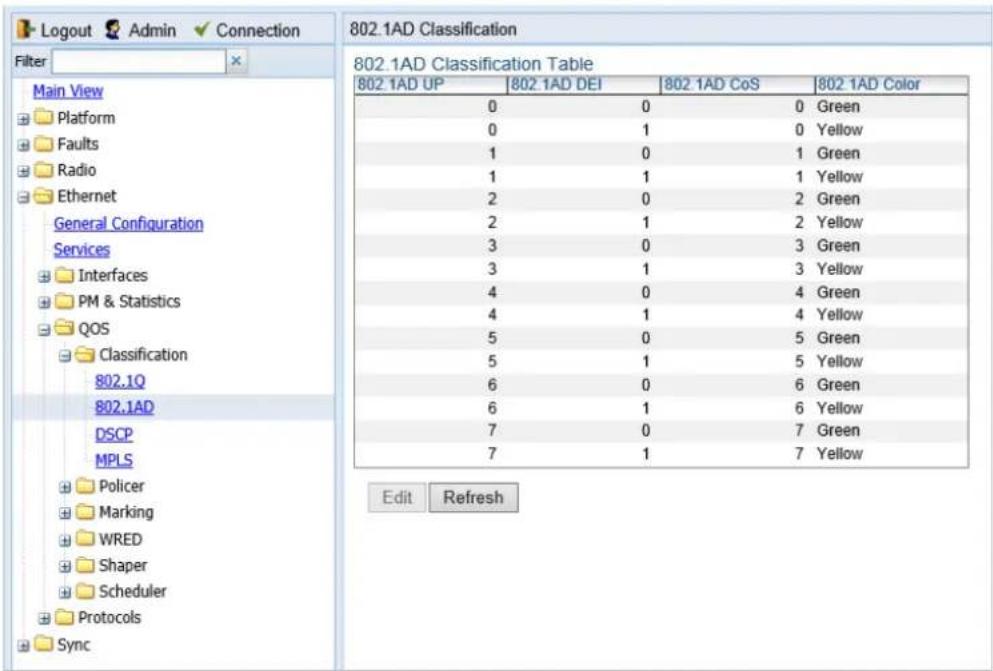
- Select the row you want to modify and click Edit. The 802.1AD Classification - Edit page opens.
Figure 226 802.1Q Classification - Edit Page

-
Modify the parameters you want to change:
-
802.1AD UP – Read-only. The User Priority (UP) bit to be mapped.
- 802.1ADQ DEI – Read-only. The DEI bit to be mapped.
- 802.1AD CoS – The CoS assigned to frames with the designated UP and DEI.
-
802.1AD Color – The Color assigned to frames with the designated UP and DEI.
-
Click Apply, then Close.
Modifying the DSCP Classification Table
You can configure the classification criteria for Differentiated Service Code Point (DSCP) priority values. The DSCP is a 6-bit length field inside the IP datagram header carrying priority information. Classification by DSCP can be used for untagged frames, as well as 802.1Q tagged or provider VLAN tagged frames.
To modify the classification criteria for DSCPs:
- Select Ethernet > QoS > Classification > DSCP. The DSCP Classification page opens.
Figure 227 DSCP Classification Page

- Select the row you want to modify and click Edit. The DSCP Classification - Edit page opens.
Figure 228 DSCP Classification - Edit Page
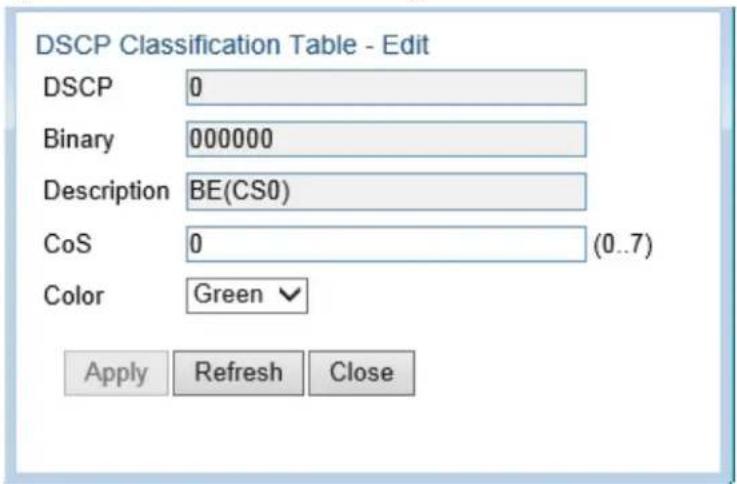
- Modify the parameters you want to change:
o DSCP – Read-only. The DSCP value to be mapped.
- Binary – Read-only. The binary representation of the DSCP value.
- Description – Read-only. The description of the DSCP value.
- CoS – The CoS assigned to frames with the designated DSCP value.
- Color – The Color assigned to frames with the designated DSCP value.
- Click Apply, then Close.
Modifying the MPLS EXP Bit Classification Table
MPLS bits are used to provide QoS capabilities by utilizing the bits set in the MPLS labels. Classification by MPLS bits is supported in both untagged and 802.1Q provider-tagged frames.
To modify the classification criteria for MPLS EXP bits:
- Select Ethernet > QoS > Classification > MPLS. The MPLS Classification page opens.
Figure 229 MPLS Classification Page
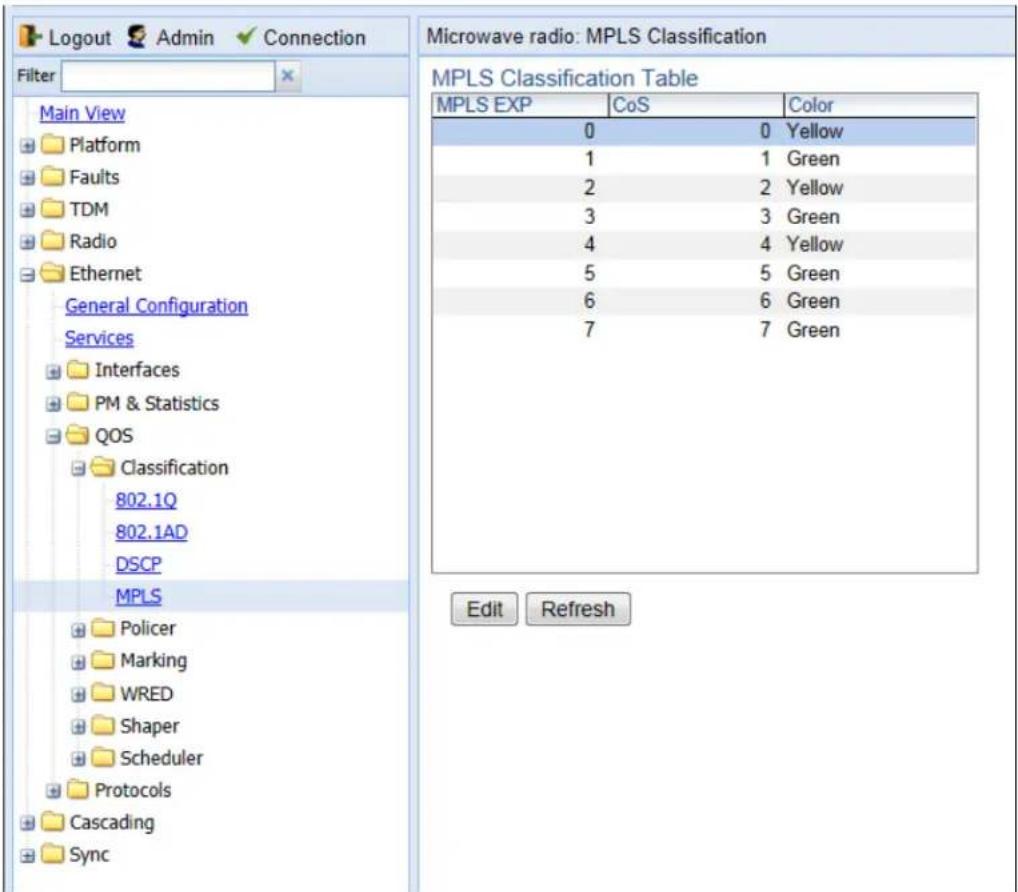
- Select the row you want to modify and click Edit. The MPLS Classification - Edit page opens.
Figure 230 MPLS Classification - Edit Page

-
Modify the parameters you want to change:
-
MPLS EXP – Read-only. The MPLS (experimental) bit to be mapped.
- CoS – The CoS assigned to frames with the designated MPLS EXP value.
-
Color – The Color assigned to frames with the designated MPLS EXP value.
-
Click Apply, then Close.
Modifying the MAC DA Classification Table
You can determine whether classification is performed by MAC DA in the CoS Mode field of the service point's Ingress Parameters page. See Ethernet Service Points – Ingress Attributes.
To add an entry to the MAC DA Classification Table:
- Select Ethernet > QoS > Classification > MAC DA. The MAC DA Classification page opens.
Figure 231 MAC DA Classification Page
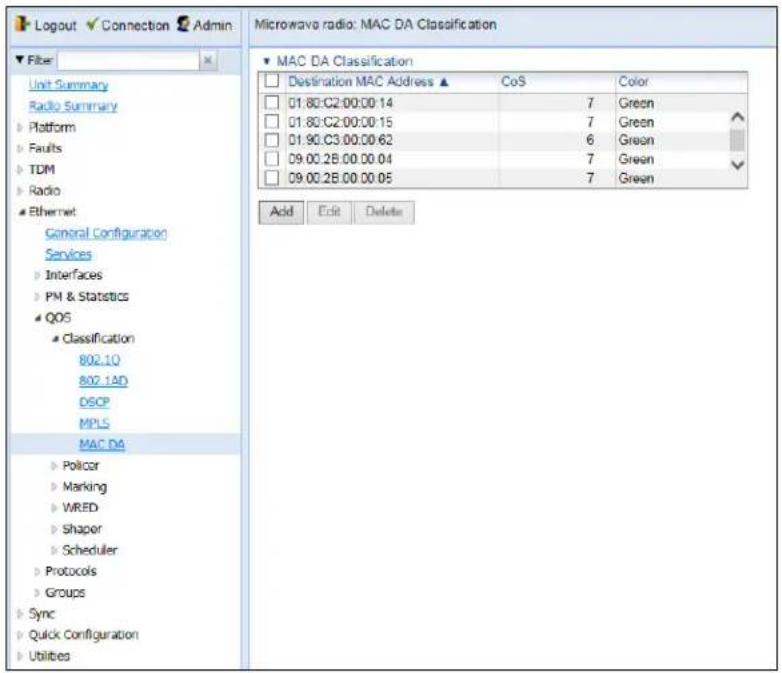
- Click Add. The MAC DA Classification – Add page opens.
Figure 232 MAC DA Classification – Add Page

- In the Destination MAC Address field, enter the MAC address.
- In the CoS field, enter the CoS to be assigned to frames with this MAC DA.
- In the Color field, enter the Color to be assigned to frames with this MAC DA.
- Click Apply, then Close.
To modify an entry in the MAC DA Classification Table:
- In the MAC DA Classification page, select the row you want to modify and click Edit. The MAC DA Classification – Edit page opens.
Figure 233 MAC DA Classification – Edit Page

-
Modify the parameters you want to change:
-
CoS – The CoS assigned to frames with this MAC DA.
-
Color – The Color assigned to frames with this MAC DA.
-
Click Apply, then Close.
To delete an entry from the MAC DA Classification Table:
- In the MAC DA Classification page, select the row you want to delete and click Delete. A confirmation window opens.
- Click OK.
Configuring Policers (Rate Metering)
This section includes:
• Policer (Rate Metering) Overview
- Configuring Policer Profiles
• Assigning Policers to Interfaces
- Configuring the Ingress and Egress Byte Compensation
Policer (Rate Metering) Overview
The PTP 820G and PTP 820F switching fabric supports hierarchical policing on the logical interface level. You can define up to 250 rate meter (policer) profiles.

Note
Policing on the service point level, and the service point and CoS level, must be configured via CLI. See Configuring Policers (Rate Metering) (CLI)..
PTP 820G and PTP 820F 's policer mechanism is based on a dual leaky bucket mechanism (TrTCM). The policers can change a frame's color and CoS settings based on CIR/EIR + CBS/EBS, which makes the policer mechanism a key tool for implementing bandwidth profiles and enabling operators to meet strict SLA requirements.
The output of the policers is a suggested color for the inspected frame. Based on this color, the queue management mechanism decides whether to drop the frame or to pass it to the queue.
Configuring Policer Profiles
This section includes:
- Adding a Policer Profile
• Editing a Policer Profile
• Deleting a Policer Profile
Adding a Policer Profile
To add a policer profile:
- Select Ethernet > QoS > Policer > Policer Profile. The Policer Profile page opens.
Figure 234 Policer Profile Page

- Click Add. The Policer Profile - Add page opens.
Figure 235 Policer Profile - Add Page

- Configure the profile's parameters. See Table 66 Policer Profile Parameters for a description of the policer profile parameters.
- Click Apply, then Close.
Table 73 Policer Profile Parameters
| Parameter Definition | |
| Profile ID | A unique ID for the policer profile. You can choose from any unused value from 1 to 250. Once you have added the profile, you cannot change the Profile ID. |
| Description | A description of the policer profile. |
| Policer type | Read-only. The type of policer. Always set to MEF-TRTCM. |
| CIR | Enter the Committed Information Rate (CIR) for the policer, in bits per second. Permitted values are 0, or 64,000 through 1,000,000,000 bps. If the value is 0, all incoming CIR traffic is dropped. |
| CBS | Enter the Committed Burst Rate (CBR) for the policer, in Kbytes. Permitted values are 2 through 128 Kbytes. |
| EIR | Enter the Excess Information Rate (EIR) for the policer, in bits per second. Permitted values are 0, or 64,000 through 1,000,000,000 bps. If the value is 0, all incoming EIR traffic is dropped. |
| EBS | Enter the Excess Burst Rate (EBR) for the policer, in Kbytes. Permitted values are 2 through 128 Kbytes. |
| Color mode | Select how the policer treats packets that ingress with a CFI or DEI field set to 1 (yellow). Options are:Color Aware – All packets that ingress with a CFI/DEI field set to 1 (yellow) are treated as EIR packets, even if credits remain in the CIR bucket.Color Blind – All ingress packets are treated as green regardless of their CFI/DEI value. A color-blind policer discards any former color decisions. |
| Coupling flag | Select Enable or Disable. When enabled, frames that ingress as yellow may be converted to green when there are no available yellow credits in the EIR bucket. Coupling Flag is only relevant in Color Aware mode. |
Editing a Policer Profile
To edit a policer profile, select the profile in the Police Profile table and click Edit. The Policer Profile Table Edit page opens.
The Policer Profile Table - Edit page is identical to the Policer Profile Table - Add page (Figure 225). You can edit any parameter that can be configured in the Policer Profile Table Add page, except the Profile ID.
Deleting a Policer Profile
You cannot delete a policer profile that is attached to a logical interface. You must first remove the profile from the logical interface, then delete the profile. See Assigning Policers to Interfaces.
To delete a policer profile, select the profile in the Police Profile table and click Delete. The profile is deleted.
To delete multiple policer profiles:
- Select the profiles in the Policer Profile table or select all the profiles by selecting the check box in the top row.
- Click Delete. The profiles are deleted.
Assigning Policers to Interfaces
To assign policers to a logical interface:
- Select Ethernet > Interfaces > Logical Interfaces. The Logical Interfaces page opens (Figure 214).
- Select the interface in the Ethernet Logical Port Configuration table and click Policers. The Policers page opens.
Figure 236 Logical Interfaces – Policers Page – Unicast Policer (Default)

For a logical interface, you can assign policers to the following traffic flows:
- Unicast Policer
• Multicast Policer - Broadcast Policer
- Ethertype Policers
Assigning Unicast Policers
To assign a policer for unicast traffic to a logical interface:
- Select Ethernet > Interfaces > Logical Interfaces. The Logical Interfaces page opens (Figure 214).
-
Select the interface in the Ethernet Logical Port Configuration Table and click Policers. The Policers page opens. By default, the Policers page opens to the Unicast Policer table (Figure 226).
-
In the Policer profile field, select a profile from the policer profiles defined in the system. The Policer profile drop-down list includes the ID and description of all defined profiles.
- In the Unicast admin field, select Enable to enable policing on unicast traffic flows from the logical interface, or Disable to disable policing on unicast traffic flows from the logical interface.
- Click Apply.
Assigning Multicast Policers
To assign a policer for multicast traffic to a logical interface:
- Select Ethernet > Interfaces > Logical Interfaces. The Logical Interfaces page opens (Figure 214).
- Select the interface in the Ethernet Logical Port Configuration table and click Policers. The Policers page opens. By default, the Policers page opens to the Unicast Policer table (Figure 226).
- Select Multicast Policer. The Multicast Policer table appears.
Figure 237 Logical Interfaces – Policers Page – Multicast Policer

- In the Policer profile field, select a profile from the policer profiles defined in the system. The Policer profile drop-down list includes the ID and description of all defined profiles.
- In the Multicast admin field, select Enable to enable policing on multicast traffic flows from the logical interface, or Disable to disable policing on multicast traffic flows from the logical interface.
- Click Apply.
Assigning Broadcast Policers
To assign a policer for broadcast traffic to a logical interface:
-
Select Ethernet > Interfaces > Logical Interfaces. The Logical Interfaces page opens (Figure 214).
-
Select the interface in the Ethernet Logical Port Configuration table and click Policers. The Policers page opens. By default, the Policers page opens to the Unicast Policer table (Figure 226).
- Select Broadcast Policer. The Broadcast Policer table appears.
Figure 238 Logical Interfaces – Policers Page – Broadcast Policer

- In the Policer profile field, select a profile from the policer profiles defined in the system. The Policer profile drop-down list includes the ID and description of all defined profiles.
- In the Broadcast admin field, select Enable to enable policing on broadcast traffic flows from the logical interface, or Disable to disable policing on broadcast traffic flows from the logical interface.
- Click Apply.
Assigning Ethertype Policers
You can define up to three policers per Ethertype value.
To assign a policer to an Ethertype:
- Select Ethernet > Interfaces > Logical Interfaces. The Logical Interfaces page opens (Figure 214).
- Select the interface in the Ethernet Logical Port Configuration Table and click Policers. The Policers page opens. By default, the Policers page opens to the Unicast Policer table (Figure 226).
- Select Ethertype type 1 Policer. The Ethertype type 1 Policer table appears.
Figure 239 Logical Interfaces – Policers Page – Ethertype Policer

- In the Ethertype 1 profile field, select a profile from the policer profiles defined in the system. The Ethertype 1 profile drop-down list includes the ID and description of all defined profiles.
- In the Ethertype 1 user value field, enter the Ethertype value to which you want to apply this policer. The field length is 4 nibbles (for example, 0x0806 - ARP).
- In the Ethertype 1 admin field, select Enable to enable policing on the logical interface for the specified ethertype, or Disable to disable policing on the logical interface for the specified ethertype.
- Click Apply.
- To assign policers to additional Ethertypes, select Ethertype type 2 Policer and Ethertype type 3 Policer and repeat the steps above.
Configuring the Ingress and Egress Byte Compensation
You can define the ingress and egress byte compensation value per logical interface. The policer attached to the interface uses these values to compensate for Layer 1 non-effective traffic bytes.
To define the ingress byte compensation value for a logical interface:
- Select Ethernet > Interfaces > Logical Interfaces. The Logical Interfaces page opens (Figure 214).
- Select the interface you want to configure and click Edit. The Logical Interfaces - Edit page opens (Figure 215).
- In the Ingress byte compensation field, enter the ingress byte compensation value, in bytes. Permitted values are 0 to 32 bytes. The default value is 20 bytes.
- In the Egress byte compensation field, enter the egress byte compensation value, in bytes. Permitted values are 0 to 32 bytes. The default value is 0 bytes. Only even values are permitted.
- Click Apply, then Close.
Configuring Marking
This section includes:
- Marking Overview
- Enabling Marking
• Modifying the 802.1Q Marking Table
• Modifying the 802.1AD Marking Table
Marking Overview
When enabled, PTP 820G and PTP 820F 's marking mechanism modifies each frame's 802.1p UP bit and CFI/DEI bits according to the classifier decision. The CFI/DEI (color) field is modified according to the classifier and policer decision. The color is first determined by a classifier and may be later overwritten by a policer. Green color is represented by a CFI/DEI value of 0, and Yellow color is represented by a CFI/DEI value of 1. Marking is performed on egress frames that are VLAN-tagged.
The marking is performed according to global mapping tables that describe the 802.1p UP bits and the CFI bits (for C-VLAN tags) or DEI bits (for S VLAN tags). The marking bit in the service point egress attributes determines whether the frame is marked as green or according to the calculated color.

Note
The calculated color is sent to the queue manager regardless of whether the marking bit is set.
Regular marking is only performed when:
• The outer frame is S-VLAN, and S-VLAN CoS preservation is disabled, or
• The outer frame is C-VLAN, and C-VLAN CoS preservation is disabled.
If marking and CoS preservation for the relevant outer VLAN are both disabled, special marking is applied. Special marking means that marking is performed, but only according to the values defined for Green frames in the 802.1Q and 802.1AD marking tables.
When marking is performed, the C-VLAN or S-VLAN 802.1p UP bits are re-marked according to the calculated CoS and color, and the mapping table for C-VLAN or S-VLAN.
Enabling Marking
Marking is enabled and disabled on the service point level. See Ethernet Service Points – Egress Attributes.
Modifying the 802.1Q Marking Table
The 802.1Q Marking table enables you to modify the CoS to UP and CFI bit mapping that is implemented when marking is enabled.
To modify the 802.1Q Marking table:
- Select Ethernet > QoS > Marking > 802.1Q. The 802.1Q Marking page opens. Each row in the 802.1Q Marking page represents a CoS and color combination.
Figure 240 802.1Q Marking Page
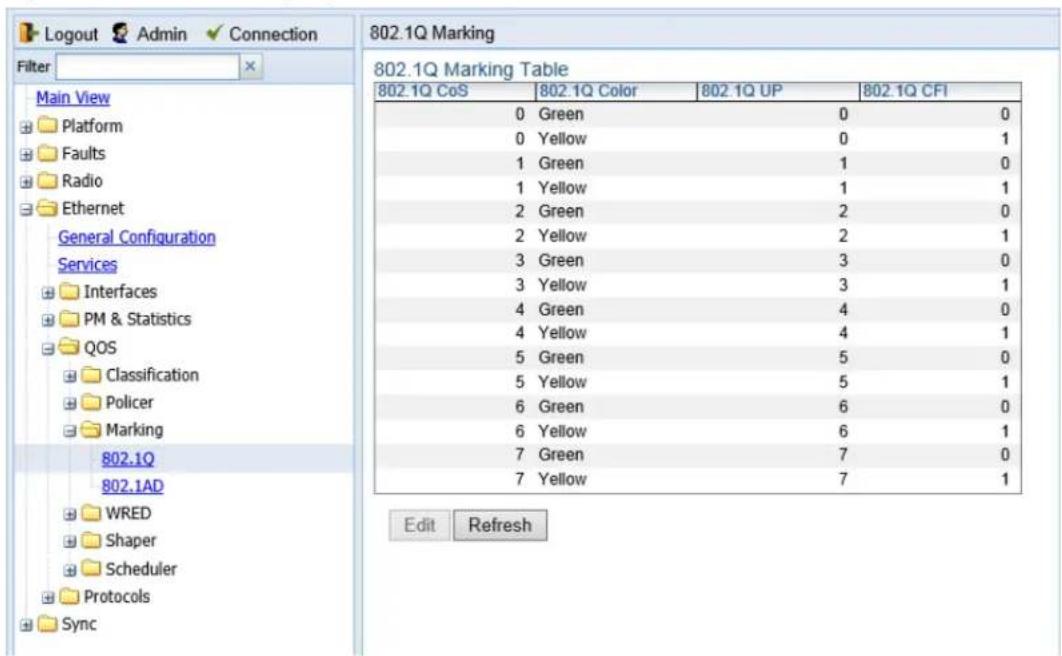
- Select the row you want to modify and click Edit. The 802.1Q Marking - Edit page opens.
Figure 241 802.1Q Marking - Edit Page

- Enter the new 802.1Q UP and 802.1Q CFI values.
- Click Apply, then Close.
Modifying the 802.1AD Marking Table
The 802.1AD Marking table enables you to modify the CoS to UP and DEI bit mapping that is implemented when marking is enabled.
To modify the 802.1AD Marking table:
- Select Ethernet > QoS > Marking > 802.1AD. The 802.1AD Marking page opens. Each row in the 802.1AD Marking page represents a CoS and color combination.
Figure 242 802.1AD Marking Page

- Select the row you want to modify and click Edit. The 802.1AD Marking - Edit page opens.
Figure 243 802.1AD Marking - Edit Page
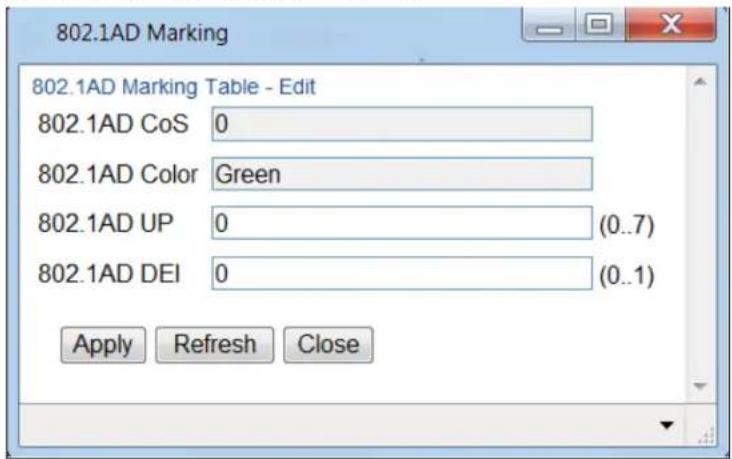
- Enter the new 802.1AD UP and 802.1AD DEI values.
- Click Apply, then Close.
Configuring WRED
This section includes:
- WRED Overview
- Configuring WRED Profiles
• Assigning WRED Profiles to Queues
WRED Overview
Weighted Random Early Detection (WRED) enables differentiation between higher and lower priority traffic based on CoS. You can define up to 30 WRED profiles. Each profile contains a green traffic curve and a yellow traffic curve. This curve describes the probability of randomly dropping frames as a function of queue occupancy.
The system also includes two pre-defined read-only profiles. These profiles are assigned profile IDs 31 and 32:
• Profile number 31 defines a tail-drop curve and is configured with the following values:
- 100% Yellow traffic drop after 64kbytes occupancy.
- 100% Green traffic drop after 128kbytes occupancy.
○ Yellow maximum drop is 100%
o Green maximum drop is 100%
- Profile number 32 defines a profile in which all will be dropped. It is for internal use and should not be applied to traffic.
A WRED profile can be assigned to each queue. The WRED profile assigned to the queue determines whether or not to drop incoming packets according to the occupancy of the queue. As the queue occupancy grows, the probability of dropping each incoming frame increases as well. As a consequence, statistically more TCP flows will be restrained before traffic congestion occurs.
Configuring WRED Profiles
This section includes:
- Adding a WRED Profile
• Editing a WRED Profile - Deleting a WRED Profile
Adding a WRED Profile
To add a WRED profile:
- Select Ethernet > QoS > WRED > WRED Profile. The WRED Profile page opens.
Figure 244 WRED Profile Page

- Click ADD. The WRED Profile - Add page opens, with default values displayed.
Figure 245 WRED Profile - Add Page

- In the WRED Profile ID field, select a unique ID to identify the profile. Permitted values are 1-30.
- In the Green curve min point field, enter the minimum throughput of green packets for queues with this profile, in Kbytes (0-8192). When this value is reached, the system begins dropping green packets in the queue.
- In the Green curve max point field, enter the maximum throughput of green packets for queues with this profile, in Kbytes (0-8192). When this value is reached, all green packets in the queue are dropped.
-
In the Green curve max drop ratio field, enter the maximum percentage (1-100) of dropped green packets for queues with this profile.
-
In the Yellow curve min point field, enter the minimum throughput of yellow packets for queues with this profile, in Kbytes (0-8192). When this value is reached, the system begins dropping yellow packets in the queue.
- In the Yellow curve max point field, enter the maximum throughput of yellow packets for queues with this profile, in Kbytes (0-8192). After this value is reached, all yellow packets in the queue are dropped.
- In the Yellow curve max drop ratio field, enter the maximum percentage (1-100) of dropped yellow packets for queues with this profile.
- Click Apply, then Close.
Editing a WRED Profile
To edit a WRED profile:
- Select Ethernet > QoS > WRED > WRED Profile. The WRED Profile page opens ().
- Select the profile you want to edit and click Edit. The WRED Profile – Edit page opens. This page is similar to the WRED Profile – Add page (Figure 235). You can edit any parameter except the WRED Profile ID.
- Modify the profile.
- Click Apply, then Close.
Deleting a WRED Profile
You cannot delete a WRED profile that is assigned to a queue. You must first remove the WRED profile from the queue, then delete the WRED profile. See Assigning WRED Profiles to Queues.
To delete a WRED profile, select the profile in the WRED Profile Configuration table (Figure 234) and click Delete. The profile is deleted.
To delete multiple WRED profiles:
- Select the profiles in the WRED Profile Configuration table or select all the profiles by selecting the check box in the top row.
- Click Delete. The profiles are deleted.
Assigning WRED Profiles to Queues
To assign a WRED profile to a queue:
- Select Ethernet > Interfaces > Logical Interfaces. The Logical Interfaces page opens (Figure 214).
- Select an interface in the Ethernet Logical Port Configuration table and click WRED. The WRED page opens.
Figure 246 Logical Interfaces – WRED Page

- In the Show Service bundle ID field, select 1.

Note
Service Bundles are bundles of queues, grouped together in order to configure common egress characteristics for specific services. In the current release, only Service Bundle 1 is supported.
- Select a CoS Queue ID and click Edit. The Logical Interfaces – WRED – Edit page opens.
Figure 247 Logical Interfaces – WRED - Edit Page
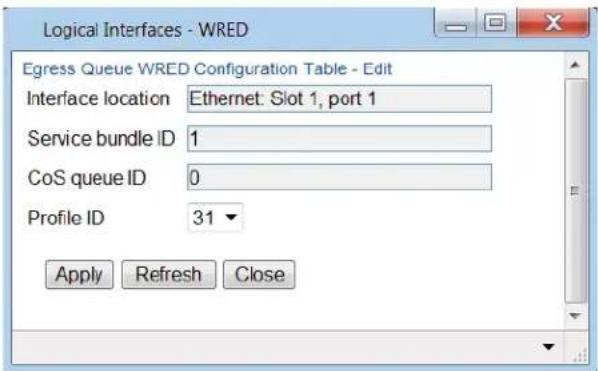
- In the Profile ID field, select the WRED profile you want to assign to the selected queue.
- Click Apply, then Close.
Configuring Egress Shaping
This section includes:
• Egress Shaping Overview
- Configuring Queue Shaper Profiles
- Configuring Service Bundle Shaper Profiles
- Assigning a Queue Shaper Profile to a Queue
- Assigning a Service Bundle Shaper Profile to a Service Bundle
Egress Shaping Overview
Egress shaping determines the traffic profile for each queue. PTP 820G and PTP 820F can perform queue shaping on the following levels:
- Queue Level – Single leaky bucket shaping. On the queue level, you can configure up to 31 single leaky bucket shaper profiles. If no profile is attached to the queue, no egress shaping is performed on that queue.
- Service Bundle Level – Dual leaky bucket shaping. On the service bundle level, users can configure up to 256 dual leaky bucket shaper profiles. If no profile is attached to the service bundle, no egress shaping is performed on that service bundle.
- Interface Level – Single leaky bucket shaping.

Note
Egress shaping on the interface level is planned for future release.
Configuring Queue Shaper Profiles
This section includes:
- Adding a Queue Shaper Profile
• Editing a Queue Shaper Profile
• Deleting a Queue Shaper Profile
Adding a Queue Shaper Profile
To add a queue shaper profile:
- Select Ethernet > QoS > Shaper > Queue Profiles. The Queue Shaper Profile page opens.
Figure 248 Queue Shaper Profile Page

- Click Add. The Queue Shaper – Add page opens, with default values displayed.
Figure 249 Queue Shaper Profile – Add Page
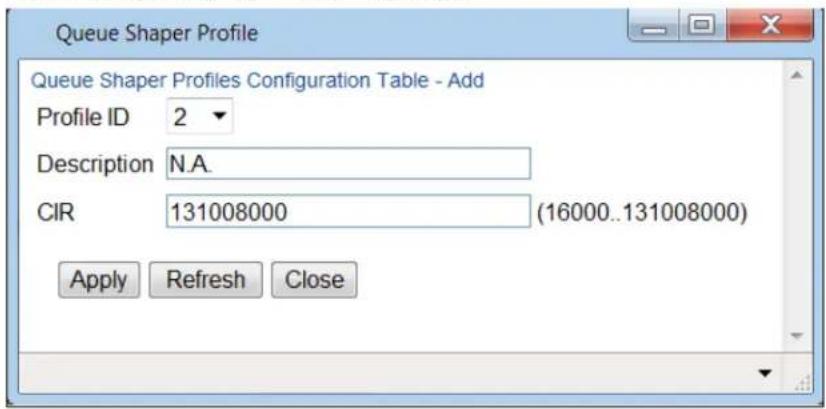
- In the Profile ID field, select a unique ID to identify the profile. Permitted values are 1-31.
- Optionally, in the Description field, enter a description of the profile.
-
In the CIR field, enter the Committed Information Rate (CIR) assigned to the profile, in bits per second. Permitted values are:
-
16,000 - 32,000,000 bps, with granularity of 16,000.
-
32,000,000 - 131,008,000 bps, with granularity of 64,000.
-
Click Apply, then Close.
Editing a Queue Shaper Profile
To edit a queue shaper profile:
- Select Ethernet > QoS > Shaper > Queue Profiles. The Queue Shaper Profile page opens (Figure 238).
- Select the profile you want to edit and click Edit. The Queue Shaper Profile – Edit page opens. This page is similar to the Queue Shaper Profile – Add page (Figure 239). You can edit any parameter except the Profile ID.
- Modify the profile.
- Click Apply, then Close.
Deleting a Queue Shaper Profile
You cannot delete a queue shaper profile that is assigned to a queue. You must first remove the profile from the queue, then delete the profile. See Assigning a Queue Shaper Profile to a Queue.
To delete a queue shaper profile, select the profile in the Queue Shaper Profiles Configuration table (Figure 238) and click Delete. The profile is deleted.
To delete multiple queue shaper profiles:
- Select the profiles in the Queue Shaper Profiles Configuration table or select all the profiles by selecting the check box in the top row.
- Click Delete. The profiles are deleted.
Configuring Service Bundle Shaper Profiles
This section includes:
• Adding a Service Bundle Shaper Profile
• Editing a Service Bundle Shaper Profile
• Deleting a Service Bundle Shaper Profile
Adding a Service Bundle Shaper Profile
To add a service bundle shaper profile:
- Select Ethernet > QoS > Shaper > Service Bundle Profiles. The Service Bundle Shaper Profile page opens.
Figure 250 Service Bundle Shaper Profile Page

- Click Add. The Service Bundle Shaper Profile – Add page opens, with default values displayed.
Figure 251 Service Bundle Shaper Profile – Add Page

-
In the Profile ID field, select a unique ID to identify the profile. Permitted values are 1-31.
-
Optionally, in the Description field, enter a description of the profile.
- In the CIR field, enter the Committed Information Rate (CIR) assigned to the profile, in bits per second. Permitted values are:
- 0 – 32,000,000 bps, with granularity of 16,000.
- 32,000,000 – 1,000,000,000 bps, with granularity of 64,000.
-
In the PIR field, enter the Peak Information Rate (PIR) assigned to the profile, in bits per second. Permitted values are:
-
16,000 – 32,000,000 bps, with granularity of 16,000.
-
32,000,000 – 1,000,000,000 bps, with granularity of 64,000.
-
Click Apply, then Close.
Editing a Service Bundle Shaper Profile
To edit a service bundle shaper profile:
- Select Ethernet > QoS > Shaper > Service Bundle Profiles. The Service Bundle Shaper Profile page opens (Figure 240).
- Select the profile you want to edit and click Edit. The Service Bundle Shaper Profile – Edit page opens. This page is similar to the Service Bundle Shaper Profile – Add page (Figure 241). You can edit any parameter except the Profile ID.
- Modify the profile.
- Click Apply, then Close.
Deleting a Service Bundle Shaper Profile
You cannot delete a service bundle shaper profile that is assigned to a service bundle. You must first remove the profile from the service bundle, then delete the profile.
To delete a service bundle shaper profile, select the profile in the Service Bundle Shaper Profiles Configuration table (Figure 240) and click Delete. The profile is deleted.
To delete multiple service bundle shaper profiles:
- Select the profiles in the Service Bundle Shaper Profiles Configuration table or select all the profiles by selecting the check box in the top row.
- Click Delete. The profiles are deleted.
Assigning a Queue Shaper Profile to a Queue
To assign a queue shaper profile to a queue:
- Select Ethernet > Interfaces > Logical Interfaces. The Logical Interfaces page opens (Figure 214).
- Select an interface in the Ethernet Logical Port Configuration table and click Shaper. The Logical Interfaces – Shaper page opens, with the Egress Queue Shaper Configuration table open by default. All queue shaper profiles defined in the system are listed in the table.
Figure 252 Logical Interfaces – Shaper – Egress Queue Shaper
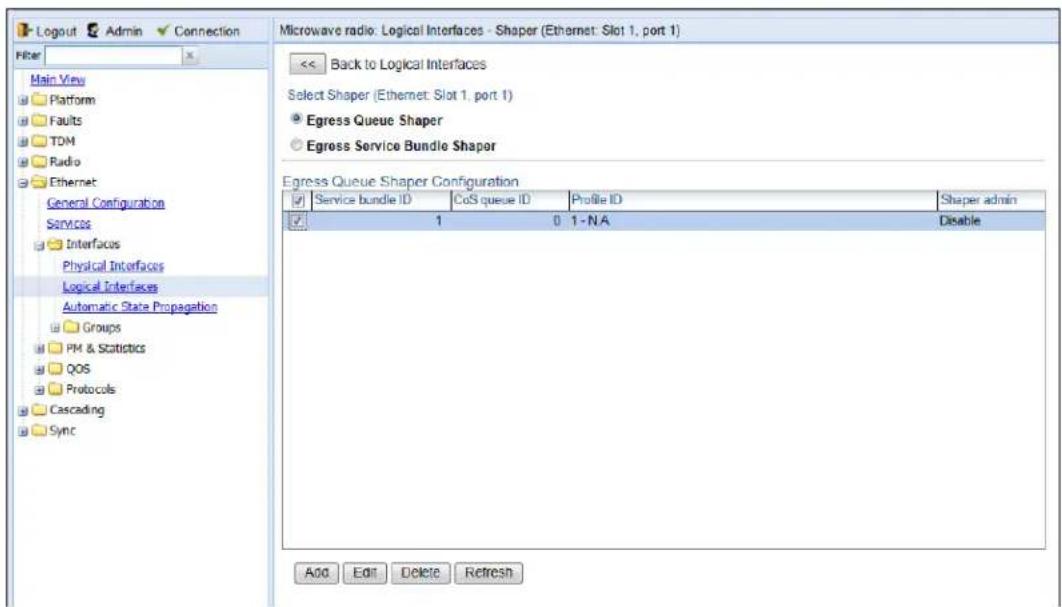
- Click Add. The Egress Queue Shaper Configuration – Add page opens.
Figure 253 Logical Interfaces – Egress Queue Shaper Configuration – Add Page
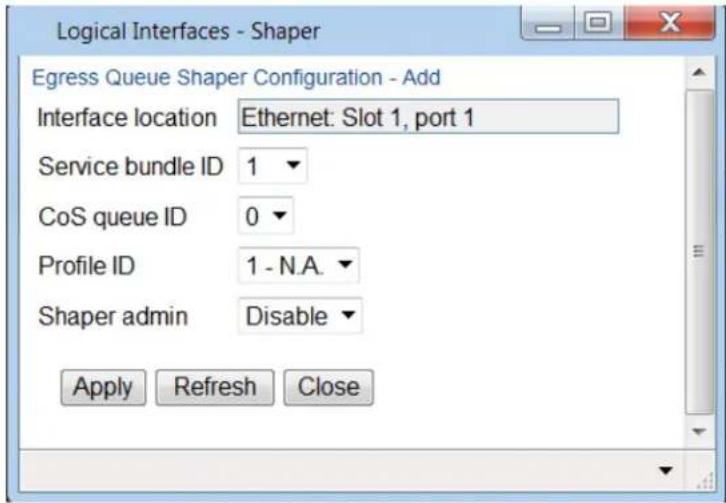

Note
In this release, only one service bundle (Service Bundle ID 1) is supported.
- In the CoS queue ID field, select the CoS queue ID of the queue to which you want to assign the shaper. Queues are numbered according to CoS value, from 0 to 7.
-
In the Profile ID field, select from a list of configured queue shaper profiles. See Configuring Queue Shaper Profiles.
-
In the Shaper Admin field, select Enable to enable egress queue shaping for the selected queue, or Disable to disable egress queue shaping for the selected queue.
- Click Apply, then Close.
To assign a different queue shaper profile to a queue:
- Select Ethernet > Interfaces > Logical Interfaces. The Logical Interfaces page opens (Figure 214).
- Select an interface in the Ethernet Logical Port Configuration table and click Shaper. The Logical Interfaces – Shaper page opens, with the Egress Queue Shaper Configuration table open by default (Figure 242).
- Select an interface in the Ethernet Logical Port Configuration table and click Shaper. The Logical Interfaces – Shaper page opens, with the Egress Queue Shaper Configuration table open by default (Figure 242).
- Select the row you want to edit and click Edit. The Egress Queue Shaper Configuration – Edit page opens. This page is similar to the Egress Queue Shaper Configuration – Add page (Figure 243).
- To assign a different egress queue shaper profile, select the profile in the Profile ID field.
- To enable or disable egress queue shaping for the selected queue, select Enable to enable egress queue shaping for the queue, or Disable to disable egress queue shaping for the queue.
- Click Apply, then Close.
Assigning a Service Bundle Shaper Profile to a Service Bundle
To assign a service bundle shaper profile to a service bundle:
- Select Ethernet > Interfaces > Logical Interfaces. The Logical Interfaces page opens (Figure 214).
- Select an interface in the Ethernet Logical Port Configuration table and click Shaper. The Logical Interfaces – Shaper page opens, with the Egress Queue Shaper Configuration table open by default (Figure 242).
- Select Egress Service Bundle Shaper. The Egress Service Bundle Shaper Configuration table appears. All service bundle shaper profiles defined in the system are listed in the table.
Figure 254 Logical Interfaces – Shaper – Egress Service Bundle Shaper

- Click Add. The Egress Service Bundle Shaper Configuration – Add page opens.
Figure 255 Logical Interfaces – Egress Service Bundle Shaper Configuration – Add Page
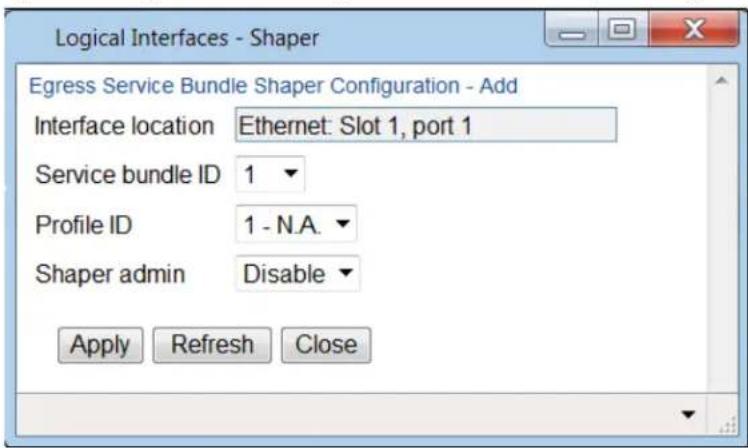

Note
Only one service bundle (Service Bundle ID 1) is supported.
- In the Profile ID field, select from a list of configured service bundle shaper profiles. See Configuring Service Bundle Shaper Profiles.
- In the Shaper Admin field, select Enable to enable egress service bundle shaping, or Disable to disable egress service bundle shaping.
- Click Apply, then Close.
To assign a different service bundle shaper profile:
- Select Ethernet > Interfaces > Logical Interfaces. The Logical Interfaces page opens (Figure 214).
- Select an interface in the Ethernet Logical Port Configuration table and click Shaper. The Logical Interfaces – Shaper page opens, with the Egress Queue Shaper Configuration table open by default (Figure 242).
- Select Egress Service Bundle Shaper. The Egress Service Bundle Shaper Configuration table appears (Figure 244). All service bundle shaper profiles defined in the system are listed in the table.
- Select the row you want to edit and click Edit. The Egress Service Bundle Shaper Configuration – Edit page opens. This page is similar to the Egress Service Bundle Shaper Configuration – Add page (Figure 245).
- To assign a different egress queue shaper profile, select the profile in the Profile ID field.
- To enable or disable egress service bundle shaping, select Enable or Disable.
- Click Apply, then Close.
Configuring Scheduling
This section includes:
- Scheduling Overview
- Configuring Priority Profiles
- Configuring WFQ Profiles
- Assigning a Priority Profile to an Interface
- Assigning a WFQ Profile to an Interface
Scheduling Overview
Scheduling determines the priority among the queues. PTP 820G and PTP 820F provides a unique hierarchical scheduling model that includes four priorities, with Weighted Fair Queuing (WFQ) within each priority, and shaping per port and per queue.
The scheduler scans the queues and determines which queue is ready to transmit. If more than one queue is ready to transmit, the scheduler determines which queue transmits first based on:
- Queue Priority – A queue with higher priority is served before lower-priority queues.
- Weighted Fair Queuing (WFQ) – If two or more queues have the same priority and are ready to transmit, the scheduler transmits frames from the queues based on a WFQ algorithm that determines the ratio of frames per queue based on a predefined weight assigned to each queue.
Configuring Priority Profiles
Scheduling priority profiles determine the queue priority. Each profile contains eight CoS-based priorities, corresponding to eight queues in an interface to which the profile is assigned. You can configure up to eight priority profiles. A ninth profile, Profile ID 9, is pre-configured. You can configure Green priorities from 4 (highest) to 1 (lowest). An additional four Yellow priority profiles are defined automatically.
This section includes:
• Adding a Scheduler Priority Profile
• Editing a Service Scheduler Priority Profile
• Deleting a Scheduler Priority Profile
Adding a Scheduler Priority Profile
To add a scheduler priority profile:
- Select Ethernet > QoS > Scheduler > Priority Profiles. The Scheduler Priority Profile page opens.
Figure 256 Scheduler Priority Profile Page

- Click Add. The Scheduler Priority Profile – Add page opens, with default values displayed.
Figure 257 Scheduler Priority Profile – Add Page
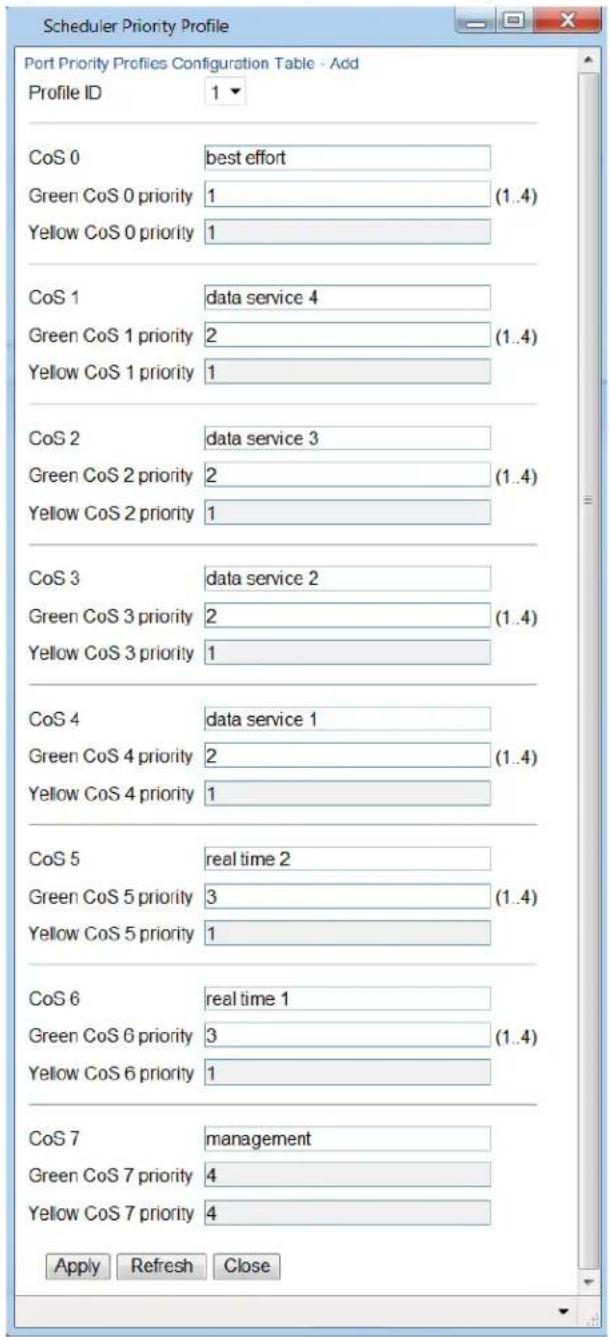
- In the Profile ID field, select a unique Profile ID between 1 and 8.
- For each CoS value, enter the Green priority, from 4 (highest) to 1 (lowest) (1-4). This priority is applied to Green frames with that CoS egressing a queue to which the profile is assigned.
- Optionally, you can enter a description of up to 20 characters in the field to the right of each CoS value.
- Click Apply, then Close.

Note
The Yellow priority values are assigned automatically by the system.
Editing a Service Scheduler Priority Profile
To edit a scheduler priority profile:
- Select Ethernet > QoS > Scheduler > Priority Profiles. The Scheduler Priority Profile page opens (Figure 246).
- Select the profile you want to edit and click Edit. The Scheduler Priority Profile – Edit page opens. This page is similar to the Scheduler Priority Profile – Add page (Figure 247). You can edit any parameter except the Profile ID.
- Modify the profile.
- Click Apply, then Close.
Deleting a Scheduler Priority Profile
To delete a scheduler priority profile, select the profile in the Scheduler Priority Profiles page (Figure 246) and click Delete. The profile is deleted.
To delete multiple scheduler priority profiles:
- Select the profiles in the Scheduler Priority Profiles page or select all the profiles by selecting the check box in the top row.
- Click Delete. The profiles are deleted.
Configuring WFQ Profiles
WFQ profiles determine the relative weight per queue. Each profile contains eight CoS-based weight values, corresponding to eight queues in an interface to which the profile is assigned. You can configure up to five WFQ profiles. A sixth profile, Profile ID 1, is pre-configured.
This section includes:
- Adding a WFQ Profile
• Editing a WFQ Priority Profile - Deleting a WFQ Profile
Adding a WFQ Profile
To add a WFQ profile:
- Select Ethernet > QoS > Scheduler > WFQ Profiles. The Scheduler WFQ Profile page opens.
Figure 258 Scheduler WFQ Profile Page

- Click Add. The Scheduler WFQ Profile – Add page opens, with default values displayed.
Figure 259 Scheduler WFQ Profile – Add Page

- In the Profile ID field, select a unique Profile ID between 2 and 7. Profile ID 1 is used for a pre-defined WFQ profile.
- For each CoS value, enter the weight for that CoS, from 1 to 20.
- Click Apply, then Close.
Editing a WFQ Priority Profile
To edit a scheduler WFQ profile:
- Select Ethernet > QoS > Scheduler > WFQ Profiles. The Scheduler WFQ Profile page opens (Figure 248).
- Select the profile you want to edit and click Edit. The Scheduler WFQ Profile – Edit page opens. This page is similar to the Scheduler WFQ Profile – Add page (Figure 249). You can edit any parameter except the Profile ID.
- Modify the profile.
- Click Apply, then Close.
Deleting a WFQ Profile
To delete a scheduler WFQ profile, select the profile in the Scheduler WFQ Profiles page (Figure 248) and click Delete. The profile is deleted.
To delete multiple scheduler WFQ profiles:
- Select the profiles in the Scheduler WFQ Profiles page or select all the profiles by selecting the check box in the top row.
- Click Delete. The profiles are deleted.
Assigning a Priority Profile to an Interface
To assign a priority profile to an interface:
- Select Ethernet > Interfaces > Logical Interfaces. The Logical Interfaces page opens (Figure 214).
- Select an interface in the Ethernet Logical Port Configuration table and click Scheduler. The Logical Interfaces – Scheduler page opens, with the Egress Port Scheduling Priority Configuration – Edit page open by default.
Figure 260 Logical Interfaces – Scheduler – Egress Port Scheduling Priority

- In the Profile ID field, select from a list of configured scheduling priority profiles. See Configuring Priority Profiles.
- Click Apply, then Close.
Assigning a WFQ Profile to an Interface
To assign a WFQ profile to an interface:
- Select Ethernet > Interfaces > Logical Interfaces. The Logical Interfaces page opens (Figure 214).
- Select an interface in the Ethernet Logical Port Configuration table and click Scheduler. The Logical Interfaces – Scheduler page opens, with the Egress Port Scheduling Priority Configuration – Edit page open by default (Figure 250).
- Select Egress Port Scheduling WFQ. The Egress Port Scheduling WFQ Configuration – Edit page opens.
Figure 261 Logical Interfaces – Scheduler – Egress Port Scheduling WFQ
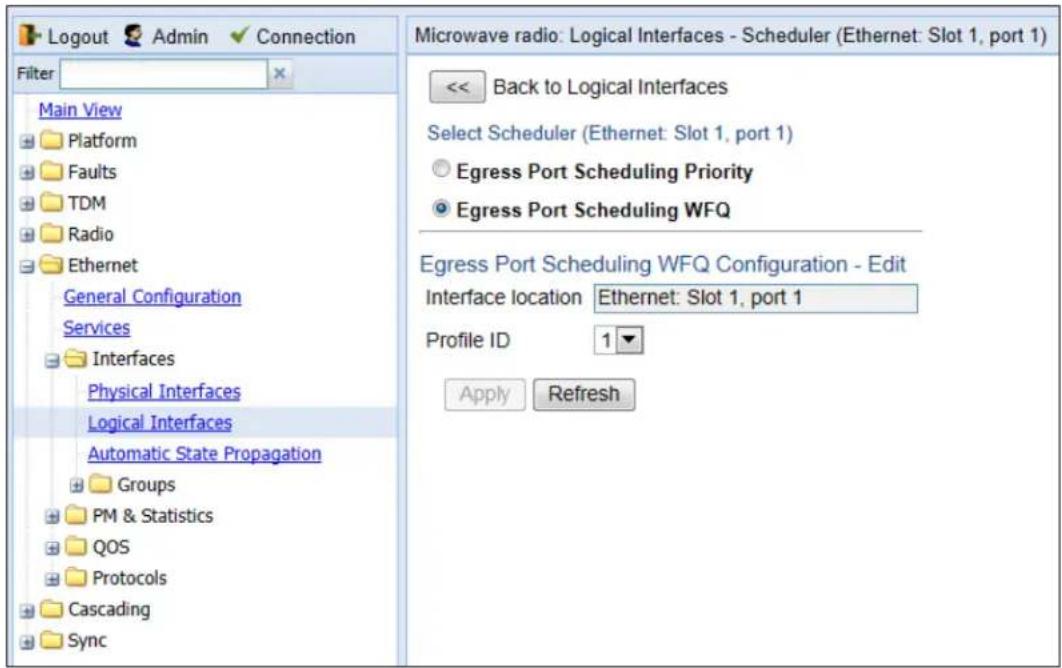
- In the Profile ID field, select from a list of configured scheduling priority profiles. See Configuring WFQ Profiles.
- Click Apply, then Close.
Configuring and Displaying Queue-Level PMs
PTP 820 devices support advanced traffic PMs per CoS queue and service bundle. For each logical interface, you can configure thresholds for Green and Yellow traffic per queue. You can then display the following PMs for 15-minute and 24-hour intervals, per queue and color:
• Maximum bytes passed per second
• Minimum bytes passed per second
• Average bytes passed per second
• Maximum bytes dropped per second
• Minimum bytes dropped per second
• Average bytes dropped per second
• Maximum packets passed per second
• Minimum packets passed per second
• Average packets passed per second
• Maximum packets dropped per second
• Minimum packets dropped per second
• Average packets dropped per second
• Seconds bytes per second were over the configured threshold per interval
These PMs are available for any type of logical interface, including groups. To activate collection of these PMs, the user must add a PM collection rule on a logical interface and service bundle and set the relevant thresholds per CoS and Color. When the PM is configured on a group, queue traffic PMs are recorded for the group and not for the individual interfaces that belong to the group.
One collection rule is available per interface.
PMs for queue traffic are saved for 30 days, after which they are removed from the database. It is important to note that they are not persistent, which means they are not saved in the event of unit reset.
To configure queue-level PMs:
- Select Ethernet > PM & Statistics > Egress CoS PM > Configuration. The Egress CoS PM Configuration page opens.
Figure 262 Egress CoS PM Configuration Page

2 Click Add. The Egress CoS PM Configuration – Add page opens.
Figure 263 Egress CoS PM Configuration – Add Page

- In the Interface Location field, select the interface for which you want to configure the collection rule.
- In the Service Bundle field, select a service bundle (1-6).
- In the Admin field, select Enable to enable the collection rule.
- Enter the Green and Yellow thresholds for each CoS, in bytes (0-4294967295).
- Click Apply.
- Repeat these steps to configure collection rules for additional interfaces.
To display queue-level PMs:
- Select Ethernet >PM & Statistics >Egress CoS PM >Egress CoS PM. The Egress CoS PM page opens.
Figure 264 Egress CoS PM Page
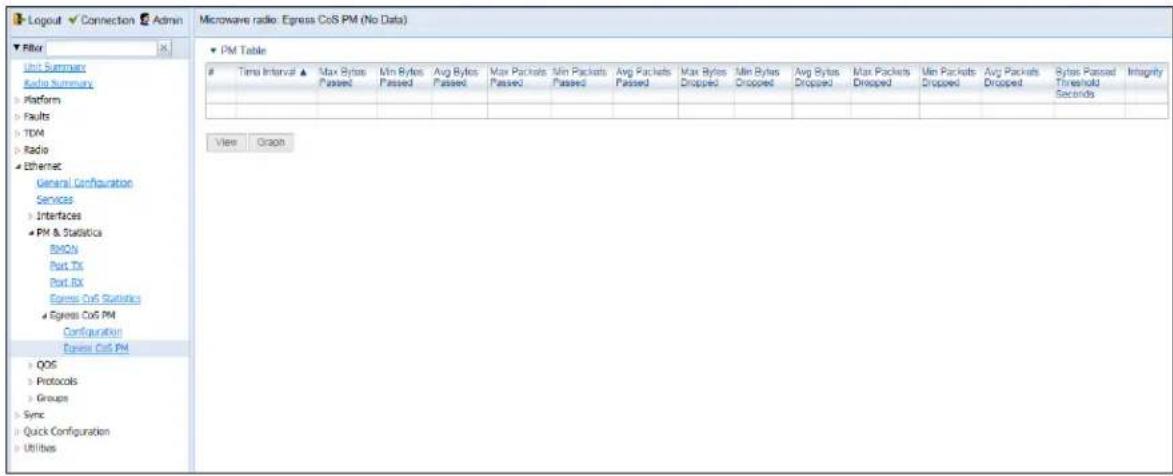
The Integrity column indicates whether the values received at the time and date of the measured interval are valid. An X in the column indicates that the values are invalid. This can occur for a number of reasons, including but not limited to a disconnected cable, a missing SFP module, muting of a radio interface, and an operational status of Down.
Chapter 8: Ethernet Protocols
This section includes:
- Configuring G.8032
- Configuring MSTP
- Configuring LLDP
Configuring G.8032
This section includes:
G.8032 Overview
- Configuring the Destination MAC Address
- Adding ERPIs
- Configuring the RPL Owner
- Configuring Timers
• Viewing ERPI State Information
• Viewing ERPI Statistics
• Viewing the ERPI Configuration and Status Parameters
- Initiating a Manual or Forced Switch and Clearing the Switch or Initiating Reversion
- Blocking or Unblocking R-APS Messages on a Service Point
G.8032 Overview

Note
P2P services are not affected by G.8032, and continue to traverse ports that are blocked by G.8032.
ERPS, as defined in the G.8032 ITU standard, is currently the most advanced ring protection protocol, providing convergence times of sub-50ms. ERPS prevents loops in an Ethernet ring by guaranteeing that at any time, traffic can flow on all except one link in the ring. This link is called the Ring Protection Link (RPL). Under normal conditions, the RPL is blocked, i.e., not used for traffic. One designated Ethernet Ring Node, the RPL Owner Node, is responsible for blocking traffic at one end of the RPL. When an Ethernet ring failure occurs, the RPL Owner unblocks its end of the RPL, allowing the RPL to be used for traffic. The other Ethernet Ring Node adjacent to the RPL, the RPL Neighbor Node, may also participate in blocking or unblocking its end of the RPL. A number of ERP instances (ERPIs) can be created on the same ring.
For a more detailed description of G.8032 in the PTP 820G of PTP 820F, refer to the Technical Description for the product you are using..
Configuring the Destination MAC Address
To configure the destination MAC address for G.8032:
1 Select Ethernet > Protocols > G.8032 > General Attribute. The G.8032 General Attribute page opens.
Figure 265 G.8032 General Attribute Page

2 In the G8032 destination MAC address field, enter the destination MAC address for PDUs generated by the node.
3 Click Apply.

Note
The G.8032 Node ID field displays the base MAC address for the node. This field is read-only.
Adding ERPIs
You can configure up to 64 Ethernet Ring Protection instances (ERPIs). Each ERPI is associated with an Ethernet service defined in the system.

Note
Before adding an ERPI to an Ethernet service, the service must be mapped to an MSTP instance. See Mapping Ethernet Services to MSTP instances (MSTIs).
To add an ERPI:
1 Select Ethernet > Protocols > G.8032 > ERPI Attribute. The G.8032 ERPI Attribute page opens.
Figure 266 G.8032 ERPI Attribute Page

2 Click Add. The Add G8032 ERPI Attribute wizard opens.
Figure 267 G.8032 ERPI Attribute Wizard – Page 1
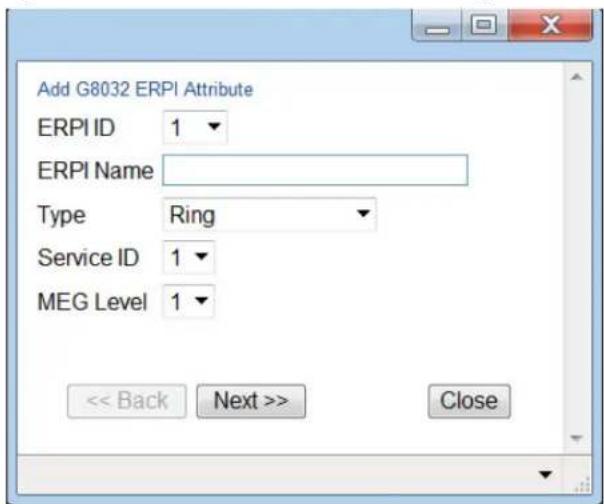
3 In the ERPI ID field, select an available ID. The ERPI ID is a unique ID that identifies the ERPI.
4 Optionally, in the ERPI Name field, enter a descriptive name for the ERPI.
5 In the Type field, select the type of ERPI, based on the type of ring:
Ring: A Ring is an Ethernet ring that is connected on two ports (East and West service points) to an interconnection node.
Sub-ring: A Sub-Ring is an Ethernet ring which is connected to another ring or network through the use of interconnection nodes (East and West service points). On their own, the Sub-Ring links do not form a closed physical loop. A closed loop may be formed by the sub-ring links and the link between interconnection nodes that is controlled by other ring or network.
- Ring with sub-ring: The ERPI includes both a ring, with East and West service points, and a connection to a sub-ring using a Sub-Ring service point.
6 In the Service ID field, select the ID of the Ethernet service to which the ERPI belongs.
7 Optionally, in the MEG Level field, select the Maintenance Entity Group (MEG) level used for R-APS messages sent in the ERPI (0-7).
8 Click Next. The second page of the Add G.8032 ERPI Attribute wizard opens.
Figure 268 G.8032 ERPI Attribute Wizard – Page 2

9 In the West ERPI port (SP) field, select the first endpoint for the ERPI. This can be any service point that has been configured for the service.

Note
Service points on the PTP 820 side of the link must have a single, determinate VLAN. This means the service point type must be dot1q, s-tag, or QinQ. On the customer side, any service point type can be used.
10 Click Next. The third page of the Add G.8032 ERPI Attribute wizard opens.
Figure 269 G.8032 ERPI Attribute Wizard – Page 3

11 In the East ERPI port (SP) field, select the second endpoint for the ERPI. This can be any service point that has been configured for the service.
12 Click Next:
- If the Type is Ring or Sub-ring, the Submit page opens. Go to Step 15.
- If the Type is Ring with sub-ring, the fourth page of the Add G.8032 ERPI Attribute wizard opens.
Figure 270 G.8032 ERPI Attribute Wizard – Page 4

13 In the Sub Ring port (SP) field, select the service point that connects the Ring with the Sub-Ring. This can be any service point that has been configured for the service.
14 Click Next. The Submit page opens.
Figure 271 G.8032 ERPI Attribute Wizard – Submit

15 Verify that the parameters of the ERPI are correct and click Submit.
Configuring the RPL Owner
The RPL Owner Node is a node in the ERPI that is responsible for blocking traffic at one end of the ERPI. You can select one RPL per ERPI. To designate the RPL Owner Node:
1 Select Ethernet > Protocols > G.8032 > ERPI Attribute. The G.8032 ERPI Attribute page opens (Figure 253).
2 Select the ERPI and click Edit. The ERPI Attribute – Edit page opens.
Figure 272 G.8032 ERPI Attribute – Edit Page
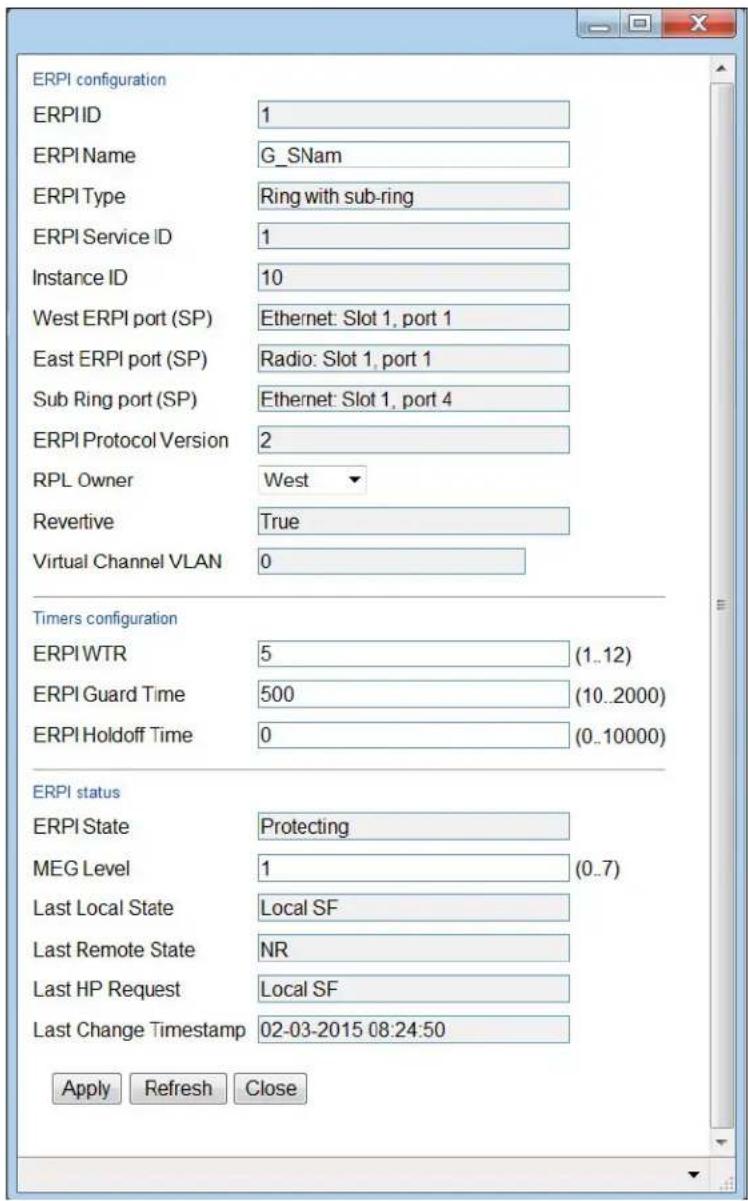
3 In the RPL Owner field, select the service point you want to configure as RPL Owner.
4 Click Apply, then Close.
Configuring Timers
You can configure timers per ERPI to control the ERPI's switching and convergence parameters. The following timers are available:
- Wait to Restore (WTR) Timer – Defines a minimum time the system waits after signal failure is recovered before reverting to idle state.
- Guard Time – The guard time is the minimum time the system waits after recovery from a signal failure before accepting new R-APS messages. The Guard Time should be greater than the maximum expected forwarding delay for which one R-APS message circles around the ring.

Note
The Guard Time is used to prevent Ethernet ring nodes from acting upon outdated R-APS messages and prevents the possibility of forming a closed loop.
- Hold-Off Time – Determines the time period from failure detection to response. It is used to coordinate between recovery mechanisms (which mechanism takes place first).
To configure the ERPI timers:
1 Select Ethernet > Protocols > G.8032 > ERPI Attribute. The G.8032 ERPI Attribute page opens (Figure 253).
2 Select the ERPI and click Edit. The ERPI Attribute – Edit page opens (Figure 259).
3 In the ERPI WTR field, enter the Wait to Restore (WTR) timer (in minutes). The WTR timer is a minimum time the system waits after signal failure is recovered before reverting to idle state.
4 In the ERPI Guard Time field, enter the ERPI guard time (in msec). You must enter a multiple of 10. The guard time is the minimum time the system waits after recovery from a signal failure before accepting new R-APS messages. The purpose of this timer is to prevent unnecessary state changes and loops.
5 In the ERPI Holdoff Time field, enter the ERPI hold-off time (in msec). You must enter a multiple of 100. The hold-off time determines the time period from failure detection to response.
6 Click Apply, then Close.
Viewing the ERPI Configuration and Status Parameters
The G.8032 ERPI Attribute page (Figure 253) displays some of the configuration and status parameters for ERPIs configured in the system.
To display a full list of configuration and status parameters for an ERPI:
1 Select Ethernet > Protocols > G.8032 > ERPI Attribute. The G.8032 ERPI Attribute page opens (Figure 253).
2 Select the ERPI and click Edit. The ERPI Attribute – Edit page opens (Figure 259).
Table 67 lists and describes the parameters in the ERPI configuration section of the ERPI Attribute – Edit page.
- Table 68 lists and describes the parameters in the ERPI status section of the ERPI Attribute – Edit page.
Table 74 Attached Interface Types
| Parameter Definition | |
| ERPI ID | Read-only. A unique ID that identifies the ERPI. |
Parameter Definition
| ERPI Name | A descriptive name for the ERPI. |
| ERPI Type | Read-only. The ERPI type. |
| ERPI Service ID | Read-only. The ID of the Ethernet service to which the ERPI belongs. |
| Instance ID | Read-only. The MSTI to which the Ethernet service is mapped. See Mapping Ethernet Services to MSTP instances (MSTIs). |
| West ERPI Port (SP) | Read-only. The interface to which the west ERPI service point belongs. |
| East ERPI Port (SP) | Read-only. The interface to which the east ERPI service point belongs. |
| Sub Ring Port (SP) | Read-only. The interface to which the service point that connects the Ring with the Sub-Ring belongs. |
| ERPI Protocol Version | Read-only. The ERPI (G.8032) protocol version currently being used in the unit. |
| RPL Owner | The RPL Owner Node is a node in the ERPI that is responsible for blocking traffic at one end of the ERPI. See Configuring the RPL Owner. |
| Revertive | Read-only. Indicates whether the ERPI is currently in revertive mode. |
| Virtual Channel VLAN | Read-only. The VLAN of the virtual channel. If the value is 0, there is no virtual channel. |
Table 75 ERPI Configuration Parameters
| Parameter Definition | |
| ERPI State | Indicates the current ERPI state. Possible values are: • Initializing • Idle • Pending • Protecting • FS (Forced Switch) • MS (Manual Switch) |
| MEG Level | The Maintenance Entity Group (MEG) level used for R-APS messages sent in the ERPI. |
| Last Local State | Describes the current local state input to the ERPI state machine. |
| Last Remote State | Indicates the last event received from the other end of the link. |
| Last HP Request | Indicates the last high-priority event. |
| Last Change Timestamp | Indicates the time of the last ring state transition. |
Viewing ERPI State Information
To view information about an ERPI's state:
1 Select Ethernet > Protocols > G.8032 > ERPI Attribute. The G.8032 ERPI Attribute page opens (Figure 253).
2 Select the ERPI and click State. The ERPI Attribute – State page opens.
Figure 273 G.8032 ERPI Attribute – State Page

Table 69 lists and describes the parameters in the ERPI Attribute – State page.
Table 76 ERPI State Parameters
| Parameter Definition | |
| ERPI Port | Identifies whether the row is for the West endpoint, the East endpoint, or a Sub-Ring connection point. |
| ERPI Port Active State | Indicates whether or not the service point is active for traffic forwarding. |
| R-APS Channel Forwarding State | Indicates whether the service point is forwarding R-APS messages. |
| ERPI Data Forwarding State | Indicates whether the service point is in unblocked (forwarding) state. |
| RPL Blocking State | Only relevant if the ERPI to which the service point belongs is the RPL owner.Indicates whether the service point is in blocked state. |
| ERPI Port Defect State | Indicates whether the service point is in Signal Fail (SF) or Signal Defect (SD) state.Note: Support for Signal Defect state is planned for future release. |
Initiating a Manual or Forced Switch and Clearing the Switch or Initiating Reversion
You can initiate a manual or forced switch, clear the switch, and initiate reversion, from the G.8032 ERPI Attribute – State page:
1 Select Ethernet > Protocols > G.8032 > ERPI Attribute. The G.8032 ERPI Attribute page opens (Figure 253).
2 Select the ERPI and click State. The ERPI Attribute – State page opens (Figure 260).
3 Select the service point on which you want to perform the operation.
To initiate a forced switch, click Force Switch.
- To initiate a manual switch, click Manual Switch.
To clear a forced or manual switch, click Clear. You can also click Clear to trigger convergence prior to the expiration of the relevant timer.
Blocking or Unblocking R-APS Messages on a Service Point
To enable or disable transmission of R-APS messages on a service point:
1 Select Ethernet > Protocols > G.8032 > ERPI Attribute. The G.8032 ERPI Attribute page opens (Figure 253).
2 Select the ERPI and click State. The ERPI Attribute – State page opens (Figure 260).
3 Select the service point on which you want to perform the operation.
To block R-APS message transmission on the service point, click R-APS Block.
To enable R-APS message transmission on the service point, click R-APS Unblock.
Viewing ERPI Statistics
To view statistics about an ERPI:
1 Select Ethernet > Protocols > G.8032 > ERPI Attribute. The G.8032 ERPI Attribute page opens (Figure 253).
2 Select the ERPI and click Statistics. The ERPI Attribute – Statistics page opens.
Figure 274 G.8032 ERPI Attribute – Statistics Page

Table 70 lists and describes the statistics shown in the ERPI Attribute – Statistics page.
Table 77 ERPI Statistics
| Parameter Definition | |
| ERPI Port | Identifies whether the row is for the West endpoint, the East endpoint, or a Sub-Ring connection point. |
| Transmitted Total R-APS Frames | The number of R-APS frames that have been transmitted via the service point. |
| Transmitted SF PDU | The number of R-APS Signal Fail (SF) frames that have been transmitted via the service point. |
| Transmitted NR PDU | The number of R-APS No Request (NR) frames that have been transmitted via the service point. |
| Transmitted RB PDU | The number of R-APS RPL Blocked (RB) frames that have been transmitted via the service point. |
| Transmitted FS PDU | The number of R-APS Force Switched (FS) frames that have been transmitted via the service point. |
| Transmitted MS PDU | The number of R-APS Manual Switched (MS) frames that have been transmitted via the service point. |
| Transmitted R-APS Events | Reserved for future use. |
| Received R-APS Frames | The number of R-APS frames that have been received via the service point. |
| Received Invalid R-APS Frames | The number of R-APS frames with an invalid format that have been received via the service point. |
| Received SF PDU | The number of R-APS Signal Fail (SF) frames that have been received via the service point. |
| Received NR PDU | The number of R-APS No Request (NR) frames that have been received via the service point. |
| Received RB PDU | The number of R-APS RPL Blocked (RB) frames that have been received via the service point. |
| Received SD PDU | The number of R-APS Signal Degrade (SD) frames that have been received via the service point. |
| Received FS PDU | The number of R-APS Forced Switch (FS) frames that have been received via the service point. |
| Received MS PDU | The number of R-APS Manual Switch (MS) frames that have been received via the service point. |
| Received R-APS Events | Reserved for future use. |
Configuring MSTP
This section includes:
- MSTP Overview
• Mapping Ethernet Services to MSTP instances (MSTIs) - Configuring the MSTP Bridge Parameters
- Configuring the MSTP Port Parameters
MSTP Overview

Note
P2P services are not affected by MSTP, and continue to traverse ports that are blocked by MSTP.
MSTP, as defined in IEEE 802.1q, provides full connectivity for frames assigned to any given VLAN throughout a bridged LAN consisting of arbitrarily interconnected bridges.
With MSTP, an independent multiple spanning tree instance (MSTI) is configured for each group of services, and only one path is made available (unblocked) per spanning tree instance. This prevents network loops and provides load balancing capability. It also enables operators to differentiate among Ethernet services by mapping them to different, specific MSTIs. The maximum number of MSTIs is configurable, from 2 to 16.
MSTP is an extension of, and is backwards compatible with, Rapid Spanning Tree Protocol (RSTP).
PTP 820G and PTP 820F supports MSTP according to the following IEEE standards:
• 802.1q
• 802.1ad amendment (Q-in-Q)
• 802.1ah (TE instance)
For a more detailed description of MSTP support in the PTP 820G or PTP 820F, refer to the Technical Description for the product you are using.
Mapping Ethernet Services to MSTP instances (MSTIs)
Ethernet services can be mapped to MSTP instances (MSTIs) in the Instances per Service Mapping section of the Ethernet General Configuration page. All mapping of Ethernet services to MSTP instances (MSTIs) should be performed before enabling MSTP.

Note
Ethernet service-to-MSTI mapping is also a prerequisite to configuring G.8032. See Configuring G.8032.
To map Ethernet services to MSTP instances (MSTIs):
1 Select Ethernet > General Configuration. The Ethernet General Configuration page opens (Figure 198).
2 In the Instance per Service Mapping table, select the Service ID of the service you want to map.
3 Click Edit. The Instance per Service Mapping – Edit page opens.
Figure 275 Instance Per Service Mapping – Edit Page
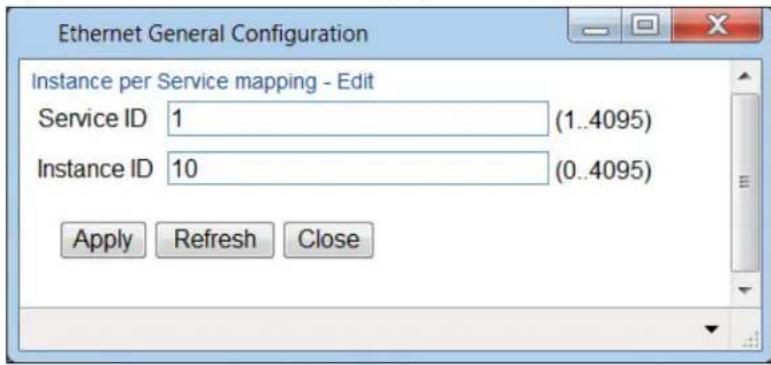
4 In the Instance ID field, enter a number between 0 and 16, or 4095. A service mapped to MSTI 4095 is never blocked by any protocol.
5 Click Apply.
By default, all Ethernet services are mapped to MSTI 0, which represents the CIST (Common Instance Spanning Tree).
Configuring the MSTP Bridge Parameters
This section includes:
• Enabling MSTP and Configuring the MSTP Bridge General Attributes
• Viewing and Configuring the MSTP Bridge Configuration ID
• Viewing and Configuring the MSTP Bridge Spanning Tree
• Viewing and Configuring the MSTP Bridge CIST Parameters
• Viewing and Configuring the MSTP Bridge MSTI Parameters
• Viewing the MSTP VLAN Parameters
Enabling MSTP and Configuring the MSTP Bridge General Attributes
To configure the MSTP bridge general attributes:
1 Select Ethernet > Protocols > MSTP > Bridge > General Attributes. The MSTP Bridge General Attributes page opens.
Figure 276 MSTP Bridge General Attributes Page
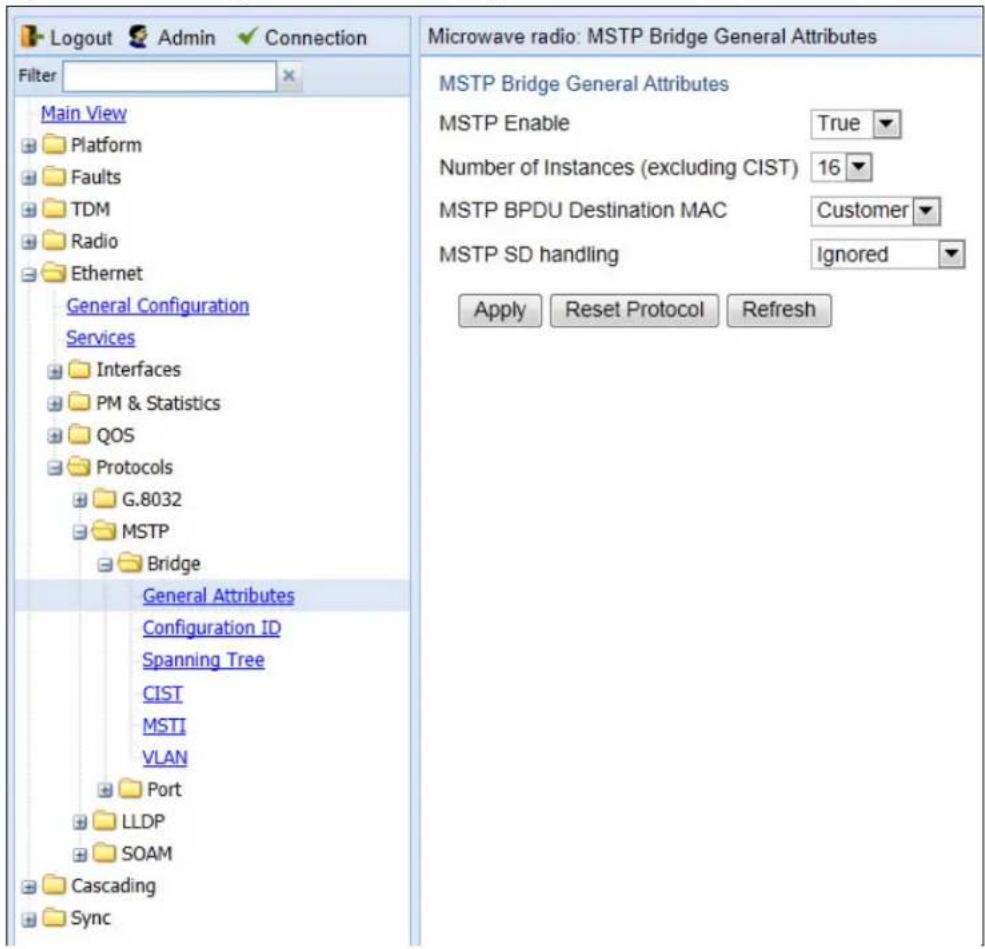
2 In the MSTP Enable field, select True to enable MSTP on the unit. To disable MSTP, select False.
○ Enabling MSTP starts the protocol and sets all ports in all MSTP instances to Blocking state. Convergence upon enabling the protocol generally takes less than two seconds.
○ Disabling MSTP stops the MSTP protocol from running and sets all ports in all MSTP instances to Forwarding state.
3 In the Number of Instances (excluding CIST) field, select the number of Multiple Spanning Tree instances (MSTIs). Possible values are 1-16. This number does not include the Common and Internal Spanning Tree (CIST).

Note
Changing the Number of Instances causes the MSTP stack to reset.
4 In the MSTP BPDU Destination MAC field, select the destination MAC address of BPDUs generated in the unit. Options are:
- Customer – The destination MAC address of BPDUs is 0x0180-C200-0000. Provider BPDUs are either tunneled or discarded.
Provider – The destination MAC address of BPDUs is 0x0180-C200-0008. Customer BPDUs are either tunneled or discarded.
5 In the MSTP SD Handling field, select how MSTP handles Signal Degrade (SD) failures. Options are:
- Ignored – Signal Degrade (SD) failures are ignored in MSTP.
- Same as SF – SD failures trigger a topology change.

Note
SD handling is planned for future release.
6 Click Apply.
To reset the MSTP stack, click Reset Protocol.
Viewing and Configuring the MSTP Bridge Configuration ID
To configure the Configuration Name and Revision Level:
1 Select Ethernet > Protocols > MSTP > Bridge > Configuration ID. The MSTP Bridge Configuration ID page opens.
Figure 277 MSTP Bridge Configuration ID Page

2 Modify the configurable parameters.
3 Click Apply.
Table 71 lists and describes the parameters in the MSTP Bridge Configuration ID page.
Table 78 MSTP Bridge Configuration ID Parameters
| Parameter Definition | |
| MSTP Configuration ID Format Selector | Read-only. Indicates the format specified in 802.1Q. |
| MSTP Configuration Name Enter a valid configuration name. Note: Changing the Configuration Name when MSTP is enabled causes the MSTP stack to reset. | |
| MSTP Configuration Digest | Read-only. Displays the MSTP Configuration Digest. |
| MSTP Revision Level Enter a valid MSTP revision level. Note: Changing the Revision Level when MSTP is enabled causes the MSTP stack to reset. | |
Viewing and Configuring the MSTP Bridge Spanning Tree
To configure the bridge-level spanning tree parameters:
1 Select Ethernet > Protocols > MSTP > Bridge > Spanning Tree. The MSTP Bridge Spanning Tree page opens.
Figure 278 MSTP Bridge Spanning Tree Page

2 Modify the configurable parameters, described in Table 73.
3 Click Apply.
Table 72 lists and describes the status parameters in the MSTP Bridge Spanning Tree page.
Table 79 MSTP Bridge Spanning Tree Status Parameters
| Parameter Definition | |
| STP Time Since Last TC | The time that has elapsed (in cs) since the last time the bridge entity detected a topology change. |
| STP Number of Topology Changes | The total number of topology changes that have been detected by this bridge since the management entity was last reset or initialized.Note: Discontinuities in the value of this counter can occur upon reinitialization of the management system. |
| STP Designated Root | The Bridge ID of the spanning tree root, as determined by MSTP in this node. This value is used as the Root ID in all configuration BPDUs originated by this node. |
Parameter Definition
| STP Root Cost | The cost of the path to the root as seen from this bridge. |
| STP Root Port | The port number of the port that offers the lowest cost path from this bridge to the external root bridge |
| STP Max Age | The maximum age (in cs) of MSTP information learned from the network on any port before the information is discarded.Note: This field displays the value actually being used by the bridge, in contrast to the STP Bridge Max Age parameter described below, which is user-configurable and which represents the value that this and all other bridges use if and when this bridge becomes the root. |
| STP Forward Delay | The speed at which ports change their spanning state when moving towards the Forwarding state. This value determines how long the port stays in Listening state and Learning state. This value is also used when a topology change has been detected and is underway for purposes of aging all dynamic entries in the filtering database.Note: This field displays the value actually being used by the bridge, in contrast to the STP Bridge Forward Delay parameter described below, which is user-configurable and which represents the value that this and all other bridges use if and when this bridge becomes the root. |
| STP Version | The STP version the bridge is currently running (MSTP). |
Table 80 MSTP Bridge Spanning Tree Configuration Parameters
| Parameter Definition | |
| STP Priority | Select a value as the writeable portion of the Bridge ID. This value constitutes the first two octets of the Bridge ID. Possible values are 0-61440, in steps of 4096 |
| STP Hold Time | Select a value (in cs) as the interval length during which no more than two configuration bridge PDUs will be transmitted by this node. Possible values are 10-100. |
| STP Bridge Max Age | Select a value (in cs) that all bridges will use, when this bridge is the root, as the maximum age of MSTP information learned from the network on any port before the information is discarded. Options are 600-4000 cs. |
| STP Bridge Forward Delay | Select a value (in cs) that all bridges will use, when this bridge is the root, as the speed at which ports change their spanning state when moving towards the Forwarding state. This value determines how long the port stays in Listening state and Learning state. This value is also used when a topology change has been detected and is underway for purposes of aging all dynamic entries in the filtering database. Options are 400-3000 cs. |
Parameter Definition
| STP Bridge Hello Time | Select the value (in cs) that all bridges will use, when this bridge is the root, as the Hello Time. The Hello Time determines how often the switch broadcasts its hello message to other switches, and is the same for all MSTIs. Options are 100-1000 cs. |
Viewing and Configuring the MSTP Bridge CIST Parameters
To configure the maximum hops parameter for the Common and Internal Spanning Tree (CIST) and view CIST status information:
1 Select Ethernet > Protocols > MSTP > Bridge > CIST. The MSTP Bridge CIST page opens.
Figure 279 MSTP Bridge CIST Page

2 In the CIST Max Hops field, select the value that all bridges will use, when this bridge is the root, as the maximum number of hops allowed for a BPDU within a region before it is discarded. Options are 6-40.
3 Click Apply.
Table 74 lists and describes the status parameters in the MSTP Bridge CIST page.
Table 81 MSTP Bridge CIST Status Parameters
| Parameter Definition | |
| CIST Bridge Identifier | The Bridge ID of the CIST. |
| CIST Topology Change in Progress | Indicates whether a topology change is currently in progress for any port that is part of the CIST. |
| CIST Regional Root ID | The Bridge ID of the current CIST regional root. |
| CIST Path Cost | The CIST path cost from the transmitting bridge to the CIST regional root. If the transmitting bridge is the CIST regional root, the value of this parameter may be 0. |
Viewing and Configuring the MSTP Bridge MSTI Parameters
To view the parameters of each MSTI in the system, and to configure the MSTI bridge priority for each MSTI:
1 Select Ethernet > Protocols > MSTP > Bridge > MSTI. The MSTP Bridge MSTI page opens.
Figure 280 MSTP Bridge MSTI Page
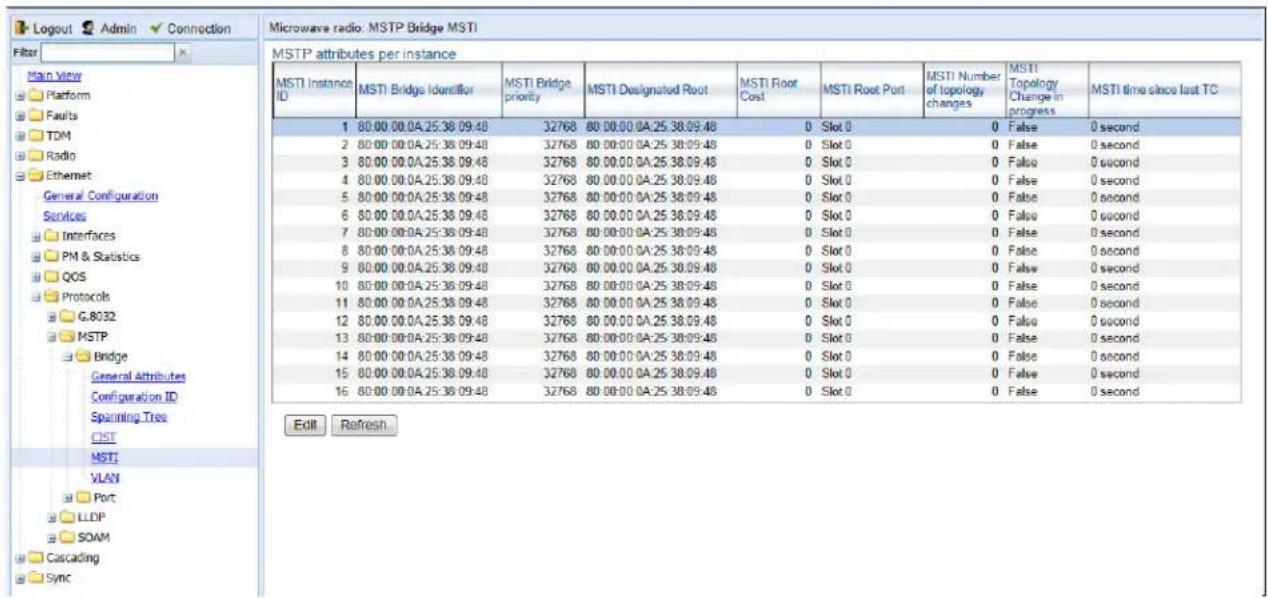
2 To view all the bridge parameters of an MSTI and/or configure its bridge priority, select the MSTI and click Edit.
Figure 281 MSTP Bridge MSTI – Edit Page

3 To view all the bridge parameters of an MSTI and/or configure its bridge priority, select the MSTI and click Edit.
4 In the MSTI Bridge Priority field, enter the MSTI writeable portion of the Bridge ID. Possible values are 0-61440, in steps of 4096.
5 Click Apply, then Close.
Table 75 lists and describes the status parameters in the MSTP Bridge MSTI page.
Table 82 MSTP Bridge MSTI Status Parameters
| Parameter Definition | |
| MSTI Instance ID The MSTI ID. | |
| MSTI Bridge Identifier The Bridge ID for the MSTI. | |
| MSTI Designated Root | The Bridge ID of the root bridge for the MSTI. |
| MSTI Root Cost | The path cost from the transmitting bridge to the root bridge for the MSTI. |
| MSTI Root Port The root port for the MSTI. | |
| MSTI Number of Topology Changes | The number of topology changes that the bridge has detected in the MSTI since the last time the management entity was reset or initialized. |
| MSTI Topology Change in Progress | Indicates whether a topology change is currently in progress on any port in the MSTI. |
Parameter Definition
MSTI Time Since Last TC
The number of centi-seconds that have elapsed since the last time the bridge identified a topology change for a port in the MSTI.
Viewing the MSTP VLAN Parameters
Each Ethernet service is mapped to an MSTI. By default, all services (VLAN ID) are assigned to MSTI 0 (CIST). See Mapping Ethernet Services to MSTP instances (MSTIs).

Note
A service mapped to MSTI 4095 is never blocked by any protocol.
To view the VLAN ID to MSTI mapping table:
1 Select Ethernet > Protocols > MSTP > Bridge > VLAN. The MSTP Bridge VLAN page opens.
Figure 282 MSTP Bridge VLAN Page

Configuring the MSTP Port Parameters
This section includes:
• Viewing and Configuring the MSTP Port Spanning Tree
• Viewing and Configuring the MSTP Port CIST Parameters
• Viewing and Configuring the MSTP Port MSTI Parameters
• Viewing and Resetting the BPDU Counters
Viewing and Configuring the MSTP Port Spanning Tree
To view the port-level spanning tree parameters and configure the STP port priority:
1 Select Ethernet > Protocols > MSTP > Port > Spanning Tree. The MSTP Port Spanning Tree page opens.
Figure 283 MSTP Port Spanning Tree Page

2 Select an interface and click Edit. The MSTP Port Spanning Tree – Edit page opens.
Figure 284 MSTP Port Spanning Tree – Edit Page

3 In the STP Port Priority field, select the CIST port priority of the interface. You can select values from 0-240, in multiples of 16.
4 Click Apply, then Close.
Table 76 lists and describes the status parameters in the MSTP Port Spanning Tree page.
Table 83 MSTP Port Spanning Tree Status Parameters
| Parameter Definition | |
| STP Interface Location | The slot number and port number of the port. |
| STP Port State | The port's current state, as defined by application of STP. The port's state controls the action the port takes upon receipt of a frame. Possible values are:Forwarding – The port sends and receives traffic normally.Blocking – The port does not send or receive traffic, but does receive BPDUs.Learning – The port receives traffic but does not forward the traffic. The port learns the source MAC addresses of incoming frames.Listening – The port monitors BPDUs, but does not forward traffic and does not learn the source MAC addresses of incoming frames.Disabled – The port is disabled (not by MSTP). |
| STP Port Designated Cost | The CIST Path Cost of the segment connected to this port. This value is compared to the root path cost in received BPDUs. |
| STP Port Designated Bridge | The CIST Bridge ID of the bridge that this port considers to be the designated bridge for this port's segment. |
Viewing and Configuring the MSTP Port CIST Parameters
To view and configure CIST port parameters:
1 Select Ethernet > Protocols > MSTP > Port > CIST. The MSTP Port CIST page opens.
Figure 285 MSTP Port CIST Page

2 Select an interface and click Edit. The MSTP Port CIST – Edit page opens.
Figure 286 MSTP Port CIST – Edit Page

3 In the CIST Port Admin Path Cost field, enter an assigned value for the contribution of this port to the path cost of paths towards the spanning tree root.

Note
Changing the value of this parameter is considered to be a topology change by the MSTP mechanism.
4 In the CIST Port Edge Admin field, select the port's administrative edge port parameter, for the CIST.
5 In the CIST MAC enabled field, select the port's MAC Enabled parameter. A value of True indicates that administratively, the MAC is set as if it were connected to a point-to-point LAN. Options are:
- Force True – The MAC is treated as if it is connected to a point-to-point LAN, regardless of any indications to the contrary that are generated by the MAC entity.
- Force False –The MAC is treated as if it is connected to a non-point-to-point LAN, regardless of any indications to the contrary that are generated by the MAC entity.
○ Automatic – The MAC Enabled parameter is set to True if the MAC is connected to a point-to-point or full-duplex LAN. The MAC Enabled parameter is set to False if the MAC is connected to a non-point-to-point and half-duplex LAN.
6 Click Apply, then Close.
Table 77 lists and describes the status parameters in the MSTP Port Spanning Tree page.
Table 84 MSTP Port CIST Status Parameters
| Parameter Definition | |
| CIST Port Interface Location | The slot number and port number of the port. |
| CIST Port Designated Root | The CIST Regional Root ID component of the port's Port Priority vector for the CIST |
| CIST Port Edge Oper State | Indicates whether or not the port is operating as an Edge port. Possible values are:True– The port is operating as an Edge port, which means it does not process the BPDUs that it receives.False– The port is operating as a non-Edge port, which means it processes the BPDUs that it receives.If CIST Port Edge Admin is set to True, the system automatically determines its operational Edge port state. |
Parameter Definition
CIST Port Role The port's current role in the CIST.
Transient port roles may be:
- Blocking – The port does not send or receive traffic, but does receive BPDUs.
- Learning – The port receives traffic but does not forward the traffic. The port learns the source MAC addresses of incoming frames.
- Listening – The port monitors BPDUs, but does not forward traffic and does not learn the source MAC addresses of incoming frames.
• Final port roles may be: - Disabled – The port is in Operational - Down state and is not included in the MSTP calculation.
- Designated – The port is in Operational - Up state and has been designated to forward traffic.
- Root – The port is forwarding traffic towards the root bridge.
- Alternate – The port is not forwarding traffic (blocked) but can become a Designated port after MSTP calculation.
| CIST Port CIST Regional Route ID | The Bridge ID of the current CIST Regional Root. |
| CIST Port CIST Path Cost | The CIST path cost from the transmitting bridge to the CIST regional root.If the transmitting bridge is the CIST regional root, the value of this parameter will be 0. |
| CIST Port Hello Time | The port's Hello Time timer parameter value, for the CIST (in cs). |
| CIST Port Protocol Migration | The current value of the mcheck variable for the port.Note: Migration support is planned for future release. |
| CIST Port MAC Oper State | The current state of the port's MAC operational parameter. True indicates the MAC is operational. |
| CIST Port Uptime | The number of seconds that have elapsed since the port was last reset or initialized. |
Viewing and Configuring the MSTP Port MSTI Parameters
To view and configure MSTI port parameters:
1 Select Ethernet > Protocols > MSTP > Port > MSTI. The MSTP Port MSTI page opens.
Figure 287 MSTP Port MSTI Page
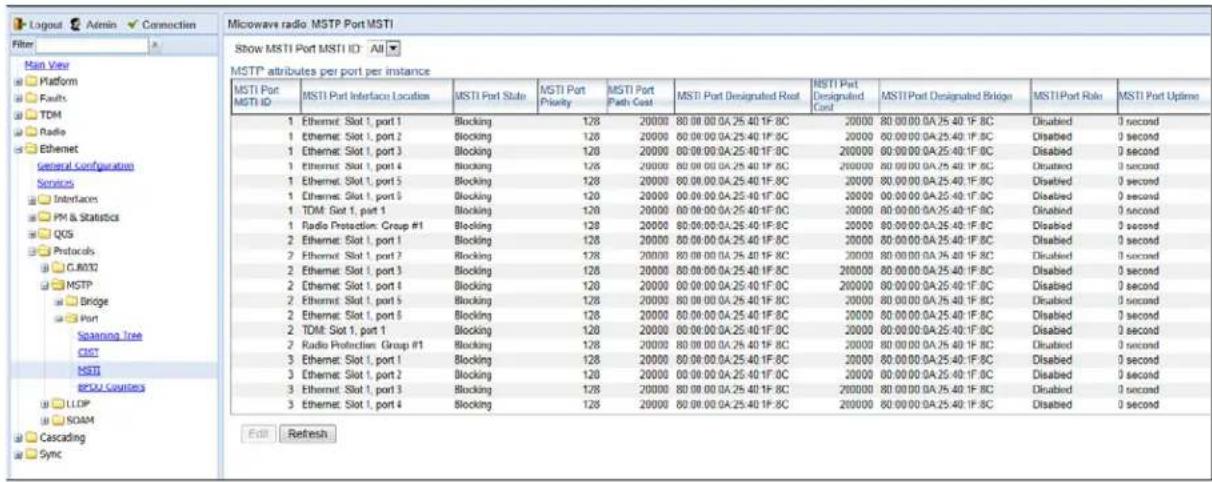
2 To view the parameters for a specific MSTI-port combination in a separate window and modify several of the parameters, select the row with the MSTI-port combination you want to view and/or modify and click Edit. The MSTP Port MSTI – Edit page opens.
Figure 288 MSTP Port MSTI – Edit Page

3 In the MSTI Port Priority field, select the port's Priority parameter value for the MSTI, i.e., the priority field for the Port ID for the MSTI. You can select values from 0-240, in multiples of 16.

Note
Changing the value of this parameter is considered to be a topology change by the MSTP mechanism.
4 In the MSTI Port Path Cost field, select the port's Path Cost parameter value for the MSTI.

Note
Changing the value of this parameter may cause re-initialization of the MSTI for which the parameter is changed. No other MSTI is affected.
5 Click Apply, then Close.
Table 78 lists and describes the status parameters in the MSTP MSTI Tree page.
Table 85 MSTP Port MSTI Status Parameters
| Parameter Definition | |
| MSTI Port MSTI ID | The MSTI ID. |
| MSTI Port Interface Location | The slot number and port number of the port. |
| MSTI Port State | The port's current state for the MSTI. Possible values are:Forwarding– The port sends and receives traffic normally.Blocking– The port does not send or receive traffic, but does receive BPDUs.Learning– The port receives traffic but does not forward the traffic. The port learns the source MAC addresses of incoming frames.Listening– The port monitors BPDUs, but does not forward traffic and does not learn the source MAC addresses of incoming frames.Disabled– The port is disabled (not by MSTP). |
| MSTI Port Designated Root | The Regional Root ID component of the port's Port Priority vector for the MSTI. |
| MSTI Port Designated Cost | The Internal Root Path Cost component of the port's MSTI port priority vector, for the MSTI. |
| MSTI Port Designated Bridge | The Designated Bridge ID component of the port's MSTI port priority vector. |
Parameter Definition
MSTI Port Role The port's current role in the MSTI.
Transient port roles may be:
- Blocking – The port does not send or receive traffic, but does receive BPDUs.
- Learning – The port receives traffic but does not forward the traffic. The port learns the source MAC addresses of incoming frames.
- Listening – The port monitors BPDUs, but does not forward traffic and does not learn the source MAC addresses of incoming frames.
• Final port roles may be: - Disabled – The port is in Operational - Down state and is not included in the MSTP calculation.
- Designated – The port is in Operational - Up state and has been designated to forward traffic.
- Root – The port is forwarding traffic towards the root bridge.
- Alternate – The port is not forwarding traffic (blocked) but can become a Designated port after MSTP calculation.
- Master – The port is forwarding traffic towards the CIST root bridge.
MSTI Port Uptime
The port's uptime parameter value for the MSTI. This is the number of seconds that have elapsed since the port was last reset or initialized.
Viewing and Resetting the BPDU Counters
To view and reset the BPDU counters:
1 Select Ethernet > Protocols > MSTP > Port > BPDU Counters. The MSTP Port BPDU Counters page opens.
Figure 289 MSTP Port BDPU Counters Page

- To reset the counters, click Reset Counters.
To display the counters for a specific interface in a separate page, select the interface and click View.
Table 79 describes the available MSTP BPDU counters.
Table 86 MSTP BPDU Counters
| Parameter Definition | |
| Interface Location | The location of the port. |
| Received TCN | The number of Topology Change Notifications (TCNs) received since the last counter reset. |
| Received Configuration BPDU | The number of configuration BPDUs received since the last counter reset. |
| Received RST BPDU | The number of Rapid Spanning Tree (RST) BPDUs received since the last counter reset. |
| Received MST BPDU | The number of Multiple Spanning Tree (MST) BPDUs received since the last counter reset. |
| Transmitted TCN BPDU | The number of Topology Change Notifications (TCNs) transmitted since the last counter reset. |
| Transmitted Configuration BPDU | The number of configuration BPDUs transmitted since the last counter reset. |
| Transmitted RST BPDU | The number of Rapid Spanning Tree (RST) BPDUs transmitted since the last counter reset. |
| Transmitted MST BPDU | The number of Multiple Spanning Tree (MST) BPDUs transmitted since the last counter reset. |
Configuring LLDP
This section includes:
- LLDP Overview
- Displaying Peer Status
- Configuring the General LLDP Parameters
- Configuring the LLDP Port Parameters
- Displaying the Unit's Management Parameters
- Displaying Peer Unit's Management Parameters
- Displaying the Local Unit's Parameters
• Displaying LLDP Statistics
LLDP Overview
Link Layer Discovery Protocol (LLDP) is a vendor-neutral layer 2 protocol that can be used by a network element attached to a specific LAN segment to advertise its identity and capabilities and to receive identity and capacity information from physically adjacent layer 2 peers. LLDP is a part of the IEEE 802.1AB – 2005 standard that enables automatic network connectivity discovery by means of a port identity information exchange between each port and its peer. Each port periodically sends and also expects to receive frames called Link Layer Discovery Protocol Data Units (LLDPDU). LLDPDUs contain information in TLV format about port identity, such as MAC address and IP address.
LLDP is used to send notifications to the NMS, based on data of the local unit and data gathered from peer systems. These notifications enable the NMS to build an accurate network topology.
Displaying Peer Status
To display a summary of the important LLDP management information regarding the unit's nearest neighbor (peer):
- Select Ethernet > Protocols > LLDP > Remote Management. The LLDP Remote Management page opens.
Figure 290 LLDP Remote System Management Page

Table 80 describes the LLDP remote system management parameters. These parameters are read-only.
Table 87 LLDP Remote System Management Parameters
| Parameter Definition | |
| Local Interface Location | The location of the local interface. |
| Management Address | The octet string used to identify the management address component associated with the remote system. |
| Address Sub Type | The type of management address identifier encoding used in the associated LLDP Agent Remote Management Address. |
| Time Mark The time the entry was created. | |
Configuring the General LLDP Parameters
This section explains how to define the general LLDP parameters for the unit. For instructions on defining port-specific parameters, see Configuring the LLDP Port Parameters.

Note
The management IP address advertised by the local element depends on the IP protocol (IPv4 or IPv6) configured for the unit. See Defining the IP Protocol Version for Initiating Communications.
To display and configure the general LLDP parameters for the unit:
- Select Ethernet > Protocols > LLDP > Advanced > Configuration > Parameters. The LLDP Configuration Parameters page opens.
Figure 291 LLDP Configuration Parameters Page

- Modify the configurable parameters, described in Table 82.
- Click Apply.
Table 81 lists and describes the status parameters in the LLDP Configuration Parameters page.
Table 88 LLDP Read-Only Configuration Parameters
| Parameter Definition | |
| Max TX Credit | Displays the maximum number of consecutive LLDPDUs that can be transmitted at any one time. In this release, the Max TX Credit is set at 5. |
| Fast TX Interval (Seconds) | Displays, in seconds, the interval at which LLDP frames are transmitted during fast transmission periods, such as when the unit detects a new peer. In this release, the Fast TX Interval is set at 1. |
| Fast TX | The initial value used to initialize the variable which determines the number of transmissions that are made during fast transmission periods. In this release, the Fast TX No. is set at 4. |
| Reinit Delay (Seconds) | Defines the minimum time, in seconds, the system waits after the LLDP Admin status becomes Disabled until it will process a request to reinitialize LLDP. For instructions on disabling or enabling LLDP on a port, see Configuring the LLDP Port Parameters.In this release, the Reinit Delay is set at 2. |
Table 89 LLDP Configurable Configuration Parameters
| Parameter Definition | |
| TX Interval (Seconds) | Defines the interval, in seconds, at which LLDP frames are transmitted. You can select a value from 5 to 32768. The default value is 30. |
| Notification Interval (Seconds) | Defines the interval, in seconds, between transmissions of LLDP notifications during normal transmission periods. You can select a value from 5 to 3600. The default value is 10. |
| Hold Multiplier | Defines the time-to-live (TTL) multiplier. The TTL determines the length of time LLDP frames are retained by the receiving device. The TTL is determined by multiplying the TX Interval by the Hold Multiplier. You can select a value from 2 to 10. The default value is 4. |
Configuring the LLDP Port Parameters
To enable LLDP per port and determine how LLDP operates and which TLVs are sent for each port:
- Select Ethernet > Protocols > LLDP > Advanced > Configuration > Port Configuration. The LLDP Port Configuration page opens.
Figure 292 LLDP Port Configuration Page
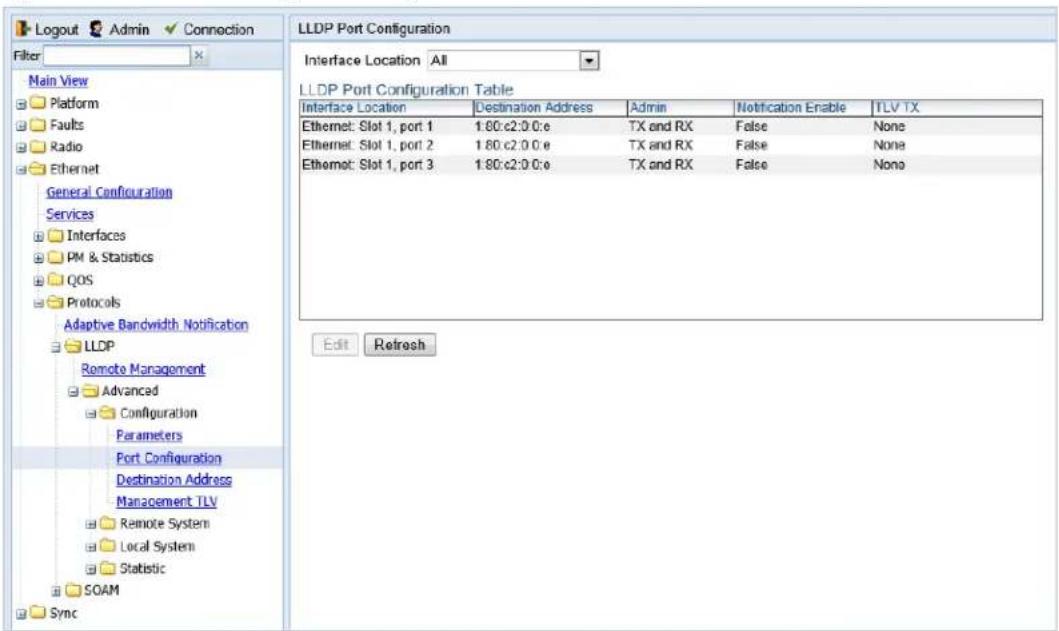
- Select an interface and click Edit. The LLDP Port Configuration - Edit page opens.
Figure 293 LLDP Port Configuration - Edit Page
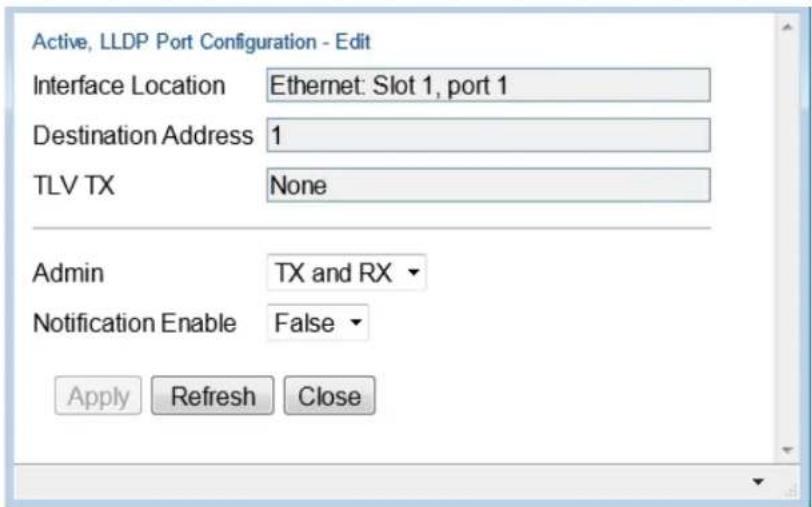
-
In the Admin field, select from the following options to define how the LLDP protocol operates for this port:
-
TX Only – LLDP agent transmits LLDP frames on this port but does not update information about its peer.
- RX Only – LLDP agent receives but does not transmit LLDP frames on this port.
- TX and RX – LLDP agent transmits and receives LLDP frames on this port (default value).
-
Disabled – LLDP agent does not transmit or receive LLDP frames on this port.
-
In the Notification Enable field, select from the following options to define, on a per agent basis, whether or not notifications from the agent to the NMS are enabled:
- True – The agent sends a Topology Change trap to the NMS whenever the system information received from the peer changes.
- False – Notifications to the NMS are disabled (default value).
5. Click Apply, then Close.
Table 83 lists and describes the status parameters in the LLDP Port Configuration page.
Table 90 LLDP Port Configuration Status Parameters
| Parameter Definition | |
| Interface Location Identifies the port. | |
| Destination Address | The destination address of the LLDP agent associated with this port. |
| TLV TX | Indicates which of the unit's capabilities is transmitted by the LLDP agent for the port:PortDesc – The LLDP agent transmits Port Description TLVs.SysName – The LLDP agent transmits System Name TLVs.SysDesc – The LLDP agent transmits System Description TLVs.SysCap – The LLDP agent transmits System Capabilities TLVs. |
Displaying the Unit's Management Parameters
To display the unit's destination LLDP MAC address:
- Select Ethernet > Protocols > LLDP > Advanced > Configuration > Destination Address. The LLDP Destination Address Table page opens.
Figure 294 LLDP Destination Address Table Page

To displays the MAC address associated with the unit for purposes of LLDP transmissions:
- Select Ethernet > Protocols > LLDP > Advanced > Configuration > Management TLV. The LLDP Management TLV Configuration page opens.
Figure 295 LLDP Management TLV Configuration Page
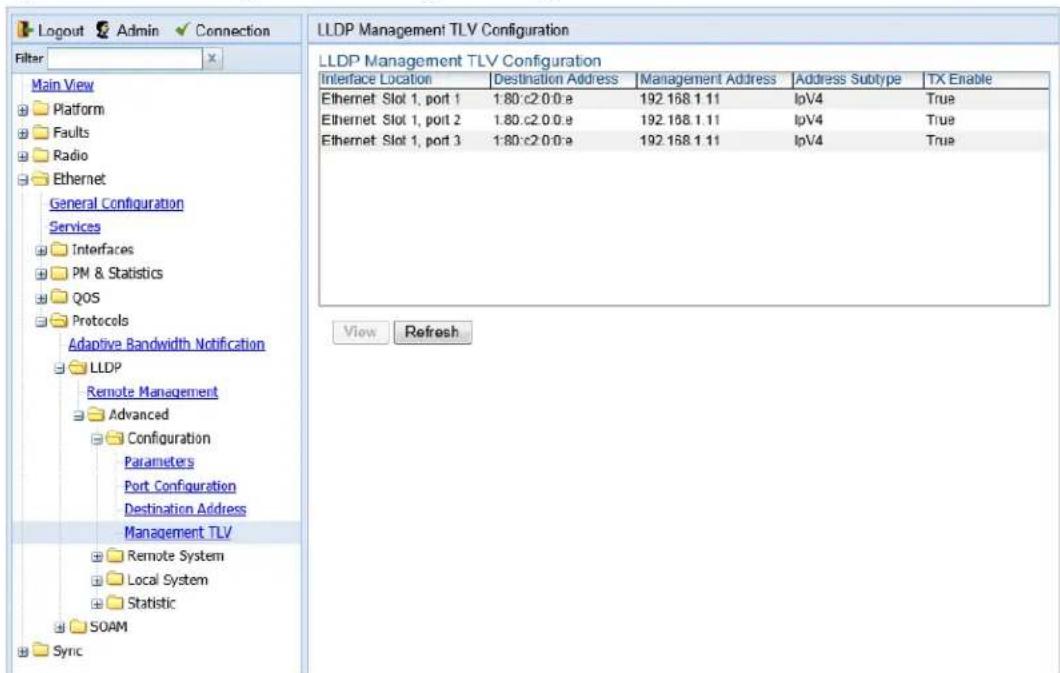
Table 84 lists and describes the status parameters in the LLDP Management TLV Configuration page.
Table 91 LLDP Management TLV Parameters
| Parameter Definition | |
| Interface Location Identifies the port. | |
| Destination Address | Defines the MAC address associated with the port for purposes of LLDP transmissions. |
| Management Address | The unit's IP address. |
| Address Subtype | Defines the type of the management address identifier encoding used for the Management Address. |
| Tx Enable | Indicates whether the unit's Management Address is transmitted with LLDPDUs. In this release, the Management Address is always sent. |
Displaying Peer Unit's Management Parameters
To display LLDP management information about the unit's nearest neighbor (peer):
- Select Ethernet > Protocols > LLDP > Advanced > Remote System > Management. The LLDP Remote System Management page opens.
Figure 296 LLDP Remote System Management Page
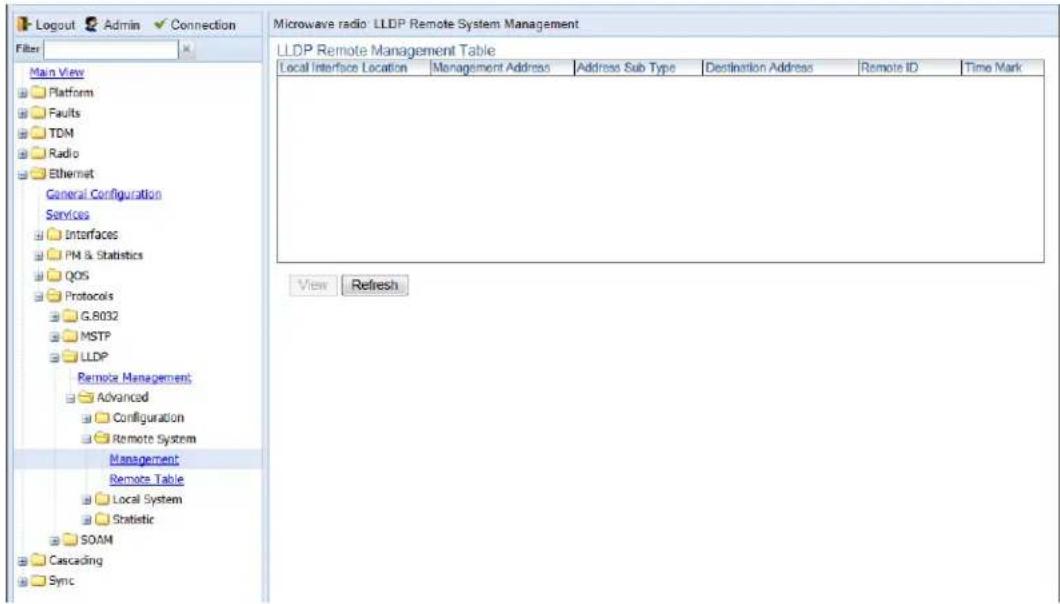
Table 85 describes the LLDP remote system management parameters. These parameters are read-only.
Table 92 LLDP Remote System Management Parameters
| Parameter Definition | |
| Local Interface Location | The location of the local interface. |
| Management Address | The octet string used to identify the management address component associated with the remote system. |
| Address Sub Type | The type of management address identifier encoding used in the associated LLDP Agent Remote Management Address. |
| Destination Address | The peer LLDP agent's destination MAC Address. |
| Remote ID | An arbitrary local integer value used by this agent to identify a particular connection instance, unique only for the indicated remote system. |
| Time Mark | The time the entry was created. |
To display unit parameter information received via LLDP from the unit's nearest neighbor (peer):
- Select Ethernet > Protocols > LLDP > Advanced > Remote System > Remote Table. The LLDP Remote System Table page opens.
Figure 297 LLDP Remote System Table Page

Table 86 describes the parameters in the LLDP Remote System Table page. These parameters are read-only.
Table 93 LLDP Remote System Table Parameters
| Parameter Definition | |
| Local Interface Location | The location of the local interface. |
| Remote ID | An arbitrary local integer value used by this agent to identify a particular connection instance, unique only for the indicated peer. |
| Remote Chassis ID | An octet string used to identify the peer's chassis. |
| Chassis ID Subtype | The type of encoding used to identify the peer's chassis. |
| Remote Port | An octet string used to identify the port component associated with the remote system. |
| Port Sub type | The type of port identifier encoding used in the peer's Port ID. |
| Time Mark The time the entry was created. | |
Displaying the Local Unit's Parameters
To display the unit parameters, as transmitted by the LLDP agents:
- Select Ethernet > Protocols > LLDP > Advanced > Local System > Parameters. The LLDP Local System Parameters page opens.
Figure 298 LLDP Local System Parameters Page

Table 87 describes the parameters in the LLDP Local System Parameters page. These parameters are read-only.
Table 94 LLDP Local System Parameters
| Parameter Definition | |
| System Name | The system name included in TLVs transmitted by the LLDP agent, as defined in theNamefield of the Unit Parameters page. SeeConfiguring Unit Parameters. |
| System Description | The system description included in TLVs transmitted by the LLDP agent, as defined in theDescriptionfield of the Unit Parameters page. SeeConfiguring Unit Parameters. |
| Chassis ID The MAC Address of the local unit's chassis. | |
| Chassis ID SubType | The type of encoding used to identify the local unit's chassis. In this release, this parameter is always set to MAC Address. |
Parameter Definition
| Capabilities Supported | A bitmap value used to identify which system capabilities are supported on the local system, as included in TLVs transmitted by the LLDP agent.The bitmap is defined by the following parameters:0 – other1 – repeater2 – bridge3 – wlanAccessPoint4 – router5 – telephone6 – docsisCableDevice7 – stationOnly8 – cVLANComponent9 – sVLANComponent10 – twoPortMACRelay |
| Capabilities Enabled | A bitmap value used to identify which system capabilities are enabled on the local system, as included in TLVs transmitted by the LLDP agent.The bitmap is defined by the following parameters:0 – other1 – repeater2 – bridge3 – wlanAccessPoint4 – router5 – telephone6 – docsisCableDevice7 – stationOnly8 – cVLANComponent9 – sVLANComponent10 – twoPortMACRelay |
To display the unit's port parameters, as transmitted by the LLDP agents:
- Select Ethernet > Protocols > LLDP > Advanced > Local System > Port. The LLDP Local System Port page opens.
Figure 299 LLDP Local System Port Page

Table 88 describes the parameters in the LLDP Local System Port page. These parameters are read-only.
Table 95 LLDP Local System Port Parameters
| Parameter Definition | |
| Interface Location Identifies the port. | |
| Port ID The port's MAC address. | |
| Port Sub Type | The type of encoding used to identify the port in LLDP transmissions. In this release, this parameter is always set to MAC Address. |
| Port Description | A description of the port. |
To display the unit's management parameters, as transmitted by the LLDP agents:
- Select Ethernet > Protocols > LLDP > Advanced > Local System > Management. The LLDP Local System Management page opens.
Figure300 LLDP Local System Management Page

- To display all the parameters, select a row and click View.
Figure 301 LLDP Local System Management – View Page

Table 89 describes the parameters in the LLDP Local System Management page. These parameters are read-only.
Table 96 LLDP Local System Management Parameters
| Parameter Definition | |
| Management Address | The local unit's IP address. |
| Address Sub Type | The format of the local unit's IP Address. |
| Address Length Reserved for future use. | |
| Address Interface ID | Reserved for future use. |
| Address Interface Sub Type | Reserved for future use. |
| Address OID Reserved for future use. | |
Displaying LLDP Statistics
To display statistics about changes reported via LLDP by the remote unit:
- Select Ethernet > Protocols > LLDP > Advanced > Statistic > General. The LLDP Statistic page opens.
Figure 302 LLDP Statistic Page
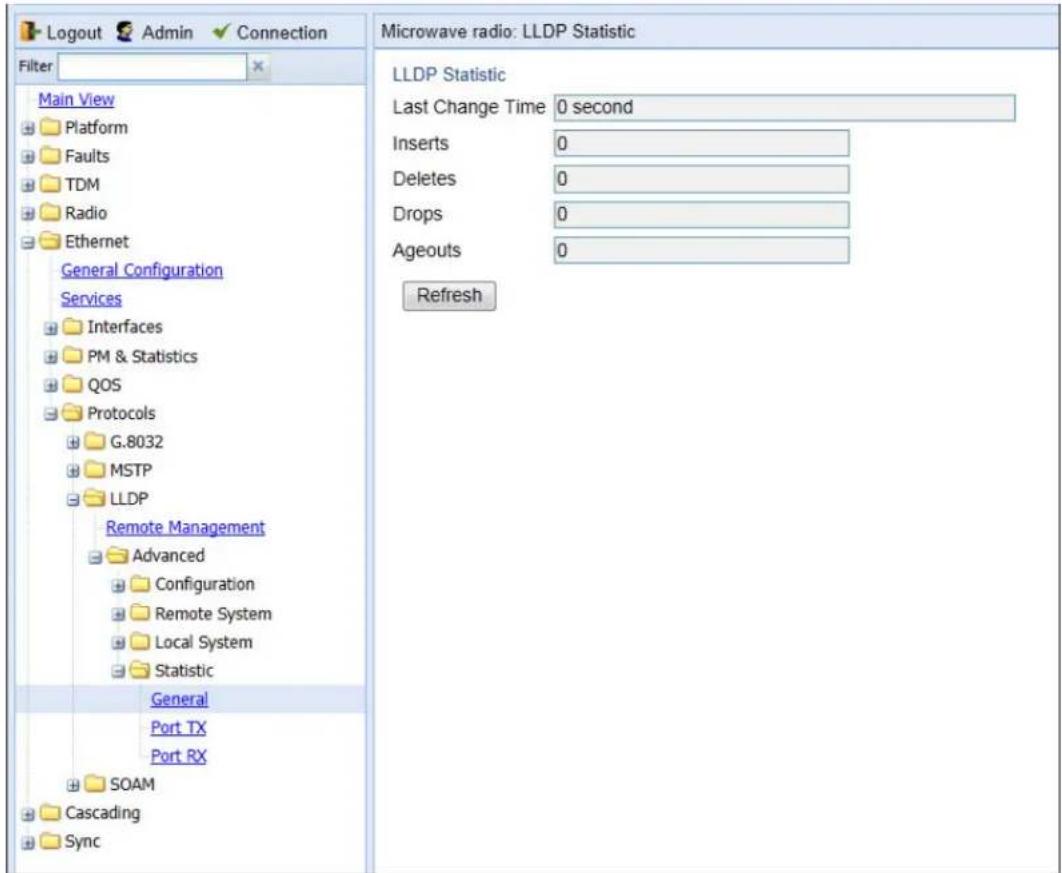
Table 90 describes the statistics in the LLDP Statistic page.
Table 97 LLDP Statistics
| Parameter Definition | |
| Last Change Time | The time of the most recent change in the remote unit, as reported via LLDP. |
| Inserts | The number of times the information from the remote system has changed. |
| Deletes | The number of times the information from the remote system has been deleted. |
| Drops Reserved for future use. | |
| Ageouts | The number of times the information from the remote system has been deleted from the local unit's database because the information's TTL has expired.The RX Ageouts counter in the Port RX page is similar to this counter, but is for specific ports rather than the entire unit. |
To display statistics about LLDP transmissions and transmission errors:
- Select Ethernet > Protocols > LLDP > Advanced > Statistic > Port TX. The LLDP Port TX Statistic page opens.
Figure 303 LLDP Port TX Statistic Page

Table 91 describes the statistics in the LLDP Port TX Statistic page.
Table 98 LLDP Port TX Statistics
Parameter Definition
| Interface Location | The index value used to identify the port in LLDP transmissions. |
| Destination Address | The LLDP MAC address associated with this entry. |
| Total Frames | The number of LLDP frames transmitted by the LLDP agent on this port to the destination MAC address. |
| Errored Length Frames | The number of LLDPDU Length Errors recorded for this port and destination MAC address.If the set of TLVs that is selected in the LLDP local system MIB by network management would result in an LLDPDU that violates LLDPDU length restrictions, then the No. of Length Error statistic is incremented by 1,and an LLDPDU is sent containing the mandatory TLVs plus as many of the optional TLVs in the set as will fit in the remaining LLDPDU length. |
To display statistics about LLDP frames received by the unit:
- Select Ethernet > Protocols > LLDP > Advanced > Statistic > Port RX. The LLDP Port TX Statistic page opens.
Figure 304 LLDP Port RX Statistic Page

Table 92 describes the statistics in the LLDP Port TX Statistic page.
Table 99 LLDP Port RX Statistics
| Parameter Definition | |
| Interface Location | The index value used to identify the port in LLDP transmissions. |
| Destination Address | The LLDP MAC address associated with this entry. |
| Total Discarded | The number of LLDP frames received by the LLDP agent on this port, and then discarded for any reason. This counter can provide an indication that LLDP header formatting problems may exist with the local LLDP agent in the sending system or that LLDPDU validation problems may exist with the local LLDP agent in the receiving system. |
| Invalid Frames | The number of invalid LLDP frames received by the LLDP agent on this port while the agent is enabled. |
| Valid Frames | The number of valid LLDP frames received by the LLDP agent on this port. |
| Discarded TLVs | The number of LLDP TLVs discarded for any reason by the LLDP agent on this port. |
| Unrecognized TLVs | The number of LLDP TLVs received on the given port that are not recognized by LLDP agent. |
| Ageouts | The number of age-outs that occurred on the port. An age-out is the number of times the complete set of information advertised by the remote system has been deleted from the unit's database because the information timeliness interval has expired.This counter is similar to theLLDP No. of Ageoutscounter in the LLDP Statistic page, except that it is per port rather than for the entire unit.This counter is set to zero during agent initialization. This counter is incremented only once when the complete set of information is invalidated (aged out) from all related tables on a particular port. Partial ageing is not allowed. |
Chapter 9: TDM Services and Interfaces
This section includes:
• TDM Overview
- Configuring the E1/DS1 Interface
- Configuring Native TDM Trails
- Configuring TDM Pseudowire Services
- Configuring Advanced Pseudowire Parameters
- Displaying TDM PMs
Related topics:
• Performing TDM Diagnostics
TDM Overview
PTP 820G and PTP 820F provides integrated support for transportation of TDM services with an integrated E1/DS1 interface (optional).
Two types of TDM services are supported using the same hardware:
- Native TDM trails
• TDM Pseudowire services (enabling interoperability with third party packet/PW equipment)
PTP 820G and PTP 820F also offers hybrid Ethernet and TDM services. Hybrid services can utilize either Native TDM or pseudowire.
Hybrid Ethernet and TDM services can also be transported via cascading interfaces. This enables the creation of links among multiple units in a node for multi-carrier and multi-directional applications.
The PTP 820G and PTP 820F Web EMS provides convenient workflows for both native TDM trails and pseudowire services. These workflows guide you through the configuration process, step by step.
Configuring the E1/DS1 Interface

Note
By default, the TDM interfaces in a PTP 820G unit are set to operate according to the ETSI standard, in E1 mode. For instructions on configuring the system to operate according to the ANSI (FCC) standard (DS1), see TDM Overview (CLI).
You can configure the E1/DS1 interface in the E1/DS1 Interfaces page.
To configure the E1/DS1 interface:
1 Select TDM > Interfaces > E1/DS1. The E1/DS1 Interfaces page opens.
2 Select an interface and click Edit. The E1/DS1 Interfaces – Edit page opens.
Figure 306 E1/DS1 Interfaces – Edit Page
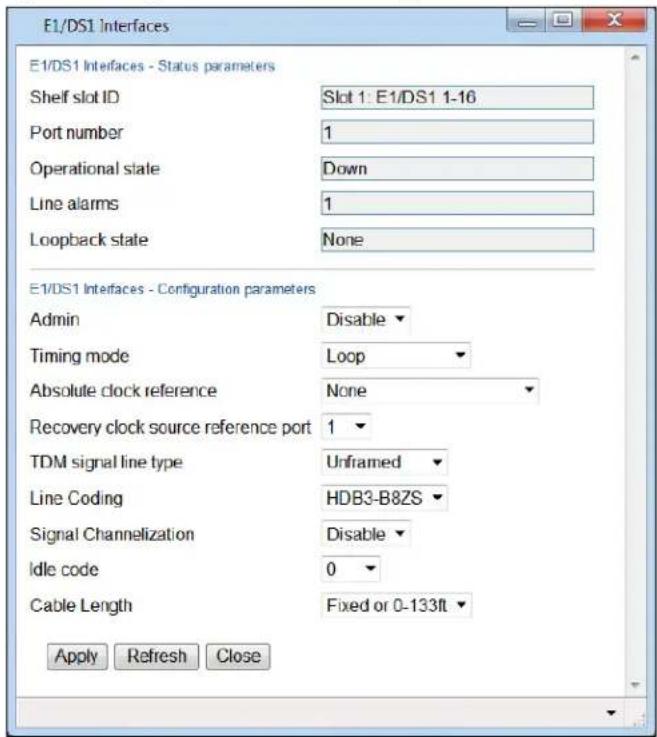
3 Configure the parameters described in Table 93.
4 Click Apply, then Close.

Note
Table 94 lists and describes the non-configurable E1/DS1 Interface status parameters.
Table 100 E1/DS1 Interface Configuration Parameters
| Parameter Definition | |
| Admin | Select Enable to enable the port or Disable to disable the port. |
| Timing Mode | Select the clock reference for the outgoing TDM signal from the port. Options are:Loop– The output signal uses the clock of the incoming E1/DS1 lines. If you select Loop, you must select the clock source reference in the Recovery Clock Source Reference Port field. By default, each port will take itself as a reference.Absolute– All ports are synchronized to a single common clock, which you select in the Absolute Clock Reference field.Clock Recovery– Adaptive Clock Recovery. Clock information is recovered on the egress path. Extra information may be located in an RTP header that can be used to correct frequency offsets.If you selectClock Recovery, you must select the clock source reference in theRecovery Clock Source Reference Portfield. |
| Absolute Clock Reference | If Timing Modeis set to Absolute, select the clock source reference for the port. Options are:Front Panel- An external clock reference from a dedicated front panel clock interface. This can be:○ An E1/DS1 line, or○ A Digital 2.048MHz/1.544MHz inputSystem Reference ClockIf Timing Modeis set to Loop or Clock Recovery, select None. |
| Recovery Clock Source Reference Port | If Timing Modeis set to Loop or Clock Recovery, select the clock source reference for the port. Options are 1-16.By default, each port will take itself as a reference. Select a different port only if more than 16 clock domains are being used.If Timing Modeis set to Absolute, this field must be set to 0. |
| TDM Signal Line Type | Select the line type of this port. Options are:UnframedE1 (reserved for future use)E1-CRC (reserved for future use)E1-MF (reserved for future use)E1-MF-CRC (reserved for future use)DS1-D4 (reserved for future use)DS1-ESF (reserved for future use) |
| Line Coding | Select the line coding for this port. Options are: • hdb3-b8zs – hdb3 coding for E1, b8zs coding for DS1.• AMI – Only relevant for DS1 ports. |
| Signal Channelization | Select Disable.Note: Channelization is only relevant for CESoP mode, which is planned for future release. |
| Idle Code | Enter the value to be transmitted on this port for unused time slots (0-255). |
| Cable Length | Reserved for future use. |
Table 101 E1/DS1 Interface Parameters
| Parameter Definition | |
| Shelf Slot ID Slot 1. | |
| Port Number | The physical port number of the port on the TDM card. |
| Operational State | Indicates whether the port is currently operational (Up) or non-operational (Down). |
| Line Alarms | The number of line-level PDH alarms currently present on the port. |
| Loopback State | The actual status of loopback on this port, as reported by the TDM card. |
Configuring Native TDM Trails
This section includes:
• Native TDM Trail Configuration Overview
• General Guidelines for Provisioning TDM Services
- Viewing TDM Trails
- Configuring the Revertive Timer
- Adding TDM Trails
- Editing TDM Trails
- Deleting TDM Trails
• Limitations on Available Endpoints
Native TDM Trail Configuration Overview

Note
By default, the TDM interfaces in a PTP 820G or PTP 820F unit are set to operate according to the ETSI standard, in E1 mode. For instructions on configuring the system to operate according to the ANSI (FCC) standard (DS1), see TDM Overview (CLI).
The Web EMS provides a simple interface that guides you, step-by-step, through the trail configuration process.
To open the Native TDM Services page:
1 Select TDM > Native TDM Services. The Native TDM Services page opens.
Figure 307 Native TDM Services Page

The Native TDM Services page displays all TDM trails configured on the unit and provides a simple and efficient workflow for adding TDM trails. The following interfaces can be used as trail endpoints:
- TDM interfaces
- Radio interfaces
- Cascading interfaces
TDM endpoints can be E1/DS1s.

Note
In order use a LIC-T155 as an endpoint for a TDM trail, you must set the Slot Admin State field in the Chassis Configuration page to Enable and the Admin Status field in the Interface Manager page to Up. Otherwise, the LIC-T155 will not appear in the dropdown list. See Enabling the Expansion Slots and Enabling the Interfaces (Interface Manager).
Radio endpoints can be selected from the radio interfaces, a Radio Protection Group, or a Multi-Carrier ABC Group.
Cascading interfaces can be configured on ports GbE1/CS1 and GbE2/CS2. When operating in cascading mode, these interfaces can handle hybrid Ethernet and Native TDM traffic, enabling operators to create links among multiplePTP 820 units in a node for multi-directional applications based on hybrid Ethernet and Native or pseudowire TDM services. For instructions, see Configuring Cascading Interfaces (Optional).

Note
In order to use a radio interface, a radio protection group, a Multi-Carrier ABC group, or a cascading interface as an endpoint for a TDM trail, you must configure either a management or a pipe service point on that interface or group. Otherwise, the interface or group will not appear in the dropdown list. See Configuring Ethernet Service(s).
General Guidelines for Provisioning TDM Services
When provisioning TDM trails, it is recommended to follow these guidelines:
- Each trail within the same local region should use a unique Trail ID. The Trail ID should also be unique along the path of each trail.
- For protected trails, the Trail ID of the protecting trail must be different from the Trail ID of the working trail.
- At one of the two endpoint devices, the Local parameter should be set to 1 while, at the far-end endpoint device, the Local parameter should be set to 2.
Viewing TDM Trails
The Native TDM Services page (Figure 294) displays the TDM trails configured on the unit and their basic parameters.
Table 95 lists and describes the parameters in the Native TDM Services page.
Table 102 Native TDM Service Parameters
| Parameter Definition | |
| Trail ID | A unique ID for the trail. |
| Trail Description | A text description of the trail. |
| Interface #1: Slot/Group | Slot 1 or the group number of the first endpoint in the trail. |
| Interface #1: Port | The port number of the first endpoint in the trail. |
| Interface #1: VC | The VC classified to the first endpoint of the trail (1-256). This field is only relevant for radio and cascading endpoints. |
| Interface #2: Slot/Group | Slot 1 or the group number of the second endpoint in the trail. |
| Interface #2: Port | The port number of the second endpoint in the trail. |
| Interface #2: VC | The VC classified to the second endpoint of the trail (1-256). This field is only relevant for radio and cascading endpoints. |
| Protecting Interface: Slot/Group | For protected trails, displays Slot 1 or the group number of the protecting trail endpoint. |
| Protecting Interface: Port | For protected trails, the port number of the protecting trail endpoint. |
| Protecting Interface: VC | For protected trails, the VC classified to the protecting trail endpoint (1-256). This field is only relevant for radio and cascading endpoints. |
| Trail Status: Admin The administrative status of the trail. | |
| Trail Status: Operational The operational status of the trail. | |
Configuring the Revertive Timer
1:1 TDM path protection can be configured to operate in revertive mode. In revertive mode, the system monitors the availability of the protected path at all times. After switchover to the protecting path, once the protected path is operational and available without any alarms, the system waits for the duration of the user-configured Wait to Restore (WTR) time and then, if the protected path remains operational and available, initiates a revertive protection switch. A single WTR time is configured for all the TDM trails in the system. However, trails with 1:1 path protection can be configured individually as revertive or non-revertive.

Note
TDM trails with 1:1 path protection that were configured using software versions prior to T7.9 are non-revertive.
The Revertive timer must be configured before creating a protecting TDM trail so that the configured WTR time will be in effect for this trail.
To set the WTR time for trails with revertive 1:1 path protection:
1 Underneath the Native TDM Services table, click Timer Configuration. The TDM Service Revertive Timer Configuration page opens.
Figure 308 TDM Service Revertive Timer Configuration Page
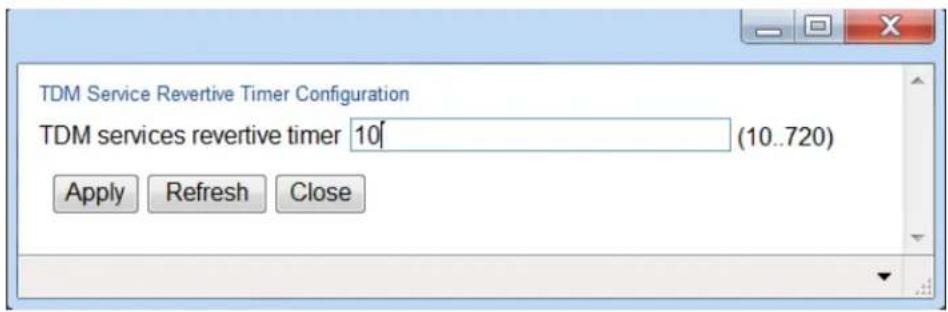
2 Enter the number, in seconds, for the WTR time. The default value is 10 seconds.
3 Click Apply, then Close.
Adding TDM Trails
To initiate the workflow for adding a TDM trail:
1 Select TDM > Native TDM Services. The Native TDM Services page opens (Figure 294).
2 Click Create Service. The Add Native TDM Service workflow begins. The workflow and options provided by the TDM Services Creation page depends on the selection you make in the Slot/Group/Port field. For detailed instructions per trail type, see:
○ Adding a Trail between a TDM Port or Protection Group and a Radio Port, a Radio Group, or a Cascading Interface
○ Adding a Trail between Radio Ports, Radio Groups, or Cascading Interfaces
You cannot add a TDM trail if any of the following conditions exist:
• There are no available TDM endpoints (E1/DS1s or VC12s).
• There are no available services:
There are no available Service IDs in the range reserved for TDM trails (801-928), or
The maximum number of trails (256) has already been configured on the PTP 820G or PTP 820F unit.
Adding a Trail between a TDM Port or Protection Group and a Radio Port, a Radio Group, or a Cascading Interface
1 In the Interface #1 screen of the TDM Services Creation page, configure the parameters of the trail's first endpoint.
2 In the Slot/Group/Port field, select a TDM interface, a radio interface or group, or a cascading interface.
Configuring a TDM Card or Group as an Endpoint
i Select the E1/DS1 interface.
Figure 309 Native TDM Service Creation – Interface #1 E1/DS1


Note
Some interfaces may not appear in the Slot/Group/Port field. Refer to Limitations on Available Endpoints for the possible reasons an interface will not appear. If there are no available interfaces, a message appears that no endpoint can be selected.
ii In the E1/DS1 field, select an E1/DS1. This configures the first endpoint for the trail.

Note
Only E1/DS1s or VC12s that are not already assigned to a TDM trail appear in the selection box. Also, an E1/DS1 or VC12 will not appear in the selection box if the TDM card or group has already been assigned a service point with a classification and a slot and port or group number that match the classification that would automatically be assigned to the E1/DS1 or VC12 via the TDM Service Creation page.
iii In the Timing field, select the synchronization mode for the endpoint. Options are:
- Loop Timing – The interface takes the timing from incoming signals.
- Recovered – Clock information is recovered on the egress path. Extra information may be located in an RTP header that can be used to correct frequency offsets.
- System Reference – The interface is synchronized to the system reference clock.
- Front Panel – The interface is synchronized to an external clock reference from a dedicated front panel clock interface.
Configuring a Radio Card or Group or a Cascading Interface as an Endpoint

Note
In order to add a radio, radio group, or cascading interface as a trail endpoint, an MNG service point must be added to the interface or group in the pre-defined management service (Service ID 1025) or in a Pipe service. See Configuring Service Points.
iv In the Interface #1 screen of the TDM Services Creation page, configure the parameters of the trail's first endpoint.
Figure 310 Native TDM Service Creation – Interface #1 Radio
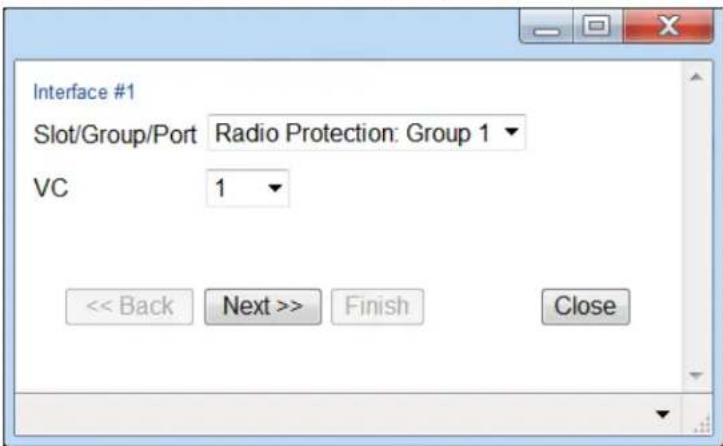

Note
Some interfaces may not appear in the Slot/Group/Port field. Refer to Limitations on Available Endpoints for the possible reasons an interface will not appear. If there are no available interfaces, a message appears that no endpoint can be selected.
v In the VC field, select the VC you want to classify to the endpoint (1-512).
3 Click Next. The Interface #2 page opens. In the Interface #2 page, configure the parameters of the trail's second endpoint:
If the first endpoint is a TDM interface, select a radio interface, a Radio Protection group, a Multi-Carrier ABC group, or a cascading interface in the Interface #2 page.
If the first endpoint is a radio interface, a Radio Protection group, a Multi-Carrier ABC group, or a cascading interface, select a TDM interface in the Interface #2 page.
4 Follow the instructions in Step 2 to configure the second endpoint.
5 Click Next. The Trail Selection page opens.
Figure 311 Native TDM Service Creation – Trail Selection Page (Radio-TDM)

6 In the Trail ID field, select a Trail ID (1-512) to identify the trail. Only unused Trail ID values appear in the selection box. The default value is the lowest unused Trail ID.
7 Optionally, in the Trail Description field, enter text to describe the trail.
8 In the Trail Protection field, select one of the following:
- Unprotected - The trail will not have trail protection.
☐ 1:1 Protection (non-revertive) – The trail will have 1:1 trail protection in which two separate network paths are defined for the trail. Each trail has the same TDM interface endpoints, but traffic flows to the destination via different radio or cascading interfaces. Bandwidth is utilized only on the active path, freeing up resources on the standby path. When you click Next, you will be asked to configure an additional radio interface, Radio Protection group, Multi-Carrier ABC group, or cascading interface as the protecting interface.
☐ 1:1 Protection (revertive) – The trail will have 1:1 trail protection, as described above, in revertive mode. See Configuring Service Points.
1+1 Protection – Used for networks in which the PTP 820G network elements are set up as a chain connected to third party networks at two different sites, where one end-point is located on a PTP 820G unit and the other end-point is located on third-party equipment supporting SNCP. The trail will have 1+1 trail protection in which two separate network paths are defined for the trail. Each trail has the same TDM interface endpoints, but traffic flows to the destination via different radio or cascading interfaces. Unlike 1:1 path protection, traffic flows through both paths simultaneously, thereby supporting SNCP in third party equipment at the other end of the link. When you click Next, you will be asked to configure an additional radio interface, Radio Protection group, Multi-Carrier ABC group, or cascading interface as the protecting interface.
☐ 1+1 Dual Homing Network Edge – Used for PTP 820G units located at the network edge in a 1+1 Protection configuration. Since the node itself is part of the protected or protecting path, the node itself is essentially unprotected and you do not need to configure a separate protecting path. When you click Next, you will be asked to configure a Working Path ID.

Note
In a 1+1 Protection configuration, the third-party equipment usually detects problems in the link via E1/DS1 AIS signals. If the third party equipment does not support the ability to read E1/DS1 AIS signals, it must be configured to perform switchover upon receiving an UNEQUIPPED indication in the signal label bits in the overhead.
9 In the Local field, select 1 or 2. If you select 1, the Local field in the network element at the other side of the link must be configured as 2, and vice versa.
If you selected Unprotected in the Trail Protection field, click Finish. The Selection Summary page opens (Figure 301).
If you selected 1:1 Protection (revertive or non-revertive) or 1+1 Protection in the Trail Protection field, click Next. The Protecting Interface Selection page opens.
Figure 312 Native TDM Service Creation – Protecting Interface Selection Page

If you selected 1+1 Dual Homing Network Edge in the Trail Protection field, click Next. The Working Trail Selection page opens. Skip steps 10 and 11 and proceed to Step 12.
Figure 313 Native TDM Service Creation – Working Trail Selection Page

10 In the Slot/Group/Port field, select a radio interface, Radio Protection group, Multi-Carrier ABC group, or cascading interface to serve as the interface for the protecting trail.

Note
Some interfaces may not appear in the Slot/Group/Port field. Refer to Limitations on Available Endpoints for the possible reasons an interface will not appear. If there are no available interfaces, a message appears that no endpoint can be selected.
11 In the VC field, select the VC you want to classify to the endpoint of the protecting trail (1-512).
12 In the Protecting Trail ID or Working Trail ID field, select a Trail ID (1-512) to identify the protecting or working trail. Only unused Trail ID values appear in the selection box. The default value is the lowest unused Trail ID. All nodes in the protected configuration, both on the protected and the protecting path, must have the same Protecting Trail ID or Working Trail ID.
13 Click Finish. The Selection Summary page opens, displaying the parameters you have configured.
Figure 314 Native TDM Service Creation – Selection Summary Page (Radio-TDM)

14 To create the trail with the displayed parameters, click Submit. If you want to return to an earlier page and change the trail parameters, click Back.

Note
An invalid configuration error may occur in the event that another user utilized a resource that you selected, such as an interface or a Trail ID, between the time you selected the resource and the time you pressed Submit. If this occurs, you must go back and, if necessary, select alternative resources for the trail.
Adding a Trail between Radio Ports, Radio Groups, or Cascading Interfaces
Note: In order to add a radio, radio group, or cascading interface as a trail endpoint, an MNG service point must be added to the interface or group in the pre-defined management service (Service ID 1025) or in a Pipe service. See Configuring Service Points.
1 In the Interface #1 screen of the TDM Services Creation page, configure the parameters of the trail's first endpoint.
Figure 315 Native TDM Service Creation – Interface #1 (Radio/Cascading)

2 In the Slot/Group/Port field, select a radio interface, Radio Protection group, Multi-Carrier ABC group, or cascading interface.

Note
Some interfaces may not appear in the Slot/Group/Port field. Refer to Limitations on Available Endpoints for the possible reasons an interface will not appear. If there are no available interfaces, a message appears that no endpoint can be selected.
3 In the VC field, select the VC you want to classify to the endpoint (1-512).
4 Click Next. The Interface #2 page opens. In the Interface #2, configure the parameters of the trail's second endpoint.
Figure 316 Native TDM Service Creation – Interface #2 (Radio/Cascading)

5 Follow the instructions in Steps 2-3 to configure the second endpoint.
6 Click Next. The Trail Selection page opens.
Figure 317 Native TDM Service Creation – Trail Selection Page (Radio/Cascading)

7 In the Trail ID field, select a Trail ID (1-512) to identify the trail. Only unused Trail ID values appear in the selection box. The default value is the lowest unused Trail ID.
8 Optionally, in the Trail Description field, enter text to describe the trail.
9 Click Finish. The Selection Summary page opens, displaying the parameters you have configured.
Figure 318 Native TDM Service Creation – Selection Summary (Radio/Cascading)

10 To create the trail with the displayed parameters, click Submit. If you want to return to an earlier page and change the trail parameters, click Back.

Note
An invalid configuration error may occur in the event that another user utilized a resource that you selected, such as an interface or a Trail ID, between the time you selected the resource and the time you pressed Submit. If this occurs, you must go back and, if necessary, select alternative resources for the trail.
Editing TDM Trails
To edit an existing trail:
1 Select the trail in the Native TDM Services page (Figure 294)j.
2 Click Edit. The Native TDM Services – Edit page opens.
Figure 319 Native TDM Services – Edit Page

You can edit the following parameters:
- Trail Description - Optional. A text description of the trail.
- Admin Status - Select Up to enable the trail or Down to disable the trail. For protected trails, you can select Working Down or Protecting Down to disable only the working or only the protecting trail.
- Switch Command - Used for protected trails to initiate a manual switchover. Select from the following options:
- No Action - No manual switchover is initiated.
o Manual Switch - Initiates a manual switchover.
To implement the changes, click Apply, then Close.
To change the Admin Status of multiple trails:
1 Select the trails in the Native TDM Services table or select all the trails by selecting the check box in the top row.
2 In the Multiple Selection Operation section underneath the Native TDM Services table, select Service Admin Status - Up or Service Admin Status - Down and click Apply.
Figure 320 Native TDM Services Edit Page – Multiple Selection Operation

Deleting TDM Trails
To delete a trail, select the trail in the TDM Services table and click Delete. The Admin status of the trail must be Down in order to delete the trail.
To delete multiple trails:
1 Select the trails in the TDM Services table or select all the trails by selecting the check box in the top row.
2 Click Delete underneath the TDM Services table.
Limitations on Available Endpoints
A group or interface will not appear in the Slot/Group/Port field if any of the following conditions exist:
• For the E1/DS1 interface, the E1/DS1s have all already been assigned to other trails.
- For a radio interface or group, all VCs have already been assigned to other trails.
• For a TDM interface, there is no available TDM trail ID.
• For a TDM interface, there are no available TDM resources.
- After opening the TDM Services Creation page, but before selecting an interface or group, the last available Service ID or Trail ID was configured by another user, or the maximum amount of trails (256) was reached for the unit.
The following additional condition applies if you are in the Interface #2 screen:
For E1/DS1, an E1/DS1 has already been selected as the first interface.
Configuring TDM Pseudowire Services
This section includes:
• TDM Pseudowire Services Configuration Overview
• General Guidelines for Provisioning TDM Pseudowire Services
• Viewing TDM Pseudowire Services
- Configuring the Revertive Timer
• Adding TDM Pseudowire Services
• Editing TDM Pseudowire Services
• Deleting TDM Pseudowire Services
• Limitations on Available Endpoints
TDM Pseudowire Services Configuration Overview

Note
By default, the TDM interfaces in a PTP 820G or PTP 820F unit are set to operate according to the ETSI standard, in E1 mode. For instructions on configuring the system to operate according to the ANSI (FCC) standard (DS1), see TDM Overview (CLI).
The PTP 820G Web EMS provides a simple and easy-to-use GUI that enables users to provision end-to-end TDM pseudowire services.
To open the TDM PseudoWire Services page:
1 Select TDM > TDM PseudoWire > Services. The TDM PseudoWire Services page opens.
Figure 321 TDM PseudoWire Services Page

The TDM PseudoWire Services page displays all pseudowire services configured on the unit and provides a simple and efficient workflow for adding pseudowire services. The following interfaces can be used as service endpoints:
- TDM interfaces
- Radio interfaces
- Cascading interfaces
- Ethernet interfaces
TDM endpoints can be E1/DS1s.
Radio endpoints can be selected from the radio interfaces, a Radio Protection Group, or a Multi-Carrier ABC Group.
Cascading interfaces can be configured on ports GbE1/CS1 and GbE2/CS2. When operating in cascading mode, these interfaces can handle hybrid Ethernet and Native TDM traffic, enabling operators to create links among multiple PTP 820 units in a node for multi-directional applications based on hybrid Ethernet and Native or pseudowire TDM services. For instructions, see Configuring Cascading Interfaces (Optional).
Ethernet interfaces can be any of the unit's Ethernet interfaces. LAGs can also be used.
General Guidelines for Provisioning TDM Pseudowire Services
When provisioning TDM pseudowire services, it is recommended to follow these guidelines:
- Each service within the same local region should use a unique EC ID. The EC ID should also be unique along the path of each service.
- For protected services, the EC ID of the protecting service must be different from the EC ID of the working service.
- At one of the two endpoint devices, the Local MEP parameter should be set to 1 while, at the far-end endpoint device, the Local MEP parameter should be set to 2.
Viewing TDM Pseudowire Services
The TDM PseudoWire Services page (Figure 294) displays the pseudowire services configured on the unit and their basic parameters.

Note
To filter the list of pseudowire services according to slot or group, select the slot or group in the
Show services for field. Only services with an endpoint in the selected slot or group appear.
Table 95 lists and describes the parameters in the TDM PseudoWire Services page.
Table 103 TDM Pseudowire Service Parameters
| Parameter Definition | |
| EC ID | A unique ID for the service. |
| Description A text description of the service. | |
| Interface #1: Slot/Group | Slot 1 or the group number of the first endpoint in the service. |
| Interface #1: Port | The port number of the first endpoint in the service. |
| Interface #1: VC/VLAN | For Ethernet, radio, and cascading interfaces – The VLAN classified to the first endpoint of the service (1-4094).For E1/DS1 interfaces – Not relevant (N/A). |
| Interface #2: Slot/Group | Slot 1 or the group number of the second endpoint in the service. |
| Interface #2: Slot/Group | The slot or group number of the second endpoint in the service. |
| Interface #2: Port | The port number of the second endpoint in the service. |
| Interface #2: VC/VLAN | For Ethernet, radio, and cascading interfaces – The VLAN classified to the second endpoint of the service (1-4094).For E1/DS1 interfaces – Not relevant (N/A). |
| Protecting Interface: Slot/Group | For protected services, Slot 1 or the group number of the protecting service endpoint. |
| Protecting Interface: Port | For protected services, the port number of the protecting service endpoint. |
| Protecting Interface: VC/VLAN | For protected services:For Ethernet, radio, and cascading interfaces – The VLAN classified to the protecting endpoint (1-4094).For E1/DS1 interfaces – Not relevant (N/A). |
| PseudoWire Service Status: Admin | The administrative status of the service. |
| PseudoWire Service Status: Operational | The operational status of the service. |
Configuring the Revertive Timer
1:1 pseudowire path protection can be configured to operate in revertive mode. In revertive mode, the system monitors the availability of the protected path at all times. After switchover to the protecting path, once the protected path is operational and available without any alarms, the system waits for the duration of the user-configured Wait to Restore (WTR) time and then, if the protected path remains operational and available, initiates a revertive protection switch. A single WTR time is configured for all the pseudowire services in the system. However, services with 1:1 path protection can be configured individually as revertive or non-revertive.

Note
Pseudowire services with 1:1 path protection that were configured using software versions prior to T7.9 are non-revertive.
To set the WTR time for services with revertive 1:1 path protection:
1 Underneath the TDM PseudoWire Services table, click Timer Configuration. The TDM Service Revertive Timer Configuration page opens.
Figure 322 TDM Service Revertive Timer Configuration Page

2 Enter the number, in seconds, for the WTR time. The default value is 10 seconds.
3 Click Apply, then Close.
Adding TDM Pseudowire Services
To initiate the workflow for adding a pseudowire service:
1 Select TDM > TDM PseudoWire > Services. The TDM PseudoWire Services page opens (Figure 308).
2 Click Create Service. The Add Pseudowire TDM Service workflow begins. The workflow and options provided by the TDM PseudoWire Services Creation page depends on the selection you make in the Slot/Group/Port field. For detailed instructions per service type, see:
○ Adding a Service between a TDM Port or Protection Group and a Radio Port, a Radio Group, or an Ethernet or Cascading Interface
○ Adding a Service between Radio Ports, Radio Groups, or Ethernet or Cascading Interfaces
You cannot add a pseudowire service if any of the following conditions exist:
• There are no available pseudowire services.
There are no available Service IDs in the range reserved for TDM services (801-928), or
The maximum number of services (256) has already been configured on the PTP 820G or PTP 820F unit.
Adding a Service between a TDM Port or Protection Group and a Radio Port, a Radio Group, or an Ethernet or Cascading Interface
1 In the Interface #1 screen of the TDM PseudoWire Services Creation page, configure the parameters of the service's first endpoint.
2 In the Slot/Group/Port field, select a TDM interface, a radio interface or group, an Ethernet interface, or a cascading interface.
Configuring a TDM Card or Group as an Endpoint
i Select the E1/DS1 interface.
Figure 323: Pseudowire Service Creation – Interface #1 E1/DS1


Note
Some interfaces may not appear in the Slot/Group/Port field. Refer to Limitations on Available Endpoints for the possible reasons an interface will not appear. If there are no available interfaces, a message appears that no endpoint can be selected.
ii In the E1/DS1 field, select an E1/DS1 or VC12. This configures the first endpoint for the service.

Note
Only E1/DS1s that are not already assigned to a pseudowire service appear in the selection box. Also, an E1/DS1 will not appear in the selection box if the TDM interface has already been assigned a service point with a classification and a slot and port or group number that match the classification that would automatically be assigned to the E1/DS1 via the TDM PseudoWire Service Creation page.
iii In the Profile field, select a pseudowire profile for the endpoint. You can select a predefined profile (Profile 1 or Profile 2), or you can configure additional profiles and select one of these profiles. See Configuring Pseudowire Profiles.
iv In the Timing field, select the synchronization mode for the endpoint. Options are:
- Loop Timing – The interface takes the timing from incoming signals.
- Recovered – Clock information is recovered on the egress path. Extra information may be located in an RTP header that can be used to correct frequency offsets.
- System Reference – The interface is synchronized to the system reference clock.
- Front Panel – The interface is synchronized to an external clock reference from a dedicated front panel clock interface.
Configuring a Radio Port or Group or an Ethernet or Cascading Interface as an Endpoint
In the Interface #1 screen of the TDM PseudoWire Services Creation page, configure the parameters of the service's first endpoint.
Figure 324 Pseudowire Service Creation – Interface #1 Radio/Ethernet/Cascading
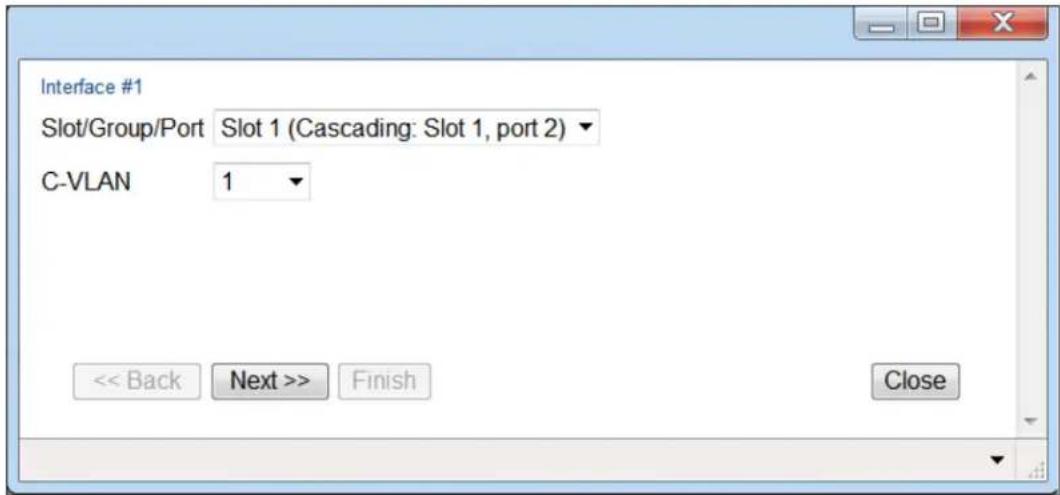

Note
Some interfaces may not appear in the Slot/Group/Port field. Refer to Limitations on Available Endpoints for the possible reasons an interface will not appear. If there are no available interfaces, a message appears that no endpoint can be selected.
ii In the VLAN Type field, select the VLAN Type for the first endpoint. The VLAN Type determines which frames enter the service via this endpoint, based on the frame's VLAN tagging. Options are:
o S-TAG – A single S-VLAN is classified to the service point.
○ C-TAG - A single C-VLAN is classified to the service point.
iii In the S-VLAN or C-VLAN field, select the VLAN you want to classify to the endpoint (1-4090).
3 Click Next. The Interface #2 page opens. In the Interface #2 page, configure the parameters of the service's second endpoint:
If the first endpoint is a TDM interface, select a radio interface, a Radio Protection group, a Multi-Carrier ABC group, or an Ethernet or cascading interface in the Interface #2 page.
If the first endpoint is a radio interface, a Radio Protection group, a Multi-Carrier ABC group, or an Ethernet or cascading interface, select a TDM interface in the Interface #2 page.
4 Follow the instructions in Step 2 to configure the second endpoint.
5 Click Next. The EC ID Selection page opens.
Figure 325 Pseudowire Service Creation – EC ID Selection Page (Radio/Ethernet/Cascading - TDM)

6 In the EC ID field, select an EC ID (1-512) to identify the service. Only unused EC ID values appear in the selection box. The default value is the lowest unused EC ID.
7 In the P-bit field, select a p-bit value (0-7). This value will be assigned to frames passing through the service.
8 Optionally, in the Description field, enter text to describe the service.

Note
The Service Type and Tunnel Type fields are read-only. In this version, only SAToP/Ethernet pseudowire services are supported.
9 In the Protection field, select one of the following:
- Unprotected - The service will not have path protection.
☐ 1:1 Protection (non-revertive) – The service will have 1:1 path protection in which two separate network paths are defined for the service. Each service has the same TDM interface endpoints, but traffic flows to the destination via different radio, Ethernet, or cascading interfaces. Bandwidth is utilized only on the active path, freeing up resources on the standby path.
When you click Next, you will be asked to configure an additional radio interface or group, or Ethernet or cascading interface, as the protecting interface.
1:1 Protection (revertive) – The service will have 1:1 path protection, as described above, in revertive mode. See Configuring the Revertive Timer.
☐ 1+1 Protection – Used for networks in which the PTP 820G or PTP 820F network elements are set up as a chain connected to third party networks at two different sites, where one end-point is located on a PTP 820G or PTP 820F unit and the other end-point is located on third-party equipment supporting SNCP. The service will have 1+1 path protection in which two separate network paths are defined for the service. Each path has the same TDM interface endpoints, but traffic flows to the destination via different radio, Ethernet, or cascading interfaces. Unlike 1:1 path protection, traffic flows through both paths simultaneously, thereby supporting SNCP in third party equipment at the other end of the link. When you click Next, you will be asked to configure an additional radio interface or group, or Ethernet or cascading interface as the protecting interface.
1+1 Dual Homing Network Edge – Used for PTP 820G or PTP 820F units located at the network edge in a 1+1 Protection configuration. Since the node itself is part of the protected or protecting path, the node itself is essentially unprotected and you do not need to configure a separate protecting path. When you click Next, you will be asked to configure a Working Path ID.

Note
In a 1+1 Protection configuration, the third-party equipment usually detects problems in the link via E1/DS1 AIS signals. If the third party equipment does not support the ability to read E1/DS1 AIS signals, it must be configured to perform switchover upon receiving an UNEQUIPPED indication in the signal label bits in the overhead.
10 In the Local MEP field, select 1 or 2. If you select 1, the Local MEP field in the network element at the other side of the link must be configured as 2, and vice versa.
If you selected Unprotected in the Protection field, click Finish. The Selection Summary page opens (Figure 315).
If you selected 1:1 Protection (revertive or non-revertive) or 1+1 Protection in the Protection field, click Next. The Protecting Interface Selection page opens.
Figure 326 Pseudowire Service Creation – Protecting Interface Selection Page

If you selected 1+1 Dual Homing Network Edge in the Protection field, click Next. The Working EC ID Selection page opens. Skip steps 11 through 13 and proceed to Step 14.
Figure 327 Pseudowire Service Creation – Working EC ID Selection Page

11 In the Slot/Group/Port field, In the Slot/Group/Port field, select a radio interface, Radio Protection group, Multi-Carrier ABC group, or cascading interface to serve as the interface for the protecting path.

Note
Some interfaces may not appear in the Slot/Group/Port field. Refer to Limitations on Available Endpoints for the possible reasons an interface will not appear. If there are no available interfaces, a message appears that no endpoint can be selected.
12 In the VLAN Type field, select the VLAN Type for the protecting path endpoint. The VLAN Type determines which frames enter the service via this endpoint, based on the frame's VLAN tagging. Options are:
- S-TAG – A single S-VLAN is classified to the service point.
○ C-TAG — A single C-VLAN is classified to the service point.
13 In the S-VLAN or C-VLAN field, select the VLAN you want to classify to the endpoint (1-4090).
14 In the Protecting EC ID or Working EC ID field, select an EC ID (1-512) to identify the protecting or working path. Only unused EC ID values appear in the selection box. The default value is the lowest unused EC ID. All nodes in the protected configuration, both on the protected and the protecting path, must have the same Protecting EC ID or Working EC ID.
15 Click Finish. The Selection Summary page opens, displaying the parameters you have configured.
Figure 328 Pseudowire Service Creation – Selection Summary Page (Radio/Ethernet/Cascading - TDM)

16 To create the service with the displayed parameters, click Submit. If you want to return to an earlier page and change the service parameters, click Back.

Note
An invalid configuration error may occur in the event that another user utilized a resource that you selected, such as an interface or a EC ID, between the time you selected the resource and the time you pressed Submit. If this occurs, you must go back and, if necessary, select alternative resources for the service.
Adding a Service between Radio Ports, Radio Groups, or Ethernet or Cascading Interfaces
1 In the Interface #1 screen of the TDM PseudoWire Services Creation page, configure the parameters of the service's first endpoint.
Figure 329 Pseudowire Service Creation – Interface #1 (Radio/Ethernet/Cascading)

2 In the Slot/Group/Port field, select a radio interface, Radio Protection group, Multi-Carrier ABC group, or cascading interface.

Note
Some interfaces may not appear in the Slot/Group/Port field. Refer to Limitations on Available Endpoints for the possible reasons an interface will not appear. If there are no available interfaces, a message appears that no endpoint can be selected.
3 In the VLAN Type field, select the VLAN Type for the first endpoint. The VLAN Type determines which frames enter the service via this endpoint, based on the frame's VLAN tagging. Options are:
- S-TAG – A single S-VLAN is classified to the service point.
○ C-TAG — A single C-VLAN is classified to the service point.
4 In the S-VLAN or C-VLAN field, select the VLAN you want to classify to the endpoint (1-4090).
5 Click Next. The Interface #2 page opens. In the Interface #2, configure the parameters of the service's second endpoint.
Figure 330 Pseudowire Service Creation – Interface #2 (Radio/Cascading)

6 Follow the instructions in Steps 2-4 to configure the second endpoint.
7 Click Next. The EC ID page opens.
Figure 331 Pseudowire Service Creation – Service Selection Page (Radio/Ethernet/Cascading)
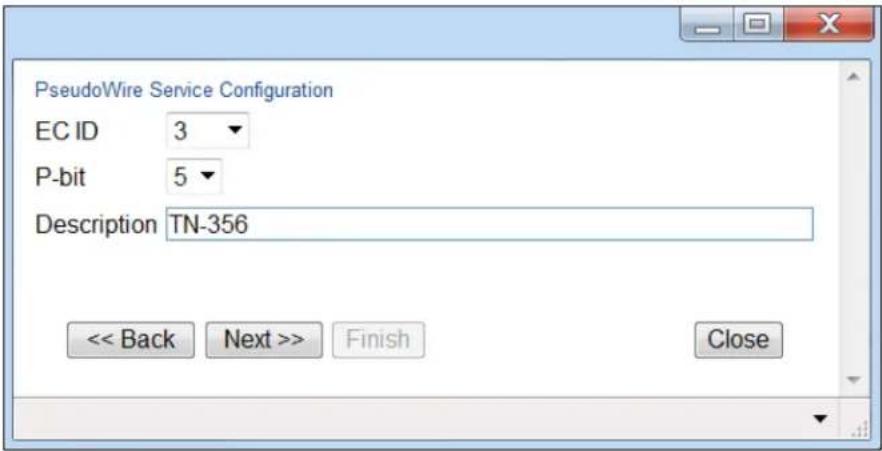
8 Select an EC ID (1-512) to identify the service. Only unused EC ID values appear in the EC ID selection box. The default value is the lowest unused EC ID.
9 In the P-bit field, select a p-bit value (0-7). This value will be assigned to frames passing through the service.
10 Optionally, in the Description field, enter text to describe the service.
11 Click Finish. The Selection Summary page opens, displaying the parameters you have configured.
Figure 332 Pseudowire Service Creation – Selection Summary (Radio/Ethernet/Cascading)

12 To create the service with the displayed parameters, click Submit. If you want to return to an earlier page and change the service parameters, click Back.

Note
An invalid configuration error may occur in the event that another user utilized a resource that you selected, such as an interface or a EC ID, between the time you selected the resource and the time you pressed Submit. If this occurs, you must go back and, if necessary, select alternative resources for the service.
Editing TDM Pseudowire Services
To edit an existing service:
1 Select the service in the TDM PseudoWire Services page (Figure 308).
2 Click Edit. The TDM PseudoWire Services – Edit page opens.
Figure 333 TDM PseudoWire Services – Edit Page

You can edit the following parameters:
• Description - Optional. A text description of the service.
- Admin Status - Select Up to enable the service or Down to disable the service. For protected service, you can select Working Down or Protecting Down to disable only the working or only the protecting path.
- Switch Command - Used for protected services to initiate a manual switchover. Select from the following options:
- No Action - No manual switchover is initiated.
o Manual Switch - Initiates a manual switchover.
To implement the changes, click Apply, then Close.
To change the Admin Status of multiple services:
1 Select the services in the TDM PseudoWire Services table or select all the services by selecting the check box in the top row.
2 In the Multiple Selection Operation section underneath the TDM PseudoWire Services table, select Service Admin Status - Up or Service Admin Status - Down and click Apply.
Figure 334 Pseudowire Services Edit Page – Multiple Selection Operation

Deleting TDM Pseudowire Services
To delete a service, select the service in the TDM PseudoWire Services table and click Delete. The Admin status of the service must be Down in order to delete the service.
To delete multiple services:
1 Select the services in the TDM PseudoWire Services table or select all the services by selecting the check box in the top row.
2 Click Delete underneath the TDM PseudoWire Services table.
Limitations on Available Endpoints
A slot, group, or interface will not appear in the Slot/Group/Port field if any of the following conditions exist:
• An SAP service point has been configured on the interface.
• For the E1/DS1 interface, the E1/DS1s have all already been assigned to other services.
• For a radio interface or group, all VCs have already been assigned to other services.
• For a TDM interface, there is no available TDM service ID.
• For TDM interface, there are no available TDM resources.
- After opening the TDM Services Creation page, but before selecting a slot or group, the last available Service ID was configured by another user, or the maximum amount of services (256) was reached for the unit.
The following additional condition applies if you are in the Interface #2 screen:
- For E1/DS1, an E1/DS1 has already been selected as the first interface.
Configuring Advanced Pseudowire Parameters
To configure pseudowire services, it is recommended to use the TDM Pseudowire Services page, which provides a step-by-step workflow based on pre-configured pseudowire settings. See Configuring TDM Pseudowire Services.
To manually configure the pseudowire parameters and services, follow the instructions in this section to configure the parameters located in the TDM > TDM PseudoWire > Advanced section of the Web EMS.
This section includes:
- Configuring Pseudowire Card Parameters
- Configuring OEM for Pseudowire Services
- Configuring Pseudowire Tunnels and Tunnel Groups
- Configuring Pseudowire Profiles
- Configuring Pseudowire TDM Services Manually

Note
The DSO Bundles page is reserved for future use.
Configuring Pseudowire Card Parameters
To configure the pseudowire parameters of the E1/DS1 interface:
1 Select TDM > TDM PseudoWire > Advanced > Configuration. The PseudoWire Card Configuration page opens.
Figure 335 PseudoWire Card Configuration Page
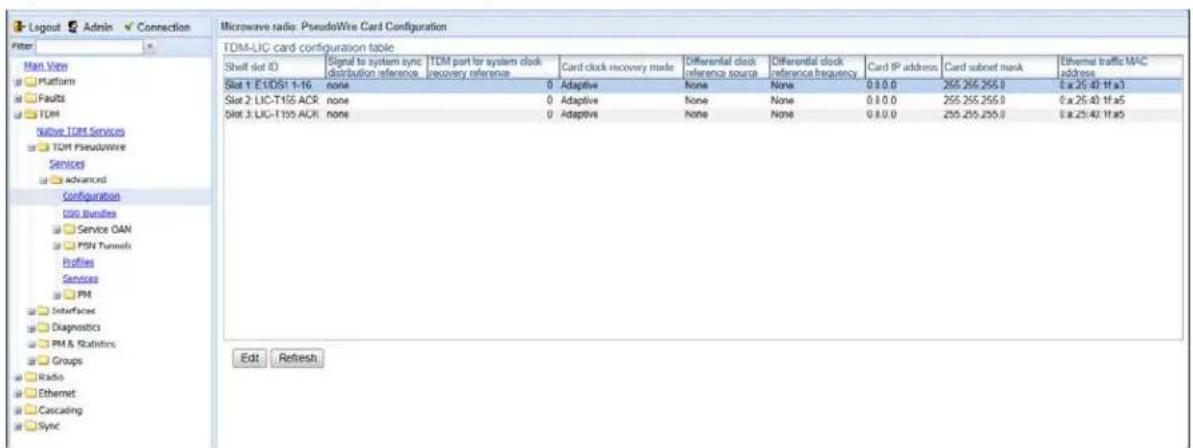
2 Select the E1/DS1 interface and click Edit. The PseudoWire Card Configuration – Edit page opens.
Figure 336 PseudoWire Card Configuration – Edit Page

3 Configure the parameters, as described in Table 97.
Table 104 Pseudowire Card Configuration Parameters
| Parameter Definition | |
| Shelf Slot ID | Read-only. Slot 1. |
| Ethernet Traffic MAC Address | Displays the E1/DS1 connector's MAC address, which is unique per unit.This means if the E1/DS1 connector is replaced, the MAC address remains the same, and no configuration changes are required. |
| Signal to System Sync Distribution Reference | Select the clock source that the TDM interface exports to the general PTP 820G or PTP 820F synchronization mechanism. Options are:None – No clock source is exported from the TDM interface to the general PTP 820G synchronization mechanism.Front Panel – Reserved for future use.Clock Recovery – Reserved for future use.clock-1588 – Reserved for future use.rx-pdh – Reserved for future use.rx-sdh – Reserved for future use. |
| TDM Port for System Clock Recovery Reference | Reserved for future use. |
| Card Clock Recovery Mode | Reserved for future use. |
Parameter Definition
| Differential Clock Reference Source | Reserved for future use. |
| Differential Clock Reference Frequency | Reserved for future use. |
| Card IP Address Reserved for future use. | |
| Card Subnet Mask Reserved for future use. | |
Configuring OEM for Pseudowire Services
In order to configure a TDM service with path protection, you must first assign a Maintenance Domain (MD) to the E1/DS1 interface. You must then configure Maintenance Associations (MAs), which are assigned to the tunnels that constitute the tunnel group in the protected service.
You can configure up to eight MDs per card.

Note
Pseudowire Loopback and Link Trace are planned for future release.
Configuring Pseudowire Maintenance Domains (MDs)
To view all the MDs configured for a TDM card:
1 Select TDM > TDM PseudoWire > Advanced > Service OAM > Maintenance Domain. The Service OAM Maintenance Domain page opens. Table 98 describes the MD parameters.
Figure 337 Service OAM Maintenance Domain Page

Table 105 Pseudowire Maintenance Domain Parameters
| Parameter Definition | |
| Maintenance Domain ID | A unique ID that identifies the MD. |
| Maintenance Domain Name | A name for the MD, for information purposes. |
| Level | The maintenance level of the MD. The maintenance level ensures that the CFM frames for each domain do not interfere with each other. Where domains are nested, the encompassing domain must have a higher level than the domain it encloses. The maintenance level is carried in all CFM frames that relate to that domain. |
To add an MD:
1 In the Select a slot field, select the TDM card to which you want to add the MD.
2 Click Add. The Service OAM Maintenance Domain – Add page opens.
Figure 338 Service OAM Maintenance Domain – Add Page

3 In the Maintenance Domain ID field, select a unique ID from 1 to 8 to identify the MD.
4 Optionally, in the Maintenance Domain Name field, enter a name for the MD, for information purposes.
5 In the Level field, select a maintenance level for the MD, from 0 to 7. The maintenance level ensures that the CFM frames for each domain do not interfere with each other. Where domains are nested, the encompassing domain must have a higher level than the domain it encloses. The maintenance level is carried in all CFM frames that relate to that domain.
6 Click Apply, then Close.
To edit an MD:
1 In the Select a slot field, select the TDM card to which the MD you want to edit belongs.
2 Click Edit. The Service OAM Maintenance Domain – Edit page opens. You can edit any of the MD parameters you can configure when you add an MD except the Maintenance Domain ID field.
3 Edit the MD parameters, as described above.
4 Click Apply, then Close.
To delete an MD:
1 In the Select a slot field, select the TDM card to which the MD you want to delete belongs.
2 Click Delete. The MD is deleted.

Note
You cannot delete an MD for which MAs have been configured. See Configuring Pseudowire Maintenance Associations (MAs).
Configuring Pseudowire Maintenance Associations (MAs)
Maintenance Associations (MAs) define Maintenance End Points (MEPs), and perform continuity checks by sending Continuity Check Messages (CCMs) between the MEPs. This is the mechanism by which PTP 820G or PTP 820F monitors the status of both paths in a protected TDM service and determines when a switchover is necessary.
For PTP 820F and PTP 820G, You can configure up to 32 MAs per unit.
Each of the two TDM tunnels that make up a path-protected TDM service must be assigned its own MA. Each MA must have a unique local MEP ID and a unique remote MEP ID. Each MA must also include a defined VLAN, which corresponds to the VLAN that will be assigned to the TDM tunnel associated with the MA.
To view all the MAs configured for a TDM card:
1 Select TDM > TDM PseudoWire > Advanced > Service OAM > Maintenance Association. The Service OAM Maintenance Association page opens. Table 99 describes the MA parameters.
Figure 339 Service OAM Maintenance Association Page
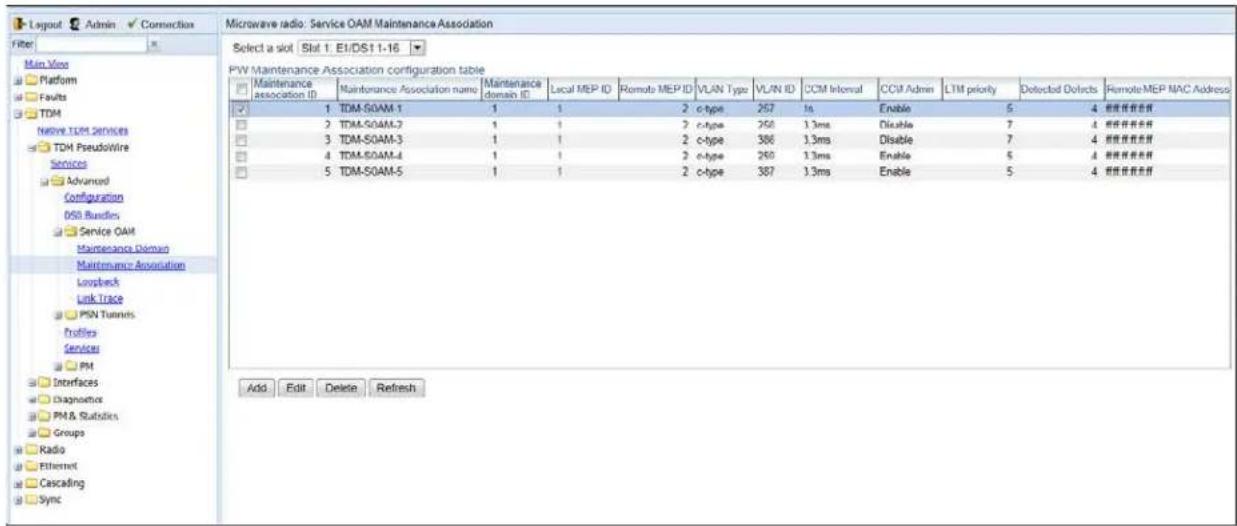
Table 106 Pseudowire Maintenance Association Parameters
| Parameter Definition | |
| Maintenance Association ID | A unique ID that identifies the MA. |
| Maintenance Association Name | A name for the MA, for information purposes. |
| Maintenance Domain ID | The MD to which the MA belongs. |
| Local MEP ID | A unique ID for the local MEP. |
| Remote MEP ID | A unique ID for the remote MEP. |
| VLAN Type | The outer VLAN type assigned to the tunnel to which the MA will be attached. This should be the same as the VLAN Type for the service being monitored. |
| VLAN ID | The VLAN assigned to the tunnel to which the MA will be attached. |
| CCM Interval | The interval (in ms) at which the MA sends CCM messages. |
| CCM Admin | Displays whether or not CCM messages are enabled for the MA. CCM must be enabled in order for the MA to serve its purpose as the monitoring mechanism for TDM path protection. |
Parameter Definition
| LTM Priority | The link trace message priority assigned to the MA (0 - 7). |
| Detected Defects | A bitmask that indicates several possible problems with the link:0: no-alarm1: RDI2: MAC-status4: remote CCM8: error CCM16: Cross-connection CCM32: AISThe number that appears indicates the sum of the defects. For example, the number 7 indicates that RDI, MAC-status, and remote CCM defects have been detected in the link. |
| Remote MEP MAC Address | The MAC address of the remote MEP. |
To add an MD:
1 In the Select a slot field, select the TDM card to which you want to add the MA.
2 Click Add. The Service OAM Maintenance Association – Add page opens.
Figure 340 Service OAM Maintenance Association – Add Page

3 In the Maintenance Association ID field, select a unique ID to identify the MA.
4 Optionally, in the Maintenance Association Name field, enter a name for the MA, for information purposes.
5 In the Maintenance Domain ID field, select an MD to which the MA belongs.
6 In the Local MEP ID field, select a unique ID for the local MEP.
7 In the Remote MEP ID field, select a unique ID for the remote MEP.
8 In the VLAN Type field, select the outer VLAN type assigned to the tunnel to which the MA will be attached. Options are:
○ None
○ C-type
○ S-type
This should be the same as the VLAN Type for the service being monitored.
9 In the VLAN ID field, select the VLAN assigned to the tunnel to which the MA will be attached. This should be the same as the VLAN of the service being monitored.
10 In the CCM Interval field, select the interval (in ms) at which the MA sends CCM messages. Options are:
○ 3.3 ms
○ 10 ms
○ 100 ms
○ 1 second
- 10 seconds
○ 1 minutes
- 10 minutes
11 In the CCM Admin field, select Enable to enable the MA to send CCM messages. CCM must be enabled in order for the MA to serve its purpose as the monitoring mechanism for TDM path protection.
12 In the LTM Priority field, select a link trace message priority for the MA (0 - 7).
13 Click Apply, then Close.
To edit an MA:
1 In the Select a slot field, select the TDM card to which the MA you want to edit belongs.
2 Click Edit. The Service OAM Maintenance Association – Edit page opens. You can edit any of the MA parameters that you can configure when adding an MA except the Maintenance Association ID field.
3 Edit the MA parameters, as described above.
4 Click Apply, then Close.
To delete an MA:
1 In the Select a slot field, select the TDM card to which the MA you want to delete belongs.
2 Click Delete. The MA is deleted.

Note
You cannot delete an MA that is assigned to a tunnel. See Configuring Pseudowire Tunnels and Tunnel Groups.
Configuring Pseudowire Tunnels and Tunnel Groups
Each TDM service must include an encapsulation tunnel to determine how traffic over the service passes through the network. In this version, encapsulation must use the MEF-8 protocol.
For PTP 820G and PTP 820F, You can configure up to 32 tunnels per unit.

Note
UDP/IP and MPLS support are planned for future release.
To configure TDM services with path protection, you must configure two tunnels for each protected service and combine these tunnels into a tunnel group. For more information, see Configuring a Tunnel Group.
Configuring a Tunnel
This section includes:
- Viewing Tunnels
- Adding a Tunnel
-
Editing a Tunnel
-
Viewing a Tunnel's Operational Status and Attributes
- Deleting a Tunnel
Viewing Tunnels
To view all the tunnels configured for the unit:
1 Select TDM > TDM PseudoWire > Advanced > PSN Tunnels > PSN Tunnels. The PseudoWire PSN Tunnels page opens. Table 100 describes the tunnel parameters.
Figure 341 Pseudowire PSN Tunnels Page

Table 107 Pseudowire PSN Tunnels Parameters
| Parameter Definition | |
| Tunnel ID | A unique ID that identifies the tunnel. |
| Tunnel Admin | Displays the administrative state of the tunnel (Enabled or Disabled). |
| Tunnel Type | Displays the tunnel's encapsulation type. In this release, only Ethernet Layer 2 MEF-8 encapsulation (Eth) is available. |
| Destination MAC Address | The MAC address of the interface or card at the other site of the link. This is only relevant for Ethernet (MEF-8) tunnels. |
| VLAN Type | Displays the outer VLAN type used by the tunnel. Options are:NoneC-typeS-type |
| VLAN ID | Displays the VLAN ID assigned to frames passing through the tunnel. |
| Tunnel P-bits | Displays the p-bit value assigned to frames passing through the tunnel. |
Parameter Definition
Maintenance Association ID
Displays the Maintenance Association (MA) ID assigned to the tunnel. This is only relevant for tunnels that are used in TDM services with path protection. For more information, see Configuring a Tunnel Group.
Adding a Tunnel
To add a tunnel:
1 Click Add. The PseudoWire PSN Tunnels – Add page opens.
Figure 342 PseudoWire PSN Tunnels—Add Page

2 In the Tunnel ID field, enter a unique ID, from 1 to 16, to identify the tunnel.
3 In the Tunnel Admin field, select Enable to enable the tunnel, or Disable if you want to add the tunnel but enable it at a later time.
4 In the Tunnel Type field, select the tunnel's encapsulation type. In this release, only Ethernet Layer 2 MEF-8 encapsulation (Eth) is available.
5 In the Destination MAC Address field, for Ethernet (MEF-8) tunnels, enter the MAC address of the card at the other site of the link.
6 In the VLAN Type field, select the outer VLAN type used by the tunnel. Options are:
○ None
○ C-type
○ S-type
7 In the VLAN ID field, enter a VLAN ID (1-4090). This value will be assigned to frames passing through the tunnel.
8 In the PSN Tunnel P-bits field, enter a p-bit value. This value will be assigned to frames passing through the tunnel.
9 In the Maintenance Association ID field, you must select a Maintenance Association (MA) if you plan to use the tunnel for path-protected services. This MA is assigned to the tunnel, defines Maintenance End Points (MEPs), and performs continuity checks by sending Continuity Check Messages (CCMs) between the MEPs. This is the mechanism by which PTP 820G or PTP 820F monitors the status of both paths in a protected TDM service and determines when a switchover is necessary.
You must define the MA separately in order to assign it to a tunnel. For instructions, see Configuring OEM for Pseudowire Services. For more information about defining TDM path protection generally, see Configuring a Tunnel Group.
10 Click Apply, then Close.
Editing a Tunnel
To edit a tunnel:
1 Select the tunnel you want to edit.
2 Click Edit. The PseudoWire PSN Tunnels – Edit page opens. You can edit any of the tunnel parameters you can configure when you add a tunnel except the Tunnel ID field.
3 Edit the tunnel parameters, as described above.
4 Click Apply, then Close.
Viewing a Tunnel's Operational Status and Attributes
To view a tunnel's operational status and attributes:
1 Select the tunnel you want to view.
2 Click Tunnel Status. The PseudoWire PSN Tunnels – Status page opens. Table 101 describes the tunnel status parameters.
Figure 343 PseudoWire PSN Tunnels- Status Page

Table 108 Pseudowire Tunnel Status Parameters
| Parameter Definition | |
| Slot ID Slot 1. | |
| Tunnel ID | A unique ID that identifies the tunnel. Once you have added the tunnel, you cannot change the Tunnel ID. |
| Tunnel operational state | Displays the current operational state of the tunnel (Up or Down). |
| Tunnel source IP address Reserved for future use. | |
| Tunnel source MAC address The source MAC address for the tunnel. | |
| Remote MAC address | The MAC address of the interface or card at the other site of the link. This is only relevant for Ethernet (MEF-8) tunnels. |
Deleting a Tunnel
To delete a tunnel:
1 Select the tunnel you want to delete.
2 Click Delete. The tunnel is deleted.

Note
You cannot delete a tunnel that is assigned to a tunnel group or a pseudowire TDM service.
Configuring a Tunnel Group
This section includes:
• TDM Pseudowire Path Protection Overview
• Viewing Tunnel Groups
- Configuring the Revertive Timer
- Adding a Tunnel Group
• Editing a Tunnel Group
- Deleting a Tunnel Group
TDM Pseudowire Path Protection Overview
TDM pseudowire path protection enables you to define two separate network paths for a single TDM pseudowire service. Each path has the same destination address, but traffic flows to the destination via different paths.
TDM pseudowire path protection requires the use of SOAM (CFM) at both end-points. The TDM interface sends two data streams to the COY. Only the data stream for the active path contains actual traffic. Both data streams contain continuity messages (CCMs). This enables the TDM interface to monitor the status of both paths without doubling the amount of data being sent over the network. The TDM interface determines when a switchover is necessary based on the monitored network status.
In order to achieve path protection, different provisioning should be made for the Ethernet service corresponding to each of the two data streams. In order to do this, it is recommended to map the corresponding Ethernet services to MSTP instance number 63, which is meant for Traffic Engineering (ports are always forwarding) and to map the two different transport VLANs over two different paths.
TDM path protection uses CFM to monitor the network paths. Because SOAM (CFM) is configured on the TDM interface level, the TDM interface can determine the status of the entire network path, up to and including the interface itself.
To configure a TDM service with path protection, you must perform the following steps:
- Configure a Maintenance Domain – see Configuring Pseudowire Maintenance Domains (MDs)
- Configure Maintenance Associations (MAs) – see Configuring Pseudowire Maintenance Associations (MAs)
- Configure PSN Tunnels and Assign to them MAs – see Configuring a Tunnel
- Configure a TDM Tunnel Group – see below
TDM pseudowire path protection is implemented by combining two TDM tunnels into a single tunnel group. One of the tunnels in the group is designated as the primary tunnel. The other tunnel is designated as the secondary tunnel. CCM messages are sent from the TDM interface to the CPU via both tunnels. However, only the primary tunnel sends actual traffic. The CPU monitors both paths using the CCM messages, and determines when to perform a switchover from the primary tunnel to the secondary tunnel.
Viewing Tunnel Groups
To view all the tunnel groups configured for the unit:
1 Select TDM > TDM PseudoWire > Advanced > PSN Tunnels > Tunnel Groups. The PseudoWire Tunnel Groups page opens.
Figure 344 Pseudowire Tunnel Groups Page

Table 109 Pseudowire Tunnel Group Parameters
| Parameter Definition | |
| Tunnel group ID | A unique ID that identifies the tunnel group. |
| Admin | Displays the administrative state of the tunnel group (Enabled or Disabled). |
| Primary Tunnel ID The primary tunnel. | |
| Secondary Tunnel ID | The secondary tunnel. |
| Revertive mode admin | Indicates whether revertive mode is enabled or disabled for the tunnel group. See Configuring the Revertive Timer. |
| Operational state | Displays the current operational state of the tunnel group (Up or Down). |
| Active Tunnel | Displays the ID of the tunnel that is currently in active mode. |
| Number of switches | Displays the number of protection switches that have taken place since the last system reset or creation of the group. |
| Revertive countdown | In the event that a switchover to the protecting path has taken place and revertive timer is enabled for the tunnel group, this column indicates the time remaining, in seconds, before reversion to the primary path will take place. See Configuring the Revertive Timer. |
Configuring the Revertive Timer
Path protection can be configured to operate in revertive mode. In revertive mode, the system monitors the availability of the protected path at all times. After switchover to the protecting path, once the active path is operational and available without any alarms, the system waits for the duration of the user-configured Wait to Restore (WTR) time and then, if the active path remains operational and available, initiates a revertive protection switch. A single WTR time is configured for all the TDM pseudowire services in the system. However, services with path protection can be configured individually as revertive or non-revertive. You can configure this when you configure the tunnel group, as explained below.

Note
TDM pseudowire services with 1:1 path protection that were configured using software versions prior to T7.9 are non-revertive.
To set the WTR time for TDM pseudowire services with revertive path protection:
1 In the Revertive Timer Configuration area at the top of the Pseudowire Tunnel Groups page (Figure 331), enter the number, in seconds, for the WTR time. The default value is 10 seconds.
2 Click Apply.
Adding a Tunnel Group
To add a tunnel group:
1 In the Select a slot field, select the TDM card to which you want to add the tunnel group.
2 Click Add. The PseudoWire Tunnel Groups – Add page opens.
Figure 345 PseudoWire Tunnel Groups – Add Page

3 In the Tunnel Group ID field, select a unique ID to identify the tunnel group.
4 In the Admin field, select Enable to enable the tunnel group, or Disable if you want to add the tunnel group but enable it at a later time.
5 In the Primary Tunnel ID field, enter the ID of the tunnel you want to assign as the primary tunnel.
6 In the Secondary Tunnel ID field, enter the ID of the tunnel you want to assign as the secondary tunnel.
7 In the Revertive mode admin field, select Enable or Disable to determine whether services using the tunnel group will use revertive mode. See Configuring the Revertive Timer.
8 Click Apply, then Close.
In the event that a switchover to the protecting path has taken place and revertive timer is enabled for the tunnel group, the Revertive Countdown field column displays the time remaining, in seconds, before reversion to the primary path will take place. See Configuring the Revertive Timer.
Editing a Tunnel Group
To edit a tunnel group:
1 Select the tunnel you want to edit.
2 Click Edit. The PseudoWire Tunnel Groups – Edit page opens. You can edit any of the tunnel group parameters you can configure when you add a tunnel except the Tunnel group ID field.
3 Edit the tunnel group parameters, as described above.
4 Click Apply, then Close.

Note
To edit the other parameters of a tunnel group, you must first set Admin to Disable and click Apply.
Deleting a Tunnel Group
To delete a tunnel group:
1 Select the tunnel you want to delete.
2 Click Delete. The tunnel group is deleted.

Note
You cannot delete a tunnel group that is assigned to a pseudowire TDM service.
Configuring Pseudowire Profiles
Each TDM service must include a TDM profile. The profile determines the behavior of the service, including the buffer, payload suppression, and other parameters. A profile can be used by multiple services.
You can configure up to 64 TDM profiles.
This section includes:
• Viewing a Pseudowire Profile
- Adding a Pseudowire Profile
• Editing a Pseudowire Profile
- Deleting a Pseudowire Profile
Viewing a Pseudowire Profile
To view all the pseudowire profiles configured for the unit:
1 Select TDM > TDM PseudoWire > Advanced > Profiles. The PseudoWire Profiles page opens.
Figure 346 PseudoWire Profiles Page
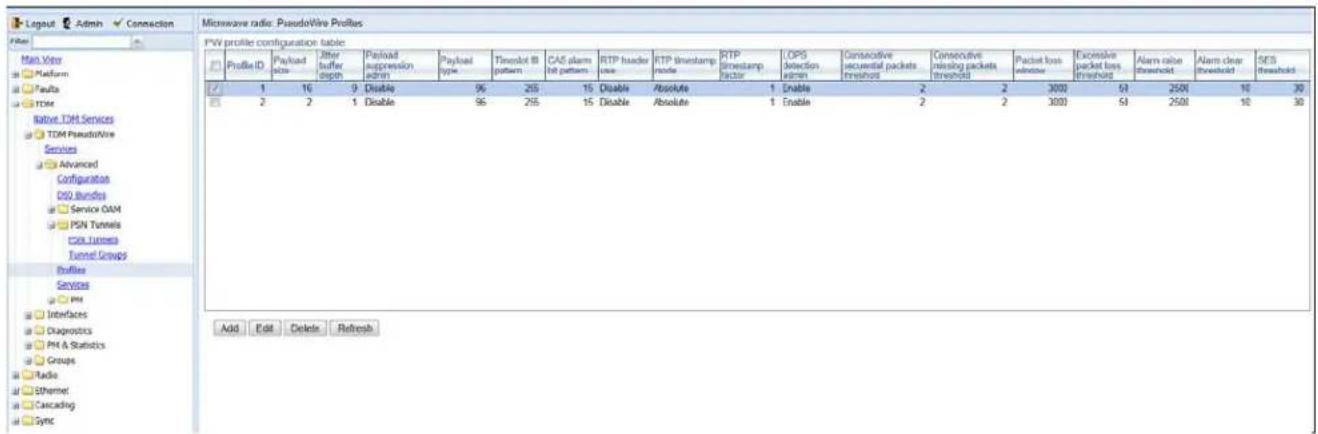
Table 103 describes the pseudowire profile parameters.
Table 110 Pseudowire Profile Parameters
| Parameter Definition | |
| Profile ID | Enter unique ID, from 1 to 64, that identifies the profile. Once you add the profile, you cannot edit this field. |
| Payload Size | Enter the number of times E1/DS1 should be sampled for each Ethernet packet. |
| Jitter Buffer Depth | Enter the desired jitter buffer depth (from 1 to 32, in milliseconds). This is used to enable the network to accommodate PSN-specific packet delay variation. The jitter buffer can be increased if the network experiences a higher-than-normal level of jitter. |
| Payload Suppression Admin | Select Enable or Disable to enable or disable payload suppression. When enabled, the payload is suppressed upon incoming TDM failure. |
| Payload Type | Enter a value between 96 and 127. This value is used to distinguish between signaling and data types. The default value is 96. |
| Timeslot Fill Pattern | Enter the byte pattern transmitted on DS0 channels when packets overflow or underflow the jitter buffer (from 0 to 255). |
| CAS Alarm Bit Pattern | Enter the CAS alarm pattern transmitted on the E1/DS1 interface when packets overflow or underflow the jitter buffer (from 0 to 15). |
| RTP Header Use | Reserved for future use. |
| RTP Timestamp Mode Reserved for future use. | |
| RTP Timestamp Factor Reserved for future use. | |
| LOPS Detection Admin | Select Enable or Disable to enable or disable loss of packet synchronization (LOPS) detection. The default value is Enable. |
| Consecutive Sequential Packets Threshold | Enter the number of consecutive packets with sequential sequence numbers required in order for the system to exit a loss of packet synchronization state (LOPS), from 1 to 10. The default value is 2. |
| Consecutive Missing Packets Threshold | Enter the number of consecutive missing packets required in order for the system to enter a loss of packet synchronization state (LOPS), from 1 to 15. The default value is 2. |
| Packet Loss Window | Enter the time period (in milliseconds) the system uses to compute the average packet loss rate in order to detect excessive packet loss (1-65535). The default value is 3000. |
| Excessive Packet Loss Threshold | Enter the alarm threshold (in percentage) for excessive packet loss (1-100). The default value is 50. |
| Alarm Raise Threshold | Enter the amount of time (in milliseconds) the system waits after a fault condition exists before raising an alarm (1-65535). The default value is 2500. |
| Alarm Clear Threshold | Enter the time (in milliseconds) the system waits before clearing an alarm once the alarm condition has ended (1-65535). The default value is 10000. |
| SES Threshold | Enter the percentage of missing packets detected within a one second window that will cause SES to be counted. |
Adding a Pseudowire Profile
To add a pseudowire profile:
1 In the PseudoWire Profiles page (Figure 333), click Add. The PseudoWire Profiles – Add page opens.
Figure 347 PseudoWire Profiles – Add Page

2 Configure the pseudowire profile parameters, described in Table 103.
3 Click Apply, then Close.
Editing a Pseudowire Profile
To edit a pseudowire profile:
1 In the PseudoWire Profiles page (Figure 333), select the profile you want to edit and click Edit. The PseudoWire Profiles – Edit page opens.
2 Edit the pseudowire profile parameters, described in Table 103. You can edit any of the parameters you can configure when you add a profile except the Profile ID field.
3 Click Apply, then Close.
Deleting a Pseudowire Profile
To delete a pseudowire profile:
1 In the PseudoWire Profiles page (Figure 333), select the profile you want to delete.
2 Click Delete. The profile is deleted.

Note
You cannot delete a tunnel group that is assigned to a pseudowire TDM service.
Configuring Pseudowire TDM Services Manually
For PTP 820F and PTP 820G, you can configure up to 16 TDM pseudowire services per unit.

Note
Once a profile, tunnel, or bundle has been assigned to a service, you cannot modify that profile, tunnel, or bundle until you first disable the service.
This section includes:
• Viewing Pseudowire TDM Services
• Adding a Pseudowire TDM Service
• Editing a Pseudowire TDM Service
• Viewing the Status of a Pseudowire TDM Service
• Deleting a Pseudowire TDM Service
Viewing Pseudowire TDM Services
To view all the pseudowire TDM services configured for a TDM card:
1 Select TDM > TDM PseudoWire > Advanced > Services. The PseudoWire Services page opens. Table 104 describes the pseudowire TDM service parameters.
Figure 348 PseudoWire Services Page
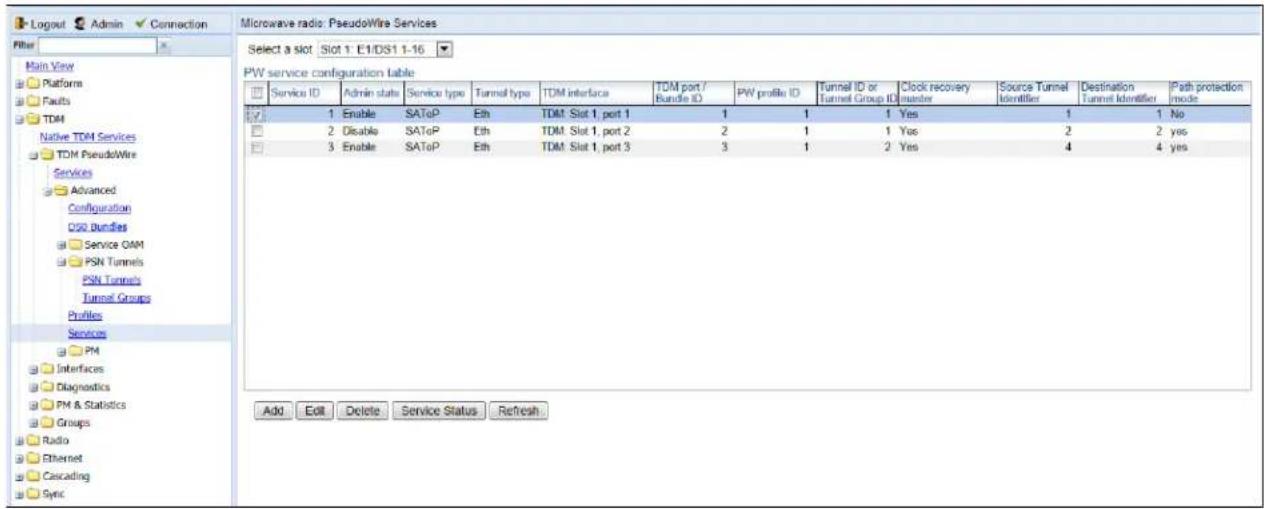
Table 111 Pseudowire TDM Service Parameters
| Parameter Definition | |
| Service ID | A unique ID that identifies the service. Once you have added the service, you cannot change the Service ID. Options are 1-16. |
| Admin State Select one of the following options:Enable– The service is functional.Disable– The service is disabled until this parameter is changed to Enabled. In this mode, the service occupies system resources but is unable to receive and transmit data. | |
| Service Type | Select the pseudotype protocol you want to use for the service:E1 SAToP– Service uses SAToP protocolCESoPSN– Service uses CESoP protocol without CAS signalingCAS-CESoPSN– Service uses CESoP protocol with CAS signaling.Only SAToP is supported in this release. |
| Tunnel Type | Select the encapsulation type to use with the service. Options are:UDP/IP– UDP/IPEth– MEF-8Only Eth is supported in this release. |
| TDM Interface Select the TDM port to use with the service. | |
| TDM Port/ Bundle ID Reserved for future use. | |
| PW Profile ID | Select the TDM profile to use with the service. The TDM profile determines the behavior of the TDM service, including the buffer, payload suppression, and other parameters. A profile can be used by multiple TDM services.You can define up to 64 TDM profiles for the unit in the PseudoWire Profiles page. See Configuring Pseudowire Profiles. |
| Tunnel ID or Tunnel Group ID | Select the TDM tunnel or tunnel group to use with the service. The tunnel determines how traffic over the service passes through the network. In this version, encapsulation must use the MEF-8 protocol.Up to 16 tunnels can be configured. TDM tunnels are configured in the PseudoWire Tunnels page. Tunnel groups are configured in the Tunnel Groups page. See Configuring Pseudowire Tunnels and Tunnel Groups. |
| Clock Recovery Master | Select Enable to use this service as a reference for clock recovery. Otherwise, select Disable. |
| Source Tunnel Identifier | Enter the source ECID for the Ethernet tunnel.Note:The ECID must be unique for each service. |
| Destination Tunnel Identifier | Enter the destination ECID for the Ethernet tunnel. |
Parameter Definition
| Path Protection Mode | If you are creating a service with path protection, select Yes. If you are creating a service without path protection, select No. |
| If you select Yes, the Tunnel ID must be the ID of a Tunnel Group. For instructions on creating a tunnel group, see Configuring a Tunnel Group. |
Adding a Pseudowire TDM Service
To add a pseudowire TDM service:
1 Click Add. The PseudoWire Services – Add page opens.
Figure 349 PseudoWire Services – Add Page
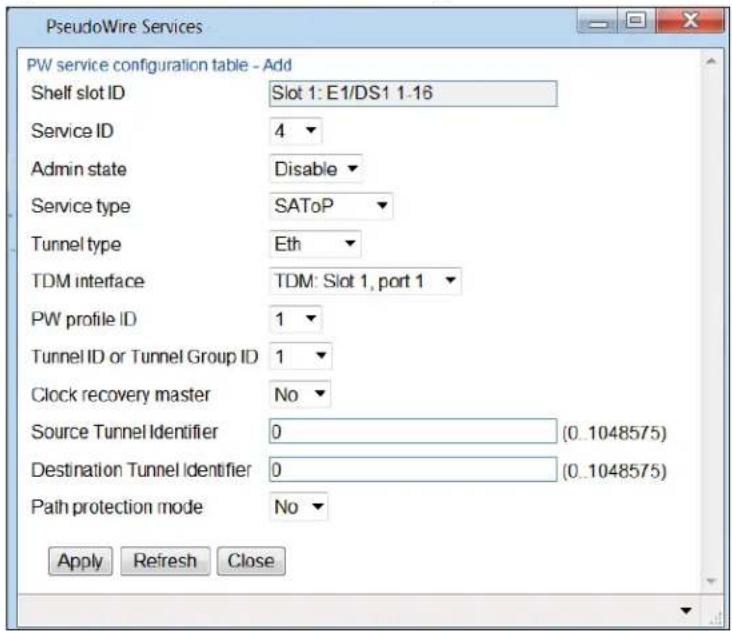
2 Configure the pseudowire service parameters, described in Table 104.
3 Click Apply, then Close.
Editing a Pseudowire TDM Service
To edit a pseudowire service:
1 Select the service you want to edit.
2 Click Edit. The PseudoWire Services – Edit page opens. You can edit any of the service parameters you can configure when you add a service except the Service ID field.
3 Edit the service parameters, as described above.
4 Click Apply, then Close.
Viewing the Status of a Pseudowire TDM Service
To view the operational status of a service and the service's statistics:
1 Select the service you want to view.
2 Click Service Status. The PseudoWire Services – Information page opens.
Figure 350 PseudoWire Services – Information Page

Table 105 describes the pseudowire TDM service status parameters.
To clear the statistics, click Clear Statistics at the bottom of the page.
Table 112 Pseudowire TDM Service Status Parameters
| Parameter Definition | |
| Shelf Slot ID Slot 1. | |
| Service ID | A unique ID that identifies the service. Once you have added the service, you cannot change the Service ID. |
| Operational Status | Displays the current operational state of the service (Up or Down). If no traffic is currently passing through the service, the Operational Status displays Down. This does not necessarily mean there is anything wrong with the unit or the configuration of the service. |
| Tx Packets | The number of transmitted packets. |
| Rx Packets The number of received packets. | |
| LOPS Transitions | The number of transitions from normal state to Loss of Packet Synchronization (LOPS) state. |
| Jitter Buffer Overruns | The number of jitter buffer overruns. |
| Jitter Buffer Deviations The maximum jitter buffer deviation. | |
| Minimum Jitter Buffer Count | The minimum jitter buffer usage registered for the previous second. |
Parameter Definition
Maximum Jitter Buffer Count
The maximum jitter buffer usage registered for the previous second.
Deleting a Pseudowire TDM Service
To delete a pseudowire TDM service:
1 Select the service you want to delete.
2 Select the service.
3 Click Edit, and set the Admin State of the service to Disable.
4 Click Apply, then Close.
5 Select the service.
6 Click Delete. The service is deleted.
Displaying TDM PMs
This section includes:
• Displaying E1/DS1 PMs
• Displaying Native TDM Service PMs
• Displaying Pseudowire Service PMs
Displaying E1/DS1 PMs
To display PMs for all E1/DS1s in the system:
1 Select TDM > PM & Statistics > E1/DS1. The E1/DS1 PM page opens.
Figure 351 E1/DS1 PM Page

2 In the Interface field, select the port for which you want to display PMs.
3 In the Interval Type field, select:
To display reports in 15-minute intervals, select 15 minutes.
- To display reports in daily intervals, select 24 hours.
Table 106 describes the E1/DS1 PMs.
| Parameter Definition | |
| ES | Indicates the number of seconds during which errors occurred. |
| SES | Indicates the number of seconds during which severe errors occurred. |
| UAS | Indicates the Unavailable Seconds value of the current interval. The value can be between 0 and 900 seconds (15 minutes). |
Parameter Definition
Integrity
Indicates whether the values received at time and date of the measured interval are reliable. An x in the column indicates that the values are not reliable due to a possible power surge or power failure that occurred at that time.
To display the PMs in a graph format, click Graph.
Figure 352 E1/DS1 PM Page – Graph Format

line
| Time | ES | SES | UAS | | ---------- | ----- | ----- | ----- | | 21-Mar-15 00 | 1.00 | 1.00 | 1.00 | | 21-Mar-15 11 | 1.00 | 1.00 | 1.00 | | 21-Mar-17 00 | 1.00 | 1.00 | 1.00 | | 21-Mar-17 12 | 1.00 | 1.00 | 1.00 | | 21-Mar-19 00 | 1.00 | 1.00 | 1.00 | | 21-Mar-19 13 | 1.00 | 1.00 | 1.00 | | 21-Mar-19 16 | 1.00 | 1.00 | 1.00 | | 21-Mar-19 19 | 1.00 | 1.00 | 1.00 | | 21-Mar-20 00 | 1.00 | 1.00 | 1.00 | | 21-Mar-21 00 | 1.00 | 1.00 | 1.00 | | 21-Mar-22 00 | 1.00 | 1.00 | 1.00 | | 21-Mar-23 00 | 1.00 | 1.00 | 1.00 | | 22-Mar-25 00 | 1.00 | 1.00 | 1.00 | | 22-Mar-25 13 | 1.00 | 1.00 | 1.00 | | 22-Mar-25 23 | 1.00 | 1.00 | 1.00 | | 22-Mar-26 34 | 1.00 | 1.00 | 1.00 | | 22-Mar-26 43 | 1.00 | 1.00 | 1.00 | | 22-Mar-27 53 | 1.00 | 1.00 | 1.00 | | 22-Mar-28 63 | 1.00 | 1.00 | 1.00 | | 22-Mar-29 73 | 1.00 | 1.00 | 1.00 | | End | | | |Displaying Native TDM Service PMs
To display PMs for all Native TDM services defined in the system:
1 Select TDM > PM & Statistics > Service. The Services PM page opens.
Figure 353 Services PM Page (Native TDM Services)
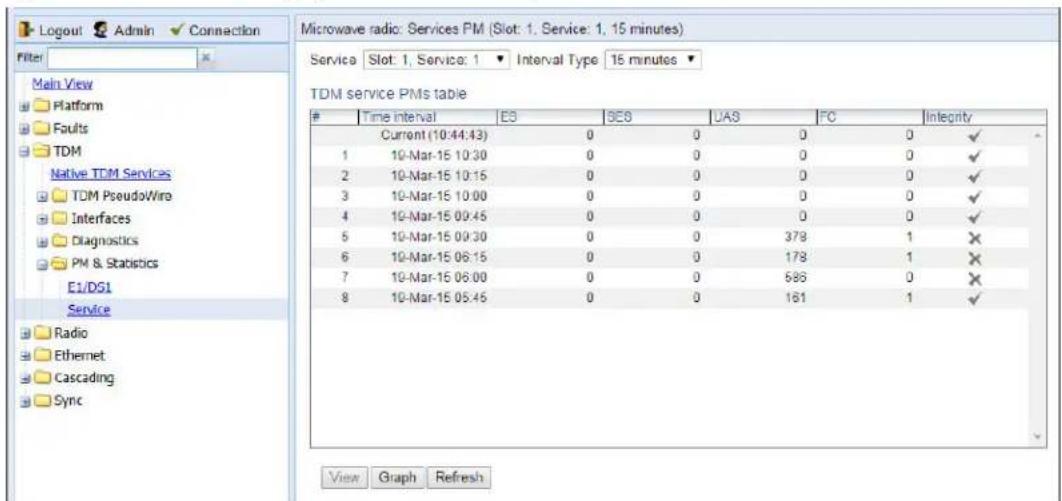
2 In the Service field, select a service.
3 In the Interval Type field, select:
To display reports in 15-minute intervals, select 15 minutes.
- To display reports in daily intervals, select 24 hours.
Table 107 describes the Native TDM Service PMs.
Table 114 Native TDM Service PMs
| Parameter Definition | |
| ES | Indicates the number of seconds during which errors occurred. |
| SES | Indicates the number of seconds during which severe errors occurred. |
| UAS | Indicates the Unavailable Seconds value of the current interval. The value can be between 0 and 900 seconds (15 minutes). |
| FC | Indicates the number of LOPS (Loss of Packets) events during the current interval. |
| Integrity | Indicates whether the values received at time and date of the measured interval are reliable. An x in the column indicates that the values are not reliable due to a possible power surge or power failure that occurred at that time. |
To display the PMs in a graph format, click Graph.
Figure 354 Native TDM Services Page – Graph Format

line
Services PM graph | Time | ES | SES | UAS | |---|---|---|---| | 21-Mar-15 10:00 | 100 | 100 | 100 | | 21-Mar-15 11:00 | 100 | 100 | 100 | | 21-Mar-15 12:00 | 100 | 100 | 100 | | 21-Mar-15 13:00 | 100 | 100 | 100 | | 21-Mar-15 14:00 | 100 | 100 | 100 | | 21-Mar-15 15:00 | 100 | 100 | 100 | | 21-Mar-15 16:00 | 100 | 100 | 100 | | 21-Mar-15 17:00 | 100 | 100 | 100 | | 21-Mar-15 18:00 | 100 | 100 | 100 | | 21-Mar-15 19:00 | 100 | 100 | 100 | | 21-Mar-15 20:00 | 100 | 100 | 100 | | 21-Mar-15 21:00 | 100 | 100 | 100 | | 21-Mar-15 22:00 | 100 | 100 | 100 | | 21-Mar-15 23:00 | 100 | 100 | 100 | | 22-Mar-15 00:00 | 100 | 100 | 100 | | 22-Mar-15 01:00 | 100 | 100 | 100 | | 22-Mar-15 02:00 | 100 | 100 | 100 | | 22-Mar-15 03:00 | 100 | 100 | 100 | | 22-Mar-15 04:00 | 100 | 100 | 100 | | 22-Mar-15 05:00 | 100 | 100 | 100 | | 22-Mar-15 06:00 | 100 | 100 | 100 | | 22-Mar-15 07:00 | 100 | 100 | 100 | | 22-Mar-15 08:00 | 100 | 100 | 100 | | 22-Mar-15 09:00 | 100 | 100 | 100 | Refresh CloseDisplaying Pseudowire Service PMs
To display PMs for all pseudowire TDM services defined in the system:
1 Select TDM > TDM PseudoWire > Advanced > PM > Service. The Services PM page opens.
Figure 355 Services PM Page (Pseudowire TDM Services)
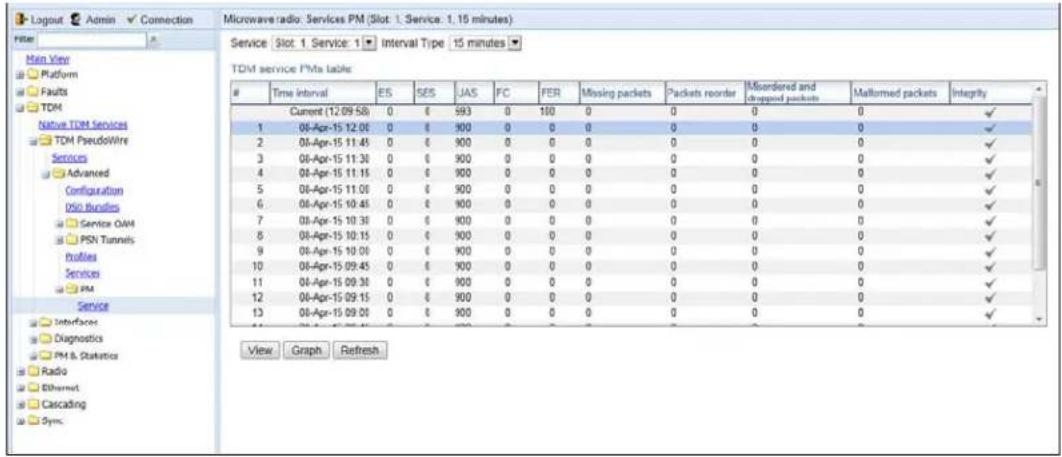
2 In the Service field, select a service.
3 In the Interval Type field, select:
- To display reports in 15-minute intervals, select 15 minutes.
- To display reports in daily intervals, select 24 hours.
Table 108 describes the Pseudowire TDM Service PMs.
Table 115 Pseudowire TDM Service PMs
| Parameter Definition | |
| ES | Indicates the number of seconds during which errors occurred. |
| SES | Indicates the number of seconds during which severe errors occurred. |
| UAS | Indicates the Unavailable Seconds value of the current interval. The value can be between 0 and 900 seconds (15 minutes). |
| FC | Indicates the number of LOPS (Loss of Packets) events during the current interval. |
| FER | Indicates the number of LOPS (Loss of Packets) events during the current interval. |
| Missing packets | Indicates the number of packets that never reached the service endpoint during the current interval. |
| Packets reorder | Indicates the number of packets that arrived out of order but could be recovered during the current interval. |
| Misordered and Dropped Packets | Indicates the number of packets that arrived out of order and could not be recovered during the current interval. |
| Malformed Packets | Indicates the number of packets that were detected as having an unexpected size or a bad header stack during the current interval. |
| Integrity | Indicates whether the values received at time and date of the measured interval are reliable. An x in the column indicates that the values are not reliable due to a possible power surge or power failure that occurred at that time. |
To display the PMs in a graph format, click Graph.
Figure 356 Pseudowire TDM Services Page – Graph Format

line
Services PM graph | Time | ES | SES | UAS | |---|---|---|---| | 21-Mar-15 03 | 0 | 0 | 0 | | 21-Mar-15 11 | 0 | 0 | 0 | | 21-Mar-15 12 | 0 | 0 | 0 | | 21-Mar-15 13 | 0 | 0 | 0 | | 21-Mar-15 14 | 0 | 0 | 0 | | 21-Mar-15 15 | 0 | 0 | 0 | | 21-Mar-15 16 | 0 | 0 | 0 | | 21-Mar-15 17 | 0 | 0 | 0 | | 21-Mar-15 18 | 0 | 0 | 0 | | 21-Mar-15 19 | 0 | 0 | 0 | | 21-Mar-15 20 | 0 | 0 | 0 | | 21-Mar-15 21 | 0 | 0 | 0 | | 21-Mar-15 22 | 0 | 0 | 0 | | 21-Mar-15 23 | 0 | 0 | 0 | | 22-Mar-15 23 | 0 | 0 | 0 | | 22-Mar-15 24 | 0 | 0 | 0 | | 22-Mar-15 25 | 0 | 0 | 0 | | 22-Mar-15 26 | 0 | 0 | 0 | | 22-Mar-15 27 | 0 | 0 | 0 | | 22-Mar-15 28 | 0 | 0 | 0 | | 22-Mar-15 29 | 0 | 0 | 0 | | 22-Mar-15 30 | 0 | 0 | 0 | Ref:th CloseChapter 10: Synchronization
This section includes:
- Configuring the Sync
- Configuring the Outgoing Clock and SSM Message
- Configuring 1588 Transparent Clock
- Configuring the 1588 Boundary Clock

Note
By default, the unit is set to operate according to the ETSI standard. For instructions on configuring the system to operate according to the ANSI (FCC) standard (DS1), see TDM Overview (CLI).
Configuring the Sync Source
Frequency signals can be taken by the system from Ethernet and radio interfaces.
The reference frequency may also be conveyed to external equipment through different interfaces. For instructions how to configure the outgoing clock, see Configuring the Outgoing Clock and SSM Messages.
Frequency is distributed by configuring the following parameters in each node:
- System Synchronization Sources – These are the interfaces from which the frequency is taken and distributed to other interfaces. Up to 16 sources can be configured in each node. A revertive timer can be configured. For each interface, you must configure:
- Priority (1-16) – No two synchronization sources can have the same priority.
- Quality – The quality level applied to the selected synchronization source. This enables the system to select the source with the highest quality as the current synchronization source.
• Each unit determines the current active clock reference source interface:
- The interface with the highest available quality is selected.
From among interfaces with identical quality, the interface with the highest priority is selected.

Note
You can configure a revertive timer for the PTP 820G or PTP 820F unit. When the revertive timer is configured, the unit will not switch to another synchronization source unless that source has been stable for at least the number of seconds defined in the revertive timer. This helps to prevent a situation in which numerous switchovers occur when a synchronization source reports a higher quality for a brief time interval, followed by a degradation of the source's quality. By default, the revertive timer is set to 0, which means that it is disabled. Configuration of the revertive timer must be performed via CLI. See Configuring the Revertive Timer (CLI).
When configuring the Sync source, the Sync mode must be set to its default setting of automatic. To display the current Sync mode, enter the following CLI command in root view:
root> platform sync mode show
If the Sync mode is set to pipe, you must set it to automatic by entering the following CLI command in root view:
root> platform sync mode set automatic
When configuring an Ethernet interface as a Sync source, the Media Type of the interface must be RJ45 or SFP, not Auto-Type. To view and configure the Media Type of an Ethernet interface, see Configuring Ethernet Interfaces.
Viewing the Sync Source Status
To view the current sync source and its quality:
- Select Sync > Sync Source. The Sync Source page opens. Figure 357 Sync Source Page

Table 109 lists and defines the sync source status parameters.
Table 116 Sync Source Parameters
| Parameter Definition | |
| System Reference Quality | The quality of the current synchronization source interface. A value of DNU indicates that no synchronization source interfaces are currently defined. |
| Current Active Sync Source | The currently active system synchronization source interface. |
| Sync clock unit status | The status of the unit's Sync E mechanism. |
| Sync Interface | Displays the interface that is configured as a synchronization source. |
| Sync Interface Quality | Displays the quality level assigned to this synchronization source. This enables the system to select the source with the highest quality as the current synchronization source.If the Sync Interface Quality is set to Automatic, the quality is determined by the received SSMs. If no valid SSM messages are received or in case of interface failure (such as LOS, LOC, LOF), the quality becomes "Failure." SSM must be enabled on the remote interface in order for the interface to receive SSM messages. For instructions how to enable SSM, see Configuring the Outgoing Clock and SSM Messages. |
| Sync Interface Priority | Displays the priority assigned to this synchronization source. |
| Sync Interface Quality Status | Displays the current actual synchronization quality of the interface. |
Adding a Sync Source
To add a synchronization source:
1 In the Sync Source page (Figure 344), click Add. The Sync Source – Add page opens.
Figure 358 Sync Source – Add Page

2 In the Sync Interface field, select the interface you want to define as a synchronization source. You can select from the following interface types:
- Ethernet interfaces – You can use Ethernet interfaces, including Cascading interfaces.
- Radio interfaces – You can use any radio interface.

Note
In order to select an Ethernet interface, you must first specify the media type for this interface. See Configuring Ethernet Interfaces.
3 In the Sync Interface Quality field, select the quality level applied to the selected synchronization source. This enables the system to select the source with the highest quality as the current synchronization source.
If the Sync Interface Quality is set to Automatic, the quality is determined by the received SSMs. If no valid SSM messages are received or in case of interface failure (such as LOS, LOC, LOF), the quality becomes Failure. SSM must be enabled on the remote interface in order for the interface to receive SSM messages. For instructions how to enable SSM, see Configuring the Outgoing Clock and SSM Messages.
○ If the Sync Interface Quality is set to a fixed value, then the quality status becomes Failure upon interface failure (such as LOS, LOC, LOF).
4 In the Sync Interface Priority field, select the priority of this synchronization source relative to other synchronization sources configured in the unit (1-16). You cannot assign the same priority to more than one synchronization source. Once a priority value has been assigned, it no longer appears in the Sync Interface Priority dropdown list.
5 Click Apply, then Close.
Editing a Sync Source
To edit a synchronization source:
1 In the Sync Source page (Figure 344), click Edit. The Sync Source – Edit page opens.
2 Edit the parameters, as defined above. You can edit all the parameters except Sync Interface, which is read-only.
3 Click Apply, then Close.
Deleting a Sync Source
To delete a synchronization source:
1 Select the synchronization source in the Sync Source page (Figure 344).
2 Click Delete. The synchronization source is deleted.
Configuring the Outgoing Clock and SSM Messages
In the Outgoing Clock page, you can view and configure the following synchronization settings per interface:
• The interface's clock source (outgoing clock).
- For radio interfaces, the synchronization radio channel (used for interoperability).
• SSM message administration.
In order to provide topological resiliency for synchronization transfer, PTP 820G and PTP 820F implements the passing of SSM messages over the radio interfaces. SSM timing in PTP 820G and PTP 820F complies with ITU-T G.781.
In addition, the SSM mechanism provides reference source resiliency, since a network may have more than one source clock. The following are the principles of operation:
- At all times, each source interface has a "quality status" which is determined as follows:
○ If quality is configured as fixed, then the quality status becomes "failure" upon interface failure (such as LOS, LOC, LOF).
If quality is automatic, then the quality is determined by the received SSMs. If no valid SSM messages are received or in case of interface failure (such as LOS, LOC, LOF), the quality becomes "failure." - Each unit holds a parameter which indicates the quality of its reference clock. This is the quality of the current synchronization source interface.
- The reference source quality is transmitted through SSM messages to all relevant radio interfaces.
- In order to prevent loops, an SSM with quality “Do Not Use” is sent from the active source interface (both radio and Ethernet)
In order for an interface to transmit SSM messages, SSM must be enabled on the interface. By default, SSM is disabled on all interfaces.

Note
LIC-T155 (1x ch-STM-1/OC-3) cardscannot pass SSMmessages.
When configuring the outgoing clock and SSM administration, the Sync mode must be set to its default setting of automatic. To display the current Sync mode, enter the following CLI command in root view:
root> platform sync mode show
If the Sync mode is set to pipe, you must set it to automatic by entering the following CLI command in root view:
root> platform sync mode set automatic
To configure the outgoing clock on an Ethernet interface, the Media Type of the interface must be RJ45 or SFP, not Auto-Type. To view and configure the Media Type of an Ethernet interface, see Configuring Ethernet Interfaces. To view and configure the synchronization parameters of the unit's interfaces:
1 Select Sync >Outgoing Clock. The Outgoing Clock page opens.
Figure 359 Outgoing Clock Page
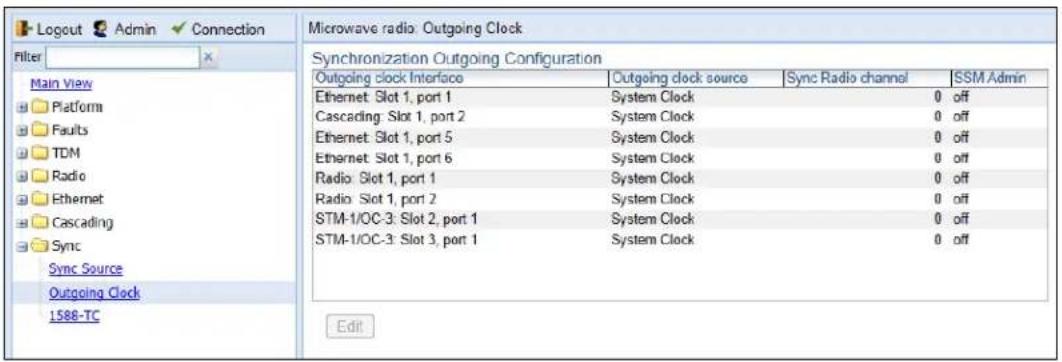
2 Select the interface you want to configure and click Edit. The Outgoing Clock – Edit page opens.

Note
You cannot edit the clock source of E1/DS1 interfaces.
Figure 360 Outgoing Clock – Edit Page

3 In the Outgoing clock source field, select the interface's synchronization source. Options are:
o Local Clock – The interface uses its internal clock as its synchronization source.
- System Clock – Default value. The interface uses the system clock as its synchronization source.
Source Interface – Reserved for future use.
- Time Loop – Reserved for future use.
4 The Sync Radio Channel field is only relevant for radio interfaces. Select a synchronization channel to use for interoperability:
- For interoperability with other PTP 820G or PTP 820F units, use the default value of 0.
- For non-radio interfaces, use the default value of 0.
5 In the SSM Admin field, select On or Off to enable or disable SSM for the interface. By default, SSM is disabled on all interfaces. On radio interfaces, SSM messages with the quality DNU (Do not Use) are sent when SSM Admin is set to Off.
Configuring 1588 Transparent Clock

Note
This section is only relevant for PTP 820G
PTP 820G uses 1588v2-compliant Transparent Clock to counter the effects of delay variation. Transparent Clock measures and adjusts for delay variation, enabling the PTP 820G to guarantee ultra-low PDV.
A Transparent Clock node resides between a master and a slave node, and updates the timestamps of PTP packets passing from the master to the slave to compensate for delay, enabling the terminating clock in the slave node to remove the delay accrued in the Transparent Clock node. The Transparent Clock node is itself neither a master nor a slave node, but rather, serves as a bridge between master and slave nodes.
Note that in release 11.3:
• 1588 TC is not supported when Master-Slave communication is using the IPv6 transport layer.
• 1588 TC cannot be used on 1+1 HSB links.
• 1588 TC is not supported with Frame Cut-Through.

Note
Make sure to enable Transparent Clock on the remote side of the link before enabling it on the local side.
To configure Transparent Clock:
- Add the port receiving synchronization from the customer side as a Sync source. See Adding a Sync Source.
- Add a radio interface as a Sync source, with lower priority than the port receiving synchronization from the customer side. See Adding a Sync Source.
- On the remote side of the radio link, add the radio interface facing the local device as a Sync source, with Sync Interface Priority 1. See Adding a Sync Source
- On the remote side of the radio link, if there is an Ethernet port conveying synchronization, add this port as a Sync source, with lower priority than the radio interface. See Adding a Sync Source
- Verify that the Sync Interface Quality Status of the first Sync source is not Failure. See Viewing the Sync Source Status.
- Select Sync > 1588-TC. The 1588-TC page opens.
Figure 361 1588-TC Page
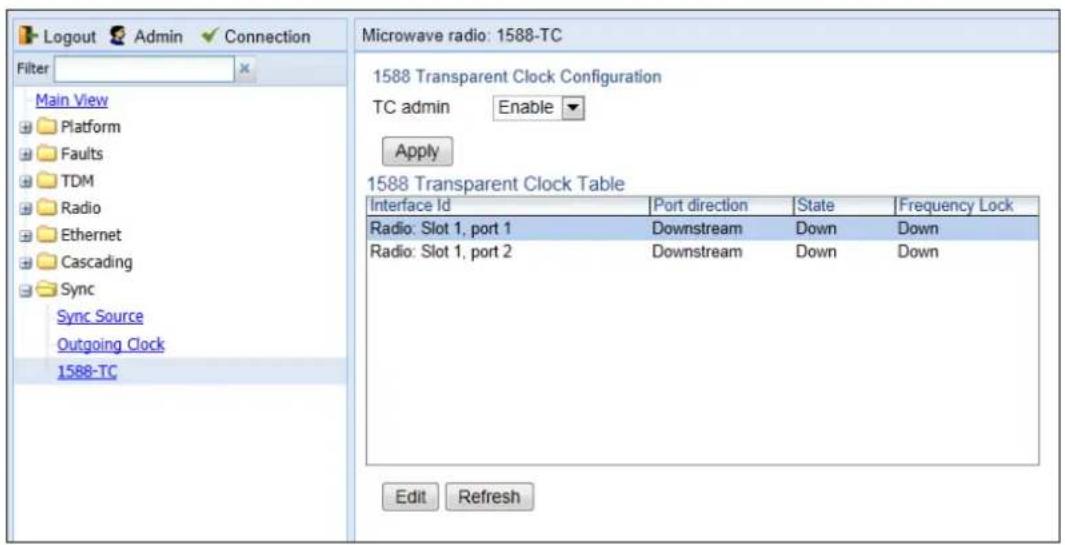
- In the TC admin field, select Enable.
- Click Apply.
- Select a radio and click Edit. The 1588-TC – Edit page opens.
Figure 362 1588-TC – Edit Page

- In the Port direction field, select Upstream or Downstream. This field must be set to different values on the two sides of the link. If you set the local side to Upstream, you must set the remote side to Downstream, and vice versa.

Note
This parameter must be set to Upstream on one side of the 1588 link and Downstream on the other.
- Click Apply, then Close.
- 1588 packets should be mapped to CoS 7. By default, 1588 packets are not mapped to any CoS. To map 1588 packets to CoS 7, you must disable CoS preservation for 1588 packets. This must be performed via CLI, using the following command:
root> ethernet generalcfg ptp-tc cos-preserve set admin disable
- To map 1588 packets to CoS 7, enter the following command:
root> ethernet generalcfg ptp-tc cos-preserve cos value 7
After you enter these commands, 1588 packets will automatically be mapped to CoS 7.

Note
If necessary, you can use the ethernet generalcfg ptp-tc cos-preserve cos value command to map a different CoS value (0-7) to 1588 packets, but it is recommended to map 1588 packets to CoS 7.
Configuring 1588 Boundary Clock

Note
This section is only relevant for PTP 820G. 1588 Boundary Clock for PTP 820F is planned for future release.
IEEE-1588v2 Boundary Clock enables the PTP 820 to regenerate phase synchronization via standard Ethernet.
Boundary Clock complies with ITU-T Telecom Profile G.8275.1. This enables PTP 820, with Boundary Clock, to meet the rigorous synchronization requirements of LTE-Advanced (LTE-A) networks.
The Boundary Clock in PTP 820 supports up to four 1588 slave clock devices.
The Boundary Clock terminates the PTP flow it receives on the slave port, recovers the time and phase, and regenerates the PTP flow on the master ports.
The Boundary Clock node selects the best synchronization source available in the domain and regenerates PTP towards the slave clocks. This reduces the processing load from grandmaster clocks and increases the scalability of the synchronization network, while rigorously maintaining timing accuracy.
The PTP 820 Boundary Clock mechanism requires the use of untagged Ethernet multicast PTP packets.

Note
Boundary Clock and Transparent Clock can be used together in the same PTP 820 node.
Note that in System Release 11.3:
- 1588 BC cannot be configured on interface groups, such as HSB and Multi-Carrier ABC. However, it can be configured on LAGs.
• 1588 BC can only be used in a chain or star topology. It cannot be used in a ring topology.
• 1588 BC is not supported when Master-Slave communication is using the IPv6 transport layer.
• 1588 BC is not supported with RMC-A
• 1588 BC cannot be used on 1+1 links.
• 1588 BC is not supported with Frame Cut-Through
Enabling Boundary Clock

Note
Before configuring Boundary Clock, you must configure Transparent Clock. See Configuring 1588 Transparent Clock.
To enable Boundary Clock:
- Select Sync > 1588 > General Configuration. The 1588 – General Configuration page opens.
-
In the 1588 PTP field, select Enable.
-
Click Apply.
- Select Sync > 1588 > Boundary Clock > Port Parameters. The 1588 Boundary Clock – Port Parameters page opens. You can configure up to four interfaces per unit to be part of the Boundary Clock node. These interfaces can be radio and Ethernet interfaces, but not TDM interfaces or groups (e.g., LAG or Multi-Carrier ABC groups).
Figure 363 1588 Boundary Clock – Port Parameters Page

- Select an interface and click Edit. The 1588 Boundary Clock – Port Parameters – Edit page opens.
Figure 364 1588 Boundary Clock – Port Parameters – Edit Page

- In the Admin field, select Enable.
-
In the Master Only field, select from the following options:
-
Yes – The port can only be used as the master port, which means the port acts as a PTP synchronization source for other nodes.
-
No – The port can be used as either a master port or the slave port. The slave port receives PTP synchronization input from an external grandmaster clock. The Best Master Clock Algorithm (BMCA) determines the port's role, based on its determination of which is the best available grandmaster clock. Only one slave port can exist in a single PTP 820 node at any one time.
-
Optionally, in the Local Priority field, select a value between 1-255. The default value is 128. The Local Priority value is taken into account when two identical announce messages are received by at least two different ports. In such a case, the Boundary Clock mechanism selects the slave port based on the best (lowest) Local Priority.
-
In the Destination Mac Address field, select a MAC address for multicast re-transmission of PTP packets. Options are:
01-1B-19-00-00-00 – General group address. An 802.1Q VLAN Bridge would forward the frame unchanged.
- 01-80-C2-00-00-0E – Individual LAN Scope group address. An 802.1Q VLAN Bridge would drop the frame.
-
Click Apply.
-
Repeat these steps to add up to four interfaces to the unit's Boundary Clock node.
- To map PTP packets into the Boundary Clock node, a service point must be created on each interface in the Boundary Clock node. This service point must be defined to gather untagged packets. See Adding a Service Point.
- Add a port receiving synchronization from the customer side as a Sync source, with Sync Interface Priority 1. See Adding a Sync Source.
- Add a radio interface as a Sync source, with lower priority than the port receiving synchronization from the customer side. See Adding a Sync Source.
- On the remote side of the radio link, add the radio interface facing the local device as a Sync source, with Sync Interface Priority 1. See Adding a Sync Source.
- On the remote side of the radio link, if there is an Ethernet port conveying synchronization, add this port as a Sync source, with lower priority than the radio interface. See Adding a Sync Source.
- Verify that the Sync Interface Quality Status of the first Sync source is not Failure. See Viewing the Sync Source Status.
Displaying and Setting the Boundary Clock Default Parameters
To display and set the Boundary Clock default parameters:
- Select Sync > 1588 > Boundary Clock > Clock Parameters > Default. The 1588 Boundary Clock – Clock Default Parameters page opens.
Figure 365 1588 Boundary Clock – Clock Default Parameters Page

- In the Priority 2 field, you can select a value between 0 and 255. The default value is 128. The Priority 2 value is one of the factors used by the BMCA to determine the grandmaster. The PTP 820's Boundary Clock node advertises this value when it is not locked on an external grandmaster.
- In the Domain Number field, you can select a value between 24 and 43. The default value is 24.
- In the Local Priority field, you can select a value between 1 and 255. The default value is 128. The Local Priority value is taken into account when two identical announce messages are received by at least two different ports. In such a case, the Boundary Clock mechanism selects the slave port based on the best (lowest) Local Priority.
- In the Max Step removed field, you can select the maximum number of PTP clocks traversed from the grandmaster to the slave clock in the local PTP 820 Boundary Clock node. The value range is 1-255. The default value is 255. If the defined number is exceeded, packets from this grandmaster candidate are discarded and the grandmaster will not be eligible for use by the Boundary Clock node.
- To implement your changes, click Apply.
The following Table lists and describes the read-only Boundary Clock default parameters.
Table 117 Boundary Clock Default Parameters
| Parameter Definition | |
| Two Step | Indicates whether the Boundary Clock node is operating in two-step mode. In PTP 820, this is always set to Yes. |
| Clock Identity Identifies the system clock. | |
| Number of Ports | Displays the number of ports on the unit on which Boundary Clock is enabled. The maximum is 4 per PTP 820 unit. |
| Clock Class | One of the elements of the clock quality, as defined in IEEE-1588. |
| Clock Accuracy | One of the elements of the clock quality, as defined in IEEE-1588. |
| Offset Scaled Log Variance | One of the elements of the clock quality, as defined in IEEE-1588. |
| Slave Only | Indicates whether the Boundary Clock node is operating in slave mode only. In PTP 820, this is always set to No. |
| Priority 1 Always displays 128. | |
Displaying the Boundary Clock Advanced Parameters
To display and set the Boundary Clock advanced parameters:
- Select Sync > 1588 > Boundary Clock > Clock Parameters > Advanced. The 1588 Boundary Clock – Clock Advanced Parameters page opens.
Figure 366 1588 Boundary Clock – Clock Advanced Parameters Page

All of the advanced Boundary Clock parameters are read-only. The following Table lists and describes the Boundary Clock advanced parameters.
Table 118 Boundary Clock Advanced Parameters
| Parameter Definition | |
| Steps Removed | The number of PTP clocks traversed from the grandmaster to the slave clock in the local PTP 820 Boundary Clock node. You can define a maximum number of steps in the Clock Default Parameters page. See Displaying and Setting the Boundary Clock Default Parameters. |
| Offset from Master (Nanoseconds) | The time difference between the master clock and the local slave clock (in ns). |
| Mean Path Delay (Nanoseconds) | The mean propagation time for the link between the master and the local slave (in ns). |
| Lock Status | Provides 1588 Boundary Clock stack lock status information. |
| Free Running | APR stack manual free run state. |
| Master Clock Identity | The clock identity of the current master clock. |
| Master Port Number | The clock identity of the current master port. |
| Grandmaster Identity | The clock identity of the current grandmaster. |
| Grandmaster Clock Class | The clock class of the current grandmaster. The clock class is one of the elements of the clock quality, as defined in IEEE-1588. |
| Grandmaster Clock Accuracy | The clock accuracy of the current grandmaster. The clock accuracy is one of the elements of the clock quality, as defined in IEEE-1588. |
| Grandmaster Offset Scaled Log Variance | The offset scaled log variance of the current grandmaster. The offset scaled log variance is one of the elements of the clock quality, as defined in IEEE-1588. |
| Grandmaster Priority 1 | The Priority 1 value of the current grandmaster. |
| Grandmaster Priority 2 | The Priority 2 value of the current grandmaster. |
| Current UTC Offset (Seconds) | The current UTC offset value (in seconds). |
| Current UTC Offset Valid | Indicates whether the current UTC offset value is valid. |
| Leap 59 | Indicates that the last minute of the current UTC day contains 59 seconds. |
| Leap 61 | Indicates that the last minute of the current UTC day contains 61 seconds. |
| Time Traceable Traceability to the primary time reference. | |
| Frequency Traceable | Traceability to the primary frequency reference. |
| PTP Timescale | Indicates whether the clock time scale of the grandmaster clock is PTP. |
| Time Source | The source of the time used by the grandmaster clock. |
Displaying the Boundary Clock Port Parameters
To display the Boundary Clock port parameters:
- Select Sync > 1588 > Boundary Clock > Port Parameters. The 1588 Boundary Clock – Port Parameters page opens.
- Select the port you want to configure and click Edit. The 1588 Boundary Clock – Port Parameters – Edit page opens.
For an explanation of the configurable fields, see Enabling Boundary Clock. The Following Table describes the Boundary Clock Port Parameters,
Table 119 Boundary Clock Port Parameters.
| Parameter Definition | |
| Clock Identity | ThePTP 820 unit's clock identity. The same value is used for every port that belongs to the Boundary Clock node. |
| Port Number In this version, displays 1 for every port. | |
| Port State | Indicates whether the port is currently acting as Master (distributing PTP to other nodes) or Slave (receiving PTP from a grandmaster). |
| Log Min Delay Req Interval | The minimum allowed interval between Delay Request messages. |
| Log Announce Interval | The interval between Announce messages. |
| Announce Receipt Timeout | The maximum allowed number of intervals without receiving any Announce messages. |
| Log Sync Interval Interval between sync messages. | |
| Delay Mechanism Always displays 1. | |
| Version Number Always displays 2. | |
Displaying the Boundary Clock Port Statistics
To display the Boundary Clock port statistics:
- Select Sync > 1588 > Boundary Clock > Port Statistics. The 1588 Boundary Clock – Port Statistics page opens.
Figure 367 1588 Boundary Clock – Port Statistics Page

• To display the statistics for a specific port in a separate page, click View.
- To clear the statistics for a specific port, select the port's row and click Clear.
• To clear the statistics for all Boundary Clock ports, click Clear All.
The Following Table lists and describes the Boundary Clock port statistics.
Table 120 Boundary Clock Port Statistics
| Parameter Definition | |
| Announce Transmitted | The number of Announce messages that have been transmitted from the port. |
| Sync Transmitted | The number of Sync messages that have been transmitted from the port. |
| Follow-Up Transmitted | The number of Follow-Up messages that have been transmitted from the port. |
| Delay Response Transmitted | The number of Delay Response messages that have been transmitted from the port. |
| Delay Request Transmitted | The number of Delay Request messages that have been transmitted from the port. |
| Announce Received | The number of Announce messages that have been received by the port. |
| Sync Received | The number of Sync messages that have been received by the port. |
| Follow-Up Received | The number of Follow-Up messages that have been received by the port. |
| Delay Response Received | The number of Delay Response messages that have been received by the port. |
| Delay Request Received | The number of Delay Request messages that have been received by the port. |
| Dropped Messages | The number of dropped messages. |
| Lost Messages The number of lost messages. | |
Disabling 1588 PTP
To disable 1588 PTP synchronization:
- Select Sync > 1588 > Boundary Clock > Port Parameters. The 1588 Boundary Clock – Port Parameters page opens.
- Select an interface and click Edit. The 1588 Boundary Clock – Port Parameters – Edit page opens.
- In the Admin field, select Disable.

Note
It is important to disable Boundary Clock on the interfaces before disabling 1588 PTP.
- Select Sync > 1588 > General Configuration. The 1588 – General Configuration page opens.
- In the 1588 PTP field, select Disable.
- Click Apply.

Note
Disabling 1588 PTP disables both Transparent Clock and Boundary Clock, and can drastically affect time synchronization performance in the entire network.
Chapter 11: Access Management and Security
This section includes:
- Quick Security Configuration
- Configuring the General Access Control Parameters
- Configuring the Password Security Parameters
- Configuring the Session Timeout
- Configuring Users
- Configuring RADIUS
- Configuring X.509 CSR Certificates and HTTPS
- Downloading and Installing an RSA Key
- Blocking Telnet Access
- Uploading the Security Log
- Uploading the Configuration Log

Note
Another security feature, HTTPS cipher hardening, can be configured via CLI. For instructions, see Configuring HTTPS Cipher Hardening (CLI).
PTP 820 devices support SDN, with NETCONF/YANG capabilities. This enables PTP 820 devices to be managed via SDN using Cambium's SDN controller, SDN Master. NETCONF must be enabled via CLI. See Enabling NETCONF (CLI).
Related topics:
- Changing Your Password
- Operating in FIPS Mode
Quick Security Configuration
The Web EMS provides a set of Quick Configuration pages that enable you to quickly configure the unit's access and security parameters. This section describes these pages, with cross references to the sections in which each parameter is described in depth.

Note
The Quick Security Configuration pages are only available in release 11.1 and higher.
Quick Security Configuration – General Parameters Page
To configure the FIPS Admin, import and export security settings, session timeout, a login banner, and AES-256 payload encryption:

Note
FIPS and AES-256 are not supported with PTP 820F.
- Select Quick Configuration > Security > General Parameters. The Quick Configuration Security General Parameters page opens.
Figure 368 Quick Configuration Security General Parameters Page

- In the FIPS Mode Admin field, you can enable or disable FIPS mode. For details, see Operating in FIPS Mode.

Note
Only certain versions supports FIPS mode. These versions include system release 8.3 and 11.1.
- The Import/Export security settings field determines whether security configurations are included in configuration backup files. If you select Enable, security configurations will not be included in backup files.
- In the Session timeout field, you can configure a session timeout, in minutes, from 1 to 60 minutes. The default session timeout is 10 minutes. For details, see Configuring the Session Timeout.
- In the Login Banner Text field, you can define a login banner of up to 2,000 bytes. This banner will appear every time a user establishes a connection with the Web EMS. The banner appears before the login prompt, so that users will always see the login banner and must manually close the banner before logging in to the Web EMS. For details, see Defining a Login Banner.
- In the Radio Payload Encryption area, select an interface and click Edit to define AES-256 payload encryption. For details, see Configuring AES-256 Payload Encryption.
Quick Security Configuration – Protocols Page
To configure the HTTP type, Telnet blocking, and SNMP parameters:
- Select Quick Configuration > Security > Protocols. The Quick Configuration Security Protocols page opens.
Figure 369 Quick Configuration Security Protocols Page
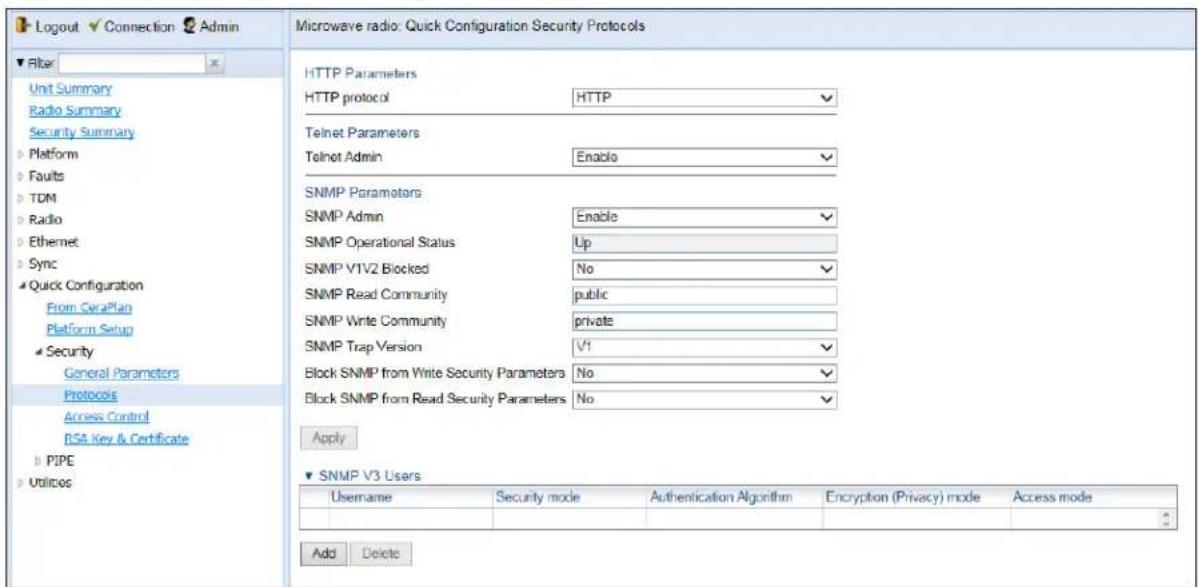
- In the HTTP protocol field, you can determine the web interface protocol for accessing the unit (HTTP or HTTPS). By default, the web interface protocol is HTTP. For details, see Enabling HTTPS (CLI).

Note
After changing the HTTP protocol, management is lost. To restore management, simply refresh the page.
- In the Telnet Admin field, you can block or enable telnet access to the unit. By default, telnet access is enabled. For details, see Blocking Telnet Access.
- In the SNMP Parameters area, you can configure the unit's SNMP parameters. For details, see Configuring SNMP. In addition, you can configure the following parameters only in the Quick Configuration Security Protocols page:
a. In the Block SNMP from Write Security Parameters field, select Yes if you want to block SNMP from writing security parameters.
b. In the Block SNMP from Read Security Parameters field, select Yes if you want to block SNMP from reading security parameters.
- When you are finished editing the parameters described above, click Apply.
- In the SNMP V3 Users are, you can click Add to add SNMP V3 users. For details, see Configuring SNMP.
Quick Security Configuration – Access Control Page
To configure parameters relating to users and login parameters:
13. Select Quick Configuration > Security > Access Control. The Quick Configuration Security Protocols page opens.
Figure 370 Quick Configuration Security Access Control Page

- In the Login & Password Management area, you can configure enhanced security requirements for user passwords and for logging into the unit. For details, see Configuring the Password Security Parameters and Configuring the General Access Control Parameters.
- When you are finished editing the login and password parameters, click Apply.
- In the User Accounts area, you can configure individual users:
- To add a user, click Add.
To edit an existing user, select the user in the User Accounts table and click Edit.
For details, see Configuring Users.
- To configure user profiles, click Access Control User Profiles. For details, see Configuring User Profiles.
Quick Security Configuration – RSA Key & Certificate Page
To download and install an RSA key and/or a Certificate Signing Request (CSR) file:
- Select Quick Configuration > Security > RSA Key & Certificate. The Quick Configuration Security RSA Key & Certificate page opens.
Figure 371 Quick Configuration Security RSA Key & Certificate Page

- In the RSA Key Download Status area, you can download and install an RSA key. For details, see Downloading and Installing an RSA Key.
- In the Download Certification Status area, you can download and install a CSR file. For details, see Configuring X.509 CSR Certificates and HTTPS.
Configuring the General Access Control Parameters
To avoid unauthorized login to the system, PTP 820 automatically blocks users upon a configurable number of failed login attempts. You can also configure PTP 820G and PTP 820F to block users that have not logged into the unit for a defined number of days.
To configure the blocking criteria:
- Select Platform > Security > Access Control > General. The Access Control General Configuration page opens.
Figure 372 Access Control General Configuration Page

-
In the Failure login attempts to block user field, select the number of failed login attempts that will trigger blocking. If a user attempts to login to the system with incorrect credentials this number of times consecutively, the user will temporarily be prevented from logging into the system for the time period defined in the Blocking period field. Valid values are 1-10. The default value is 3.
-
In the Blocking period (Minutes) field, enter the length of time, in minutes, that a user is prevented from logging into the system after the defined number of failed login attempts. Valid values are 1-60. The default value is 5.
-
In the Unused account period for blocking (Days) field, you can configure a number of days after which a user is prevented from logging into the system if the user has not logged in for the configured number of days. Valid values are 0, or 30-90. If you enter 0, this feature is disabled. The default value is 0.
-
Click Apply.
Once a user is blocked, you can unblock the user from the User Accounts page. To unblock a user:
- Select Platform > Security > Access Control > User Accounts. The Access Control User Accounts page opens (Figure 361).
- Select the user and click Edit. The Access Control User Accounts - Edit page opens.
Figure 373 Access Control User Accounts - Edit Page

- In the Blocked field, select No.
- Click Apply, then Close.
Configuring the Password Security Parameters
To configure enhanced security requirements for user passwords:
- Select Platform > Security > Access Control > Password Management. The Access Control Password Management page opens.
Figure 374 Access Control Password Management Page

-
In the Enforce password strength field, select Yes or No. When Yes is selected:
-
Password length must be at least eight characters.
-
Password must include characters of at least three of the following character types: lower case letters, upper case letters, digits, and special characters. For purposes of meeting this requirement, upper case letters at the beginning of the password and digits at the end of the password are not counted.
○ A password cannot be repeated within five changes in password. -
In the Password change for first login field, select Yes or No. When Yes is selected, the system requires the user to change his or her password the first time the user logs in.
- In the Password aging (Days) field, select the number of days that user passwords will remain valid from the first time the user logs into the system. You can enter 20-90, or No Aging. If you select No Aging, password aging is disabled and passwords remain valid indefinitely.
- Click Apply.
Configuring the Session Timeout
By default, there is a 10 minute session timeout. If you do not perform any activity on the system for the period of time defined as the session timeout, the user session times out and you will have to log in to the system again.
To modify the session timeout:
- Select Platform > Security > Protocols Control. The Protocols Control page opens.
Figure 375 Protocols Control Page

- In the Session timeout (Minutes) field, select a session timeout, in minutes, from 1 to 60.
- Click Apply.
Configuring Users
This section includes:
- User Configuration Overview
- Configuring User Profiles
- Configuring Users Accounts
Related topics:
- Changing Your Password
User Configuration Overview
User configuration is based on the Role-Based Access Control (RBAC) model. According to the RBAC model, permissions to perform certain operations are assigned to specific roles. Users are assigned to particular roles, and through those role assignments acquire the permissions to perform particular system functions.
In the PTP 820G and PTP 820F GUI, these roles are called user profiles. Up to 50 user profiles can be configured. Each profile contains a set of privilege levels per functionality group, and defines the management protocols (access channels) that can be used to access the system by users to whom the user profile is assigned.
The system parameters are divided into the following functional groups:
- Security
- Management
- Radio
• TDM - Ethernet
- Synchronization
A user profile defines the permitted access level per functionality group. For each functionality group, the access level is defined separately for read and write operations. The following access levels can be assigned:
- None – No access to this functional group.
- Normal – The user has access to parameters that require basic knowledge about the functional group.
- Advanced – The user has access to parameters that require advanced knowledge about the functional group, as well as parameters that have a significant impact on the system as a whole, such as restoring the configuration to factory default settings.
Configuring User Profiles
User profiles enable you to define system access levels. Each user must be assigned a user profile. Each user profile contains a detailed set of read and write permission levels per functionality group.
The system includes a number of pre-defined user profiles. You can edit these profiles, and add user profiles. All together, the system supports up to 50 user profiles.
To add a user profile:
- Select Platform > Security > Access Control > User Profiles. The Access Control User Profiles page opens.
Figure 376 Access Control User Profiles Page
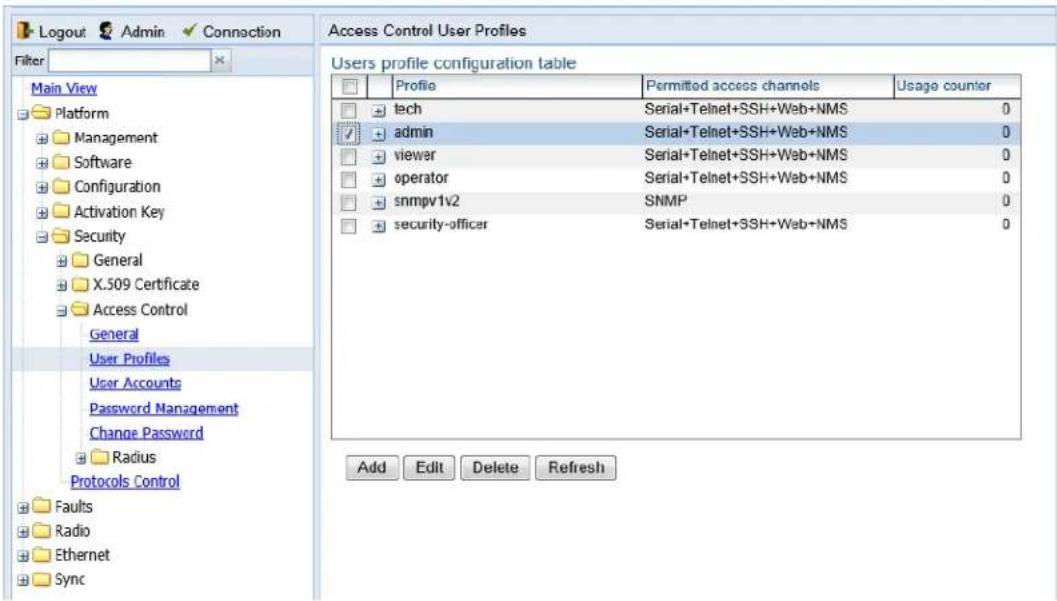
- Click Add. The Access Control User Profiles - Add page opens.
Figure 377 Access Control User Profiles - Add Page
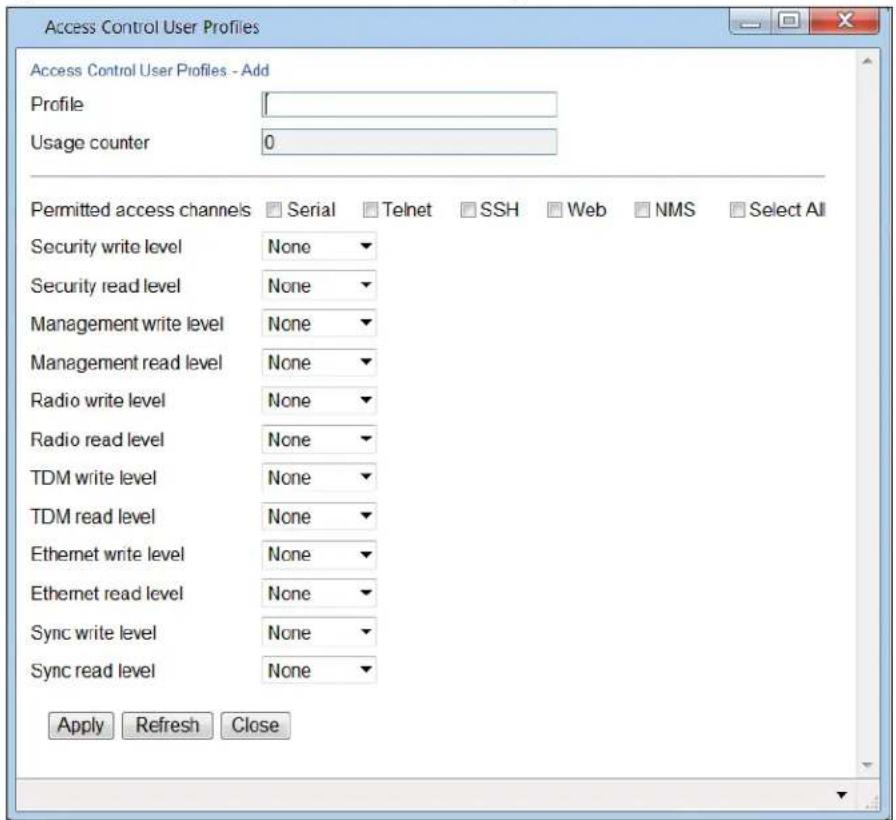
- In the Profile field, enter a name for the profile. The profile name can include up to 49 characters. Once you have created the user profile, you cannot change its name.

Note
The Usage counter field displays the number of users to whom the user profile is assigned.
- In the Permitted access channels row, select the access channels the user will be permitted to use to access the system.
- For each functionality group, select one of these options for write level and read level. All users with this profile will be assigned these access levels:
○ None
○ Normal
- Advanced
- Click Apply, then Close.
To view a user profile, click + next to the profile you want to view.
To edit a user profile, select the profile and click Edit. You can edit all of the profile parameters except the profile name.
To delete a user profile, select the profile and click Delete.

Note
You cannot delete a user profile if the profile is assigned to any users.
Configuring Users Accounts
You can configure up to 2,000 users. Each user has a user name, password, and user profile. The user profile defines a set of read and write permission levels per functionality group. See Configuring User Profiles.
To add a new user:
- Select Platform > Security > Access Control > User Accounts. The Access Control User Accounts page opens.
Figure 378 Access Control User Accounts Page

- Click Add. The Access Control User Profiles - Add page opens.
Figure 379 Access Control User Accounts - Add Page
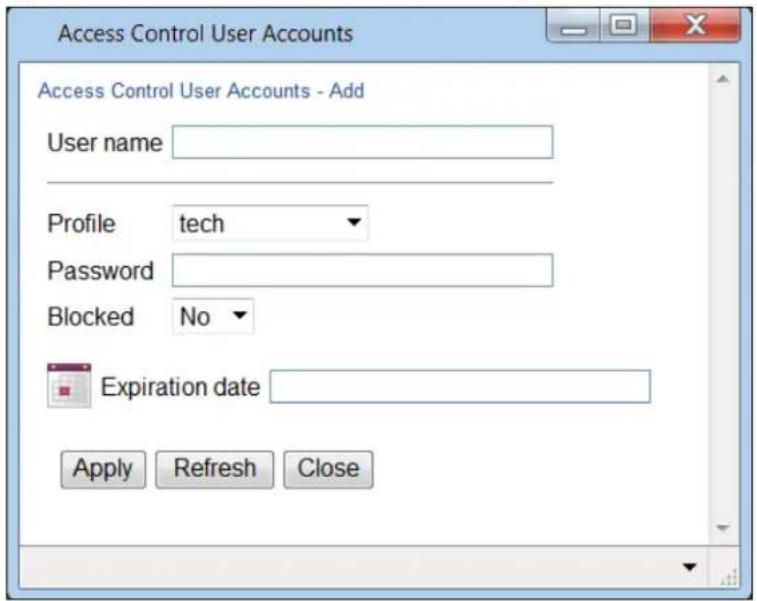
- In the User name field, enter a user name for the user. The user name can be up to 32 characters.
- In the Profile field, select a User Profile. The User Profile defines the user's access levels for functionality groups in the system. See Configuring User Profiles.
-
In the Password field, enter a password for the user. If Enforce Password Strength is activated (see Configuring the Password Security Parameters), the password must meet the following criteria:
-
Password length must be at least eight characters.
-
Password must include characters of at least three of the following character types: lower case letters, upper case letters, digits, and special characters. For purposes of meeting this requirement, upper case letters at the beginning of the password and digits at the end of the password are not counted.
○ A password cannot be repeated within five changes in password. -
In the Blocked field, you can block or unblock the user. Selecting Yes blocks the user. You can use this option to block a user temporarily, without deleting the user from the system. If you set this option to Yes while the user is logged into the system, the user will be automatically logged out of the system within 30 seconds.

Note
Users can also be blocked by the system automatically. You can unblock the user by selecting No in the Blocked field. See Configuring the General Access Control Parameters.
- Optionally, in the Expiration date field, you can configure the user to remain active only until a defined date. After that date, the user automatically becomes inactive. To set an expiration date, click the calendar icon and select a date, or enter a date in the format dd-mm-yyyy.

Note
If no expiration date is configured, the user account will expire five years after the date configured on the unit.
In addition to the configurable parameters described above, the Access Control User Accounts page displays the following information for each user:
- Login Status – Indicates whether the user is currently logged into the system.
- Last Logout – The date and time the user most recently logged out of the system.
To edit a user's account details, select the user and click Edit. You can edit all of the user account parameters except the User name and password.
To add a user, click Add.
To delete a user, select the user and click Delete.
Configuring RADIUS
This section includes:
• RADIUS Overview
- Activating RADIUS Authentication
- Configuring the RADIUS Server Attributes
• Viewing RADIUS User Permissions and Connectivity
RADIUS Overview
The RADIUS protocol provides centralized user management services. PTP 820G and PTP 820F supports RADIUS server and provides a RADIUS client for authentication and authorization. When RADIUS is enabled, a user attempting to log into the system from any access channel (CLI, WEB, NMS) is not authenticated locally. Instead, the user's credentials are sent to a centralized standard RADIUS server which indicates to the PTP 820G or PTP 820F whether the user is known, and which privilege is to be given to the user.
The following RADIUS servers are supported:
- FreeRADIUS
• RADIUS on Windows Server (IAS) - Windows Server 2008
You can define up to two Radius servers. If you define two, one serves as the primary server and the other as the secondary server.
Activating RADIUS Authentication
To activate RADIUS authentication:
- Select Platform > Security > Access Control > Radius > Radius Configuration. The Radius Configuration page opens.
Figure 380 Radius Configuration Page

- In the Radius Admin field, select Enable.
- Click Apply
Configuring the RADIUS Server Attributes
To configure the RADIUS server attributes:
- Select Platform > Security > Access Control > Radius > Radius Configuration. The Radius Configuration page opens (Figure 363).
-
In the Radius Configuration table, select the line that corresponds to the RADIUS server you want to configure:
-
Select Server ID 1 to configure the Primary Radius server.
-
Select Server ID 2 to configure the Secondary Radius server.
-
Click Edit. The Radius Configuration – Edit page opens.
Figure 381 Radius Configuration – Edit Page

- In the IPV4 address field, enter the IP address of the RADIUS server.
- In the Port field, enter the port ID of the RADIUS protocol in the RADIUS server.
- In the Retries field, enter the number of times the unit will try to communicate with the RADIUS server before declaring the server to be unreachable.
- In the Timeout field, enter the length of time (in seconds) the device will wait during each communication with the Radius server before retrying if no response is received.
- In the Secret field, enter a text string that will serve as the password between the RADIUS server and the RADIUS client. The string must be between 22 and 128 characters long.
- Click Apply, then Close.
In addition to the configurable parameters described above, the Radius Configuration page displays the following information for each RADIUS server:
• Server Id – The server ID of the Radius server:
- 1 – The primary Radius server.
- 2 – The secondary Radius server.
- Connectivity Status – The connectivity status of the Radius server in the last attempted connection:
o True – The last connection attempt succeeded.
- False – The last connection attempt failed.
Viewing RADIUS User Permissions and Connectivity
You can view RADIUS user connectivity and permissions information for all Radius users currently connected.
To view RADIUS users:
- Select Platform > Security > Access Control > Radius > Radius Users. The Radius Users page opens.
Figure 382 Radius Users Page
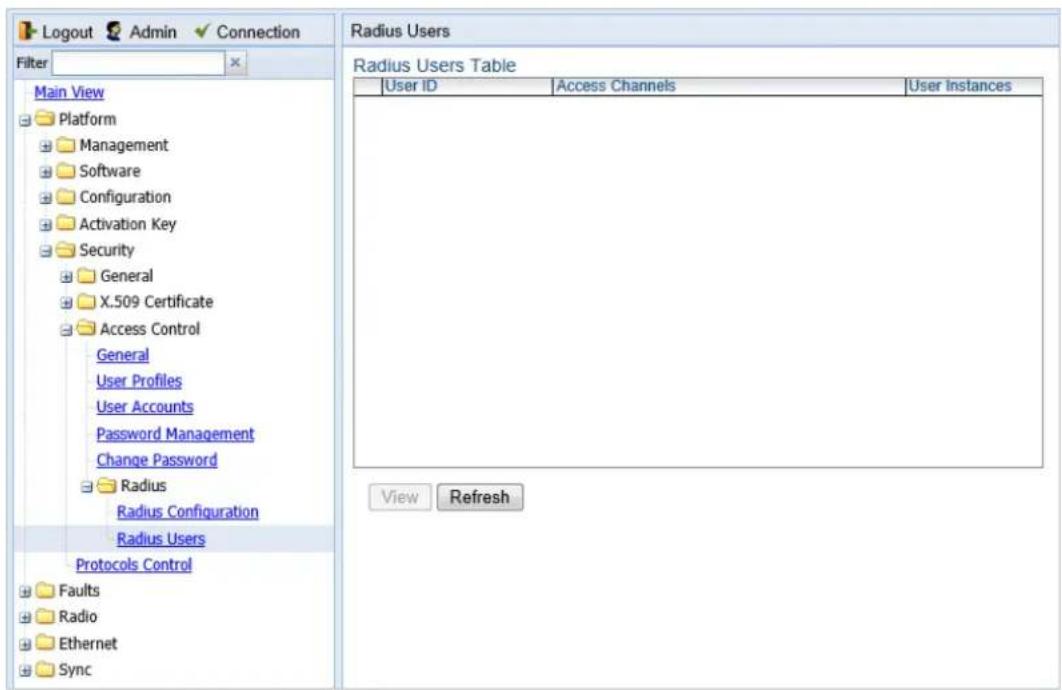
- The User ID column displays the user's name.
- The Access Channels column displays the access channels the user is allowed to use to access the unit.
- The User Instances column displays the number of open sessions the user currently has.
To view the user's authorized access levels, click + next to the user name. The page refreshes and displays the additional access level information.
Figure 383 Radius Users Page – Expanded
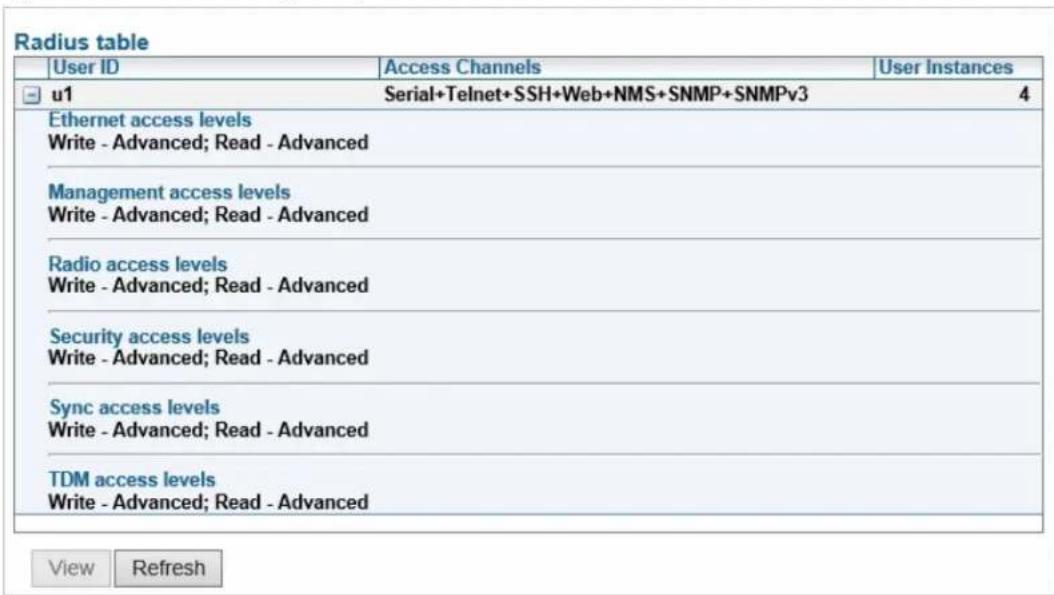
For each of the six functional groups (Ethernet, Management, Radio, Security, Sync, TDM), the page displays the Read access level (None, Regular, or Advanced), and the Write access level (None, Regular, or Advanced).
Configuring a RADIUS Server
If you want to use the PTP 820 RADIUS feature, you must first install a RADIUS server and configure it to work with the PTP 820 device.
The following subsections describe how to configure a Win2008 RADIUS server and a Linux FreeRADIUS server to work with a PTP 820. For the sake of simplicity, the subsections describe how to create three users: a Advanced user with Advanced read/write permissions, a Normal user with regular read/write permissions, and a Viewer user with no read/write permissions.
Configuring a Win 2008 RADIUS Server
The following sub-sections describe how to configure a Win 2008 RADIUS Server to work with PTP 820 device.
Step 1 – Creating Groups and Users
To create groups and users:
1 Create three user groups, as follows:
In the Server Manager, navigate to Configuration > Local Users and Groups.
ii Right click Groups and create the following three user groups:
- Radius_Advanced
- Radius_Normal
- Radius_Viewer
Figure 384 Server Manager – Creating User Groups

2 Create three users:
o u1
o u2
o u3
Figure 385 Server Manager – Creating Users
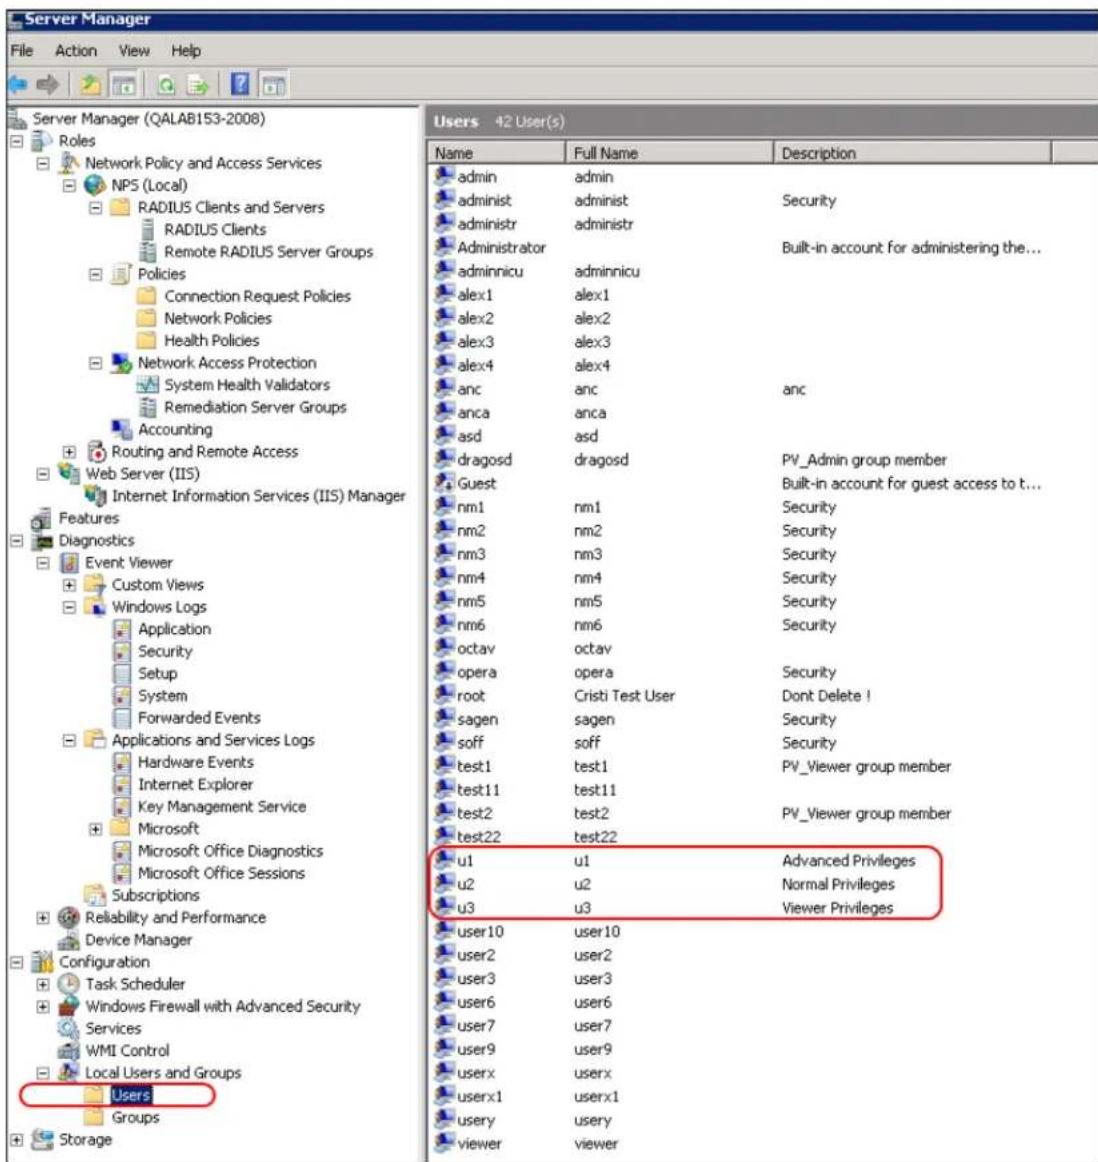
3 Attach each user to a group, as follows:
o Attach u1 to Radius_Advanced
○ Attach u2 to Radius_Normal
- Attach u3 to Radius_Viewer
Step 2 – Creating a RADIUS Client
Define the PTP 820 device as a RADIUS client, as follows:
1 In the Server Manager, navigate to Roles > Network Policy and Access Services > NPS (Local) > RADIUS Clients and Servers > RADIUS Clients.
2 Right-click RADIUS Clients, and select New RADIUS Client. The New RADIUS Client window appears.
Figure 386 Server Manager – Creating a RADIUS Client

3 In the New RADIUS Client window:
i Select the Enable this RADIUS client check box.
ii Enter a descriptive Friendly name for the device, such as PTP 820X.
iii Enter the device IP Address.
iv Select RADIUS Standard as the Vendor name.
v In the Shared Secret section, select Manual, and enter a Shared secret, then enter it again in Confirm shared secret. Note down the secret because you will need to enter the same value in the Secret field of the Radius Configuration – Edit page (Figure 364).
Step 3 – Creating a Network Policy
Create a network policy for each of the three groups you created: Radius_Advanced, Radius_Normal, Radius_Viewer. That is, follow the instructions in this section, for each of the three groups.
To create a network policy:
1 In the Server Manager, navigate to Roles > Network Policy and Access Service > NPS (Local) > Policies > Network Policies.
2 Right-click Network Policies, and select New. The New Network Policy wizard appears.
3 In the specify Network Policy Name and Connection Type, give the policy a descriptive name, indicating whether it is a policy for the Advanced, the Normal or the Viewer group.
Figure 387 Create Network Policy – Specify Name and Connection Type
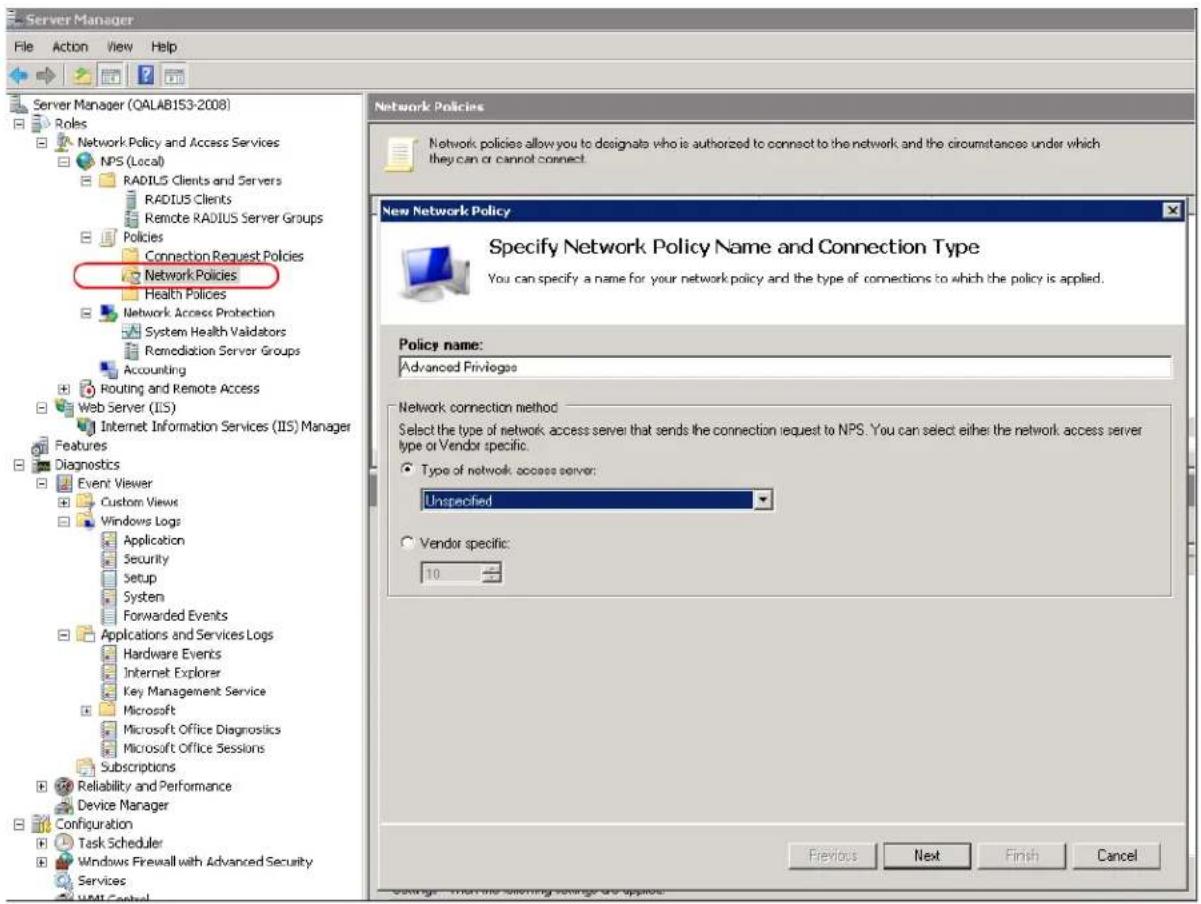
4 Click Next.
5 In the Specify Conditions window, click Add.
6 In the Select Condition window that appears, select the User Groups condition and click Add.
Figure 388 Create Network Policy – Select Condition

7 In the User Groups window that appears, click Add Groups.
8 In the Select Group window that appears, click Advanced.
9 In the Select Group window that appears, click Find Now to list all groups, and then select the appropriate group from the list: Radius_Advanced, Radius_Normal, or Radius_Viewer.
10 Click OK.
Figure 389 Create Network Policy – User Group added to Policy's Conditions

11 Click OK to save settings.
12 Click Next.
13 In the Specify Access Permission window that appears, select the Access Granted option.
Figure 390 Create Network Policy – Specifying Access Permission
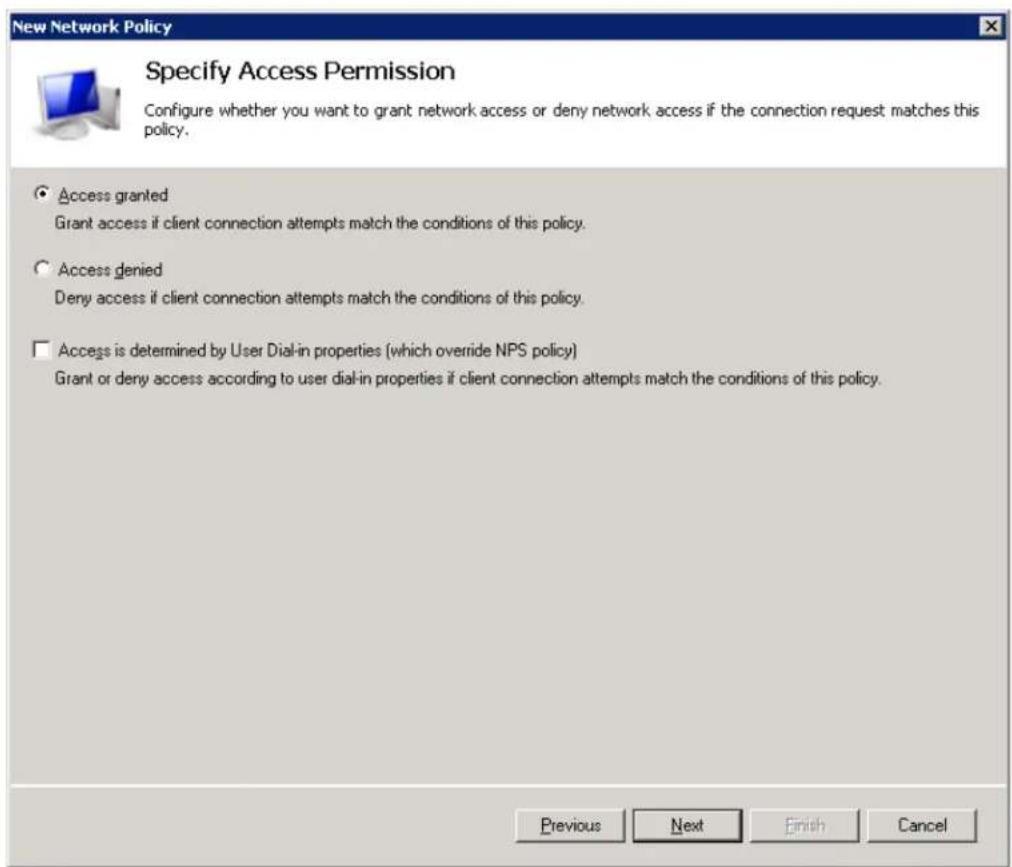
14 Click Next.
15 In the Configure Authentication Methods window that appears, make sure only the Unencrypted Authentication (PAP, SPAP) option is selected.
Figure 391 Create Network Policy – Configuring Authentication Methods
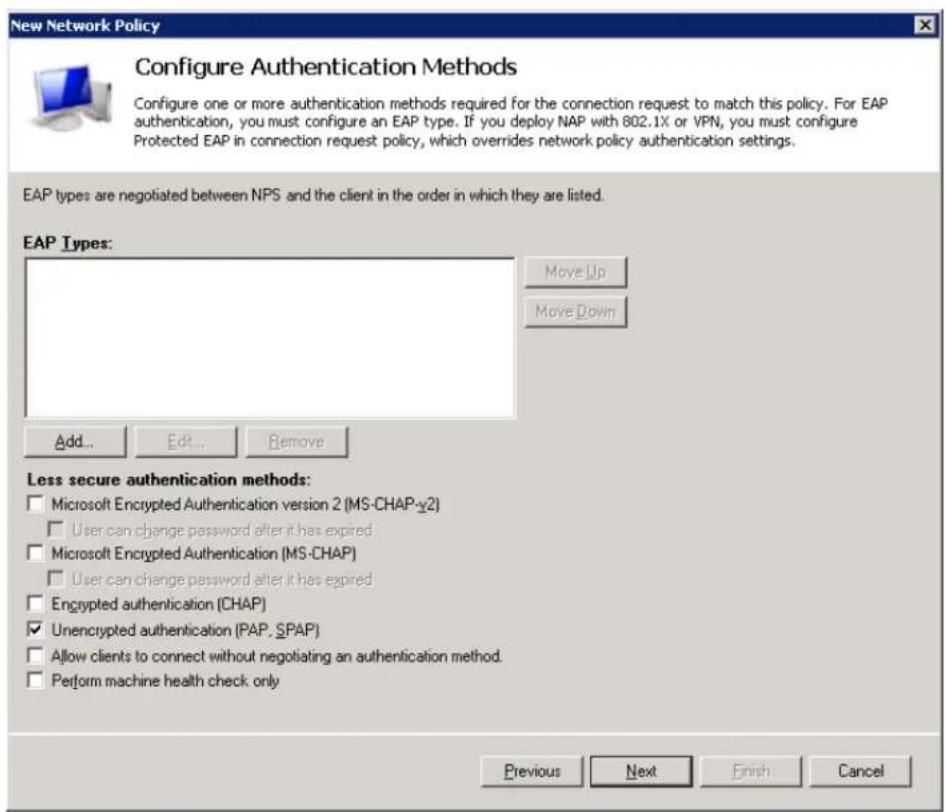
16 In the query window that appears, click No.
Figure 392 Create Network Policy – Insecure Authentication Method Query

17 In the Configure Constraints window that appears, click Next.
Figure 393 Create Network Policy – Configuring Constraints

18 In the Configure Settings window that appears:
i Remove all Standard RADIUS attributes. Make sure the Attributes table is empty.
Figure 394 Create Network Policy – Configuring Settings
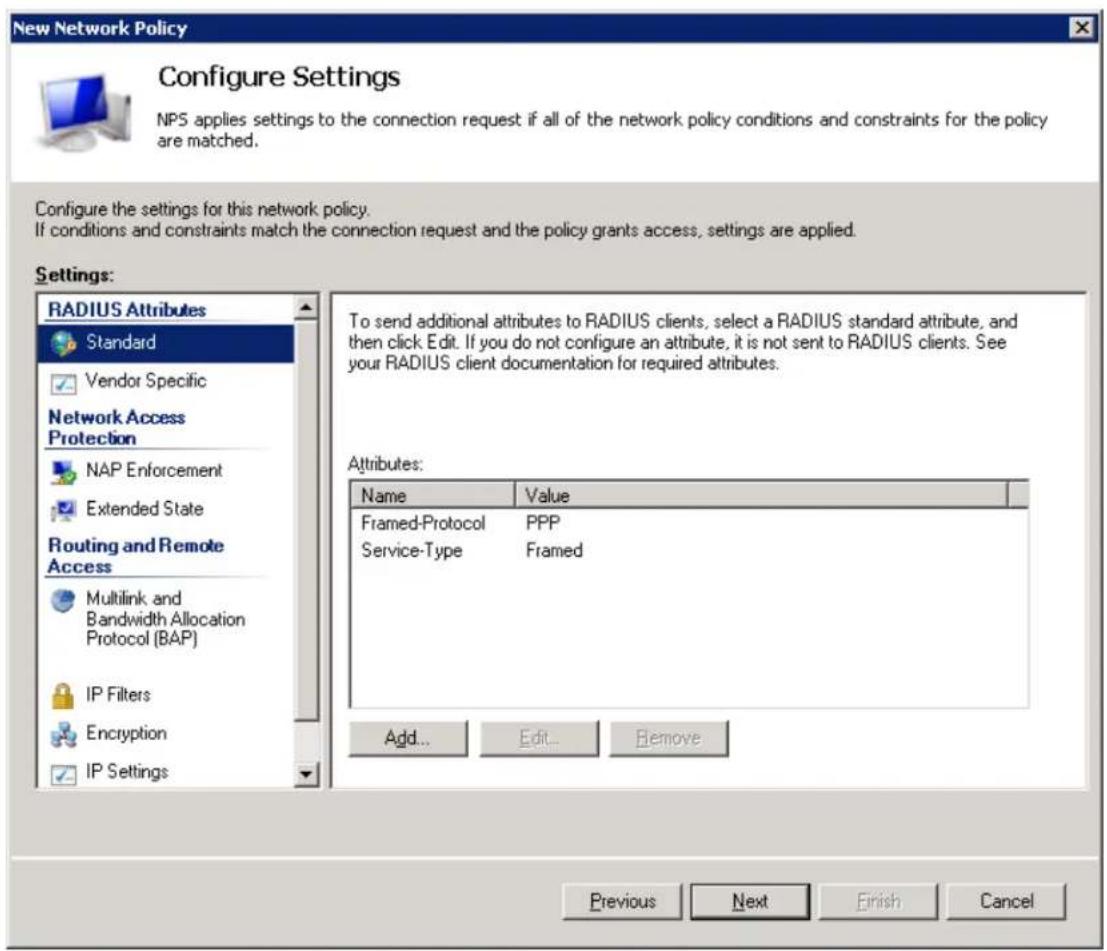
ii Select the Vendor Specific checkbox and click Add under the Attributes table.
19 In the Add Vendor Specific Attribute window that appears:
i Select Custom in the Vendor drop down field.
ii Click Add.
Figure 395 Create Network Policy – Adding Vendor Specific Attributes

20 In the Attribute Information window that appears, click Add.
Figure 396 Create Network Policy – Selecting to Add Attribute Information
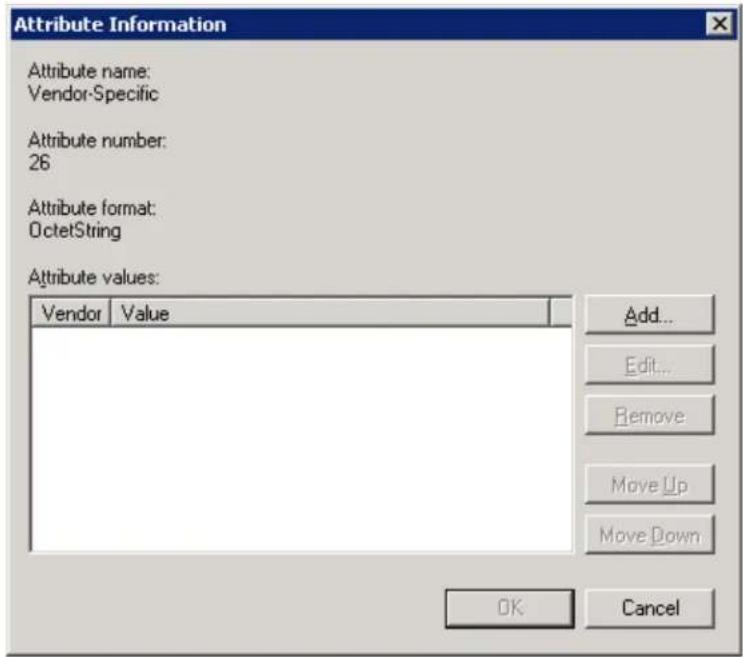
21 In the Vendor-Specific Attribute Information window that appears:
i Select Enter Vendor Code.
ii Enter 2281 in the Enter Vendor Code field.
iii Select the option Yes. It conforms.
iv Click Configure Attribute.
Figure 397 Create Network Policy – Specifying the Vendor

22 In the Configure VSA (RFC Compliant) window that appears, configure 13 attributes as follows:
For Vendor-assigned attribute number from 21 till 32, select Decimal in the Attribute format field. These twelve attributes define the Read access level (None, Regular, or Advanced), and the Write access level (None, Regular, or Advanced) for each of the six functional groups (Ethernet, Management, Radio, Security, Sync, TDM). Therefore, in the Attribute value field enter the value corresponding to the access level you wish to permit to members of the group whose policy you are configuring, where:
2 = Advanced
1 = Regular
0 = None
Thus for example, enter 2 for all twelve attributes if you are configuring a policy for the Radius_Advanced group. This gives Advanced read permissions and Advanced write permissions, for all six functional groups, to the members of the Radius_Advanced group.
Figure 398 Create Network Policy – Configuring Vendor-Specific Attribute Information

ii For Vendor-assigned attribute number 50, select Decimal in the Attribute format field. The Attribute value of this attribute defines the access channel(s) permitted to members of the group whose policy you are configuring. The Attribute value is the sum of the values corresponding to the access channels you wish to permit, where the value for each access channel is:
- none=0
- serial=1
- telnet=2
- ssh=4
- web=8
- nms=16
- snmp=3
- snmpV3
Thus for example, enter 127 to allow access from all channels: Serial + Telnet + SSH + Web + NMS + SNMP + SNMPv3;
Or enter 24 to allow access only from NMS + SNMP channels. iii Click OK.
23 Click OK.
The following figure shows the Attributes table for the Radius_Advanced group, where access to the device is allowed from all channels.
Figure 399 Create Network Policy – Example of Vendor-Specific Attribute Configuration

24 Close all opened windows and click Next.
25 In the Completing New Network Policy window, click Finish.
26 Reset the Network Policy Server (NPS) by stopping and starting the NPS service as follows:
i Right click the NPS (Local) node, and select Stop NPS Service.
ii Right click the NPS (Local) node, and select Start NPS Service.
Figure 400 Create Network Policy – Stopping/Starting NPS Services

Configuring a Linux FreeRADIUS Server
The following sub-sections describe how to configure a Linux FreeRADIUS server to work with PTP 820 device.
To so do, you will need to modify the following three files:
/etc/raddb/users
• /etc/raddb/clients.conf
• /usr/share/freeradius/dictionary.cambium
Step 1 – Creating Users
This step describes how to create the following three users:
• u1 – with advanced read/write privileges, password 1111
• u2 – with normal read/write privileges, password 2222
• u3 – with no read/write privileges, password 3333
To create these RADIUS users:
1 Add the users in the /etc/raddb/users file, using any editor you like, according to the following example:
<h1 id="user1-advanced-privileges">user1 - advanced privileges</h1>
u1 auth-type := local, Cleartext-Password := "1111"
security-ro = advanced,
security-wo = advanced,
mng-ro = advanced,
mng-wo = advanced,
radio-ro = advanced,
radio-wo = advanced,
tdm-ro = advanced,
tdm-wo = advanced,
eth-ro = advanced,
eth-wo = advanced,
sync-ro = advanced,
sync-wo = advanced,
access_channel = ulaccesschannel,
fall-through = yes

<h1 id="user2-regular-privileges">user2 - regular privileges</h1>
u2 auth-type := local, Cleartext-Password := "2222"
security-ro = regular,
security-wo = regular,
mng-ro = regular,
mng-wo = regular,
radio-ro = regular,
radio-wo = regular,
tdm-ro = regular,
tdm-wo = regular,
eth-ro = regular,
eth-wo = regular,
sync-ro = regular,
sync-wo = regular,
access_channel = u2accesschannel,
fall-through = yes

<h1 id="user3-no-privilege-viewer">user3 - no privilege (viewer)</h1>
u3 auth-type := local, Cleartext-Password := "3333"
security-ro = none,
security-wo = none,
mng-ro = none,
mng-wo = none,
radio-ro = none,
radio-wo = none,
tdm-ro = none,
tdm-wo = none,
eth-ro = none,
eth-wo = none,
sync-ro = none,
sync-wo = none,
access_channel = u3accesschannel,
fall-through = yes
2 Save the changes in the /etc/raddb/users file.
Step 2 – Defining the Permitted Access Channels
The access_channel of each user we configured in the /etc/raddb/users file, defines the channels through which that user is allowed to access the unit.
This is done by summing the values corresponding to the allowed channels, where the values are:
<h3 id="none-0">none 0</h3>
<h3 id="serial-1">serial 1</h3>
<h3 id="telnet-2">telnet 2</h3>
<h3 id="ssh-4">ssh 4</h3>
<h3 id="web-8">web 8</h3>
<h3 id="nms-16">nms 16</h3>
<h3 id="snmp-32">snmp 32</h3>
<h3 id="snmpv3-64">snmpV3 64</h3>
For example:
- The value 127 denotes permission to access the device from all channels:
Serial + Telnet + SSH + Web + NMS + SNMP + SNMPv3
- The value 24 indicates permission to access the device only from the Web + NMS channels.
To define each user's access channels:
1 In the usr/share/freeradius/dictionary.cambium file, configure the values of the access channels according to the following example:
<h3 id="access-channel-for-u1-userserialtelnetsshwebnmssnmpsnmpv4">access channel for u1 user:serial+telnet+ssh+web+nms+snmp+snmpV4</h3>
VALUE ACCESS_CHANNEL ulaccesschannel 127
2 Save the changes to the usr/share/freeradius/dictionary.cambium file.
Step 3 – Specifying the RADIUS client
This step describes how to define a device as a RADIUS client. The RADIUS server accepts attempts to connect to a device only if that is device is defined as a RADIUS client.
To define a device as a RADIUS client:
1 In the /etc/raddb/clients.conf file, add the device according to the following example.
The example shows how to add PTP 820G device with IP address 192.168.1.118:
<h1 id="ip20-g">IP20-G</h1>
client 192.168.1.118 {
    secret = default_not_applicable
    shortname = cambium-PTP 820G
}
Keep in mind:
The secret must be between 22 and 128 characters long. Note down the secret because you will need to enter the same value in the Secret field of the Radius Configuration – Edit page (Figure 364).
o The shortname is not mandatory, but should be added, and should be different for each RADIUS client.
2 Save the changes to the /etc/raddb/clients.conf file.
Step 4 – Restarting the RADIUS client
After configuring all of the above, restart the RADIUS process.
To restart the RADIUS process:
1 Stop the process by entering:
killall -9 radiusd
2 Start the process running in the background by entering:
radius -X &

Note
To check the logs each time a user connects to the server, enter:
radius -X &.
Configuring X.509 CSR Certificates and HTTPS
The web interface protocol for accessing PTP 820G or PTP 820F can be configured to HTTP (default) or HTTPS. It cannot be set to both at the same time.
Before setting the protocol to HTTPS, you must:
- Create and upload a CSR file. See Generating a Certificate Signing Request (CSR) File.
- Download the certificate to the PTP 820G or PTP 820F and install the certificate. See Downloading a Certificate.
- Enable HTTPS. This must be performed via CLI. See Enabling HTTPS (CLI).
When uploading a CSR and downloading a certificate, the PTP 820G or PTP 820F functions as an SFTP client. You must install SFTP server software on the PC or laptop you are using to perform the upload or download. For details, see Configuring the Internal Ports for FTP or SFTP.

Note
For these operations, SFTP must be used.
Generating a Certificate Signing Request (CSR) File

Note
If you need a customized public RSA key, you must download and install the RSA key first, before generating a CSR file. Otherwise, the CSR file will include the current public RSA key. See Downloading and Installing an RSA Key.
To generate a Certificate Signing Request (CSR) file:
- Select Platform > Security > X.509 Certificate > CSR. The Security Certificate Request page opens.
Figure 401 Security Certificate Request Page

- In the Common Name field, enter the fully-qualified domain name for your web server. You must enter the exact domain name.
- In the Organization field, enter the exact legal name of your organization. Do not abbreviate.
- In the Organization Unit field, enter the division of the organization that handles the certificate.
- In the Locality field, enter the city in which the organization is legally located.
- In the State field, enter the state, province, or region in which the organization is located. Do not abbreviate.
- In the Country field, enter the two-letter ISO abbreviation for your country (e.g., US).
- In the Email field, enter an e-mail address that can be used to contact your organization.
- In the File Format field, select the PEM file format. Note that the DER file format is planned for future release.

Note
In this version, only PEM is supported.
-
Click Apply to save your settings.
-
Click FTP Parameters to display the FTP Parameters page.
Figure 402 FTP Parameters Page (Security Certificate Request)

- In the Username field, enter the user name you configured in the SFTP server.
- In the Password field, enter the password you configured in the SFTP server. If you did not configure a password for your SFTP user, simply leave this field blank.
- In the Path field, enter the directory path to which you are uploading the CSR. Enter the path relative to the SFTP user's home directory, not the absolute path. To leave the path blank, enter //.
- In the File Name field, enter the name you want to give to the exported CSR.
- If the IP address family is configured to be IPv4, enter the IPv4 address of the PC or laptop you are using as the SFTP server in the Server IP address field. See Defining the IP Protocol Version for Initiating Communications.
- If the IP address family is configured to be IPv6, enter the IPv6 address of the PC or laptop you are using as the SFTP server in the Server IPv6 address field. See Defining the IP Protocol Version for Initiating Communications.
- Click Apply, then Close to save the FTP parameters and return to the Security Log Upload page.
- Click Generate & Upload. The file is generated and uploaded.
The CSR Status field displays the status of any pending CSR generation and upload. Possible values are:
- Ready – The default value, which appears when CSR generation and upload is in progress.
- File-in-transfer – The upload operation is in progress.
- Success – The file has been successfully uploaded.
- Failure – The file was not successfully uploaded.
The CSR Percentage field displays the progress of any current CSR upload operation.
Downloading a Certificate
To download a certificate:
- Select Platform > Security > X.509 Certificate > Download & Install. The Security Certification Download and Install page opens.
Figure 403 Security Certification Download and Install Page

- Click FTP Parameters to display FTP Parameters page.
Figure 404 FTP Parameters Page (Security Certificate Download & Install)

- In the Username field, enter the user name you configured in the SFTP server.
- In the Password field, enter the password you configured in the SFTP server. If you did not configure a password for your SFTP user, simply leave this field blank.
-
In the Path field, enter the directory path from which you are uploading the certificate. Enter the path relative to the SFTP user's home directory, not the absolute path. If the location is the home directory, it should be left empty. If the location is a sub-folder under the home directory, specify the folder name. If the shared folder is "C:\", this parameter can be left empty or populated with "//".
-
In the File Name field, enter the certificate's file name in the SFTP server.
-
If the IP address family is configured to be IPv4, enter the IPv4 address of the PC or laptop you are using as the SFTP server in the Server IPV4 address field. See Defining the IP Protocol Version for Initiating Communications.
-
If the IP address family is configured to be IPv6, enter the IPv6 address of the PC or laptop you are using as the SFTP server in the Server IPv6 address field. See Defining the IP Protocol Version for Initiating Communications.
-
Click Apply, then Closeto save the FTP parameters and return to the Security Log Upload page.
-
Click Download. The certificate is downloaded.
-
Click Install. The certificate is installed on the PTP 820G or PTP 820F.
Blocking Telnet Access
You can block telnet access to the unit. By default, telnet access is not blocked.
To block telnet access:
1 Select Platform > Security > Protocols Control. The Protocols Control page opens.
Figure 405 Protocols Control Page
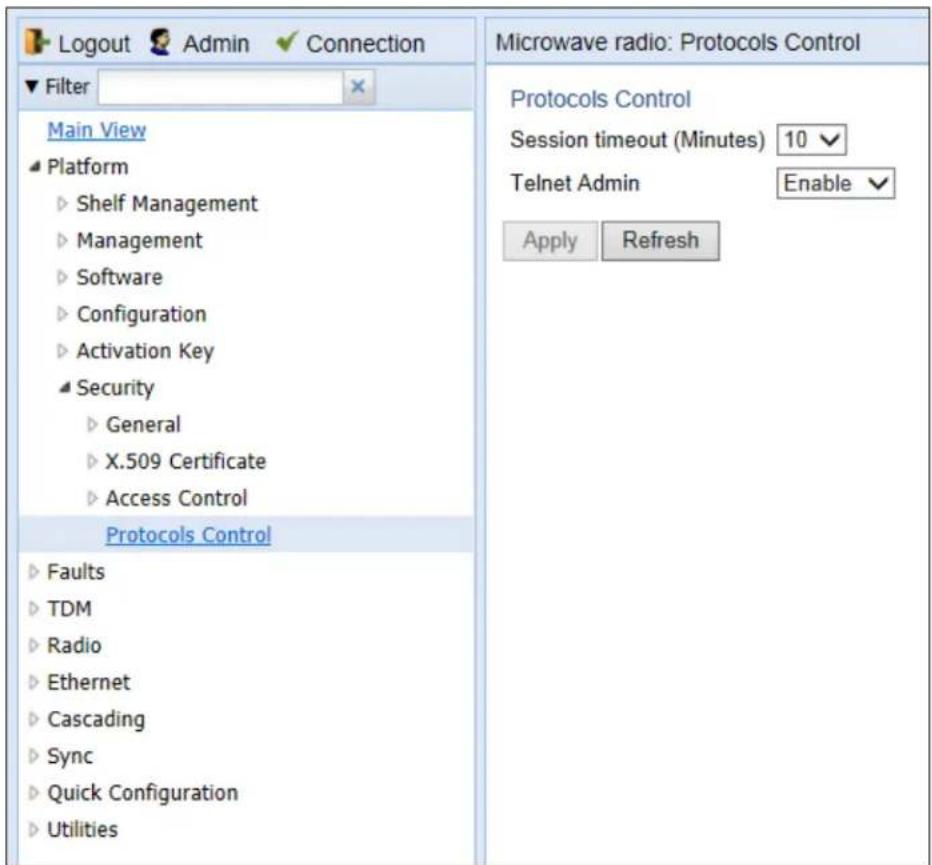
2 In the Telnet Admin field, select Disable to block telnet access. By default, telnet access is enabled (Enable).
3 Click Apply.
Uploading the Security Log
The security log is an internal system file which records all changes performed to any security feature, as well as all security related events.
When uploading the security log, the PTP 820G or PTP 820F functions as an FTP or SFTP client. You must install FTP or SFTP server software on the PC or laptop you are using to perform the import or export. For details, see Configuring the Internal Ports for FTP or SFTP.
To upload the security log:
- Install and configure an FTP server on the PC or laptop you are using to perform the upload. See Configuring the Internal Ports for FTP or SFTP.
- Select Platform > Security > General > Security Log Upload. The Security Log Upload page opens.
Figure 406 Security Log Upload Page

- Click FTP Parameters to display FTP Parameters page.
Figure 407 FTP Parameters Page (Security Upload Page)
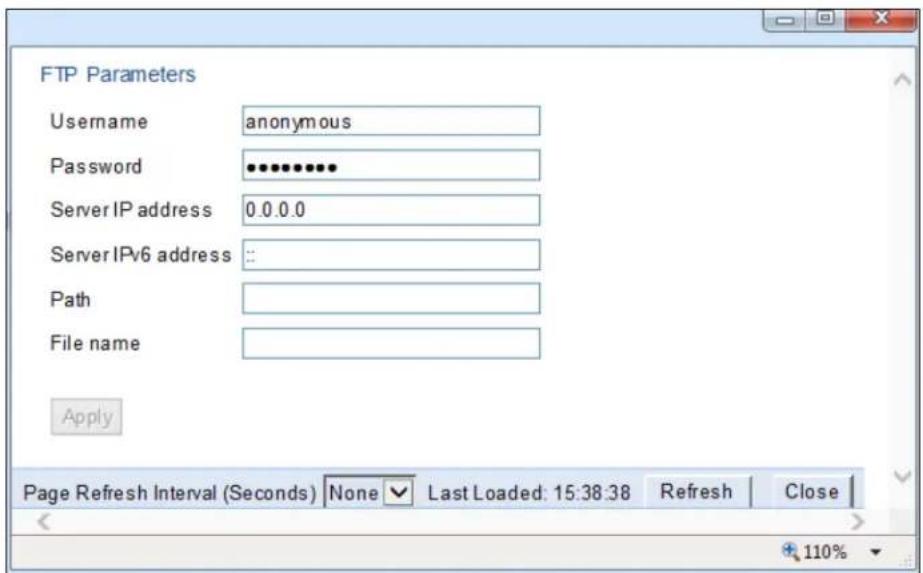
- In the Username field, enter the user name you configured in the FTP server.
-
In the Password field, enter the password you configured in the FTP server. If you did not configure a password for your FTP user, simply leave this field blank.
-
If the IP address family is configured to be IPv4, enter the IPv4 address of the PC or laptop you are using as the FTP server in the Server IP address field. See Defining the IP Protocol Version for Initiating Communications.
- If the IP address family is configured to be IPv6, enter the IPv6 address of the PC or laptop you are using as the FTP server in the Server IPv6 address field. See Defining the IP Protocol Version for Initiating Communications.
- In the Path field, enter the directory path to which you are uploading the files. Enter the path relative to the FTP user's home directory, not the absolute path. To leave the path blank, enter //.
- In the File name field, enter the name you want to give to the exported security log.
- Click Apply, then Closeto save the FTP parameters and return to the Security Log Upload page.
- Click Upload. The upload begins.
The File transfer operation status field displays the status of any pending security log upload. Possible values are:
- Ready – The default value, which appears when no file transfer is in progress.
- File-in-transfer – The upload operation is in progress.
- Success – The file has been successfully uploaded.
- Failure – The file was not successfully uploaded.
The Process percentage field displays the progress of any current security log upload operation.
Uploading the Configuration Log
The configuration log lists actions performed by users to configure the system. This file is mostly used for security, to identify suspicious user actions. It can also be used for troubleshooting.
When uploading the configuration log, the PTP 820G or PTP 820F functions as an FTP or SFTP client. You must install FTP or SFTP server software on the PC or laptop you are using to perform the upload. For details, see Configuring the Internal Ports for FTP or SFTP.
To upload the configuration log:
- Install and configure an FTP server on the PC or laptop you are using to perform the upload. See Configuring the Internal Ports for FTP or SFTP.
- Select Platform > Security > General > Configuration Log Upload. The Security Log Upload page opens.
Figure 408 Configuration Log Upload Page

- Click FTP Parameters to display FTP Parameters page.
Figure 409 FTP Parameters Page (Configuration Log Upload)
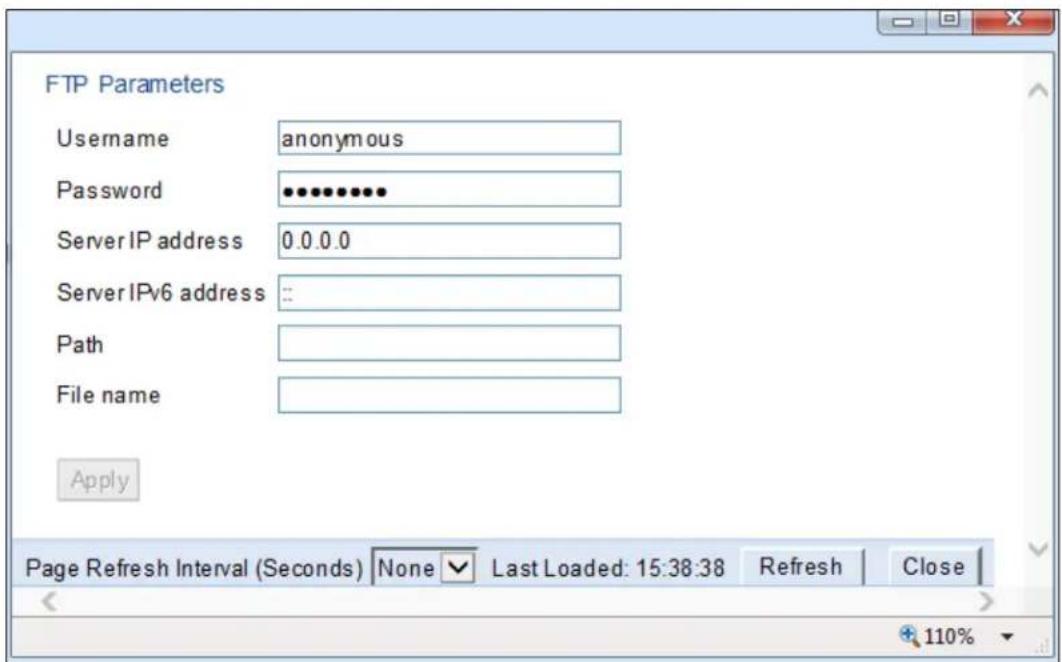
- In the Username field, enter the user name you configured in the FTP server.
- In the Password field, enter the password you configured in the FTP server. If you did not configure a password for your FTP user, simply leave this field blank.
- If the IP address family is configured to be IPv4, enter the IPv4 address of the PC or laptop you are using as the FTP server in the Server IP address field. See Defining the IP Protocol Version for Initiating Communications.
- If the IP address family is configured to be IPv6, enter the IPv6 address of the PC or laptop you are using as the FTP server in the Server IPv6 address field. See Defining the IP Protocol Version for Initiating Communications.
- In the Path field, enter the directory path to which you are uploading the files. Enter the path relative to the FTP user's home directory, not the absolute path. To leave the path blank, enter //.
- In the File name field, enter the name you want to give to the exported configuration log.

Note
The directory path and fie name, together, cannot be more than:
If the IP address family is configured to be IPv4: 236 characters
If the IP address family is configured to be IPv6: 220 characters
- Click Apply, then Close to save the FTP parameters and return to the Configuration Log Upload page.
- Click Upload. The upload begins.
The File transfer operation status field displays the status of any pending configuration log upload. Possible values are:
- Ready – The default value, which appears when no file transfer is in progress.
- File-in-transfer – The upload operation is in progress.
- Success – The file has been successfully uploaded.
- Failure – The file was not successfully uploaded.
The Process percentage field displays the progress of any current configuration log upload operation.
Chapter 12: Alarm Management and Troubleshooting
This section includes:
• Viewing Current Alarms
• Viewing Alarm Statistics
• Viewing the Event Log
• Editing Alarm Text and Severity
- Uploading Unit Info
• Performing Diagnostics

Note
CW mode, used to transmit a single or dual frequency tones for debugging purposes, can be configured using the CLI. See Working in CW Mode (Single or Dual Tone) (CLI).
Related topics:
- Configuring Trap Managers
- Alarms List

Note
You can configure a wait time of up to 120 seconds after an alarm is cleared in the system before the alarm is actually reported as being cleared. This prevents traps flooding the NMS in the event that some external condition causes the alarm to be raised and cleared continuously. The timeout for trap generationConfigured via CLI. By default, the timeout is 10 seconds. It can be enabled and disabled via CLI. See Configuring a Timeout for Trap Generation (CLI)..
Viewing Current Alarms
To display a list of current alarms in the unit:
- Select Faults > Current Alarms. The Current Alarms page opens. The Current Alarms page displays current alarms in the unit. Each row in the Current Alarms table describes an alarm and provides basic information about the alarm. For a description of the information provided in the Current Alarms page, see Table 114.
Figure 410 Current Alarms Page
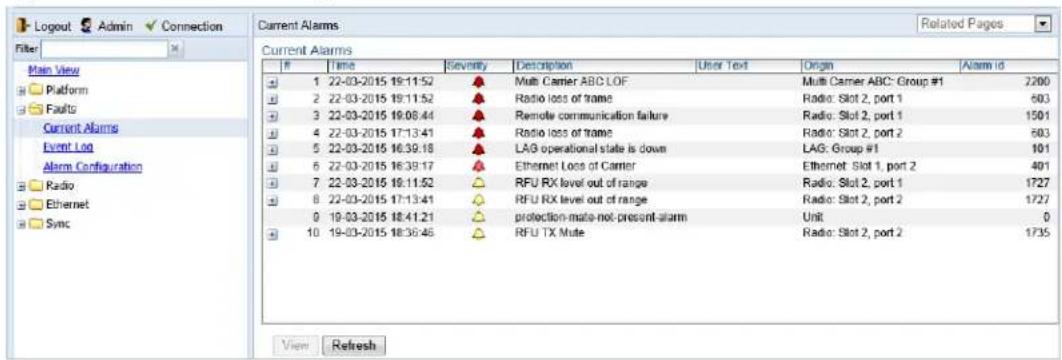
- To view more detailed information about an alarm, click + at the beginning of the row or select the alarm and click View.
Figure 411 Current Alarms - View Page
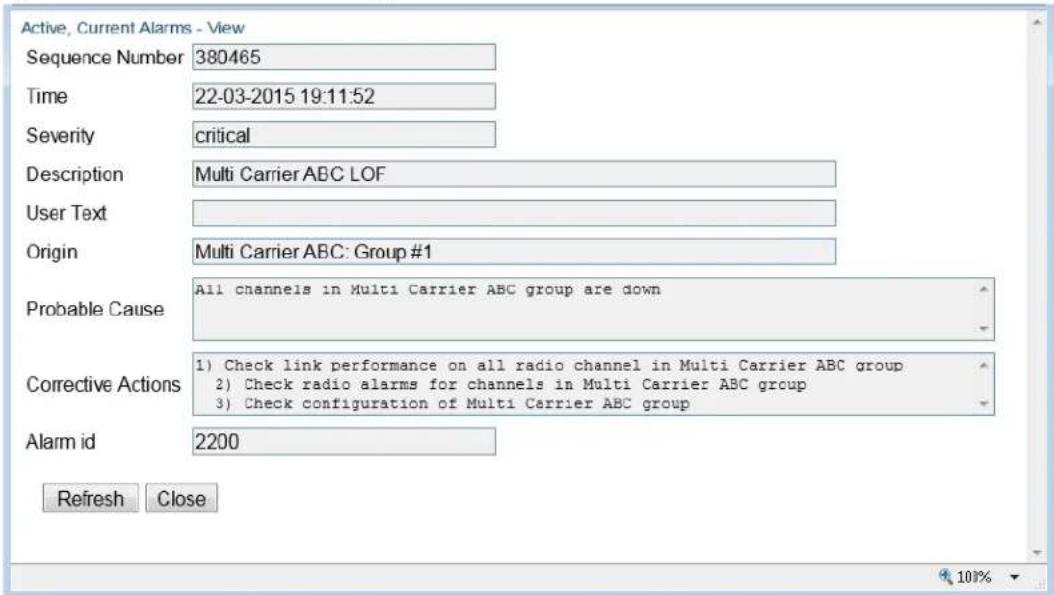
Table 121 Alarm Information
| Parameter Definition | |
| Sequence Number (#) | A unique sequence number assigned to the alarm by the system. |
| Time | The date and time the alarm was triggered. |
| Severity | The severity of the alarm. In the Current Alarms table, the severity is indicated by a symbol. You can display a textual description of the severity by holding the cursor over the symbol.Note: You can edit the severity of alarm types in the Alarm Configuration page. See Editing Alarms and Disabling Alarms. |
| Description | A system-defined description of the alarm. |
| User Text | Additional text that has been added to the system-defined description of the alarm by users.Note: You can add user text to alarms in the Alarm Configuration page. See Editing Alarms and Disabling Alarms. |
| Origin | The module that generated the alarm. |
| Probable Cause | This field only appears in the Current Alarms - View page. One or more possible causes of the alarm, to be used for troubleshooting. |
| Corrective Actions | This field only appears in the Current Alarms - View page. One or more possible corrective actions to be taken in troubleshooting the alarm. |
| Alarm ID | A unique ID that identifies the alarm type. |
Viewing Alarm Statistics
To display a summary of alarms per module and per interface:
- Select Faults > Alarm Statistics. The Alarm Statistics page opens.
Figure 412 Alarm Statistics Page
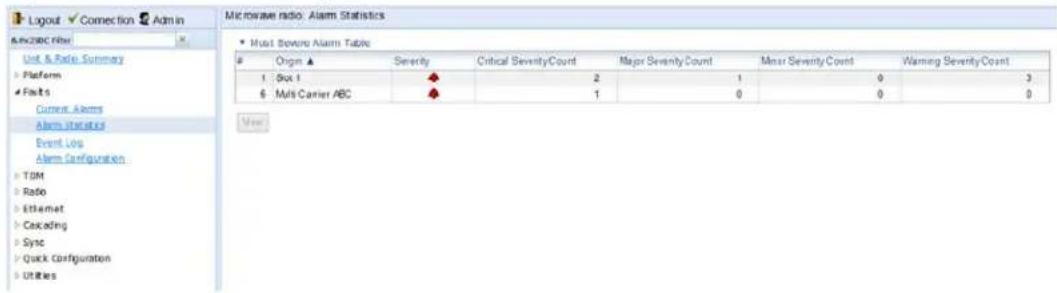
The Alarm Statistics page displays the number of current alarms per severity level for each module, interface, and virtual interface (such as Multi-Carrier ABC groups) in the unit. Only modules and interfaces for which one or more alarms are currently raised are listed in the Alarm Statistics page.
Viewing the Event Log
The Event Log displays a list of current and historical events and information about each event.
To display the Event Log:
- Select Faults > Event Log. The Event Log opens. For a description of the information provided in the Event Log, see Table 115 Event Log Information.
Figure 413 Event Log
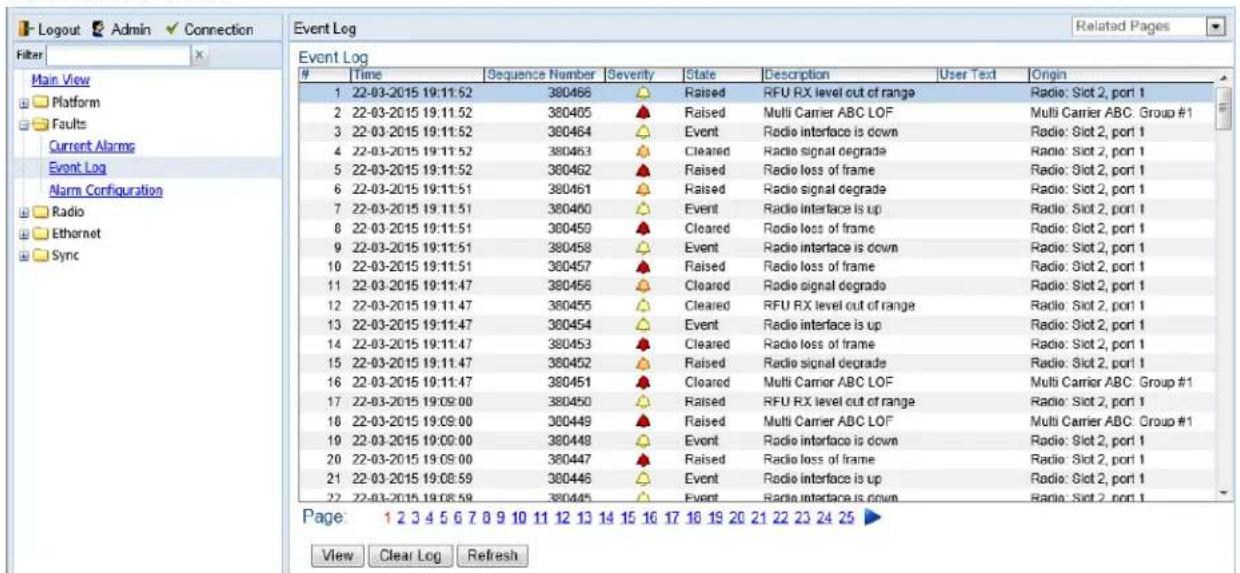
Table 122 Event Log Information
| Parameter Definition | |
| Time | The date and time the event was triggered. |
| Sequence Number (#) | A unique sequence number assigned to the event by the system. |
| Severity | The severity of the event. In the Event Log table, the severity is indicated by a symbol. You can display a textual description of the severity by holding the cursor over the symbol.Note: You can edit the severity of event types in the Alarm Configuration page. See Editing Alarms Disabling Alarms and Events. |
| State Indicates whether the event is currently raised or has been cleared. | |
| Description | A system-defined description of the event. |
| User Text | Additional text that has been added to the system-defined description of the event by users.Note: You can add user text to events in the Alarm Configuration page.See Editing Alarms Disabling Alarms and Events. |
| Origin | The module that generated the event. |
Editing Alarms Disabling Alarms and Events
You can view a list of alarm types, edit the severity level assigned to individual alarm types, and add additional descriptive text to individual alarm types.
This section includes:
• Displaying Alarm Information
• Viewing the Probable Cause and Corrective Actions for an Alarm Type
• Editing Alarms and Disabling Alarms and Events
• Setting Alarms to their Default Values
Displaying Alarm Information
To view the list of alarms defined in the system:
- Select Faults > Alarm Configuration. The Alarm Configuration page opens. For a description of the information provided in the Alarm Configuration page, see Table 116 Alarm Configuration Page Parameters.
Figure 414 Alarm Configuration Page

Table 123 Alarm Configuration Page Parameters
| Parameter Definition | |
| Sequence Number (#) | A unique sequence number assigned to the row by the system. |
| Alarm ID | A unique ID that identifies the alarm type. |
| Severity | The severity assigned to the alarm type. You can edit the severity in the Alarm Configuration – Edit page. See Editing Alarms and Disabling Alarms and Events. |
| Description | A system-defined description of the alarm. |
| Additional Text | Additional text that has been added to the system-defined description of the alarm by users. You can edit the text in the Alarm Configuration – Edit page. See Editing Alarms and Disabling Alarms and Events. |
| Service Affecting | Indicates whether the alarm is considered by the system to be service-affecting (on) or not (off). |
Viewing the Probable Cause and Corrective Actions for an Alarm Type
Most alarm types include a system-defined probable cause and suggested corrective actions. To view an alarm type's probable cause and corrective actions, click + on the left side of the alarm type's row in the Alarm Configuration page. The Probable Cause and Corrective Actions appear underneath the alarm type's row, as shown below. If there is no +, that means no Probable Cause and Corrective Actions are defined for the alarm type.
Figure 415 Alarm Configuration Page – Expanded
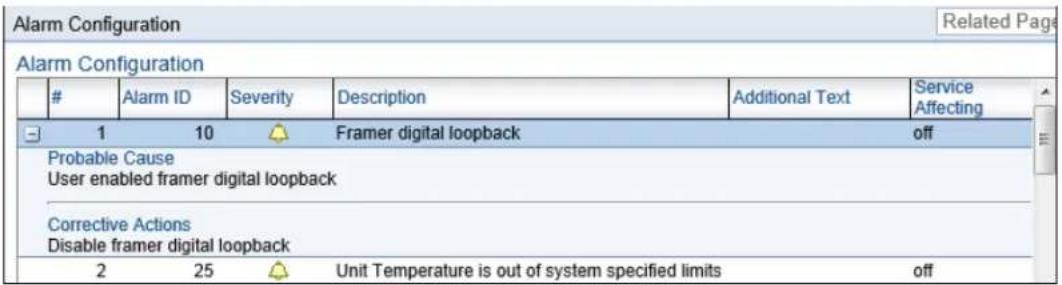
Editing Alarms and Disabling Alarms and Events
To change the severity of an alarm type and add additional text to the alarm type's description:
- Select the alarm type in the Alarm Configuration page (Figure 397).
- Click Edit. The Alarm Configuration - Edit page opens.
Figure 416 Alarm Configuration - Edit Page
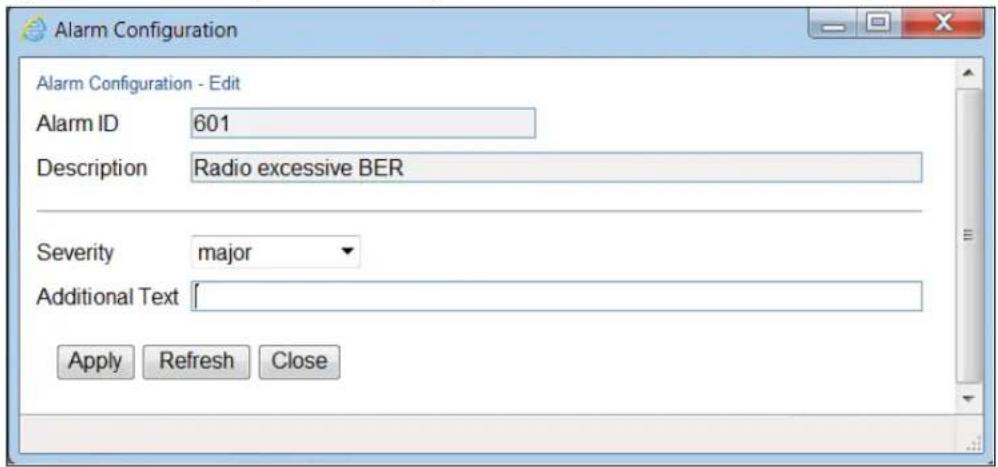
- Modify the Severity and/or Additional Text fields.
- In the Alarm group field, you can re-assign the Alarm group to which the alarm belongs. The Alarm group is used to determine which alarms trigger an external alarm output. For details, see Configuring the Output Alarm.
- Click Apply, then Close.
Setting Alarms to their Default Values
To set all alarms to their default severity levels, Alarm groups, and text descriptions, click Set All to Default in the Alarm Configuration page (Figure 397).
Configuring External Alarms
PTP 820G and PTP 820F includes a DB9 dry contact external alarms interface. This interface is located on the front panel. See External Alarms.
Table 117 shows the pin-outs for the external alarms interface.
Table 124 External Alarms Interface Pin-Outs
| Pin Number Description | |
 | 1 External Input Alarm #1 |
| 2 External Input Alarm #2 | |
| 3 External Input Alarm #3 | |
| 4 External Input Alarm #4 | |
| 5 External Input Alarm #5 | |
| 6 Relay #1, normally closed pin | |
| 7 Relay #1, common pin | |
| 8 Relay #1, normally open pin | |
| 9 GND | |
Configuring Input Alarms
To enable and configure the input alarms:
1 Select Platform > Management > External Alarms > Input. The External Alarms Input page opens.
Figure 417 External Alarms Input Page
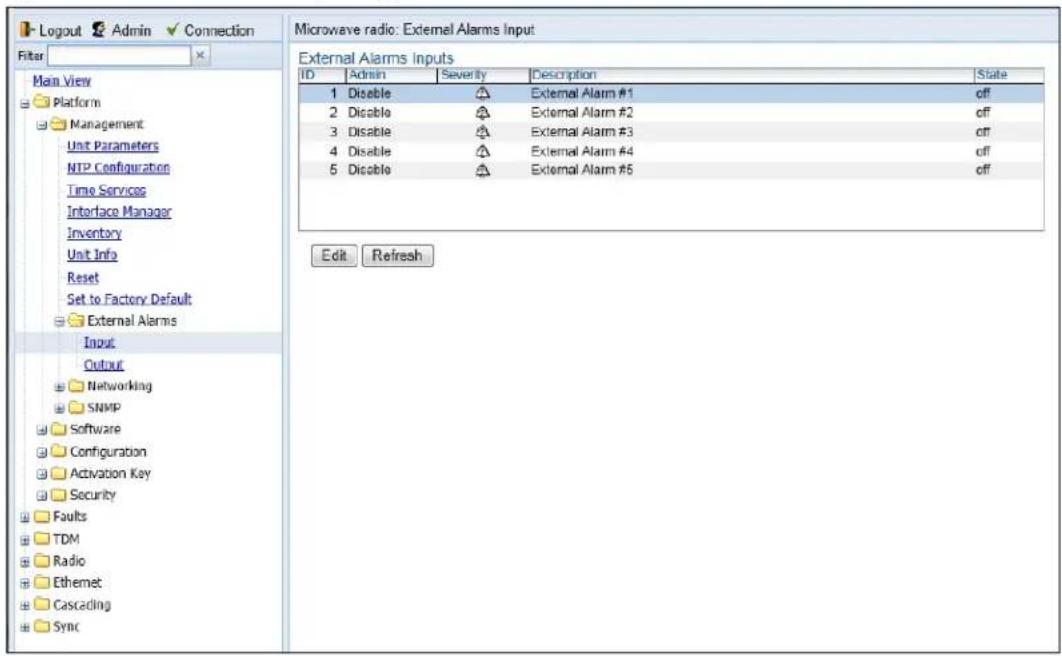
2 Select the alarm input you want to configure.
3 Click Edit. The External Alarms Input – Edit page opens.
Figure 418 External Alarms Input – Edit Page

4 In the Admin field, select Enable to enable the alarm input or Disable to disable the alarm input.
5 In the Severity field, select the alarm severity:
- Indeterminate
○ Critical
○ Major
○ Minor
○ Warning
6 In the Description field, enter text to describe the alarm input. When the alarm is raised, this appears as the alarm description text.
7 Click Apply, then Close.
The ID field identifies the external alarm input. See Table 117 External Alarms Interface Pin-Outs.
The State field indicates whether the alarm is currently raised (on) or cleared (off).
Configuring Voltage Alarm Thresholds and Masking Undervoltage Alarms
Some hardware models include dual power interfaces for power redundancy. If you are only using one feed in a dual-feed configuration, it is recommended to mask the unused feed in order to prevent an unnecessary undervoltage alarm.
You can also configure undervoltage and overvoltage alarm thresholds. The default thresholds for PTP 820F, PTP 820G are:
• Undervoltage Raise Threshold: 40V
• Undervoltage Clear Threshold: 42V
• Overvoltage Raise Threshold: 60V
• Overvoltage Clear Threshold: 58V
These thresholds determine when the following alarms are raised and cleared:
• Alarm #32000: Under voltage
• Alarm #32001: Over voltage
To mask undervoltage alarms and configure voltage alarm thresholds:
1 Select Faults > Voltage Alarm Configuration. The Voltage Alarm Configuration page opens.

Figure 419: Voltage Alarm Configuration Page
2 To mask the undervoltage alarm, select Enable in the appropriate row in the Alarm Parameters section of the Alarm Configuration page, then click Apply:
- Mask undervoltage alarm on 1st DC power feed – Select Enable to mask the undervoltage alarm for the power feed on the left.
- Mask undervoltage alarm on 2nd DC power feed – Select Enable to mask the undervoltage alarm for the power feed on the right.
3 To change the undervoltage and overvoltage alarm thresholds, click Edit. The Voltage Alarm Configuration – Edit page opens.

Figure 420: Voltage Alarm Configuration – Edit Page
4 Select the thresholds you want in the Undervoltage clear threshold (V), Undervoltage raise threshold (V), Overvoltage clear threshold (V), and Overvoltage raise threshold (V) fields. The configurable values for these thresholds are 0-100V.
5 Click Apply.
In addition to adding the ability to configure these alarm thresholds, Release 10.9 adds PMs that indicate, per 15-minute and 24-hour periods:
• The number of seconds the unit was in an undervoltage state during the measured period.
• The number of seconds the unit was in an overvoltage state during the measured period.
• The lowest voltage during the measured period.
• The highest voltage during the measured period.
These PMs are displayed via CLI. For instructions, see Configuring Voltage Alarm Thresholds and Displaying Voltage Threshold PMs (CLI).
Configuring the Output Alarm
By default, all alarms are assigned to a pre-defined alarm group. You can define which group will trigger the external alarm output. This includes the option to determine that alarms from all groups will trigger the external alarm output.
For each alarm, you can edit the default group setting. You can also assign alarms to a user-defined group and select that group as the group that will trigger the external alarm output. For instructions on editing an alarm's group setting, see Editing Alarms and Disabling Alarms and Events.
To enable and configure the output alarm:
1 Select Platform > Management > External Alarms > Output. The External Alarms Output page opens.
Figure External Alarms Output Page

2 In the Admin field, select enable to enable the output alarm or disable to disable the output alarm.
3 In the Group field, select from a list of alarm groups, or select all groups. When an alarm belonging to the selected group is raised, the alarm output is triggered. The available alarm groups are:
o Communications
o Quality of Service
- Processing
o Equipment
o Environmental
- User Defined
○ All groups

Note
For a list of alarms and their default groups, see Alarms List.
4 Click Apply, then Close.
Uploading Unit Info
You can generate a Unit Information file, which includes technical data about the unit. This file can be uploaded and forwarded to customer support, at their request, to help in analyzing issues that may occur. You can upload the Unit Information file using HTTP, HTTPS, FTP, or SFTP.
When uploading a Unit Information file, the PTP 820G functions as an FTP or SFTP client. You must install FTP or SFTP server software on the PC or laptop you are using to perform the upload. For details, see Configuring the Internal Ports for FTP or SFTP.

Note
For troubleshooting, it is important that an updated configuration file be included in User Info files that are sent to customer support. To ensure that an up-to-date configuration file is included, it is recommended to back up the unit's configuration before generating the Unit Info file.
For PTP 820G units with Unit Redundancy, you must use FTP or SFTP to upload the User Information file.
Uploading a Unit Info File Via HTTP or HTTPS
To uploading a User Information file using HTTP or HTTPS:
1 Platform > Management > Unit Info. The Unit Info page opens.
2 Select HTTP.

Figure 421: Unit Info Page – HTTP/HTTPS Upload
3 Select HTTP.
4 Click Create to create the Unit Information file. The following fields display the status of the file creation process:
- File Creation Status – Displays the file creation status. You must wait until the status is Success to upload the file. Possible values are:
Ready – The default value, which appears when no file is being created.
- Generating File – The file is being generated.
- Success – The file has been successfully created. You may now upload the file.
- Failure – The file was not successfully created.
- File Creation Progress – Displays the progress of the current Unit Information file creation operation.
5 Click Export. The upload begins. The following fields display the status of the upload process:
- File Transfer Status – Displays the status of any pending Unit Information file upload. Possible values are:
Ready – The default value, which appears when no file transfer is in progress.
- File-in-transfer – The upload operation is in progress.
- Success – The file has been successfully uploaded.
- Failure – The file was not successfully uploaded.
If you try to export the file before it has been created, the following error message appears: Error #3-Invalid set value.
If this occurs, wait about two minutes then click Export again.
- File Creation Progress – Displays the progress of the current Unit Information file upload operation.
Uploading a Unit Info File Via FTP or SFTP
To generate and upload a Unit Information file:
- Install and configure an FTP server on the PC or laptop you are using to perform the upload. See Configuring the Internal Ports for FTP or SFTP.
- Select Platform > Management > Unit Info. The Unit Info page opens.
Figure 422 Unit Info Page
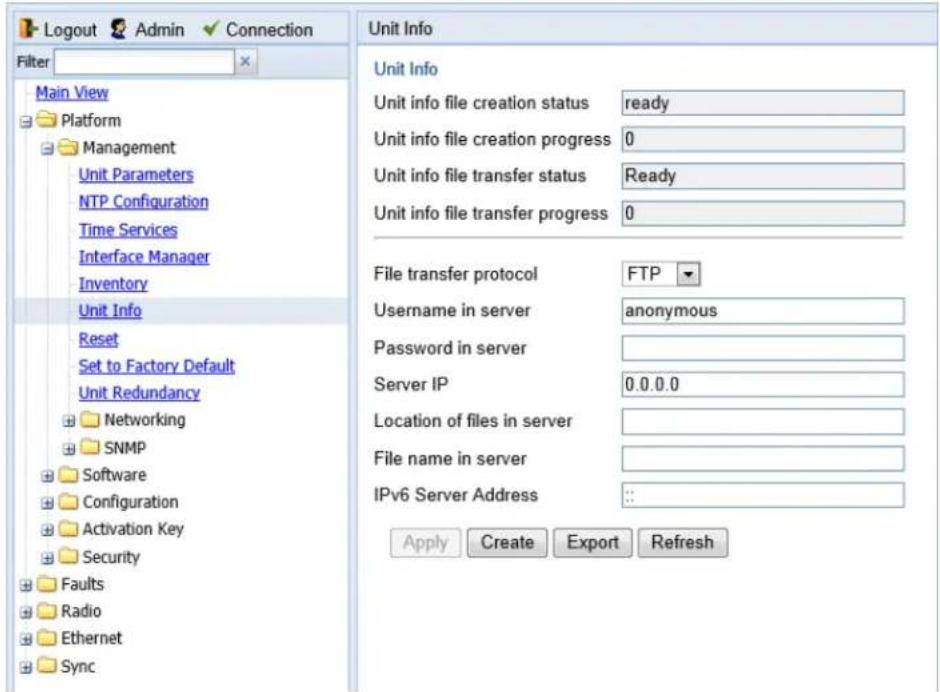
- In the File transfer protocol field, select the file transfer protocol you want to use (FTP or SFTP).
- In the Username in server field, enter the user name you configured in the FTP server.
- In the Password in server field, enter the password you configured in the FTP server. If you did not configure a password for your FTP user, simply leave this field blank.
-
If the IP address family is configured to be IPv4, enter the IPv4 address of the PC or laptop you are using as the FTP server in the Server IP field. See Defining the IP Protocol Version for Initiating Communications.
-
If the IP address family is configured to be IPv6, enter the IPv6 address of the PC or laptop you are using as the FTP server in the IPv6 Server Address field. See Defining the IP Protocol Version for Initiating Communications.
- In the Location of files in server field, enter the directory path to which you are uploading the file. Enter the path relative to the FTP user's home directory, not the absolute path. To leave the path blank, enter //.
- In the File Name in server field, enter the name you want to give to the exported Unit Information file.
- Click Apply to save your settings.
- Click Create to create the Unit Information file. The following fields display the status of the file creation process:
Unit Info File Creation Status – Displays the file creation status. You must wait until the status is Success to upload the file. Possible values are:
- Ready – The default value, which appears when no file is being created.
- Generating File – The file is being generated.
- Success – The file has been successfully created. You may now upload the file.
- Failure – The file was not successfully created.
Unit Info File Creation Progress – Displays the progress of the current Unit Information file creation operation.
- Click Export. The upload begins. The following fields display the status of the upload process:
Unit Info File Transfer Status – Displays the status of any pending Unit Information file upload. Possible values are:
- Ready – The default value, which appears when no file transfer is in progress.
- File-in-transfer – The upload operation is in progress.
- Success – The file has been successfully uploaded.
- Failure – The file was not successfully uploaded.
If you try to export the file before it has been created, the following error message appears: Error #3-Invalid set value.
If this occurs, wait about two minutes then click Export again.
Unit Info File Creation Progress – Displays the progress of the current Unit Information file upload operation.
Performing Diagnostics
This section includes:
• Performing Radio Loopback
• Performing Ethernet Loopback
• Performing TDM Diagnostics
- Configuring Service OAM (SOAM) Fault Management (FM)
Performing Radio Loopback
To perform loopback on a radio:
- Select Radio > Diagnostics > Loopback. The Radio Loopbacks page opens.
Figure 423 Radio Loopbacks Page – PTP 820F
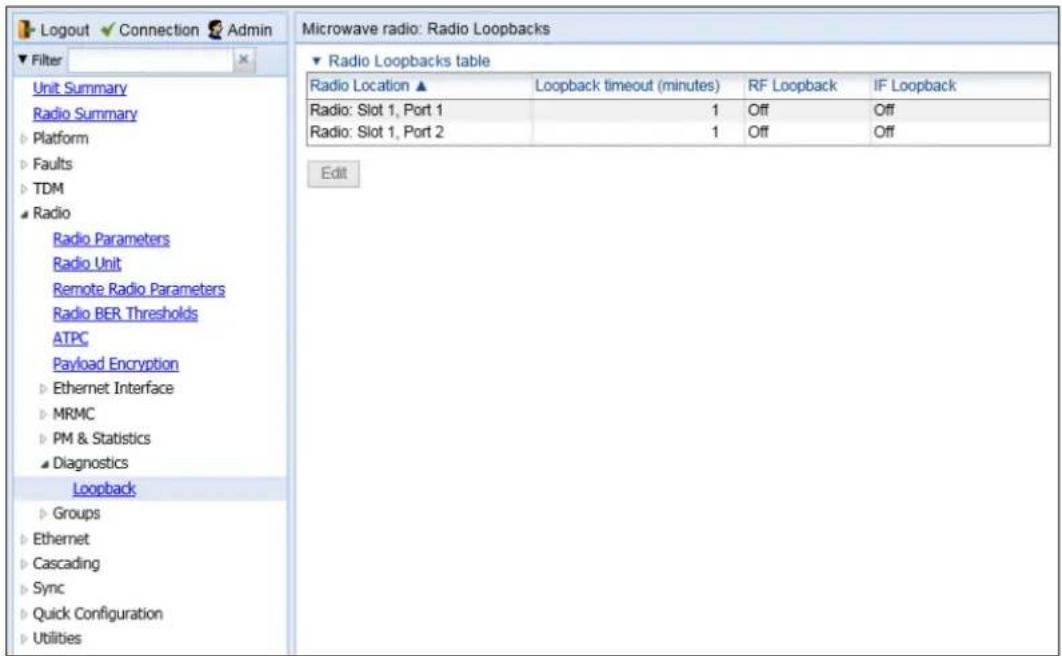
Figure 424 Radio Loopbacks Page – PTP 820G

- Select the slot on which you want to perform loopback and click Edit. The Radio Loopbacks – Edit page opens.

Note
You cannot perform loopback directly on a Multi-Carrier ABC group. To perform traffic-level diagnostics on a Multi-Carrier ABC group, the loopback must be activated for all members of the group. Radio-level diagnostics can still be performed on individual members of the group.
Figure 425 Radio Loopbacks – Edit Page
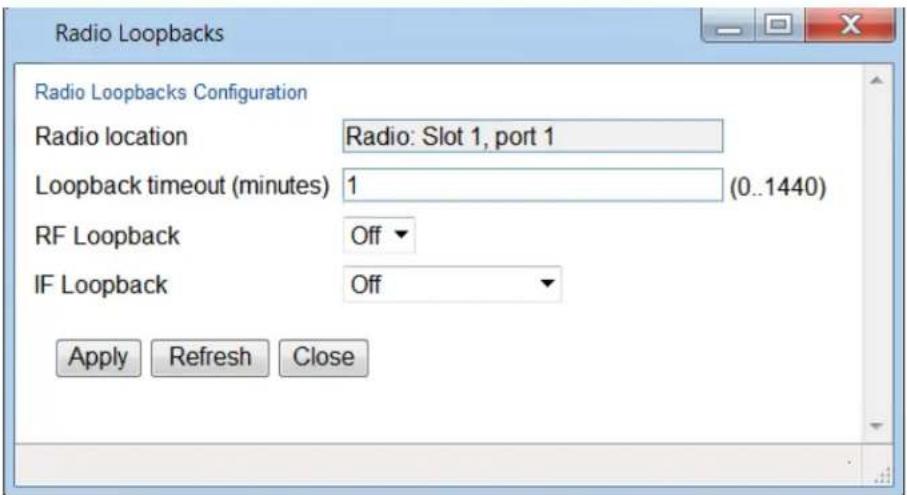
-
In the Loopback timeout (minutes) field, enter the timeout, in minutes, for automatic termination of the loopback (0-1440). A value of 0 indicates that there is no timeout.
-
In the RF loopback field, select On.
- Click Apply.
Performing Ethernet Loopback
Ethernet loopbacks can be performed on any logical Ethernet interface except a LAG. When Ethernet loopback is enabled on an interface, the system loops back all packets ingressing the interface. This enables loopbacks to be performed over the link from other points in the network.
To perform Ethernet loopback:
- Select Ethernet > Interfaces > Logical Interfaces. The Logical Interfaces page opens (Figure 214).
- Select an interface in the Ethernet Logical Port Configuration table and click Loopback. The Logical Interfaces – Loopback page opens.
Figure 426 Logical Interfaces – Loopback Page
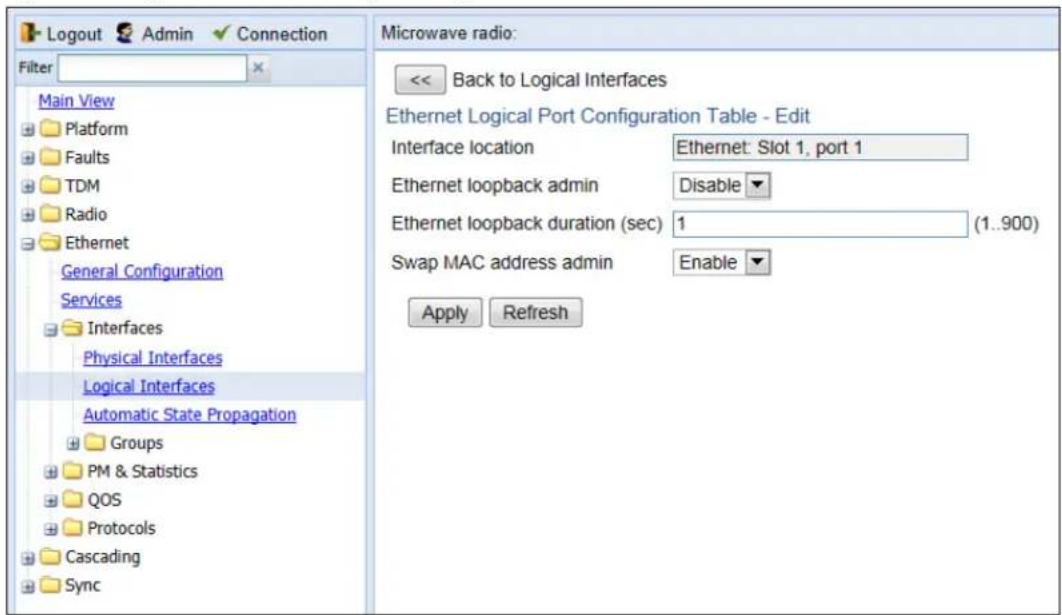
- In the Ethernet loopback admin field, select Enable to enable Ethernet loopback on the logical interface, or Disable to disable Ethernet loopback on the logical interface.
- In the Ethernet loopback duration (sec) field, enter the loopback duration time (in seconds).
- In the Swap MAC address admin field, select whether to swap DA and SA MAC addresses during the loopback. Swapping addresses prevents Ethernet loops from occurring. It is recommended to enable MAC address swapping if LLDP is enabled.
- Click Apply to initiate the loopback.
Performing TDM Diagnostics
This section includes:
• Performing Loopback on E1/DS1s
Performing Loopback on E1/DS1s
To perform PDH loopback on a TDM line:
1 Select TDM > Diagnostics > PDH Loopback. The PDH Loopback page opens.
Figure 427 PDH Loopback Page

2 In the Select a slot field at the top of the PDH Loopback page, select the slot with the TDM card on which you want to run the loopback.
3 In the TDM Loopback Timeout field, specify the number of minutes before timing out a loopback operation.
4 Click Apply to save the settings.
5 For each interface, select the interface and click Edit. The PDH Loopback – Edit page opens.
Figure 428 PDH Loopback – Edit Page

6 In the Loopback type field, select the type of loopback to run on the selected interface:
○ None
- Towards Line
- Towards System
7 Click Apply, then Close.
Configuring Service OAM (SOAM) Fault Management (FM)
This section includes:
- SOAM Overview
- Configuring MDs
- Configuring MA/MEGs
- Configuring MEPs
- Displaying Remote MEPs
- Displaying Last Invalid CCMS
- Configuring MIPs with MHF Default
- Performing Loopback
SOAM Overview
The Y.1731 standard and the MEF-30 specifications define Service OAM (SOAM). SOAM is concerned with detecting, isolating, and reporting connectivity faults spanning networks comprising multiple LANs, including LANs other than IEEE 802.3 media.
Y.1731 Ethernet FM (Fault Management) consists of three protocols that operate together to aid in fault management:
- Continuity check
- Link trace
- Loopback

Note
Link trace are planned for future release.
PTP 820G and PTP 820F utilizes these protocols to maintain smooth system operation and non-stop data flow.

Note
Support for IEEE 802.1ag is planned for future release.
The following are the basic building blocks of FM:
- MD (Maintenance Domain) – An MD defines the management space on a network, typically owned and operated by a single entity, for which connectivity faults are managed via SOAM.
-
MA/MEG (Maintenance Association/Maintenance Entity Group) – An MA/MEG contains a set of MEPs or MIPs.
-
MEP (MEG End Points) – Each MEP is located on a service point of an Ethernet service at the boundary of the MEG. By exchanging CCMs (Continuity Check Messages), local and remote MEPs have the ability to detect the network status, discover the MAC address of the remote unit/port where the peer MEP is defined, and identify network failures.
- MIP –(MEG Intermediate Points) – Similar to MEPs, but located inside the MEG and can only respond to, not initiate, CCM messages.
- CCM (Continuity Check Message) – MEPs in the network exchange CCMs with their peers at defined intervals. This enables each MEP to detect loss of connectivity or failure in the remote MEP.
Configuring MDs
In the current release, you can define one MD, with an MD Format of None.
To add an MD:
- Select Ethernet > Protocols > SOAM > MD. The SOAM MD page opens.
Figure 429 SOAM MD Page

- Click Add. The SOAM MD – Add page opens.
Figure 430 SOAM MD Page

- In the MD Name field, enter an identifier for the MD (up to 43 alphanumeric characters). The MD Name should be unique over the domain.
- In the MD Format field, select None.

Note
Support for MDs with the MD format Character String is planned for future release. In this release, the software enables you to configure such MDs, but they have no functionality.
- In the MD Level field, select the maintenance level of the MD (1-7). The maintenance level ensures that the CFM frames for each domain do not interfere with each other. Where domains are nested, the encompassing domain must have a higher level than the domain it encloses. The maintenance level is carried in all CFM frames that relate to that domain. The MD Level must be the same on both sides of the link.
- Click Apply, then Close.
The MHF (MIP) Creation field displays the type of MHF format included in the CCMs sent in this MD (in the current release, this is MHF Default).
The Sender TLV Content field displays the contents of TLVs included in the CCMs sent in this MD (in the current release, this is Send ID Chassis).
Configuring MA/MEGs
You can configure up to 1280 MEGs per network element. MEGs are classified as Fast MEGs or Slow MEGs according to the CCM interval (see Table 118):
• Fast MEGs have a CCM interval of 1 second.
- Slow MEGs have a CCM interval of 10 seconds, 1 minute, or 10 minutes.
You can configure up to 64 MEP pairs per network element.
To add a MEG:
- Select Ethernet > Protocols > SOAM > MA/MEG. The SOAM MA/MEG page opens.
Figure 431 SOAM MA/MEG Page
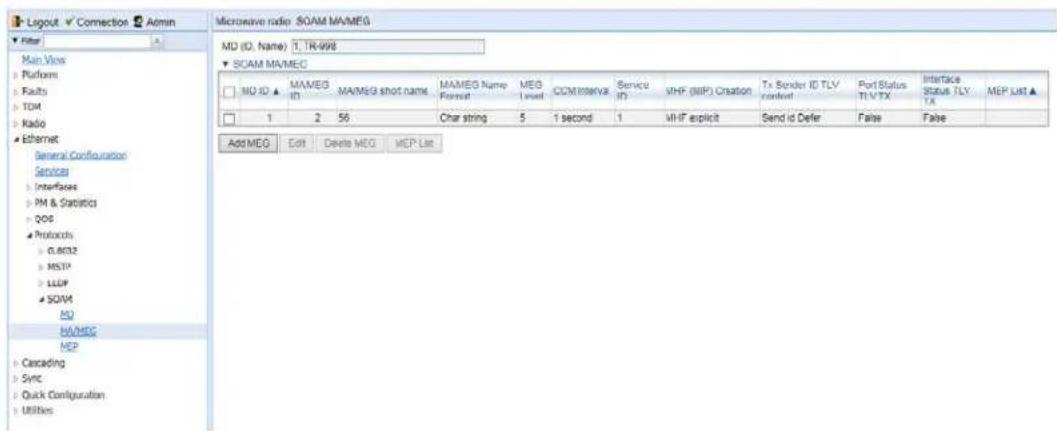
- Click Add MEG. The SOAM MA/MEG – Add page opens.
Figure 432 SOAM MA/MEG – Add Page

-
Configure the fields described in Table 118.
-
Click Apply, then Close.
To edit a MEG, select the MEG and click Edit. The SOAM MA/MEG – Edit page opens. Only the CCM Interval and MIP Creation fields can be edited.
Table 119 describes the status (read-only) fields in the SOAM MA/MEG Component table.
Table 125 SOAM MA/MEG Configuration Parameters
| Parameter Definition | |
| MD (ID, Name) | Select the MD to which you are assigning the MEP. |
| MA/MEG short name | Enter a name for the MEG (up to 44 alphanumeric characters). |
| MEG Level | Select a MEG level (0-7). The MEG level must be the same for MEGs on both sides of the link. Higher levels take priority over lower levels.If MEGs are nested, the OAM flow of each MEG must be clearly identifiable and separable from the OAM flows of the other MEGs. In cases where the OAM flows are not distinguishable by the Ethernet layer encapsulation itself, the MEG level in the OAM frame distinguishes between the OAM flows of nested MEGs.Eight MEG levels are available to accommodate different network deployment scenarios. When customer, provider, and operator data path flows are not distinguishable based on means of the Ethernet layer encapsulations, the eight MEG levels can be shared among them to distinguish between OAM frames belonging to nested MEGs of customers, providers and operators. The default MEG level assignment among customer, provider, and operator roles is:The customer role is assigned MEG levels 6 and 7.The provider role is assigned MEG levels 3 through 5.The operator role is assigned MEG levels: 0 through 2.The default MEG level assignment can be changed via a mutual agreement among customer, provider, and/or operator roles.The number of MEG levels used depends on the number of nested MEs for which the OAM flows are not distinguishable based on the Ethernet layer encapsulation. |
| CCM Interval | The interval at which CCM messages are sent within the MEG. Options are:1 second (default)10 seconds1 minute10 minutesIt takes a MEP 3.5 times the CCM interval to determine a change in the status of its peer MEP. For example, if the CCM interval is 1 second, a MEP will detect failure of the peer 3.5 seconds after it receives the first CCM failure message. If the CCM interval is 10 minutes, the MEP will detect failure of the peer 35 minutes after it receives the first CCM failure message. |
| Service ID | Select an Ethernet service to which the MEG belongs. You must define the service and add service points before you configure the MEG. |
Parameter Definition
| MIP Creation | Determines whether MIPs are created on the MEG. Options are:MHF none – No MIPs are created.MHF default – MIPs are created automatically on any service point in the MEG’s Ethernet service.MHF explicit – MIPs are created on the service points of the MEG when a lower-level MEP exists on the service point. This option is usually used when the operator’s domain is encompassed by another domain.MHF defer – No MIPs are created. Not used in the current release. |
Table 126 SOAM MA/MEG Status Parameters
| Parameter Definition | |
| MA/MEG ID | Automatically generated by the system. |
| MA/MEG Name Format | Reserved for future use. In the current release, this is Char String only. |
| Tx Sender ID TLV content | Sender ID TLV is transmitted. |
| Port Status TLV TX | Reserved for future use. No Port Status TLV is transmitted in the CCM frame. |
| Interface Status TLV TX | An Interface Status TLV is transmitted in the CCM frame, indicating the operational status of the interface on which the transmitting MEP is configured (Up or Down).. |
| MEP List | Lists all local and remote MEPs that have been defined for the MEG. |
Configuring MEPs
Each MEP is attached to a service point in an Ethernet service. The service and service point must be configured before you configure the MEP. See Configuring Ethernet Service(s).
Each MEP inherits the same VLAN, C-VLAN, or S-VLAN configuration as the service point on which it resides. See Configuring Service Points.
In order to set the VLAN used by CCM/LBM/LTM if the service point is defined ambiguously (for example PIPE, Bundle-C, Bundle-S, or All-to-One), the service point's C-VLAN/S-VLAN parameter should not be set to N.A.
To configure a MEP, you must:
- Add MEPs to the relevant MA/MEG. In this stage, you add both local and remote MEPs. The only thing you define at this point is the MEP ID. See Adding Local and Remote MEPs.
- Configure the local MEPs. At this point, you determine which MEPs are local MEPs. The system automatically defines the other MEPs you configured in the previous step as remote MEPs. See Configuring the Local MEPs.
- Enable the Local MEPs. See Enabling Local MEPs.
d. Adding Local and Remote MEPs
To add a MEP to the MA/MEG:
- In the SOAM MA/MEG page, select a MA/MEG and click MEP List. The MEP List page opens.
Figure 433 MEP List Page

- Click Add. The Add MEP page opens.
Figure 434 Add MEP Page

- In the MEP ID field, enter a MEP ID (1-8191).
4. Click Apply, then Close.
e. Configuring the Local MEPs
Once you have added local and remote MEPs, you must define the MEPs and determine which are the local MEPs:
- Select Ethernet > Protocols > SOAM > MEP. The SOAM MEP page opens. Table 120 lists and describes the parameters displayed in the SOAM MEP page.
Figure 435 SOAM MEP Page


Note
To display MEPs belonging to a specific MEG, select the MEG in the Filter by MA/MEG field near the top of the SOAM MEP page. To display all MEPs configured for the unit, select All.
- Click Add. Page 1 of the Add SOAM MEP wizard opens.
Figure 436 Add SOAM MEP Wizard – Page 1

- In the MEG Name field, select an MA/MEG.
- Click Next. Page 2 of the Add SOAM MEP wizard opens.
Figure 437 Add SOAM MEP Wizard – Page 2
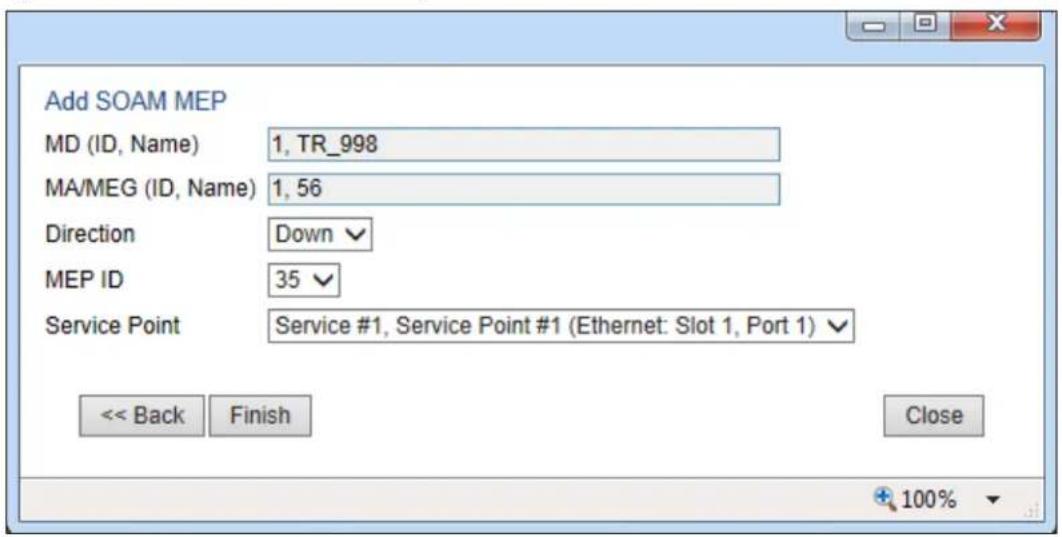
- In the Direction field, select Down.

Note
In the current release, the Up direction is not supported.
- In the MEP ID field, select from a list of MEPs you have added to the selected MEG.
- In the Service Point field, select the service point on which you want to place the MEP.
- Click Finish. The Add Soam MEP wizard displays the parameters you have selected.
Figure 438 Add SOAM MEP Wizard – Summary Page

- Verify that you want to submit the displayed parameters and click Submit.
Table 127 SOAM MEP Parameters
| Parameter Definition | |
| MD (ID, Name) | The MD ID and name are automatically generated by the system. |
| MA/MEG (ID, Name) | The MA/MEG ID and name are automatically generated by the system. |
| MEP ID The MEP ID. | |
| Interface Location | The interface on which the service point associated with the MEP is located. |
| SP ID The service point ID. | |
| MEP Direction | Up or Down. |
| MEP Fault Notification State | Indicates the status of the defect SOAM state machine. Possible values are:• Fng Reset – Initial state.• Fng Defect – Transient state when a defect is detected.• Fng Defect Reported – The defect state is steady (stable).• Fng Defect Clearing – Transient state when a defect is in the process of being cleared.• Fng Defect Cleared – The defect has been cleared (transient state). |
| Connectivity Status | Indicates whether a MEP can exchange PDU (CCM, Loopback, LTR) with its remote MEP. A MEP with some defect or an inactive MEP cannot exchange PDUs.Possible values are:• inactive – At least one of the remote MEPs is in rMEPFailed status (not discovered).• active – All remote MEPs are discovered correctly and have an rMEPOk status. |
| MEP Active | Indicates whether the MEP is enabled (True) or disabled (False). |
| MEP CCM TX Enable | Indicates whether the MEP is sending CCMs (True/False). |
| CCM and LTM Priority | The p-bit included in CCMs and/or LTM frames sent by this MEP (0 to 7). |
| MEP Defects | Indicates if a defect has been detected by the MEP level. |
| RMEP List | Once you have configured at least one local MEP, all other MEPs that you have added but not configured as local MEPs are displayed here and are considered to be remote MEPs. |
f. Enabling Local MEPs
Once you have added a MEP and defined it as a local MEP, you must enable the MEP.
To enable a MEP:
-
In the SOAM MEP page (Figure 416), select the MEP you want to enable.
-
Click Edit. The SOAM MEP - Edit page opens.
Figure 439 SOAM MEP - Edit Page
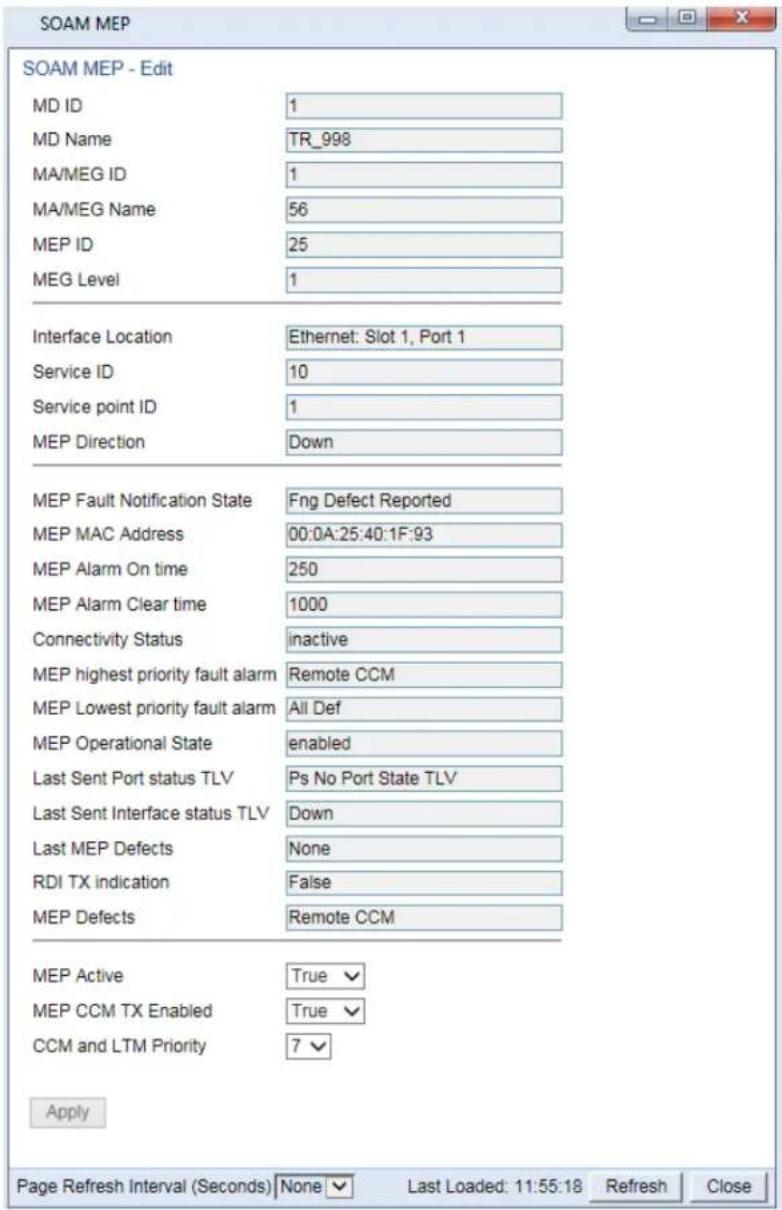
- In the MEP Active field, select True.
- In the MEP CCM TX Enable field, select True.
- In the CCM and LTM Priority field, select the p-bit that will be include in CCMs sent by this MEP (0 to 7). It is recommended to select 7.
- Click Apply, then Close.
Displaying Remote MEPs
To display a list of remote MEPs (RMEPs) and their parameters:
- Select Ethernet > Protocols > SOAM > MEP. The SOAM MEP page opens (Figure 416).
- Select a MEP and click RMEP List. The SOAM MEP DB table is displayed.
Figure 440 SOAM MEP DB Table
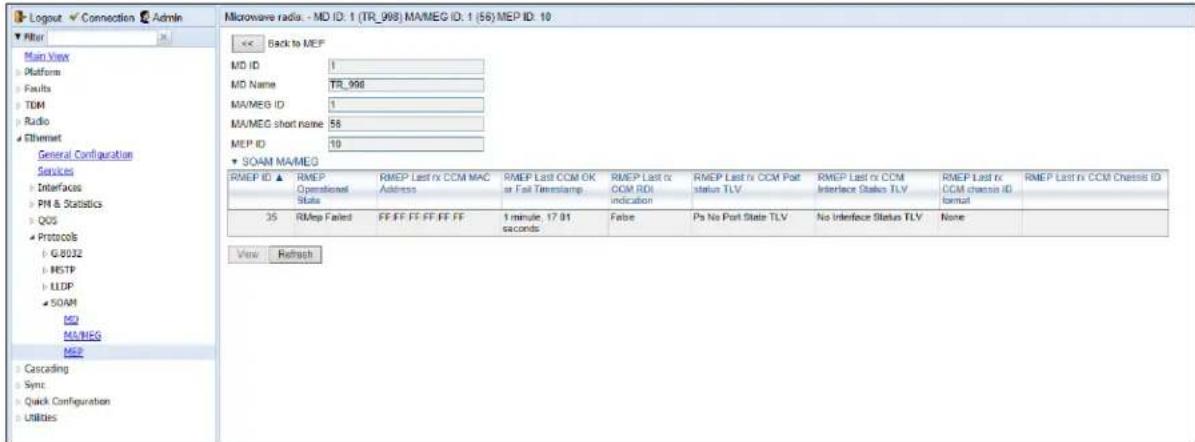
Table 121 lists and describes the parameters displayed in the SOAM MEP DB table. To return to the SOAM MEP page, click Back to MEP.
Table 128 SOAM MEP DB Table Parameters
| Parameter Definition | |
| RMEP ID The remote MEP ID. | |
| RMEP Operational State | The operational state of the remote MEP. |
| RMEP Last rx CCM MAC Address | The MAC Address of the interface on which the remote MEP is located. |
| RMEP Last CCM OK or Fail Timestamp | The timestamp marked by the remote MEP indicated the most recent CCM OK or failure it recorded. If none, this field indicates the amount of time since SOAM was activated. |
| RMEP Last rx CCM RDI Indication | Displays the state of the RDI (Remote Defect Indicator)bit in the most recent CCM received by the remote MEP:True – RDI was received in the last CCM.False – No RDI was received in the last CCM. |
| RMEP Last rx CCM Port Status TLV | The Port Status TLV in the most recent CCM received from the remote MEP. Reserved for future use. |
| RMEP Last rx CCM Interface Status TLV | Displays the operational status of the interface on which the remote MEP has been defined. |
Parameter Definition
| RMEP Last rx CCM Chassis ID Format | Displays the format of the remote chassis (always the MAC address). |
| RMEP Last rx CCM Chassis ID | Displays the MAC address of the remote chassis. |
Displaying Last Invalid CCMS
To display the entire frame of the last CCM error message and the last CCM cross-connect error message received by a specific local MEP:
- Select Ethernet > Protocols > SOAM > MEP. The SOAM MEP page opens (Figure 416).
- Select a MEP and click Last Invalid CCMS. The MEP Last Invalid CCMS page opens.
Figure 441 MEP Last Invalid CCMS Page

The Last RX error CCM message field displays the frame of the last CCM error message received by the MEP.
The Last RX Xcon fault message field displays the frame of the last CCM cross-connect error message received by the MEP.

Note
A cross-connect error occurs when a CCM is received from a remote MEP that has not been defined locally.
Configuring MIPs with MHF Default
If you configure a MEG with the MHF default option, MIPS are created automatically on all service points of the service to which the MEG is attached. These MIPs cannot be displayed in the Web EMS, but can be displayed via CLI. See Displaying MEP and Remote MEP Attributes (CLI).
Creating MIPs is subject to the following limitations:
- Once you have created a MEG that contains MIPS, i.e., a MEG with the MHF default attribute, you cannot create a MEG with the MHF none attribute on the same or higher level on the same Ethernet Service. However, you can create MEGs with the MHF none attribute on the same service on lower levels then the MEG with the MHF default attribute.
- MEPs cannot be attached to a MEG with the MHF default attribute.
- The Ethernet service and service points must already be defined before creating the MEG with the MHF default attribute in order for MIPs to be created on the service points.
To configure MEGs with MIPs:
1 Create a MEG with the MHF none attribute on the intended Ethernet service. See Configuring MA/MEGs.
2 Select the MEG and click Edit. The SOAM MA/MEG – Edit page opens.
3 In the MIP Creation field, select MHF Default.
4 Click Apply, then Close.
Performing Loopback
To perform loopback on a MEP:
1 In the SOAM MEP page (Figure 416), select the MEP on which you want to perform the loopback.
2 Click Loopback. The SOAM MEP – Loopback page opens.
Figure 442 SOAM MEP Loopback Page

3 In the Loopback Destination area, select from the following options:
- MEP ID – If you select MEP ID, you must enter the MEP ID of the MEP on the interface to which you want to perform the loopback in the Loopback Messages Destination MEP ID field. If you select MEP ID, the loopback will only be activated if CCMs have already been received from the MEP. For this reason, it is recommended to initiate loopback via MAC address.
- MAC Address (default) – If you select MAC Address, you must enter the MAC address of the interface to which you want to send the loopback in the Loopback Messages Destination MAC Address. If you are not sure what the interface's MAC address is, you can get it from the Interface Manager by selecting Platform > Management > Interface Manager.
4 In the Loopback messages to be transmitted field, select the number of loopback messages to transmit (0 - 1024). If you select 0, loopback will not be performed.
5 In the Loopback Messages Interval field, select the interval (in seconds) between each loopback message (0.1 – 60). You can select in increments of 1/10 second. However, the lowest possible interval is 1 second. If you select a smaller interval, the actual interval will still be 1 second.
6 In the Loopback Messages Frame Size field, select the frame size for the loopback messages (64 - 1516). Note that for tagged frames, the frame size will be slightly larger than the selected frame size.
7 In the Loopback Messages Priority field, select a value (0 - 7) for the priority bit for tagged frames.
8 In the Drop Enable field, choose the value of the DEI field for tagged loopback frames (True or False). The default value is False.
9 In the Loopback Messages Data Pattern Type field, select the type of data pattern to be sent in an OAM PDU Data TLV. Options are All Zeros and All Ones. The default value is All Zeros.
10 Click Apply to begin the loopback. The Loopback session state field displays the status of the loopback:
- SOAM Loopback Complete – The loopback has been successfully completed.
- SOAM Loopback Stopped – The loopback has been manually stopped.
- SOAM Loopback Failed – The loopback failed.
- SOAM Loopback Active – The loopback is currently active.
- SOAM Loopback Inactive – No loopback has been initiated.
The remote interface will answer and the loopback session will be completed if either of the following is true:
• A remote MEP has been defined on the destination interface.
• A MIP has been defined on the destination interface. See Configuring MIPs with MHF Default.

Note
To manually stop a loopback, you must use the CLI. Enter the following command in root view: root> ethernet soam loopback stop meg-id
Chapter 13: Web EMS Utilities
This section includes:
• Restarting the HTTP Server
• Calculating an ifIndex
• Displaying, Searching, and Saving a list of MIB Entities
Restarting the HTTP Server
To restart the unit's HTTP server:
1 Select Utilities > Restart HTTP. The Restart HTTP page opens.
Figure 443 Restart HTTP Page

2 Click Restart. The system prompts you for confirmation.
3 Click OK. The HTTP server is restarted, and all HTTP sessions are ended. After a few seconds, the Web EMS prompts you to log in again.
Calculating an ifIndex
The ifIndex calculator enables you to:
• Calculate the ifIndex for any object in the system.
• Determine the object represented by any valid ifIndex.
To use the ifIndex calculator:
1 Select Utilities > ifCalculator. The ifIndex Calculator page opens.
Figure 444 ifIndex Calculator Page

- If you have an ifIndex and you want to determine which hardware item in the unit it represents, enter the number in the ifIndex number field and click Calculate Index to name. A description of the object appears in the Result field.
- To determine the ifIndex of a hardware item in the unit, such as an interface, card, or slot, select the object type in the Functional Type field, select the Slot and Port (if relevant), and click Calculate Name to Index. The object's ifIndex appears in the Result field.
Displaying, Searching, and Saving a list of MIB Entities
To display a list of entities in the PTP 820 private MIB:
1 Select Utilities > MIB Reference Guide. The MIB Reference Table page opens.
Figure 445 MIB Reference Table Page

The MIB Reference Table is customized to the type of PTP 820 product you are using. There are two separate versions of the MIB Reference Table:
- PTP 820G/F
- PTP 820C/S

Note
Even though the MIB Reference Table is customized to these three product groups, some of the entities listed in the Table may not be relevant to the particular unit you are using. This may occur because of activation key restrictions, minor differences between product types, or simply because a certain feature is not used in a particular configuration.
Chapter 14: Getting Started (CLI)
This section includes:
• Establishing a Connection (CLI)
- Logging On (CLI)
- General CLI Commands
• Changing Your Password (CLI)
- Configuring In-Band Management (CLI)
• Changing the Management IP Address (CLI)
- Configuring Unit Redundancy for the PTP 820 Split Mount (CLI)
- Configuring the Activation Key (CLI)
- Setting the Time and Date (Optional) (CLI)
• Enabling the Interfaces (Interface Manager) (CLI)
- Configuring Cascading Interfaces (Optional) (CLI)
- Entering Radio View (CLI)
- Unmuting a Radio (CLI)
- Configuring the Transmit (TX) Level (CLI)
- Configuring the Transmit (TX) Frequency (CLI)
- Configuring the Radio (MRMC) Script(s) (CLI)
• Enabling ACM with Adaptive Transmit Power (CLI)
- Configuring the RSL Threshold Alarm (CLI)
- Operating in FIPS Mode (CLI)
Establishing a Connection (CLI)
For instructions on establishing a physical management connection to the unit from your PC or laptop, see Establishing a Connection.
Logging On (CLI)
Use a telnet connection to manage the PTP 820G or PTP 820F via CLI. You can use any standard telnet client, such as PuTTY or ZOC Terminal. Alternatively, you can simply use the telnet
The default IP address of the unit is 192.168.1.1. Establish a telnet connection to the unit using the default IP address.
When you have connected to the unit, a login prompt appears. For example:
Linux 2.6.34.8-grsec-WR4.1.0.0_cgl-CE.0.5 (localhost) (13:44 on Saturday, 21 March 2015)
login:
At the prompt, enter the default login user name: admin
A password prompt appears. Enter the default password: admin
General CLI Commands
To display all command levels available from your current level, press
root>
auto-state-propagation ethernet exit multi-carrier-abc
platform pwe3 quit radio radio-groups
stmloc3_rst switch-back switch-to wait
Some of these are complete commands, such as quit and exit. Others constitute the first word or phrase for a series of commands, such as ethernet and radio.
Similarly, if you enter the word platform and press
root> platform
activation-key configuration if-manager management
security shelf-manager software status
sync tdm-latency-optimization tdm-offset tdm-range
unit-info unit-info-file wtr-timer
root> platform
To auto-complete a command, press
Use the up and down arrow keys to navigate through recent commands.
Use the ? key to display a list of useful commands and their definitions.
At the prompt, or at any point in entering a command, enter the word help to display a list of available commands. If you enter help at the prompt, a list of all commands is displayed. If you enter help after entering part of a command, a list of commands that start with the portion of the command you have already entered is displayed.
To scroll up and down a list, use the up and down arrow keys.
To end the list and return to the most recent prompt, press the letter q.
To ping another network device, enter one of the following commands in root view:
root> ping ipv4-address <x.x.x.x> count <number of echo packets> packet-size
<packet-size>
root> ping ipv6-address <ipv6> count <number of echo packets> packet-size
<packet-size>
The optional count parameter determines how many packets are sent. This parameter can be an integer from 1 to 1000. The default value is 4.
The optional packet-size parameter determines the size of each packet, in bytes. This parameter can be an integer from 64 to 1480. The default value is 64.
The ping command is available from all views (e.g., root, interface views, group views).
Changing Your Password (CLI)
It is recommended to change your default Admin password as soon as you have logged into the system.
In addition to the Admin password, there is an additional password protected user account, "root user", which is configured in the system. The root user password and instructions for changing this password are available from CambiumCambium Customer Support. It is strongly recommended to change this password.
To change your password, enter the following command in root view:
root> platform security access-control password edit own-password
The system will prompt you to enter your existing password. The system will then prompt you to enter the new password.
If Enforce Password Strength is activated, the password must meet the following criteria:
- Password length must be at least eight characters.
- Password must include characters of at least three of the following character types: lower case letters, upper case letters, digits, and special characters. For purposes of meeting this requirement, upper case letters at the beginning of the password and digits at the end of the password are not counted.
- A password cannot be repeated within five changes in password.
See Configuring the Password Security Parameters (CLI).
Configuring In-Band Management (CLI)
You can configure in-band management in order to manage the unit remotely via its radio and/or Ethernet interfaces.
Each PTP 820 unit includes a pre-defined management service with Service ID 257. The management service is a multipoint service that connects the two local management ports and the network element host CPU into a single service. In order to enable in-band management, you must add at least one service point to the management service, in the direction of the remote site or sites from which you want to access the unit for management. For instructions on adding service points, see Configuring Service Points (CLI).

Note
In order to use in-band management, it must be supported on the external switch.
Changing the Management IP Address (CLI)
Related Topics:
• Defining the IP Protocol Version for Initiating Communications (CLI)
- Configuring the Remote Unit's IP Address (CLI)
You can enter the unit's address in IPv4 format and/or in IPv6 format. The unit will receive communications whether they were sent to its IPv4 address or its IPv6 address.
To set the unit's IP address in IPv4 format, enter the following command in root view to configure the IP address, subnet mask, and default gateway:
root> platform management ip set ipv4-address <ipv4-address> subnet <subnet> gateway <gateway> name <name> description <name>
Table 129 IP Address (IPv4) CLI Parameters
| Parameter | Input Type | Permitted Values | Description |
| ipv4-address | Dotted decimal format. | Any valid IPv4 address. | The IP address for the unit. |
| subnet | Dotted decimal format. | Any valid subnet mask. | The subnet mask for the unit. |
| gateway Dotted decimal format. Any valid IPv4 address. | The default gateway for the unit (optional). | ||
| name | Text String. | Enter a name (optional). | |
| description Text String. | Enter a description (optional). | ||
To set the unit's IP address in IPv6 format, set in root view the IP address, prefix length, and default gateway of the PTP 820G or PTP 820F unit, as follows:
root> platform management ip set ipv6-address <ipv6-address> prefix-length <prefix-length> gateway <gateway>

Note
It is recommended not to configure addresses of type FE:80::/64 (Link Local addresses) because traps are not sent for these addresses.
Table 130 IP Address (IPv6) CLI Parameters
| Parameter | Input Type | Permitted Values | Description |
| ipv6-address | Eight groups of four hexadecimal digits separated by colons. | Any valid IPv6 address. | The IP address for the unit. |
| prefix-length | Number. | 1-128 | The prefix-length for the unit. |
| gateway | Eight groups of four hexadecimal digits separated by colons. | Any valid IPv6 address. | The default gateway for the unit (optional). |
Examples
The following command sets the following parameters:
• IPv4 Address - 192.168.1.160
- Subnet Mask - 255.255.0.0
• Default Gateway – 192.168.1.100
root> platform management ip set ipv4-address 192.168.1.160 subnet 255.255.0.0 gateway 192.168.1.100
The following command sets the following parameters:
• IPv6 Address - FE80:0000:0000:0000:0202:B3FF:FE1E:8329
- Prefix length - 64
- Default Gateway - FE80:0000:0000:0000:0202:B3FF:FE1E:8329
root> platform management ip set ipv6-address
FE80:0000:0000:0000:0202:B3FF:FE1E:8329 prefix-length 64 gateway
FE80:0000:0000:0000:0202:B3FF:FE1E:8329
Configuring Unit Redundancy for the PTP 820 Split Mount (CLI)
This section explains how to configure unit redundancy and includes the following topics:
- Configuring Unit Redundancy (CLI)
- Configuring Ethernet Interface Protection (CLI)
• Enabling Unit Redundancy (CLI)
• Changing the Configuration after Enabling Unit Redundancy (CLI)
• Running Commands in the Standby Unit (CLI)
• Viewing Link and Protection Status and Activity (CLI) - Switchover (CLI)
• Performing Lockout (CLI)
• Disabling Unit Redundancy (CLI)
For an overview of unit redundancy and a description of the relevant cabling requirements, see:
• Unit Redundancy Overview
• Cabling Requirements for Unit Redundancy
To configure unit redundancy, you must perform the following steps:
- Verify that the proper cables for unit redundancy are connected to the units. See Cabling Requirements for Unit Redundancy.
- Configure Ethernet interface protection. See Configuring Ethernet Interface Protection (CLI).
- Enable unit redundancy. See Enabling Unit Redundancy (CLI).
Configuring Unit Redundancy (CLI)
- Before configuring unit redundancy, verify that both units have the same hardware part number see, Displaying Unit Inventory (CLI). and the same software version (see Displaying Current Software Versions (CLI). If the units do not have the same software version, upgrade each unit to the most recent software release (see Upgrading the Software (CLI)).
To configure unit redundancy, you must perform the following steps:
- Verify that the PC or laptop being used to configure the devices is directly connected to the management port of the unit that will be the active unit.
- Configure the unit that will be the active unit so that it will have a working radio link by performing all necessary radio configurations, such as configuring the MRMC scripts, setting the frequency, unmuting the radio, and setting up radio groups such as XPIC or Multi-Carrier ABC (Multi-Radio).
-
Perform all necessary Ethernet and TDM configurations on the unit that will be the active unit, such as defining Ethernet and TDM services.
-
Resolve any alarms in the unit that will be the active unit, so that there are no active alarms raised.
- Configure Ethernet interface protection on the unit that will be the active unit. See Configuring Ethernet Interface Protection (CLI).
- Power up the unit that will be the standby unit.
- Connect the management PC or laptop to the management port of the unit that will be the standby unit.
- Enable unit redundancy on the unit that will be the standby unit. See Enabling Unit Redundancy (CLI).
- Connect the PC or laptop again to the management port of the unit that will be the active unit.
- Enable unit redundancy on the unit that will be the active unit. See Enabling Unit Redundancy (CLI).
- Verify that the proper cables for unit redundancy are connected to the units. See Cabling Requirements for Unit Redundancy. Note that the first unit you configured should automatically be assigned by the system to be the active unit because it will have no alarms. In contrast, the second unit will have at least one alarm since you have not yet changed its settings from the default settings.
- On the active unit, verify that the connection operation state is Up and the protection link to mate status is Connected. See Viewing Link and Protection Status and Activity (CLI).
- Enter the following command in root view to copy the configuration of the active unit to the standby unit:
root> platform management protection copy-to-mate

Note
While the system is performing the copy-to-mate operation, a temporary loss of management connection will occur.
-
Once the standby unit comes back online, perform final checks to verify that unit redundancy has been configured properly:
-
Check the port status on the standby unit.
- Check the radio link status on the standby unit.
o Verify that there is no Configuration Mismatch alarm. See Changing the Configuration after Enabling Unit Redundancy (CLI).
o Verify that no other alarms are raised on either unit.
Configuring Ethernet Interface Protection (CLI)
No special software configuration is required for Optical Splitter and Electrical Splitter modes.
For Line Protection mode, you must perform the following steps:
- Configure the GbE interfaces on the external switch in LACP mode. The external switch must support LACP.
- Connect a GbE port on the external switch to a GbE interface on each of the PTP 820G units.
- Enable LACP on the GbE interfaces on the PTP 820G that are connected to the external switch:
a. Go to interface view for the GbE interface.
b. In interface view, enter the following command:
eth type eth [1/x]>interface-mode-set interface-mode LACP
c. Reset the unit. See Performing a Hard (Cold) Reset (CLI).

Note
Because a unit reset is required when changing the Interface Mode to or from LACP, it is recommended to perform copy-to-mate immediately after changing the Interface Mode to or from LACP, then to reset the active unit only after the standby unit is back up after the copy-to-mate operation.
To disable LACP mode, enter the following command in Ethernet interface view:
eth type eth [1/x]>interface-mode-set interface-mode NONE
To display an interface's current LACP setting, enter the following command in Ethernet interface view:
eth type eth [1/x]>interface-mode-show
Enabling Unit Redundancy (CLI)
To enable unit redundancy:
- To enable protection, enter the following command in root view:
root> platform management protection set admin enable
The system configures itself for unit redundancy:
- The system determines which unit is the Active unit based on a number of pre-defined criteria.
When the system returns online, all management must be performed via the Active unit using the IP address you defined for that unit.
The IP address you defined for the unit which is now the Standby unit is no longer valid, and the management port of the Standby unit becomes non-operational. Note, however, that if switchover takes place before you perform copy-to-mate, the original IP of the Standby unit, now the Active unit, becomes the working IP for management of both units.
Management of the Standby unit is performed via the Active unit, via the protection cable. Protection communications are transmitted via Management port 2 in each unit, which is no longer usable or configurable as a management port.

Note
An PTP 820G unit on which (i) unit redundancy is enabled, (ii) there is no radio link, and (iii) no mate unit is connected, will automatically be selected as a standby unit when booting up. As a result, management to the unit will be lost.
Changing the Configuration after Enabling Unit Redundancy (CLI)
To keep the standby unit up-to-date, after any change to the configuration of the active unit you must enter a copy-to-mate command to copy the configuration to the standby unit.
If you change the configuration of the Active unit but do not perform a copy-to-mate command, a Configuration Mismatch alarm is raised.
To display a list of mismatched parameters, enter the following command in root view:
root> platform management protection show mismatch details
The following items must be configured separately for the Standby unit, and are not copied via copy-to-mate:
- Setting the Unit Name – See Configuring Unit Parameters (CLI).
- Disabling/enabling Radio TX mute – See Unmuting a Radio (CLI).
- Clearing the Radio and RMON counters – See Configuring and Viewing Radio PMs and Statistics (CLI) and Viewing Ethernet PMs and Statistics (CLI).
- Configuring the activation key—See Configuring the Activation Key (CLI).
For instructions on performing configuration directly on the standby unit, see Running Commands in the Standby Unit (CLI).
When configuring MRMC scripts after enabling unit redundancy, it should be done in the following order. It is important to use this order because if the changes are not performed in the correct order, the connection to the remote units will be lost:
- Change the MRMC script on the standby unit of the remote pair.
- Change the MRMC script on the active unit of the remote pair. This will cause the local-remote link to be lost.
- Change the MRMC script on the active unit of the local pair. When the unit reboots, the local-remote link will be restored.
- Perform copy-to-mate on the active unit of the local pair.
Running Commands in the Standby Unit (CLI)
You can run CLI commands in the standby unit.
To run CLI commands in the standby unit:
- Use the following command to enter view context for the standby unit:
root> switch-to mate
mate/root>
-
Enter the specific CLI command you want to run in mate/root context.
-
To switch back to the active unit, enter the following command:
mate/root> switch-to local
root>
Viewing Link and Protection Status and Activity (CLI)
You can view link and protection status and activity any time.
- To view whether unit redundancy is enabled or disabled, enter the following command in root view:
root> platform management protection show admin
- To view whether unit redundancy is functional, enter the following command in root view. Note that protection is not functional if the management connection to the mate is down.
root> platform management protection show operational-state
- To view whether the unit you are managing is the active or standby unit, enter the following command in root view:
root> platform management protection show activity-state
• To view the status of the protection link to the mate, enter the following command in root view:
root> platform management protection show link-status
• To view the status of the last copy-to-mate operation, enter the following command in root view:
root> platform management protection show copy-to-mate status
- To view the current lockout status, enter the following command in root view:
root> platform management protection show lockout status
Switchover (CLI)
The following events trigger switchover for unit redundancy according to their priority, with the highest priority triggers listed first.
- Loss of active unit
- Force switch
- Lockout
- Radio Loss of Frame (LOF) on active unit
- Change request from the remote unit. This takes place in the event of radio LOF on both units; a change request is sent to the active unit on the other side of the link.
- Loss of Carrier (LOC) in any of the Ethernet interfaces or Loss of Signal (LOS) in any of the TDM interfaces
- Manual switch
LOC takes place if the Admin status of the interface is Enabled and the Operational status is Down. If the interface is closed as a result of ASP, the interface is not considered to be in LOC state, and switchover is not triggered.
Following switchover triggered by LOC, there is an automatic timeout of one minute before any further switchover can take place due to LOC.
At any point, you can manually switch to the standby unit, provided that the highest protection fault level in the standby unit is no higher than the highest protection fault level on the active unit.
You can also perform a force switch to the standby unit, even if the protection fault level is higher in the standby unit. Force switch also implements lockout.
To perform a manual switch, enter the following command in root view:
root> platform management protection set manual-switch
To perform a force switch, enter the following command in root view:
root> platform management protection set force-switch
Performing Lockout (CLI)
At any point, you can perform lockout, which prevents switchover to the standby unit in all cases other than a force switch.
To perform lockout, enter the following command in root view:
root> platform management protection lockout set admin on
To release lockout, enter the following command in root view:
root> platform management protection lockout set admin off
Disabling Unit Redundancy (CLI)
You can disable unit redundancy at any time.
To disable protection, enter the following command in root view.
root> platform management protection set admin disable
If in-band management is being used, unit redundancy must be disabled in the following order to ensure that management is not lost:
- Disable unit redundancy in the active unit of the remote pair. The link remains up and no switchover takes place.
- Change the IP address of the active remote unit.
- Disable all active traffic interfaces on the active remote unit. Line interfaces should be disabled first, followed by radio interfaces, since disabling a radio interface causes switchover. See Enabling the Interfaces (Interface Manager) (CLI). This causes switchover on the remote pair.
- Disable unit redundancy in the active unit of the local pair. The link remains up and no switchover takes place.
- Change the IP address of the active local unit.
- Disable all active traffic interfaces on the active local unit. Line interfaces should be disabled first, followed by radio interfaces, since disabling a radio interface causes switchover. See Enabling the Interfaces (Interface Manager) (CLI). This causes switchover on the local pair.
- Disable unit redundancy on the both the remote and the local units that were the standby units and have now become the active units.

Note
On some occasions, in links with TDM traffic, if you disable unit redundancy then re-enable unit redundancy later, a TDM-LIC configuration mismatch alarm may be raised (Alarm ID 2002). If this happens, you must reset the unit with the alarm, then perform copy-to-mate.
Configuring the Activation Key (CLI)
This section includes:
• Activation Key Overview (CLI)
• Installing an Activation Key (CLI)
• Displaying Activation Key Information (CLI)
• Activating an Activation Key (CLI)
Activation Key Overview (CLI)
PTP 820G and PTP 820F offers a pay-as-you-grow concept in which future capacity growth and additional functionality can be enabled with activation keys. For purposes of the activation keys, each PTP 820G or PTP 820F chassis is considered a distinct device, regardless of which cards are included in the chassis. Each device contains a single unified activation key cipher.
New PTP 820G and PTP 820F units are delivered with a default activation key that enables you to manage and configure the unit. Additional feature and capacity support requires you to enter an activation key. Contact your vendor to obtain your activation key cipher.

Note
To obtain an activation key cipher, you may need to provide the unit's serial number. See Displaying Unit Inventory (CLI).
Each required feature and capacity should be purchased with an appropriate activation key. It is not permitted to enable features that are not covered by a valid activation key. In the event that the activation-key-enabled capacity and feature set is exceeded, an Activation Key Violation alarm occurs and the Web EMS displays a yellow background and an activation key violation warning. After a 48-hour grace period, all other alarms are hidden until the capacity and features in use are brought within the activation key's capacity and feature set.
In order to clear the alarm, you must configure the system to comply with the activation key that has been loaded in the system. The system automatically checks the configuration to ensure that it complies with the activation-key-enabled features and capacities. If no violation is detected, the alarm is cleared.
When entering sanction state, the system configuration remains unchanged, even after power cycles. However, the alarms remain hidden until an appropriate activation key is entered or the features and capacities are reconfigured to be within the parameters of the current activation key.
A demo activation key is available that enables all features for 60 days. When the demo activation key expires, the most recent valid activation key goes into effect. The 60-day period is only counted when the system is powered up. Ten days before the demo activation key expires, an alarm is raised indicating that the demo activation key is about to expire.
Installing an Activation Key (CLI)
To install an activation key, use the following command to enter the activation key cipher you have received from the vendor. The activation key cipher is a string that enables all features and capacities that have been purchased for the unit.
root> platform activation-key set key string <key string>
If the activation key cipher is not legal (e.g., a typing mistake or an invalid serial number), an Activation Key Loading Failure event is sent to the Event Log. When a legal activation key cipher is entered, an Activation Key Loaded Successfully event is sent to the Event Log.
Displaying Activation Key Information (CLI)
To display information about the currently installed activation key, enter the following command in root view:
root> platform activation-key show all
To display a list of features that your current activation key supports, and usage information about these features, enter the following command in root view:
root> platform activation-key show usage all
To display a list of the radio capacities that your current activation key supports and their usage information, enter the following command in root view:
root> platform activation-key show usage radio
Activating an Activation Key (CLI)
You can use a demo license to enable all PTP 820G and PTP 820F features for 60 days. The demo license expires 60 days from the time it was activated, and the most recent previously installed and valid license goes into effect. The 60-day period is only counted when the system is powered up. 48 hours before the demo license expires, an alarm is raised indicating that the demo license is about to expire.
To activate the demo license, enter the following command in root view:
root> platform activation-key set demo admin enable
To display the current status of the demo license, enter the following command in root view:
root> platform activation-key show demo status
Setting the Time and Date (Optional) (CLI)
Related Topics:
- Configuring NTP (CLI)
PTP 820G and PTP 820F uses the Universal Time Coordinated (UTC) standard for time and date configuration. UTC is a more updated and accurate method of date coordination than the earlier date standard, Greenwich Mean Time (GMT).
Every PTP 820G and PTP 802F unit holds the UTC offset and daylight savings time information for the location of the unit. Each management unit presenting the information uses its own UTC offset to present the information in the correct time.

Note
If the unit is powered down, the time and date are saved for 96 hours (four days). If the unit remains powered down for longer, the time and date may need to be reconfigured.
To set the UTC time, enter the following command in root view:
root> platform management time-services utc set date-and-time <date-and-time>
To set the local time offset relative to UTC, enter the following command in root view:
root> platform management time-services utc set offset hours-offset <hours-offset> minutes-offset <minutes-offset>
To display the local time configurations, enter the following command in root view:
root> platform management time-services show status
Table 131 Local Time Configuration CLI Parameters
| Parameter | Input Type | Permitted Values | Description |
| date-and-time | Number | dd-mm-yyyy,hh:mm:sswhere:dd = datemm = monthyyyy= yearhh = hourmm = minutesss = seconds | Sets the UTC time. |
| hours-offset | Number | -12 – 13 | The required hours offset (positive or negative) relative to GMT. This is used to offset the clock relative to GMT, according to the global meridian location. |
| minutes-offset | Number | 0 – 59 | The required minutes relative to GMT. This is used to offset the clock relative to GMT, according to the global meridian location. |
The following command sets the GMT date and time to January 30, 2014, 3:07 pm and 58 seconds:
root> platform management time-services utc set date-and-time 30-01-2014,15:07:58
The following command sets the GMT offset to 13 hours and 32 minutes:
root> platform management time-services utc set offset hours-offset 13 minutes-offset 32
To set the daylight savings time parameters, enter the following command in root view:
root> platform management time-services daylight-savings-time set start-date-month <start-date-month> start-date-day <start-date-day> end-date-month <end-date-month> end-date-day <end-date-day> offset <offset>
Table 132 Daylight Savings Time CLI Parameters
| Parameter | Input Type | Permitted Values | Description |
| start-date-month | Number | 1 - 12 | The month when Daylight Savings Time begins. |
| start-date-day | Number | 1 - 31 | The date in the month when Daylight Savings Time begins. |
| end-date-month | Number | 1 - 12 | The month when Daylight Savings Time ends. |
| end-date-day | Number | 1 - 31 | The date in the month when Daylight Savings Time ends. |
| offset Number 0 - 23 | The required offset, in hours, for Daylight Savings Time. Only positive offset is supported. | ||
The following command configures daylight savings time as starting on May 30 and ending on October 1, with an offset of 20 hours.
root> platform management time-services daylight-savings-time set start-date-month 5 start-date-day 30 end-date-month 10 end-date-day 1 offset 20
The following is a sample output of the platform management time-services show status command:
root> platform management time-services show status
Local Time 04-03-2014,03:07:01
UTC date & time 04-03-2014,08:07:01
UTC offset hours -5
UTC offset minutes 0

Daylight Saving Time (DST) settings:
Start-Date <month/day> 3/9
End-Date <month/day> 11/1
Offset in hours 1
root>
Enabling the Interfaces (Interface Manager) (CLI)
The following are the default settings for the unit's interfaces:
- Ethernet traffic interfaces, the second management interface, and the Synchronization interface are disabled, and must be manually enabled as described below.
- Radio interfaces, the first management interface, and the TDM interface (optional) are automatically enabled.
To enable or disable an interface, enter the following command in root view:
root> platform if-manager set interface-type <interface-type> slot <slot> port <port> admin <admin>

Note
To enable or disable an E1/DS1 interface, use the pwe3 tdm enable slot command. See Configuring the E1/DS1 Parameters (CLI).
PTP 820F supports both single-carrier and Multi Core RFUs. The radio carriers are displayed as shown in following Table.
Table 133 Interface Configuration CLI Parameters
| Parameter | Input Type | Permitted Values | Description |
| interface-type | Variable | ethernet | ethernet - An Ethernet interface. |
| radio | radio - A radio interface | ||
| management | management - A management interface. | ||
| sync | sync - A synchronization interface. | ||
| stm1oc3 | stm1oc3 - The STM-1/OC-3interface. | ||
| slot | Number | 1 | Always enter 1. |
| port Number | ethernet: 1-6 | The interface you want to enable or disable. | |
| radio: 1-2 | |||
| management: 1-2 | |||
| sync: 1 | |||
| tdm: 1 | |||
| admin Variable | up | Enter up to enable the interface or down to disable the interface. | |
| down |
The following command enables Ethernet port 1:
root> platform if-manager set interface-type ethernet slot 1 port 1 admin up
The following command enables an STM-1/OC-3 card in expansion slot 2:
root> platform if-manager set interface-type stmloc3 slot 2 port 1 admin up
The following command displays the status of all the interfaces in the unit:
root> platform if-manager show interfaces
Enabling the Second Management Interface (CLI)
To enable the second management interface, enter the following command in root view:
root> platform management local-mngt admin state set enable port mng2
To disable the second management interface, enter the following command in root view:
root> platform management local-mngt admin state set disable port mng2
To display the status of both management interfaces, enter the following command in root view:
root> platform management local-mngt admin state show port all
Configuring Cascading Interfaces (Optional) (CLI)
Ethernet interfaces 1 and 2 (GbE1/CS1 and GbE2/CS2) can be configured as normal GE traffic interfaces or as cascading interfaces. When operating in cascading mode, these interfaces can handle hybrid Ethernet and Native TDM traffic, enabling operators to create links among multiple units in a node for multi-directional applications based on hybrid Ethernet and Native or pseudowire TDM services.

Note
You cannot change the status of an interface (Cascading or Ethernet) if a service point is configured on the interface.
You cannot change the status of an interface (Cascading or Ethernet) if the interface belongs to a LAG.
You cannot set Auto Negotiation to On while the interface is configured as a Cascading interface.
To configure an interface as a cascading interface, go to interface view for the interface and enter the following command:
eth type eth [1/2]> port-cascading-set cascading <cascading>
To display whether or not an interface is configured as a cascading interface, go to interface view for the interface and enter the following command:
eth type eth [1/1]> port-cascading-show
Table 134 Cascading Interface CLI Parameters
| Parameter | Input Type | Permitted Values | Description |
| cascading | Boolean | Cascading ethernet | Cascading – The interface is configured as a cascading interface.ethernet – The interface is configured as a non-cascading Ethernet interface. |
For example, the following commands configure Ethernet port 2 as a cascading interface:
root> ethernet interfaces eth slot 1 port 2
eth type eth [1/2]> port-cascading-set cascading Cascading
Entering Radio View (CLI)
To view and configure radio parameters, you must first enter the radio's view level in the CLI.
To enter a radio's view level, enter the following command in root view:
root> radio slot <slot> port <port>
The following command enters radio view for radio interface 1:
root> radio slot 1 port 1
The following prompt appears:
radio[1/1]>
The following command enters radio view for radio interface 2:
root> radio slot 1 port 2
The following prompt appears:
radio[1/2]>
Unmuting a Radio (CLI)
To mute or unmute the radio, go to radio view and enter the following command:
radio[x/x]>rf mute set admin <admin>
To display the mute status of a radio, go to radio view and enter the following command:
radio[x/x]>rf mute show status
Table 135 Radio Mute/Unmute CLI Parameters
| Parameter | Input Type | Permitted Values | Description |
| admin Variable on | off | Mutes (on) or unmutes (off) the radio. | |
The following command mutes radio interface 1:
radio[1/1]>rf mute set admin on
The following command unmutes radio interface 2:
radio[1/2]>rf mute set admin off
Configuring the Transmit (TX) Level (CLI)
To set the transmit (TX) level of a radio, go to radio view and enter the following command:
radio[x/x]>rf set tx-level <tx-level>
To display the maximum transmit (TX) level of a radio, go to radio view and enter the following command:
radio[x/x]>rf show max-tx-level
Table 136 Radio Transmit (TX) Level CLI Parameters
| Parameter | Input Type | Permitted Values | Description |
| tx-level | Number | PTP 820G units: -1 to 22 | The desired TX signal level (TSL), in dBm. |
The following command sets the TX level of radio interface 1 to 10 dBm:
radio[2/1]>rf set tx-level 10
Configuring the Transmit (TX) Frequency (CLI)
To set the transmit (TX) frequency of a radio, enter the following command in radio view. This command automatically sets the remote RX frequency in parallel, unless you set the local-remote attribute to disable:
radio[x/x]>rf set tx-frequency
Table 137 Radio Transmit (TX) Frequency CLI Parameters
| Parameter | Input Type | Permitted Values | Description |
| tx-frequency Number | Depends on the MRMC script and the unit type. | The desired TX frequency (in KHz) and, ifis set to enable, the desired RX frequency of the remote unit. | |
| local-remote Variable enable | disable | Optional. Determines whether to apply the configured TX frequency value to the RX frequency of the remote unit. | |
The following command sets the TX frequency of radio interface 1 to 12900000 KHz, and sets the RX frequency of the remote unit to the same value.
radio[1/1]>rf set tx-frequency 12900000
The following command sets the TX frequency of radio interface 2 to 12900000 KHz, but does not set the RX frequency of the remote unit.
radio[1/2]>rf set rx-frequency 12900000 local-remote disable
Configuring the Radio (MRMC) Script(s) (CLI)
Multi-Rate Multi-Constellation (MRMC) radio scripts define how the radio utilizes its available capacity. Each script is a pre-defined collection of configuration settings that specify the radio's transmit and receive levels, link modulation, channel spacing, and bit rate. Scripts apply uniform transmit and receive rates that remain constant regardless of environmental impact on radio operation.
To display all scripts that are available for a specific radio carrier in your unit, enter the following command in radio view:
radio[x/x]>mrmc script show script-type <script-type> acm-support <acm-support>

Note
The list of available scripts reflects activation-key-enabled features. Only scripts within your activation-key-enabled capacity will be displayed.
Displaying Available MRMC Scripts (CLI)
To display all scripts that are available for a specific radio carrier in your unit, go to radio view and enter the following command:
radio[x/x]>mrmc script show script-type <script-type> acm-support <acm-support>

Note
The list of available scripts reflects activation-key-enabled features. Only scripts within your activation-key-enabled capacity will be displayed.
Table 138 MRMC Script CLI Parameters
| Parameter | Input Type | Permitted Values | Description |
| script-type | Variable | normalasymmetrical | Determines the type of scripts to be displayed:normal – Scripts for symmetrical bandwidth.asymmetrical – Scripts for asymmetrical bandwidth.Note: Asymmetrical scripts are not supported in this release. |
| acm-support | Boolean yes | no | Determines whether to display scripts that support Adaptive Coding Modulation (ACM). In ACM mode, a range of profiles determines Tx and Rx rates. This allows the radio to modify its transmit and receive levels in response to environmental conditions. |
The following commands display available symmetrical (normal) scripts with ACM support for radio interface 1:
root> radio slot 1 port 1
radio [1/1]>mrmc script show script-type normal acm-support yes
Script |Script-Name
ID# |
<1003> |mdN_A5656N_145_1003
<1004> |mdN_A2828N_149_1004
<1005> |mdN_A2828N_130_1005
<1006> |mdN_A5656N_129_1006
<1007> |mdN_A4040N_119_1007
<1008> |mdN_A0707N_121_1008
<1009> |mdN_A1414N_113_1009
<1010> |mdN_A5050N_111_1010
<1020> |mdN_A1010N_100_1020
<1021> |mdN_A2020N_100_1021
<1203> |mdN_A5656X_105_1203
<1204> |mdN_A2828X_113_1204
<1205> |mdN_A2828X_111_1205
<1206> |mdN_A5656X_101_1206
<1207> |mdN_A4040X_109_1207
<1210> |mdN_A5050X_104_1210
<1214> |mdN_A2828X_102_1214
<1217> |mdN_A4040X_102_1217
<1222> |mdN_A2525X_103_1222

radio [1/1]>
Assigning an MRMC Script to a Radio Carrier (CLI)
Once you have a list of valid scripts, you can assign a script to the radio carrier. The command syntax differs depending on whether you are assigning a script with ACM support or a script without ACM support.

Note
When you enter a command to change the script, a prompt appears informing you that changing the script will reset the unit and affect traffic. To continue, enter yes. Changing the maximum or minimum profile does not reset the radio interface.
To assign a script with ACM enabled, go to radio view and enter the following command:
radio[x/x]> mrmc set acm-support script-id <script-id> modulation adaptive max-profile <profile>
To assign a script without ACM enabled, go to radio view and enter the following command:
radio[x/x]> mrmc set acm-support script-id <script-id> modulation fixed profile <profile>
To display the current MRMC script configuration, go to radio view and enter the following command:
radio[x/x]>mrmc show script-configuration
Table 139 MRMC Script Assignation to Radio Carrier CLI Parameters
| Parameter | Input Type | Permitted Values | Description |
| script-id Number | Depends on available scripts. | The ID of the script you want to assign to the radio carrier. | |
| modulation Variable | adaptive fixed | Determines whether ACM is enabled (adaptive) or disabled (fixed). | |
| max-profile Number | For fixed interfaces and RMC-B: 0 – 10For RMC-A: 0 – 7 | Adaptive ACM mode only: The maximum profile for the script. For example, if you select a maximum profile of 5, the system will not climb above profile 5, even if channel fading conditions allow it. | |
| min-profile Number | For fixed interfaces and RMC-B: 0 – 10For RMC-A: 0 – 7 | Adaptive ACM mode only: The minimum profile for the script. For example, if you select a minimum profile of 3, the system will not go below profile 3 regardless of the channel fading conditions. The minimum profile cannot be greater than the maximum profile, but it can be equal to it.If you do not include this parameter in the command, the minimum profile is set at the default value of 0. | |
| profile Number | For fixed interfaces and RMC-B: 0 – 10 | Fixed ACM mode only: The profile in which the system will operate | |
| For RMC-A: 0 – 7 | |||
The following command assigns MRMC script ID 1204, with ACM enabled, a minimum profile of 3 and a maximum profile of 8, to radio interface 2:
radio[1/2]>mrmc set acm-support script-id 1204 modulation adaptive max-profile 8 min profile 3
The following command assigns MRMC script ID 1204, with ACM disabled and a maximum profile of 5, to radio interface 1:
radio[1/1]>mrmc set acm-support script-id 1204 modulation fixed profile 5
Enabling ACM with Adaptive Transmit Power (CLI)
This feature requires:
- ACM script
- When working with RFU-C, requires RFU software version 2.17 or above
When planning ACM-based radio links, the radio planner attempts to apply the lowest transmit power that will perform satisfactorily at the highest level of modulation. During fade conditions requiring a modulation drop, most radio systems cannot increase transmit power to compensate for the signal degradation, resulting in a deeper reduction in capacity. The PTP 820G or PTP 820F is capable of adjusting power on the fly, and optimizing the available capacity at every modulation point.
To enable Adaptive TX Power for a radio, enter the following command in radio view:
radio[x/x]>rf adaptive-power admin enable
To disable Adaptive TX Power for a radio, enter the following command in radio view:
radio[x/x]>rf adaptive-power admin disable
To display whether Adaptive TX Power is enabled, enter the following command in radio view:
radio[x/x]>rf adaptive-power show status
The output of this command is:
radio [x/x]>rf adaptive-power show status
RF adaptive power admin status: [enable/disable]
RF adaptive power operational status: [up/down]
RF adaptive power operational status: Up means the feature is enabled and fully functional for that radio link. Note that the feature is configured and operates independently for each radio link.
Configuring the RSL Threshold Alarm (CLI)
You can enable an alarm to be triggered in the event that the RSL falls beneath a defined threshold. This alarm is alarm ID 1610, Radio Receive Signal Level is below the configured threshold. By default, the alarm is disabled.
To enable the RSL threshold alarm, enter the following command in radio view:
radio[x/x]> rf rsl-degradation set admin enable
To disable the RSL threshold alarm, enter the following command in radio view:
radio[x/x]> rf rsl-degradation set admin disable
To set the threshold of the RSL threshold alarm, enter the following command in radio view:
radio[x/x]> rf rsl-degradation set threshold <-99-0>
The default threshold is -68 dBm.
To display the current alarm configuration, enter the following command in radio view:
radio[x/x]> rf rsl-degradation show status
The following commands enable the RSL threshold alarm for fixed radio interface 1 and set the threshold to -55 dBm.
root> radio slot 1 port 1
radio [1/1]>rf rsl-degradation set admin enable
radio [1/1]>rf rsl-degradation set threshold -55
radio [1/1]>rf rsl-degradation show status
RSL degradation alarm admin: enable
RSL degradation threshold: -55
radio [1/1]>
The alarm is cleared when the RSL goes above the configured threshold. The alarm is masked if the radio interface is disabled, the radio does not exist, or a communication-failure alarm (Alarm ID #1703) is raised.
Operating in FIPS Mode (CLI)
From release 8.3, PTP 820G can be configured to be FIPS 140-2-compliant in specific hardware and software configurations, as described in this section.

Note
FIPS 140-2 compliance is only available with the PTP 820 Assured platform. System release 11.3 cannot be used in PTP 820 Assured platforms. For PTP 820 Assured, use System release 8.3
Requirements for FIPS Compliance (CLI)
For a full list of FIPS requirements, refer to the Cambium PTP 820 FIPS 140-2 Security Policy, available upon request. It is the responsibility of the customer to ensure that these requirements are met.
PTP 820G unit redundancy configurations can be configured to be FIPS 140-2-compliant. This requires encryption of the protection link between the two units. See Encrypting the External Protection Link (CLI).
For details on hardware requirements for operating in FIPS mode, see Requirements for FIPS Compliance.
Enabling FIPS Mode (CLI)
To set the unit to operate in FIPS mode, enter the following command in root view:
root> platform security fips-mode set admin enable
To disable FIPS mode, enter the following command in root view:
root> platform security fips-mode set admin disable

Note
Changing the FIPS configuration causes a unit reset.
To display the unit's current FIPS setting, enter the following command in root view:
root> platform security fips-mode show
Status values are:
- enable – FIPS mode is enabled.
- disable – FIPS mode is disabled.
After enabling FIPS:
- The MD5 option for SNMPv3 is blocked.
- After any system reset, the length of time before users can log back into the system is longer than usual due to FIPS-related self-testing.
Chapter 15: Configuration Guide (CLI)
This section includes:
• System Configurations (CLI)
- Configuring a 1+0 Link (CLI)
- Configuring Multi-Carrier ABC (CLI)
- Configuring Link Aggregation (LAG) and LACP (CLI)
- Configuring XPIC (CLI)
- Configuring HSB Radio Protection (CLI)
System Configurations (CLI)
This section lists basic system configurations and their prerequisites, with links to configuration instructions.
This section includes:
• Radio Configurations (CLI)
• TDM Configurations

Note
For an up-to-date description of feature and configuration limitations, refer to the Release Notes for version 10.0.
Radio Configurations (CLI)
A PTP 820G or PTP 820F system can be used in the following radio configurations.

Note
One Multi-Carrier ABC group can be configured per unit.
Table 140 Radio Configuration PTP 820F
| Configuration | Special Requirements | Link to Configuration Instructions |
| 1+0 Configuring a 1+0 Link (CLI) | ||
| 2+0 Single Polarization | Requires Multi-Carrier ABC or LAG | Configuring Multi-Carrier ABC (CLI)Configuring Link Aggregation (LAG) and LACP (CLI) |
| 2+0 Dual Polarization (XPIC) | Requires Multi-Carrier ABC or LAG | Configuring XPIC (CLI)Configuring Multi-Carrier ABC (CLI)Configuring Link Aggregation (LAG) and LACP (CLI) |
Table 141 Radio Configurations PTP 820G
| Configuration | Special Requirements | Link to Configuration Instructions |
| 1+0 Configuring a 1+0 Link (CLI) | ||
| 2+0 Single Polarization | Requires Multi-Carrier ABC or LAG | Configuring Multi-Carrier ABC (CLI)Configuring Link Aggregation (LAG) and LACP (CLI) |
| 2+0 Dual Polarization (XPIC) | Requires Multi-Carrier ABC or LAG | Configuring Multi-Carrier ABC (CLI)Configuring XPIC (CLI)Configuring Link Aggregation (LAG) and LACP (CLI) |
| 1+1 HSB Protection | Configuring HSB Radio Protection (CLI) | |
| 1+1 HSB Protection with BBS Space Diversity | Requires Multi-Carrier ABC | Configuring HSB Radio Protection (CLI)Configuring Multi-Carrier ABC (CLI) |
TDM Configurations
PTP 820G provides integrated support for transportation of TDM (E1/DS1) services with integrated E1/DS1 interfaces.
Two types of TDM services are supported using the same hardware:
- Native TDM trails.
• TDM Pseudowire services (enabling interoperability with third party packet/PW equipment).
PTP 820G and PTP 820F also offers hybrid Ethernet and TDM services. Hybrid services can utilize either Native TDM or pseudowire.
PTP 820G and PTP 820F offers a variety of path protection options.
Table 135 lists the basic TDM configuration options, with links to configuration instructions.
Table 142 TDM Configurations
| Configuration | Special Requirements | Link to Configuration Instructions |
| Native TDM Services | Requires E1/DS1 interface. | Configuring Native TDM Trails (CLI) |
| Native TDM Services with Path Protection | Requires E1/DS1 interface. | Configuring Native TDM Trails (CLI) |
| Pseudowire TDM Services | Requires E1/DS1 interface. | Configuring TDM Pseudowire Services (CLI) |
| Pseudowire TDM Services with Path Protection | Requires E1/DS1 interface. | Configuring TDM Pseudowire Services (CLI) |
Configuring a 1+0 Link (CLI)
To configure a 1+0 link, you must perform the following steps:
1 Unmute the radio. See Unmuting a Radio (CLI).
2 Configure the radio's TX level. See Configuring the Transmit (TX) Level (CLI).
3 Configure the radio's frequency. See Configuring the Transmit (TX) Frequency (CLI).
4 Configure the radio's MRMC script. See Configuring the Radio (MRMC) Script(s) (CLI).
Configuring Multi-Carrier ABC (CLI)

Note
ForPTP 820F, Multi-Carrier ABC requires a MultiCore RFU-D.
This section includes:
• Multi-Carrier ABC Overview (CLI)
- Configuring a Multi-Carrier ABC Group (CLI)
- Removing Members from a Multi-Carrier ABC Group (CLI)
• Deleting a Multi-Carrier ABC Group (CLI)
Multi-Carrier ABC Overview (CLI)
Multi-Carrier Adaptive Bandwidth Control (ABC) enables multiple separate radio carriers to be shared by a single Ethernet port. This provides an Ethernet link over the radio with the total sum of the capacity of all the radios in the group, while still behaving as a single Ethernet interface. In Multi-Carrier ABC mode, traffic is dynamically divided among the carriers, at the Layer 1 level, without requiring Ethernet Link Aggregation.
Load balancing is performed regardless of the number of MAC addresses or the number of traffic flows. During fading events which cause ACM modulation changes, each carrier fluctuates independently with hitless switchovers between modulations, increasing capacity over a given bandwidth and maximizing spectrum utilization. The result is 100% utilization of radio resources in which traffic load is balanced based on instantaneous radio capacity per carrier.
One Multi-Carrier ABC group that includes both radio interfaces can be configured per unit.

Note
If the modulation of a radio carrier in the Multi-Carrier ABC group drops to Profile 0, that carrier is removed from the group until modulation returns to Profile 1 or higher.
In this version, one Multi-Carrier ABC group that includes both radio carriers can be configured per unit. The MRMC scripts for both radio carriers must be identical.
Configuring a Multi-Carrier ABC Group (CLI)
The Multi-Carrier ABC group configuration procedure is different for PTP 820F, on one hand, and PTP 820G, on the other.
For PTP 820F, Multi-Carrier ABC is configured between the two carriers of the same RFU (RFU-D or RFU-D-HP).
For PTP 820G, Multi-Carrier ABC is configured between different radio interfaces connected to different RFUs.

Note
Radio slot 2 port 1 should always be configured on channel 1 while Radio slot 2 port 2 should always be configured on channel 2.
Configuring Multi-Carrier ABC for PTP 820F (CLI)
To configure a Multi-Carrier ABC group for PTP 820F (CLI):
- Create the group by entering the following command in root view.
root> multi-carrier-abc create group group_id 1 slot 1 type RFU
- Add members to the group by entering the following commands to enter Multi-Carrier ABC Group view and attaching both carriers of the RFU (ports) to the group.
root> multi-carrier-abc group-id <1-4> slot <slot> type RFU
multi-carrier-abc group-id 1 slot 1
multi-carrier-abc group-id [x]> attach-member slot 1 port 1 channel-id <1-16>
multi-carrier-abc group-id [x]> attach-member slot 1 port 2 channel-id <1-16>
The Channel ID identifies the interface within the group.
- To set the amount of bandwidth in the Multi-Carrier ABC group, in kbps, reserved for Ethernet traffic, enter the following command in Multi-Carrier ABC Group view:
multi-carrier-abc group-id 1 slot 1 high-pri-ethernet-bandwidth set <1-2147483647>

Note
If you are managing the unit using in-band management, it is strongly recommended to set this parameter to a value that will ensure that sufficient Ethernet bandwidth is available at all times for management traffic. The default value is 0..
The following commands create a Multi-Carrier ABC group with the two carriers of an RFU-D or RFU-D-HP, and assign 100000 kbps to Ethernet traffic.
root> multi-carrier-abc create group group_id 1 slot 1 type RFU
root> multi-carrier-abc group-id 1 slot 1 type RFU
multi-carrier-abc group-id [1] slot [1]>attach-member slot 1 port 1 channel-id 1
multi-carrier-abc group-id [1] slot [1]>attach-member slot 1 port 2 channel-id 2
multi-carrier-abc group-id [1] slot [1]>
multi-carrier-abc group-id [1] slot [1]> high-pri-ethernet-bandwidth set 100000
multi-carrier-abc group-id [1] slot [1]> exit
Configuring Multi-Carrier ABC for PTP 820G (CLI)
To configure a Multi-Carrier ABC group for PTP 820G (CLI):
1 Create the group by entering the following command in root view:
root> multi-carrier-abc create group group_id 1
multi-carrier-abc group-id [1]>
2 Enter Multi-Carrier ABC Group view by entering the following command in root view:
root> multi-carrier-abc group-id [1]
3 Add members to the group as follows:
To add a radio carrier to the group, enter the following command in Multi-Carrier ABC Group view. Repeat this command for each radio carrier you want to add.
multi-carrier-abc group-id [1]> attach-member slot 2 port <port> channel-id <1-16>
The Channel ID identifies the interface within the group.
4 Repeat for the second radio carrier.
The following commands create a Multi-Carrier ABC group.
root> multi-carrier-abc create group group_id 1
multi-carrier-abc group-id[1]> attach-member slot 2 port 1 channel-id 1
multi-carrier-abc group-id[1]> attach-member slot 2 port 2 channel-id 2
multi-carrier-abc group-id[1]> exit
Removing Members from a Multi-Carrier ABC Group (CLI)
To remove members from a Multi-Carrier ABC group:
1 To remove an individual radio carrier from the Multi-Carrier ABC group, go to Multi-Carrier ABC group view and enter the following command:
multi-carrier-abc group-id[1]> detach-member channel-id <channel-id>
2 To remove a protection group member from the Multi-Carrier ABC group, go to Multi-Carrier ABC group view and enter the following command:
multi-carrier-abc group-id[1]> detach-group channel-id <channel-id>
Deleting a Multi-Carrier ABC Group (CLI)

Note
For instructions on deleting a Multi-Carrier ABC/HSB-SD group, see Deleting an HSB Radio Protection Group with Space Diversity (CLI).
To delete a Multi-Carrier ABC group:
- 1 Remove the members from the group. See Removing Members from a Multi-Carrier ABC Group (CLI).
- 2 To delete a Multi-Carrier ABC group on a PTP 820F enter the following command in root view:
root> multi-carrier-abc delete group group_id 1 slot 1 type RFU
- To delete a Multi-Carrier ABC group on a PTP 820G enter the following command in root view:
root> multi-carrier-abc delete group group_id 1 slot 1
Configuring Link Aggregation (LAG) and LACP (CLI)
Link aggregation (LAG) enables you to group several physical Ethernet or radio interfaces into a single logical interface bound to a single MAC address. This logical interface is known as a LAG group. Traffic sent to the interfaces in a LAG group is distributed by means of a load balancing function. PTP 820G uses a distribution function of up to Layer 4 in order to generate the most efficient distribution among the LAG physical ports.
This section explains how to configure LAG and includes the following topics:
- LAG Overview (CLI)
- Configuring a LAG Group (CLI)
- Configuring LACP (CLI)
- Configuring Enhanced LAG Distribution (CLI)
- Deleting a LAG Group (CLI)
• Displaying LACP Parameters and Statistics (CLI)
LAG Overview (CLI)
Link aggregation (LAG) enables you to group several physical Ethernet or radio interfaces into a single logical interface bound to a single MAC address. This logical interface is known as a LAG group. Traffic sent to the interfaces in a LAG group is distributed by means of a load balancing function. PTP 820G uses a distribution function of up to Layer 4 in order to generate the most efficient distribution among the LAG physical ports.
LAG can be used to provide interface redundancy, both on the same card (line protection) and on separate cards (line protection and equipment protection).
LAG can also be used to aggregate several interfaces in order to create a wider (aggregate) link. For example, LAG can be used to create a 4 Gbps channel.
You can create up to four LAG groups. The following restrictions exist with respect to LAG groups:
- Only physical interfaces (including radio interfaces), not logical interfaces, can belong to a LAG group.
- Cascading interfaces cannot belong to a LAG group. See Configuring Cascading Interfaces (Optional) (CLI).
- Interfaces can only be added to the LAG group if no services or service points are attached to the interface.
- Any classification rules defined for the interface are overridden by the classification rules defined for the LAG group.
- When removing an interface from a LAG group, the removed interface is assigned the default interface values.
There are no restrictions on the number of interfaces that can be included in a LAG. It is recommended, but not required, that each interface in the LAG have the same parameters (e.g., speed, duplex mode).

Note
To add or remove an Ethernet interface to a LAG group, the interface must be in an administrative state of "down". This restriction does not apply to radio interfaces. For instructions on setting the administrative state of an interface, see Enabling the Interfaces (Interface Manager) (CLI)
PTP 820 supports LACP, which expands the capabilities of static LAG and provides interoperability with third-party equipment that uses LACP. LACP improves the communication between LAG members. This improves error detection capabilities in situations such as improper LAG configuration or improper cabling. It also enables the LAG to detect uni-directional failure and remove the link from the LAG, preventing packet loss.
LACP is enabled as part of the LAG configuration process. It should only be used if the LAG is in a link with another LACP-enabled LAG.

Note
- LACP is not supported with unit redundancy. For unit redundancy, a special, limited implementation is configured on the logical interface level. See Configuring Unit Redundancy for the PTP 820 Split Mount (CLI).
• LACP can only be used with Ethernet interfaces. - LACP cannot be used with Enhanced LAG Distribution or with the LAG Group Shutdown in Case of Degradation Event feature.
Configuring a LAG Group (CLI)
To create a LAG group, go to interface view for the first interface you want to assign to the LAG and enter the following command:
eth type eth [x/x]> static-lag add lagid <lag1|lag2|lag3|lag4>
Repeat this process for each interface you want to assign to the LAG.
To remove an Ethernet member interface from a LAG, go to interface view for the LAG and enter the following command:
eth group [lagx]> port static-lag remove member interface eth slot <slot> port <port>
To remove a radio member interface from a LAG, go to interface view for the LAG and enter the following command:
eth group [lagx]> port static-lag remove member interface radio slot <slot> port <port>
To display the name of a LAG to which an interface belongs, go to interface view for the interface and enter the following command:
eth type eth [x/x]> static-lag show name
To enter interface view for a LAG, enter the following command in root view:
root> ethernet interfaces group <lag1|lag2|lag3|lag4>
To display details about a LAG, go to interface view for the LAG: and enter the following command:
eth group [lagx]> summary show
To display a LAG's operational state, go to interface view for the LAG: and enter the following command:
eth group [lagx]> operational state show
To display a list of interfaces that belong to a LAG, go to interface view for the LAG and enter the following command:
eth group [lagx]> port static-lag show members
The following commands create a LAG with the ID lag2. The LAG includes Ethernet ports 1, 2, and 3:
root> platform if-manager set interface-type ethernet slot 1 port 1 admin
down
root> platform if-manager set interface-type ethernet slot 1 port 2 admin
down
root> platform if-manager set interface-type ethernet slot 1 port 3 admin
down
root> ethernet interfaces eth slot 1 port 1
eth type eth [1/1]>
eth type eth [1/1]> static-lag add lagid lag2
eth type eth [1/1]> exit
root>
root> ethernet interfaces eth slot 1 port 2
eth type eth [1/2]>
eth type eth [1/2]> static-lag add lagid lag2
eth type eth [1/2]> exit
root>
root> ethernet interfaces eth slot 1 port 3
eth type eth [1/3]>
eth type eth [1/3]> static-lag add lagid lag2
eth type eth [1/3]> exit
root> platform if-manager set interface-type ethernet slot 1 port 1 admin
up
root> platform if-manager set interface-type ethernet slot 1 port 2 admin
up
root> platform if-manager set interface-type ethernet slot 1 port 3 admin
up
The following command displays the name of the LAG to which Ethernet port 1 belongs:
eth type eth [1/1]> static-lag show name
Static-lag group name: lag2
The following commands display details about the LAG::
root> ethernet interfaces group lag2
eth group [lag2]>
eth group [lag2]> port static-lag show members
Static-lag members
Eth#[1/1]
Eth#[1/2]
Eth#[1/3]]
eth group [lag2]> summary show
Group lag2 Summary: Value
Port Description:
Port Admin state: enable
Port Operational state: down
Port Edge state: non-edge-port
Member Port#(1) 1/1
Member Port#(2) 1/2
Member Port#(3) 1/3
eth group [lag2]> operational state show
Port operational state: up.
eth group [lag2]>
The following commands remove Ethernet port 2 from the LAG:
root> platform if-manager set interface-type ethernet slot 1 port 2 admin down
root> ethernet interfaces group lag2
eth group [lag2]>
eth group [lag2]> port static-lag remove member interface eth slot 1 port 2
Configuring LACP (CLI)
To enable LACP on a LAG group, go to interface view for the LAG and enter the following command:
eth group [lagx]> lacp admin set enable
To disable LACP on a LAG group, go to interface view for the LAG and enter the following command:
eth group [lagx]> lacp admin set disable
To display whether or not LACP is enabled on a LAG group, go to interface view for the LAG and enter the following command:
eth group [lagx]>lacp admin show
The following commands enable LACP for LAG group 1:
root> ethernet interfaces group lag1
eth group [lag1]>lacp admin set enable
eth group [lag1]>
Enabling and Disabling the LAG Group Shutdown in case of Degradation Event Option (CLI)

Note
LAG Group Shutdown in Case of Degradation Event cannot be used with LACP.
A LAG group can be configured to be automatically closed in the event of LAG degradation. This option is used if you want traffic from the switch to be re-routed during such time as the link is providing less than a certain capacity.
By default, the LAG group shutdown in case of degradation event option is disabled. When enabled, the LAG is automatically closed in the event that any one or more ports in the LAG fail. When all ports in the LAG are again operational, the LAG is automatically re-opened.

Note
Failure of a port in the LAG also triggers a lag-degraded alarm, Alarm ID 100.
To enable the LAG group shutdown in case of degradation event option, go to interface view for the LAG and enter the following command:
eth group [lagx]> static-lag set lag-degrade-admin admin enable
To disable the LAG group shutdown in case of degradation event option, go to interface view for the LAG and enter the following command:
eth group [lagx]> static-lag set lag-degrade-admin admin disable
To display the current the LAG group shutdown in case of degradation event option setting, go to interface view for the LAG and enter the following command:
eth group [lagx]> static-lag show lag-degrade-admin
The following commands enable the LAG group shutdown in case of degradation event option for LAG group 1:
root> ethernet interfaces group lag1
eth group [lag1]>static-lag set lag-degrade-admin admin enable
eth group [lag1]>
Configuring Enhanced LAG Distribution (CLI)
You can change the distribution function by selecting from ten pre-defined LAG distribution schemes. The feature includes a display of the TX throughput for each interface in the LAG, to help you identify the best LAG distribution scheme for the specific link.

Note
Enhanced LAG distribution is only available for LAG groups that consist of exactly two interfaces, it cannot be used with LACP.
To configure enhanced LAG distribution, go to interface view for the LAG and enter the following command:
eth group [lagx]> static-lag set df-pattern df <1-10>
The following commands set the LAG distribution scheme for LAG group 1 as distribution pattern 3.
root> ethernet interfaces group lag1
eth group [lag1]>static-lag set df-pattern df 3
The default LAG distribution pattern is 1.
To display the current LAG distribution scheme, go to interface view for the LAG and enter the following command:
eth group [lagx]> static-lag show df-pattern
It is recommended to experiment with the various schemes by monitoring the TX port PMs for each interface in the LAG for each LAG distribution scheme. In the Web EMS, the page in which you configure enhanced LAG distribution also displays TX throughput PMs per interface. See Configuring Enhanced LAG Distribution. For information on monitoring Ethernet port PMs via the CLI, see Displaying Ethernet Port PMs (CLI).
Deleting a LAG Group (CLI)
In order to delete a LAG group, you must first make sure that no service points are attached to the LAG group. To delete a LAG group, simply delete all the members from the LAG, as described above.
Displaying LACP Parameters and Statistics (CLI)
You can display the following LACP parameters and statistics:
• LACP Aggregation (per LAG)
• LACP Port Status
• LACP Port Statistics
• LACP Port Debug Statistics

Note
PTP 820 does not support any LACP write parameters
Displaying LACP Aggregation Status Parameters (CLI)
To display LACP aggregation status parameters, go to interface view for the LAG and enter the following command:
eth group [lagx]> lacp show status
root> ethernet interfaces group lag1
eth group [lag1]>lacp show status
| LACP LAG Configuration |
Admin key : 0
System ID : 0:0:0:0:0:0
System Priority : 0
Aggregate or Individual : 0
Actor Oper Key: 0
Agg MAC address : 0:0:0:0:0:0
Partner System ID : 0:0:0:0:0:0
Partner System Priority : 0
Partner Oper Key : 0
Collector Max Delay : 0
eth group [lag1]>
Table 143 LACP aggregation status parameters
| Parameter Definition | |
| Admin Key | The current administrative value of the key for the Aggregator. |
| System ID | The MAC address value used as a unique identifier for the system that contains this Aggregator. |
| System Priority | The priority value associated with the Actor's System ID. |
| Aggregate or Individual | Indicates whether the Aggregator represents an aggregate or an individual link. |
| Actor Oper Key | The current operational value of the Key for the Aggregator. |
| Agg MAC Address | The individual MAC address assigned to the Aggregator. |
| Partner System ID | The MAC address value consisting of the unique identifier for the current protocol Partner of this Aggregator. |
| Partner System Priority | The priority value associated with the Partner's System ID. |
| Partner Oper Key | The current operational value of the Key for the Aggregator's current Protocol partner. |
| Collector Max Delay The maximum delay, in tens of microseconds. | |
Displaying LACP Port Status Parameters (CLI)
To display LACP port status parameters, go to interface view for the LAG and enter the following command:
eth group [lagx]> lacp show ports status
root> ethernet interfaces group lag1
eth group [lag1]>lacp show ports status

| LACP LAG Ports Configuration |
Ethernet: Slot 1, Port 1

Port :    11    Partner Oper Port :    0
System Priority : 32768    Partner Oper System Priority : 0
Admin Key :    1    Partner Oper Key :    0
System ID :    0:a:25:40:1f:8c    Partner Oper System ID :    0:0:0:0:0:0
Port Priority : 32768    Partner Oper Port Priority : 0

Actor State : Active+Aggregatable+Defaulted
Partner State : None
Last RX Time: 0 seconds
Age:    382 seconds
RX State : Defaulted
MUX State : Detached
MUX reason: Selected = False

Ethernet: Slot 1, Port 2

Port :    12    Partner Oper Port :    0
System Priority : 32768    Partner Oper System Priority : 0
Admin Key :    1    Partner Oper Key :    0
System ID : 0:a:25:40:1f:8c    Partner Oper System ID :    0:0:0:0:0:0
Port Priority : 32768    Partner Oper Port Priority : 0

Actor State : Active+Aggregatable+Defaulted
Partner State : None
Last RX Time: 0 seconds
Age:    382 seconds
RX State : Defaulted
MUX State : Detached
MUX reason: Selected = False
eth group [lag1]>
Table 144 LACP port status parameters
| Parameter Definition | |
| System Priority | The priority value associated with the Actor's System ID. |
| Admin Key | The current administrative value of the Key for the Aggregation Port. |
| System ID | The MAC Address value that defines the value of the System ID for the system that contains this Aggregation Port. |
| Port Priority | The priority value assigned to this Aggregation Port. |
| Actor State | The current operational values of the Actor's state as transmitted by the Actor via LACPDUs. |
| Partner State | The current values of Actor State in the most recently received LACPDU transmitted by the protocol Partner. |
| Last RX Time | The value of a TimeSinceSystemReset (F.2.1) when the last LACPDU was received by this Aggregation port. |
| RX State | The state of the receive state machine for the Aggregation port.Possible values are:Current – An LACPDU was received before expiration of the most recent timeout period.Expired – No LACPDU was received before expiration of the most recent timeout period.Defaulted – No LACPDU was received during the two most recent timeout periods. |
| Mux State | The state of the Mux state machine for the Aggregation port. Possible values are Collecting, Distributing, Attached, and Detached. |
| Mux Reason | A text string indicating the reason for the most reason change in the state of the Mux machine. |
| Partner Oper Port | The operational port number assigned to this Aggregation port by the Aggregation port's port Partner. |
| Partner Oper System Priority | The operational value of priority associated with the Partner's System ID. |
| Partner Oper Key | The current operational value of the Key for the protocol Partner. |
| Partner Oper System ID | The MAC Address value representing the current value of the Aggregation Port's protocol Partner's System ID. |
| Partner Oper Port Priority | The Priority value assigned to this Aggregation port by the Partner. |
Displaying LACP Port Statistics (CLI)
To display LACP port statistics, go to interface view for the LAG and enter the following command:
eth group [lagx]> lacp show ports statistics
| eth group [lag1]>lacp show ports statistics |
| | LACP LAG Ports Statistics | |
| Ethernet: Slot 1, Port 1 |
| LACPDU Rx : 0 LACPDU Tx : 192 Illegal Rx: 0 Unknown Rx: 0 |
| Ethernet: Slot 1, Port 2 |
| LACPDU Rx : 0 LACPDU Tx : 58 Illegal Rx: 0 Unknown Rx: 0 eth group [lag1]> |
The following table describes the LACP port statistics.
Table 145 LACP port statistics.
| Parameter Definition | |
| LACPDU RX | The number of LACPDUs that this port has received. |
| LACPDU TX | The number of LACPDUs that this port has transmitted. |
| Illegal RX | The number of illegal protocol frames that this port has received. |
| Unknown RX | The number of unknown protocol frames that this port has received. |
Configuring XPIC (CLI)
Cross Polarization Interference Canceller (XPIC) is a feature that enables two radio carriers to use the same frequency with a polarity separation between them. Since they will never be completely orthogonal, some signal cancellation is required.
In addition, XPIC includes an automatic recovery mechanism that ensures that if one carrier fails, or a false signal is received, the mate carrier will not be affected. This mechanism also assures that when the failure is cleared, both carriers will be operational.
This section includes:
• Prerequisites for XPIC (CLI)
- Configuring the Carriers (CLI)
- Creating an XPIC Group (CLI)
• Performing Antenna Alignment (CLI)
- Deleting an XPIC Group (CLI)
Related topics:
- Configuring the XPI Thresholds and Displaying the XPI PMs (CLI)
Prerequisites for XPIC (CLI)
• ForPTP 820F, XPIC requires a MultiCore RFU-D.
- For PTP 820G, each radio interface must be connected to the same type of RFU.
- Each radio carrier must be assigned the same script. The script must be an XPIC script. The script must be an XPIC script. The letter X (XPIC) or N (Non-XPIC) in the script name indicates whether or not the script supports XPIC. For example:
- The script mdN_A2828X_102_1205 supports XPIC.
- The script mdN_A2828N_123-1005 does not support XPIC.
Configuring the Carriers (CLI)
To configure the radio carriers:
- Configure the carriers on both ends of the link to the desired frequency channel. Both carriers must be configured to the same frequency channel.
- Assign XPIC (CCDP operational mode) support-enabled script to both RMCs on both ends of the link. Each RMC must be assigned the same script. See Assigning an MRMC Script to a Radio Carrier (CLI).

Note
XPIC support is indicated by an X in the script name. For example, mdN_A2828X_111_1205 is an XPIC-enabled script. mdN_A2828N_130_100 is not an XPIC-enabled script. For a list of XPIC support-enabled scripts, refer to the most recent PTP 820G Release Notes.
- Create an XPIC group that consists of the two radio carriers that will be in the XPIC group. See Creating an XPIC Group (CLI).
Creating an XPIC Group (CLI)
To create an XPIC group:
1 Create the XPIC group by entering the following command in root view:
root> radio xpic create group <group> radio <slot> port <port> radio <slot> port <port>
2 Enable the group by entering the following command in root view:
root> radio xpic set group <group id> admin enable
The following commands create and enable XPIC group 1 consisting of the two radio carriers of an RFU-D being used with an PTP 820F:
root> radio xpic create group 1 radio 1 port 1 radio 1 port 2
root> radio xpic set group 1 admin enable
Table 146 XPIC Configuration CLI Parameters
| Parameter | Input Type | Permitted Values | Description |
| Group | Number | 1-4 | The group ID of the XPIC group. |
| slot Number 1 | |||
| port Number 1-2 | Theradio carrier you want to add to the XPIC group. | ||
Performing Antenna Alignment for XPIC (CLI)
- Align the antennas for the first carrier. While you are aligning these antennas, mute the second carrier. See Unmuting a Radio (CLI).
- Adjust the antenna alignment until you achieve the maximum RSL for the first-carrier link (the "RSL_wanted"). This RSL should be no more than +/-2 dB from the expected level. Record the RSL of the first carrier as the RSL_wanted.
- Measure the RSL of the second carrier and record it as the "RSLunwanted".
- Determine the XPI, using either of the following two methods:
- To calculate the XPI, subtract the RSL unwanted from the RSL wanted.
- Read the XPI from the Modem XPI field of the Radio Parameters page in the Web EMS. See Viewing the Radio Status and Settings (CLI).
- The XPI should be between 25dB and 30dB. If it is not, you should adjust the OMT assembly on the back of the antenna at one side of the link until you achieve the highest XPI, which should be no less than 25dB. Adjust the OMT very slowly in a right-left direction. OMT adjustment requires very fine movements and it may take several minutes to achieve the best possible XPI.

Note
As an extra step, to check the veracity of the initial measurements, you can mute the first carrier and unmute the second carrier on the upper carriers on both sides of the link. Then measure the RSL of the second carrier link (the "RSL wanted "), measure the RSL of the first carrier (the "RSL unwanted ") and determine the XPI. The XPI should match the XPI with the second carriers muted.
- Unmute all the carriers and check the RSL levels of all the carriers on both sides of the link. The RSL of the horizontal carrier of the local unit should match the RSL of the vertical carrier of the remote unit, within ±2dB . The RSL of the vertical carrier of the local unit should match the RSL of the horizontal carrier of the remote unit, within ±2dB .
- Check the XPI levels of both carriers on both sides of the link by checking the Modem XPI field of the Radio Parameters page in the Web EMS. See Viewing the Radio Status and Settings. All four carriers should have approximately the same XPI value. Do not adjust the XPI at the remote side of the link, as this may cause the XPI at the local side of the link to deteriorate.

Note
In some cases, the XPI might not exceed the required 25dB minimum due to adverse atmospheric conditions. If you believe this to be the case, you can leave the configuration at the lower values, but be sure to monitor the XPI to make sure it subsequently exceeds 25dB. A normal XPI level in clear sky conditions is between 25 and 30dB.
Deleting an XPIC Group (CLI)
In order to delete an XPIC group, you must first disable the group. Disable the group by entering the following command in root view:
root> radio xpic disable group <group id>
To delete an XPIC group, enter the following command in root view:
root> radio xpic delete group <group id>
You must then assign non-XPIC MRMC scripts to the radio carriers that were included in the XPIC pair.
The following commands disable and delete XPIC group 1:
root> radio xpic disable group 1
root> radio xpic delete group 1
Configuring HSB Radio Protection (CLI)

Note
This section is only relevant for PTP 820G.
This section includes:
• HSB Radio Protection Overview (CLI)
- Configuring 1+1 HSB without Space Diversity (CLI)
- Configuring 1+1 HSB with Space Diversity (CLI)
• Copying Configuration to Mate (CLI)
- Revertive Mode (CLI)
• Switchovers and Lockout (CLI)
• Deleting an HSB Radio Protection Group (CLI) without Space Diversity
• Deleting an HSB Radio Protection Group with Space Diversity (CLI)
HSB Radio Protection Overview (CLI)
In dual-carrier systems, PTP 820G offers 1+1 HSB radio protection. With Multi-Carrier ABC, you can also configure 1+1 HSB radio protection with BBS Space Diversity.
You can configure the two radio interfaces as a protection group, which protects against hardware failure in the RFU. The CPU monitors the radio interfaces and initiates switchover upon indication of a hardware or signal failure.
The radios in a protected pair operate in active and standby mode. If there is a failure in the active radio, the standby radio switches to active mode.
Configuring 1+1 HSB without Space Diversity (CLI)
To create a 1+1 HSB radio protection group without Space Diversity, Multi-Carrier ABC may not be configured on the unit.
To create a protection group:
1 Enter the following command in root view. Radio interface 1 will automatically be the active radio carrier.
root>radio protection create group <group> radio <radio> port <port> radio <radio> port <port> type 1-plus-1-HSB
Table 147 1+1 HSB CLI Parameters
| Parameter | Input Type | Permitted Values | Description |
| group | Number | 1-4 | The group ID of the protection group. |
| radio Number 1 | |||
| port Number 1-2 | The interface you want to add to the protection group. | ||
The following example creates a 1+1 HSB protection group with Group ID 1. Radio interface 1 will be the active radio carrier.
root> radio protection create group 1 radio 1 port 1 radio 1 port 2 type 1-plus-1-HSB
2 Configure the active radio carrier and perform a copy-to-mate command to ensure that the radios in the HSB pair have the same configuration. See Copying Configuration to Mate (CLI).
3 Optionally, you can enable revertive mode so that following a switchover, the system initiates a revertive protection switchover back to the original receiver once proper link and/or equipment conditions are restored. See Revertive Mode (CLI).
Configuring 1+1 HSB with Space Diversity (CLI)
To configure 1+1 HSB protection with Space Diversity, you must perform the following steps:
1 Create a Multi-Carrier ABC group with no members, in Admin state Disable. For instructions, see Configuring a Multi-Carrier ABC Group (CLI).
2 Enable protection for the Multi-Carrier ABC group by entering the following command in Multi-Carrier ABC group view:
multi-carrier-abc group-id[1]> protection set enable
3 Create a 1+1 HSB-SD protection group by entering the following command in root view. Radio interface 1 will automatically be the active radio carrier:
root> radio protection create group 1 radio 1 port 1 radio 1 port 2 type 1-plus-1-HSB-SD
4 Configure the active radio carrier and perform a copy-to-mate command to ensure that the radios in the HSB pair have the same configuration. See Copying Configuration to Mate (CLI).
5 When you have finished configuring the 1+1 HSB group, unmute both radio carriers on both sides of the link. See .
6 Optionally, you can enable revertive mode so that following a switchover, the system initiates a revertive protection switchover back to the original receiver once proper link and/or equipment conditions are restored. See Revertive Mode (CLI).
7 Add the 1+1 HSB-SD group to the Multi-Carrier ABC group by entering the following command in Multi-Carrier ABC group view:
multi-carrier-abc group-id[1]> attach-group group-id 1 type 1-plus-1-HSB-SD channel-id 1
Copying Configuration to Mate (CLI)
In a 1+1 HSB configuration, it is necessary for both radio carriers to have the same configuration. PTP 820G includes a mismatch mechanism that detects if there is a mismatch between the radio configurations of the local and mate radio carriers. This mechanism is activated by the system periodically and independently of other protection mechanisms, at fixed intervals. It is activated asynchronously for both the active and the standby radio carriers. Once the mismatch mechanism detects a configuration mismatch, it raises a Mate Configuration Mismatch alarm. When the configuration of the active and standby radio carriers is changed to be identical, the mechanism clears the Mate Configuration Mismatch alarm.

Note
The TX Level and Mute settings are not copied to the Stand by radio. Therefore, you must manually set the TX Level and unmute the Stand by radio in order for 1+1 protection to function. See Configuring the Radio Parameters.
In order to align the configuration between the active and standby radio carriers, you must verify that at least one of the radio carriers is properly configured, and then perform a copy to mate command. This command copies the entire configuration from a selected radio in the protection pair to the other radio in the pair to achieve full configuration alignment between the radios in the pair. The command also initiates a reset of the radio carriers to which the configuration is copied. As soon as the radio to which the confirmation was copied is up and running, its configuration is aligned to the configuration of the other radio. This operation has no effect on the source radio.
To perform a copy-to-mate command, enter the following command in root view:
root> radio protection copy-to-mate group <group> source-radio <radio>
source-port <port>
| Parameter | Input Type | Permitted Values | Description |
| group | Number | 1-4 | The group ID of the protection group. |
| radio Number 1 | |||
| port Number 1-2 | |||
The following command copies the configuration of the active radio carrier in protection group 1 (radio interface 1) to its standby radio carrier (radio interface 2):
root> radio protection copy-to-mate group 1 source-radio 1 source-port 1
Revertive Mode (CLI)
When revertive mode is enabled, following a switchover the system initiates a revertive protection switchover back to the original receiver once proper link and/or equipment conditions are restored. This ensures that the primary path is used whenever possible.
For HSB-SD groups, an additional revertive mode option enables you to configure revertive mode for diversity. If a diversity switchover takes place and revertive mode is enabled for diversity, the system initiates a revertive diversity switchover back to the original receiver once a proper signal is restored on the primary receiver.
To configure revertive mode, enter the following command in root view:
root> radio protection revertive group <group> admin <enable|disable> primary-radio-slot <slot> primary-radio-port <port>
The following command enables protection revertive mode for protection group 1, with radio interface 1 designated as the primary radio:
root> radio protection revertive group 1 admin enable primary-radio-slot 1 primary-radio-port 1
To configure revertive mode for space diversity, enter the following command in root view:
root> radio protection set revertive-space-div <enable|disable> group <group>
The following command enables diversity revertive mode for protection group 1:
root> radio protection set revertive-space-div enable group 1
Table 148 HSB Revertive Mode CLI Parameters
| Parameter | Input Type | Permitted Values | Description |
| group | Number | 1-4 | The group ID of the protection group. |
| radio Number 1 | |||
| port Number 1-2 | |||
Switchovers and Lockout (CLI)
The following events trigger switchover for 1+1 HSB protection according to their priority, with the highest priority triggers listed first.
1 Card missing
2 Lockout
3 Force switch
4 Traffic failures
5 Manual switch
To perform a manual switchover, use the following command:
root> radio protection manual-switch group <group#>
For example, to perform a manual switchover on group 1, use the following command:
root> radio protection manual-switch group 1
To perform a force switchover, use the following command:
root> radio protection force-switch group <group#>
For example, to perform a force switchover on group 1, use the following command:
root>radio protection force-switch group 1
To perform a lockout of a protection group, use the following command:
root> radio protection lock group <group#>
For example, to perform a lockout on group 1, use the following command:
root>radio protection lock group 1
To unlock a protection group that is in lockout mode, use the following command:
root> radio protection unlock group <group#>
For example, to unlock group 1, use the following command:
root> radio protection unlock group 1
Deleting an HSB Radio Protection Group (CLI) without Space Diversity

Note
Before deleting an HSB radio protection group, both members of the group must be unmuted. See Unmuting a Radio (CLI).
To delete a radio protection group, enter the following command in root view:
root>r adio protection delete group <group#>
The following example deletes protection group 2:
root> radio protection delete group 2
Deleting an HSB Radio Protection Group with Space Diversity (CLI)

Note
Before deleting an HSB radio protection group, both members of the group must be unmuted. See Unmuting a Radio (CLI).
To delete an HSB radio protection group with space diversity:
1 Remove the HSB-SD group from the Multi-Carrier ABC group. See Removing Members from a Multi-Carrier ABC Group (CLI).
2 Disable protection for the Multi-Carrier ABC group by entering the following command in Multi-Carrier ABC group view:
multi-carrier-abc group-id[1]> protection set disable
3 Delete the HSB-SD group. See Deleting an HSB Radio Protection Group (CLI).
4 Delete the Multi-Carrier ABC group. See Deleting a Multi-Carrier ABC Group (CLI).
Chapter 16: Unit Management (CLI)
This section includes:
• Defining the IP Protocol Version for Initiating Communications (CLI)
- Configuring the Remote Unit's IP Address (CLI)
- Configuring SNMP (CLI)
- Configuring the Internal Ports for FTP or SFTP (CLI)
- Upgrading the Software (CLI)
• Backing Up and Restoring Configurations (CLI)
• Editing CLI Scripts (CLI)
- Setting the Unit to the Factory Default Configuration (CLI)
• Performing a Hard (Cold) Reset (CLI)
- Configuring Unit Parameters (CLI)
- Configuring NTP (CLI)
• Displaying Unit Inventory (CLI)
Related topics:
• Setting the Time and Date (Optional) (CLI)
• Enabling the Interfaces (Interface Manager) (CLI)
- Uploading Unit Info (CLI)
• Changing the Management IP Address (CLI)
Defining the IP Protocol Version for Initiating Communications (CLI)
Select which IP protocol version the unit will use when initiating communications, such as downloading software, sending traps, pinging, or exporting configurations. The options are IPv4 or IPv6. To do so, enter the following command in root view:
root> platform management ip set ip-address-family <ipv4|ipv6>
To show the IP protocol version the unit will use when initiating communications, enter the following command in root view:
root> platform management ip show ip-address-family
Configuring the Remote Unit's IP Address (CLI)
You can configure the remote radio's IP address, subnet mask and default gateway in IPv4 format and/or in IPv6 format. The remote unit will receive communications whether they were sent to its IPv4 address or its IPv6 address.

Note
If you want to change the Remote IP Address to a different subnet, you must first change the address of the Remote Default Gateway to 0.0.0.0, then set the Remote IP Address as desired, and the Remote Default Gateway as desired.
Similarly, if you want to change the Remote IPv6 Address to a different subnet, you must first change the address of the Remote IPv6 Default Gateway to 0:0:0:0:0:0:0, then set the Remote IPv6 Address as desired, and the Remote IPv6 Default Gateway as desired.
Configuring the Remote Radio's IP Address in IPv4 format (CLI)
To configure the remote radio's default gateway, enter the following command in radio view:
radio[x/x]>remote-unit set default-gateway IP <ipv4-address>
To display the remote radio's default gateway, enter the following command in radio view:
radio[x/x]>remote-unit show default-gateway
To set the remote radio's IP Address, enter the following command in radio view:
radio[x/x]>remote-unit set ip-address <ipv4-address>
To display the remote radio's IP Address, enter the following command in radio view:
radio[x/x]>remote-unit show ip-address
To set the remote radio's subnet mask, enter the following command in radio view:
radio[x/x]>remote-unit set subnet-mask IP <subnet-mask>
To display the remote radio's subnet mask, enter the following command in radio view:
radio[x/x]>remote-unit show subnet-mask
Table 149 Remote Unit IP Address (IPv4) CLI Parameters
| Parameter | Input Type | Permitted Values | Description |
| ipv4-address | Dotted decimal format. | Any valid IPv4 address. | Sets the default gateway or IP address of the remote radio. |
| subnet-mask | Dotted decimal format. | Any valid subnet mask. | Sets the subnet mask of the remote radio. |
The following command sets the default gateway of the remote radio as 192.168.1.20:
radio[2/1]>remote-unit set default-gateway IP 192.168.1.20
The following commands set the IP address of the remote radio as 192.168.1.1, with a subnet mask of 255.255.255.255.
radio[2/2]>remote-unit set ip-address 192.168.1.1
radio[2/2]>remote-unit set subnet-mask IP 255.255.255.255
Configuring the Remote Radio's IP Address in IPv6 format (CLI)
To configure the remote radio's default gateway, enter the following command in radio view:
radio[x/x]>remote-unit set default-gateway-ipv6 IPv6 <ipv6-address>
To display the remote radio's default gateway, enter the following command in radio view:
radio[x/x]>remote-unit show default-gateway-ipv6
To set the remote radio's IP Address, enter the following command in radio view:
radio[x/x]>remote-unit set ip-address-ipv6 <ipv6-address>
To display the remote radio's IP Address, enter the following command in radio view:
radio[x/x]>remote-unit show ip-address-ipv6
To set the remote radio's prefix length, enter the following command in radio view:
radio[x/x]>remote-unit set prefix-length <prefix-length>
To display the remote radio's prefix-length, enter the following command in radio view:
radio[x/x]>remote-unit show prefix-length
Table 150 Remote Unit IP Address (IPv6) CLI Parameters
| Parameter | Input Type | Permitted Values | Description |
| ipv6-address | Eight groups of four hexadecimal digits separated by colons. | Any valid IPv6 address. | Sets the default gateway or IP address of the remote radio. |
| prefix-length | Number | 1-128 | Sets the prefix length of the remote radio. |
The following command sets the default gateway of the remote radio as
FE80:0000:0000:0000:0202:B3FF:FE1E:8329 :
radio[2/1]>remote-unit set default-gateway-ipv6 IPv6 FE80:0000:0000:0000:0202:B3FF:FE1E:8329
The following commands set the IP address of the remote radio as FE80:0000:0000:0000:0202:B3FF:FE1E:8329, with a prefix length of 64:
radio[2/2]>remote-unit set ip-address-ipv6
FE80:0000:0000:0000:0202:B3FF:FE1E:8329
radio[2/2]>remote-unit set prefix-length 64
Configuring SNMP (CLI)
This section includes:
- Configuring SNMP (CLI)
• Defining the SNMP Parameters (CLI)
• Displaying the SNMP Settings (CLI) - Configuring Trap Managers (CLI)
Configuring SNMP (CLI)
PTP 820G and PTP 820F supports SNMP v1, V2c, and v3. You can set community strings for access to IDUs.
PTP 820G and PTP 820F supports the following MIBs:
• RFC-1213 (MIB II)
- RMON MIB
- MIB (proprietary)
Defining the SNMP Parameters (CLI)
The following commands are relevant for all SNMP versions.
To enable SNMP, enter the following command in root view:
root> platform security protocols-control snmp admin set <admin>
To specify the SNMP version, enter the following command in root view:
root> platform security protocols-control snmp version set <version>
To specify the SNMP read and write communities, enter the following command in root view:
root> platform security protocols-control snmpv1v2 set read-community <read-community> write-community <write-community>
The following commands are relevant for SNMPv3.
To block SNMPv1 and SNMPv2 access so that only SNMPv3 access will be enabled, enter the following command in root view:
root> platform security protocols-control snmp v1v2-block set <set-block>
To block SNMPv1 and SNMPv2 access so that only SNMPv3 access will be enabled, enter the following command in root view:
root> platform security protocols-control snmp v1v2-block set <set-block>
To add an SNMPv3 user, enter the following command in root view:
root> platform security protocols-control snmp v3-authentication add v3-user-name <v3-user-name> v3-user-password <v3-user-password> v3-security-mode <v3-security-mode> v3-encryption-mode <v3-encryption-mode> v3-auth-algorithm <v3-auth-algorithm> v3-access-mode <v3-access-mode>
To remove an SNMP v3 user, enter the following command in root view:
root> platform security protocols-control snmp v3-authentication remove v3-user-name <user-name>
To display all SNMP v3 users and their authentication parameters, enter the following command in root view:
root> platform security protocols-control snmp v3-authentication show
Table 151 SNMPv3 CLI Parameters
| Parameter | Input Type | Permitted Values | Description |
| admin Variable | enable disable | Select enable to enable SNMP monitoring, or disable SNMP monitoring. | |
| version Variable | v1 | Select v1, v2, or v3 to specify the SNMP version. | |
| v2 | |||
| v3 | |||
| read-community | Text String | Any valid SNMP read community. | The community string for the SNMP read community. |
| write-community | Text String | Any valid SNMP write community. | The community string for the SNMP write community. |
| set-block Variable | yes | yes - SNMPv1 and SNMPv2 access is blocked.no - SNMPv1 and SNMPv2 access is not blocked. | |
| v3-user-name | Text String | A SNMPv3 user name. | |
| v3-user-password | Text String | Must be at least eight characters. | A SNMPv3 user password. |
| v3-security-mode | Variable | authNoPriv authPriv noAuthNoPriv | Defines the security mode to be used for this user. |
| v3-encryption-mode | Variable | None DES AES | Defines the encryption (privacy) protocol to be used for this user. |
| v3-auth-algorithm | Variable | None SHA MD5 | Defines the authentication algorithm to be used for this user. |
| v3-access-mode | Variable | readWrite readOnly | Defines the access permission level for this user. |
The following commands enable SNMP v2 on the unit, and set the read community to "public" and the write community to "private":
root> platform security protocols-control snmp admin set enable
root> platform security protocols-control snmp version set v2
root> platform security protocols-control snmpv1v2 set read-community
public write-community private
The following commands enable SNMP v3 on the unit, block SNMP v1 and SNMP v2 access, and define an SNMPv3 user with User Name=Geno, Password=abcdefgh, security mode authPriv, encryption mode DES, authentication algorithm SHA, and read-write access:
root> platform security protocols-control snmp admin set enable
root> platform security protocols-control snmp version set v3
root> platform security protocols-control snmp v1v2-block set yes
root> platform security protocols-control snmp v3-authentication add v3-user-name geno v3-user-password abcdefgh v3-security-mode authPriv v3-encryption-mode DES v3-auth-algorithm SHA v3-access-mode readWrite
Displaying the SNMP Settings (CLI)
To display the general SNMP parameters, enter the following command in root view:
root> platform security protocols-control snmp show-all
To display the current MIB version used in the system, enter the following command in root view:
root> platform security protocols-control snmp show-mib-version
To display details about the current MIB version used in the system, enter the following command in root view:
root> platform security protocols-control snmp show-mib-version-table
To display the SNMP read and write communities, enter the following command in root view:
root> platform security protocols-control snmpv1v2 show
Configuring Trap Managers (CLI)
In this version, trap manager configuration should be performed via the Web EMS. See Configuring Trap Managers.
Configuring the Internal Ports for FTP or SFTP (CLI)
By default, the following PTP 820 ports are used for FTP and SFTP when the PTP 820 unit is acting as an FTP or SFTP client (e.g., software downloads, configuration file backup and restore operations):
- FTP - 21
- SFTP - 22
To change the port for either protocol, enter the following command in root view:
root> platform management file-transfer port-config protocol <ftp|sftp> port-number <0-65535>
To display the ports that are currently configured for FTP and SFTP, enter the following command in root view:
root> platform management file-transfer port-show
These ports are configured globally, rather than per specific operation.
The following sequence of commands displays the current (default) FTP and SFTP port settings, changes the FTP port to 125 and the SFTP port to 126, and shows the new FTP and SFTP port settings.
root>platform management file-transfer port-show
Port config table:
------------------
File transfer File transfer port
protocol number
------------------
ftp 21
sftp 22
root> platform management file-transfer port-config protocol ftp port-number 125
root> platform management file-transfer port-config protocol sftp port-number 126
root> platform management file-transfer port-show
Port config table:
------------------
File transfer File transfer port
protocol number
------------------
ftp 125
sftp 126
root>
Upgrading the Software (CLI)
This section includes:
• Software Upgrade Overview (CLI)
• Displaying Current Software Versions (CLI)
- Configuring a Software Download (CLI)
• Downloading a Software Package (CLI)
• Installing and Upgrading Software (CLI)
• Installing and Upgrading Software in the RFU (CLI)
Software Upgrade Overview (CLI)
PTP 820G and PTP 820F software and firmware releases are provided in a single bundle that includes software and firmware for all components supported by the system, including RFU's. Software is first downloaded to the system, then installed. After installation, a reset is automatically performed on all components whose software was upgraded. RFU software must be installed separately.
When you download a software bundle, the system verifies the validity of the bundle. The system also compares the files in the bundle to the files currently installed in the PTP 820G or PTP 820F and its components, so that only files that need to be updated are actually downloaded. A message is displayed for each file that is actually downloaded.

Note
When downloading an older version, all files in the bundle may be downloaded, including files that are already installed.
Software bundles are downloaded via FTP or SFTP. After the software download is complete, you can initiate the installation. Although RFU software is included in the standard installation bundle, the current software version is not automatically updated in the RFU when an installation is performed. To upgrade the software in an RFU, you must perform the upgrade manually, per slot. This enables you to manage IDU and RFU software versions separately.

Note
Before performing a software upgrade, it is important to verify that the system date and time are correct. See Setting the Time and Date (Optional) (CLI).
Displaying Current Software Versions (CLI)
To display all current software versions, enter the following command in root view:
root> platform software show versions
For example:
root> platform software show versions
Current software versions table:
================
Package Name Target Device Running Version Installed Downloaded Reset Type
Version version
gnss Cleared N/A 7.7.0.0.0.42 7.7.0.0.0.42 main-board-cold-reset
gnss-atp Cleared 7.7.0.0.0.42 1.38.5 1.38.5 main-board-cold-reset
gnss-fpga-fw-elic Cleared N/A 1.7.1 1.7.1 main-board-cold-reset
gnss-fpga-fw-rmc Cleared N/A 1.42 1.42 main-board-cold-reset
gnss-fpga-fw-rmce Cleared N/A 2.32 2.32 main-board-cold-reset
gnss-fpga-fw-tcc Cleared 40 1.42.13 1.42.13 main-board-cold-reset
gnss-fpga-fw-xlic Cleared N/A 3 3 main-board-cold-reset
gnss-management Cleared 1.7.0.19 1.7.0.19 1.7.0.19 main-board-cold-reset
gnss-mctl Cleared 7.7.0.0.0.42 7.7.0.0.0.42 7.7.0.0.0.42 main-board-cold-reset
gnss-modem-fw Cleared N/A 3.40.2 3.40.2 main-board-cold-reset
gnss-mrmc-b-scripts Cleared N/A 2.24 2.24 main-board-cold-reset
gnss-mrmc-scripts Cleared N/A 7.16 7.16 main-board-cold-reset
gnss-pwc Cleared N/A 5.8 5.8 main-board-cold-reset
gnss-pwc-stml Cleared N/A 5.14 5.14 main-board-cold-reset
gnss-rfu Cleared N/A 3.0.10 3.0.10 main-board-cold-reset
gnss-rmc-b Cleared N/A 1.0.37 1.0.37 main-board-cold-reset
gnss-vm-control Cleared N/A 1.0.2.11 1.0.2.11 main-board-cold-reset
gnss_tcc-config Cleared N/A 1.0 1.0 main-board-cold-reset
gnss_tcc-kernel Cleared 2.6.34.8 v2.6.34.8 v2.6.34.8 main-board-cold-reset
gnss-fpga-fw-hrzn Cleared N/A N/A N/A no-reset
root>
To display all current RFU software versions, enter the following command in root view:
root> platform software show rfu versions
For example:
| root> platform software show rfu versions | ||||||
| Installed Bundle Name: gnss-rfu Installed version: 3.0.11 | ||||||
| Available Versions | ||||||
| Bundle Name DSP SW Configuration Tables Constant Tables RFU Scripts Firmware | ||||||
| rfu-HC 552f N/A N/A N/A N/A N/A | ||||||
| rfu-1500HP 813a2 N/A N/A N/A N/A | ||||||
| rfu-SP N/A N/A N/A N/A N/A N/A | ||||||
| rfu-C 2.17 N/A N/A N/A N/A N/A | ||||||
| rfu-H 5.14 N/A N/A N/A N/A N/A | ||||||
| rfu_HP 5.14 N/A N/A N/A N/A N/A | ||||||
| rfu-A 5.14 N/A N/A N/A N/A N/A | ||||||
| rfu-D N/A N/A N/A N/A N/A N/A N/A | ||||||
| rfu-EVO-XCVR 6B01 N/A N/A 1A19 6A00/3A00 | ||||||
| Installed Versions Slot Port DSP SW Configuration Tables Constant Tables RFU Scripts Firmware | ||||||
| 7 1 N/A N/A N/A N/A N/A N/A N/A | ||||||
| 8 1 N/A N/A N/A N/A N/A N/A N/A | ||||||
| Running Versions Slot Port DSP SW Configuration Tables Constant Tables RFU Scripts Firmware | ||||||
| 7 1 N/A N/A N/A N/A N/A N/A N/A N/A root> root> | ||||||
Configuring a Software Download (CLI)
You can download software using HTTP, HTTPS, FTP, or SFTP.
When downloading software via HTTP or HTTPS, the PTP 820F or PTP 820G functions as the server, and you can download the software directly to the PTP 820F or PTP 820G unit.

Note
HTTP and HTTPS software download is only supported using the Web EMS. For instructions, see Downloading and Installing Software.
When downloading software, the IDU functions as an FTP or SFTP client. You must install FTP or SFTP server software on the PC or laptop you are using to perform the software upgrade. For details, see Configuring the Internal Ports for FTP or SFTP (CLI).
To set the file transfer protocol you want to use (FTP or SFTP), enter the following command:
root> platform software download version protocol <ftp|sftp>
If the IP protocol selected in platform management ip set ip-address-family is IPv4, enter the following command:
root> platform software download channel server set server-ip <server-ipv4> directory <directory> username <username> password <password>
If the IP protocol selected in platform management ip set ip-address-family is IPv6, enter the following command:
root> platform software download channel server-ipv6 set server-ip <server-ipv6> directory <directory> username <username> password <password>
To display the software download channel configuration, enter one of the following commands:
root> platform software download channel server show root> platform software download channel server-ipv6 show
Table 152 Software Download CLI Parameters
| Parameter | Input Type | Permitted Values | Description |
| server-ipv4 | Dotted decimal format. | Any valid IPv4 address. | The IPv4 address of the PC or laptop you are using as the FTP server. |
| server-ipv6 | Eight groups of four hexadecimal digits separated by colons. | Any valid IPv6 address. | The IPv6 address of the PC or laptop you are using as the FTP server. |
| server-ip | Dotted decimal format. | Any valid IP address. | The IP address of the PC or laptop you are using as the FTP server. |
| directory Text String | The directory path from which you are downloading the files. Enter the path relative to the FTP user's home directory, not the absolute path. To leave the path blank, enter //. | ||
| username | Text String | The user name for the FTP session. | |
The following command configures a download from IP address 192.168.1.242, in the directory "current", with user name "anonymous" and password "12345."
root> platform software download channel server set server-ip 192.168.1.242 directory \current username anonymous password 12345
Downloading a Software Package (CLI)
To initiate a software download, enter the following command in root view:
root> platform software download version protocol ftp
The following prompt appears:
You are about to perform a software management operation. This may cause a system reset.
Are you sure? (yes/no)
Enter Yes at the prompt. When the prompt appears again, enter the following command to check the download status:
root> platform software download status show
Once the following message appears, proceed with the installation:
DOWNLOAD VERSION status: download success, process percentage: 100
Installing and Upgrading Software (CLI)
To install or upgrade the software, enter the following command in root view after downloading the software bundle:
root> platform software install version
To display the status of an IDU software installation or upgrade, enter the following command:
root> platform software install status show
Installing and Upgrading Software in the RFU (CLI)
RFU software is installed and upgraded per carrier. After downloading a new software bundle, you must enter the following two commands in root view to install the new RFU software version in a carrier:
root> platform software update rfu version slot <slot> radio-port <radio-port>
root> platform software install rfu version slot <slot> radio-port <radio-port>
To view the status of an RFU installation or upgrade procedure, enter the following command in root view:
root> platform software rfu status show
To display all RFU software versions currently running in the unit, enter the following command:
root> platform software show rfu versions
Table 153 RFU Software Upgrade CLI Parameters
| Parameter | Input Type | Permitted Values | Description |
| slot Number 1 | |||
| port Number 1-2 | |||
After installing the new version, it is recommended that you verify the installation by entering the platform software show rfu versions command to verify that the new version has been properly installed.
The following sequence of commands installs RFU-C software version 2.13 in radio interface 1.
First, enter the following command to determine which software versions are available, and which software versions are installed and running:
root> platform software show tfu versions
Installed Bundle Name: gns-srfu Installed version: 3.0.7
Available Versions
| Bundle Name | DSP SW Tables | Configuration | Constant Tables | RFU Scripts | Firmware |
| rfu-HC | 5.52f | N/A | N/A | N/A | N/A |
| rfu-HP | N/A | N/A | N/A | N/A | N/A |
| rfu-SP | N/A | N/A | N/A | N/A | N/A |
| rfu-C | 2.13 | N/A | N/A | N/A | N/A |
| rfu-H | N/A | N/A | N/A | N/A | N/A |
| rfu_HP | N/A | N/A | N/A | N/A | N/A |
| rfu-A | N/A | N/A | N/A | N/A | N/A |
| rfu-D | N/A | N/A | N/A | N/A | N/A |
Installed Versions
| Slot | Port | DSP SW Tables | Configuration | Constant Tables | RFU Scripts | Firmware |
| Slot | Port | DSP SW Tables | Configuration | Constant Tables | RFU Scripts | Firmware |
| 1 | 1 | 2.10_B7 | N/A | N/A | N/A | N/A |
The Installed Versions table indicates which RFU software versions are installed in the IDU (first row) and in the RFUs (second row). The version must be installed in the IDU before it can be used to update the RFU itself. Note that in this example, the version you want to install (2.13) has been downloaded, since it appears in the Available Versions table. However, no versions are available in the IDU, as indicated by the fact that there is no data underneath the first row of the Installed Versions table. The last row of the table indicates that the RFU is running an older version of the software, version 2.10_B7.
The next step is to perform the update and install commands:
root> platform software update rfu version slot 1 radio-port 1
root> platform software install rfu version slot 1 radio-port 1
To check the status of an update or install operation, enter the following command:
root> platform software show cfu status
| Slot | Port | Install Status | Install Progress in Progress | Timed | Installation | Install Time | Time to Install |
| 1 1 installation-success 1 no 00:00 00:00 root> platform software show rfu status | |||||||
Once the installation is complete, the Install Status column should indicate installation success and the In Progress column should indicate 100 (100%):
foot> platform software show rfu status
| Slot | Post | Install Status | Install Progressin Progress | Turned | Installation | Install Time | Time to Install |
| 1.1 installation-success 100 no 00:00 00:00root> platform software show cfu status | |||||||
When the installation is complete, enter the show rfu versions command again to verify that the new version has been properly installed in both the IDU and the RFU:
root> platform software show tfu versions
| Installed Bundle Name: goss-rfs Installed version: 3.0.7 |
| Available Versions |
| Bundle Name | DSP SW Tables | Configuration | Constant Tables | RFU Scripts | Firmware |
| rfu-HC | 5.52f | N/A | N/A | N/A | N/A |
| rfu-HP | N/A | N/A | N/A | N/A | N/A |
| rfu-SP | N/A | N/A | N/A | N/A | N/A |
| rfu-C | 2.13 | N/A | N/A | N/A | N/A |
| rfu-H | N/A | N/A | N/A | N/A | N/A |
| rfu_HP | N/A | N/A | N/A | N/A | N/A |
| rfu-A | N/A | N/A | N/A | N/A | N/A |
| rfu-D | N/A | N/A | N/A | N/A | N/A |
Installed Versions
| Slot | Port | DSP SW Tables | Configuration | Constant Tables | RFU Scripts | Firmware |
| 3 | 1 | 2.13 | N/A | N/A | N/A | N/A |
| Slot | Port | DSP SW Tables | Configuration | Constant Tables | RFU Scripts | Firmware |
| 1 | 1 | 2.13_B7 | N/A | N/A | N/A | N/A |
Note that in the table above, the new version (2.13) is listed for both the IDU and the RFU.
Backing Up and Restoring Configurations (CLI)
This section includes:
- Configuration Management Overview (CLI)
- Setting the Configuration Management Parameters (CLI)
• Backing up a Configuration File (CLI) - Importing and Restoring a Configuration File (CLI)
Configuration Management Overview (CLI)
You can import and export PTP 820G and PTP 820F configuration files. This enables you to copy the system configuration to multiple PTP 820G and PTP 820F units. You can also backup and save configuration files.
Importing and exporting configuration files can be done using HTTP, HTTPS, FTP, or SFTP. However, import and export using HTTP or HTTPS must be performed using the Web EMS. See Backing Up and Restoring Configurations.
System configuration files consist of a zip file that contains three components:
- A binary configuration file which is used by the system to restore the configuration.
- A text file which enables users to examine the system configuration in a readable format. The file includes the value of all system parameters at the time of creation of the backup file.
- An additional text file which enables you to write CLI scripts in order to make desired changes in the backed-up configuration. This file is executed by the system after restoring the configuration.
The system provides three restore points to manage different configuration files. Each restore point contains a single configuration file. Files can be added to the restore points by creating backups of the current system state or by importing them from an external server. For example, you may want to use one restore point to keep a last good configuration, another to import changes from an external server, and the third to store the current configuration.
You can apply a configuration file to the system from any of the restore points.
You can only import PTP 820F configuration files into anPTP 820F unit, PTP 820G configuration files into anPTP 820G unit.
Setting the Configuration Management Parameters (CLI)
When importing and exporting configuration files, the PTP 820G functions as an FTP or SFTP client. You must install FTP or SFTP server software on the PC or laptop you are using to perform the import or export. For details, see Configuring the Internal Ports for FTP or SFTP (CLI).

Note
Before importing or exporting a configuration file, you must verify that the system date and time are correct. See Setting the Time and Date (Optional) (CLI).
To set the FTP or SFTP parameters for configuration file import and export, enter one of the following commands in root view:
- If the IP protocol selected in platform management ip set ip-address-family is IPv4, enter the following command:
root> platform configuration channel server set ip-address <server-ipv4>
directory <directory> filename <filename> username <username> password
<password>
- If the IP protocol selected in platform management ip set ip-address-family is IPv6, enter the following command:
root> platform configuration channel server-ipv6 set ip-address <server-ipv6> directory <directory> filename <filename> username <username> password <password>
To set the file transfer protocol you want to use (FTP or SFTP), enter the following command:
root>platform configuration channel set protocol <ftp|sftp>
To display the FTP channel parameters for importing and exporting configuration files, enter one of the following commands in root view:
root> platform configuration channel server show
root> platform configuration channel server-ipv6 show
Table 154 Configuration Management CLI Parameters
| Parameter | Input Type | Permitted Values Description | |
| server-ipv4 | Dotted decimal format. | Any valid IPv4 address. | The IPv4 address of the PC or laptop you are using as the FTP server. |
| server-ipv6 | Eight groups of four hexadecimal digits separated by colons. | Any valid IPv6 address. | The IPv6 address of the PC or laptop you are using as the FTP server. |
| directory Text String. | The directory path to which you are exporting or from which you are importing the configuration file. Enter the path relative to the FTP user's home directory, not the absolute path. To leave the path blank, enter //. | ||
| filename Text String. | The name of the file you are importing, or the name you want to give the file you are exporting.Note: You must add the suffix .zip to the file name. Otherwise, the file import may fail. You can export the file using any name, then add the suffix .zip manually. | ||
| Parameter | Input Type | Permitted Values Description |
| username | Text String. | The user name you configured in the FTP server. |
| password | Text String. | The password you configured in the FTP server. If you did not configure a password for your FTP user, simply omit this parameter. |
Examples
The following command configures the FTP channel for configuration file import and export to IP address 192.168.1.99, in the directory "current", with file name "version_8_backup.zip", user name "anonymous", and password "12345."
root> platform configuration channel server set server-ip 192.168.1.99 directory \current filename version_8_backup.zip username anonymous password 12345
Backing up a Configuration File (CLI)
When downloading software, the IDU functions as an FTP or SFTP client. You must install FTP server software on the PC or laptop you are using to perform the software upgrade. For details, see Configuring the Internal Ports for FTP or SFTP (CLI)..
To set the file transfer protocol you want to use (FTP or SFTP), enter the following command:
root>platform configuration channel set protocol <ftp|sftp>
To set the FTP or SFTP parameters for configuration file import and export, enter one of the following commands in root view:
If the IP protocol selected in platform management ip set ip-address-family is IPv4, enter the following command:
root> platform configuration channel server set ip-address <server-ipv4> directory <directory> filename <filename> username <username> password <password>
If the IP protocol selected in platform management ip set ip-address-family is IPv6, enter the following command:
root> platform configuration channel server-ipv6 set ip-address <server-ipv6> directory <directory> filename <filename> username <username> password <password>
You must configure from 1 to 3 restore points:
- When you import a configuration file, the file is saved to the selected restore point, and overwrites whichever file was previously held in that restore point.
- When you export a configuration file, the file is exported from the selected restore point.
- When you back up the current configuration, the backup configuration file is saved to the selected restore point, and overwrites whichever file was previously held in that restore point.
- When you restore a configuration, the configuration file in the selected restore point is the file that is restored.
To display the FTP or SFTP channel parameters for importing and exporting configuration files, enter one of the following commands in root view:
root> platform configuration channel server show
root> platform configuration channel server-ipv6 show
To save the current configuration as a backup file to one of the restore points, enter the following command in root view:
root> platform configuration configuration-file add <restore-point>
To export a configuration from a restore point to the external server location, enter the following command in root view:
root> platform configuration configuration-file export <restore-point>
Table 155 Configuration Management CLI Parameters
| Parameter | Input Type | Permitted Values | Description |
| server-ipv4 | Dotted decimal format. | Any valid IPv4 address. | The IPv4 address of the PC or laptop you are using as the FTP server. |
| server-ipv6 | Eight groups of four hexadecimal digits separated by colons. | Any valid IPv6 address. | The IPv6 address of the PC or laptop you are using as the FTP server. |
| directory Text String | The location of the file you are downloading or uploading. If the location is the root shared folder, it should be left empty. If the location is a sub-folder under the root shared folder, specify the folder name. If the shared folder is "C:\\", this parameter can be left empty or populated with "/". | ||
| filename Text String | The name of the file you are importing, or the name you want to give the file you are exporting.Note: You must add the suffix .zip to the file name. Otherwise, the file import may fail. You can export the file using any name, then add the suffix .zip manually. | ||
| username Text String | The user name for the FTP session. | ||
| password Text String | The password for the FTP session. To configure the FTP settings without a password, simply omit this parameter. | ||
| restore-point Variable | restore-point-1 restore-point-2 restore-point-3 | Identifies the restore point to or from which to perform the backup operation. | |
The following command configures the FTP channel for configuration file import and export to IP address 192.168.1.99, in the directory "current," with file name "version_8_backup.zip," user name "anonymous," and password "12345."
root> platform configuration channel server set ip-address 192.168.1.99 directory \current filename version_8_backup.zip username anonymous password 12345
The following commands save the current configuration as a configuration at Restore Point 1, and export the file to the external server location:
root> platform configuration configuration-file add restore-point-1
root> platform configuration configuration-file export restore-point-1
Importing and Restoring a Configuration File (CLI)
You can import a configuration file from an external PC or laptop to one of the restore points. Once you have imported the file, you can restore the configuration. Restoring a saved configuration does not change the unit's FIPS mode or ETSI/ANSI mode.

Note
In order to import a configuration file, you must configure the FTP channel parameters and restore points, as described in Setting the Configuration Management Parameters and Backing up a Configuration File.
To import a configuration file, enter the following command in root view:
root> platform configuration configuration-file import <restore-point>
To restore a configuration from a restore point to become the active configuration file, enter the following command in root view:
root> platform configuration configuration-file restore <restore-point>
Table 156 Configuration Import and Restore CLI Parameters
| Parameter | Input Type | Permitted Values | Description |
| restore-point | Variable | restore-point-1 | The restore point to which the file is imported, and from which it is applied to the PTP 820G or PTP 820F. |
| restore-point-2 | |||
| restore-point-3 |
The following commands import a configuration file from an external PC or laptop to Restore Point 2 on the PTP 820G or PTP 820F, and restore the file to be the system configuration file for the PTP 820G or PTP 820F:
root> platform configuration configuration-file import restore-point-2
root> platform configuration configuration-file restore restore-point-2
Editing CLI Scripts (CLI)
The configuration file package includes a text file that enables you to write CLI scripts in a backed-up configuration that are executed after restoring the configuration.
To edit a CLI script:
- Back up the current configuration to one of the restore points. See Backing up a Configuration File (CLI).
- Export the configuration from the restore point to a PC or laptop. See Backing up a Configuration File (CLI).
- On the PC or laptop, unzip the file Configuration_files.zip.
- Edit the cli_script.txt file using clish commands, one per line.
- Save and close the cli_script.txt file, and add it back into the Configuration_files.zip file.
- Import the updated Configuration_files.zip file back into the unit. See Importing and Restoring a Configuration File (CLI)
- Restore the imported configuration file. See Importing and Restoring a Configuration File (CLI). The unit is automatically reset. During initialization, the CLI script is executed, line by line.

Note
If any specific command in the CLI script requires reset, the unit is reset when that that command is executed. During initialization following the reset, execution of the CLI script continues from the following command.
Setting the Unit to the Factory Default Configuration (CLI)
To restore the unit to its factory default configuration, while retaining the unit's IP address settings and logs, enter the following commands in root view:
root> platform management set-to-default
The following prompt appears:
WARNING: All database and configuration will be lost, unit will be restart.
Are you sure? (yes/no):yes
At the prompt, type yes.

Note
This does not change the unit's IP address or FIPS configuration.
Performing a Hard (Cold) Reset (CLI)
To initiate a hard (cold) reset on the unit, enter the following command in root view:
root> platform management chassis reset
The following prompt appears:
You are about to reset the shelf
Are you sure? :(yes/no):
Enter yes. The unit is reset.
Configuring Unit Parameters (CLI)
To configure a name for the unit, enter the following command in root view:
root> platform management system-name set name <name>
For example:
root> platform management system-name set name "My-System-Name"
To define a location for the unit, enter the following command in root view:
root> platform management system-location set name <name>
For example:
root> platform management system-location set name "My System Location"
To define a contact person for questions pertaining to the unit, enter the following command in root view:
root> platform management system-contact set name <name>
For example:
root> platform management system-contact set name "John Doe"
To define the unit's latitude coordinates, enter the following command in root view:
root> platform management system-latitude set <latitude>
For example:
root> platform management system-latitude set 40
To define the unit's longitude coordinates, enter the following command in root view:
root> platform management system-longitude set <longitude>
For example:
root> platform management system-longitude set 73
To define the type of measurement unit you want the system to use, enter the following command in root view:
root> platform management set unit_measure_format <unit_measure_format>
For example:
root> platform management set unit_measure_format metric
To display the type of measurement unit used by the system, enter the following command in root view:
root> platform management show unit_measure_format
To display the unit parameters, including current temperature and input voltage:
root> platform management unit-status
For example:
root> platform management unit-status
Unit name: Microwave radio
Unit Description: PTP 820G 1RU, 2 radio, 6 GbE, 16 TDM, dual feed
Unit contact person:
Unit location:
Unit Latitude:
Unit Longitude:
Unit System Object ID: 1.3.6.1.4.1.2281.1.20.1.3.2
Unit type:
Unit operational status: normal
System up time [seconds]: 4615
Unit Temperature [Celsius]: 11
Unit Temperature [Fahrenheit]: 51
Unit Input voltage port 1 [volts]: 45
Unit Input voltage port 2 [volts]: 0
root>
Table 157 Unit Parameters CLI Parameters
| Parameter | Input Type | Permitted Values | Description |
| name Text Up to 64 characters. | Defines the system parameter specified by the command. | ||
| latitude | Text | Up to 256 characters. | Defines the system parameter specified by the command. |
| longitude | Text | Up to 256 characters. | Defines the system parameter specified by the command. |
| unit_measure _format | Variable | metric imperial | Defines the system parameter specified by the command. |
Configuring NTP (CLI)
PTP 820G and PTP 820F supports Network Time Protocol (NTP). NTP distributes Coordinated Universal Time (UTC) throughout the system, using a jitter buffer to neutralize the effects of variable latency.
You can configure up to four NTP servers. Each server can be configured using IPv4 or IPv6. When multiple servers are configured, the unit chooses the best server according to the implementation of Version 4.2.6p1 of the NTPD (Network Time Protocol Daemon). The servers are continually polled. The polling interval is determined by the NTPD, to achieve maximum accuracy consistent with minimum network overhead.
To configure an NTP server, enter the following commands in root view:
root> platform management ntp set admin <admin> ntp-version <ntp-version>
ntp-server-ip-address-1 <ntp-server-ip-address>
To specify the server's IP address, use one of the following commands:

Note
For each NTP server you configure, you can define an IPv4 address or an IPv6 address, but not both.
To configure the NTP server with an IPv4 address, enter the following command in root view:
root> platformmanagement ntp setserver ipv4 index <index> ipv4 <ipv4>
To display the current configuration of all the defined NTP servers, enter the following command in root view:
root> platform management ntp show status
To display the current configuration and status of all the defined NTP servers, including details that can be used for debugging, enter the following command inroot view:
root> platform management ntp show status all
Table 158 NTP CLI Parameters
| Parameter | Input Type | Permitted Values | Description |
| admin Variable. enable | disable | Enter enable or disable to enable or disable the NTP server. | |
| ntp-version Variable. v3 | v4 | Enter the NTP version you want to use.NTPv4 provides interoperability with NTP v3 and with SNTP. | |
| ntp-server-ip-address | Dotted decimal format. | Any valid IP address. | Enter the IP address of the NTP server. |
The following command enables NTP, using NTP v4, and sets the IP address of the NTP server as 62.90.139.210.
root> platform management ntp set admin index 3 admin enable
root> platform management ntp setserver ipv4 index 3 ipv462.90.139.210
ntp-version ntpv4
Displaying Unit Inventory (CLI)
To view inventory information, enter the following command in root view:
root> platform management inventory show-info
For example:
root> platform management inventory show info
System information:
card-name : PTP 820G
Subtype : 572792847
part number : 24-G009-1A
serial number : E095900075
company name : Cambium Networks Ltd.
product name : PTP 820G
product description : PTP 820G 1RU, 2 radio, 6 GbE, 16 TDM, dual feedroot>
Chapter 17: Radio Configuration (CLI)
This section includes:
• Viewing the Radio Status and Settings (CLI)
- Configuring the Remote Radio Parameters (CLI)
- Configuring ATPC and Override Timer (CLI)
- Configuring Header De-Duplication (CLI)
- Configuring Frame Cut-Through (CLI)
- Configuring AES-256 Payload Encryption (CLI)
- Configuring and Viewing Radio PMs and Statistics (CLI)
Related topics:
- Entering Radio View (CLI)
- Unmuting a Radio (CLI)
- Configuring the Transmit (TX) Level (CLI)
- Configuring the Transmit (TX) Frequency (CLI)
- Configuring the Radio (MRMC) Script(s) (CLI)
• Radio Configurations (CLI) - Configuring a 1+0 Link (CLI)
- Configuring Multi-Carrier ABC (CLI)
- Configuring Link Aggregation (LAG) and LACP (CLI)
- Configuring XPIC (CLI)
• Configuring HSB Radio Protection (CLI)
• Performing Radio Loopback (CLI)
Viewing the Radio Status and Settings (CLI)
To display the RFU status, enter the following command in radio view:
radio[x/x]>rf module status show
The following commands display the RFU status for radio interface 1:
root> radio slot 1 port 1
radio [7/1]>rf module status show

TX Frequency(KHz): 18186250
RX Frequency(KHz): 18723750
TX RX Frequency separation(KHz): 537500

TX Level(dBm): 15
RX Level(dBm): -99
IF Combiner Mode: main
IF Combiner RX Level Diversity(dBm): 0
IF Combiner RX Level Combined(dBm): 0
Mute Configuration: on
Mute status: on
Temperature(Celsius): 32
Temperature(Fahrenheit): 89
Communication status: up
RSL connector: main
SW running version: C2.16_B5
XPIC mode: disable
radio [1/1]>
To display the RFU capabilities, enter the following command in radio view:
radio[x/x]>rf module capabilities show
The following commands display the RFU capabilities for radio interface 1:
root> radio slot 1 port 1
radio [7/1]>rf module capabilities show

Type: RFU-C
Part Number: 1C18020L0B
Serial Number: F42927471

Band: 18
Max bandwidth(KHz): 5600
Min bandwidth(KHz): 100
Max RX frequency(KHz): 19206250
Min RX frequency(KHz): 18723750
Max TX frequency(KHz): 18186250
Min TX frequency(KHz): 17713750

Max Available TX Power(dBm): 18
Min Available TX Power(dBm): 0
XPIC Support: yes

IF Combiner support: not-supported
radio [1/1]>
Configuring the Remote Radio Parameters (CLI)
This section includes:
• Displaying Communication Status with the Remote Radio (CLI)
- Displaying the Remote Radio's Link ID and Location (CLI)
• Muting and Unmuting the Remote Radio (CLI)
- Displaying the Remote Radio's RX Level (CLI)
- Configuring the Remote Radio's TX Level (CLI)
- Configuring Remote ATPC (CLI)
Related topics:
- Configuring the Remote Unit's IP Address (CLI)
Displaying Communication Status with the Remote Radio (CLI)
To display the communication status with the remote radio, go to radio view and enter the following command in radio view:
radio[x/x]>remote-unit communication status show
Displaying the Remote Radio's Link ID and Location (CLI)
To display the remote radio's Link ID, go to radio view and enter the following command:
radio[x/x]>remote-unit show link-id
To display the remote radio's slot ID (location in the chassis), enter the following command in radio view:
radio[x/x]>remote-unit show slot-id
Muting and Unmuting the Remote Radio (CLI)
To mute or unmute the remote radio, go to radio view and enter the following command:
radio[x/x]>remote-unit mute set admin <admin>
To display the mute status of the remote radio, go to radio view and enter the following command:
radio[x/x]>remote-unit mute show status
Table 159 Remote Radio Mute/Unmute CLI Parameters
| Parameter | Input Type | Permitted Values | Description |
| admin Variable on | off | Mutes (on) or unmutes (off) the remote unit. | |
The following command mutes the remote radio:
radio[2/1]>remote-unit mute set admin on
The following command unmutes the remote radio:
radio[2/1]>remote-unit mute set admin off
Displaying the Remote Radio's RX Level (CLI)
To display the remote radio's RX level, go to radio view and enter the following command:
radio[x/x]>remote-unit show rx-level
Configuring the Remote Radio's TX Level (CLI)
To set the transmit (TX) level of the remote radio, go to radio view and enter the following command:
radio[x/x]>remote-unit set tx-level <tx-level>
To display the transmit (TX) level of the remote radio, go to radio view and enter the following command:
radio[x/x]>remote-unit show tx-level
Table 160 Remote Radio TX Level CLI Parameters
| Parameter | Input Type | Permitted Values | Description |
| tx-level Number | Depends on the frequency and unit type. | The desired TX signal level (TSL), in dBm. |
The following command sets the TX level of the remote radio to 10 dBm:
radio[2/1]>remote-unit set tx-level 10
Configuring Remote ATPC (CLI)
To set the RX reference level for ATPC on the remote radio, go to radio view and enter the following command:
radio[x/x]>remote-unit atpc set ref-level <ref-level>
To display the RX reference level for ATPC on the remote radio, go to radio view and enter the following command:
radio[x/x]>remote-unit atpc show ref-level
Table 161 Remote Radio ATPC CLI Parameters
| Parameter | Input Type | Permitted Values | Description |
| ref-level | Number | -70 - -30 | The RX reference level for the ATPC mechanism. |
Configuring ATPC and Override Timer (CLI)
ATPC is a closed-loop mechanism by which each carrier changes the TX power according to the indication received across the link, in order to achieve a desired RSL on the other side of the link.
With ATPC, if the radio increases its TX power up to the configured TX power, it can lead to a period of sustained transmission at maximum power, resulting in unacceptable interference with other systems.
In order to minimize interference, PTP 820G and PTP 820F provides an ATPC override mechanism. When ATPC override is enabled, a timer begins when ATPC raises the TX power to its maximum. When the timer expires, the radio enters ATPC override state. In ATPC override state, the radio transmits no higher than the pre-determined ATPC override TX level, and an ATPC override alarm is raised. The radio remains in ATPC override state until the ATPC override state is manually cancelled by the user (or until the unit is reset). The radio then returns to normal ATPC operation.
In a configuration with unit redundancy or radio protection, the ATPC override state is propagated to the standby unit or radio in the event of switchover.

Note
When canceling an ATPC override state, you should ensure that the underlying problem has been corrected. Otherwise, ATPC may be overridden again.
To enable or disable ATPC, enter the following command in radio view:
radio[x/x]>atpc set admin <admin>
To display whether or not ATPC is enabled, enter the following command in radio view:
radio[x/x]>atpc show admin
To set the RX reference level for ATPC, enter the following command in radio view:
radio[x/x]>atpc set rx-level atpc_ref_rx_level <rx-level>
To display the RX reference level for ATPC, enter the following command in radio view:
radio[x/x]>atpc show rx-level
radio[x/x]>atpc set override timeout <timeout>

Note
The next command actually enables ATPC override. However, it is recommended to set the timer before enabling ATPC override. Failure to do so can lead to unexpected reduction of the TX power with corresponding loss of capacity if TX override is enabled with the timer set to a lower-than-desired value.
To enable ATPC override, enter the following command in radio view. ATPC must be enabled before you enable ATPC override.
radio[x/x]>atpc override set admin <override admin>
To display whether or not ATPC override is enabled, enter the following command in radio view:
radio[x/x]>atpc override show admin
To display the ATPC override timeout, enter the following command in radio view:
radio[x/x]>atpc show override timeout
To set the TX power to be used when the unit is in an ATPC override state, enter the following command in radio view:
radio[x/x]>atpc set override-tx-level <override-tx-level>
To display the ATPC override TX power, enter the following command in radio view:
radio[x/x]>atpc show override tx-level
To display the current ATPC override state, enter the following command in radio view:
radio[x/x]>atpc show override
Possible values are:
- Normal – ATPC override is enabled, and there is no override.
- Disabled – ATPC override is not enabled.
- Override – ATPC override has been activated.
To cancel ATPC override, enter the following command in radio view:
radio[x/x]>atpc set override-cancel
Table 162 Radio ATPC CLI Parameters
| Parameter | Input Type | Permitted Values | Description |
| admin Variable enable | disable | Enables or disables ATPC mode. | |
| rx-level | Number | -70 - -30 | The RX reference level for the ATPC mechanism. |
| timeout Number 0-1800 | The amount of time, in seconds, the timer counts from the moment the radio reaches its maximum configured TX power until ATPC override goes into effect. | ||
| override admin | Variable enable | disable | Enables or disables ATPC override. |
| override-tx-level | Number -50 - 50 | The TX power, in dBm, to be used when the unit is in an ATPC override state. The range of values depends on the frequency, MRMC script, and RFU type. | |
The following commands enable ATPC mode for radio interface 1 and set the RX reference level to -55:
radio[2/1]>atpc set admin enable
radio[2/1]>atpc set rx-level atpc_ref_rx_level -55
radio[1/1]>atpc set override timeout 900
radio[1/1]>atpc override set admin enable
radio[1/1]>atpc set override-tx-level 18
Configuring Header De-Duplication (CLI)
Header De-Duplication identifies traffic flows and replaces header fields with a flow ID. The Header De-Duplication module includes an algorithm for learning each new flow, and implements compression on the flow type starting with the next frame of that flow type.
You can determine the depth to which the compression mechanism operates, from Layer 2 to Layer 4. You must balance the depth of compression against the number of flows in order to ensure maximum efficiency. Multi-Layer (Enhanced) compression supports up to 256 flow types.

Note
The Header De-Duplication configuration must be identical on both sides of the link.
To configure Header De-Duplication, enter the following command in radio view:
radio[x/x]> compression header-compression set <mode>
To clear Ethernet port counters, including both Frame Cut-Through and Header De-Duplication counters, enter the following command in radio view:
radio[x/x]>clear-ethernet-port-counters
Table 163 Header De-Duplication CLI Parameters
| Parameter | Input Type | Permitted Values | Description |
| mode | Variable Disabled | Disabled - Header De-Duplication is disabled. | |
| Layer2 | Layer2 - Header De-Duplication operates on the Ethernet level. | ||
| MPLS | |||
| Layer3 | |||
| Layer4 | MPLS - Header De-Duplication operates on the Ethernet and MPLS levels. | ||
| Tunnel | |||
| Tunnel-Layer3 | Layer3 - Header De-Duplication operates on the Ethernet and IP levels. | ||
| Tunnel-Layer4 | |||
| Layer4 - Header De-Duplication operates on all supported layers up to Layer 4. | |||
| Tunnel - Header De-Duplication operates on Layer 2, Layer 3, and on the Tunnel layer for packets carrying GTP or GRE frames. | |||
| Tunnel-Layer3 - Header De-Duplication operates on Layer 2, Layer 3, and on the Tunnel and T-3 layers for packets carrying GTP or GRE frames. | |||
| Tunnel-Layer4 - Header De-Duplication operates on Layer 2, Layer 3, and on the Tunnel, T-3, and T-4 layers for packets carrying GTP or GRE frames. |
The following command enables Layer 2 Header De-Duplication on fixed radio interface 1, with a defined flow type of 0x00:
root> radio slot 1 port 1
radio[1/1]> compression header-compression set mode Layer2
Displaying Header De-Duplication Information (CLI)
To display the current Header De-Duplication configuration, enter the following command in radio view:
radio[x/x]> compression show-configuration
To display counters for Header De-Duplication, enter the following command in radio view:
radio[x/x]> header-compression show-counters
The following counters are displayed:
• TX in octet count - Bytes on the TX side before Header De-Duplication.
- TX out octet count - Bytes on the TX side that were compressed by Header De-Duplication.
- TX frame in count - Frames on the TX side before Header De-Duplication.
- TX frame out compressed count - Frames on the TX side that were compressed by Header De-Duplication.
- TX frame uncompressed count - The number of frames on the TX side that were not compressed due to exclusion rules.

Note
The use of exclusion rules for Header De-Duplication is planned for future release.
- TX frame uncompressed other count - Frames on the TX side that were not compressed for reasons other than the use of exclusion rules.
- TX out frame learning count - The number of frames that have been used to learn unique data flows. Once a particular flow type has been learned, subsequent frames with that flow type are compressed by Header De-Duplication.
- TX out number of active flows in count - The number of Header De-Duplication flows that are active on the TX side.
Configuring Frame Cut-Through (CLI)
Using the Frame Cut-Through feature, frames assigned to queues with 4th priority pre-empt frames already in transmission over the radio from other queues. After the 4th queue frames have been transmitted, transmission of the pre-empted frames resumes.

Note
The Frame Cut-Through configuration must be identical on both sides of the link.
If Frame Cut-Through is used together with 1588 Transparent Clock, the 1588 packets must be given a CoS that is not assigned to the fourth priority queue.
To enable Frame Cut-Through on a radio carrier, enter the following command in radio view:
radio[x/x]>cut-through mode <mode>
Table 164 Frame Cut-Through CLI Parameters
| Parameter | Input Type | Permitted Values | Description |
| mode | Variable yes | yes - Enables Frame Cut-Through | |
| no | no - Disables Frame Cut-Through |
The following commands enable Frame Cut-Through on radio interface 1:
root> radio slot 1 port 1
radio[1/1]>cut-through mode yes
To display the current Frame Cut-Through mode for a radio carrier, enter the following command in radio view:
radio[x/x]>cut-through show-mode
To display counters for Frame Cut-Through for a radio carrier, enter the following command in radio view:
radio[x/x]>cut-through show-counters
Configuring AES-256 Payload Encryption (CLI)

Note
AES-256 is not supported with PTP 820F.
This feature requires:
- Requires an activation key. If no valid AES activation key has been applied to the unit, AES will not operate on the unit. See Configuring the Activation Key.

Note
In order for the AES activation key to become active, you must reset the unit after configuring a valid AES activation key. Until the unit is reset, an alarm will be present if you enable AES. This is not the case for other activation keys.
PTP 820G supports AES-256 payload encryption. AES is enabled and configured separately for each radio carrier.
PTP 820 uses a dual-key encryption mechanism for AES:
- The user provides a master key. The master key can also be generated by the system upon user command. The master key is a 32-byte symmetric encryption key. The same master key must be manually configured on both ends of the encrypted link.
- The session key is a 32-byte symmetric encryption key used to encrypt the actual data. Each link uses two session keys, one for each direction. For each direction, the session key is generated by the transmit side unit and propagated automatically, via a Key Exchange Protocol, to the other side of the link. The Key Exchange Protocol exchanges session keys by encrypting them with the master key, using the AES-256 encryption algorithm. Session keys are regenerated at user-configured intervals.
The first KEP exchange that takes place after a new master key is configured causes traffic to be blocked for up to one minute, until the Crypto Validation State becomes Valid. Subsequent KEP exchanges that take place when a session key expires do not affect traffic. KEP exchanges have no effect upon ACM, RSL, and MSE.
To display the current payload encryption status for all available radio links on the unit, enter the following command in root view:
root> payload encryption status show
The following is a sample output of this command in which payload encryption is enabled but not operational on radio interface 1, and disabled on radio interface 2.
| [root> payload encryption status show Traffic Crypto configuration table: | ||||
| Interface slot | Interface port | Admin mode | Master Key | Session Key Period |
| 1 | 1 | AES-256 | 5QV_{Fm'v1iKgaQhnP#09As6&QA.#dH^ | 00:00 |
| 1 | 2 | Disable | 00:00 | |
| Traffic Crypto status table: | ||||
| Interface slot | Interface port | Crypto Validation State | ||
| 1 | 1 | not-valid | ||
| 1 | 2 | not-valid | ||
| root> | ||||
To configure payload encryption:
1 Verify that both the local and remote units are running with no alarms. If any alarm is present, take corrective actions to clear the alarms before proceeding.
2 If the link is using in-band management, identify which unit is local and which unit is remote from the management point of view.
3 In a link with HSB radio protection, enable protection lockout, first on the remote and then on the local unit. See Switchovers and Lockout (CLI).
4 To configure AES on a radio carrier, you must first enter Payload Encryption view for the specific radio. To enter Payload Encryption view, enter the following command in root view:
root> payload encryption slot <slot> port <port>
For example, to configure AES on fixed radio interface 2, enter the following command in root view:
root> payload encryption slot 1 port 2
Payload Encryption [1/2]>
To display the payload encryption mode of the radio interface, enter the following command in Payload Encryption view:
Payload Encryption [x/x]> payload encryption mode show
The following display indicates that payload encryption is enabled on fixed radio interface 2:
Traffic Encryption [1/2]> payload encryption mode show
Admin Mode: AES-256
The following display indicates that payload encryption is disabled on fixed radio interface 1:
Payload Encryption [1/1]> payload encryption mode show
Admin Mode: Disable
5 Configure the master key on the remote unit by doing one of the following:
- Enter a master key manually.
○ Generate the master key automatically.
You must use the same master key on both sides of the link. This means that if you generate a master key automatically on one side of the link, you must copy that key and for use on the other side of the link. Once payload encryption has been enabled on both sides of the link, the Key Exchange Protocol periodically verifies that both ends of the link have the same master key. If a mismatch is detected, an alarm is raised and traffic transmission is stopped for the mismatched carrier at both sides of the link. The link becomes non-valid and traffic stops being forwarded.
To define the master key manually, enter the following command in Payload Encryption view:
Payload Encryption [x/x]> payload encryption mkey
When you press
Please enter key:
Enter the master key and press
To generate the master key automatically, enter the following command in Payload Encryption view:
Payload Encryption [x/x]> master key generate
A random master key is generated. You must copy and paste this key to the other end of the link to ensure that both sides of the link have the same master key. To display and copy the master key, enter the Payload encryption status show command described above. You can copy the master key from the output of this command.
6 On the local unit, follow the procedure described in Step 5 to configure the same master key configured on the remote unit also on the local unit.
7 Enable payload encryption on the remote unit:
i Enter the following command in Payload Encryption view:
Payload Encryption [x/x]> payload encryption mode admin AES-256
This step will cause the link status to be Down until payload encryption is successfully enabled on the local unit. However, the RSL measured on the link should remain at an acceptable level.
To disable payload encryption, enter the following command in Payload Encryption view:
Payload Encryption [x/1]> payload encryption mode admin Disable
ii The session key is automatically regenerated at defined intervals. To set the session key regeneration interval, enter the following command in Payload Encryption view :
Payload Encryption [x/1]> payload encryption session-key period set <00:03-12:00>
Enter the regeneration interval in hours and minutes (HH:MM). For example, the following command configures fixed radio interface 1 to regenerate the session key every 4 hours and 15 minutes:
Payload Encryption [2/1]> payload encryption session-key period set 04:15
To display the session key regeneration interval, enter the following command in Payload Encryption view:
Payload Encryption [x/1]> payload encryption session-key period show

Note
The session key regeneration interval must be the same on both sides of the link.
8 Enable payload encryption on the local unit by following the procedure described in Step 7. Verify that on both the local and remote active units, the link status returns to Up and user traffic is restored. In links using in-band management, verify also that in-band management returns.
9 In a link with HSB radio protection, perform copy-to-mate, first on the remote and then on the local unit. See 7. After the copy-to-mate operation, wait for both standby units to re-boot and verify that there are no alarms.

Note
The standby unit may have a payload encryption failure alarm for up to about one minute after the unit is up and running.
5 In a link with radio protection, remove the protection lockout, first on the remote and then on the local unit. See Switchovers and Lockout (CLI).
6 Verify that there are no alarms on the link.
You can set all master keys defined on the unit to zero value. To zeroize the master keys, enter the following command in root view:
root> payload encryption key zeroize

Warning
Executing this command on a FIPS enabled unit formats the unit's disk, and renders the unit non-operational. If it is necessary to use this command, contact Cambium Networks Technical Support for instructions how to re-configure the unit.
This command has no effect on units that are not enabled for FIPS.

Note
Any time payload encryption fails, the Operational status of the link is Down until payload encryption is successfully restored.
Configuring and Viewing Radio PMs and Statistics (CLI)
This section includes:
- Displaying General Modem Status and Defective Block PMs(CLI)
• Displaying Excessive BER (Aggregate) PMs (CLI) - Displaying BER Level and Configuring the Excessive BER Thresholds (CLI)
- Configuring RSL Thresholds (CLI)
- Configuring TSL Thresholds (CLI)
• Displaying RSL and TSL Levels (CLI) - Configuring the Signal Level Threshold (CLI)
- Configuring the MSE Thresholds and Displaying the MSE PMs (CLI)
- Configuring the XPI Thresholds and Displaying the XPI PMs (CLI)
- Displaying ACM PMs and Configuring ACM Profile Thresholds (CLI)
Displaying General Modem Status and Defective Block PMs(CLI)
To display the general status of the modem, go to radio view and enter the following command in radio view:
radio[x/x]>modem show status
The following is a sample output of the modem show status command:
MSE[db]: -99.00
Defective Blocks count: 0
Current Tx profile: 0
Current Tx QAM: 4
Current Tx rate(Kbps): 43389
Current Rx profile: 0
Current Rx QAM: 4
Current Rx rate(Kbps): 43389
radio [1/1]>modem show status
MSE[db]: -99.00
Defective Blocks count: 0
Current Tx profile: 0
Current Tx QAM: 4
Current Tx rate(Kbps): 43389
Current Rx profile: 0
Current Rx QAM: 4
Current Rx rate(Kbps): 43389
radio [1/1]>
To clear all radio PMs in the system, enter the following command in root view:
root> radio pm clear all
To clear defective blocks counters for a radio, go to radio view and enter the following command:
radio[x/x]>modem clear counters
Displaying Excessive BER (Aggregate) PMs (CLI)
You can display modem BER (Bit Error Ratio) PMs in either 15-minute or daily intervals.
To display modem BER PMs in 15-minute intervals, go to radio view and enter the following command:
radio [x/x]>framer pm-aggregate show interval 15min
The following is a partial sample output of the framer pm-aggregate show interval 15min command:
radio [1/1]>framer pm-aggregate show interval 15min
Modem BER PM table:
Interval Integrity ES SES UAS BBE
0 1 0 0 333 0
1 1 0 0 900 0
2 1 0 0 900 0
3 1 0 0 900 0
4 1 0 0 900 0
5 1 0 0 900 0
6 1 0 0 900 0
7 1 0 0 900 0
8 1 0 0 900 0
radio [1/1]>
To display modem BER PMs in daily intervals, go to radio view and enter the following command:
radio [x/x]>framer pm-aggregate show interval 24hr
The following is a sample output of the framer pm-aggregate show interval 24hr command:
radio [1/1]>framer pm-aggregate show interval 24hr
Modem BER PM table:
Interval Integrity ES SES UAS BBE
0 1 0 0 53843 0
4 1 0 0 37061 0
5 1 0 0 4034 0
6 1 0 0 85971 0
8 1 0 0 46171 0
11 1 0 0 24184 0
15 1 0 0 85978 0
17 1 0 0 54979 0
radio [1/1]>
Table 165 Aggregate PMs (CLI)
| Parameter Description | |
| Interval | The number of the interval: 1-30 for daily PM reports, and 1-96 for 15 minute PM reports. |
| Integrity | Indicates whether the values received at the time and date of the measured interval are reliable. "1" in the column indicates that the values are not reliable due to a possible power surge or power failure that occurred at that time. |
| ES | Indicates the number of seconds in the measuring interval during which errors occurred. |
| SES | Indicates the number of severe error seconds in the measuring interval. |
| UAS | Indicates the Unavailable Seconds value of the measured interval. The value can be between 0 and 900 seconds (15 minutes). |
| BBE | Indicates the number of background block errors during the measured interval. |
Displaying BER Level and Configuring the Excessive BER Thresholds (CLI)
To display the current BER level, go to radio view and enter the following command:
radio [x/x]>modem show ber
The excessive-ber parameter determines whether or not excessive BER is propagated as a fault and considered a system event. For example, if excessive-ber is enabled, excessive BER can trigger a protection switchover.
To enable or disable Excessive BER Admin, enter the following command in root view:
root> radio excessive-ber set admin <admin>

Note
By default, Excessive BER Admin is disabled.
To display the current setting for excessive-ber, enter the following command in root view:
root> radio excessive-ber show admin
To set the level above which an excessive BER alarm is issued for errors detected over the radio link, go to radio view and enter the following command:
radio [x/x]>modem excessive-ber set threshold <threshold>
To display the excessive BER threshold, go to radio view and enter the following command:
radio [x/x]>modem excessive-ber show threshold
Table 166 Excessive BER CLI Parameters
| Parameter | Input Type | Permitted Values | Description |
| admin Variable enable | disable | Enables or disables propagation of excessive BER as a fault. | |
For example, the following command enables excessive-ber:
root> radio excessive-ber set admin enable
To set the level above which an excessive BER alarm is issued for errors detected over the radio link, enter the following command in radio view:
radio[x/x]>modem excessive-ber set threshold
To display the excessive BER threshold, enter the following command in radio view:
radio[x/x]>modem excessive-ber show threshold
Table 167 Excessive BER Threshold Parameters (CLI)
| Parameter | Input Type | Permitted Values | Description |
| threshold Variable | 1e-3 | The level above which an excessive BER alarm is issued for errors detected over the radio link. | |
| 1e-4 | |||
| 1e-5 | |||
The following command sets the excessive BER threshold for radio interface 2 to 1e-5:
radio[1/2]>modem excessive-ber set threshold 1e-5
Configuring RSL Thresholds (CLI)
You can set two RSL (RX Signal Level) thresholds. The number of seconds during which the RSL exceeds these thresholds are counted as RSL Exceed Threshold Seconds. See Displaying RSL and TSL Levels (CLI).
To set the RSL thresholds, go to radio view and enter the following command:
radio [x/x]>rf pm-rsl set threshold1
Table 168 RSL Thresholds CLI Parameters
| Parameter | Input Type | Permitted Values | Description |
| threshold1 | Number | -75 --15 | The first RSL threshold (dBm). |
| threshold2 | Number | -75 --15 | The second RSL threshold (dBm). |
The following command sets the RSL thresholds to -30 dBm and -60 dBm, respectively.
radio [2/1]>rf pm-rsl set threshold1 -30 threshold2 -60
Configuring TSL Thresholds (CLI)
The number of seconds during which the TX Signal Level exceeds the TSL threshold are counted as TSL Exceed Threshold Seconds. See Displaying RSL and TSL Levels (CLI).
To set the TSL threshold, go to radio view and enter the following command:
radio [x/x]>rf pm-tsl set threshold -15
Table 169 TSL Thresholds CLI Parameters
| Parameter | Input Type | Permitted Values | Description |
| threshold | Number | -10 - 34 | The TSL threshold (dBm). |
The following command sets the TSL threshold to 10 dBm:
radio [2/1]>rf pm-tsl set threshold 10
Displaying RSL and TSL Levels (CLI)
You can display the RSL (RX Signal Level) and TSL (TX Signal Level) PMs in either 15-minute or daily intervals.
To display RSL and TSL PMs in 15-minute intervals, go to radio view and enter the following command:
radio [x/x]>rf pm-rsl-tsl show interval 15min
To display RSL and TSL PMs in daily intervals, go to radio view and enter the following command:
radio [x/x]>rf pm-rsl-tsl show interval 24hr
The following is the output format of the rf pm-rsl-tsl show commands:
radio [1/1]>rf pm-rsl-tsl show interval 15min RF PM table:
Interval Integrity Min RSI. (dBm) Max RSI. (dBm) Min TSI. (dBm) Max TSI. (dBm) TSI. exceed RSI. exceed RSI. exceed threshold threshold1 threshold2 seconds seconds seconds
radio [1/1]>
Table 170 RSL and TSL PMs (CLI)
| Parameter Description | |
| Interval | The number of the interval: 1-30 for daily PM reports, and 1-96 for 15 minute PM reports. |
| Integrity | Indicates whether the values received at the time and date of the measured interval are reliable. "1" in the column indicates that the values are not reliable due to a possible power surge or power failure that occurred at that time. |
| Min RSL (dBm) | The minimum RSL (Received Signal Level) that was measured during the interval. |
| Max RSL (dBm) | The maximum RSL (Received Signal Level) that was measured during the interval. |
| Min TSL (dBm) | The minimum TSL (Transmit Signal Level) that was measured during the interval. |
| Max TSL (dBm) | The maximum TSL (Transmit Signal Level) that was measured during the interval. |
| TSL exceed threshold seconds | The number of seconds the measured TSL exceeded the threshold during the interval. See Configuring TSL Thresholds (CLI). |
| RSL exceed threshold1 seconds | The number of seconds the measured RSL exceeded RSL threshold 1 during the interval. See Configuring RSL Thresholds (CLI) |
| RSL exceed threshold2 seconds | The number of seconds the measured RSL exceeded RSL threshold 2 during the interval. See Configuring RSL Thresholds (CLI) |
Configuring the Signal Level Threshold (CLI)
To set the BER (Bit Error Rate) level above which a Signal Degrade alarm is issued for errors detected over the radio link, go to radio view and enter the following command:
radio [x/x]>modem signal-degrade set threshold 1e-7
To display the Signal Degrade BER threshold, go to radio view and enter the following command:
radio [x/x]>modem signal-degrade show threshold
Table 171 Signal Level Threshold CLI Parameters
| Parameter | Input Type | Permitted Values | Description |
| threshold Variable 1e-6 | The BER level above which a Signal Degrade alarm is issued for errors detected over the radio link. | ||
| 1e-7 | |||
| 1e-8 | |||
| 1e-9 | |||
| 1e-10 | |||
The following command sets the Signal Degrade threshold at 1e-7:
radio [2/1]>modem signal-degrade set threshold le-7
Configuring the MSE Thresholds and Displaying the MSE PMs (CLI)
To configure the MSE (Mean Square Error) threshold, go to radio view and enter the following command:
radio [x/x]>modem set mse-exceed threshold <threshold>
To display the currently configured MSE threshold, go to radio view and enter the following command:
radio [x/x]>modem show threshold-mse-exceed
Table 172 MSE CLI Parameters
| Parameter | Input Type | Permitted Values | Description |
| threshold | Number | -99 - -1 | The MSE threshold. |
The following command sets the MSE threshold for radio interface 1 to -30:
radio[1/1]>modem set mse-exceed threshold -30
To display MSE (Mean Square Error) PMs in 15-minute intervals, go to radio view and enter the following command:
radio [x/x]>modem pm-mse show interval 15min
The following is a partial sample output of the modem pm-mse show interval 15min command:
radio [1/1]>modem pm-mse show interval 15min

Modem MSE PM Table:
================----

Interval Integrity Min MSE (dB) Max MSE (dB) Exceed
threshold
seconds

================----

0 1 0.00 0.00 708
1 1 0.00 0.00 900
2 1 0.00 0.00 900
3 1 0.00 0.00 900
4 1 0.00 0.00 900
5 1 0.00 0.00 900
6 1 0.00 0.00 900
7 1 0.00 0.00 900
8 1 0.00 0.00 900
9 1 0.00 0.00 900
10 1 0.00 0.00 900

radio [1/1]>
To display MSE (Mean Square Error) PMs in daily intervals, go to radio view and enter the following command:
radio [x/x]>modem pm-mse show interval 24hr
The following is sample output of the modem pm-mse show interval 24hr command:
radio [1/1]>modem pm-mse show interval 24hr
Modem MSE PM Table:
====================
Interval Integrity Min MSE (dB) Max MSE (dB) Exceed
threshold
seconds
====================
====================
0 1 0.00 0.00 63745
4 1 0.00 0.00 37062
5 1 0.00 0.00 3495
6 1 0.00 0.00 85976
8 1 0.00 0.00 46173
11 1 0.00 0.00 24185
15 1 0.00 0.00 85988
17 1 0.00 0.00 54981
radio [1/1]>modem
Table 173 MSE PMs (CLI)
| Parameter Description | |
| Interval | The number of the interval: 1-30 for daily PM reports, and 1-96 for 15 minute PM reports. |
| Integrity | Indicates whether the values received at the time and date of the measured interval are reliable. "1" in the column indicates that the values are not reliable due to a possible power surge or power failure that occurred at that time. |
| Min MSE (dB) | Indicates the minimum MSE in dB, measured during the interval. |
| Max MSE (dB) | Indicates the maximum MSE in dB, measured during the interval. |
| Exceed Threshold Seconds | Indicates the number of seconds the MSE exceeded the MSE PM threshold during the interval. |
Displaying ACM PMs and Configuring ACM Profile Thresholds (CLI)
To display ACM PMs in 15-minute intervals, enter the following command in radio view:
radio [x/x]>mrmc pm-acm show interval 15min
The following is a partial sample output of the modem pm-acm show interval 15min command:
radio [1/1]>mrmc pm-acm show interval 15min
MRMC PM Table:
====================

Interval Integrity Min profile Max profile Min bitrate Max bitrate
====================

---
0 1 0 0 43389 43389
1 1 0 0 43389 43389
2 1 0 0 43389 43389
3 1 0 0 43389 43389
4 1 0 0 43389 43389
5 1 0 0 43389 43389
6 1 0 0 43389 43389
7 1 0 0 43389 43389
8 1 0 0 43389 43389
9 1 0 0 43389 43389
10 1 0 0 43389 43389

radio [1/1]>
To display ACM PMs in daily intervals, enter the following command in radio view:
radio [x/x]>mrmc pm-acm show interval 24hr
The following is sample output of the modem pm-acm show interval 24hr command:
radio [1/1]>mrmc pm-acm show interval 24hr
MRMC PM Table:
----
Interval Integrity Min profile Max profile Min bitrate Max bitrate
====

0 1 0 0 43389 43389
4 1 0 0 43389 43389
5 1 0 0 43389 43389
6 1 0 0 43389 43389
8 1 0 0 43389 43389
11 1 0 0 43389 43389
15 1 0 0 43389 43389
17 1 0 0 43389 43389

radio [1/1]>
Table 174 ACM PMs (CLI)
| Parameter Description | |
| threshold1 | The higher ACM profile threshold (0-15). The default value is 0. |
| threshold2 | The lower ACM profile threshold (0-15). The default value is 0. |
| Interval | The number of the interval: 1-30 for daily PM reports, and 1-96 for 15 minute PM reports. |
| Integrity | Indicates whether the values received at time and date of the measured interval are reliable. "1" in the column indicates that the values are not reliable due to a possible power surge or power failure that occurred at that time. |
| Min profile | Indicates the minimum ACM profile that was measured during the interval. |
| Max profile | Indicates the maximum ACM profile that was measured during the interval. |
| Min bitrate | Indicates the minimum total radio throughput (Mbps), delivered during the interval. |
| Max bitrate | Indicates the maximum total radio throughput (Mbps), delivered during the interval. |
Configuring the XPI Thresholds and Displaying the XPI PMs (CLI)
To configure the modem XPI threshold for calculating XPI Exceed Threshold seconds, go to radio view and enter the following command:
radio[x/x]>modem set threshold-xpi-exceed threshold
To display the currently configured XPI threshold, go to radio view and enter the following command:
radio[x/x]>modem show threshold-xpi-below
Table 175 XPI Threshold CLI Parameters
| Parameter | Input Type | Permitted Values | Description |
| threshold | Number | 0-99 | The XPI threshold. |
To display XPI PMs in 15-minute intervals, go to radio view and enter the following command:
radio[x/x]>modem pm-xpi show interval 15min
The following is a partial sample output of the modem pm-xpi show interval 15min command:
radio [1/1]>modem pm-xpi show interval 15min
Modem XPI PM Table:
====================

Interval Integrity Min XPI (dB) Max XPI (dB) XPI below
threshold
seconds
====================

===

0 1 55.00 0.00 0
1 1 55.00 0.00 0
2 1 55.00 0.00 0
3 1 55.00 0.00 0
4 1 55.00 0.00 0
5 1 55.00 0.00 0
6 1 55.00 0.00 0
7 1 55.00 0.00 0
8 1 55.00 0.00 0
9 1 55.00 0.00 0
10 1 55.00 0.00 0
radio [1/1]>
To display XPI PMs in daily intervals, go to radio view and enter the following command:
radio[x/x]>modem pm-xpi show interval 24hr
The following is a partial sample output of the modem pm-xpi show interval 24hr command:
radio [1/1]>modem pm-xpi show interval 24hr

Modem XPI PM Table:

Interval Integrity Min XPI (dB) Max XPI (dB) XPI below threshold seconds

---
0 1 55.00 0.00 0
1 1 55.00 0.00 0
2 1 55.00 0.00 0
3 1 55.00 0.00 0
4 1 55.00 0.00 0
5 1 55.00 0.00 0
6 1 55.00 0.00 0
7 1 55.00 0.00 0
8 1 0.00 0.00 38802
9 1 0.00 0.00 48647
10 1 0.00 0.00 9665
11 1 0.00 0.00 1605
12 1 55.00 0.00 0
radio [1/1]>
Table 176 XPI PMs (CLI)
| Parameter Description | |
| Interval | The number of the interval: 1-30 for daily PM reports, and 1-96 for 15 minute PM reports. |
| Integrity | Indicates whether the values received at the time and date of the measured interval are reliable. "1" in the column indicates that the values are not reliable due to a possible power surge or power failure that occurred at that time. |
| Min XPI (dB) | Indicates the lowest XPI value in dB, measured during the interval. |
| Max XPI (dB) | Indicates the highest XPI value in dB, measured during the interval. |
| XPI Below Threshold Seconds | Indicates the number of seconds the XPI value was lower than the XPI threshold during the interval. |
Chapter 18: Ethernet Services and Interfaces (CLI)
This section includes:
- Configuring Ethernet Services (CLI)
- Setting the MRU Size and the S-VLAN Ethertype (CLI)
- Configuring Ethernet Interfaces (CLI)
- Configuring Automatic State Propagation and Link Loss Forwarding (CLI)
• Viewing Ethernet PMs and Statistics (CLI)
Related topics:
- Configuring Link Aggregation (LAG) and LACP (CLI)
• Quality of Service (QoS) (CLI) - Ethernet Protocols (CLI)
• Performing Ethernet Loopback (CLI) - Ethernet Traffic Interfaces
• Ethernet Pin-Outs and LEDs
Configuring Ethernet Services (CLI)
This section includes:
• Ethernet Services Overview (CLI)
• General Guidelines for Provisioning Ethernet Services (CLI)
- Defining Services (CLI)
- Configuring Service Points (CLI)
• Defining the MAC Address Forwarding Table for a Service (CLI)
Ethernet Services Overview (CLI)
Users can define up to 64 Ethernet services. Each service constitutes a virtual bridge that defines the connectivity between logical ports in the PTP 820G or PTP 820F network element.
This version of PTP 820G and PTP 820F supports the following service types:
- Multipoint (MP)
- Point-to-Point (P2P)
- Management (MNG)
In addition to user-defined services, PTP 820G and PTP 820F contains a pre-defined management service (Service ID 257). By default, this service is operational.

Note
You can use the management service for in-band management. For instructions on configuring in-band management, see Configuring In-Band Management (CLI).
A service point is a logical entity attached to a physical or logical interface. Service points define the movement of frames through the service. Each service point includes both ingress and egress attributes. A Point-to-Point or Multipoint service can hold up to 32 service points. A Management service can hold up 30 service points.
For a more detailed overview of the PTP 820G and PTP 820F service-oriented Ethernet switching engine, refer to the Technical Description for the PTP 820 product type you are using.
General Guidelines for Provisioning Ethernet Services (CLI)
When provisioning Ethernet services, it is recommended to follow these guidelines:
- Use the same Service ID for all service fragments along the path of the service.
- Do not re-use the same Service ID within the same region. A region is defined as consisting of all PTP 820G and PTP 820F devices having Ethernet connectivity between them.
-
Use meaningful EVC IDs.
-
Give the same EVC ID (service name) to all service fragments along the path of the service.
- Do not reuse the same EVC ID within the same region.
It is recommended to follow these guidelines for creating service points:
• Always use SNP service points on NNI ports and SAP service points on UNI ports.
- For each logical interface associated with a specific service, there should never be more than a single service point.
- The transport VLAN ID should be unique per service within a single region. That is, no two services should use the same transport VLAN ID.
Defining Services (CLI)
Use the commands described in the following sections to define a service and its parameters. After defining the service, you must add service points to the service in order for the service to carry traffic.
This section includes:
- Adding a Service (CLI)
- Entering Service View (CLI)
• Showing Service Details (CLI) - Configuring a Service's Operational State (CLI)
- Configuring a Service's CoS Mode and Default CoS (CLI)
- Configuring a Service's EVC ID and Description (CLI)
- Deleting a Service (CLI)
Adding a Service (CLI)
To add a service, enter the following command in root view:
root> ethernet service add type <service type> sid <sid> admin <service admin mode> evc-id <evc-id> description <evc-description>
Table 177 Adding Ethernet Service CLI Parameters
| Parameter | Input Type | Permitted Values | Description |
| service type | Variable | P2P - Point-to-Point MP - Multipoint | Defines the service type. |
| sid Number | Any unused value from 1-1024 | A unique ID for the service. Once you have added the service, you cannot change the Service ID. Service ID 1025 is reserved for a pre-defined management service. | |
| service admin mode | Variable | operational reserved | The administrative state of the service:operational- The service is functional.reserved- The service is disabled until this parameter is changed tooperational. In this mode, the service occupies system resources but is unable to receive and transmit data. |
| evc-id | Text String | Up to 20 characters. | Defines an Ethernet Virtual Connection (EVC) ID. This parameter does not affect the network element's behavior, but is used by the NMS for topology management. |
| evc description | Text String | Up to 64 characters. | A text description of the service. This parameter does not affect the network element's behavior, but is used by the NMS for topology management. |
The following command adds a Multipoint service with Service ID 18.
root> ethernet service add type mp sid 18 admin operational evc-id Ring_1 description east_west
The following command adds a Point-to-Point service with Service ID 10.
root> ethernet service add type p2p sid 10 admin operational evc-id Ring_1 description east_west
These services are immediately enabled, although service points must be added to the services in order for the services to carry traffic.
Entering Service View (CLI)
To view service details and set the service's parameters, you must enter the service's view level in the CLI.
To enter a service's view level:
root> ethernet service sid <sid>
The following command enters service view for the service with Service ID 10:
root> ethernet service sid 10
The following prompt appears:
service[10]>
Showing Service Details (CLI)
To display the attributes of a service, go to service view for the service and enter the following command:
service[SID]>service info show
For example:
service[1]>service info show
service info:
service id: 1
service type: p2p
service admin: operational
Maximal MAC address learning entries: 131072
default cos: 0
cos mode: preserve-sp-cos-decision
EVC id: N.A.
EVC description: N.A.
split horizon group: disable
configured multicast grouping: no
service[1]>
To display the attributes of a service and its service points, go to service view for the service and enter the following command:
service[SID]>service detailed-info show
For example:
service[1]>service detailed-info show
service info:
service id: 1
service type: mp
service admin: operational
Maximal MAC address learning entries: 131072
default cos: 0
cos mode: preserve-sp-cos-decision
EVC id: N.A.
EVC description: N.A.
split horizon group: disable
configured multicast grouping: no
service-points info:
+----+----+----+----+----+
|Service ID|Service Type|List of SP's|Attached to Interface|Attached Interface Type|Service Admin|STP Instance|SP name|
+----+----+----+----+
|1 |mp |sap \2 |rj45 1/2|dot1q |operational |0 | N.A. |
|1 |mp |snp \3 |radio 3/1|s-tag |operational |0 | N.A. |
+----+----+----+----+----+
service[1]>
To display a list of service points and their attributes, enter the following command in root view:
root>ethernet service show info sid <sid>
Table 178 Displaying Ethernet Service Details CLI Parameters
| Parameter | Input Type | Permitted Values | Default | Description |
| sid | Number | Any defined Service ID. | None | None |
For example:
root> ethernet service show info sid 1
service-points info:
+----+----+----+----+----+
----+----+----+----+
|Service ID|Service Type|List of SP's|Attached to Interface|Attached Interface Type|Service Admin|STP Instance|SP name|
+----+----+----+----+
----+----+----+----+
|1 |mp |sap \2 |rj45 1/2|dot1q |operational |0 | N.A. |
|1 |mp |snp \3 |radio 3/1|s-tag |operational |0 | N.A. |
+----+----+----+----+----+
----+----+----+----+
root>
Configuring a Service's Operational State (CLI)
To change the operational state of a service, go to service view for the service and enter the following command:
service[SID]>service admin set <service admin mode>
Table 179 Ethernet Service Operational State CLI Parameters
| Parameter | Input Type | Permitted Values | Description |
| service admin mode | Variable Operational reserved | The administrative state of the service:operational - The service is functional.reserved - The service is disabled until this parameter is changed to operational. In this mode, the service occupies system resources but is unable to receive and transmit data. | |
The following command sets Service 10 to be operational:
service[10]>service admin set operational
To display a service's admin mode, go to service view for the service and enter the following command:
Service[SID]> service admin show state
Configuring a Service's CoS Mode and Default CoS (CLI)
The CoS mode determines whether or not frames passing through the service have their CoS modified at the service level. The CoS determines the priority queue to which frames are assigned.
The CoS of frames traveling through a service can be modified on the interface level, the service point level, and the service level. The service level is the highest priority, and overrides CoS decisions made at the interface and service point levels. Thus, by configuring the service to apply a CoS value to frames in the service, you can define a single CoS for all frames traveling through the service.
To set a service's CoS mode, go to service view for the service and enter the following command:
service[SID]>service cos-mode set cos-mode <cos-mode>
If the CoS mode is set to default-cos, you must define the Default CoS. Use the following command to define the Default CoS:
service[SID]>service default-cos set cos <cos>
Table 180 Ethernet Service CoS Mode CLI Parameters
| Parameter | Input Type | Permitted Values | Description |
| cos-mode Variable | default-cos preserve-sp-cos-decision | default cos - Frames passing through the service are assigned the default CoS defined below. This CoS value overrides whatever CoS may have been assigned at the service point or interface level.preserve-sp-cos-decision - The CoS of frames passing through the service is not modified by the service. | |
If the CoS mode is set to default-cos, you must define the Default CoS. Use the following command to define the Default CoS:
service[SID]>service default-cos set cos <cos>
Table 181 Ethernet Service Default CoS CLI Parameters
| Parameter | Input Type | Permitted Values | Description |
| cos Number 0 – 7 | This value is assigned to frames at the service level if cos-mode is set to default-cos. Otherwise, this value is not used, and frames retain whatever CoS value they were assigned at the service point or logical interface level. | ||
The following commands configure Service 10 to assign a CoS value of 7 to frames traversing the service:
service[10]>service cos-mode set cos-mode default-cos
service[10]>service default-cos set cos 7
The following command configures Service 10 to preserve the CoS decision made at the interface or service point level for frames traveling through the service:
service[10]>service cos-mode set cos-mode preserve-sp-cos-decision
Configuring a Service's EVC ID and Description (CLI)
To add or change the EVC ID of a service, go to service view for the service and enter the following command:
service[SID]>service evcid set <evcid>
To display a service's EVC ID, go to service view for the service and enter the following command:
service[SID]>service evcid show
To add or change the EVC description of a service, go to service view for the service and enter the following command:
service[SID]>service description set <evc description>
To display a service's EVC description, go to service view for the service and enter the following command:
service[SID]>service description show
Table 182 Ethernet Service EVC CLI Parameters
| Parameter | Input Type | Permitted Values | Description |
| evcid Text String | Up to 20 characters. | Defines an Ethernet Virtual Connection (EVC) ID.This parameter does not affect the network element’s behavior, but is used by the NMS for topology management. |
To display a service's EVC ID, go to service view for the service and enter the following command:
service[STD]>service evcid show
To add or change the EVC description of a service, go to service view for the service and enter the following command:
service[SID]>service description set <evc description>
Table 183 Ethernet Service EVC Description CLI Parameters
| Parameter | Input Type | Permitted Values | Description |
| evc description | Text String | Up to 64 characters. | A text description of the service. This parameter does not affect the network element’s behavior, but is used by the NMS for topology management. |
To display a service's EVC description, go to service view for the service and enter the following command:
service[SID]>service description show
For example, the following commands add the EVC ID "East_West" and the EVC description "Line-to-Radio" to Service 10:
service[10]>service evcid set East_West
service[10]>service description set Line-to-Radio
Deleting a Service (CLI)
Before deleting a service, you must first delete any service points attached to the service (refer to Deleting a Service Point (CLI)).
Use the following command to delete a service:
root>ethernet service delete sid <sid>
The following command deletes Service 10:
root>ethernet service delete sid 10
Configuring Service Points (CLI)
This section includes:
• Service Points Overview (CLI)
• Service Point Classification (CLI)
• Adding a Service Point (CLI)
- Configuring Service Point Ingress Attributes (CLI)
- Configuring Service Point Egress Attributes (CLI)
• Displaying Service Point Attributes (CLI)
• Deleting a Service Point (CLI)
Service Points Overview (CLI)
Service points are logical interfaces within a service. A service point is a logical entity attached to a physical or logical interface. Service points define the movement of frames through the service. Each service point includes both ingress and egress attributes.
Each service point for a Point-to-Point or Multipoint service can be either a Service Access Point (SAP) or a Service Network Point (SNP). A Point-to-Point service can also use Pipe service points.
- An SAP is equivalent to a UNI in MEF terminology and defines the connection of the user network with its access points. SAPs are used for Point-to-Point and Multipoint traffic services.
- An SNP is equivalent to an NNI or E-NNI in MEF terminology and defines the connection between the network elements in the user network. SNPs are used for Point-to-Point and Multipoint traffic services.
- A Pipe service point is used to create traffic connectivity between two ports in a port-based manner (Smart Pipe). In other words, all the traffic from one port passes to the other port.
Management services utilize Management (MNG) service points.
A Point-to-Point or Multipoint service can hold up to 32 service points. A management service can hold up to 30 service points.
Table 177 summarizes the service point types available per service type.
Table 184 Service Points per Service Type
| Service Point Type | |||||
| MNG SAP SNP Pipe | |||||
| Service Type | Management | Yes | No | No | No |
| Point-to-Point | No | Yes | Yes | Yes | |
| Multipoint | No | Yes | Yes | No | |
Table 178 shows which service point types can co-exist on the same interface. Table 185 Service Point Types per Interface
MNG SAP SNP Pipe
| MNG | Only one MNG SP is allowed per interface. | Yes Yes Yes | ||
| SAP | Yes | Yes | No | No |
| SNP | Yes | No | Yes | No |
| PIPE | Yes | No | No | Only one Pipe SP is allowed per interface. |
Service Point Classification (CLI)
This section includes:
• Overview of Service Point Classification (CLI)
- SAP Classification (CLI)
• SNP Classification (CLI)
• Pipe Service Point Classification (CLI)
• MNG Service Point Classification (CLI)
Overview of Service Point Classification (CLI)
Service points connect the service to the network element interfaces. It is crucial that the network element have a means to classify incoming frames to the proper service point. This classification process is implemented by means of a parsing encapsulation rule for the interface associated with the service point. This rule is called the Interface Type, and is based on a key consisting of:
- The Interface ID of the interface through which the frame entered.
- The frame's C-VLAN and/or S-VLAN tags.
The Interface Type provides a definitive mapping of each arriving frame to a specific service point in a specific service. Since more than one service point may be associated with a single interface, frames are assigned to the earliest defined service point in case of conflict.
SAP Classification (CLI)
SAPs can be used with the following Interface Types:
- All to one – All C-VLANs and untagged frames that enter the interface are classified to the same service point.
- Dot1q – A single C-VLAN is classified to the service point.
- QinQ – A single S-VLAN and C-VLAN combination is classified to the service point.
- Bundle C-Tag – A set of multiple C-VLANs is classified to the service point.
- Bundle S-Tag – A single S-VLAN and a set of multiple C-VLANs are classified to the service point.
SNP Classification (CLI)
SNPs can be used with the following Attached Interface Types:
- Dot1q – A single C-VLAN is classified to the service point.
- S-Tag – A single S-VLAN is classified to the service point.
Pipe Service Point Classification (CLI)
Pipe service points can be used with the following Attached Interface Types:
- Dot1q – All C-VLANs and untagged frames that enter the interface are classified to the same service point.
- S-Tag – All S-VLANs and untagged frames that enter the interface are classified to the same service point.
MNG Service Point Classification (CLI)
Management service points can be used with the following Interface Types:
- Dot1q – A single C-VLAN is classified to the service point.
- S-Tag – A single S-VLAN is classified to the service point.
- QinQ – A single S-VLAN and C-VLAN combination is classified to the service point.
Table 179 and Table 180 show which service point – Interface Type combinations can co-exist on the same interface.
Table 186 Legal Service Point – Interface Type Combinations per Interface – SAP and SNP
| SP Type | SAP | SNP | ||||||
| SP Type | Attached Interface Type | 802.1q | Bundle-C | Bundle-S | All to One | Q in Q | 802.1q | S-Tag |
| SAP | 802.1q | Yes | Yes | No | No | No | No | No |
| Bundle-C | Yes | Yes | No | No | No | No | No | |
| Bundle-S | No | No | Yes | No | Yes | No | No | |
| All to One | No | No | No | Only 1 All to One SP Allowed | No | No | No | |
| Q in Q | No | No | Yes | No | Yes | No | No | |
| SNP | 802.1q | No | No | No | No | No | Yes | No |
| S-Tag | No | No | No | No | No | No | Yes | |
| Pipe | 802.1q | No | No | No | No | No | No | No |
| S-Tag | No | No | No | No | No | No | No | |
| MNG | 802.1q | Yes | Yes | No | No | No | Yes | No |
| Q in Q | No | No | Yes | No | Yes | No | No | |
| S-Tag | No | No | No | No | No | No | Yes |
Table 187 Legal Service Point – Interface Type Combinations per Interface – Pipe and MNG
| SP Type | Pipe | MNG | ||||
| SP Type | Attached Interface Type | 802.1q | S-Tag | 802.1q | Q in Q | S-Tag |
| SAP | 802.1q | No | No | Yes | No | No |
| Bundle-C | No | No | Yes | No | No | |
| Bundle-S | No | No | No | Yes | No | |
| All to One | No | No | No | No | No | |
| Q in Q | No | No | No | Yes | No | |
| SNP | 802.1q | No | No | Yes | No | No |
| S-Tag | No | No | No | No | Yes | |
| Pipe | 802.1q | Only one Pipe SP Allowed | No | Yes | No | No |
| S-Tag | No | Only one Pipe SP Allowed | No | No Yes | ||
| MNG | 802.1q | Yes | No | Only 1 MNG SP Allowed | No | No |
| Q in Q | No | No | No | Only 1 MNG SP Allowed | No | |
| S-Tag | No | Yes | No | No | Only 1 MNG SP Allowed |
Adding a Service Point (CLI)
The command syntax for adding a service point depends on the interface type of the service point. The interface type determines which frames enter the service via this service point.
To add a service point with an All-to-One interface type, go to service view for the service and enter the following command:
service[SID]>sp add sp-type <sp-type> int-type all-to-one spid <sp-id>[interface|group] <interface|group> slot <slot> port <port> sp-name <sp-name>
To add a service point with a Dot1q interface type, go to service view for the service and enter the following command:
service[SID]>sp add sp-type <sp-type> int-type dot1q spid <sp-id>
[interface|group] <interface|group> slot <slot> port <port> vlan <vlan>
sp-name <sp-name>
To add a service point with an S-Tag interface type, go to service view for the service and enter the following command:
service[SID]>sp add sp-type <sp-type> int-type s-tag spid <sp-id>
[interface|group] <interface|group> slot <slot> port <port> vlan <vlan>
sp-name <sp-name>
To add a service point with a Bundle-C interface type, go to service view for the service and enter the following command:
service[SID]>sp add sp-type <sp-type> int-type bundle-c spid <sp-id>
[interface|group] <interface|group> slot <slot> port <port> sp-name <sp-name>
To add a service point with a Bundle-S interface type, go to service view for the service and enter the following command:
service[SID]>sp add sp-type <sp-type> int-type bundle-s spid <sp-id>[interface|group] <interface|group> slot <slot> port <port> [outer-vlan <outer-vlan>|vlan <vlan>] sp-name <sp-name>

Note
In SAP service points, use the parameter outer-vlan. In SP service points, use the parameter vlan.
To add a service point with a Q-in-Q interface type, go to service view for the service and enter the following command:
service[SID]>sp add sp-type <sp-type> int-type qinq spid <sp-id>
[interface|group] <interface|group> slot <slot> port <port> outer-vlan <outer-vlan> inner-vlan <inner-vlan> sp-name <sp-name>
To add a Pipe service point, go to service view for the service and enter the following command:
service[SID]>sp add sp-type pipe int-type <int-type> spid <sp-id>
[interface|group] <interface|group> slot <slot> port <port> sp-name <sp-name>
Table 188 Add Service Point CLI Parameters
| Parameter | Input Type | Permitted Values | Description |
| sp-type Variable | sap | SAP – Service Access Point | |
| snp | SNP – Service Network Point | ||
| pipe | PIPE – Pipe service point | ||
| mng | MNG – Management service point | ||
| int-type Variable | all-to-one dot1q s-tag bundle-c-tag bundle-s-tag qinq | Determines which frames enter the service via this service point, based on the frame's VLAN tagging.Since more than one service point may be associated with a single interface, frames are assigned to the earliest defined service point in case of conflict.all-to-one – All C-VLANs and untagged frames that enter the interface are classified to the service point. Only valid for SAP service point types.dot1q – A single C-VLAN is classified to the service point. Valid for all service point types.s-tag – A single S- VLAN is classified to the service point. Valid for SNP and MNG service point types.bundle-c-tag – A set of multiple C-VLANs is classified to the service point. Only valid for SAP service point types.bundle-s-tag – A single S-VLAN and a set of multiple C-VLANs are classified to the service point. Only valid for SAP service point types.qinq – A single S-VLAN and C-VLAN combination is classified to the service point. Valid for SAP and MNG service point types. | |
| sp-id Number | 1-32 for P2P and MP services.1-30 for MNG services. | This ID is unique within the service. | |
| interface Variable | ethpweradio | The Interface type for the service point:eth – An Ethernet interface.pwe – A TDM interface.radio – A radio interface.When you are defining the service point on a group, such as a 1+1 HSB group or a LAG group, use the group parameter instead of the interface parameter. | |
| group Variable | rp1 | When you are defining the service point on a 1+1 HSB group, a LAG group, or a Multi-Carrier ABC group, use this parameter instead of the interface parameter to identify the group. The group must be defined before you add the service point. See:• Configuring HSB Radio Protection (CLI)• Configuring Link Aggregation (LAG) and LACP (CLI)• Configuring Multi-Carrier ABC (CLI) | |
| rp2 | |||
| rp3 | |||
| rp4 | |||
| lag1 | |||
| lag2 | |||
| lag3 | |||
| lag4 | |||
| mc-abc1 | |||
| mc-abc2 | |||
| mc-abc3 | |||
| mc-abc4 | |||
| slot Number 1 | |||
| port Number | ethernet: 1-6 radio: 1-2 management: 1-2 tdm: 1 | The port on which the service point is located. | |
| vlan | Number or Variable | 1-4094, or Untagged | Defines the VLAN classified to the service point. This parameter should not be included for service points with an interface type of bundle-C-tag. For instructions on attaching a bundled VLAN, refer to Attaching a VLAN Bundle to a Service Point.This parameter is also not relevant for:Service points with an interface type of qinq and all-to-one.Pipe service points. |
| outer-vlan Number | 1-4094, or Untagged | Defines the S-VLAN classified to the service point. This parameter is only relevant for service points with the interface type bundle-s-tag or qinq. | |
| inner-vlan Number | 1-4094, or Untagged | Defines the C-VLAN classified to the service point. This parameter is only relevant for service points with the interface type qinq. | |
| sp-name | Text string | Up to 20 characters. | A descriptive name for the service point (optional). |
Adding Service Point Examples (CLI)
The following command adds an SAP service point with Service Point ID 10 to Service 37, with interface type dot1q. This service point is located on radio interface 1. VLAN ID 100 is classified to this service point.
service[37]>sp add sp-type sap int-type dot1q spid 10 interface radio slot 1 port 1 vlan 100 sp-name Radio
The following command adds an SAP service point with Service Point ID 10 to Service 37, with interface type bundle-c-tag. This service point is located on radio interface 2.
service[37]>sp add sp-type sap int-type bundle-c-tag spid 10 interface radio slot 1 port 2 sp-name Radio
The following command adds an SAP service point with Service Point ID 10 to Service 37, with interface type qinq. This service point is located on radio interface 1. S-VLAN 100 and C-VLAN 200 are classified to the service point.
service[37]>sp add sp-type sap int-type qinq spid 10 interface radio slot 1 port 1 outer-vlan 100 inner-vlan 200 sp-name Radio
The following command adds an SAP service point with Service Point ID 10 to Service 37, with interface type all-to-one. This service point is located on radio interface 2. All traffic entering the system from that port is classified to the service point.
service[37]>sp add sp-type sap int-type all-to-one spid 10 interface radio slot 1 port 2 sp-name all-to-one
The following command adds an SNP service point with Service Point ID 10 to Service 37, with interface type dot1q. This service point is located on radio interface 1. VLAN ID 100 is classified to this service point.
service[37]>sp add sp-type snp int-type dot1q spid 10 interface radio slot 1 port 1 vlan 100 sp-name Radio
The following command adds an SAP service point with Service Point ID 7 to Service 36, with interface type dot1q. This service point is connected to Radio Group 1 (rp1). VLAN ID 100 is classified to the service point.
service[36]>sp add sp-type sap int-type dot1q spid 7 group rp1 vlan 100 sp-name test1
The following command adds a Pipe service point with Service Point ID 1 to Service 1, with interface type dot1q. This service point is located on Ethernet port 1.
service[1]>sp add sp-type pipe int-type dot1q spid 1 interface eth slot 1 port 1 sp-name pipe_dot1q
The following command adds a Pipe service point with Service Point ID 2 to Service 1, with interface type dot1q. This service point is located on Ethernet port 2.
service[1]>sp add sp-type pipe int-type dot1q spid 2 interface radio slot 1 port 2 sp-name pipe_dot1q_radio
The following commands create a Smart Pipe service between Ethernet port 1 and Multi-Carrier ABC group 1. This service carries S-VLANs and untagged frames between the two interfaces:
root> ethernet service add type p2p sid 10 admin operational evc-id test
description east_west
root>
root> ethernet service sid 10
service[10]>
service[10]>sp add sp-type pipe int-type s-tag spid 1 interface eth slot
1 port 1 sp-name test1
service[10]>
service[10]>sp add sp-type pipe int-type s-tag spid 2 group mc-abcl sp-name test2
service[10]>
Configuring Service Point Ingress Attributes (CLI)
A service point's ingress attributes are attributes that operate upon frames ingressing via the service point. This includes how the service point handles the CoS of ingress frames and how the service point forwards frames to their next destination within the service.
This section includes:
• Enabling and Disabling Broadcast Frames (CLI)
• CoS Preservation and Modification on a Service Point (CLI)
• Enabling and Disabling Flooding (CLI)
Enabling and Disabling Broadcast Frames (CLI)
To determine whether frames with a broadcast destination MAC address are allowed to ingress the service via this service point, go to service view for the service and enter the following command:
service[SID]>sp broadcast set spid <sp-id> state <state>
Table 189 Enable/Disable Broadcast Frames CLI Parameters
| Parameter | Input Type | Permitted Values | Description |
| sp-id Number | 1-32 for P2P and MP services. | The Service Point ID. | |
| 1-30 for MNG services. | |||
| state Variable Allow | disable | Determines whether frames with a broadcast destination MAC address are allowed to ingress the service via this service point. |
The following command allows frames with a broadcast destination MAC address to ingress Service 37 via Service Point 1.
service[37]>sp broadcast set spid 1 state allow
The following command prevents frames with a broadcast destination MAC address from ingressing Service 37 via Service Point 1.
service[37]>sp broadcast set spid 1 state disable
CoS Preservation and Modification on a Service Point (CLI)
The CoS of frames traversing a service can be modified on the logical interface, service point, and service level. The service point can override the CoS decision made at the interface level. The service, in turn, can modify the CoS decision made at the service point level.
To determine whether the service point modifies CoS decisions made at the interface level, go to service view for the service and enter the following command:
service[SID]> sp cos-mode set spid <sp-id> mode <cos mode>
Table 190 Service Point CoS Preservation CLI Parameters
| Parameter | Input Type | Permitted Values | Description |
| sp-id Number | 1-32 for P2P and MP services.1-30 for MNG services. | The Service Point ID. | |
| cos mode Variable | sp-def-cos interface-decision | sp-def-cos – The service point re-defines the CoS of frames that pass through the service point, according to the Default CoS (below). This decision can be overwritten on the service level.interface-decision – The service point preserves the CoS decision made at the interface level. This decision can still be overwritten at the service level. | |
If you set cos-mode to sp-def-cos, you must then configure a default CoS. This CoS is applied to frames that ingress the service point, but can be overwritten at the service level.
To configure the default CoS, go to service view for the service and enter the following command:
service[SID]>sp sp-def-cos set spid <sp-id> cos <cos>
Table 191 Service Point Default CoS CLI Parameters
| Parameter | Input Type | Permitted Values | Description |
| sp-id Number | 1-32 for P2P and MP services.1-30 for MNG services. | The Service Point ID. | |
| cos Number 0 – 7 | If cos-mode is sp-def-cos, this is the CoS assigned to frames that pass through the service point. This decision can be overwritten on the service level. |
The following commands configure Service Point 1 in Service 37 to apply a CoS value of 5 to frames that ingress the service point:
service[37]>sp cos-mode set spid 1 mode sp-def-cos
service[37]>sp sp-def-cos set spid 1 cos 5
The following command configures Service Point 1 in Service 37 to preserve the CoS decision made at the interface level for frames that ingress the service point:
service[37]>sp cos-mode set spid 1 mode interface-decision
Enabling and Disabling Flooding (CLI)
The ingress service point for a frame can forward the frame within the service by means of flooding or dynamic MAC address learning in the service.
To enable or disable forwarding by means of flooding for a service point, go to service view for the service and enter the following command:
service[SID]>sp flooding set spid <sp-id> state <flooding state>
Table 192 Service Point Enable/Disable Flooding CLI Parameters
| Parameter | Input Type | Permitted Values | Description |
| sp-id Number | 1-32 for P2P and MP services. | The Service Point ID. | |
| 1-30 for MNG services. | |||
| state Variable Allow | disable | Determines whether incoming frames with unknown MAC addresses are forwarded to other service points via flooding. |
The following command configures Service Point 1 in Service 37 to flood incoming frames with unknown MAC addresses to other service points:
service[37]>sp flooding set spid 1 state allow
The following command configures Service Point 1 in Service 37 not to flood incoming frames with unknown MAC addresses to other service points:
service[37]>sp flooding set spid 1 state disable
Configuring Service Point Egress Attributes (CLI)
A service point's egress attributes are attributes that operate upon frames ingressing via the service point. This includes VLAN preservation and marking attributes.
This section includes:
- Configuring VLAN and CoS Preservation (CLI)
- Configuring Service Bundles (CLI)
Configuring VLAN and CoS Preservation (CLI)
CoS and VLAN preservation determines whether the CoS and/or VLAN IDs of frames egressing the service via the service point are restored to the values they had when the frame entered the service.
This section includes:
- Configuring C-VLAN CoS Preservation (CLI)
- Configuring C-VLAN Preservation (CLI)
- Configuring S-VLAN CoS Preservation (CLI)
Configuring C-VLAN CoS Preservation (CLI)
To configure CoS preservation for C-VLAN-tagged frames, go to service view for the service and enter the following command:
service[SID]>sp cvlan-cos-preservation-mode set spid <sp-id> mode <c-vlan cos preservation mode>
Table 193 C-VLAN CoS Preservation Mode CLI Parameters
| Parameter | Input Type | Permitted Values | Description |
| sp-id Number | 1-32 for P2P and MP services.1-30 for MNG services. | The Service Point ID. | |
| c-vlan cos preservation mode | Variable | enable disable | Select enable or disable to determine whether the original C-VLAN CoS value is preserved or restored for frames egressing the service point.enable – the C-VLAN CoS value of frames egressing the service point is the same as the value when the frame entered the service.disable – the C-VLAN CoS value of frames egressing the service point is set at whatever value might have been re-assigned by the interface, service point, or service, or whatever value results from marking (see Configuring Marking (CLI)). |
The following command enables C-VLAN CoS preservation for Service Point 1 on Service 37:
service[37]>sp cvlan-cos-preservation-mode set spid 1 mode enable
The following command disables C-VLAN CoS preservation for Service Point 1 on Service 37:
service[37]>sp cvlan-cos-preservation-mode set spid 1 mode disable
Configuring C-VLAN Preservation (CLI)
To configure VLAN preservation for C-VLAN-tagged frames, go to service view for the service and enter the following command:
service[SID]>sp cvlan-preservation-mode set spid <sp-id> mode <cvlan preservation mode>
Table 194 C-VLAN Preservation CLI Parameters
| Parameter | Input Type | Permitted Values | Description |
| sp-id Number | 1-32 for P2P and MP services.1-30 for MNG services. | The Service Point ID. | |
| c-vlan preservation mode | Variable | enable disable | Determines whether the original C-VLAN ID is preserved or restored for frames egressing from the service point.enable – The C-VLAN ID of frames egressing the service point is the same as the C-VLAN ID when the frame entered the service.disable – The C-VLAN ID of frames egressing the service point is set at whatever value might have been re-assigned by the interface, service point, or service, or whatever value results from marking (see Configuring Marking (CLI)). |
The following command enables C-VLAN preservation for Service Point 1 on Service 37:
service[37]>sp cvlan-preservation-mode set spid 1 mode enable
The following command disables C-VLAN preservation for Service Point 1 on Service 37:
service[37]>sp cvlan-preservation-mode set spid 1 mode disable
Configuring S-VLAN CoS Preservation (CLI)
To configure CoS preservation for S-VLAN-tagged frames, go to service view for the service and enter the following command:
service[SID]>sp svlan-cos-preservation-mode set spid <sp-id> mode <svlan cos preservation mode>
Table 195 S-VLAN CoS Preservation CLI Parameters
| Parameter | Input Type | Permitted Values | Description |
| sp-id Number | 1-32 for P2P and MP services.1-30 for MNG services. | The Service Point ID. | |
| s-vlan cos preservation mode | Variable | enable disable | Select enable or disable to determine whether the original S-VLAN CoS value is preserved or restored for frames egressing the service point.enable – the S-VLAN CoS value of frames egressing the service point is the same as the value when the frame entered the service.disable – the S-VLAN CoS value of frames egressing the service point is set at whatever value might have been re-assigned by the interface, service point, or service, or whatever value results from marking (see Configuring Marking (CLI)). |
The following command enables S-VLAN CoS preservation for Service Point 1 on Service 37:
service[37]>sp svlan-cos-preservation-mode set spid 1 mode enable
The following command disables S-VLAN CoS preservation for Service Point 1 on Service 37:
service[37]>sp svlan-cos-preservation-mode set spid 1 mode disable
Configuring Service Bundles (CLI)
You can use service bundles to personalize common sets of egress queue attributes that can be applied to multiple service points. In this version only one service bundle is supported.
To assign a service point to a service bundle, go to service view for the service and enter the following command:
service[SID]>sp egress-service-bundle set spid 1 service-bundle-id <service-bundle-id>
Table 196 Service Bundle CLI Parameters
| Parameter | Input Type | Permitted Values | Description |
| sp-id Number | 1-32 for P2P and MP services.1-30 for MNG services. | The Service Point ID. | |
| service-bundle-id | Number 1 – 63 | Note: In the current release, only Service Bundle 1 is supported. | The service bundle assigned to the service point. |
The following command assigns Service Bundle 1 to Service Point 1 in Service 37.
service[37]>sp egress-service-bundle set spid 1 service-bundle-id 1
Attaching a VLAN Bundle to a Service Point (CLI)
For service points with an interface type of bundle-C-tag or bundle-S-tag, you must classify a group of VLANs (VLAN Bundle) to the service point.
To classify a VLAN Bundle to a bundle-c-tag or bundle s-tag service point, go to service view for the service and enter the following command:
service[SIP]>sp bundle cvlan attach spid
To remove a VLAN Bundle from a bundle-c-tag or bundle-s-tag service point, go to service view for the service and enter the following command:
service[SIP]>sp bundle cvlan remove spid
Table 197 VLAN Bundle to Service Point CLI Parameters
| Parameter | Input Type | Permitted Values | Description |
| sp-id Number | 1-32 for P2P and MP services.1-30 for MNG services. | This ID is unique within the service. | |
| vlan Number 1-4094 | The C-VLAN at the beginning of the range of the VLAN Bundle. | ||
| to-vlan Number 1-4094 | The C-VLAN at the end of the range of the VLAN Bundle. |
The following command classifies C-VLANs 100 through 200 to Service Point 1 in Service 37:
service[37]>sp bundle cvlan attach spid 1 vlan 100 to-vlan 200
The following command removes C-VLANs 100 through 200 from Service Point 1 in Service 37:
service[37]>sp bundle cvlan remove spid 1 vlan 100 to-vlan 200
Displaying Service Point Attributes (CLI)
To display a service point's attributes, go to service view for the service to which the service point belongs and enter the following command:
service[SID]>sp service-point-info show spid <sp-id>
Table 198 Display Service Point Attributes CLI Parameters
| Parameter | Input Type | Permitted Values | Description |
| sp-id | Number | 1-32 for P2P and MP services.1-30 for MNG services. | The Service Point ID. |
The following command displays the attributes of Service Point 1 in Service 37:
service[37]>sp service-point-info show spid 1
Deleting a Service Point (CLI)
You can only delete a service point if no VLAN bundles are attached to the service point. This is only relevant if the interface type of the service point is bundle-c-tag or bundle-s-tag. For more information, refer to Attaching a VLAN Bundle to a Service Point (CLI).
To delete a service point from a service, go to service view for the service and enter the following command:
service[SID]>sp delete spid <sp-id>
The following command deletes Service Point 10 from Service 37:
service[37]>sp delete spid 10
Defining the MAC Address Forwarding Table for a Service (CLI)
This section includes:
• MAC Address Forwarding Table Overview (CLI)
- Setting the Maximum Size of the MAC Address Forwarding Table (CLI)
- Setting the MAC Address Forwarding Table Aging Time (CLI)
- Adding a Static MAC Address to the Forwarding Table (CLI)
• Displaying the MAC Address Forwarding Table (CLI)
- Flushing the MAC Address Forwarding Table (CLI)
• Enabling MAC Address Learning on a Service Point (CLI)
MAC Address Forwarding Table Overview (CLI)
PTP 820G and PTP 820F performs MAC address learning per service. PTP 820G and PTP 820F can learn up to 131,072 MAC addresses.
If necessary due to security issues or resource limitations, you can limit the size of the MAC address forwarding table. The maximum size of the MAC address forwarding table is configurable per service in granularity of 16 entries.
When a frame arrives via a specific service point, the learning mechanism checks the MAC address forwarding table for the service to which the service point belongs to determine whether that MAC address is known to the service. If the MAC address is not found, the learning mechanism adds it to the table.
In parallel with the learning process, the forwarding mechanism searches the service's MAC forwarding table for the frame's MAC address. If a match is found, the frame is forwarded to the service point associated with the MAC address. If not, the frame is flooded to all service points in the service.
Setting the Maximum Size of the MAC Address Forwarding Table (CLI)
To limit the size of the MAC address forwarding table for a specific service, go to service view for the service and enter the following command:
service[SID]>service mac-limit-value set
Table 199 MAC Address Forwarding Table Maximum Size CLI Parameters
| Parameter | Input Type | Permitted Values | Description |
| mac limit Number | 16 to 131,072, in multiples of 16 | The maximum MAC address table size for the service. This maximum only applies to dynamic, not static, MAC address table entries. | |
The following command limits the number of dynamic MAC address forwarding table entries for Service 10 to 128:
service[10]>service mac-limit-value set 128
Setting the MAC Address Forwarding Table Aging Time (CLI)
You can configure a global aging time for dynamic entries in the MAC address forwarding table. Once this aging time expires for a specific table entry, the entry is erased from the table.
To set the global aging time for the MAC address forwarding table, enter the following command:
root> ethernet service learning-ageing-time set time <time>
Table 200 MAC Address Forwarding Table Aging Time CLI Parameters
| Parameter | Input Type | Permitted Values | Description |
| time | Number | 15 - 3825 | The global aging time for the MAC address forwarding table, in seconds. |
The following command sets the global aging time to 2500 seconds:
root> ethernet service learning-ageing-time set time 2500
To display the global aging time for the MAC address forwarding table, enter the following command:
root> ethernet service learning-ageing-time show
Adding a Static MAC Address to the Forwarding Table (CLI)
You can add static entries to the MAC forwarding table. The global aging timer does not apply to static entries, and they are not counted with respect to the maximum size of the MAC address forwarding table. It is the responsibility of the user not to use all the entries in the table if the user also wants to utilize dynamic MAC address learning.
To add a static MAC address to the MAC address forwarding table, go to service view for the service to which you want to add the MAC address and enter the following command:
service[SID]>service mac-learning-table set-static-mac <static mac> spid <sp-id>
To delete a static MAC address from the MAC address forwarding table, go to service view for the service from which you want to delete the MAC address and enter the following command:
service[SID]>service mac-learning-table del-static-mac <static mac> spid <sp-id>
Table 201 Adding Static Address to MAC Address Forwarding Table CLI Parameters
| Parameter | Input Type | Permitted Values | Description |
| static mac | Six groups of two hexadecimal digits | The MAC address. | |
| sp-id | Number | 1-32 | The Service Point ID of the service point associated with the MAC address. |
The following command adds MAC address 00:11:22:33:44:55 to the MAC address forwarding table for Service 10, and associates the MAC address with Service Point ID 1 on Service 10:
service[10]>service mac-learning-table set-static-mac 00:11:22:33:44:55 spid 1
The following command deletes MAC address 00:11:22:33:44:55, associated with Service Point 1, from the MAC address forwarding table for Service 10:
service[10]>service mac-learning-table del-static-mac 00:11:22:33:44:55 spid 1
Displaying the MAC Address Forwarding Table (CLI)
You can display the MAC address forwarding table for an interface, a service, or for the entire unit.
To display the MAC address forwarding table for a service, go to service view for the service and enter the following command:
service[SID]>service mac-learning-table show
To display the MAC address forwarding table for an interface, go to interface view for the interface and enter the following command:
eth type xxx[x/x]>mac-learning-table show
To display the MAC address forwarding table for the entire unit, enter the following command:
root> ethernet generalcfg mac-learning-table show
For example, to display the MAC address forwarding table for GbE 1, enter the following commands:
root> ethernet interfaces eth slot 1 port 1
eth type eth[1/1]>mac-learning-table show
Flushing the MAC Address Forwarding Table (CLI)
You can perform a global flush on the MAC address forwarding table. This erases all dynamic entries for all services. Static entries are not erased.

Note
The ability to flush the MAC address forwarding table per-service and per-interface is planned for future release.
To perform a global flush of the MAC address forwarding table, enter the following command:
root> ethernet service mac-learning-table set global-flush
Enabling MAC Address Learning on a Service Point (CLI)
You can enable or disable MAC address learning for specific service points. By default, MAC learning is enabled.
To enable or disable MAC address learning for a service point, go to service view for the service and enter the following command:
service[SID]>sp learning-state set spid
Table 202 Enabling MAC Address Learning CLI Parameters
| Parameter | Input Type | Permitted Values | Description |
| sp-id Number | 1-32 for P2P and MP services.1-30 for MNG services. | The Service point ID. | |
| learning Variable | enable disable | Select enable or disable to enable or disable MAC address learning for frames that ingress via the service point. When enabled, the service point learns the source MAC addresses of incoming frames and adds them to the MAC address forwarding table. |
The following command enables MAC address learning for Service Point 1 on Service 37:
service[37]>sp learning-state set spid 1 learning enable
The following command disables MAC address learning for Service Point 1 on Service 37:
service[37]>sp learning-state set spid 1 learning disable
Setting the MRU Size and the S-VLAN Ethertype (CLI)
The following parameters are configured globally for the PTP 820G switch:
- S-VLAN Ethertype – Defines the ethertype recognized by the system as the S-VLAN ethertype.
- C-VLAN Ethertype – Defines the ethertype recognized by the system as the C-VLAN ethertype. PTP 820G and PTP 820F supports 0x8100 as the C-VLAN ethertype.
- MRU – The maximum segment size defines the maximum receive unit (MRU) capability and the maximum transmit capability (MTU) of the system. You can configure a global MRU for the system.

Note
The MTU is determined by the receiving frame and editing operation on the frame.
This section includes:
- Configuring the S-VLAN Ethertype (CLI)
- Configuring the C-VLAN Ethertype (CLI)
- Configuring the MRU (CLI)
Configuring the S-VLAN Ethertype (CLI)
To configure the S-VLAN Ethertype, enter the following command in root view:
root> ethernet generalcfg ethertype set svlan-value <ethertype>
To display the system S-VLAN ethertype, enter the following command in root view:
root> ethernet generalcfg ethertype show svlan
Table 203 Configure S-VLAN Ethertype CLI Parameters
| Parameter | Input Type | Permitted Values | Description |
| ethertype | Hexadecimal 0x8100 | Defines the ethertype recognized by the system as the S-VLAN ethertype. | |
| 0x88a8 | |||
| 0x9100 | |||
| 0x9200 |
For example, the following command sets the system S-VLAN ethertype to 0x88a8:
root> ethernet generalcfg ethertype set svlan-value 0x88a8
Configuring the C-VLAN Ethertype (CLI)
The system C-VLAN Ethertype is set by the system as 0x8100.
To display the system C-VLAN ethertype, enter the following command in root view:
root> ethernet generalcfg ethertype show cvlan
Configuring the MRU (CLI)
To define the global size (in bytes) of the Maximum Receive Unit (MRU), enter the following command in root view:
root> ethernet generalcfg mru set size <size>
To display the system MRU, enter the following command in root view:
root> ethernet generalcfg mru show
Table 204 Configure MRU CLI Parameters
| Parameter | Input Type | Permitted Values | Description |
| size Number 64 to 9612 | Defines the global size (in bytes) of the Maximum Receive Unit (MRU). Frames that are larger than the global MRU will be discarded. | ||
For example, the following command sets the system MRU to 9612:
root> ethernet generalcfg mru set size 9612
Configuring Ethernet Interfaces (CLI)
PTP 820G and PTP 820F's switching fabric distinguishes between physical interfaces and logical interfaces. Physical and logical interfaces serve different purposes in the switching fabric. In some cases, a physical interface corresponds to a logical interface on a one-to-one basis. For some features, such as 1+1 protection, a group of physical interfaces can be joined into a single logical interface.
The basic interface characteristics, such as media type, port speed, duplex, and auto-negotiation, are configured on the physical interface level. Ethernet services, QoS, VLAN Ethertype, and OAM characteristics are configured on the logical interface level.
This section includes:
- Entering Interface View (CLI)
- Displaying the Operational State of the Interfaces in the Unit (CLI)
• Viewing Interface Attributes (CLI) - Configuring an Interface's Media Type (CLI)
- Configuring an Interface's Speed and Duplex State (CLI)
- Configuring an Interface’s Auto Negotiation State (CLI)
- Configuring an Interface's IFG (CLI)
- Configuring an Interface's Preamble (CLI)
- Adding a Description for the Interface (CLI)
Related Topics:
• Enabling the Interfaces (Interface Manager) (CLI)
• Performing Ethernet Loopback (CLI)
• Configuring Ethernet Services (CLI)
• Quality of Service (QoS) (CLI)
Entering Interface View (CLI)
To view interface details and set the interface's parameters, you must enter the interface's view level in the CLI. Use the following command to enter an Ethernet interface's view level:
root> ethernet interfaces eth slot <slot> port <port>
Use the following command to enter the radio interface's view level:
root> ethernet interfaces radio slot <slot> port <port>
Use the following command to enter the view level of a group, such as a Multi-Carrier ABC group, an HSB protection group, or a LAG:
root> ethernet interfaces group <group>
Table 205 Entering Interface View CLI Parameters
| Parameter | Input Type | Permitted Values | Description |
| slot Number 1 | |||
| port Number | ethernet: 1-6radio: 1-2management: 1-2tdm: 1 | The port number of the interface. | |
For example, the following command enters interface view for Ethernet port 3:
root> ethernet interfaces eth slot 1 port 3
The following prompt appears:
eth type eth [1/3]>
The exact prompt depends on the type of interface. For example:
• Radio interface: eth type radio [x/x]>
• Group interface (e.g., 1+1 HSB-SD group): eth type group [x/x]
• TDM interface: eth type pwe [x/x] >
For simplicity, the examples in the following sections show the prompt for an Ethernet interface.
Displaying the Operational State of the Interfaces in the Unit (CLI)
To display a list of all interfaces in the unit and their operational states, enter the following command:
root> platform if-manager show interfaces
The following is a sample output of this command:
root> platform if-manager show interfaces
| Interface type | | slot | port | Type | Description | Admin status | Operational status | Secondary operational-status | Last change | Connector Present | Speed | MTU | MAC address | |
| ethernet | 1 | 1 | 6 | Ethernet | down | down | RX LOS/LOC Interface not ready | 01-01-1970,00:00:01 | false | 1000000000 | 2000 | 01a:25:40:1f:93 |
| ethernet | 1 | 2 | 6 | Cascading | down | down | RX LOS/LOC Interface not ready | 01-01-1970,00:00:01 | false | 1000000000 | 2000 | 01a:25:40:1f:94 |
| ethernet | 1 | 5 | 6 | Ethernet | down | down | RX LOS/LOC Interface not ready | 01-01-1970,00:00:01 | false | 1000000000 | 2000 | 01a:25:40:1f:95 |
| ethernet | 1 | 6 | 6 | Ethernet | down | down | RX LOS/LOC Interface not ready | 01-01-1970,00:00:01 | false | 1000000000 | 2000 | 01a:25:40:1f:96 |
| radio | 1 | 1 | 1 | Radio | up | down | Rx LOF/LOP | 01-01-1970,00:00:01 | false | 39978000 | 2000 | 01a:25:40:1f:8f |
| radio | 1 | 2 | 1 | Radio | up | down | Rx LOF/LOP | 01-01-1970,00:00:01 | false | 39978000 | 2000 | 01a:25:40:1f:90 |
| management | 1 | 1 | 6 | Management | up | up | Clear | 12-04-2015,09:21:22 | false | 100000000 | 1632 | 010:10:10:10 |
| management | 1 | 2 | 6 | Management | down | down | RX LOS/LOC | 01-01-1970,00:00:01 | false | 10000000 | 1632 | 010:10:10:10 |
| synch | 1 | 1 | 1 | Synchronization | down | down | RX LOS/LOC | 01-01-1970,00:00:01 | false | 2048000 | 0 | 010:10:10:10 |
| tdm | 1 | 1 | 1 | pw-eth-port | up | up | Clear | 12-04-2015,09:22:30 | false | 1000000000 | 2000 | 01a:25:40:1f:a3 |
| group | 68 | 1 | 1 | HSS 1=1 | up | down | Clear | 01-01-1970,00:00:01 | true | 39978000 | 2000 | 01a:25:40:1f:8f |
| group | 68 | 2 | 1 | HSS 1=1 | up | down | Clear | 01-01-1970,00:00:01 | true | 40978000 | 2000 | 01a:25:40:1f:9L |
root>
Viewing Interface Attributes (CLI)
To display an interface's attributes, go to interface view for the interface and enter the following command:
eth type eth [x/x]>summary show
To display an interface's current operational state (up or down), go to interface view for the interface and enter the following command:
eth type eth [x/x]>operational state show
The following command shows the operational state of GbE 1:
eth type eth [1/1]>operational state show
Configuring an Interface's Media Type (CLI)
The Media Type attribute defines the physical interface Layer 1 media type. Permitted values are RJ-45 and SFP. Auto Type is only relevant for Ethernet interfaces. When Auto Type is selected, the system detects whether the optical or electrical port is being used. Auto Type can only be used when the interface speed is set to 1000 Mbps.
To configure an Ethernet interface's Media Type, go to interface view for the interface and enter the following command:
eth type eth [x/x]>media-type state set <media type>
Table 206 Interface Media Type CLI Parameters
| Parameter | Input Type | Permitted Values | Description |
| media type | Variable | auto-type | Select the physical interface layer 1 media type: |
| rj45 | |||
| sfp | auto-type – Only relevant for Ethernet interfaces. The system detects whether the optical or electrical port is being used. Auto-type can only be used when the interface speed is set to 1000 Mbps. | ||
| RJ45 – An electrical (RJ-45) Ethernet interface. | |||
| SFP – An optical (SFP) Ethernet interface. |
The following command sets Ethernet port 1 to auto-type:
eth type eth [1/1]>media-type state set auto-type
Configuring an Interface's Speed and Duplex State (CLI)
To configure an Ethernet interface's maximum speed and duplex state, go to interface view for the interface and enter the following command:
eth type eth [x/x]>speed-and-duplex state set <speed-and-duplex state>
Table 207 Interface Speed and Duplex State CLI Parameters
| Parameter | Input Type | Permitted Values | Description |
| speed-and-duplex state | Variable '10hd' | This parameter sets the maximum speed and the duplex state of the interface. For RJ-45 interfaces, any of the permitted values can be configured. For SFP interfaces, only '1000fd' is supported. | |
| '10fd' | |||
| '100hd' | |||
| '100fd' | |||
| '1000fd' |

Note
10HD is not supported in the current release.
The following command sets GbE 1 to 100 Mbps, full duplex:
eth type eth [1/1]>speed-and-duplex state set '100fd'

Note
Before performing this command, you must verify that the media-type attribute is set to rj45.
The following command sets GbE 1 to 1000 Mbps, full duplex:
eth type eth [1/1]>speed-and-duplex state set '1000fd'
Configuring an Interface's Auto Negotiation State (CLI)
To configure an Ethernet interface's auto-negotiation state, go to interface view for the interface and enter the following command:
eth type eth [x/x]>autoneg state set <autoneg state>
Table 208 Interface Auto Negotiation State CLI Parameters
| Parameter | Input Type | Permitted Values | Description |
| autoneg state | Variable On | off | Enables or disables auto-negotiation on the physical interface. |
The following command enables auto negotiation for Ethernet port 4:
eth type eth [1/4]>autoneg state set on
Configuring an Interface's IFG (CLI)
The IFG attribute represents the physical port Inter-frame gap. Although you can modify the IFG field length, it is strongly recommended not to modify the default value of 12 bytes without a thorough understanding of how the modification will impact traffic.
To configure an Ethernet interface's IFG, go to interface view for the interface and enter the following command:
eth type eth [x/x]>ifg set <ifg>
Table 209 Interface IFG CLI Parameters
| Parameter | Input Type | Permitted Values | Description |
| ifg | Number | 6 - 15 | Sets the interface’s IFG (in bytes). |
The following command sets the ifg for Ethernet port 3 to 12:
eth type eth [1/3]>ifg set 12
The following displays the currently configured ifg for Ethernet port 1:
eth type eth [1/1]>ifg get
Configuring an Interface's Preamble (CLI)
Although you can modify an Ethernet interface's preamble, it is strongly recommended not to modify the default value of 8 bytes without a thorough understanding of how the modification will impact traffic.
To configure an Ethernet interface's preamble, go to interface view for the interface and enter the following command:
eth type eth [x/x]>preamble set <preamble>
Table 210 Interface Preamble CLI Parameters
| Parameter | Input Type | Permitted Values | Description |
| preamble | Number | 6 - 15 | Sets the interface’s preamble (in bytes). |
The following command sets the preamble for Ethernet port 6 to 8:
eth type eth [1/6]>preamble set 8
The following command displays the current preamble for Ethernet port 5:
eth type eth [1/5]>preamble get
Adding a Description for the Interface (CLI)
You can add a text description for an interface. To add a description, go to interface view for the interface and enter the following command:
eth type eth [x/x]>description set <description>
To delete a description, go to interface view for the interface and enter the following command:
eth type eth [x/x]>description delete
To display an interface's description, go to interface view for the interface and enter the following command:
eth type eth [x/x]>description show
Table 211 Interface Description CLI Parameters
| Parameter | Input Type | Permitted Values | Description |
| description | Text String | Up to 40 characters | Adds a text description to the interface. |
The following command adds the description "Line" to Ethernet port 2:
eth type eth [1/2]>description set Line
Configuring Automatic State Propagation and Link Loss Forwarding (CLI)
Automatic state propagation enables propagation of radio failures back to the Ethernet port. You can also configure Automatic State Propagation to close the Ethernet port based on a radio failure at the remote carrier. Automatic state propagation is configured as pairs of interfaces. Each interface pair includes a Monitored Interface and a Controlled Interface. The Monitored Interface is a radio or TDM interface, or a radio protection or Multi-Carrier ABC group. The Controlled Interface is an Ethernet interface LAG. Only one ASP pair can be configured per radio or TDM interface or radio protection or Multi-Carrier ABC group, and only one ASP pair can be configured per Ethernet interface.

Note
A radio interface that belongs to a LAG group cannot be used as monitored interface.
Each Controlled Interface is assigned an LLF ID. If ASP trigger by remote fault is enabled on the remote side of the link, the ASP state of the Controlled Interface is propagated to the Controlled Interface with the same LLF ID at the remote side of the link. This means if ASP is triggered locally, it is propagated to the remote side of the link, but only to Controlled Interfaces with LLF IDs that match the LLF IDs of the affected Controlled Interfaces on the local side of the link.

Note
It is recommended to configure both ends of the link to the same Automatic State Propagation configuration.
Configuring Automatic State Propagation to an Ethernet Port (CLI)
To configure propagation of a radio interface failure to an Ethernet port, use the following commands:
root> auto-state-propagation add eth-port-to-radio eth-slot <eth-slot>
eth-port <eth-port> radio-slot <radio-slot> radio-port <radio-port>
To enable automatic state propagation on an Ethernet port and determine whether remote interface failures are also propagated, use the following command:
root> auto-state-propagation configure eth-port eth-slot <eth-slot> eth-port <eth-port> asp-admin <asp-admin> remote-fault-trigger-admin <remote-fault-trigger-admin> csf-mode-admin <csf-mode-admin>
To delete automatic state propagation on an Ethernet port, use the following command:
root> auto-state-propagation delete eth-port eth-slot <eth-slot> eth-port <eth-port>
To display all automatic state propagation configurations on the unit, use the following command:
root> auto-state-propagation show-config all
To display the automatic state propagation configuration for a specific Ethernet port, use the following command:
root> auto-state-propagation show-config eth-port eth-slot
Table 212 Automatic State Propagation to an Ethernet Port CLI Parameters
| Parameter | Input Type | Permitted Values | Description |
| eth-slot Number 1 | |||
| eth-port Number 1-6 | The interface to which you want to propagate faults from the selected radio or group. | ||
| radio-slot Number 1 | |||
| radio-port | Number | 1-2 | The radio interface. |
| multi-radio-group | Number 1-4 | The Multi-Carrier ABC group failure of which is propagated to the defined interface. | |
| protection-group | Number 1-4 | The HSB protection group failure of which is propagated to the defined interface. | |
| asp-admin Variable | enable disable | Enables or disables automatic state propagation on the Ethernet interface. | |
| remote-fault-trigger-admin | Variable | enable disable | Determines whether faults on the remote radio interface or group are propagated to the local Ethernet interface. |
| csf-mode-admin | Variable | enable disable | Enables or disables Client Signal Failure (CSF) mode. In CSF mode, the ASP mechanism does not physically shut down the Controlled Interface when ASP is triggered. Instead, the ASP mechanism sends a failure indication message (a CSF message). The CSF message is used to propagate the failure indication to external equipment. |
The following commands configure and enable automatic state propagation to propagate faults from radio interface 2 to Ethernet port 1. Faults on the remote carrier are also propagated to Ethernet port 1. CSF mode is disabled.
root> auto-state-propagation add eth-port-to-radio eth-slot 1 eth-port 1 radio-slot 1 radio-port 2
root> auto-state-propagation configure eth-port eth-slot 1 eth-port 1 asp-admin enable remote-fault-trigger-admin enable csf-mode-admin disable
The following commands configure and enable automatic state propagation to propagate faults from Multi-Carrier ABC group 1 to Ethernet port 1. Faults on the remote carrier are also propagated to Ethernet port 1. CSF mode is disabled.
root> auto-state-propagation add eth-port-to-multi-radio-group eth-slot 1
eth-port 1 multi-radio-group 1
root> auto-state-propagation configure eth-port eth-slot 1 eth-port 1
asp-admin enable remote-fault-trigger-admin enable csf-mode-admin disable
The following commands configure and enable automatic state propagation to propagate faults from 1+1 HSB protection group 1 to Ethernet port 2. Faults on the remote carrier are not propagated to Ethernet port 2. CSF mode is disabled.
root> auto-state-propagation add eth-port-to-protection-group eth-slot 1
eth-port 2 protection-group 1

root> auto-state-propagation configure eth-port eth-slot 1 eth-port 2
asp-admin enable remote-fault-trigger-admin disable csf-mode-admin
disable
The following commands configure and enable automatic state propagation to propagate faults from radio interface 2 to LAG group 1. Faults on the remote carrier are also propagated to LAG group 1. CSF mode is disabled.
root> auto-state-propagation add lag-to-radio lag-id 1 radio-slot 1
radio-port 2

root> auto-state-propagation configure lag lag-id 1 asp-admin enable
remote-fault-trigger-admin enable csf-mode-admin disable
Viewing Ethernet PMs and Statistics (CLI)
PTP 820G and PTP 820F stores and displays statistics in accordance with RMON and RMON2 standards. You can display various peak TX and RX rates (per second) and average TX and RX rates (per second), both in bytes and in packets, for each measured time interval. You can also display the number of seconds in the interval during which TX and RX rates exceeded the configured threshold.
This section includes:
• Displaying RMON Statistics (CLI)
- Configuring Ethernet Port PMs and PM Thresholds (CLI)
• Displaying Ethernet Port PMs (CLI)
• Clearing Ethernet Port PMs (CLI)
Displaying RMON Statistics (CLI)
To display RMON statistics for a physical interface, go to interface view for the interface and enter the following command:
eth type eth [x/x]>rmon statistics show clear-on-read <clear-on-read>
layer-1 <layer-1>
Table 213 RMON Statistics CLI Parameters
| Parameter | Input Type | Permitted Values | Description |
| clear-on-read | Boolean Yes | no | If you enter yes, the statistics are cleared once you display them. |
| layer-1 | Boolean Yes | no | yes – Statistics are represented as Layer 1 statistics, including preamble and IFG.no – Statistics are represented as Layer 2 statistics. |
The following commands bring you to interface view for Ethernet port 1, and clears the statistics after displaying them.
root> ethernet interfaces eth slot 1 port 1
eth type eth [1/1]>rmon statistics show clear-on-read yes layer-1 yes
The following commands bring you to interface view for radio interface 2, without clearing the statistics.
root> ethernet interfaces radio slot 2 port 1
eth type radio[2/2]>rmon statistics show clear-on-read no layer-1 no
Configuring Ethernet Port PMs and PM Thresholds (CLI)
To enable the gathering of PMs for an Ethernet interface, go to interface view for the interface and enter the following command:
eth type eth [x/x]> pm set admin <enable|disable>
You can configure thresholds and display the number of seconds these thresholds were exceeded during a specified interval.
To configure interface PM thresholds, go to interface view for the interface and enter the following command:
eth type eth [x/x]> pm set thresholds rx-layer1-rate-threshold <0-4294967295> tx-layer1-rate-threshold <0-4294967295>
To display whether or not PM gathering is enabled for an Ethernet interface, as well as the configured thresholds, go to interface view for the interface and enter the following command:
eth type eth [x/x]> pm show configuration
Table 214 Port PM Thresholds CLI Parameters
| Parameter | Input Type | Permitted Values | Description |
| rx-layer1-rate-thershold | Number 0-4294967295 | The exceed threshold for port RX PMs, in bytes per second. | |
| tx-layer1-rate-thershold | Number 0-4294967295 | The exceed threshold for port TX PMs, in bytes per second. | |
The following commands bring you to interface view for Ethernet port 1, enable PM gathering, and set the thresholds for RX and TX PMs at 1,000,000,000 bytes per second:
root> ethernet interfaces eth slot 1 port 1
eth type eth [1/1]>pm set admin enable
eth type eth [1/1]>pm set thresholds rx-layer1-rate-threshold 1000000000
tx-layer1-rate-threshold 1000000000
Displaying Ethernet Port PMs (CLI)
To display RX packet PMs in 15-minute intervals, go to interface view for the interface and enter the following command:
eth type eth [x/x]> pm show rx-packets interval 15min
To display RX packet PMs in 24-hour intervals, go to interface view for the interface and enter the following command:
eth type eth [x/x]> pm show rx-packets interval 24hr
To display RX broadcast packet PMs in 15-minute intervals, go to interface view for the interface and enter the following command:
eth type eth [x/x]> pm show rx-bcast-packets interval 15min
To display RX broadcast packet PMs in 24-hour intervals, go to interface view for the interface and enter the following command:
eth type eth [x/x]> pm show rx-bcast-packets interval 24hr
To display RX multicast packet PMs in 15-minute intervals, go to interface view for the interface and enter the following command:
eth type eth [x/x]> pm show rx-mcast-packets interval 15min
To display RX multicast packet PMs in 24-hour intervals, go to interface view for the interface and enter the following command:
eth type eth [x/x]> pm show rx-mcast-packets interval 24hr
To display Layer 1 RX PMs, in bytes per second, in 15-minute intervals, go to interface view for the interface and enter the following command:
eth type eth [x/x]> pm show rx-bytes-layer1 interval 15min
To display Layer 1 RX PMs, in bytes per second, in 24-hour intervals, go to interface view for the interface and enter the following command:
eth type eth [x/x]> pm show rx-bytes-layer1 interval 24hr
To display Layer 2 RX PMs, in bytes per second, in 15-minute intervals, go to interface view for the interface and enter the following command:
eth type eth [x/x]> pm show rx-bytes-layer2 interval 15min
To display Layer 2 RX PMs, in bytes per second, in 24-hour intervals, go to interface view for the interface and enter the following command:
eth type eth [x/x]> pm show rx-bytes-layer2 interval 24hr
To display TX packet PMs in 15-minute intervals, go to interface view for the interface and enter the following command:
eth type eth [x/x]> pm show tx-packets interval 15min
To display TX packet PMs in 24-hour intervals, go to interface view for the interface and enter the following command:
eth type eth [x/x]> pm show tx-packets interval 24hr
To display TX broadcast packet PMs in 15-minute intervals, go to interface view for the interface and enter the following command:
eth type eth [x/x]> pm show tx-bcast-packets interval 15min
To display TX broadcast packet PMs in 24-hour intervals, go to interface view for the interface and enter the following command:
eth type eth [x/x]> pm show tx-bcast-packets interval 24hr
To display TX multicast packet PMs in 15-minute intervals, go to interface view for the interface and enter the following command:
eth type eth [x/x]> pm show tx-mcast-packets interval 15min
To display TX multicast packet PMs in 24-hour intervals, go to interface view for the interface and enter the following command:
eth type eth [x/x]> pm show tx-mcast-packets interval 24hr
To display Layer 1 TX PMs, in bytes per second, in 15-minute intervals, go to interface view for the interface and enter the following command:
eth type eth [x/x]> pm show tx-bytes-layer1 interval 15min
To display Layer 1 TX PMs, in bytes per second, in 24-hour intervals, go to interface view for the interface and enter the following command:
eth type eth [x/x]> pm show tx-bytes-layer1 interval 24hr
To display Layer 2 TX PMs, in bytes per second, in 15-minute intervals, go to interface view for the interface and enter the following command:
eth type eth [x/x]> pm show tx-bytes-layer2 interval 15min
To display Layer 2 TX PMs, in bytes per second, in 24-hour intervals, go to interface view for the interface and enter the following command:
eth type eth [x/x]> pm show tx-bytes-layer2 interval 24hr
Table 215 Ethernet Port PMs
| Parameter Definition | |
| Interval | For 24-hour intervals, displays the date of the interval. For 15-minute intervals, displays the date and ending time of the interval. |
| Invalid data flag | Indicates whether the values received during the measured interval are valid. An x in the column indicates that the values are not valid (for example, because of a power surge or power failure that occurred during the interval). |
| Peak RX Packets | The peak rate of RX packets per second for the measured time interval. |
| Average RX Packets | The average rate of RX packets per second for the measured time interval. |
| Peak RX Broadcast Packets | The peak rate of RX broadcast packets per second for the measured time interval. |
| Average RX Broadcast Packets | The average rate of RX broadcast packets per second for the measured time interval. |
| Peak RX Multicast Packets | The peak rate of RX multicast packets per second for the measured time interval. |
| Average RX Multicast Packets | The average rate of RX multicast packets per second for the measured time interval. |
| Peak RX Bytes in Layer1 | The peak RX rate, in bytes per second, for the measured time interval (including preamble and IFG). |
| Average RX Bytes in Layer1 | The average RX rate, in bytes per second, for the measured time interval (including preamble and IFG). |
| RX Bytes Layer1 Exceed Threshold (sec) | The number of seconds during the measured time interval that the RX rate exceeded the configured threshold. |
| Peak RX Bytes in Layer2 | The peak RX rate, in bytes per second, for the measured time interval (excluding preamble and IFG). |
| Average RX Bytes in Layer2 | The average RX rate, in bytes per second, for the measured time interval (excluding preamble and IFG). |
| Peak TX Packets | The peak rate of TX packets per second for the measured time interval. |
| Average TX Packets | The average rate of TX packets per second for the measured time interval. |
| Peak TX Broadcast Packets | The peak rate of TX broadcast packets per second for the measured time interval. |
| Average TX Broadcast Packets | The average rate of TX broadcast packets per second for the measured time interval. |
| Peak TX Multicast Packets | The peak rate of TX multicast packets per second for the measured time interval. |
| Average TX Multicast Packets | The average rate of TX multicast packets per second for the measured time interval. |
| Peak TX Bytes in Layer1 | The peak TX rate, in bytes per second, for the measured time interval (including preamble and IFG). |
| Average TX Bytes in Layer1 | The average TX rate, in bytes per second, for the measured time interval (including preamble and IFG). |
| TX Bytes Layer1 Exceed Threshold (sec) | The number of seconds during the measured time interval that the TX rate exceeded the configured threshold. |
| Peak TX Bytes in Layer2 | The peak TX rate, in bytes per second, for the measured time interval (excluding preamble and IFG). |
| Average TX Bytes in Layer2 | The average TX rate, in bytes per second, for the measured time interval (excluding preamble and IFG). |
Clearing Ethernet Port PMs (CLI)
To clear all PMs for an Ethernet interface, go to interface view for the interface and enter the following command:
eth type eth [x/x]> pm clear-all
Chapter 19: Quality of Service (QoS) (CLI)
This section includes:
- Configuring Classification (CLI)
- Configuring Policers (Rate Metering) (CLI)
- Configuring Marking (CLI)
- Configuring WRED (CLI)
- Configuring Shapers (CLI)
- Configuring Scheduling (CLI)
• Displaying Egress Statistics (CLI)
Configuring Classification (CLI)
This section includes:
• Classification Overview (CLI)
- Configuring Ingress Path Classification on a Logical Interface (CLI)
- Configuring VLAN Classification and Override (CLI)
- Configuring 802.1p Classification (CLI)
- Configuring DSCP Classification (CLI)
- Configuring MPLS Classification (CLI)
- Configuring a Default CoS (CLI)
- Configuring Ingress Path Classification on a Service Point (CLI)
- Configuring Ingress Path Classification on a Service (CLI)
Classification Overview (CLI)
PTP 820G and PTP 820F supports a hierarchical classification mechanism. The classification mechanism examines incoming frames and determines their CoS and Color. The benefit of hierarchical classification is that it provides the ability to “zoom in” or “zoom out”, enabling classification at higher or lower levels of the hierarchy. The nature of each traffic stream defines which level of the hierarchical classifier to apply, or whether to use several levels of the classification hierarchy in parallel.
The hierarchical classifier consists of the following levels:
• Logical interface-level classification
• Service point-level classification
• Service level classification
Configuring Ingress Path Classification on a Logical Interface (CLI)
Logical interface-level classification enables you to configure classification on a single interface or on a number of interfaces grouped tougher, such as a LAG group.
The classifier at the logical interface level supports the following classification methods, listed from highest to lowest priority. A higher level classification method supersedes a lower level classification method:
- VLAN ID
- 802.1p bits.
- DSCP values.
- MPLS EXP field.
- Default CoS
PTP 820G and PTP 820F performs the classification on each frame ingressing the system via the logical interface. Classification is performed step by step from the highest priority to the lowest priority classification method. Once a match is found, the classifier determines the CoS and Color decision for the frame for the logical interface-level. For example, if the frame is an untagged IP Ethernet frame, a match will not be found until the third priority level (DSCP). The CoS and Color values defined for the frame's DSCP value will be applied to the frame.
You can disable some of these classification methods by configuring them as un-trusted. For example, if 802.1p classification is configured as un-trusted for a specific interface, the classification mechanism does not perform classification by UP bits. This is useful, for example, if classification is based on DSCP priority bits.
If no match is found at the logical interface level, the default CoS is applied to incoming frames at this level. In this case, the Color of the frame is assumed to be Green.
Configuring VLAN Classification and Override (CLI)
You can specify a specific CoS and Color for a specific VLAN ID. In the case of double-tagged frames, the match must be with the frame's outer VLAN. Permitted values are CoS 0 to 7 and Color Green or Yellow per VLAN ID. This is the highest classification priority on the logical interface level, and overrides any other classification criteria at the logical interface level.
To configure CoS and Color override based on VLAN ID, go to interface view for the interface and enter the following command:
eth type eth [x/x]>vlan-cos-override set outer-vlan-id <outer-vlan-id>
inner-vlan-id <inner-vlan-id> use-cos <use-cos> use-color <use-color>
To display configured VLAN-based CoS and Color override values, go to interface view for the interface and enter the following command:
eth type eth [x/x]>vlan-cos-override show outer-vlan-id <outer-vlan-id>
inner-vlan-id <inner-vlan-id>
To delete a set of VLAN-based CoS and Color override values, go to interface view for the interface and enter the following command:
eth type eth [x/x]>vlan-cos-override delete outer-vlan-id <outer-vlan-id>
inner-vlan-id <inner-vlan-id>
Table 216 VLAN Classification and Override CLI Parameters
| Parameter | Input Type | Permitted Values | Description |
| outer-vlan-id | Number | 1 – 4094 | For double-tagged frames, the S-VLAN value mapped to the CoS and Color values defined in the command.For single-tagged frames, the VLAN value mapped to the CoS and Color values defined in the command. |
| inner-vlan-id | Number | 1 – 4094 | Optional. Include this parameter when you want to map double-tagged frames to specific CoS and Color values. When this parameter is included in the command, both the S-VLAN and the C-VLAN IDs must match the configured outer-vlan-id and inner-vlan-id values, respectively, in order for the defined CoS and Color values to be applied to the frame. |
| use-cos | Number | 0 – 7 | The CoS value applied to matching frames. |
| use-color Variable | green yellow | The Color applied to matching frames. | |
The following command configures the classification mechanism on GbE 1 to override the CoS and Color values of frames with S-VLAN ID 10 and C-VLAN ID 30 with a CoS value of 6 and a Color value of Green:
eth type eth [1/1]>vlan-cos-override set outer-vlan-id 10 inner-vlan-id 30 use-cos 6 use-color green
The following command configures the classification mechanism on GbE 2 to override the CoS and Color values of frames with VLAN ID 20 with a CoS value of 5 and a Color value of Green:
eth type eth [1/2]>vlan-cos-override set outer-vlan-id 20 use-cos 5 use-color green
The following command displays the CoS and Color override values for frames that ingress on GbE 1, with S-VLAN ID 10 and C-VLAN ID 20:
eth type eth [1/1]>vlan-cos-override show outer-vlan-id 10 inner-vlan-id 20
The following command displays all CoS and Color override values for frames that ingress on GbE 2:
eth type eth [1/2]>vlan-cos-override show all
The following command deletes the VLAN to CoS and Color override mapping for frames that ingress on GbE 1, with S-VLAN ID 10 and C-VLAN ID 20:
eth type eth [1/1]>vlan-cos-override delete outer-vlan-id 10 inner-vlan-id 20
Configuring 802.1p Classification (CLI)
When 802.1p classification is set to Trust mode, the interface performs QoS and Color classification according to user-configurable tables for 802.1q UP bit (C-VLAN frames) or 802.1AD UP bit (S-VLAN frames) to CoS and Color classification.
This section includes:
- Configuring Trust Mode for 802.1p Classification (CLI)
• Modifying the C-VLAN 802.1 UP and CFI Bit Classification Table (CLI)
• Modifying the S-VLAN 802.1 UP and DEI Bit Classification Table (CLI)
Configuring Trust Mode for 802.1p Classification (CLI)
To define the trust mode for 802.1p classification, go to interface view for the interface and enter the following command:
eth type eth [x/x]>classification set 802.1p <802.1p>
To display the trust mode for 802.1p classification, go to interface view for the interface and enter the following command:
eth type eth [x/x]>classification show 802.1p state
Table 217 802.1p Trust Mode CLI Parameters
| Parameter | Input Type | Permitted Values | Description |
| 802.1p | Variable trust | un-trust | Enter the interface's trust mode for user priority (UP) bits:trust – The interface performs QoS and color classification according to UP and CFI/DEI bits according to user-configurable tables for 802.1q UP bits (C-VLAN frames) or 802.1AD UP bits (S-VLAN frames). VLAN UP bit classification has priority over DSCP and MPLS classification, so that if a match is found with the UP bit of the ingressing frame, DSCP values and MPLS bits are not considered.un-trust – The interface does not consider 802.1 UP bits during classification. |
The following command enables 802.1p trust mode for GbE 1:
eth type eth [1/1]>classification set 802.1p trust
The following command disables 802.1p trust mode for GbE 1:
eth type eth [1/1]>classification set 802.1p un-trust
Modifying the C-VLAN 802.1 UP and CFI Bit Classification Table (CLI)
The following table shows the default values for the C-VLAN 802.1 UP and CFI bit classification table.
Table 218 C-VLAN 802.1 UP and CFI Bit Classification Table Default Values
| 802.1 UP | CFI | CoS (configurable) | Color (configurable) |
| 0 | 0 | 0 | Green |
| 0 | 1 | 0 | Yellow |
| 1 | 0 | 1 | Green |
| 1 | 1 | 1 | Yellow |
| 2 | 0 | 2 | Green |
| 2 | 1 | 2 | Yellow |
| 3 | 0 | 3 | Green |
| 3 | 1 | 3 | Yellow |
| 4 | 0 | 4 | Green |
| 4 | 1 | 4 | Yellow |
| 5 | 0 | 5 | Green |
| 5 | 1 | 5 | Yellow |
| 6 | 0 | 6 | Green |
| 6 | 1 | 6 | Yellow |
| 7 | 0 | 7 | Green |
| 7 | 1 | 7 | Yellow |
To modify the C-VLAN 802.1 UP and CFI bit classification table, enter the following command:
root> ethernet qos 802.1q-up-bits-mapping-tbl set 802.1p <802.1p> cfi <cfi> cos <cos> color <color>
To display the C-VLAN 802.1 UP and CFI bit classification table, enter the following command:
root> ethernet qos 802.1q-up-bits-mapping-tbl show
Table 219 C-VLAN 802.1 UP and CFI Bit Classification Table CLI Parameters
| Parameter | Input Type | Permitted Values | Description |
| 802.1p | Number | 0 – 7 | The User Priority (UP) bit to be mapped. |
| cfi | Number | 0 – 1 | The CFI bit to be mapped. |
| cos | Number | 0 – 7 | The CoS assigned to frames with the designated UP and CFI. |
| color | Variable green yellow | The Color assigned to frames with the designated UP and CFI. |
The following command maps frames with an 802.1p UP bit value of 1 and a CFI bit value of 0 to CoS 1 and Green color:
root> ethernet qos 802.1q-up-bits-mapping-tbl set 802.1p 1 cfi 0 cos 1 color green
Modifying the S-VLAN 802.1 UP and DEI Bit Classification Table (CLI)
The following table shows the default values for the S-VLAN 802.1 UP and DEI bit classification table.
Table 220 S-VLAN 802.1 UP and DEI Bit Classification Table Default Values
| 802.1 UP | CFI | CoS (configurable) | Color (configurable) |
| 0 0 0 Green | |||
| 0 | 1 | 0 | Yellow |
| 1 | 0 | 1 | Green |
| 1 | 1 | 1 | Yellow |
| 2 | 0 | 2 | Green |
| 2 | 1 | 2 | Yellow |
| 3 | 0 | 3 | Green |
| 3 | 1 | 3 | Yellow |
| 4 | 0 | 4 | Green |
| 4 | 1 | 4 | Yellow |
| 5 | 0 | 5 | Green |
| 5 | 1 | 5 | Yellow |
| 6 | 0 | 6 | Green |
| 6 | 1 | 6 | Yellow |
| 7 | 0 | 7 | Green |
| 7 | 1 | 7 | Yellow |
To modify the S-VLAN 802.1 UP and DEI bit classification table, enter the following command:
root> ethernet qos 802.1ad-up-bits-mapping-tbl set 802.1p <802.1p> dei
To display the S-VLAN 802.1 UP and CFI bit classification table, enter the following command:
root> ethernet qos 802.1ad-up-bits-mapping-tbl show
Table 221 S-VLAN 802.1 UP and DEI Bit Classification Table CLI Parameters
| Parameter | Input Type | Permitted Values | Description |
| 802.1p | Number | 0 – 7 | The User Priority (UP) bit to be mapped. |
| dei | Number | 0 - 1 | The DEI bit to be mapped. |
| cos | Number | 0 – 7 | The CoS assigned to frames with the designated UP and CFI. |
| color Variable green | yellow | The Color assigned to frames with the designated UP and CFI. | |
The following command maps frames with an 802.1ad UP bit value of 7 and a DEI bit value of 0 to CoS 7 and Green color:
root> ethernet qos 802.1ad-up-bits-mapping-tbl set 802.1p 7 dei 0 cos 7 color green
Configuring DSCP Classification (CLI)
When DSCP classification is set to Trust mode, the interface performs QoS and Color classification according to a user-configurable DSCP to CoS and Color classification table. 802.1p classification has priority over DSCP Trust Mode, so that if a match is found on the 802.1p level, DSCP is not considered.
This section includes:
- Configuring Trust Mode for DSCP Classification (CLI)
• Modifying the DSCP Classification Table (CLI)
Configuring Trust Mode for DSCP Classification (CLI)
To define the trust mode for DSCP classification, go to interface view for the interface and enter the following command:
eth type eth [x/x]>classification set ip-dscp <ip-dscp>
To display the trust mode for DSCP classification, go to interface view for the interface and enter the following command:
eth type eth [x/x]>classification show 802.1p state
Table 222 Trust Mode for DSCP CLI Parameters
| Parameter | Input Type | Permitted Values | Description |
| ip-dscp | Variable | trust | Select the interface's trust mode for DSCP classification: |
| un-trust | trust – The interface performs QoS and color classification according to a user-configurable table for DSCP to CoS and color classification. | ||
| DSCP classification has priority over MPLS classification, so that if a match is found with the DSCP value of the ingressing frame, MPLS bits are not considered. | |||
| un-trust – The interface does not consider DSCP during classification. |
The following command enables DSCP trust mode for GbE 1:
eth type eth [1/1]>classification set ip-dscp trust
The following command disables DSCP trust mode for GbE 1:
eth type eth [1/1]>classification set ip-dscp un-trust
Modifying the DSCP Classification Table (CLI)
The following table shows the default values for the DSCP classification table.
Table 223 DSCP Classification Table Default Values
| DSCP | DSCP (bin) | Description | CoS (Configurable) | Color (Configurable) |
| 0 (default) | 000000 | BE (CSO) | 0 | Green |
| 10 | 001010 | AF11 | 1 | Green |
| 12 | 001100 | AF12 | 1 | Yellow |
| 14 | 001110 | AF13 | 1 | Yellow |
| 18 | 010010 | AF21 | 2 | Green |
| 20 | 010100 | AF22 | 2 | Yellow |
| 22 | 010110 | AF23 | 2 | Yellow |
| 26 | 011010 | AF31 | 3 | Green |
| 28 | 011100 | AF32 | 3 | Yellow |
| 30 | 011110 | AF33 | 3 | Yellow |
| 34 | 100010 | AF41 | 4 | Green |
| 36 | 100100 | AF42 | 4 | Yellow |
| 38 | 100110 | AF43 | 4 | Yellow |
| 46 | 101110 | EF | 7 | Green |
| 8 | 001000 | CS1 | 1 | Green |
| 16 | 010000 | CS2 | 2 | Green |
| 24 | 011000 | CS3 | 3 | Green |
| 32 | 100000 | CS4 | 4 | Green |
| 40 | 101000 | CS5 | 5 | Green |
| 48 | 110000 | CS6 | 6 | Green |
| 56 | 111000 | CS7 | 7 | Green |
| 51 | 110011 | DSCP_51 | 6 | Green |
| 52 | 110100 | DSCP_52 | 6 | Green |
| 54 | 110110 | DSCP_54 | 6 | Green |
| 56 | 111000 | CS7 | 7 | Green |
To modify the DSCP classification table, enter the following command:
root> ethernet qos dscp-mapping-tbl set dscp <dscp> cos <cos> color <color>
To display the DSCP classification table, enter the following command:
root> ethernet qos dscp-mapping-tbl show
Table 224 Modify DSCP Classification Table CLI Parameters
| Parameter | Input Type | Permitted Values | Description |
| dscp | Number | Valid DSCP values.Refer to the DSCPcolumn in the tableabove. | The DSCP value to be mapped. |
| cos | Number | 0 – 7 | The CoS assigned to frames with the designated DSCP value. |
| color | Variable | greenyellow | The Color assigned to frames with the designated DSCP value. |
The following command maps frames with DSCP value of 10 to CoS 1 and Green color:
root> ethernet qos dscp-mapping-tbl set dscp 10 cos 1 color green
Configuring MPLS Classification (CLI)
When MPLS classification is set to Trust mode, the interface performs QoS and Color classification according to a user-configurable MPLS EXP bit to CoS and Color classification table. Both 802.1p and DSCP classification have priority over MPLS Trust Mode, so that if a match is found on either the 802.1p or DSCP levels, MPLS bits are not considered.
This section includes:
- Configuring Trust Mode for MPLS Classification (CLI)
• Modifying the MPLS EXP Bit Classification Table (CLI)
Configuring Trust Mode for MPLS Classification (CLI)
To define the trust mode for MPLS classification, go to interface view for the interface and enter the following command:
eth type eth [x/x]>classification set mpls <mpls>
To display the trust mode for MPLS classification, go to interface view for the interface and enter the following command:
eth type eth [x/x]>classification show mpls state
Table 225 Trust Mode for MPLS CLI Parameters
| Parameter | Input Type | Permitted Values | Description |
| mpls Variable Trust | un-trust | Select the interface's trust mode for MPLS bits:trust – The interface performs QoS and color classification according to a user-configurable table for MPLS EXP to CoS and color classification.un-trust – The interface does not consider MPLS bits during classification. | |
The following command enables MPLS trust mode for Ethernet port 1:
eth type eth [1/1]>classification set mpls trust
The following command disables MPLS trust mode for Ethernet port 1:
eth type eth [1/1]>classification set mpls un-trust
Modifying the MPLS EXP Bit Classification Table (CLI)
The following table shows the default values for the MPLS EXP bit classification table.
Table 226 MPLS EXP Bit Classification Table Default Values
| MPLS EXP bits | CoS (Configurable) | Color (Configurable) |
| 0 0 Yellow | ||
| 1 1 Green | ||
| 2 2 Yellow | ||
| 3 3 Green | ||
| 4 4 Yellow | ||
| 5 5 Green | ||
| 6 6 Green | ||
| 7 7 Green |
To modify the MPLS EXP bit classification table, enter the following command:
root> ethernet qos mpls-exp-bits-mapping-tbl set mpls-exp <mpls-exp> cos <cos> color <color>
To display the MPLS EXP bit classification table, enter the following command:
root> ethernet qos mpls-mapping-tbl show
Table 227 MPLS EXP Bit Classification Table Modification CLI Parameters
| Parameter | Input Type | Permitted Values | Description |
| mpls-exp | Number | 0 – 7 | The MPLS EXP bit to be mapped. |
| cos | Number | 0 – 7 | The CoS assigned to frames with the designated MPLS EXP bit value. |
| color Variable green | yellow | The Color assigned to frames with the designated MPLS EXP bit value. | |
The following command maps frames with MPLS EXP bit value of 4 to CoS 4 and Yellow color:
root> ethernet qos mpls-exp-bits-mapping-tbl set mpls-exp 4 cos 4 color yellow
Configuring a Default CoS (CLI)
You can define a default CoS value for frames passing through the interface. This value can be overwritten on the service point and service level. The Color is assumed to be Green.
To define a default CoS value for an interface, go to interface view for the interface and enter the following command:
eth type eth [x/x]>classification set default-cos <default-cos>
To display the default CoS value for an interface, go to interface view for the interface and enter the following command:
eth type eth [x/x]>classification show default-cos
Table 228 Default CoS CLI Parameters
| Parameter | Input Type | Permitted Values | Description |
| default-cos | Number | 0 – 7 | Enter the default CoS value for frames passing through the interface. This value can be overwritten on the service point and service level. |
The following command sets the default CoS for GbE 1 as 7:
eth type eth [1/1]>classification set default-cos 7
Configuring Ingress Path Classification on a Service Point (CLI)
For instruction on configuring ingress path classification on a service point, see CoS Preservation and Modification on a Service Point (CLI).
Configuring Ingress Path Classification on a Service (CLI)
For instruction on configuring ingress path classification on a service, see Configuring a Service's CoS Mode and Default CoS (CLI).
Configuring Policers (Rate Metering) (CLI)
This section includes:
• Overview of Rate Metering (Policing) (CLI)
- Configuring Rate Meter (Policer) Profiles (CLI)
• Displaying Rate Meter Profiles (CLI)
• Deleting a Rate Meter Profile (CLI)
- Attaching a Rate Meter (Policer) to an Interface (CLI)
- Attaching a Rate Meter (Policer) to a Service Point and CoS (CLI)
- Configuring the Line Compensation Value for a Rate Meter (Policer) (CLI)
• Displaying Rate Meter Statistics for an Interface (CLI)
Overview of Rate Metering (Policing) (CLI)
The PTP 820G and PTP 820F switching fabric supports hierarchical policing on the logical interface level. You can define up to 250 rate meter (policer) profiles.

Note
Policing on the service point level, and the service point and CoS level, is planned for future release.
The PTP 820G and PTP 820F's policer mechanism is based on a dual leaky bucket mechanism (TrTCM). The policers can change a frame's color and CoS settings based on CIR/EIR + CBS/EBS, which makes the policer mechanism a key tool for implementing bandwidth profiles and enabling operators to meet strict SLA requirements.
The output of the policers is a suggested color for the inspected frame. Based on this color, the queue management mechanism decides whether to drop the frame or to pass it to the queue.
Configuring Rate Meter (Policer) Profiles (CLI)
To add a rate meter (policer) profile, enter the following command:
root> ethernet qos rate-meter add profile-id <profile-id> cir <cir> cbs
< cbs> eir <eir> ebs <ebs> color-mode <color-mode> coupling-flag
< coupling-flag> rate-meter-profile-name <rate-meter-profile-name>
To edit an existing rate meter (policer) profile, enter the following command:
root> ethernet qos rate-meter edit profile-id <profile-id> cir <cir> cbs
<cbs> eir <eir> ebs <ebs> color-mode <color-mode> coupling-flag
<coupling-flag> rate-meter-profile-name <rate-meter-profile-name>
Table 229 Rate Meter Profile CLI Parameters
| Parameter | Input Type | Permitted Values | Description |
| profile-id | Number | 1 - 250 | A unique ID for the rate meter (policer) profile. |
| cir Number | 0, or 64,000 - 1,000,000,000 | The Committed Information Rate (CIR) defined for the rate meter (policer), in bits per second.If the value is 0, all incoming CIR traffic is dropped. | |
| cbs | Number | 0 - 128 | The Committed Burst Rate (CBR) for the rate meter (policer), in Kbytes. |
| eir Number | 0, or 64,000 - 1,000,000,000 | The Excess Information Rate (EIR) for the rate meter (policer), in bits per second.If the value is 0, all incoming EIR traffic is dropped. | |
| ebs | Number | 0 - 128 | The Excess Burst Rate (EBR) for the rate meter (policer), in Kbytes. |
| color-mode | Variable | color-blind color-aware | Determines how the rate meter (policer) treats frames that ingress with a CFI or DEI field set to 1 (yellow). Options are:color aware – All frames that ingress with a CFI/DEI field set to 1 (yellow) are treated as EIR frames, even if credits remain in the CIR bucket.color blind – All ingress frames are treated as green regardless of their CFI/DEI value. A color-blind policer discards any former color decisions. |
| coupling-flag | Variable | enable disable | When enabled, frames that ingress as yellow may be converted to green when there are no available yellow credits in the EIR bucket. Only relevant in color-aware mode. |
| rate-meter-profile-name | Text string | Up to 20 characters. | A description of the rate meter (policer) profile. |
The following command creates a rate meter (policer) profile with Profile ID 50, named "64k."
root> ethernet qos rate-meter add profile-id 50 cir 64000 cbs 5 eir 64000 ebs 5 color-mode color-blind coupling-flag disable rate-meter-profile-name 64k
This profile includes the following parameters:
- CIR - 64,000 bps
- CBS - 5 Kbytes
- EIR - 64,000 bps
- EBS - 5 Kbytes
- Color Blind mode
- Coupling Flag disabled
The following command edits the rate meter (policer) profile with Profile ID 50, and changes its name to "256 kBytes."
root> ethernet qos rate-meter edit profile-id 50 cir 128000 cbs 5 eir 128000 ebs 5 color-mode color-aware coupling-flag enable rate-meter-profile-name 256 kBytes
This edited profile includes the following parameters:
• CIR - 128,000 bps
- CBS - 5 Kbytes
• EIR - 128,000 bps
- EBS - 5 Kbytes
• Color Aware mode
- Coupling Flag enabled
Displaying Rate Meter Profiles (CLI)
You can display all configured rate meter (policer) profiles or a specific profile.
To display a specific profile, enter the following command:
root> ethernet qos rate-meter show profile-id <profile-id>
For example, the following command displays the parameters of Rate Meter Profile 50:
root> ethernet qos rate-meter show profile-id 50
To display all configured profiles, enter the following command:
root> ethernet qos rate-meter show profile-id all
Deleting a Rate Meter Profile (CLI)
You cannot delete a rate meter (policer) profile that is attached to a logical interface. You must first remove the profile from the logical interface, then delete the profile.
To delete a rate meter (policer) profile, use the following command:
root> ethernet qos rate-meter delete profile-id <profile-id>
The following command deletes Rate Meter Profile 50:
root> ethernet qos rate-meter delete profile-id 50
Attaching a Rate Meter (Policer) to an Interface (CLI)
On the logical interface level, you can assign rate meter (policer) profiles as follows:
• Per frame type (unicast, multicast, and broadcast)
• Per frame ethertype
This section includes:
- Assigning a Rate Meter (Policer) for Unicast Traffic (CLI)
- Assigning a Rate Meter (Policer) for Multicast Traffic (CLI)
- Assigning a Rate Meter (Policer) for Broadcast Traffic (CLI)
- Assigning a Rate Meter (Policer) per Ethertype (CLI)
Assigning a Rate Meter (Policer) for Unicast Traffic (CLI)
To assign a rate meter (policer) profile for unicast traffic to the interface, go to interface view for the interface and enter the following command:
eth type eth [x/x]>rate-meter unicast add capability admin-state <admin-state> profile-id <profile-id>
To change the rate meter (policer) profile for unicast traffic, go to interface view for the interface and enter the following command:
eth type eth [x/x]>rate-meter unicast edit admin-state <admin-state> profile-id <profile-id>
To display the current unicast rate meter (policer) profile for an interface, go to interface view for the interface and enter the following command:
eth type eth [x/x]>rate-meter unicast show configuration
To delete the rate meter (policer) profile for unicast traffic, go to interface view for the interface and enter the following command:
eth type eth [x/x]>rate-meter unicast delete
Table 230 Assigning Rate Meter for Unicast Traffic CLI Parameters
| Parameter | Input Type | Permitted Values | Description |
| admin-state | Variable enable | disable | Enables or disables rate metering on unicast traffic flows from the logical interface. |
| profile-id | Number | 1 – 250 | Select from the rate meter profiles defined in the system. |
The following command assigns Rate Meter Profile 1 to unicast traffic on GbE 1, and enables rate metering on the port:
eth type eth [1/1]>rate-meter unicast add capability admin-state enable profile-id 1
The following command changes the rate meter (policer) profile for unicast traffic on GbE 1 to 4:
eth type eth [1/1]>rate-meter unicast edit admin-state enable profile-id 4
Assigning a Rate Meter (Policer) for Multicast Traffic (CLI)
To assign a rate meter (policer) profile for multicast traffic to the interface, go to interface view for the interface and enter the following command:
eth type eth [x/x]>rate-meter multicast add capability admin-state <admin-state> profile-id <profile-id>
To change the rate meter (policer) profile for multicast traffic, go to interface view for the interface and enter the following command:
eth type eth [x/x]>rate-meter multicast edit admin-state <admin-state> profile-id <profile-id>
To display the current multicast rate meter (policer) profile for an interface, go to interface view for the interface and enter the following command:
eth type eth [x/x]>rate-meter multicast show configuration
To delete the rate meter (policer) profile for multicast traffic, go to interface view for the interface and enter the following command:
eth type eth [x/x]>rate-meter multicast delete
Table 231 Assigning Rate Meter for Multicast Traffic CLI Parameters
| Parameter | Input Type | Permitted Values | Description |
| admin-state | Variable enable | disable | Enables or disables rate metering on multicast traffic flows from the logical interface. |
| profile-id | Number | 1 – 250 | Select from the rate meter profiles defined in the system. |
The following command assigns Rate Meter Profile 1 to multicast traffic on GbE 1, and enables rate metering on the port.
eth type eth [1/1]>rate-meter multicast add capability admin-state enable profile-id 1
The following command changes the rate meter (policer) profile for multicast traffic on GbE 1 to 4:
eth type eth [1/1]>rate-meter multicast edit admin-state enable profile-id 4
Assigning a Rate Meter (Policer) for Broadcast Traffic (CLI)
To assign a rate meter (policer) profile for broadcast traffic to the interface, go to interface view for the interface and enter the following command:
eth type eth [x/x]>rate-meter broadcast add capability admin-state <admin-state> profile-id <profile-id>
To change the rate meter (policer) profile for broadcast traffic, go to interface view for the interface and enter the following command:
eth type eth [x/x]>rate-meter broadcast edit admin-state <admin-state> profile-id <profile-id>
To display the current broadcast rate meter (policer) settings for an interface, go to interface view for the interface and enter the following command:
eth type eth [x/x]>rate-meter broadcast show configuration
To delete the rate meter (policer) profile for broadcast traffic, go to interface view for the interface and enter the following command:
eth type eth [x/x]>rate-meter broadcast delete
Table 232 Assigning Rate Meter for Broadcast Traffic CLI Parameters
| Parameter | Input Type | Permitted Values | Description |
| admin-state | Variable enable | disable | Enables or disables rate metering on broadcast traffic flows from the logical interface. |
| profile-id | Number | 1 – 250 | Select from the rate meter profiles defined in the system. |
The following command assigns Profile 1 to broadcast traffic on GbE 1, and enables rate metering on the port.
eth type eth [1/1]>rate-meter broadcast add capability admin-state enable profile-id 1
The following command changes the rate meter (policer) profile for broadcast traffic on GbE 1 to 4:
eth type eth [1/1]>rate-meter broadcast edit admin-state enable profile-id 4
Assigning a Rate Meter (Policer) per Ethertype (CLI)
You can define up to three policers per Ethertype value.
To assign a rate meter (policer) profile for a specific Ethertype to an interface, go to interface view for the interface and enter the following command:
eth type eth [x/x]>rate-meter <ethertype#> add capability ethertype-value <ethertype-value> admin-state <admin-state> profile-id <profile-id>
To change the rate meter (policer) profile for a specific Ethertype, go to interface view for the interface and enter the following command:
eth type eth [x/x]>rate-meter <ethertype#> edit ethertype-value <ethertype-value> admin-state <admin-state> profile-id <profile-id>
To display the current Ethertype rate meter (policer) settings for an interface, go to interface view for the interface and enter the following commands:
eth type eth [x/x]>rate-meter ethertype1 show configuration
eth type eth [x/x]>rate-meter ethertype2 show configuration
eth type eth [x/x]>rate-meter ethertype3 show configuration
To delete the rate meter (policer) profile for an Ethertype, go to interface view for the interface and enter one or more of the following commands:
eth type eth [x/x]>rate-meter ethertype1 delete
eth type eth [x/x]>rate-meter ethertype2 delete
eth type eth [x/x]>rate-meter ethertype3 delete
Table 233 Assigning Rate Meter per Ethertype CLI Parameters
| Parameter | Input Type | Permitted Values | Description |
| ethertype# | Variable | ethertype1 | Identifies which of three possible policer-per-Ethertype combinations you are defining. |
| ethertype2 | |||
| ethertype3 I | |||
| ethertype-value | Hexadecimal | 1-65535 | Identifies the Ethertype to which the profile applies. |
| admin-state | Variable enable | disable | Enables or disables policing on broadcast traffic flows from the logical interface. |
| profile-id | Number | 1 – 250 | Select from the policer profiles defined in the system. For instructions on defining rate meter (policer) profiles, refer to Configuring Rate Meter (Policer) Profiles (CLI). |
The following commands assign Rate Meter Profiles 1, 2, and 3 to Ethertypes 0x8000, 0x8100, and 0x9100, respectively, on GbE 1, and enable rate metering on the port.
eth type eth [1/1]>rate-meter ethertype1 add capability ethertype-value 0x8000 admin-state enable profile-id 1
eth type eth [1/1]>rate-meter ethertype2 add capability ethertype-value 0x8100 admin-state enable profile-id 2
eth type eth [1/1]>rate-meter ethertype3 add capability ethertype-value 0x9100 admin-state enable profile-id 3
The following commands change the rate meter (policer) profiles assigned in the examples above to 4, 5, and 6, respectively.
eth type eth [1/1]>rate-meter ethertype1 edit ethertype-value 0x8000
admin-state enable profile-id 4
eth type eth [1/1]>rate-meter ethertype2 edit ethertype-value 0x8100
admin-state enable profile-id 5
eth type eth [1/1]>rate-meter ethertype3 edit ethertype-value 0x9100
admin-state enable profile-id 6
Attaching a Rate Meter (Policer) to a Service Point and CoS (CLI)
To assign a rate meter (policer) profile to a service point, go to service view for the service and enter the following commands:
service[x]>sp rate-meter add capability spid <spid>
service[x]>sp rate-meter edit spid <spid> admin-state <admin-state>
profile-id <profile-id>
To change the rate meter (policer) profile for a service point, go to service view for the service and enter the following command:
service[x]>sp rate-meter edit spid <spid> admin-state <admin-state>
profile-id <profile-id>
To display the current rate meter (policer) profile for a service point, go to service view for the service and enter the following command:
service[x]>sp rate-meter show configuration spid <spid>
To assign a rate meter (policer) profile to a service point and CoS, go to service view for the service and enter the following commands:
service[x]>sp rate-meter add capability spid <spid>
service[x]>sp rate-meter edit spid <spid> cos <cos> admin-state <admin-state> profile-id <profile-id>
To change the rate meter (policer) profile for a service point and CoS, go to service view for the service and enter the following command:
service[x]>sp rate-meter edit spid <spid> cos <cos> admin-state <admin-state> profile-id <profile-id>
To display the current rate meter (policer) profile for a service point and CoS, go to service view for the service and enter the following command:
service[x]>sp rate-meter show configuration spid <spid> cos <cos>
To delete the rate meter (policer) profile for a service point or service point/CoS combination, go to service view for the service and enter the following command:
service[x]>sp rate-meter delete spid <spid>
Table 234 Assigning Rate Meter for Service Point and Service Point/CoS CLI Parameters
| Parameter | Input Type | Permitted Values | Description |
| sp-id Number | 1-32 for P2P and MP services. 1-30 for MNG services. | The Service Point ID. | |
| admin-state Variable enable | disable | Enables or disables rate metering on unicast traffic flows from the logical interface. | |
| profile-id | Number | 1 – 250 | Select from the rate meter profiles defined in the system. |
| Cos Number 0 – 7 | The CoS value to which you are assigning the rate meter. | ||
The following commands assign Rate Meter Profile 2 to service point 10 on service 5:
root> ethernet service sid 5
service[5]> sp rate-meter add capability spid 10
service[5]>sp rate-meter edit spid 10 admin-state enable profile-id 2
The following commands assign Rate Meter Profile 4 to service point 10 and CoS 6 on service 5:
root> ethernet service sid 5
service[5]> sp rate-meter add capability spid 10
service[5]>sp rate-meter edit spid 10 cos 6 admin-state enable profile-id 4
Configuring the Line Compensation Value for a Rate Meter (Policer) (CLI)
A rate meter can measure CIR and EIR at Layer 1 or Layer 2 rates. Layer 1 capacity is equal to Layer 2 capacity plus 20 additional bytes for each frame due to the preamble and Inter Frame Gap (IFG). In most cases, the preamble and IFG equals 20 bytes, but other values are also possible. Line compensation defines the number of bytes to be added to each frame for purposes of CIR and EIR calculation. When Line Compensation is 20, the rate meter operates as Layer 1. When Line Compensation is 0, the rate meter operates as Layer 2. This parameter is very important to users that want to distinguish between Layer 1 and Layer 2 traffic.
To configure the rate meter (policer) line compensation value for an interface, go to interface view for the interface and enter the following command:
eth type eth [x/x]>rate-meter-compensation-value set <value>
To display the rate meter (policer) line compensation value for an interface, go to interface view for the interface and enter the following command:
eth type eth [x/x]>rate-meter-compensation-value get
Table 235 Assigning Line Compensation Value for Rate Meter CLI Parameters
| Parameter | Input Type | Permitted Values | Description |
| value | Number | 0 – 32 | Policers attached to the interface use this value to compensate for Layer 1 non-effective traffic bytes. |
The following command sets the line compensation value for policers attached to GbE 1 to 20:
eth type eth [1/1]>rate-meter-compensation-value set 20
Displaying Rate Meter Statistics for an Interface (CLI)
For the rate meter (policer) at the logical interface level, you can display the following statistics counters:
- Green Frames
- Green Bytes
- Yellow Frames
- Yellow Bytes
- Red Frames
- Red Bytes

Note
Rate meter (policer) counters are displayed in granularity of 64 bits.
The following commands display rate meter counters for the available frame types and Ethertypes:
eth type eth [x/x]>rate-meter unicast show statistics clear-on-read
<clear-on-read> layer-1 <layer-1>
eth type eth [x/x]>rate-meter multicast show statistics clear-on-read
<clear-on-read> layer-1 <layer-1>
eth type eth [x/x]>rate-meter broadcast show statistics clear-on-read
<clear-on-read> layer-1 <layer-1>
eth type eth [x/x]>rate-meter ethertype1 show statistics clear-on-read
<clear-on-read> layer-1 <layer-1>
eth type eth [x/x]>rate-meter ethertype2 show statistics clear-on-read
<clear-on-read> layer-1 <layer-1>
eth type eth [x/x]>rate-meter ethertype3 show statistics clear-on-read
<clear-on-read> layer-1 <layer-1>
Table 236 Displaying Rate Meter Statistics CLI Parameters
| Parameter | Input Type | Permitted Values | Description |
| clear-on-read | Boolean yes | no | If you enter yes, the statistics are cleared once you display them. |
| layer 1 | Boolean yes | no | yes – Statistics are represented as Layer 1 statistics, including preamble and IFG.no – Statistics are represented as Layer 2 statistics. |
The following commands display rate meter counters for GbE 1, for each of the available frame types and Ethertypes. These commands clear the counters after displaying them.
eth type eth [1/1]>rate-meter unicast show statistics clear-on-read yes layer-1 no
eth type eth [1/1]>rate-meter multicast show statistics clear-on-read yes layer-1 no
eth type eth [1/1]>rate-meter broadcast show statistics clear-on-read yes layer-1 no
eth type eth [1/1]>rate-meter ethertype1 show statistics clear-on-read yes layer-1 no
eth type eth [1/1]>rate-meter ethertype2 show statistics clear-on-read yes layer-1 no
eth type eth [1/1]>rate-meter ethertype3 show statistics clear-on-read yes layer-1 no
Configuring Marking (CLI)
This section includes:
• Marking Overview (CLI)
- Configuring Marking Mode on a Service Point (CLI)
• Marking Table for C-VLAN UP Bits (CLI)
• Marking Table for S-VLAN UP Bits (CLI)
Marking Overview (CLI)
When enabled, PTP 820G and PTP 820F's marking mechanism modifies each frame's 802.1p UP bit and CFI/DEI bits according to the classifier decision. The CFI/DEI (color) field is modified according to the classifier and policer decision. The color is first determined by a classifier and may be later overwritten by a policer. Green color is represented by a CFI/DEI value of 0, and Yellow color is represented by a CFI/DEI value of 1. Marking is performed on egress frames that are VLAN-tagged.
The marking is performed according to global marking tables that describe the 802.1p UP bits and the CFI bits (for C-VLAN tags) or DEI bits (for S VLAN tags). The marking mode attribute in the service point egress attributes determines whether the frame is marked as Green or Yellow according to the calculated color.

Note
The calculated color is sent to the queue manager regardless of whether the marking bit is set.
Regular marking is only performed when:
• The outer frame is S-VLAN, and S-VLAN CoS preservation is disabled
• The outer frame is C-VLAN, and C-VLAN CoS preservation is disabled
If marking and CoS preservation for the relevant outer VLAN are both disabled, special marking is applied. Special marking means that marking is performed, but only according to the values defined for Green frames in the 802.1Q and 802.1AD marking tables.
When marking is performed, the C-VLAN or S-VLAN 802.1p UP bits are re-marked according to the calculated CoS and Color.
Configuring Marking Mode on a Service Point (CLI)
To enable or disable marking mode on a service point, go to service view for the service and enter the following command:
service[SID]>sp marking set spid
Table 237 Marking Mode on Service Point CLI Parameters
| Parameter | Input Type | Permitted Values | Description |
| sp-id Number | 1-32 for P2P and MP services.1-30 for MNG services. | The Service Point ID. | |
| mode Variable | enable disable | Determines whether re-marking of the outer VLAN (C-VLAN or S-VLAN) of tagged frames that pass through the service point is enabled.If mode is set to enable, and CoS preservation for the relevant outer VLAN is set to disable, the service point remarks the C-VLAN or S-VLAN 802.1p UP bits of egress frames according to the calculated CoS and Color, and the user-configurable 802.1Q and 802.1AD marking tables.If mode is set to enable and CoS preservation for the relevant outer VLAN is also set to enable, re-marking is not performed.If mode is set to disable and CoS preservation for the relevant outer VLAN is also set to disable, re-marking is applied, but only according to the values defined for Green frames in the 802.1Q and 802.1AD marking tables.For information about configuring CoS Preservation, refer to CoS Preservation and Modification on a Service Point. |
The following command enables marking mode on Service Point 3 on Service 2:
service[2]>sp marking set spid 3 mode enable
The following command disables marking mode on Service Point 3 on Service 2:
service[2]>sp marking set spid 3 mode disable
Marking Table for C-VLAN UP Bits (CLI)
When marking is performed, the following table is used by the marker to decide which CoS and Color to use as the egress CoS and Color bits for C-VLAN-tagged frames.
Table 238 Marking Table for C-VLAN UP Bits
| CoS | Color | 802.1q (Configurable) | CFI Color (Configurable) |
| 0 Green 0 0 | |||
| 0 Yellow 0 1 | |||
| 1 Green 1 0 | |||
| 1 Yellow 1 1 | |||
| 2 Green 2 0 | |||
| 2 Yellow 2 1 | |||
| 3 Green 3 0 | |||
| 3 Yellow 3 1 | |||
| 4 Green 4 0 | |||
| 4 Yellow 4 1 | |||
| 5 Green 5 0 | |||
| 5 Yellow 5 1 | |||
| 6 Green 6 0 | |||
| 6 Yellow 6 1 | |||
| 7 Green 7 0 | |||
| 7 Yellow 7 1 | |||
To modify the 802.1q CoS and Color to UP and CFI bit mapping table, enter the following command in root view:
root> ethernet qos 802.1q-up-bits-marking-tbl set cos <cos> color <color> 802.1p <802.1p> cfi <cfi>
To display the 802.1q CoS and Color to UP and CFI bit mapping table, enter the following command in root view:
root> ethernet qos 802.1q-up-bits-marking-tbl show
Table 239 802.1q CoS and Color to UP and CFI Bit Mapping Table CLI Parameters
| Parameter | Input Type | Permitted Values | Description |
| cos | Number | 0 – 7 | The CoS value to be mapped. |
| color Variable green | yellow | The Color to be mapped. | |
| 802.1p | Number | 0 – 7 | The UP bit value assigned to matching frames. |
| cfi | Number | 0 – 1 | The CFI bit value assigned to matching frames. |
The following command maps CoS 0, Green, to 802.1p UP bit 0, and CFI bit 0:
root> ethernet qos 802.1q-up-bits-marking-tbl set cos 0 color green
802.1p 0 cfi 0
Marking Table for S-VLAN UP Bits (CLI)
When marking is performed, the following table is used by the marker to decide which CoS and Color to use as the egress CoS and Color bits for S-VLAN-tagged frames.
Table 240 802.1ad UP Marking Table (S-VLAN)
| CoS | Color | 802.1ad UP (Configurable) | DEI Color (Configurable) |
| 0 Green 0 0 | |||
| 0 Yellow 0 1 | |||
| 1 Green 1 0 | |||
| 1 Yellow 1 1 | |||
| 2 Green 2 0 | |||
| 2 Yellow 2 1 | |||
| 3 Green 3 0 | |||
| 3 Yellow 3 1 | |||
| 4 Green 4 0 | |||
| 4 Yellow 4 1 | |||
| 5 Green 5 0 | |||
| 5 Yellow 5 1 | |||
| 6 Green 6 0 | |||
| 6 Yellow 6 1 | |||
| 7 Green 7 0 | |||
| 7 Yellow 7 1 | |||
To modify the 802.1ad CoS and Color to UP and DEI bit mapping table, enter the following command in root view:
root> ethernet qos 802.1ad-up-bits-marking-tbl set cos <cos> color <color> 802.1p <802.1p> dei <dei>
To display the 802.1q CoS and Color to UP and CFI bit mapping table, enter the following command in root view:
root> ethernet qos 802.1ad-up-bits-marking-tbl show
Table 241 802.1ad UP Marking Table (S-VLAN) CLI Parameters
| Parameter | Input Type | Permitted Values | Description |
| cos | Number | 0 – 7 | The CoS value to be mapped. |
| color Variable green | yellow | The Color to be mapped. | |
| 802.1p | Number | 0 – 7 | The UP bit value assigned to matching frames. |
| dei | Number | 0 – 1 | The DEI bit value assigned to matching frames. |
The following command marks CoS 5, Yellow, to 802.1p UP bit 5, and DEI bit 1:
root> ethernet qos 802.1ad-up-bits-marking-tbl set cos 5 color yellow 802.1p 5 dei 1
Configuring WRED (CLI)
This section includes:
• WRED Overview (CLI)
- Configuring WRED Profiles (CLI)
- Assigning a WRED Profile to a Queue (CLI)
WRED Overview (CLI)
Weighted Random Early Detection (WRED) enables differentiation between higher and lower priority traffic based on CoS. You can define up to 30 WRED profiles. Each profile contains a green traffic curve and a yellow traffic curve. These curves describe the probability of randomly dropping frames as a function of queue occupancy.
The system also includes two pre-defined read-only profiles. These profiles are assigned WRED profile IDs 31 and 32:
• Profile number 31 defines a tail-drop curve and is configured with the following values:
- 100% Yellow traffic drop after 64kbytes occupancy.
- 100% Green traffic drop after 128kbytes occupancy.
- Yellow maximum drop is 100%
o Green maximum drop is 100%
- Profile number 32 defines a profile in which all will be dropped. It is for internal use and should not be applied to traffic.
A WRED profile can be assigned to each queue. The WRED profile assigned to the queue determines whether or not to drop incoming frames according to the occupancy of the queue. As the queue occupancy grows, the probability of dropping each incoming frame increases as well. As a consequence, statistically more TCP flows will be restrained before traffic congestion occurs.
Configuring WRED Profiles (CLI)
To configure a WRED profile, enter the following command in root view:
root> ethernet qos wred-profile-tbl add profile-id <profile-id> green-min-threshold <green-min-threshold> green-max-threshold <green-max-threshold> green-max-drop <green-max-drop> yellow-min-threshold <yellow-min-threshold> yellow-max-threshold <yellow-max-threshold> yellow-max-drop <yellow-max-drop>
To edit an existing WRED profile, enter the following command in root view:
root> ethernet qos wred-profile-tbl edit profile-id <profile-id> green-min-threshold <green-min-threshold> green-max-threshold <green-max-threshold> green-max-drop <green-max-drop> yellow-min-threshold <yellow-min-threshold> yellow-max-threshold <yellow-max-threshold> yellow-max-drop <yellow-max-drop>
To display a WRED profile, enter the following command in root view:
root> ethernet qos wred-profile-tbl show profile-id <profile-id>
To delete a WRED profile, enter the following command in root view:
root> ethernet qos wred-profile-tbl delete profile-id <profile id>
You cannot delete an WRED profile that is assigned to a queue. You must first remove the WRED profile from the queue by replacing it with a different WRED profile. You can then delete the WRED profile.

Note
Each queue always has a WRED profile assigned to it. By default, WRED Profile 31 is assigned to every queue until a different profile is assigned.
Table 242 WRED Profile CLI Parameters
| Parameter | Input Type | Permitted Values | Description |
| profile-id | Number | 1 - 30 | A unique ID to identify the profile. |
| green-min-threshold | Number 0 - 8192 | The minimum throughput of green frames for queues with this profile, in Kbytes. When this value is reached, the system begins dropping green frames in the queue. | |
| green-max-threshold | Number 0 - 8192 | The maximum throughput of green frames for queues with this profile, in Kbytes. When this value is reached, all green frames in the queue are dropped. | |
| green-max-drop | Number 1 - 100 | The maximum percentage of dropped green frames for queues with this profile. | |
| yellow-min-threshold | Number 0 - 8192 | The minimum throughput of yellow frames for queues with this profile, in Kbytes. When this value is reached, the system begins dropping yellow frames in the queue. | |
| yellow-max-threshold | Number 0 - 8192 | The maximum throughput of yellow frames for queues with this profile, in Kbytes. After this value is reached, all yellow frames in the queue are dropped. | |
| yellow-max-drop | Number 1 - 100 | The maximum percentage of dropped yellow frames for queues with this profile. |
The following command adds a WRED profile.
root> ethernet qos wred-profile-tbl add profile-id 2 green-min-threshold 8000 green-max-threshold 8000 green-max-drop 100 yellow-min-threshold 8000 yellow-max-threshold 8000 yellow-max-drop 100
The new profile has the following parameters:
- profile-id - 2
• green-min-threshold – 8000 Kbytes
• green-max-threshold – 8000 Kbytes - green-max-drop – 100%
• yellow-min-threshold – 8000 Kbytes
• yellow-max-threshold – 8000 Kbytes
• yellow-max-drop - 100%
The following command edits the WRED profile created by the previous command:
root> ethernet qos wred-profile-tbl edit profile-id 2 green-min-threshold 8000 green-max-threshold 8000 green-max-drop 100 yellow-min-threshold 4000 yellow-max-threshold 4000 yellow-max-drop 100
The edited profile has the following parameters:
• green-min-threshold – 8000 Kbytes
• green-max-threshold – 8000 Kbytes
- green-max-drop – 100%
• yellow-min-threshold – 4000 Kbytes
• yellow-max-threshold -4000 Kbytes
- yellow-max-drop – 100%
Assigning a WRED Profile to a Queue (CLI)
To assign a WRED profile to a queue, go to interface view for the interface and enter the following command:
eth type eth [x/x]> wred set service-bundle-id <service-bundle-id> cos <cos> profile-id <profile-id>
To display the WRED profile assigned to a queue, go to interface view for the interface and enter the following command:
eth type eth [x/x]> wred show profile-id service-bundle-id <service-bundle-id> cos <cos>
Table 243 Assigning WRED Profile to Queue CLI Parameters
| Parameter | Input Type | Permitted Values | Description |
| service-bundle-id | Number 1 – 63 | Note: In the current release, only Service Bundle 1 is supported. | Assigns the WRED profile to a Service Bundle. Service Bundles are bundles of queues, grouped together in order to configure common egress characteristics for specific services. |
| cos Number 0 – 7 | Assigns the WRED profile to a queue in the designated service bundle. | ||
| profile-id | Number | 1 – 32 | A unique ID that identifies the profile. |
The following command assigns WRED Profile 2 to the CoS 0 queue in Service Bundle 1, on GbE 1:
eth type eth [1/1]> wred set service-bundle-id 1 cos 0 profile-id 2
The following command displays the WRED profile assigned to the CoS 0 queue in Service Bundle 1, on Ethernet port 1:
eth type eth [1/1]> wred show profile-id service-bundle-id 1 cos 0
Configuring Shapers (CLI)
This section includes:
• Overview of Egress Shaping (CLI)
- Configuring Shapers (CLI)
- Configuring Service Bundle Shapers (CLI)
- Configuring Egress Line Compensation for Shaping (CLI)
Overview of Egress Shaping (CLI)
Egress shaping determines the traffic profile for each queue. PTP 820G and PTP 820F performs egress shaping on the following levels:
- Queue level – Single leaky bucket shaping
• Service Bundle level – Dual leaky bucket shaping

Note
Single leaky bucket shaping on the interface level is planned for future release.
You can configure up to 32 single leaky bucket queue shaper profiles. The CIR value can be set to the following values:
• 16,000 – 32,000,000 bps – granularity of 16,000 bps
• 32,000,000 – 131,008,000 bps – granularity of 64,000 bps

Note
You can enter any value within the permitted range. Based on the value you enter, the software automatically rounds off the setting according to the granularity. If you enter a value below the lowest granular value (except 0), the software adjusts the setting to the minimum.
You can attach one of the configured queue shaper profiles to each priority queue. If no profile is attached to the queue, no egress shaping is performed on that queue.
This section includes:
- Configuring Queue Shaper Profiles (CLI)
- Attaching a Shaper Profile to a Queue (CLI)
Configuring Queue Shaper Profiles (CLI)
To configure a queue shaper profile, enter the following command in root view:
root> ethernet qos queue-shaper-profile-tbl add profile-id <profile-id> cir <cir> shaper-profile-name <shaper-profile-name>
To edit the parameters of an existing queue shaper profile, enter the following command in root view:
root> ethernet qos queue-shaper-profile-tbl edit profile-id <profile-id> cir <cir> shaper-profile-name <shaper-profile-name> burst-type short

Note
The burst-type parameter is reserved for future use. However, you must enter this parameter in order for the command to execute.
To display the parameters of a queue shaper profile, enter the following command in root view:
root> ethernet qos queue-shaper-profile-tbl show profile-id <profile-id>
To delete a queue shaper profile, enter the following command in root view:
root> ethernet qos queue-shaper-profile-tbl delete profile-id <profile id>
You cannot delete a queue shaper profile if it is attached to a queue. You must first remove the profile from the queue. You can then delete the profile.
Table 244 Queue Shaper Profiles CLI Parameters
| Parameter | Input Type | Permitted Values | Description |
| profile-id | Number | 1 - 32 | A unique ID that identifies the profile. |
| cir | Number | 16000 – 131008000 | The Committed Information Rate (CIR) assigned to the profile (in bps). |
| shaper-profile-name | Text String | Up to 20 characters. | A description of the profile. |
The following command creates Queue Shaper 1, named "p1", with a CIR value of 16000 bps.
root> ethernet qos queue-shaper-profile-tbl add profile-id 1 cir 16000 shaper-profile-name pl
The following command changes the CIR value of the profile created above from 16000 to 32000, and changes the profile name to p3.
root> ethernet qos queue-shaper-profile-tbl edit profile-id 1 cir 32000 shaper-profile-name p3 burst-type short
Attaching a Shaper Profile to a Queue (CLI)
You can attach one of the configured queue shaper profiles to each priority queue. If no profile is attached to the queue, no egress shaping is performed on that queue. Shapers are attached to queues based on the logical interface and service bundle to which the queue belongs, and the queue's CoS value.
To attach a queue shaper profile to a queue, go to interface view for the interface and enter the following command:
eth type eth [x/x]> queue-shaper add capability service-bundle-id <service-bundle-id> cos <cos> admin-state <admin-state> profile-id <profile-id>
To change the queue shaper profile attached to a queue, go to interface view for the interface and enter the following command:
eth type eth [x/x]> queue-shaper edit service-bundle-id <service-bundle-id> cos <cos> admin-state <admin-state> profile-id <profile-id>
To display the queue shaper profile attached to a queue, go to interface view for the interface and enter the following command:
eth type eth [x/x]> queue-shaper show configuration service-bundle-id <service-bundle-id> cos <cos>
To remove a queue shaper profile from a queue, go to interface view for the interface and enter the following command:
eth type eth [x/x]> queue-shaper delete service-bundle-id <service-bundle-id> cos <cos>
Table 245 Attaching Shaper Profile to Queue CLI Parameters
| Parameter | Input Type | Permitted Values | Description |
| service-bundle-id | Number 1 – 63 | Note: In the current release, only Service Bundle 1 is supported. | The service bundle to which you are attaching the queue shaper profile. |
| cos | Number | 0 – 7 | The CoS queue ID of the queue to which you want to assign the shaper. Queues are numbered according to CoS value. |
| admin-state Variable enable | disable | Select enable to enable egress queue shaping on the queue, or disable to disable egress queue shaping on the queue. If you set shaping to disable, the shaper profile remains attached to the queue, but does not affect traffic. | |
| profile-id | Number | 1 – 32 | Enter the ID of one of the configured queue shaper profiles. |
The following command adds Queue Shaper Profile 5 to queues with CoS 0, on Service Bundle 1, on Ethernet port 1, and enables shaping on these queues:
eth type eth [1/1]> queue-shaper add capability service-bundle-id 1 cos 0 admin-state enable profile-id 5
The following command changes the Queue Shaper Profile assigned in the previous command to Queue Shaper Profile 2:
eth type eth [1/1]> queue-shaper edit service-bundle-id 1 cos 0 admin-state enable profile-id 2
Configuring Service Bundle Shapers (CLI)
You can configure up to 256 dual leaky bucket service bundle shaper profiles. The profiles can be configured as follows:
Valid CIR values are:
- 0 – 32,000,000 bps, with granularity of 16,000 bps
• 32,000,000 – 1,000,000,000 bps, with granularity of 64,000 bps
Valid PIR values are:
• 16,000 – 32,000,000 bps, with granularity of 16,000 bps
• 32,000,000 – 1,000,000,000 bps, with granularity of 64,000 bps

Note
You can enter any value within the permitted range. Based on the value you enter, the software automatically rounds off the setting according to the granularity. If you enter a value below the lowest granular value (except 0), the software adjusts the setting to the minimum.
You can attach one of the configured service bundle shaper profiles to each service bundle. If no profile is attached to the service bundle, no egress shaping is performed on that service bundle.
This section includes:
- Configuring Service Bundle Shaper Profiles (CLI)
- Attaching a Shaper Profile to a Service Bundle (CLI)
Configuring Service Bundle Shaper Profiles (CLI)
To configure a service bundle shaper profile, enter the following command in root view:
root> ethernet qos service-bundle-shaper-profile-tbl add profile-id <profile-id> cir <cir> pir <pir> shaper-profile-name <shaper-profile-name>
To edit the parameters of an existing service bundle shaper profile, enter the following command in root view:
root> ethernet qos service-bundle-shaper-profile-tbl edit profile-id <profile-id> cir <cir> pir <pir> shaper-profile-name <shaper-profile-name>
To display the parameters of a service bundle shaper profile, enter the following command in root view:
root> ethernet qos service-bundle-shaper-profile-tbl show profile-id <profile-id>
To display the parameters of all configured service bundle shaper profiles, enter the following command in root view:
root> ethernet qos service-bundle-shaper-profile-tbl show profile-id all
To delete a service bundle shaper profile, enter the following command in root view:
root> ethernet qos service-bundle-shaper-profile-tbl delete profile-id <profile-id>
You cannot delete a service bundle shaper profile if it is attached to a service bundle. You must first remove the profile from the service bundle. You can then delete the profile.
Table 246 Service Bundle Shaper Profiles CLI Parameters
| Parameter | Input Type | Permitted Values | Description |
| profile-id | Number | 1 - 256 | A unique ID that identifies the profile. |
| cir | Number | 1 - 1000000000 | The Committed Information Rate (CIR) assigned to the profile (in bps). |
| pir | Number | 16000 - 1000000000 | The Peak Information Rate (PIR) assigned to the profile (in bps). |
| shaper-profile-name | Text String | Up to 20 characters. | A description of the profile. |
The following command creates Service Bundle Shaper 1, named "p1", with a CIR value of 100000000 bps and a PIR value of 200000000 bps:
root> ethernet qos service-bundle-shaper-profile-tbl add profile-id 1 cir 100000000 pir 200000000 shaper-profile-name p1
The following command changes the CIR value in the Service Bundle Shaper created above from 100000000 bps to 110000000 bps:
root> ethernet qos service-bundle-shaper-profile-tbl edit profile-id 1 cir 110000000 pir 200000000 shaper-profile-name p1
Attaching a Shaper Profile to a Service Bundle (CLI)
You can attach one of the configured service bundle shaper profiles to each service bundle. If no profile is attached to the service bundle, no egress shaping is performed on that service bundle.
To attach a service bundle shaper profile to a service bundle, go to interface view for the service bundle and enter the following command:
eth type eth [x/x]> service-bundle-shaper add capability service-bundle-id <service-bundle-id> admin-state <admin-state> profile-id <profile-id>
To change the service bundle shaper profile attached to a service bundle, go to interface view for the interface and enter the following command:
eth type eth [x/x]> service-bundle-shaper edit service-bundle-id <service-bundle-id> admin-state <admin-state> profile-id <profile-id>
To display the service bundle shaper profile attached to a service bundle, go to interface view for the interface and enter the following command:
eth type eth [x/x]> service-bundle-shaper show configuration service-bundle-id <service-bundle-id>
To remove a service bundle shaper profile from a service bundle, go to interface view for the interface and enter the following command:
eth type eth [x/x]> service-bundle-shaper delete service-bundle-id <service-bundle-id>
Table 247 Attaching Shaper Profile to Service Bundle CLI Parameters
| Parameter | Input Type | Permitted Values | Description |
| service-bundle-id | Number 1 – 63 | Note: In the current release, only Service Bundle 1 is supported. | The service bundle to which you are attaching the queue shaper profile. |
| admin-state | Variable enable | disable | Select enable to enable egress shaping on the service bundle, or disable to disable egress shaping on the service bundle. |
| profile-id | Number | 1 – 256 | Enter the ID of one of the configured service bundle shaper profiles. |
The following command adds Service Bundle Shaper Profile 5 to Service Bundle 1, on Ethernet port 1, and enables shaping on this service bundle:
eth type eth [1/1]> service-bundle-shaper add capability service-bundle-id 1 admin-state enable profile-id 5
The following command changes the Service Bundle Shaper Profile assigned in the previous command to Service Bundle 1, from 5 to 4:
eth type eth [1/1]> service-bundle-shaper edit service-bundle-id 1 admin-state enable profile-id 4
Configuring Egress Line Compensation for Shaping (CLI)
You can configure a line compensation value for all the shapers under a specific logical interface. This value is used to compensate for Layer 1 non-effective traffic bytes on egress.
To set the egress line compensation value, go to interface view for the interface and enter the following command:
eth type eth [x/x]>shaping-compensation-value set
To display the egress line compensation value, go to interface view for the interface and enter the following command:
eth type eth [x/x]>shaping-compensation-value get
Table 248 Egress Line Compensation for Shaping CLI Parameters
| Parameter | Input Type | Permitted Values | Description |
| value Number | 0 – 26 (even numbers only) | Shapers attached to the interface use this value to compensate for Layer 1 non-effective traffic bytes on egress. |
The following command sets the egress line compensation value to 0 on Ethernet port 1:
eth type eth [1/1]>shaping-compensation-value set 0
Configuring Scheduling (CLI)
This section includes:
• Overview of Egress Scheduling (CLI)
- Configuring Queue Priority (CLI)
- Configuring Interface Priority Profiles (CLI)
- Attaching a Priority Profile to an Interface (CLI)
- Configuring Weighted Fair Queuing (WFQ) (CLI)
Overview of Egress Scheduling (CLI)
Egress scheduling is responsible for transmission from the priority queues. PTP 820G and PTP 820F use a unique algorithm with a hierarchical scheduling model over the three levels of the egress path that enables compliance with SLA requirements.
The scheduler scans all the queues over all the service bundles, per interface, and determines which queue is ready to transmit. If more than one queue is ready to transmit, the scheduler determines which queue transmits first based on:
- Queue Priority – A queue with higher priority is served before lower-priority queues.
- Weighted Fair Queuing (WFQ) – If two or more queues have the same priority and are ready to transmit, the scheduler transmits frames from the queues based on a WFQ algorithm that determines the ratio of frames per queue based on a predefined weight assigned to each queue.
Configuring Queue Priority (CLI)
A priority profile defines the exact order for serving the eight priority queues in a single service bundle. When you attach a priority profile to an interface, all the service bundles under the interface inherit the profile.
The priority mechanism distinguishes between two states of the service bundle:
• Green State – Committed state
• Yellow state – Best effort state
Green State refers to any time when the service bundle rate is below the user-defined CIR. Yellow State refers to any time when the service bundle is above the user-defined CIR but below the PIR.
You can define up to four Green priority profiles, from 4 (highest) to 1 (lowest). An additional four Yellow priority profiles are defined automatically and cannot be changed or edited.
The following table provides a sample of an interface priority profile. This profile is also used as the default interface priority profile.
Table 249 Interface Priority Profile Example
| Profile ID (1-9) | |||
| CoS | Green Priority(user defined) | Yellow Priority(read only) | Description |
| 0 | 1 | 1 | Best Effort |
| 1 | 2 | 1 | Data Service 4 |
| 2 | 2 | 1 | Data Service 3 |
| 3 | 2 | 1 | Data Service 2 |
| 4 | 2 | 1 | Data Service 1 |
| 5 | 3 | 1 | Real Time 2 (Video with large buffer) |
| 6 | 3 | 1 | Real Time 1 (Video with small buffer) |
| 7 | 4 | 4 | Management (Sync, PDUs, etc.) |
When the service bundle state is Green (committed state), the service bundle priorities are as defined in the Green Priority column. When the service bundle state is Yellow (best effort state), the service bundle priorities are system-defined priorities shown in the Yellow Priority column.

Note
CoS 7 is always marked with the highest priority and cannot be changed or edited, no matter what the service bundle state is, since it is assumed that only high priority traffic will be tunneled via CoS 7.
The system supports up to nine interface priority profiles. Profiles 1 to 8 are defined by the user, while profile 9 is the pre-defined read-only default interface priority profile.
Configuring Interface Priority Profiles (CLI)
To define an interface priority profile, enter the following command in root view:
root> ethernet qos port-priority-profile-tbl add profile-id <profile-id>
cos0-priority <cos0-priority> description <description> cos1-priority
<cos1-priority> description <description> cos2-priority <cos2-priority>
description <description> cos3-priority <cos3-priority> description
<description> cos4-priority <cos4-priority> description <description>
cos5-priority <cos5-priority> description <description> cos6-priority
<cos6-priority> description <description> cos7-priority <cos7-priority>
description <description>
To edit an existing interface priority profile, enter the following command in root view:
root> ethernet qos port-priority-profile-tbl edit profile-id <profile-id>
cos0-priority <cos0-priority> description <description> cos1-priority
<cos1-priority> description <description> cos2-priority <cos2-priority>
description <description> cos3-priority <cos3-priority> description
<description> cos4-priority <cos4-priority> description <description>
cos5-priority <cos5-priority> description <description> cos6-priority
<cos6-priority> description <description> cos7-priority <cos7-priority>
description <description>
To display the parameters of an interface priority profile, enter the following command in root view:
root> ethernet qos port-priority-profile-tbl show profile-id <profile-id>
To delete an interface priority profile, enter the following command in root view:
root> ethernet qos port-priority-profile-tbl delete profile-id <profile-id>
You can only delete an interface priority profile if the profile is not attached to any interface.
Table 250 Interface Priority Profile CLI Parameters
| Parameter | Input Type | Permitted Values Description | |
| profile-id | Number | 1 – 8 | A unique ID to identify the profile. |
| cos0-priority | Number | 1-4 | The Green priority for the CoS 0 queue, from 4 (highest) to 1 (lowest). This priority is applied to Green frames with CoS 0 egressing the service bundle to which the profile is assigned. |
| description Text String | Up to 20 characters. | A description of the priority level. | |
| cos1-priority | Number | 1-4 | The Green priority for the CoS 1 queue, from 4 (highest) to 1 (lowest). This priority is applied to Green frames with CoS 1 egressing the service bundle to which the profile is assigned. |
| cos2-priority | Number | 1-4 | The Green priority for the CoS 2 queue, from 4 (highest) to 1 (lowest). This priority is applied to Green frames with CoS 2 egressing the service bundle to which the profile is assigned. |
| cos3-priority | Number | 1-4 | The Green priority for the CoS 3 queue, from 4 (highest) to 1 (lowest). This priority is applied to Green frames with CoS 3 egressing the service bundle to which the profile is assigned. |
| cos4-priority | Number | 1-4 | The Green priority for the CoS 4 queue, from 4 (highest) to 1 (lowest). This priority is applied to Green frames with CoS 4 egressing the service bundle to which the profile is assigned. |
| cos5-priority | Number | 1-4 | The Green priority for the CoS 5 queue, from 4 (highest) to 1 (lowest). This priority is applied to Green frames with CoS 5 egressing the service bundle to which the profile is assigned. |
| cos6-priority | Number | 1-4 | The Green priority for the CoS 6 queue, from 4 (highest) to 1 (lowest). This priority is applied to Green frames with CoS 6 egressing the service bundle to which the profile is assigned. |
| cos7-priority | Number | 1-4 | The Green priority for the CoS 7 queue, from 4 (highest) to 1 (lowest). This priority is applied to Green frames with CoS 7 egressing the service bundle to which the profile is assigned. |
The following command configures a priority profile with Profile ID 1.
root> ethernet qos port-priority-profile-tbl add profile-id 1 cos0-priority 1 description c0_p1 cos1-priority 1 description c1_p1 cos2-priority 1 description c2_p1 cos3-priority 2 description c3_p2 cos4-priority 2 description c4_p2 cos5-priority 3 description c5_p3 cos6-priority 4 description c6_p4 cos7-priority 4 description c7_p4
This profile has the parameters listed in the following table.
Table 251 Interface Priority Sample Profile Parameters
| CoS | Green Priority (user defined) | Yellow Priority (read only) | Description |
| 0 1 1 c0_p1 | |||
| 1 1 1 c1_p1 | |||
| 2 1 1 c2_p1 | |||
| 3 2 1 c3_p2 | |||
| 4 2 1 c4_p2 | |||
| 5 3 1 c5_p3 | |||
| 6 4 1 c6_p4 | |||
| 7 4 4 c7_p4 |
The following command edits the profile you created in the previous command so that CoS 6 queues have a Green priority of 3 instead of 4, and a description of "c6_p3".
root> ethernet qos port-priority-profile-tbl edit profile-id 1 cos0-priority 1 description c0_p1 cos1-priority 1 description c1_p1 cos2-priority 1 description c2_p1 cos3-priority 2 description c3_p2 cos4-priority 2 description c4_p2 cos5-priority 3 description c5_p3 cos6-priority 3 description c6_p3 cos7-priority 4 description c7_p4
Attaching a Priority Profile to an Interface (CLI)
To attach a priority profile to an interface, go to interface view for the interface and enter the following command:
eth type eth [x/x]> priority set profile-id <profile-id>
Table 252 Attaching Priority Profile to Interface CLI Parameters
| Parameter | Input Type | Permitted Values Description | |
| profile-id | Number | 1 – 9 | Enter the ID of one of the configured logical interface priority profiles. |
The following command attaches Interface Priority Profile 3 to GbE 1:
eth type eth [1/1]> priority set profile-id 3
To display which priority profile is attached to an interface, go to interface view for the interface and enter the following command:
eth type eth [x/x]> port-priority show profile-id
The following is a sample output from this command:
eth type eth [1/1]>port-priority show profile-id
Profile ID: 9

CoS Priority Priority Description
(When queue is green) When queue is yellow)
0 1 1 best effort
1 2 1 data service
2 2 1 data service
3 2 1 data service
4 2 1 data service
5 3 1 real time
6 3 1 real time
7 4 4 management
eth type eth [1/1]>
Configuring Weighted Fair Queuing (WFQ) (CLI)
This section includes:
• Overview of WFQ (CLI)
- Configuring a WFQ Profile (CLI)
- Attaching a WFQ Profile to an Interface (CLI)
Overview of WFQ (CLI)
The scheduler serves the queues based on their priority, but when two or more queues have data to transmit and their priority is the same, the scheduler uses Weighted Fair Queuing (WFQ) to determine the priorities within each priority. WFQ defines the transmission ratio, in bytes, between the queues. All the service bundles under the interface inherit the WFQ profile attached to the interface.
The system supports up to six WFQ interface profiles. Profile ID 1 is a pre-defined read-only profile, and is used as the default profile. Profiles 2 to 6 are user-defined profiles.
The following table provides an example of a WFQ profile.
Table 253 WFQ Profile Example
| Profile ID (1-7) | |
| CoS Queue Weight (Green) | Queue Weight (Yellow – not visible to users, and cannot be edited) |
| 0 20 20 | |
| 1 20 20 | |
| 2 20 20 | |
| 3 20 20 | |
| 4 20 20 | |
| 5 20 20 | |
| 6 20 20 | |
| 7 20 20 | |
You can attach one of the configured interface WFQ profiles to each interface. By default, the interface is assigned Profile ID 1, the pre-defined system profile.
Configuring a WFQ Profile (CLI)
To define a WFQ profile, enter the following command in root view:
root> ethernet qos wfq-weight-profile-tbl add profile-id <profile.id>
cos0-weight <cos0-weight> cos1-weight <cos1-weight> cos2-weight <cos2-weight> cos3-weight <cos3-weight> cos4-weight <cos4-weight> cos5-weight <cos5-weight> cos6-weight <cos6-weight> cos7-weight <cos7-weight>
To edit an existing WFQ profile, enter the following command in root view:
root> ethernet qos wfq-weight-profile-tbl edit profile-id <profile.id> cos0-weight <cos0-weight> cos1-weight <cos1-weight> cos2-weight <cos2-weight> cos3-weight <cos3-weight> cos4-weight <cos4-weight> cos5-weight <cos5-weight> cos6-weight <cos6-weight> cos7-weight <cos7-weight>
To display the parameters of a WFQ profile, enter the following command in root view:
root> ethernet qos wfq-weight-profile-tbl show profile-id
To delete a WFQ profile, enter the following command in root view:
root> ethernet qos wfq-weight-profile-tbl delete profile-id
You can only delete WFQ profile if the profile is not attached to any interface.
Table 254 WFQ Profile CLI Parameters
| Parameter | Input Type | Permitted Values Description | |
| profile-id | Number | 2 – 6 | A unique ID to identify the profile. |
| cos0-weight | Number | 1 - 20 | The relative weight for the CoS 0 queue. |
| cos1- weight | Number | 1 - 20 | The relative weight for the CoS 1 queue. |
| cos2- weight | Number | 1 - 20 | The relative weight for the CoS 2 queue. |
| cos3- weight | Number | 1 - 20 | The relative weight for the CoS 3 queue. |
| cos4- weight | Number | 1 - 20 | The relative weight for the CoS 4 queue. |
| cos5- weight | Number | 1 - 20 | The relative weight for the CoS 5 queue. |
| cos6- weight | Number | 1 - 20 | The relative weight for the CoS 6 queue. |
| cos7- weight | Number | 1 - 20 | The relative weight for the CoS 7 queue. |
The following command configures a WFQ profile with Profile ID 2.
root> ethernet qos wfq-weight-profile-tbl add profile-id 2 cos0-weight 15 cos1-weight 15 cos2-weight 15 cos3-weight 15 cos4-weight 15 cos5-weight 15 cos6-weight 15 cos7-weight 20
This profile has the parameters listed in the following table. Note that the yellow queue weight is constant and cannot be changed. This means that all best effort traffic (yellow) will always have the same weight, regardless of CoS.
Table 255 WFQ Sample Profile Parameters
| CoS Queue Weight (Green) | Queue Weight (Yellow – not visible to users, and cannot be edited) |
| 0 15 20 | |
| 1 20 20 | |
| 2 20 20 | |
| 3 20 20 | |
| 4 20 20 | |
| 5 20 20 | |
| 6 20 20 | |
| 7 20 20 |
The following command edits the profile you created in the previous command so that CoS 6 queues have a weight of 20 instead of 15:
root> ethernet qos wfq-weight-profile-tbl edit profile-id 2 cos0-weight 15 cos1-weight 15 cos2-weight 15 cos3-weight 15 cos4-weight 15 cos5-weight 15 cos6-weight 20 cos7-weight 20
Attaching a WFQ Profile to an Interface (CLI)
To attach a WFQ profile to an interface, go to interface view for the interface and enter the following command:
eth type eth [x/x]> port-wfq set profile-id
Table 256 Attaching WFQ Profile to Interface CLI Parameters
| Parameter | Input Type | Permitted Values Description | |
| profile-id | Number | 1 – 6 | Enter the ID of one of the configured WFQ profiles. |
The following command attaches WFQ Profile 3 to Ethernet port 1:
eth type eth [1/1]> port-wfq set profile-id 3
To display which WFQ profile is attached to an interface, go to interface view for the interface and enter the following command:
eth type eth [x/x]> port-wfq show profile-id
The following is a sample display for this command:
eth type eth [1/1]>port-wfq show profile-id
Profile ID: 1
CoS Queue Weight
(Green)
0 20
1 20
2 20
3 20
4 20
5 20
6 20
7 20
eth type eth [1/1]>
Displaying Egress Statistics (CLI)
PTP 820G and PTP 820F collects egress PMs at the queue level and the service bundle level.
Displaying Queue-Level PMs (CLI)
PTP 820G and PTP 820F supports the following counters per queue at the queue level:
• Transmitted Green Packets (64 bits counter)
• Transmitted Green Bytes (64 bits counter)
• Transmitted Green Bits per Second (32 bits counter)
• Dropped Green Packets (64 bits counter)
- Dropped Green Bytes (64 bits counter)
• Transmitted Yellow Packets (64 bits counter)
• Transmitted Yellow Bytes (64 bits counter)
• Transmitted Yellow Bits per Second (32 bits counter)
• Dropped Yellow Packets (64 bits counter)
• Dropped Yellow Bytes (64 bits counter)
To display queue-level PMs, enter interface view for the interface and enter the following command:
eth type eth [x/x]> tm-queue show statistics service-bundle-id <service-bundle-id> cos <cos> clear-on-read <clear-on-read> layer-1 <layer-1>
To clear queue-level PMs for a specific service bundle, enter interface view for the interface and enter the following command:
eth type eth [x/x]> tm-queue clear statistics service-bundle-id <service-bundle-id>
Table 257 Egress Queue Level PMs CLI Parameters
| Parameter | Input Type | Permitted Values Description | |
| service-bundle-id | Number | 1 – 63Note: In the current release, only Service Bundle 1 is supported. | The service bundle for which you want to display PMs. |
| cos | Number | 0 - 7 | The queue for which you want to display PMs. |
| clear-on-read | Boolean | yes no | If you enter yes, the statistics are cleared once you display them. |
| Parameter | Permitted | ||
| Input Type | Values | Description | |
| layer-1 | Boolean | yes | yes – Statistics are represented as Layer 1 |
| no | statistics, including preamble and IFG. | ||
| no – Statistics are represented as Layer 2 statistics. | |||
The following command displays PMs for the CoS 0 queue in Service Bundle 1, on GbE 2. The PMs are cleared after they are displayed.
eth type eth [1/2]> tm-queue show statistics service-bundle-id 1 cos 0 clear-on-read yes layer-1 yes
The following command clears PMs for all queues in Service Bundle 1, on GbE 2.
eth type eth [1/2]> tm-queue clear statistics service-bundle-id 1
Configuring and Displaying Queue-Level PMs (CLI)
PTP 820 devices support advanced traffic PMs per CoS queue and service bundle. For each logical interface, you can configure thresholds for Green and Yellow traffic per queue. You can then display the following PMs for 15-minute and 24-hour intervals, per queue and color:
• Maximum bytes passed per second
• Minimum bytes passed per second
• Average bytes passed per second
• Maximum bytes dropped per second
• Minimum bytes dropped per second
• Average bytes dropped per second
• Maximum packets passed per second
• Minimum packets passed per second
• Average packets passed per second
• Maximum packets dropped per second
• Minimum packets dropped per second
• Average packets dropped per second
• Seconds bytes per second were over the configured threshold per interval
These PMs are available for any type of logical interface, including groups. To activate collection of these PMs, the user must add a PM collection rule on a logical interface and service bundle and set the relevant thresholds per CoS and Color. When the PM is configured on a group, queue traffic PMs are recorded for the group and not for the individual interfaces that belong to the group.
One collection rule is available per interface.
PMs for queue traffic are saved for 30 days, after which they are removed from the database. It is important to note that they are not persistent, which means they are not saved in the event of unit reset.
To configure and display queue-level PMs, you must first enter interface view. See Entering Interface View (CLI).
To display whether any service bundles are configured on an interface, enter the following command in interface view:
eth type eth [x/x]> eth type eth [1/2]>pm tm-queue show configuration all
If no service bundles have been configured, the following output is displayed:
eth type eth [x/x]>pm tm-queue show configuration all
Num entries: 0
If a service bundle has been configured and enabled, the following output is displayed:
eth type eth [x/x]>pm tm-queue show configuration all
Service bundle: 1 Admin: enable
Num entries: 1
If a service bundle has been configured but it's Admin status is disabled, the following output is displayed:
eth type eth [x/x]>pm tm-queue show configuration all
Service bundle: 1 Admin: disable
Num entries: 1
To configure a service bundle, enter the following command in interface view:
eth type eth [x/x]> pm tm-queue create service-bundle-id <1-6> admin-state <enable|disable>
To change the Admin state of a service bundle, enter the following command in interface view:
eth type eth [x/x]> pm tm-queue set service-bundle-id <1-6> admin-state <enable|disable>
To remove a service bundle, enter the following command in interface view:
eth type eth [x/x]> pm tm-queue remove service-bundle-id <1-6>
For example:
eth type eth [1/1]>pm tm-queue remove service-bundle-id 1
WARNING: All PM history for that service bundle will be deleted.
Are you sure? (yes/no):yes
eth type eth [1/1]>
To display the threshold settings for a service bundle, enter the following command in interface view:
eth type eth [x/x]> pm tm-queue show configuration service-bundle-id <1-6>
For example:
eth type eth [1/1]>pm tm-queue show configuration service-bundle-id 1
Admin: enable
cos0 green bytes passed threshold: 675000 bytes
cos1 green bytes passed threshold: 675000 bytes
cos2 green bytes passed threshold: 675000 bytes
cos3 green bytes passed threshold: 675000 bytes
cos4 green bytes passed threshold: 675000 bytes
cos5 green bytes passed threshold: 675000 bytes
cos6 green bytes passed threshold: 675000 bytes
cos7 green bytes passed threshold: 675000 bytes
cos0 yellow bytes passed threshold: 675000 bytes
cos1 yellow bytes passed threshold: 675000 bytes
cos2 yellow bytes passed threshold: 100000 bytes
cos3 yellow bytes passed threshold: 675000 bytes
cos4 yellow bytes passed threshold: 675000 bytes
cos5 yellow bytes passed threshold: 675000 bytes
cos6 yellow bytes passed threshold: 675000 bytes
cos7 yellow bytes passed threshold: 675000 bytes
To set thresholds for green bytes, enter the following command in interface view:
eth type eth [x/x]> pm tm-queue set service-bundle-id <1-6> cos <0-7> green-bytes-passed-threshold <0-4294967295>
To set thresholds for yellow bytes, enter the following command in interface view:
eth type eth [x/x]> pm tm-queue set service-bundle-id <1-6> cos <0-7> yellow-bytes-passed-threshold <0-4294967295>
To display PMs for green bytes passed, enter the following command in interface view:
eth type eth [x/x]> pm tm-queue show counter green_bytes_passed service-bundle-id 1 cos <0-7> interval <15min|24hr>
For example:
eth type eth [1/2]>exit
root> ethernet interfaces eth slot 1 port 1
eth type eth [1/1]>pm tm-queue show counter green_bytes_passed service-bundle-id 1 cos 1 interval 24hr
PM on TM counters:
interval    integrity    max cos1 green bytes passed per second    min cos1 green bytes passed per second    avg cos1 green bytes passed per second    cos1 seconds green bytes passed threshold
To display PMs for green packets passed, enter the following command in interface view:
eth type eth [x/x]> pm tm-queue show counter green_packets_passed service-bundle-id 1 cos <0-7> interval <15min|24hr>
For example:
eth type eth [1/1]>pm tm-queue show counter green_packets_passed service-bundle-id 1 cos 1 interval 24hr
PM on TM counters:
interval integrity max cos1 green min cos1 green avg cos1 green packets passed packets passed packets passed per second per second per second
To display PMs for green bytes dropped, enter the following command in interface view:
eth type eth [x/x]> pm tm-queue show counter green_bytes_dropped service-bundle-id 1 cos <0-7> interval <15min|24hr>
For example:
eth type eth [1/1]>pm tm-queue show counter green_bytes_dropped service-bundle-id 1 cos 1 interval 24hr
PM on TM counters:
interval integrity max cos1 green min cos1 green avg cos1 green bytes dropped bytes dropped bytes dropped per second per second per second
To display PMs for green packets dropped, enter the following command in interface view:
eth type eth [x/x]> pm tm-queue show counter green_packets_dropped service-bundle-id 1 cos <0-7> interval <15min|24hr>
For example:
eth type eth [1/1]>pm tm-queue show counter green_packets_dropped service-bundle-id 1 cos 1 interval 24hr
PM on TM counters:
interval    integrity    max cos1 green min cos1 green avg cos1 green
    packets    packets    packets
    dropped per   dropped per   dropped per
    second    second    second
To display PMs for yellow bytes passed, enter the following command in interface view:
eth type eth [x/x]> pm tm-queue show counter yellow_bytes_passed service-bundle-id 1 cos <0-7> interval <15min|24hr>
For example:
eth type eth [1/1]>pm tm-queue show counter yellow_bytes_passed service-bundle-id 1 cos 1 interval 15min
PM on TM counters:
interval    integrity    max cos1    min cos1    avg cos1    cos1 seconds
        yellow bytes    yellow bytes    yellow bytes    yellow bytes
        passed per    passed per    passed per    passed per
        second    second    second    threshold
To display PMs for yellow packets passed, enter the following command in interface view:
eth type eth [x/x]> pm tm-queue show counter yellow_packets_passed service-bundle-id 1 cos <0-7> interval <15min|24hr>
For example:
eth type eth [1/1]>pm tm-queue show counter yellow_packets_passed service-bundle-id 1 cos 1 interval 15min
PM on TM counters:
====================
interval    integrity    max cos1    min cos1    avg cos1
        yellow packets    yellow packets    yellow packets
        passed per    passed per    passed per
        second    second    second
====================
To display PMs for yellow bytes dropped, enter the following command in interface view:
eth type eth [x/x]> pm tm-queue show counter yellow_bytes_dropped service-bundle-id 1 cos <0-7> interval <15min|24hr>
For example:
eth type eth [1/1]>pm tm-queue show counter yellow_bytes_dropped service-bundle-id 1 cos 1 interval 15min
PM on TM counters:
interval    integrity    max cos1    min cos1    avg cos1
    yellow bytes    yellow bytes    yellow bytes
    dropped per    dropped per    dropped per
    second    second    second
To display PMs for yellow packets dropped, enter the following command in interface view:
eth type eth [x/x]> pm tm-queue show counter yellow_packets_dropped service-bundle-id 1 cos <0-7> interval <15min|24hr>
For example:
eth type eth [1/1]>pm tm-queue show counter yellow_packets_dropped service-bundle-id 1 cos 1 interval 15min
PM on TM counters:
interval    integrity    max cos1    min cos1    avg cos1
    yellow packets    yellow packets    yellow packets
    dropped per    dropped per    dropped per
    second    second    second
The integrity column indicates whether the PM is valid:
- 0 indicates a valid entry.
1 indicates an invalid entry. This can occur for a number of reasons, including but not limited to a disconnected cable, a missing SFP module, muting of a radio interface, and an operational status of Down
Displaying Service Bundle-Level PMs (CLI)
PTP 820G and PTP 820F supports the following counters per service bundle at the service bundle level:
• Transmitted Green Packets (64 bits counter)
• Transmitted Green Bytes (64 bits counter)
• Transmitted Green Bits per Second (32 bits counter)
• Dropped Green Packets (64 bits counter)
- Dropped Green Bytes (64 bits counter)
• Transmitted Yellow Packets (64 bits counter)
• Transmitted Yellow Bytes (64 bits counter)
• Transmitted Yellow Bits per Second (32 bits counter)
• Dropped Yellow Packets (64 bits counter)
• Dropped Yellow Bytes (64 bits counter)
To display service bundle-level PMs, enter interface view for the interface and enter the following command:
eth type eth [x/x]> tm-service-bundle show statistics service-bundle-id <service-bundle-id> clear-on-read <clear-on-read> layer-1 <layer-1>
To clear service bundle-level PMs for all service bundles on an interface, enter interface view for the interface and enter the following command:
eth type eth [x/x]> tm-service-bundle clear statistics
Table 258 Egress Service Bundle Level PMs CLI Parameters
| Parameter | Input Type | Permitted Values | Description |
| service-bundle-id | Number 1 – 63 | Note: In the current release, only Service Bundle 1 is supported. | The service bundle for which you want to display PMs. |
| clear-on-read | Boolean yes | no | If you enter yes, the statistics are cleared once you display them. |
| layer-1 | Boolean yes | no | yes – Statistics are represented as Layer 1 statistics, including preamble and IFG.no – Statistics are represented as Layer 2 statistics. |
The following command displays service bundle PMs for Service Bundle 1, on GbE 1. The PMs are cleared after they are displayed.
eth type eth [1/1]> tm-service-bundle show statistics service-bundle-id 1 clear-on-read yes layer-1 yes
Chapter 20: Ethernet Protocols (CLI)
This section includes:
- Configuring G.8032 (CLI)
- Configuring MSTP (CLI)
- Configuring LLDP (CLI)
Configuring G.8032 (CLI)
This section includes:
- Configuring the Destination MAC Address (CLI)
- Configuring ERPIs (CLI)
- Configuring the RPL Owner (CLI)
- Configuring Timers (CLI)
- Initiating a Manual or Forced Switch and Clearing the Switch or Initiating Reversion (CLI)
- Blocking or Unblocking R-APS Messages on a Service Point (CLI)
• Displaying the ERPI Attributes (CLI)
Configuring the Destination MAC Address (CLI)
To set the destination MAC address for PDUs generated by the node, enter the following command in root view:
root> ethernet generalcfg g8032-dest-mac-address set MAC <MAC address>
To display the destination MAC address, enter the following command in root view:
root> ethernet generalcfg g8032-dest-mac-address show
To display the destination MAC address and the node ID, enter the following command in root view:
root> ethernet g8032 show-node-attributes
The node ID is the base MAC address for the node.
Table 259 G.8032 Destination MAC Address CLI Parameters
| Parameter | Input Type | Permitted Values | Description |
| MAC address | Six groups of two hexadecimal digits | 01:19:a7:00:00:x where x can be any number between 0 and 16. | The destination MAC address for PDUs generated by the node. |
The following command sets the destination MAC address as 01:19:a7:00:00:02:
root> ethernet generalcfg g8032-dest-mac-address set MAC
01:19:a7:00:00:02
Configuring ERPIs (CLI)
You can configure up to 64 Ethernet Ring Protection instances (ERPIs). Each ERPI is associated with an Ethernet service defined in the system. An ERPI can be:
- Ring: A Ring is an Ethernet ring that is connected on two ports (East and West service points) to an interconnection node.
- Sub-Ring: A Sub-Ring is an Ethernet ring which is connected to another ring or network through the use of interconnection nodes (East and West service points). On their own, the Rub-Ring links do not form a closed physical loop. A closed loop may be formed by the sub-ring links and the link between interconnection nodes that is controlled by other ring or network.
- Ring with Sub-Ring: The ERPI includes both a ring, with East and West service points, and a connection to a sub-ring using a Sub-Ring service point.

Note
Service points on the PTP 820 side of the link must have a single, determinate VLAN. This means the service point type must be dot1q, s-tag, or QinQ. On the customer side, any service point type can be used.
To add a Ring ERPI, enter the following command in root view:
root> ethernet g8032 create-erpi erp-type ring erpi-id <erpi-id> erpi-service-id <erpi-service-id> west-sp <west-sp> east-sp <east-sp> level <level> version <version>
To add a Sub-Ring ERPI, enter the following command in root view:
root> ethernet g8032 create-erpi erp-type sub-ring erpi-id <erpi-id> erpi-service-id <erpi-service-id> west-sp <west-sp> east-sp <east-sp> level <level> version <version>
To add a Ring with Sub-Ring ERPI, enter the following command in root view:
root> ethernet g8032 create-erpi erp-type ring-with-sub-ring erpi-id <erpi-id> erpi-service-id <erpi-service-id> west-sp <west-sp> east-sp <east-sp> sub-ring-sp <sub-ring-sp> level <level> version <version>
To assign a name to an ERPI, enter the following command in root view:
root> ethernet g8032 set-erpi-name erpi-id <erpi-id> erpi-name <erpi-name>
To delete an ERPI, enter the following command in root view:
root> ethernet g8032 delete-erpi erpi-id 1
Table 260 G.8032 ERPI Configuration CLI Parameters
| Parameter | Input Type | Permitted Values | Description |
| erpi-id | Number | 1-64 | A unique ID that identifies the ERPI. |
| erpi-service-id | Number | 1-4095 | The ID of the Ethernet service to which the ERPI belongs. |
| west-sp | Number | 1-32 | The first endpoint for the ERPI. This can be any service point that has been configured for the service. |
| east-sp | Number | 1-32 | The second endpoint for the ERPI. This can be any service point that has been configured for the service. |
| sub-ring-sp | Number | 1-32 | The service point that connects the Ring with the Sub-Ring. This can be any service point that has been configured for the service. |
| level Number 0-7 | Optional. The Maintenance Entity Group (MEG) level used for R-APS messages sent in the ERPI. | ||
| version Number 1-2 | Optional. The ERPI (G.8032) protocol version currently being used in the unit. | ||
| erpi-name | Text | A descriptive name for the ERPI. | |
The following commands create a Ring ERPI with ID 1, and name the ERPI "service_x". This ERPI is associated with Ethernet Service 1. The end points of the ERPI are Service Point 1 and Service Point 2. The ERPI is configured with MEG level 2
root> ethernet g8032 create-erpi erp-type ring erpi-id 1 erpi-service-id 1 west-sp 1 east-sp 2 level 2
root> ethernet g8032 set-erpi-name erpi-id 1 erpi-name service_x
The following commands create a Sub-Ring ERPI with ID 10, and name the ERPI "Sub_ring". This ERPI is associated with Ethernet Service 20. The end points of the ERPI are Service Point 1 and Service Point 2. The ERPI is configured with MEG level 4
root> ethernet g8032 create-erpi erp-type sub-ring erpi-id 10 erpi-service-id 20 west-sp 1 east-sp 2 level 4
root> ethernet g8032 set-erpi-name erpi-id 1 erpi-name Sub_ring
The following commands create a Ring with Sub-Ring ERPI with ID 20, and name the ERPI "RSRi". This ERPI is associated with Ethernet Service 30. The end points of the ERPI are Service Point 1 and Service Point 2, and the point of connection between the Ring and the Sub-Ring is Service Point 3. The ERPI is configured with MEG level 5
root> ethernet g8032 create-erpi erp-type ring-with-sub-ring erpi-id 20 erpi-service-id 30 west-sp 1 east-sp 2 sub-ring-sp 3 level 5 root> ethernet g8032 set-erpi-name erpi-id 1 erpi-name RSRi
The following command deletes ERPI 1:
root> ethernet g8032 delete-erpi erpi-id 1
Configuring the RPL Owner (CLI)
The RPL Owner Node is a node in the ERPI that is responsible for blocking traffic at one end of the ERPI.
To set the RPL Owner Node, enter the following command in root view:
root> ethernet g8032 set-rpl-owner erpi-id <erpi-id> SP <SP>
To remove the RPL Owner Node, enter the following command in root view:
root> ethernet g8032 remove-rpl-owner erpi-id <erpi-id>
Table 261 G.8032 RPL Owner CLI Parameters
| Parameter | Input Type | Permitted Values | Description |
| erpi-id | Number | 1-64 | The ID of the ERPI for which you want to set or delete the RPL owner. |
| SP | Number or Variable | east west sub-ring | Specifies the service point you want to designate as the RPL owner. |
The following command sets the East service point as the RPL owner for ERPI 1:
root> ethernet g8032 set-rpl-owner erpi-id 1 SP east
The following command sets the Sub-Ring service point as the RPL owner for ERPI 20:
root> ethernet g8032 set-rpl-owner erpi-id 20 SP sub-ring
The following command removes the RPL owner for ERPI 1:
root> ethernet g8032 remove-rpl-owner erpi-id 1
Configuring Timers (CLI)
You can configure timers per ERPI to control the ERPI's switching and convergence parameters. The following timers are available:
- Wait to Restore (WTR) Timer – Defines a minimum time the system waits after signal failure is recovered before reverting to idle state.
- Guard Time – Prevents unnecessary state changes and loops.
- Hold-Off Time – Determines the time period from failure detection to response.
To configure the WTR timer, enter the following command in root view:
root> ethernet g8032 set-wtr erpi-id <erpi-id> wtr <wtr>
To configure the guard time, enter the following command in root view:
root> ethernet g8032 set-guard-time erpi-id <erpi-id> guard-time <guard-time>
To configure the hold-off, enter the following command in root view:
root> ethernet g8032 set-holdoff-time erpi-id <erpi-id> holdoff-time <holdoff-time>
Table 262 G.8032 Timer Configuration CLI Parameters
| Parameter | Input Type | Permitted Values | Description |
| erpi-id | Number | 1-64 | The ID of the ERPI for which you want to set a timer. |
| wtr Number 1-12 | The minimum time (in minutes) the system waits after signal failure is recovered before reverting to idle state. | ||
| guard-time Number | 10-2000, in multiples of 10 | The minimum time (in msec) the system waits after recovery from a signal failure before accepting new R-APS messages. The purpose of this timer is to prevent unnecessary state changes and loops. | |
| holdoff-time Number | 0-10000, in multiples of 100 | The minimum time (in msec) the system waits before reacting to a signal failure. | |
The following command sets the WTR timer for ERPI 1 to 2 minutes:
root> ethernet g8032 set-wtr erpi-id 1 wtr 2
The following command sets the guard time for ERPI 1 to 20 msecs:
root> ethernet g8032 set-guard-time erpi-id 1 guard-time 20
The following command sets the hold-off time for ERPI 1 to 1000 msecs:
root> ethernet g8032 set-holdoff-time erpi-id 1 holdoff-time 1000
Initiating a Manual or Forced Switch and Clearing the Switch or Initiating Reversion (CLI)
To initiate a forced switch, enter the following command in root view:
root> ethernet g8032 fs-erpi erpi-id <erpi-id> SP <SP>
To initiate a manual switch, enter the following command in root view:
root> ethernet g8032 ms-erpi erpi-id <erpi-id> SP <SP>
You can use a "clear" command to clear a forced or manual switch. You can also use a "clear" command to trigger convergence prior to the expiration of the relevant timer. To issue a "clear" command, enter the following command in root view:
root> ethernet g8032 clear-erpi erpi-id <erpi-id> SP <SP>
Table 263 G.8032 Switching and Reversion CLI Parameters
| Parameter | Input Type | Permitted Values | Description |
| erpi-id | Number | 1-64 | The ID of the ERPI on which you want to perform or clear the switch or initiate convergence. |
| SP | Number or Variable | east west sub-ring | Specifies the service point on which to clear the manual or forced switch or to implement convergence. |
The following command initiates a forced switch in the East service point of ERPI 1:
root> ethernet g8032 fs-erpi erpi-id 1 SP east
The following command initiates a manual switch in the Sub-Ring service point of ERPI 20:
root> ethernet g8032 ms-erpi erpi-id 20 SP sub-ring
The following command initiates convergence in the East service point of ERPI 1:
root> ethernet g8032 clear-erpi erpi-id 1 SP east
Blocking or Unblocking R-APS Messages on a Service Point (CLI)
To enable or disable transmission of R-APS messages on a service point, enter the following command in root view:
root> ethernet g8032 set-erpi-sp-tx-raps-cntrl erpi-id <erpi-id> SP <SP> tx-raps <tx-raps>
Table 264 G.8032 Switching and Reversion CLI Parameters
| Parameter | Input Type | Permitted Values | Description |
| erpi-id | Number | 1-64 | The ID of the ERPI on which you want to perform or clear the switch or initiate convergence. |
| SP Variable | eastwestsub-ring | Specifies the service point on which to clear the manual or forced switch or to implement convergence. | |
| tx-raps Variable | truefalse | true – R-APS message transmission is enabled on the service point.false – R-APS message transmission is blocked on the service point. |
Displaying the ERPI Attributes (CLI)
To display a list of all ERPIs configured on the unit, enter the following command in root view:
root> ethernet g8032 show-all-erpi
The following is an example of this command's output.
root> ethernet g8032 show-all-erpi
| ERPI id | ERPI name | Service | User instance | Ring state | West SP | East SP | Sub-ring SP |
| 1 | 1 | 1 | protecting | 3 | 2 | 1 | |
| 2 | 2 | 2 | protecting | 3 | 2 | N/A | |
| 3 | 5 | 5 | protecting | 3 | 2 | N/A | |
| 4 | 6 | 6 | protecting | 3 | 2 | N/A | |
| 5 | 7 | 7 | protecting | 3 | 2 | N/A | |
| 6 | 8 | 8 | protecting | 3 | 2 | N/A | |
| 8 | 3 | 15 | protecting | 2 | 1 | N/A | |
| 16 | 4 | 16 | protecting | 2 | 1 | N/A |
root>
To display all ERPIs that include a service point on a specific port, enter the following command in root view:
root> ethernet g8032 show-all-port-erpi interface <interface> slot <slot> port <port>
To display all ERPIs that include a service point on a specific group, enter the following command in root view:
root> ethernet g8032 show-all-port-erpi group <group>
The following command displays all ERPIs with a service point on port 1 of the TCC in slot 1:
root> ethernet g8032 show-all-port-erpi interface eth slot 1 port 1
The following command displays all ERPIs with a service point on LAG group 1:
root> ethernet g8032 show-all-port-erpi group lag1
The following command displays all ERPIs with a service point on HSB protection group 2:
root> ethernet g8032 show-all-port-erpi group rp2
The following command displays all ERPIs with a service point on Multi-Carrier ABC group 1:
root> ethernet g8032 show-all-port-erpi group mc-abc1
The following is an example of this command's output.
[root> ethernet g8032 show-all-port-erpi interface radio slot 5 port 1
| ERPI id | ERPI name | Service | userinstance | Ring state | West SP | East SP | Sub-ring SP |
| 1 | 1 | 1 | protecting | 3 | 2 | 1 | |
| 2 | 2 | 2 | protecting | 3 | 2 | N/A | |
| 3 | 5 | 5 | protecting | 3 | 2 | N/A | |
| 4 | 6 | 6 | protecting | 3 | 2 | N/A | |
| 5 | 7 | 7 | protecting | 3 | 2 | N/A | |
| 6 | 8 | 8 | protecting | 3 | 2 | N/A | |
| 8 | 3 | 15 | protecting | 2 | 1 | N/A | |
| 16 | 4 | 16 | protecting | 2 | 1 | N/A |
root>
To display detailed information about a specific ERPI, enter the following command in root view:
root> ethernet g8032 show-erpi-config erpi-id <erpi-id>
The following command displays detailed output for ERPI 1:
root> ethernet g8032 show-erpi-config erpi-id 1
The following is an example of this command's output.
root> ethernet g8032 show-erpi-config erpi-id 1
| ERPI id | ERPI name | Service | user | west SP | East SP | Sub-ring SP | ERPI type | MEG level | version | virtual | RPL owner | |
| instance | channel | |||||||||||
| 1 | 1 | 1 | 3 | 2 | 1 | ring | 1 | 2 | 0 | none | ||
| Revertive | WTR | guard time | Hold-off time | SD handling | West SP SD capacity threshold | East SP SD capacity threshold | sub-ring SP SD capacity threshold | |||||
| true | 5 | 500 | 0 | 2 | 50 | 50 | 50 | |||||
root>
To display state information about a specific ERPI, enter the following command in root view:
root> ethernet g8032 show-erpi-dynamic erpi-id <erpi-id>
The following command displays detailed output for ERPI 1:
root> ethernet g8032 show-erpi-dynamic erpi-id 1
The following is an example of this command's output.
root> ethernet g8032 show-erpi-dynamic erpi-id 1
| |ERPI id | |Ring state | |Local state | |Remote state | |Last HP request | |Last change time |
| |1 | |protecting | |clear-sf | |raps-sf | |nr | |0 |
root>
Table 265 G.8032 ERPI Display Command Input Parameters
| Parameter | Input Type | Permitted Values | Description |
| interface Variable | eth | Enter the type of interface: | |
| radio | eth – Ethernet | ||
| pwe | radio – Radio | ||
| pwe – TDM | |||
| group Variable | rp1 | To display ERPIs that include a service point on a 1+1 HSB group, a LAG group, or a Multi-Carrier ABC group, use this parameter instead of the interface, slot, and port parameters to identify the group. See:• Configuring HSB Radio Protection (CLI)• Configuring Link Aggregation (LAG) and LACP (CLI)• Configuring Multi-Carrier ABC (CLI) | |
| rp2 | |||
| rp3 | |||
| rp4 | |||
| lag1 | |||
| lag2 | |||
| lag3 | |||
| lag4 | |||
| mc-abc1 | |||
| mc-abc2 | |||
| mc-abc3 | |||
| mc-abc4 | |||
| slot Number 1 | |||
| port Number | ethernet: 1-6radio: 1-2management: 1-2tdm: 1 | The interface for which you want to display ERPIs. | |
| erpi-id | Number | 1-64 | The ID of the ERPI for which you want to perform or clear the switch, initiate convergence, or display information. |
Table 266 G.8032 ERPI Display Command Output Parameters
| Parameter Description | |
| ERPI ID | A unique ID that identifies the ERPI. |
| ERPI Name | A descriptive name for the ERPI. |
| Service | The ID of the Ethernet service to which the ERPI belongs. |
| User Instance | The MSTI to which the Ethernet service is mapped. |
| Ring State | Indicates the current ERPI state. Possible values are:InitializingIdlePendingProtectingFS (Forced Switch)MS (Manual Switch) |
| West SP | The interface to which the west ERPI service point belongs. |
| East SP | The interface to which the east ERPI service point belongs. |
| Sub-Ring SP | The interface to which the ERPI service point that connects the Ring to the Sub-Ring belongs. |
| ERPI Type | The ERPI type (Ring, Sub-Ring, or Ring with Sub-Ring). |
| MEG Level | The Maintenance Entity Group (MEG) level used for R-APS messages sent in the ERPI. |
| Version | The ERPI (G.8032) protocol version currently being used in the unit. |
| Virtual Channel Reserved for future use. | |
| RPL Owner | Indicates whether the ERPI is currently an RPL owner, and if it is, which ERPI port is the owner. |
| Revertive | Indicates whether the ERPI is currently in revertive mode. |
| WTR | The Wait to Restore (WTR) timer. This timer sets the minimum time (in minutes) the system waits after signal failure before entering revertive mode. |
| Guard Time | The minimum time (in msec) the system waits after recovery from a signal failure before accepting new R-APS messages. The purpose of this timer is to prevent unnecessary state changes that might be caused by outdated messages. |
| Hold-Off Time | The minimum time (in msec) the system waits before reacting to a signal failure. |
| SD Handling Reserved for future use. | |
| West SP SD Capacity Threshold | Reserved for future use. |
| East SP SD Capacity Threshold | Reserved for future use. |
| Sub-Ring SP SD Capacity Threshold | Reserved for future use. |
| Local State | The current local state input to the ERPI state machine. |
| Remote State | The last event received from the other end of the link. |
| Last HP Request | The last high priority request. |
| Last Change Time | The time of the last ring state transition. |
To display the state of a specific service point, enter the following command in root view:
root> ethernet g8032 show-erpi-sp-state erpi-id
The following command displays the current state of the East service point for ERPI 1:
root> ethernet g8032 show-erpi-sp-state erpi-id 1 SP east
The following is an example of this command's output.
| root> ethernet q8032 show-erpi-sp-state erpi-1d 1 SP east | |||||||||||||
| ERPI 1d | SP Index | SP ID | Active state | R-APS channelforwarding state | dataforwarding state | RPL linkblocked state | defectstate | TX R-APSframes | TX R-APSFS | TX R-APSNR | TX R-APSRB | TX R-APSSD | |
| 1 | east | 2 | true | true | true | false | no-defect | 3 | 0 | 3 | 0 | 0 | |
| TX R-APSFS | TX R-APSMS | TX R-APSEvent | RX R-APSframes | Rx invalidR-APS frames | RX R-APSFS | RX R-APSNR | RX R-APSRB | RX R-APSSD | RX R-APSFS | RX R-APSMS | RX R-APSEvent | ||
| 0 | 0 | 0 | 1762 | 0 | 1756 | 6 | 0 | 0 | 0 | 0 | 0 | ||
root>
Table 267 G.8032 Service Point Display Command Output Parameters
| Parameter Description | |
| ERPI ID | A unique ID that identifies the ERPI. |
| SP Index | Identifies the service point in the ERPI. |
| SP ID The Service Point ID. | |
| Active State | Indicates whether or not the service point is active for traffic forwarding. |
| R-APS Channel Forwarding State | Indicates whether the service point is forwarding R-APS messages. |
| Data Forwarding State | Indicates whether the service point is in unblocked (forwarding) state. |
| RPL Link Blocked State | Only relevant if the ERPI to which the service point belongs is the RPL owner. Indicates whether the service point is in blocked state. |
| Defect State | Indicates whether the service point is in Signal Fail (SF) or Signal Defect (SD) state.Note: Support for Signal Defect state is planned for future release. |
| TX R-APS Frames | The number of R-APS frames that have been transmitted via the service point. |
| TX R-APS SF | The number of R-APS Signal Fail (SF) frames that have been transmitted via the service point. |
| TX R-APS NR | The number of R-APS No Request (NR) frames that have been transmitted via the service point. |
| TX R-APS RB | The number of R-APS RPL Blocked (RB) frames that have been transmitted via the service point. |
| TX R-APS SD | The number of R-APS Signal Degrade (SD) frames that have been transmitted via the service point. |
| TX R-APS FS | The number of R-APS Forced Switch (FS) frames that have been transmitted via the service point. |
| TX R-APS MS | The number of R-APS Manual Switch (MS) frames that have been transmitted via the service point. |
| TX R-APS Event | Reserved for future use. |
| RX R-APS Frames | The number of R-APS frames that have been received by the service point. |
| RX Invalid R-APS Frames | The number of R-APS frames with an invalid format that have been received by the service point. |
| RX R-APS SF | The number of R-APS Signal Fail (SF) frames that have been received by the service point. |
| RX R-APS NR | The number of R-APS No Request (NR) frames that have been received by the service point. |
| TX R-APS RB | The number of R-APS RPL Blocked (RB) frames that have been transmitted by the service point. |
| TX R-APS SD | The number of R-APS Signal Degrade (SD) frames that have been transmitted by the service point. |
| TX R-APS FS | The number of R-APS Forced Switch (FS) frames that have been transmitted by the service point. |
| TX R-APS MS | The number of R-APS Manual Switch (MS) frames that have been transmitted by the service point. |
| TX R-APS Event | Reserved for future use. |
Configuring MSTP (CLI)
This section includes:
- Configuring the MSTP Bridge Parameters (CLI)
- Configuring the MSTP Port Parameters (CLI)
Configuring the MSTP Bridge Parameters (CLI)
This section includes:
• Enabling and Disabling MSTP (CLI)
• Defining the Number of MSTIs (CLI)
- Setting the BPDU Destination MAC Address (CLI)
• Freezing MSTP (CLI)
• Resetting the MSTP Stack (CLI)
• Handling Signal Degrade (SD) Failures (CLI)
• Setting the Configuration ID (CLI)
• Mapping Services to MSTIs (CLI)
- Setting the Bridge Level Spanning Tree Parameters (CLI)
- Setting and Viewing the Bridge Level MSTI Parameters (CLI)
• Viewing the MSTP Parameters (CLI)
Enabling and Disabling MSTP (CLI)
Enabling MSTP starts the protocol and sets all port states in all MSTP instances to Blocking. Convergence upon enabling the protocol generally takes less than two seconds.

Note
All mapping of Ethernet services to MSTP instances (MSTIs) should be performed before enabling MSTP, For instructions, see Mapping Services to MSTIs (CLI).
To enable MSTP on the unit, enter the following command in root view:
root> ethernet mstp mstp-enable
Disabling MSTP stops the MSTP protocol from running and sets all ports in all MSTP instances to Forwarding state.
To disable MSTP on the unit, enter the following command in root view:
root> ethernet mstp mstp-disable
To display whether MSTP is currently enabled or disabled on the unit, enter the following command in root view:
root> ethernet mstp show-mstp-enabled
Defining the Number of MSTIs (CLI)
PTP 820G and PTP 820F can support from 1 to 16 Multiple Spanning Tree Instances (MSTIs) on a single unit. This does not include the Common and Internal Spanning Tree (CIST).
To specify the number of MSTIs, enter the following command in root view:
root> ethernet mstp set number-of-instances <MSTI>

Note
Changing the number of MSTIs causes the MSTP stack to reset.
To display the number of MSTIs on the unit, enter the following command in root view:
root> ethernet mstp show-number-of-instances
Table 268 Defining Number of MSTIs CLI Parameters
| Parameter | Input Type | Permitted Values | Description |
| MSTI Number | 2-16 | The number of MSTIs on the unit. This number does not include the Common and Internal Spanning Tree (CIST). |
The following command sets the number of MSTIs to 14:
root> ethernet mstp set number-of-instances 14
Setting the BPDU Destination MAC Address (CLI)
To specify the destination MAC address for BPDUs generated in the unit, enter the following command in root view:
root> ethernet mstp set bpdu-destination-mac <bpdu-destination-mac>
Table 269 BPDU Destination MAC Address CLI Parameters
| Parameter | Input Type | Permitted Values | Description |
| bpdu-destination-mac | Variable | customer provider | customer – The destination MAC address of BPDUs is 0x0180-C200-0000. Provider BPDUs are either tunneled or discarded.provider – The destination MAC address of BPDUs is 0x0180-C200-0008. Customer BPDUs are either tunneled or discarded. |
Freezing MSTP (CLI)
You can freeze MSTP in the unit. When MSTP is frozen, BPDUs are neither transmitted nor processed, and all port states are maintained as they were before MSTP was frozen.
To freeze MSTP, enter the following command in root view:
root> ethernet mstp mstp-freeze
To unfreeze MSTP, enter the following command in root view:
root> ethernet mstp mstp-defreeze
To display whether MSTP is or is not currently frozen in the unit, enter the following command in root view:
root> ethernet mstp show-mstp-frozen
Resetting the MSTP Stack (CLI)
To reset MSTP on the unit, enter the following command in root view:
root> ethernet mstp mstp-reset
Handling Signal Degrade (SD) Failures (CLI)
Signal Degrade failures (SD) can either be ignored or treated the same as SF, which means an SD failure triggers a topology change.

Note
This feature is planned for future release.
To determine how SD failures are treated, enter the following command in root view:
root> ethernet mstp set sd-handling <sd-handling>
Table 270 MSTP Signal Degrade Failure CLI Parameters
| Parameter | Input Type | Permitted Values | Description |
| sd-handling Variable | ignored same-as-SF | ignored – Signal Degrade (SD) failures are ignored in MSTP. same-as-SF – MSTP handles SD failures the same as Signal Failure, i.e., an SD failure triggers a topology change. | |
Setting the Configuration ID (CLI)
The configuration ID attributes include the Configuration Name and the Revision Level. These attributes are part of the Bridge Configuration Identifier.
To set the configuration ID attributes, enter the following command in root view:
root> ethernet mstp set configuration-name <configuration-name> revision-level <revision-level>
To display the configuration ID attributes, enter the following command in root view:
root> ethernet mstp show-config-id
Table 271 MSTP Configuration ID CLI Parameters
| Parameter | Input Type | Permitted Values | Description |
| configuration-name | Text String | The IEEE 802.1Q Configuration Name. The Configuration Name is part of the bridge configuration Identifier. | |
| revision-level | Number | 0-65535 | The IEEE 802.1Q Revision Level. The Revision Level is part of the bridge configuration Identifier. |
Mapping Services to MSTIs (CLI)
By default, all Ethernet services are assigned to MSTI 0 (CIST). You can map Ethernet services to other MSTIs.

Note
All mapping of Ethernet services to MSTP instances (MSTIs) should be performed before enabling MSTP.
To assign a service to another MSTI, enter the following command in root view:
root> ethernet generalcfg instance-to-service-mapping set service sid <sid> instance-id <instance-id>
To assign a range of services to another MSTI, enter the following command in root view:
root> ethernet generalcfg instance-to-service-mapping set service sid <sid> to <sid> instance-id <instance-id>
To display the service to MSTI mapping for a specific service, enter the following command in root view:
root> ethernet generalcfg instance-to-service-mapping show service sid <sid>
To display the service to MSTI mapping for a range of services, enter the following command in root view:
root> ethernet generalcfg instance-to-service-mapping show service sid <sid> to <sid>
Table 272 MSTP Service to MSTI Mapping CLI Parameters
| Parameter | Input Type | Permitted Values | Description |
| sid | Number or Range | Any Ethernet service or range of services configured in the unit. | The service ID. |
| instance-id | Number | 1-16, 4095 | The MSTI to which you want to map the service. |
The following command assigns Service 1 to MSTI 2:
root> ethernet generalcfg instance-to-service-mapping set service sid 1
instance-id 2
The following command assigns Services 1 through 10 to MSTI 2:
root> ethernet generalcfg instance-to-service-mapping set service sid 1 to 10 instance-id 2
The following command displays the service to MSTI mapping for services 1 through 1000:
root> ethernet generalcfg instance-to-service-mapping show service sid 1 to 1000
Setting the Bridge Level Spanning Tree Parameters (CLI)
The bridge level spanning tree parameters determine most of the bridge MSTP parameters, including parameters that are applied to all bridges when this bridge is acting as the root.
To set the CIST bridge priority, enter the following command in root view:
root> ethernet mstp set cist-bridge-priority <cist-bridge-priority>
To set the CIST hold time, enter the following command in root view:
root> ethernet mstp set cist-bridge-hold-time <cist-bridge-hold-time>
To set the CIST maximum age, enter the following command in root view:
root> ethernet mstp set cist-bridge-max-age <cist-bridge-max-age>
To set the CIST forward delay, enter the following command in root view:
root> ethernet mstp set cist-bridge-forward-delay <cist-bridge-forward-delay>
To set the CIST Hello Time, enter the following command in root view:
root> ethernet mstp set cist-bridge-hello-time <cist-bridge-hello-time>
To set the CIST maximum number of hops, enter the following command in root view:
root> ethernet mstp set cist-bridge-max-hops <cist-bridge-max-hops>
Table 273 MSTP Bridge Level Spanning Tree CLI Parameters
| Parameter | Input Type | Permitted Values | Description |
| cist-bridge-priority | Number | 0-61440, in steps of 4096. | Enter a value as the writeable portion of the Bridge ID. This value constitutes the first two octets of the Bridge ID. |
| cist-bridge-hold-time | Number 10-100 | Enter a value (in cs) as the interval length during which no more than two configuration bridge PDUs will be transmitted by this node. | |
| cist-bridge-max-age | Number 600-4000 | Enter a value (in cs) that all bridges will use, when this bridge is the root, as the maximum age of MSTP information learned from the network on any port before the information is discarded. | |
| cist-bridge-forward-delay | Number 400-3000 | Enter a value (in cs) that all bridges will use, when this bridge is the root, as the speed at which ports change their spanning state when moving towards the Forwarding state. This value determines how long the port stays in Listening state and Learning state. This value is also used when a topology change has been detected and is underway for purposes of aging all dynamic entries in the filtering database. | |
| cist-bridge-hello-time | Number 100-1000 | Enter the value (in cs) that all bridges will use, when this bridge is the root, as the Hello Time. The Hello Time determines how often the switch broadcasts its hello message to other switches, and is the same for all MSTIs. | |
| cist-bridge-max-hops | Number 6-40 | Enter the value that all bridges will use, when this bridge is the root, as the maximum number of hops allowed for a BPDU within a region before it is discarded. |
Setting and Viewing the Bridge Level MSTI Parameters (CLI)
To set the bridge priority for an MSTI, enter the following command in root view:
root> ethernet mstp set instance <msti-id> msti-bridge-priority <msti-bridge-priority>
To display the bridge parameters of an MSTI, enter the following command in root view:
root> ethernet mstp show-msti-attributes instance <msti-id>
Table 274 Bridge Level MSTI CLI Parameters
| Parameter | Input Type | Permitted Values | Description |
| instance Number 1-16 | Enter the MSTI ID of the MSTI you want to configure. | ||
| msti-bridge-priority | Number | 0-61440, in steps of 4096. | The MSTI writeable portion of the Bridge ID. |
| interface Variable | ethradiopwe | Enter the type of interface:eth – Ethernetradio – Radiopwe – TDM | |
| slot Number 1 | |||
| port Number | ethernet: 1-6radio: 1-2management: 1-2tdm: 1 | The interface you want to configure. | |
| group Variable | rp1rp2rp3rp4lag1lag2lag3lag4mc-abc1mc-abc2mc-abc3mc-abc4 | To display bridge parameters for a 1+1 HSB group, a LAG group, or a Multi-Carrier ABC group, use this parameter instead of the interface, slot, and port parameters to identify the group. See:Configuring HSB Radio Protection (CLI)Configuring Link Aggregation (LAG) and LACP (CLI)Configuring Multi-Carrier ABC (CLI) | |
The following command sets the bridge priority for MSTI 15 to 28672:
root> ethernet mstp set instance 15 msti-bridge-priority 28672
The following command displays the bridge parameters of MSTI 10:
root> ethernet mstp show-msti-attributes instance 10
Viewing the MSTP Parameters (CLI)
To display the general MSTP parameters, enter the following command in root view:
root> ethernet mstp show-gen-attributes
Configuring the MSTP Port Parameters (CLI)
This section includes:
- Configuring and Viewing the CIST Port Parameters (CLI)
- Configuring and Viewing the MSTI Port Parameters (CLI)
• Viewing and Resetting Port BPDU Counters (CLI)
Configuring and Viewing the CIST Port Parameters (CLI)
To set the CIST port priority of a port, enter the following command in root view:
root> ethernet mstp set interface <interface> slot <slot> port <port> cist-port-priority <cist-port-priority>
To set the CIST port priority of an interface group, enter the following command in root view:
root> ethernet mstp set group <group> cist-port-priority <cist-port-priority>
To set the CIST path cost of a port, enter the following command in root view:
root> ethernet mstp set interface <interface> slot <slot> port <port> cist-port-path-cost <cist-port-path-cost>
To set the CIST path cost of an interface group, enter the following command in root view:
root> ethernet mstp set group <group> cist-port-path-cost <cist-port-path-cost>
To set a port's administrative edge port parameter for the CIST, enter the following command in root view:
root> ethernet mstp set interface <interface> slot <slot> port <port> cist-port-edge-port <cist-port-edge-port>
To set an interface group's administrative edge port parameter for the CIST, enter the following command in root view:
root> ethernet mstp set group <group> cist-port-edge-port <cist-port-edge-port>
To set a port's MAC Enabled parameter for the CIST, enter the following command in root view:
root> ethernet mstp set interface <interface> slot <slot> port <port> cist-port-mac-enabled <cist-port-mac-enabled>
To set an interface group's MAC Enabled parameter for the CIST, enter the following command in root view:
root> ethernet mstp set group <group> cist-port-mac-enabled <cist-port-mac-enabled
To display a port's CIST parameters, enter the following command in root view:
root> ethernet mstp show-cist-port-attributes interface <interface> slot <slot> port <port>
To display an interface group's CIST parameters, enter the following command in root view:
root> ethernet mstp show-cist-port-attributes group <group>
Table 275 CIST Port CLI Parameters
| Parameter | Input Type | Permitted Values | Description |
| interface Variable | ethradiopwe | Enter the type of interface:eth – Ethernetradio – Radiopwe – TDM | |
| slot Number 1 | |||
| port Number | ethernet: 1-6radio: 1-2management: 1-2tdm: 1 | The interface you want to configure. | |
| group Variable | rp1rp2rp3rp4lag1lag2lag3lag4mc-abc1mc-abc2mc-abc3mc-abc4 | To configure or display parameters for a LAG group, or a Multi-Carrier ABC group, use this parameter instead of the interface, slot, and port parameters to identify the group. See:Configuring HSB Radio Protection (CLI)Configuring Link Aggregation (LAG) and LACP (CLI)Configuring Multi-Carrier ABC (CLI) | |
| cist-port-priority | Number | 0-240, in multiples of 16. | The priority contained in the first octet of the two-octet Port ID. |
| cist-port-path-cost | Number 1-200000000. | The configurable assigned value for the contribution of this port to the path cost of paths towards the spanning tree root.Note:Changing the value of this parameter is considered to be a topology change by the MSTP mechanism. | |
| cist-port-edge-port | Variable | truefalse | true – The port is considered an edge port in the CIST.false – The port is considered a non-edge port in the CIST. |
| cist-port-mac-enabled | Variable | forceTrueforceFalseauto | forceTrue – The MAC is treated as if it is connected to a point-to-point LAN, regardless of any indications to the contrary that are generated by the MAC entity.forceFalse –The MAC is treated as if it is connected to a non-point-to-point LAN, regardless of any indications to the contrary that are generated by the MAC entity.auto – The MAC Enabled parameter is set to True if the MAC is connected to a point-to-point or full-duplex LAN. The MAC Enabled parameter is set to False if the MAC is connected to a non-point-to-point and half-duplex LAN. |
The following command sets the CIST port priority for Ethernet port 2 to 192:
root> ethernet mstp set interface eth slot 1 port 2 cist-port-priority 192
The following command sets the CIST port priority for HSB protection group 1 to 192:
root> ethernet mstp set group rp1 cist-port-priority 192
The following command sets the CIST path cost for Ethernet port 1 to 20,000:
root> ethernet mstp set interface eth slot 1 port 1 cist-path-cost 20000
The following command sets the CIST path cost for LAG 1 to 20,000:
root> ethernet mstp set group lag1 cist-path-cost 20000
The following command sets radio interface 1 to be an Edge port in the CIST:
root> ethernet mstp set interface radio slot 3 port 1 cist-port-admin-edge true
The following command sets HSB protection group 1 to be an Edge port in the CIST:
root> ethernet mstp set group rpl cist-port-admin-edge true
The following command displays the CIST parameters of radio interface 2:
root> ethernet mstp show-cist-port-attributes interface radio slot 1 port 2
The following command displays the CIST parameters of LAG 1:
root> ethernet mstp show-cist-port-attributes group lag1
Configuring and Viewing the MSTI Port Parameters (CLI)
To set the port priority for an MSTI and port, enter the following command in root view:
root> ethernet mstp set instance <instance> interface <interface> slot <slot> port <port> msti-port-priority <msti-port-priority>
To set the port priority for an MSTI and an interface group, enter the following command in root view:
root> ethernet mstp set instance <instance> group <group> msti-port-priority <msti-port-priority>
To set the path cost for a port in a specific MSTI, enter the following command in root view:
root> ethernet mstp set instance <instance> interface <interface> slot <slot> port <port> msti-port-path-cost <msti-port-path-cost>
To set the path cost for an interface group in a specific MSTI, enter the following command in root view:
root> ethernet mstp set instance <instance> group <group> msti-port-path-cost <msti-port-path-cost>
To display the MSTI parameters for a specific MSTI and port, enter the following command in root view:
root> ethernet mstp show-msti-port-attributes instance <instance>
interface <interface> slot <slot> port <port>
To display the MSTI parameters for a specific MSTI and interface group, enter the following command in root view:
root> ethernet mstp show-msti-port-attributes instance <instance> group <group>
Table 276 MSTI Port CLI Parameters
| Parameter | Input Type | Permitted Values | Description |
| instance Number 1-16 | Enter the MSTI ID of the MSTI you want to configure. | ||
| interface Variable | ethradiopwe | Enter the type of interface:eth – Ethernetradio – Radiopwe – TDM | |
| slot Number 1 | |||
| port Number | ethernet: 1-6radio: 1-2management: 1-2tdm: 1 | The interface you want to configure. | |
| group Variable | rp1 | To configure or display parameters for a LAG group, or a Multi-Carrier ABC group, use this parameter instead of the interface, slot, and port parameters to identify the group. See:Configuring HSB Radio Protection (CLI)Configuring Link Aggregation (LAG) and LACP (CLI)Configuring Multi-Carrier ABC (CLI) | |
| rp2 | |||
| rp3 | |||
| rp4 | |||
| lag1 | |||
| lag2 | |||
| lag3 | |||
| lag4 | |||
| mc-abc1 | |||
| mc-abc2 | |||
| mc-abc3 | |||
| mc-abc4 | |||
| msti-port-priority | Number | 0-240, in multiples of 16. | The priority contained in the first octet of the two-octet Port ID. |
| msti-port-path-cost | Number 1-200000000. | The port's Path Cost parameter for the MSTI.Note:Changing the value of this parameter may cause re-initialization of the MSTI for which the parameter is changed. No other MSTI should be affected. | |
The following command sets the MSTI port priority for MSTI 14 on Ethernet port 2 to 192:
root> ethernet mstp set instance 14 interface eth slot 1 port 2 msti-port-priority 192
The following command sets the MSTI port priority for MSTI 14 on LAG 1 to 192:
root> ethernet mstp set instance 14 group lag1 msti-port-priority 192
The following command sets the MSTI path cost for MSTI 12 on Ethernet port 3 to 20000:
root> ethernet mstp set instance 12 interface eth slot 1 port 3 msti-port-path-cost 20000
The following command sets the MSTI path cost for MSTI 12 on HSB protection group 1 to 20000:
root> ethernet mstp set instance 12 group rp1 msti-port-path-cost 20000
The following command displays the MSTI parameters for MSTI 10 and radio interface 1:
root> ethernet mstp show-msti-port-attributes instance 10 interface radio slot 1 port 1
The following command displays the MSTI parameters for MSTI 10 and LAG 1:
root> ethernet mstp show-msti-port-attributes instance 10 group lag1
Viewing and Resetting Port BPDU Counters (CLI)
To view the BPDU counters for a port, enter the following command in root view:
root> ethernet mstp show-port-counters interface <interface> slot <slot> port <port>
To view the BPDU counters for an interface group, enter the following command in root view:
root> ethernet mstp show-port-counters group <group>
To reset the BPDU counters, enter the following command in root view:
root> ethernet mstp reset-counters
Table 277 Port BPDU Counters CLI Parameters
| Parameter | Input Type | Permitted Values | Description |
| interface Variable | eth | Enter the type of interface: | |
| radio | eth - Ethernet | ||
| pwe | radio - Radio | ||
| pwe - TDM | |||
| slot Number 1 | |||
| port Number | ethernet: 1-6 | The interface for which you want to display counters. | |
| radio: 1-2 | |||
| management: 1-2 | |||
| tdm: 1 | |||
| group Variable | rp1 | To display counters for a LAG group, or a Multi-Carrier ABC group, use this parameter instead of the interface, slot, and port parameters to identify the group. See: | |
| rp2 | |||
| rp3 | |||
| rp4 | |||
| lag1 | Configuring HSB Radio Protection (CLI) | ||
| lag2 | Configuring Link Aggregation (LAG) and LACP (CLI) | ||
| lag3 | |||
| lag4 | Configuring Multi-Carrier ABC (CLI) | ||
| mc-abc1 | |||
| mc-abc2 | |||
| mc-abc3 | |||
| mc-abc4 | |||
Configuring LLDP (CLI)
Link Layer Discovery Protocol (LLDP) is a vendor-neutral layer 2 protocol that can be used by a network element attached to a specific LAN segment to advertise its identity and capabilities and to receive identity and capacity information from physically adjacent layer 2 peers. LLDP is a part of the IEEE 802.1AB – 2005 standard that enables automatic network connectivity discovery by means of a port identity information exchange between each port and its peer. Each port periodically sends and also expects to receive frames called Link Layer Discovery Protocol Data Units (LLDPDU). LLDPDUs contain information in TLV format about port identity, such as MAC address and IP address.
LLDP is used to send notifications to the NMS, based on data of the local unit and data gathered from peer systems. These notifications enable the NMS to build an accurate network topology.
This section includes:
- Configuring the General LLDP Parameters (CLI)
• Displaying the General LLDP Parameters (CLI) - Configuring LLDP Port Parameters (CLI)
• Displaying the LLDP Local System Parameters (CLI)
• Displaying the LLDP Remote System Parameters (CLI)
• Displaying LLDP Statistics (CLI)
Configuring the General LLDP Parameters (CLI)
The Transmit Interval is the interval at which LLDP frames are transmitted.
The time-to-live (TTL) determines the length of time LLDP frames are retained by the receiving device. The TTL is determined by multiplying the Transmit Interval by the TTL Multiplier.
To define the Transmit Interval, enter the following command in root view:
root> ethernet lldp tx-interval-set tx-interval <tx-interval>
To define the TTL Multiplier, enter the following command in root view:
root> ethernet lldp tx-hold-multiplier-set hold-multiplier <hold-multiplier>
To define the interval between transmission of LLDP notifications during normal transmission periods, enter the following command in root view:
root> ethernet lldp notif-interval-set notif-interval <notif-interval>
Table 278 General LLDP CLI Parameters
| Parameter | Input Type | Permitted Values | Description |
| tx-interval | Number 5-3600 | The interval, in seconds, at which LLDP frames are transmitted. The default value is 30. | |
| hold-multiplier | Number 2-10 | The TTL Multiplier, which is multiplied by the Transmit Interval to determine the TTL, in seconds, of LLDP frames. The default value is 4. | |
| notif-interval | Number 5-3600 | The interval, in seconds, between transmission of LLDP notifications during normal transmission periods. The default value is 30. |
Displaying the General LLDP Parameters (CLI)
To display the general LLDP parameters, enter the following command in root view:
root> ethernet lldp configuration-scalers-show
The following information is displayed:
- Message Tx Interval - The interval, in seconds, at which LLDP frames are transmitted, as defined by the ethernet lldp tx-interval-set tx-interval command. The default value is 30.
- Message Tx Hold Multiplier - The TTL Multiplier, as defined by the ethernet lldp tx-hold-multiplier-set hold-multiplier command. The TTL Multiplier is multiplied by the Transmit Interval to determine the TTL, in seconds, of LLDP frames. The default value is 4.
- Reinit Delay - The minimum time, in seconds, the system waits after the LLDP Admin status becomes Disabled until it will process a request to reinitialize LLDP. In this release, this parameter is set at 2.
- Notification Interval - The interval, in seconds, between transmission of LLDP notifications during normal transmission periods, as defined by the ethernet lldp notif-interval-set notif-interval command. The default value is 30.
- Tx Credit Max - The maximum number of consecutive LLDPDUs that can be transmitted at any one time. In this release, the Tx Credit Max is set at 5.
- Message Fast Tx - The interval, in seconds, at which LLDP frames are transmitted during fast transmission periods, such as when the unit detects a new neighbor. In this release, this parameter is set at 1.
- Message Fast Init - The initial value used to initialize the variable which determines the number of transmissions that are made during fast transmission periods. In this release, this parameter is set at 4.
The following commands set the Transmit Interval to 50 seconds with a TTL Multiplier of 5. This produces a TTL of 4 minutes and 10 seconds.
root> ethernet lldp tx-interval-set tx-interval 50
root> ethernet lldp tx-hold-multiplier-set hold-multiplier 50
The following command sets a Notification Interval of 20 seconds:
root> ethernet lldp notif-interval-set notif-interval 20
Configuring LLDP Port Parameters (CLI)
To define how the LLDP agent operates on a specific port, enter the following command in root view:
root> ethernet lldp agent-admin-set interface eth slot <slot> port <port>
agent-admin <agent-admin>
To enable or disable LLDP notifications to the NMS on a specific port, enter the following command in root view:
root> ethernet lldp agent-notif-enable interface eth slot <slot> port
<port> agent-notif-enable <agent-notif-enable>
To display the LLDP agent configuration on all ports, enter the following command in root view:
root> ethernet lldp agent-configuration-show
The following is a sample output of the ethernet lldp agent-configuration-show command:
| interface type | |slot|port | Mac DA Identifier | Admin Status | Notification Enable | TLV TX | |
| ethernet | 1 | 1 | 1 | txAndRx | false | None |
| ethernet | 1 | 2 | 1 | txAndRx | false | None |
| ethernet | 1 | 3 | 1 | disabled | false | None |
| ethernet | 1 | 4 | 1 | txAndRx | false | None |
| ethernet | 1 | 5 | 1 | txAndRx | false | None |
| ethernet | 1 | 6 | 1 | txAndRx | false | None |
| root> | ||||||
Table 279 LLDP Port CLI Parameters
| Parameter | Input Type | Permitted Values | Description |
| slot Number 1 | |||
| port Number 1-6 | The port for which you want to configure LLDP. | ||
| agent-adminAdmin Status | Variable | txOnlyrxOnlytxAndRxdisabled | • txOnly – The LLDP agent transmits LLDP frames on this port but does not update information about its peer.• rxOnly – The LLDP agent receives but does not transmit LLDP frames on this port.• txAndRx – The LLDP agent transmits and receives LLDP frames on this port (default value).• disabled – The LLDP agent does not transmit or receive LLDP frames on this port. |
| agent-notif-enable | Variable | truefalse | • true – The agent sends a Topology Change trap to the NMS whenever the system information received from its peer changes.• false – Notifications to the NMS are disabled (default value). |
The following commands configure Ethernet port 2 to transmit and receive LLDP frames and to send a Topology Change trap to the NMS whenever the system information of its peer changes:
root> ethernet lldp agent-admin-set interface eth slot 1 port 2 agent-admin txAndRx
root> ethernet lldp agent-notif-enable interface eth slot 1 port 2 agent-notif-enable true
Displaying the LLDP Local System Parameters (CLI)
To display the local unit's unit parameters, as transmitted by the LLDP agents, enter the following command in root view:
root> ethernet lldp local-system-scalars-show
The following information is displayed:
- local Chassis Id Subtype – The type of encoding used to identify the local unit's chassis. In this release, this parameter is always set to MAC Address.
- local Chassis Id – The MAC Address of the local unit's chassis.
- local System Name - The system name included in TLVs transmitted by the LLDP agent. To define the system name, see. Configuring Unit Parameters (CLI).
- local System Description – The system description included in TLVs transmitted by the LLDP agent.
- local System Cap Supported – A bitmap value used to identify which system capabilities are supported on the local system, as included in TLVs transmitted by the LLDP agent. The bitmap is defined by the following parameters:
○ 0 - other
○ 1 – repeater
○ 2 - bridge
- 3 - wlanAccessPoint
○ 4-router
- 5 - telephone
- 6 -docsisCableDevice
- 7 - stationOnly
- 8 - cVLANComponent
- 9 - sVLANComponent
- 10-twoPortMACRelay
- local System Cap Enabled – A bitmap value used to identify which system capabilities are enabled on the local system, as included in TLVs transmitted by the LLDP agent. The bitmap is defined by the following parameters:
o 0-other
○ 1 - repeater
○ 2 - bridge
- 3 - wlanAccessPoint
o 4-router
- 5 – telephone
- 6 -docsisCableDevice
- 7 - stationOnly
- 8 - cVLANComponent
- 9-sVLANComponent
- 10 - twoPortMACRelay
To display the local unit's management information, enter the following command in root view:
root> ethernet lldp local-mng-show
The following information is displayed:
- Mng Addr SubType – The format of the local unit's IP Address. In this release, only IPV4 is supported.
- Management Address – The local unit's IP address.
- Mng Addr Length – Reserved for future use.
- Mng Addr IF SubType – Reserved for future use.
- Mng Addr IF – Reserved for future use.
- Mng Addr OID – Reserved for future use.
To display the destination MAC address or range of MAC addresses associated with the unit, and their internal index, enter the following command in root view:
root> ethernet lldp mac-da-table-show
The following information is displayed:
- LLDP DA Index – The internal index associated with the unit's destination LLDP MAC address.
- LLDP DA – The unit's destination LLDP MAC address.
To display local port parameters, as transmitted by the LLDP agent, enter the following command in root view:
root> ethernet lldp local-port-show
The following information is displayed:
- Interface type/slot/port – The port type, slot number, and port number.
- Port ID Subtype – The type of encoding used to identify the port in LLDP transmissions. In this release, this parameter is always set to MAC Address.
- Port ID – The port's MAC address.
- Description – A text string that describes the port. In this release, this parameter is always set to ethPort.
To display the local unit's management information per port, enter the following command in root view:
root> ethernet lldp mng-addr-table-show
The following information is displayed:
- Interface type/slot/port – The port type, slot number, and port number.
- Dest Mac Address – Defines the MAC address associated with the port for purposes of LLDP transmissions.
- Mng Address subType – Defines the type of the management address identifier encoding used for the Management Address. In this release, only IpV4 is supported.
- Management Address – The unit's IP address.
- Mng Address Tx Enable – Indicates whether the unit's Management Address is transmitted with LLDPDUs. In this release, the Management Address is always sent.
Displaying the LLDP Remote System Parameters (CLI)
This section includes:
• Displaying the LLDP Remote Unit Parameters (CLI)
• Displaying the LLDP Remote Management Data per Port (CLI)

Note
Remote information is not displayed for ports that belong to a LAG group.
Displaying the LLDP Remote Unit Parameters (CLI)
To display the peer's LLDP unit parameter information, starting from a specific time, enter the following command in root view. If no time is specified, all data is displayed.
root> ethernet lldp agent-remote-table-show agent-start-time <agent-start-time> interface eth slot <slot> port <port>
The following information is displayed:
• Time Mark – The time the entry was created.
- Interface Type/Slot/Port – The port for which you are displaying data about the peer.
- Rem Dest Mac Address – The peer LLDP agent's destination MAC Address.
- Remote Index – An arbitrary local integer value used by this agent to identify a particular connection instance, unique only for the indicated peer.
- Remote Chassis ID subType – The type of encoding used to identify the peer's chassis.
- Remote Chassis ID – An octet string used to identify the peer's chassis.
- Rem Port ID subType - The type of port identifier encoding used in the peer's Port ID.
- Rem Port ID – An octet string used to identify the port component associated with the peer.
- Rem Port Description – A description of the peer's port.
- Rem System Name – The peer's system name.
- Rem System Description – The peer's system description.

Note
The Rem Port Description, Rem System Name, and Rem System Description fields are not used in the current version.
- Rem System Cap Supported – The bitmap value used to identify which system capabilities are supported on the peer. The bitmap is defined by the following parameters:
○ 0 - other
○ 1 - repeater
○ 2 - bridge
- 3 - wlanAccessPoint
○ 4 - router
- 5 - telephone
- 6 -docsisCableDevice
- 7 - stationOnly
- 8 - cVLANComponent
- 9 - sVLANComponent
- 10 - twoPortMACRelay
- Rem System Cap Enabled - The bitmap value used to identify which system capabilities are enabled on the peer. The bitmap is defined by the following parameters:
○ 0 - other
○ 1 - repeater
○ 2 - bridge
- 3 - wlanAccessPoint
○ 4 - router
- 5 - telephone
- 6 -docsisCableDevice
- 7 - stationOnly
- 8 - cVLANComponent
- 9 - sVLANComponent
- 10 - twoPortMACRelay
- Remote Changes - Indicates whether there are changes in the peer's MIB, as determined by the variable remoteChanges. Possible values are:
- True - Changes have taken place in the peer's MIB since the defined agent-start-time.
False - No changes have taken place in the peer's MIB since the defined agent-start-time.
Displaying the LLDP Remote Management Data per Port (CLI)
To display remote LLDP management data from a specific port, starting from a specific time, enter the following command in root view. If no time is specified, all data is displayed.
root> ethernet lldp agent-remote-mng-show agent-start-time <agent-start-time> interface eth slot <slot> port <port>
The following information is displayed:
• Time Mark – The time the entry was created.
- Interface Type/Slot/Port – The port for which you are displaying data about the peer.
- Rem Dest Mac Address – The peer LLDP agent's destination MAC Address.
- Remote Index – An arbitrary local integer value used by this agent to identify a particular connection instance, unique only for the indicated peer.
- Remote Mng Addr subType – The type of management address identifier encoding used in the associated LLDP Agent Remote Management Address.
- Remote Mng Address – The octet string used to identify the management address component associated with the remote system. The purpose of this address is to contact the management entity.
- Remote Mng IF subType – The enumeration value that identifies the interface numbering method used for defining the interface number, associated with the remote system. Possible values are:
o unknown(1)
○ ifIndex(2)
o systemPortNumber(3)
- Agent Rem OID – The OID value used to identify the type of hardware component or protocol entity associated with the management address advertised by the remote system agent.
Table 280 LLDP Local System CLI Parameters
| Parameter | Input Type | Permitted Values | Description |
| interface Variable | ethradiopwe | Enter the type of interface:eth – Ethernetradio – Radiopwe – TDM | |
| slot Number 1 | |||
| port Number | ethernet: 1-6radio: 1-2management: 1-2tdm: 1 | ||
| agent-start-time | Number | dd-mm-yyyy,hh:mm:ss,where:dd = datemm = monthyyyy= yearhh = hourmm = minutesss = seconds | A filter that enables you to view data that was added to the database starting from the defined time. |
Displaying LLDP Statistics (CLI)
This section includes:
• Displaying Statistics Regarding Changes in Peer Unit (CLI)
• Displaying LLDP Transmission Statistics (CLI)
• Displaying LLDP Received Frames Statistics (CLI)
Displaying Statistics Regarding Changes in Peer Unit (CLI)
To display statistics about changes reported via LLDP by the remote unit, enter the following command in root view:
root> ethernet lldp statistics-scalars-show
The following information is displayed:
- stats Rem Tables Last Change Time – The time of the most recent change in the remote unit, as reported via LLDP.
- stats Rem Tables Inserts – The number of times the information from the remote system has changed.
- stats Rem Tables Deletes – The number of times the information from the remote system has been deleted.
- stats Rem Tables Drops – Reserved for future use.
- stats Rem Tables Ageouts – The number of times the information from the remote system has been deleted from the local unit's database because the information's TTL has expired. The RX Ageouts counter is similar to this counter, but is for specific ports rather than the entire unit.
Displaying LLDP Transmission Statistics (CLI)
To display statistics about LLDP transmissions and transmission errors, enter the following command in root view:
root> ethernet lldp statistics-port-tx-show
The following information is displayed:
- LLDP TX Statistics Ifindex – The index value used to identify the port in LLDP transmissions.
- LLDP TX Statistics DA ID – The LLDP MAC address associated with this entry.
- LLDP TX Statistics Total Frames – The number of LLDP frames transmitted by the LLDP agent on this port to the destination MAC address.
- LLDP TX Statistics No. of Length Error – The number of LLDPDU Length Errors recorded for this port and destination MAC address. If the set of TLVs that is selected in the LLDP local system MIB by network management would result in an LLDPDU that violates LLDPDU length restrictions, then the No. of Length Error statistic is incremented by 1, and an LLDPDU is sent containing the mandatory TLVs plus as many of the optional TLVs in the set as will fit in the remaining LLDPDU length.
Displaying LLDP Received Frames Statistics (CLI)
To display statistics about LLDP frames received by the unit, enter the following command in root view:
root> ethernet lldp statistics-port-rx-show
The following information is displayed:
- RX Destination Port – The index value used to identify the port in LLDP transmissions.
- RX DA Index – The index value used to identify the destination MAC address associated with this entry.
- RX Total Discarded – The number of LLDP frames received by the LLDP agent on this port, and then discarded for any reason. This counter can provide an indication that LLDP header formatting problems may exist with the local LLDP agent in the sending system or that LLDPDU validation problems may exist with the local LLDP agent in the receiving system.
- RX Invalid Frames – The number of invalid LLDP frames received by the LLDP agent on this port while the agent is enabled.
- RX Valid Frames – The number of valid LLDP frames received by the LLDP agent on this port.
- RX Discarded TLVs – The number of LLDP TLVs discarded for any reason by the LLDP agent on this port.
- RX Unrecognized TLVs – The number of LLDP TLVs received on the given port that are not recognized by LLDP agent.
- RX Ageouts – The number of age-outs that occurred on the port. An age-out is the number of times the complete set of information advertised by the remote system has been deleted from the unit's database because the information timeliness interval has expired. This counter is similar to the LLDP No. of Ageouts counter, except that it is per port rather than for the entire unit. This counter is set to zero during agent initialization. This counter is incremented only once when the complete set of information is invalidated (aged out) from all related tables on a particular port. Partial ageing is not allowed.
Chapter 21: TDM Services and Interfaces (CLI)
This section includes:
• TDM Overview (CLI)
- Configuring the Unit to Operate in ANSI Mode (CLI)
- Configuring TDM Cards and Interfaces (CLI)
- Configuring Native TDM Trails (CLI)
- Configuring TDM Pseudowire Services (CLI)
• Displaying TDM PMs (CLI)
Related topics:
• Performing TDM Diagnostics (CLI)
TDM Overview (CLI)
PTP 820G and PTP 820F provides integrated support for transportation of TDM (E1/DS1) services with an integrated E1/DS1 interface.
Two types of TDM services are supported using the same hardware:
- Native TDM trails
• TDM Pseudowire services (enabling interoperability with third party packet/PW equipment)
PTP 820G and PTP 820F also offers hybrid Ethernet and TDM services. Hybrid services can utilize either Native TDM or pseudowire.
Hybrid Ethernet and TDM services can also be transported via cascading interfaces. This enables the creation of links among multiple units in a node for multi-carrier and multi-directional applications
Configuring the Unit to Operate in ANSI Mode (CLI)
By default, the TDM interfaces in a PTP 820G or PTP 820F unit are set to operate according to the ETSI standard, in E1 mode.
To change the TDM interfaces to operate according to the ANSI (FCC) standard (DS1), enter the following command in root view.

Note
This command results in system reset and restores the default configuration.
root> platform management set tdm-interfaces-standard ansi
Configuring TDM Cards and Interfaces (CLI)
This section includes:
- Configuring the E1/DS1 Interface (CLI)
- Configuring the E1/DS1 Parameters (CLI)
Configuring the E1/DS1 Interface (CLI)
To enable the slot, enter the following command in root view:
root> platform shelf-manager admin set slot <slot> state enable
To enable the E1/DS1 interface, enter the following command in root view:
root> platform if-manager set interface-type tdm slot <slot> port <port> admin <admin>

Note
To enable or disable an E1/DS1 interface, use the pwe3 tdm enable slot command. See Configuring the E1/DS1 Parameters (CLI).
Table 281 TDM Slot Configuration CLI Parameters
| Parameter | Input Type | Permitted Values | Description |
| slot Number | For TDM cards in an expansion slot: 2-3For the fixed E1/DS1 interface: 1 | ||
| type Variable | LIC-T16-ACRLIC-T155-ACR | LIC-T16-ACR – A 16xE1/DS1 TDM card.LIC-T155-ACR – A 1 x ch-STM-1/OC-3 card. | |
| port | Number | • STM-1: 1-63• OC-3: 1-84 | The physical port number of the port. |
| admin Variable | updown | Enter up to enable the port or down to disable the port. |
To verify the parameters of the slot you just configured, enter the following command:
root> pwe3 pwc config show slot 3
Configuring the E1/DS1 Parameters (CLI)
You can use the following commands to configure the E1/DS1 parameters. You must enter these commands from pwe3 view:
root> pwe3
pwe3>
pwe3> pwe3 tdm config modify port slot <slot> tdm-port <tdm-port> line-type <line-type> line-coding <line-coding> channelization
<channelization> timing-mode <timing-mode> clk-src-ref <clk-src-ref> clk-src-ref-port <clk-src-ref-port> idle-code <idle-code> cable-length
<cable-length>
pwe3> pwe3 tdm enable slot <slot> tdm-port <tdm-port>
Table 282 E1/DS1 Configuration CLI Parameters
| Parameter | Input Type | Permitted Values | Description |
| slot Number | For TDM cards in an expansion slot: 2-3For the fixed E1/DS1 interface: 1 | ||
| tdm-port Number | The fixed E1/DS1 interface or an LIC-T16 (16 x E1/DS1): 1-16If the card is an LIC-T155 (1x ch-STM-1/OC-3): STM-1: 1-63OC-3: 1-84 | The physical port number of the port. | |
| line-type | Variable | unframed | The line type of this port. In this release, unframed is the only available option. |
| line-coding Variable | hdb3-b8zsami | The line coding for this port. Options are:hdb3-b8zs – hdb3 coding for E1, b8zs coding for DS1.ami – Only relevant for DS1 ports. | |
| channelization | Variable disable | Channelization is only relevant for CESoP mode, which is planned for future release. | |
| timing-mode Variable | loopabsoluteclock-recovery | The clock reference for the outgoing TDM signal from the port. Options are:loop- The output signal uses the clock of the incoming lines. By default, each port is its will take itself as a reference.absolute- All ports are synchronized to a single common clock, as defined by the clk-src-ref parameter.clock-recovery- Adaptive Clock Recovery. Clock information is included in the TDM data stream at the point where the data is frameized. Extra information may be located in an RTP header that can be used to correct frequency offsets. The clock information is extracted at the point where the frames are received and reconverted to TDM. The extracted clock information is used for the reconversion to TDM. If you configure the timing-mode as clock-recovery, you must use the clk-src-ref-port parameter to configure the clock source reference port. | |
| clk-src-ref | Variable | nonefront-panelsys-ref-clk | If timing-mode is set to absolute, use this parameter to configure the clock source reference for the port. Options are:front-panel-An external clock reference from a dedicated front panel clock interface. This can be:An E1/DS1 line, orA Digital 2.048MHz/1.544MHz inputsys-ref-clk-Clock is taken from the system reference clock defined for the entire unit.If the timing-mode parameter is set to loop or clock-recovery, set this parameter to none. |
| clk-src-ref-port | Number 0-16 | The recovery clock source reference port. If timing-mode is set to loop or clock-recovery, select the clock source reference for the port.By default, each port is its will take itself as a reference. Select a different port only if more than 16 clock domains are being used.If timing-mode is set to absolute, this parameter must be set to 0. | |
| idle-code | Number | 0-255 | The value to be transmitted on this port for unused time slots. |
| cable-length Variable | ffixed-or-0-133ft133-266ft/266-399ft399-533ft533-655ft | Reserved for future use. | |
The following commands configure and enable port 9 in the E1/DS1 interface.
pwe3> pwe3 tdm config modify port slot 1 tdm-port 9 line-type unframed line-coding hdb3-b8zs channelization disable timing-mode loop clk-src-ref none clk-src-ref-port 9 idle-code 0 cable-length fixed-or-0-133ft
pwe3> pwe3 tdm enable slot 1 tdm-port 9
To verify the configuration of the TDM port you use configured, enter the following command:
pwe3> pwe3 tdm config show slot 1 tdm-port 9
Configuring Native TDM Trails (CLI)
To configure native TDM services, it is recommended to use the Web EMS's simple, step-by-step workflow, which guides you through the configuration process. See Configuring Native TDM Trails.
Configuring TDM Pseudowire Services (CLI)
To configure pseudowire services, it is recommended to use the Web EMS TDM Pseudowire Services interface, which provides a step-by-step workflow based on pre-configured pseudowire settings. See Configuring TDM Pseudowire Services.
To manually configure the pseudowire parameters and services, follow the instructions in this section.
This section includes:
- Configuring Pseudowire Tunnels (CLI)
• Configuring Pseudowire Profiles (CLI) - Configuring Ethernet Services for TDM Traffic (CLI)
- Configuring Pseudowire Path Protection and Dual Homing (CLI)
• Manually Configuring Pseudowire Services (CLI)
Configuring Pseudowire Tunnels (CLI)
Each TDM service must include an encapsulation tunnel to determine how traffic over the service passes through the network. In this version, encapsulation must use the MEF-8 protocol.
For PTP 820G: You can configure up to 32 tunnels per unit.
To configure a tunnel, you will need the MAC address of the TDM interface at the remote side of the tunnel. TDM tunnel configuration must be performed from pwe3 view:
root> pwe3
pwe3>

Note
UDP/IP and MPLS support are planned for future release.
To configure a TDM tunnel, enter the following commands:
pwe3> pwe3 tunnel eth add slot <slot> id <id> remote-mac-addr <remote-mac-addr>
pwe3> pwe3 tunnel vlan modify slot <slot> tunnel <id> type <type> vid
<vid> p-bits <p-bits>
pwe3> pwe3 tunnel enable slot <slot> id <id>
To display the status of all tunnels configured on the unit, enter the following command in pwe3 view:
pwe3> pwe3 tunnel status show
The following is an example of a pwe3 tunnel status show command and its output:
root> pwe3
pwe3> pwe3 tunnel status show

-------->
    Slot Number: 1
    PSN Tunnel Id: 1
    Operational Status: down
    Source MAC Address: 0:a:25:0:28:e8
    Actual Remote MAC Address: 0:0:0:0:0:0
-------->
-------->
    Slot Number: 1
    PSN Tunnel Id: 2
    Operational Status: up
    Source MAC Address: 0:a:25:0:28:e8
    Actual Remote MAC Address: 0:a:25:0:32:ea
To display the status of a specific tunnel, enter the following command in pwe3 view:
pwe3> pwe3 tunnel status show slot <slot> id <id>
The following is an example of a pwe3 tunnel status show slot
root> pwe3
pwe3> pwe3 tunnel status show slot 1 id 1
-------->
Slot Number: 1
PSN Tunnel Id: 1
Operational Status: down
Source MAC Address: 0:a:25:0:28:e8
Actual Remote MAC Address: 0:0:0:0:0:0
pwe3>
Table 283 Pseudowire Tunnel CLI Parameters
| Parameter | Input Type | Permitted Values | Description |
| slot Number 1 | |||
| id | Number | 1-168 | A unique ID that identifies the tunnel. |
| remote-mac-addr | Six groups of two hexadecimal digits | Any valid MAC address | The MAC address of the interface at the other site of the link. This is only relevant for Ethernet (MEF-8) tunnels. |
| type Variable | none s-type c-type | The outer VLAN type used by the tunnel. | |
| vid Number 0-4094 | A VLAN ID (1-4094). This value will be assigned to frames passing through the tunnel. | ||
| p-bits Number 0-7 | A p-bit value. This value will be assigned to frames passing through the tunnel. | ||
The following commands create and enable tunnel 7, from the E1/DS1 interface to MAC address 00:0a:25:00:25:5B:
pwe3> pwe3 tunnel eth add slot 1 id 7 remote-mac-addr 00:0a:25:00:25:5B
pwe3> pwe3 tunnel vlan modify slot 1 tunnel 7 type c-type vid 4070 p-bits 5
pwe3> pwe3 tunnel enable slot 1 id 7
To verify the configuration details of the tunnel you just created, enter the following command:
pwe3> pwe3 tunnel config show slot 1 id 7
To verify the tunnel status and MAC addresses of the tunnel you just created, enter the following command:
pwe3> pwe3 tunnel status show slot 1 id 7

Note
These examples assume that all hops between the unit you are configuring and the TDM interface on the remote unit are already configured. If they are not configured, you can still configure the tunnel, but the verification commands may produce unexpected results.
To configure a pseudowire tunnel on which the remote MAC address is dynamically learned the remote-mac-addr parameters must be configured to 00:00:00:00:00:00. In this case the remote MAC address is learned through CFM protocol. You have to create a Maintenance Domain (MD), a Maintenance Association (MA), to enable CCM Messages and to assign an MA to the tunnel. See Adding a Maintenance Domain (MD) (CLI), Adding a Maintenance Association (MA) (CLI), Enabling CCM Messages (CLI), and Assigning an MA to a TDM Tunnel (CLI).
The following commands create and enable tunnel 7, from the fixed E1/DS1 interface with the remote MAC address dynamically learned:
pwe3> pwe3 tunnel eth add slot 1 id 7 remote-mac-addr 00:00:00:00:00:00
pwe3> pwe3 tunnel vlan modify slot 1 tunnel 7 type c-type vid 4070 p-bits 5
pwe3> pwe3 tunnel enable slot 1 id 7
Configuring Pseudowire Profiles (CLI)
Each TDM service must include a profile. The profile determines the behavior of the service, including the buffer, payload suppression, and other parameters. A profile can be used by multiple services. You can configure up to 64 TDM profiles. TDM profile configuration must be performed from pwe3 view:
root> pwe3
pwe3>
To create and configure a TDM profile, use the following commands:
pwe3> pwe3 pw-profile add id <id>
pwe3> pwe3 pw-profile basic-params modify id <id> payload-size <payload-size> jitter-buffer-depth <jitter-buffer-depth> payload-suppression <payload-suppression>
Table 284 Pseudowire Profile CLI Parameters
| Parameter | Input Type | Permitted Values | Description |
| id | Number | 1-64 | A unique ID that identifies the profile. |
| payload-size | Number 1-64 | The number of times E1 should be sampled for each Ethernet packet. | |
| jitter-buffer-depth | Number 1-32 | The desired jitter buffer depth (in milliseconds). This is used to enable the network to accommodate PSN-specific packet delay variation. The jitter buffer can be increased if the network experiences a higher-than-normal level of jitter. | |
| payload-suppression | Variable | enable disable | Enables or disables payload suppression. When enabled, the payload is suppressed upon incoming TDM failure. |
The following commands add TDM profile 5, with a payload size of 2, jitter buffer depth of 4 milliseconds, and payload suppression disabled:
pwe3> pwe3 pw-profile add id 5
pwe3> pwe3 pw-profile basic-params modify id 5 payload-size 2 jitter-buffer-depth 4 payload-suppression disable
To verify the details of the profile you just created, enter the following command:
pwe3> pwe3 pw-profile show id 5
Configuring Ethernet Services for TDM Traffic (CLI)
You can configure traffic services for TDM traffic using the same commands and parameters used for Ethernet services. For instructions, refer to Ethernet Services Overview (CLI).
The following commands add a multipoint service with an EVC ID of PW-Slot12_EVC-70. This service has the following service points:
- A service point on a 1+1 HSB group (rp3), with an s-tag interface type and VLAN 4070 classified to the service point.
- A service point on the E1/DS1 interface, port 1, with a dot1q interface type and VLAN 4070 classified to the service point.
root> ethernet service add type mp sid 970 admin operational evc-id PW-Slot12_EVC-70
root> ethernet service sid 970
service[970]>
service[970]> sp add sp-type snp int-type s-tag spid 1 group rp3 vlan 4070 sp-name PWtoRadio_SP4070-1
service[970]> sp add sp-type sap int-type dot1q spid 2 interface pwe slot 1 port 1 vlan 4070 sp-name PWtoRadio_SP4070-1
service[970]> exit
Configuring Pseudowire Path Protection and Dual Homing (CLI)
Pseudowire path protection enables the operator to define two separate network paths for a single TDM service.
Two different kinds of path protection are available, each suitable for a different network topology:
- 1:1 Pseudowire path protection is suitable for ring networks that consist entirely of PTP 820G and/or PTP 820G and/or PTP 820F elements with two end-point interfaces for the TDM trail.
- 1+1 Dual Homing Pseudowire path protection is suitable for networks in which the PTP 820G and/or PTP 820F elements are set up as a chain connected to the third party networks at two different sites. The ring is closed on one side by the PTP 820G and/or PTP 820F elements, and on the other by third party equipment supporting SNCP. In this case, there are three end-point interfaces in the PTP 820G and/or PTP 820F section of the network.
Both types of pseudowire path protection requires the use of SOAM (CFM) at both end-points. The TDM module sends two data streams to the CPU.
In 1:1 path protection, only the data stream for the active path contains actual traffic. Both data streams contain continuity messages (CCMs). This enables the TDM module to monitor the status of both paths without doubling the amount of data being sent over the network. In 1+1 Dual Homing path protection, both data streams contain actual traffic and CCMs. In both types of path protection, the TDM module determines when a switchover is necessary based on the monitored network status.
In order to achieve path protection, different provisioning should be made for the Ethernet service corresponding to each of the two data streams. In order to do this, it is recommended to map the corresponding Ethernet services to MSTP instance number 4095, which is meant for Traffic Engineering (ports are always forwarding) and to map the two different transport VLANs over two different paths.
Pseudowire path protection uses CFM to monitor the network paths. Because SOAM (CFM) is configured on the TDM module level, the TDM module can determine the status of the entire network path, up to and including the actual TDM interface.
This section describes the CLI commands required to configure CFM and tunnel groups, which are basic components of a pseudowire path protection configuration. This is followed by a sample configuration, which illustrates how to perform all the steps required to configure a TDM service with path protection.
This section includes:
- Adding a Maintenance Domain (MD) (CLI)
• Adding a Maintenance Association (MA) (CLI)
• Enabling CCM Messages (CLI)
• Assigning an MA to a TDM Tunnel (CLI) - Configuring a Pseudowire Tunnel Group (CLI)
- Configuring a Network Edge Node in a Dual Homing Configuration (CLI)
Adding a Maintenance Domain (MD) (CLI)
You must define at least one MD. To define an MD, enter the following command in pwe3 view:
pwe3> pwe3 soam md add slot <slot> id <id> name <name> level <level>
The following command assigns MD 1 to the E1/DS1 interface. The name of the MD is "test", and its MD level is 5:
pwe3> pwe3 soam md add slot 1 id 1 name test level 5
Table 285 Pseudowire OEM MD CLI Parameters
| Parameter | Input Type | Permitted Values | Description |
| slot Number 1 | |||
| id Number 1-8 | An ID that identifies the MD. This ID is unique per slot. | ||
| name Text String | Assigns a name to the MD, for informational purposes. | ||
| level Number 1-7 | The maintenance level of the MD. The maintenance level ensures that the CFM frames for each domain do not interfere with each other. Where domains are nested, the encompassing domain must have a higher level than the domain it encloses. The maintenance level is carried in all CFM frames that relate to that domain. | ||
Adding a Maintenance Association (MA) (CLI)
Maintenance Associations (MAs) define Maintenance End Points (MEPs), and perform continuity checks by sending Continuity Check Messages (CCMs) between the MEPs. This is the mechanism by which PTP 820G or PTP 820F monitors the status of both paths in a protected TDM service and determines when a switchover is necessary.
For PTP 820F and PTP 820G, you can configure up to 64 MAs.
Each of the two TDM tunnels that make up a path-protected TDM service must be assigned its own MA. Each MA must have a unique local MEP ID and a unique remote MEP ID. Each MA must also include a defined VLAN, which corresponds to the VLAN that will be assigned to the TDM tunnel associated with the MA.
To add an MA, enter the following command in pwe3 view:
pwe3> pwe3 soam ma add slot <slot> id <id> name <name> md-id <md-id>
local-mep <local-mep> remote-mep <remote-mep> vlan-type <vlan-type> vid
<vid>
Table 286 Pseudowire OEM MA CLI Parameters
| Parameter | Input Type | Permitted Values | Description |
| slot Number 1 | |||
| id | Number | 1-168 | A unique ID that identifies the MA. |
| md-id | Number | Any configured MD ID. | The MD to which the MA belongs. |
| local-mep | Number | 1-231 | A unique ID for the local MEP. |
| remote-mep | Number | 1-231 | A unique ID for the remote MEP. |
| vlan-type Variable | none s-type c-type | The outer VLAN type assigned to the tunnel to which the MA will be attached. | |
| vid | Number | 0-4094 | A VLAN ID (1-4094). The VLAN assigned to the tunnel to which the MA will be attached. |
To display the status of all MAs configured on the unit's TDM module, enter the following command in pwe3 view:
pwe3> pwe3 soam ma status show
The following is an example of a pwe3 soam ma status show command and its output:
root> pwe3
pwe3> pwe3 soam ma status show
Slot Number: 1
Maintenance Association Id: 1
Remote MEP MAC Address: ff:ff:ff:ff:ff:ff
Defects:
rmep-ccm
Slot Number: 1
Maintenance Association Id: 2
Remote MEP MAC Address: 0:a:25:0:32:ea
Defects:
no-alarm
To display the status of a specific MA, enter the following command in pwe3 view:
pwe3> pwe3 soam ma status show slot <slot> id <id>
The following is an example of a pwe3 soam ma status show slot
root> pwe3
pwe3> pwe3 soam ma status show slot 1 id 1
Slot Number: 1
Maintenance Association Id: 1
Remote MEP MAC Address: ff:ff:ff:ff:ff:ff
Defects:
rmep-ccm
pwe3>
The following command creates MA 1 on the E1/DS1 interface. This MA includes a local MEP with ID 200 and a remote MEP with ID 1. This MA will later be assigned to a TDM tunnel using C-Type VLAN 100:
pwe3> pwe3 soam ma add slot 1 id 1 name MA1 md-id 1 local-mep 200 remote-mep 1 vlan-type c-type vid 100
Enabling CCM Messages (CLI)
In order for an MA to check the connectivity of the network path, you must enable CCM on the MA. To enable CCM, enter the following command in pwe3 view:
pwe3> pwe3 soam ma ccm enable slot <slot> id <id>
Table 287 Pseudowire OEM CCM Messages CLI Parameters
| Parameter | Input Type | Permitted Values | Description |
| slot Number 1 | |||
| id Number | The ID of any configured MA. | The MA on which you want to enable CCM. | |
The following command enables CCM on MA 1 on the E1/DS1 card:
pwe3> pwe3 soam ma ccm enable slot 4 id 1
Assigning an MA to a TDM Tunnel (CLI)
Once you have created at least two MAs and at least two TDM tunnels, you must assign the MAs to the tunnels. To assign an MA to a TDM tunnel, enter the following command in pwe3 view:
pwe3> pwe3 tunnel ma-id modify slot <slot> tunnel <tunnel> ma-id <ma-id>
Table 288 Assigning MA to TDM Tunnel CLI Parameters
| Parameter | Input Type | Permitted Values | Description |
| slot Number 1 | |||
| tunnel Number | Any configured TDM tunnel ID. | The ID of the TDM tunnel. | |
| ma-id | Number | Any configured MA ID. | The MA you want to assign to the tunnel. |
The following command assigns MA 1 to TDM tunnel 1 on the E1/DS1 card:
pwe3> pwe3 tunnel ma-id modify slot 1 tunnel 1 ma-id 1
Configuring a Pseudowire Tunnel Group (CLI)
TDM 1:1 and 1+1 Dual Homing path protection are implemented by combining two pseudowire tunnels into a single tunnel group. One of the tunnels in the group is designated as the primary tunnel. The other tunnel is designated as the secondary tunnel.
CCM messages are sent from the TDM module to the CPU via both tunnels. In 1:1 path protection, only the primary tunnel sends actual traffic. In 1+1 Dual Homing path protection, both tunnels send traffic.
The CPU monitors both paths using the CCM messages, and determines when to perform a switchover from the primary tunnel to the secondary tunnel.
Path protection can be configured to operate in revertive mode. In revertive mode, the system monitors the availability of the protected path at all times. After switchover to the protecting path, once the active path is operational and available without any alarms, the system waits for the duration of the user-configured Wait to Restore (WTR) time and then, if the active path remains operational and available, initiates a revertive protection switch. A single WTR time is configured for all the TDM pseudowire services in the system. However, services with path protection can be configured individually as revertive or non-revertive. You can configure this in the revertive-admin parameter of the command for creating a tunnel group (see below).

Note
TDM pseudowire services with 1:1 path protection that were configured using software versions prior to T7.9 are non-revertive.
To set the WTR time for TDM pseudowire services with revertive path protection, enter the following command in root view:
root> platform wtr-timer set <wtr-timer>
To display the WTR time for TDM pseudowire services with revertive path protection, enter the following command in root view:
root> platform wtr-timer show
To create a Pseudowire tunnel group, enter the following command in pwe3 view:
pwe3> pwe3 tunnel-group add slot <slot> id <id> primary-id <primary-id> secondary-id <secondary-id> 1plus1 <1plus1> revertive-admin <revertive>
To enable a Pseudowire tunnel group, enter the following command in pwe3 view:
pwe3> pwe3 tunnel-group enable slot <slot> id <id>
Table 289 Pseudowire Tunnel Group CLI Parameters
| Parameter | Input Type | Permitted Values | Description |
| wtr-timer | Number | 10-720 | The WTR time, in seconds, for TDM pseudowire services with revertive path protection. |
| slot Number 1 | |||
| id | Number | 1-84 | The ID of the TDM tunnel group. |
| primary-id Number | Any configured TDM tunnel. | The tunnel you want to assign as the primary tunnel. | |
| secondary-id Number | Any configured TDM tunnel. | The tunnel you want to assign as the secondary tunnel. | |
| 1plus1 Variable | enable disable | Determines whether the tunnel group is configured for 1:1 path protection or 1+1 Dual Homing path protection: enable - The tunnel group will perform 1+1 Dual Homing path protection. disable - The tunnel group will perform 1:1 path protection. If you do not include this parameter in the command, the tunnel group will be configured as a 1:1 path protection group. | |
| revertive Variable | enable disable | Determines whether services using the tunnel group will use revertive mode. | |
The following commands create and enable tunnel group 1 on the E1/DS1 interface. This group will perform 1:1 path protection. In this tunnel group, tunnel 1 is the primary tunnel and tunnel 2 is the secondary tunnel. Revertive mode is disabled for this tunnel group.
pwe3> pwe3 tunnel-group add slot 1 id 1 primary-id 1 secondary-id 2
revertive-admin disable
pwe3> pwe3 tunnel-group enable slot 1 id 1
The following commands set the revertive timer to 20 seconds, and create and enable tunnel group 2 on the E1/DS1 interface. This group will perform 1+1 Dual Homing path protection. In this tunnel group, tunnel 1 is the primary tunnel and tunnel 2 is the secondary tunnel. Revertive mode is enabled for this group.
root> platform wtr-timer set 20
root> pwe3
pwe3> pwe3 tunnel-group add slot 1 id 2 primary-id 1 secondary-id 2
lplus1 enable revertive-admin enable
pwe3> pwe3 tunnel-group enable slot 1 id 2
To display the status of all tunnel groups configured on the unit, enter the following command in pwe3 view:
pwe3> pwe3 tunnel-group status show
The following is an example of a pwe3 soam ma status show command and its output:
root> pwe3
pwe3> pwe3 tunnel-group status show

-------->
    Slot Number: 1
    PSN Tunnel Group Id: 1
    Operational Status: up
    Active PSN Tunnel: secondary
    Protection Switches: 3

-------->
    Slot Number: 1
    PSN Tunnel Group Id: 2
    Operational Status: up
    Active PSN Tunnel: primary
    Protection Switches: 0
To display the status of a specific tunnel group, enter the following command in pwe3 view:
pwe3> pwe3 tunnel-group status show slot <slot> id <id>
Table 290 Pseudowire Tunnel Group Display CLI Parameters
| Parameter | Input Type | Permitted Values | Description |
| slot Number 1 | |||
| id Number 1-84 | An ID that identifies the tunnel group.This ID is unique per slot. | ||
The following is an example of a pwe3 tunnel-group status show slot
root> pwe3
pwe3> pwe3 tunnel-group status show slot 1 id 1
-------->
Slot Number: 1
PSN Tunnel Group Id: 1
Operational Status: up
Active PSN Tunnel: secondary
Protection Switches: 3
pwe3>
Configuring a Network Edge Node in a Dual Homing Configuration (CLI)
For a tunnel that is to be used as the network edge node in a 1+1 Dual Homing configuration, you must use the following command in pwe3 view to enable the propagation of defects to the service's end point:
pwe3> pwe3 tunnel prop-tdm-defect-to-soam admin enable slot <slot> id <tunnel>

Note
Since the edge node itself is part of the protected or protecting path, the node itself is essentially unprotected and you do not need to configure a tunnel group for the node.
Table 291 Network Edge Node for Dual Homing CLI Parameters
| Parameter | Input Type | Permitted Values | Description |
| slot Number 1 | |||
| tunnel Number | Any configured TDM tunnel ID. | The ID of the TDM tunnel. | |
Manually Configuring Pseudowire Services (CLI)

Note
It is recommended to use the Web EMS TDM Pseudowire Services interface, which provides a step-by-step workflow based on pre-configured pseudowire settings. See Configuring TDM Pseudowire Services.
For PTP 820F and PTP 820G, you can configure up to 16 TDM pseudowire services. Pseudowire service configuration must be performed from pwe3 view:
root> pwe3
pwe3>

Caution
Once a profile, tunnel, or bundle has been assigned to a service, you cannot modify that profile, tunnel, or bundle until you first disable the service.
To configure and enable a pseudowire service, use the following commands:
pwe3> pwe3 pws satop-eth add slot <slot> id <id> tdm-port <tdm-port> pw-profile-id <pw-profile-id> psn-tunnel-id <psn-tunnel-id> src-ecid <src-ecid> dst-ecid <dst-ecid> cr-master-pws <cr-master-pws> protected <protected>
pwe3> pwe3 pws enable slot <slot> id <id>
To display the status of all pseudowire services, enter the following command in pwe3 view:
pwe3> pwe3 pws status show slot <slot>
The following is an example of a pwe3 pws status show slot command and its output:
root> pwe3
pwe3> pwe3 pws status show slot 1

Slot Number: 1
SW Version: 2.10.18016
Ethernet Source MAC Address: 0:a:25:0:28:e8
Alarms:
Front Panel Clock LOS: cleared
Card Reset: cleared
Configuration Mismatch: cleared
Card Communication Disruption: cleared
Host Communication Disruption: cleared
HW Failure: cleared
LEDs:
Front Panel Clock Output: gray
Front Panel Clock Input: gray
To display the status of a specific pseudowire service, enter the following command in pwe3 view:
pwe3> pwe3 pws status show slot <slot> id <id>
The following is an example of a pwe3 tunnel status show slot
root> pwe3
pwe3> pwe3 pws status show slot 1 id 1
-------->
Slot Number: 1
PW Service Id: 1
Operational Status: down
Transmitted Packets: 83653910
Received Packets: 0
Transitions Normal LOPS: 1
Jitter Buffer Overruns: 0
Max Jitter Buffer Deviation: 900
Current Min Jitter Buffer: 0
Current Max Jitter Buffer: 0
Alarms:
Misconnection: cleared
Loss of Frames: raised
Late Frame: cleared
Malformed Frames: cleared
Jitter Buffer Overrun: cleared
Table 292 Pseudowire Service CLI Parameters
| Parameter | Input Type | Permitted Values | Description |
| slot Number 1 | |||
| id | Number | 1-16 | A unique ID that identifies the service. |
| tdm-port | Number | 1-16 | The port used with the service. |
| pw-profile-id | Number | 1-64 | The pseudowire profile used with the service. The pseudowire profile determines the behavior of the service, including the buffer, payload suppression, and other parameters. A profile can be used by multiple services. |
| psn-tunnel-id | Number | 1-168 | The pseudowire tunnel used with the service. The tunnel determines how traffic over the service passes through the network. In this version, encapsulation must use the MEF-8 protocol. Up to 16 tunnels can be configured for each TDM card in the chassis.If the protected parameter is set to yes, the psn-tunnel-id parameter identifies a tunnel group rather than a tunnel. |
| src-ecid | Number | 1-1048575 | The source ECID for the Ethernet tunnel. |
| dst-ecid | Number | 1-1048575 | The destination ECID for the Ethernet tunnel. |
| cr-master-pws | Variable | yes no | Enter yes to use this service as a reference for clock recovery. Otherwise, enter no. |
| protected Variable | yes no | Enter yes to create a protected path service. Otherwise, enter no.If this parameter is set to yes, the psn-tunnel-id parameter identifies a tunnel group rather than a tunnel, and the service is configured as a path-protected service. For more information on pseudowire path protection, refer to Configuring Pseudowire Path Protection and Dual Homing (CLI). | |
The following commands configure and enable service 12, on the E1/DS1 interface:
pwe3> pwe3 pws satop-eth add slot 1 id 12 tdm-port 9 pw-profile-id 5 psn-tunnel-id 7 src-ecid 31 dst-ecid 131 cr-master-pws no protected no
pwe3> pwe3 pws enable slot 1 id 12
To verify the configuration of the service you just created, enter the following command:
pwe3> pwe3 pws config show slot 1 id 12
Displaying TDM PMs (CLI)

Note
Native TDM and pseudowire service PMs can only be displayed via the Web EMS. See Displaying Native TDM Service PMs and Displaying Pseudowire Service PMs.
To display PMs for the E1/DS1 interface measured at 15 minute intervals, enter the following command in root view:
root> pwe3 pws line-pm-15 show slot <slot> id <id>
To display PMs for the E1/DS1 interface measured at daily intervals, enter the following command in root view:
root> pwe3 pws line-pm-24 show slot <slot> id <id>
Table 293 E1/DS1 PMs CLI Parameters
| Parameter | Input Type | Permitted Values | Description |
| slot Number 1 | |||
| id | Number | 1-16 | The interface |
Chapter 22: Synchronization (CLI)
This section includes:
- Configuring the Sync Source (CLI)
- Configuring the Outgoing Clock (CLI)
- Configuring SSM Messages (CLI)
- Configuring the Revertive Timer (CLI)
• Displaying Synchronization Status and Parameters (CLI) - Configuring 1588 Transparent Clock (CLI)
- Configuring 1588 Boundary Clock (CLI)

Note
By default, the unit is set to operate according to the ETSI standard. For instructions on configuring the system to operate according to the ANSI (FCC) standard (DS1), see TDM Overview (CLI).
Configuring the Sync Source (CLI)
The Frequency signals can be taken by the system from Ethernet and radio interfaces. The reference frequency may also be conveyed to external equipment through different interfaces.

Note
T3 is only supported when the unit is operating in ETSI mode.
Frequency is distributed by configuring the following parameters in each node:
- System Synchronization Sources – These are the interfaces from which the frequency is taken and distributed to other interfaces. Up to 16 sources can be configured in each node. A revertive timer can be configured. For each interface, you must configure:
- Priority (1-16) – No two synchronization sources can have the same priority.
- Quality – The quality level applied to the selected synchronization source. This enables the system to select the source with the highest quality as the current synchronization source.
• Each unit determines the current active clock reference source interface:
- The interface with the highest available quality is selected.
From among interfaces with identical quality, the interface with the highest priority is selected.
When configuring a Sync source, the Sync mode must be set to its default setting of automatic. To display the current Sync mode, enter the following CLI command in root view:
root> platform sync mode show
If the Sync mode is set to pipe, you must set it to automatic by entering the following CLI command in root view:
root> platform sync mode set automatic
When configuring an Ethernet interface as a Sync source, the Media Type of the interface must be rj45 or sfp, not auto-type. To view and configure the Media Type of an Ethernet interface, see Configuring an Interface's Media Type (CLI).
This section includes:
- Configuring an Ethernet Interface as a Synchronization Source (CLI)
- Configuring a Radio Interface as a Synchronization Source (CLI)
• Clearing All Sync Sources (CLI)
Configuring an Ethernet Interface as a Synchronization Source (CLI)
You can configure Ethernet interfaces, including Cascading interfaces, to be synchronization sources.

Note
In order to select an Ethernet interface, you must first specify the media type for this interface. See Configuring Ethernet Services (CLI).
To configure an Ethernet interface as a synchronization source, enter the following command in root view:
root> platform sync source add eth-interface slot <slot> port <port>
priority <priority> quality <quality>
To edit the parameters of an existing Ethernet interface synchronization source, enter the following command in root view:
root> platform sync source edit eth-interface slot <slot> port <port> priority <priority> quality <quality>
To remove an Ethernet interface as a synchronization source, enter the following command in root view:
root> platform sync source remove eth-interface slot <slot> port <port>
Table 294 Sync Source Ethernet CLI Parameters
| Parameter | Input Type | Permitted Values | Description |
| slot Number 1 | |||
| port Number 1-6 | The interface to be configured as a synchronization source. | ||
| priority | Number | 1-16 | The priority of this synchronization source relative to other synchronization sources configured in the unit. |
| quality | Variable | For ETSI systems:automaticprcssu-assu-bg813.8262For ANSI (FCC) systems:automaticprsstratum-2transit-nodestratum-3estratum-3smcunknown | The quality level applied to the selected synchronization source. This enables the system to select the source with the highest quality as the current synchronization source.If the quality is set to automatic, then the quality is determined by the received SSMs. If no valid SSM messages are received or in case of interface failure (such as LOS, LOC, LOF), the quality becomes "failure."SSM must be enabled on the remote interface in order for the interface to receive SSM messages.If the quality is configured to a fixed value, then the quality status becomes "failure" upon interface failure (such as LOS, LOC, LOF). |
The following command configures Ethernet port 2 as a synchronization source with priority = 8, and quality = automatic:
root> platform sync source add eth-interface slot 1 port 2 priority 8 quality automatic
The following command changes the priority of this synchronization source to 6:
root> platform sync source edit eth-interface slot 1 port 2 priority 6
The following command removes this synchronization source:
root> platform sync source remove eth-interface slot 1 port 2
Configuring a Radio Interface as a Synchronization Source (CLI)
To configure a radio interface as a synchronization source, enter the following command in root view:
root> platform sync source add radio-interface slot <slot> port <port> radio-channel <radio-channel> priority <priority> quality <quality>
To edit the parameters of an existing radio interface synchronization source, enter the following command in root view:
root> platform sync source edit radio-interface slot <slot> port <port> radio-channel <radio-channel> priority <priority> quality <quality>
To remove a radio interface as a synchronization source, enter the following command in root view:
root> platform sync source remove radio-interface slot <slot> port <port> radio-channel <radio-channel>
Table 295 Sync Source Radio CLI Parameters
| Parameter | Input Type | Permitted Values | Description |
| slot Number | RMC in an expansion slot: 2-3Fixed radio interfaces: 1 | ||
| port Number | RMC in an expansion slot: 1Fixed radio interface: PTP 820G and PTP 820GX: 1-2 | ||
| radio-channel | Number | 0 – 85 | A synchronization channel used for interoperability.For interoperability with other PTP 820G or PTP 820F units, this parameter must be set to 0. |
| priority | Number | 1 – 16 | The priority of this synchronization source relative to other synchronization sources configured in the unit. |
| quality | Variable | For ETSI systems:automaticprcssu-asssu-bg813.8262For ANSI (FCC) systems:automaticprsstratum-2transit-nodestratum-3estratum-3smcunknown | The quality level applied to the selected synchronization source. This enables the system to select the source with the highest quality as the current synchronization source.If the quality is set to automatic, then the quality is determined by the received SSMs. If no valid SSM messages are received or in case of interface failure (such as LOS, LOC, LOF), the quality becomes "failure."SSM must be enabled on the remote interface in order for the interface to receive SSM messages. |
The following command configures radio interface 1 as a synchronization source with priority = 16, and quality = automatic:
root> platform sync source add radio-interface slot 1 port 1 radio-channel 1 priority 16 quality automatic
The following command changes the priority of this synchronization source to 14:
root> platform sync source edit radio-interface slot 1 port 1 radio-channel 1 priority 14
The following command removes this synchronization source:
root> platform sync source remove radio-interface slot 1 port 1 radio-channel 1
Clearing All Sync Sources (CLI)
To clear all synchronization sources that have been configured in the system, enter the following command in root view:
root> platform sync source remove all
Configuring the Outgoing Clock (CLI)
For each interface, you can choose between using the system clock or the interface's internal clock as its synchronization source. By default, interfaces use the system clock.

Note
You cannot edit the clock source of E1/DS1 interfaces.
To set the interface clock for a radio interface, enter the following command in root view:
root> platform sync interface-clock set radio-interface slot <slot> port <port> radio-channel <radio-channel> source <source>

Note
To configure the interface clock on an Ethernet interface, the Media Type of the interface must be rj45 or sfp, not auto-type. To view and configure the Media Type of an Ethernet interface, see Configuring an Interface's Media Type (CLI).
To set the interface clock for an Ethernet interface, enter the following command in root view:
root> platform sync interface-clock set eth-interface slot <slot> port
<port> source <source>
Table 296 Outgoing Clock CLI Parameters
| Parameter | Input Type | Permitted Values | Description |
| slot Number 1 | |||
| port Number | ethernet: 1-6radio: 1-2tdm: 1 | The port number of the interface. | |
| radio-channel | Number | 1 – 84 | The radio-channel configured for the synchronization source. |
| source Variable | system-clocklocal-clock | system-clock – The interface uses the system clock as its synchronization source.local-clock – The interface uses its internal clock as its synchronization source. | |
The following command sets the clock source for radio interface 2 to its internal clock:
root> platform sync interface-clock set radio-interface slot 1 port 2
radio-channel 1 source local-clock
The following command sets the clock source for Ethernet port 2 to the system clock:
root> platform sync interface-clock set eth-interface slot 1 port 2 source system-clock
Configuring SSM Messages (CLI)
In order to provide topological resiliency for synchronization transfer, PTP 820G and PTP 820F implements the passing of SSM messages over the Ethernet and radio interfaces. SSM timing in PTP 820G and PTP 820F complies with ITU-T G.781.

Note
LIC-T155 (1x ch-STM-1/OC-3) cards cannot pass SSM messages.
In addition, the SSM mechanism provides reference source resiliency, since a network may have more than one source clock.
The following are the principles of operation:
- At all times, each source interface has a "quality status" which is determined as follows:
○ If quality is configured as fixed, then the quality status becomes “failure” upon interface failure (such as LOS, LOC, LOF).
If quality is automatic, then the quality is determined by the received SSMs. If no valid SSM messages are received or in case of interface failure (such as LOS, LOC, LOF), the quality becomes "failure."
- Each unit holds a parameter which indicates the quality of its reference clock. This is the quality of the current synchronization source interface.
- The reference source quality is transmitted through SSM messages to all relevant radio interfaces.
- In order to prevent loops, an SSM with quality "Do Not Use" is sent from the active source interface (both radio and Ethernet).
In order for an interface to transmit SSM messages, SSM must be enabled on the interface. By default, SSM is disabled on all interfaces. On radio interfaces, SSM messages with the quality DNU (Do not Use) are sent when SSM is disabled on the interface.
To enable SSM on a radio interface, enter the following command in root view:
root> platform sync ssm admin radio-interface slot <slot> port <port> admin on
To disable SSM on a radio interface, enter the following command in root view:
root> platform sync ssm admin radio-interface slot <slot> port <port> admin off
To enable SSM on an Ethernet interface, enter the following command in root view:
root> platform sync ssm admin eth-interface slot <slot> port <port> admin on
To disable SSM on an Ethernet interface, enter the following command in root view:
root> platform sync ssm admin eth-interface slot <slot> port <port> admin off
The following command enables SSM on radio interface 2:
root> platform sync ssm admin radio-interface slot 2 port 1 admin on
The following command enables SSM on Ethernet port 1:
root> platform sync ssm admin eth-interface slot 1 port 1 admin on
Configuring the Revertive Timer (CLI)
You can configure a revertive timer for the unit. When the revertive timer is configured, the unit will not switch to another synchronization source unless that source has been stable for at least the number of seconds defined in the revertive timer. This helps to prevent a situation in which numerous switchovers occur when a synchronization source reports a higher quality for a brief time interval, followed by a degradation of the source's quality. By default, the revertive timer is set to 0, which means that it is disabled.

Note
TDM trails with 1:1 path protection that were configured using software versions prior to T7.9 are non-revertive.
The Revertive timer must be configured before creating a protecting TDM trail so that the configured WTR time will be in effect for this trail.
To configure the revertive timer, enter the following command in root view:
root> platform sync revertive-timer set rev_time <rev_time>
Table 297 Synchronization Revertive Timer CLI Parameters
| Parameter | Input Type | Permitted Values | Description |
| rev_time | Number | 1-1800 | The revertive timer, in seconds. |
The following command sets the revertive timer as 7 seconds:
root> platform sync revertive-timer set rev_time 7
To display the revertive timer, enter the following command in root view:
root> platform sync revertive-timer show
Displaying Synchronization Status and Parameters (CLI)
To display the synchronization sources configured in the system, enter the following command in root view:
root> platform sync source config show
The following is a sample synchronization source display output:
number of configured sources = 4
----| Slot | Port | Type | Instance | Priority | Quality |
----| 1 | 1 | Ethernet | | 11 | automatic |
----| 1 | 1 | Radio | | 3 | automatic |
----| 1 | 2 | Radio | | 5 | automatic |
----|
To display the synchronization source status, enter the following command in root view:
root> platform sync source status show
The following is a sample synchronization source status display output:
number of configured sources = 4
|----|
| Slot | Port | Type | Instance | Active-Src | Act. Quality | Received SSM | revert-time |
|----|
| 1 | 1 | ethernet | | false | PRC | do-not-use | 0 |
|----|
| 1 | 1 | radio | | false | do-not-use | do-not-use | 0 |
|----|
| 1 | 2 | radio | | false | failure | do-not-use | 0 |
|----|
To display the current system reference clock quality, enter the following command in root view:
root> platform sync source show-reference-clock-quality
To display the current synchronization configuration of the unit's interfaces, enter the following command in root view:
root> platform sync interface config show
The following is a sample interface synchronization configuration display output:
| Slot | Port | Type | Trail Radio | Source-Type | SSM-Admin | | |||||
| 1 | 1 | Ethernet | | System Clock | Off | |
| 1 | 2 | Ethernet | | System Clock | Off | |
| 1 | 3 | Ethernet | | System Clock | Off | |
| 1 | 4 | Ethernet | | System Clock | Off | |
| 1 | 5 | Ethernet | | System Clock | Off | |
| 1 | 6 | Ethernet | | System Clock | On | |
| 1 | 1 | Radio | | System Clock | On | |
| 1 | 2 | Radio | | System Clock | On | |
To display the current system clock status, enter the following command in root view:
root> platform sync clu-state show
The following is a sample system clock status display output:
CLU is in Free-running mode
Configuring 1588 Transparent Clock (CLI)

Note
This section is only relevant for PTP 820G. 1588 Transparent Clock for PTP 820F is planned for future release.
PTP 820G uses 1588v2-compliant Transparent Clock to counter the effects of delay variation. Transparent Clock measures and adjusts for delay variation, enabling the PTP 820G to guarantee ultra-low PDV.
A Transparent Clock node resides between a master and a slave node, and updates the timestamps of PTP packets passing from the master to the slave to compensate for delay, enabling the terminating clock in the slave node to remove the delay accrued in the Transparent Clock node. The Transparent Clock node is itself neither a master nor a slave node, but rather, serves as a bridge between master and slave nodes.
Note that in release 11.3:
• 1588 TC is not supported when Master-Slave communication is using the IPv6 transport layer.
• 1588 TC cannot be used on 1+1 HSB links.
• 1588 TC is not supported with Frame Cut-Through.
• 1588 TC is supported with IPv4 UDP encapsulation only.
- Multicast PTP packets are only supported with Point-to-Point services. Unicast PTP packets are supported with both Point-to-Point and Multipoint services.
Before configuring Transparent Clock:
- Add the port receiving synchronization from the customer side as a Sync source with Sync Interface Priority 1. See Configuring an Ethernet Interface as a Synchronization Source (CLI).
- Add a radio interface as a second Sync source with lower priority than the port receiving synchronization from the customer side. See Configuring a Radio Interface as a Synchronization Source (CLI).
- On the remote side of the radio link, add the radio interface facing the local device as a Sync source, with Sync Interface Priority 1. See Configuring a Radio Interface as a Synchronization Source (CLI).
- Add the port receiving synchronization from the customer side as a Sync source, with Sync Interface Priority 1. See Configuring a Radio Interface as a Synchronization Source (CLI).
- Verify that the Sync Interface Quality Status of the first Sync source is not Failure. See Displaying Synchronization Status and Parameters (CLI).

Note
Make sure to enable Transparent Clock on the remote side of the link before enabling it on the local side.
To enable Transparent Clock, enter the following command in root view to enable:
root> platform sync ptp-tc set admin enable
To disable Transparent Clock, enter the following command in root view :
root> platform sync ptp-tc set admin disable
Enter one of the following commands in root view to assign the radio or Multi-Carrier ABC group that will carry the PTP packets and determine the direction of the PTP packet flow.
For an individual radio, enter the following command:
root> platform sync ptp-tc set radio slot <slot> port <port> direction <upstream|downstream>
For a Multi-Carrier ABC group, enter the following command:
root> platform sync ptp-tc set group id <group> direction <upstream|downstream>
The direction parameter must be set to different values on the two sides of the link, so that if you set the local side to upstream, you must set the remote side to downstream, and vice versa. Otherwise than that, it does not matter how you set this parameter.
To display the Transparent Clock settings, enter the following command in root view:
root> platform sync ptp-tc show status
The following commands enable Transparent Clock on radio carrier 1 and configure the radio to send PTP packets downstream:
root> platform sync ptp-tc set admin enable
root> platform sync ptp-tc set radio slot 1 port 1 direction downstream
The following commands enable Transparent Clock on Multi-Carrier ABC group 1 and configure the radio to send PTP packets upstream:
root> platform sync ptp-tc set group id mc-abcl direction upstream
Table 298 1588 Transparent Clock CLI Parameters
| Parameter | Input Type | Permitted Values | Description |
| slot Number 1 | |||
| port Number 1-2 | |||
| group | Variables | mc-abc1 | |
1588 packets should be mapped to CoS 7. By default, 1588 packets are not mapped to any CoS. To map 1588 packets to CoS 7, you must disable CoS preservation for 1588 packets. This must be performed via CLI, using the following command:
root> ethernet generalcfg ptp-tc cos-preserve set admin disable
To map 1588 packets to CoS 7, enter the following command:
root> ethernet generalcfg ptp-tc cos-preserve cos value 7
After you enter these commands, 1588 packets will automatically be mapped to CoS 7.

Note
If necessary, you can use the ethernet generalcfg ptp-tc cos-preserve cos value command to map a different CoS value (0-7) to 1588 packets, but it is recommended to map 1588 packets to CoS 7.
Configuring 1588 Boundary Clock (CLI)

Note
This section is only relevant for PTP 820G. 1588 Boundary Clock forptp 820F is planned for future release.
IEEE-1588v2 Boundary Clock enables the PTP 820 to regenerate phase synchronization via standard Ethernet. Boundary Clock complies with ITU-T Telecom Profile G.8275.1. This enables PTP 820, with Boundary Clock, to meet the rigorous synchronization requirements of LTE-Advanced (LTE-A) networks.
The Boundary Clock in PTP 820 supports up to four 1588 slave clock devices.
The Boundary Clock terminates the PTP flow it receives on the slave port, recovers the time and phase, and regenerates the PTP flow on the master ports.
The Boundary Clock node selects the best synchronization source available in the domain and regenerates PTP towards the slave clocks. This reduces the processing load from grandmaster clocks and increases the scalability of the synchronization network, while rigorously maintaining timing accuracy.
The PTP 820 Boundary Clock mechanism requires the use of untagged Ethernet multicast PTP packets.

Note
Boundary Clock and Transparent Clock can be used together in the same PTP 820 node.
Note that in release 11.3:
• 1588 BC cannot be configured on interface groups, such as LAG and Multi-Carrier ABC.
• 1588 BC can only be used in a chain or star topology. It cannot be used in a ring topology.
• 1588 BC is not supported when Master-Slave communication is using the IPv6 transport layer.
• 1588 BC is not supported with RMC-A.
• 1588 BC cannot be used on 1+1 HSB links.
• 1588 BC is not supported with Frame Cut-Through
Enabling Boundary Clock (CLI)

Note
Before configuring Boundary Clock, you must configure Transparent Clock. See Configuring 1588 Transparent Clock (CLI).
To enable Boundary Clock, enter the following command in root view to enable:
root> platform sync ptp set admin enable
You can configure up to four interfaces per unit to be part of the Boundary Clock node. These interfaces can be radio and Ethernet interfaces, but not TDM interfaces or groups (e.g., LAG or Multi-Carrier ABC groups).
For each interface, use the following commands to enable and define Boundary Clock.
To enable Boundary Clock on a port, enter the following command in root view:
root> platform sync ptp-bc interfaces set interface-type <interface-type>
slot <slot> port <port> admin enable
To set the port's role in the Boundary Clock node, enter the following command in root view:
root> platform sync ptp-bc interfaces set interface-type <interface-type>
slot <slot> port <port> master-only <master-only>
Optionally, use the following command to set the Local Priority. The Local Priority value is taken into account when two identical announce messages are received by at least two different ports. In such a case, the Boundary Clock mechanism selects the slave port based on the best (lowest) Local Priority. The default value is 128.
root> platform sync ptp-bc interfaces set interface-type <interface-type>
slot <slot> port <port> local-priority <local-priority>
Use the following command to set a MAC address for multicast re-transmission of PTP packets:
root> platform sync ptp-bc interfaces set interface-type <interface-type>
slot <slot> port <port> dest-mac <dest-mac>
Table 299 Boundary Clock Configuration CLI Parameters
| Parameter | Input Type | Permitted Values | Description |
| interface-type | Variable | ethernetradio | |
| slot Number | For interfaces on cards in an expansion slot: 2-3For fixed interfaces: 1 | The slot in which the card resides. | |
| port Number | ethernet: 1-6radio (fixed): 1-2radio (expansion slot): 1 | ||
| admin Variable | enabledisable | Enables or disables Boundary Clock on the port. | |
| master-only Variable | yesno | yes – The port can only be used as the master port, which means the port acts as a PTP synchronization source for other nodes.no – The port can be used as either a master port or the slave port. The slave port receives PTP synchronization input from an external grandmaster clock. The Best Master Clock Algorithm (BMCA) determines the port's role, based on its determination of which is the best available grandmaster clock. Only one slave port can exist in a single PTP 820 node at any one time. | |
| local-priority | Number 1-255 | ||
| dest-mac | Variable | 01-1B-19-00-00-0001-80-C2-00-00-0E | 01-1B-19-00-00-00 – General group address. An 802.1Q VLAN Bridge would forward the frame unchanged.01-80-C2-00-00-0E – Individual LAN Scope group address. An 802.1Q VLAN Bridge would drop the frame. |
The following commands set up a Boundary Clock node that includes Ethernet interfaces 1 and 2, and fixed radio interface 1 and an RMC in expansion slot 2. The Ethernet interfaces can serve as master or slave; the slave role is allocated dynamically according to the interface receiving the best grandmaster announce message according to the BMCA. The radio interfaces can only serve in the master role, i.e., they distribute PTP synchronization but do not receive PTP synchronization from an external grandmaster.
root> platform sync ptp set admin enable

root> platform sync ptp-bc interfaces set interface-type ethernet slot 1 port 1 admin enable

root> platform sync ptp-bc interfaces set interface-type ethernet slot 1 port 1 master-only no

root> platform sync ptp-bc interfaces set interface-type ethernet slot 1 port 2 admin enable

root> platform sync ptp-bc interfaces set interface-type ethernet slot 1 port 2 master-only no

root> platform sync ptp-bc interfaces set interface-type radio slot 1 port 1 admin enable

root> platform sync ptp-bc interfaces set interface-type radio slot 1 port 1 master-only yes

root> platform sync ptp-bc interfaces set interface-type radio slot 2 port 1 admin enable

root> platform sync ptp-bc interfaces set interface-type radio slot 2 port 1 master-only yes
In addition, you must perform the following steps to properly configure the Boundary Clock node:
- To map PTP packets into the Boundary Clock node, a service point must be created on each interface in the Boundary Clock node. This service point must be defined to gather untagged packets. See Adding a Service Point (CLI).
- Add a port receiving synchronization from the customer side as a Sync source, with Sync Interface Priority 1. See Configuring the Sync Source (CLI).
- Add a radio interface as a Sync source, with lower priority than the port receiving synchronization from the customer side. See Configuring the Sync Source (CLI).
- On the remote side of the radio link, add the radio interface facing the local device as a Sync source, with Sync Interface Priority 1. See Configuring the Sync Source (CLI).
- On the remote side of the radio link, if there is an Ethernet port conveying synchronization, add this port as a Sync source, with lower priority than the radio interface. See Configuring the Sync Source (CLI).
- Verify that the Sync Interface Quality Status of the first Sync source is not Failure. See Displaying Synchronization Status and Parameters (CLI).
Use the following command to display the current Boundary Clock configuration:
Configuring the Sync Source (CLI)
root> platform sync ptp-bc interfaces show config
Figure 446 1588 Boundary Clock – Current Configuration Sample Display (CLI)
| Interface location | Master Only | Local Priority | Admin | Destination Mac Address |
| Ethernet: Slot 1, Port 3 | yes | 128 | enable | 1:1b:19:0:0:0 |
| Ethernet: Slot 1, Port 4 | no | 128 | enable | 1:1b:19:0:0:0 |
| Ethernet: Slot 1, Port 5 | yes | 128 | disable | 1:1b:19:0:0:0 |
| Ethernet: Slot 1, Port 6 | yes | 128 | disable | 1:1b:19:0:0:0 |
| Radio: Slot 1, Port 1 | yes | 128 | enable | 1:1b:19:0:0:0 |
| Radio: Slot 1, Port 2 root> | yes | 128 | enable | 1:1b:19:0:0:0 |
Displaying and Setting the Boundary Clock Default Parameters (CLI)
The following commands set the Boundary Clock default parameters.
The Priority 2 value is one of the factors used by the BMCA to determine the grandmaster. The PTP 820 Boundary Clock node advertises this value when it is not locked on an external grandmaster. The default value is 128. The following command can be used to change the Boundary Clock node's Priority 2 value.
root> platform sync ptp-bc clock set priority2 <priority2>
The following command sets the Boundary Clock node's Domain Number. The default value is 24. The following command can be used to change the Boundary Clock node's Domain Number.
root> platform sync ptp-bc clock set domain-number <domain-number>
The Local Priority value is taken into account when two identical announce messages are received by at least two different ports. In such a case, the Boundary Clock mechanism selects the slave port based on the best (lowest) Local Priority. The default value is 128. The following command can be used to change the Boundary Clock node's default Local Priority.
root> platform sync ptp-bc clock set local-priority <local-priority>
You can select the maximum number of PTP clocks traversed from the grandmaster to the slave clock in the local PTP 820 Boundary Clock node. If the defined number is exceeded, packets from this grandmaster candidate are discarded and the grandmaster will not be eligible for use by the Boundary Clock node. The default value is 255. The following command can be used to change the Boundary Clock node's maximum number of PTP clocks traversed.
root> platform sync ptp-bc clock set max-steps-removed <max-steps-removed>
Table 300 Boundary Clock Default Settings – CLI Parameters
| Parameter | Input Type | Permitted Values |
| priority2 Number 0-255 | ||
| domain-number | Number | 24-43 |
| local-priority Number 1-255 | ||
| max-steps-removed | Number | 1-255 |
Use the following command to display the Boundary Clock node's default parameters.
root> platform sync ptp-bc clock show default
Figure 447 1588 Boundary Clock – Default Parameters Sample Display (CLI)
| Two Step Clock Identity Number Of Ports Clock Class Clock Accuracy Offset Scaled Log Variance Priority 1 Priority 2 Domain Number Slave Only Local Priority Max Step removed Reset Port Counters Clock Index | |||||||||||||
| yes root) | 000A25FFFE38094B | 4 | 187 | CLOCK ACCURACY_WORSE THAN_10s | 52592 | 128 | 128 | 24 | no | 128 | 255 | no | 1 |
Table 301 Boundary Clock Default Parameters
| Parameter Definition | |
| Two Step (read only) | Indicates whether the Boundary Clock node is operating in two-step mode. In PTP 820, this is always set to Yes. |
| Clock Identity (read only) Identifies the system clock. | |
| Number of Ports (read only) | Displays the number of ports on the unit on which Boundary Clock is enabled. The maximum is 4 per PTP 820 unit. |
| Clock Class (read only) | One of the elements of the clock quality, as defined in IEEE-1588. |
| Clock Accuracy (read only) | One of the elements of the clock quality, as defined in IEEE-1588. |
| Offset Scaled Log Variance (read only) | One of the elements of the clock quality, as defined in IEEE-1588. |
| Priority 1 (read only) Always displays 128. | |
| Priority 2 | One of the factors used by the BMCA to determine the grandmaster.The PTP 820's Boundary Clock node advertises this value when it is not locked on an external grandmaster. The default value is 128 (user-configurable). |
| Domain Number | The default value is 24 (user-configurable). |
| Slave Only (read only) | Indicates whether the Boundary Clock node is operating in slave mode only. In PTP 820, this is always set to no. |
| Max Step Removed | The maximum number of PTP clocks traversed from the grandmaster to the slave clock in the local PTP 820 Boundary Clock node. If the defined number is exceeded, packets from this grandmaster candidate are discarded and the grandmaster will not be eligible for use by the Boundary Clock node. The default value is 255 (user-configurable). |
| Reset Port Counters | In PTP 820, this is always set to no. |
| Clock Index | In PTP 820, this is always set to 1. |
Displaying the Boundary Clock Advanced Parameters (CLI)
Use the following command to display the Boundary Clock node's general advanced parameters.
root> platform sync ptp-bc clock show current
Figure 448 1588 Boundary Clock – Advanced (General) Parameters Sample Display (CLI)
| root> platform sync ptp-bc clock show current | |||
| 1588 BC Clock current DS table: | |||
| Steps Removed Offset From Mean Path Delay Clock Index Master | |||
| 0 0 s 0 ns 0 s 0 ns 1 root> |
Use the following command to display information about the current master and grandmaster being used by the Boundary Clock node.
root> platform sync ptp-bc clock show parent
Figure 449 1588 Boundary Clock – Parent Clock Parameters Sample Display (CLI)
| root> platform sync ptp-bo clock show parent 1588 BC Clock parent DS table: | ||||||||
| Master Clock Identity | Master Port Number | Grandmaster Identity | Grandmaster Clock Class | Grandmaster Clock Accuracy | Grandmaster Offset Scaled Log Variance | Grandmaster Priority 1 | Grandmaster Priority 2 | Clock Index |
| 000A25FFFE38094B root> | 0 | 000A2SFFFFE38094B | 187 | CLOCK_ACCURACY_WORSE_THAN_10s | 52592 | 128 | 128 | 1 |
Use the following command to display information about the Boundary Clock node's current time parameters.
root> platform sync ptp-bc clock show time
Figure 450 1588 Boundary Clock – Time Parameters Sample Display (CLI)
| root> platform sync ptp-bc clock show time | ||||||||
| 1588 BC Clock time DS table: | ||||||||
| Current UTC Offset (Seconds) | Current UTC Offset Valid | Leap 59 | Leap 61 | Time Traceable | Frequency Traceable | PTP Timescale | Time Source | Clock Index |
| 36 root> | no | no | no | no | no | yes | INTERNAL OSCILLATOR | 1 |
All of the advanced Boundary Clock parameters are read-only.
Table 302 Boundary Clock Advanced Parameters (CLI)
| Parameter Definition | |
| Steps Removed | The number of PTP clocks traversed from the grandmaster to the slave clock in the local PTP 820 Boundary Clock node. You can define a maximum number of steps in the Clock Default Parameters page. See Displaying and Setting the Boundary Clock Default Parameters (CLI). |
| Offset from Master (Nanoseconds) | The time difference between the master clock and the local slave clock (in ns). |
| Mean Path Delay (Nanoseconds) | The mean propagation time for the link between the master and the local slave (in ns). |
| Master Clock Identity | The clock identity of the current master clock. |
| Master Port Number | The clock identity of the current master port. |
| Grandmaster Identity | The clock identity of the current grandmaster. |
| Grandmaster Clock Class | The clock class of the current grandmaster. The clock class is one of the elements of the clock quality, as defined in IEEE-1588. |
| Grandmaster Clock Accuracy | The clock accuracy of the current grandmaster. The clock accuracy is one of the elements of the clock quality, as defined in IEEE-1588. |
| Grandmaster Offset Scaled Log Variance | The offset scaled log variance of the current grandmaster. The offset scaled log variance is one of the elements of the clock quality, as defined in IEEE-1588. |
| Grandmaster Priority 1 | The Priority 1 value of the current grandmaster. |
| Grandmaster Priority 2 | The Priority 2 value of the current grandmaster. |
| Current UTC Offset (Seconds) | The current UTC offset value (in seconds). |
| Current UTC Offset Valid | Indicates whether the current UTC offset value is valid. |
| Leap 59 | Indicates that the last minute of the current UTC day contains 59 seconds. |
| Leap 61 | Indicates that the last minute of the current UTC day contains 61 seconds. |
| Time Traceable Traceability to the primary time reference. | |
| Frequency Traceable | Traceability to the primary frequency reference. |
| PTP Timescale | Indicates whether the clock time scale of the grandmaster clock is PTP. |
| Time Source | The source of the time used by the grandmaster clock. |
Displaying the Boundary Clock Port Parameters (CLI)
Use the following command to display the Boundary Clock port parameters.
root> root> platform sync ptp-bc interfaces show status
Figure 451 1588 Boundary Clock Port Parameters (CLI)
| [root] platform sync ptp-hc interfaces show status1588 BC ports status table: | |||||||||
| Interface location | Clock Identity | Port Number | Port State | Log Min Delay Req Interval | Log Sync Interval | Log Announce Interval | Announce Receipt Timeout | Version Number | Delay Mechanism |
| Ethernet: Slot 1, Port 3 | 000A25FFFE401F93 | 1 | PORT_STATE_MASTER | -4 (16 pps) | -4 (16 pps) | -3 (8 pps) | 8 | 2 | 1 |
| Ethernet: Slot 1, Port 6 | 000A25FFFE401F93 | 2 | PORT_STATE_MASTER | -4 (16 pps) | -4 (16 pps) | -3 (8 pps) | 8 | 2 | 1 |
| Ethernet: Slot 1, Port 5 | 000000000000000 | 1 | PORT_STATE_INITIALIZING | 4294967293 | 2 | 1 | |||
| Ethernet: Slot 1, Port 6 | 000000000000000 | 1 | PORT_STATE_INITIALIZING | 4294967293 | 2 | 1 | |||
| Radio: Slot 1, Port 1 | 000A25FFFE401F93 | 4 | PORT_STATE_MASTER | -4 (16 pps) | -4 (16 pps) | -3 (8 pps) | 8 | 2 | 1 |
| Radio: Slot 1, Port 2 | 000A25FFFE401F93 | 3 | PORT_STATE_MASTER | -4 (16 pps) | -4 (16 pps) | -3 (8 pps) | 8 | 2 | 1 |
Table 303 Boundary Clock Port Parameters (CLI)
| Parameter Definition | |
| Clock Identity | The PTP 820 unit's clock identity. The same value is used for every port that belongs to the Boundary Clock node. |
| Port Number In this version, displays 1 for every port. | |
| Port State | Indicates whether the port is currently acting as Master (distributing PTP to other nodes) or Slave (receiving PTP from a grandmaster). |
| Log Min Delay Req Interval | The minimum allowed interval between Delay Request messages. |
| Log Sync Interval Interval between sync messages. | |
| Log Announce Interval | The interval between Announce messages. |
| Announce Receipt Timeout | The maximum allowed number of intervals without receiving any Announce messages. |
| Version Number Always displays 2. | |
| Delay Mechanism Always displays 1. | |
Displaying the Boundary Clock Port Statistics (CLI)
Use the following command to display the Boundary Clock statistics.
root> platform sync ptp-bc interfaces show statistics interface-type
Table 304 Boundary Clock Configuration CLI Parameters
| Parameter | Input Type | Permitted Values | Description |
| interface-type | Variable | ethernetradio | |
| slot Number | For 1RU chassis: 1-6For 2RU chassis: 1-12 | The slot in which the card resides. | |
| port Number | Any port on the selected slot. | ||
| clear-on-read Boolean | yesno | If yes is selected, the interface statistics are cleared after the command is executed. |
The following command displays statistics for Ethernet interface port 1 on an Ethernet LIC in slot 2, and clears the statistics after displaying them.
root> platform sync ptp-bc interfaces show statistics interface-type ethernet slot 2 port 1 clear-on-read yes
Figure 452 1588 Boundary Clock Statistics (CLI)

Table 305 Boundary Clock Port Statistics (CLI)
| Parameter Definition | |
| Announce Transmitted | The number of Announce messages that have been transmitted from the port. |
| Sync Transmitted | The number of Sync messages that have been transmitted from the port. |
| Follow-Up Transmitted | The number of Follow-Up messages that have been transmitted from the port. |
| Delay Response Transmitted | The number of Delay Response messages that have been transmitted from the port. |
| Delay Request Transmitted | The number of Delay Request messages that have been transmitted from the port. |
| Dropped Messages | The number of dropped messages. |
| Lost Messages The number of lost messages. | |
| Announce Received | The number of Announce messages that have been received by the port. |
| Sync Received | The number of Sync messages that have been received by the port. |
| Follow-Up Received | The number of Follow-Up messages that have been received by the port. |
| Delay Response Received | The number of Delay Response messages that have been received by the port. |
| Delay Request Received | The number of Delay Request messages that have been received by the port. |
Disabling Boundary Clock (CLI)
Use the following command to disable each Boundary Clock interface in the node. It is important to disable Boundary Clock on the interfaces before disabling 1588 PTP.
root> platform sync ptp-bc interfaces set interface-type <interface-type>
slot <slot> port <port> admin disable
After disabling the Boundary Clock interfaces, enter the following command in root view:
root> platform sync ptp set admin disable

Note
Disabling 1588 PTP disables both Transparent Clock and Boundary Clock, and can drastically affect time synchronization performance in the entire network.
Chapter 23: Access Management and Security (CLI)
This section includes:
- Configuring the General Access Control Parameters (CLI)
- Configuring the Password Security Parameters (CLI)
- Configuring Users (CLI)
- Configuring RADIUS (CLI)
- Configuring X.509 CSR Certificates and HTTPS (CLI)
• Uploading the Security Log (CLI) - Uploading the Configuration Log (CLI)
Related Topics:
- Changing Your Password
- Operating in FIPS Mode (CLI)
- Configuring AES-256 Payload Encryption (CLI)
Configuring the General Access Control Parameters (CLI)
To avoid unauthorized login to the system, the following parameters should be set:
- Inactivity Timeout
- Blocking access due to login failures
- Blocking unused accounts
This section includes:
- Configuring the Inactivity Timeout Period (CLI)
- Configuring Blocking Upon Login Failure (CLI)
- Configuring Blocking of Unused Accounts (CLI)
Configuring the Inactivity Timeout Period (CLI)
A system management session automatically times out after a defined period (in minutes) with no user activity. To configure the session timeout period, enter the following command in root view:
root> platform security protocols-control session inactivity-timeout set <inactivity-timeout>
To display the currently configured session timeout period, enter the following command in root view:
root> platform security protocols-control session inactivity-timeout show
Table 306 Inactivity Timeout Period CLI Parameters
| Parameter | Input Type | Permitted Values | Description |
| inactivity-timeout | Number 1 - 60 | The session inactivity timeout period (in minutes). |
The following command sets the session inactivity timeout period to 30 minutes:
root> platform security protocols-control session inactivity-timeout set 30
Configuring Blocking Upon Login Failure (CLI)
Upon a configurable number of failed login attempts, the system blocks the user from logging in for a configurable number of minutes.
To configure the number of failed login attempts that will temporarily block the user from logging into the system, enter the following command in root view:
root> platform security access-control block-failure-login attempt set <attempt>
To define the period (in minutes) for which a user is blocked after the configured number of failed login attempts, enter the following command in root view:
root> platform security access-control block-failure-login period set <period>
To display the current failed login attempt blocking parameters, enter the following command in root view:
root> platform security access-control block-failure-login show
Table 307 Blocking Upon Login Failure CLI Parameters
| Parameter | Input Type | Permitted Values | Description |
| attempt Number 1 - 10 | If a user attempts to login to the system with incorrect credentials this number of times consecutively, the user will temporarily be prevented from logging into the system for the time period defined by the platform security access-control block-failure-login period set command. | ||
| period | Number | 1 - 60 | The duration of time, in minutes, that a user is prevented from logging into the system after the defined number of failed login attempts. |
The following commands configure a blocking period of 45 minutes for users that perform 5 consecutive failed login attempts:
root> platform security access-control block-failure-login attempt set 5
root> platform security access-control block-failure-login period set 45
Configuring Blocking of Unused Accounts (CLI)
You can configure a number of days after which a user is prevented from logging into the system if the user has not logged in for the configured number of days. You can also manually block a specific user.
To configure the blocking of unused accounts period, enter the following command in root view:
root> platform security access-control block-unused-account period set <period>
Once the user is blocked, you can use the following command to unblock the user:
root> platform security access-control user-account block user-name <user-name> block no
To manually block a specific user, enter the following command in root view:
root> platform security access-control user-account block user-name <user-name> block yes
To display the currently configured blocking of unused account period, enter the following command in root view:
root> platform security access-control block-unused-account show
Table 308 Blocking Unused Accounts CLI Parameters
| Parameter | Input Type | Permitted Values | Description |
| period | Number | 0, 30 - 90 | The number of days after which a user is prevented from logging into the system if the user has not logged in for the configured number of days. If you enter 0, this feature is disabled. |
| user-name | Text String | Any valid user name. | The user account you want to block or unblock. See Configuring User Accounts (CLI). |
The following command configures the system to block any user that does not log into the system for 50 days:
root> platform security access-control block-unused-account period set 50
Configuring the Password Security Parameters (CLI)
You can configure enhanced security requirements for user passwords.
This section includes:
- Configuring Password Aging (CLI)
- Configuring Password Strength Enforcement (CLI)
• Forcing Password Change Upon First Login (CLI)
• Displaying the System Password Settings (CLI)
Configuring Password Aging (CLI)
Passwords remain valid from the first time the user logs into the system for the number of days (20-90) set by this command. If you set this parameter to 0, password aging is disabled, and passwords remain valid indefinitely.
To configure password aging, enter the following command in root view:
root> platform security access-control password aging set <password aging>
Table 309 Password Aging CLI Parameters
| Parameter | Input Type | Permitted Values | Description |
| password aging | Number | 0, 20 - 90 | The number of days that user passwords will remain valid from the first time the user logs into the system. |
The following command sets the password aging time to 60 days:
root> platform security access-control password aging set 60
Configuring Password Strength Enforcement (CLI)
To set password strength enforcement, enter the following command in root view:
root> platform security access-control password enforce-strength set <enforce-strength>
Table 310 Password Strength Enforcement CLI Parameters
| Parameter | Input Type | Permitted Values | Description |
| enforce-strength | Boolean Yes | no | When yes is selected:Password length must be at least eight characters.Password must include characters of at least three of the following character types: lower case letters, upper case letters, digits, and special characters. For purposes of meeting this requirement, upper case letters at the beginning of the password and digits at the end of the password are not counted.A password cannot be repeated within five changes in password. |
The following command enables password strength enforcement:
root> platform security access-control password enforce-strength set yes
Forcing Password Change Upon First Login (CLI)
To determine whether the system requires users to change their password the first time they log into the system, enter the following command in root view.
root> platform security access-control password first-login set
To require users to change their password the first time they log in, enter the following command in root view:
root> platform security access-control password first-login set yes
Table 311 Force Password Change on First Time Login CLI Parameters
| Parameter | Input Type | Permitted Values | Description |
| first-login | Boolean Yes | no | When yes is selected, the system requires users to change their password the first time they log in. |
Displaying the System Password Settings (CLI)
Use the following command to display the system password settings:
root> platform security access-control password show-all
Configuring Users (CLI)
User configuration is based on the Role-Based Access Control (RBAC) model. According to the RBAC model, permissions to perform certain operations are assigned to specific roles. Users are assigned to particular roles, and through those role assignments acquire the permissions to perform particular system functions.
In the PTP 820G and PTP 820F GUI, these roles are called user profiles. Up to 50 user profiles can be configured. Each profile contains a set of privilege levels per functionality group, and defines the management protocols that can be used to access the system by users to whom the user profile is assigned
This section includes:
• User Configuration Overview (CLI)
- Configuring User Profiles (CLI)
- Configuring User Accounts (CLI)
Related topics:
- Logging On (CLI)
User Configuration Overview (CLI)
User configuration is based on the Role-Based Access Control (RBAC) model. According to the RBAC model, permissions to perform certain operations are assigned to specific roles. Users are assigned to particular roles, and through those role assignments acquire the permissions to perform particular system functions.
In the PTP 820 GUI, these roles are called user profiles. Up to 50 user profiles can be configured. Each profile contains a set of privilege levels per functionality group, and defines the management protocols (access channels) that can be used to access the system by users to whom the user profile is assigned.
The system parameters are divided into the following functional groups:
- Security
- Management
- Radio
• TDM - Ethernet
- Synchronization
A user profile defines the permitted access level per functionality group. For each functionality group, the access level is defined separately for read and write operations. The following access levels can be assigned:
- None – No access to this functional group.
- Normal – The user has access to parameters that require basic knowledge about the functional group.
- Advanced – The user has access to parameters that require advanced knowledge about the functional group, as well as parameters that have a significant impact on the system as a whole, such as restoring the configuration to factory default settings.
Configuring User Profiles (CLI)
User profiles enable you to define system access levels. Each user must be assigned a user profile. Each user profile contains a detailed set of read and write permission levels per functionality group.
To create a new user profile with default settings, enter the following command:
root> platform security access-control profile add name <profile-name>
To edit the settings of a user profile, enter the following command:
root> platform security access-control profile edit group name <profile-name> group <group> write-lvl <write-lvl> read-lvl <read-lvl>
Table 312 User Profile CLI Parameters
| Parameter | Input Type | Permitted Values | Description |
| profile--name | Text String | Up to 49 characters | The name of the user profile. |
| group Variable security | managementradioethernetsync | The functionality group for which you are defining access levels. | |
| write-lvl | Variable | nonenormaladvanced | The read level for the functionality group. |
| read-lvl | Variable | nonenormaladvanced | The read level for the functionality group. |
The following commands create a user profile called “operator” and give users to whom this profile is assigned normal write privileges for all system functionality and advanced read privileges for all functionality except security features.
root> platform security access-control profile add name operator
root> platform security access-control profile edit group name operator
group security write-lvl normal read-lvl normal group management write-
lvl normal read-lvl advanced group radio write-lvl normal read-
lvl advanced group ethernet write-lvl normal read-lvl advanced group sync
write-lvl normal read-lvl advanced
Limiting Access Protocols for a User Profile (CLI)
The user profile can limit the access channels that users with the user profile can use to access the system. By default, a user profile includes all access channels.
Use the following command to limit the protocols users with this user profile can use to access the system.
root> platform security access-control profile edit mng-channel name
Table 313 User Profile Access Protocols CLI Parameters
| Parameter | Input Type | Permitted Values | Description |
| profile--name | Text String | Up to 49 characters | The name of the user profile. |
| channel-type | Variable | Serial | The access channel type allowed or disallowed by the command for users with this user profile. |
| Web | |||
| NMS | |||
| Telnet | |||
| SSH | |||
| allowed Boolean yes | no | yes – Users with this user profile can access the access channel type defined in the preceding parameter.no - Users with this user profile cannot access the access channel type defined in the preceding parameter. | |
For example, the following command prevents users with the user profile "operator" from accessing the system via NMS:
root> platform security access-control profile edit mng-channel name operator channel-type NMS allowed no
Configuring User Accounts (CLI)
Use the following command to create a new user account:
root> platform security access-control user-account add user-name
Table 314 User Accounts CLI Parameters
| Parameter | Input Type | Permitted Values | Description |
| user-name | Text String | Up to 32 characters | The name of the user profile. |
| profile name | Text String | Up to 49 characters | The name of the User Profile you want to assign to the user. The User Profile defines the user's access permissions per functionality group. |
| expired-date Date | Use the format: YYYY-MM-DD | Optional. The date on which the user account will expire. On this date, the user automatically becomes inactive. | |
The following command creates a user account named Tom_Jones, with user profile "operator". This user's account expires on February 1, 2014.
root> platform security access-control user-account add user-name Tom_Jones profile-name operator expired-date 2014-02-01
When you create a new user account, the system will prompt you to enter a default password. If Enforce Password Strength is activated (refer to Configuring Password Strength Enforcement (CLI)), the password must meet the following criteria:
- Password length must be at least eight characters.
- Password must include characters of at least three of the following character types: lower case letters, upper case letters, digits, and special characters. For purposes of meeting this requirement, upper case letters at the beginning of the password and digits at the end of the password are not counted.
• The last five passwords you used cannot be reused.
See Configuring the Password Security Parameters (CLI).
Configuring RADIUS (CLI)
This section includes:
• RADIUS Overview (CLI)
• Activating RADIUS Authentication (CLI)
- Configuring the RADIUS Server Attributes (CLI)
• Viewing RADIUS Access Control and Server Attributes (CLI)
• Viewing RADIUS User Permissions and Connectivity (CLI)
RADIUS Overview (CLI)
The RADIUS protocol provides centralized user management services. PTP 820G and PTP 820F support RADIUS server and provides a RADIUS client for authentication and authorization.
When RADIUS is enabled, a user attempting to log into the system from any access channel (CLI, WEB, NMS) is not authenticated locally. Instead, the user's credentials are sent to a centralized standard RADIUS server which indicates to the PTP 820G or PTP 820F whether the user is known, and which privilege is to be given to the user.
You can define up to two Radius servers. If you define two, one serves as the primary server and the other as the secondary server.
Activating RADIUS Authentication (CLI)
To enable or disable Radius access control, enter the following command:
root> platform security radius-admin set <admin>
Table 315 Activate RADIUS CLI Parameters
| Parameter | Input Type | Permitted Values | Description |
| admin Variable enable | disable | Enables or disables Radius access control. | |
Configuring the RADIUS Server Attributes (CLI)
To configure Radius server attributes, enter the following command:
root> platform security radius-server-communication-ipv4 set server-id <server-id> ip-address <ip-address> port <radius-port> retries <retries> timeout <timeout> secret <shared-secret>
Table 316 RADIUS Server CLI Parameters
| Parameter | Input Type | Permitted Values | Description |
| server-id Number | 1 | 1 – The primary RADIUS server | |
| 2 | 2 – The secondary RADIUS server. | ||
| ip-address | Dotted decimal format | Any valid IP address | The IP address of the RADIUS server. |
| radius-port | Number | 0-65535 | The port ID of the RADIUS server. |
| retries Number | 3-30 | The number of times the device will try to communicate with the RADIUS server before declaring the server to be unreachable. | |
| timeout Number | 1-10 | The timeout (in seconds) that the agent will wait in each communication with the selected RADIUS server before retrying if no response is received. | |
The following command configures Radius server attributes for the primary Radius server:
root> platform security radius-server-communication-ipv4 set server-id 1 ip-address 192.168.1.99 port 1812 retries 5 timeout 10 secret U8glp3KJ6FKGksdgase4IQ9FMm
Viewing RADIUS Access Control and Server Attributes (CLI)
To display the Radius access control status, enter the following command:
root> platform security radius-admin show
To display Radius server attributes, enter the following command:
root> platform security radius-server-communication show
Viewing RADIUS User Permissions and Connectivity (CLI)
You can view Radius user connectivity and permissions information for all Radius users currently connected. To do so, enter the following command:
root> platform security radius-server-privileges show
The following user information is displayed, for each currently connected Radius user:
• User ID - The user name
- Access Channels - The permitted access channels.
- User Instances - The number of currently open sessions.
- Security Func Group Read level – The Read access level in the Security functional group: None, Regular or Advanced.
- Security Func Group Write level – The Write access level in the Security functional group: None, Regular or Advanced.
- Management Func Group Read level – The Read access level in the Management functional group: None, Regular or Advanced.
- Management Func Group Write level – The Write access level in the Management functional group: None, Regular or Advanced.
- Radio Func Group Read level – The Read access level in the Radio functional group: None, Regular or Advanced.
- Radio Func Group Write level – The Write access level in the Radio functional group: None, Regular or Advanced.
- TDM Func Group Read level – The Read access level in the TDM functional group: None, Regular or Advanced.
- TDM Func Group Write level – The Write access level in the TDM functional group: None, Regular or Advanced.
- Eth Func Group Read level – The Read access level in the Eth functional group: None, Regular or Advanced.
- Eth Func Group Write level – The Write access level in the Eth functional group: None, Regular or Advanced.
- Sync Func Group Read level – The Read access level in the Sync functional group: None, Regular or Advanced.
- Sync Func Group Write level – The Write access level in the Sync functional group: None, Regular or Advanced.
Configuring X.509 CSR Certificates and HTTPS (CLI)
The web interface protocol for accessing PTP 820G and PTP 820F can be configured to HTTP (default) or HTTPS. It cannot be set to both at the same time.
Before setting the protocol to HTTPS, you must:
1 Create and upload a CSR file. See Generating a Certificate Signing Request (CSR) File (CLI).
2 Download the certificate to the PTP 820G or PTP 820F and install the certificate. See Downloading a Certificate (CLI).
3 Enable HTTPS. See Enabling HTTPS (CLI).
When uploading a CSR and downloading a certificate, the PTP 820G or PTP 820F functions as an SFTP client. You must install SFTP server software on the PC or laptop you are using to perform the upload or download. For details, see Configuring the Internal Ports for FTP or SFTP (CLI).

Note
For these operations, SFTP must be used.
This section includes:
- Generating a Certificate Signing Request (CSR) File (CLI)
• Downloading a Certificate (CLI)
• Enabling HTTPS (CLI)
Generating a Certificate Signing Request (CSR) File (CLI)
To set the CSR parameters, enter the following command in root view:
root> platform security csr-set-parameters common-name <common-name>
country <country> state <state> locality <locality> organization
<organization> org-unit <org-unit> email <email> file-format <file-format>
To display the currently-configured CSR parameters, enter the following command in root view:
root> platform security csr-show-parameters
If the IP address family is configured to be IPv4, enter the following command in root view to configure the SFTP server parameters for the CSR file upload:
root> platform security csr-set-server-parameters server-ipv4 <server-ipv4> server-path <server-path> filename <filename> server-username <username> server-password <password>
If the IP address family is configured to be IPv6, enter the following command in root view to configure the SFTP server parameters for the CSR file upload:
root> platform security csr-set-server-parameters server-ipv6 <server-ipv6> server-path <server-path> filename <filename> server-username <username> server-password <password>
To display the currently-configured SFTP parameters for CSR upload, enter the following command in root view:
root> platform security csr-show-server-parameters
To generate and upload a CSR, enter the following command in root view:
root> platform security csr-generate-and-upload
To display the status of a pending CSR generation and upload operation, enter the following command in root view:
root> platform security csr-generate-and-upload-show-status
Table 317 CSR Generation and Upload CLI Parameters
| Parameter | Input Type | Permitted Values | Description |
| common name | String | The fully-qualified domain name for your web server. You must enter the exact domain name. | |
| country String | The two-letter ISO abbreviation for your country (e.g., US) | ||
| state String | The state, province, or region in which the organization is located. Do not abbreviate. | ||
| locality String | The city in which the organization is legally located. | ||
| organization String | The exact legal name of your organization. Do not abbreviate. | ||
| org-unit String | The division of the organization that handles the certificate. | ||
| email String | An e-mail address that can be used to contact your organization. | ||
| file-format Variable | PEM DER | The file format of the CSR. In this version, only PEM is supported. | |
| server-ipv4 | Dotted decimal format. | Any valid IPv4 IP address. | The IP address of the FTP server. |
| server-ipv6 | Eight groups of four hexadecimal digits separated by colons. | Any valid IPv6 address. | The IPv6 address of the PC or laptop you are using as the SFTP server. |
| server-path | Text String | The directory path to which you are uploading the CSR. Enter the path relative to the SFTP user's home directory, not the absolute path. To leave the path blank, enter //. | |
| filename | Text String | The name you want to give the CSR. | |
| username | Text String | The user name for the SFTP session. | |
| password | Text String | The password for the SFTP session. To configure the SFTP settings without a password, simply omit this parameter. |
Downloading a Certificate (CLI)
If the IP address family is configured to be IPv4, enter the following command in root view to configure the SFTP server parameters for downloading a certificate:
root> platform security certificate-set-download-parameters server-ipv4 <server-ipv4> server-path <server-path> filename <filename> server-username <username> server-password <password>
If the IP address family is configured to be IPv6, enter the following command in root view to configure the SFTP server parameters for downloading a certificate:
root> platform security certificate-set-download-parameters server-ipv6 <server-ipv6> server-path <server-path> filename <filename> server-username <username> server-password <password>
To display the currently-configured SFTP parameters for downloading a certificate, enter the following command in root view:
root> platform security certificate-show-download-parameters
To download a certificate, enter the following command in root view:
root> platform security certificate-download
To display the status of a pending certificate download, enter the following command in root view:
root> platform security certificate-download-show-status
To install a certificate, enter the following command in root view:
root> platform security certificate-install
Table 318 Certificate Download and Install CLI Parameters
| Parameter | Input Type | Permitted Values | Description |
| server-ipv4 | Dotted decimal format. | Any valid IPv4 IP address. | The IPv4 address of the PC or laptop you are using as the SFTP server. |
| server-ipv6 | Eight groups of four hexadecimal digits separated by colons. | Any valid IPv6 address. | The IPv6 address of the PC or laptop you are using as the SFTP server. |
| server-path Text String | The directory path from which you are downloading the CSR. Enter the path relative to the SFTP user's home directory, not the absolute path. To leave the path blank, enter // . | ||
| filename Text String | The certificate's file name in the SFTP server. | ||
| username Text String | The user name for the SFTP session. | ||
| password Text String | The password for the SFTP session. To configure the SFTP settings without a password, simply omit this parameter. | ||
Enabling HTTPS (CLI)
By default, HTTP is used by PTP 820G and PTP 820F as its web interface protocol.
To change the protocol to HTTPS, enter the following command in root view:
root> platform security url-protocol-set url-protocol https

Note
Make sure you have installed a valid certificate in the PTP 820G or PTP 820F before changing the web interface protocol to HTTPS. Failure to do this may prevent users from accessing the Web EMS.
To change the protocol back to HTTP, enter the following command in root view:
root> platform security url-protocol-set url-protocol http
To display which protocol is currently enabled, enter the following command in root view:
root> platform security url-protocol-show
Configuring HTTPS Cipher Hardening (CLI)
You can configure the PTP 820 to operate in HTTPS strong mode. In HTTPS strong mode, SSLv3, TLSv1.0, and TLSv1.1 are disabled completely and only certain ciphers are supported in TLSv1.2.
For a list of supported HTTPS ciphers, including an indication of which ciphers are supported in HTTPS strong mode,
To set HTTPS strong mode, enter the following command:
root> platform security https-ciphers-hardening-level-set level strong
To set HTTPS normal mode, enter the following command:
root> platform security https-ciphers-hardening-level-set level normal
Note: The default HTTP cipher mode is normal.
To display the current HTTPS cipher mode, enter the following command:
root> platform security https-ciphers-hardening-level-show
Blocking Telnet Access (CLI)
You can block telnet access to the unit. By default, telnet access is not blocked.
To block telnet access, enter the following command:
root> platform security protocols-control telnet admin set disable
To unblock telnet access, enter the following command:
root> platform security protocols-control telnet admin set enable
To display whether telnet is currently allowed (enable) or blocked (disable), enter the following command:
root> platform security protocols-control telnet show
Note: When you block telnet, any current telnet sessions are immediately disconnected.
Uploading the Security Log (CLI)
The configuration log lists actions performed by users to configure the system. This file is mostly used for security, to identify suspicious user actions. It can also be used for troubleshooting.
In order to read the security log, you must upload the log to an FTP or SFTP server. PTP 820G and PTP 820F works with any standard FTP or SFTP server. For details, see Configuring the Internal Ports for FTP or SFTP.
To set the FTP parameters for security log upload, enter the following command in root view:
root> platform security file-transfer set server-path <server-path> file-name <file-name> ip-address <ip-address> protocol <protocol> username <username> password <password>
To display the FTP channel parameters for uploading the security log, enter the following command in root view:
root> platform security file-transfer show configuration
To upload the security log to your FTP server, enter the following command in root view:
root> platform security file-transfer operation set upload-security-log
To display the progress of a current security log upload operation, enter the following command in root view:
root> platform security file-transfer show operation
To display the result of the most recent current security log upload operation, enter the following command in root view:
root> platform security file-transfer show status
Table 319 Security Log CLI Parameters
| Parameter | Input Type | Permitted Values | Description |
| server-path Text String | The directory path to which you are uploading the security log. Enter the path relative to the FTP user's home directory, not the absolute path. To leave the path blank, enter //. | ||
| file-name | Text String | The name you want to give the file you are uploading. | |
| ip-address | Dotted decimal format. | Any valid IP address. | The IP address of the FTP server. |
| protocol Variable ftp | sftp | ||
| username Text String | The user name for the FTP or SFTP session. | ||
| password | Text String | The password for the FTP or SFTP session. To configure the FTP settings without a password, simply omit this parameter. | |
The following commands configure an FTP channel for security log upload to IP address 192.168.1.80, in the directory "current", with file name "security_log_Oct8.zip", user name "anonymous", and password "12345", and initiate the upload:
root> platform security file-transfer set server-path \current file-name security_log_Oct8.zip ip-address 192.168.1.80 protocol ftp username anonymous password 12345
root> platform security file-transfer operation set upload-security-log
Uploading the Configuration Log (CLI)
The configuration log lists actions performed by users to configure the system. This file is mostly used for security, to identify suspicious user actions. It can also be used for troubleshooting.
In order to upload the configuration log, you must install an FTP or SFTP server on the laptop or PC from which you are performing the upload. PTP 820G works with any standard FTP or SFTP server. For details, see Configuring the Internal Ports for FTP or SFTP.
To set the FTP or SFTP parameters for configuration log export, enter the following command in root view:
root> platform security configuration-log-upload-params set path <path>
file-name <file-name> ip-address <ip-address> protocol <protocol>
username <username> password <password>
To display the FTP or SFTP parameters for configuration log export, enter the following command in root view:
root> platform security configuration-log-upload-params show
To export the configuration log, enter the following command in root view:
root> platform security configuration-log upload
To display the status of a configuration log export operation, enter the following command in root view
root> platform security configuration-log-upload-status show
Table 320 Configuration Log CLI Parameters
| Parameter | Input Type | Permitted Values | Description |
| path Text String | The directory path to which you are exporting the configuration log. Enter the path relative to the FTP user's home directory, not the absolute path. If the location is the home directory, it should be left empty. If the location is a sub-folder under the home directory, specify the folder name. If the shared folder is "C:\\", this parameter can be left empty or populated with "/". | ||
| file-name | Text String | The name you want to give the file you are exporting.Note: You must add the suffix .zip to the file name. Otherwise, the file import may fail. You can export the file using any name, then add the suffix .zip manually. For example: UnitInfo.zipIf the Unit Information file is exported several times consecutively, the file itself will not be replaced. Instead, the filename will be updated by time stamp. For example: UnitInfo.zip.11-05-14 03-31-04 | |
| ip-address | Dotted decimal format. | Any valid IP address. | The IP address of the PC or laptop you are using as the FTP or SFTP server. |
| protocol Variable ftp | sftp | The file transfer protocol. | |
| username | Text String | The user name for the FTP or SFTP session. | |
| password Text String | The password for the FTP or SFTP session. To configure the FTP or SFTP settings without a password, simply omit this parameter. | ||

Note
The path and fie name, together, cannot be more than:
If the IP address family is configured to be IPv4: 236 characters
If the IP address family is configured to be IPv6: 220 characters
The following commands configure an FTP channel for configuration log export to IP address 192.168.1.99, in the directory "current", with file name "cfg_log", user name "anonymous", and password "12345."
root> platform security configuration-log-upload-params set path \file-name cfg_log ip-address 192.168.1.99 protocol ftp username anonymous password 12345
root> platform unit-info channel set protocol frp
The following command exports the configuration log to the external server location:
root> platform security configuration-log upload
Chapter 24: Alarm Management and Troubleshooting (CLI)
This section includes:
• Viewing Current Alarms (CLI)
• Viewing the Event Log (CLI)
• Editing Alarm Text and Severity (CLI)
- Configuring a Timeout for Trap Generation (CLI)
- Uploading Unit Info (CLI)
• Performing Diagnostics (CLI)
• Working in CW Mode (Single or Dual Tone) (CLI)
Related Topics:
• Ethernet Pin-Outs and LEDs
- Uploading the Configuration Log (CLI)

Note
External alarms can only be configured via the Web EMS. See Configuring External Alarms.
Viewing Current Alarms (CLI)
To display all alarms currently raised on the unit, enter the following command in root view:
root> platform status current-alarm show module unit
To display the most severe alarm currently raised in the unit, enter the following command in root view:
root> platform status current-alarm show most-severe-alarm module unit
For example:
root> platform status current-alarm show most-severe-alarm module slot all
Most Severe Alarm Table:
Slot Severity
1 critical
64 cleared
68 cleared
root>
Modules are identified as follows:
• 1 – Fixed Interfaces
64-LAG
• 66 – Multi-Carrier ABC
67 - XPIC
• 68 – HSB Radio Protection
To display the most severe alarm currently raised in the unit, enter the following command in root view:
root> platform status current-alarm show most-severe-alarm module unit
Viewing the Event Log (CLI)
The Event Log displays a list of current and historical events and information about each event.
To display the event log, enter the following command in root view:
root> platform status event-log show module unit
To clear the event log, enter the following command in root view:
root> platform status event-log clear module unit
Editing Alarm Text and Severity (CLI)
You can view a list of alarm types, edit the severity level assigned to individual alarm types, and add additional descriptive text to individual alarm types.
This section includes:
• Displaying Alarm Information (CLI)
• Editing an Alarm Type (CLI)
• Setting Alarms to their Default Values (CLI)
Displaying Alarm Information (CLI)
To display a list of all alarm types and their severity levels and descriptions, enter the following command in root view:
root> platform status alarm-management show alarm-id all
Editing an Alarm Type (CLI)
To edit an alarm type's severity level, enter the following command in root view:
root> platform status alarm-management set alarm-id <alarm-id> severity-level <severity-level>
To add descriptive information to an alarm type, enter the following command in root view:
root> platform status alarm-management set alarm-id <alarm-id>
additional-text <additional-text>
To re-assign the Alarm group to which the alarm belongs, enter the following command in root view:
root> platform status alarm-management set alarm-id <alarm-id> alarm-group <alarm-group>

Note
The Alarm group is used to determine which alarms trigger an external alarm output. For details, see Configuring the Output Alarm.
To display all alarms currently assigned to a specific Alarm group, enter the following command in root view:
root> platform status alarm-management show all alarm-group <alarm-group>
Table 321 Editing Alarm Text and Severity CLI Parameters
| Parameter | Input Type | Permitted Values | Description |
| alarm-id Number | All valid alarm type IDs, depending on system configuration | Enter the unique Alarm ID that identifies the alarm type. | |
| severity-level | Variable | indeterminate critical major minor warning | The severity of the alarm, as displayed to users. |
| additional-text | Text String | 255 characters | An additional text description of the alarm type. |
The following command changes the severity level of alarm type 401 (Ethernet Loss of Carrier) to minor:
root> platform status alarm-management set alarm-id 401 severity-level minor
The following command assigns alarm type 101 (LA Goperational state is down) to the user-defined Alarm group:
Root > platform status alarm-management set alarm-id 101alarm-group user-defined
Setting Alarms to their Default Values (CLI)
To restore an alarm type's severity level and description to their default values, enter the following command in root view:
root> platform status alarm-management set alarm-id <alarm-id> restore default
To restore the severity levels and descriptions of all alarm types to their default values, enter the following command in root view:
root> platform status alarm-management set all default
Table 322 Restoring Alarms to Default CLI Parameters
| Parameter | Input Type | Permitted Values | Description |
| alarm-id Number | All valid alarm type IDs, depending on system configuration | Enter the unique Alarm ID that identifies the alarm type. | |
The following command restores alarm type 401 (Ethernet Loss of Carrier) to its default severity level:
root> platform status alarm-management set alarm-id 401 restore default
Configuring a Timeout for Trap Generation (CLI)
You can configure a wait time of up to 120 seconds after an alarm is cleared in the system before the alarm is actually reported as being cleared. This prevents traps flooding the NMS in the event that some external condition causes the alarm to be raised and cleared continuously.
This means that when the alarm is cleared, the alarm continues to be displayed and no clear alarm trap is sent until the timeout period is finished. The timeout for trap generation can be configured via CLI. By default, the timeout is 10 seconds. If the timeout is set to 0, there is no timeout.

Note
If the unit is upgraded from an earlier version to System release 10.0 or higher, the timeout retains its previous value until it is changed. That means if it was never configured, it retains its previous default value of 0. If the unit is set to its factory default configuration, the timeout is set to 10 seconds.
To configure the timeout (in seconds) for trap generation, enter the following command in root view:
root> platform status alarm-management alarm-stabilization-set time <0-120>
To disable the timeout for trap generation, enter the following command in root view:
root> platform status alarm-management alarm-stabilization-set time 0
To display the current trap generation timeout, enter the following command in root view:
root> platform status alarm-management alarm-stabilization-show
The following command sets a trap generation timeout of 60 seconds:
root> platform status alarm-management alarm-stabilization-set time 60
Disabling Alarms and Events (CLI)
You can choose to disable selected alarms and events. Any alarm or event can be disabled, so that no indication of the alarm is displayed, and no traps are sent for the alarm.
If you disable an alarm that is currently raised, the alarm is treated as if it has been cleared. If an alarm that has been disabled is enabled while it is in a raised state, the alarm is treated as if it has just been raised when it is enabled.
If a timeout for trap generation is configured, and a disabled alarm is enabled while the alarm is raised, the timeout count begins to run when the alarm is enabled. If an alarm is disabled while raised, the timeout count begins to run upon disabling the alarm, and an alarm cleared trap is sent when the timeout expires.
To disable an alarm or event, enter the following command in root view:
root> platform status alarm-management set alarm-id <alarm ID> admin disable
To enable an alarm or event, enter the following command in root view:
root> platform status alarm-management set alarm-id <alarm ID> admin enable
To display a list of all disabled alarms and events, and their attributes, enter the following command in root view:
root> platform status alarm-management show all admin disable attributes
To display a list of all enabled alarms and events and their attributes, enter the following command in root view:
root> platform status alarm-management show all admin enable attributes
To enable all alarms and events, enter the following command in root view:
root> platform status alarm-management set all admin default
The alarm status commands platform status alarm-management show alarm-id all and platform status alarm-management show alarm-id
Configuring Voltage Alarm Thresholds and Displaying Voltage Threshold PMs (CLI)
You can configure undervoltage and overvoltage alarm thresholds. The default thresholds for FibeAir PTP 820F, PTP 820G are:
Undervoltage Raise Threshold: 40V
• Undervoltage Clear Threshold: 42V
• Overvoltage Raise Threshold: 60V
• Overvoltage Clear Threshold: 58V
These thresholds determine when the following alarms are raised and cleared:
• Alarm #32000: Under voltage
• Alarm #32001: Over voltage
To display the current thresholds, enter the following command in root view.
root> platform management voltage thresholds show
To change the threshold for raising an undervoltage alarm, enter the following command in root view:
root> platform management undervoltage set raise-threshold <0-100>
To change the threshold for clearing an undervoltage alarm, enter the following command in root view:
root> platform management undervoltage set clear-threshold <0-100>
To change the threshold for raising an overvoltage alarm, enter the following command in root view:
root> platform management overvoltage set raise-threshold <0-100>
To change the threshold for clearing an overvoltage alarm, enter the following command in root view:
root> platform management overvoltage set clear-threshold <0-100>
You can display voltage PMs that indicate, per 15-minute and 24-hour periods:
The number of seconds the unit was in an undervoltage state during the measured period.
The number of seconds the unit was in an overvoltage state during the measured period.
The lowest voltage during the measured period.
The highest voltage during the measured period.
For PTP 820F, PTP 820G devices with two power inputs, the PMs are displayed for both inputs.
To display voltage PMs, enter the following command in root view:
root> platform management voltage pm show pm-interval-type <all|15min|24hr>
The IDF column indicates whether the PM is valid:
0 indicates a valid entry.
- 1 indicates an invalid entry. This can be caused by a power surge or power failure that occurred during the interval.
Uploading Unit Info (CLI)
You can generate a unit information file, which includes technical data about the unit. This file can be forwarded to customer support, at their request, to help in analyzing issues that may occur.

Note
For troubleshooting, it is important that an updated configuration file be included in User Info files that are sent to customer support. To ensure that an up-to-date configuration file is included, it is recommended to back up the unit's configuration before generating the Unit Info file.
In order to export a unit information file, you must install an FTP or SFTP server on the laptop or PC from which you are performing the upload. PTP 820G and PTP 820F works with any standard FTP or SFTP server. For details, see Configuring the Internal Ports for FTP or SFTP.

Note
You can also use HTTP or HTTPS to upload the Unit Information file. HTTP or HTTPS upload must be performed via the Web EMS. See Uploading Unit Info.
To set the FTP or SFTP parameters for unit information file export, enter one of the following commands in root view. If the IP protocol selected in platform management ip set ip-address-family is IPv4, enter the destination IPv4 address. If the selected IP protocol is IPv6, enter the destination IPv6 address.
root> platform unit-info channel server set ip-address <server-ipv4>
directory <directory> filename <filename> username <username> password
<password>

root> platform unit-info channel server-ipv6 set ip-address <server-ipv6>
directory <directory> filename <filename> username <username> password
<password>
To set the protocol for unit information file export, enter the following command in root view.
root> platform unit-info channel set protocol <protocol>
To display the FTP or SFTP parameters for unit information file export, enter one of the following commands in root view:
root> platform unit-info-file channel show
root> platform unit-info-file channel-ipv6 show
To create a unit information file based on the current state of the system, enter the following command in root view:
root> platform unit-info-file create
To export the unit information file you just created, enter the following command in root view:
root> platform unit-info-file export
To display the status of a unit information file export operation, enter the following command in root view
root> platform unit-info-file status show
Table 323 Uploading Unit Info CLI Parameters
| Parameter | Input Type | Permitted Values | Description |
| server-ipv4 | Dotted decimal format. | Any valid IPv4 address. | The IPv4 address of the PC or laptop you are using as the FTP or SFTP server. |
| server-ipv6 | Eight groups of four hexadecimal digits separated by colons. | Any valid IPv6 address. | The IPv6 address of the PC or laptop you are using as the FTP or SFTP server. |
| directory Text String | The directory path to which you are exporting the unit information file. Enter the path relative to the FTP or SFTP user's home directory, not the absolute path. To leave the path blank, enter // . | ||
| filename Text String | The name you want to give the file you are exporting.Note: You must add the suffix .zip to the file name. Otherwise, the file import may fail. You can export the file using any name, then add the suffix .zip manually. | ||
| username Text String | The user name for the FTP or SFTP session. | ||
| password Text String | The password for the FTP or SFTP session. To configure the FTP or SFTP settings without a password, simply omit this parameter. | ||
| protocol Variable ftp | sftp | The file transfer protocol. | |
The following commands configure an FTP or SFTP channel for configuration log export to IP address 192.168.1.99, in the directory "current", with file name "cfg_log", user name "anonymous", and password "12345."
root> platform security configuration-log-upload-params set path \\ file-name cfg_log ip-address 192.168.1.99 protocol ftp username anonymous password 12345
root> platform unit-info channel set protocol ftp
The following commands create a unit information file and export the file to the external server location:
root> platform unit-info-file create
root> platform unit-info-file export
Activating the Radio Logger (CLI)
The Radio Logger is available for PTP 820F. By default, the Radio Logger is inactive. When it is activated, it gathers technical data about the radio and its operation. It should only be activated by technical support personnel, or by the customer upon request of Cambium Customer Support team. Data gathered by the Radio Logger is added to the Unit Info file, which can be exported from the unit and sent to Customer Support upon their request. See Uploading Unit Info (CLI).
Note: In order to conserve CPU resources, do not activate the Radio Logger unless it is necessary for unit diagnostic purposes, and do not leave it active longer than necessary.
To activate the Radio Logger, enter the following command in root view:
root> logger start logger-type radio logger-duration <1-1440> slot1 1 port1 <1-2> slot2 1 port2 <1-2> slot3 1 port3 <1-2> slot4 1 port4 <1-2>
The logger-duration parameter is set in minutes. You can activate the logger on up to four radios in a single command. For example, the following command activates the logger for 40 minutes on carrier one of the RFUs connected to RFU1 and RFU2:
root> logger start logger-type radio logger-duration 40 slot1 1 port1 1 slot2 1 port2 3
For RFU-D and RFU-D-HP, you can activate the logger on one or both radio carriers. For example, the following command activates the logger for 60 minutes on both carriers on both of the RFUs connected to RFU1 and RFU2:
root> logger start logger-type radio logger-duration 40 slot1 1 port1 1 slot2 1 port2 2 slot3 1 port1 3 slot4 1 port2 4
To display whether the Radio Logger is currently active, enter the following command in root view:
root> logger get status logger-type radio
For example, the following display indicates the Radio Logger has been set for 20 minutes on both carriers of an RFU-D or RFU-D-HP connected to RFU1, and that the Logger is set to run for an additional 1191 seconds:
root> logger get status logger-type radio
Logger status:
Logger duration(in minutes): 20
Logger time left(in seconds): 1191
Active instances list:
Slot 1 Port 1
Slot 1 Port 2
root>
To stop the Radio Logger manually, enter the following command in root view:
root> logger stop logger-type radio
To delete all data that has been saved by the Radio Logger, enter the following command in root view:
root> logger delete logger files<logger-type>.
Important Note: Whenever you activate the Radio Logger, any previous Radio Logger results are deleted.
Performing Diagnostics (CLI)
This section includes:
• Performing Radio Loopback (CLI)
• Performing Ethernet Loopback (CLI)
• Performing TDM Diagnostics (CLI)
- Configuring Service OAM (SOAM) Fault Management (FM) (CLI)
Performing Radio Loopback (CLI)

Note
To perform traffic-level diagnostics on a Multi-Carrier ABC group, the loopback must be activated for all members of the group. Radio-level diagnostics can still be performed on individual members of the group. For more information about Multi-Carrier ABC groups, see Configuring Multi-Carrier ABC (CLI).
To perform radio loopback, the radio must be set to its maximum TX power.
To set the timeout for a radio loopback, go to radio view and enter the following command:
radio[x/x]> radio loopbacks-timeout set duration <duration>
To display the radio loopback timeout, go to radio view and enter the following command:
radio[x/x]>radio loopbacks-timeout show
To activate an IF loopback on the modem, enter the following command in radio view:
radio[x/x]>modem loopback-if set admin towards-system
To deactivate an IF loopback on the modem, enter the following command in radio view:
radio[x/x]>modem loopback-if set admin off
To display whether there is currently an active IF loopback on the radio level, enter the following command in radio view:
radio[x/x]>modem loopback-if show
To activate an RF loopback, enter the following command in radio view:
radio[x/x]> rf loopback-rf set admin <admin>
Table 324 Radio Loopback CLI Parameters
| Parameter | Input Type | Permitted Values | Description |
| duration Number 0 – 1440admin Variable on | The timeout, in minutes, for automatic termination of a loopback. A value of 0 indicates that there is no timeout.Set on to initiate an RF loopback. | ||
| off | |||
The following commands initiate an IF loopback on radio interface 2, with a timeout of two minutes:
radio[2/1]> radio loopbacks-timeout set duration 2
radio[2/1]>rf loopback-rf set admin on
Performing Ethernet Loopback (CLI)
Ethernet loopbacks can be performed on any logical Ethernet interface except a LAG. When Ethernet loopback is enabled on an interface, the system loops back all packets ingressing the interface. This enables loopbacks to be performed over the link from other points in the network.
To configure loopback on an Ethernet interface, go to interface view for the interface and enter the following command:
eth type eth[x/x]> loopback admin <loopback-admin-state>
To configure the loopback duration time, go to interface view for the interface and enter the following command:
eth type eth[x/x]> loopback set duration <loopback-duration>
You can select whether to swap DA and SA MAC addresses during the loopback. Swapping addresses prevents Ethernet loops from occurring. It is recommended to enable MAC address swapping if LLDP is enabled.
To configure MAC address swapping, go to interface view for the interface and enter the following command:
eth type eth[x/x]> loopback swap-mac-address admin <MAC_swap-admin-state>
To view loopback status, go to interface view for the interface and enter the following command:
eth type eth[x/x]> loopback status show
Table 325 Ethernet Loopback CLI Parameters
| Parameter | Input Type | Permitted Values | Description |
| loopback-admin-state | Variable enable disable | disable | Enter enable to enable Ethernet loopback on the interface, or disable to disable Ethernet loopback on the interface. |
| loopback-duration | Number | 1 - 900 | The loopback duration time, in seconds. |
| MAC_swap-admin-state | Variable enable disable | disable | Enter enable to enable MAC address swapping, or disable to disable MAC address swapping. |
The following command enables Ethernet loopback on Ethernet interface 2.
eth type eth [1/2]> loopback admin enable
The following command sets the loopback duration time to 900 seconds.
eth type eth [1/2]> loopback set duration 900
The following command enables MAC address swapping during the loopback.
eth type eth [1/2]> loopback swap-mac-address admin enable
The following command displays Ethernet port loopback status.
eth type eth [1/2]> loopback status show
Performing TDM Diagnostics (CLI)
This section includes:
• Performing Loopback on E1/DS1s (CLI)
Performing Loopback on E1/DS1s (CLI)
To configure a loopback on an E1/DS1 interface, enter the following command in pwe3 view:
pwe3> pwe3 tdm loopback set slot <slot> tdm-port <tdm-port> type <type>
Table 326 E1/DS1 Loopback CLI Parameters
| Parameter | Input Type | Permitted Values | Description |
| slot Number 1 | |||
| tdm-port Number 1-16 | The E1/DS1 port on which to run the loopback. | ||
| type Variable | towards-line towards-system none | Determines the type of loopback. | |
Configuring Service OAM (SOAM) Fault Management (FM) (CLI)
This section includes:
• SOAM Overview (CLI)
- Configuring MDs (CLI)
- Configuring MA/MEGs (CLI)
- Configuring MEPs (CLI)
• Performing Loopback (CLI)
• Displaying MEP and Remote MEP Attributes (CLI)
• Displaying Detailed MEP Error Information (CLI)
SOAM Overview (CLI)
The Y.1731 standard and the MEF-30 specifications define Service OAM (SOAM). SOAM is concerned with detecting, isolating, and reporting connectivity faults spanning networks comprising multiple LANs, including LANs other than IEEE 802.3 media.
Y.1731 Ethernet FM (Fault Management) consists of three protocols that operate together to aid in fault management:
- Continuity check
- Link trace
- Loopback

Note
Link trace is planned for future release.
PTP 820 utilizes these protocols to maintain smooth system operation and non-stop data flow.
The following are the basic building blocks of FM:
- MD (Maintenance Domain) – An MD defines the management space on a network, typically owned and operated by a single entity, for which connectivity faults are managed via SOAM.
- MA/MEG (Maintenance Association/Maintenance Entity Group) – An MA/MEG contains a set of MEPs or MIPs.
- MEP (MEG End Points) – Each MEP is located on a service point of an Ethernet service at the boundary of the MEG. By exchanging CCMs (Continuity Check Messages), local and remote MEPs have the ability to detect the network status, discover the MAC address of the remote unit/port where the peer MEP is defined, and identify network failures.
- MIP –(MEG Intermediate Points) – Similar to MEPs, but located inside the MEG and can only respond to, not initiate, CCM messages.
- CCM (Continuity Check Message) – MEPs in the network exchange CCMs with their peers at defined intervals. This enables each MEP to detect loss of connectivity or failure in the remote MEP.
Configuring MDs (CLI)
In the current release, you can define one MD, with an MD Format of None.
To add an MD, enter the following command in root view:
root> ethernet soam md create md-id <md-id> md-format none md-name <md-name> md-level <md-level>

Note
Support for MDs with the MD format Character String is planned for future release. In this release, the software enables you to configure such MDs, but they have no functionality.
The following command creates MD 5, named TR-988 with maintenance level 5.
root> ethernet soam md create md-id 5 md-format none md-name TR-988 md-level 5
To delete an MD, enter the following command in root view. Before deleting an MD, you must delete any MA/MEG associated with the MD.
root> ethernet soam md delete md-id <md-id>
To display a list of MDs and their attributes, enter the following command in root view:
root> ethernet soam md show
Table 327 Maintenance Domain CLI Parameters
| Parameter | Input Type | Permitted Values | Description |
| md-id | Number | 1-4294967295 | |
| md-name String | Up to 43 alphanumeric characters. | An identifier for the MD. The MD Name should be unique over the domain. | |
| md-level Number 0-7 | The maintenance level of the MD. The maintenance level ensures that the CFM frames for each domain do not interfere with each other. Where domains are nested, the encompassing domain must have a higher level than the domain it encloses. The maintenance level is carried in all CFM frames that relate to that domain. The maintenance level must be the same on both sides of the link.Note: In the current release, the maintenance level is not relevant to the SOAM functionality. | ||


- Cambium Networks™
- User Guide
- Accuracy
- Copyrights
- Restrictions
- License Agreements
- High Risk Materials
- Contents
- About This User Guide .... 1
- Problems and warranty....4
- Security advice .... 5
- Warnings, cautions, and notes 6
- Caring for the environment 7
- Chapter 1: Introduction.... 1-1
- System Overview 1-4
- PTP 820F IDU Hardware Architecture.... 1-6
- Front Panel Description 1-7
- PTP 820G IDU Hardware Architecture 1-12
- Front Panel Description 1-13
- Chapter 13: Web EMS Utilities....13-1
- Chapter 14: Getting Started (CLI)....14-1
- Chapter 15: Configuration Guide (CLI)....15-1
- Chapter 16: Unit Management (CLI)....16-1
- Chapter 23: Access Management and Security (CLI)....23-1
- Chapter 24: Alarm Management and Troubleshooting (CLI) 24-1
- List of Figures
- List of Tables
- About This User Guide
- Contacting Cambium Networks
- Purpose
- Cross references
- Feedback
- Problems and warranty
- Reporting problems
- Repair and service
- Hardware warranty
- Caution
- Security advice
- Warnings, cautions, and notes
- Warnings
- Warning
- Cautions
- Notes
- Note
- Caring for the environment
- In EU countries
- Disposal of Cambium equipment
- Disposal of surplus packaging
- In non-EU countries
- Chapter 1: Introduction
- This section includes:
- Configuration Tips
- Ethernet Port Configuration
- Admin Status of Second Radio Interface
- SyncE Interface Configuration
- In-Band Management
- Software Upgrade
- Configuration Management and Backup Restoration
- System Overview
- PTP 820F
- PTP 820G
- Assured Platform
- PTP 820F IDU Hardware Architecture
- Front Panel Description
- Ethernet Traffic interfaces
- Ethernet Management interfaces
- E1/DS1 Interface
- Radio Interfaces
- Power Interface
- Synchronization Interface
- Terminal Interface
- External Alarms
- Storage Memory Card
- PTP 820G IDU Hardware Architecture
- E1/DS1 Interface (Optional)
- RFU Overview
- RFU's used with PTP 820F
- IDU-RFU Connection and Power Supply for PTP 820F
- IDU-RFU Connection and Power Supply for PTP 820G
- The Web-Based Element Management System
- Introduction to the Web EMS
- Web EMS Page Layout
- Front Panel Representation
- Related Pages Drop-Down List
- The Unit Summary Page
- The Radio Summary Page
- The Security Summary Page
- Reference Guide to Web EMS Menu Structure
- Chapter 2: Getting Started
- Assigning IP Addresses in the Network
- Establishing a Connection
- Connecting to the Unit with a Serial Connection
- Connecting to the Unit with a LAN Connection
- Logging On
- Changing Your Password
- Applying a Pre-Defined Configuration File
- Performing Quick Platform Setup
- Configuring In-Band Management
- Changing the Management IP Address
- Related Topics:
- Configuring Unit Redundancy for the PTP 820G
- Unit Redundancy Overview
- Configuring Unit Redundancy
- Cabling Requirements for Unit Redundancy
- Cabling for Ethernet Interfaces
- Cabling for E1/DS1 Interfaces
- Cabling for T3 Synchronization
- Inter-IDU Protection Connectivity and Management
- Configuring Ethernet Interface Protection
- Enabling Unit Redundancy
- Changing the Configuration after Enabling Unit Redundancy
- Viewing the Configuration of the Standby Unit
- Viewing Link and Protection Status and Activity
- Switchover
- Performing Lockout
- Disabling Unit Redundancy
- Determining ETSI or ANSI (FCC) TDM Mode
- Configuring the Activation Key
- Viewing the Activation Key Status Parameters
- Entering the Activation Key
- To enter a new activation key:
- Click Apply.
- Activating a Demo Activation Key
- To activate a demo activation key:
- Activation Key Reclaim
- Displaying a List of Activation-Key-Enabled Features
- Setting the Time and Date (Optional)
- - Configuring NTP
- Enabling the Interfaces (Interface Manager)
- Enabling the Second Management Interface
- Configuring RFU3/SFP5,RFU3/2.5GE5 as an Ethernet or RFU Interface(PTP 820F only)
- Configuring Cascading Interfaces (Optional)
- Configuring the Radio Parameters
- Enabling Link ID Mismatch Security
- Entering Radio View (CLI)
- Muting and Unmuting the Radio (CLI)
- Configuring the Transmit (TX) Frequency (CLI)
- Configuring the Transmit (TX) Level (CLI)
- Configuring the Radio (MRMC) Script(s)
- • Displaying MRMC Status
- Click Apply.
- Enabling ACM with Adaptive Transmit Power
- Operating in FIPS Mode
- Requirements for FIPS Compliance
- Encrypting the External Protection Link
- Initial Configuration of FIPS-Compliant Unit Redundancy Configuration
- Replacing a Unit in a FIPS-Compliant Unit Redundancy Configuration
- Configuring Grouping (Optional)
- Creating Service(s) for Traffic
- Chapter 3: Configuration Guide
- System Configurations
- Radio Configurations
- PTP 820F Radio Configurations
- TDM Configurations
- Configuring a Link Using the Quick Configuration Wizard
- Configuring a 1+0 Link Using the Quick Configuration Wizard
- Click Next. Page 2 of the 1+0 Quick Configuration wizard opens.
- Configuring a 1+0 (Repeater) Link Using the Quick Configuration Wizard
- Configuring a 1+1 HSB Link Using the Quick Configuration Wizard
- Configuring a 1+1 HSB-SD Link Using the Quick Configuration Wizard
- Configuring an N+0 Multi-Carrier ABC Link Using the Quick Configuration Wizard
- Configuring a 1+0 Link
- Configuring Multi-Carrier ABC
- Multi-Carrier ABC Overview
- Configuring a Multi-Carrier ABC Group
- Adding and Removing Group Members
- Configuring the Multi-Carrier ABC Minimum Bandwidth Override Option
- Deleting a Multi-Carrier ABC Group
- Configuring Link Aggregation (LAG) and LACP
- LAG Overview
- Configuring a LAG Group
- Creating a LAG Group
- Editing a LAG Group
- Enabling and Disabling LAG Group Shutdown in case of Degradation Event
- Configuring Enhanced LAG Distribution
- Deleting a LAG Group
- Displaying LACP Parameters and Statistics
- Displaying LACP Aggregation Status Parameters
- Displaying LACP Port Status Parameters
- Displaying LACP Port Statistics
- Displaying LACP Port Debug Statistics
- Configuring XPIC
- Prerequisites for XPIC
- Configuring the Carriers
- To configure the radio carriers:
- Creating an XPIC Group
- Performing Antenna Alignment for XPIC
- Deleting an XPIC Group
- Configuring HSB Radio Protection
- HSB Radio Protection Overview
- Configuring 1+1 HSB without Space Diversity
- Configuring 1+1 HSB with Space Diversity
- Copying Configuration to Mate
- Revertive Mode
- Click Apply.
- Switchovers and Lockout
- Deleting an HSB Radio Protection Group without Space Diversity
- Deleting an HSB Radio Protection Group with Space Diversity
- Configuring IF Combining
- Chapter 4: Unit Management
- Defining the IP Protocol Version for Initiating Communications
- Configuring the Remote Unit's IP Address
- Configuration SNMP
- Configuring Trap Managers
- Configuring the Internal Ports for FTP or SFTP
- Installing and Configuring an FTP or SFTP Server
- Upgrading the Software
- Viewing Current Software Versions
- Parameter Definition
- Software Upgrade Overview
- Downloading and Installing Software
- Downloading software Via HTTP and HTTPS
- Downloading Software Via FTP or SFTP
- Installing Software
- To install software:
- Configuring a Timed Installation
- Installing RFU Software
- Backing Up and Restoring Configurations
- Configuration Management Overview
- Viewing Current Backup Files
- Setting the FTP/SFTP Configuration Management Parameters
- Exporting a Configuration File
- Exporting a Configuration File Via HTTP or HTTPS
- Importing a Configuration File
- Deleting a Configuration File
- Backing Up the Current Configuration
- Restoring a Saved Configuration
- Setting the Unit to the Factory Default Configuration
- Performing a Hard (Cold) Reset
- Configuring Unit Parameters
- Configuring NTP
- Displaying Unit Inventory
- Defining a Login Banner
- Chapter 5: Radio Configuration
- Viewing the Radio Status and Settings
- Configuring the IDU-RFU Connection (PTP 820F only)
- Configuring the Remote Radio Parameters
- Displaying Communication Status with Remote Radio (CLI)
- Displaying Remote Radio's Link ID and Location (CLI)
- Muting and Unmuting the Remote Radio (CLI)
- Displaying the Remote Radio's RX Level (CLI)
- Configuring the Remote Radio's TX Level (CLI)
- Configuring Remote ATPC (CLI)
- Configuring ATPC and Override Timer
- Configuring Header De-Duplication
- Configuring Frame Cut-Through
- Viewing Header De-Duplication and Frame Cut-Through Counters
- Configuring AES-256 Payload Encryption
- This feature requires:
- Configuring and Viewing Radio PMs and Statistics
- Configuring BER Thresholds and Displaying Current BER
- Displaying MRMC Status
- Displaying MRMC PMs and Configuring ACM Profile Thresholds
- Interval ▲ Min profile Max profile Min bitrate Max bitrate Integrity
- Displaying Defective Block Counters
- Displaying Signal Level PMs and Configuring Signal Level PM Thresholds
- Interval ▲ Max TSL (dBm) Min TSL (dBm) Max HSL (dBm) Min RSL (dBm) TSL exceed threshold seconds RSL exceed threshold1 seconds RSL exceed threshold2 seconds Integrity
- Displaying PMs for the Combined IF Combining Signal
- Interval Combined max RSL (dBm) Combined min RSL (dBm) Combined RSL exceed threshold1 seconds Combined RSL exceed threshold2 seconds Integrity
- Displaying Modem BER (Aggregate) PMs
- Internal ▲ ES SES UAS BBE Integrity
- Displaying MSE PMs and Configuring MSE PM Thresholds
- Interval ▲ Min MSE (dd) Max MSE (dd) Exceed threshold seconds Integrity
- Displaying XPI PMs and Configuring XPI PM Thresholds
- Interval ▲ Min XPI (dB) Max XPI (dB) XPI below threshold seconds Integrity
- Displaying Traffic PMs
- Displaying Capacity and Throughput PMs
- Time Interval Index Peak capacity (Mbps) Average capacity (Mbps) Seconds exceeding threshold Peak throughput (Mbps) Average throughput (Mbps) Seconds exceeding threshold Integrity
- Displaying Utilization PMs and Configuring Utilization Thresholds
- Time interval index Peak utilization (%) Average utilization (%) Seconds exceeding threshold Integrity
- Displaying Frame Error Rate PMs
- Time interval index FER Integrity
- Chapter 6: Ethernet Services and Interfaces
- Configuring Ethernet Service(s)
- Ethernet Services Overview
- General Guidelines for Provisioning Ethernet Services
- The Ethernet Services Page
- Adding an Ethernet Service
- Editing a Service
- Deleting a Service
- Enabling, Disabling, or Deleting Multiple Services
- Viewing Service Details
- Configuring Service Points
- Ethernet Services Points Overview
- The Ethernet Service Points Page
- To open the Ethernet Service Points page:
- a. Ethernet Service Points – General SP Attributes Table
- b. Ethernet Service Points – Ingress Attributes
- c. Ethernet Service Points – Egress Attributes
- Adding a Service Point
- Click Apply, then Close.
- Editing a Service Point
- To edit a service point:
- Deleting a Service Point
- To delete a service point:
- Attaching VLANs
- To add multiple C-VLANs:
- Setting the MRU Size and the S-VLAN Ethertype
- Configuring Ethernet Interfaces
- Configuring Automatic State Propagation and Link Loss Forwarding
- Viewing Ethernet PMs and Statistics
- RMON Statistics
- Egress CoS Statistics
- In the Show Service bundle ID field, select 1.
- Port TX Statistics
- Displaying Ethernet Port TX PMs
- Enabling or Disabling Gathering of Port TX PM Statistics per Interface
- Setting the Ethernet Port TX Threshold
- Port RX Statistics
- Displaying Ethernet Port RX PMs
- Enabling or Disabling Gathering of Port RX PM Statistics per Interface
- Setting the Ethernet Port RX Threshold
- Chapter 7: Quality of Service (QoS)
- QoS Overview
- Configuring Classification
- Classification Overview
- Configuring Ingress Path Classification on a Logical Interface
- Modifying the C-VLAN 802.1Q UP and CFI Bit Classification Table
- Modifying the S-VLAN 802.1 UP and DEI Bit Classification Table
- Modifying the DSCP Classification Table
- Modifying the MPLS EXP Bit Classification Table
- Modifying the MAC DA Classification Table
- Configuring Policers (Rate Metering)
- Policer (Rate Metering) Overview
- Configuring Policer Profiles
- Adding a Policer Profile
- Editing a Policer Profile
- Deleting a Policer Profile
- Assigning Policers to Interfaces
- Assigning Unicast Policers
- Assigning Multicast Policers
- Assigning Broadcast Policers
- Assigning Ethertype Policers
- Configuring the Ingress and Egress Byte Compensation
- Configuring Marking
- Marking Overview
- Enabling Marking
- Modifying the 802.1Q Marking Table
- Modifying the 802.1AD Marking Table
- Configuring WRED
- WRED Overview
- Configuring WRED Profiles
- Adding a WRED Profile
- Editing a WRED Profile
- Deleting a WRED Profile
- Assigning WRED Profiles to Queues
- Configuring Egress Shaping
- Egress Shaping Overview
- Configuring Queue Shaper Profiles
- Adding a Queue Shaper Profile
- Editing a Queue Shaper Profile
- To edit a queue shaper profile:
- Deleting a Queue Shaper Profile
- Configuring Service Bundle Shaper Profiles
- Adding a Service Bundle Shaper Profile
- Editing a Service Bundle Shaper Profile
- Deleting a Service Bundle Shaper Profile
- Assigning a Queue Shaper Profile to a Queue
- Assigning a Service Bundle Shaper Profile to a Service Bundle
- Configuring Scheduling
- Scheduling Overview
- Configuring Priority Profiles
- Adding a Scheduler Priority Profile
- Editing a Service Scheduler Priority Profile
- Deleting a Scheduler Priority Profile
- Configuring WFQ Profiles
- Adding a WFQ Profile
- Editing a WFQ Priority Profile
- Deleting a WFQ Profile
- Assigning a Priority Profile to an Interface
- Assigning a WFQ Profile to an Interface
- Configuring and Displaying Queue-Level PMs
- Time Interval ▲ Max Bytes Passed Min Bytes Passed Avg Bytes Passed Max Packets Passed Min Packets Passed Avg Packets Passed Max Bytes Dropped Min Bytes Dropped Avg Bytes Dropped Max Packets Dropped Avg Packets Dropped Bytes Passed Threshold Seconds Integrity
- Chapter 8: Ethernet Protocols
- Configuring G.8032
- G.8032 Overview
- Configuring the Destination MAC Address
- Adding ERPIs
- Configuring the RPL Owner
- Configuring Timers
- Viewing the ERPI Configuration and Status Parameters
- Viewing ERPI State Information
- Initiating a Manual or Forced Switch and Clearing the Switch or Initiating Reversion
- Blocking or Unblocking R-APS Messages on a Service Point
- Viewing ERPI Statistics
- Configuring MSTP
- MSTP Overview
- Mapping Ethernet Services to MSTP instances (MSTIs)
- Configuring the MSTP Bridge Parameters
- Enabling MSTP and Configuring the MSTP Bridge General Attributes
- Click Apply.
- Viewing and Configuring the MSTP Bridge Configuration ID
- Viewing and Configuring the MSTP Bridge Spanning Tree
- Viewing and Configuring the MSTP Bridge CIST Parameters
- Viewing and Configuring the MSTP Bridge MSTI Parameters
- Viewing the MSTP VLAN Parameters
- Configuring the MSTP Port Parameters
- Viewing and Configuring the MSTP Port Spanning Tree
- Viewing and Configuring the MSTP Port CIST Parameters
- Viewing and Configuring the MSTP Port MSTI Parameters
- Click Apply, then Close.
- Viewing and Resetting the BPDU Counters
- Configuring LLDP
- LLDP Overview
- Displaying Peer Status
- Configuring the General LLDP Parameters
- Configuring the LLDP Port Parameters
- Click Apply, then Close.
- Displaying the Unit's Management Parameters
- Displaying Peer Unit's Management Parameters
- Displaying the Local Unit's Parameters
- Displaying LLDP Statistics
- Chapter 9: TDM Services and Interfaces
- TDM Overview
- Configuring the E1/DS1 Interface
- Configuring Native TDM Trails
- Native TDM Trail Configuration Overview
- General Guidelines for Provisioning TDM Services
- Viewing TDM Trails
- Configuring the Revertive Timer
- Adding TDM Trails
- Adding a Trail between a TDM Port or Protection Group and a Radio Port, a Radio Group, or a Cascading Interface
- Configuring a TDM Card or Group as an Endpoint
- Configuring a Radio Card or Group or a Cascading Interface as an Endpoint
- Adding a Trail between Radio Ports, Radio Groups, or Cascading Interfaces
- Editing TDM Trails
- Deleting TDM Trails
- Limitations on Available Endpoints
- Configuring TDM Pseudowire Services
- TDM Pseudowire Services Configuration Overview
- General Guidelines for Provisioning TDM Pseudowire Services
- Viewing TDM Pseudowire Services
- Adding TDM Pseudowire Services
- Adding a Service between a TDM Port or Protection Group and a Radio Port, a Radio Group, or an Ethernet or Cascading Interface
- Configuring a Radio Port or Group or an Ethernet or Cascading Interface as an Endpoint
- Adding a Service between Radio Ports, Radio Groups, or Ethernet or Cascading Interfaces
- Editing TDM Pseudowire Services
- Deleting TDM Pseudowire Services
- Configuring Advanced Pseudowire Parameters
- Configuring Pseudowire Card Parameters
- Configuring OEM for Pseudowire Services
- Configuring Pseudowire Maintenance Domains (MDs)
- To add an MD:
- Configuring Pseudowire Maintenance Associations (MAs)
- - 10 minutes
- Configuring Pseudowire Tunnels and Tunnel Groups
- Configuring a Tunnel
- Viewing Tunnels
- Adding a Tunnel
- Editing a Tunnel
- Viewing a Tunnel's Operational Status and Attributes
- Deleting a Tunnel
- Configuring a Tunnel Group
- TDM Pseudowire Path Protection Overview
- Viewing Tunnel Groups
- Adding a Tunnel Group
- Editing a Tunnel Group
- Deleting a Tunnel Group
- Configuring Pseudowire Profiles
- Viewing a Pseudowire Profile
- Adding a Pseudowire Profile
- Editing a Pseudowire Profile
- Deleting a Pseudowire Profile
- Click Delete. The profile is deleted.
- Configuring Pseudowire TDM Services Manually
- Viewing Pseudowire TDM Services
- Adding a Pseudowire TDM Service
- Editing a Pseudowire TDM Service
- Viewing the Status of a Pseudowire TDM Service
- Deleting a Pseudowire TDM Service
- Displaying TDM PMs
- Displaying E1/DS1 PMs
- Time Interval ES SES UAS Integrity
- Displaying Native TDM Service PMs
- Time interval ES SES UA9 FC Integrity
- Displaying Pseudowire Service PMs
- Time interval ES SES JAS FC FER Missing packets Packets reorder Misordered and dropped packets Mallomed packets Integrity
- Chapter 10: Synchronization
- Configuring the Sync Source
- Viewing the Sync Source Status
- Adding a Sync Source
- Editing a Sync Source
- Deleting a Sync Source
- To delete a synchronization source:
- Configuring the Outgoing Clock and SSM Messages
- Configuring 1588 Transparent Clock
- Note that in release 11.3:
- To configure Transparent Clock:
- Configuring 1588 Boundary Clock
- Note that in System Release 11.3:
- Enabling Boundary Clock
- To enable Boundary Clock:
- Displaying and Setting the Boundary Clock Default Parameters
- Displaying the Boundary Clock Advanced Parameters
- Displaying the Boundary Clock Port Parameters
- Displaying the Boundary Clock Port Statistics
- Disabling 1588 PTP
- Chapter 11: Access Management and Security
- Quick Security Configuration
- Quick Security Configuration – General Parameters Page
- Quick Security Configuration – Protocols Page
- Quick Security Configuration – Access Control Page
- Quick Security Configuration – RSA Key & Certificate Page
- Configuring the General Access Control Parameters
- Configuring the Password Security Parameters
- Configuring the Session Timeout
- Configuring Users
- User Configuration Overview
- Configuring User Profiles
- Configuring Users Accounts
- Configuring RADIUS
- RADIUS Overview
- Activating RADIUS Authentication
- Configuring the RADIUS Server Attributes
- Viewing RADIUS User Permissions and Connectivity
- Configuring a RADIUS Server
- Configuring a Win 2008 RADIUS Server
- Step 1 – Creating Groups and Users
- Step 2 – Creating a RADIUS Client
- In the New RADIUS Client window:
- Step 3 – Creating a Network Policy
- Click OK.
- Configuring a Linux FreeRADIUS Server
- Step 1 – Creating Users
- Step 2 – Defining the Permitted Access Channels
- Step 3 – Specifying the RADIUS client
- Step 4 – Restarting the RADIUS client
- Configuring X.509 CSR Certificates and HTTPS
- Generating a Certificate Signing Request (CSR) File
- Downloading a Certificate
- Blocking Telnet Access
- Uploading the Security Log
- Uploading the Configuration Log
- Chapter 12: Alarm Management and Troubleshooting
- Viewing Current Alarms
- Time Severity Description User Text Origin Alarm Id
- Viewing Alarm Statistics
- Origin ▲ Severity Critical SeverityCount Major SeverityCount MaaS SeverityCount Warning SeverityCount
- Viewing the Event Log
- Time Sequence Number Severity State Description User Text Origin
- Editing Alarms Disabling Alarms and Events
- Displaying Alarm Information
- Alarm ID Severity Description Additional Test Service
- Viewing the Probable Cause and Corrective Actions for an Alarm Type
- Alarm ID Severity Description Additional Text Service
- Editing Alarms and Disabling Alarms and Events
- Setting Alarms to their Default Values
- Configuring External Alarms
- Configuring Input Alarms
- Configuring Voltage Alarm Thresholds and Masking Undervoltage Alarms
- Configuring the Output Alarm
- Uploading Unit Info
- Uploading a Unit Info File Via HTTP or HTTPS
- Uploading a Unit Info File Via FTP or SFTP
- Performing Diagnostics
- Performing Radio Loopback
- Performing Ethernet Loopback
- Performing TDM Diagnostics
- Performing Loopback on E1/DS1s
- Configuring Service OAM (SOAM) Fault Management (FM)
- SOAM Overview
- Configuring MDs
- Configuring MA/MEGs
- Configuring MEPs
- d. Adding Local and Remote MEPs
- Click Apply, then Close.
- e. Configuring the Local MEPs
- f. Enabling Local MEPs
- Displaying Remote MEPs
- Displaying Last Invalid CCMS
- Configuring MIPs with MHF Default
- Performing Loopback
- Chapter 13: Web EMS Utilities
- Restarting the HTTP Server
- Calculating an ifIndex
- Displaying, Searching, and Saving a list of MIB Entities
- HIB OID ▼
- Chapter 14: Getting Started (CLI)
- Establishing a Connection (CLI)
- Logging On (CLI)
- General CLI Commands
- Changing Your Password (CLI)
- Configuring In-Band Management (CLI)
- Changing the Management IP Address (CLI)
- Examples
- Configuring Unit Redundancy for the PTP 820 Split Mount (CLI)
- Configuring Unit Redundancy (CLI)
- Configuring Ethernet Interface Protection (CLI)
- Enabling Unit Redundancy (CLI)
- To enable unit redundancy:
- Changing the Configuration after Enabling Unit Redundancy (CLI)
- Running Commands in the Standby Unit (CLI)
- Viewing Link and Protection Status and Activity (CLI)
- Switchover (CLI)
- Performing Lockout (CLI)
- Disabling Unit Redundancy (CLI)
- Configuring the Activation Key (CLI)
- Activation Key Overview (CLI)
- Installing an Activation Key (CLI)
- Displaying Activation Key Information (CLI)
- Activating an Activation Key (CLI)
- Setting the Time and Date (Optional) (CLI)
- - Configuring NTP (CLI)
- Enabling the Interfaces (Interface Manager) (CLI)
- Enabling the Second Management Interface (CLI)
- Configuring Cascading Interfaces (Optional) (CLI)
- Unmuting a Radio (CLI)
- Configuring the Radio (MRMC) Script(s) (CLI)
- Displaying Available MRMC Scripts (CLI)
- Assigning an MRMC Script to a Radio Carrier (CLI)
- Enabling ACM with Adaptive Transmit Power (CLI)
- Configuring the RSL Threshold Alarm (CLI)
- Operating in FIPS Mode (CLI)
- Requirements for FIPS Compliance (CLI)
- Enabling FIPS Mode (CLI)
- Status values are:
- Chapter 15: Configuration Guide (CLI)
- System Configurations (CLI)
- Radio Configurations (CLI)
- Configuring a 1+0 Link (CLI)
- Configuring Multi-Carrier ABC (CLI)
- Multi-Carrier ABC Overview (CLI)
- Configuring a Multi-Carrier ABC Group (CLI)
- Configuring Multi-Carrier ABC for PTP 820F (CLI)
- Configuring Multi-Carrier ABC for PTP 820G (CLI)
- Removing Members from a Multi-Carrier ABC Group (CLI)
- Deleting a Multi-Carrier ABC Group (CLI)
- Configuring Link Aggregation (LAG) and LACP (CLI)
- LAG Overview (CLI)
- Configuring a LAG Group (CLI)
- Configuring LACP (CLI)
- Enabling and Disabling the LAG Group Shutdown in case of Degradation Event Option (CLI)
- Configuring Enhanced LAG Distribution (CLI)
- Deleting a LAG Group (CLI)
- Displaying LACP Parameters and Statistics (CLI)
- Displaying LACP Aggregation Status Parameters (CLI)
- Displaying LACP Port Status Parameters (CLI)
- Displaying LACP Port Statistics (CLI)
- Configuring XPIC (CLI)
- Prerequisites for XPIC (CLI)
- Configuring the Carriers (CLI)
- Creating an XPIC Group (CLI)
- Performing Antenna Alignment for XPIC (CLI)
- Deleting an XPIC Group (CLI)
- Configuring HSB Radio Protection (CLI)
- HSB Radio Protection Overview (CLI)
- Configuring 1+1 HSB without Space Diversity (CLI)
- Configuring 1+1 HSB with Space Diversity (CLI)
- Copying Configuration to Mate (CLI)
- Revertive Mode (CLI)
- Switchovers and Lockout (CLI)
- Deleting an HSB Radio Protection Group (CLI) without Space Diversity
- Deleting an HSB Radio Protection Group with Space Diversity (CLI)
- Chapter 16: Unit Management (CLI)
- Defining the IP Protocol Version for Initiating Communications (CLI)
- Configuring the Remote Unit's IP Address (CLI)
- Configuring the Remote Radio's IP Address in IPv4 format (CLI)
- Configuring the Remote Radio's IP Address in IPv6 format (CLI)
- Configuring SNMP (CLI)
- Defining the SNMP Parameters (CLI)
- Displaying the SNMP Settings (CLI)
- Configuring Trap Managers (CLI)
- Configuring the Internal Ports for FTP or SFTP (CLI)
- Upgrading the Software (CLI)
- Software Upgrade Overview (CLI)
- Displaying Current Software Versions (CLI)
- Configuring a Software Download (CLI)
- Downloading a Software Package (CLI)
- Installing and Upgrading Software (CLI)
- Installing and Upgrading Software in the RFU (CLI)
- Backing Up and Restoring Configurations (CLI)
- Configuration Management Overview (CLI)
- Setting the Configuration Management Parameters (CLI)
- Backing up a Configuration File (CLI)
- Importing and Restoring a Configuration File (CLI)
- Editing CLI Scripts (CLI)
- To edit a CLI script:
- Setting the Unit to the Factory Default Configuration (CLI)
- Performing a Hard (Cold) Reset (CLI)
- Configuring Unit Parameters (CLI)
- Configuring NTP (CLI)
- Displaying Unit Inventory (CLI)
- Chapter 17: Radio Configuration (CLI)
- Viewing the Radio Status and Settings (CLI)
- Configuring the Remote Radio Parameters (CLI)
- Displaying Communication Status with the Remote Radio (CLI)
- Displaying the Remote Radio's Link ID and Location (CLI)
- Configuring ATPC and Override Timer (CLI)
- Configuring Header De-Duplication (CLI)
- Displaying Header De-Duplication Information (CLI)
- Configuring Frame Cut-Through (CLI)
- Configuring AES-256 Payload Encryption (CLI)
- To configure payload encryption:
- Configuring and Viewing Radio PMs and Statistics (CLI)
- Displaying General Modem Status and Defective Block PMs(CLI)
- Displaying Excessive BER (Aggregate) PMs (CLI)
- Displaying BER Level and Configuring the Excessive BER Thresholds (CLI)
- Configuring RSL Thresholds (CLI)
- Configuring TSL Thresholds (CLI)
- Displaying RSL and TSL Levels (CLI)
- Configuring the Signal Level Threshold (CLI)
- Configuring the MSE Thresholds and Displaying the MSE PMs (CLI)
- Displaying ACM PMs and Configuring ACM Profile Thresholds (CLI)
- Configuring the XPI Thresholds and Displaying the XPI PMs (CLI)
- Chapter 18: Ethernet Services and Interfaces (CLI)
- Configuring Ethernet Services (CLI)
- Ethernet Services Overview (CLI)
- General Guidelines for Provisioning Ethernet Services (CLI)
- Defining Services (CLI)
- Adding a Service (CLI)
- Entering Service View (CLI)
- Showing Service Details (CLI)
- Configuring a Service's Operational State (CLI)
- Configuring a Service's CoS Mode and Default CoS (CLI)
- Configuring a Service's EVC ID and Description (CLI)
- Deleting a Service (CLI)
- Configuring Service Points (CLI)
- Service Points Overview (CLI)
- Service Point Classification (CLI)
- Overview of Service Point Classification (CLI)
- SAP Classification (CLI)
- SNP Classification (CLI)
- Pipe Service Point Classification (CLI)
- MNG Service Point Classification (CLI)
- Adding a Service Point (CLI)
- Adding Service Point Examples (CLI)
- Configuring Service Point Ingress Attributes (CLI)
- Enabling and Disabling Broadcast Frames (CLI)
- CoS Preservation and Modification on a Service Point (CLI)
- Enabling and Disabling Flooding (CLI)
- Configuring Service Point Egress Attributes (CLI)
- Configuring VLAN and CoS Preservation (CLI)
- Configuring C-VLAN CoS Preservation (CLI)
- Configuring C-VLAN Preservation (CLI)
- Configuring S-VLAN CoS Preservation (CLI)
- Configuring Service Bundles (CLI)
- Attaching a VLAN Bundle to a Service Point (CLI)
- Displaying Service Point Attributes (CLI)
- Deleting a Service Point (CLI)
- Defining the MAC Address Forwarding Table for a Service (CLI)
- MAC Address Forwarding Table Overview (CLI)
- Setting the Maximum Size of the MAC Address Forwarding Table (CLI)
- Setting the MAC Address Forwarding Table Aging Time (CLI)
- Adding a Static MAC Address to the Forwarding Table (CLI)
- Displaying the MAC Address Forwarding Table (CLI)
- Flushing the MAC Address Forwarding Table (CLI)
- Enabling MAC Address Learning on a Service Point (CLI)
- Setting the MRU Size and the S-VLAN Ethertype (CLI)
- Configuring the S-VLAN Ethertype (CLI)
- Configuring the C-VLAN Ethertype (CLI)
- Configuring the MRU (CLI)
- Configuring Ethernet Interfaces (CLI)
- Entering Interface View (CLI)
- Displaying the Operational State of the Interfaces in the Unit (CLI)
- Viewing Interface Attributes (CLI)
- Configuring an Interface's Media Type (CLI)
- Configuring an Interface's Speed and Duplex State (CLI)
- Configuring an Interface's Auto Negotiation State (CLI)
- Configuring an Interface's IFG (CLI)
- Configuring an Interface's Preamble (CLI)
- Adding a Description for the Interface (CLI)
- Configuring Automatic State Propagation and Link Loss Forwarding (CLI)
- Configuring Automatic State Propagation to an Ethernet Port (CLI)
- Viewing Ethernet PMs and Statistics (CLI)
- Displaying RMON Statistics (CLI)
- Configuring Ethernet Port PMs and PM Thresholds (CLI)
- Displaying Ethernet Port PMs (CLI)
- Clearing Ethernet Port PMs (CLI)
- Chapter 19: Quality of Service (QoS) (CLI)
- Configuring Classification (CLI)
- Classification Overview (CLI)
- Configuring Ingress Path Classification on a Logical Interface (CLI)
- Configuring VLAN Classification and Override (CLI)
- Configuring 802.1p Classification (CLI)
- Configuring Trust Mode for 802.1p Classification (CLI)
- Modifying the C-VLAN 802.1 UP and CFI Bit Classification Table (CLI)
- Modifying the S-VLAN 802.1 UP and DEI Bit Classification Table (CLI)
- Configuring DSCP Classification (CLI)
- Configuring Trust Mode for DSCP Classification (CLI)
- Modifying the DSCP Classification Table (CLI)
- Configuring MPLS Classification (CLI)
- Configuring Trust Mode for MPLS Classification (CLI)
- Modifying the MPLS EXP Bit Classification Table (CLI)
- Configuring a Default CoS (CLI)
- Configuring Ingress Path Classification on a Service Point (CLI)
- Configuring Ingress Path Classification on a Service (CLI)
- Configuring Policers (Rate Metering) (CLI)
- Overview of Rate Metering (Policing) (CLI)
- Configuring Rate Meter (Policer) Profiles (CLI)
- Displaying Rate Meter Profiles (CLI)
- Deleting a Rate Meter Profile (CLI)
- Attaching a Rate Meter (Policer) to an Interface (CLI)
- Assigning a Rate Meter (Policer) for Unicast Traffic (CLI)
- Assigning a Rate Meter (Policer) for Multicast Traffic (CLI)
- Assigning a Rate Meter (Policer) for Broadcast Traffic (CLI)
- Assigning a Rate Meter (Policer) per Ethertype (CLI)
- Attaching a Rate Meter (Policer) to a Service Point and CoS (CLI)
- Configuring the Line Compensation Value for a Rate Meter (Policer) (CLI)
- Displaying Rate Meter Statistics for an Interface (CLI)
- Configuring Marking (CLI)
- Marking Overview (CLI)
- Configuring Marking Mode on a Service Point (CLI)
- Marking Table for C-VLAN UP Bits (CLI)
- Marking Table for S-VLAN UP Bits (CLI)
- Configuring WRED (CLI)
- WRED Overview (CLI)
- Configuring WRED Profiles (CLI)
- Assigning a WRED Profile to a Queue (CLI)
- Configuring Shapers (CLI)
- Overview of Egress Shaping (CLI)
- Configuring Queue Shaper Profiles (CLI)
- Attaching a Shaper Profile to a Queue (CLI)
- Configuring Service Bundle Shapers (CLI)
- Configuring Service Bundle Shaper Profiles (CLI)
- Attaching a Shaper Profile to a Service Bundle (CLI)
- Configuring Egress Line Compensation for Shaping (CLI)
- Configuring Scheduling (CLI)
- Overview of Egress Scheduling (CLI)
- Configuring Queue Priority (CLI)
- Configuring Interface Priority Profiles (CLI)
- Attaching a Priority Profile to an Interface (CLI)
- Configuring Weighted Fair Queuing (WFQ) (CLI)
- Overview of WFQ (CLI)
- Configuring a WFQ Profile (CLI)
- Attaching a WFQ Profile to an Interface (CLI)
- Displaying Egress Statistics (CLI)
- Displaying Queue-Level PMs (CLI)
- Configuring and Displaying Queue-Level PMs (CLI)
- Displaying Service Bundle-Level PMs (CLI)
- Chapter 20: Ethernet Protocols (CLI)
- Configuring G.8032 (CLI)
- Configuring the Destination MAC Address (CLI)
- Configuring ERPIs (CLI)
- Configuring the RPL Owner (CLI)
- Configuring Timers (CLI)
- Initiating a Manual or Forced Switch and Clearing the Switch or Initiating Reversion (CLI)
- Blocking or Unblocking R-APS Messages on a Service Point (CLI)
- Displaying the ERPI Attributes (CLI)
- Configuring MSTP (CLI)
- Configuring the MSTP Bridge Parameters (CLI)
- Enabling and Disabling MSTP (CLI)
- Defining the Number of MSTIs (CLI)
- Setting the BPDU Destination MAC Address (CLI)
- Freezing MSTP (CLI)
- Resetting the MSTP Stack (CLI)
- Handling Signal Degrade (SD) Failures (CLI)
- Setting the Configuration ID (CLI)
- Mapping Services to MSTIs (CLI)
- Setting the Bridge Level Spanning Tree Parameters (CLI)
- Setting and Viewing the Bridge Level MSTI Parameters (CLI)
- Viewing the MSTP Parameters (CLI)
- Configuring the MSTP Port Parameters (CLI)
- Configuring and Viewing the CIST Port Parameters (CLI)
- Configuring and Viewing the MSTI Port Parameters (CLI)
- Viewing and Resetting Port BPDU Counters (CLI)
- Configuring LLDP (CLI)
- Configuring the General LLDP Parameters (CLI)
- Displaying the General LLDP Parameters (CLI)
- Configuring LLDP Port Parameters (CLI)
- Displaying the LLDP Local System Parameters (CLI)
- Displaying the LLDP Remote System Parameters (CLI)
- Displaying the LLDP Remote Unit Parameters (CLI)
- The following information is displayed:
- Displaying the LLDP Remote Management Data per Port (CLI)
- Displaying LLDP Statistics (CLI)
- Displaying Statistics Regarding Changes in Peer Unit (CLI)
- Displaying LLDP Transmission Statistics (CLI)
- Displaying LLDP Received Frames Statistics (CLI)
- Chapter 21: TDM Services and Interfaces (CLI)
- TDM Overview (CLI)
- Configuring the Unit to Operate in ANSI Mode (CLI)
- Configuring TDM Cards and Interfaces (CLI)
- Configuring the E1/DS1 Interface (CLI)
- Configuring the E1/DS1 Parameters (CLI)
- Configuring Native TDM Trails (CLI)
- Configuring TDM Pseudowire Services (CLI)
- Configuring Pseudowire Tunnels (CLI)
- Configuring Pseudowire Profiles (CLI)
- Configuring Ethernet Services for TDM Traffic (CLI)
- Configuring Pseudowire Path Protection and Dual Homing (CLI)
- Adding a Maintenance Domain (MD) (CLI)
- Adding a Maintenance Association (MA) (CLI)
- Enabling CCM Messages (CLI)
- Assigning an MA to a TDM Tunnel (CLI)
- Configuring a Pseudowire Tunnel Group (CLI)
- Configuring a Network Edge Node in a Dual Homing Configuration (CLI)
- Manually Configuring Pseudowire Services (CLI)
- Displaying TDM PMs (CLI)
- Chapter 22: Synchronization (CLI)
- Configuring the Sync Source (CLI)
- Configuring an Ethernet Interface as a Synchronization Source (CLI)
- Configuring a Radio Interface as a Synchronization Source (CLI)
- Clearing All Sync Sources (CLI)
- Configuring the Outgoing Clock (CLI)
- Configuring SSM Messages (CLI)
- Configuring the Revertive Timer (CLI)
- Displaying Synchronization Status and Parameters (CLI)
- Configuring 1588 Transparent Clock (CLI)
- Configuring 1588 Boundary Clock (CLI)
- Enabling Boundary Clock (CLI)
- Displaying and Setting the Boundary Clock Default Parameters (CLI)
- Displaying the Boundary Clock Advanced Parameters (CLI)
- Displaying the Boundary Clock Port Parameters (CLI)
- Displaying the Boundary Clock Port Statistics (CLI)
- Disabling Boundary Clock (CLI)
- Chapter 23: Access Management and Security (CLI)
- Configuring the General Access Control Parameters (CLI)
- Configuring the Inactivity Timeout Period (CLI)
- Configuring Blocking Upon Login Failure (CLI)
- Configuring Blocking of Unused Accounts (CLI)
- Configuring the Password Security Parameters (CLI)
- Configuring Password Aging (CLI)
- Configuring Password Strength Enforcement (CLI)
- Forcing Password Change Upon First Login (CLI)
- Displaying the System Password Settings (CLI)
- Configuring Users (CLI)
- User Configuration Overview (CLI)
- Configuring User Profiles (CLI)
- Limiting Access Protocols for a User Profile (CLI)
- Configuring User Accounts (CLI)
- Configuring RADIUS (CLI)
- RADIUS Overview (CLI)
- Activating RADIUS Authentication (CLI)
- Configuring the RADIUS Server Attributes (CLI)
- Viewing RADIUS Access Control and Server Attributes (CLI)
- Viewing RADIUS User Permissions and Connectivity (CLI)
- Configuring X.509 CSR Certificates and HTTPS (CLI)
- Generating a Certificate Signing Request (CSR) File (CLI)
- Downloading a Certificate (CLI)
- Enabling HTTPS (CLI)
- Configuring HTTPS Cipher Hardening (CLI)
- Blocking Telnet Access (CLI)
- Uploading the Security Log (CLI)
- Uploading the Configuration Log (CLI)
- Chapter 24: Alarm Management and Troubleshooting (CLI)
- Viewing Current Alarms (CLI)
- Viewing the Event Log (CLI)
- Editing Alarm Text and Severity (CLI)
- Displaying Alarm Information (CLI)
- Editing an Alarm Type (CLI)
- Setting Alarms to their Default Values (CLI)
- Configuring a Timeout for Trap Generation (CLI)
- Disabling Alarms and Events (CLI)
- Configuring Voltage Alarm Thresholds and Displaying Voltage Threshold PMs (CLI)
- Uploading Unit Info (CLI)
- Activating the Radio Logger (CLI)
- Performing Diagnostics (CLI)
- Performing Radio Loopback (CLI)
- Performing Ethernet Loopback (CLI)
- Performing TDM Diagnostics (CLI)
- Performing Loopback on E1/DS1s (CLI)
- Configuring Service OAM (SOAM) Fault Management (FM) (CLI)
- SOAM Overview (CLI)
- Configuring MDs (CLI)
Brand : Cambium Networks
Model : PTP 820E
Category : Network Equipment