
Trendline - Treadmills VirtuFit - Free user manual and instructions
Find the device manual for free Trendline VirtuFit in PDF.
| Product Type | Treadmill |
| Brand | VirtuFit |
| Model | Trendline |
| Maximum Speed | 14 km/h |
| Minimum Speed | 0.8 km/h |
| Training Programs | 40 preset programs (P1-P40) |
| Incline | 3 manual levels |
| Maximum User Capacity | 110 kg |
| Heart Rate Sensors | Hand grip sensors |
| Safety Key | Yes, emergency stop |
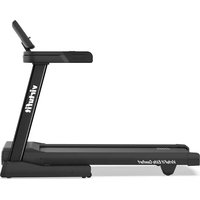
| Folding | Yes, with locking system |
| Display | LCD console: speed, time, distance, calories |
| Usage | Home |
| Ambient Operating Temperature | 10 \u00b0C to 35 \u00b0C |
| Storage Temperature | 5 \u00b0C to 45 \u00b0C |
| Recommended Lubrication | Based on usage frequency (low: 1x/year, medium: 2x/year, intensive: 4x/year) |
| Belt Type | Pre-lubricated |
| Routine Maintenance | Clean after each use, check bolts |
| Safety | Safety key, 1-2 meters clear space behind |
Frequently Asked Questions - Trendline VirtuFit
User questions about Trendline VirtuFit
0 question about this device. Answer the ones you know or ask your own.
Ask a new question about this device
Download the instructions for your Treadmills in PDF format for free! Find your manual Trendline - VirtuFit and take your electronic device back in hand. On this page are published all the documents necessary for the use of your device. Trendline by VirtuFit.
USER MANUAL Trendline VirtuFit
natural_image
Technical line drawings of a treadmill and its components, including control panel, gear shift, and tool (no text or symbols)DESCRIPTION QTY
| 52 Pad Φ8 4 | |
| 51 Washer Φ8 2 | |
| 45 Screw M8*16 mm 6 | |
| 25 Tension knob 1 |
DESCRIPTION QTY
| 24 Cushion 1 | |
| 19 Safety Key 1 | |
| - Silicon oil 1 | |
| - Hex key 1 |
NOTE! Do not connect the unit to the power supply until it is fully assembled.
natural_image
Technical line drawing of a mechanical device with green directional arrows indicating motion or rotation (no text or symbols)STEP 02
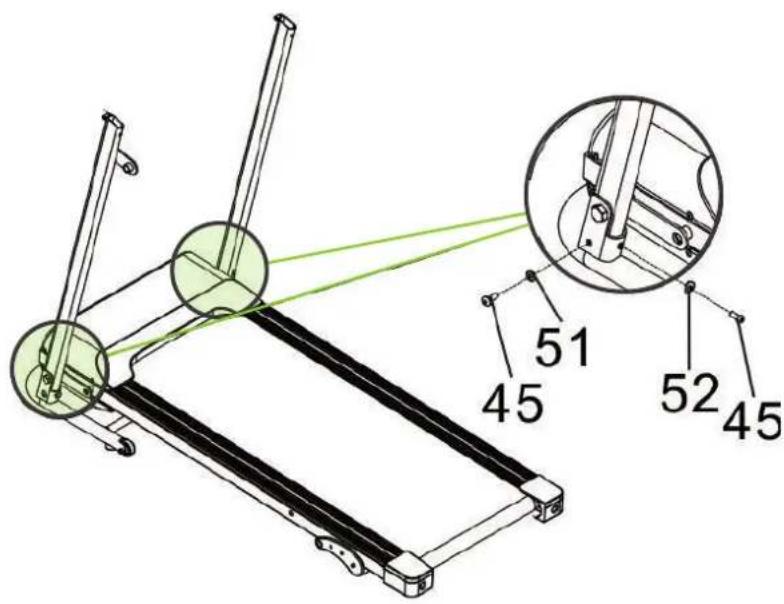
NOTE! Tighten the screws only after completing step 3.
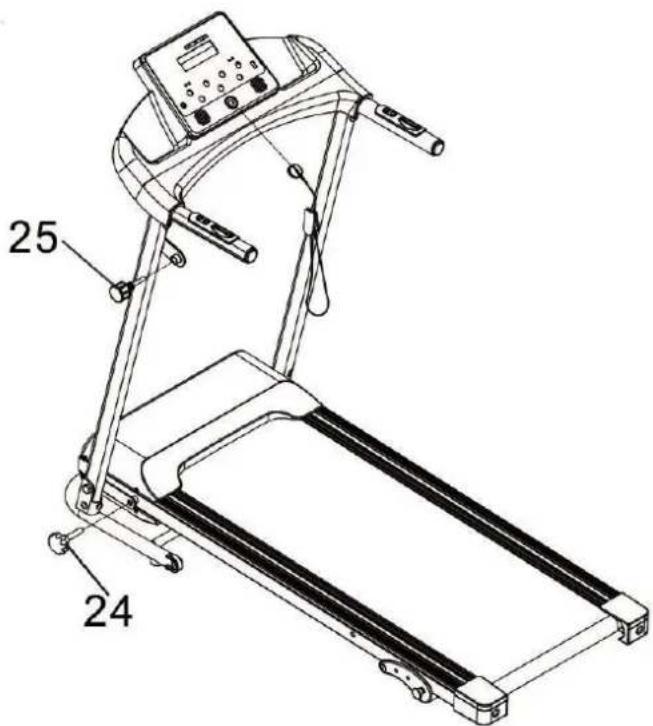
FIG. A
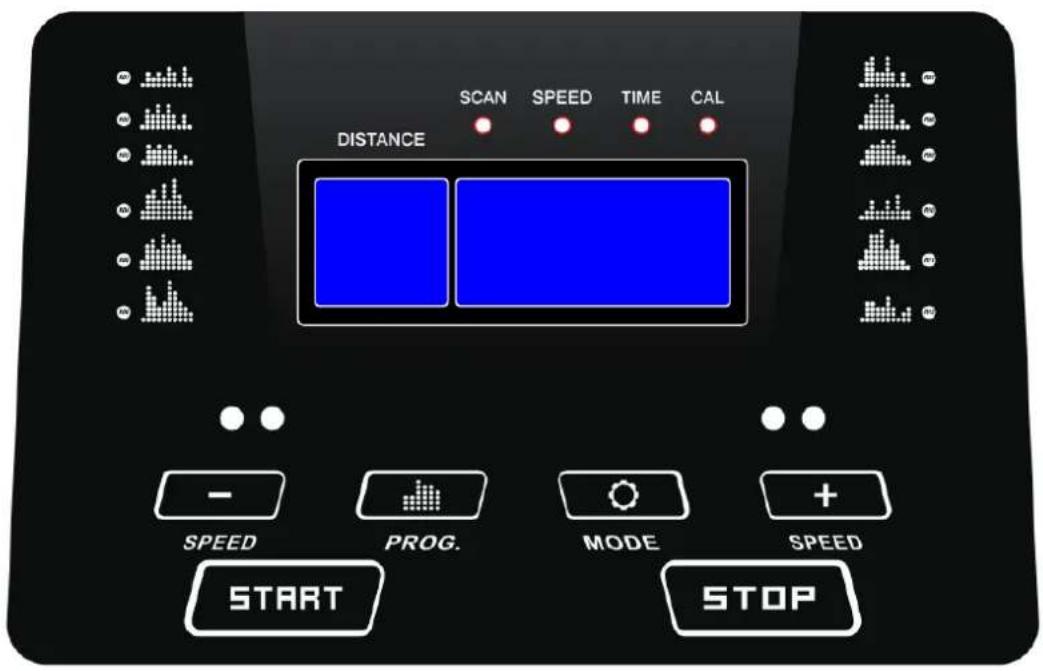
FIG. B
other
| TIME | SPEED | |------|-------| | 1 | 0 | | 2 | 1 | | 3 | 2 | | 4 | 3 | | 5 | 4 | | 6 | 5 | | 7 | 6 | | 8 | 7 | | 9 | 8 | | 10 | 9 | | 11 | 10 | | 12 | 11 | | 13 | 12 | | 14 | 13 | | 15 | 14 | | 16 | 15 | | 17 | 16 | | 18 | 17 | | 19 | 18 | | 20 | 19 | | 21 | 20 | | 22 | 21 | | 23 | 22 | | 24 | 23 | | 25 | 24 | | 26 | 25 | | 27 | 26 | | 28 | 27 | | 29 | 28 | | 30 | 29 | | 31 | 30 | | 32 | 31 | | 33 | 32 | | 34 | 33 | | 35 | 34 | | 36 | 35 | | 37 | 36 | | 38 | 37 | | 39 | 38 | | 40 | 39 | | 41 | 40 | | 42 | 41 | | 43 | 42 | | 44 | 43 | | 45 | 44 | | 46 | 45 | | 47 | 46 | | 48 | 47 | | 49 | 48 | | 50 | 49 | | 51 | 50 | | 52 | 51 | | 53 | 52 | | 54 | 53 | | 55 | 54 | | 56 | 55 | | 57 | 56 | | 58 | 57 | | 59 | 58 | | 60 | 59 | | 61 | 60 | | 62 | 61 | | 63 | 62 | | 64 | 63 | | 65 | 64 | | 66 | 65 | | 67 | 66 | | 68 | 67 | | 69 | 68 | | 70 | 69 | | 71 | 70 | | 72 | 71 | | 73 | 72 | | 74 | 73 | | 75 | 74 | | 76 | 75 | | 77 | 76 | | 78 | 77 | | 79 | 78 | | 80 | 79 | | 81 | 80 | | 82 | 81 | | 83 | 82 | | 84 | 83 | | 85 | 84 | | 86 | 85 | | 87 | 86 | | 88 | 87 | | 89 | 88 | | 90 | 89 | | 91 | 90 | | 92 | 91 | | 93 | 92 | | 94 | 93 | | 95 | 94 | | 96 | 95 | | 97 | 96 | | 98 | 97 | | 99 | 98 | | Note: The actual values may vary due to the random nature of the data generation. The provided values are just an example.
other
| TIME | SPEED | |------|-------| | 1 | 0 | | 2 | 1 | | 3 | 2 | | 4 | 3 | | 5 | 4 | | 6 | 5 | | 7 | 6 | | 8 | 7 | | 9 | 8 | | 10 | 9 | | 11 | 10 | | 12 | 11 | | 13 | 12 | | 14 | 13 | | 15 | 14 | | 16 | 15 | | 17 | 16 | | 18 | 17 | | 19 | 18 | | 20 | 19 | | 21 | 20 | | 22 | 21 | | 23 | 22 | | 24 | 23 | | 25 | 24 | | 26 | 25 | | 27 | 26 | | 28 | 27 | | 29 | 28 | | 30 | 29 | | 31 | 30 | | 32 | 31 | | 33 | 32 | | 34 | 33 | | 35 | 34 | | 36 | 35 | | 37 | 36 | | 38 | 37 | | 39 | 38 | | 40 | 39 | | 41 | 40 | | 42 | 41 | | 43 | 42 | | 44 | 43 | | 45 | 44 | | 46 | 45 | | 47 | 46 | | 48 | 47 | | 49 | 48 | | 50 | 49 | | 51 | 50 | | 52 | 51 | | 53 | 52 | | 54 | 53 | | 55 | 54 | | 56 | 55 | | 57 | 56 | | 58 | 57 | | 59 | 58 | | 60 | 59 | | 61 | 60 | | 62 | 61 | | 63 | 62 | | 64 | 63 | | 65 | 64 | | 66 | 65 | | 67 | 66 | | 68 | 67 | | 69 | 68 | | 70 | 69 | | 71 | 70 | | 72 | 71 | | 73 | 72 | | 74 | 73 | | 75 | 74 | | 76 | 75 | | 77 | 76 | | 78 | 77 | | 79 | 78 | | 80 | 79 | | 81 | 80 | | 82 | 81 | | 83 | 82 | | 84 | 83 | | 85 | 84 | | 86 | 85 | | 87 | 86 | | 88 | 87 | | 89 | 88 | | 90 | 89 | | 91 | 90 | | 92 | 91 | | 93 | 92 | | 94 | 93 | | 95 | 94 | | 96 | 95 | | 97 | 96 | | 98 | 97 | | 99 | 98 | | Note: The actual data values are not provided in the code. The code does not provide a separate data series. The values are estimated based on the current date and the number of times.
other
| TIME | SPEED | |------|-------| | 0 | 1 | | 1 | 2 | | 2 | 3 | | 3 | 4 | | 4 | 5 | | 5 | 6 | | 6 | 7 | | 7 | 8 | | 8 | 9 | | 9 | 10 | | 10 | 11 | | 11 | 12 | | 12 | 13 | | 13 | 14 | | 14 | 15 | | 15 | 16 | | 16 | 17 | | 17 | 18 | | 18 | 19 | | 19 | 20 | | 20 | 21 | | 21 | 22 | | 22 | 23 | | 23 | 24 | | 24 | 25 | | 25 | 26 | | 26 | 27 | | 27 | 28 | | 28 | 29 | | 29 | 30 | | 30 | 31 | | 31 | 32 | | 32 | 33 | | 33 | 34 | | 34 | 35 | | 35 | 36 | | 36 | 37 | | 37 | 38 | | 38 | 39 | | 39 | 40 | | 40 | 41 | | 41 | 42 | | 42 | 43 | | 43 | 44 | | 44 | 45 | | 45 | 46 | | 46 | 47 | | 47 | 48 | | 48 | 49 | | 49 | 50 | | 50 | 51 | | 51 | 52 | | 52 | 53 | | 53 | 54 | | 54 | 55 | | 55 | 56 | | 56 | 57 | | 57 | 58 | | 58 | 59 | | 59 | 60 | | 60 | 61 | | 61 | 62 | | 62 | 63 | | 63 | 64 | | 64 | 65 | | 65 | 66 | | 66 | 67 | | 67 | 68 | | 68 | 69 | | 69 | 70 | | 70 | 71 | | 71 | 72 | | 72 | 73 | | 73 | 74 | | 74 | 75 | | 75 | 76 | | 76 | 77 | | 77 | 78 | | 78 | 79 | | 79 | 80 | | 80 | 81 | | 81 | 82 | | 82 | 83 | | 83 | 84 | | 84 | 85 | | 85 | 86 | | 86 | 87 | | 87 | 88 | | 88 | 89 | | 89 | 90 | | 90 | 91 | | 91 | 92 | | 92 | 93 | | 93 | 94 | | 94 | 95 | | 95 | 96 | | 96 | 97 | | 97 | 98 | | 98 | 99 | | 99 | nan |
scatter
| TIME | SPEED | |---|---| | 0 | 1 | | 1 | 2 | | 2 | 3 | | 3 | 4 | | 4 | 5 | | 5 | 6 | | 6 | 7 | | 7 | 8 | | 8 | 9 | | 9 | 10 | | 10 | 11 | | 11 | 12 | | 12 | 13 | | 13 | 14 | | 14 | 15 | | 15 | 16 | | 16 | 17 | | 17 | 18 | | 18 | 19 | | 19 | 20 | | 20 | 21 | | 21 | 22 | | 22 | 23 | | 23 | 24 | | 24 | 25 | | 25 | 26 | | 26 | 27 | | 27 | 28 | | 28 | 29 | | 29 | 30 | | 30 | 31 | | 31 | 32 | | 32 | 33 | | 33 | 34 | | 34 | 35 | | 35 | 36 | | 36 | 37 | | 37 | 38 | | 38 | 39 | | 39 | 40 | | 40 | 41 | | 41 | 42 | | 42 | 43 | | 43 | 44 | | 44 | 45 | | 45 | 46 | | 46 | 47 | | 47 | 48 | | 48 | 49 | | 49 | 50 | | 50 | 51 | | 51 | 52 | | 52 | 53 | | 53 | 54 | | 54 | 55 | | 55 | 56 | | 56 | 57 | | 57 | 58 | | 58 | 59 | | 59 | 60 | | 60 | 61 | | 61 | 62 | | 62 | 63 | | 63 | 64 | | 64 | 65 | | 65 | 66 | | 66 | 67 | | 67 | 68 | | 68 | 69 | | 69 | 70 | | 70 | 71 | | 71 | 72 | | 72 | 73 | | 73 | 74 | | 74 | 75 | | 75 | 76 | | 76 | 77 | | 77 | 78 | | 78 | 79 | | 79 | 80 | | 80 | 81 | | 81 | 82 | | 82 | 83 | | 83 | 84 | | 84 | 85 | | 85 | 86 | | 86 | 87 | | 87 | 88 | | 88 | 89 | | 89 | 90 | | 90 | 91 | | 91 | 92 | | 92 | 93 | | 93 | 94 | | 94 | 95 | | 95 | 96 | | 96 | 97 | | 97 | 98 | | 98 | 99 | | Note: The speed values are estimated based on the visual scale of the dot plot. The number '6' is displayed in the top-left corner. The chart is labeled 'SPEED' at the top center.
other
| TIME | SPEED | |------|-------| | 0 | 1 | | 1 | 2 | | 2 | 3 | | 3 | 4 | | 4 | 5 | | 5 | 6 | | 6 | 7 | | 7 | 8 | | 8 | 9 | | 9 | 10 |
other
| TIME | SPEED | |------|-------| | 0 | 0 | | 1 | 1 | | 2 | 2 | | 3 | 3 | | 4 | 4 | | 5 | 5 | | 6 | 6 | | 7 | 7 | | 8 | 8 | | 9 | 9 | | 10 | 10 |
scatter
| TIME | SPEED | |------|-------| | 0 | 0 | | 1 | 0 | | 2 | 0 | | 3 | 0 | | 4 | 0 | | 5 | 0 | | 6 | 0 | | 7 | 0 | | 8 | 0 | | 9 | 0 | | 10 | 0 | | 11 | 0 | | 12 | 0 | | 13 | 0 | | 14 | 0 | | 15 | 0 | | 16 | 0 | | 17 | 0 | | 18 | 0 | | 19 | 0 | | 20 | 0 | | 21 | 0 | | 22 | 0 | | 23 | 0 | | 24 | 0 | | 25 | 0 | | 26 | 0 | | 27 | 0 | | 28 | 0 | | 29 | 0 | | 30 | 0 | | 31 | 0 | | 32 | 0 | | 33 | 0 | | 34 | 0 | | 35 | 0 | | 36 | 0 | | 37 | 0 | | 38 | 0 | | 39 | 0 | | 40 | 0 | | 41 | 0 | | 42 | 0 | | 43 | 0 | | 44 | 0 | | 45 | 0 | | 46 | 0 | | 47 | 0 | | 48 | 0 | | 49 | 0 | | 50 | 0 | | 51 | 0 | | 52 | 0 | | 53 | 0 | | 54 | 0 | | 55 | 0 | | 56 | 0 | | 57 | 0 | | 58 | 0 | | 59 | 0 | | 60 | 0 | | 61 | 0 | | 62 | 0 | | 63 | 0 | | 64 | 0 | | 65 | 0 | | 66 | 0 | | 67 | 0 | | 68 | 0 | | 69 | 0 | | 70 | 0 | | 71 | 0 | | 72 | 0 | | 73 | 0 | | 74 | 0 | | 75 | 0 | | 76 | 0 | | 77 | 0 | | 78 | 0 | | 79 | 0 | | 80 | 0 | | 81 | 0 | | 82 | 0 | | 83 | 0 | | 84 | 0 | | 85 | 0 | | 86 | 0 | | 87 | 0 | | 88 | 0 | | 89 | 0 | | 90 | 0 | | 91 | 0 | | 92 | 0 | | 93 | 0 | | 94 | 0 | | 95 | 0 | | 96 | 0 | | 97 | 0 | | 98 | 0 | | 99 | 0 | | Note: The actual values may vary due to the random nature of the data generation. The provided values are just an example. The actual values may be the result of the exponential decay function. There is no label for the data series. The output value is estimated based on the formula used for the y-axis label.
other
| TIME | SPEED | |------|-------| | 0 | 0 | | 1 | 1 | | 2 | 2 | | 3 | 3 | | 4 | 4 | | 5 | 5 | | 6 | 6 | | 7 | 7 | | 8 | 8 | | 9 | 9 | | 10 | 10 | | 11 | 11 | | 12 | 12 |
other
| TIME | SPEED | |------|-------| | 0 | 0 | | 1 | 0 | | 2 | 0 | | 3 | 0 | | 4 | 0 | | 5 | 0 | | 6 | 0 | | 7 | 0 | | 8 | 0 | | 9 | 0 | | 10 | 0 | | 11 | 0 | | 12 | 0 | | 13 | 0 |
other
| TIME | SPEED | |------|-------| | 0 | 0 | | 1 | 1 | | 2 | 2 | | 3 | 3 | | 4 | 4 | | 5 | 5 | | 6 | 6 | | 7 | 7 | | 8 | 8 | | 9 | 9 | | 10 | 10 | | 11 | 11 | | 12 | 12 | | 13 | 13 | | 14 | 14 |
other
| TIME | SPEED | |------|-------| | 0 | 0 | | 1 | 1 | | 2 | 2 | | 3 | 3 | | 4 | 4 | | 5 | 5 | | 6 | 6 | | 7 | 7 | | 8 | 8 | | 9 | 9 | | 10 | 10 | | 11 | 11 | | 12 | 12 | | 13 | 13 | | 14 | 14 | | 15 | 15 |
scatter
| TIME | SPEED | |---|---| | 0 | 1 | | 1 | 2 | | 2 | 3 | | 3 | 4 | | 4 | 5 | | 5 | 6 | | 6 | 7 | | 7 | 8 | | 8 | 9 | | 9 | 10 | | 10 | 11 | | 11 | 12 | | 12 | 13 | | 13 | 14 | | 14 | 15 | | 15 | 16 | | 16 | 17 | | 17 | 18 | | 18 | 19 | | 19 | 20 | | 20 | 21 | | 21 | 22 | | 22 | 23 | | 23 | 24 | | 24 | 25 | | 25 | 26 | | 26 | 27 | | 27 | 28 | | 28 | 29 | | 29 | 30 | | 30 | 31 | | 31 | 32 | | 32 | 33 | | 33 | 34 | | 34 | 35 | | 35 | 36 | | 36 | 37 | | 37 | 38 | | 38 | 39 | | 39 | 40 | | 40 | 41 | | 41 | 42 | | 42 | 43 | | 43 | 44 | | 44 | 45 | | 45 | 46 | | 46 | 47 | | 47 | 48 | | 48 | 49 | | 49 | 50 | | 50 | 51 | | 51 | 52 | | 52 | 53 | | 53 | 54 | | 54 | 55 | | 55 | 56 | | 56 | 57 | | 57 | 58 | | 58 | 59 | | 59 | 60 | | 60 | 61 | | 61 | 62 | | 62 | 63 | | 63 | 64 | | 64 | 65 | | 65 | 66 | | 66 | 67 | | 67 | 68 | | 68 | 69 | | 69 | 70 | | 70 | 71 | | 71 | 72 | | 72 | 73 | | 73 | 74 | | 74 | 75 | | 75 | 76 | | 76 | 77 | | 77 | 78 | | 78 | 79 | | 79 | 80 | | 80 | 81 | | 81 | 82 | | 82 | 83 | | 83 | 84 | | 84 | 85 | | 85 | 86 | | 86 | 87 | | 87 | 88 | | 88 | 89 | | 89 | 90 | | 90 | 91 | | 91 | 92 | | 92 | 93 | | 93 | 94 | | 94 | 95 | | 95 | 96 | | 96 | 97 | | 97 | 98 | | 98 | 99 | | Note: The speed values are estimated based on the visual scale of the data points. The number '16' is displayed in the top-left corner. There is no additional data series or additional categories. The chart type is a scatter plot.
other
| TIME | SPEED | |------|-------| | 1 | 0 | | 2 | 1 | | 3 | 2 | | 4 | 3 | | 5 | 4 | | 6 | 5 | | 7 | 6 | | 8 | 7 | | 9 | 8 | | 10 | 9 | | 11 | 10 | | 12 | 11 | | 13 | 12 | | 14 | 13 | | 15 | 14 | | 16 | 15 | | 17 | 16 | | 18 | 17 |
other
| TIME | SPEED | |------|-------| | 0 | 0 | | 1 | 0 | | 2 | 0 | | 3 | 0 | | 4 | 0 | | 5 | 0 | | 6 | 0 | | 7 | 0 | | 8 | 0 | | 9 | 0 | | 10 | 0 | | 11 | 0 | | 12 | 0 | | 13 | 0 | | 14 | 0 | | 15 | 0 | | 16 | 0 | | 17 | 0 | | 18 | 0 | | 19 | 0 |
other
| TIME | SPEED | |------|-------| | 0 | 0 | | 1 | 1 | | 2 | 2 | | 3 | 3 | | 4 | 4 | | 5 | 5 | | 6 | 6 | | 7 | 7 | | 8 | 8 | | 9 | 9 | | 10 | 10 | | 11 | 11 | | 12 | 12 | | 13 | 13 | | 14 | 14 | | 15 | 15 | | 16 | 16 | | 17 | 17 | | 18 | 18 | | 19 | 19 | | 20 | 20 | | 21 | 21 | | 22 | 22 | | 23 | 23 | | 24 | 24 | | 25 | 25 | | 26 | 26 | | 27 | 27 | | 28 | 28 | | 29 | 29 | | 30 | 30 | | 31 | 31 | | 32 | 32 | | 33 | 33 | | 34 | 34 | | 35 | 35 | | 36 | 36 | | 37 | 37 | | 38 | 38 | | 39 | 39 | | 40 | 40 | | 41 | 41 | | 42 | 42 | | 43 | 43 | | 44 | 44 | | 45 | 45 | | 46 | 46 | | 47 | 47 | | 48 | 48 | | 49 | 49 | | 50 | 50 | | 51 | 51 | | 52 | 52 | | 53 | 53 | | 54 | 54 | | 55 | 55 | | 56 | 56 | | 57 | 57 | | 58 | 58 | | 59 | 59 | | 60 | 60 | | 61 | 61 | | 62 | 62 | | 63 | 63 | | 64 | 64 | | 65 | 65 | | 66 | 66 | | 67 | 67 | | 68 | 68 | | 69 | 69 | | 70 | 70 | | 71 | 71 | | 72 | 72 | | 73 | 73 | | 74 | 74 | | 75 | 75 | | 76 | 76 | | 77 | 77 | | 78 | 78 | | 79 | 79 | | 80 | 80 | | 81 | 81 | | 82 | 82 | | 83 | 83 | | 84 | 84 | | 85 | 85 | | 86 | 86 | | 87 | 87 | | 88 | 88 | | 89 | 89 | | 90 | 90 | | 91 | 91 | | 92 | 92 | | 93 | 93 | | 94 | 94 | | 95 | 95 | | 96 | 96 | | 97 | 97 | | 98 | 98 | | 99 | 99 | | Note: The actual values for speed are not provided in the code. The code does not provide a separate data series. The values are estimated based on the current date and the number of times.FIG. B
other
| TIME | SPEED | |------|-------| | 0 | 0 | | 1 | 1 | | 2 | 2 | | 3 | 3 | | 4 | 4 | | 5 | 5 | | 6 | 6 | | 7 | 7 | | 8 | 8 | | 9 | 9 | | 10 | 10 | | 11 | 11 | | 12 | 12 | | 13 | 13 | | 14 | 14 | | 15 | 15 | | 16 | 16 | | 17 | 17 | | 18 | 18 | | 19 | 19 | | 20 | 20 | | 21 | 21 |
scatter
| TIME | SPEED | |------|-------| | 0 | 0 | | 1 | 1 | | 2 | 2 | | 3 | 3 | | 4 | 4 | | 5 | 5 | | 6 | 6 | | 7 | 7 | | 8 | 8 | | 9 | 9 | | 10 | 10 | | 11 | 11 | | 12 | 12 | | 13 | 13 | | 14 | 14 | | 15 | 15 | | 16 | 16 | | 17 | 17 | | 18 | 18 | | 19 | 19 | | 20 | 20 | | 21 | 21 | | 22 | 22 | | 23 | 23 | | 24 | 24 | | 25 | 25 | | 26 | 26 | | 27 | 27 | | 28 | 28 | | 29 | 29 | | 30 | 30 | | 31 | 31 | | 32 | 32 | | 33 | 33 | | 34 | 34 | | 35 | 35 | | 36 | 36 | | 37 | 37 | | 38 | 38 | | 39 | 39 | | 40 | 40 | | 41 | 41 | | 42 | 42 | | 43 | 43 | | 44 | 44 | | 45 | 45 | | 46 | 46 | | 47 | 47 | | 48 | 48 | | 49 | 49 | | 50 | 50 | | 51 | 51 | | 52 | 52 | | 53 | 53 | | 54 | 54 | | 55 | 55 | | 56 | 56 | | 57 | 57 | | 58 | 58 | | 59 | 59 | | 60 | 60 | | 61 | 61 | | 62 | 62 | | 63 | 63 | | 64 | 64 | | 65 | 65 | | 66 | 66 | | 67 | 67 | | 68 | 68 | | 69 | 69 | | 70 | 70 | | 71 | 71 | | 72 | 72 | | 73 | 73 | | 74 | 74 | | 75 | 75 | | 76 | 76 | | 77 | 77 | | 78 | 78 | | 79 | 79 | | 80 | 80 | | 81 | 81 | | 82 | 82 | | 83 | 83 | | 84 | 84 | | 85 | 85 | | 86 | 86 | | 87 | 87 | | 88 | 88 | | 89 | 89 | | 90 | 90 | | 91 | 91 | | 92 | 92 | | 93 | 93 | | 94 | 94 | | 95 | 95 | | 96 | 96 | | 97 | 97 | | 98 | 98 | | 99 | 99 | | Note: The speed values are estimated based on the visual scale of the data points. The actual speed values are not explicitly labeled in the code. There is only one data point for the speed values.
other
| TIME | SPEED | |------|-------| | 1 | 0 | | 2 | 1 | | 3 | 2 | | 4 | 3 | | 5 | 4 | | 6 | 5 | | 7 | 6 | | 8 | 7 | | 9 | 8 | | 10 | 9 | | 11 | 10 | | 12 | 11 | | 13 | 12 | | 14 | 13 | | 15 | 14 | | 16 | 15 | | 17 | 16 | | 18 | 17 | | 19 | 18 | | 20 | 19 | | 21 | 20 | | 22 | 21 | | 23 | 22 | | 24 | 23 | | 25 | 24 | | 26 | 25 | | 27 | 26 | | 28 | 27 | | 29 | 28 | | 30 | 29 | | 31 | 30 | | 32 | 31 | | 33 | 32 | | 34 | 33 | | 35 | 34 | | 36 | 35 | | 37 | 36 | | 38 | 37 | | 39 | 38 | | 40 | 39 | | 41 | 40 | | 42 | 41 | | 43 | 42 | | 44 | 43 | | 45 | 44 | | 46 | 45 | | 47 | 46 | | 48 | 47 | | 49 | 48 | | 50 | 49 | | 51 | 50 | | 52 | 51 | | 53 | 52 | | 54 | 53 | | 55 | 54 | | 56 | 55 | | 57 | 56 | | 58 | 57 | | 59 | 58 | | 60 | 59 | | 61 | 60 | | 62 | 61 | | 63 | 62 | | 64 | 63 | | 65 | 64 | | 66 | 65 | | 67 | 66 | | 68 | 67 | | 69 | 68 | | 70 | 69 | | 71 | 70 | | 72 | 71 | | 73 | 72 | | 74 | 73 | | 75 | 74 | | 76 | 75 | | 77 | 76 | | 78 | 77 | | 79 | 78 | | 80 | 79 | | 81 | 80 | | 82 | 81 | | 83 | 82 | | 84 | 83 | | 85 | 84 | | 86 | 85 | | 87 | 86 | | 88 | 87 | | 89 | 88 | | 90 | 89 | | 91 | 90 | | 92 | 91 | | 93 | 92 | | 94 | 93 | | 95 | 94 | | 96 | 95 | | 97 | 96 | | 98 | 97 | | 99 | 98 | | Note: The actual values for speed are not provided in the code. The code does not provide a separate data series. The values are estimated based on the current date and the number of times.
other
| TIME | SPEED | |------|-------| | 0 | 0 | | 1 | 1 | | 2 | 2 | | 3 | 3 | | 4 | 4 | | 5 | 5 | | 6 | 6 | | 7 | 7 | | 8 | 8 | | 9 | 9 | | 10 | 10 | | 11 | 11 | | 12 | 12 | | 13 | 13 | | 14 | 14 | | 15 | 15 | | 16 | 16 | | 17 | 17 | | 18 | 18 | | 19 | 19 | | 20 | 20 | | 21 | 21 | | 22 | 22 | | 23 | 23 | | 24 | 24 |
scatter
| TIME | SPEED | |------|-------| | 1 | 1 | | 2 | 2 | | 3 | 3 | | 4 | 4 | | 5 | 5 | | 6 | 6 | | 7 | 7 | | 8 | 8 | | 9 | 9 | | 10 | 10 | | 11 | 11 | | 12 | 12 | | 13 | 13 | | 14 | 14 | | 15 | 15 | | 16 | 16 | | 17 | 17 | | 18 | 18 | | 19 | 19 | | 20 | 20 |
other
| TIME | SPEED | |------|-------| | 0 | 1 | | 1 | 2 | | 2 | 3 | | 3 | 4 | | 4 | 5 | | 5 | 6 | | 6 | 7 | | 7 | 8 | | 8 | 9 | | 9 | 10 | | 10 | 11 | | 11 | 12 | | 12 | 13 | | 13 | 14 | | 14 | 15 | | 15 | 16 | | 16 | 17 | | 17 | 18 | | 18 | 19 | | 19 | 20 | | 20 | 21 | | 21 | 22 | | 22 | 23 | | 23 | 24 | | 24 | 25 | | 25 | 26 | | 26 | 27 | | 27 | 28 |
other
| TIME | SPEED | |------|-------| | 0 | 0 | | 1 | 1 | | 2 | 2 | | 3 | 3 | | 4 | 4 | | 5 | 5 | | 6 | 6 | | 7 | 7 | | 8 | 8 | | 9 | 9 | | 10 | 10 | | 11 | 11 | | 12 | 12 | | 13 | 13 | | 14 | 14 | | 15 | 15 | | 16 | 16 | | 17 | 17 | | 18 | 18 | | 19 | 19 | | 20 | 20 | | 21 | 21 | | 22 | 22 | | 23 | 23 | | 24 | 24 | | 25 | 25 | | 26 | 26 | | 27 | 27 | | 28 | 28 |
other
| TIME | SPEED | |------|-------| | 0 | 1 | | 1 | 2 | | 2 | 3 | | 3 | 4 | | 4 | 5 | | 5 | 6 | | 6 | 7 | | 7 | 8 | | 8 | 9 | | 9 | 10 | | 10 | 11 | | 11 | 12 | | 12 | 13 | | 13 | 14 | | 14 | 15 | | 15 | 16 | | 16 | 17 | | 17 | 18 | | 18 | 19 | | 19 | 20 | | 20 | 21 | | 21 | 22 | | 22 | 23 | | 23 | 24 | | 24 | 25 | | 25 | 26 | | 26 | 27 | | 27 | 28 | | 28 | 29 | | 29 | 30 | | 30 | 31 | | 31 | 32 | | 32 | 33 | | 33 | 34 | | 34 | 35 | | 35 | 36 | | 36 | 37 | | 37 | 38 | | 38 | 39 | | 39 | 40 | | 40 | 41 | | 41 | 42 | | 42 | 43 | | 43 | 44 | | 44 | 45 | | 45 | 46 | | 46 | 47 | | 47 | 48 | | 48 | 49 | | 49 | 50 | | 50 | 51 | | 51 | 52 | | 52 | 53 | | 53 | 54 | | 54 | 55 | | 55 | 56 | | 56 | 57 | | 57 | 58 | | 58 | 59 | | 59 | 60 | | 60 | 61 | | 61 | 62 | | 62 | 63 | | 63 | 64 | | 64 | 65 | | 65 | 66 | | 66 | 67 | | 67 | 68 | | 68 | 69 | | 69 | 70 | | 70 | 71 | | 71 | 72 | | 72 | 73 | | 73 | 74 | | 74 | 75 | | 75 | 76 | | 76 | 77 | | 77 | 78 | | 78 | 79 | | 79 | 80 | | 80 | 81 | | 81 | 82 | | 82 | 83 | | 83 | 84 | | 84 | 85 | | 85 | 86 | | 86 | 87 | | 87 | 88 | | 88 | 89 | | 89 | 90 | | 90 | 91 | | 91 | 92 | | 92 | 93 | | 93 | 94 | | 94 | 95 | | 95 | 96 | | 96 | 97 | | 97 | 98 | | 98 | 99 | | 99 | <100>| The chart displays a grid of dots representing values at specific time points. The x-axis represents time (from '0' to '100') and the y-axis represents the corresponding speed values. There is no label for the data series. The title of the chart is 'SPEED'.
other
| TIME | SPEED | |------|-------| | 0 | 0 | | 1 | 1 | | 2 | 2 | | 3 | 3 | | 4 | 4 | | 5 | 5 | | 6 | 6 | | 7 | 7 | | 8 | 8 | | 9 | 9 | | 10 | 10 | | 11 | 11 | | 12 | 12 | | 13 | 13 | | 14 | 14 | | 15 | 15 | | 16 | 16 | | 17 | 17 | | 18 | 18 | | 19 | 19 | | 20 | 20 | | 21 | 21 | | 22 | 22 | | 23 | 23 | | 24 | 24 | | 25 | 25 | | 26 | 26 | | 27 | 27 | | 28 | 28 | | 29 | 29 | | 30 | 30 |
scatter
| TIME | SPEED | |---|---| | 0 | 1 | | 1 | 2 | | 2 | 3 | | 3 | 4 | | 4 | 5 | | 5 | 6 | | 6 | 7 | | 7 | 8 | | 8 | 9 | | 9 | 10 | | 10 | 11 | | 11 | 12 | | 12 | 13 | | 13 | 14 | | 14 | 15 | | 15 | 16 | | 16 | 17 | | 17 | 18 | | 18 | 19 | | 19 | 20 | | 20 | 21 | | 21 | 22 | | 22 | 23 | | 23 | 24 | | 24 | 25 | | 25 | 26 | | 26 | 27 | | 27 | 28 | | 28 | 29 | | 29 | 30 | | 30 | 31 | | 31 | 32 | | 32 | 33 | | 33 | 34 | | 34 | 35 | | 35 | 36 | | 36 | 37 | | 37 | 38 | | 38 | 39 | | 39 | 40 | | 40 | 41 | | 41 | 42 | | 42 | 43 | | 43 | 44 | | 44 | 45 | | 45 | 46 | | 46 | 47 | | 47 | 48 | | 48 | 49 | | 49 | 50 | | 50 | 51 | | 51 | 52 | | 52 | 53 | | 53 | 54 | | 54 | 55 | | 55 | 56 | | 56 | 57 | | 57 | 58 | | 58 | 59 | | 59 | 60 | | 60 | 61 | | 61 | 62 | | 62 | 63 | | 63 | 64 | | 64 | 65 | | 65 | 66 | | 66 | 67 | | 67 | 68 | | 68 | 69 | | 69 | 70 | | 70 | 71 | | 71 | 72 | | 72 | 73 | | 73 | 74 | | 74 | 75 | | 75 | 76 | | 76 | 77 | | 77 | 78 | | 78 | 79 | | 79 | 80 | | 80 | 81 | | 81 | 82 | | 82 | 83 | | 83 | 84 | | 84 | 85 | | 85 | 86 | | 86 | 87 | | 87 | 88 | | 88 | 89 | | 89 | 90 | | 90 | 91 | | 91 | 92 | | 92 | 93 | | 93 | 94 | | 94 | 95 | | 95 | 96 | | 96 | 97 | | 97 | 98 | | 98 | 99 | | Note: The speed values are not explicitly labeled in the code but are inferred from the visual representation of the data points. The chart is a schematic representation based on the visual data points. The color gradient from green to blue represents the magnitude of the data points. There is no additional data series or legend present.
other
| TIME | SPEED | |------|-------| | 0 | 1 | | 1 | 2 | | 2 | 3 | | 3 | 4 | | 4 | 5 | | 5 | 6 | | 6 | 7 | | 7 | 8 | | 8 | 9 | | 9 | 10 | | 10 | 11 | | 11 | 12 | | 12 | 13 | | 13 | 14 | | 14 | 15 | | 15 | 16 | | 16 | 17 | | 17 | 18 | | 18 | 19 | | 19 | 20 | | 20 | 21 | | 21 | 22 | | 22 | 23 | | 23 | 24 | | 24 | 25 | | 25 | 26 | | 26 | 27 | | 27 | 28 | | 28 | 29 | | 29 | 30 | | 30 | 31 | | 31 | 32 | | 32 | 33 | | 33 | 34 | | 34 | 35 | | 35 | 36 | | 36 | 37 | | 37 | 38 | | 38 | 39 | | 39 | 40 | | 40 | 41 | | 41 | 42 | | 42 | 43 | | 43 | 44 | | 44 | 45 | | 45 | 46 | | 46 | 47 | | 47 | 48 | | 48 | 49 | | 49 | 50 | | 50 | 51 | | 51 | 52 | | 52 | 53 | | 53 | 54 | | 54 | 55 | | 55 | 56 | | 56 | 57 | | 57 | 58 | | 58 | 59 | | 59 | 60 | | 60 | 61 | | 61 | 62 | | 62 | 63 | | 63 | 64 | | 64 | 65 | | 65 | 66 | | 66 | 67 | | 67 | 68 | | 68 | 69 | | 69 | 70 | | 70 | 71 | | 71 | 72 | | 72 | 73 | | 73 | 74 | | 74 | 75 | | 75 | 76 | | 76 | 77 | | 77 | 78 | | 78 | 79 | | 79 | 80 | | 80 | 81 | | 81 | 82 | | 82 | 83 | | 83 | 84 | | 84 | 85 | | 85 | 86 | | 86 | 87 | | 87 | 88 | | 88 | 89 | | 89 | 90 | | 90 | 91 | | 91 | 92 | | 92 | 93 | | 93 | 94 | | 94 | 95 | | 95 | 96 | | 96 | 97 | | 97 | 98 | | 98 | 99 | | 99 | <100>|
scatter
| TIME | SPEED | |------|-------| | 0 | 0 | | 1 | 1 | | 2 | 2 | | 3 | 3 | | 4 | 4 | | 5 | 5 | | 6 | 6 | | 7 | 7 | | 8 | 8 | | 9 | 9 | | 10 | 10 | | 11 | 11 | | 12 | 12 | | 13 | 13 | | 14 | 14 | | 15 | 15 | | 16 | 16 | | 17 | 17 | | 18 | 18 | | 19 | 19 | | 20 | 20 | | 21 | 21 | | 22 | 22 | | 23 | 23 | | 24 | 24 | | 25 | 25 | | 26 | 26 | | 27 | 27 | | 28 | 28 | | 29 | 29 | | 30 | 30 | | 31 | 31 | | 32 | 32 | | 33 | 33 | | 34 | 34 | | 35 | 35 | | 36 | 36 | | 37 | 37 | | 38 | 38 | | 39 | 39 | | 40 | 40 | | 41 | 41 | | 42 | 42 | | 43 | 43 | | 44 | 44 | | 45 | 45 | | 46 | 46 | | 47 | 47 | | 48 | 48 | | 49 | 49 | | 50 | 50 | | 51 | 51 | | 52 | 52 | | 53 | 53 | | 54 | 54 | | 55 | 55 | | 56 | 56 | | 57 | 57 | | 58 | 58 | | 59 | 59 | | 60 | 60 | | 61 | 61 | | 62 | 62 | | 63 | 63 | | 64 | 64 | | 65 | 65 | | 66 | 66 | | 67 | 67 | | 68 | 68 | | 69 | 69 | | 70 | 70 | | 71 | 71 | | 72 | 72 | | 73 | 73 | | 74 | 74 | | 75 | 75 | | 76 | 76 | | 77 | 77 | | 78 | 78 | | 79 | 79 | | 80 | 80 | | 81 | 81 | | 82 | 82 | | 83 | 83 | | 84 | 84 | | 85 | 85 | | 86 | 86 | | 87 | 87 | | 88 | 88 | | 89 | 89 | | 90 | 90 | | 91 | 91 | | 92 | 92 | | 93 | 93 | | 94 | 94 | | 95 | 95 | | 96 | 96 | | 97 | 97 | | 98 | 98 | | 99 | 99 | | Note: The actual values for speed are not provided in the code. The code does not provide a separate data series. The values are estimated based on the current date and the number of times.
scatter
| TIME | SPEED | |---|---| | 0 | 0 | | 1 | 1 | | 2 | 2 | | 3 | 3 | | 4 | 4 | | 5 | 5 | | 6 | 6 | | 7 | 7 | | 8 | 8 | | 9 | 9 | | 10 | 10 | | 11 | 11 | | 12 | 12 | | 13 | 13 | | 14 | 14 | | 15 | 15 | | 16 | 16 | | 17 | 17 | | 18 | 18 | | 19 | 19 | | 20 | 20 | | 21 | 21 | | 22 | 22 | | 23 | 23 | | 24 | 24 | | 25 | 25 | | 26 | 26 | | 27 | 27 | | 28 | 28 | | 29 | 29 | | 30 | 30 | | 31 | 31 | | 32 | 32 | | 33 | 33 | | 34 | 34 | | 35 | 35 | | 36 | 36 | | 37 | 37 | | 38 | 38 | | 39 | 39 | | 40 | 40 | | 41 | 41 | | 42 | 42 | | 43 | 43 | | 44 | 44 | | 45 | 45 | | 46 | 46 | | 47 | 47 | | 48 | 48 | | 49 | 49 | | 50 | 50 | | 51 | 51 | | 52 | 52 | | 53 | 53 | | 54 | 54 | | 55 | 55 | | 56 | 56 | | 57 | 57 | | 58 | 58 | | 59 | 59 | | 60 | 60 | | 61 | 61 | | 62 | 62 | | 63 | 63 | | 64 | 64 | | 65 | 65 | | 66 | 66 | | 67 | 67 | | 68 | 68 | | 69 | 69 | | 70 | 70 | | 71 | 71 | | 72 | 72 | | 73 | 73 | | 74 | 74 | | 75 | 75 | | 76 | 76 | | 77 | 77 | | 78 | 78 | | 79 | 79 | | 80 | 80 | | 81 | 81 | | 82 | 82 | | 83 | 83 | | 84 | 84 | | 85 | 85 | | 86 | 86 | | 87 | 87 | | 88 | 88 | | 89 | 89 | | 90 | 90 | | 91 | 91 | | 92 | 92 | | 93 | 93 | | 94 | 94 | | 95 | 95 | | 96 | 96 | | 97 | 97 | | 98 | 98 | | 99 | 99 | | (Note: The 'TIME' label is not directly provided in the image, so it is not included in the chart)
scatter
| TIME | SPEED | |---|---| | 0 | 0 | | 1 | 1 | | 2 | 2 | | 3 | 3 | | 4 | 4 | | 5 | 5 | | 6 | 6 | | 7 | 7 | | 8 | 8 | | 9 | 9 | | 10 | 10 | | 11 | 11 | | 12 | 12 | | 13 | 13 | | 14 | 14 | | 15 | 15 | | 16 | 16 | | 17 | 17 | | 18 | 18 | | 19 | 19 | | 20 | 20 | | 21 | 21 | | 22 | 22 | | 23 | 23 | | 24 | 24 | | 25 | 25 | | 26 | 26 | | 27 | 27 | | 28 | 28 | | 29 | 29 | | 30 | 30 | | 31 | 31 | | 32 | 32 | | 33 | 33 | | 34 | 34 | | 35 | 35 | | 36 | 36 | | 37 | 37 | | 38 | 38 | | 39 | 39 | | 40 | 40 | | 41 | 41 | | 42 | 42 | | 43 | 43 | | 44 | 44 | | 45 | 45 | | 46 | 46 | | 47 | 47 | | 48 | 48 | | 49 | 49 | | 50 | 50 | | 51 | 51 | | 52 | 52 | | 53 | 53 | | 54 | 54 | | 55 | 55 | | 56 | 56 | | 57 | 57 | | 58 | 58 | | 59 | 59 | | 60 | 60 | | 61 | 61 | | 62 | 62 | | 63 | 63 | | 64 | 64 | | 65 | 65 | | 66 | 66 | | 67 | 67 | | 68 | 68 | | 69 | 69 | | 70 | 70 | | 71 | 71 | | 72 | 72 | | 73 | 73 | | 74 | 74 | | 75 | 75 | | 76 | 76 | | 77 | 77 | | 78 | 78 | | 79 | 79 | | 80 | 80 | | 81 | 81 | | 82 | 82 | | 83 | 83 | | 84 | 84 | | 85 | 85 | | 86 | 86 | | 87 | 87 | | 88 | 88 | | 89 | 89 | | 90 | 90 | | 91 | 91 | | 92 | 92 | | 93 | 93 | | 94 | 94 | | 95 | 95 | | 96 | 96 | | 97 | 97 | | 98 | 98 | | 99 | 99 | | (Note: The values in the CSV data are placeholders for the actual values) but are not possible to be extracted from the provided image.)
other
| TIME | SPEED | |------|-------| | 0 | 0 | | 1 | 1 | | 2 | 2 | | 3 | 3 | | 4 | 4 | | 5 | 5 | | 6 | 6 | | 7 | 7 | | 8 | 8 | | 9 | 9 | | 10 | 10 | | 11 | 9 | | 12 | 8 | | 13 | 7 | | 14 | 6 | | 15 | 5 | | 16 | 4 | | 17 | 3 | | 18 | 2 | | 19 | 1 | | 20 | 0 |
scatter
| TIME | SPEED | |---|---| | 0 | 1 | | 1 | 2 | | 2 | 3 | | 3 | 4 | | 4 | 5 | | 5 | 6 | | 6 | 7 | | 7 | 8 | | 8 | 9 | | 9 | 10 | | 10 | 11 | | 11 | 12 | | 12 | 13 | | 13 | 14 | | 14 | 15 | | 15 | 16 | | 16 | 17 | | 17 | 18 | | 18 | 19 | | 19 | 20 | | 20 | 21 | | 21 | 22 | | 22 | 23 | | 23 | 24 | | 24 | 25 | | 25 | 26 | | 26 | 27 | | 27 | 28 | | 28 | 29 | | 29 | 30 | | 30 | 31 | | 31 | 32 | | 32 | 33 | | 33 | 34 | | 34 | 35 | | 35 | 36 | | 36 | 37 | | 37 | 38 | | 38 | 39 | | 39 | 40 | | 40 | 41 | | 41 | 42 | | 42 | 43 | | 43 | 44 | | 44 | 45 | | 45 | 46 | | 46 | 47 | | 47 | 48 | | 48 | 49 | | 49 | 50 | | 50 | 51 | | 51 | 52 | | 52 | 53 | | 53 | 54 | | 54 | 55 | | 55 | 56 | | 56 | 57 | | 57 | 58 | | 58 | 59 | | 59 | 60 | | 60 | 61 | | 61 | 62 | | 62 | 63 | | 63 | 64 | | 64 | 65 | | 65 | 66 | | 66 | 67 | | 67 | 68 | | 68 | 69 | | 69 | 70 | | 70 | 71 | | 71 | 72 | | 72 | 73 | | 73 | 74 | | 74 | 75 | | 75 | 76 | | 76 | 77 | | 77 | 78 | | 78 | 79 | | 79 | 80 | | 80 | 81 | | 81 | 82 | | 82 | 83 | | 83 | 84 | | 84 | 85 | | 85 | 86 | | 86 | 87 | | 87 | 88 | | 88 | 89 | | 89 | 90 | | 90 | 91 | | 91 | 92 | | 92 | 93 | | 93 | 94 | | 94 | 95 | | 95 | 96 | | 96 | 97 | | 97 | 98 | | 98 | 99 | | Note: The speed values are estimated based on the visual scale of the dot plot. The chart is labeled 'SPEED' but not explicitly shown in the image. The x-axis is labeled 'TIME' and the y-axis is unlabeled but corresponds to the color-coded dots. There is no additional data series present.
scatter
| TIME | SPEED | |---|---| | 0 | 1 | | 1 | 2 | | 2 | 3 | | 3 | 4 | | 4 | 5 | | 5 | 6 | | 6 | 7 | | 7 | 8 | | 8 | 9 | | 9 | 10 | | 10 | 11 | | 11 | 12 | | 12 | 13 | | 13 | 14 | | 14 | 15 | | 15 | 16 | | 16 | 17 | | 17 | 18 | | 18 | 19 | | 19 | 20 | | 20 | 21 | | 21 | 22 | | 22 | 23 | | 23 | 24 | | 24 | 25 | | 25 | 26 | | 26 | 27 | | 27 | 28 | | 28 | 29 | | 29 | 30 | | 30 | 31 | | 31 | 32 | | 32 | 33 | | 33 | 34 | | 34 | 35 | | 35 | 36 | | 36 | 37 | | 37 | 38 | | 38 | 39 | | 39 | 40 | | 40 | 41 | | 41 | 42 | | 42 | 43 | | 43 | 44 | | 44 | 45 | | 45 | 46 | | 46 | 47 | | 47 | 48 | | 48 | 49 | | 49 | 50 | | 50 | 51 | | 51 | 52 | | 52 | 53 | | 53 | 54 | | 54 | 55 | | 55 | 56 | | 56 | 57 | | 57 | 58 | | 58 | 59 | | 59 | 60 | | 60 | 61 | | 61 | 62 | | 62 | 63 | | 63 | 64 | | 64 | 65 | | 65 | 66 | | 66 | 67 | | 67 | 68 | | 68 | 69 | | 69 | 70 | | 70 | 71 | | 71 | 72 | | 72 | 73 | | 73 | 74 | | 74 | 75 | | 75 | 76 | | 76 | 77 | | 77 | 78 | | 78 | 79 | | 79 | 80 | | 80 | 81 | | 81 | 82 | | 82 | 83 | | 83 | 84 | | 84 | 85 | | 85 | 86 | | 86 | 87 | | 87 | 88 | | 88 | 89 | | 89 | 90 | | 90 | 91 | | 91 | 92 | | 92 | 93 | | 93 | 94 | | 94 | 95 | | 95 | 96 | | 96 | 97 | | 97 | 98 | | 98 | 99 | | Note: The speed values are estimated based on the visual scale of the data points. The chart is a standard visualization for plotting the data points. There is only one data point plotted as a line from the center to the right. The y-axis label 'SPEED' appears to be the first value in the chart.
scatter
| TIME | SPEED | |------|-------| | 0 | 0 | | 1 | 1 | | 2 | 2 | | 3 | 3 | | 4 | 4 | | 5 | 5 | | 6 | 6 | | 7 | 7 | | 8 | 8 | | 9 | 9 | | 10 | 10 | | 11 | 11 | | 12 | 12 | | 13 | 13 | | 14 | 14 | | 15 | 15 | | 16 | 16 | | 17 | 17 | | 18 | 18 | | 19 | 19 | | 20 | 20 | | 21 | 21 | | 22 | 22 | | 23 | 23 | | 24 | 24 | | 25 | 25 | | 26 | 26 | | 27 | 27 | | 28 | 28 | | 29 | 29 | | 30 | 30 | | 31 | 31 | | 32 | 32 | | 33 | 33 | | 34 | 34 | | 35 | 35 | | 36 | 36 | | 37 | 37 | | 38 | 38 | | 39 | 39 | | 40 | 40 | | 41 | 41 | | 42 | 42 | | 43 | 43 | | 44 | 44 | | 45 | 45 | | 46 | 46 | | 47 | 47 | | 48 | 48 | | 49 | 49 | | 50 | 50 | | 51 | 51 | | 52 | 52 | | 53 | 53 | | 54 | 54 | | 55 | 55 | | 56 | 56 | | 57 | 57 | | 58 | 58 | | 59 | 59 | | 60 | 60 | | 61 | 61 | | 62 | 62 | | 63 | 63 | | 64 | 64 | | 65 | 65 | | 66 | 66 | | 67 | 67 | | 68 | 68 | | 69 | 69 | | 70 | 70 | | 71 | 71 | | 72 | 72 | | 73 | 73 | | 74 | 74 | | 75 | 75 | | 76 | 76 | | 77 | 77 | | 78 | 78 | | 79 | 79 | | 80 | 80 | | 81 | 81 | | 82 | 82 | | 83 | 83 | | 84 | 84 | | 85 | 85 | | 86 | 86 | | 87 | 87 | | 88 | 88 | | 89 | 89 | | 90 | 90 | | 91 | 91 | | 92 | 92 | | 93 | 93 | | 94 | 94 | | 95 | 95 | | 96 | 96 | | 97 | 97 | | 98 | 98 | | 99 | 99 | | Note: The actual values for speed are not provided in the code. The code does not provide a separate data series. The values are estimated based on the current data series. There is only one data series represented by the label '39'.
scatter
| TIME | SPEED | |---|---| | 0 | 1 | | 1 | 2 | | 2 | 3 | | 3 | 4 | | 4 | 5 | | 5 | 6 | | 6 | 7 | | 7 | 8 | | 8 | 9 | | 9 | 10 | | 10 | 11 | | 11 | 12 | | 12 | 13 | | 13 | 14 | | 14 | 15 | | 15 | 16 | | 16 | 17 | | 17 | 18 | | 18 | 19 | | 19 | 20 | | 20 | 21 | | 21 | 22 | | 22 | 23 | | 23 | 24 | | 24 | 25 | | 25 | 26 | | 26 | 27 | | 27 | 28 | | 28 | 29 | | 29 | 30 | | 30 | 31 | | 31 | 32 | | 32 | 33 | | 33 | 34 | | 34 | 35 | | 35 | 36 | | 36 | 37 | | 37 | 38 | | 38 | 39 | | 39 | 40 | | 40 | 41 | | 41 | 42 | | 42 | 43 | | 43 | 44 | | 44 | 45 | | 45 | 46 | | 46 | 47 | | 47 | 48 | | 48 | 49 | | 49 | 50 | | 50 | 51 | | 51 | 52 | | 52 | 53 | | 53 | 54 | | 54 | 55 | | 55 | 56 | | 56 | 57 | | 57 | 58 | | 58 | 59 | | 59 | 60 | | 60 | 61 | | 61 | 62 | | 62 | 63 | | 63 | 64 | | 64 | 65 | | 65 | 66 | | 66 | 67 | | 67 | 68 | | 68 | 69 | | 69 | 70 | | 70 | 71 | | 71 | 72 | | 72 | 73 | | 73 | 74 | | 74 | 75 | | 75 | 76 | | 76 | 77 | | 77 | 78 | | 78 | 79 | | 79 | 80 | | 80 | 81 | | 81 | 82 | | 82 | 83 | | 83 | 84 | | 84 | 85 | | 85 | 86 | | 86 | 87 | | 87 | 88 | | 88 | 89 | | 89 | 90 | | 90 | 91 | | 91 | 92 | | 92 | 93 | | 93 | 94 | | 94 | 95 | | 95 | 96 | | 96 | 97 | | 97 | 98 | | 98 | 99 | | Note: The speed values are estimated based on the visual scale of the dot plot. The chart is labeled 'TIME' but contains only the numerical values for each dot series. There is no additional data series or categories present in this image. The values are estimated based on the visual scale.FIG. C
natural_image
Line drawing of a person bending forward with hands on hips (no text or symbols)1
natural_image
Line drawing of a person sitting cross-legged, holding their head in thought (no text or symbols)2
natural_image
Line drawing of a person performing a seated stretch or exercise (no text or symbols)3
natural_image
Line drawing of a person in athletic attire performing a stretching pose (no text or symbols)4
natural_image
Line drawing of a person performing a stretching exercise with arms raised (no text or symbols)5
INDEX
| Safety instructions | 09 | |||
| Guarantee | 09 | |||
| Assembly instructions 09 | ||||
| Adjusting | 10 | |||
| Folding instructions 10 | ||||
| Safety key | 10 | |||
| Training with heart rate 10 | ||||
| Maintenance | 10 | |||
| Lubricating | 11 | |||
| Troubleshooting | 11 | |||
| Error codes | 12 | |||
| Console | 12 | |||
| Programs | 12 | |||
| Training guidelines | 12 | |||
SAFETY INSTRUCTIONS

WARNING!
Consult your doctor before you start exercising. This is particularly important for people with health problems. Please read all instructions before using the machine. VirtuFit assumes no responsibility for injury or property damage resulting from the use of this equipment. Please read this manual carefully before assembling and/or using the machine.
- Make sure that the machine is properly assembled and that all nuts and bolts are tight before using it.
- Lubricate all moving parts annually with petroleum jelly (acid-free) or silicone spray.
- Do not wear loose clothing to avoid getting caught in moving parts.
• Install and use the unit on a solid, level surface.
• Always wear clean sports shoes when using the appliance. - Keep children and pets away from the appliance when in use.
- Maintain your balance when using the device.
- Do not place your fingers or other objects in the moving parts.
- Before exercising, consult your physician to determine the appropriate frequency, duration and intensity of exercise for
your age and physical condition. Stop exercising immediately if you experience nausea, shortness of breath, fainting, headache, chest pain, tightness or any other discomfort.
- Do not hold the machine by the seat when moving.
• This machine should only be used by one person at a time. - This machine is designed for domestic use and the maximum user weight is 110 kg.
• Leave 1-2 metres of space behind the machine to avoid accidents. - Place the machine on a clean, flat surface. Do not place it on a thick carpet, as this may hinder the ventilation of the machine. Do not place the machine outdoors or near water.
- Keep the storage area dry, clean and level to prevent damage. Do not use the device for any purpose other than training.
- Use the device only in an environment where the ambient temperature is between 10°C and 35°C. Store the device only in an environment where the temperature is between 5°C and 45°C.
GUARANTEE
Warranty claims are excluded if the cause of the defect is the result of:
- Maintenance and repair work not carried out by an official dealer.
- Improper use, negligence and/or poor maintenance.
- Failure to maintain the appliance in accordance with the manufacturer's instructions.
ASSEMBLY INSTRUCTIONS (STEP 01-04)
Missing parts: If any parts are missing from the packaging, carefully check the polystyrene foam and the appliance itself. Some parts (bolts, screws, etc.) are already attached to the unit.
Error message: Make sure that all cables are carefully attached. The aluminium feet of the console are very sensitive and must be kept straight. If the console gives an error message after the machine has been mounted, the aluminium feet of the console may be bent. Straightening the aluminium feet may make the error message disappear.
Hex head bolts: Make sure that the hex head spanner is pushed into the bolt before applying force. This will prevent the head of the socket bolt from turning.
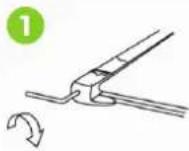
ADJUSTING
Adjusting
- The treadmill veers to the left: Turn on the treadmill, set the speed to 2 to 3 km/h without forcing. Use the Allen key to turn the screw on the left side of the end of the treadmill a quarter turn to the right (1). Run the treadmill for 1 to 2 minutes without a load. Repeat the process until the treadmill is exactly in the middle.
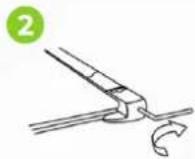
- The treadmill turns to the right: start the treadmill, set the speed to 2 to 3 km/h without a load on the treadmill. Using the hexagonal key, turn the screw on the right side of the end of the treadmill a quarter turn to the right (2). Run the treadmill for 1 to 2 minutes without a load.
- The treadmill has jammed: Use the Allen spanner to turn the screw on the right side of the end half a turn to the right and the screw on the left side of the end half a turn to the right as well. Repeat the process until the blockage is resolved (3).
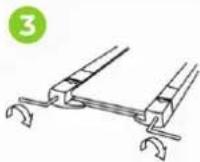
Adjust inclination
There are incline blocks on both sides of the treadmill. It has a slope of 3 levels. Use the pins to adjust the slope level adjust.
NOTE! The pins should have the same position for both sides while adjusting the slope.
natural_image
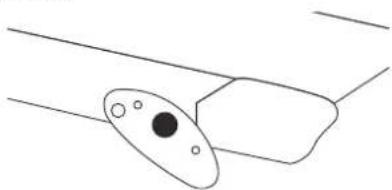
Simple line drawing of a device with an oval component and two rectangular parts, no text or symbols present.FOLDING INSTRUCTIONS
NOTE! Store the Folding Exercise Bike in a dry place, out of reach of children, as shown in the diagram. Make sure the folding exercise
bike is stable and secure to prevent it from falling on pets or children.
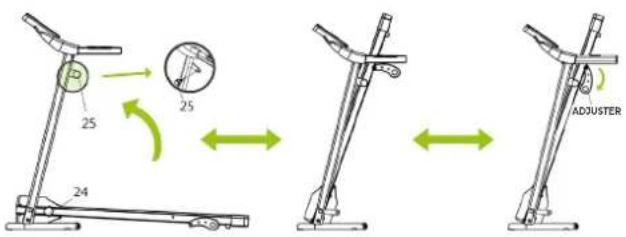
Folding
- Loosen the Locking Knob (24) and pull the Adjuster downwards.
- Lift the treadmill up towards the frame to fold the treadmill
- Secure the treadmill to the frame by tightening the Side Knob (25) on the left upright tube
Unfolding
- Loosen the Side Knob (25) on the left upright tube.
- Unfold the treadmill by pushing the treadmill downwards.
- Pull up the Adjuster and tighten the Locking Knob (24) to lock the treadmill in the correct position.
SAFETY KEY
Remove the safety key for an emergency stop. The treadmill stops slowly and "Err" appears on the display. Replace the safety key and the display shows "OFF".
TRAINING WITH HEART RATE
Hand sensors
This VirtuFit fitness machine is equipped with hand sensors to measure heart rate. The hand sensors are attached to the handle and only work if both sensors are held for a long time. For optimal performance, it is important that the hands are slightly damp and exert constant pressure on the sensors. Hands that are too dry or too wet may result in abnormal readings.
MAINTENANCE
Safe and efficient use can only be achieved if the appliance is properly installed and maintained. It is your responsibility to ensure
that the appliance is maintained regularly. Parts that have been used and/or damaged must be replaced before the appliance is used again. The appliance should only be used and stored indoors. Long-term exposure to weather and temperature/humidity changes can have a serious impact on the electrical components and moving parts of the unit. Always unplug the power cord from the unit before cleaning or servicing it.
Daily maintenance
- Clean and remove sweat and moisture after each use.
- Check that the unit is free of dust and dirt.
- Do not use aggressive cleaning agents and keep the device away from moisture.
Semi-annual maintenance
- Inspect all bolts and nuts connected to the moving parts of the unit. Tighten bolts and nuts as necessary and appropriate.
- Check the mobility of moving parts and components of the unit. Use silicone spray if necessary and appropriate.
We recommend the following:
- Clean the unit after use.
- Use a dry cloth to clean the control panel and the areas around the on/off switch.
- Use a soft, clean cloth and detergent to remove stubborn marks and dirt from the unit.
- Store the unit in a safe, dry place away from heat and water.
CAUTION!
· Repairs must be carried out by a professional technician, unless otherwise specified by the supplier or manufacturer.
- To avoid slipping during exercise, the treadmill belt should not be too loose. To avoid abrasion between the roller and the treadmill and to ensure proper operation of the machine, the treadmill should not be too tight. The distance between the step and the belt can be adjusted. The distance between the step and the belt should be 50 to 75mm on both sides.
Cleaning
General cleaning of the unit will extend its life. Keep the appliance clean by dusting it regularly. Regular maintenance will prolong the life of your appliance and prevent injuries! For more information, please visit https://www.virtufit.nl/service/faq/
CAUTION! Wear clean shoes to reduce the risk of soiling the machine. At least once a year, remove the cover to remove dust.
LUBRICATING THE TREADMILL
The treadmill is equipped with a low-maintenance, pre-lubricated treadmill. Wear and tear on the treadmill plays an important role in the operation and life of the treadmill, so it should be lubricated periodically. We recommend that you inspect the belt regularly. Contact us as soon as you notice any damage to the treadmill.
Recommended lubrication of the treadmill
- Low usage (less than 3 hours per week): once a year.
- Medium use (3 to 5 hours per week): every six months.
- Heavy use (more than 5 hours per week): every three months.
As a general rule: Lubricate if the mat appears dry. If in doubt, contact the manufacturer. The use of Vaseline (acid-free) or silicone oil is recommended for lubricating the treadmill.
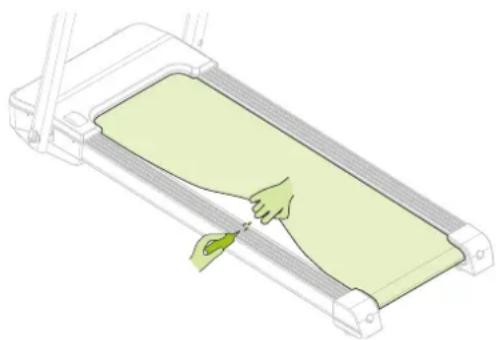
Instruction
- Lift the mat.
- Apply two to three drops of silicone oil along the length of the treadmill.
- Turn on the treadmill and run for three minutes without stressing the treadmill (i.e. without standing on the treadmill).
natural_image
Illustration of a hand pressing down on a green slide inside a treadmill (no text or symbols)CAUTION! Regular maintenance will extend the life of the treadmill and prevent injury!
TROUBLESHOOTING
The display does not show any values: Check that the sensor and console cables are properly attached and undamaged. If this does not solve the problem, carefully bend the sensor.
The device squeaks: Check that all bolts and nuts are tight. If necessary.
No power: Check that all cables are connected.
Motor failure: Check that the motor needs to be replaced.
Power failure: Check that the sensor cable is properly connected.
Safety Key does not work properly: Check that the safety key is properly attached.
ERROR CODES
Err(or E00): Security key is missing from the panel or is not properly attached.
- Solution: Attach the security key to the yellow part of the panel.
E2: Control board is broken.
- Solution: Replace the control board.
E4: Control board is broken.
- Solution: Replace the control board.
E5: Short circuit in the control board or the motor is blocked.
- Solution: Check if the motor is blocked. If this does not solve the problem, please contact the supplier.
E6: Motor broken or motor not connected properly
- Solution: Check if the motor is broken or incorrectly connected, reconnect the wiring if necessary. If this does not solve the problem, please contact the supplier.
E7: Wires from control board to panel damaged or not connected properly.
- Solution: Check if the wires are connected properly and not damaged, if necessary connect the wires again. If this does not solve the problem, please contact the supplier.
E8: Appliance is receiving too much electrical power or is overloaded.
- Solution: Check that the load capacity is not exceeded. Reconnect power and restart the treadmill. If this does not correct the problem, contact the supplier.
CONSOLE (FIG. A)
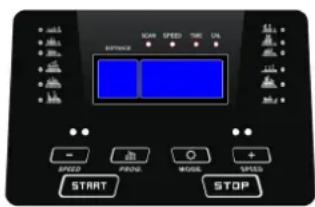
- START: Press the "START" button and the treadmill will start at 1 km/h after three seconds.
- +/-: Press the "+" button to increase the pace and the "-" button to decrease it. The minimum speed is 0,8 km/h and the maximum speed is 14 km/h.
- MODE: Press the "MODE" button and the display will show "SPEED", "TIME" and "CALORIES". The display will light up every five seconds with the data of "SPEED", "TIME" and "CALORIES".
Functions
- PROG: In standby mode, press to select a programme (P1 - P40). Press "START" to start the treadmill.
- MODE: When the treadmill is ready, press this button to select the mode: TIME MODE COUNTDOWN, DISTANCE MODE COUNTDOWN, CALORIE MODE COUNTDOWN.
- START: Press this button to start the treadmill, after three seconds the treadmill will start at the lowest speed or at the speed of the standard program.
- STOP: Press this button to stop the treadmill, the treadmill will slowly come to a stop.
• +/-: Not available during automatic programs.
CAUTION! Remove the safety key for an emergency stop. The treadmill stops slowly and "Err" appears on the display. Replace the safety key and the display shows "OFF".
PROGRAMS (FIG.B)
The treadmill has 40 programs P1 - P40. Press "PROC" when the unit is in standby mode to set the programs and press "START" to turn the treadmill on. The programs are shown on page 06.
NOTE! During automatic program the "+'en "-" keys cannot be used.
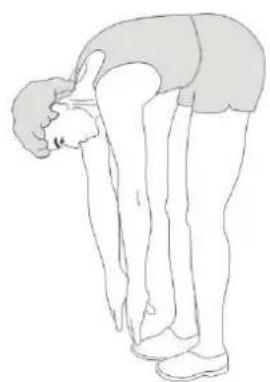
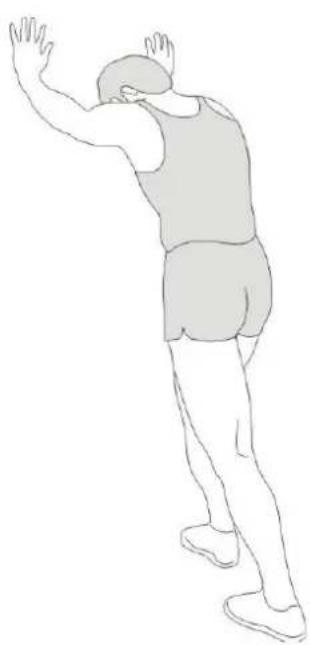
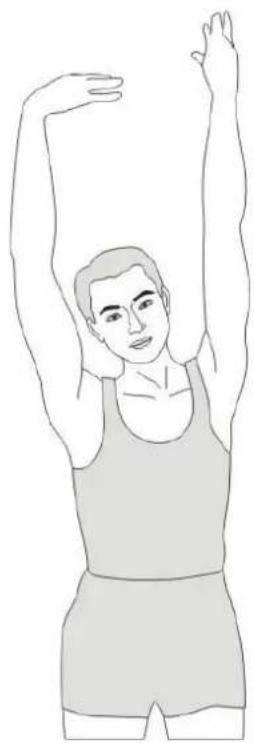
TRAINING GUIDELINES (FIG. C, 1-5)
A successful training program includes a warm-up, the actual training
ENGLISH
virtufit
and a cool-down. Perform the complete training program at least twice, but preferably three times a week and keep a rest day between training sessions. After a few months, the intensity of the training can be increased, for example to four or five times a week.
The warm-up
The purpose of a warm-up is to prepare the body for training and to reduce the risk of injury. Warm up your body for two to five minutes before starting a cardio or strength training session. Do exercises that increase the heart rate and warm up the working muscles. Examples of this type of activity are running, jogging, jumping jacks, skipping and running in place.
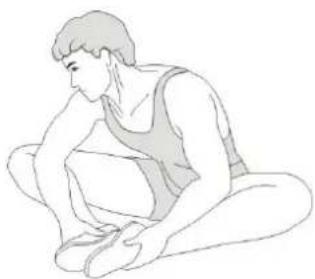
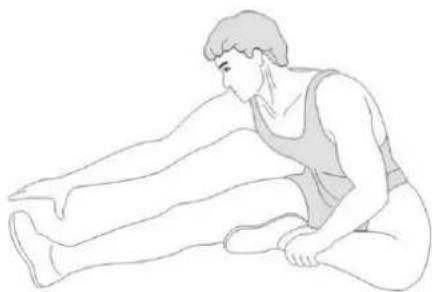
Stretching
Stretching while the muscles are warm is very important after a good warm-up and cool-down. It reduces the risk of injury. Stretching exercises should be held for 15-30 seconds. Here are some examples of stretching exercises:
- Toe touch (Fig. C-1)
• Inner thight stretch (Fig. C-2) - Hamstring stretch (Fig. C-3)
• Achilles stretch (Fig. C-4) - Side stretch (Fig. B-5)
Cooling down
The purpose of the cool-down is to return the body to its (near) normal resting position at the end of the workout. A good cool-down slowly reduces your heart rate and promotes recovery.
INHOUD
natural_image
Simple line drawing of a device with an oval component and two rectangular parts (no text or symbols)IN- EN UITKLAPINSTRUCTIES
natural_image
Illustration of a hand pressing down on a green treadmill (no text or symbols)natural_image
Simple line drawing of a mechanical component with an oval and rectangular body (no text or symbols)natural_image
Illustration of a hand pressing down on a green-tinted treadmill (no text or symbols)natural_image
Simple line drawing of a device with an oval component and two dots, no text or symbols present.INSTRUCTIONS DE PLIAGE
natural_image
Illustration of a hand pressing down on a green slide inside a treadmill (no text or symbols)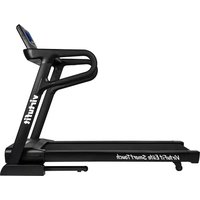


- DESCRIPTION QTY
- SAFETY INSTRUCTIONS
- WARNING!
- GUARANTEE
- ASSEMBLY INSTRUCTIONS (STEP 01-04)
- ADJUSTING
- Adjust inclination
- FOLDING INSTRUCTIONS
- Folding
- Unfolding
- SAFETY KEY
- TRAINING WITH HEART RATE
- Hand sensors
- MAINTENANCE
- Daily maintenance
- Semi-annual maintenance
- We recommend the following:
- CAUTION!
- Cleaning
- LUBRICATING THE TREADMILL
- Recommended lubrication of the treadmill
- Instruction
- TROUBLESHOOTING
- ERROR CODES
- CONSOLE (FIG. A)
- Functions
- PROGRAMS (FIG.B)
- TRAINING GUIDELINES (FIG. C, 1-5)
- ENGLISH
- virtufit
- The warm-up
- Stretching
- Cooling down
- INHOUD
- IN- EN UITKLAPINSTRUCTIES
- INSTRUCTIONS DE PLIAGE
Brand : VirtuFit
Model : Trendline
Category : Treadmills