
IWORK 08 - Suite bureautique APPLE - Notice d'utilisation et mode d'emploi gratuit
Retrouvez gratuitement la notice de l'appareil IWORK 08 APPLE au format PDF.

| Type de produit | Suite bureautique |
| Version | iWork '08 |
| Applications incluses | Pages '08, Numbers '08, Keynote '08 |
| Système d'exploitation requis | Mac OS X 10.4.11 ou ultérieur |
| Mémoire vive minimale | 512 Mo |
| Espace disque requis | 1,5 Go |
| Processeur | Intel, PowerPC G5 ou G4 (867 MHz ou plus) |
| Fonctions principales | Traitement de texte, tableur, présentation |
| Modèles fournis | Plus de 140 modèles pour Pages, Numbers et Keynote |
| Formats d'exportation | PDF, Word, RTF, Texte brut, QuickTime |
| Outils de révision | Suivi des modifications, commentaires |
| Formules et fonctions | Plus de 150 fonctions intégrées, éditeur de formules |
| Graphiques | Graphiques 2D et 3D, diagrammes |
| Animations | Transitions, builds d'objets, Smart Builds |
| Gestion des images | Masquage, contour instantané, ajustement d'image |
| Outils de recherche | Dictionnaire, thésaurus, recherche Google/Wikipedia |
| Langues disponibles | Multilingue (français inclus) |
| Mise à jour | Via Apple Software Update |
| Informations générales | Suite intégrée à l'environnement Mac |
FOIRE AUX QUESTIONS - IWORK 08 APPLE
Questions des utilisateurs sur IWORK 08 APPLE
0 question sur cet appareil. Repondez a celles que vous connaissez ou posez la votre.
Poser une nouvelle question sur cet appareil
Téléchargez la notice de votre Suite bureautique au format PDF gratuitement ! Retrouvez votre notice IWORK 08 - APPLE et reprennez votre appareil électronique en main. Sur cette page sont publiés tous les documents nécessaires à l'utilisation de votre appareil IWORK 08 de la marque APPLE.
MODE D'EMPLOI IWORK 08 APPLE
iWork'08
Getting Started
Apple Inc.
© 2007 Apple Inc. All rights reserved.
Under the copyright laws, this manual may not be copied, in whole or in part, without the written consent of Apple.
The Apple logo is a trademark of Apple Inc., registered in the U.S. and other countries. Use of the "keyboard" Apple logo (Option-Shift-K) for commercial purposes without the prior written consent of Apple may constitute trademark infringement and unfair competition in violation of federal and state laws.
Every effort has been made to ensure that the information in this manual is accurate. Apple is not responsible for printing or clerical errors.
Apple
1 Infinite Loop
Cupertino, CA 95014-2084
408-996-1010
www.apple.com
Apple, the Apple logo, iLife, iPhoto, iPod, iTunes, Keynote, Mac, the Mac logo, Macintosh, Mac OS, Pages, and QuickTime are trademarks of Apple Inc., registered in the U.S. and other countries.
Aperture, Finder, GarageBand, iWeb, iWork, and Safari are trademarks of Apple Inc.
AppleCare and Apple Store are service marks of Apple Inc., registered in the U.S. and other countries.
.Mac is a service mark of Apple Inc.
Adobe, the Adobe logo, Acrobat, the Acrobat logo, Distiller, PostScript, and the PostScript logo are trademarks or registered trademarks of Adobe Systems Incorporated in the U.S. and/or other countries.
Other company and product names mentioned herein are trademarks of their respective companies. Mention of third-party products is for informational purposes only and constitutes neither an endorsement nor a recommendation. Apple assumes no responsibility with regard to the performance or use of these products.
034-4051-A 06/2007
Contents
7 Welcome to iWork '08
8 Welcome to Pages '08
10 Welcome to Numbers '08
12 Welcome to Keynote '08
14 About This Book
14 Where to Go for More Help
16 Overview of iWork Tools
16 The Toolbar and Format Bar
17 The Inspector Window
18 The Media Browser
19 The Font Panel
20 The Colors Window
21 Keyboard Shortcuts
23 Chapter 1: Getting Started with Pages
23 What You'll Learn
24 Step 1: Create a New Document and Choose a Template
26 Step 2: Add and Format Text
27 Changing Font Color and Other Text Attributes
30 Using Styles and Creating Lists
35 Step 3: Add Objects
35 Using Media Placeholders
36 Adding Objects
37 Wrapping Text Around Objects
39 Adding Shapes
40 Step 4: Use Writing Tools
40 Checking Spelling and Proofreading Your Document
42 Researching Information
42 Step 5: Share Your Document
43 Working with Page Layout Documents
45 Creating and Linking Text Boxes
48 Adding and Reordering Pages
49 Masking (Cropping) Images
52 Removing Unwanted Areas from an Image
54 Continue to Explore
55 Chapter 2: Getting Started with Numbers
55 What You'll Learn
56 Step 1: Create a New Spreadsheet
58 Step 2: Get Familiar with the Numbers Window
59 Introducing Tables
63 Introducing Charts
64 Introducing Sheets
65 Step 3: Create a New Table
65 Adding a Table
66 Defining Table Elements
69 Formatting a Table
70 Working with Columns and Rows
73 Adding Data
76 Using Cell Controls
77 Formatting Cells
80 Step 4: Use Formulas and Functions
81 Adding a Quick Formula
82 Using the Formula Editor
84 Using the Function Browser to Add a Function
86 Performing Instant Calculations
87 Using Your Results in the Loan Comparison Table
88 Step 5: Enhance Your Spreadsheet
88 Adding Charts
95 Adding Text, Shapes, and Other Objects
97 Step 6: Share Your Spreadsheet
97 Preparing a Sheet for Sharing
99 Printing and Exporting Your Spreadsheet
99 Continue to Explore
101 Chapter 3: Getting Started with Keynote
101 What You'll Learn
102 Step 1: Create a New Document and Choose a Theme
105 The Slide Organizer
106 The Notes Field
106 Step 2: Create Slides
108 Adding and Formatting Text
108 Adding Graphics and Other Media
113 Step 3: Organize Your Slides
115 Step 4: Enhance Your Slideshow with Motion
115 Adding Transitions Between Slides
117 Making Objects Move
124 Step 5: Rehearse and Share Your Slideshow
124 Rehearsing Your Presentation
125 Customizing a Presentation for the Audience
126 Continue to Explore
127 Index
Welcome to iWork '08
This book will help you quickly create your first documents, spreadsheets, and slideshows.
iWork '08 includes three applications that integrate seamlessly with your Mac experience:
- Pages. The word processor with an incredible sense of style.
- Numbers. Powerful, compelling spreadsheets made easy.
• Keynote. Cinema-quality presentations for everyone.
Welcome to Pages '08
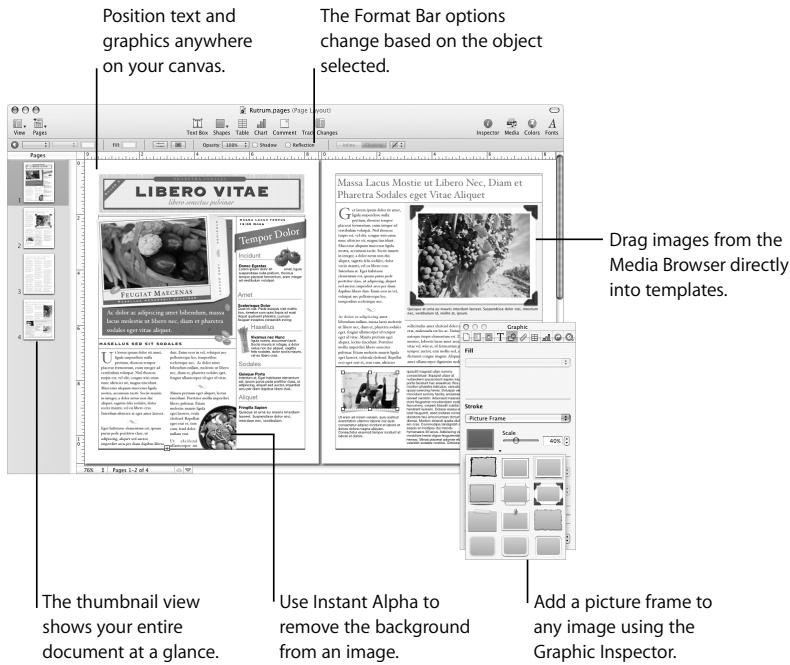
Just open Pages and start typing to create compelling letters, reports, and other word processing documents. You can also create beautifully designed brochures, flyers, and newsletters with the powerful page layout mode. Pages features change tracking, rich graphics and text tools, and more than 140 templates.
Use paragraph and character styles to make your documents consistent.
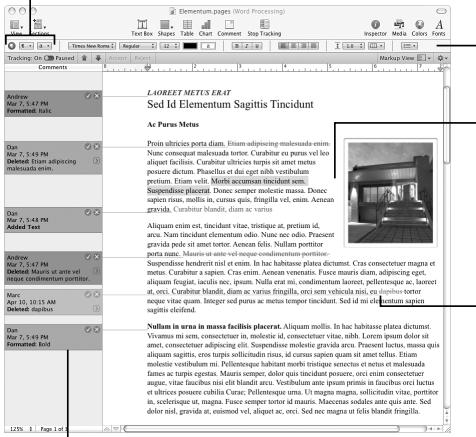
Use the Format Bar to change fonts, colors, line spacing, and more.
Text automatically flows around inserted images.
Track changes directly in the text, or hide tracking.
Use change tracking to edit documents with multiple authors.
Above, a Word Processing template is shown.
Below, a Page Layout template is shown.
Welcome to Numbers '08
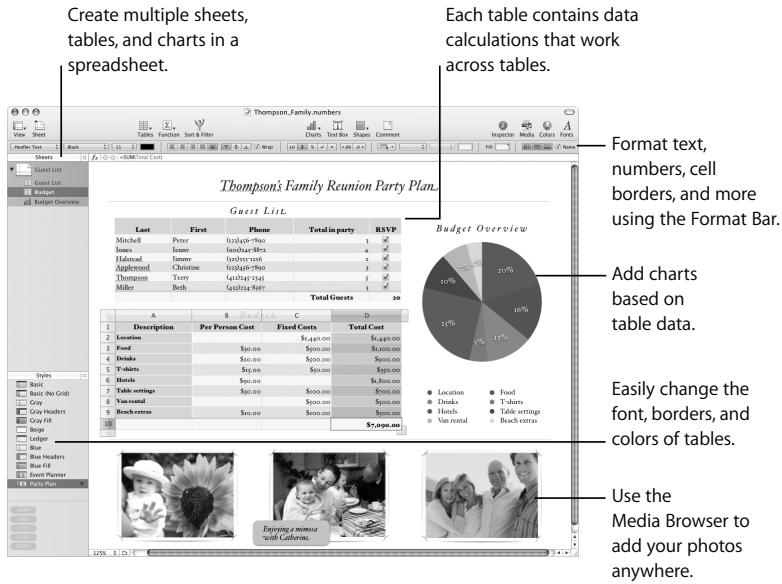
Numbers is a new and innovative—yet familiar—spreadsheet application with over 150 functions and fundamentally better ways to organize data, perform calculations, and manage lists. Numbers includes intelligent tables, customizable checkboxes and sliders, 2D and 3D charts, an interactive print view, and templates for home, education and business.
pie
| Table | Description | Per Person Cost | Fixed Costs | Total Cost | | :--- | :--- | :--- | :--- | :--- | | 1 | Food | 50.00 |1,400.00 | $1,400.00 | | 2 | Drinks | 50.00 |500.00 | $500.00 | | 3 | T-shirts | 50.00 |50.00 | $50.00 | | 4 | Hats | 50.00 |50.00 | $50.00 | | 5 | Vac rental | 50.00 |500.00 | $500.00 | | 6 | Beach extras | 50.00 |500.00 | $500.00 | | Total Guests (28) | A | B | C | D | | Budget Overview (28) | Location | 1,400.00 |1,400.00 | $1,400.00 | | Budget Overview (28) | Drinks | 1,400.00 |1,400.00 | $1,400.00 | | Budget Overview (28) | T-shirts | 1,400.00 |1,400.00 | $1,400.00 | | Budget Overview (28) | Hats | 1,400.00 |1,400.00 | $1,400.00 | | Budget Overview (28) | Vac rental | 1,400.00 |1,400.00 | $1,400.00 | | Budget Overview (28) | Beach extras | 1,400.00 |1,400.00 | $1,400.00 | The image contains a table for the 'Thompson's Family Reunion Party Plan' table and is also displayed in a spreadsheet.
Welcome to Keynote '08
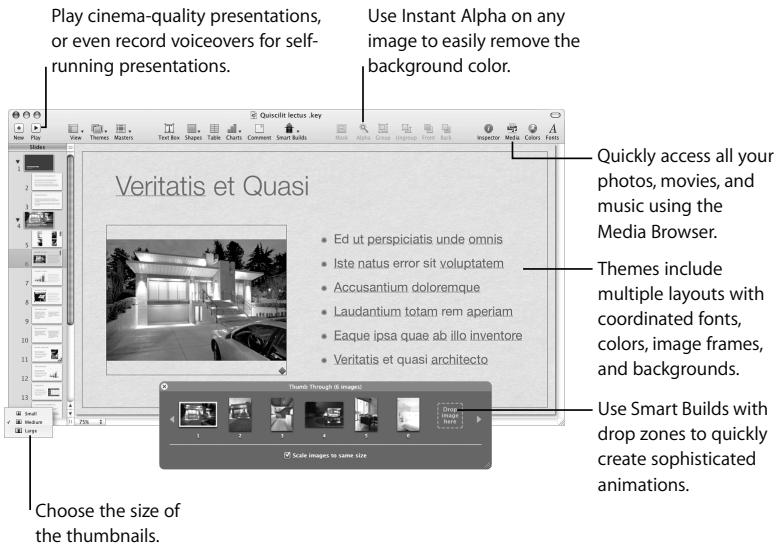
Create spectacular presentations to amaze your audiences. Start with one of over 30 Apple-designed themes, and then add gorgeous text effects and advanced animations, using Smart Builds or action builds, which move objects from point A to point B. Remove an unwanted background from an image using Instant Alpha. Record your voice with your slides for self-running presentations, kiosks, storyboards, or even podcasts.
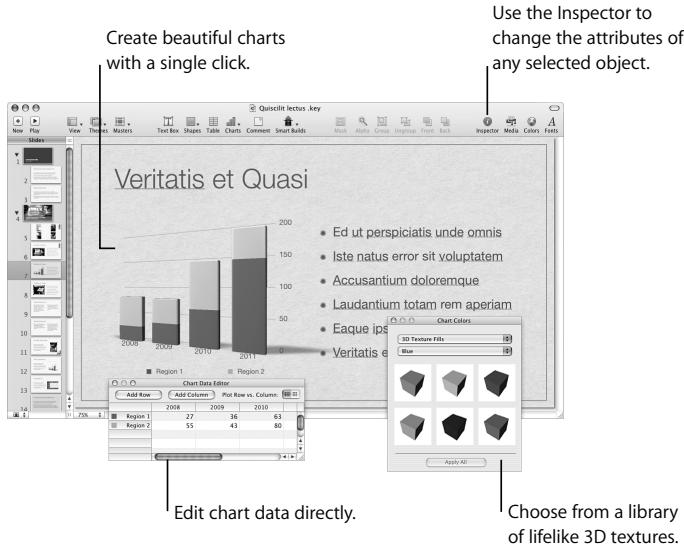
bar
| Year | Region 1 | Region 2 | Region 3 | | :--- | :--- | :--- | :--- | | 2008 | 45 | 60 | 75 | | 2009 | 50 | 65 | 80 | | 2010 | 60 | 75 | 90 | | 2011 | 70 | 85 | 100 | The chart data is directly edited using the Inspector to change the attributes of any selected object. The chart displays a bar chart (top) and a table (bottom) for the same data series. Legend indicates: 'Edit chart data directly.' and 'Choose from a library of lifelike 3D textures.'About This Book
This book contains the following chapters:
- Chapter 1, "Getting Started with Pages," takes you step by step through the process of creating a word processing document and a more graphics-intensive document.
- Chapter 2, "Getting Started with Numbers," takes you through the process of creating a simple spreadsheet.
- Chapter 3, "Getting Started with Keynote," takes you through the process of creating a slideshow.
These three tutorials will get you up and running quickly in each application.
Where to Go for More Help
In addition to this book, there are many other resources to help you as you use iWork '08:
- iWork '08 tour. Watch an overview of what you can do with the iWork '08 suite. To view the tour, open an iWork '08 application and choose Help > iWork Tour.
- Online tutorials. Watch how-to videos about performing common tasks in each application. The first time you open each iWork '08 application, a message appears with a link to these tutorials on the web. You can view an application's tutorial anytime by choosing Help > Video Tutorials.
- User's guides. A printable PDF document, containing detailed instructions for completing any task, is available for each application. To view a user guide, open the application and choose Help > Application User Guide.
- Onscreen help is provided for each application. The help contains thorough instructions for completing all iWork tasks. To open the help, open an application and choose Help > Application Help.
The first page of help also provides access to the following websites:
- iWork website (www.apple.com/iwork): The latest news and information about iWork.
- Support website (www.apple.com/support/application): Detailed information about solving problems.
- Help tags are available for many onscreen items. To see a help tag, hold the pointer over an item for a few seconds.
Overview of iWork Tools
All three iWork applications share many of the same tools.
The Toolbar and Format Bar
At the top of each application window, the toolbar provides controls for common tasks. Each toolbar is described in detail in the appropriate chapter in this book. You can customize the toolbar so that it contains the tools you use most often.
To customize the toolbar:
- Choose View > Customize Toolbar.
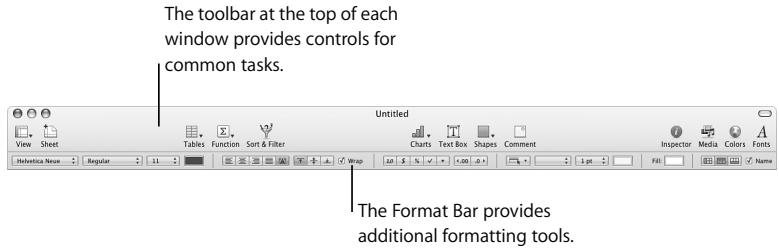
The Format Bar provides quick access to commonly used tools for formatting objects. If the Format Bar isn't visible beneath the toolbar, click View in the toolbar and choose Show Format Bar to show it.
The Inspector Window
You can format all elements of your document using the panes of the Inspector window. The Inspector panes are described in detail in the user's guides.
To open the Inspector window:
- Click Inspector (a blue i) in the toolbar.
Click the buttons along the top to see the different Inspector panes.
You can have more than one Inspector window open at a time.
To open another Inspector window:
- Choose View > New Inspector, or Option-click one of the buttons at the top of the Inspector window.
To see what a control does, rest the pointer over it until its help tag appears.
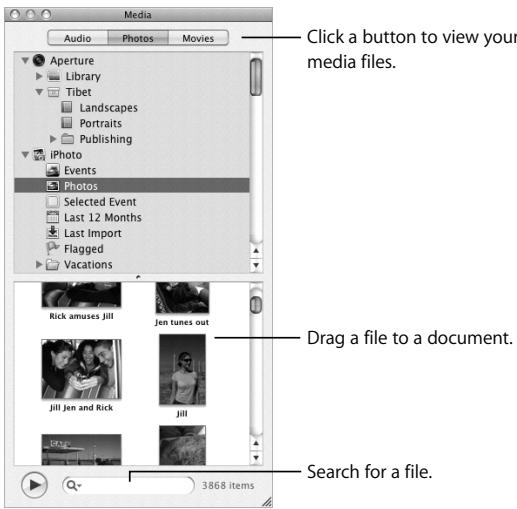
The Media Browser
This window provides quick access to all the files in your iTunes library, your iPhoto library, your Aperture library, and your Movies folder. You can drag any audio file, photo, or movie from the Media Browser directly into an iWork document.
To open the Media Browser:
- Click the Media button in the toolbar.
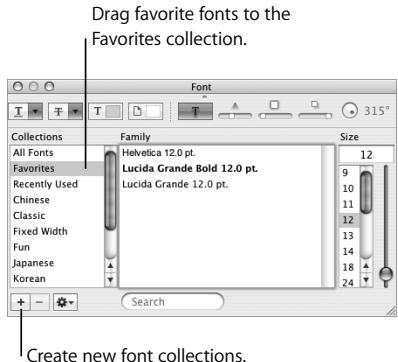
The Font Panel
All three iWork applications use the Mac OS X Font panel, so you can use any font installed on your computer in your iWork documents.
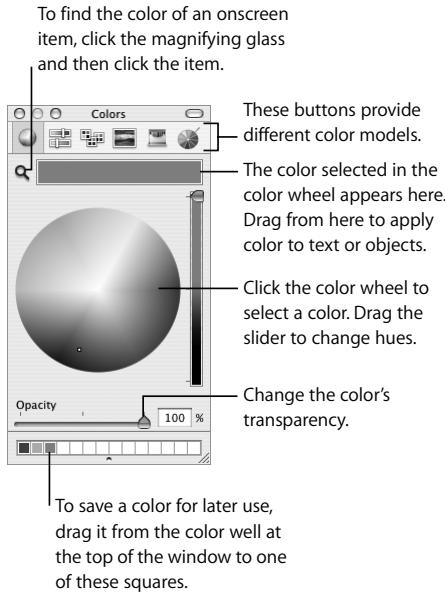
The Colors Window
Use the Mac OS X Colors window to choose colors for text, table cells, objects, shadows, and more.
Keyboard Shortcuts
You can perform many tasks by pressing certain keys. To see a complete list of an application's shortcuts, choose Help > Keyboard Shortcuts.
This chapter provides an overview of the basic steps for creating documents in Pages.
What You'll Learn
This tutorial shows you how to:
- Create new documents and choose templates.
- Add and format text.
- Add photos and other media.
- Add, delete, and reorder pages.
- Use writing tools such as spell checking.
- Share your document by printing it or exporting it for use in other applications.
Step 1: Create a New Document and Choose a Template
Templates are documents with placeholder content and formatting options—such as font styles and margins—already set up for you, so that you can focus on your content instead of design.
Pages provides two kinds of templates:
- Word Processing templates are best suited for text-intensive documents, such as letters and reports.
- Page Layout templates are most useful for documents that feature graphics and are more layout intensive, such as newsletters and flyers.
You complete most tasks exactly the same way in both kinds of documents. This tutorial first takes you through the steps for creating a word processing document and then presents the basics of page layout documents. For more information about the differences between the two kinds of documents, see “Working with Page Layout Documents” on page 43.
To create a new document:
1 Do one of the following:
- If Pages is open, choose File > New.
- If Pages isn't open, open it (click its icon in the Dock or double-click its icon in the iWork '08 folder inside the Applications folder).
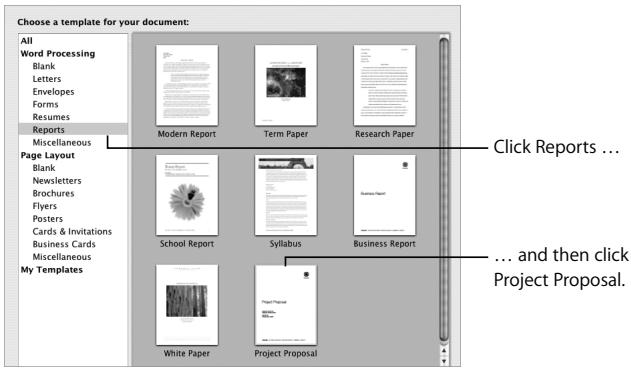
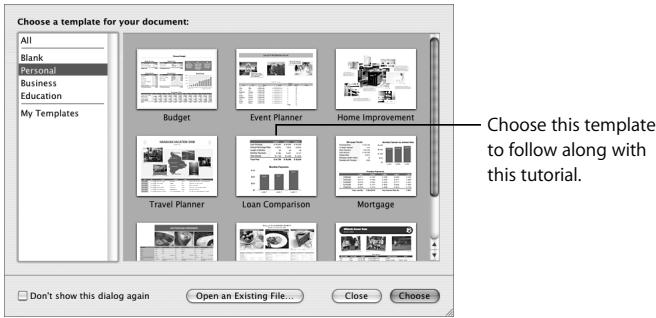
2 In the Template Chooser that appears, click a template category on the left, click a template on the right, and then click Choose.
This part of the tutorial uses the Project Proposal template for its examples.
▶ Tip: You can choose a default template for new documents. Choose Pages > Preferences, select "Use template," and then click Choose to choose a new template.
Stopping, Saving, and Continuing
Be sure to save your work often by choosing File > Save.
You can stop this tutorial (or quit Pages) at any time and return to it later. To quit Pages, choose Pages > Quit Pages.
To reopen your document later, double-click it in the Finder, drag its icon to the Pages icon in the Dock, or open Pages and choose File > Open.
Step 2: Add and Format Text
Pages templates contain placeholder text, which shows you what text will look like and where it will appear. Placeholder text is either a label (Prepared by, for example), sample text (Project Proposal), or Latin text (Lorem ipsum ...).
To replace placeholder text:
- Click the text and type.
When you click placeholder text in a template, all the placeholder text is highlighted. When you type, the placeholder text disappears and is replaced by the text you type.
| Placeholder text: When you click it, the entire text area is selected. | |
| Aenean iaculis laoreet arcu | |
| Eset eiusmod tempor incidunt et labore et dolore magna aliquam. Ut enim ad minim veniam, quis nostrud exerc. Irure dolor in reprehend incidunt ut labore et dolore magna aliqua. Ut enim ad minim veniam, quis nostrud exercitation ullamco laboris nisi ut aliquip ex ea commodo consequat. | |
▶ Tip: You might find it easier to work in the document if you display formatting characters such as Return characters. Choose View > Show Invisibles.
Text you type to replace placeholder text is preformatted, but you can modify it to suit your needs.
Changing Font Color and Other Text Attributes
You can format text using a variety of tools:
- The Format Bar. Right below the toolbar, the Format Bar provides quick access to commonly needed tools for changing fonts, type size and color, and other attributes. To see what a tool does, rest the pointer over it for a few seconds until a help tag appears.
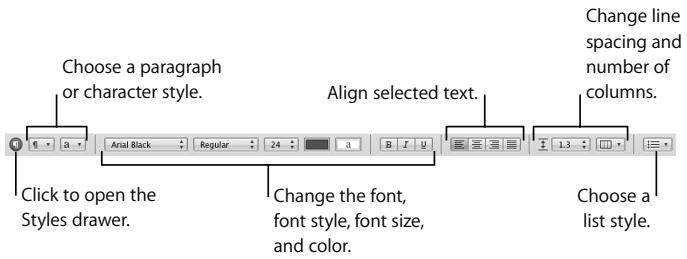
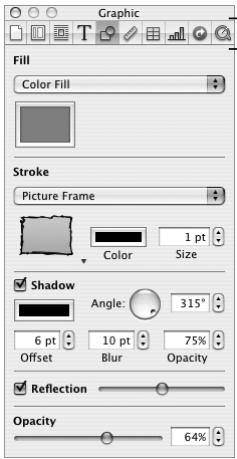
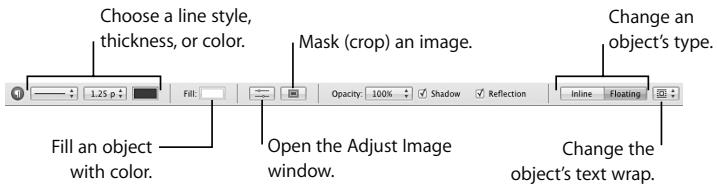
You can also use the Format Bar to modify elements other than text; the tools available change depending on what you select. When you select a graphic, for example, the Format Bar displays graphic-specific controls:
- The Format menu and Font panel. You can use the Format menu commands and the Font panel for many text formatting tasks. To open the Font panel, click Fonts in the toolbar.
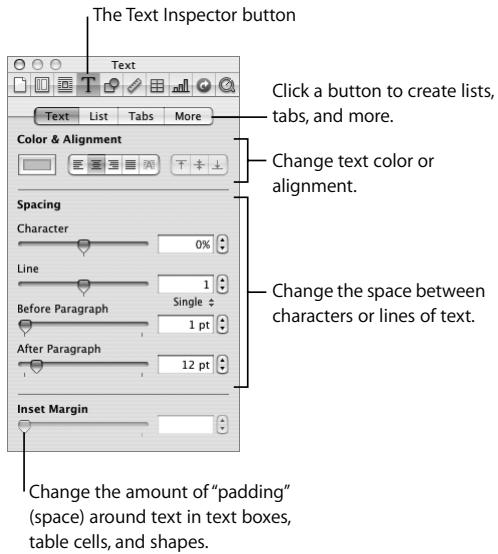
- The Inspector. The Text Inspector provides more formatting tools.
To open the Text Inspector:
1 Click Inspector in the toolbar (the blue i button).
2 Click the Text Inspector button.
▶ Tip: You can open multiple Inspectors by choosing View > New Inspector.
Using Styles and Creating Lists
A style is predefined formatting for a particular kind of text, such as body text or captions. Styles are useful for quickly formatting and reformatting a document. When you apply a style to text, it automatically uses the style's font, size, color, and more. If you want to change something—the size of body text, for example—you can simply redefine the style—all the text that uses the style updates automatically to reflect the new formatting.
Pages provides three kinds of text styles:
- Paragraph styles can be applied only to entire paragraphs (chunks of text that end with a Return character), not to individual words within paragraphs.
- Character styles can be used to format individual words, groups of words, or letters within a paragraph. A common use of character styles is to emphasize particular words using bold or italic. Applying a character style does not change the style of the rest of the paragraph.
- List styles are used to create bulleted or numbered lists. Pages provides many list styles; you can modify these styles or create your own.
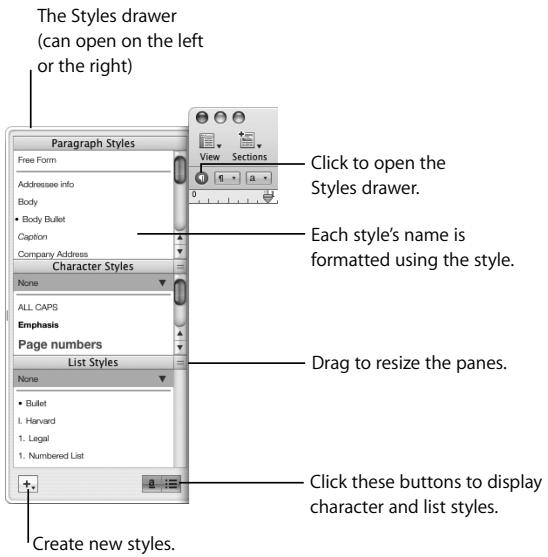
You can apply paragraph, character, and list styles using the Format Bar or the Styles drawer.
To open the Styles drawer:
- Click the Styles button on the far left of the Format Bar (or choose View > Show Styles Drawer).
To apply a style to a paragraph:
- Select the paragraph or paragraphs you want to change, and then do one of the following:
- In the Styles drawer, select a paragraph style.
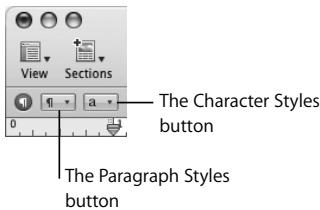
- In the Format Bar, click the Paragraph Styles button and choose a style.
To apply a style to characters:
1 Select the character, word, or words you want to change, and then do one of the following:
- In the Styles drawer, select a character style.
- In the Format Bar, click the Character Styles button and choose a style.
To create a list:
1 Place the insertion point where you want to begin typing your list.
2 Do one of the following:
- In the Styles drawer, select a list style (if you don't see List Styles, click the button at the bottom right of the Styles drawer).
- In the Format Bar, click the List Styles button and choose a style.
The List Styles button
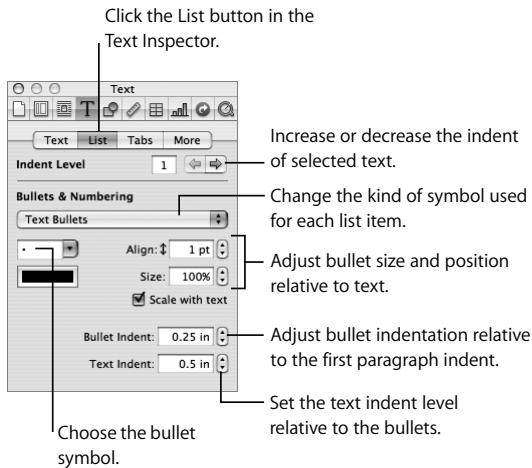
- In the Text Inspector, click List, and then choose a style from the Bullets & Numbering pop-up menu.
3 Type your text, pressing Return when you want to create the next item in the list or Shift-Return to create a subparagraph (a new line of text that's not the next list item).
You can press Tab to indent an item one level. For example, in a numbered list, pressing Tab at the beginning of 4 changes the number to 1.
Tip: You can also generate lists automatically. For example, if you type an asterisk, a space, some text, and then press Return, the next line automatically begins with an asterisk. You can create automatic lists using the following characters followed by a space and text:
- Bullet (•) (press Option-8)
- Hyphen (-)
- Asterisk (*)
• Letter followed by a period
• Number followed by a period or a right parenthesis
To turn off automatic list creation:
- Choose Pages > Preferences, click Auto-Correction, and deselect "Automatically detect lists."
To change a list's format, use the List pane of the Text Inspector. You can, for example, change the text or image used for bullets.
You can modify any style included with a Pages template, and you can create your own styles. For instructions, see Pages Help or the Pages User's Guide.
Step 3: Add Objects
The Media Browser gives you quick access to your iTunes library, your iPhoto library, your Aperture library, and files in your Movies folder. For more information, see “The Media Browser” on page 18.
Using Media Placeholders
The Pages templates provide media placeholders you can use to add your own images, audio files, and movies to your documents. Although you can add these kinds of files anywhere in a document, when you drag a file to a media placeholder, the file retains the size and attributes of the original placeholder image.
Images in Pages templates are placeholders for your own images, audio files, and movies.
To use a media placeholder:
- Drag a file from the Media Browser (or the Finder) to the media placeholder; don't release the mouse until a blue rectangle appears around the placeholder.
natural_image
Icon showing a circular fan with grid pattern and a plus button, labeled 'Apple' and 'Image' (no text or symbols on the fan itself)Make sure a blue rectangle appears around the media placeholder before you release the mouse button.
To replace the file in a media placeholder, simply drag a new file onto it—you don't have to delete the old one first.
Adding Objects
You can add objects—graphics, photos, movies, and so on—anywhere in a document (not only in media placeholders). When you add an object to a page, it is either inline or floating.
- Inline objects are embedded within text and move along with the text. If you want a graphic to be part of a particular paragraph, for example, you would add it as an inline object.
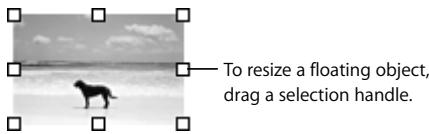
- Floating objects don't move with text; they change position only if you drag them to a new location.
To add a floating object:
- Drag an image from the Media Browser or the Finder to the document.
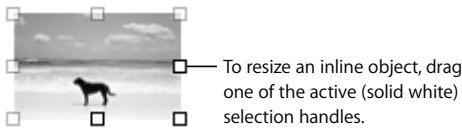
To add an inline object:
1 Hold down the Command key while you drag an object from the Media Browser or the Finder to the document (don't release the mouse yet).
2 When the insertion point is at the location in the text where you want the image to appear, release the mouse.
You can also place the insertion point within the text first, and then choose Insert > Choose.
The selection handles on the top of inline objects are inactive. You can't drag these handles to resize the object; you resize it by dragging the active handles.
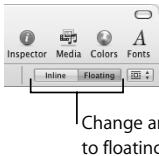
In word processing documents, you can change an object from one kind to another at any time.
To change an object from inline to floating, or vice versa:
1 Select the object.
2 In the Format Bar, click the Inline or Floating button.
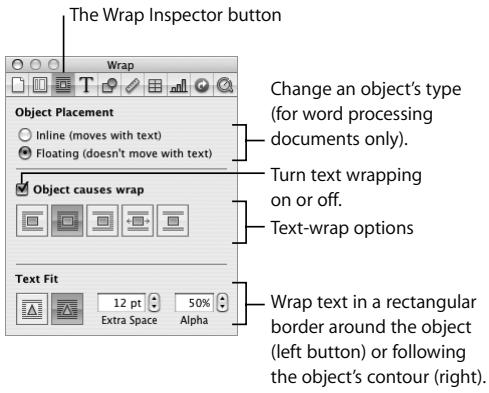
Wrapping Text Around Objects
You can wrap text around an image or other object, whether it is inline or floating. By default, items you add to a word processing document have text wrapping turned on, but you can turn it off if you want text to go on top of or under the object.
You can choose how you want text to wrap around an object—on the right side, left side, top and bottom, and so on.
To change text-wrap options:
■ Select the object and do one of the following:
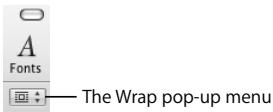
- In the Format Bar, choose an option from the Wrap pop-up menu.
- Open the Wrap Inspector and choose a text-wrap option.
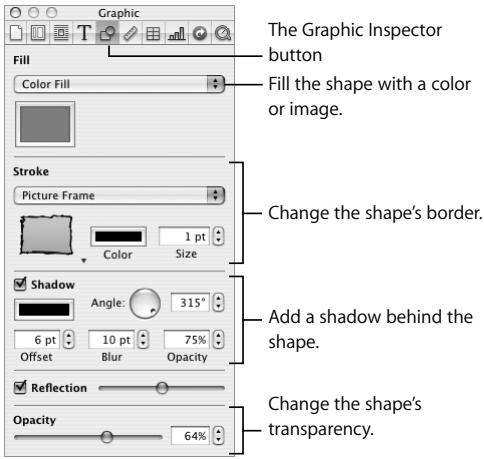
Adding Shapes
Pages comes with a variety of shapes you can add to your document.
To add a shape:
- Click the Shapes button in the toolbar and select a shape (or choose Insert > Shape).
You can modify the shape using the Graphic Inspector. If the Inspector window isn't open, click Inspector in the toolbar. Then click the Graphic Inspector button.
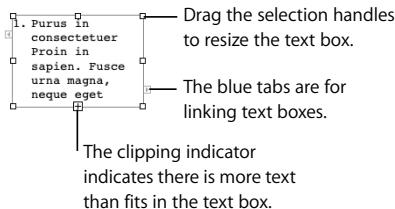
You can also add text inside a shape.
To add text inside a shape:
■ Double-click the shape and then type.
If you type more text than fits in the shape, a clipping indicator appears. To display the rest of the text, select the shape (you might have to click outside the shape first) and drag the selection handles to make the shape larger.
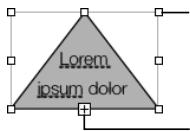
Drag a selection handle to resize the shape.
The clipping indicator appears when there is more text than fits in the shape.
Step 4: Use Writing Tools
Pages makes it easy to refine and edit your document.
Checking Spelling and Proofreading Your Document
By default, Pages flags spelling errors as you type by putting a red dashed line below misspelled words. You can also check for other errors, such as duplicated words, improper capitalization, and punctuation errors.
To turn off automatic spell checking:
- Choose Edit > Spelling > "Check Spelling as You Type" to remove the checkmark next to the menu command.
To find misspelled words whether or not "Check Spelling as You Type" is on:
■ To check the spelling of a particular word, Control-click it.
- To check spelling and view suggestions for misspelled words, choose Edit > Spelling > Spelling.
- To highlight the next misspelled word (after the insertion point), choose Edit > Spelling > Check Spelling.
To look for writing errors:
- Select the text you wish to check and do one of the following:
- To check for errors as you type (with green underlining), choose Edit > Proofreading > "Proofread as You Type."
- To display a window explaining the error and suggesting alternatives, choose Edit > Proofreading > Proofreader.
- To highlight the next grammatical error in the document, choose Edit > Proofreading > Proofread.
Tracking Changes
As you revise a document, you can automatically record your changes. This feature is useful, for example, when you work on a document with others, so that your collaborators can easily see your changes.
To turn on change tracking, click Track Changes in the toolbar. Each person who edits the document is automatically assigned a unique color. Any change you make is recorded in a “change bubble” along the outside edge of the document. Others have the opportunity to accept or reject your changes.
Change bubbles appear for added or deleted text, replaced text, character and paragraph formatting changes, and more. For more information about change tracking, see Pages Help or the Pages User's Guide.
Researching Information
Pages provides a variety of useful research and reference tools that you can use to enrich your document.
To see a word's definition:
- Select the word and choose Edit > Writing Tools > "Look Up in Dictionary and Thesaurus."
To research information on the Internet:
- Select the text you want to investigate and do one of the following:
- Choose Edit > Writing Tools > Search in Google.
- Choose Edit > Writing Tools > Search in Wikipedia.
You can also Control-click anywhere in your document to quickly access the research and reference tools.
Step 5: Share Your Document
When you want to share your document with others, you can print it, save it as a PDF or in another format, or export it to an iLife application such as iWeb.
Here are ways to share your document:
- To export your document, choose File > Export and choose a format.
- PDF: PDF files can be viewed and printed in Preview, Safari, or Adobe Reader. If you want to send a Pages document to someone who doesn't have Pages, a PDF is a good option.
-
Word: Word files can be opened and edited in Microsoft Word on a Mac OS X computer or a Windows computer.
-
RTF: RTF stands for Rich Text Format, a file format that retains most text formatting and graphics. You can open and edit RTF files in a word processor.
- Plain Text: Plain Text files can be opened and edited in a text editing application, such as TextEdit. However, exporting to a plain text file removes all your formatting, and images aren't exported.
- If you have iWeb '08 or later installed, you can send a Pages document directly to a blog or podcast entry, as an attachment. Choose File > Send to iWeb > PDF or Pages Document. In iWeb, choose the blog or podcast to attach your document to.
■ To print a document, choose File > Print.
Working with Page Layout Documents
You would choose a Page Layout template (rather than a Word Processing template) for a graphics-intensive document, such as a flyer, where you'll frequently reposition images and other objects. Page layout documents are also useful for continuing text on nonsequential pages, as you would do in a newsletter.
You can do all the tasks described so far in this chapter in page layout documents as well as in word processing documents. This section of the tutorial explains the differences between the two kinds of documents and describes some of the typical tasks when working with page layout documents.
The main differences between word processing and page layout documents are the following:
- Adding text. You can type text directly on a word processing document. In a page layout document, you can type text only in a text box. The templates include text boxes, and you can easily add your own.
- Adding pages. In a word processing document, when you type more text than fits on a page, a new page is automatically added. In page layout documents, new pages aren't added automatically, but it's easy to add new pages (as described below). In a page layout document, when you type more text than fits in a text box, you can create a new text box and link the two boxes together (as described below).
Note: You can add and link text boxes in word processing documents, too.
- Reordering pages. In a page layout document, each page is a discrete unit and you can easily reorder pages. In a word processing document, you rearrange content by copying and pasting, or by rearranging entire document sections. (For more information about sections, see Pages Help or the Pages User's Guide.)
- Adding objects. You can add floating and inline objects to page layout documents, but you can't change an object from one kind to the other. Any object you add to a Page Layout template is a floating object, unless you insert the object within text.
To try working in a page layout document, open the Extreme Newsletter template (choose File > New From Template Chooser, click Newsletters on the left, click Extreme Newsletter on the right, and click Choose).

The rest of the tutorial uses this Page Layout template.
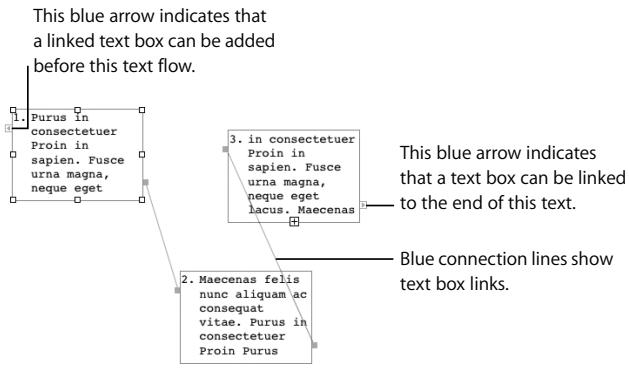
Creating and Linking Text Boxes
In page layout documents, all text is in text boxes that don't grow automatically to accommodate all the text. When text in a text box is longer than fits in the box, you can make the box larger, or you can continue the text in another text box and link it to the first. Linked text boxes can appear anywhere in a document. For example, you could begin a story on page 1 and continue it on page 4.
You can add text boxes to word processing documents as well as to page layout documents.
To add a text box:
1 Click Text Box in the toolbar.
A floating text box appears on the page.
2 To enter text in the text box, click inside it and type.
3 To select the text box (to move it, for example), click outside of it and then click it, or press Command-Return.
When you type more text than fits inside a text box, a clipping indicator appears. To continue the text in another text box, you link the two text boxes.
To link text boxes:
1 Click either of the blue tabs on the first text box.
2 Click another text box, or create a new linked text box by clicking anywhere on the page or scrolling to another page and clicking.
flowchart
graph TD
    A["1. Purus in consectetur Proin in sapien. Fusce urna magna, neque eget"] --> B["2. Maecenas felis nunc aliquam ac consequat vitae. Purus in consectetur Proin Purus"]
    A --> C["3. in consectetur Proin in sapien. Fusce urna magna, neque eget lacus. Maecenas"]
    C --> D["This blue arrow indicates that a linked text box can be added before this text flow."]
    C --> E["Blue connection lines show text box links."]
To unlink text boxes:
- Select the text box you want to unlink and choose Format > Text Box > "Break Connection out of Text Box."
- Drag a blue tab (at the end of a connection line) to break the link.
- Drag a blue connection line to break the link.
Adding and Reordering Pages
In page layout documents, thumbnails of each page are displayed on the left side of the document window. Thumbnails make it easy to see all your document's pages at once, go quickly to a specific page, or change the order of pages or sections.
(You can display thumbnails in word processing documents too, but they don't appear by default.)
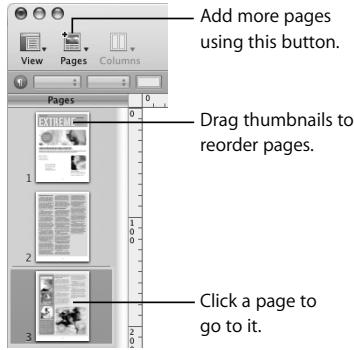
In page layout documents, you add pages as you need them. Each Pages template comes with a variety of page types. For example, the Extreme Newsletter template includes a cover, a text page without graphics, a back page, and more.
To add a page:
- Click the Pages button in the toolbar and choose a page type.
To reorder pages:
- Drag pages in the thumbnail viewer.
To show or hide thumbnails:
- Choose View > Show Page Thumbnails (or Hide Page Thumbnails).
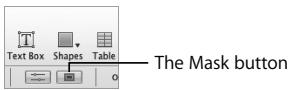
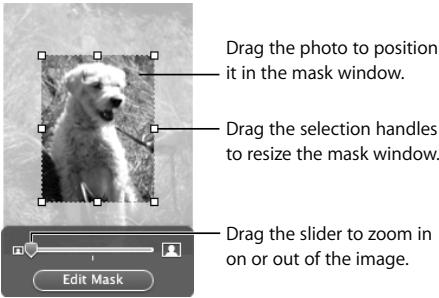
Masking (Cropping) Images
Masking enables you to show only part of an image. Typically, when you crop an image, you delete the parts of the image that are outside of the crop border. With masking, you can show only what you want, without changing the original image file.
You can mask images in word processing and page layout documents, using rectangles or shapes.
To mask an image:
1 Select an image and click the Mask button in the Format Bar (or choose Format > Mask).
A mask appears over the image, with a resizable "window" in the center.
2 To select the part of the image you want to appear, do any of the following:
- Drag the selection handles to resize the window.
- Drag the window to center it over the part of the image you want to feature.
- To resize the image, move the slider left or right.
3 When the window displays the portion of the image you want to appear, double-click the window, press Return, or click the Edit Mask button.
The borders of a masked image are dotted lines. You can drag a masked image to reposition it on the page, and you can drag the selection handles to resize the image.
To change the size of a mask:
1 Double-click the masked image.
2 Click the dotted border of the resizable window to select it (the hand pointer turns to an arrow pointer when it is on the dotted border).
3 Drag the window, the selection handles, and the slider to remask the image.
4 When the window displays the portion of the image you want to appear, do one of the following to exit masking mode:
- Double-click the mask window.
- Press Return.
- Click the Edit Mask button.
To mask an image with a shape:
1 Select an image, choose Format > "Mask with Shape," and select a shape.
2 Follow the steps above to mask the image.

natural_image
Black-and-white photo of a smiling dog inside a five-pointed star (no text or symbols)To remove the mask from a masked image:
- Select the image and choose Format > Unmask.
Removing Unwanted Areas from an Image
The Instant Alpha tool converts areas of a certain color to transparent. This tool is useful, for example, for removing an unwanted background.
To remove the background from an image:
1 Select the image.
2 Choose Format > Instant Alpha.
3 Drag slowly over an area you want to remove.
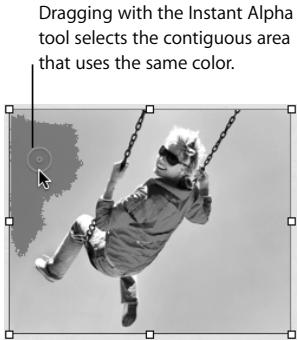
As you drag, the selection grows to include the contiguous area that uses the same color. You can control how much of the image is selected by dragging less or more.
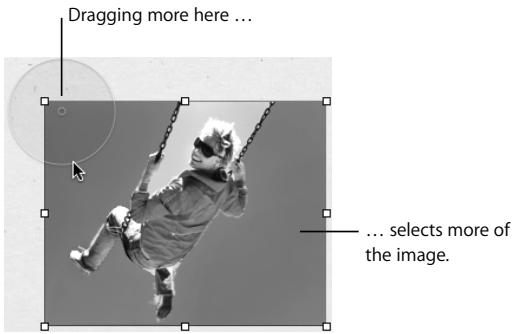
4 Repeat step 3 until you achieve the desired effect.
You can restore parts removed from the image at any time.
To restore parts of an image:
- Choose Format > Remove Instant Alpha.
- Choose Edit > Undo Instant Alpha as many times as you want.
Continue to Explore
Now that you've completed the Pages tutorial, here are some suggestions for experimenting with Pages on your own:
- Open different templates and explore the ways they organize and present text.
- Add shadows, reflections, graphical borders, and other visual effects.
- Add tables and charts.
• Explore headers, footers, and other document parts. - Design your own templates.
Instructions for all these tasks and more are available in Pages Help and the Pages User's Guide (a PDF document).
This chapter takes you step by step through the process of creating a simple spreadsheet.
What You'll Learn
This tutorial shows you how to:
- Create a new spreadsheet.
- Add and format tables.
- Use formulas and functions.
- Add charts.
- Share your spreadsheet by printing it or exporting it for use by other applications.
Stopping, Saving, and Continuing
Be sure to save your work often by choosing File > Save. You can stop this tutorial (or quit Numbers) at any time and return to it later. To quit Numbers, choose Numbers > Quit Numbers.
To reopen your spreadsheet later, double-click it in the Finder, or drag its icon to the Numbers icon in the Dock.
Step 1: Create a New Spreadsheet
To get started, you'll create a Numbers spreadsheet based on a template that contains predefined tables and a chart for comparing different loan options.
To create a new spreadsheet:
1 Do one of the following:
- If Numbers is open, choose File > New.
- If Numbers isn't open, click its icon in the Dock or double-click its icon in the iWork '08 folder inside the Applications folder.
2 In the Template Chooser that appears, select Personal in the list of template categories on the left, select the Loan Comparison template, and then click Choose.
Importing Excel and OFX Data
If you already have a document created in Microsoft Excel, you can import it into Numbers. Simply drag the Excel document to the Numbers icon in the Dock or the Finder.
If you receive financial records from your bank in a file that is in OFX (Open Financial Exchange) format, you can drag the file to the Numbers icon.
Step 2: Get Familiar with the Numbers Window
This is what the template looks like when you first open it:
In this step, you're introduced to the basic Numbers elements—tables, charts, and sheets.
Introducing Tables
The Loan Comparison table in the template you're using has a header row, a header column, and a footer row.
Header column (the leftmost cell in every row)
| Loan 1 | Loan 2 | Loan 3 | |
| Loan Principal | 30,000 | 30,000 | 30,000 |
| Annual Percentage Rate | 6.00% | 7.50% | 9.00% |
| Length in Months | 60 | 60 | 48 |
| Monthly Payments | 580 | 601 | 747 |
| Total Interest | 4,799 | 6,068 | 5,834 |
| Total Paid | 34,799 | 36,068 | 35,834 |
Header row (the topmost cell in every column)
Footer row (the bottom row, even when you add new rows)
Although they're optional, header rows, header columns, and footer rows are very useful.
- Header rows and header columns let you assign names to rows and columns and then use those names to refer to cells in formulas. They're also used to label data in charts.
- Footer rows are useful for highlighting values derived from other values in the table.
To learn some basic table characteristics:
1 Select the Loan Comparison table by moving your pointer to the edge of the table. When the pointer changes to include black crosshairs, click to select the table.

Square selection handles appear at the edges of a table when it's selected.
| Loan 1 | Loan 2 | Loan 3 | |
| Loan Principal | 30,000 | 30,000 | 30,000 |
| Annual Percentage Rate | 6.00% | 7.50% | 9.00% |
| Length in Months | 60 | 60 | 48 |
| Monthly Payments | 580 | 601 | 747 |
| Total Interest | 4,799 | 6,068 | 5,834 |
| Total Paid | 34,799 | 36,068 | $35,834 |
When a table's selected, you can work with the table as a whole. For example, you can add a particular background color to the table or resize the table.
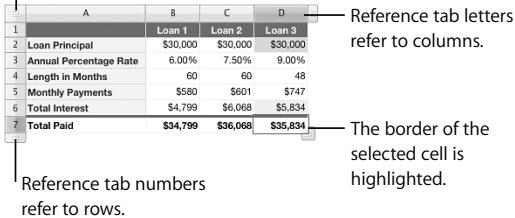
2 To work with a particular cell, you select the cell by moving the pointer over it. The pointer changes to a white plus sign, and you click the cell to select it.

Select the bottom right table cell, which contains the value \$35,834.
When a cell is selected, its border is highlighted. Also, reference tabs appear around the outside of the table. You can use the reference tabs to refer to cells in formulas, select entire rows and columns, and more, as you'll see throughout this tutorial.
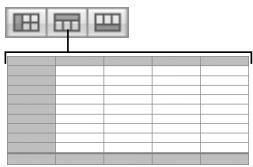
Click the Table handle to select
the table. Drag the handle to
move the table.
When a cell is selected, you can use the Table handle in the upper-left corner to select or move the table.
3 The value in the cell you just selected is derived using a formula that's associated with the cell. To see the formula, look at the Formula Bar.
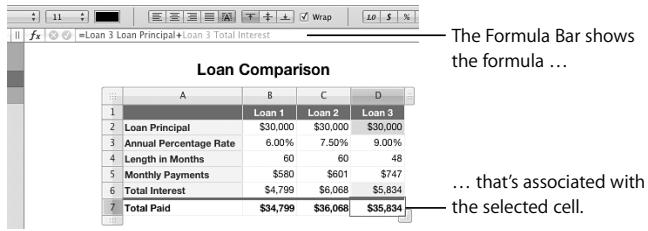
The formula adds the value in two cells, which are highlighted using color in both the table and the Formula Bar. In the formula, header row and header column names are used to refer to the two cells. For example, Loan 3 Loan Principal is the cell at the intersection of the column named Loan 3 and the row named Loan Principal.
Using header text to refer to cells makes formulas more readable. But you can also use the letters and numbers in the reference tabs to refer to cells. For example, Loan 3 Loan Principal and D2 refer to the same cell. To use letters and numbers instead of header cell text, choose Numbers > Preferences, and then deselect "Use header cell names as references."
Loan 3 Loan Principal and D2 are called cell references. When you add a cell reference to a formula, you first specify the column identifier (name or letter) and then specify the row identifier (name or number).
4 Click the cell containing the text Length in Months.
| A | B | C | D | |
| 1 | Loan 1 | Loan 2 | Loan 3 | |
| 2 | Loan Principal | 30,000 | 30,000 | 30,000 |
| 3 | Annual Percentage Rate | 6.00% | 7.50% | 9.00% |
| 4 | Length in Months | 60 | 60 | 48 |
| 5 | Length in Years | 580 | 601 | 747 |
| 6 | Total Interest | 4,799 | 6,068 | 5,834 |
| 7 | Total Paid | 34,799 | 36,068 | $35,834 |
Click this arrow.
When you click the small arrow that appears, a pop-up menu opens. The pop-up menu is one kind of cell control. Cell controls provide a way to control the data that a cell can contain. In the case of a pop-up menu, the cell can contain only one of the items in the menu.
You'll learn later how to add different kinds of cell controls—such as checkboxes and sliders—to a cell.
Introducing Charts
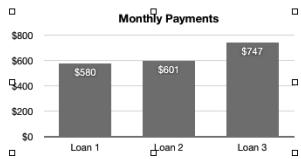
Charts provide a graphical way to display table data. In the template you're working with, the Monthly Payments chart shows some of the data in the Loan Comparison table.
To see which table data is represented in the chart:
- Click the "Monthly Payments" chart to select it.
| Loan 1 | Loan 2 | Loan 3 | ||
| Loan Principal | 30,000 | 30,000 | 30,000 | |
| Annual Percentage Rate | 6.00% | 7.50% | 9.00% | |
| Length in Months | ■ | 60 | 60 | 48 |
| Monthly Payments | 580 | 601 | 747 | |
| Total Interest | 4,799 | 6,068 | 5,834 | |
| Total Paid | 34,799 | 36,068 | $35,834 | |
When the chart (below) is selected, the related data is highlighted in the table.
bar
Monthly Payments | Loan | Value ($) | |---|---| | Loan 1 | 580 | | Loan 2 | 601 | | Loan 3 | 747 |Introducing Sheets
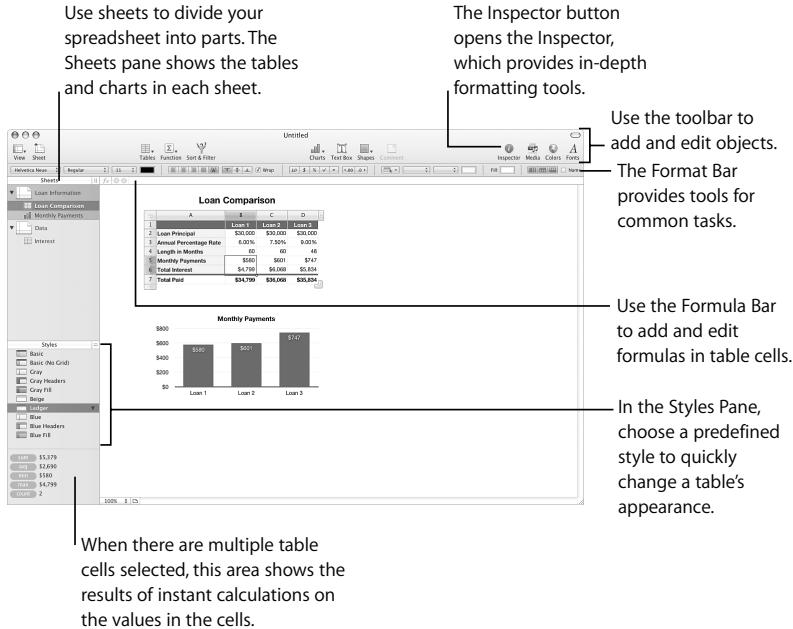
Like chapters in a book, sheets enable you to divide information into manageable groups. For example, you might want to place a chart and its associated table on the same sheet. Or you might want to place all the tables on one sheet and all the charts on another. You might want to use one sheet for keeping track of business contacts and other sheets for friends and relatives.
The Sheets pane—located to the left of the window, above the Styles pane—displays the sheets and the tables and charts on each sheet.
Here are ways to use the Sheets pane:
- To show or hide all of a sheet's tables and charts, click the triangle to the left of the sheet in the pane.
- To move tables and charts among sheets, drag them from one sheet to another in the Sheets pane.
- To rename a table or chart, double-click the name in the Sheets pane and make your changes.
Step 3: Create a New Table
In this step, you'll create a table for recording information about expenses for which you might need a loan.
Adding a Table
To add a new table, you choose an empty preformatted table that serves as a starting point.
To add a table to use in this tutorial:
1 Click Tables in the toolbar and choose Plain
2 In the Styles pane, click Basic to apply the Basic table style.
| A | B | C | D | |
| 1 | ||||
| 2 | ||||
| 3 | ||||
| 4 | ||||
| 5 | ||||
| 6 | ||||
| 7 | ||||
| 8 | ||||
| 9 | ||||
| 10 |
Numbers comes with many predefined table styles. As you've just seen, you can apply a new style with a single click. Click some of the other table styles to see their effect, but click Basic before continuing.
Defining Table Elements
Now you'll practice resizing your new table and adding a header column, a header row, a footer row, and a table name.
To resize your table by adding columns and rows:
1 Click inside the table so that the reference tabs are visible.
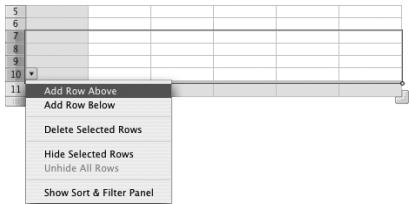
2 To add a row, click the arrow near any row's reference tab to display its pop-up menu, and then choose Add Row Above or Add Row Below.
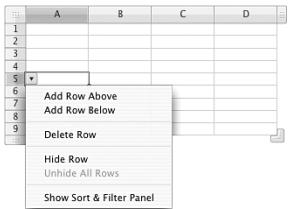
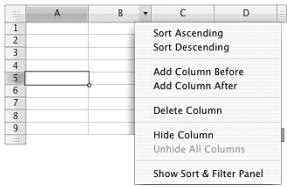
3 To add a column, click the arrow in any column's reference tab to display its pop-up menu, and then choose Add Column Before or Add Column After.
Later you'll learn other techniques for adding rows and columns.
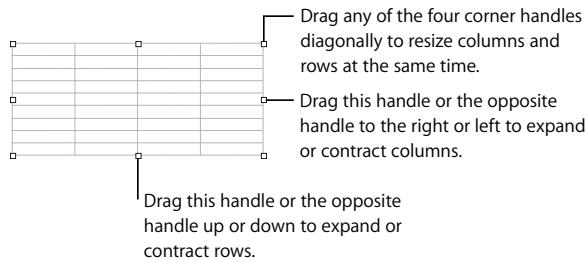
To resize your table by dragging selection handles:
- Select your new table and then experiment with the various selection handles to discover how they affect table size.
Before continuing, delete the table you've been resizing and add a fresh one.
To add a fresh table:
1 Select the table you've been using, and press Delete.
2 Add a Plain table, and apply the Basic table style to it.
To add a header column, a header row, and a footer row:
1 Select your new table.
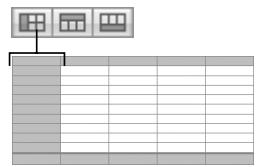
2 Click the buttons in the Format Bar that add a header column, a header row, and a footer row.
Add a header column.
flowchart
graph TD
    A["Input Box 1"] --> B["Process Step"]
    C["Input Box 2"] --> B
    D["Input Box 3"] --> B
    B --> E["Output Box"]
Add a header row.
Add a footer row.
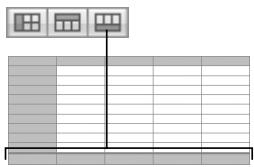
natural_image
Pure diagram of a grid layout with three windows above a rectangular base (no text or symbols)To remove a header column or row, or a footer row, click its button again.
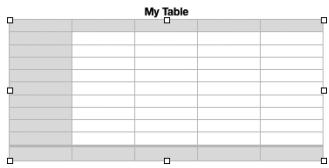
To add a table name:
1 Select the table.
2 In the Sheets pane, double-click the text next to the table's icon, type the name My Table, and press Return.
3 In the Format Bar, select the Name checkbox to show the name on the sheet.
Formatting a Table
You've already used a table style to quickly format your table. Now that your table has headers and a footer, take a moment to see how the table styles change them.
To apply a different style to your table:
1 Select the table or any cell in it.
2 In the Styles pane, click a style.
3 Click other styles to explore the various effects.
4 Before continuing with the tutorial, click Basic.
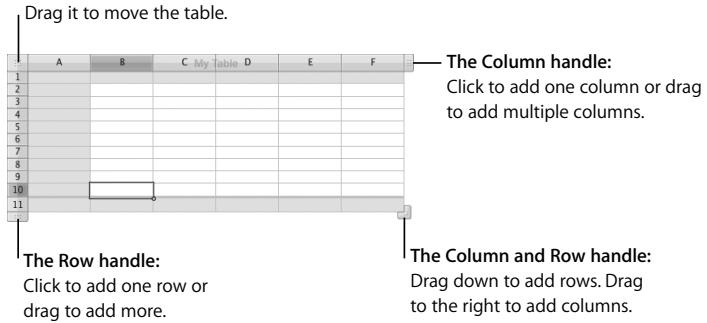
Working with Columns and Rows
Now you'll practice manipulating a table's columns and rows.
To change the columns and rows:
1 Add a column to the table by clicking any cell in the table and then clicking the Column handle in the upper-right corner.
The Table handle:
2 Delete rows 7 through 10.
a Click the reference tab for row 7 to select the entire row, and then press the Shift key while you click the reference tab for row 10.
You can also drag the row 7 reference tab downward until row 10 is selected.
b Click the arrow near the row 10 reference tab and choose Delete Selected Rows.
3 In the header row and header column cells, add labels for the columns and rows.
My Table
| Jan-Mar | Apr-June | July-Sept | Oct-Dec | Total | |
| Landscaping | |||||
| Roof repair | |||||
| Appliances | |||||
| Vacation | |||||
| Gifts | |||||
| Totals |
a Select cell B1, type Jan–Mar, press Tab, and then type Apr–June. Keep typing and pressing Tab until all the header row cells contain values.
b Select cell A2, type Landscaping, press Return, and then type Roof repair. Keep typing and pressing Return until you've typed Gifts.
c Press the Down Arrow key to select the footer cell, and then type Totals.
Navigating from Cell to Cell
To navigate among cells, you can use the arrow keys. But as you've just seen, you can also use the Tab and Return keys:
- Pressing Tab saves the value you just entered and then selects the next cell to the right. For the last cell in a row, pressing Tab twice saves the value and adds a new column.
- Pressing Return selects the next cell down. If you've been using the Tab key to navigate among cells, pressing Return selects the next cell down from the cell in which you started tabbing.
For the last row in a table (if there's a footer row, the last row is the row above the footer row), pressing Return adds a new row. For the last cell in the last row, pressing Return twice saves the value and adds a new row.
Note: If your table contains a lot of text, you might want to change what happens when you press the Tab and Return keys. For information, see Numbers Help or the Numbers User's Guide.
Adding Data
Now you'll practice adding data, formatting data, and performing other operations on cell values.
You can use cell formats to control how cell values are displayed. For this example, you'll apply the Currency format to blank table cells, so that when you enter a number in a cell, the number is automatically formatted as a monetary value. For example, when you enter 25000, the number is automatically displayed as \$25,000.00.
To apply a cell format to table cells:
1 Select cell B2, hold down the Shift key, and then select cell F7.
2 In the Format Bar, click the Currency Format button to define a currency format.
By default, this format displays the currency symbol, 2 decimal places, a thousands separator, and negative numbers with the negative symbol.
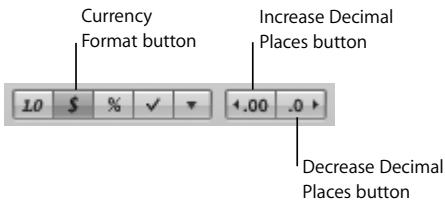
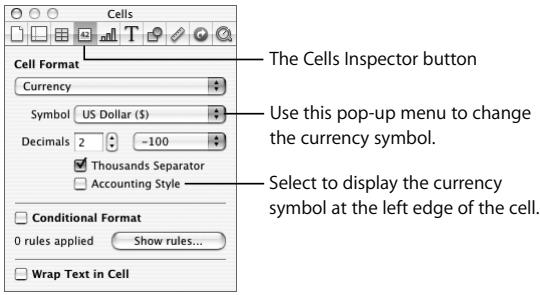
To change the number of decimal places displayed, you could use the Decrease Decimal Places button or the Increase Decimal Places button. For even more control over cell formatting, you use the Cells Inspector.
Open the Cells Inspector by clicking Inspector in the toolbar and then clicking the Cells Inspector button.
Type numbers in the cells as shown below. You don't need to type the currency symbol, the thousands separator, the decimal point, or the decimal digits. As soon as you leave a cell, the Currency format applies them automatically.
My Table
| Jan-Mar | Apr-June | July-Sept | Oct-Dec | Totals | |
| Landscaping | 25,000.00 | ||||
| Roof repair | 2,500.00 | ||||
| Appliances | 1,500.00 | ||||
| Vacation | 2,000.00 | 5,000.00 | |||
| Gifts | 1,000.00 | ||||
| Totals |
Need Quick Instructions?
To view information about a button or other control, rest your pointer over it until a help tag—a brief description of what the control does—appears.
To sort rows:
1 Click anywhere in the table.
2 Rest the pointer over column B's reference tab.
3 Click the arrow that appears in the reference tab to display its pop-up menu, and then choose Sort Ascending.
| A | B | C | My Table D | E | F | |
| 1 | Jan-Mar | Sort Ascending | Oct-Dec | Total | ||
| 2 | Landscaping | Sort Descending | ||||
| 3 | Roof repair | 2,500 | ||||
| 4 | Appliances | 1,500 | Add Column Before | |||
| 5 | Vacation | Add Column After | ||||
| 6 | Gifts | $1,000.00 | ||||
| 7 | Totals | Delete Column | ||||
The rows are sorted using the values in column B.
My Table
| Jan-Mar | Apr-June | July-Sept | Oct-Dec | Total | |
| Appliances | 1,500.00 | ||||
| Roof repair | 2,500.00 | ||||
| Landscaping | 25,000.00 | ||||
| Vacation | 2,000.00 | 5,000.00 | |||
| Gifts | 1,000.00 | ||||
| Totals |
4 For more advanced sorting options, click Sort & Filter in the toolbar.
When content is too large for a cell, you can use automatic text wrapping.
To see text wrapping in action:
In cell A2, change Appliances to Kitchen appliances.
The height of the cell changes to accommodate the longer text string, because Wrap is selected for the cell, as you can see in the Format Bar. In the template you're using, text wrapping is on by default for the cells in the row and column headers and the footer. For more information, see Numbers Help or the Numbers User's Guide.
Using Cell Controls
Instead of typing a value in a cell, you can use a cell control to add the value. A cell control can precisely regulate the data in a cell, and makes it easier than typing to enter a value.
There are several kinds of cell controls:
- A checkbox is for cells whose value can be one of two states, such as yes or no.
- A slider enables you to make large changes to numbers very quickly.
- A stepper enables you to increase or decrease numbers in specific, predefined increments.
- A pop-up menu enables you to predefine specific values a cell can contain.
To add a stepper:
1 Select cell D5, which should contain the value \$5,000.00.
2 In the Cells Inspector, choose Stepper from the Cell Format pop-up menu.
3 Change the Maximum value to 10000 and the Increment value to 500.
In the table cell, click the up arrow in the stepper twice to increase the value in the cell to \$6,000.
| C My Table D | |
| Apr-June | July-Sept |
| 25,000.00 | |
| 2,000.00 | $6,000.00 |
Press Tab to select the adjacent cell. The stepper in cell D4 is no longer visible, because a cell control is visible only when its cell is selected.
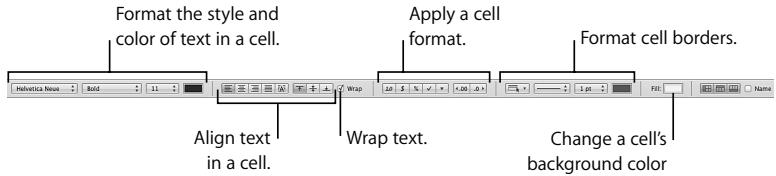
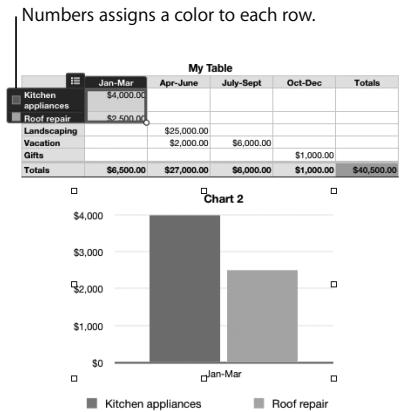
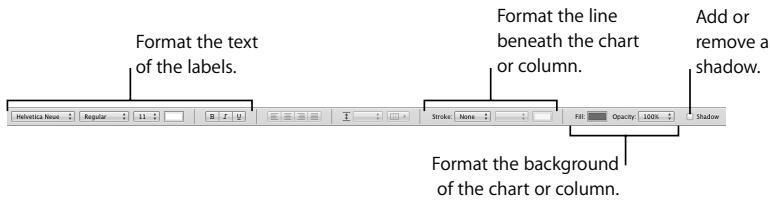
Formatting Cells
The Format Bar gives you quick access to commonly needed formatting controls for the selected object. Here's what the Format Bar looks like with one or more cells selected:
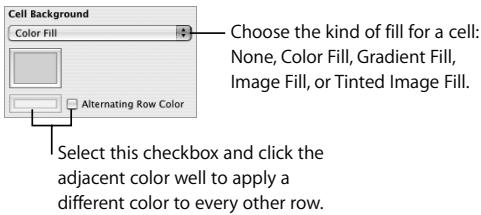
When you want to draw attention to particular cells—for example, cells that contain a key value—you can use color.
To change the background color of a cell:
1 Select cell F7, the bottom-right cell in your table.
2 In the Format Bar, click the Fill button.
3 In the palette that appears, click a color.
My Table
| Jan-Mar | Apr-June | July-Sept | Oct-Dec | Totals | |
| Kitchen appliances | 1,500.00 | ||||
| Roof repair | 2,500.00 | ||||
| Landscaping | 25,000.00 | ||||
| Vacation | 2,000.00 | 6,000.00 | |||
| Gifts | 1,000.00 | ||||
| Totals | — Add a background color to this cell. |
You can also add color to a cell, and to alternating rows, using the Table Inspector.
To format a border at the bottom of the table:
1 Click the reference tab for the footer row to select all the cells in the row.
2 In the Format Bar, choose Bottom Edge from the Border Selection pop-up menu.
Bottom Edge indicates you want to format a border for the bottom segment of each selected cell.
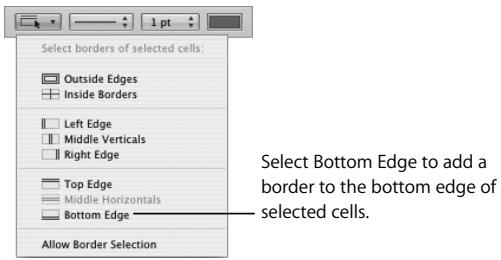
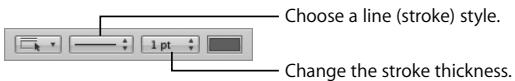
3 Choose a line style and a stroke thickness for the border from the two adjacent pop-up menus.
4 Click the color well to choose a color for the border.

Step 4: Use Formulas and Functions
Numbers can automatically perform calculations for you. For example, you can have a spreadsheet automatically add a column of numbers and display the sum in a table cell.
To display the results of a calculation in a table cell, you add a formula to that cell. Most formula calculations are done using values in other table cells.
Formulas use the following:
- Operators perform operations such as addition (+). For example, =A2 + 16 is a formula that adds 16 to the value in cell A2. When the value in A2 changes, so does the value in the cell containing the formula.
Note: All formulas must begin with an equal sign (=). For simplicity, the equal sign may be omitted in explanatory text.
- Functions are predefined, named operations, such as SUM and AVERAGE. To use a function, you select it from a list or type its name, and then specify the arguments the function needs in parentheses following the function's name.
- Arguments provide the data that a function uses to perform its operations. For example, SUM(A2, 16, B4) adds three values. Notice that arguments are separated using commas.
Numbers provides several tools for working with formulas. In the following pages, you'll practice using all of them.
Adding a Quick Formula
To perform a simple calculation using values in adjacent cells, the easiest approach is to use a quick formula. Here you'll use a quick formula to add the values in column B of your table and display the result in the column's footer cell.
To add a quick formula:
1 Click cell B7, the footer cell for column B.
2 Click Function in the toolbar and choose Sum.
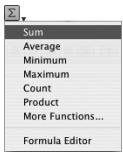
The value \$4,000, the sum of the two numbers in column B, appears in the column's footer cell.
My Table
| Jan-Mar | Apr-June | July-Sept | Oct-Dec | Totals | |
| Kitchen appliances | 1,500.00 | ||||
| Roof repair | 2,500.00 | ||||
| Landscaping | 25,000.00 | ||||
| Vacation | 2,000.00 | 6,000.00 | |||
| Gifts | 1,000.00 | ||||
| Totals | $4,000.00 |
This value is calculated automatically using a quick formula.
The sum changes whenever the values in column B change.
3 To commit the value, click cell B2, type 4000, and then press Tab.
Notice that the sum changes to \$6,500.
To view a formula:
- Click the cell in which the sum is displayed (cell B7), and look at the Formula Bar (beneath the Format Bar) to view the formula associated with the cell.
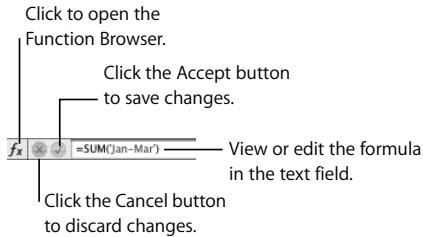
The formula in the cell is SUM('Jan-Mar'). SUM is a function that adds together the values in the arguments specified between the parentheses. In this case, the column heading is the argument; using a header cell name is an easy way to refer to all the values in a column or row.
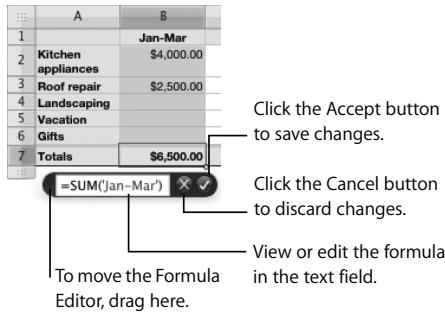
Using the Formula Editor
Another way to add, view, and edit formulas is to use the Formula Editor.
To view a formula using the Formula Editor:
■ Double-click cell B7.
The Formula Editor opens, with the formula in its text field.
To add a formula using the Formula Editor:
1 Click outside the Formula Editor to close it.
2 Click the column C footer cell.
3 Type the equal sign (=) to open the Formula Editor.
4 In the text field, type SUM followed by a left parenthesis.
5 Click the column header Apr–June.
Numbers adds the column name to the formula.
6 Type a right parenthesis after the column name.
7 Click the Accept button.
To quickly add the same formula to other cells, you can use autofilling, a technique for quickly duplicating the data, formula, cell format, or fill of a selected cell.
To use autofilling:
1 Select cell C7.
2 Drag the Fill handle to the right to select cells D7 and E7.
The pointer changes to a plus sign when the Fill handle is selected.
Using the Function Browser to Add a Function
Numbers provides many built-in functions, which you can access using the Function Browser. You'll use it to add a formula to your table that creates a grand total by adding the values in the footer row.
To add a function using the Function Browser:
1 Click the column F footer cell (the cell you filled with color earlier).
2 In the Formula Bar, click the Function Browser button.
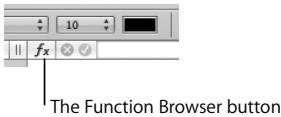
3 In the Function Browser, select Numeric on the left and SUM on the right.

4 Click Insert.
The function appears in the Formula Editor and the Formula Bar, and contains argument placeholders for you to replace with your own values.
=SUM(number, [number,...])

5 In the Formula Editor or the Formula Bar, select everything inside the left and right parentheses, and then click cells B7, C7, D7, and E7 to use them as arguments.
=SUM('Jan-Mar' Totals,'Apr-June' Totals,'July-Sept' Totals,'Oct-Dec' Totals)

6 Click the Accept (green checkmark) button to see the grand total—\$40,500.00—displayed in the bottom-right cell.
My Table
| Jan-Mar | Apr-June | July-Sept | Oct-Dec | Totals | |
| Kitchen appliances | 4,000.00 | ||||
| Roof repair | 2,500.00 | ||||
| Landscaping | 25,000.00 | ||||
| Vacation | 2,000.00 | 6,000.00 | |||
| Gifts | 1,000.00 | ||||
| Totals | 6,500.00 | 27,000.00 | 6,000.00 | 1,000.00 | $40,500.00 |
Performing Instant Calculations
You can have Numbers perform instant calculations on values in one or more cells.
To use instant calculations:
- Select cells C5 and D5, and view the calculation results in the lower-left corner.
| Blue Headers Blue Fill | A | B | C My table | D | E | F | |
| 1 | Jan-Mar Apr-June July-Sept Oct-Dec Totals | ||||||
| 2 | Kitchen appliances | 4,000.00 | |||||
| 3 | Roof repair Landscoping | 2,500.00 | |||||
| 4 | 25,000.00 | ||||||
| 5 | Vacation | 2,000.00 6,000.00 | |||||
| 6 | Gifts | 1,000.00 | |||||
| 7 | Totals | 6,500.00 | 27,000.00 | 6,000.00 | 1,000.00 | ||
Here are the results of instant calculations for the two selected cells.
If you find a particular calculation very useful and you want to incorporate it into a table, drag the calculation to an empty table cell anywhere in your spreadsheet.
Using Your Results in the Loan Comparison Table
Now you can use the predefined template table to compare three loans for \$40,500.
To compare loans:
1 Select the Loan Comparison table.
If you were using this table for your own loan comparison, you'd change the values for Annual Percentage Rate or loan duration (Length in Months or Length in Years) to match the terms of the loans you're comparing. For this exercise, we'll use the predefined values.
2 Select cell B2 and type the equal sign (=) to open the Formula Editor.
3 Click the lower-right cell in My Table to indicate you want to display the grand total in cell B2 of the Loan Comparison table.
4 Click the Accept button in the Formula Editor.
The Loan Comparison table reappears, with the value \$40,500 in cell B2.
| Loan 1 | Loan 2 | Loan 3 | |
| Loan Principal | 40,500 | 30,000 | 30,000 |
| Annual Percentage Rate | 6.00% | 7.50% | 9.00% |
| Length in Months | 60 | 60 | 48 |
| Monthly Payments | 783 | 601 | 747 |
| Total Interest | 6,479 | 6,068 | 5,834 |
| Total Paid | 46,979 | 36,068 | $35,834 |
Compare monthly payments ...
... and compare the total costs.
5 Repeat steps 2 through 4 to add the grand total to cells C2 and D2.
Whenever the grand total in My Table changes, the values in the Loan Principal row are automatically updated.
Whenever monthly payment values in the Loan Comparison table change, the Monthly Payments chart is automatically updated.
In the next step, you'll create and format your own chart to learn how to link table and chart data.
Step 5: Enhance Your Spreadsheet
You've already seen how table data looks in a colorful chart. You can also use shapes and graphics to make your spreadsheet more informative and inviting.
Adding Charts
A chart can visually reveal trends or relationships that aren't as apparent when you view data in rows and columns.
You can use a Numbers chart to display data from one or more tables. When you change data in a table, its associated chart updates automatically.
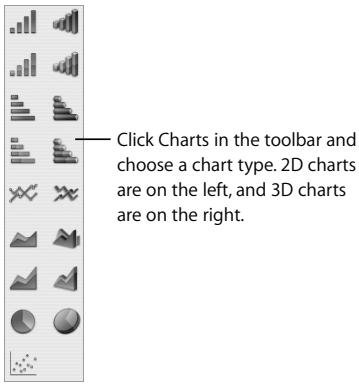
Numbers provides many chart types—pie charts, line charts, bar charts, and more. Most chart types have two-dimensional (2D) and three-dimensional (3D) versions.
Now you'll add a chart that plots some of the values in your table.
To add and format a chart:
1 Click any cell in My Table.
2 Click and hold cell B2 and drag down to add cell B3 to the selection.
3 Click Charts in the toolbar, and then choose the top-left chart type.
Numbers creates a 2D column chart that plots the two selected values.
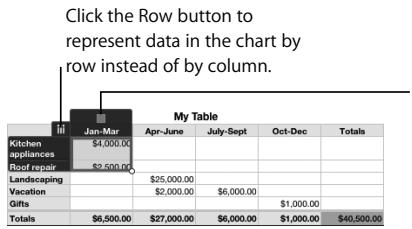
Numbers assigns a color to the table column so you can easily see how chart elements map to table data.
bar
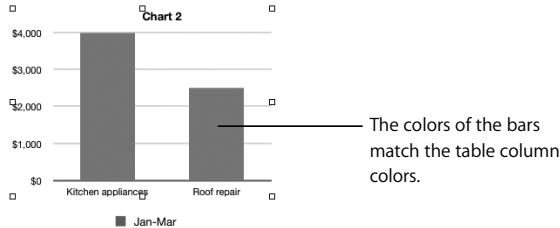
| Category | Value | | ----------------- | ------ | | Kitchen appliances | $4,000 | | Roof repair | $2,500 |4 Click the Row button in the upper left.
Each row is now represented in the chart using a different color. Notice how the labels and legend beneath the chart have also changed.
There are many easy techniques for adding data to a chart, removing data, or changing it. See Numbers Help or the Numbers User's Guide for details.
Here are ways to change a chart:
- For quick formatting, use the Format Bar. Select the chart or one of the columns in it and experiment with the controls in the Format Bar.
- For more extensive chart editing, use the Chart Inspector: Click Inspector in the toolbar and then click the Chart Inspector button.
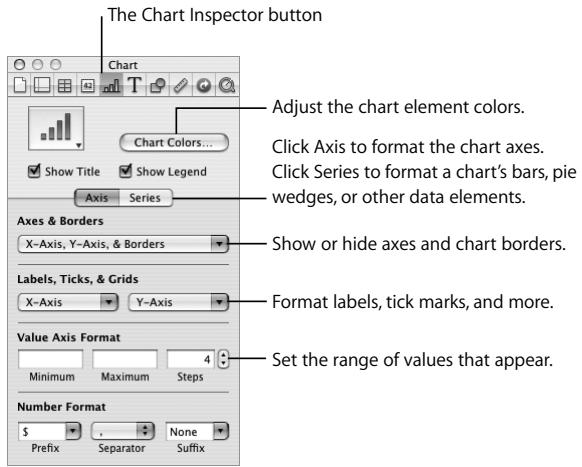
To change the chart:
1 Select the chart you created.
2 Choose the 3D pie chart from the pop-up menu in the upper left of the Chart Inspector.
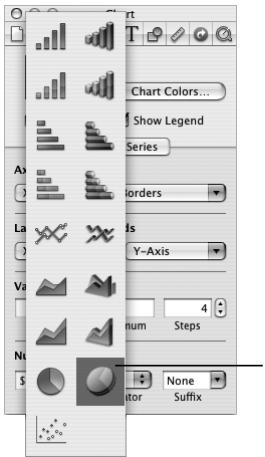
The 3D pie chart is the bottom 3D chart type in the pop-up menu.
3 Hide the chart title and the legend by deselecting Show Title and Show Legend in the Chart Inspector.
4 Apply textures to the wedges:
a In the Chart Inspector, click Chart Colors.
b Choose 3D Texture Fills in the top pop-up menu and Marble in the lower pop-up menu.
c Click Apply All.

pie
| Category | Percentage (%) | |---|---| | Slice 1 | 38 | | Slice 2 | 62 |Adding Text, Shapes, and Other Objects
You can annotate and decorate your spreadsheet by adding text, shapes, and images. You can even add audio and movie files.
To add text:
1 In the toolbar, click Text Box.
2 In the text box that appears, type your text.
3 To move the text box, drag it.
4 To format the text, use the Format Bar or the Text Inspector.
To add a shape:
1 In the toolbar, click Shapes and choose a shape.
2 To add text to the shape, double-click it and type.
3 Change the shape's color and other attributes using the Format Bar or the Graphic Inspector.
To add an audio file, graphic, or movie:
1 In the toolbar, click Media.
2 In the Media Browser, click the Audio, Photos, or Movies button.
3 Drag a file to the sheet.
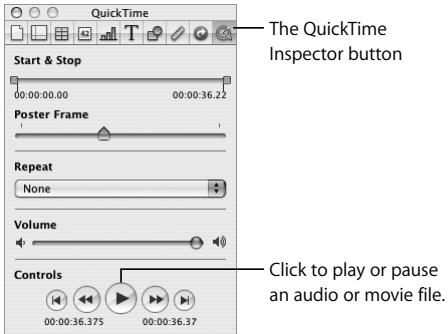
To play an audio or movie file:
1 Select the file on the sheet.
2 Click Inspector in the toolbar and then click the QuickTime Inspector button.
3 Click the Play/Pause button.
Step 6: Share Your Spreadsheet
When you want to share your spreadsheet with others, you have several options.
Preparing a Sheet for Sharing
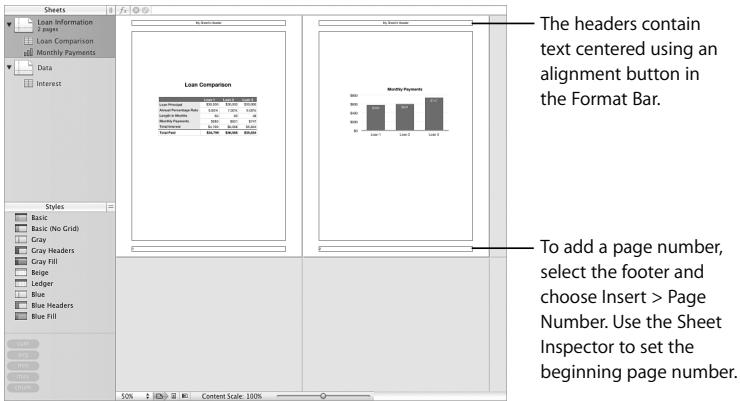
Before you share a sheet, you may want to paginate its contents.
To paginate a sheet:
1 Select the sheet in the Sheets pane.
2 To view a paginated version of your sheet, click View in the toolbar and choose Show Print View.
3 To zoom out so you can see more pages at one time, choose 50% from the pop-up menu in the lower left of the canvas.
4 To adjust the size of all the objects so they fit on fewer or more pages, move the Content Scale slider at the bottom of the window to the left or right.
The Content Scale slider enlarges or shrinks all the objects on the sheet.
5 To refine the layout of objects, move, resize, and drag them between pages until you achieve the visual effect you want.
6 Add headers and footers:
a Click View in the toolbar and choose Show Layout.
b Put text or graphics in the header or footer area.
If you want to make a change to a table, chart, or other object, or add new objects, you can do so while using Print View.
Printing and Exporting Your Spreadsheet
You can print a single sheet, or you can export your spreadsheet in a format another application can open.
Here are ways to share your spreadsheet:
- To print a sheet, select it in the Sheets pane and choose File > Print Sheet.
-
To export your spreadsheet, choose File > Export and choose a format:
-
PDF: PDF files can be viewed or printed in Preview, Safari, and Adobe Reader.
- Excel: Excel files can be opened and edited in Microsoft Excel on a Mac OS X computer or a Windows computer.
- CSV: CSV stands for Comma Separated Values, a file format that many spreadsheet applications can open.
- You can attach a spreadsheet to an iWeb blog entry (iLife '08 or later is required). Choose Send to iWeb > PDF or Send to iWeb > Numbers Document. When iWeb opens, choose the blog (or podcast) to attach your spreadsheet to.
Continue to Explore
Here are some suggestions for experimenting with Numbers on your own:
- Open different templates and examine how they organize and present data.
- Study various predefined formulas, and practice creating your own formulas.
- Create charts that use data from more than one table.
- Add Address Book data to a table.
- Design your own templates and predefined tables.
This chapter takes you step by step through the process of creating a simple slideshow.
What You'll Learn
This tutorial shows you how to:
- Create a new slideshow and choose a theme.
- Change the theme for a slide or slideshow.
- Add, delete, skip, and reorder slides.
- Add text, graphics, and sound, including recorded narration.
- Add transitions (special effects between slides).
- Animate your slides using object builds.
- Rehearse and present your slideshow.
Step 1: Create a New Document and Choose a Theme
Each slideshow is its own Keynote document.
To create a new slideshow:
1 Do one of the following:
- If Keynote is open, choose File > New.
- If Keynote isn't open, open it (click its icon in the Dock or double-click its icon in the iWork '08 folder inside the Applications folder).
2 In the Theme Chooser, double-click a theme to select it.
This tutorial uses the Headlines theme, but you can use any theme you like.
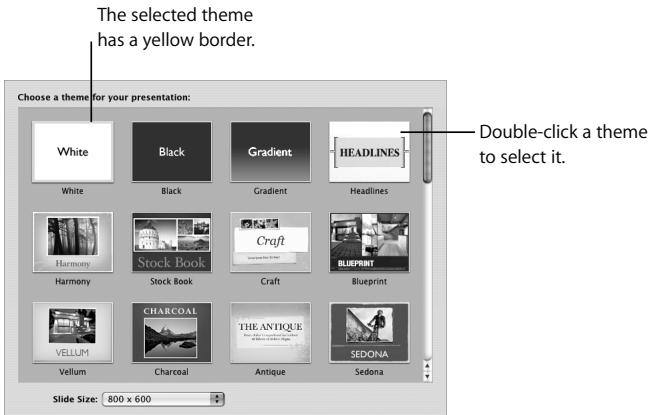
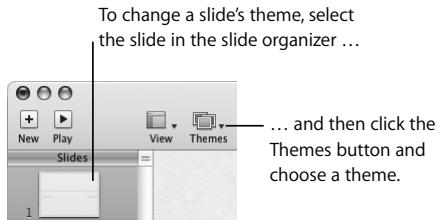
You can change a slide's theme at any time.
To change a slide's theme:
1 In the slide organizer (on the left side of the Keynote window), select the slide.
2 In the toolbar, click Themes and choose a different theme.
Tip: You can set up Keynote to always use the same theme when you create a new document. Choose Keynote > Preferences, click General, select "Use theme" and choose a theme.
Saving, Stopping, and Continuing
Be sure to save your work often by choosing File > Save.
You can stop this tutorial (or quit Keynote) at any time and return to it later. To quit Keynote, choose Keynote > Quit Keynote. To reopen your slideshow later, double-click it in the Finder or drag its icon to the Keynote icon in the Dock.
Your slideshow now contains one slide. Double-click the text and type your own.
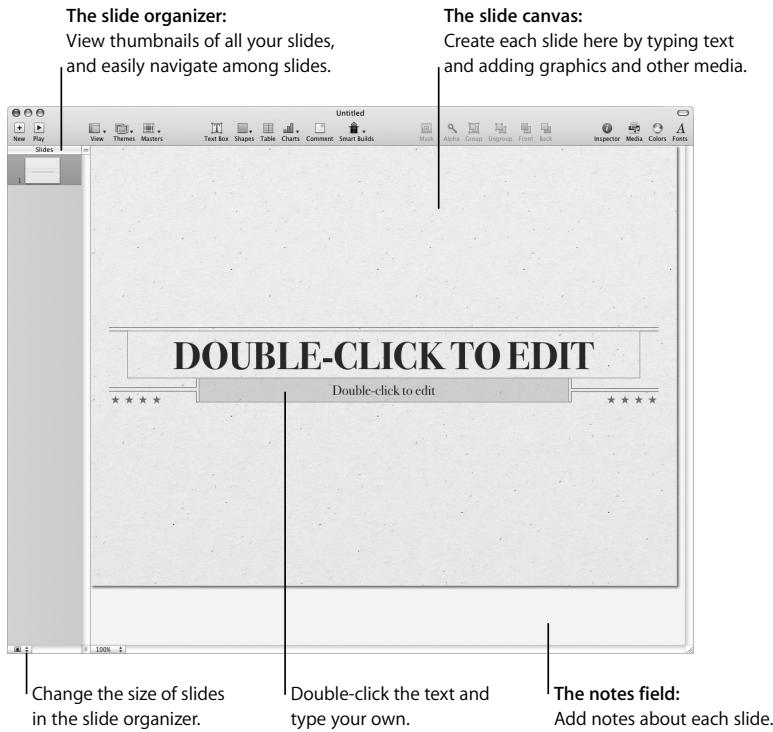
The Slide Organizer
In the slide organizer you can:
• See thumbnails of all your slides.
- Go to a specific slide by clicking it.
- Reorder slides by dragging them.
- Organize slides into groups by indenting them.
The slide organizer has two views:
- Navigator view is most useful for slideshows with graphics.
- Outline view is best for slideshows that contain mostly text. In this view, you can read and edit the text on the thumbnails.
To change from one view to another:
- Click View in the toolbar and choose an option.
To hide the slide organizer:
- Choose View > Slide Only.
If your slideshow contains many slides, you can see more thumbnails at once by using light table view.
To show light table view:
- Click View in the toolbar and choose Light Table.
For more information, see Keynote Help or the Keynote User's Guide.
The Notes Field
You can display a text area where you can write notes about what you want to say about each slide. If you play your slideshow on a computer and viewers watch the slideshow on a different display, you can view these notes during your presentation without your audience seeing them.
To show the notes field:
- Click View in the toolbar and choose Show Presenter Notes.
To learn how to print your notes or view them during a presentation, see Keynote Help or the Keynote User's Guide.
Step 2: Create Slides
Now add some more slides.
Here are some of the ways to add a slide:
- Click New in the toolbar.
- Select a slide in the slide organizer and press Return.
- Choose Slide > New Slide.
When you create a new document, the first slide automatically uses the Title & Subtitle master slide. The next slide (the first slide you add) automatically uses the Title & Bullets master. After that, when you create a new slide, it uses the master of the selected slide.
About Master Slides
Each Keynote theme includes a family of master slides (templates), each with its own layout. Some master slides, for example, have only text; others have placeholders for photos and other media.
You can change the master a slide uses at any time. For example, you might want to change a large photo's orientation from horizontal to vertical. To apply a new master to a slide, select the slide, click Masters in the toolbar, and choose a new master slide.
You can also modify a master slide. When you modify a master slide, all the slides based on that master also change. For example, you could add a logo to a master slide and the logo would automatically appear on every slide—existing slides as well as new ones—using that master.
For more information about changing a slide's master and modifying master slides, see Keynote Help or the Keynote User's Guide.
To delete a slide:
- Select the slide in the slide organizer and press the Delete key.
Adding and Formatting Text
Each slide includes various kinds of text—title, subtitle, bullets—depending on its master. Choose a master slide with the combination of text and other elements that best suits the slide's content.
Most body text is bulleted. For information about creating text without bullets, see "Adding Text Without Bullets" in Keynote Help or the Keynote User's Guide.
Here are ways to work with bulleted text:
- To add a new line of bulleted text, press Return.
- To indent a bulleted line, press Tab.
- To move an indented line to a higher level, press Shift-Tab.
- To add a new line of nonbulleted text (to create a subparagraph under a bullet, for example), press Option-Return.
You can change text properties—such as font, size, color, and spacing—at any time using either the Font panel or the Text Inspector. For more information about these tools, see “The Font Panel” on page 19 and “The Inspector Window” on page 17.
Adding Graphics and Other Media
You can add many types of media to your presentation, including photos, movies, audio, graphics created in other applications, and tables and charts created in Keynote or one of the other iWork '08 applications.
Many of the master slides contain placeholder photos. Although you can add photos anywhere on a slide, dropping a photo on one of these placeholders automatically positions and sizes the photo. You can use the placeholders for other types of media too, including movies and sound files.
Here are ways to add a media file to a slide:
- Drag the file from the Media Browser or the Finder to a media placeholder, or anywhere on the slide.
- Choose Insert > Choose and select the file.
Adding Sound
You can add audio—a music file or playlist from your iTunes library, or any other sound file—to a Keynote document. You can add sound in the following ways:
- As a soundtrack for the entire slideshow: The music starts playing when the slideshow starts.
- On an individual slide: The sound plays when the slide appears and stops when the slideshow advances.
- As recorded narration: You can record yourself talking about each slide.
To add a soundtrack to a whole slideshow:
1 If it isn't open, open the Document Inspector (click Inspector in the toolbar and then click the Document Inspector button).
2 Click Audio.
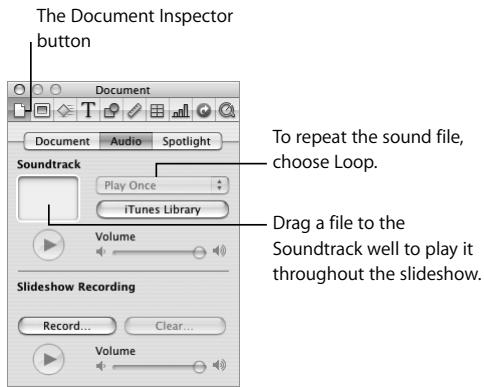
3 Drag an audio file from the Media Browser or the Finder to the Soundtrack well in the Document Inspector.
4 To play the audio file for as long as the presentation plays, choose Loop from the pop-up menu in the Document Inspector.
The music starts playing when the slideshow starts.
To add sound to a specific slide:
- Drag a file from the Media Browser or the Finder to the slide canvas or a media placeholder.
Tip: You can more finely control when music starts and stops by using an object build. See Keynote Help or the Keynote User's Guide for more information.
About Adding Audio and Movie Files
When you add a media file—such as a sound or a movie—to a slideshow, the file is saved as part of the document. This feature ensures that all elements of the slideshow will play correctly if it is transferred to another computer.
To keep a document's file size smaller, you can save your slideshow without copying media files into the document. As long as you play the slideshow on the computer on which it was created (or transfer the media files separately), the slideshow will play correctly.
To learn how to save documents with or without media files, see "Saving a Document" in Keynote Help or the Keynote User's Guide.
Adding Narration
You can record yourself talking about each slide. When you advance to the next slide by clicking the mouse or pressing a key, your timing is recorded as well.
Note: Pointer movements are not recorded, but mouse clicks (if you click a link or a movie, for example) are.
To record a slideshow:
1 If you're using an external microphone instead of your computer's built-in microphone, connect the microphone and use the Sound pane of System Preferences to configure the input settings.
2 Select the slide on which you want the recording to start.
You don't have to select the first slide, but a recorded slideshow plays only from the first recorded slide. If you select a skipped slide, recording starts with the nearest previous unskipped slide.
3 In the Document Inspector, click the Audio button and then click Record (or choose File > Record Slideshow).
4 As the presentation plays, speak into the microphone to record your narration.
A pulsing red light in the upper-left corner of the screen indicates that recording is in progress.
5 To advance to the next slide, click the mouse or press the Right Arrow key.
The following table lists other keyboard commands you can use to control the presentation while you are recording.
| Press | To do this |
| W (white screen), F (freeze), or B (black) | Pause recording. Press any key to resume recording the slideshow. |
| Red recording indicator | Pause recording. |
| Esc | Stop playback and save the recording. |
To play a recorded slideshow:
- To listen to the narration, click the Play button on the Document Inspector's Audio pane. Use the Volume slider to adjust the volume.
- To play a recorded presentation, click Play in the toolbar or choose View > Play Recorded Slideshow.
If you record a slideshow and then modify slides, the recording might be out of sync with the slides. You can rerecord part or all of a recorded slideshow.
Step 3: Organize Your Slides
As described in “The Slide Organizer” on page 105, you can easily reorder slides by dragging them in the slide organizer. There are other ways to organize your slides to make it easier to work on your slideshow.
You can organize slides into groups by indenting them in the slide organizer.
To indent slides:
- Select the slide or slides you want to indent and press Tab.
▶ Tip: Select multiple slides by Shift-clicking (for a range of slides) or Command-clicking (for noncontiguous slides).
You can create more indent levels by pressing Tab again. You can indent a slide only one level deeper than the previous ("parent") slide.
To move slides to a higher level:
- Select the slide or slides and press Shift-Tab.
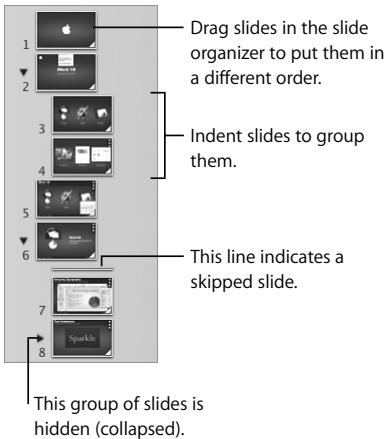
To show or hide a group of slides:
- Click the disclosure triangle to the left of the first slide in the group.
Important: If a group of slides is hidden (collapsed), deleting the first slide deletes the entire group.
To move a group of slides:
- Drag the first slide in the group.
When you play a slideshow, hidden (collapsed) groups of slides appear in the presentation. If you want to hide slides during a slideshow, you can mark them to be skipped.
To skip a slide during playback:
- Select the slide and choose Slide > Skip Slide.
To display a skipped slide:
- Select the slide (it looks like a line in the slide organizer) and choose Slide > Don't Skip Slide.
Step 4: Enhance Your Slideshow with Motion
Keynote makes it easy to add special effects to your presentation.
Adding Transitions Between Slides
Keynote provides a variety of special effects for moving from one slide to the next.
To add a transition to a slide:
1 If the Slide Inspector isn't open, open it (click Inspector in the toolbar and then click the Slide Inspector button).
2 If it's not already selected, click Transition.
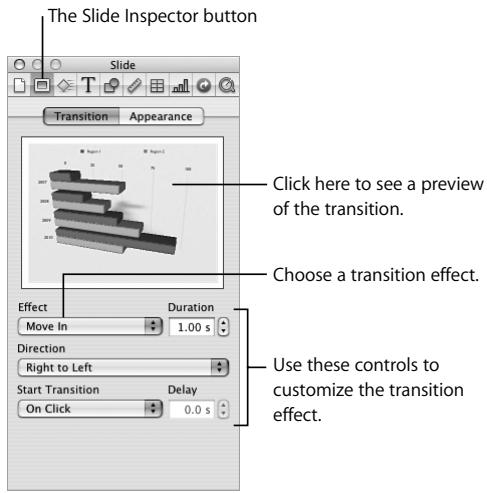
3 Choose an option from the Effect pop-up menu.
4 Choose an option from the Direction pop-up menu (not all transition effects provide this option).
5 To change how long it takes to complete the transition, type a value in the Duration field or click the arrows.
6 Choose an option from the Start Transition pop-up menu:
- On Click starts the transition when you click to move to the next slide.
- Automatically starts the transition after the amount of time specified in the Delay field.
Making Objects Move
Use object builds to make slide elements appear one at a time (or in groups), in any order you like. For example, bulleted text can appear on the slide line by line. Or you can focus on certain parts of a chart by moving them onto the slide one at a time. You can also use object builds to move elements off a slide or to another position on the slide.
There are various kinds of object builds:
- Build In effects move elements onto a slide.
- Build Out effects move elements off a slide.
• Action builds animate elements on a slide. - Smart Builds are predefined action builds for animating images on a slide.
You can create multiple builds on one slide, and you can apply multiple action builds to the same object.
Moving Objects On or Off a Slide
To animate an object as it enters or leaves a slide:
1 If the Build Inspector isn't open, open it.
2 To animate an object entering the slide, click Build In. To animate an object leaving the slide, click Build Out.
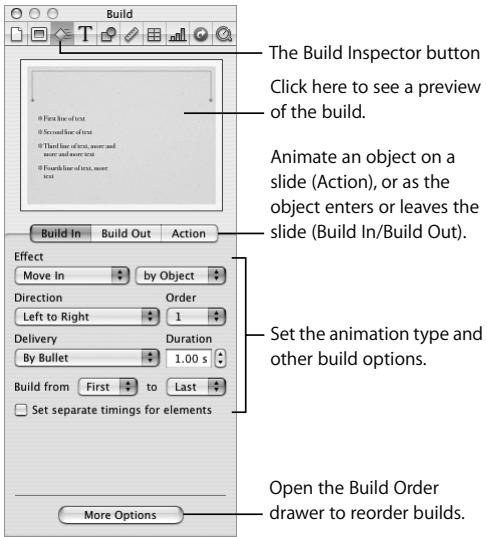
3 Select an object on a slide and choose an option from the Effect pop-up menu.
4 Choose an option from the Direction pop-up menu (not all effects provide this option).
5 To change how long it takes to complete the build, type a value in the Duration field (or click the arrows).
After you choose an effect for each item you want to animate, you can easily change the order in which the items build. You can also choose whether to begin each build automatically (after a specified time) or when you click the mouse.
Here are ways to change the order of object builds:
In the Build Inspector, choose an option from the Order pop-up menu.
- Select "Set separate timings for elements," click More Options, and then drag items in the Build Order drawer.
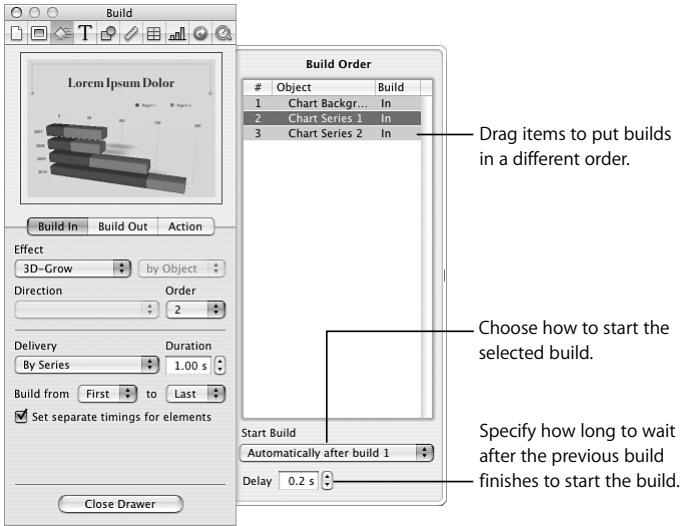
Moving Objects on a Slide
In addition to moving objects on or off a slide, you can move objects from one position on a slide to another—along a custom path—using action builds.
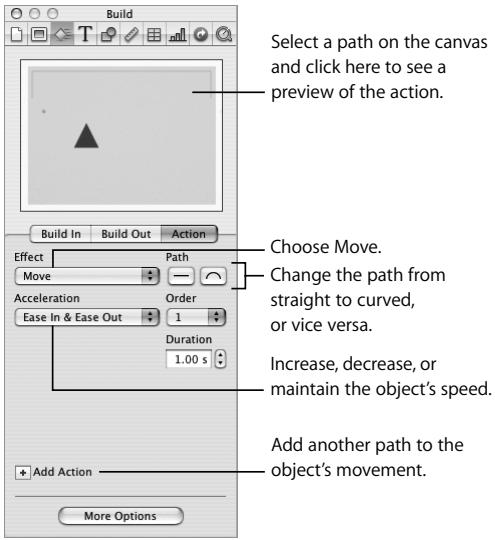
To move an object from one position on a slide to another:
1 Select an object on a slide.
2 In the Build Inspector, click Action, and then choose Move from the Effect pop-up menu.
A red line connected to a "ghosted" (transparent) version of the object appears, showing the object's destination.
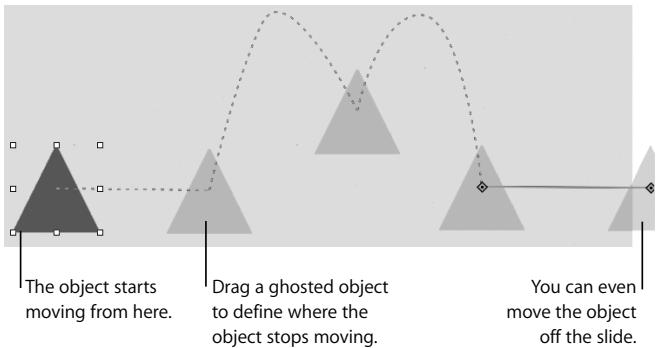
flowchart
graph TD
    A["The object starts moving from here."] --> B["Drag a ghosted object to define where the object stops moving."]
    B --> C["You can even move the object off the slide."]
3 To modify the movement, select the path and do any of the following:
- To change the direction or distance the object moves, drag the ghosted object.
- To change the path from straight to curved, click the curved Path button in the Build Inspector.
- To reshape a curved path, drag one of its nodes or a ghosted object.
- To add a node (point) to a path, hold down the Option key while you click the path.
- To control the speed and nature of the object's movement, use the Acceleration popup menu in the Build Inspector.
4 To add another path for the object, click the Add Path button next to the last ghosted object or the Add Action button in the Build Inspector.
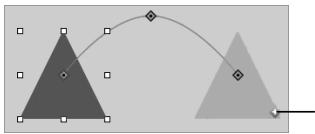
natural_image
Two gray triangles with square markers and a curved line connecting them, no text or symbols present.To add another path for the object, click the Add Path button (next to the last ghosted object).
To view all the motion paths of an object:
Click the red Show Path button next to the object.
natural_image
Simple gray triangle shape with a small circular mark at one corner (no text or symbols)The Show Path button
You can also use action builds to make objects on a slide rotate, fade, grow, or shrink.
To make an object fade, rotate, grow, or shrink:
1 On a slide, select an object.
2 In the Action pane of the Build Inspector, choose Opacity, Rotate, or Scale from the Effect pop-up menu.
3 Use the controls to specify how the object should look when the transformation is complete.
Animating Images Using Smart Builds
Keynote provides predefined action builds you can use to animate a collection of your own photos and other images.
To set up a Smart Build:
1 Click Smart Builds in the toolbar and choose an option.
2 Drag photos from the Photos pane of the Media Browser to the rectangles in the Smart Build photo window.
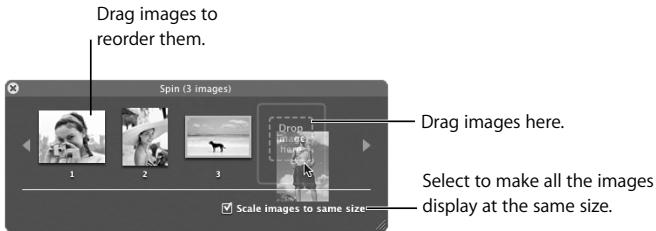
3 Modify the build using the controls in the Smart Build photo window and the Action pane of the Build Inspector.
For more information, see Keynote Help or the Keynote User's Guide.
Step 5: Rehearse and Share Your Slideshow
As you develop your slideshow, you'll want to see what it will look like when you present it.
To play your slideshow on your computer:
1 In the slide organizer, select the slide you want to start with.
2 In the toolbar, click Play.
3 To advance to the next slide (or object build), click the mouse.
4 To stop the slideshow, press Q or Esc.
When you actually give your presentation, if your audience is larger than a few people, you'll want to use a second computer or display. If you have more than one display (your computer and a big projection screen, for example), you can see the presentation—along with your notes and other presenter information—on your computer, while your audience sees only the presentation.
For more information about ways to share your slideshow, see Keynote Help or the Keynote User's Guide.
Rehearsing Your Presentation
Keynote provides a rehearsal view so that you can view your presenter information without having to use a second display.
To rehearse your slideshow:
- Choose View > Rehearse Slideshow.
To scroll presenter notes up or down, press the U or D key. To quit rehearsal view, press Esc.
To customize the presenter's view:
1 Choose Keynote > Preferences, and then click Presenter Display.
2 Select the items you want to appear in the presenter's view.
3 To rearrange items, click Edit Presenter Layout.
Customizing a Presentation for the Audience
Depending on how your slideshow will be viewed, you can set it up to play in different ways:
- Normal: Advances when the presenter clicks the mouse or uses the keyboard. Unless you specify otherwise, your slideshow works this way.
- Hyperlinks only: Advances when the presenter or viewer clicks a hyperlink.
- Recorded: If you recorded your slideshow, this option is automatically selected. Your slideshow plays like a movie using the timing you recorded.
- Self-playing: Advances automatically, like a movie. No user interaction is possible. This kind of presentation is useful in a kiosk setting.
For information about creating these and other kinds of slideshows, see Keynote Help or the Keynote User's Guide.
Continue to Explore
Congratulations—you've completed the Keynote tutorial. Now that you're familiar with the basic tools and features of Keynote, you can continue to explore on your own.
Here are some other ways you might want to develop your slideshow:
- Add movies.
- Customize photos (see "Masking (Cropping) Images" on page 49).
- Add a snapshot of a webpage (called a web view) that updates automatically.
- Add tables and charts.
- Export your slideshow to another format—such as a QuickTime movie that can be viewed on your iPod—or send it to an iLife application such as iWeb or GarageBand.
- Design your own themes and master slides.
Instructions for all these tasks are available in Keynote Help and the Keynote User's Guide.
B
Build Inspector 118
bulleted text 108
C
cell controls 63, 76
Cells Inspector 74
charts
adding and formatting 89
applying textures 94
changing the type 92
showing table data in 88
types 89
color
applying to text or objects 20
changing transparency 20
saving for reuse 20
Colors window 20
cropping (masking) images 49
D
dictionary 42
document
creating new 24,102
exporting 42
saving 24, 25
sharing 42
Document Inspector 110
E
export formats 42, 99
F
floating objects 36
Font panel 19
fonts
adding new collections 19
changing color 27
changing size and other attributes 27
dragging to Favorites 19
Format Bar 16, 27, 92
Formula Bar 62, 82
Formula Editor 82
formulas 80
Function Browser 84
functions 80
G
grammar check 41
H
help
help tags 15
onscreen 15
tour 14
tutorial videos 14
user's guide 14
websites 15
help tags 15
|
images
adding 35, 108, 109
masking (cropping) 49
removing unwanted background 52
importing spreadsheets 57
inspectors
opening more than one at a time 17
panes 17
Inspector window 17
Instant Alpha tool 52
Internet research 42
invisible formatting characters 26
iWeb blog entry exporting to 99
K
keyboard shortcuts 21
L
lists
changing the text or image used for bullets 34
creating 32
formatting 34
generating automatically 33
list style 30
M
masking (cropping) images 49
master slides 107
Media Browser 18, 35
media files adding 35
media placeholders 35
misspelled words 40, 41
N
narration 111
navigator view 105
notes field 104, 106
0
object builds
changing the order 119
creating 117
moving objects on a slide 120
Smart Build 123
viewing action paths 122
objects
adding motion 117
inline or floating 36
moving on and off a slide 117
Smart Build 117
outline view 105
P
page layout documents
adding pages and text 44
reordering content 44
Page Layout templates 24
placeholder photos 108
placeholder text 26
presentations
customizing for audience 125
keyboard commands 112
playing back recorded 112
presenter notes 106
printing 43
proofreading 41
Q
quick formulas 81
R
reference tabs 61
research tools 42
S
saving 25, 55, 103
shapes
adding 39, 95
clipping indicator (too much text to fit) 40
masking (cropping) an image with 51
sheets
adding headers and footers 98
adding page numbers 98
moving tables and charts among 65
refining for printing or sharing 97
using 64
Sheets pane 64
slide canvas 104
Slide Inspector 115, 116
slide organizer 104, 105
slides
adding 106
adding sound to a specific slide 110
deleting 107
moving a group of 114
organizing 113
showing or hiding a group 114
skipping during playback 115
special transitions between 115
thumbnails 104
slideshows
adding a soundtrack 109
adding recorded narration 109
choosing a theme 102
controlling file size 111
customizing the presenter's view 125
recording narration 111
rehearsing 124
sound
adding 109
spelling check
as you type 40
turning off automatic 40
spreadsheet
creating new 56
importing from Excel 57
Styles drawer 30, 31
T
table cells
changing background color 78
formatting 77
formatting borders 79
formatting numbers 73
resizing 76
sorting values 75
tables
adding 63
adding and deleting columns and rows 70
displaying table data in charts 63
formatting 69
header and footer rows 66
navigating 70, 72
selecting 60
selecting a cell 60
template categories 24
Template Chooser 24, 56
templates 24
text
applying styles 29
placeholder text 26
wrapping around objects 37
text boxes
adding 45, 95
linking 47
unlinking 47
Text Inspector 28, 108
text styles
applying 32
character 30
list 30
paragraph 30
themes
changing 103
choosing 102
choosing a theme for all new documents 103
thesaurus 42
toolbar 16
transitions 115
U
user's guide 14
W
Word Processing templates 24
- iWork'08
- Contents
- Welcome to iWork '08
- Welcome to Pages '08
- Welcome to Numbers '08
- Welcome to Keynote '08
- About This Book
- Where to Go for More Help
- Overview of iWork Tools
- The Toolbar and Format Bar
- To customize the toolbar:
- The Inspector Window
- To open the Inspector window:
- To open another Inspector window:
- The Media Browser
- To open the Media Browser:
- The Font Panel
- The Colors Window
- Keyboard Shortcuts
- What You'll Learn
- Step 1: Create a New Document and Choose a Template
- To create a new document:
- Stopping, Saving, and Continuing
- Step 2: Add and Format Text
- To replace placeholder text:
- - Click the text and type.
- ▶ Tip: You might find it easier to work in the document if you display formatting characters such as Return characters. Choose View > Show Invisibles.
- Changing Font Color and Other Text Attributes
- To open the Text Inspector:
- Using Styles and Creating Lists
- To open the Styles drawer:
- To apply a style to a paragraph:
- To apply a style to characters:
- To create a list:
- The List Styles button
- To turn off automatic list creation:
- Step 3: Add Objects
- Using Media Placeholders
- To use a media placeholder:
- Adding Objects
- To add a floating object:
- To add an inline object:
- Wrapping Text Around Objects
- To change text-wrap options:
- Adding Shapes
- To add a shape:
- To add text inside a shape:
- Step 4: Use Writing Tools
- Checking Spelling and Proofreading Your Document
- To turn off automatic spell checking:
- To look for writing errors:
- Tracking Changes
- Researching Information
- To see a word's definition:
- To research information on the Internet:
- Step 5: Share Your Document
- Here are ways to share your document:
- Working with Page Layout Documents
- Creating and Linking Text Boxes
- To add a text box:
- To link text boxes:
- To unlink text boxes:
- Adding and Reordering Pages
- To add a page:
- To reorder pages:
- To show or hide thumbnails:
- Masking (Cropping) Images
- To mask an image:
- To change the size of a mask:
- To mask an image with a shape:
- Removing Unwanted Areas from an Image
- To remove the background from an image:
- To restore parts of an image:
- Continue to Explore
- Step 1: Create a New Spreadsheet
- To create a new spreadsheet:
- Importing Excel and OFX Data
- Step 2: Get Familiar with the Numbers Window
- Introducing Tables
- To learn some basic table characteristics:
- Click the cell containing the text Length in Months.
- Introducing Charts
- To see which table data is represented in the chart:
- Introducing Sheets
- Here are ways to use the Sheets pane:
- Step 3: Create a New Table
- Adding a Table
- To add a table to use in this tutorial:
- Defining Table Elements
- To resize your table by adding columns and rows:
- To resize your table by dragging selection handles:
- To add a fresh table:
- To add a table name:
- Formatting a Table
- To apply a different style to your table:
- Working with Columns and Rows
- To change the columns and rows:
- Navigating from Cell to Cell
- Adding Data
- To apply a cell format to table cells:
- Need Quick Instructions?
- To sort rows:
- To see text wrapping in action:
- Using Cell Controls
- To add a stepper:
- Formatting Cells
- To change the background color of a cell:
- To format a border at the bottom of the table:
- Step 4: Use Formulas and Functions
- Adding a Quick Formula
- To add a quick formula:
- To view a formula:
- Using the Formula Editor
- To view a formula using the Formula Editor:
- To add a formula using the Formula Editor:
- To use autofilling:
- Using the Function Browser to Add a Function
- To add a function using the Function Browser:
- Performing Instant Calculations
- To use instant calculations:
- Using Your Results in the Loan Comparison Table
- To compare loans:
- Step 5: Enhance Your Spreadsheet
- Adding Charts
- To add and format a chart:
- Here are ways to change a chart:
- To change the chart:
- Adding Text, Shapes, and Other Objects
- To add text:
- To add an audio file, graphic, or movie:
- To play an audio or movie file:
- Step 6: Share Your Spreadsheet
- Preparing a Sheet for Sharing
- To paginate a sheet:
- Add headers and footers:
- Printing and Exporting Your Spreadsheet
- Here are ways to share your spreadsheet:
- Step 1: Create a New Document and Choose a Theme
- To create a new slideshow:
- To change a slide's theme:
- Saving, Stopping, and Continuing
- The Slide Organizer
- To change from one view to another:
- To hide the slide organizer:
- To show light table view:
- The Notes Field
- To show the notes field:
- Step 2: Create Slides
- About Master Slides
- To delete a slide:
- Adding and Formatting Text
- Here are ways to work with bulleted text:
- Adding Graphics and Other Media
- Here are ways to add a media file to a slide:
- Adding Sound
- To add a soundtrack to a whole slideshow:
- Click Audio.
- To add sound to a specific slide:
- About Adding Audio and Movie Files
- Adding Narration
- To record a slideshow:
- To play a recorded slideshow:
- Step 3: Organize Your Slides
- To indent slides:
- To move slides to a higher level:
- To show or hide a group of slides:
- To move a group of slides:
- To skip a slide during playback:
- To display a skipped slide:
- Step 4: Enhance Your Slideshow with Motion
- Adding Transitions Between Slides
- To add a transition to a slide:
- Making Objects Move
- Moving Objects On or Off a Slide
- Here are ways to change the order of object builds:
- Object Build
- Moving Objects on a Slide
- To move an object from one position on a slide to another:
- To view all the motion paths of an object:
- To make an object fade, rotate, grow, or shrink:
- Animating Images Using Smart Builds
- To set up a Smart Build:
- Step 5: Rehearse and Share Your Slideshow
- To play your slideshow on your computer:
- Rehearsing Your Presentation
- To rehearse your slideshow:
- To customize the presenter's view:
- Customizing a Presentation for the Audience
- B
- C
- D
- E
- F
- G
- H
- |
- K
- L
- M
- N
- 0
- P
- Q
- R
- S
- T
- U
- W
Marque : APPLE
Modèle : IWORK 08
Catégorie : Suite bureautique