
PAA6 - Uncategorized PHONIC - Free user manual and instructions
Find the device manual for free PAA6 PHONIC in PDF.


| Product Type | Handheld Real-Time Audio Analyzer |
| Model | PAA6 |
| Brand | Phonic |
| Dimensions (H x W x D) | Approx. 200 x 65 x 35 mm |
| Weight | Approx. 250 g (with batteries) |
| Power Supply | 4 x AA batteries (6 V DC) or external power adapter |
| Display | Backlit LCD with real-time spectrum graph |
| Main Functions | Real-time spectrum analysis (RTA), SPL measurement, frequency band analysis, pink noise generator, calibration reference |
| Frequency Range | 31.5 Hz to 16 kHz (one-third octave bands) |
| Measurement Range | 30 dB to 130 dB SPL (with supplied microphone) |
| Precision | ±1.5 dB typical |
| Outputs | 1/4" TRS line out, internal speaker |
| Inputs | Built-in electret condenser microphone, 1/4" TRS line input |
| Connectivity | None (standalone unit) |
| Memory | Internal storage for up to 100 measurements |
| Battery Life | Approx. 10 hours continuous use (alkaline batteries) |
| Maintenance | Clean exterior with dry cloth; check microphone windscreen periodically |
| Safety | Do not disassemble; use only specified power supply; avoid extreme temperatures |
| Spare Parts & Reparability | Contact Phonic authorized service center for battery replacement, microphone, and electronic repairs |
| Warranty | Limited 1-year warranty (check local distributor) |
| Country of Origin | China |
Frequently Asked Questions - PAA6 PHONIC
User questions about PAA6 PHONIC
0 question about this device. Answer the ones you know or ask your own.
Ask a new question about this device
Download the instructions for your Uncategorized in PDF format for free! Find your manual PAA6 - PHONIC and take your electronic device back in hand. On this page are published all the documents necessary for the use of your device. PAA6 by PHONIC.
USER MANUAL PAA6 PHONIC
2-Channel Audio Analyzer with Color Touch LCD
IMPORTANT SAFETY INSTRUCTIONS
The apparatus shall not be exposed to dripping or splashing and that no objects filled with liquids, such as vases, shall be placed on the apparatus. The MAINS plug is used as the disconnect device, the disconnect device shall remain readily operable.
Warning: the user shall not place this apparatus in the confined area during the operation so that the mains switch can be easily accessible.
- Read these instructions before operating this apparatus.
- K eep these instructions for future reference.
- H eed all warnings to ensure safe operation.
- Follow all instructions provided in this document.
- Do not use this apparatus near water or in locations where condensation may occur.
- Clean only with dry cloth. Do not use aerosol or liquid cleaners. Unplug this apparatus before cleaning.
- Do not block any of the ventilation openings. Install in accordance with the manufacturer's instructions.
- Do not install near any heat sources such as radiators, heat registers, stoves, or other apparatus (including amplifiers) that produce heat.
- Do not defeat the safety purpose of the polarized or grounding-type plug. A polarized plug has two blades with one wider than the other. A grounding type plug has two blades and a third grounding prong. The wide blade or the third prong is provided for your safety. If the provided plug does not fit into your outlet, consult an electrician for replacement of the obsolete outlet.
- Protect the power cord from being walked on or pinched particularly at plug, convenience receptacles, and the point where they exit from the apparatus.
- Only use attachments/accessories specified by the manufacturer.
- Use only with a cart, stand, tripod, bracket, or table specified by the manufacturer, or sold with the apparatus. When a cart is used, use caution
when moving the cart/apparatus combination to avoid injury from tip-over.
- Unplug this apparatus during lighting storms or when unused for long periods of time.

- Refer all servicing to qualified service personnel. Servicing is required when the apparatus has been damaged in any way, such as power-supply cord or plug is damaged, liquid has been spilled or objects have fallen into the apparatus, the apparatus has been exposed to rain or moisture, does not operate normally, or has been dropped.
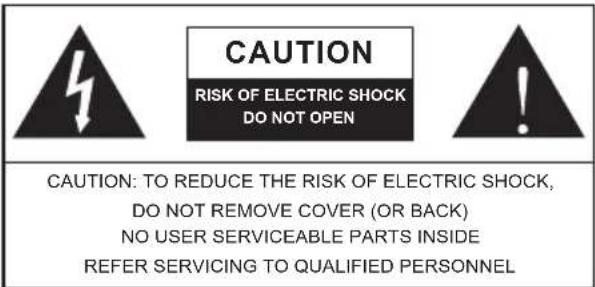

The lightning flash with arrowhead symbol, within an equilateral triangle, is intended to alert the user to the presence of uninsulated "dangerous voltage" within the product's enclosure that may be of sufficient magnitude to constitute a risk of electric shock to persons.

The exclamation point within an equilateral triangle is intended to alert the user to the presence of important operating and maintenance (servicing) instructions in the literature accompanying the appliance.
WARNING: To reduce the risk of fire electric shock, do not expose this apparatus to rain or moisture.
CAUTION: Use of controls or adjustments or performance of procedures other than those specified may result in hazardous radiation exposure.
INTRODUCTION
Congratulations on your purchase of the Phonic PAA6 dual channel professional audio analyzer – a highly accurate audio analyzer that sits comfortably in the palm of your hand and features all the tools you need to set up any audio system.
With 61-band real-time spectrum analysis, fast Fourier transform, sound pressure and dBu / dBV / line voltage measurement, EQ setting, phase and polarity check, LEQ, scope and RT-60, the PAA6 is the ideal companion for all sound engineers. This professional audio analyzer is powered by a long-life lithium-ion and offers two built-in omni-directional microphones and balanced XLR inputs and outputs, ensuring all audio analyzing situations are possible. With the PAA6, you will no doubt conquer the acoustics of all environments with precision and ease.
Phonic understands the importance of sound reproduction management. We know that, as this is your profession, your first – and perhaps only – concern is sound quality. Consequently, with an audio tool like the PAA6, you expect a precise rule to obtain accurate measurements and guarantee the best possible quality of sound that any professional would expect. We at Phonic took the utmost of care in ensuring the PAA6 is an extremely accurate and effective means for you to gather all the data necessary to determine what your set up needs.
To help you familiarize yourself with the PAA6, this manual includes instructions and tips on every function listed in the main menu and sub-menus. It is recommended that you take the time to have a read of it. After doing so, store it in an easily accessible place in case it's needed in future.
FEATURES
- Powerful dual channel palm-size audio analyzer
- 480 x 272 color LCD touch screen
- Elegant graphical user interface
- Two built-in measurement condenser mic can be put in remote position
- Useful functions include RTA, LEQ, RT-60, FFT, THD+N, Polarity, Phase, Scope and Meter (dB SPL, dBu, dBV & Volt)
- Long-lasting rechargeable lithium-ion battery system
- Tone generator includes pink noise, white noise, sine wave, sweep, polarity, triangle and square
- USB port and SD card slot included for storing and retrieving data
- Capture function immediately takes screen shots of the current function and stores them as BMP files (an image format universally recognized by all computers)
• 30 - 130 dB SPL meter
PACKAGE CONTENTS
- PAA6 Unit
- AC Power Adaptor
- USB Cable
- 3/8" and 5/8" microphone stand adaptors
- User Manual
SOFTWARE
The PAA6 Windows software is available through the PAA6 product page on www.phonic.com. Be sure to read all instructions provided with the software carefully.
CONTROLS & DISPLAY
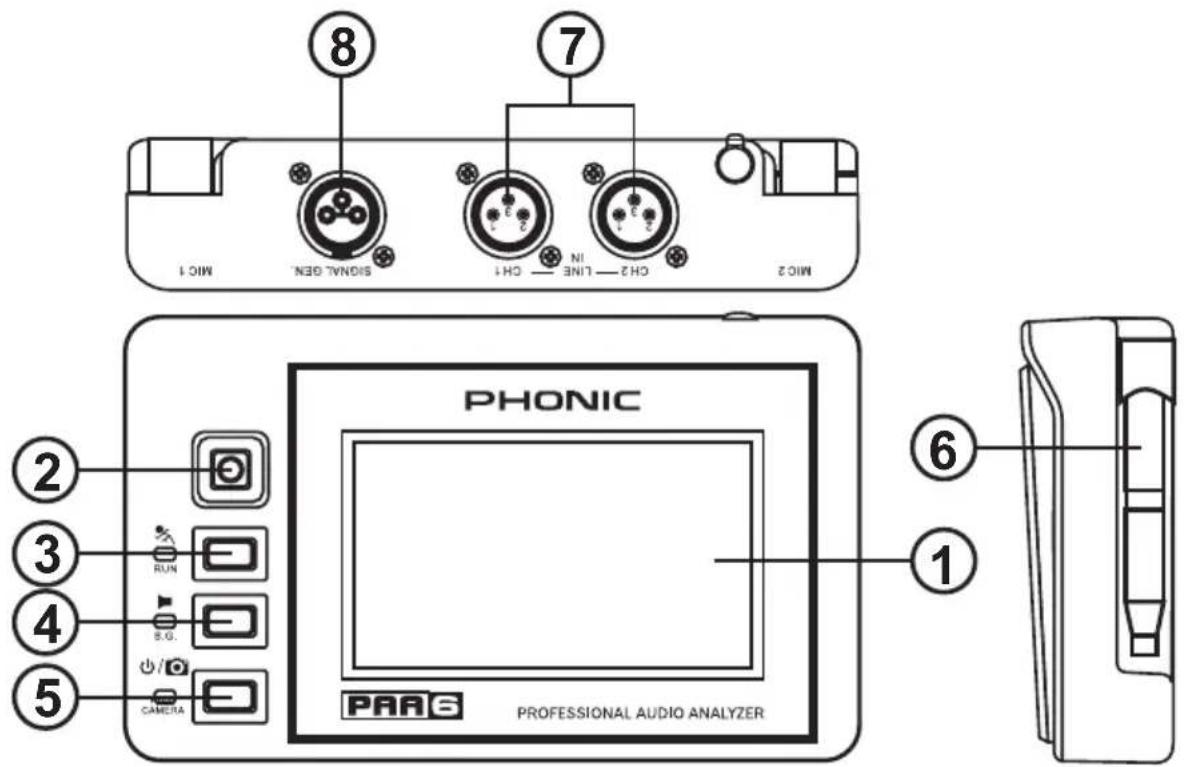
1. Color Touch Screen
All features, functions and controls of the PAA6 can be viewed and adjusted using this display window. The touch screen should be calibrated the first time you use it. You can calibrate the screen at any time by accessing the System menu and selecting Calibration.
2. Directional Control
Push this little control twice in quick succession to activate manual control. You can then use this control to select the onscreen zone that you wish to control. Push the control in twice to select this zone, and use the control to select any of the onscreen icons.
3. Run/Stop Button and Indicator
Push this button to activate ("RUN") the currently selected function. Push it again to deactivate ("STOP") the function. When a function is running, the accompanying LED will light up.
4. Signal Generator Button and Indicator
Pushing this button will activate and deactivate the built-in signal generator. When the signal generator is active, the accompanying LED will illuminate.
5. Power / Capture Button and Indicator
Push this button to turn on the PAA6. When the unit is on users can push and hold the button for two or three seconds to turn off the unit.
A quick push of the power button while the PAA6 is on will capture the current screen and save a BMP file to the inserted SD card.
6. Built-in Microphones
These two built-in microphones can be used to take measurements with the PAA6. The microphones can be adjusted into 6 different positions for taking measurements. They can also be replaced back close to the body of the PAA6 to allow it to fit better into your pocket.
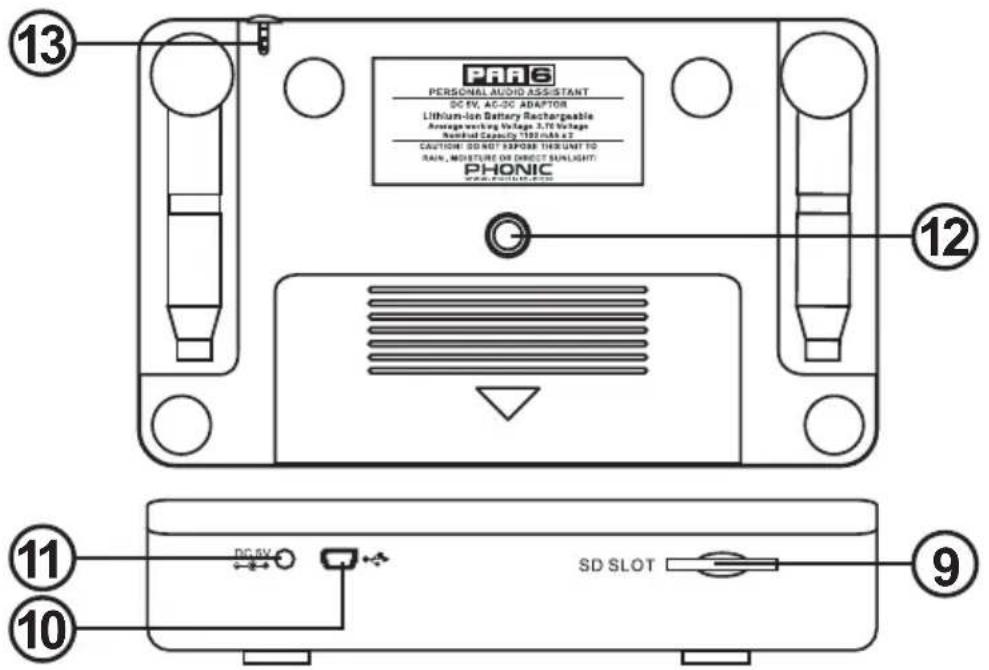
7. Balanced XLR Inputs
These balanced inputs allow users to feed signals from external devices into the PAA6 to take various readings in any number of different functions. To use the XLR inputs as your input source, select "Line in" as the function's primary input source.
8. Balanced XLR Output
This connector is for sending a balanced signal from the internal tone generator to external devices. The level of the output signal is determined by the tone generator software.
9. SD Memory Card Slot
Insert an appropriate SD memory card into this slot to save your readings.
10. USB Connector
Connecting the PAA6 to your computer through this USB connector will allow users to upload and download saved readings to and from the PAA6 or any SD card inserted into the PAA6's SD card slot. Real time operation will also possible through a future online update, so please check www.phonic.com for information on software updates.
11. DC Power Input
Connect the included DC power supply here to recharge the built-in battery. The DC power supply can also be used to operate the unit without wasting the battery life.
12. Stand Mount
A stand mount is located on the rear of the PAA6. This allows for connection to a tripod or any other stand that has a standard #6 - 20 connecting screw. These are often found on camera tripods. Also included with the PAA6 is a stand adapter, allowing the unit to be mounted on microphone stands as well.
13. Touch Pen
The PAA6's touch pen can be found in this slot. Replace the pen into the slot when it is not being used to ensure you do not lose it.
GETTING STARTED
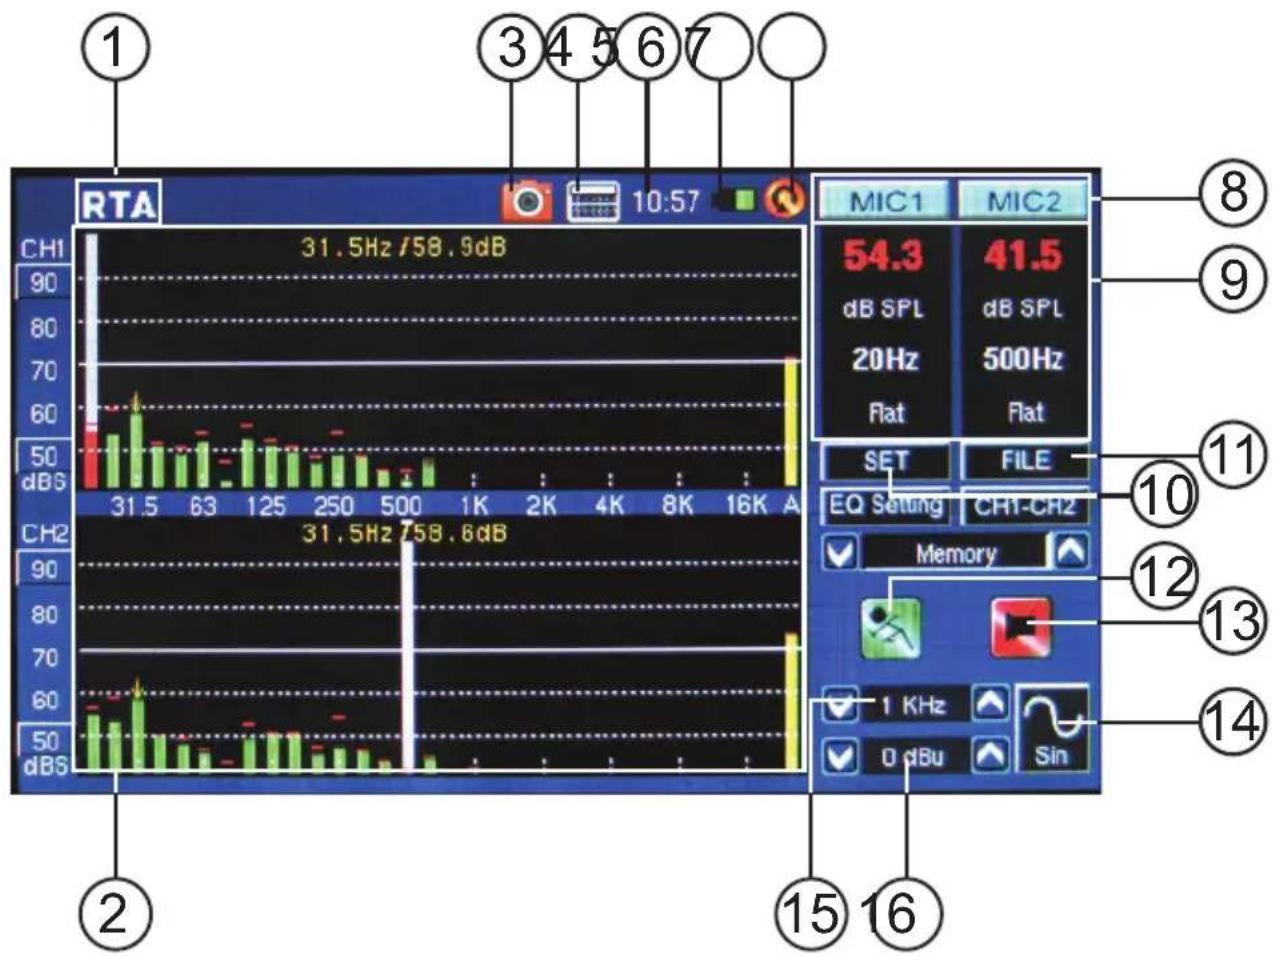
When you initially start the PAA6, the first page you see will be the main menu. Here all 9 of the audio analysis functions can be easily accessed, as well as the SYSTEM setup function. Although all of the function screens different slightly, many of the onscreen options are similar as can be seen in the below diagram.
bar
| Component | Value | | --------- | --------- | | MIC1 | 54.3 | | MIC2 | 41.5 | | SET | - | | FILE | - | | EQ Setting | CH1-CH2 | | Memory | - | | 1 KHz | - | | 0 dBu | - | | Sin | - |- Function Title – The name of the function you are currently using is displayed here.
- Analyzer Display Window – Your currently selected function's results will be displayed here.
- Capture Icon – Tap this icon to immediately save the current screen in BMP format to your SD card. Files are captured in resolution identical to the PAA6 screen resolution (480 x 272).
-
Calculator – Users can pull up the onboard calculator by pushing this onscreen icon. Using the calculator will not affect the results of your current function.
-
Time – The time will be displayed here. Users can set the time in the System menu or directly by clicking the time on the top of the screen to bring up the time settings. Like the calculator, bringing up the time menu will not affect the current function.
-
Battery Indicator – This little bar gives users an indication of the current battery levels. When the indicator turns red, it's advised that you connect the DC power adapter to the unit. A full green bar means the battery is fully charged.
-
Back Icon – Push this small icon to return to the previous screen.
- Channel Icons – These two small boxes indicate the currently active input channels (MIC1 and MIC2 or Line1 and Line2). Touching either of these boxes will activate and deactivate that channel.
- Properties Windows – This small window will display properties of the incoming signal, typically the currently selected frequency band's level (whether in dB SPL, dBu, dBV or Volt), the frequency of those peaks and the unit currently being measured. Depending on the function, the results shown here may differ slightly.
- SET Icon – Found on all functions, the SET icon will allow users to directly adjust the appropriate parameters of their currently selected operation.
- FILE Icon – Users can select this icon to load, save or delete any of their readings. Readings can be saved to either the PAA6 itself or an external SD card and are saved as *.txt files.
- Run/Stop Icon – When this icon is red and the stick-figure within seems to be standing still, the current function is not active. Push the icon to activate the function. The icon will turn green and the stick figure will appear to be running. This button works along-side the RUN/STOP button found on the left-hand side of the PAA6.
13 Signal Generator On/Off Icon – Push this icon to turn the onboard signal generator on and off. When the signal generator is off, the icon will be red. When it is on, the icon will be green. This button works concurrently with the S.G. Button on the left-hand side of PAA6.
14. Signal Generator Icon – The currently selected signal will be represented in this icon, whether it be a sine wave, triangle wave, sweep, etc. Push this icon to access the signal generator setup menu.
15. Signal Generator Frequency – This option allows users to adjust the frequency of the outgoing signal between 20 Hz and 20 kHz without having to enter the signal generator setup. When using the sweep signal, this area will give a real-time update on the current frequency being sent from the signal generator output. When white noise or pink noise are selected, the currently selected 'filter mode' will be indicated here – whether it's flat, 1/3 octave or 1 octave.
16. Signal Generator Level – As with the above option, users can adjust the signal generator's output signal level without entering the signal generator setup menu. The signal level can be adjusted between 4 dBu and -40 dBu for all of the built-in signals.
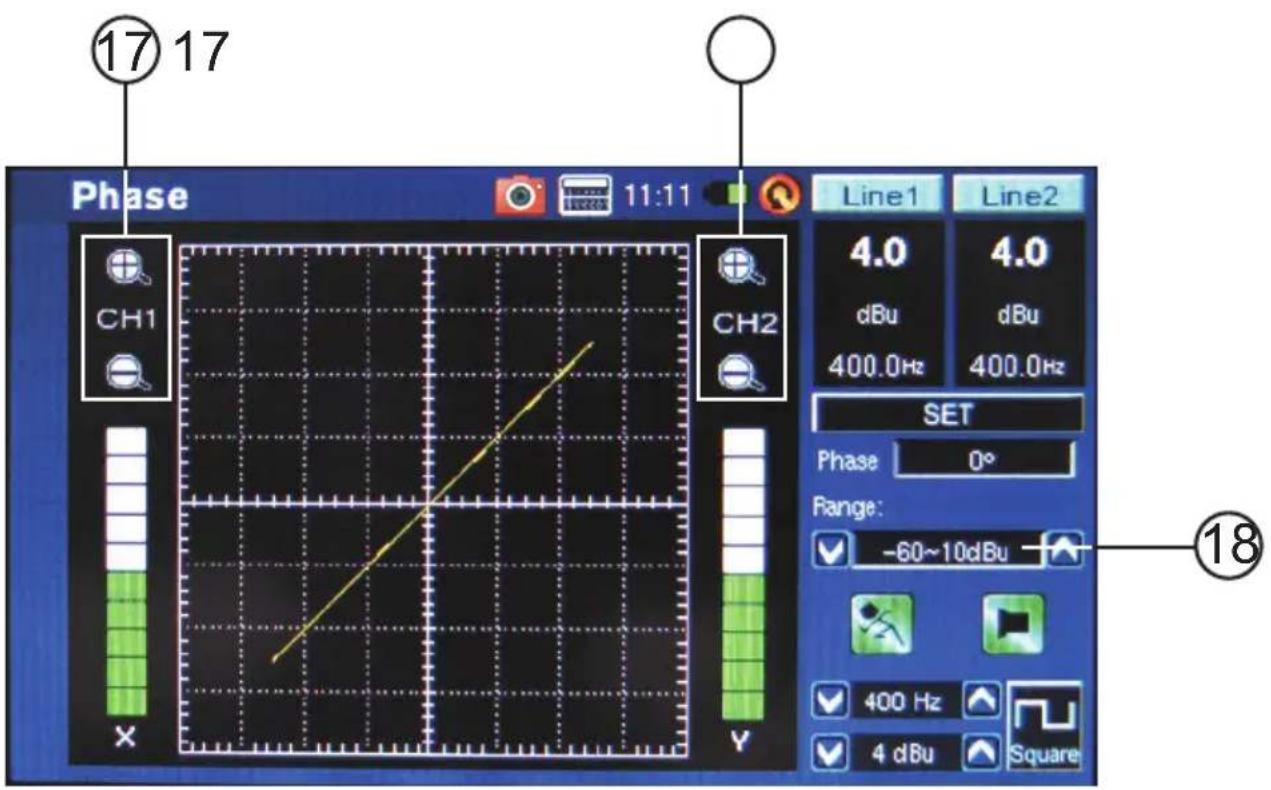
- Zoom Icons – Featured on functions like Phase and Scope, these + and – icons will allow users to zoom in and out on their current results. In the case of the Phase meter, these icons will allow users to zoom in on the X and Y axis of the accompanying graph.
- Range Level – Featured on the Phase, Scope and Polarity functions, the range allows users to switch between a variety of dB SPL, dBu, dBV and Voltage ranges, depending which unit is currently selected.
OPERATING TIPS
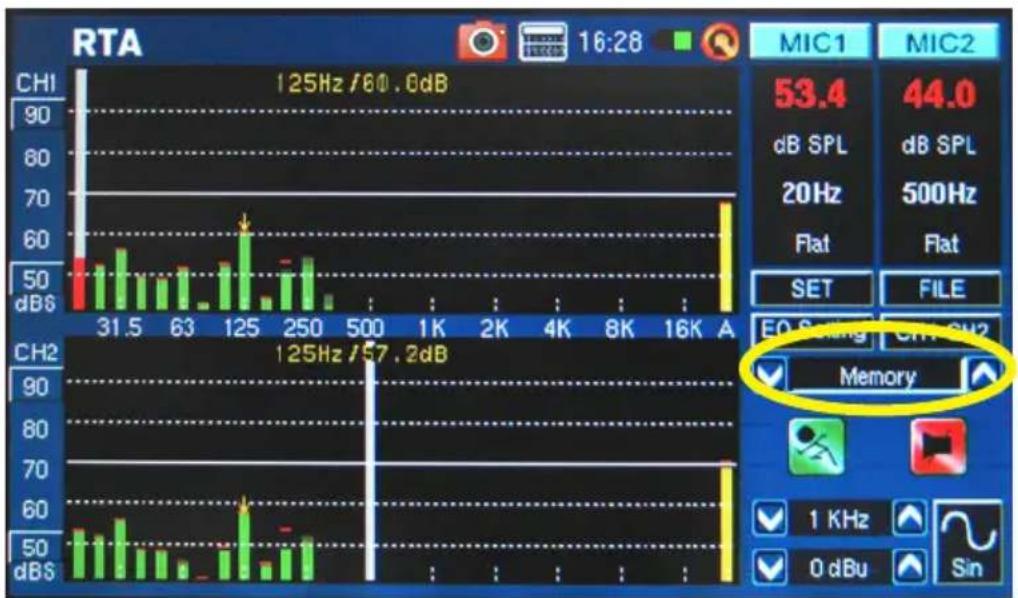
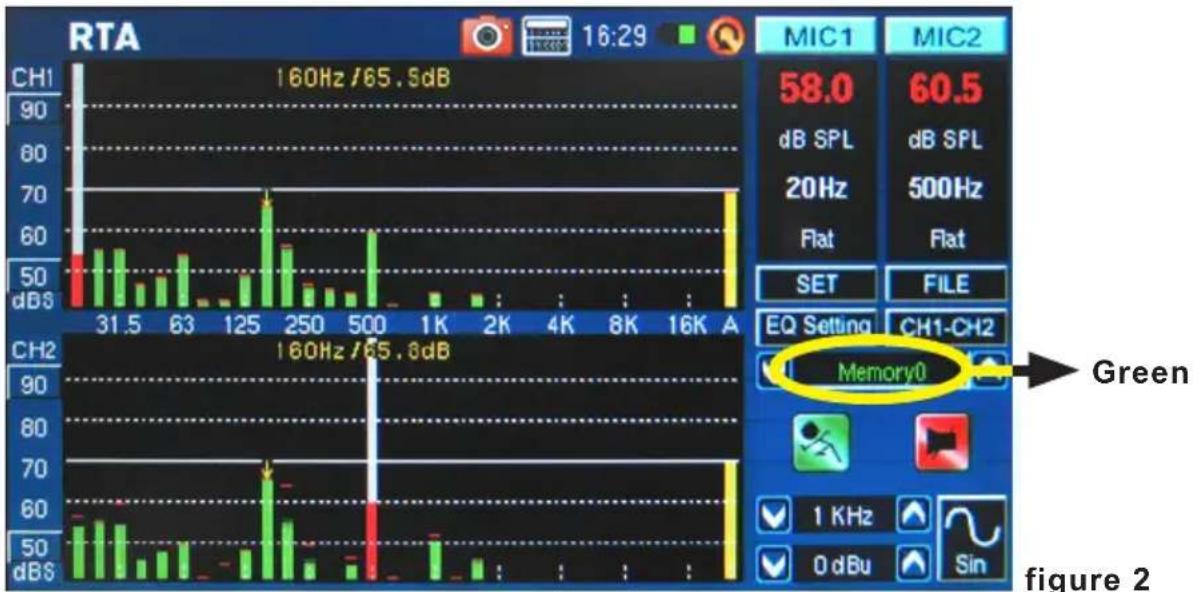
- Save your readings quickly using the touch screen. On the right hand side of the display there is a window that reads "Memory" followed by a slot number (0, 1, 2, 3, and so forth). Push the up and down arrows (figure 1) to change the memory slot number, click the memory slot name to save. Green text indicates that data has not yet been written to that slot (figure 2); red indicates that data has already been written to that slot (figure 3).
bar
RTA | Frequency (MHz) | CH1 (dB) | CH2 (dB) | | :--- | :--- | :--- | | 31.5 | 50 | 50 | | 63 | 50 | 50 | | 125 | 60 | 60 | | 250 | 50 | 50 | | 500 | 50 | 50 | | 1K | 50 | 50 | | 2K | 50 | 50 | | 4K | 50 | 50 | | 8K | 50 | 50 | | 16K | 50 | 50 | A | 70 | 70 | 125Hz / 60.0 dB 125Hz / 57.2 dB MIC1 MIC2 53.4 dB SPL 44.0 dB SPL 20Hz 500Hz Flat Flat SET FILE EQ Setting CH1 SH2 ✓ Memory ✓ 1 KHz ✓ ✓ 0 dBu ✓ Sinfigure 1
bar
| Frequency | Channel Voltage (dB) | Channel Voltage (dB) | | --------- | -------------------- | -------------------- | | 31.5 | 58.0 | 60.5 | | 63 | 58.0 | 60.5 | | 125 | 58.0 | 60.5 | | 250 | 58.0 | 60.5 | | 500 | 58.0 | 60.5 | | 1K | 58.0 | 60.5 | | 2K | 58.0 | 60.5 | | 4K | 58.0 | 60.5 | | 8K | 58.0 | 60.5 | | 16K | 58.0 | 60.5 | | 31.5 | 70.0 | 70.0 | | 63 | 70.0 | 70.0 | | 125 | 70.0 | 70.0 | | 250 | 70.0 | 70.0 | | 500 | 70.0 | 70.0 | | 1K | 70.0 | 70.0 | | 2K | 70.0 | 70.0 | | 4K | 70.0 | 70.0 | | 8K | 70.0 | 70.0 | | 16K | 70.0 | 70.0 | | 31.5 | 90.0 | 90.0 | | 63 | 90.0 | 90.0 | | 125 | 90.0 | 90.0 | | 250 | 90.0 | 90.0 | | 500 | 90.0 | 90.0 | | 1K | 90.0 | 90.0 | | 2K | 90.0 | 90.0 | | 4K | 90.0 | 90.0 | | 8K | 90.0 | 90.0 | | 16K | 90.0 | 90.0 | | 31.5 | 160.0 | 160.0 | | 63 | 160.0 | 160.0 | | 125 | 160.0 | 160.0 | | 250 | 160.0 | 160.0 | | 500 | 160.0 | 160.0 | | 1K | 160.0 | 160.0 | | 2K | 160.0 | 160.0 | | 4K | 160.0 | 160.0 | | 8K | 160.0 | 160.0 | | 16K | 160.0 | 160.0 | | CH1 | CH1 | CH1 | | CH2 | CH2 | CH2 | | SET | SET | SET | | EQ Setting| EQ Setting | EQ Setting | | MemoryO | MemoryO | MemoryO | | Green | MemoryO | MemoryO | | Figure 2 | | |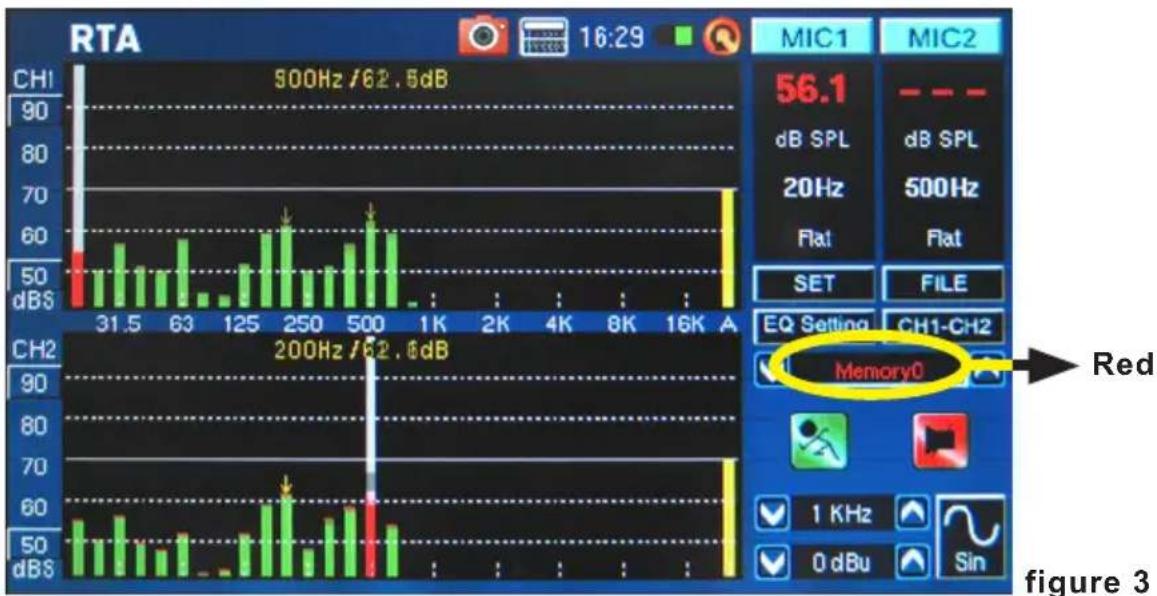
bar
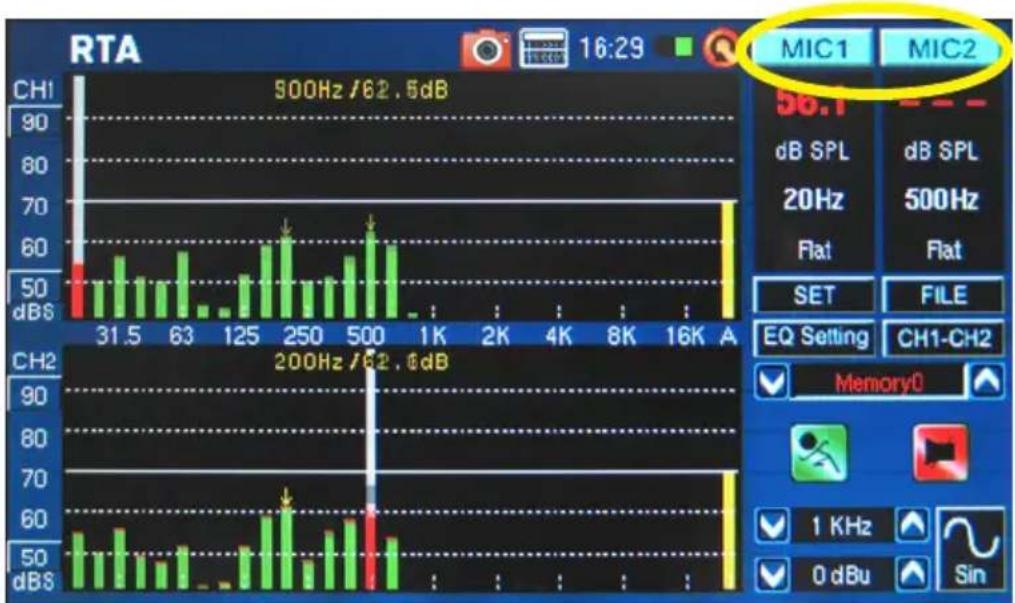
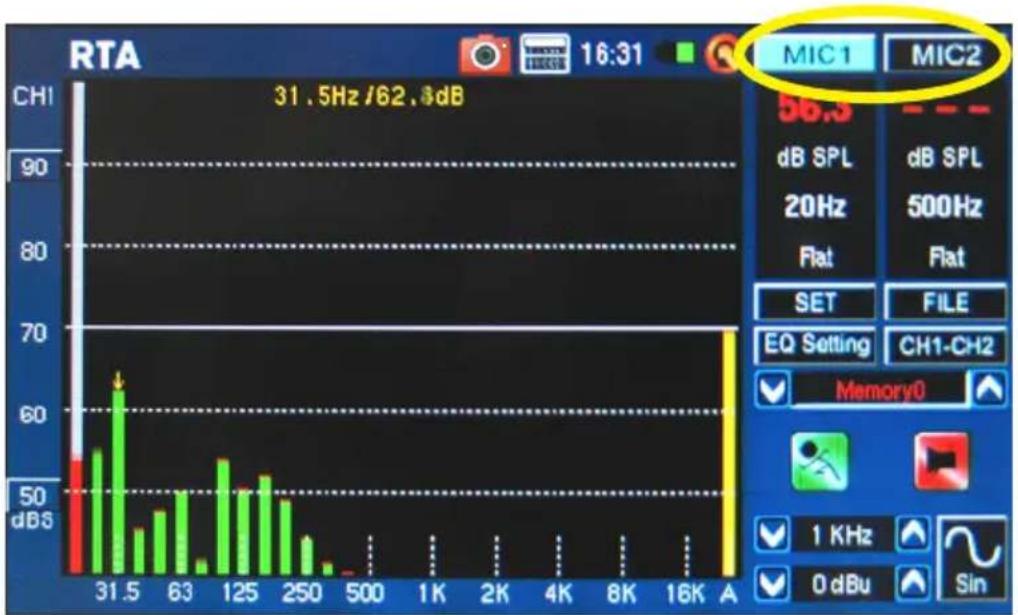
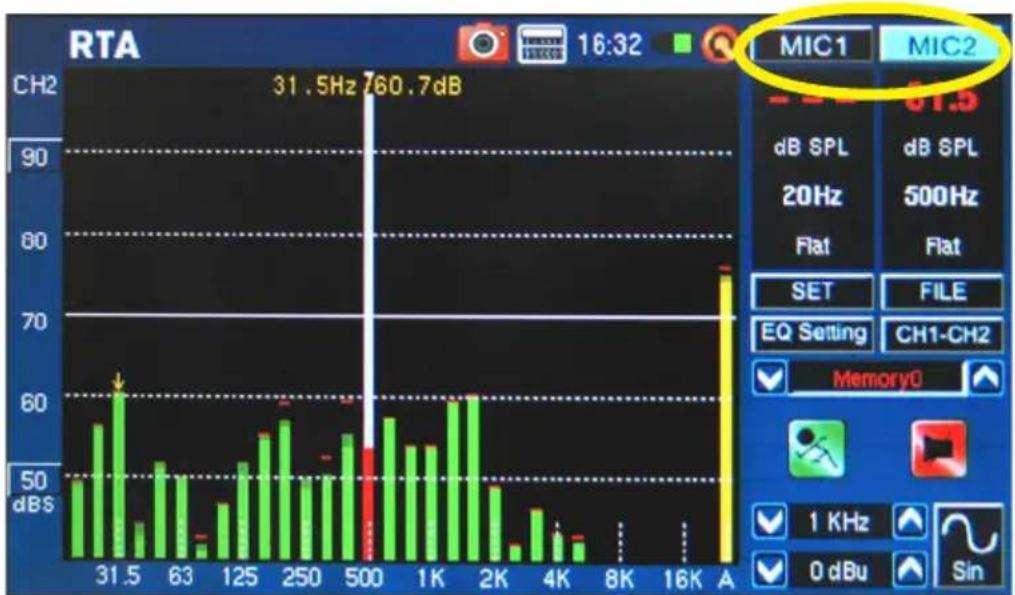
| Frequency | Channel Voltage (dB) | | --------- | -------------------- | | 31.5 | 56.1 | | 63 | 56.1 | | 125 | 56.1 | | 250 | 56.1 | | 500 | 56.1 | | 1K | 56.1 | | 2K | 56.1 | | 4K | 56.1 | | 8K | 56.1 | | 16K | 56.1 | | 31.5 | 200Hz / 62.6dB | | 63 | 200Hz / 62.6dB | | 125 | 200Hz / 62.6dB | | 250 | 200Hz / 62.6dB | | 500 | 200Hz / 62.6dB | | 1K | 200Hz / 62.6dB | | 2K | 200Hz / 62.6dB | | 4K | 200Hz / 62.6dB | | 8K | 200Hz / 62.6dB | | 16K | 200Hz / 62.6dB |- Push the MIC1/MIC2 icons (see figure 4 - 6) or Line1/Line2 icons to deactivate the corresponding channels, allowing users to read only the results of the other channel. If you feel the PAA6 has stopped working, be sure you haven't simply deactivated both channels (see figure 7)!
bar
| Frequency | MIC1 (kHz) | MIC2 (kHz) | | :--- | :--- | :--- | | 31.5 | 50 | 50 | | 63 | 50 | 50 | | 125 | 50 | 50 | | 250 | 60 | 60 | | 500 | 60 | 60 | | 1K | 50 | 50 | | 2K | 50 | 50 | | 4K | 50 | 50 | | 8K | 50 | 50 | | 16K | 50 | 50 | A 500Hz / 62.5dB 200Hz / 62.6dB MIC1 MIC2 56.1 dB SPL dB SPL 20Hz 500Hz Flat Flat SET FILE EQ Setting CH1-CH2 Memory0 1 KHz 0 dBu Sinfigure 4
bar
| Frequency (Hz) | MIC1 (dB) | MIC2 (dB) | |---|---|---| | 31.5 | 55 | 64 | | 63 | 40 | 50 | | 125 | 55 | 52 | | 250 | 48 | 30 | | 500 | 1 | 1 | | 1K | 0 | 0 | | 2K | 0 | 0 | | 4K | 0 | 0 | | 8K | 0 | 0 | | 16K | 0 | 0 | A | 70 | 70 | 31.5 Hz /62.8 dB MIC1 MIC2 16:31 1 KHz 0 dBu Sinfigure 5
bar
| Frequency | Frequency (Hz) | | :--- | :--- | | 31.5 | 60.7 | | 63 | 50 | | 125 | 55 | | 250 | 58 | | 500 | 90 | | 1K | 60 | | 2K | 50 | | 4K | 40 | | 8K | 30 | | 16K | 20 | | A | 75 |figure 6
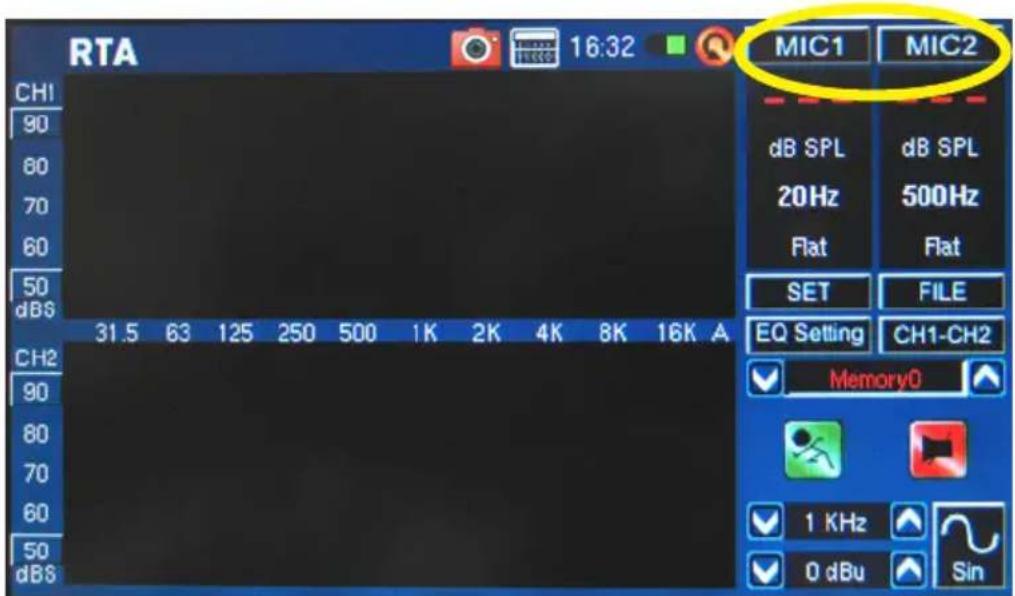
figure 7
- It is not recommended that you continue using PAA6 for any measurements when the battery is low. Always ensure you have the charger on hand, just in case.
- Push and hold the power button for 3 seconds to turn the unit off. In the unlikely event that the PAA6 crashes, push and hold the power button for 10 seconds to turn it off.
- If you need to make quick calculations, the PAA6's calculator can be brought up without quitting your current function (figure 8).
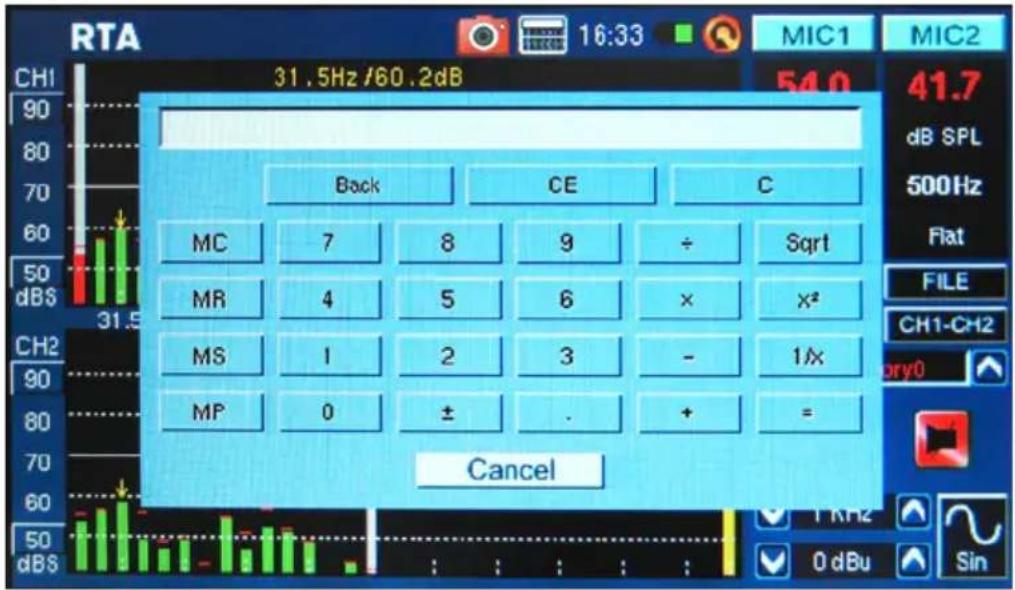
figure 8
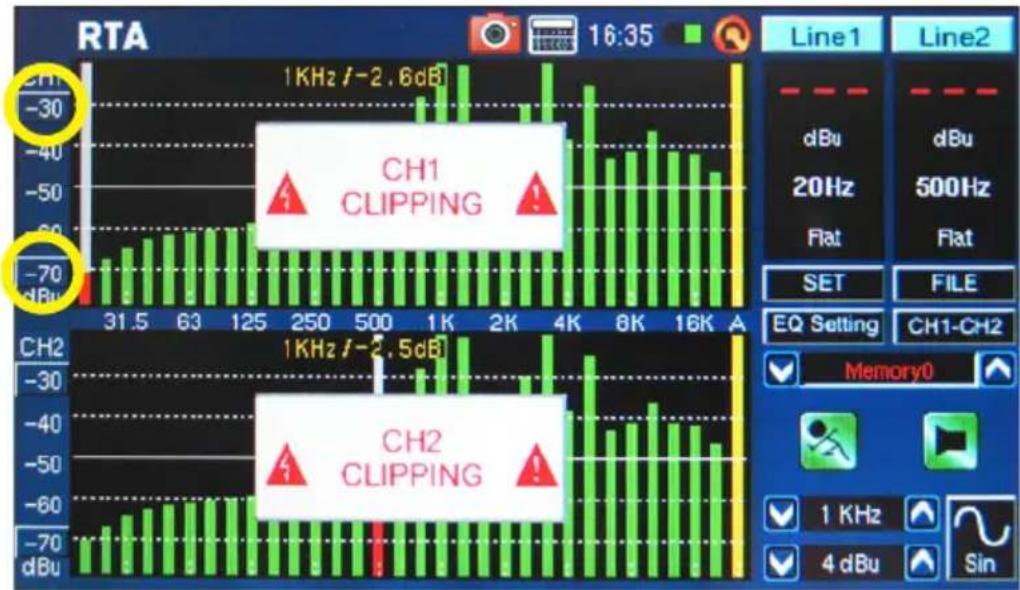
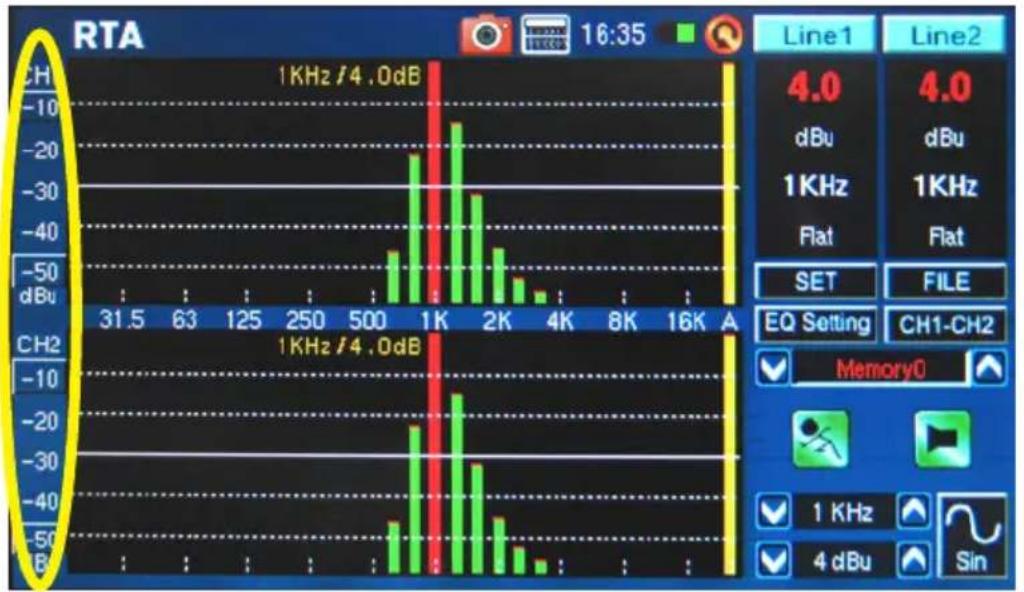
- Particularly usefully in RTA mode: if you're finding that one or more of your channels is clipping continuously, just find the 'dBS' or 'dBu' values to the left of the screen (see figure 9 and 10). Clicking the very top value (which should be contained within a small square) will scroll your window up and give you higher readings – without the clipping.
bar
| Frequency (GHz) | Channel | Signal Label | |---|---|---| | 1KHz / -2.6 | CH1 CLIPPING | 1 KHz / -2.6 dB | | 1KHz / -2.5 | CH2 CLIPPING | 1 KHz / -2.5 dB | | 4 dB | CH2 CLIPPING | 4 dBu Sin |figure 9
bar
| Frequency (kHz) | Value (dB) | | :--- | :--- | | 1K | -20 | | 2K | -30 | | 3K | -40 | | 4K | -50 | | 5K | -55 | | 6K | -58 | | 7K | -59 | | 8K | -60 | | 9K | -61 | | 10K | -62 | | 11K | -63 | | 12K | -64 | | 13K | -65 | | 14K | -66 | | 15K | -67 | | 16K | -68 | | 17K | -69 | | 18K | -70 | | 19K | -71 | | 20K | -72 | | 21K | -73 | | 22K | -74 | | 23K | -75 | | 24K | -76 | | 25K | -77 | | 26K | -78 | | 27K | -79 | | 28K | -80 | | 29K | -81 | | 30K | -82 | | 31K | -83 | | 32K | -84 | | 33K | -85 | | 34K | -86 | | 35K | -87 | | 36K | -88 | | 37K | -89 | | 38K | -90 | | 39K | -91 | | 40K | -92 | | 41K | -93 | | 42K | -94 | | 43K | -95 | | 44K | -96 | | 45K | -97 | | 46K | -98 | | 47K | -99 | | 48K | -100 | | 49K | -101 | | 50K | -102 | | 51K | -103 | | 52K | -104 | | 53K | -105 | | 54K | -106 | | 55K | -107 | | 56K | -108 | | 57K | -109 | | 58K | -110 | | 59K | -111 | | 60K | -112 | | 61K | -113 | | 62K | -114 | | 63K | -115 | | 64K | -116 | | 65K | -117 | | 66K | -118 | | 67K | -119 | | 68K | -120 | | 69K | -121 | | 70K | -122 | | 71K | -123 | | 72K | -124 | | 73K | -125 | | 74K | -126 | | 75K | -127 | | 76K | -128 | | 77K | -129 | | 78K | -130 | | 79K | -131 | | 80K | -132 | | 81K | -133 | | 82K | -134 | | 83K | -135 | | 84K | -136 | | 85K | -137 | | 86K | -138 | | 87K | -139 | | 88K | -140 | | 89K | -141 | | 90K | -142 | | 91K | -143 | | 92K | -144 | | 93K | -145 | | 94K | -146 | | 95K | -147 | | 96K | -148 | | 97K | -149 | | 98K | -150 | | 99K | -151 | | 100K | -152 | | Note: The frequency values are not explicitly labeled but are estimated based on the 'GHz' label in the chart.figure 10
- If you will be reading measurements off the screen without touching it, be sure to turn the backlight's sleep mode 'off', otherwise the screen will go dark after a few minutes (see figure 11). This is done through the System > Display menu.
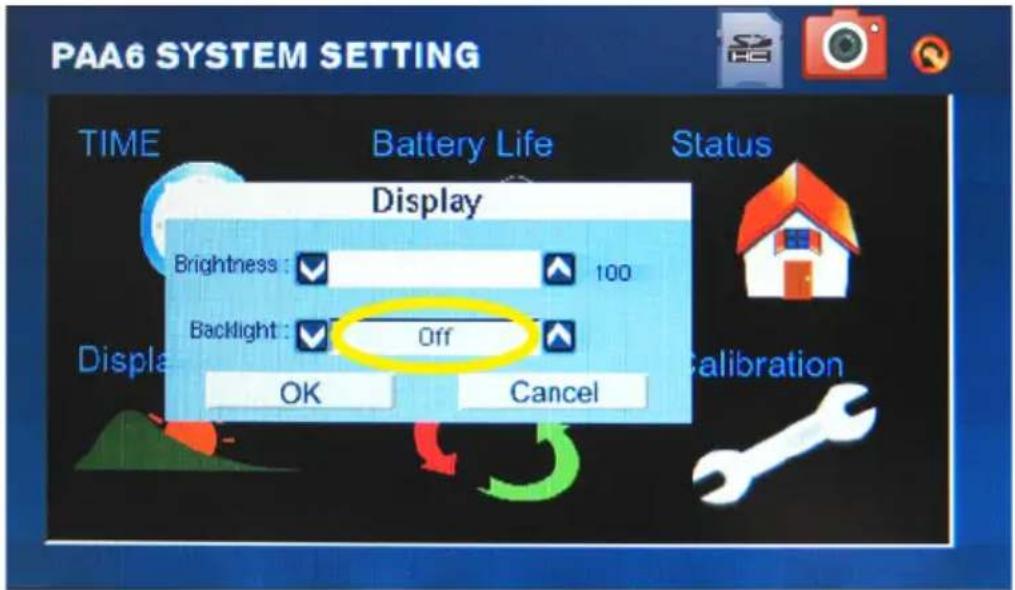
figure 11
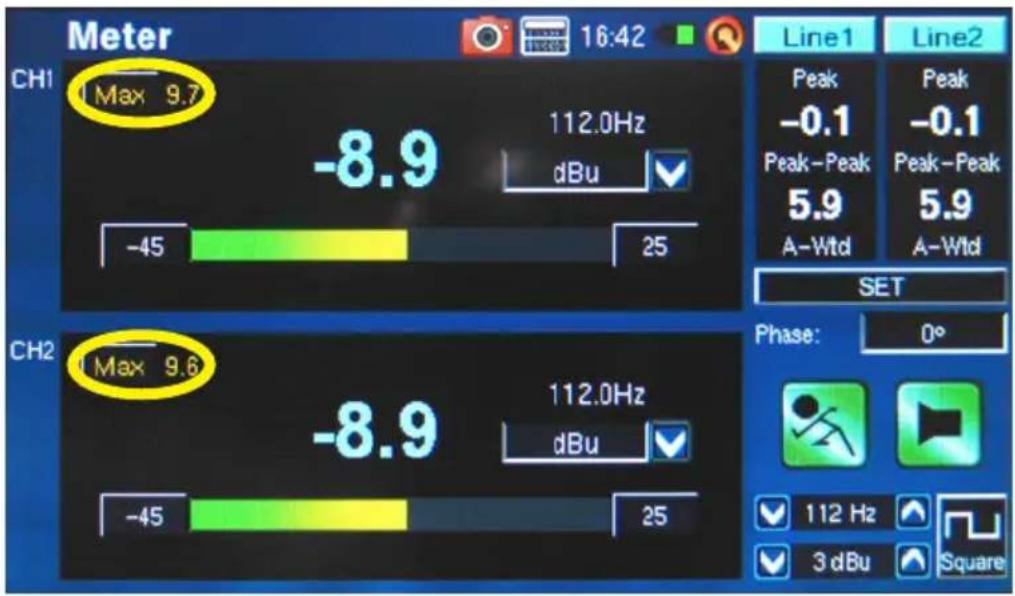
- To refresh the maximum SPL display, simply push the word "Max" on screen (figure 12).
bar
| Channel | Peak | Peak - Peak | A-Wtd | Phase | | :--- | :--- | :--- | :--- | :--- | | CH1 | 9.7 | -8.9 dBu | -45 | 0 | | CH2 | 9.6 | -8.9 dBu | -45 | 0 |figure 12
- Pushing the Run/Stop and Signal Generator (S.G.) buttons on the left of the PAA6 may be quicker than pushing the onscreen icons.
- The PAA6 cannot be charged through the USB connector. To charge the unit, the provided DC power adapter needs to be connected to the PAA6.
- When the PAA6 is off and charging, the power LED will flash. This LED will stop flashing when the battery is fully charged.
- Tap the camera 📋 icon in the software header to immediately capture a suitable file. This capture icon is found on every page. Users can also tap the power button to perform the same function.
- View captured readings by going into the main menu, accessing the "System" menu and selecting the SD card icon at the top of the screen.
AUDIO ANALYSIS FUNCTIONS
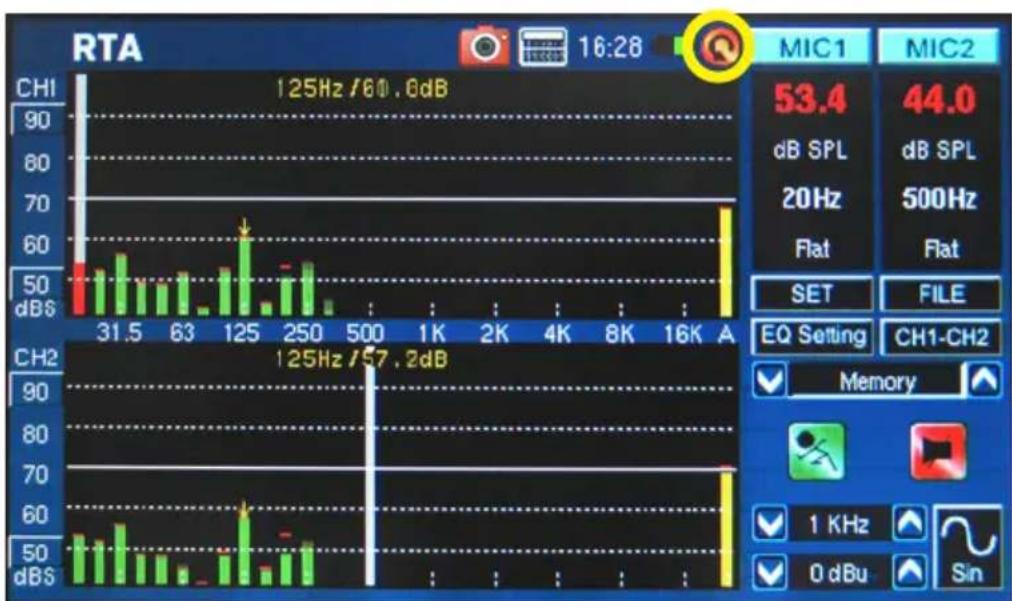
On the following pages we will discuss the various audio analysis functions that the PAA6 provides. There are nine in total (see figure 13), all of which are easily accessibly through the main menu. If at any point you wish to access a new feature, simply push the BACK icon to return to the main menu (see figure 14).
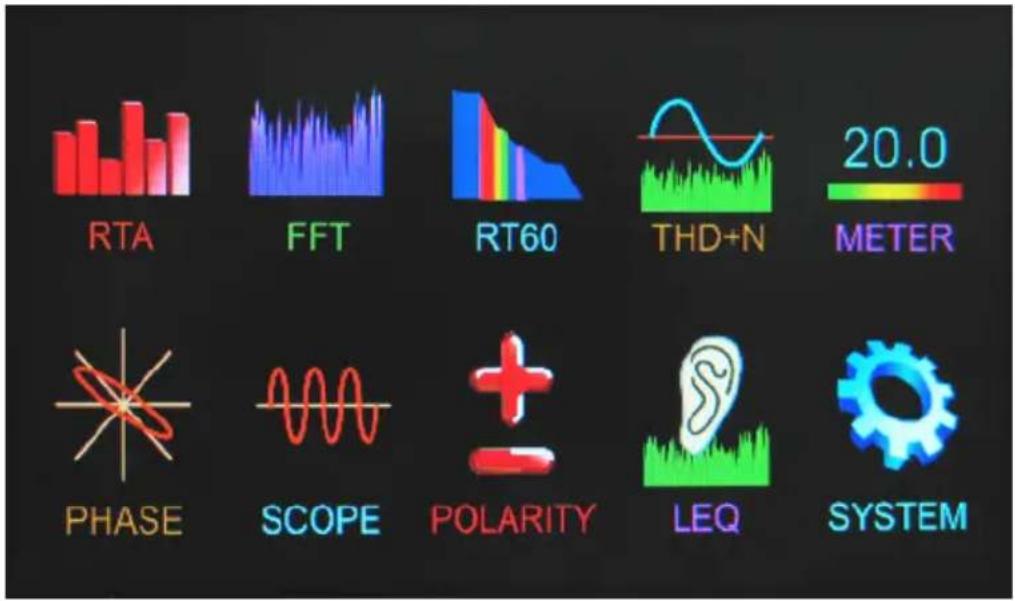
figure 13
bar
RTA | Frequency | MIC1 (dB) | MIC2 (dB) | | :--- | :--- | :--- | | 31.5 | 53.4 | 44.0 | | 63 | 20Hz | 500Hz | | 125 | 50Hz | 57.2 | | 250 | 50Hz | 50Hz | | 500 | 50Hz | 50Hz | | 1K | 50Hz | 50Hz | | 2K | 50Hz | 50Hz | | 4K | 50Hz | 50Hz | | 8K | 50Hz | 50Hz | | 16K | 50Hz | 50Hz | A | 50Hz | 50Hz | 125Hz /60.0 dB 125Hz /57.2 dB 1 KHz 0 dBu Sinfigure 14
Real Time Analyzer (RTA)
This function analyzes the audio received through either the built-in microphones or line in connectors, divided into a number of separate bands in 1, 2/3rd, 1/3rd or 1/6th octave resolution (see figure 15). Each frequency band is graphed as a vertical bar on the RTA, the height of which represents the level – whether in dB SPL, dBu, etc – of the individual octave or sub-octave bands. A 60 dB range is displayed at any one time, and users can scroll up the page slightly if clipping occurs, or scroll down if the results aren't visible.
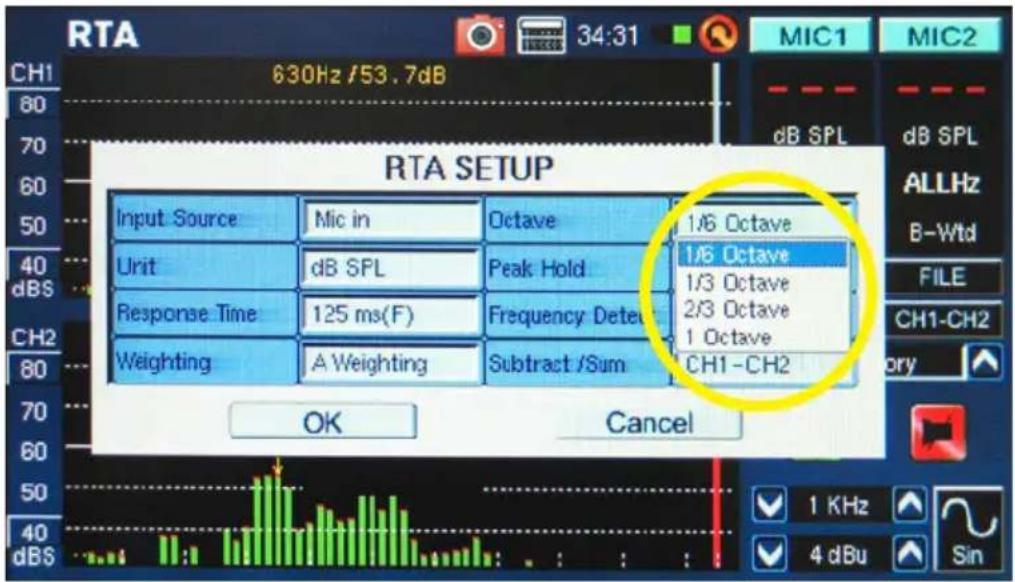
figure 15
Frequencies from 20 Hz to 20 kHz can be monitored individually by selecting the frequency band on screen. The level and frequency will appear to the left of the screen. Measurements can be taken at four different response times (35 ms, 125 ms, 250 ms, and 1 sec, shown in figure 16) and in four weighting types (A weighting, B weighting, C weighting and Flat, as shown in figure 17). For more info on response times and weighting, please consult the appropriate sections.
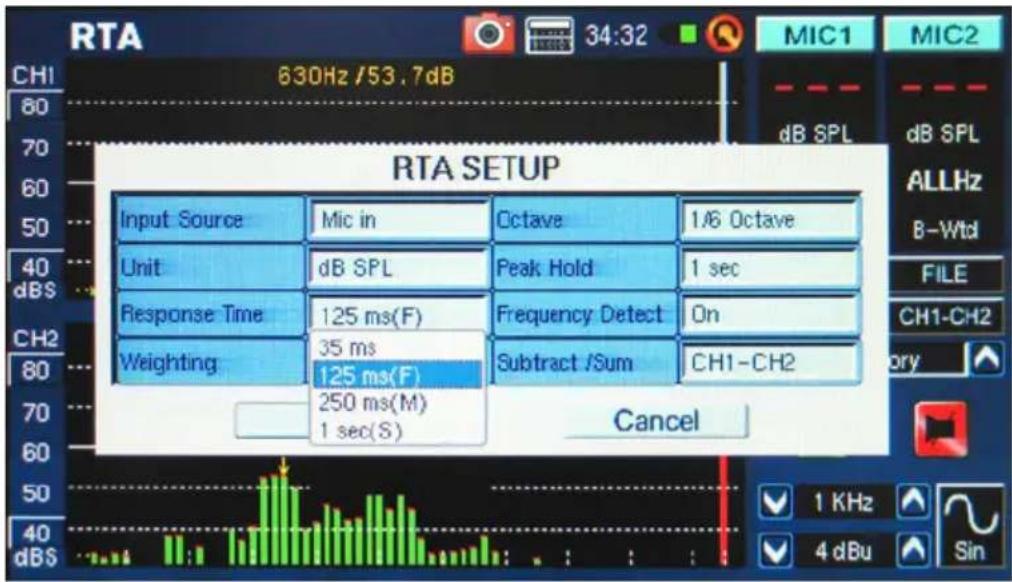
figure 16
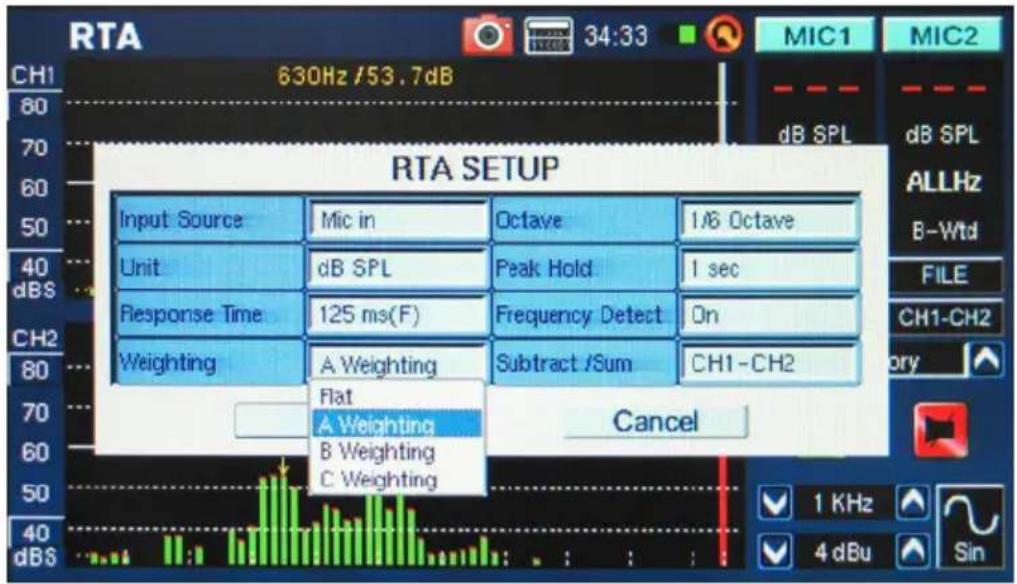
figure 17
Procedure for taking acoustic measurements:
- Enter the SET menu on the RTA screen and change the input source to "Mic" (see figure 18).
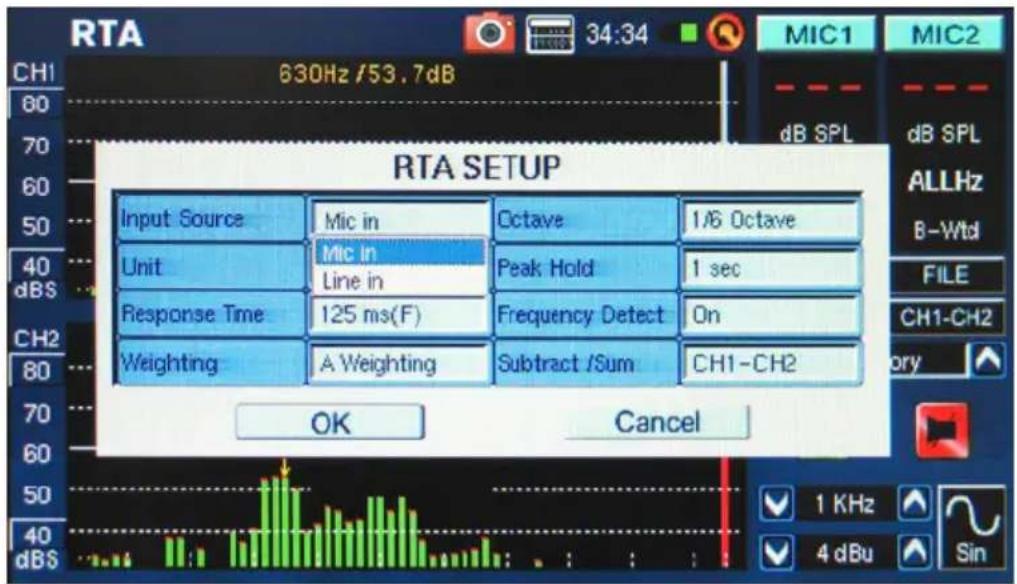
figure 18
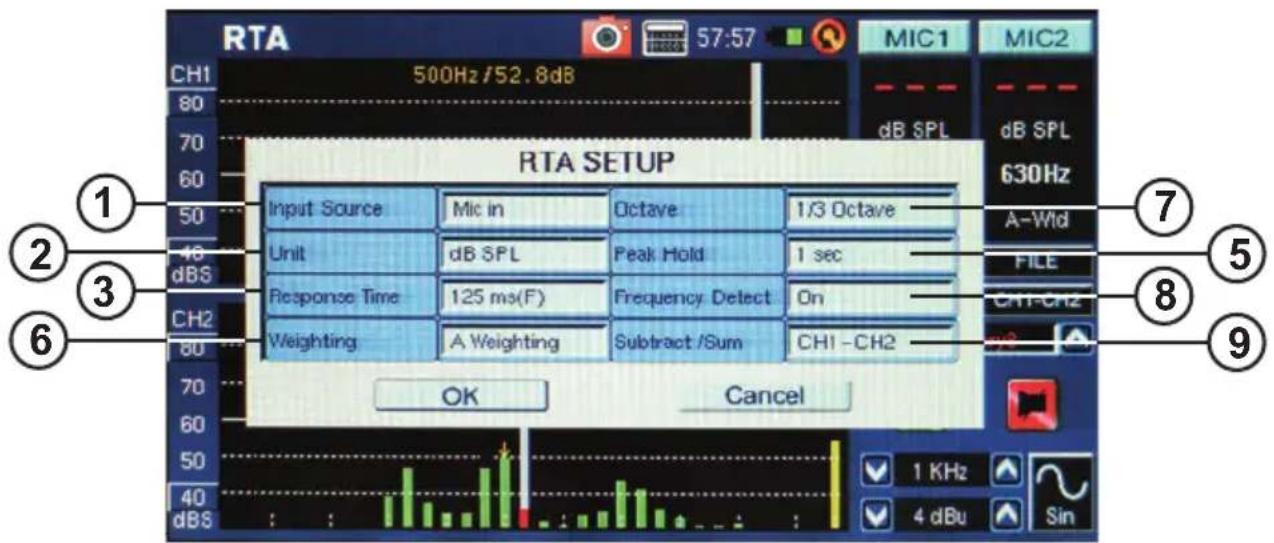
- Select the ‘octave’ settings you wish to use for your calculations (figure 19). Users can select from 1 octave resolution (for a total of 10 bands on the RTA), 2/3 octave resolution (for a total of 15 bands), 1/3 octave resolution (for a total of 31 bands), or 1/6 octave resolution (for a total of 61 bands).
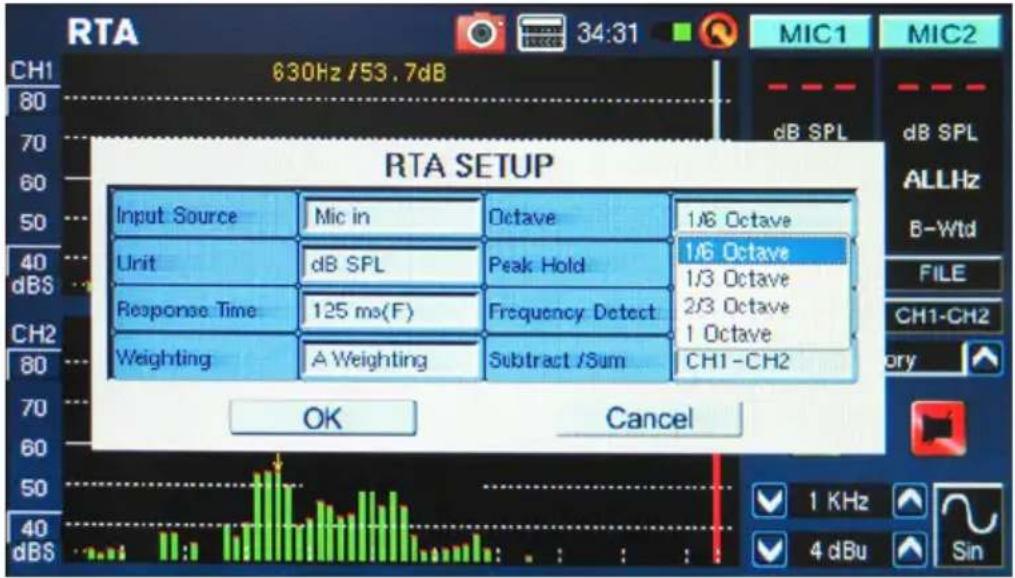
figure 19
- Also in the settings menu, set the appropriate weighting (figure 20). The most common weighting used for acoustical analysis is perhaps A-weighting, as it closely mimics the conditions of human hearing.
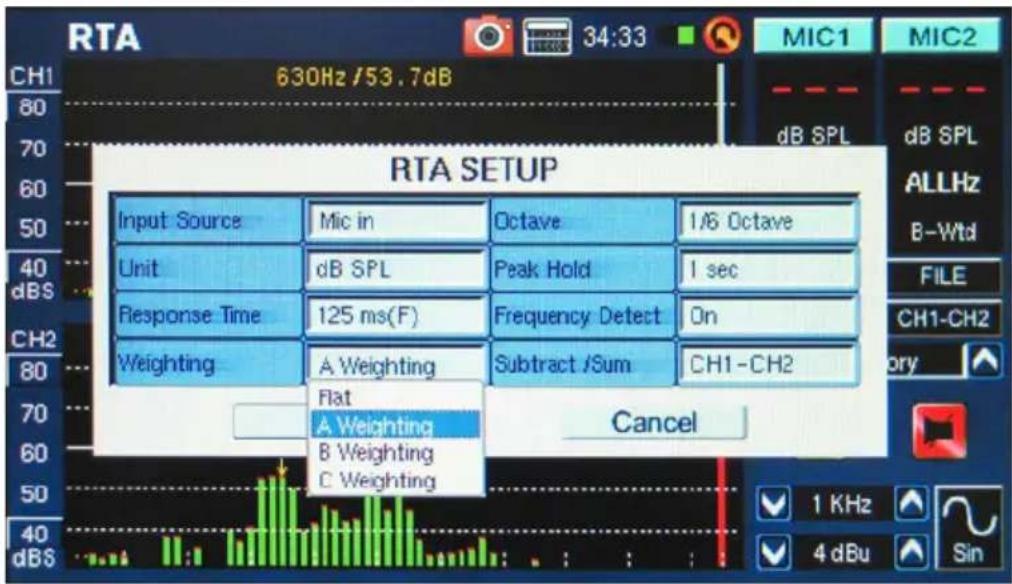
figure 20
- Adjust response time, peak hold, frequency detect or other relevant properties as needed (below).
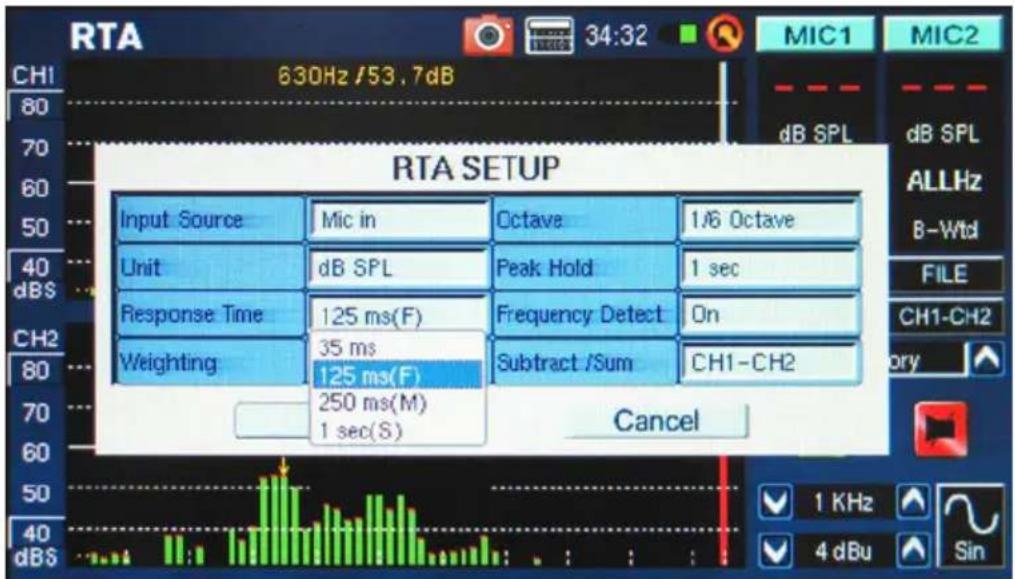
figure 21
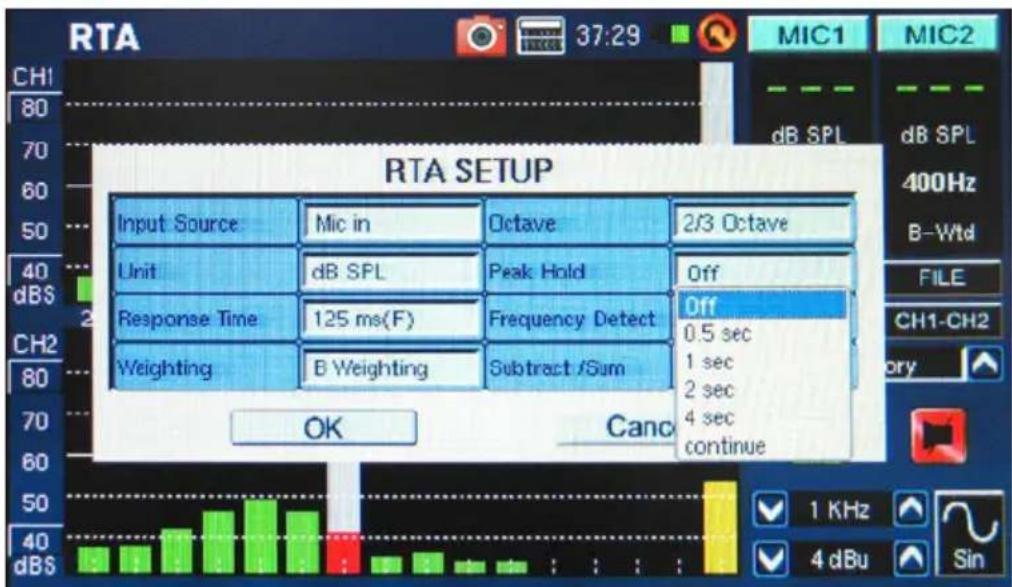
figure 22
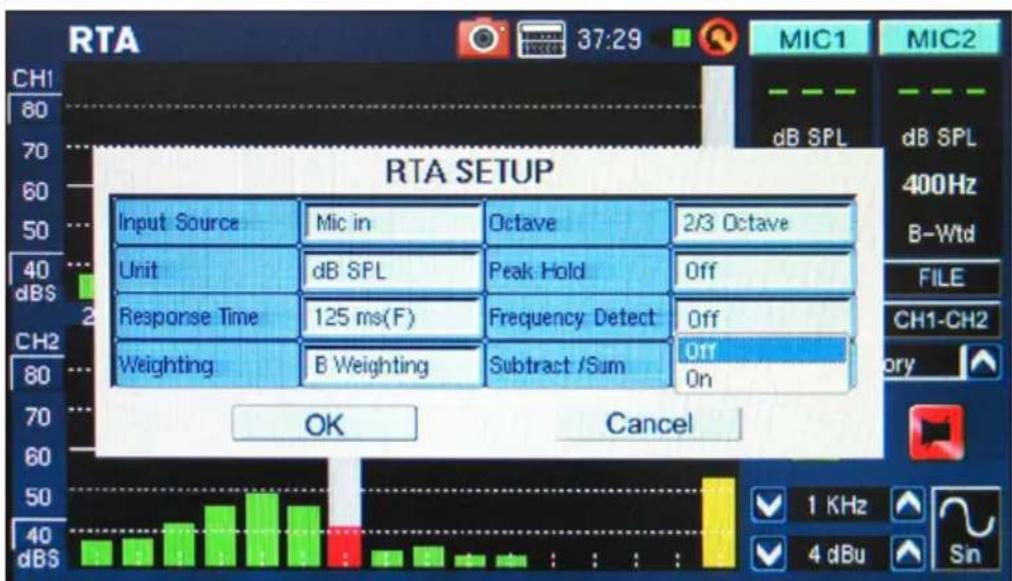
figure 23
- Exit the SET menu by selecting "OK."
- Push the onscreen "RUN/STOP" icon or the RUN/STOP button on the left-hand side of the PAA6. The RTA will begin.
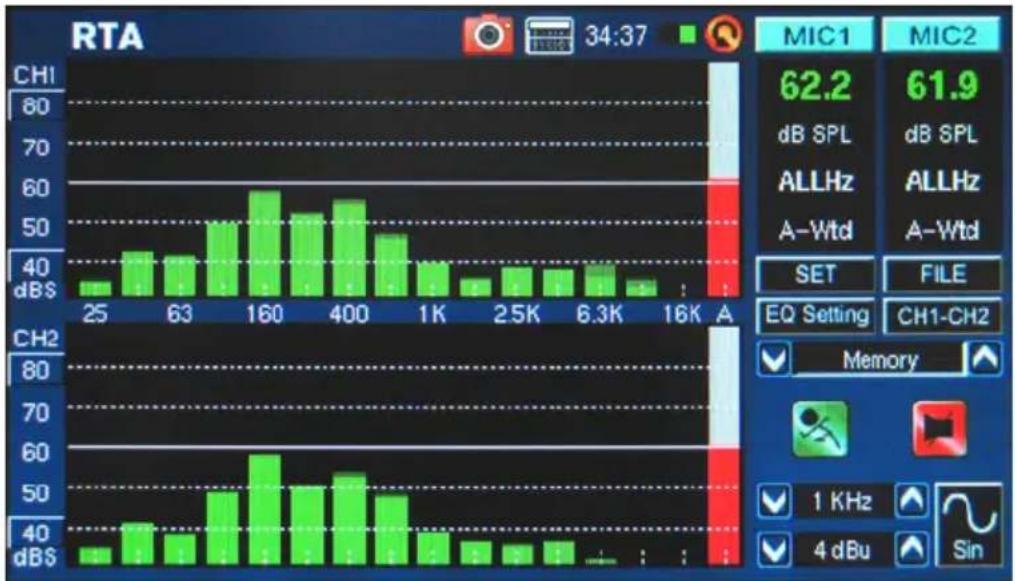
- Use the touch screen to select an individual band and view the dB SPL in real time for center frequencies of that particular band (figure 24). The rightmost bar is the ALL FREQUENCY level. To the right of the screen you will find two boxes with channel properties listed. The top value will be the dB SPL results for the currently selected band, below which you will find the center frequency of the currently selected band (if the all frequency bar is chosen, this value will read ALLHz). The weighting that the user selected will be visible below this.
bar
RTA | Frequency | CHI (dB) | CH2 (dB) | | :--- | :--- | :--- | | 25 | 35 | 30 | | 63 | 42 | 40 | | 160 | 58 | 60 | | 400 | 55 | 55 | | 1K | 40 | 35 | | 2.5K | 35 | 30 | | 6.3K | 38 | 32 | | 16K | 30 | 25 | MIC1: 62.2 dB SPL, MIC2: 61.9 dB SPL, ALLHz: ALLHz, A-Wtd: A-Wtd, SET: FILE EQ Setting: CH1-CH2 Memory, 1 KHz, 4 dBu Sinfigure 24
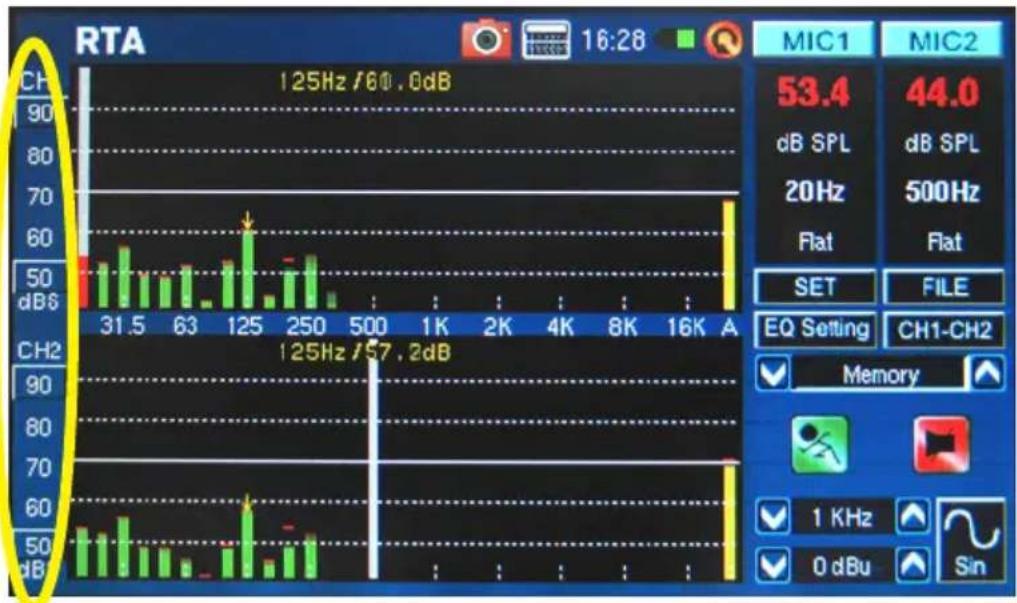
- A 60 dB range can be seen on the RTA screen at any one time. The total range viewable is 30 dB to 130 dB. If you find the RTA is clipping constantly, pushing the dBS values to the left of the RTA display (shown in figure 25) will allow users to scroll up their results (in 5 dB increments).
bar
RTA | Frequency | MIC1 (dB) | MIC2 (dB) | | :--- | :--- | :--- | | 31.5 | 53.4 | 44.0 | | 63 | 500Hz Flat | 500Hz Flat | | 125 | 53.4 | 53.4 | | 250 | 53.4 | 53.4 | | 500 | 53.4 | 53.4 | | 1K | 53.4 | 53.4 | | 2K | 53.4 | 53.4 | | 4K | 53.4 | 53.4 | | 8K | 53.4 | 53.4 | | 16K | 53.4 | 53.4 | | A | 53.4 | 53.4 | 125Hz /60, 0dB 125Hz /57, 2dB 1 KHz 0 dBu Sinfigure 25
- When monitoring signals as high as 80 dB to 120 dB SPL, you can still view the lower levels by pausing the RTA (select "RUN/STOP") and scrolling down the screen to see the lower levels.
- You can save your readings by entering the FILE menu and saving to either the PAA6 or inserted memory card (figure 26).
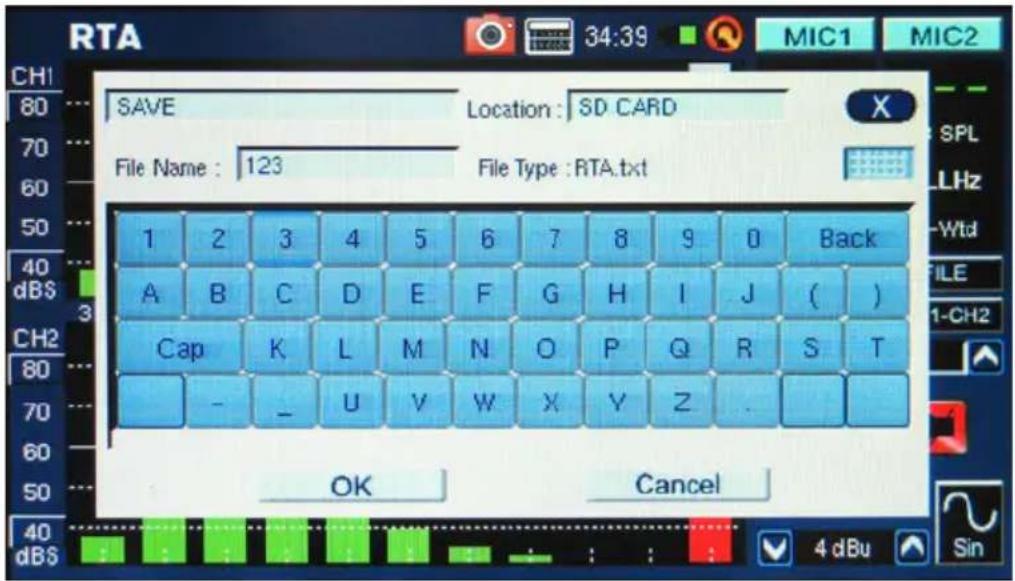
figure 26
Procedure for measuring an electrical signal:
- Enter the SET menu and set the input source to "Line" and measurement unit to "dBu," "dBV," or "voltage," as required (see figures 27 and 28).
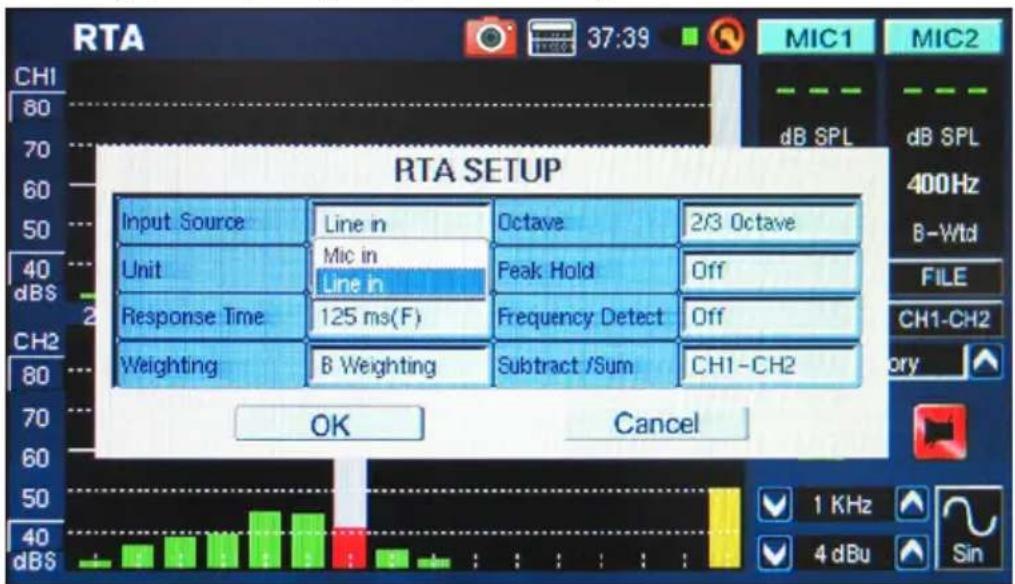
figure 27
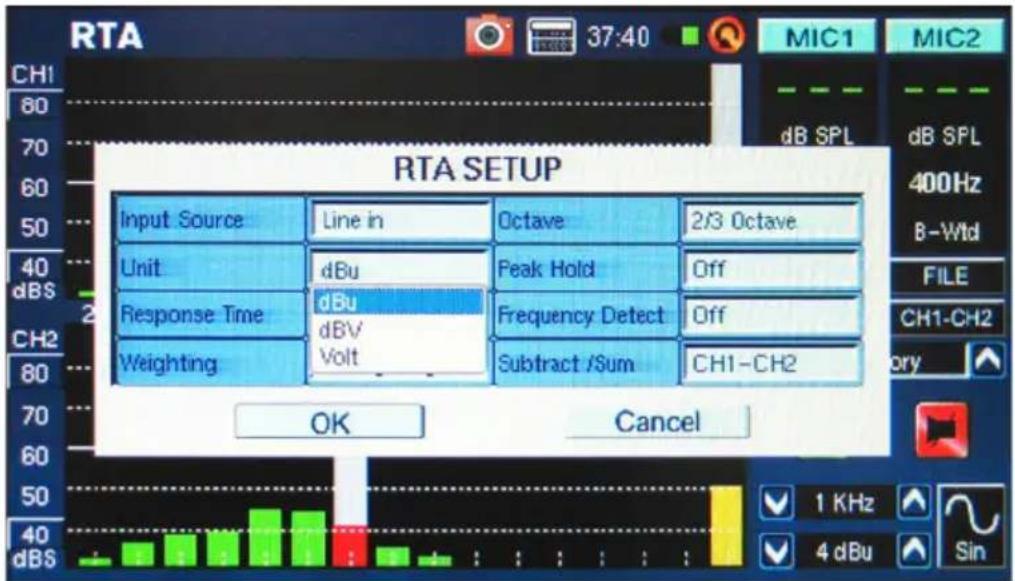
figure 28
- You may also want to adjust the response time, weighting, octave, peak hold, frequency detect and Subtract/Sum (figure 29) properties.
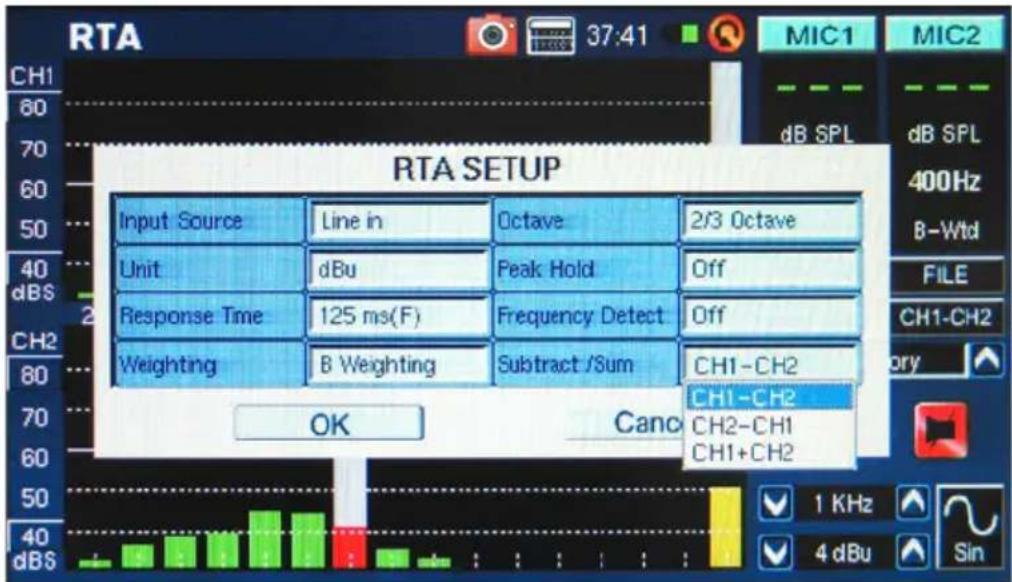
figure 29
- Send a signal through the PAA6's female XLR jacks. The wiring should be as follows: Pin 2 – Hot, Pin 3 – Cold, Pin 1 – Ground
-
Push the "RUN/STOP" button.
-
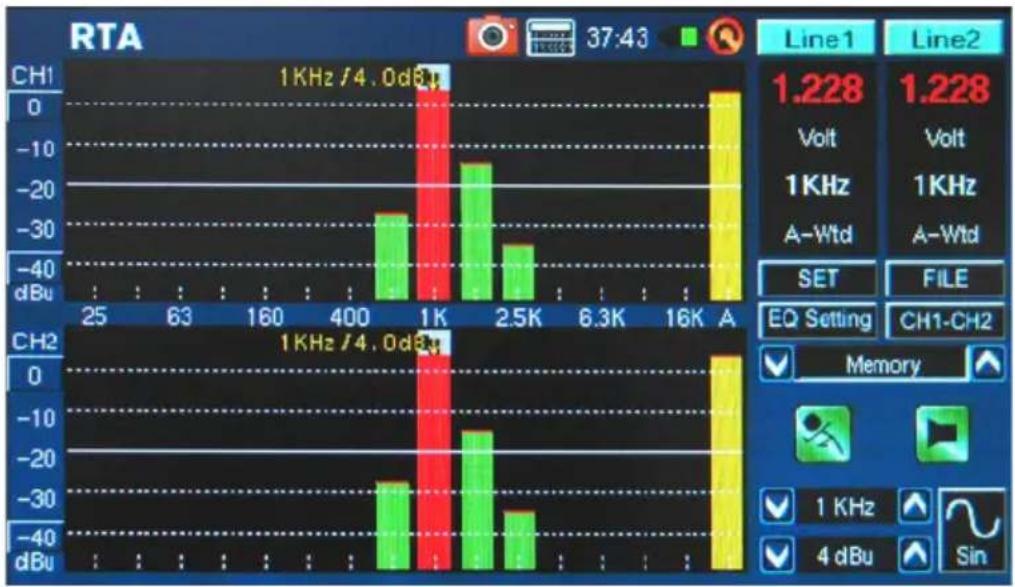
You can read the level of any individual channel or all frequencies simultaneously (figure 30). Select the desired frequency band onscreen to get a clearer picture of that frequency's signal properties. This information is found on the top right-hand corner of the display.
bar
RTA | Frequency Ratio | Line1 (dBu) | Line2 (dBu) | | :--- | :--- | :--- | | 1 KHz / 4.0 dBu | -30 | -25 | | 1 KHz | -15 | -10 | | 1 KHz | -25 | -20 | | 1 KHz | -30 | -25 | | 1 KHz | -40 | -35 | | 1 KHz | -40 | -40 | Line1: 1.228, Volt: 1KHz, A-Wtd: 1KHz, SET FILE: SET Setting CH1-CH2 Memory: 1 KHz, 4 dBu Sin: 4 dBufigure 30
- Save your settings entering the FILE menu and saving to either the PAA6 or inserted memory card (as shown in figure 26).
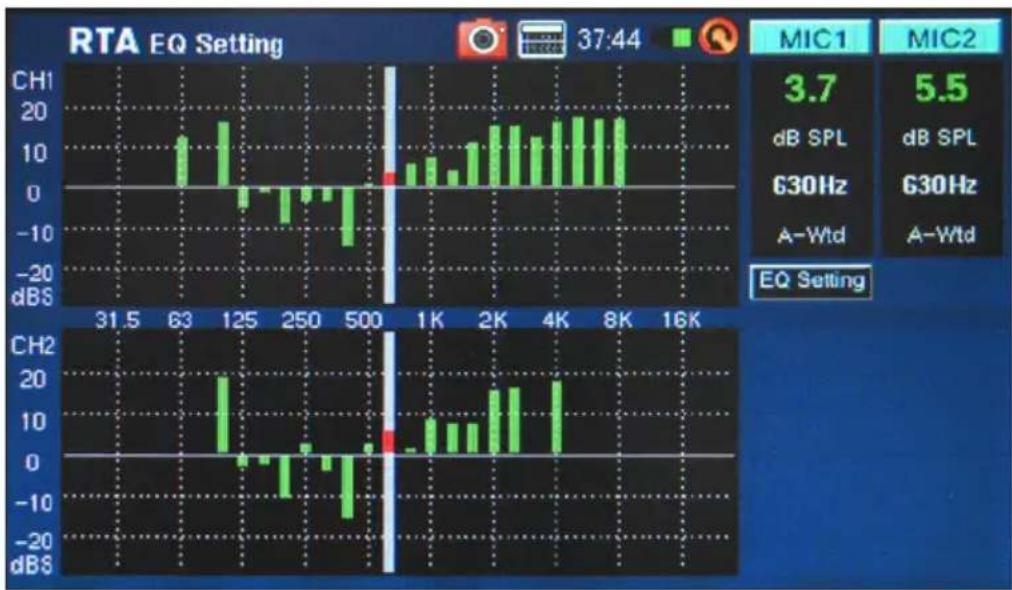
EQ Setting (figure 31): Also included within the RTA is an EQ setting function. Pushing the onscreen icon will allow you monitor the suggested equalizer band settings – updated in real time. Users can also opt to load any pre-saved readouts, then run the EQ Setting function to find the PAA6's suggested EQ readings from that. Ideally, you want the EQ Setting function to display a flat line with no suggested frequency adjustments. This will allow for great quality audio with little potential for feedback and other issues.
bar
| Frequency | Channel | Value | | --------- | ------- | ----- | | 37:44 | CH1 | 37.0 | | 37:44 | CH2 | 5.5 |figure 31
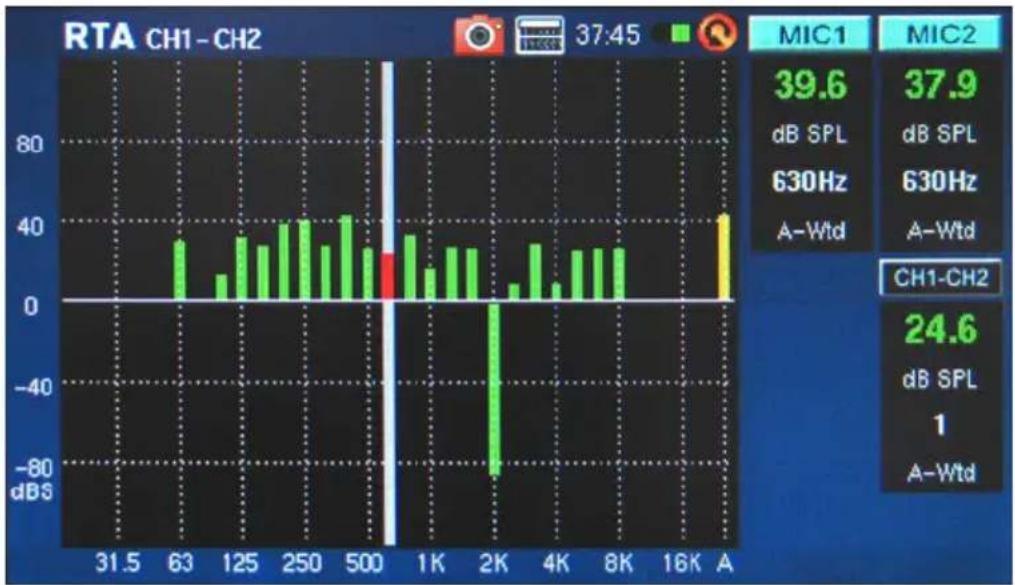
Compare Function (Subtract/Sum): Users can also opt to add the results from channel 1 to those of channel 2 together, or subtract either channel from the other (to compare the difference in level). This option is set up in the SET menu, and is activated by pushing the appropriate onscreen icon (CH1+CH2, CH1-CH2 or CH2-CH1). See figure 32.
bar
RTA CH1-CH2 | X-axis (dB) | Value | |---|---| | 31.5 | 0 | | 63 | 36 | | 125 | 28 | | 250 | 38 | | 500 | 41 | | 1K | 34 | | 2K | -78 | | 4K | 35 | | 8K | 34 | | 16K | 0 | | A | 42 | MIC1: 39.6 dB SPL, 630Hz A-Wtd; MIC2: 37.9 dB SPL, 630Hz A-Wtd; CH1-CH2: 24.6 dB SPL, 1 A-Wtdfigure 32
Fast Fourier Transform (FFT)
The FFT function is, in essence, an RTA with much finer resolution and slightly slower refresh rate. Use the FFT analyzer to check the frequency response of sound systems and listening rooms as you adjust your speaker positions, room treatments and equalizer settings. Continuously monitor results as you correct these problems for updates on whether the situation has improved or not.
Like the RTA function, measurements can be taken at any weighting, with various other possible settings available. A frequency range as wide as 0.2 Hz to 20 kHz can be monitored using the FFT function.
Taking FFT measurements:
-
Position the PAA6's microphone in an appropriate position. This usually means somewhere pointing at the ceiling, preferably directed away from all loudspeakers in your setup.
-
Set the frequency range that best suits your needs. The following are the selectable frequency ranges:
| 0.2 Hz – 78.2 Hz | 0.4 Hz – 156.3 Hz | 0.7 Hz – 312.7 Hz | 1.5 Hz – 625.5 Hz |
| 2.0 Hz – 834.0 Hz | 3.9 Hz – 1.6 kHz | 4.7 Hz – 2.0 kHz | 7.8 Hz – 3.3 kHz |
| 9.4 Hz – 4.0 kHz | 11.7 Hz – 5.0 kHz | 15.6 Hz – 6.6 kHz | 23.4 Hz – 10 kHz |
| 46.9 Hz – 20 kHz |
- Set the 'weighting' of the FFT. The most common weighting for many applications is flat (ie. no weighting). (figure 33)
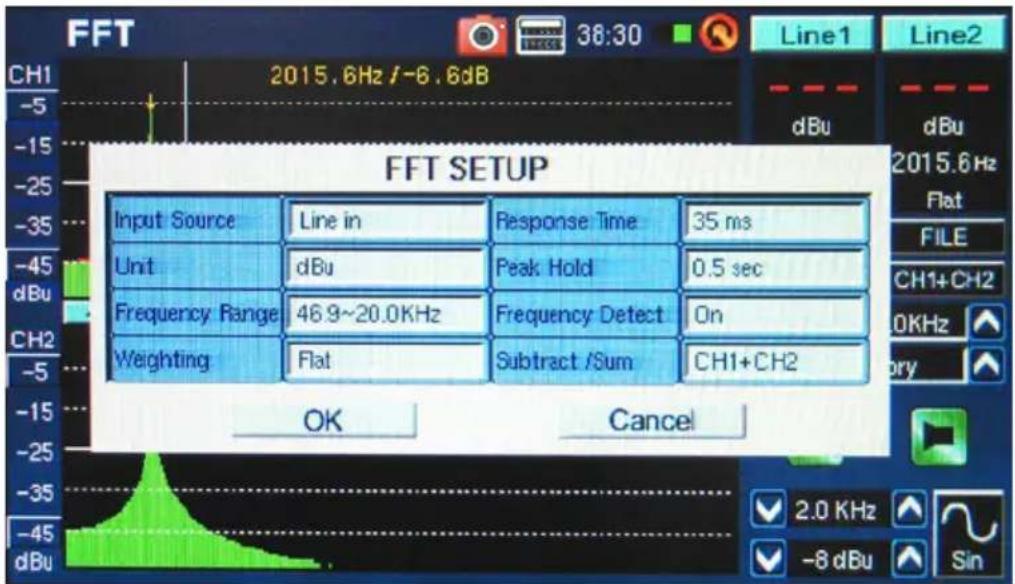
figure 33
- Also set the response time, and turn the peak hold and frequency detect on or off as required. (figure 33)
- Run pink noise through your system. Whether the pink noise comes from the built in signal generator or a test tone CD is not important.
-
Push the "RUN/STOP" button. Push the "RUN/STOP" button again at any time to pause the FFT.
-
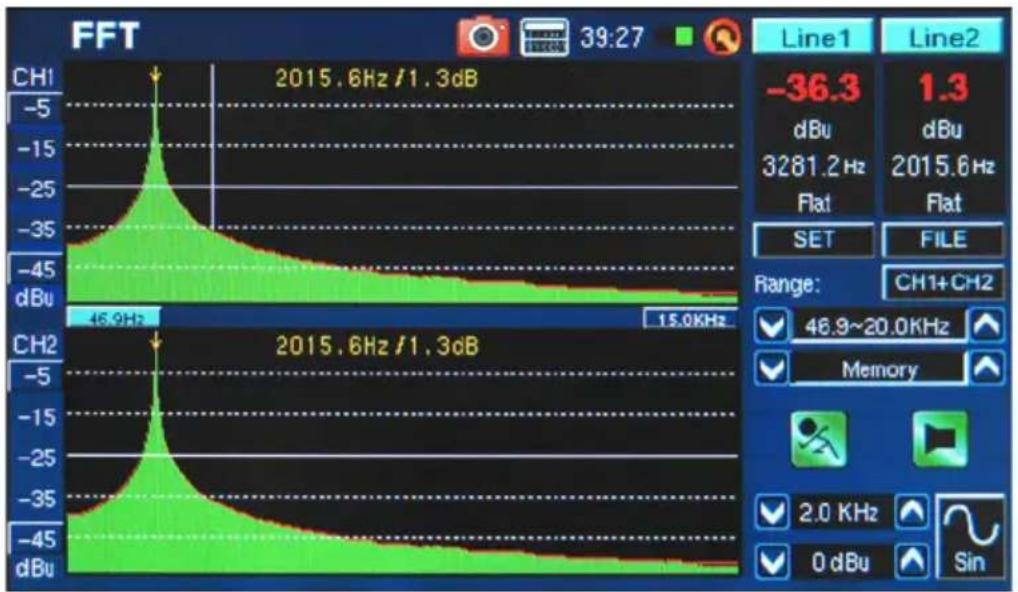
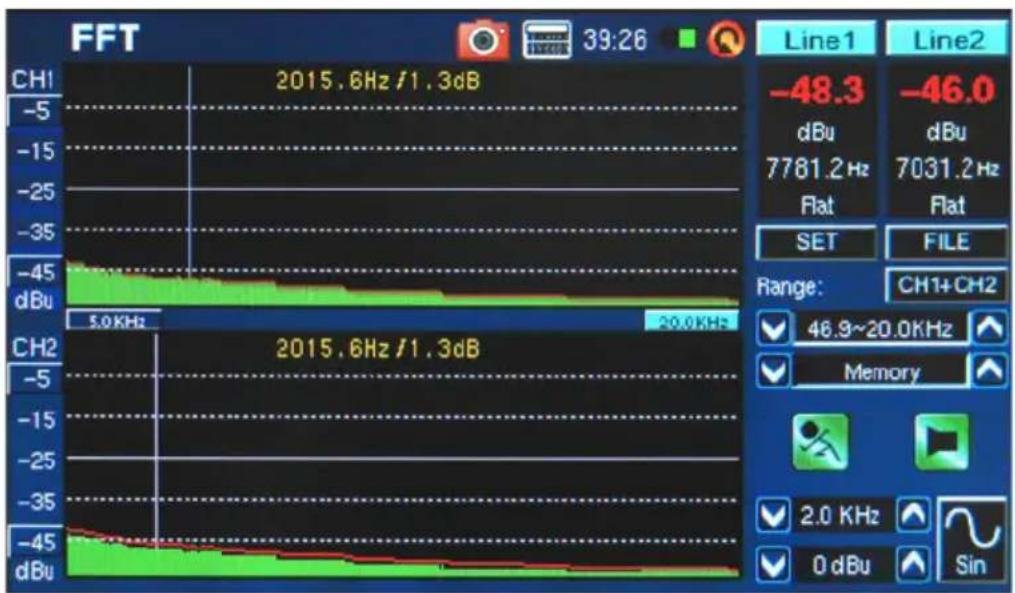
FFT results are displayed over two pages, meaning you can actually 'scroll' to the left or right to view more results. This is done by the pushing the frequency values in the bottom left- and right-hand corners of the display window. (figure 34 and 35)
line
| Frequency | Value | | --------- | --------- | | 2015.6 Hz | 1.3 dB | | 46.9 Hz | 15.0 kHz |figure 34
line
| Frequency | Channel | Value (dB) | | --------- | ------- | ---------- | | 2015.6Hz | CH1 | -48.3 | | 2015.6Hz | CH2 | -46.0 |figure 35
Reverb Time (RT60)
The RT60 function gives the decay time of any signal. The decay time is the time that it takes for a signal to diminish 60 dB below the original sound. This can be done with entirely no filtering (flat weighting) or with filtering imposed (A, B or C weighting). The RT60 calculations can also be made with no frequency filtering active (meaning the reverb time will be calculated for all frequencies, 20 Hz to 20 kHz) or with a 1 octave filter imposed (the frequency of which can be selected from 10 preset values).
Working out the average of many different RT60 readings from around a room allows users to get an idea as to how much absorption or reflection of audio the room provides. Depending on your needs, you may wish to have a high or low RT60 measurement. For example, for public speaking, an RT60 measurement of less than 1 second is preferable, as to have a clear, concise voice conveyed to the audience. With choirs or instrumental music, an RT60 measurement of greater than 1.5 seconds may be appropriate.
Measuring Reverb Time:
- Enter the RT60 function.
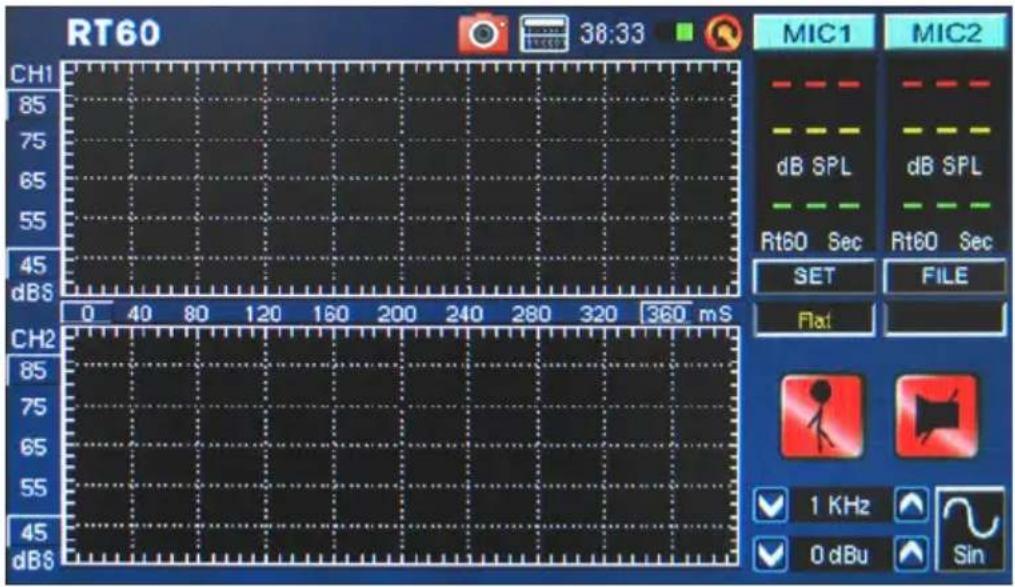
figure 36
- Select "RUN/STOP" to allow the PAA6 time to calculate the background noise (figure 37).
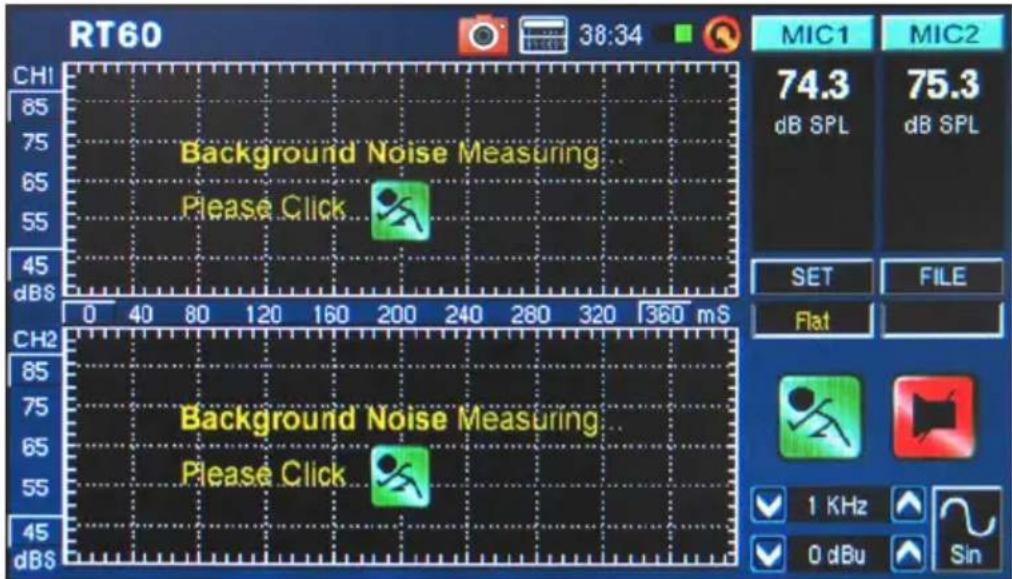
figure 37
- After the background noise is detected, select the "RUN/STOP" icon once again.
- The PAA6 will wait for a signal greater than 30 dB over the background noise. A little helpful hint: the louder the test signal, the greater the accuracy of your RT60 calculation (figure 38).
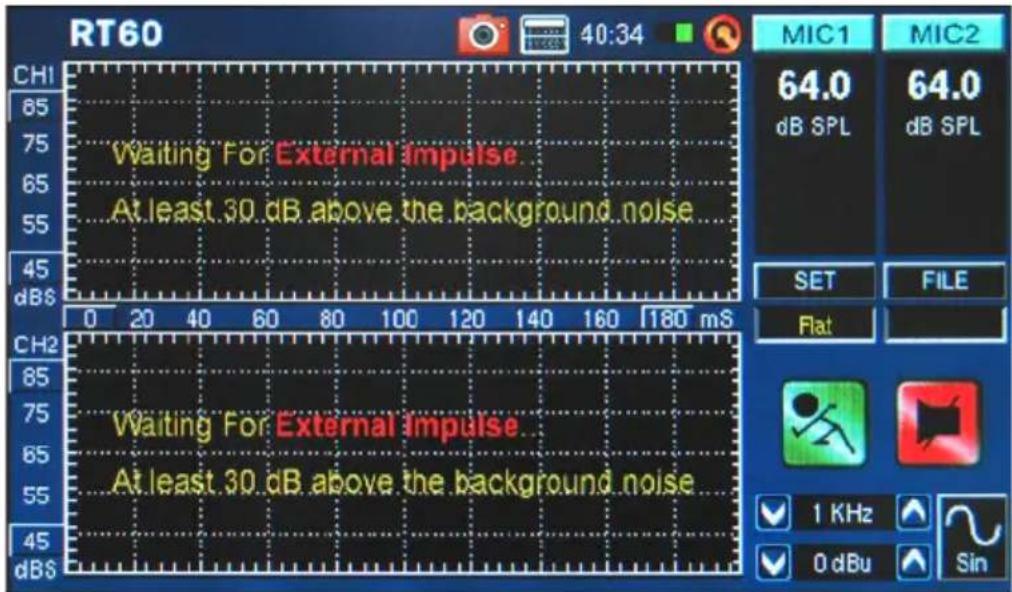
figure 38
- Play pink noise through your audio system (this can be done using the PAA6's signal generator or an audio test CD). Make sure that if you're sending the pink noise from the PAA6 that the trigger is set to internal. If you're getting the pink noise from an external source, the trigger should be set to external.
- Slowly move the master fader up to a point where the audio level received by the PAA6 is greater than 30 dB over the background noise. Quickly mute the system to get your RT60 reading as accurate as possible (figure 39).
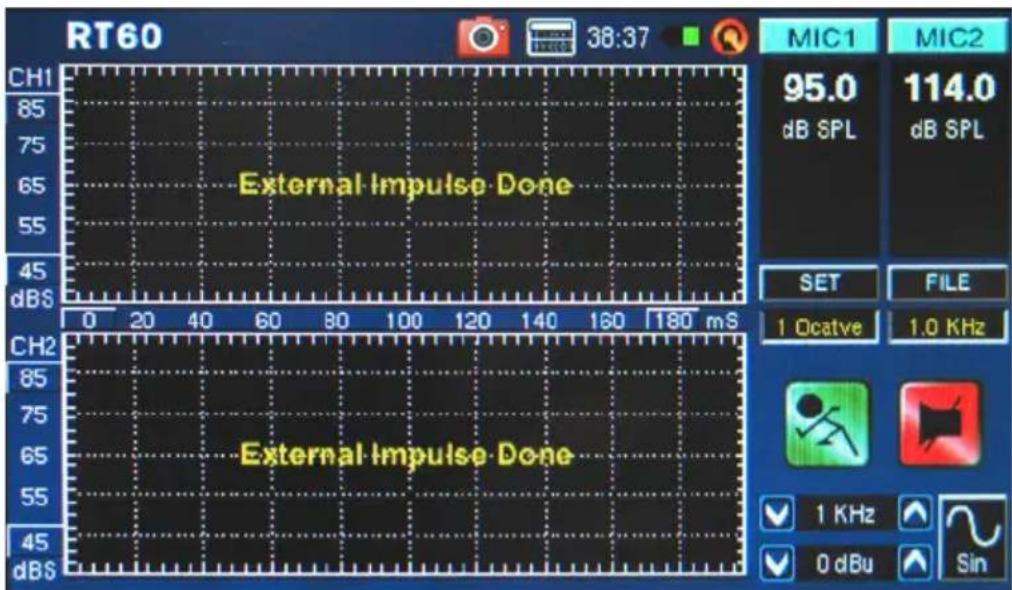
figure 39
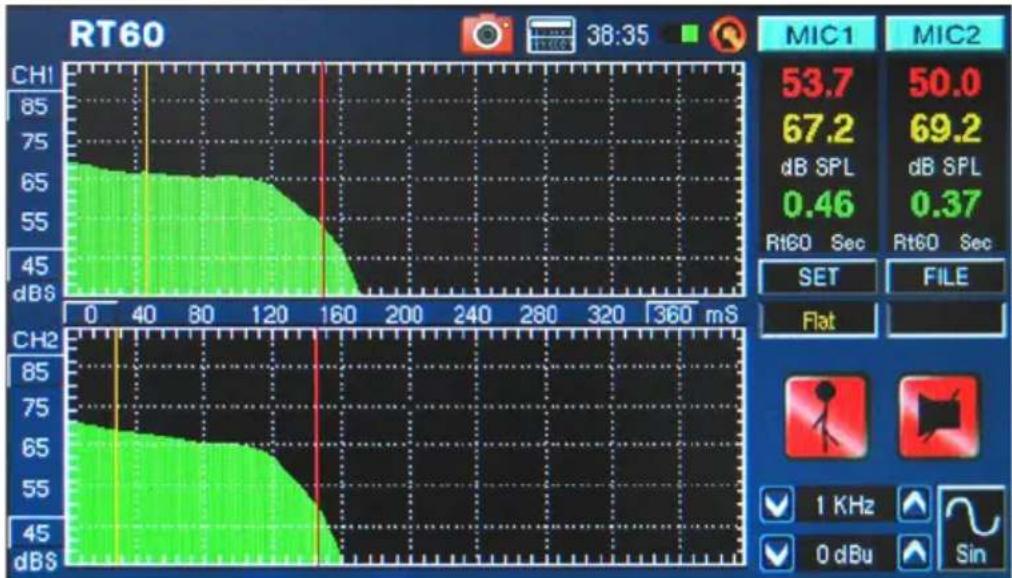
- After the measurement is taken, the RT60 measurement graph will appear onscreen (figure 40, and 41).
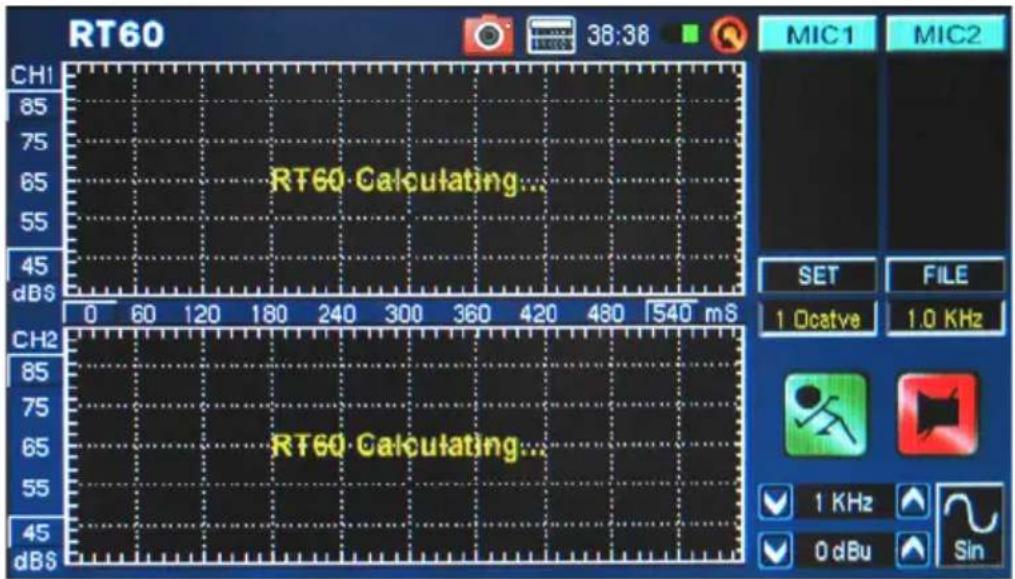
figure 40
line
| Metric | Value | |--------|-------| | MIC1 | 53.7 | | MIC2 | 50.0 | | dB SPL | 67.2 | | dB SPL | 69.2 | | dB SPL | 0.46 | | dB SPL | 0.37 |figure 41
-
Moving the red and yellow vertical lines on the RT60 graph will allow you to refine your RT60 results. Position one of these lines at the beginning of the decay slope and the other at the bottom to get an accurate read-out of the RT60 time. These results can be found to the right of the RT60 graph.
-
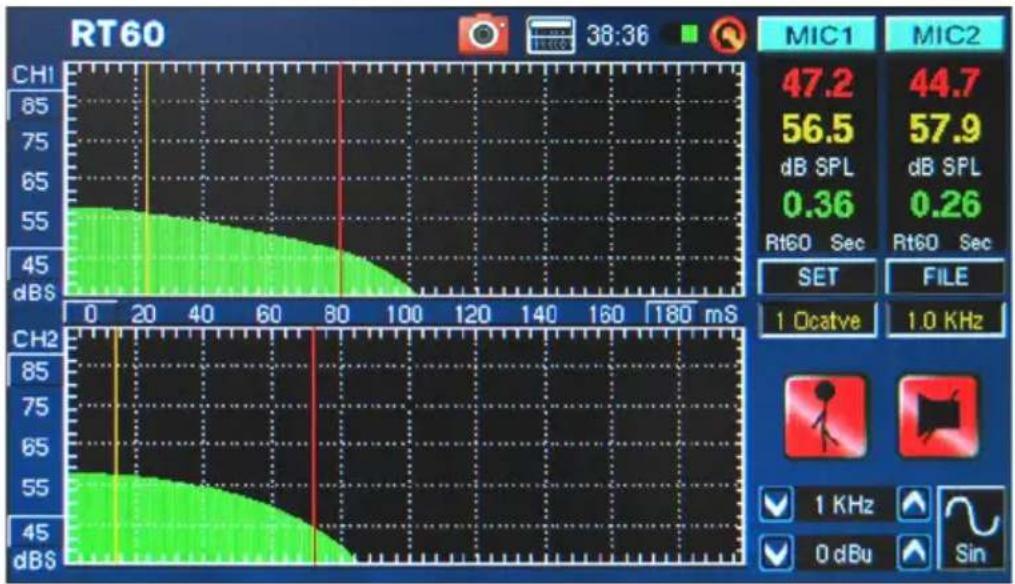
Select SET and change the filter mode to 1 octave. After doing so, select one of the frequencies from the filter frequency field. Doing so will allow users to retrieve the RT60 calculation for the selected frequency only (figure 42).
line
| Metric | Value | |--------|-------| | MIC1 | 47.2 | | MIC2 | 44.7 | | dB SPL | 56.5 | | dB SPL | 57.9 | | Rt60 Sec| 0.36 | | Rt60 Sec| 0.26 | | SET | | | FILE | | | 1 Ocatve| | | 1.0 KHz| | | 1 KHz | | | 0 dBu | | | Sin | |figure 42
Trigger Mode (figure 43) – two trigger modes are provided in the setup menu.
Internal: Use this mode when the PAA6 generator output is used to provide the pink noise (or other tone) for calculating the RT60.
External: Use this mode to trigger the RT60 calculations using an external sound impulse, such as clapping, the thud of a bass-drum, a balloon popping or an external signal generator.
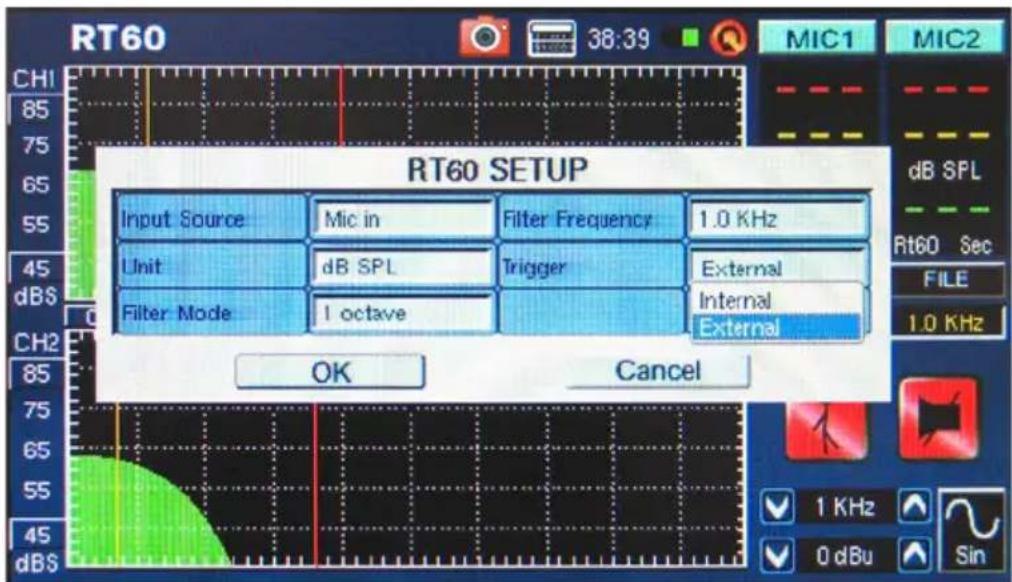
figure 43
Total Harmonic Distortion + Noise (THD+N)
This function will give the total amount of distortion and noise in any given audio signal. The THD is the unwanted audio that is not directly a part of an audio signal, however still harmonically related to it. If a piece of equipment is perfect, the output should show no remnants of audio articles outside the original signal. You'll be hard-pressed to find such a piece of equipment, however. In the case of THD+N, not only are the signals directly related to the audio signal tested, but so are other bits and pieces of audio that are not directly related to the signal. Noise, hum, buzz, RFI, and so forth are all included in working out the THD+N value.
Measuring the THD+N:
- Enter the THD+N function and choose SET to enter the settings menu. Here users can choose the input source, unit (which is not directly important to the THD+N results, but is probably best set to dBu for reference's sake).
- Set the input source to "Line in" and select OK to continue (figure 44).
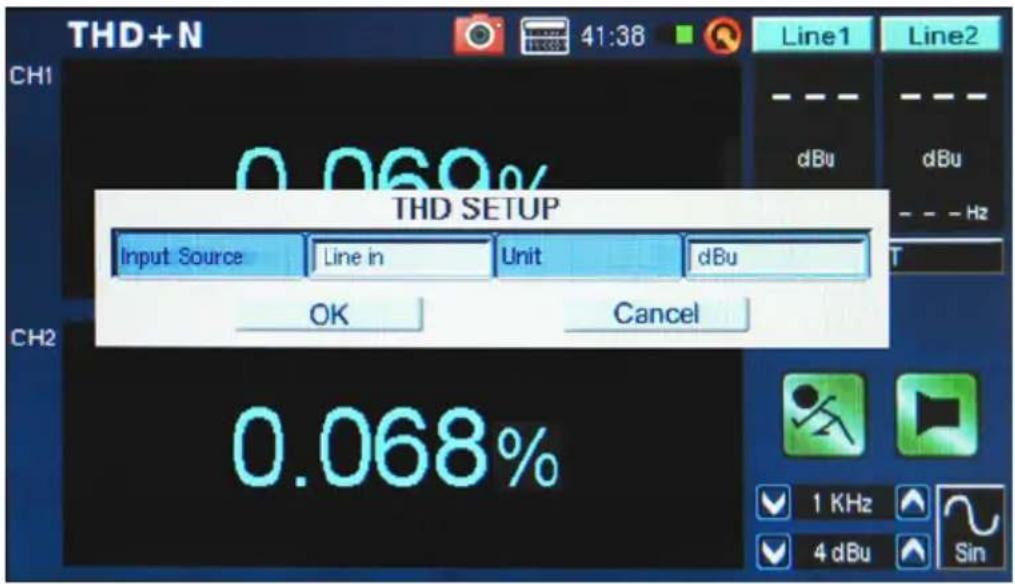
figure 44
- Connect the output channel of your audio device to the PAA6, ensuring that the device's faders, gain controls, etc are all set to 0 dB/unity. Also ensure any equalizers in the audio path are centered.
- Send a +4 dBu sine wave through your audio system, routing it through to the PAA6. This can be done using an external signal generator or the PAA6's internal signal generator. The frequency of the sine wave at this point is not too important, however for accurate results a number of results should be taken from a number of frequencies (preferably between 100 Hz and 10 kHz, at least) and the average of these results calculated.
- Select the "RUN/STOP" icon (or push the RUN/STOP button to the left of the PAA6).
- To the right of the display you should find the PAA6 is receiving a 4 dBu signal of whatever frequency you are sending through it (1000.0 Hz, for example). Provided the values listed here are exactly what you sent out from your signal generator, the THD+N results given on screen will be accurate (figure 45).
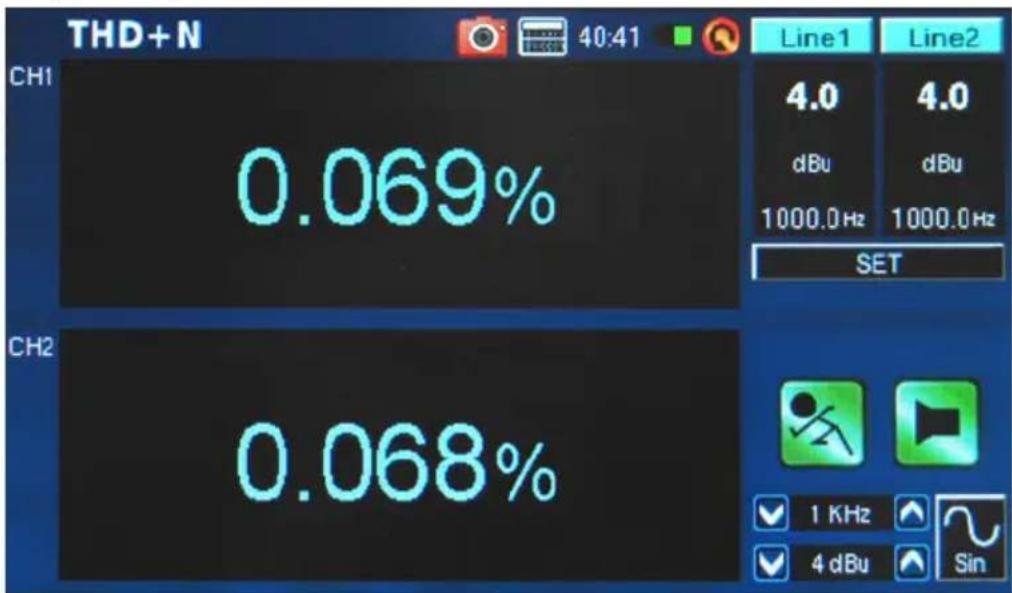
figure 45
Tip: When giving THD+N results, they should be written with the THD+N percentage first, followed by the signal level (+4 dBu for professional application), then the frequency range tested, and finally a clarification that the device was set to 'unity gain'. For example: "<0.015%, +4 dBu, 20 Hz to 20 kHz, unit gain."
Meter
The meter function can take calculations in dB SPL (through the built-in microphone), dBu, dBV or Volt (through the line inputs). The SPL function provides users with the overall 'loudness' of their input signal and can be accessed by simply selecting 'Mic In' as the desired input source. The dBu, dBV and Volt measurements can be taken through the line inputs, and give visual representations of their respective levels.
Taking SPL measurements:
- Enter the SET menu within the Meter function (figure 46).
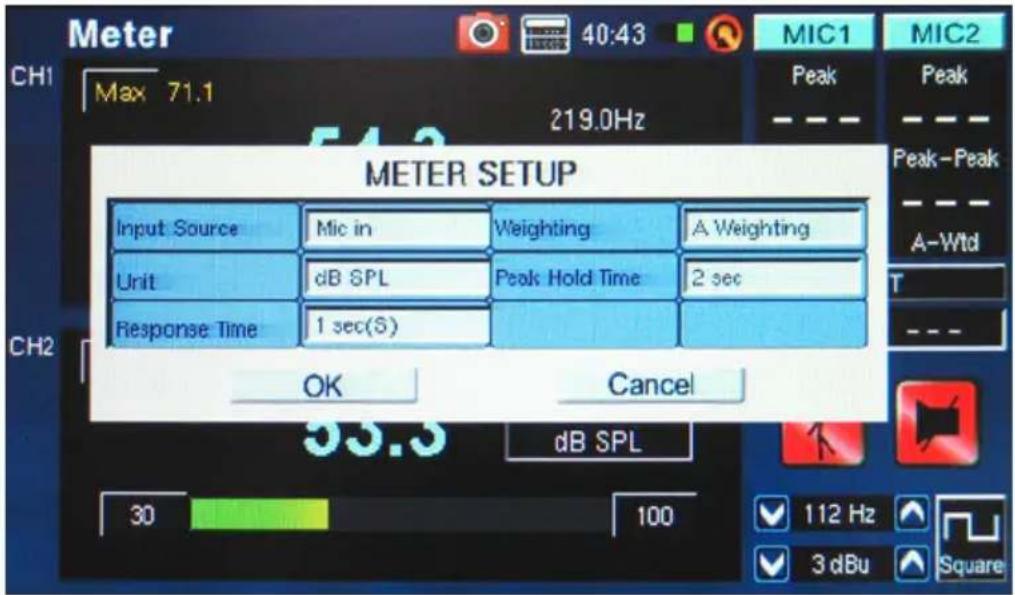
figure 46
- Select "Mic in" as your input source. The unit will automatically be set to dB SPL (figure 46).
- Also in the settings menu, users can choose the response time, weighting and peak hold (figure 46).
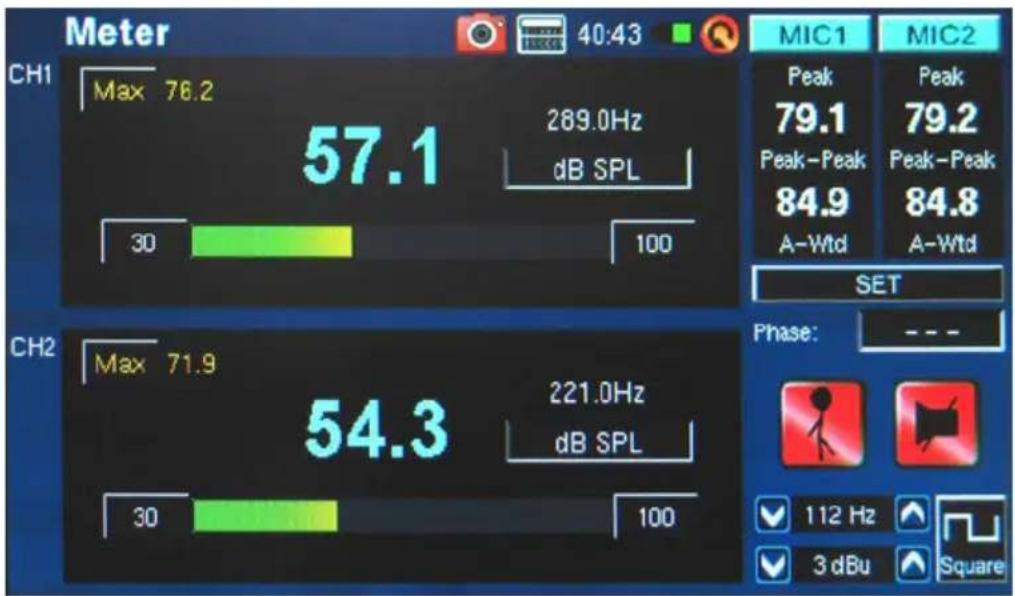
- Return to the meter by clicking "OK" (figure 47).
bar
| Channel | Max | Value | | :--- | :--- | :--- | | CH1 | 76.2 | 57.1 | | CH2 | 71.9 | 54.3 | | MIC1 | Peak | 79.1 | | MIC2 | Peak | 79.2 | | MIC1 - Peak | 84.9 | 79.2 | | MIC2 - Peak | 84.8 | 79.2 | | SET | A-Wtd | 84.9 | | Phase: | --- | --- | | 112 Hz | ✓ | ✓ | | 3 dBu | ✓ | ✓ | | Square | ✓ | ✓ |figure 47
- A 70 dB range is visible on screen at any time. Users can view 30 to 100 dB SPL, 45 to 115 dB SPL or 60 to 130 dB SPL. To change the range, simply push the dB values on the meter itself.
- Reset the Maximum SPL level by simply selecting the word "Max" on screen.
Taking measurements through the line inputs:
- Enter the SET menu within the Meter function and set your input source to "Line in." You can also select your desired measurement unit from dBu, dBV and Volt (figure 48).
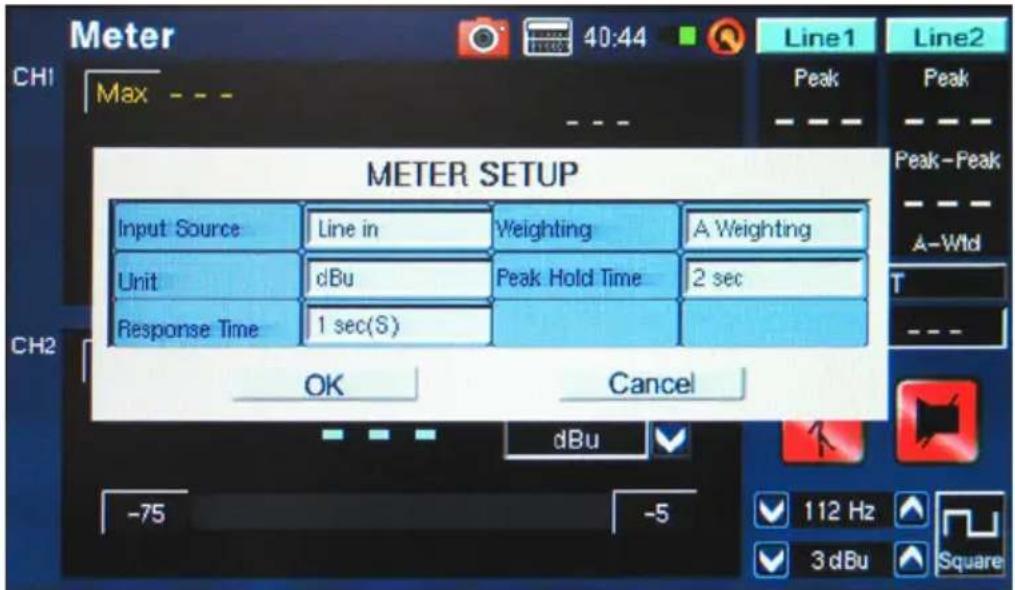
figure 48
- You may select a response time, weighting, or peak hold time (figure 48). Push "OK" to close the settings menu (figure 49).
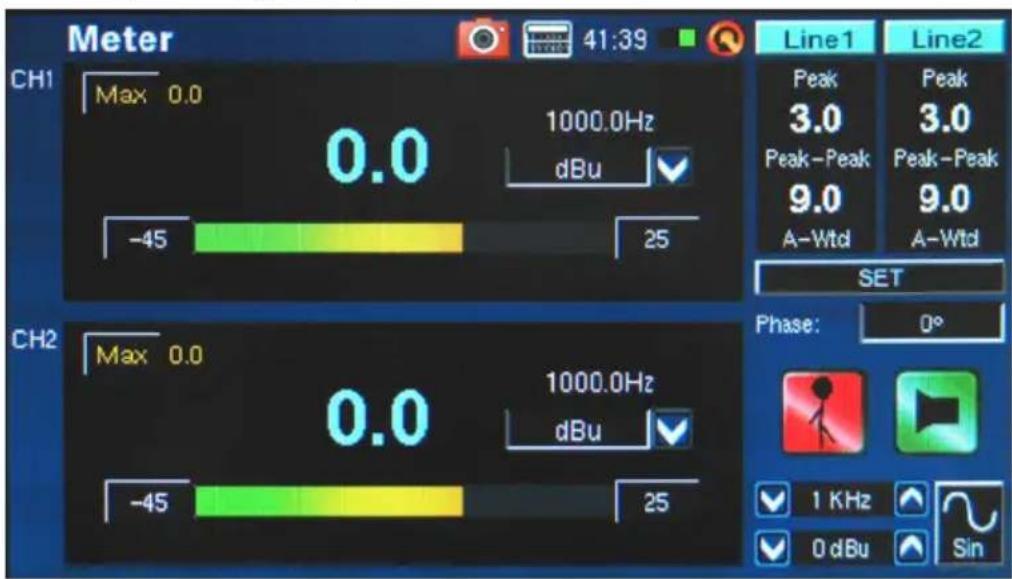
figure 49
- Connect a source signal into the PAA6's line inputs.
- Push the RUN/STOP button to start the level meter.
- If the level meter clips, it may be necessary to adjust the measurement range. This is done by simply clicking the range values on the level meter itself. The measurement range will depend on the unit selected in the settings. Each unit type has three different ranges that can be selected. When operating under dBu, the range can be adjusted between -85 to -20 dBu, -75 to -5 dBu, -60 to 10 dBu and -45 to 25 dBu. When dBV is selected as the unit, the range is selectable between -87.2 to -22.2 dBV, -77.2 to -7.2 dBV, -62.2 to 7.8 dBV and -47.2 to 22.8 dBV. Under voltage, you can select 43.6u to 77.4mV, 0.14m to 435 mV, 0.78 to 2.45V or 4.36m to 13.7V.
Phase
The PAA6's phase meter gives a visual representation – as well as numerical representation (in degrees) – of the phase difference between the two input signals. Sine waves with the same frequency must be used, however the levels can differ. Levels and frequencies must be stable, however, to obtain consistent measurements.
Checking the difference in Phase between two signals:
- Enter the SET menu for the Phase function. Here users can adjust the input source, unit and response time. Set the input source to "Line in" (figure 50). The unit is not too important for the results of the phase meter itself, although it's best to set the unit to whatever unit your input signal will be. Select "OK" to return to the phase meter.
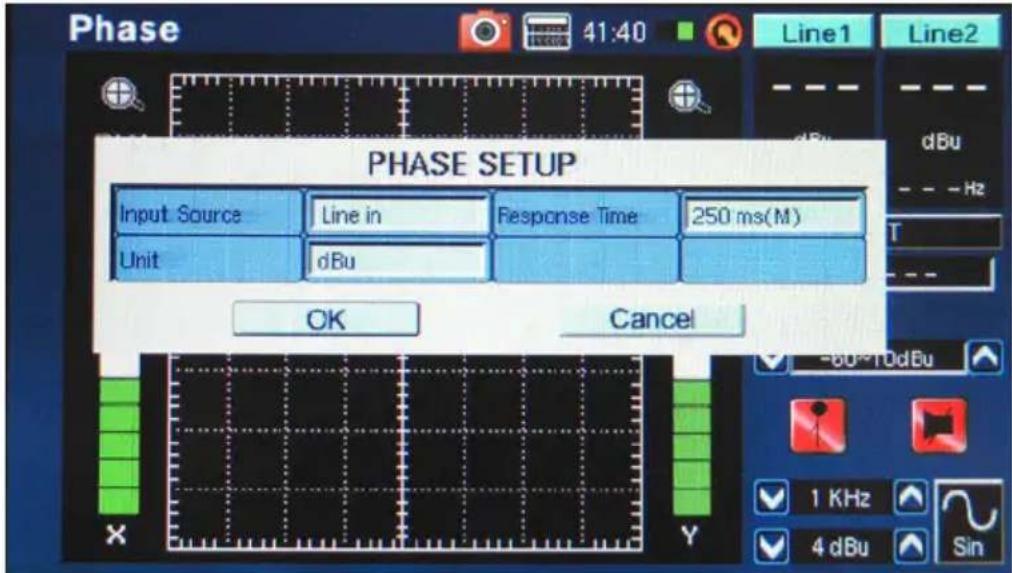
figure 50
- Adjust the measurement range for the phase meter. The measurement range will depend on the unit selected in the settings. When operating under dBu, the range can be adjusted between -85 to -20 dBu, -75 to -5 dBu, -60 to 10 dBu and -45 to 25 dBu. When dBV is selected as the unit, the range is selectable between -87.2 to -22.2 dBV, -77.2 to -7.2 dBV, -62.2 to 7.8 dBV and -47.2 to 22.8 dBV. Under voltage, you can select 43.6u to 77.4mV, 0.14m to 435 mV, 0.78 to 2.45V or 4.36m to 13.7V.
- Connect two outputs from your audio system (containing the two signals you'd like to check against one another) to the PAA6's input. Remember, the Phase function compares the difference between the signals so two inputs is vital to getting accurate results.
-
Ideally, run sine waves through your system to the inputs of the PAA6. The sine waves can be of differing levels, but the frequency of the signal must be identical.
-
A 45^ line represents a stereo signal that is perfectly panned (or a phase value of 0^ , as shown in figure 51). Anything differing from the 45^ slant will begin to be out of phase. A line that lays perfectly horizontal (along the X axis) shows two signals that are perfectly out-of-phase and that will cancel each other out when played in mono. A vertical line (a line that runs along the Y axis) shows the two signals are in perfect mono.
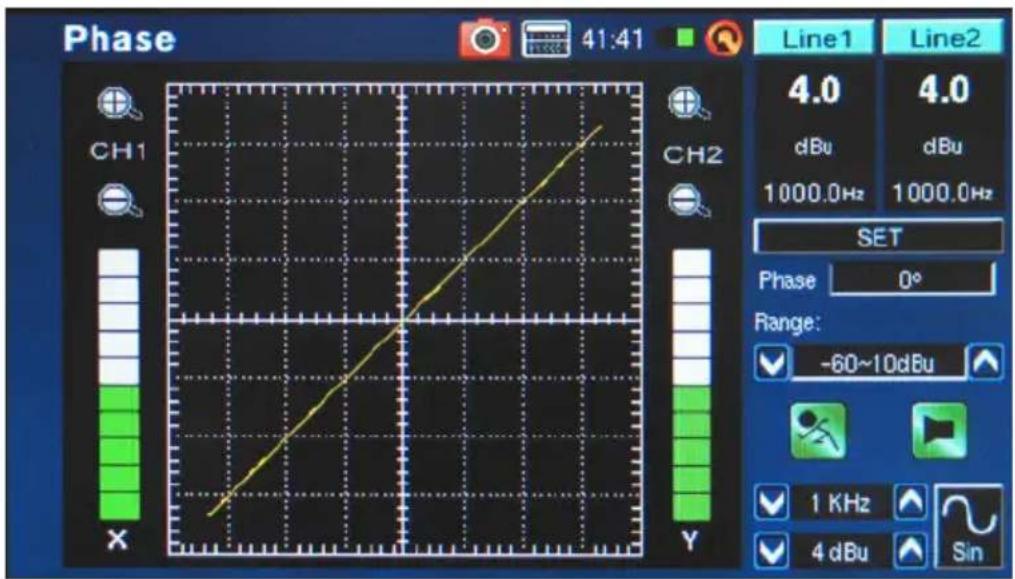
figure 51
- The actual phase of the signal will be displayed to the right of display. The phase is displayed and updated in 1 degree increments.
Scope
This is an audio bandwidth oscilloscope. This function provides an accurate graphic representation of audio waveforms, allowing users to better identify audio distortion, clipping, and problems with the polarity of a signal.
Using the scope to measure a waveform:
- Enter the SET menu within the Scope function (figure 52). Here users can adjust the input source, unit, response time and trigger. The scope can be used for a multitude of measurements, both through the mic and line inputs.
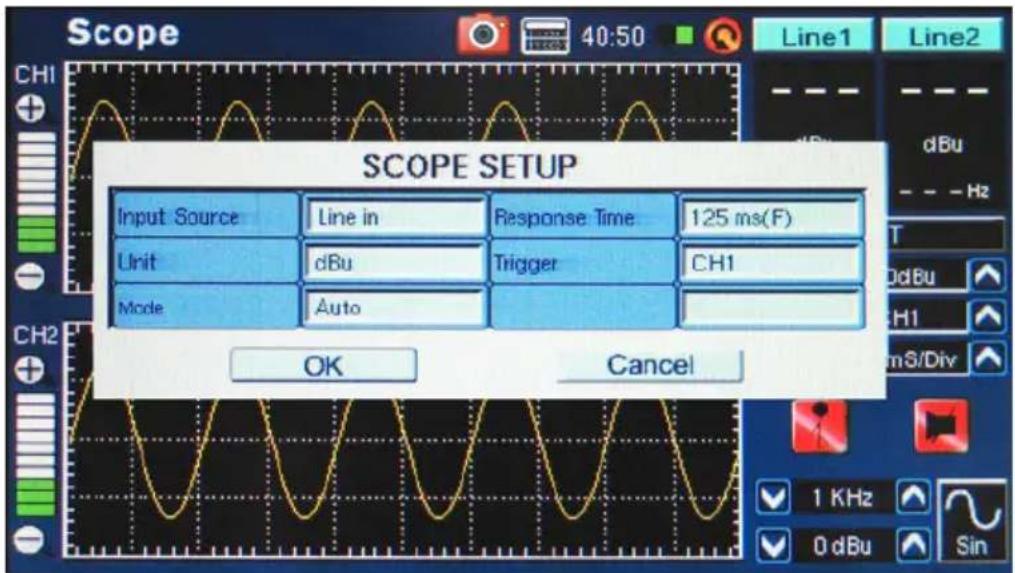
figure 52
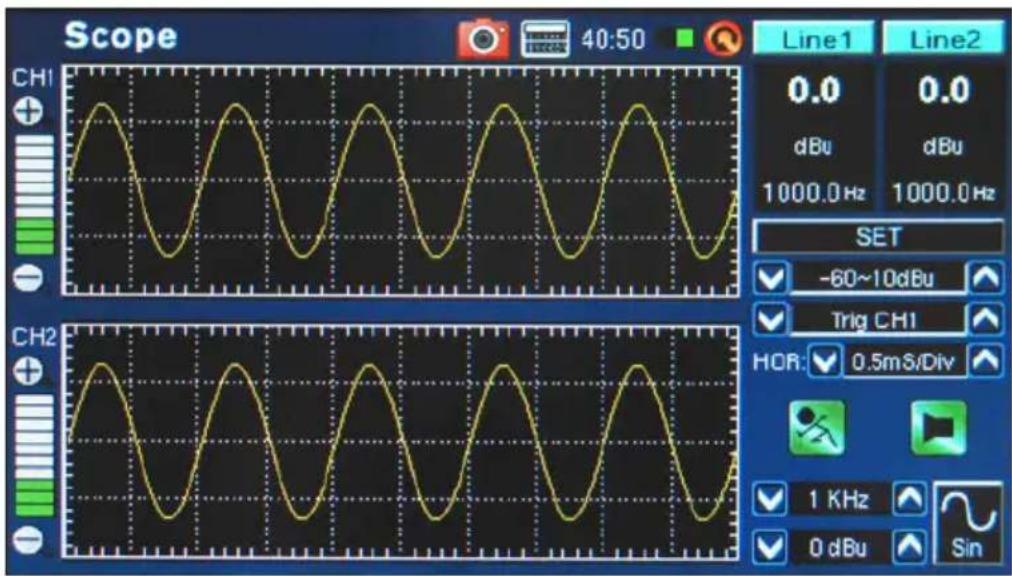
figure 53
-
Set the range of measurements taken. The range can depend on the 'unit' selected in point 1. In dB SPL, users can select 30 to 100 dB SPL, 45 to 115 dB SPL or 60 to 130 dB SPL. When operating under dBu, the range can be adjusted between -85 to -20 dBu, -75 to -5 dBu, -60 to 10 dBu and -45 to 25 dBu. When dBV is selected as the unit, the range is selectable between -87.2 to -22.2 dBV, -77.2 to -7.2 dBV, -62.2 to 7.8 dBV and -47.2 to 22.8 dBV. Under voltage, users can select 43.6u to 77.4mV, 0.14m to 435 mV, 0.78 to 2.45V or 4.36m to 13.7V.
-
Play a signal through the PAA6's microphone or line inputs (depending what was selected in point 1 above).
- Signals such as sine waves, triangle waves, square waves, etcetera, will appear as you would expect. If the appearance of these waves seems cluttered or out of focus, you may need to adjust the HOR (horizontal time) option, found on the right-hand side of the display window (figure 54).
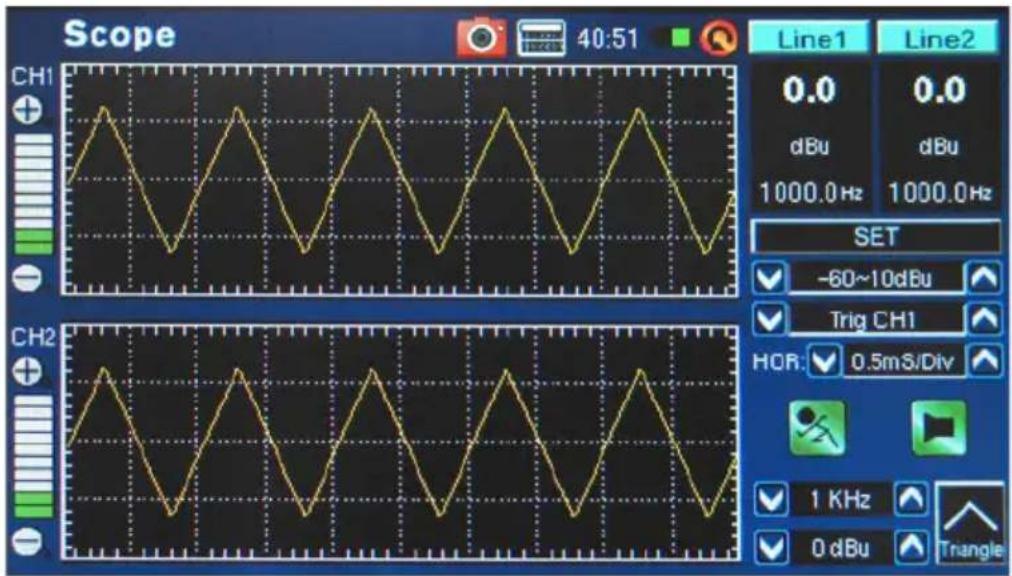
figure 54
Trigger: Users can select channel 1, channel 2 or both as the Scope's trigger (see figure 55). Setting the trigger on one of (or both of) the channels allows users to better read the results of repeating waveforms without them moving excessively.
Mode: The trigger mode of the Scope function (found in the SET menu) can be selected between Auto and Normal. An auto trigger will be updated constantly, whereas a normal trigger mode will hold the waveform even after the test signal is no longer present. This is useful in allowing users to still read the waveform after the signal generator is turned off.
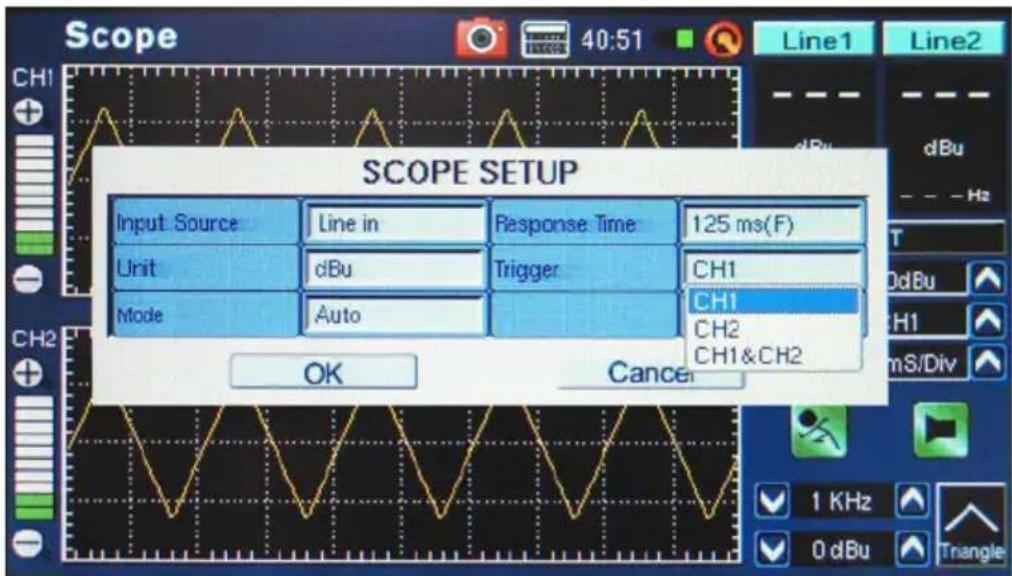
figure 55
Horizontal Time Option (HOR): Featured on the Scope function, the horizontal division option allows users to adjust the value of time between each horizontal segment (or 'division') of the scope's display grid. The horizontal division time can be adjusted between 0.17ms, 0.33ms, 0.5ms, 1.0ms, 2.0ms, 5.0ms, 8.0ms, 10.0ms, 20.0ms, 50.0ms, 80.0ms, 100ms, 200ms and 500ms. There are a total of 10 horizontal divisions displayed.
Polarity
The polarity function is most useful in determining whether a speaker is correctly wired. A polarity signal is typically required when checking the phase of a speaker. Thankfully, one is provided through the onboard signal generator.
Procedure for checking the polarity of speakers:
- Go to the Polarity function.
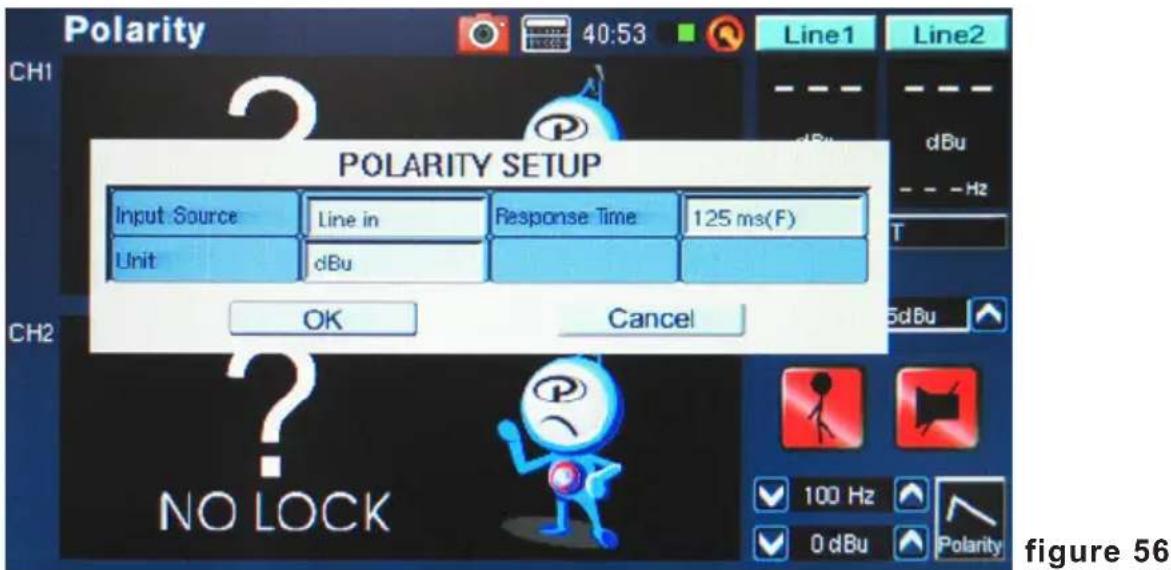
- Go to the SET menu (figure 56) and select MIC as your input source. Exit the setting menu.
- Connect the signal generator output to your sound system's inputs. Ideally, with active speakers, you will connect the signal generator into your speakers to avoid the complication of finding miss-wired cables elsewhere in your setup.
- Start the polarity tone playing by pushing the signal generator on/off icon. You could also opt to play a polarity signal through your speakers through some other means (compact disc, external tone generator, etc.).
- Stand approximately one meter (3 or 4 feet) in front of the speaker that plays the polarity signal.
-
Activate the polarity function by pushing the PAA6's Run/Stop button (either on screen or on the left hand side of the unit).
-
A large “+” appearing on screen means the signal is in phase and the wiring is correct (figure 57).
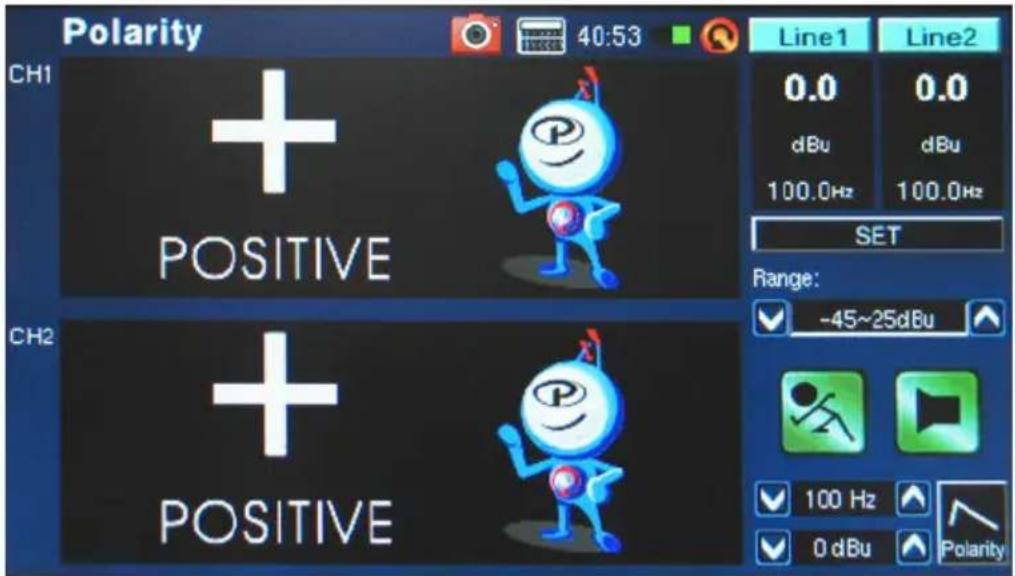
figure 57
- If instead of a “+” you get a “-”, the speaker is out of phase and should be corrected.
- A big “?” or a screen switching between plus and minus symbols means the sound pressure is at a level that is not detectable by the PAA6. So turn it up! The signal generator's level can be turned up, as can your speaker's signal.
Attention: Make sure the sound pressure level of the polarity signal from the system is higher than the noise from the surrounding environment. The PAA6 will not be able to detect the phase of the speaker accurately if the polarity signal is not at a suitable level.
The above procedure is for checking the polarity of speakers. The same method can be used to check the wiring of cables themselves, you simply need to select the Line input as your input source. After doing so, connect one end of the cable in question to your signal generator and the other end to your input. Points 6 through 9 should be identical from that point on.
Equivalent Continuous Noise Level (LEQ)
The LEQ is essentially a 10-band RTA that provides the linear average sound pressure levels over a pre-determined measure of time. The results of the LEQ can be taken for any period of time, from a few seconds up to a maximum of 48 hours. Results are updated on screen every second. This function is particularly useful for ensuring that noise standards are being met.
Taking LEQ measurements:
- Enter the LEQ setup by pushing "SET" on the LEQ function page (figure 58). Users can adjust the weighting and duration here. As previously stated, A weighting is more preferable in dB SPL situations, as the results will mimic that of human hearing. However there are many possible uses for B, C and flat weightings, so it all depends on your requirements.
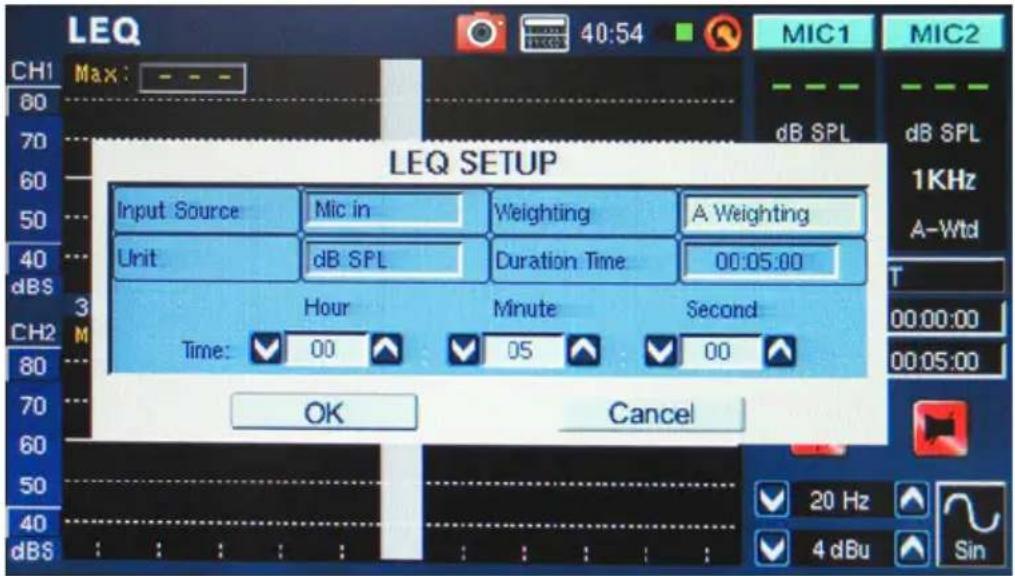
figure 58
- After setting the duration and weighting, exit the LEQ Setting menu by pushing "OK".
- It is best to place the PAA6 in an area where it will not be disturbed for the entire LEQ duration, as to completely ensure the accuracy of your results during this period.
-
When taking measurements over hours or days, be sure to connect the DC power supply.
-
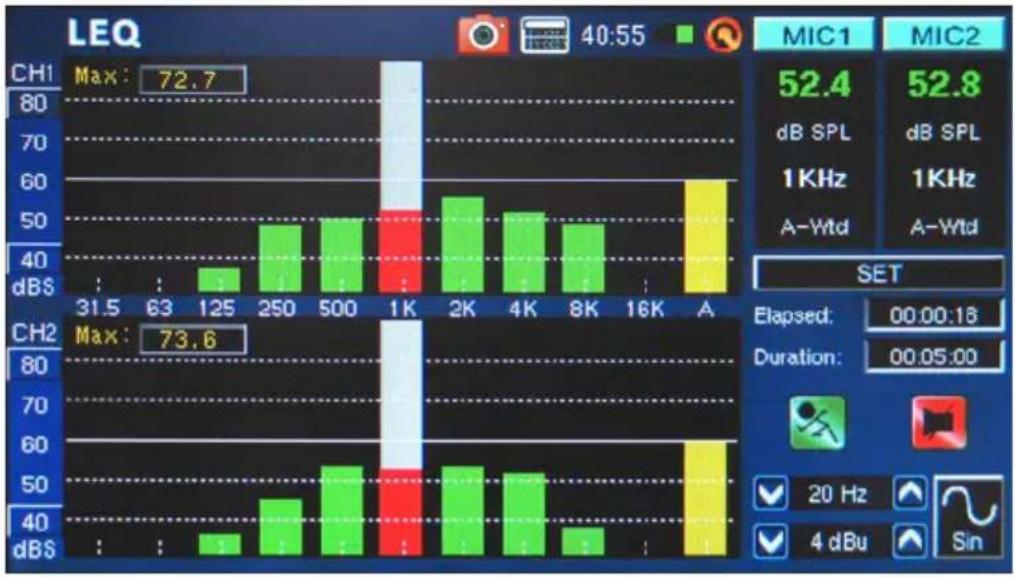
Push "RUN/STOP" to start the LEQ. Results will be updated frequently on screen (figure 59).
bar
| Parameter | Value | | :--- | :--- | | MAX | 72.7 | | SET | 52.4 | | MHz | 52.8 | | Duration | 00.05:00 | | Elapsed: | 00.00:16 | | 20 Hz | | | 4 dBu | Sin |figure 59
- Pushing the "RUN/STOP" button again will stop the LEQ and freeze the current results on screen. Once the LEQ has been stopped, however, it cannot be resumed from that point.
MEMORY
The PAA6's RTA, FFT and RT60 functions allow you to save and recall your read-outs. These can be saved on either an external SD card, or on the PAA6's internal memory (of which there is 100MB available). Users can also load or delete their previously stored measurements.
Save:
- In any function where readings can be saved, select the small "FILE" icon to the right of the page.
- Select SAVE from the pull-down menu on the top left of the page (figure 60).
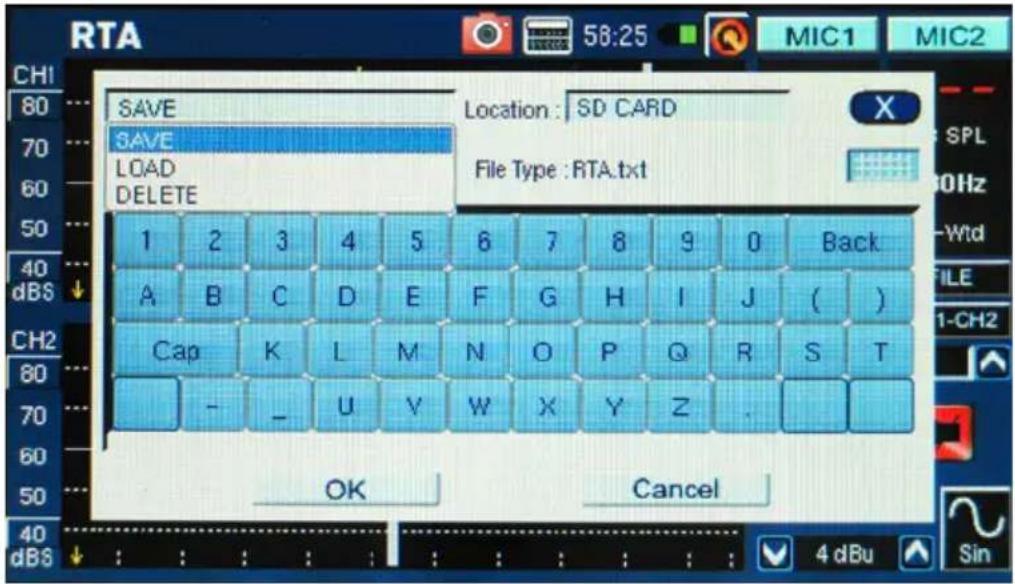
figure 60
- Choose the appropriate location for your save file (from either the PAA6 or an SD card) (figure 60).
- Select the small keyboard icon to the right of the window (figure 60).
- Enter a title for your save file.
- Push OK to save the file.
- Save your readings quickly using the on screen display. On the right hand side of the screen there is a window that reads "Memory" followed by a slot number (0, 1, 2, 3, and so forth). Push the up and down arrows to change the memory number, click the memory slot name to save. Red text indicates that data has already been written to that slot; green indicates a free slot.
Load:
- As in point 1 above, select the "FILE" icon.
- Select LOAD from the pull-down menu found at the top right-hand side of the page (figure 61).
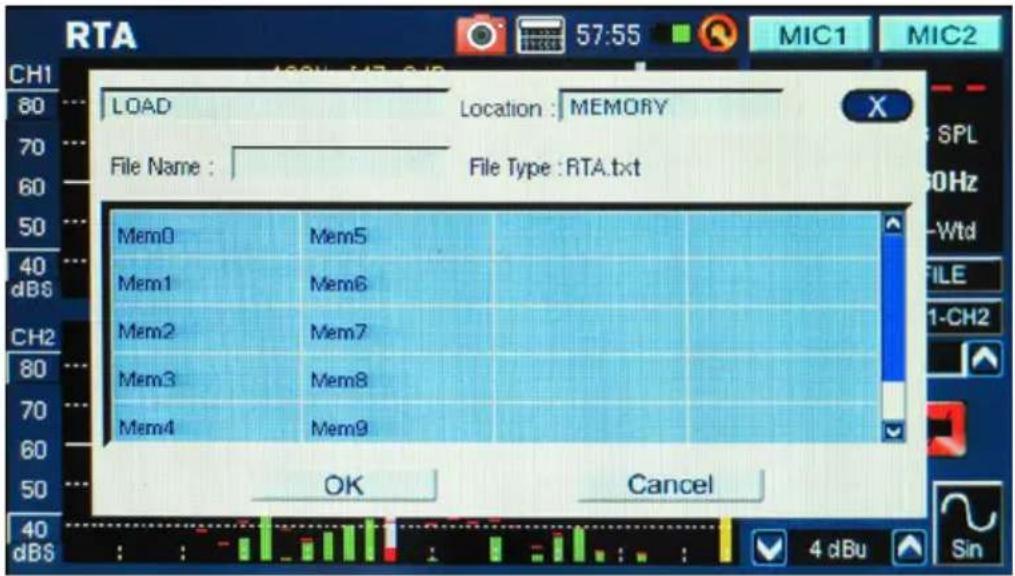
figure 61
- Select the location from which you wish to load your previously recorded data.
- Select the file from the list that appears on screen (figure 62).
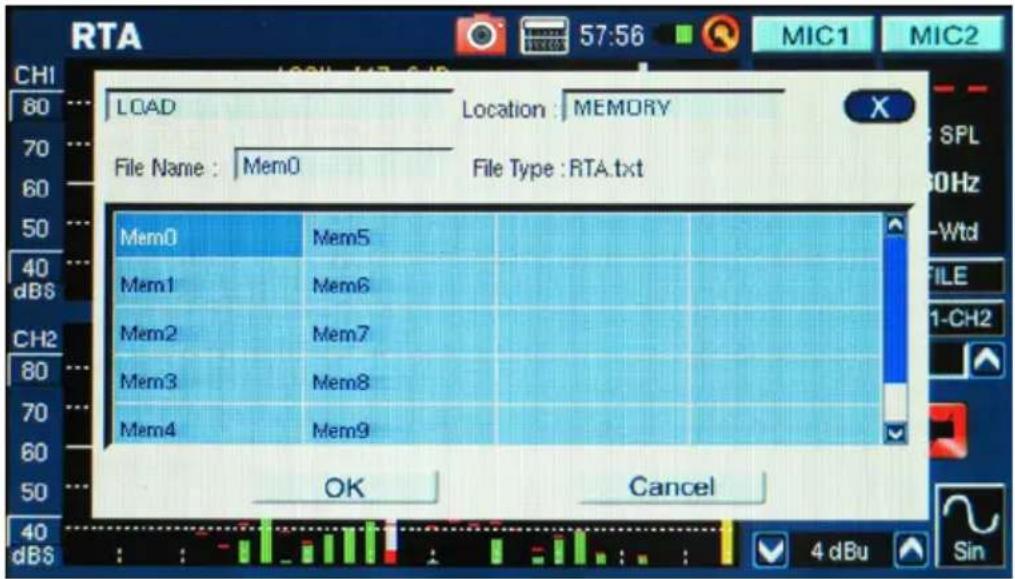
figure 62
- Push OK to continue.
- Once you load any file, you can then use the Memory, Memory0, Memory1... menu (found to the right of the function screen) to load recorded data directly from the PAA6 memory.
SETTINGS
Every one of the PAA6's functions offers its own variable settings. To access the settings menu on each function, push the "SET" icon that is found to the right of the display window.
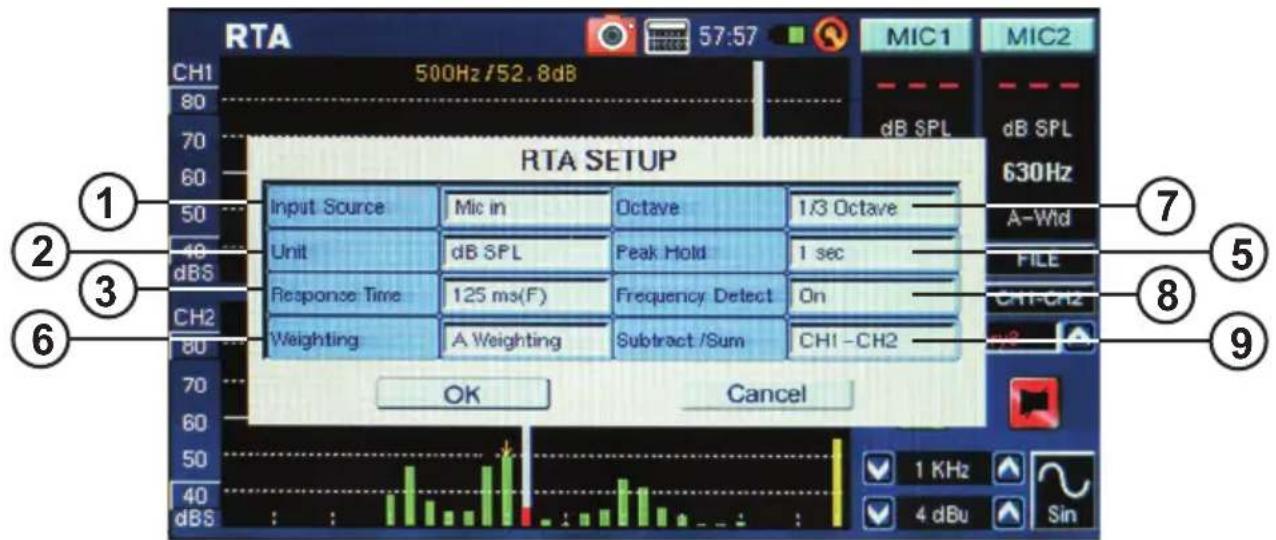
- Input Source – This setting allows users to switch between the built-in microphones and the XLR (line) inputs as their input source for that particular function.
- Unit – This allows users to adjust between various measurement units. This may include dB SPL (when the microphone is selected as the input source), dBu, dBV and Volt (when line is selected as the input source).
- Response Time – This feature allows users to select the speed at which their calculations are made and displayed on screen. The response time can be selected between 35 ms (for explosive sounds), 125 ms (fast), 250 ms (medium) and 1 second (slow).
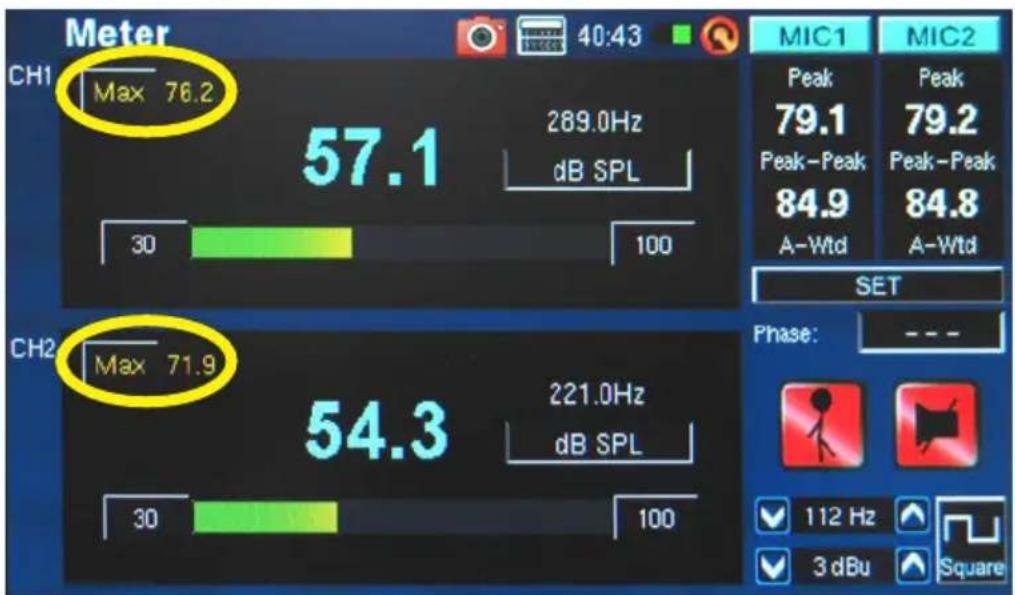
- Max level – Though not mentioned in the settings menu, the maximum level is visible in a number of functions (the meter, for example). The maximum level is kept until the value is reset. This is done by simply pushing the word “max” onscreen (figure 63).
bar
| Channel | Metric | Value | | :--- | :--- | :--- | | CH1 | Max | 76.2 | | CH1 | 57.1 | 289.0Hz | | CH1 | dB SPL | 100 | | CH2 | Max | 71.9 | | CH2 | 54.3 | 221.0Hz | | CH2 | dB SPL | 100 | | MIC1 | Peak | 79.1 | | MIC1 | Peak-Peak | 84.9 | | MIC1 | A-Wtd | 84.8 | | MIC2 | Peak | 79.2 | | MIC2 | Peak-Peak | 84.8 | | MIC2 | A-Wtd | 84.8 | The chart displays the maximum and minimum values for each metric at 40:43. The data is presented in a table format with three distinct bars representing different measurements. The 'SET' label indicates the setting for comparison across the two metrics.figure 63
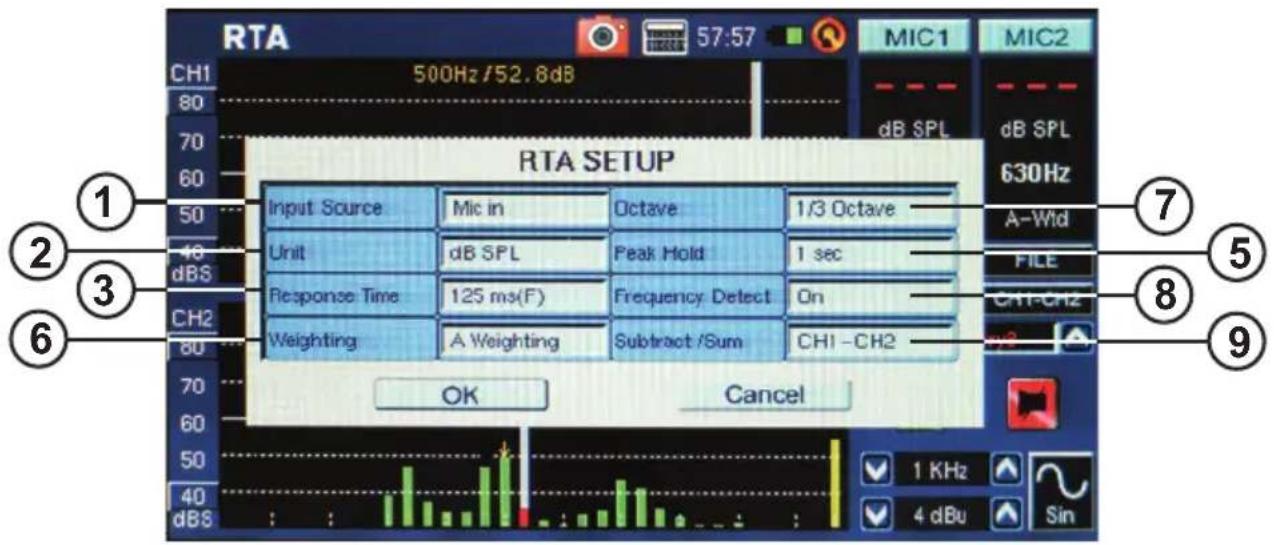
- Peak Hold – The peak hold function will cause the highest signal peaks to be held for a short period of time, giving a better visual representation of these high peaks. This is typically represented by a small red line/dot at the top of the frequency bar. This red mark will remain for as long as the peak hold time is set, or until the frequency's signal rises above the previous peak.
- Weighting – Any audio analyzer needs to be designed so that it hears sound properties in a manner that would be appropriate for the measurements it is taking. For example, the sensitivity of human hearing is restricted to the frequency range of 20 Hz to 20 kHz. The human ear, however, is most sensitive to sounds in the range of 500 Hz to 8 kHz. The ear becomes progressively less sensitive to sound out of this range. Microphones, however, are not restricted by this limitation and therefore do not respond in the same manner that our ear would.
Audio analysis devices such as the PAA6 provide various weightings for the measurements taken to compensate for the increased and decreased sensitivity. The weighting determines the curve that the PAA6 will use to interpret the input signals from the chosen input source. Flat, A-, B- and C-weightings are available. Each of these weightings is ideal for different applications, with A-weighting perhaps being the most commonly used (and that which most closely matches the human ear) and internationally recognized standard for measurement.
- Octave – Changing the octave allows users to change the resolution of their measurements. For example, measurements taken in 1/6th octave measurements are much finer than those taken at 1 octave increments. Users can also opt to take measurements in 1/3rd and 2/3rd octave increments.
- Frequency Detect – This function can be turned on and off on the RTA and FFT functions. This will give an on screen real-time update of the frequency with the highest level. These results will be given on the top of the channel window. There will also be a yellow arrow indicating the frequency within the RTA and FFT results.
-
Subtract/Sum – This features does exactly what it says: allows the users to add or subtract the two input channels to or from one another.
-
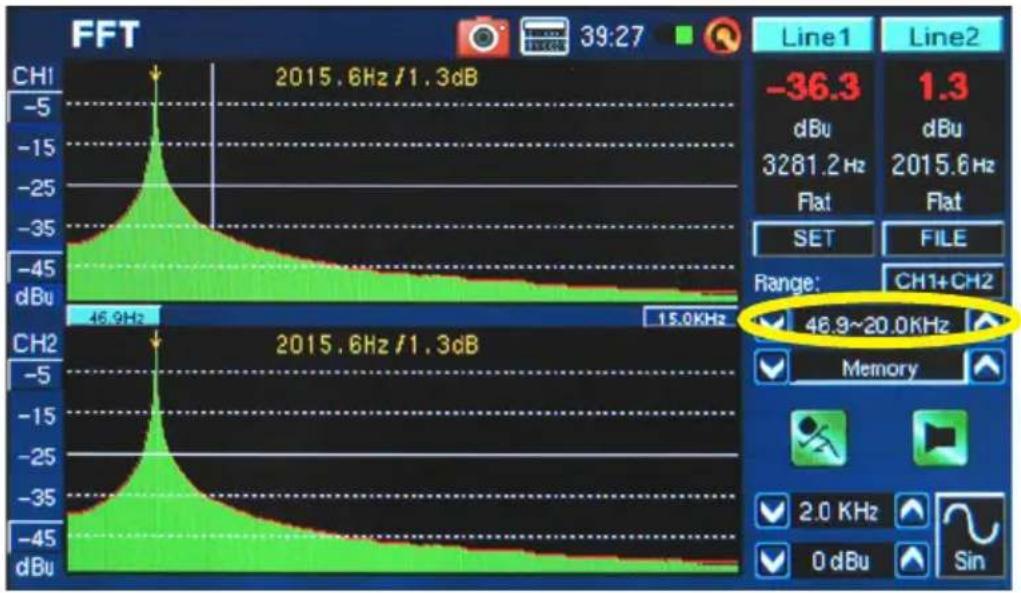
Frequency Range (figure 64) – The frequency range is selectable on the FFT function only. There are 13 different frequency ranges selectable to users. This allows the FFT function to measure frequencies anywhere between 0.2 Hz to 20 kHz.
line
| Frequency Range | Value | | --------------- | --------- | | 46.9 Hz | 46.9~20.0 kHz | | 3281.2 Hz | 1.3 dB |figure 64
- Filter Mode/Frequency (figure 65)—On the RT60 function, this setting allows users to select one of the preset frequencies to calculate their RT60 measurements. Even after performing an RT60 calculation under the 'flat' frequency filter mode, users can enter the settings menu to add a 1 octave filter at 31.5 Hz, 63 Hz, 125 Hz, 250 Hz, 500 Hz, 1.0 kHz, 2.0 kHz, 4.0 kHz, 8.0 kHz or 16.0 kHz to view the reverb time results under these frequencies.
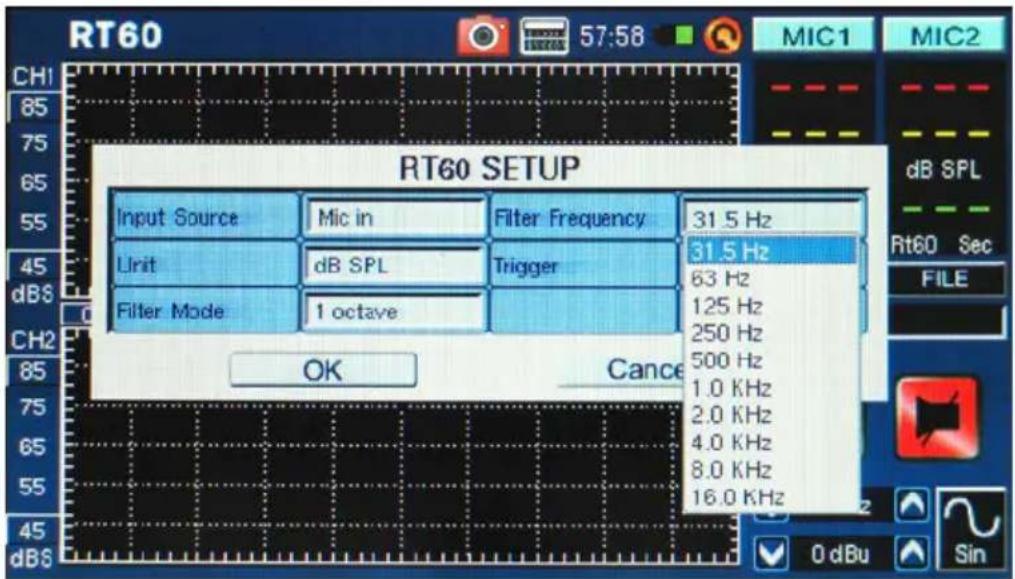
figure 65
SIGNAL GENERATOR
The signal generator can be accessed through every function of the PAA6. There are seven built-in signals, each with their own adjustable properties. All generated signals can have their output level adjusted between -40 dBu and +4 dBu. All signals – except the sweep signal – can also have their gate time adjusted, where users can select a time up to 10 seconds for the signal to run, at which time the signal will turn off.
Sweep: The sweep signal consists of a sine wave with an ever-changing frequency. The frequencies can be user-defined, with 1/6, 1/3, 2/3 and 1 octave intervals selectable by the user. Alternatively, users can choose 'Select' and adjust the sweep range manual. Once users choose 'Select', the Sweep start and Sweep stop fields will become active and users can select the start frequency (between 20Hz and 20 kHz) and stop frequency (between 20 Hz and 20 kHz). Users can opt to have a continuous sweep tone, where the signal generator will run through the entire audio spectrum selected, then stop again. Alternatively, users can opt for the tone to repeat itself anywhere between 1 and 10 times before it turns off (figure 66).
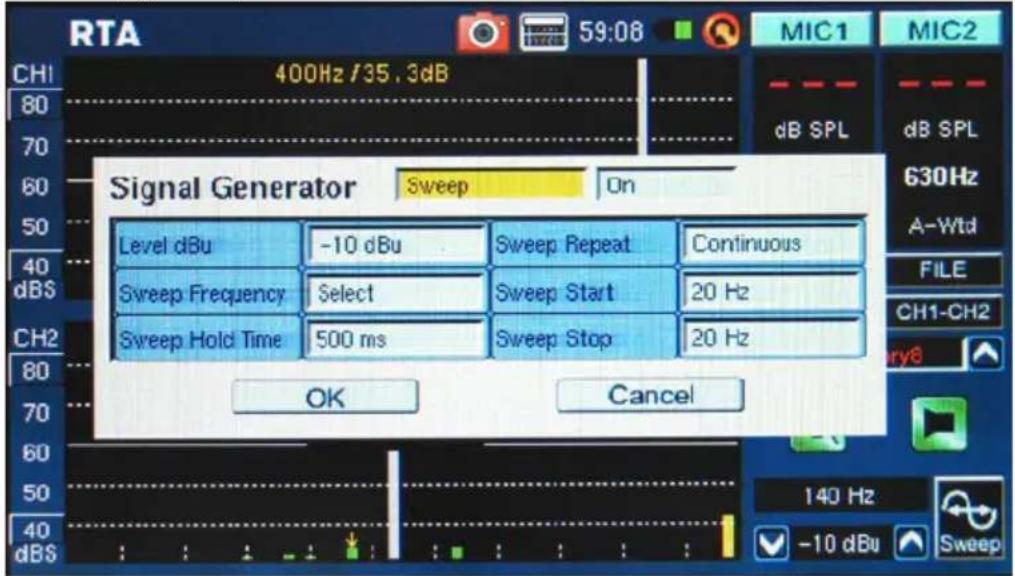
figure 66
Sine: Used for a variety of purposes. A 1 kHz sine wave is perhaps the most commonly used sine wave. However, users can adjust the PAA6's sine wave to a number of frequencies between 20 Hz and 20 kHz (figure 67).
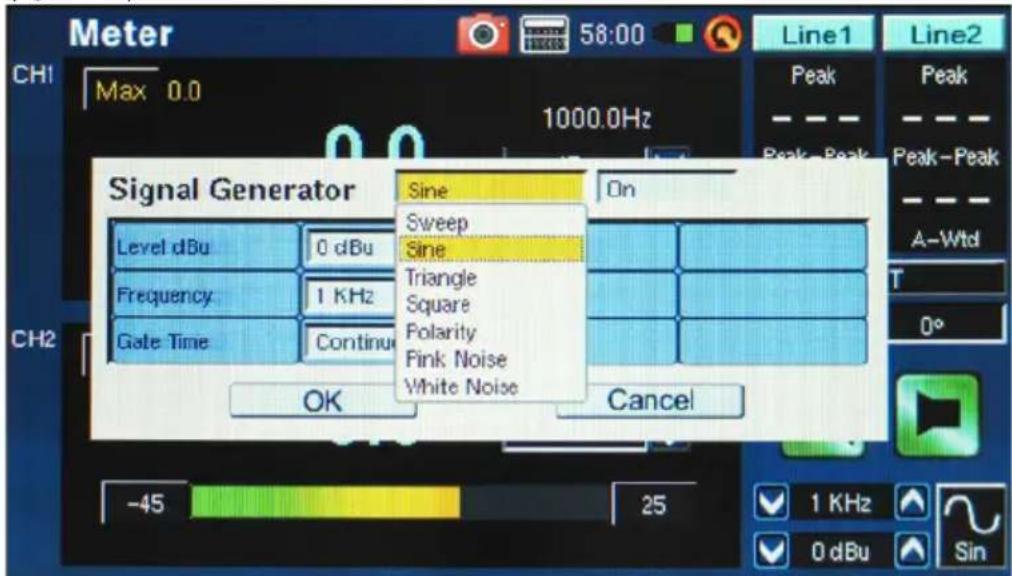
figure 67
Triangle: Triangle waves, like sine waves, are used for a variety of analyzing purposes. They are called triangle waves due to their appearance on an oscilloscope.
Square: Square waves, like triangle waves, get their name from the appearance they produce on an oscilloscope. These blocky waves alternate between two levels at regular intervals – making them sound and appear quite different to the gradual high and low curves of sine and triangle waves.
Polarity: The polarity signal is usually used for checking the polarity of speakers. Check the Polarity section of the menu for more information.
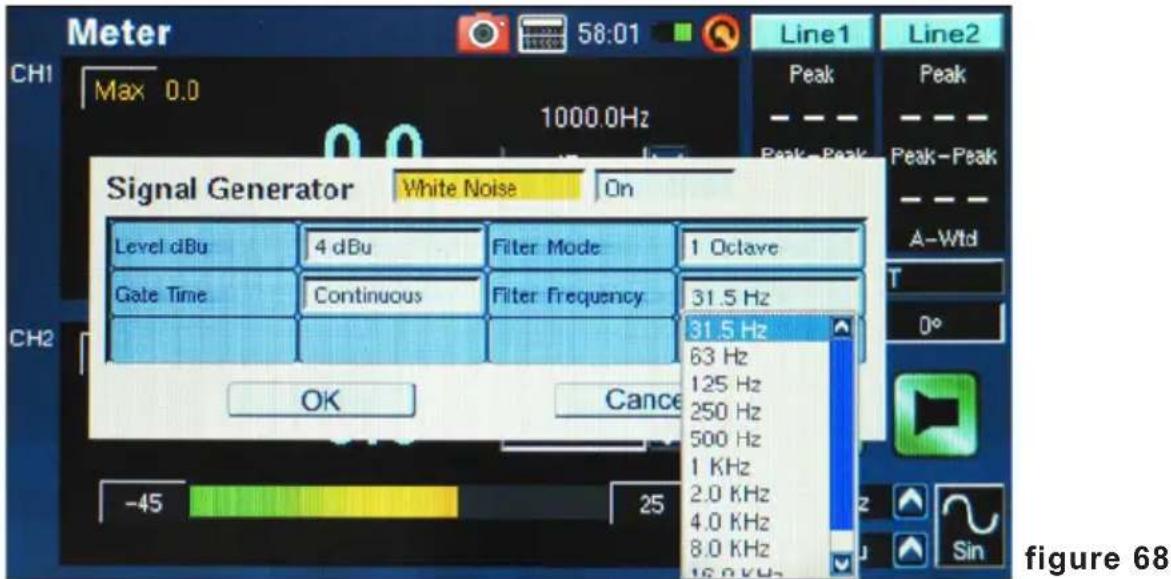
Pink Noise: The pink noise signal is typically used for adjustment of environment acoustics. The most common use would be in the setting of equalizers. As pink noise encompasses most frequencies within it, playing a pink noise signal in any given setting can give engineers a sense of the acoustical properties of the room and allows them to compensate through the equalizer. Users can filter specific frequencies for the pink noise generator simply by using the “Filter Mode” and “Filter Frequency” options.
White Noise: As with pink noise, white noise can be used to set up equalizers. It also features the "Filter Mode" and "Filter Frequency" options that the pink noise offers (figure 68).
SYSTEM SETUP
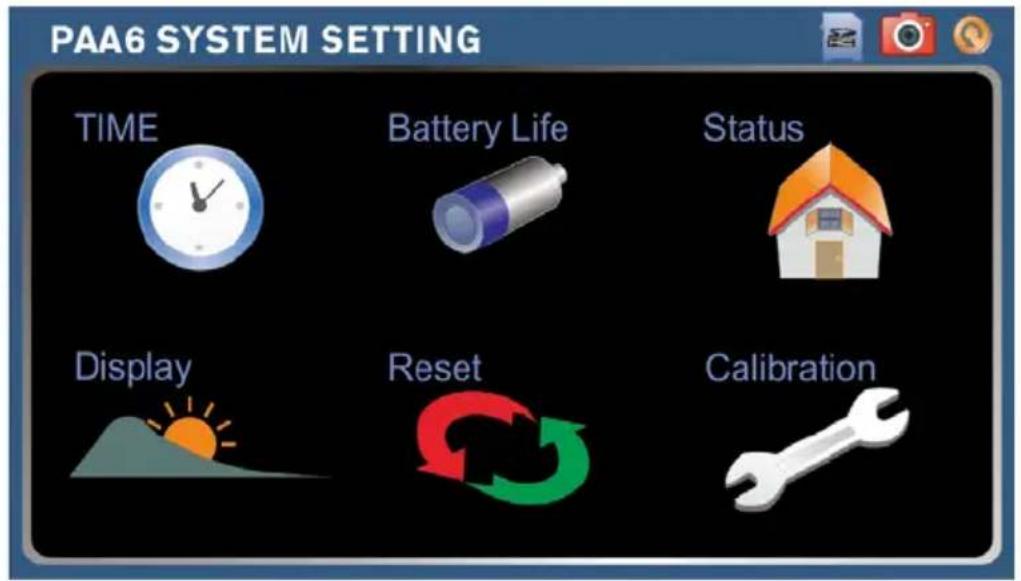
Time: Users can adjust the time and date through this option.
Battery Life: Users can monitor the current battery life and select whether to turn on an 'auto power off' function. The auto power off function will turn the PAA6 off after a pre-determined period of time if the user does not touch the PAA6.
Status: The status screen allows users to see the amount of available space left on the PAA6 or any inserted SD card. The firmware version is also listed on the status screen.
Display: Users can adjust the brightness level through the display menu. Reducing the brightness of the screen can help preserve battery power, or increasing it can enhance visibility in bright areas. The display section also features a backlight time option that allows users to adjust the time they wish the backlight of the PAA6's touch screen to remain on before it goes dark to preserve the battery power. Adjusting the backlight to 'off' will ensure that it never goes dark.
Reset: Select reset to restore the factory settings of the PAA6.
Calibrate: There are two calibration options: Microphone and Touch Screen. The touch screen calibration is self-explanatory. Users must touch each of the five cursers that appears on screen to calibrate the touch-function of the onboard display. The microphone calibration is slightly more involved and will be discussed in the Microphone Calibration section.
As the PAA6 comes already calibrated, you should never actually need to calibrate your unit. If measurement data or the operation of the unit begins to seem abnormal, however, it may be necessary to perform a calibration. Anyone can calibrate the PAA6 and regain accurate sound pressure level measurement, provided they have a quality sound level calibrator with 1/2" diameter adapter that sends out a 1 kHz tone. A B&K TYPE 4231 sound level calibrator is suggested.
Procedure:
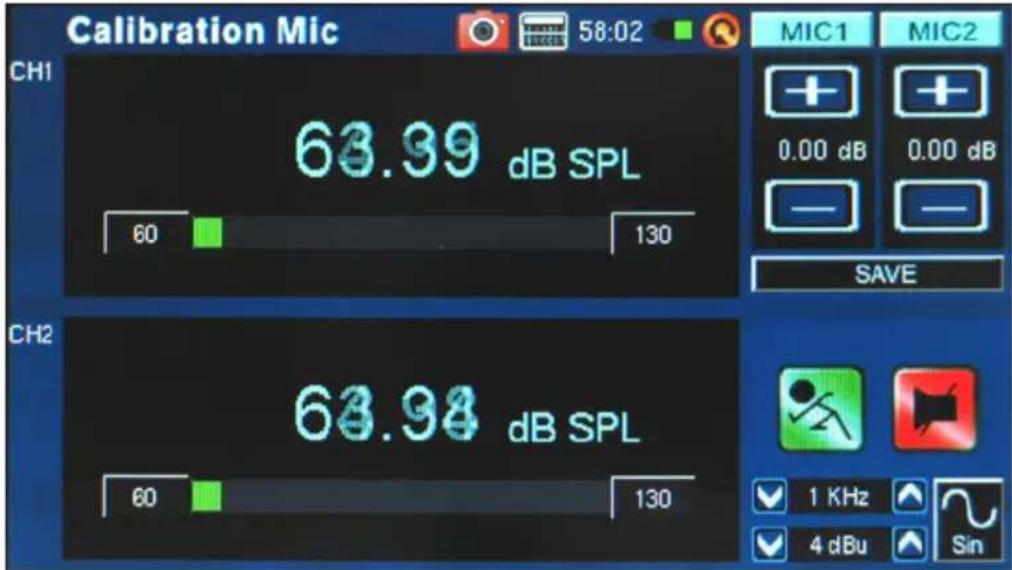
- Enter the System > Calibration > Mic menu (figure 69).
bar
| Channel | Calibration Mic (dB SPL) | | ------- | ------------------------ | | CH1 | 63.39 | | CH2 | 63.94 |figure 69
- As you probably cannot calibrate both microphones concurrently, it's advised that you turn one microphone off while you calibrate the other. Push the MIC1 or MIC2 icons at the top right-hand side of the screen to turn one of the microphones off.
-
Place the PAA6's microphone within a sound level calibrator with a microphone connector of a 1/2" diameter.
-
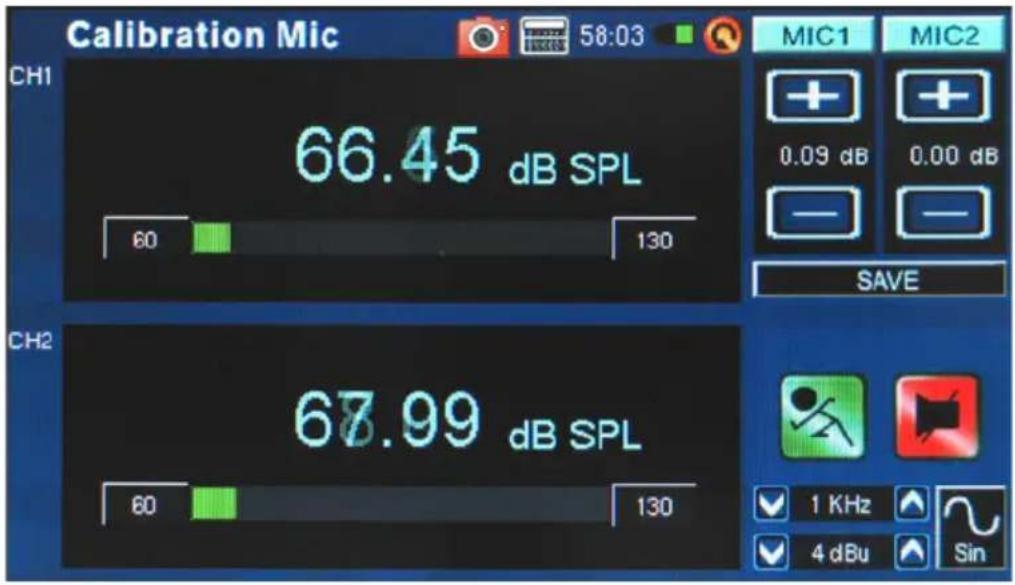
Adjust the level measured from the SPL calibrator by pressing "+" and "-" buttons until the level is equal to that of the sound level calibrator (typically 94 dB). Pressing the "+" button each time will increase the value by 0.1dB; pressing the "-" button each time will decrease the value by 0.1 dB (figure 70).
bar
| Channel | Value | |---------|-----------| | CH1 | 66.45 dB SPL | | CH2 | 67.99 dB SPL |figure 70
- Press the SAVE button to complete the calibration (the PAA6 will restart in this case) or the BACK button to exit without saving. (figure 71 shows the saving calibration confirmation screen)
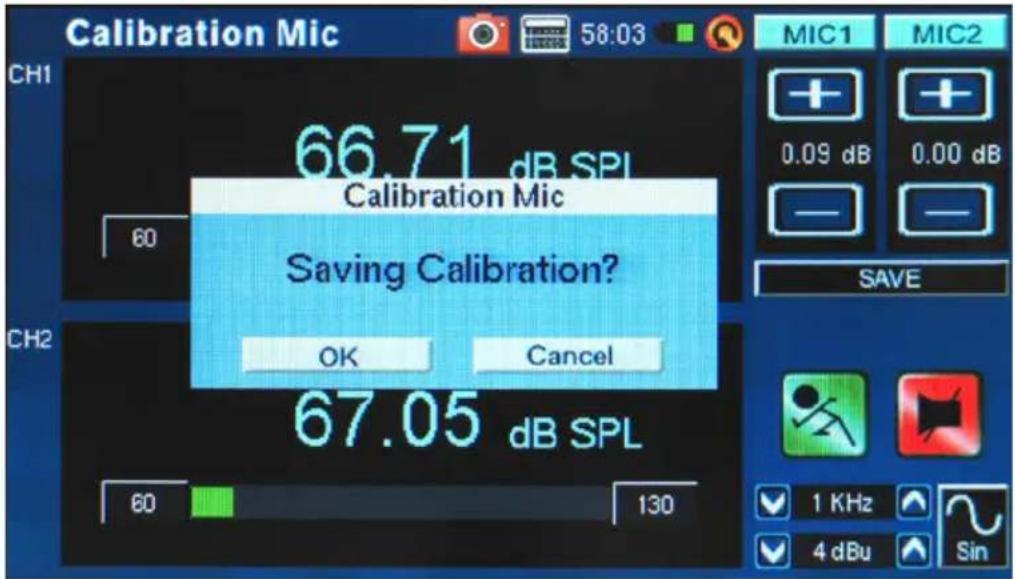
figure 71
SPECIFICATIONS
| Inputs / Outputs Built-in Mic | Condenser mic | |
| XLR Jack XLR input and output | ||
| USB USB High Speed | 2.0 Interface | |
| Display 480 x 272, 16-bit, ful | color touch screen | |
| Range Mic in / Line In 30~130 | dB SPL / -85~25 dBu | |
| Memory SD card and interna | memory | |
| Generator Sine, triangle, square | are, polarity, sweep, pink noise, white noise | |
| RTA Frequency 20 Hz ~ 20 KHz | Hz, all frequencies | |
| EQ Setting EQ Cut or | Boost | |
| Subtract / Sum | CH1+CH2. CH1-CH2. CH2-CH1 | |
| Dynamic Range | 30 ~130 dB. 60dB display range, eg. 70~130, 60~120, 50~110 | |
| dB-scale setting | + / - 5dB steps on Y-Axis | |
| Unit | dB SPL, dBu, dBV, Volt | |
| Octave | 1/1, 1/3, 2/3, 1/6 | |
| Weighted | A. B. C. Flat | |
| FFT | Frequency Range | 13 selectable bandwidths |
| Subtract / Sum | CH1+CH2. CH1-CH2. CH2-CH1 | |
| Unit | dB SPL, dBu, dBV, Volt | |
| Octave | 1/1, 1/3, 2/3, 1/6 | |
| Weighted | A. B. C. Flat | |
| RT-60 | Unit | dB SPL, dBu, dBV, Volt |
| Trigger | Internal / External | |
| Weighted | A. B. C. Flat. 1 Octave | |
| THD+N | less than 0.005% 20~20KHz +4 dBu | |
| Meter | 30~130 dB SPL / -85~25 dBu / -87.2~22.8 dBV / 0.0436mV~13.7V | |
| Phase | Phase Degree | Phase Correlation (out of phase or in phase) |
| Oscillator Scope | Trigger | CH1, CH2, CH1+CH2 |
| Mode | Auto, Normal | |
| Polarity | Polarity checker (Negative / Positive) | |
| LEQ | Weighted | A. B. C. Flat |
| KHz | Selectable Frequency | |
| Image Capture | *.BMP | 480 x 272 |
| Battery | Lithium-ion DC3.7V - 2 x 1100 mAh | |
| Dimensions (W x H x D) | 174.5 x 40 x 105.5 mm (6.89" x 1.57" x 4.17") | |
SERVICE AND REPAIR
For replacement parts, service and repairs please contact the Phonic distributor in your country. Phonic does not release service manuals to consumers, and advice users to not attempt any self repairs, as doing so voids all warranties. You can locate a dealer near you at http://www.phonic.com/where-to-buy/.
WARRANTY INFORMATION
Phonic stands behind every product we make with a no-hassles warranty. Warranty coverage may be extended, depending on your region. Phonic Corporation warrants this product for a minimum of one year from the original date of purchase against defects in material and workmanship under use as instructed by the user's manual. Phonic, at its option, shall repair or replace the defective unit covered by this warranty. Please retain the dated sales receipt as evidence of the date of purchase. You will need it for any warranty service. No returns or repairs will be accepted without a proper RMA number (return merchandise authorization). In order to keep this warranty in effect, the product must have been handled and used as prescribed in the instructions accompanying this warranty. Any tampering of the product or attempts of self repair voids all warranty. This warranty does not cover any damage due to accident, misuse, abuse, or negligence. This warranty is valid only if the product was purchased new from an authorized Phonic dealer/distributor. For complete warranty policy information, please visit http://www.phonic.com/warranty/.
CUSTOMER SERVICE AND TECHNICAL SUPPORT
We encourage you to visit our online help at http://support.phonic.com/. There you can find answers to frequently asked questions, tech tips, driver downloads, returns instruction and other helpful information. We make every effort to answer your questions as soon as possible.
support@phonic.com
http://www.phonic.com
PHONIC
MANUAL DEL USUARIO
CONTENIDO
INTRODUCCIÓN 1
CARACTERÍSTICAS 1
7. Entradas Balanceadas XLR
figura 13
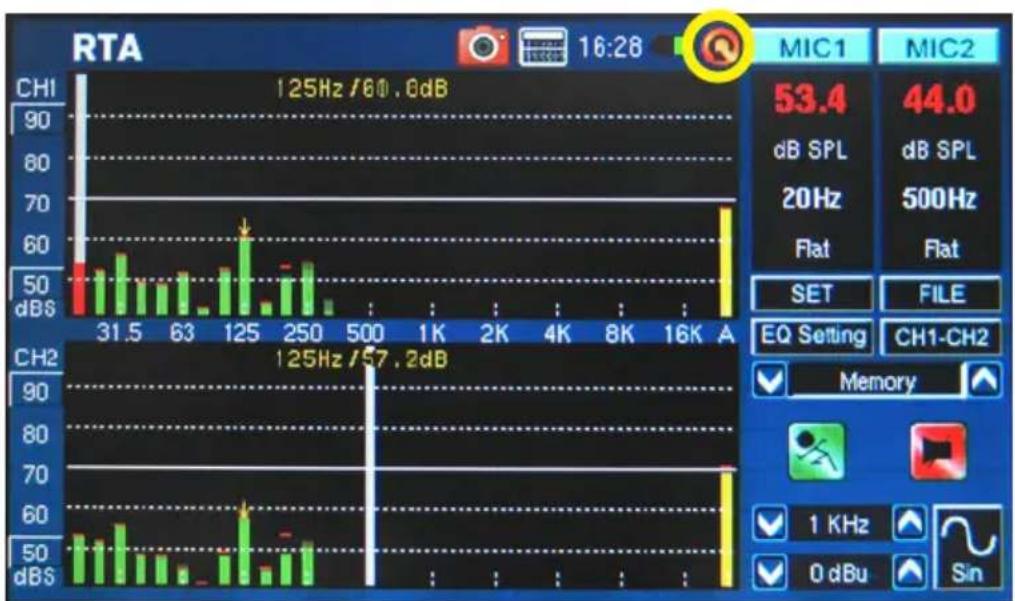
figura 14
figura 16
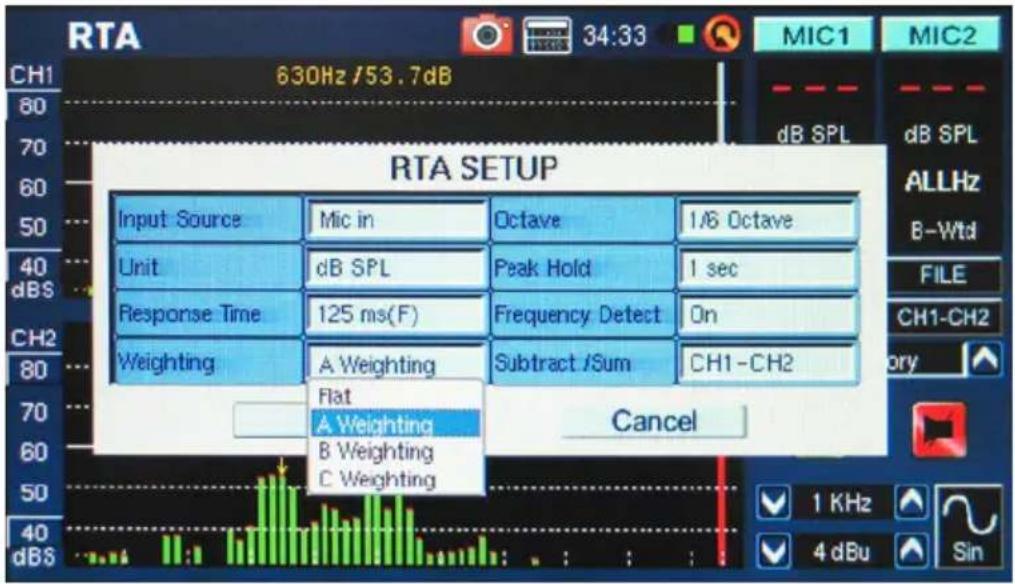
figura 17
figura 20
figura 26
figura 27
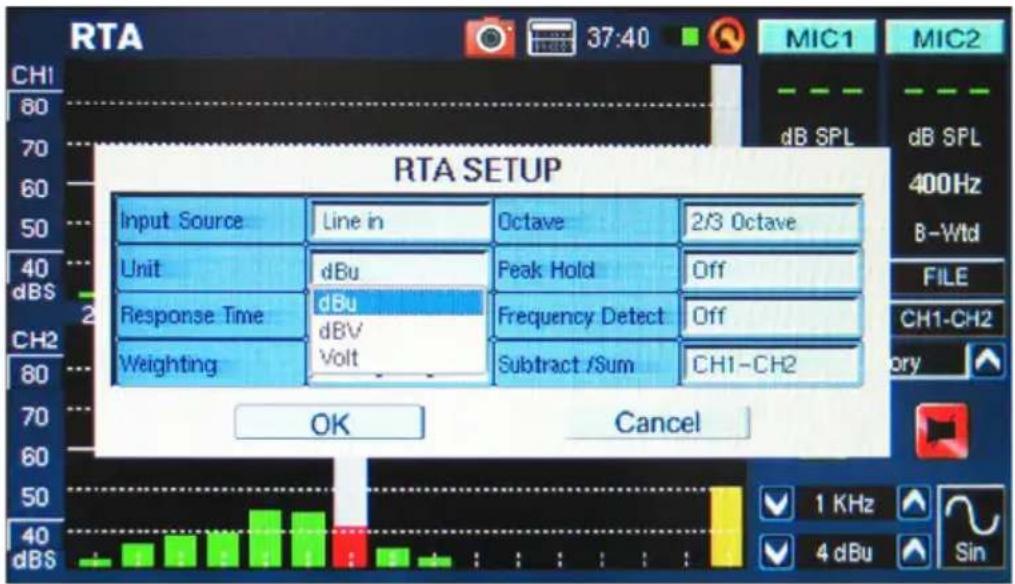
figura 28
figura 33
line
| Channel | MIC1 | MIC2 | | ------- | ---- | ---- | | CH1 | 53.7 | 50.0 | | CH2 | 67.2 | 69.2 |figura 41
figura 44
figura 46
bar
| Channel | Max | 57.1 dB SPL | 289.0Hz | | :--- | :--- | :--- | :--- | | CH1 | 76.2 | 30 | 100 | | CH2 | 71.9 | 30 | 100 | | MHz | 54.3 | 289.0 Hz | 221.0 Hz | | MHz | Peak | 79.1 | 79.2 | | MHz | Peak-Peak | 84.9 | 84.8 | | MHz | A-Wtd | A-Wtd | A-Wtd | | MHz | SET | — | — | | MHz | Phase: —— | 112 Hz | 3 dBu Square | | MHz | — | — | — | | MHz | — | — | — | | MHz | — | — | — | | MHz | — | — | — | | MHz | — | — | — | | MHz | — | — | — | | MHz | — | — | — | | MHz | — | — | — | | MHz | — | — | — | | MHz | — | — | — | | MHz | — | — | — | | MHz | — | — | — |figura 47
figura 48
figura 50
figura 52
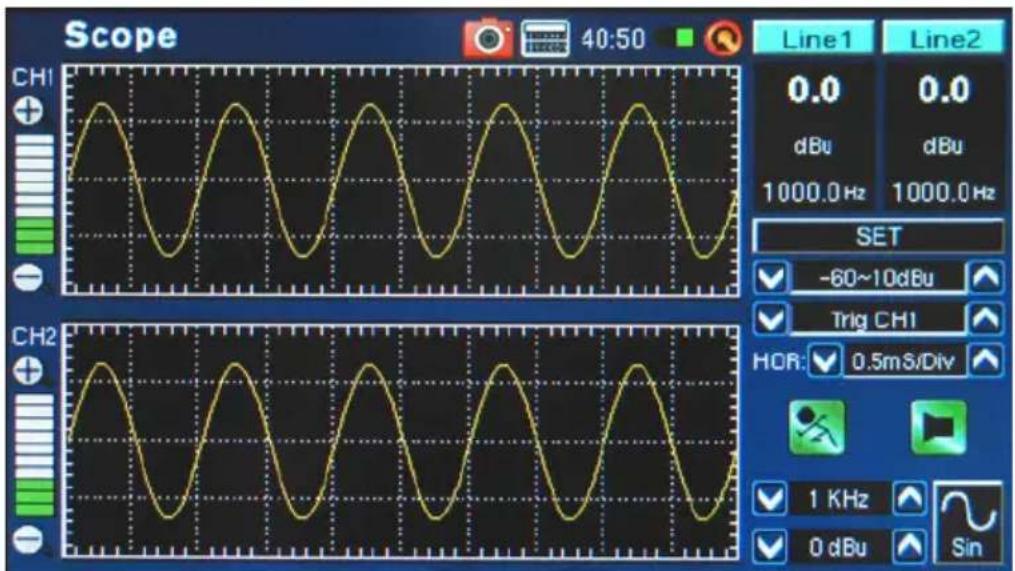
figura 53
figura 56
figura 58
bar
LEQ | Parameter | Channel | Value | | :--- | :--- | :--- | | CH1 | Max | 72.7 | | SET | CH2 | Max | | 31.5 | 31.5 | 73.6 | | 63 | 63 | 73.6 | | 125 | 125 | 73.6 | | 250 | 250 | 73.6 | | 500 | 500 | 73.6 | | 1K | 1K | 73.6 | | 2K | 2K | 73.6 | | 4K | 4K | 73.6 | | 8K | 8K | 73.6 | | 16K | A | 73.6 | | MIC1 | 52.4 dB SPL | 52.8 dB SPL | | MIC2 | 52.4 dB SPL | 52.8 dB SPL | | Duration: 00:05:00 | Duration: 00:05:00 | Duration: 00:05:00 | | 20 Hz | Sin | Sin | | 4 dBu | Sin | Sin |figura 59
bar
| Metric | Value | | :--- | :--- | | CH1 | Max 76.2 | | CH1 | 57.1 | | CH1 | 30 | | CH1 | 100 | | CH2 | Max 71.9 | | CH2 | 54.3 | | CH2 | 30 | | CH2 | 100 | | MHz SPL | 289.0 Hz | | MHz SPL | dB SPL | | MHz SPL | 221.0 Hz | | MHz SPL | dB SPL | | Peak | 79.1 | | Peak-Peak | 84.9 | | A-Wtd | 84.8 | | SET | — — | | Phase: | Value | | :--- | :--- | | 112 Hz | ▼ | | 3 dBu | ▲ | | Square | ▲ | | Measurement Type | Label | | :--- | :--- | | CH1 | Max 76.2 | | CH1 | 57.1 | | CH1 | 30 | | CH1 | 100 | | CH2 | Max 71.9 | | CH2 | 54.3 | | CH2 | 30 | | CH2 | 100 | MIC1 | Peak | | MIC1 | Peak-Peak | | MIC1 | A-Wtd | | MIC2 | Peak-Peak | | MIC2 | Peak-Peak | | MIC2 | A-Wtd |figura 63
line
| Frequency Range | Label | | --------------- | ------------- | | 2015.6 Hz | -36.3 | | 2015.6 Hz | 1.3 | | 46.9–20.0 KHz | 46.9–20.0 KHz |figura 64
DIMENSIONS DIMENSION
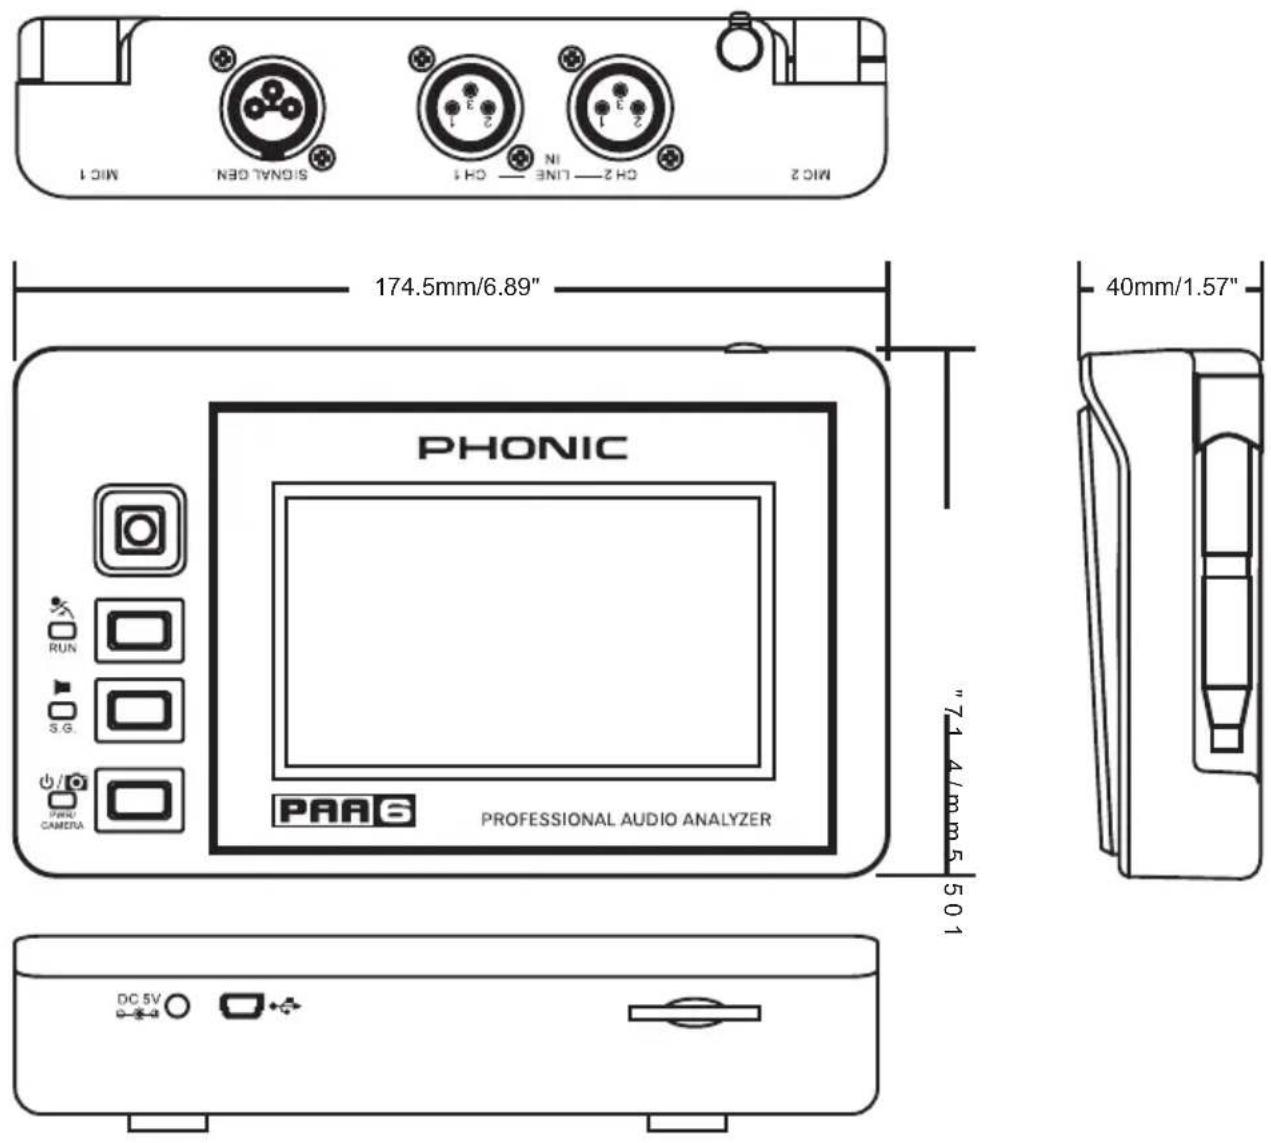
Measurements are shown in mm/inches.
- IMPORTANT SAFETY INSTRUCTIONS
- INTRODUCTION
- FEATURES
- PACKAGE CONTENTS
- SOFTWARE
- CONTROLS & DISPLAY
- Color Touch Screen
- Directional Control
- Run/Stop Button and Indicator
- Signal Generator Button and Indicator
- Power / Capture Button and Indicator
- Built-in Microphones
- Balanced XLR Inputs
- Balanced XLR Output
- SD Memory Card Slot
- USB Connector
- DC Power Input
- Stand Mount
- Touch Pen
- GETTING STARTED
- OPERATING TIPS
- AUDIO ANALYSIS FUNCTIONS
- Real Time Analyzer (RTA)
- Procedure for taking acoustic measurements:
- Procedure for measuring an electrical signal:
- Fast Fourier Transform (FFT)
- Taking FFT measurements:
- Reverb Time (RT60)
- Measuring Reverb Time:
- Total Harmonic Distortion + Noise (THD+N)
- Measuring the THD+N:
- Meter
- Taking SPL measurements:
- Taking measurements through the line inputs:
- Phase
- Checking the difference in Phase between two signals:
- Scope
- Using the scope to measure a waveform:
- Polarity
- Procedure for checking the polarity of speakers:
- Equivalent Continuous Noise Level (LEQ)
- Taking LEQ measurements:
- MEMORY
- Save:
- Load:
- SETTINGS
- SIGNAL GENERATOR
- SYSTEM SETUP
- Procedure:
- SERVICE AND REPAIR
- WARRANTY INFORMATION
- CUSTOMER SERVICE AND TECHNICAL SUPPORT
- MANUAL DEL USUARIO
- CONTENIDO
- Entradas Balanceadas XLR
- DIMENSIONS DIMENSION
Brand : PHONIC
Model : PAA6
Category : Uncategorized