HSA1016 - Measurement Owon - Free user manual and instructions
Find the device manual for free HSA1016 Owon in PDF.


| Product Type | Spectrum Analyzer |
| Brand | Owon |
| Model | HSA1016 |
| Frequency Range | 9 kHz to 1.6 GHz |
| Resolution Bandwidth (RBW) | 1 Hz to 1 MHz (1-3-5-10 steps) |
| Video Bandwidth (VBW) | 10 Hz to 3 MHz (1-3-5-10 steps) |
| Display | 8-inch TFT LCD, 1024 x 768, color |
| Input Impedance | 50 Ω (nominal) |
| RF Input Connector | N-type female |
| Maximum Input DC Voltage | 50 V |
| Maximum RF Input Level | +30 dBm (1 W) damage level; +20 dBm continuous with 40 dB attenuation |
| Displayed Average Noise Level (DANL) | Typical -140 dBm (1 MHz - 500 MHz, preamp off, RBW=100 Hz) |
| Phase Noise (at 100 kHz offset, fc=1 GHz) | < -104 dBc/Hz typical |
| Tracking Generator (option) | Included (TG model), 100 kHz to 1.6 GHz, output level -40 dBm to 0 dBm |
| Number of Traces | 5 |
| Detector Modes | Positive Peak, Negative Peak, Normal, Sample, RMS Average, Voltage Average, Quasi-Peak (EMI option) |
| Sweep Time Range | 10 ms to 3000 s |
| Power Supply | AC-DC adapter (100-240 VAC, 12-15 VDC output, 45 W) or internal Li-ion battery (7.4 V, 9100 mAh) |
| Dimensions (W x H x D) | 265 mm x 190 mm x 58 mm |
| Weight | Approx. 2.5 kg |
| Warranty | 3 years for main unit, 12 months for accessories |
| Calibration Interval | 18 months (recommended) |
| Included Accessories | Power cord, CD-ROM, Quick Guide, USB cable, AC-DC adapter, GPS antenna, metal case |
Frequently Asked Questions - HSA1016 Owon
User questions about HSA1016 Owon
0 question about this device. Answer the ones you know or ask your own.
Ask a new question about this device
Download the instructions for your Measurement in PDF format for free! Find your manual HSA1016 - Owon and take your electronic device back in hand. On this page are published all the documents necessary for the use of your device. HSA1016 by Owon.
USER MANUAL HSA1016 Owon
Notice: -TG models are with tracking generator
July 2023 edition V2.0.0
Copyright © LILLIPUT Company. All rights reserved.
The LILLIPUT's products are under the protection of the patent rights, including ones which have already obtained the patent rights and those which are applied for. The information in this manual will replace all materials published.
The information in this manual was correct at the time of printing. However, LILLIPUT will continue to improve products and reserves the rights to change specification at any time without notice.
owon ^® is the registered trademark of the LILLIPUT Company.
Fujian LILLIPUT Optoelectronics Technology Co., Ltd.
No. 19, Heming Road
Lantian Industrial Zone, Zhangzhou 363005 P.R. China
Tel: +86-596-2130430 Fax: +86-596-2109272
Web: www.owon.com
E-mail: info@owon.com.cn
General Warranty
We warrant that the product will be free from defects in materials and workmanship for a period of 3 years from the date of purchase of the product by the original purchaser from our company. The warranty period for accessories is 12 months. This warranty only applies to the original purchaser and is not transferable to a third party.
If the product proves defective during the warranty period, we will either repair the defective product without charge for parts and labour, or will provide a replacement in exchange for the defective product. Parts, modules and replacement products used by our company for warranty work may be new or reconditioned like new. All replaced parts, modules and products become the property of our company.
In order to obtain service under this warranty, the customer must notify our company of the defect before the expiration of the warranty period. Customer shall be responsible for packaging and shipping the defective product to the designated service centre, a copy of the customers proof of purchase is also required.
This warranty shall not apply to any defect, failure or damage caused by improper use or improper or inadequate maintenance and care. We shall not be obligated to furnish service under this warranty a) to repair damage resulting from attempts by personnel other than our company representatives to install, repair or service the product; b) to repair damage resulting from improper use or connection to incompatible equipment; c) to repair any damage or malfunction caused by the use of not our supplies; or d) to service a product that has been modified or integrated with other products when the effect of such modification or integration increases the time or difficulty of servicing the product.
Please contact the nearest Sales and Service Offices for services.
Excepting the after-sales services provided in this summary or the applicable warranty statements, we will not offer any guarantee for maintenance definitely declared or hinted, including but not limited to the implied guarantee for marketability and special-purpose acceptability. We should not take any responsibilities for any indirect, special or consequent damages.
Table of contents
List of figures...... iii
- General Safety Requirements .... 1
- Safety Terms and Symbols...... 4
- Document Overview .... 5
- Quick Start 6
4.1 General Inspection....6
4.2 Safety Precaution before Operation....6
4.3 First Time to Power on 7
4.4 Front Panel Overview 9
4.5 Top Panel Overview....10
4.6 Rear Panel Overview....12
4.7 User Interface Overview....12
4.8 Function Keys 16
4.9 Parameter Input....19
4.10 Build-in Help....21
4.11 Touchscreen Controls 21
4.12 External keyboard control....25
4.13 Basic Measurement....27
5. Menu Interpretation ...... 31
- Specification 73
- Troubleshooting....86
- Appendix 87
Appendix A: Enclosure 87
Appendix B: General Care and Cleaning....88
Appendix C: USB Disk Requirements 88
Appendix D: PC Software Requirements....88
List of figures
Figure 4-1 Front panel....9
Figure 4-2 Top panel 10
Figure 4-3 Rear panel....12
Figure 4-4 User interface 13
Figure 4-5 Function softkeys....16
Figure 4-6 Shift key and function hardkeys ...... 18
Figure 4-7 Numeric keypad 19
Figure 4-8 The rotary knob....20
Figure 4-9 Arrow keys 20
Figure 4-10 Full Span 28
Figure 4-11 Set frequency span....29
Figure 4-12 Set reference level....30
List of tables
Table 4-1 AC-DC adapter requirement....7
Table 5-1 Detector type comparison ....50
Table 5-2 [Factory] Settings 62
1. General Safety Requirements
Before use, please read the following safety precautions to avoid any possible bodily injury and to prevent this product or any other connected products from damage. To avoid any contingent danger, ensure this product is only used within the ranges specified.
■ Use Proper Power Cord. Use only the power cord supplied with the product and certified to use in your country.
■ Power Grounded. The main plug should be inserted in a power socket outlet only if provided with a protective earth contact.
■ Check all Terminal Ratings. To avoid fire or shock hazard, check all ratings and markings on this product. Refer to the user manual for more information about ratings before connecting to the instrument.
■ Use Proper Overvoltage Protection. Make sure that no overvoltage (such as that caused by a thunderstorm) can reach the product, or else the operator might expose to danger of electrical shock.
■ Do not operate without covers. Do not operate the instrument with covers or panels removed.
■ Avoid exposed circuit. Be careful when working on exposed circuitry to avoid risk of electric shock or other injury.
■ Do not operate if any damage. If you suspect damage to the instrument, have it inspected by qualified service personnel before further use. Any maintenance, adjustment or replacement especially to circuits or accessories must be performed by qualified service personnel.
■ Use your instrument in a well-ventilated area. Make sure the instrument installed with proper ventilation.
■ Do not operate in damp conditions. In order to avoid short circuiting to the interior of the device or electric shock, please
do not operate in a humid environment.
■ Do not operate in an explosive atmosphere. In order to avoid damages to the device or personal injuries, it is important to operate the device away from an explosive atmosphere.
- Keep product surfaces clean and dry. To avoid the influence of dust or moisture in air, please keep the surface of device clean and dry.
■ Electrostatic Prevention. Operate the instrument in an electrostatic discharge protective environment to avoid damage induced by static discharges. Always ground both the internal and external conductors of cables to release static before making connections.
■ Protect the Input Terminals of Instrument. Do not bend or hit the input terminals and the connected devices, (such as filter, attenuator, etc.) as such stress may cause damages to devices and the instrument. Do not mix the use of 50Ω and 75Ω connectors and/or cables.
■ Do Not Overload the Input. To avoid damaging the instrument, the signals at input terminal must be less than 50V DC voltage components and 30 dBm (1 W) AC (RF) components.
■ Appropriate Use of Power Meter. If you are not sure of the characteristics of signal under measure, follow these recommendations to ensure safe operations: if a RF power meter is available, use it to measure the power level of this signal first; or add a rated external attenuator between signal cable and input terminal of the instrument. Maximum attenuation, reference level and maximum span frequency should be selected, to make the signals displayed within the screen.
■ Know About the Specification Conditions of the Instrument. For maximum performance of the instrument, use the analyzer under specified conditions.
■ Handling Safety. Please handle with care during transportation to avoid damages to buttons, knob, interfaces and other parts on the panels.
2. Safety Terms and Symbols
Safety Terms
Terms in this manual (The following terms may appear in this manual):

WARNING
Warning indicates conditions or practices that could result in injury or loss of life.

CAUTION
Caution indicates the conditions or practices that could result in damage to this product or other property.
Terms on the product (The following terms may appear on this product):
DANGER
Indicates an immediate hazard or injury possibility.
WARNING
Indicates a possible hazard or injury.
CAUTION
Indicates potential damage to the instrument or other property.
Symbols on the product (The following symbols may appear on the product):

Refer to Manual

Conforms to European Union directives

This product complies with the WEEE Directive (2002/96/EC) marking equipment. The affixed product label indicates that you must not discard this electrical/electronic product in domestic household waste.
3. Document Overview
- Quick Start
This chapter states the matters need to attention before first power on, how to power on at first time, introduces spectrum analyzer's front/rear panel and user interface, explains how to use the instrument with a measurement example demonstration.
- Menu Interpretation
This chapter offers spectrum analyzer's front panel menu and button interpretation.
- Specification
This chapter lists spectrum analyzer's specification parameter.
- Trouble Shooting
This chapter helps to implement the troubleshooting and deal with after sale repair.
- Appendix
This chapter introduces accessories of spectrum analyzer and how to maintain device.
Convention on button and menu key format:
Button character + bold bracket, e.g. 【FREQ】stands for FREQ bottom softkey.
Submenu words+bracket, e.g.[Center frequency] stands for
【FREQ】function's center frequency item, that is common called softkey menu item.
Related document:
Related documents including: Quick guide, User manual, programme guide and etc.
4. Quick Start
This chapter states the matters need to attention before first power on, and how to power on at first time, introduces spectrum analyzer's front/top panel and user interface, explains how to use the instrument with a measurement example demonstration.
4.1 General Inspection
When you receive your new instrument, it is recommended that you check the instrument following these steps:
1. Check for transportation damage.
If it is found that the packaging carton or the foamed plastic protection cushion has suffered serious damage, do not throw it away until the complete device and its accessories have been electrically and mechanically checked.
2. Check the Accessories
The supplied accessories are described in the "Appendix A: Enclosure" of this Manual. Please ensure that all the listed accessories are present and undamaged, if any problems are found please contact your distributor or our local office.
3. Check the Complete Instrument
If there is any physical damage, operational fault, or performance issue please contact your distributor or our local office. If there is any damage to the instrument please ensure you keep the original packaging. Ideally you should always keep the original packaging if the instrument must be returned for repair.
4.2 Safety Precaution before Operation
4.2.1 Power Supply Requirements
The analyzer allows the use of either an internal lithium battery pack, or AC-DC adapter shipped with the analyzer for its power supply.
The lithium battery is 7.4V, 9100 mAh.
The table below lists the requirement of the AC-DC adapter.
Table 4-1 AC-DC adapter requirement
| AC-DC adapter parameter | Compatible range |
| Input Voltage | 100 V - 240 VAC, 50/60 Hz |
| Output Voltage | 12 - 15 VDC |
| Max. Power | 45 W |
4.2.2 Electro-static Discharge (ESD) Protection
ESD is an issue often ignored by users. Damage from ESD on the instrument is unlikely to occur immediately but will significantly reduce the reliability of it. Therefore, ESD precautions should be implemented in the work environment, and applied daily.
Generally, there are two steps to manage ESD protection:
1) Conductive table mat to connect hands via wrist bands
2) Conductive ground mat to connect feet via ankle straps
Implement both protection methods will provide a good level of anti-static protection. If used alone, the protection will not be as reliable. To ensure user's safety, anti-static components should offer at least 1MΩ isolation resistance.

WARNING
The above ESD protections measures cannot be used when working with over 500V!
Make good use of anti-static technology to protect components from damage:
1) Quickly ground the internal and external conductor of the coaxial cable before it is connected to the spectrum analyzer.
2) Staff must wear anti-static gloves before touching the connector cord or doing any assemble work.
3) Assure all the instruments are grounded properly to avoid static storage.
4.3 First Time to Power on
Note: Keep the air vents always clear of obstructions for proper
ventilation and cooling of the instrument.

CAUTION
Use only the original AC-DC adapter or originally supplied battery for the power source.
The maximum RF input level of an average continuous power is 30 dBm (or 50 VDC signal input). Avoid connecting a signal into the analyzer that exceeds the maximum level.
1) Press the power switch on the front panel.
2) Self-initialization takes about 30 seconds, after the boot screen the spectrum analyzer will default to the scanning curve.
3) After power on, let the spectrum analyzer warm up for 30 minutes for stabilization to obtain the most accurate results.
4.4 Front Panel Overview
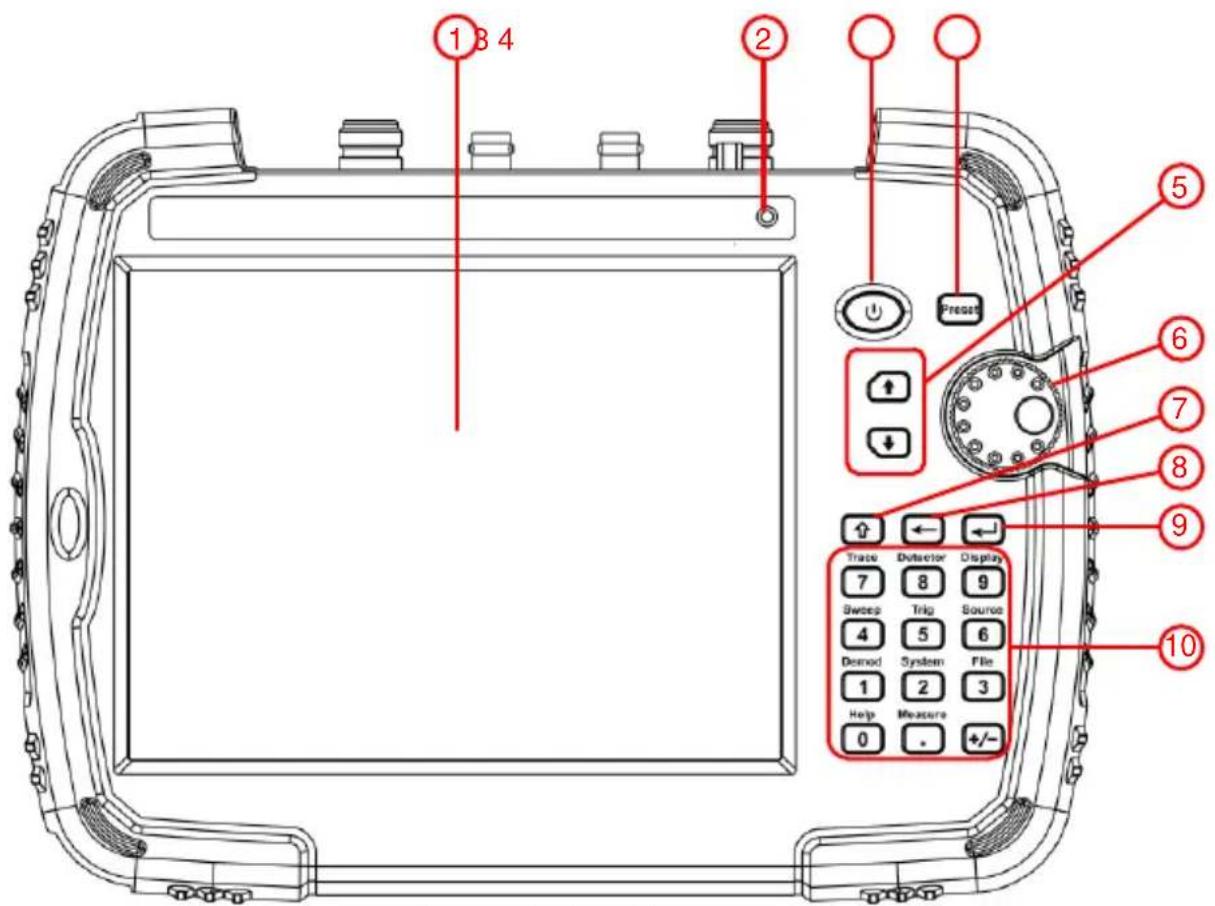
Figure 4-1 Front panel
| NO. | Description |
| 1 | LCD touchscreen. |
| 2 | Light Sensor: Adjusts the screen backlight according to the environmental light. This state can be specified in 【Display】→ [Brightness]. |
| 3 | Power key: Long push to turn on the analyzer, push to turn on/off the LCD display, long push to turn off the analyzer. |
| 4 | Preset key: Resets the analyzer to a known state. This state can be specified in 【System】→ [PowerOn/Preset>] → [Preset>]. |
| 5 | Arrow keys. |
| 6 | Rotary knob. |
| 7 | Shift key: Press the Shift key to active it, the light is on. When the Shift key is active, pressing a number key will execute the upper function.Long press the Shift key to active it persistently. To switch to the brief active status, short press the Shift key. |
| 8 | Backspace key: Deletes the last character from input. |
| 9 | Enter key: Confirms a parameter selection or configuration. |
| 10 | Function / numeric keypad. |
4.5 Top Panel Overview
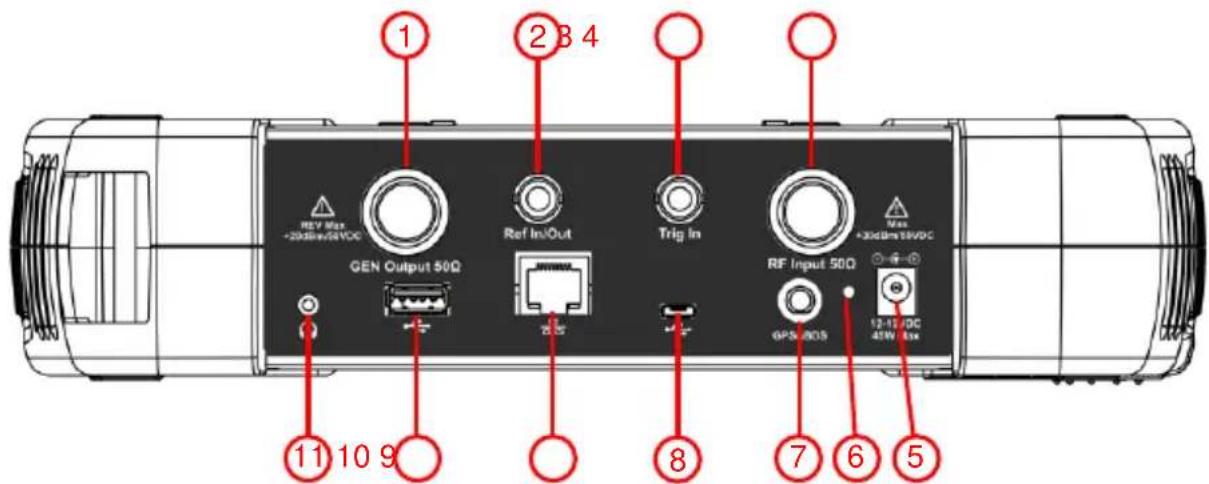
Figure 4-2 Top panel
| NO. | Name | Description |
| 1 | GEN Output connector (50 Ω) | N type female connector. The output for the built-in tracking generator. |
| 2 | 10MHz IN/OUT | BNC, female connector. The BNC input or output of the 10 MHz reference clock. |
| 3 | EXT Trig In connector | BNC, female connector. Connects to an external TTL signal. The TTL signal is used to trigger the analyzer's internal sweep. |
| 4 | RF Input connector (50 Ω) | N type female connector. Connector for RF input.⚠CAUTIONInput voltage at RF input port must not be higher than 50 V DC to avoid damage to the attenuator and input mixer tracking generator.When input attenuator is higher than 10 dB, the RF port input signal must be less than +30 dBm. |
| 5 | External power connector | Provides input for the DC power source via an AC-DC adapter. |
| 6 | LED indicator | Green light when external DC power is connected. Red light when the battery is charging. Blinking light when charge suspend or battery absent. |
| 7 | GPS/BDS antenna connector | SMA-female type. Connects an GPS/BDS Antenna to offer the GPS location for the field testing. Active antenna supported. |
| 8 | USB Device interface | MICRO-USB type. Connects to a PC. This USB interface supports PictBridge printer and remote-control connection. |
| 9 | LAN interface | Through this interface, the analyzer can be connected to your local network for remote control. |
| 10 | Mouse keyboard and other USB device interface | Type A. Connects to a USB memory stick. |
| 11 | Headphone jack | Insert the headset to listen to the sound after signal demodulation. |
4.6 Rear Panel Overview
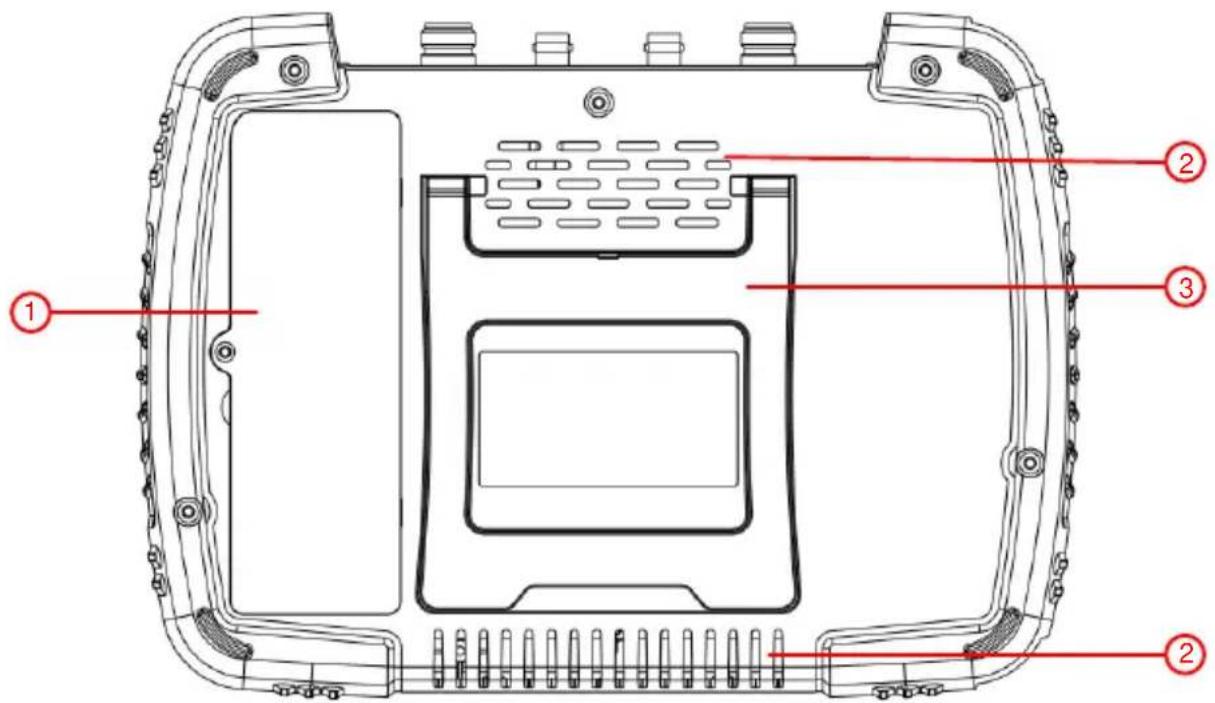
Figure 4-3 Rear panel
| NO. | Name |
| 1 | Battery compartment |
| 2 | Air vents |
| 3 | Tilt stand |
4.7 User Interface Overview
Figure below illustrates the user interface, with touch screen menu keys, top bar, and measurement settings and results around the graph area.
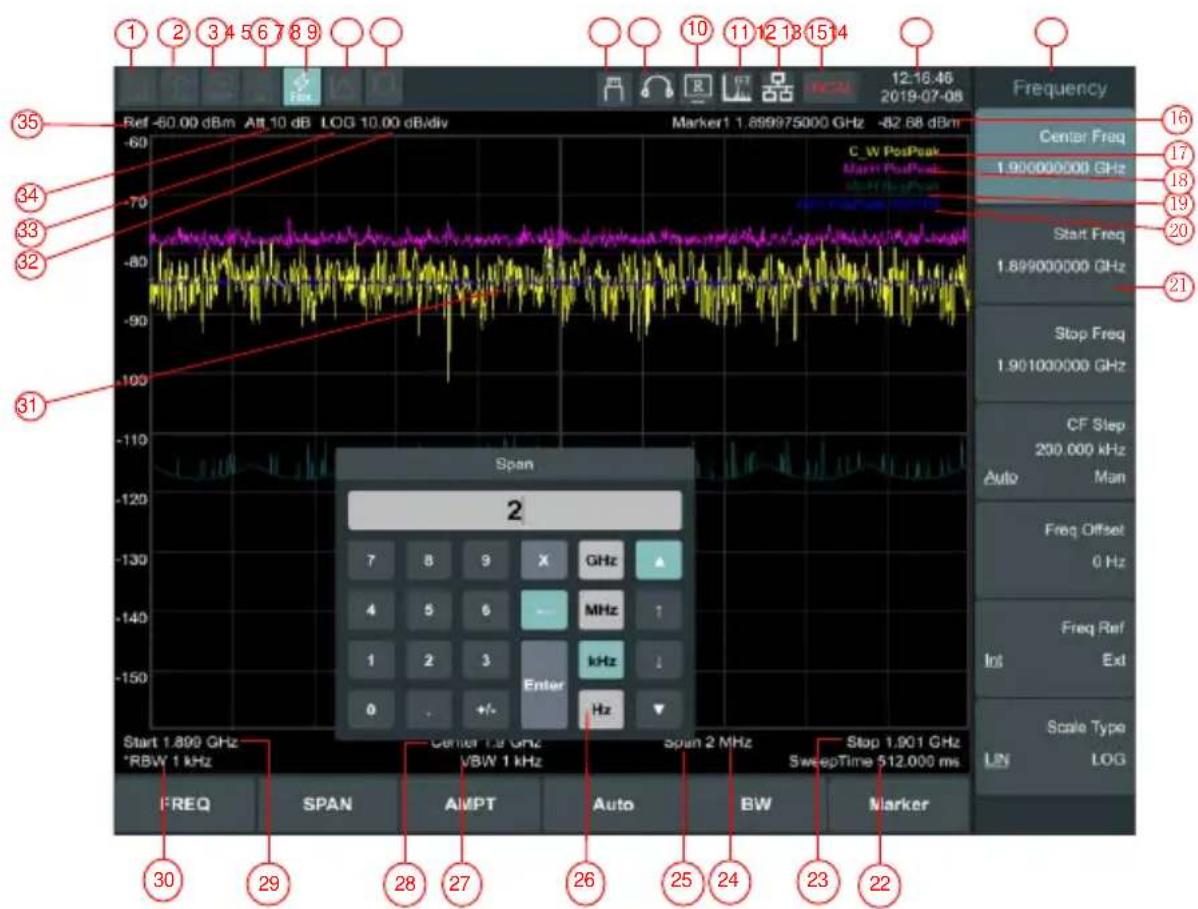
line
| Frequency | Value | | --------- | ----- | | 16 | 1.899000000 GHz | | 17 | 1.900000000 GHz | | 18 | 1.899000000 GHz | | 19 | 1.901000000 GHz | | 20 | 200.000 kHz | | 21 | 232.000 ms | | 2 | 512.000 ms | | 7 | 1.899000000 GHz | | 8 | 1.899000000 GHz | | 9 | 1.899000000 GHz | | X | 1.899000000 GHz | | 4 | 1.899000000 GHz | | 5 | 1.899000000 GHz | | 6 | 1.899000000 GHz | | MHz | 1.899000000 GHz | | 1 | 1.899000000 GHz | | 2 | 1.899000000 GHz | | 3 | 1.899000000 GHz | | kHz | 1.899000000 GHz | | Enter | 1.899000000 GHz | | Hz | 1.899000000 GHz | | Start | 1.89900000 GHz | | Start | 1.899001 kHz | | Start | 1.89915 kHz | | Start | 1.8992 MHz | | Start | 1.8992 MHz | | Start | 1.8992 MHz | | Start | 1.8992 MHz | | Start | 1.8992 MHz | | Start | 1.8992 MHz | | Start | 1.8992 MHz | | Start | 1.8992 MHz | | Start | 1.75 MHz | | Start | 1.75 MHz | | Start | 1.75 MHz | | Start | 1.75 MHz | | Start | 1.75 MHz | | Start | 1.75 MHz | | Start | 1.75 MHz | | Start | 1.75 MHz | | Start | 1.75 MHz | | Start | 1.75 Hz | | Start | 1.75 Hz | | Start | 1.75 Hz | | Start | 1.75 Hz | | Start | 1.75 Hz | | Start | 1.75 Hz | | Start | 1.75 Hz | | Start | 1.75 Hz | | Start | 1.75 Hz | | Start | 1.75 Hz |Figure 4-4 User interface
| NO. | Name | Description | Related Key |
| 1 | External reference | Set the reference frequency as Int (internal) or Ext (external) input. | FREQ → [Freq Ref] |
| 2 | Preamplifier | Turn on/off the preamplifier. | AMPTD→ [Preamplifier] |
| 3 | Sweep status | Set the sweep status to Single or Cont (continuous). | 【Sweep】→ [Sweep Single] or [Sweep Cont] |
| 4 | Source | Show the source type as CW (Continuous Wave) or TG (Tracking Generator), press to turn on/off the source output. | 【Source】→ [Output] and [Source GEN] |
| 5 | Trigger type | Set the trigger type to Auto, Video, Pos (external positive edge), Neg (external negative edge). | 【Trig】 |
| 6 | Continuous peak search | Open/close continuous peak search. | 【Marker】→[Peak>] |
| 7 | Automatic search | In automatic search mode. | 【Auto】 |
| 8 | USB sign | USB access mark. | |
| 9 | Audio demodulation | Open audio demodulation. | 【Mode】→[Modulation>] |
| 10 | Remote control | In remote control mode. | |
| 11 | FFT mode | When the resolution bandwidth is set to less than 3kHz, it is automatically transferred to FFT mode. | |
| 12 | LAN interface communication sign | LAN internet interface communication sign. | |
| 13 | UNCAL sign | Measurements not calibrated. | |
| 14 | Date/Time | Display system Date/Time, click to call the modify date screen. | 【System】→[Setting>]→[Date/Time>] |
| 15 | Menu title | The current menu belongs to the function, click to call out the shortcut menu. | |
| 16 | Marker value | Display current marker value and amplitude value(when zero sweep is time ).When marker function open,display respond marker value. | 【Marker】 |
| 17 | Trace 1 | Display current trace1 type is refresh,the detection is a positive peak. | |
| 18 | Trace 2 | Display current trace2 type is maximum hold ,the detection is a positive peak. | |
| 19 | Trace 3 | Display current trace3 type is minimum hold,the detection is negative peak. | |
| 20 | Trace 4 | Display current trace4 type is average,the detection is positive peak. | |
| 21 | Menu item | Current function menu item. | Menu item |
| 22 | Sweep time | System sweep time. | 【Sweep】→[Sweep Time] |
| 23 | Stop frequent | Display stop frequent. | FREQ→ [Stop Freq] |
| 24 | Mouse cursor | Displays when using an external mouse. | |
| 25 | Sweep | Display sweep value. | 【Sweep】→[Sweep] |
| 26 | Touch screen digital input keyboard | Click to modify the input parameter position to call. | |
| 27 | Video bandwidth | Display video bandwidth. | BW→ [VBW] |
| 28 | Center frequency | Display center frequency | FREQ→ [Center Freq] |
| 29 | Start frequency | Display start frequency. | FREQ→ [Start Freq] |
| 30 | Resolution bandwidth | Display resolution bandwidth. | BW→[RBW] |
| 31 | Frequent Marker | Display current activated marker, drag the marker to change the marker position. | Marker |
| 32 | Amplitude scale | Amplitude display scale setting ratio. | 【AMPTD】→[Scale/div] |
| 33 | Amplitude Scale Type | Amplitude Scale Type can choose Log (logarithmic) or Line (linear). | 【AMPTD】→[Scale Type] |
| 34 | Attenuation | Displays the RF input attenuator Settings as manual or automatic. | 【AMPTD】→[Attenuation] |
| 35 | Reference level | Reference level setting value. | 【AMPTD】→[Ref Unit] |
Note:
1\~7 can be switched with a touch screen or mouse click;
1\~20 can touch the screen or click the mouse to call to modify the current trace interface;
22、27、30、34 If * is displayed before the display, the item is in the manually set state;
21\~35 Click to call out the number input keyboard interface.
4.8 Function Keys
There are 6 function softkeys on the interface screen and 11 function hardkeys on the front panel.
4.8.1 Function Softkeys
There are 6 function softkeys horizontally arranged along the bottom of the interface screen. Press one of the function softkeys to show the submenu along the right side of the display.
| FREQ | SPAN | AMPT | Auto | BW | Marker |
Figure 4-5 Function softkeys
| Softkeys | Description | |
| FREQ | Activates the center-frequency function, and accesses the frequency function menu. | |
| Span | Activates the frequency sweep span function, and set Full Span\Zero Span\Last Span. | |
| AMPTD | Activates the reference level function, and accesses the amplitude softkeys, with which you set functions that affect data on the vertical axis. | |
| Auto | Searches the signal automatically within the full frequency range. | |
| BW | Activates the RBW (resolution bandwidth) function, and accesses the softkeys that control the bandwidth functions and averaging. | |
| Marker | [Marker] | Accesses the marker control keys that select the type and number of markers and turns them on and off. |
| [MarkerFctn] | Maker measure function menu, such as N dB bandwidth measure, marker noise, frequency counting and filed. | |
| [Marker→] | Accesses the marker function softkeys that allow you to set other system parameters based on the current marker value. | |
| [Peak] | Places a marker on the highest peak, and accesses the Peak functions menu. | |
4.8.2 Function Hardkeys
Pressing the ↑ Shift key and then press the number key and the function represented by the number key will be displayed in the menu on the right side of the screen interface.
Shift key:
- Press the Shift key to active it, the light is on.
- When the Shift key is active, pressing a number key will execute the upper function.
●Long press the Shift key to active it persistently.
●To switch to the brief active status, short press the Shift key.
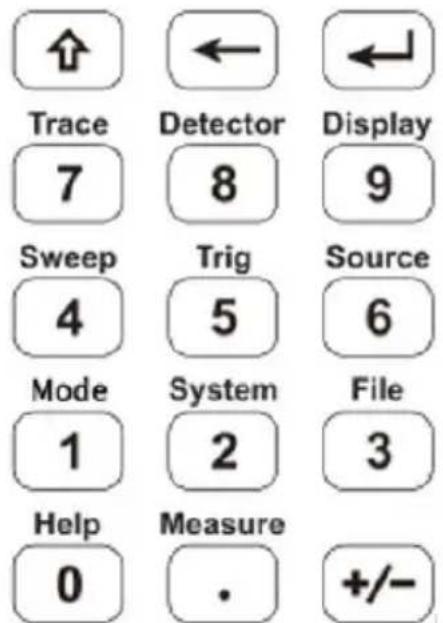
Figure 4-6 Shift key and function hardkeys
| Hardkeys | Description |
| 【Trace】 | The trace measurement and display mode can be set, and the related trace can be operated. |
| 【Detector】 | Set the detection mode. |
| 【Display】 | Set the parameters displayed on the screen. |
| 【Sweep】 | The system is set to single or continuous scanning mode. Users can also set the scanning mode and scanning time. |
| 【Trig】 | Set the triggering mode and related parameters of the sweep frequency. |
| 【Source】 | Trace source Settings. |
| 【Mode】 | Switch between scanning spectrum mode, demodulation mode and other modes. |
| 【System】 | System parameter setting and instrument calibration operation menu. |
| 【File】 | Browse, delete, export, load, power on, and reset stored files. |
| 【Help】 | On the spectrum analyzer help menu, click this key once to open the system help function, and then click again to disable the help function. |
| 【Measure】 | The expanded measurement functions based on the spectrometer platform include adjacent channel power measurement, channel power measurement, occupied bandwidth measurement, etc. For specific measurement function parameter Settings, refer to the measurement Settings menu. |
4.9 Parameter Input
The active parameter value can be entered using the numeric keypad, knob, and arrow keys.
4.9.1 Numeric keypad
Enters a specific value, the submenu typically shows the selectable units. Press the desired unit or press Enter key to complete the entry.
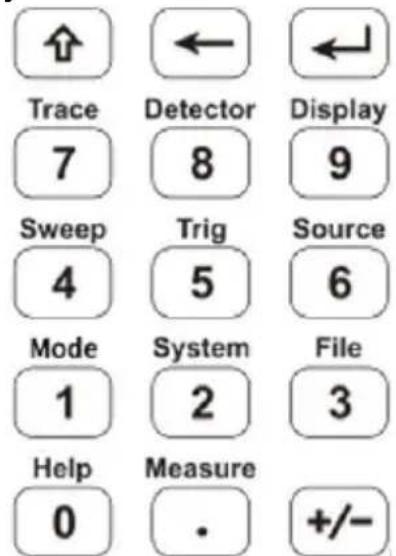
Figure 4-7 Numeric keypad
1. Number keys
Numbers 0-9 are available to be used.
- Decimal point
A decimal point "." will be inserted at the cursor position when this key is pressed.
- Sign key
Sign key "+/-" is to toggle the sign of a parameter. When pressed the first time, a "-" will be inserted and changed into "+" following the second press.
- Backspace key
(1) During the process of parameter editing, this key will delete the characters on the left side of the cursor.
(2) While in the process of file name editing, pressing this key will delete characters that have been entered.
- Enter key
When pressed, the system will complete the input process and insert a default measurement unit for the parameter automatically.
4.9.2 Rotary knob
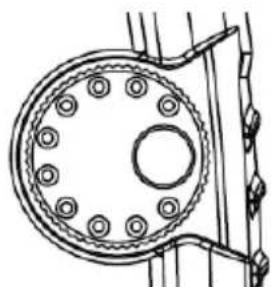
natural_image
Technical line drawing of a mechanical component with circular features and mounting brackets (no text or symbols)Figure 4-8 The rotary knob
The knob function:
During parameter editing, turn the knob clockwise to increase, or counterclockwise to decrease the parameter values at specified steps.
4.9.3 Arrow keys


Figure 4-9 Arrow keys
The arrow keys have following functions:
1) Increase or decrease the parameter value at specific steps
while editing a parameter.
Note: Press FREQ→[CF Step] to set the center frequency step.
2) Move the cursor though the directory tree in the 【File】 function.
4.10 Build-in Help
The built-in help provides information that refers to every function key and menu key on the front panel. Users can view this help information if required.
1.How to acquire built-in help
Press Shift key, then【Help】key; a prompt about how to obtain help information will be shown
2.Page up and down
If there is more than one page of information, you can read the complete information by using the arrow keys or dragging via touch screen.
3. Close the current help information
Press ↑ Shift key, then 【Help】key again to close help.
4. Acquire the softkey help
A message about how to obtain help information will be shown, press the softkeys to get the corresponding help.
5. Acquire the help information of any function hardkey
A message about how to obtain help information will be shown, press ↑ Shift key, then any function hardkey to get the corresponding help.
4.11 Touchscreen Controls
The LCD display is touchable and you can control the analyzer with different gestures.
The touch screen control is described below. You can also use the buttons/knobs in brackets to do the same thing.
- Click on the screen at the top of the tag can switch the corresponding state. See User Interface Overview for details on page 12.

- Select a menu softkey: Touch the menu softkeys in the bottom, or in the right.

- Switch menu items: If there are options that can be switched in the menu, you can repeatedly touch the area of the menu item to switch.
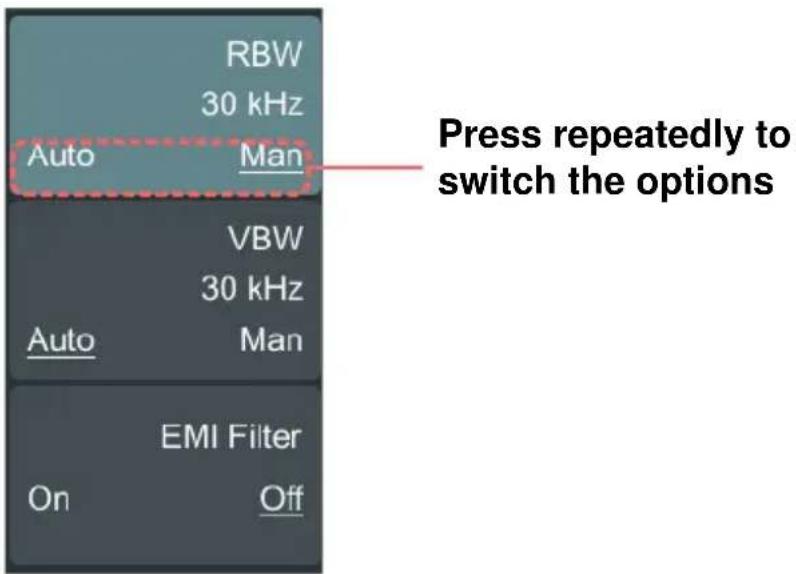
- Scroll the list: If there is a scroll bar in the file system window, you can swipe up and down to scroll the list.
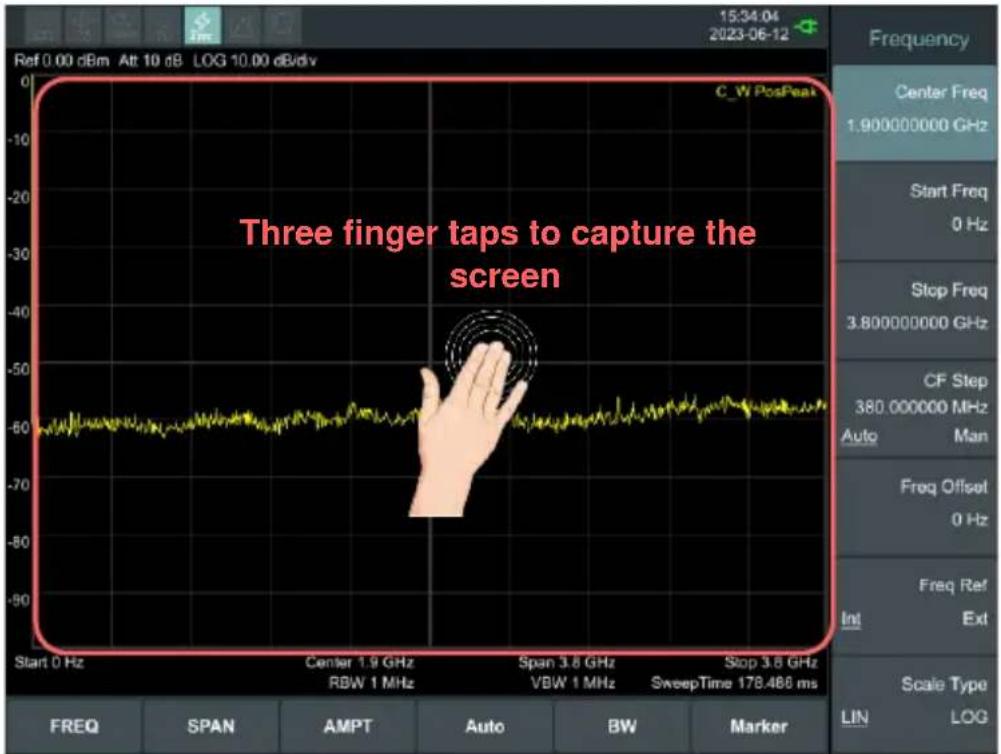
●Capture the screen (【System】→ [Save/Recall>] → [Screen Pixmap>]): Double-tap in the display area to quickly capture a PNG image of the current screen display. If a USB device is inserted, the image will be saved to USB device, otherwise the local memory. A file name is automatically created using the current date and time stamp.
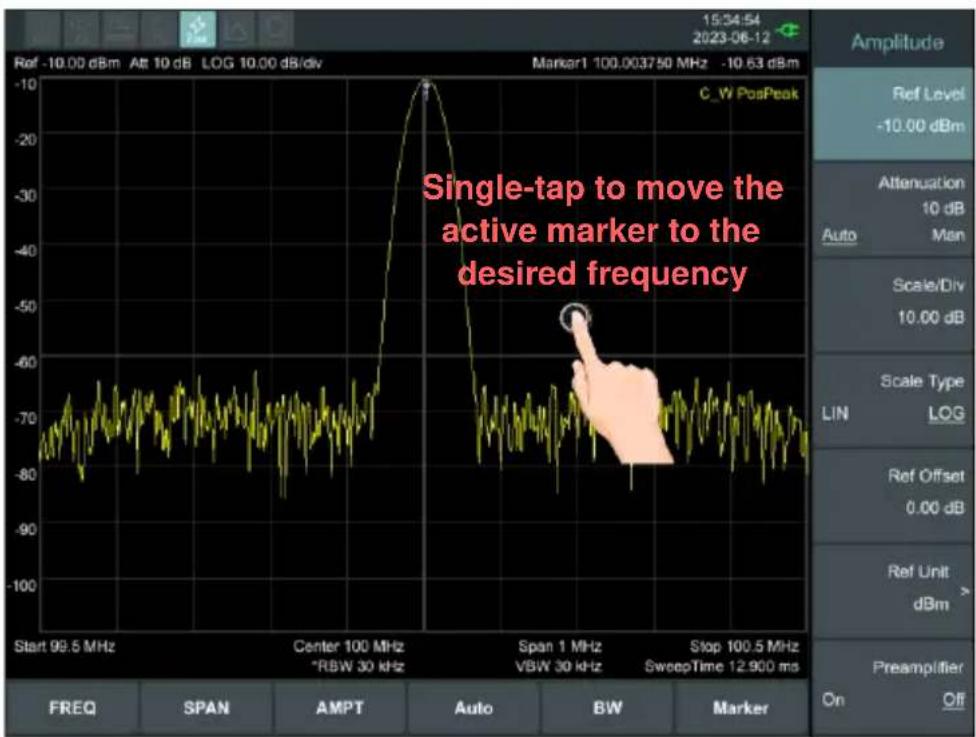
- Move the active marker to the desired frequency (Marker → [Marker >] → turn the knob): When a marker is active, hold down the marker and drag it to the desired position to release.
line
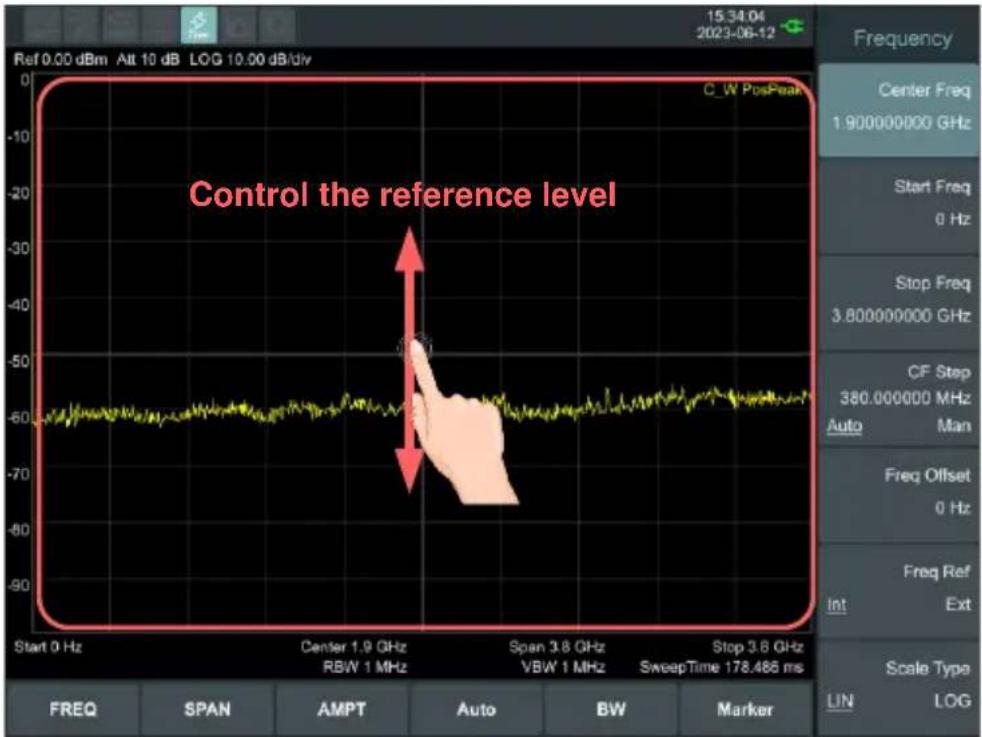
| Frequency | Amplitude | | --------------- | --------- | | Center 100 MHz | -10.63 dBm | | Span 1 MHz | -50.00 dBm | | Stop 100.5 MHz | -70.00 dBm |- Set the reference level (AMPTD → [Ref Level]): Swipe up or down in the display area.
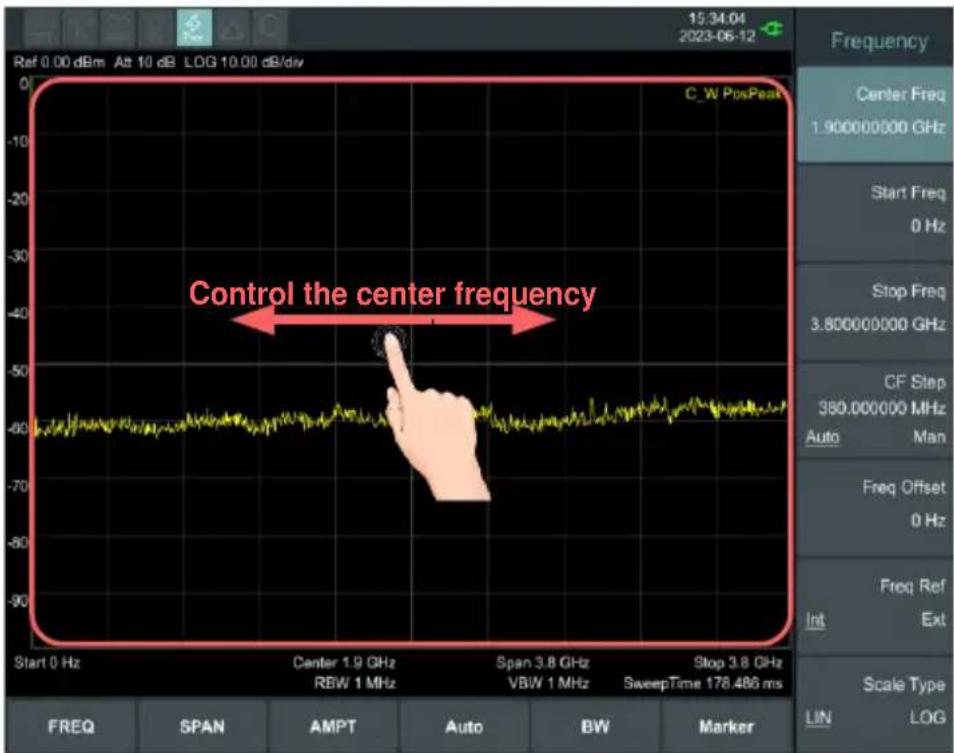
- Set the center or start frequency (FREQ→ [Center Freq] or [Start Freq]): Swipe left or right in the display area.
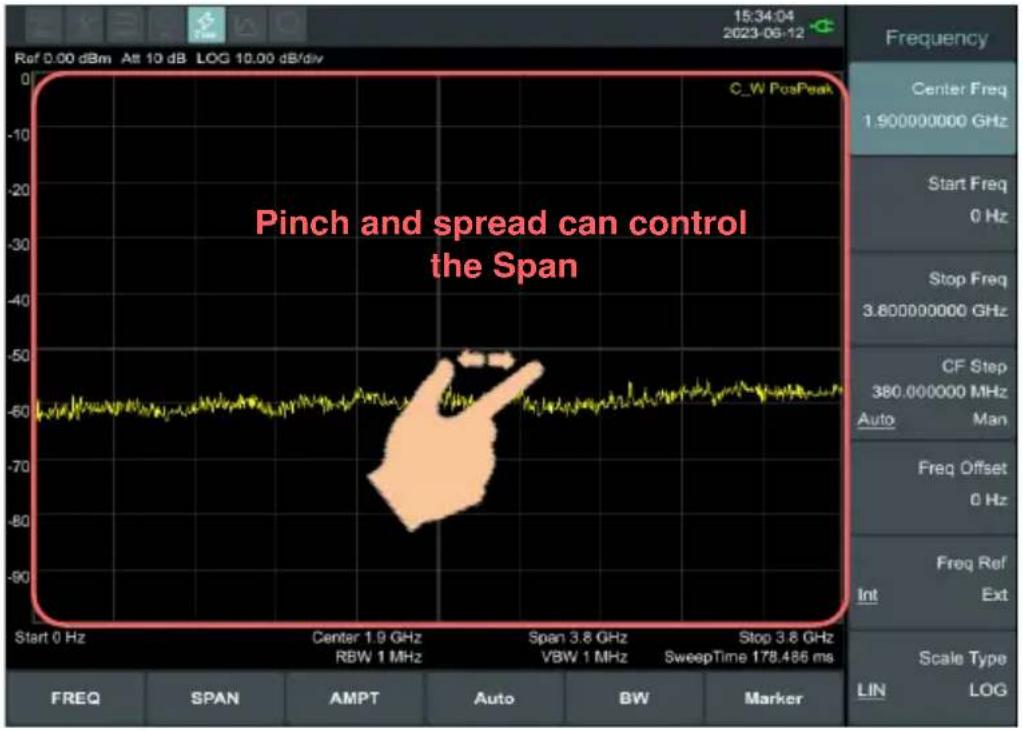
- Set the Span (Span→[Span]): In the trace display area, place two fingers horizontally on the touch screen and close or separate to reduce the increase of the sweep width and achieve the effect of horizontally enlarging or shrinking the trace.
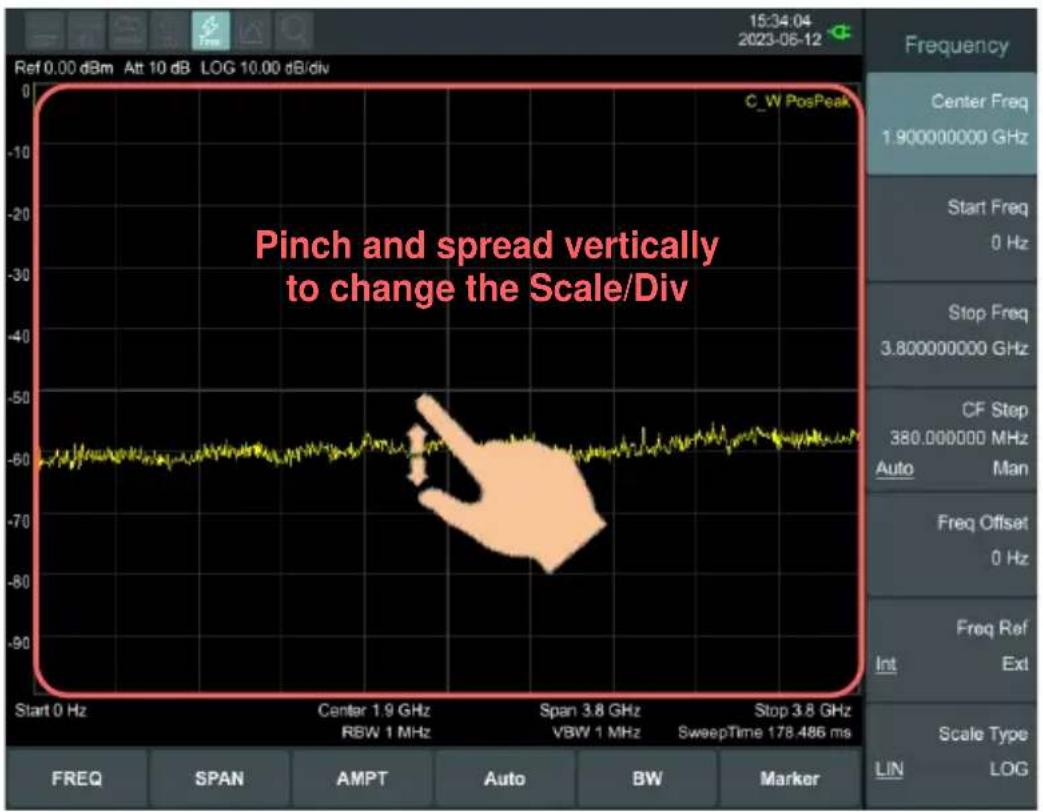
- Set the Scale/Div (AMPTD → [Scale/Div]): In the display area, pinch and spread vertically to change the Scale/Div.
4.12 External keyboard control
Plug the keyboard into the USB Host port (Type A) on the top panel. You can control and input through the keyboard. The keys
correspond to the following:
【F】 Frequency
【S】 Span
【A】 Amplitude
【R】 Auto Tune
【B】 Band Width
【D】 Detector
【W】 Sweep
【O】 Track Gen
【T】 Trace
【V】 Display
【I】 Trig
【M】 Mode
【Y】 System
【Q】 Quick Save
【P】 Peak
【K】 Marker
【X】 File
【L】 Save/Recall
【N】 Preset
【H】 Help
【J】 Measure
【F1\~F7】Menu button 1-7
【F9】GHz/dBm【F10】MHz/dB【F11】kHz/dBmV【F12】Hz/mv
【0\~9】 0\~9
【Backspace】<-
【Esc】X
【Enter】 enter
4.13 Basic Measurement
Basic measurements include, input signal frequency and amplitude display, marked by a frequency marker.
Follow these five simple steps below to implement input signal measurement.
a) Find the signal frequency at full sweep width;
b) Set the center frequency according to the signal frequency in step 1;
c) Setting span and resolution bandwidth;
d) Activate marker;
e) Adjust amplitude parameter.
For example, to measure a 100 MHz, -10 dBm signal, you must turn on the spectrum analyzer and ensure it is warmed up for 30 minutes to ensure measurement accuracy.
1. Equipment connection
Connect the output terminal of signal generator to the RF Input 50Ω connector on the top of the spectrum analyzer. Set the parameters as follows:
Frequency 100 MHz
Amplitude -10 dBm
2. Setting parameters
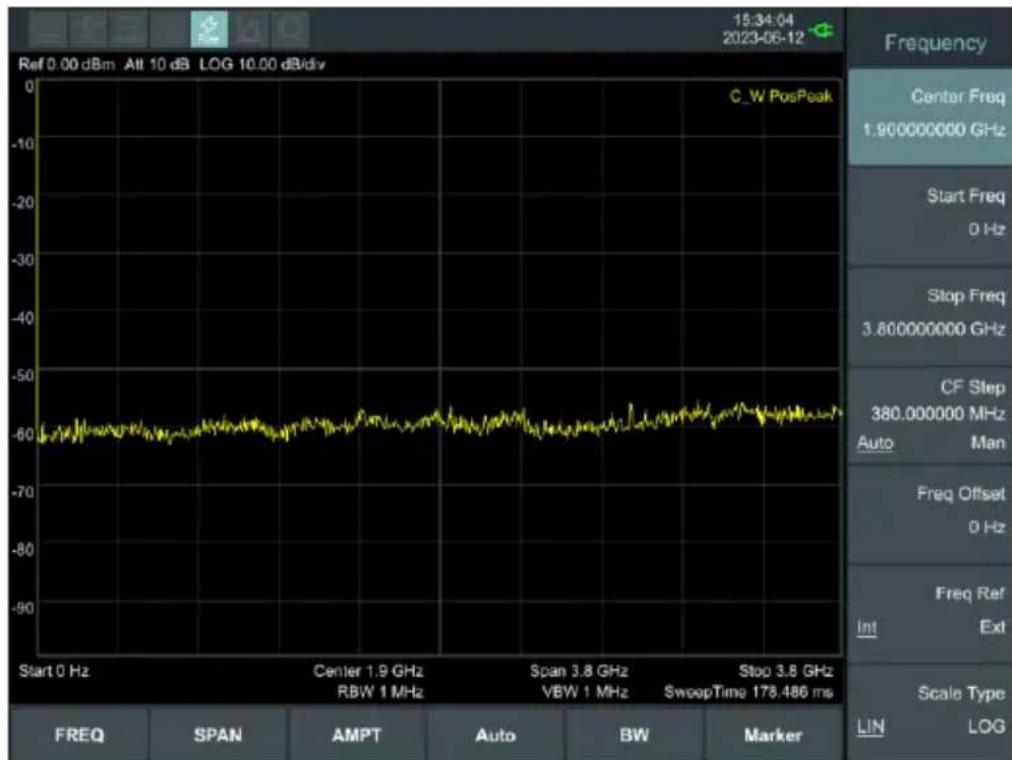
1) Press 【Preset】 on the front panel to restore the analyzer to its factory-defined state. The Spectrum analyzer will display the spectrum from 9kHz to the maximum span width. The signal generated will display as a vertical line at 100MHz. Refer to Figure 4-10.
line
| Frequency | Center Freq (GHz) | | --------- | ----------------- | | Start Freq | 0 Hz | | Stop Freq | 3.800000000 GHz | | CF Step | 380.000000 MHz | | Freq Offset | 0 Hz | | Freq Ref | Int | | Scale Type | LIN | | LOG | |Figure 4-10 Full Span
To clearly observe the signal, reduce the frequency span to 1 MHz and set the center frequency to 100MHz.
2) Setting center frequency
Press FREQ softkey on the bottom, select [Center Freq] on the right submenu. Input "100" and select the unit as MHz on the right softkeys. The number keys can be used to set the exact value, the knob and arrow keys can also be used to set the center frequency.
3) Setting frequency span
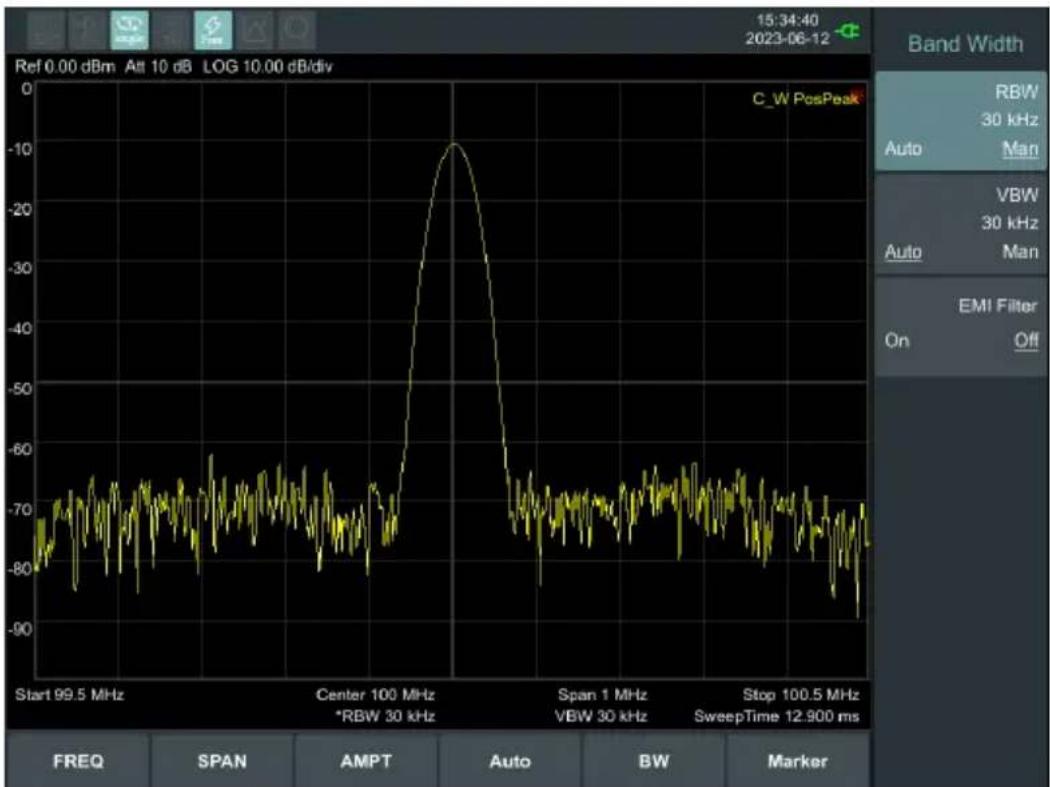
—Press 【Span】 softkey, input "1" and press MHz as its unit, or press button reduce to 1 MHz.
—Press BW softkey, set [RBW] to Man, and input "30" and press kHz as its unit, or press ↓ button reduce to 30kHz. —Press【Detector】key, set the detection type to Pos Peak.
Figure 4-11 shows the signal at a higher resolution.
Please note that resolution bandwidth, video bandwidth and frequency span are self-adapted. They adjust to certain values according to frequency span. Sweep time can be self-adapted too.
line
| Frequency | Value | | --------- | ----- | | Center | -10 | | Span | -70 | | Stop | -80 |Figure 4-11 Set frequency span
4) Activate marker
—Press Marker softkey on the bottom, the button is located at the bottom of the screen. Then select [Marker >] softkey on the right screen. And press the softkey to select [Marker_1 2 3 4 5 6 7 8], select Marker 1, the marker is located at horizontal center by default, that is the signal peak point or its neighbor.
—Press Marker softkey on the bottom, the button is located at the bottom of the screen. Then select [Peak >] on the right screen. And select [Max Search]. Frequency and amplitude values are read by the marker and shown on the top right of the display area.
5) Setting amplitude
The reference level will be shown at the top of the display grid. To get a better dynamic range, the real signal peak point should be located at or near the top of display grid (reference level). The reference level is also the maximum value on Y axis. Here the dynamic range is increased by reducing the reference level.
Press AMPTD softkey on the bottom, the button is located at the bottom of the screen, and press the [Ref Level] softkey on the right screen. The reference level can be input at the top left of the display grid. Input "-10" using the numeric keypad and set
the unit to dBm. Also can use step button ↓ or knob to adjust.
The reference level is set at -10 dBm, which is the signal peak value near the top of the grid. The balance between the signal peak value and noise is dynamic range.
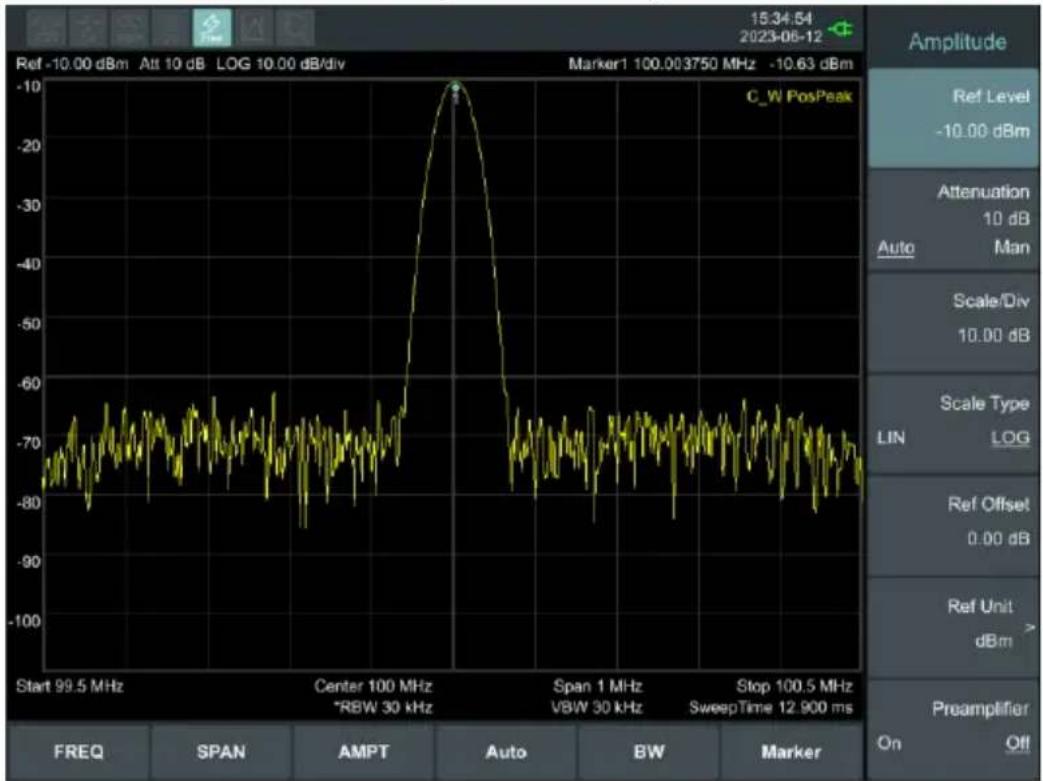
line
| Frequency | Amplitude (dBm) | | --------------- | --------------- | | Center 100 MHz | -10 | | Span 1 MHz | -70 | | Stop 100.5 MHz | -80 |Figure 4-12 Set reference level
5. Menu Interpretation
This chapter provides you with the information on the function softkeys and hardkeys of the spectrum analyzer.
Key access: [FREQ] softkey at the bottom of the screen
The frequency range of a channel can be expressed by either of two groups of parameters: Start Frequency and Stop Frequency; or Center Frequency and Span. If any such parameter is changed, the others would be adjusted automatically in order to ensure the coupling relationship among them.
$$ f _ {\text { center }} = \left(f _ {\text { stop }} + f _ {\text { start }}\right) / 2 \tag {5-1} $$
$$ f _ {s p a n} = f _ {s t o p} - f _ {s t a r t} \tag {5-2} $$
f_center, f_stop, f_start and f_span denotes the center frequency, the stop frequency, the start frequency and the span respectively.
5.1.1 [Center Freq]
Sets the center frequency of the sweep. When pressed, the frequency mode is switched to Center Freq and Span in order to enter the desired parameter data.
Key Points:
- The start and stop frequencies vary with the center frequency when the span is constant.
- Changing the center frequency horizontally shifts the current sweep channel and the adjustment is limited by the specified frequency range.
- In Zero Span mode, the start frequency, stop frequency and center frequency are always equal. If one is changed the others are updated to match.
- You can modify this parameter using the numeric keys, knob, or direction keys.
5.1.2 [Start Freq]
Sets the start frequency of the sweep. When pressed, the frequency mode is switched to Start Freq and Stop Freq in order to
enter the desired parameter data.
Key Points:
- The span and center frequency are changed automatically according to the start frequency. The change of the span would have influence on other system parameters. For more details, please refer to "Span".
- In Zero Span mode, the start frequency, stop frequency and center frequency are always equal. If one is changed the others are updated to match.
- You can modify this parameter using the numeric keys, knob, or direction keys.
- If start freq is larger than stop freq when setting, then stop freq will increase automatically to the same value of start freq.
5.1.3 [Stop Freq]
Sets the stop frequency of the sweep. When pressed, the frequency mode is switched to Start Freq and Stop Freq in order to enter the desired parameter data.
Key Points:
- Modifying the stop frequency changes the span and center frequency, and the change of span influences other system parameters, see "Span".
- You can modify this parameter using the numeric keys, knob, or direction keys.
- If stop freq is larger than start freq when setting, then start freq will decrease automatically to the same value of stop freq.
5.1.4 [CF Step Auto Manual]
Sets the step of center frequency. Changing the center frequency in a fixed step continuously switches the channel to be measured.
Key Points:
- The frequency step type could be "Manual" or "Auto". In Auto mode, the CF step is 1/10 of span if it is in Non-zero span mode or if the sweep width is zero, the step automatically defaults to 1Hz; in Manual mode, you can set the step using the numeric, step keys or knob. Then activate 【Center Frequency】, press step, center frequency will change as setting step.
● After you set an appropriate frequency step and select center frequency, you can use using up and down direction keys to
switch between measurement channels in a specified step in order to sweep the adjacent channels manually.
- You can modify this parameter using the numeric keys, knob, or direction keys.
Frequency step lends itself to detect the harmonic waves and bandwidths that are beyond the current span.
For example, for order of harmonic of a 300 MHz signal, you can use set both the center frequency and frequency step to 300 MHz, and press the up direction key continuously to increase the center frequency to 600MHz, that is secondary harmonic. Press frequency steps to increase center frequency by 300MHz, which reaches 900MHz. [Frequency Step Auto Manual] shows the auto or manual mode to setting the steps. When step is under manual mode, press [Frequency Step Auto Manual] to return to auto mode.
5.1.5 [Freq Offset]
You can set a frequency offset to displayed frequency value, including freq marker value. This movement won't influence sweep frequency range.
While this function activated (frequency offset isn't 0Hz), you can modify this parameter using the numeric keys, knob or direction keys.
5.1.6 [Freq Ref Int Ext]
Set the reference frequency as internal or external input, this is regarded as whole device reference.
5.1.7 [Scale Type Lin LOG]
Setting the scale type can switch the frequency axis to linear or logarithmic, the default is linear.
Key access: [Span] softkey at the bottom of the screen
Set the spectrum analyzer to span mode. When press 【Span】 softkey, [Span], [Full Span], [Zero Span] and [Last Span] submenu
will be available along the right side of the display. You can modify span using the numeric keys, knob or direction keys. Use numeric key or [Zero Span] to clear span.
5.2.1 [Span]
Sets the frequency range of the sweep. When pressed, the frequency mode is switched to Center Freq/Span.
Key points:
- The start and stop frequencies are changed with the span automatically.
- In manual span mode, the span can be set down to 0 Hz, that is zero span mode. And up to the full span described in "Specification". When it is set to the maximum span, it enters full span mode.
- Modifying the span in non-zero span mode may cause an automatic change in both CF step and RBW if they were in Auto mode, and the change of RBW may influence VBW (in Auto VBW mode).
- In non-zero span mode, variation in the span, RBW or VBW would cause a change in sweep time.
- You can modify this parameter using the numeric keys, knob, or direction keys.
5.2.2 [Full Span]
Sets the spectrum analyzer to center frequency/sweep mode, and span of the analyzer to the maximum.
5.2.3 [Zero Span]
Sets the span of the analyzer to 0 Hz. Both the start and stop frequencies will equal the center frequency and the horizontal axis will denote time. The analyzer here is measuring the time domain characteristics of amplitude, located at the corresponding frequency point. This will help to observe the signal (especially for modulated signal) at time domain.
5.2.4 [Last Span]
Changes the span to the previous span setting.
Key access: [AMPTD] softkey at the bottom of the screen
Sets the amplitude parameters of the analyzer. Through these parameters, signals under measurement can be displayed at an optimal view with minimum error. The amplitude submenu includes [Ref Level], [Attenuation Auto Manual], [Scale/Div], [Scale Type Lin Log], [Ref Offset], [Ref Unit], and [Preamp On Off].
5.3.1 [Ref Level]
Activate reference level function and sets the maximum power or voltage for display window.
Key points:
- This value is affected by a combination of maximum mixing level, input attenuation, and preamplifier. When you adjust it, the input attenuation is adjusted under a constant max mixing level, meeting:
$$ L _ {R e f} - a _ {R F} + a _ {P A} \leq L _ {m i x} \tag {5-3} $$
L_Ref , a_RF , a_PA and L_mix denotes the reference level, the input attenuation, the preamplifier, and the max mixing level, respectively.
- You can modify this parameter using the numeric keys, knob, or direction keys.
Reference level located at the top of axis grid. Measurement near the reference level would gain better accuracy, but input signal amplitude should not exceed the reference level; if it exceeds, the signal will be compressed and distorted, result in wrong measurement. Analyzer's input attenuation is related with reference level, it can self-adjust to avoid signal compression. Minimum reference level is -80dBm at Log scale under 0dB attenuation.
5.3.2 [Attenuation Auto Man]
Sets the front attenuator of the RF input in order to permit big signals
(or small signals) to pass from the mixer with low distortion (or low noise). It only works under internal mixer mode to adjust input attenuator insider analyzer. In Auto mode, input attenuator is related with reference level.
Key points:
- When the preamplifier is On, the input attenuation could be set up to 40 dB. You can adjust the reference level to ensure that the specified parameters meet the requirement.
- Modifying the reference level may cause an automatic change in attenuation value; But the change of attenuation value won't influence reference level.
- You can modify this parameter using the numeric keys, knob, or direction keys.
Attenuator adjustment is to make the maximum signal amplitude pass from mixer less than or equal to -10dBm. E.g. if the reference level is +12dBm, the attenuator value is 22dB, then the input level in mixer is -18dBm (12-22-8=-18), its mainly purpose is to avoid signal compression. Switch [Input Atten Auto Manual] to manual mode, adjust the attenuator manually. The highlight under auto or manual stands for auto coupling and manual coupling. When attenuator is under manual mode, press [Input Atten Auto Manual] will match the attenuator and reference level again.
Note: Maximum input signal amplitude of input attenuator (10dB input attenuation at least) is +30dBm, higher power signal will damage input attenuator or mixer.
5.3.3 [Scale/Div]
Sets the logarithmic units per vertical grid division on the display. Select 1,2,4 or 10dB log amplitude scale. It's 10dB/div by default. Every activated marker is with dBm as unit, difference between two markers is treated as marker difference under dB unit.
Key points:
- By changing the scale, the displayed amplitude range is adjusted.
● The amplitude that can be displayed is from reference level minus 10 times the current scale value to the reference level.
- You can modify this parameter using the numeric keys, knob, or direction keys.
5.3.4 [Scale Type Lin Log]
Sets the Scale Type of Y-axis to Lin or Log, the default is Log. It only works under internal mixer mode. In general, select mV as Lin amplitude scale unit. Of course there would be other units for select.
Key points:
- In Log scale type: The Y-axis denotes the logarithmic coordinates, the value shown at top of the grid is the reference level, and the grid size is equal to the scale value. The unit of Y-axis will be automatically switched into the default "dBm" when the scale type is changed from Lin to Log.
- In Lin scale type: The Y-axis denotes the linear coordinates, the value shown at the top of the grid is the reference level and the bottom of the grid shows 0 V. The grid size is 10% of the Reference level and the Scale/Div is invalid. The unit of Y-axis will be automatically switched into the default "mV" when the scale type is changed from Log to Lin.
- Other than as mentioned above, the unit of Y-axis is independent of the Scale Type.
5.3.5 [Ref Offset]
Assigns an offset to the reference level to attempt to compensate for gains or losses generated between the device under measurement and the analyzer.
Key points:
- The changing of this value changes both the readout of the reference level and the amplitude readout of the marker, but will not impact the position of the curve on the screen.
- You can modify this parameter using the numeric keys.
- This offset use dB as absolute unit, will not change with selected scale and unit.
5.3.6 [Ref Unit>]
Sets the unit of the Y-axis to [dBm], [dBμW], [dBpW], [dBmV], [dBμV], [W] or [V].
Key points:
1) [dBm]
Choose decibel equals to 1mW as amplitude unit.
2) [dB W]
Choose decibel equals to 1 W as amplitude unit.
3) [dBpW]
Choose decibel equals to 1pW as amplitude unit.
4) [dBmV]
Choose decibel equals to 1mV as amplitude unit.
5) [dBμV]
Choose decibel equals to 1 W as amplitude unit.
6) [W]
Choose Watts as amplitude unit.
7) [V]
Choose Voltage as amplitude unit.
5.3.7 [Preamplifier On Off]
Sets the status of preamplifier located at the front of the RF signal path. Turning on the preamplifier reduces the displayed average noise level in order to distinguish small signals from the noise when working with small signals.
Key access: [Auto] softkey at the bottom of the screen
Searches for signals automatically throughout the full frequency range, adjusts the frequency and amplitude to their optimum and realizes one-key signal search and auto setting of parameters.
Key points: some parameters such as reference level, scale, and input attenuation may be changed during the auto tune.
Key access: [BW] softkey at the bottom of the screen
Sets the RBW (Resolution Bandwidth) and VBW (Video Bandwidth) parameters of the analyzer. The setting menu includes [RBW Auto Man], [VBW Auto Man], [EMI On Off].
5.5.1 [RBW Auto Man]
Adjust the resolution bandwidth ranging from 1Hz to 1MHz. Use
numeric key, step key or knob to switch resolution bandwidth. The underline under Auto or Manual means Auto mode or Manual mode. Press [RBW Auto Manual] to have Auto underlined. Then the resolution bandwidth is under auto coupling mode.
Key points:
- Reducing the value of RBW will increase the frequency resolution, but may also cause sweeps to take longer (Sweep Time is affected by a combination of RBW and VBW when it is in Auto mode).
- RBW decreases with the span (non-zero span) in Auto RBW mode.
5.5.2 [VBW Auto Man]
Sets the desired video bandwidth in order to remove the band noise. Set the video resolution displays in function area, ranging from 10Hz to 30MHz by sequence step. You can modify this parameter by numeric key, step key or knob. The underline under Auto or Manual means Auto mode or Manual mode. Press [VBW Auto Manual] to have Auto underlined to return auto mode.
Key points:
- Reducing the VBW to smooth the spectrum line and differentiate small signals from the noise. However, this may cause a longer sweep time. (Sweep Time is affected by a combination of RBW and VBW when it is in Auto mode).
- VBW varies with RBW when it is set to Auto.
5.5.3 [EMI On Off]
Pop out the menu for EMI measurement bandwidth.
Key access: [Marker] softkey at the bottom of the screen
Markers are diamond-shaped characters that identify points of traces. The submenu on the right of the screen includes
【Marker>】,【MarkerFctn>】,【Marker→>】,【Peak>】.
5.6.1【Marker>】 right softkey
Key access:
[Marker] bottom softkey → [Marker >] right softkey
We can easily readout the parameters of the marked point on the trace, such as the amplitude, frequency and sweep time.
Key points:
- The analyzer allows for up to 8 pairs of markers to be displayed simultaneously, but only one pair or one single marker can be active at a time. You can use the numeric keys, knob or direction keys to enter the desired frequency or time when any marker type menu is active, so as to view the readouts of different points on the trace.
5.6.1.1 [Marker 1 2 3 4 5 6 7 8]
Selects one marker, the default is Marker1, and place the marker at the center of the trace. If a delta marker is activated, this softkey changes to the menu under the [Delta] function.
If there is already a marker, this command will not produce any operation. If there are already two markers (e.g. in [Delta] mode), [Marker] changes the active marker to a new single marker.
Frequency and amplitude information can be obtained from the marker (time and amplitude information when the span is set as Zero Span), and these values are displayed in the active function area and in the upper right corner of the screen. You can use the knob, touch screen, or the numeric keys to move the active marker.
The marker reads data from the current active track (this track may be track A or track B). If both tracks are active or both tracks are in static display mode, the marker will read data from track A.
Touchscreen Control: When a marker is active, single-tap in the display area (at any level) to quickly move the marker to the desired frequency.
![Owon HSA1016 - [Marker 1 2 3 4 5 6 7 8] - 1](/content/2026/05/902507/images/ebbe19728f18ddce14cf3a83064c694c6c09c685417f662f783198bb793865a6.jpg)
line
| Frequency | Amplitude | | --------------- | --------- | | Start 99.5 MHz | -10.00 dBm | | Center 100 MHz | -10.63 dBm | | Span 1 MHz | -10.00 dBm | | Stop 100.5 MHz | -10.00 dBm |5.6.1.2 [Trace 1 2 3 4 5]
In the trace measurement, the marker used to activate the traces.
5.6.1.3 [Normal]
One of the marker types, which is used to measure the values of X (Frequency or Time) or Y (Amplitude) at certain point of the trace. When selected, a marker will appear with its marker number such as "1" on the trace.
Key points:
- If no active marker exists currently, a sing frequency marker will be activated automatically at the center frequency of current trace.
- You can use the knob or numeric keys to move the marker. The readouts of the marker will be displayed on the upper right of the screen.
- The readout resolution of the X-axis corresponds to the span and sweep points. For higher resolution, add sweep points or reduce the span.
5.6.1.4 [Delta]
One of the marker types, which is used to measure the delta values of X (Frequency or Time) and Y (Amplitude) between the
Reference point and certain point on the trace. When selected, a pair of markers appears on the trace, which are the Reference Marker and the Delta Marker.
Key points:
- If a single marker already exists, the reference marker will be activated at the position of current marker.
If no marker is active at the present, the reference marker and delta marker will appear at the center frequency location. - The location of the Reference Marker is fixed (both in the X-axis and the Y-axis), while the Delta Marker is active. You can use the knob, touch screen, or the numeric keys to move the delta marker.
- The frequency (or time) and amplitude differences between the two markers will show in the active area and in the upper right corner of the display. The displayed amplitude difference is expressed in dB, or is the linear unit in terms of the corresponding scale.
- If [Delta] has been activated, press [Delta] again to move the reference marker to the active delta marker position.
- Two ways to enable a certain point as a reference marker:
a) Open a Normal marker and locate it onto a point and then switch the marker type into "Delta", creating a new reference, then you can modify the location of the delta marker to achieve the delta measurement.
b) Open a Delta Marker and place the delta marker onto a point, then press [Delta] again to locate the reference marker to this point, then you can modify the location of the delta point to achieve the delta measurement.
5.6.1.5 [Off]
Turn off the selected markers.
5.6.1.6 [All Off]
Turns off all the opened markers and the related functions. The marker won't show again.
5.6.1.7 [Marker Table On Off]
Turns on or off the display of the marker table.
5.6.2【MarkerFctn >】right softkey
Key access:
[Marker] bottom softkey → [MarkerFctn >] right softkey
Accesses the marker function setting menu.
5.6.2.1 [Function Off]
Turn off marker measurement function.
5.6.2.2 [NdB On Off]
Enables the N dB bandwidth measurement or sets the value of N. The N dB bandwidth denotes the frequency difference between points that are located on both sides of the current marker while the amplitude falls off (N<0) or rises (N>0) N dB separately,
Key points:
- When the measurement starts, the analyzer will search the two points which are located at both sides of the current point and are N dB amplitudes smaller or greater than the current point, and display the frequency difference between the two points.
- You can use the numeric keys, knob or direction keys to modify the value of N, 3 dB at default.
5.6.2.3 [Marker Noise On Off]
Turn on or off the marker noise function. The function of marker noise is applied to the selected marker, and reads the noise Power Spectral Density at the marked point. When turned on, the average noise level at the marked point is normalized to 1 Hz bandwidth for noise power.
5.6.2.4 [Freq Count >]
Activate the frequency counter function and display the count results in the upper right corner of the screen. The counter counts only the signals that are displayed on the screen.
1) [Freq Count On Off]
Turn on or off the frequency counter function. This function is invalid when the tracking generator is activated. The count value is displayed in the upper right corner of the screen.
2) [BW]
Sets the frequency counter resolution. The allowed values are 1 Hz, 10 Hz, 100 Hz and 1 kHz. Changing the counter resolution can change the counter accuracy. The higher the resolution, the higher the counting accuracy.
5.6.2.5 [FIELD>]
After the antenna is connected, it is used to measure the field strength of the air signal.
1) [FIELD On Off]
Open or close Filed measurement.
2) [Antenna Gain On Off]
Open or close Antenna Gain.
3) [UNIT]
Set filed measurement amplitude unit V ,dbuV, V/m, dbuV/m.
When Filed measurement is closed, unit V ,dbuV;
When Filed measurement is opening, unit V/m, dbuV/m.
4)[Antenna Set]
Enter Antenna Set submenu.
- Recall >
Recall antenna source, antenna 1 to antenna 6.
●New
Click to add new antenna factor.
- Delete
Click to delete antenna factor.
●Frequency
Set antenna factor frequency range.
●Factor
Set antenna factor parameters.
- Save
Save the set antenna factor parameters.
5.6.3【Marker→>】
Key access:
[Marker] bottom softkey, and then [Marker→>] right softkey
Use the current marker readings to set the parameters (such as Center frequency, Reference level).
5.6.3.1 [Mkr→CF]
Sets the center frequency of the analyzer to the frequency of the current marker. This feature quickly moves the signal to the center of the screen.
- In Normal marker mode, the center frequency will be set to the frequency of the current marker.
- In Delta marker mode, the center frequency will be set to the frequency at which the Delta Marker is located.
● The function is not available in zero span mode.
5.6.3.2 [Mkr→CF Step]
Sets the center frequency step of the analyzer to the frequency of the current marker.
- In Normal marker mode, the center frequency step will be set to the frequency of current marker.
- In Delta marker mode, the center frequency step will be set to the frequency at which the Delta Marker is located.
● The function is not available in zero span mode.
5.6.3.3 [Mkr→Start]
Sets the start frequency of the analyzer to the frequency of the current marker.
- In Normal marker mode, the start frequency will be set to the frequency of the current marker.
- In Delta marker mode, the start frequency will be set to the frequency at which the Delta Marker is located.
● The function is not available in zero span mode.
5.6.3.4 [Mkr→Stop]
Sets the stop frequency of the analyzer to the frequency of the current marker.
- In Normal marker mode, the stop frequency will be set to the frequency of the current marker.
- In Delta marker mode, the stop frequency will be set to the
frequency at which the Delta Marker is located.
●The function is not available in zero span mode.
5.6.3.5 [Mkr→Ref Level]
Sets the reference level of the analyzer to the amplitude of the current marker.
- In Normal marker mode, the reference level will be set to the amplitude of the current marker.
- In Delta marker mode, the reference level will be set to the amplitude at which the Delta Marker is located.
5.6.3.6 [Mkr Span]
Sets the span of the analyzer to the frequency difference between the two markers in Delta marker mode.
5.6.3.7 [Mkr CF]
Sets the center frequency of the analyzer to the frequency difference between the two markers in Delta marker mode.
5.6.4【Peak>】
Key access:
[Marker] bottom softkey → [Peak >] right softkey
Accesses the Peak setting menu.
Key Points:
The spurious signal at the zero frequency caused by LO feed through is ignored.
5.6.4.1 [Max Peak]
Place a frequency marker at the highest point of the trace, and display the frequency and amplitude of the marker in the upper right corner of the screen.
5.6.4.2 [Peak-Peak]
Peak search and minimum search are performed at the same time, and marked with "difference pair" frequency label, wherein peak search results are marked with difference frequency label and minimum search results are marked with reference frequency
label..
5.6.4.3 [Next Peak]
Searches the peak whose amplitude is the closest to that of the current peak. The peak is then identified with a marker. When this key is pressed repeatedly, you can quickly find a lower peak.
5.6.4.4 [Left Peak]
Searches the nearest peak located to the left of the current marker. The peak is then identified with a marker.
5.6.4.5 [Right Peak]
Searches the nearest peak located to the right of the current marker. The peak is then identified with a marker.
5.6.4.6 [Cont Peak On Off]
Enables or disables the Cont Max search, the default is Off. When enabled, the system will always execute a peak search automatically.
5.6.4.7 [Peak Setup >]
Used to move the peak point to the Peak setup screen.
- [Peak Excursion]
Set peak altitude.
● [Peak Mode Max Min]
Set peak mode is max or min.
- [Sort Freq Ampt]
Set the peak list to be sorted by frequency or amplitude.
● [Peak List On Off]
Enable or disable the peak value list. When the peak list is opened, the trace will display all the frequency markers that meet the peak conditions in order, and below the trace color list of all the frequency markers that meet the peak conditions.
- [Return]
Return to the upper-level menu.
5.7 【Trace】 hardkey
Key access:
Press ↑ Shift key, then Trace hardkey (7 in numeric keypad).
As the sweep signal is displayed as a trace on the screen, you can set parameters about the trace using this key. The analyzer allows for up to five traces to be displayed at one time. Press this key to access the menu for trace. It includes [Trace 1 2 3 4 5], [Clear Write], [Max Hold], [Min Hold], [Blank], [View], [Operations >], [1 ↔ 2], [2-DL → 2], [2 ↔ 3], [1 → 3] and [2 → 3].
5.7.1 [Trace 1 2 3 4 5]
Select trace, the analyzer offers 1,2,3,4,5 trace. The selected trace number in the menu will be underlined.
5.7.2 [State Blank >]
Set the status of the spectrum trace type.
1) [Clear&Write]
Refresh the current spectrum curve to display the latest spectrum trace.
2) [Max Hold]
Maintains the maximum for each point of the trace, and updates each trace point if a new maximum level is detected in successive sweeps.
3) [Min Hold]
Maintains the minimum for each point of the trace, and updates each trace point if a new minimum level is detected in successive sweeps.
4) [Average]
Average the current trace. Each point of the trace shows the result of averaging the data after multiple scans. This type of trace displays smoothly. The average number of traces is 100 by default and the maximum is 1000.
5) [View]
Holds and displays current trace for observation. The trace register is not updated as the analyzer sweeps.
6) [Blank]
Clear the trace on screen. The selected trace register stores the trace data, and will not be updated as the analyzer sweeps.
7) [Return]
Return to the upper-level menu.
5.7.3 [Operations>]
Enter the trace math submenu.
1) [1 2]
Exchange the trace register 1 data with the trace register 2, and place them in display mode.
2) [2-DL → 2]
Subtracts the display line value from the trace register 2. This function executes once when activated. Press [2-DL 2] again to execute it the second time. When this function activated, the display line will also be activated.
3) [2 3]
Exchange the trace register 2 data with the trace register 3, and place them in display mode.
4) [1 3]
Change the trace register 1 data to the trace register 3, and place the trace register 3 data in display mode.
5) [2 3]
Change the trace register 2 data to the trace register 3, and place the trace register 3 data in display mode.
6) [Return]
Return to the upper-level menu.
While displaying a wider span, each pixel contains spectrum information associated with a larger subrange. That is, several samples may fall on one pixel. Which of the samples will be represented by the pixel depends on the selected detector type. The submenu includes[Trace 1 2 3 4 5], [Pos Peak], [Neg Peak], [Normal], [Sample], [RMS Avg], [Voltage Avg], [Quasi-Peak].
Key points:
- Selects an appropriate type according to the application in order to ensure the accuracy of the measurement for your application.
- When 【BW】bottom softkey→[EMI Filter]→[EMI Filter] is On, [Quasi-Peak] is available.
Table 5-1 Detector type comparison
| Detector Type | Measurement |
| Pos Peak | Positive peak detector ensures that no peak signal is missed, which is useful for measuring signals that are very close to the base noise. |
| Neg Peak | Negative peak detector is used in most cases with the self-test of the spectrum analyzer and is rarely used in the measurement. It is able to restore the modulation envelope of the AM signal well. |
| Normal | Display pos peak and neg peak alternately when noise is detected, or it only display pos peak. |
| Sample | Sampling detector is conducive to measurement noise signal. Compared with the standard detection method, it can measure noise better. |
| RMS Avg | RMS Average detector averages rms levels to calculate the true average power. It is best for measuring the power of complex signals. |
| Voltage Avg | Voltage Average detector averages the linear voltage data of the envelope signal measured during the bucket interval. It is useful for observing rise and fall behavior of AM or pulse-modulated signals. |
| Quasi-Peak | Quasi-peak detector is a weighted form of peak detection. The measured value drops as the repetition rate of the measured signal decreases. It is used in EMI testing. |
5.8.1 [Trace 1 2 3 4 5]
Select the trace, the spectrum analyzer provides 1, 2, 3, 4, 5 traces, the selected trace number and the status menu item in which the trace is located will be underlined. Where the color of the number corresponds to the color of the trace.
5.8.2 [Pos Peak]
Searches the maximum from the sampling data segment and displays it at the corresponding pixel.
5.8.3 [Neg Peak]
Searches the minimum from the sampling data segment and displays it at the corresponding pixel.
5.8.4 [Sample]
Chooses any point data from the sampling data segment and displays at the corresponding pixel. This mode is usually used for video averaging and noise frequency Maker.
5.8.5 [Normal]
When noise is detected, the positive and negative peaks are alternately displayed, otherwise only positive peaks are displayed.
5.8.6 [Voltage Avg]
Set the detector to the Voltage Average detector mode. This mode calculates the average voltage of all the samples in the sample bucket.
5.8.7 [More >]
Enter detection more menu.
5.8.7.1 [RMS Avg]
Set the detector to the RMS Average detector mode. This mode calculates the RMS average power of all the samples in the
sample bucket.
5.8.7.2 [Quasi-Peak]
Set the detector to the Quasi-Peak detector mode. This mode is available when EMI filter is turned on. The quasi-peak detector is a peak detector that is weighted by the duration and repetition rate of the signal, as specified by the CISPR 16-1-1 standard. Quasi-peak detection is characterized by a fast charge time and slow decay time.
5.8.7.3 [Return]
Return to the upper-level menu.
Controls the screen display of the analyzer, such as full screen, setting the on or off for window zoom, display line, amplitude scale, grid and label.
5.9.1 [Full Screen]
Set to full-screen display graphical interface, press any key to exit.
5.9.2 [Display Line On Off]
When this menu is on, an adjustable horizontal reference line is activated on the screen.
5.9.3 [Ampt Graticule On Off]
Turn on or Off amplitude scale function.
5.9.4 [Label On Off]
Defines the content displayed or hidden in the comments that appear in the display grid area.
5.9.5 [Menu Hide On Off]
Set the hiding time of right menu (off, or 5 – 60 seconds). The right
menu is hided after the specified time when no keys or touch screen operation.
5.9.6 [Brightness]
Toggle the screen brightness between Auto and Man. When it is set to Auto, the brightness adjusts according to the environment automatically with the built-in light sensor. When it is set to Man, you can set a fixed brightness value manually (0 - 100).
5.9.7 [Screen Sleep]
Turn on/off the sleeping mode which turns off the LCD display after a user-defined idle time (1 to 60 minutes). Press the power key to re-activate the LCD display after the LCD display sleeping mode has been triggered.
5.10 【Sweep】 hardkey
Key access:
Press ↑ Shift key, then Sweep hardkey (4 in numeric keypad).
Sets parameters about the Sweep time and mode including [Sweep Time Auto Manual]. [Sweep Single], [Sweep Cont], [Sweep Points].
5.10.1 [Sweep Time Auto Man]
Sets the time interval for the analyzer to complete a sweep.
- In non-zero span, the analyzer uses the shortest sweep time on the basis of the current RBW and VBW settings if Auto is selected.
- You can modify this parameter using the numeric keys, knob, or direction keys.
5.10.2 [Sweep Single]
Press to set the sweep mode to single sweep. In this mode, pressing [Seep Single] enables a sweep.
5.10.3 [Sweep Cont]
Press [Sweep Cont] to set the sweep mode to continuous sweep. The analyzer performs one sweep after another as soon as it is triggered.
5.11 【Trig】 hardkey
Key access:
Press ↑ Shift key, then Trig hardkey (5 in numeric keypad).
Sets the trigger mode and other associated parameters, submenu includes [Auto Run], [Video], [External >].
5.11.1 [Free]
Set the trigger mode to free run mode. In this mode, new sweep starts as soon as possible after the current sweep ends.
5.11.2 [Video]
In Video mode, a trigger signal will be generated when the system detects a video signal in which the voltage exceeds the specified video trigger level.
Use the numeric keys, knob or direction keys to set the trigger level in Video mode. The screen will display corresponding line Triger Level and the value.
5.11.3 [External >]
In this mode, an external signal (TTL signal) is input from the [Trig In] connector at the top panel, of which the edge conditions should meet with the user settings to generate trigger signals.
Press [External >] to access the submenu, select [Positive Edge] or [Negative Edge] as the trigger condition.
Press ↑ Shift key, then Source hardkey (6 in numeric keypad).
When the Source is turned on, an independent signal or a signal with the same frequency of the current sweep signal will be output from the GEN Output 50Ω terminal on the top panel. Press the key to access the submenu includes [Output On Off], [Source GEN CW TG], [Output Level], [Output FREQ], [OF Step], [Network Meas >]. The source is turned off in the power-on and reset states.
5.12.1 [Track Gen On Off]
Enable or disable the trace source. The RF output and spectrum reception are fully synchronized on the frequency scan, and the tracking source frequency cannot be set separately.
5.12.2[Output Level]
Sets the output power of the tracking source signal.
5.12.3 [Reference]
When normalization is turned on, the vertical position of the trace on the screen can be adjusted by adjusting the reference level value.
5.12.4 [Position]
When normalization is turned on, the vertical position of the normalized reference level on the screen can be adjusted by adjusting the reference position.
Note:
●Similar to the function achieved by the normalized reference level, when set to 0%, the normalized reference level is located at the bottom of the screen grid, and when set to 100%, it is located at the top of the screen grid.
- You can modify this parameter using numeric keys, knobs, or arrow keys.
5.12.5 [Do Normalize]
This soft menu is used to track the user field calibration of the
source network measurement. After connecting the instrument RF output to the RF input, the display displays a straight line on the 0dB scale after pressing the "Perform Normalization" soft menu. Note: Normalization must be turned off before performing this operation.
5.12.6 [Normalize On Off]
This soft menu is used to turn normalization on or off after normalization is performed.
5.13 【Mode】 hardkey
Key access:
Press ↑ Shift key, then Mode hardkey (1 in numeric keypad).
Select the working mode of the spectrum analyzer, including [Spectrum], [Demod >], and [Modulation >]. Enter the demodulation settings. This spectrum analyzer supports audio demodulation, as well as AM and FM analog demodulation. The menu options and button functions vary when switching to different modes.
5.13.1 [Spectrum]
Enter the spectrum analysis mode.
5.13.2 [Demod >]
Enter Audio Demodulation submenu.
5.13.2.1 [Demod Mode >]
Enter the demodulation mode submenu, including FM, AM.
5.13.2.2 [Sound]
When the audio demodulation is on, adjust the headphone output volume.
5.13.2.3 [Carrier Freq]
Set the frequency of audio demodulation.
5.13.2.4 [Return]
Return the upper-level menu.
5.13.3 [Modulation >]
Enter the analog demodulation submenu.
5.13.3.1 [AM >]
Enter AM demodulation submenu.
1) [Carrier Freq]
Set the carrier frequency of the AM modulation signal.
2) [IF BW]
Set the demodulation bandwidth.
3)[Setup >]
Set the time axis, depth axis and AF trigger of AM modulation.
a) [Time Axis >]
Set timeline parameters.
●[Ref.Value]
Set the start reference time in the timeline.
•[Position]
Sets the waveform's reference position in the timeline.
●[Scale/Div Auto Man]
Set each scale automatically or manually.
●[Return]
Return to the upper-level menu.
b) [Depth Axis >]
Set the depth axis parameters.
●[Ref.Value]
Sets the reference offset position, expressed as a vertical percentage.
●[Position]
Set the reference position of the waveform on the depth axis.
●[Scale/Div Auto Man]
Set each scale automatically or manually.
- [Return]
Return to the upper-level menu.
c) [AF Trigger >]
Set AF triggering conditions.
●[AF Trigger On Off]
Set AF trigger is open or close.
●[Edge Neg Pos]
Set positive edge or negative edge.
●[Trigger Mode]
Set trigger mode is single trigger or continue trigger.
●[Trigger Level]
Set trigger amplitude.
●[Trigger Delay]
Set trigger delay time.
●[Return]
Return to the upper-level menu.
4) [Date Reset]
Set the data reset of the maximum, minimum, and average values of the AM modulated signal.
5) [Return]
Return to the upper-level menu.
5.13.3.2 [FM >]
Enter FM demodulation submenu.
1) [Carrier Freq]
Set the carrier frequency of the FM modulation signal.
2) [IF BW]
Set the demodulation bandwidth.
3)[Setup>]
Set the time axis, depth axis and AF trigger of AM modulation.
a) [Time Axis >]
Set timeline parameters.
●[Ref.Value]
Set the start reference time in the timeline.
•[Position]
Sets the waveform's reference position in the timeline.
●[Scale/Div Auto Man]
Set each scale automatically or manually.
●[Return]
Return to the upper-level menu.
b) [Deviation Axis >]
Set the deviation axis parameters.
●[Ref.Deviation]
Sets the reference offset position, expressed as a vertical percentage.
●[Position]
Set the reference position of the waveform on the deviation axis.
●[Scale/Div Auto Man ]
Set each scale automatically or manually.
●[Return]
Return to the upper-level menu.
c) [AF Trigger >]
Set AF triggering conditions.
●[AF Trigger On Off]
Set AF trigger is open or close.
●[Edge Neg Pos]
Set positive edge or negative edge.
●[Trigger Mode]
Set trigger mode is single trigger or continue trigger.
●[Trigger Level]
Set trigger amplitude.
●[Trigger Delay]
Set trigger delay time.
●[Return]
Return to the upper-level menu.
4) [Date Reset]
Set the data reset of the maximum, minimum, and average values of the FM modulated signal.
5) [Return]
Return to the upper-level menu.
The menu for system parameter settings includes [System >], [Setting >], [PowerOn/Preset >], [Save/Recall >]. For first time you use the spectrum analyzer, set the system settings, the system will store the settings, restart the machine after power off won't change the settings.
5.14.1 [System >]
Access system information, firmware update, and option submenu.
5.14.1.1 [System Info]
Display the current system information, such as serial number, firmware version, temperature, MAC address, etc.
5.14.1.2 [Firmware Update]
To update your instrument firmware, do the following:
- Create a folder named "spectrum" (lowercase) on the root directory of the USB memory device, and copy the firmware file onto this folder.
- Insert the USB memory device into the top panel USB connector on your instrument. Press Shift key, then System hardkey. Press [System >], and press [Firmware Update] to execute firmware update.
- The analyzer will perform the update process. The upgrade procedure will take approximately 30 seconds. During the update process, do not remove the USB memory device, do not power off the instrument or press any key. If the update process fails, please report the problem to your distributor or our technical support.
- Once the upgrade is completed, the instrument will automatically restart.
5.14.1.3 [Option >]
Access the option submenu. TG, EMI, CW can be selected as option.
5.14.2 [Setting >]
Access the submenu for setting the analyzer, including [LAN >], [Shutdown], [Language >], [Date/Time >].
5.14.2.1 [LAN>]
Access the submenu for LAN port configuring. The analyzer supports LAN port connection for data transfer.
1) [IP]
Sets the IP address of the LAN port.
2) [Mask]
Sets the subnet mask parameter.
3) [Gate]
Sets the default gateway address.
4) [DHCP On Off]
One of the setting methods of IP address. The DHCP server assigns an IP address, subnet mask and gateway to the analyzer on the basis of the current network status.
5.14.2.2 [Shutdown On Off]
Enable/disable the automatic shutdown function. When this function is enabled, the spectrometer will automatically shut down within a customized period of time (time range: 5 minutes to 30 days). You can set the time using the number buttons, knobs, or up and down buttons.
5.14.2.3 [Language >]
Selects the screen menu language.
5.14.2.4 [Date/Time >]
Sets the date, time, and display format of the analyzer.
- [Date Set]
Set the date for the analyzer. Use the numeric keys to enter the date. The format is YYYYMMDD.
E.g. June 22th, 2012 should be entered as 20120622.
• [Time Set]
Set the time for the analyzer. Use the numeric keys to enter the
time. The format is HHMMSS.
E.g. 16:55:30 should be entered as 165530.
- [Date/Time On Off]
Turn on or off date/time display.
5.14.3 [PowerOn/Preset>]
Sets the analyzer power on setting or preset setting.
1. [Power Set >]
Select power-on settings as [Factory] and [User].
2. [Preset >]
Select preset setting as [Factory] and [User].
[Factory]
Restores the analyzer to its factory- defined settings. The factory default settings are in Table 5-2.
[User]
Restores the analyzer to a user-defined setting.
To save the current system setting as a user-defined setting, press
Shift key, then System hardkey, press [Save/Recall >] and select the [User State ] menu item.
Table 5-2 [Factory] Settings
| Parameter | Value | ||
| Frequency | |||
| 1.6G | 3.6G | 7.5G | |
| Center Frequency | 800.000000MHz | 1.800000000GHz | 3.750000000GHz |
| Start Frequency | 0kHz | ||
| Stop Frequency | 1.600000000GHz | 3.600000000GHz | 7.500000000GHz |
| Frequency Step | Auto 160.000000MHz | Auto 360.000000MHz | Auto 750.000000MHz |
| Frequency Offset | 0Hz | ||
| Frequency Reference | Internal | ||
| SPAN | |||
| 1.6G | 3.6G | 7.5G | |
- Menu Interpretation
| Sweep | 1.600000000GHz | 3.600000000GHz | 7.500000000GHz |
| AMPTD | |||
| Reference Level | 0.00dBm | ||
| Attenuator | Auto 10 dB | ||
| Scale/Div | 10.00dB | ||
| Scale Type | Log | ||
| Ref Offset | 0.00dB | ||
| Ref Unit | dBm | ||
| Preamplifier | Off | ||
| BW | |||
| RBW | Auto 1MHz | ||
| VBW | Auto 1MHz | ||
| EMI | Off | ||
| Detector | |||
| Trace | 1 | ||
| Detector Type | Pos Peak | ||
| Sweep | |||
| Sweep Time | 1.6G | 3.6G | 7.5G |
| Auto 76.731ms | Auto 169.144ms | Auto 202.972ms | |
| Sweep Mode Source | Continuous Sweep | ||
| Source TG | Off | ||
| Network Meas | Off | ||
| Trace | |||
| Trace | 1 | ||
| Trace Type | Clear Write | ||
| Trace 1 Operations | 1<->2 | ||
| Trig | |||
5.Menu Interpretation
| Trigger Type | Auto |
| Peak | |
| Peak Search | Off |
| Peak altitude | 10.00dB |
| Search mode | Max |
| Sort mode | Amplitude |
| Peak table | Off |
| Marker Fctn | |
| NdB | Off |
| Marker Noise | Off |
| Frequency Count | Off |
| Marker | |
| Marker | 1 |
| Trace | 1 |
| Marker Table | Off |
| Meas | |
| Time Spectrum | Off |
| ACPR | Off |
| Channel Power | Off |
| OBW | Off |
| Pass-Fail | Off |
| Meas Setup | |
| Channel Bandwidth | 1.000000MHz |
| Channel Internal | 2.000000MHz |
| Channel Nums | 3 |
| PowerPercent | 99.00% |
Accesses the menu to save/recall the screenshot, trace data, IAStrace data or user state.
5.14.4.1 [Save >]
Save screen shots, trace data, or user status.
●[Screen Pixmap >]
Enter screenshot save submenu, you can choose to save screenshots to local memory or USB disk, the image file format is PNG. The file name is automatically created using the current date and time.
When [Save to USB] is selected, the screenshot will be saved in a folder named spectrum (created automatically) in USB disk.
●[Trace Data >]
Enter the trace data save soft menu, you can choose to save the trace data to the local or flash memory, trace data file format is csv, the trace data saved successfully is displayed on the screen.
●[User State >]
Save the current system setting as a user self-defined setting to local memory. The user setting file can be used as the power-on setting or preset setting.
●[Limit Line]
Save the limit line file. The save location is local. The limit line file format is sp. The progress box (pop-up window) in the middle of the screen displays information about saving the limit line.
Note: Save limit line can only be loaded when area measurement is enabled (Measure → Pass-Fail > → Area Measurement >).
5.14.4.2 [Recall >]
Accesses the submenu to recall the screenshot, trace data, or user state.
●[Type >]
You can choose to call back the screen image, trace data, user configuration, scatter map, or all file types to the local. The image file format is bmp, trace data file format is csv, user configuration file is user, and scatter map file is sp. The progress box in the middle of the screen displays information about the loading success.
- [Sort >]
Select screen images, trace data, user profiles, scatter plots, or all files to view relevant information by name, by time, by size, as desired.
●[First Page]
Go to the first page of current directory.
●[Prev Page]
Go to the previous page.
●[Next Page]
Go to the next page.
●[Load >]
Recall the selected file.
- [Return]
Return the upper-level menu.
5.14.4.3 [QuickSaveSet]
Set up to quickly save screenshots, trace data, or user status. The required document type is determined by the Settings file type in System -- Save/Recall > -- QuickSaveSet >. In general, you can save a file type of screen capture, trace data, or user status to memory or an external USB flash drive (inserted).
5.15 【File】 hardkey
Key access:
Press ↑ Shift key, then File hardkey (3 key in numeric keypad).
Access the file management menu.
5.15.1 [Storage Int Ext]
Select a file storage location: internal or external.
5.15.2 [Type >]
Select the file type you wish to view under the directory, includes screen image, trace data, user states, or display all.
- Screens (*.png)
A screen file is the captured graphic of the screen. - Trace Datas (*.csv)
A trace file records trace data. - User States (*.user)
A user state file records the current controls and settings of the analyzer.
5.15.3 [First Page]
Go to the first page of current directory.
5.15.4 [Prev Page]
Go to the previous page.
5.15.5 [Next Page]
Go to the next page.
5.15.6 [Last Page]
Go to the last page of current directory.
5.15.7 [Operations >]
Access the submenu for file operations, includes [Sort >], [Delete >], [Export >], [Load >], [Set as Power On], [Set as Preset].
5.15.7.1 [Sort >]
The files can be sorted in order by name, date&time, or size.
Selects the item by which folders and files are sorted in the file list.
5.15.7.2 [Delete >]
Press [Delete Select] to delete the selected file.
Press [Delete Page] to delete the files in current page.
Press [Delete All] to delete all the files.
5.15.7.3 [Export >]
When a USB disk is inserted, you can export the files in the local memory to the USB disk.
Press [Select] to export the selected file to USB disk.
Press [Page] to export the files in current page to USB disk.
Press [All] to export all the files to USB disk.
5.15.7.4 [Load >]
Recall the selected file.
5.15.7.5 [Set as Power On]
When the user state file (the type is user) is selected in the left list, you can press [Set as Power On] to set this user state as power-on setting.
5.15.7.6 [Set as Preset]
When the user state file (the type is user) is selected in the left list, you can press [Set as Preset] to set this user state as preset setting.
5.16 【Help】 hardkey
Key access:
Press ↑ Shift key, then Help hardkey (0 key in numeric keypad).
On the spectrum analyzer help menu, press this key once to open the system help, press any key to display the help content, and press this key again to close the help function.
Press ↑ Shift key, then Measure hardkey (point key in numeric keypad).
Provide a variety of advanced measurement functions, accesses
the spectrum analyzer built-in and user-defined measurement function soft menu, turn on or off the time spectrum, adjacent channel power measurement, channel power measurement, occupied bandwidth, Pass-Fail measurement menu.
5.17.1 [Measure off]
You can directly close the currently running measurement function, you can also choose to close the measurement menu.
5.17.2 [Time Spec On Off]
Turn on time spectrum measure mode.
5.17.3 [ACPR On Off]
Turn on or off the adjacent channel power measurement.
Press 【Meas Setup】 to enter the parameters of the adjacent channel power measurement submenu. The adjacent channel power is used to measure the ratio of the adjacent channel power of the transmitter. The absolute value of the main channel power and the absolute value of the adjacent channel power are obtained by the linear power integration method, so that the adjacent channel power ratio is gained.
5.17.4 [Chanel Power On Off]
Turn on or off channel power measurements.
Press 【Meas Setup】 to enter the channel power measurement parameter settings submenu. The channel power is used to measure the transmitter channel power, according to the user set the channel bandwidth, through the linear power integration method to obtain the absolute value of the main channel power.
5.17.5 [OBW On Off]
Turn on or off the occupied bandwidth measurement.
Press 【Meas Setup >】 to enter the parameter setting submenu for occupying the bandwidth measurement. Occupied Bandwidth is a measure of the bandwidth occupied by the transmitter signal can
be measured from the total power ratio within the in-band power span, with a default value of 99% (the user can set this value).
5.17.6 [Pass-Fail >]
Enter the pass / fail measurement function submenu. Pass / fail measurement has two modes of window measurement and limit measurement.
5.17.6.1 [Window Meas>]
Enter Window measurement submenu.
1) [Window Meas On Off]
Turn on or off window measurement mode.
2) [Limit Line On Off]
Turns the amplitude line on or off, and the amplitude line turns on when the window measurement is on.
3) [Freq Line On Off]
Turns the frequency line on or off, and the frequency line turns on when the window measurement is on.
4) [Limit Set Up Low]
Used to edit the upper and lower limit on the amplitude line.
5) [Freq Set Start Stop]
Start and stop frequencies for scanning line for editing.
6) [Window Sweep On Off]
Turns window sweep on or off. When the window sweep is on, only the window formed by the intersection of the amplitude line and the frequency line is scanned. The peripheral stops scanning; the full frequency is scanned when it is closed.
5.17.6.2 [Limit Meas >]
Enter the submenu of the limit measurement mode.
1) [Limit Meas On Off]
Turn On or Off limit measurement mode.
2) [Line Up On Off]
When the upper limit line is turned on or off, the upper limit line is opened by default when the area measurement is on.
3) [Line Low On Off]
When the lower limit line is turned on or off, the lower limit line is opened by default when the area measurement is on.
4) [Offset X/Y Freq Ampt]
Frequency: For the actual measurement, the edited area as a whole superimposed on a frequency, so that it can implement left or right shift, easy to measure. Does not affect the frequency and marker of the spectrum analyzer settings.
Amplitude: The region has been edited on the whole superimposed on a degree, so that it can move up or down, easy to measure. Does not affect the amplitude setting of the spectrum analyzer.
5) [Edit >]
Upper line editing is used to edit the control line above the trace, depending on the trace.
[UpLine Edit >]
Upper line editing is used to edit the control line above the trace, depending on the trace.
[LowLine Edit >]
Lower line editing is used to edit the control line above the trace, depending on the trace.
[Save Line]
Save the limit line edited according to the trace situation.
[Load Line >]
Enter load line menu.
●[Sort >]
Select Traces to view relevant information by name, by time, and by size as desired.
●[First Page]
Go to the first page of current directory.
●[Prev Page]
Go to the previous page.
●[Next Page]
Go to the next page.
●[Last Page]
Go to the last page.
●[Load >]
Recall the selected file.
- [Return]
Return the upper-level menu.
Measurement setting menu for the corresponding measurement parameter settings when adjacent channel power, channel power, occupied bandwidth measurement mode is turned on.
5.17.7.1 [Channel BW]
Set the bandwidth of the channel power measurement, and set the total display power percentage of bandwidth.
5.17.7.2 [Channel Interval]
Set the center frequency difference of the primary channel to the adjacent channel.
5.17.7.3 [Channel Nums]
Set the number of upper and lower adjacent channels measured by adjacent channel power.
5.17.7.4 [Power Percent]
Set the power ratio of occupied bandwidth.
6. Specification
This chapter lists the technical specifications and general technical specifications of the spectrum analyzer. Unless otherwise stated, the technical specifications apply to the following conditions:
●The instrument has been preheated for 30 minutes before use.
●The instrument is in the calibration cycle and has been self-calibrated.
"Typical" and "nominal" for this product are defined as follows
●Typical: Refers to the performance of the product under certain conditions.
- Nominal: Refers to the approximate value under product application process.
| Frequency | ||
| Frequency Range | HSA1016 (TG) | 9 kHz to 1.600000000 GHz |
| HSA1036 (TG) | 9 kHz to 3.600000000 GHz | |
| HSA1075 (TG) | 9 kHz to 7.500000000 GHz | |
| Frequency | 1 Hz | |
| Internal Frequency Reference | ||
| Reference Frequency | 10 MHz | |
| Reference Frequency Accuracy | ± [ (days since last calibrate × freq aging rate) + temperature stability + initial accuracy ] | |
| Temperature stability | <1 ppm | |
| Aging rate | 0°C to 50°C, reference is 25°C | |
| <0.5 ppm | ||
| Reference Frequency | <1 ppm/year | |
| Frequency reading accuracy | ||
| Reference | 10.000000 MHz | |
| Reference Frequency Accuracy | ± [ (days since last calibrate × freq aging rate) + temperature stability + initial accuracy ] | |
| Frequency counter | ||
- Specification
| Counter resolution | 1 Hz, 10 Hz, 100 Hz, 1 kHz | |
| Counter uncertainty | ± (frequency indication × frequency reference accuracy + counter resolution) | |
| Frequency Span | ||
| Span Range | 0 Hz, 100 Hz to max frequency of instrument | |
| Span Uncertainty | ± span / (sweep points-1) | |
| SSB Phase Noise (20°C to 30°C, fc=1GHz) | ||
| Carrier Offset | 10 kHz | <-106 dBc/Hz (Typical) |
| 100 kHz | <-104 dBc/Hz (Typical) | |
| 1 MHz | <-115 dBc/Hz (Typical) | |
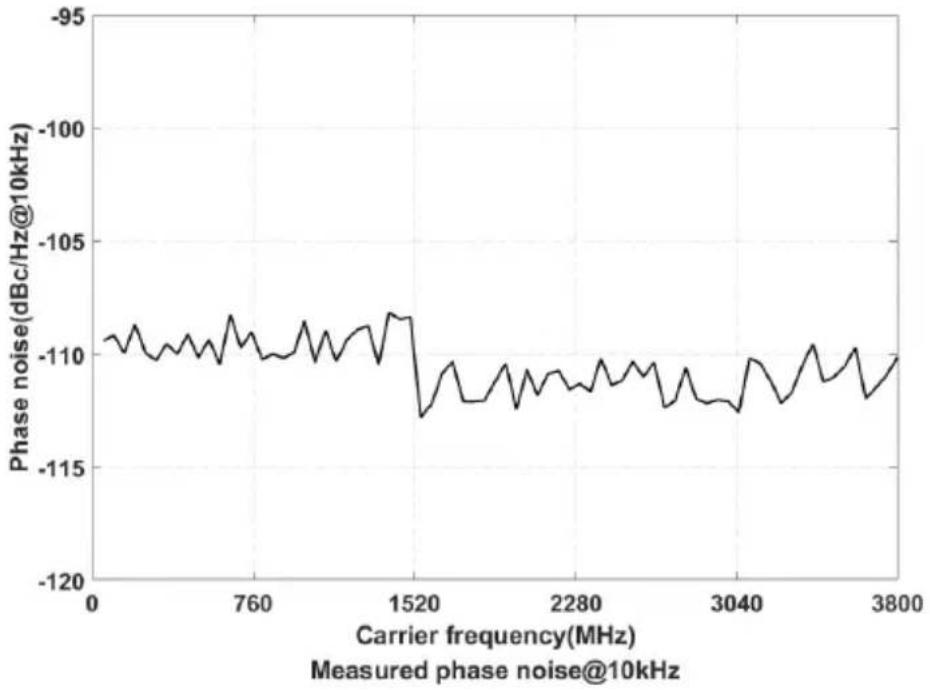 | ||
| Residual frequency modulation 20°C to 30°C, RBW=VBW= 1 kHz | ||
| Residual frequency modulation | < 50 Hz (nominal) | |
| Bandwidth | ||
| Resolution Bandwidth (-3 dB) | 1 Hz to 1 MHz, step by 1-3-5-10 | |
| RBW Accuracy | < 5% (nominal) | |
- Specification
| Resolution Filter Shape Factor (60 dB: 3 dB) | <5 (nominal) | ||
| Video Bandwidth (-3 dB) | 10 Hz to 3MHz, step by 1-3-5-10 | ||
| Resolution Bandwidth (-6 dB) (EMI option) | 200 Hz, 9 kHz, 120 kHz, 1 MHz | ||
| Amplitude | |||
| Measurement range | |||
| Range | HSA1016 (TG) | DANL to +10 dBm, 100 kHz~ 10 MHzPreamp Off DANL to +20 dBm, 10 MHz~ 1.6 GHz, Preamp Off | |
| HSA1036 (TG) | DANL to +10 dBm, 100 kHz~ 10 MHzPreamp Off DANL to +20 dBm, 10 MHz~ 3.6 GHz, Preamp Off | ||
| HSA1075 (TG) | DANL to +10 dBm, 100 kHz~ 10 MHzPreamp Off DANL to +20 dBm, 10 MHz~ 7.5 GHz, Preamp Off | ||
| Maximum input voltage | |||
| DC voltage | 50V | ||
| Continuous wave RF power | Attenuator is 40 dB | ||
| +20 dBm (100 mW) | |||
| Maximum damage level | +30 dBm (1 W) | ||
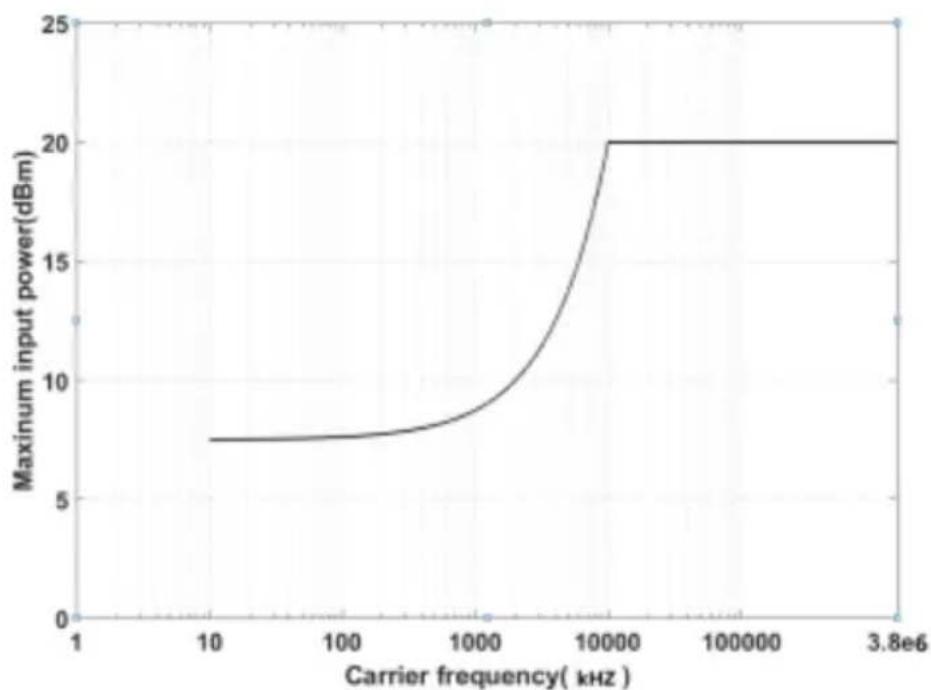
line
| Carrier frequency( kHz ) | Maximum input power(dBm) | | ------------------------ | ------------------------- | | 1 | 7.5 | | 10 | 7.6 | | 100 | 7.7 | | 1000 | 8.5 | | 10000 | 20.0 | | 100000 | 20.0 | | 3.8e6 | 20.0 |Measured frequency VS maximum input power
Displays the average noise level (DANL)
| Frequency | Attenuator is 0 dB, Resolution Bandwidth and Video Bandwidth are 100 Hz, sample detection, trace average number | ||
| Prea mp Off | HSA1016 (TG) | 9 kHz to 1 MHz | -95 dBm (Typical),<-88 dBm |
| 1 MHz to 500 MHz | -140 dBm(Typical),<-130 dBm | ||
| 500 MHz to 1.6 GHz | -138 dBm(Typical),<-128 dBm | ||
| HSA1036 (TG) | 9 kHz to 1 MHz | -95 dBm (Typical),<-88 dBm | |
| 1 MHz to 500 MHz | -140 dBm (Typical),<-130dBm | ||
| 500 MHz to 3.6 GHz | -138 dBm (Typical),<-128 dBm | ||
| HSA1075 (TG) | 9 kHz to 1 MHz | -95 dBm (Typical),<-88 dBm | |
| 1 MHz to 500 MHz | -140 dBm Typical),<-130dBm | ||
| 500 MHz to 3.6 GHz | -138 dBm (Typical),<-128 dBm | ||
| 3.6 GHz to 6 GHz | -134 dBm (Typical),<-124 dBm | ||
| 6 GHz to 7.5 GHz | -129 dBm (Typical),<-119 dBm | ||
| Prea mp On | HSA1016 (TG) | 100 kHz to 1 MHz | -135 dBm (Typical),<-128 dBm |
| 1 MHz to 500 MHz | -160 dBm Typical),<-150dBm | ||
| 500 MHz to 1.6 GHz | -158 dBm (Typical),<-148 dBm | ||
| HSA1036 (TG) | 100 kHz to 1 MHz | -135 dBm (Typical),<-128 dBm | |
| 1 MHz to 500 MHz | -160 dBm Typical),<-150dBm | ||
| 500 MHz to 3.6 GHz | -158 dBm (Typical),<-148 dBm | ||
| HSA1075 (TG) | 100 kHz to 1 MHz | -135 dBm (Typical),<-128 dBm | |
| 1 MHz to 500 MHz | -160 dBm Typical),<-150dBm | ||
| 500 MHz to 3.6 GHz | -158 dBm (Typical),<-148 dBm | ||
| 3.6 GHz to 6 GHz | -154 dBm (Typical),<-144 dBm | ||
| 6 GHz to 7.5 GHz | -149 dBm (Typical),<-139 dBm | ||
| Display level | |||
| Log scale | 0.01 dB to 1000 dB | ||
| Line scale | 0 to reference level | ||
| Display point | 801 | ||
| Trace number | 5 | ||
| Detection mode | Pos detection, Neg detection, Normal, Sample, RMS, Average voltage | ||
| Quasi-peak value (EMI option) | |||
| Trace function | Clear write, Max Hold, Min Hold, Average, View, Close, trace operation | ||
| Scale unit | dBm, dBμW, dBpW, dBmV, dBμV, W, V | ||
| Frequency response | |||
- Specification
| Preamp Off | fc ≥ 9 kHz, attenuator is 10 dB, Relative to 50 MHz, 20°C to 30°C |
| < 0.7 dB | |
| Preamp On | fc ≥ 100 kHz, attenuator is 10 dB, Relative to 50 MHz, 20°C to 30°C |
| < 1.0 dB |
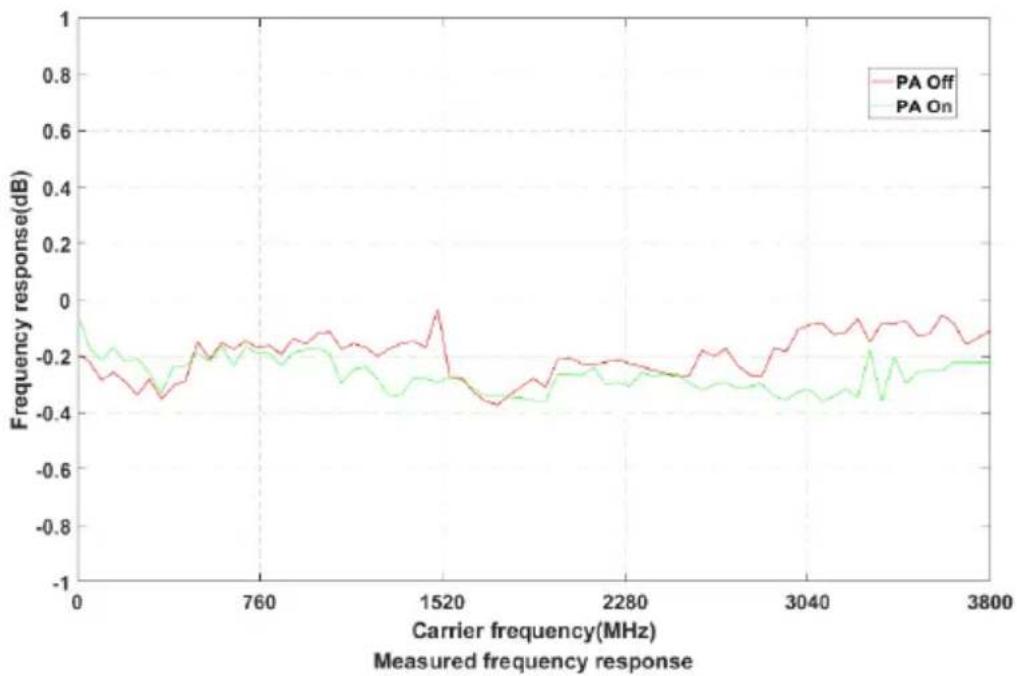
line
| Carrier frequency(MHz) | PA Off | PA On | | ---------------------- | ------ | ----- | | 0 | -0.2 | -0.1 | | 760 | -0.3 | -0.2 | | 1520 | -0.1 | -0.3 | | 2280 | -0.2 | -0.3 | | 3040 | -0.1 | -0.3 | | 3800 | -0.1 | -0.2 || Input attenuation error | |
| Setting range | 0 dB to 40 dB, step by 1 dB |
| Switching uncertainty | fc= 50 MHz, relative to 10 dB, 20°C to 30°C |
| <0.5 dB | |
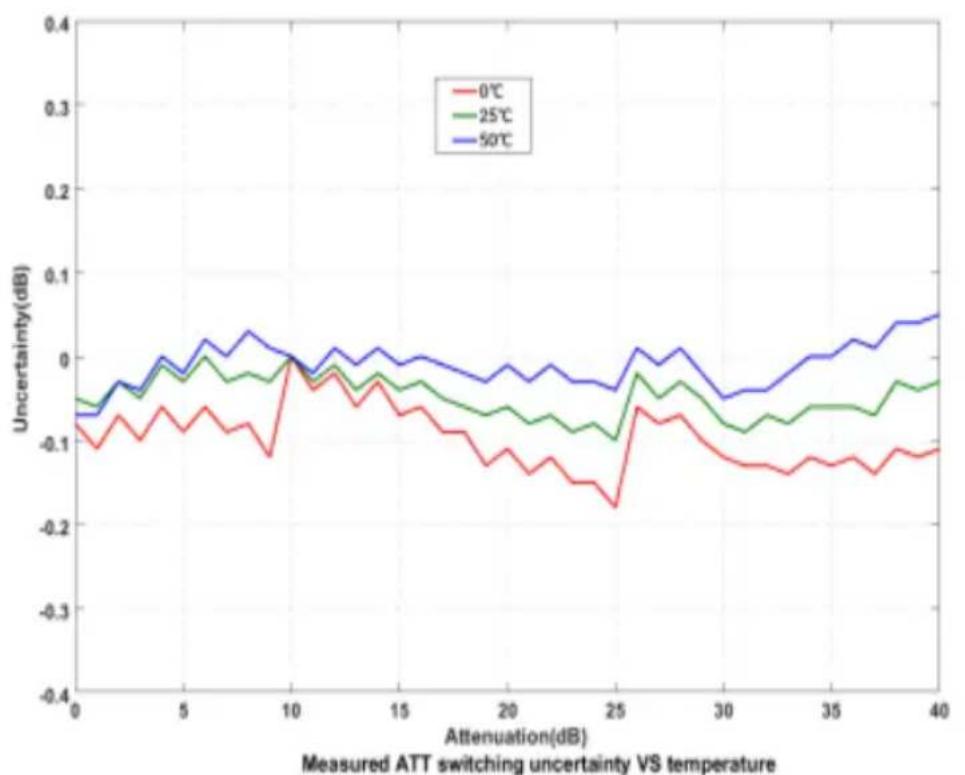
line
| Attenuation(dB) | 0°C | 25°C | 50°C | | --------------- | ------ | ------ | ------ | | 0 | -0.1 | -0.05 | -0.07 | | 5 | -0.08 | -0.03 | -0.04 | | 10 | -0.12 | -0.01 | 0.02 | | 15 | -0.06 | -0.04 | -0.02 | | 20 | -0.1 | -0.06 | -0.03 | | 25 | -0.18 | -0.08 | -0.05 | | 30 | -0.12 | -0.07 | -0.04 | | 35 | -0.1 | -0.06 | -0.03 | | 40 | -0.11 | -0.04 | 0.05 || Absolute amplitude accuracy | |||
| Uncertainty | fc= 50 MHz, Peak detector, Preamp off, attenuator is 10 dB, Input signal level =-10 dBm, 20°C to 30°C | ||
| <0.4 dB | |||
| Resolution bandwidth switch | |||
| Uncertainly | Relative to 10 kHz RBW | ||
| <0.1 dB | |||
| Reference level | |||
| Range | -80dBm to +30 dBm, step by 1 dB | ||
| Resolution | Log scale | 0.01 dB | |
| Line scale | 4 digits | ||
| Preamp | |||
| Gain | HSA 1016 (TG) | 100 kHz to 1.6 GHz | 20 dB (nominal) |
- Specification
| HSA 1036 (TG) | 100 kHz to 3.6GHz | ||
| HSA 1075 (TG) | 100 kHz to 7.5 GHz | ||
| Level measurement uncertainty (95% Confidence degree, S/N>20 dB, resolution bandwidth and Videobandwidth are1 kHz, Preamp off, attenuator is 10 dB) | |||
| Level measurement uncertainty | <0.7 dB | ||
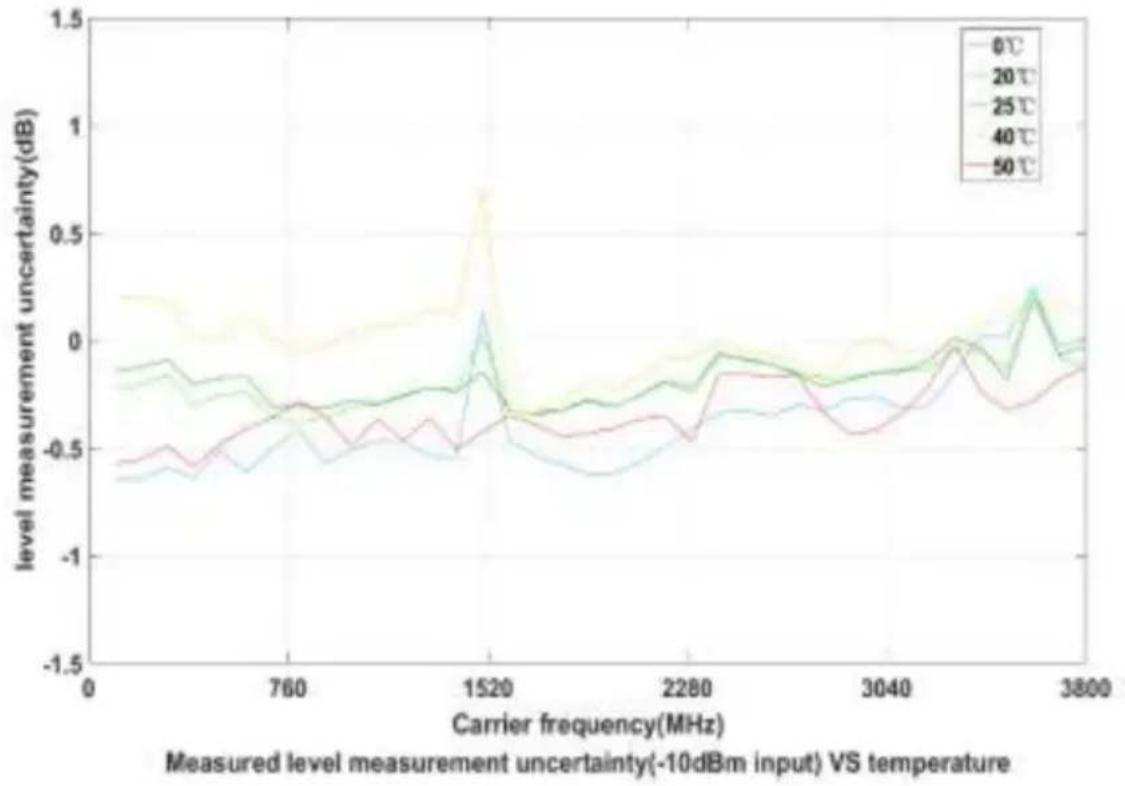 | |||
| Radio frequency input VSWR (Set attenuator≥10dB) | |||
| VSWR | HSA1016 (TG) | 300 kHz to 1.6 GHz | <1.8 (nominal) |
| HSA1036 (TG) | 300 kHz to 3.6 GHz | ||
| HSA1075 (TG) | 300 kHz to 7.5 GHz | ||
6. Specification
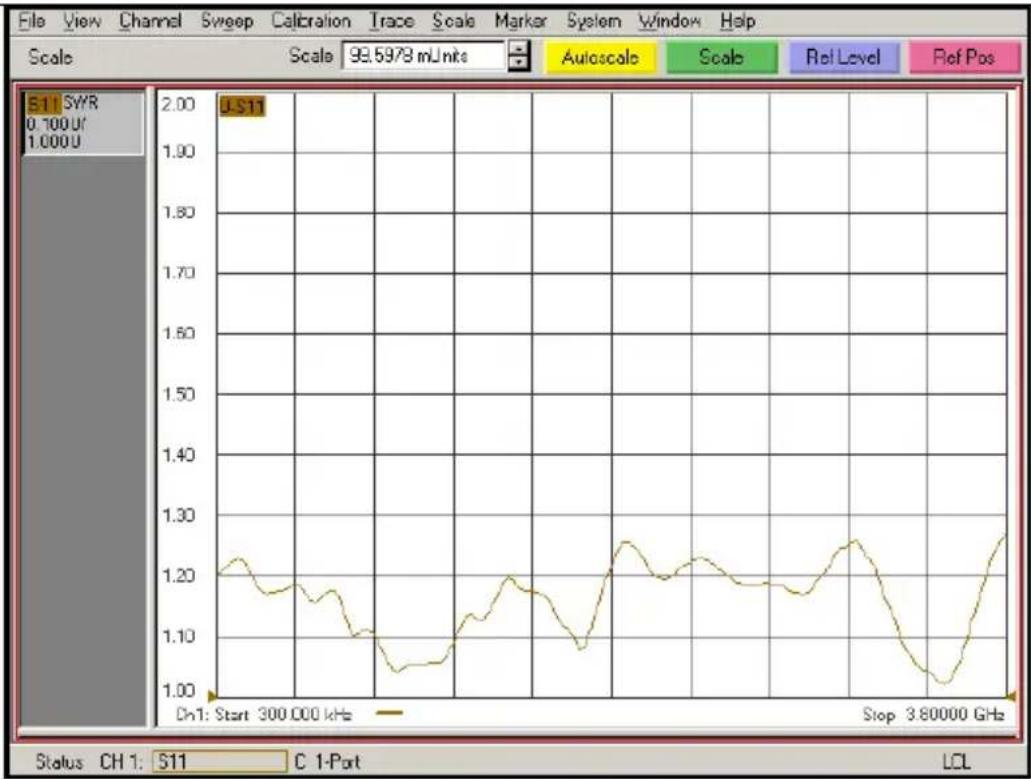
line
| Time (GHz) | Value | |------------|-------| | Start | 1.20 | | 300,000 | 1.10 | | | 1.25 | | | 1.20 | | | 1.25 | | | 1.20 | | | 1.25 | | | 1.20 | | | 1.25 | | | 1.20 | | | 1.25 | | | 1.20 | | | 1.25 | | | 1.30 | | | 1.25 | | | 1.20 | | | 1.25 | | | 1.20 | | | 1.25 | | | 1.20 | | | 1.25 | | | 1.20 | | | 1.25 | | | 1.10 | | | 1.05 | | | 1.00 | | | 1.05 | | | 1.10 | | | 1.15 | | | 1.20 | | | 1.25 | | | 1.20 | | | 1.25 | | | 1.20 | | | 1.25 | | | 1.30 | | | 1.25 | | | 1.20 | | | 1.30 | | | 1.25 | | | 1.20 | | | 1.25 | | | 1.30 | | | 1.40 | | | 1.35 | | | 1.40 | | | 1.45 | | | 1.40 | | | 1.45 | | | 1.50 | | | 1.45 | | | 1.50 | | | 1.45 | | | 1.50 | | | 1.45 | | | 1.50 | | | 1.60 | | | 1.55 | | | 1.60 | | | 1.65 | | | 1.60 | | | 1.65 | | | 1.70 | | | 1.65 | | | 1.70 | | | 1.65 | | | 1.70 | | | 1.65 | | | 1.75 | | | | | | | | | | | | | | | | | | | | | | | | | | | | | | | | | | | | | | | | | | | | | | | | | | | | | | | | | | | | | | | | | | | | | | | | | | | | | | | | | | | | | | | | | | | | | | | | | | | | | | | | | | | | | | | | | | | | | | | | | | | | | Dn:Start | | | | | | | | | | | | | | | | | | | | | | | | | | | | | | | | | | | | | | | | | | | | | | | | | | | | | | | | | | | | | | | | | | | | | | | | | | | | | | | | | | | | | | | | | | | | | | | | | | | | | | | | | | | | | | | | | | | | | | | | | | | | (Stop)| | | (Stop)| | | (Stop)| | | (Stop)| | | (Stop)| | | (Stop)| | | (Stop)| | | (Stop)| | | (Stop)| | | (Stop)| | | (Stop)| | | (Stop)| | | (Stop)| | | (Stop)| Distortion | |
| Second harmonic cut-off point | |
| Second harmonic cut-off point (SHI) | fc ≥ 50 MHz, input signal level is -20 dBm, attenuator is 10 dB |
| > +45 dBm | |
| Third order intermodulation cut-off point | |
| Third order intermodulation cut-off point (TOI) | fc ≥ 50 MHz, two magnitudes are -20 dBm, frequency interval 200 kHz Two-tone signal input mixer, attenuator is 0 dB |
| > +14 dBm (Typical) | |
| 1dB Gain compression | |
| Input the 1dB compression point of the mixer (P1dB) | fc ≥ 50 MHz, attenuator is 0 dB |
| > -2dBm (nominal) | |
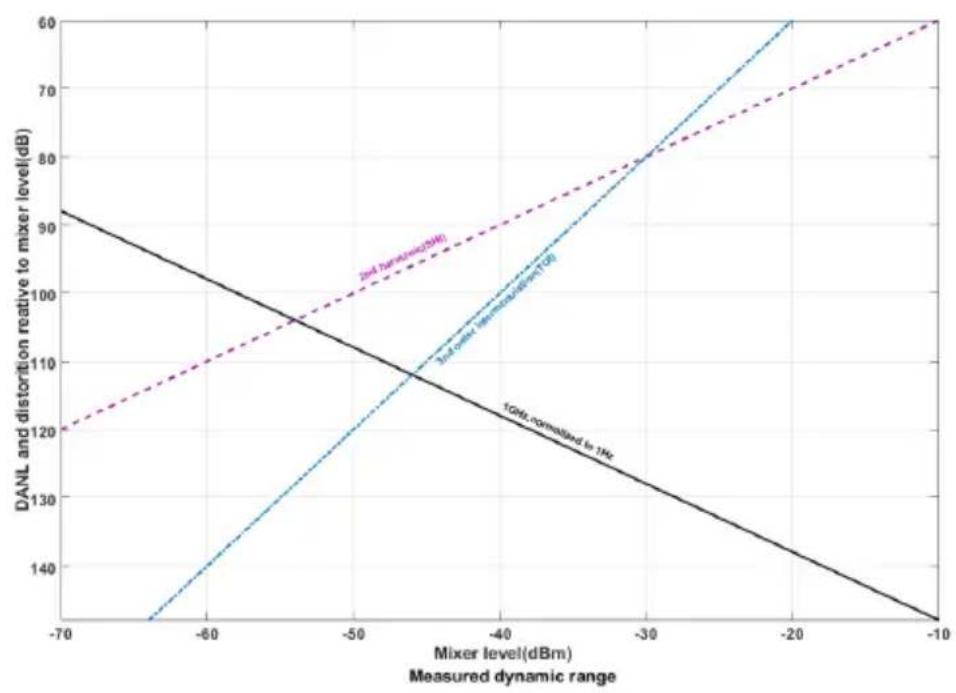
line
| Measured dynamic range (dBm) | 10Mx, normalized to 1MHz | 2nd harmonic(2MHz) | 3rd harmonic, normalized(2MHz) | | ----------------------------- | ------------------------ | ------------------ | ------------------------------ | | -70 | 92 | 120 | - | | -60 | 85 | 135 | - | | -50 | 78 | 150 | - | | -40 | 70 | 165 | - | | -30 | 62 | 180 | - | | -20 | 54 | 195 | - | | -10 | 46 | 210 | - || Spurious response | |||
| Residual response | Input port connected to 50 Ω load, attenuator is 0 dB, 20°C to 30°C | ||
| <-90 dBm, Typical | |||
| Medium frequency | <-60 dBm | ||
| System dependent sideband | Local oscillator correlation, A/D transformation correlation, harmonics and subharmonics of the first oscillator are related | ||
| <-60 dBc | |||
| Input dependent spurious | Mixer level is -30 dBm | ||
| <-80 dBm | |||
| Sweep | |||
| Sweep Time | Sweep bandwidth≥100 Hz: 10 ms to 3000 | ||
| Sweep Time uncertainty | Sweep bandwidth≥100 Hz: 5% (nominal)Zero Sweep (Sweep time set value >1 ms): | ||
| Sweep Mode | Continuous, Single | ||
| Trigger | |||
| Trigger source | liberty, video, external | ||
| External trigger level | 5 V TTL level | ||
| Trace source (option) | |||
| Trace source output | |||
| Frequency range | HSA1016 (TG) | 100 kHz to 1.6 GHz | |
| HSA1036 (TG) | 100 kHz to 3.6 GHz | ||
| HSA1075 (TG) | 100 kHz to 7.5 GHz | ||
| Output level range | -40 dBm to 0 dBm | ||
| Output level resolution | 1 dB | ||
| Output flatness | Relative to 50 MHz | ||
| ±3 dB (nominal) | |||
| Tracking source stray | Harmonic stray: -20 dBc (Typical) (Output power of the tracking source is -10 dBm时); Non-Harmonic stray: -20 dBc (Typical) (utput power of the tracking source is -10 dBm时); | ||
| Tracking source to Input isolation | -60 dBm (utput power of the tracking source is 0 dBm) | ||
| Input/Output | |||
| Front panel connector | |||
| Radio frequency input | Resistance | 50 Ω, nominal | |
| Connector | N-type negative head | ||
| Trace source output | Resistance | 50 Ω, nominal | |
| Connector | N-type negative head | ||
| Internal/External reference | |||
| Internal | Frequency | 10 MHz | |
| reference | Output level | +3 dBm to +10 dBm, +8 dBm (Typical) | |
| Resistance | 50 Ω (nominal) | ||
| Connector | BNC negative head | ||
| External reference | Frequency | 10 MHz ± 5 ppm | |
| Output level | 0 dBm to + 10 dBm | ||
| Resistance | 50 Ω (nominal) | ||
| Connector | BNC negative head | ||
| External trigger output | |||
| External trigger input | Resistance | 1 kΩ (nominal) | |
| Connector | BNC negative head | ||
| Audio interface | Resistance | 30 Ω (nominal) | |
| Connector | 3.5 mm | ||
| Communication interface | |||
| USB master terminal | |||
| USB Host | Connector | A plug | |
| Treaty | USB 2.0 | ||
| USB device end | |||
| USB Devise | Connector | Micro USB | |
| Treaty | 2.0 version | ||
| LAN | 10/100Base, RJ-45 | ||
| General technical specification | |||
| Display | |||
| Display type | TFT LCD | ||
| Display resolution | 1024*768 | ||
| Screen size | 8 inches | ||
| Screen color | 65536 | ||
| Mass storage | |||
| Mass storage | Flash disk (internal storage 50 MByte), USB | ||
| Environment | |||
| Temperat | Operating temperature | 0 °Cto 50 °C | |
- Specification
| ure | range | ||
| Storage temperature range | -20 °C to 70 °C | ||
| Humidity | 0°C to 30°C | ≤ 95% relative humidity | |
| 30°C to 40°C | ≤ 75% relative humidity | ||
| Altitude | Altitude operation | 3000 below | |
| Appearance | |||
| Dimension | 265 mm (width)× 190 mm (high)× 58 mm (depth) | ||
| Weight | Approx. 2.5 kg (main engine) | ||
| Calibration interval time | |||
| Recommended calibration interval | 18 months | ||
7. Troubleshooting
Typical issues that may occur when using your spectrum analyzer:
■ Power on malfunction
■ No signal displays
■ Wrong measurement results or poor frequency or amplitude precision.
1. Power on malfunction
Power on malfunction can include a situation where the screen is still dark (no display) after switch on.
If the screen is still dark after power on, please check:
1) If the power supply has been connected correctly and if the power supply voltage range is within the specification.
2) If the power switch has been turned on.
2. No signal displays
If there is no signal display at any wave band. Please try the following: set a signal generator at 30 MHz frequency and -10 dBm power and connect it to the spectrum analyzer RF input connector. If there is still no signal display, there may be a problem with the spectrum analyzer hardware circuit. Please contact us for service.
3. Wrong measurement results or poor signal frequency precision
If the display contents shake a lot or the frequency readout exceeds the error range during measurements, check if the signal source is stable. If so, check if spectrum analyzer reference is precise. Select internal or external frequency reference according to measurement conditions: press FREQ bottom softkey → [Freq Ref Int Ext]. If the frequency is still not precise, then the spectrum analyzer LO has lost its phase lock, please contact us for service.
4. Wrong measurement results or poor readout amplitude precision
If signal amplitude readout is not precise, perform a calibration. If amplitude readout is still not precise, then it may be a problem with internal circuit, please contact us for service.
8. Appendix
Appendix A: Enclosure
(The accessories subject to final delivery.)
Standard Accessories
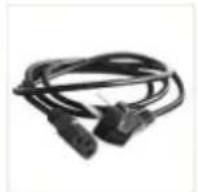
Power Cord

CD Rom

Quick Guide
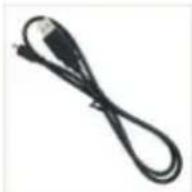
USB Cable
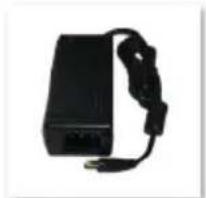
natural_image
Black electronic device with attached cable and connector (no visible text or symbols)AC-DC Adapter
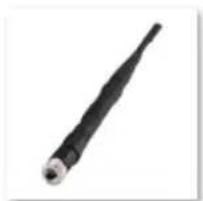
natural_image
Black cylindrical object with a pointed tip, resembling a stylized sensor or connector (no text or symbols visible)GPS Antenna
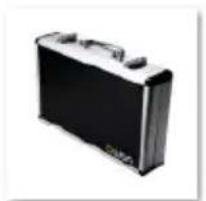
natural_image
Black and silver briefcase with handle, no visible text or symbolsMetal Case
Options
N-N Cable
N-SMA Cable
SMA-SMA Cable
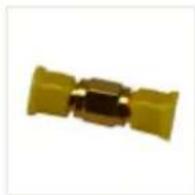
SMA Adaptor
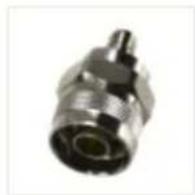
N-SMA Adaptor
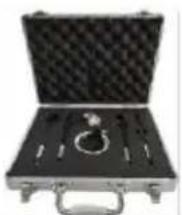
Near Field Probe includes: Four near-field probes, N-SMA adapter, SMA-SMA cable (Frequency range: 30 MHz – 3 GHz)
natural_image
Black rectangular device with lid and side pockets (no visible text or symbols)Carrying Case
Appendix B: General Care and Cleaning
General Care
Do not store or leave the instrument where the liquid crystal display could be exposed to direct sunlight for long periods of time.
Caution: To avoid any damage to the instrument or probes, do not exposed it to any sprays, liquids, or solvents.
Cleaning
Inspect the instrument and probes as often as operating conditions require.
To clean the instrument exterior, perform the following steps:
Wipe the dust from the instrument surface with a soft cloth. Take care not to scratch the transparent LCD protection screen when cleaning.

WARNING
Before reapplying power, ensure that the instrument is completely dry, avoiding any electric shock or electrical short circuit resulting from moisture.
Appendix C: USB Disk Requirements
USB disk requirements:
Max capacity 4G, NTFS file system is not supported.
If the USB disk doesn't work properly, format your USB disk and then try again.
Appendix D: PC Software Requirements
The PC software support Windows 11 \Windows 10 \ Windows 8 \ Windows 7 \ Windows Vista \ Windows 2000;the PC software does not support Windows XP.
- July 2023 edition V2.0.0
- General Warranty
- Table of contents
- List of figures...... iii
- Menu Interpretation ...... 31
- List of figures
- List of tables
- General Safety Requirements
- Safety Terms and Symbols
- Safety Terms
- WARNING
- CAUTION
- Document Overview
- - Quick Start
- - Menu Interpretation
- - Specification
- - Trouble Shooting
- - Appendix
- Convention on button and menu key format:
- Related document:
- Quick Start
- General Inspection
- Check for transportation damage.
- Check the Accessories
- Check the Complete Instrument
- Safety Precaution before Operation
- Power Supply Requirements
- Electro-static Discharge (ESD) Protection
- First Time to Power on
- Front Panel Overview
- Top Panel Overview
- Rear Panel Overview
- User Interface Overview
- Function Keys
- Function Softkeys
- Function Hardkeys
- Shift key:
- Parameter Input
- Numeric keypad
- Number keys
- Rotary knob
- Arrow keys
- Build-in Help
- 1.How to acquire built-in help
- 2.Page up and down
- Close the current help information
- Acquire the softkey help
- Acquire the help information of any function hardkey
- Touchscreen Controls
- External keyboard control
- Basic Measurement
- Equipment connection
- Setting parameters
- 2) Setting center frequency
- 3) Setting frequency span
- 4) Activate marker
- 5) Setting amplitude
- Menu Interpretation
- [Center Freq]
- Key Points:
- [Start Freq]
- [Stop Freq]
- [CF Step Auto Manual]
- [Freq Offset]
- [Freq Ref Int Ext]
- [Scale Type Lin LOG]
- [Span]
- [Full Span]
- [Zero Span]
- [Last Span]
- Key access: [AMPTD] softkey at the bottom of the screen
- [Ref Level]
- [Attenuation Auto Man]
- [Scale/Div]
- [Scale Type Lin Log]
- [Ref Offset]
- [Ref Unit>]
- [Preamplifier On Off]
- [RBW Auto Man]
- [VBW Auto Man]
- [EMI On Off]
- 5.6.1【Marker>】 right softkey
- Key access:
- [Marker] bottom softkey → [Marker >] right softkey
- [Marker 1 2 3 4 5 6 7 8]
- [Trace 1 2 3 4 5]
- [Normal]
- [Delta]
- [Off]
- [All Off]
- [Marker Table On Off]
- 5.6.2【MarkerFctn >】right softkey
- [Function Off]
- [NdB On Off]
- [Marker Noise On Off]
- [Freq Count >]
- 1) [Freq Count On Off]
- 2) [BW]
- [FIELD>]
- 1) [FIELD On Off]
- 2) [Antenna Gain On Off]
- 3) [UNIT]
- 4)[Antenna Set]
- - Recall >
- ●New
- - Delete
- ●Frequency
- ●Factor
- - Save
- 5.6.3【Marker→>】
- [Mkr→CF]
- [Mkr→CF Step]
- [Mkr→Start]
- [Mkr→Stop]
- [Mkr→Ref Level]
- [Mkr→ Span]
- [Mkr→ CF]
- 5.6.4【Peak>】
- [Max Peak]
- [Peak-Peak]
- [Next Peak]
- [Left Peak]
- [Right Peak]
- [Cont Peak On Off]
- [Peak Setup >]
- 【Trace】 hardkey
- [Trace 1 2 3 4 5]
- [State Blank >]
- 1) [Clear&Write]
- 2) [Max Hold]
- 3) [Min Hold]
- 4) [Average]
- 5) [View]
- 6) [Blank]
- 7) [Return]
- [Operations>]
- 6) [Return]
- [Trace 1 2 3 4 5]
- [Pos Peak]
- [Neg Peak]
- [Sample]
- [Normal]
- [Voltage Avg]
- [More >]
- [RMS Avg]
- [Quasi-Peak]
- [Return]
- [Full Screen]
- [Display Line On Off]
- [Ampt Graticule On Off]
- [Label On Off]
- [Menu Hide On Off]
- [Brightness]
- [Screen Sleep]
- 【Sweep】 hardkey
- [Sweep Time Auto Man]
- [Sweep Single]
- [Sweep Cont]
- 【Trig】 hardkey
- [Free]
- [Video]
- [External >]
- [Track Gen On Off]
- 5.12.2[Output Level]
- [Reference]
- [Position]
- Note:
- [Do Normalize]
- [Normalize On Off]
- 【Mode】 hardkey
- [Spectrum]
- [Demod >]
- [Demod Mode >]
- [Sound]
- [Carrier Freq]
- [Return]
- [Modulation >]
- [AM >]
- 1) [Carrier Freq]
- 2) [IF BW]
- 3)[Setup >]
- 4) [Date Reset]
- 5) [Return]
- [FM >]
- 3)[Setup>]
- [System >]
- [System Info]
- [Firmware Update]
- [Option >]
- [Setting >]
- [LAN>]
- [Shutdown On Off]
- [Language >]
- [Date/Time >]
- - [Date/Time On Off]
- [PowerOn/Preset>]
- [Power Set >]
- [Preset >]
- [Factory]
- [User]
- [Save >]
- ●[Screen Pixmap >]
- ●[Trace Data >]
- ●[User State >]
- ●[Limit Line]
- [Recall >]
- ●[Type >]
- - [Sort >]
- ●[First Page]
- ●[Prev Page]
- ●[Next Page]
- ●[Load >]
- - [Return]
- [QuickSaveSet]
- 【File】 hardkey
- [Storage Int Ext]
- [Type >]
- [First Page]
- [Prev Page]
- [Next Page]
- [Last Page]
- [Operations >]
- [Sort >]
- [Delete >]
- [Export >]
- [Load >]
- [Set as Power On]
- [Set as Preset]
- 【Help】 hardkey
- [Measure off]
- [Time Spec On Off]
- [ACPR On Off]
- [Chanel Power On Off]
- [OBW On Off]
- [Pass-Fail >]
- [Window Meas>]
- 1) [Window Meas On Off]
- 2) [Limit Line On Off]
- 3) [Freq Line On Off]
- 4) [Limit Set Up Low]
- 5) [Freq Set Start Stop]
- 6) [Window Sweep On Off]
- [Limit Meas >]
- 1) [Limit Meas On Off]
- 2) [Line Up On Off]
- 3) [Line Low On Off]
- 4) [Offset X/Y Freq Ampt]
- 5) [Edit >]
- [UpLine Edit >]
- [LowLine Edit >]
- [Save Line]
- [Load Line >]
- ●[Last Page]
- [Channel BW]
- [Channel Interval]
- [Channel Nums]
- [Power Percent]
- Specification
- Troubleshooting
- Power on malfunction
- No signal displays
- Wrong measurement results or poor signal frequency precision
- Wrong measurement results or poor readout amplitude precision
- Appendix
- Appendix A: Enclosure
- Appendix B: General Care and Cleaning
- General Care
- Cleaning
- Appendix C: USB Disk Requirements
- Appendix D: PC Software Requirements
Brand : Owon
Model : HSA1016
Category : Measurement