
PDS 62-SIN - Meter Megger - Free user manual and instructions
Find the device manual for free PDS 62-SIN Megger in PDF.


| Product Type | Partial Discharge Measuring System (PD Coupler) |
| Brand | Megger |
| Model | PDS 62-SIN |
| Maximum Voltage | 62 kV peak |
| Voltage Waveform | VLF sine wave |
| Frequency Range | 0.01 Hz to 0.1 Hz |
| PD Measuring Range | 2 pC to >100 nC |
| System Noise Level | <2 pC |
| PD Localization Range | 0 to 16,000 m (v/2 = 80 m/μs) |
| Localization Accuracy | ±1% of cable length |
| Sample Rate | 125 MHz (8 ns) |
| Bandwidth | 3 / 20 MHz (switchable) |
| Power Supply | 90 to 264 VAC, 50/60 Hz via external power supply |
| Weight | 16 kg |
| Dimensions (W x D x H) | 36 x 33 x 64 cm |
| Operating Temperature | -20 °C to 55 °C |
| Storage Temperature | -40 °C to 70 °C |
| Relative Humidity | 93% at 30 °C (non-condensing) |
| Key Features | Automatic calibration in one step; real-time PD mapping and statistical evaluation; fully automatic report generation; cable database with segment templates; OWTS data import (optional) |
| Software | Intuitive control and analysis software pre-installed on provided notebook |
| Scope of Delivery | PD measurement system, accessory bag, software license (3 dongles), notebook with case, PD calibrator CAL1, attachable HF filter, power supply, mains cable, HV connection cable (1.5 m), operational earth cable, HV alligator clip, short-circuit line (0.5 m), network cables (5 m, 3 m), USB-to-Ethernet adapter, manual |
| Maintenance | Clean housing and cables with soft, lint-free cloth and ethanol; annual service recommended by Megger |
| Safety | Follow five safety rules; only authorized electricians; use genuine accessories; observe CE directives |
| Warranty | 12 months from delivery; covers manufacturing defects; excludes wear parts, lamps, fuses, batteries |
Frequently Asked Questions - PDS 62-SIN Megger
User questions about PDS 62-SIN Megger
0 question about this device. Answer the ones you know or ask your own.
Ask a new question about this device
Download the instructions for your Meter in PDF format for free! Find your manual PDS 62-SIN - Megger and take your electronic device back in hand. On this page are published all the documents necessary for the use of your device. PDS 62-SIN by Megger.
USER MANUAL PDS 62-SIN Megger
PDS 62-SIN
Partial discharge measuring system
USER GUIDE
Issue: D (09/2022) - EN
Article number: 85958
Consultation with Megger
The present system manual has been designed as an operating guide and for reference. It is meant to answer your questions and solve your problems in as fast and easy a way as possible. Please start with referring to this manual should any trouble occur.
In doing so, make use of the table of contents and read the relevant paragraph with great attention. Furthermore, check all terminals and connections of the instruments involved.
Should any question remain unanswered or should you need the help of an authorized service station, please contact:
Megger Limited Megger Germany GmbH (Baunach)
Archcliffe Road Dr.-Herbert-Iann-Str. 6
Kent CT17 9EN D - 96148 Baunach
T: +44 1304 502100 T: +49 9544 68 - 0
F: +44 1304 207342 F: +49 9544 22 73
E: uksales@megger.com E: team.dach@megger.com
Röderaue 41 Valley Forge Corporate Centre
D - 01471 Radeburg / Dresden 2621 Van Buren Avenue
Norristown, PA 19403 USA
T: +49 35208 84 - 0 T: +1 610 676 8500
F: +49 35208 84 249 F: +1 610 676 8610
E: team.dach@megger.com
© Megger
All rights reserved. No part of this handbook may be copied by photographic or other means unless Megger have before-hand declared their consent in writing. The information in this document is subject to change without notice and should not be construed as a commitment by Megger. Megger cannot be made liable for technical or printing errors or shortcomings of this handbook. Megger also disclaims all responsibility for damage resulting directly or indirectly from the delivery, supply, or use of this matter.
Terms of Warranty
Megger accept responsibility for a claim under warranty brought forward by a customer for a product sold by Megger under the terms stated below.
Megger warrant that at the time of delivery Megger products are free from manufacturing or material defects which might considerably reduce their value or usability. This warranty does not apply to faults in the software supplied. During the period of warranty, Megger agree to repair faulty parts or replace them with new parts or parts as new (with the same usability and life as new parts) according to their choice.
This warranty does not cover wear parts, lamps, fuses, batteries and accumulators.
Megger reject all further claims under warranty, in particular those from consequential damage. Each component and product replaced in accordance with this warranty becomes the property of Megger.
All warranty claims versus Megger are hereby limited to a period of 12 months from the date of delivery. Each component supplied by Megger within the context of warranty will also be covered by this warranty for the remaining period of time but for 90 days at least.
Each measure to remedy a claim under warranty shall exclusively be carried out by Megger or an authorized service station.
This warranty does not apply to any fault or damage caused by exposing a product to conditions not in accordance with this specification, by storing, transporting, or using it improperly, or having it serviced or installed by a workshop not authorized by Megger. All responsibility is disclaimed for damage due to wear, will of God, or connection to foreign components.
For damage resulting from a violation of their duty to repair or re-supply items, Megger can be made liable only in case of severe negligence or intention. Any liability for slight negligence is disclaimed.
Since some states do not allow the exclusion or limitation of an implied warranty or of consequential damage, the limitations of liability described above perhaps may not apply to you.
Contents
Consultation with Megger....3
Terms of Warranty 4
Contents 5
1 Safety Instructions....7
1.1 General Notes 7
1.2 General Safety Instructions and Warnings....9
2 Technical Description....10
2.1 Abbreviations....10
2.2 System Description ....11
2.3 Technical Data 14
2.5 Technical Background....15
2.6 Connection Elements and Status LEDs....17
3 Commissioning ....18
3.1 Electrical Connection....18
3.1.1 Electrical Connection in Combination with a Stand-Alone Test Voltage Source 19
3.2 Switching On 21
4 Basic Operation of the Software....22
4.1 Start Screen 22
4.2 Useful Features of the Software....23
5 Conducting Measurements....25
5.1 Starting or Resuming a Measurement Task – 📋....25
5.2 Calibrating the Partial Discharge Measuring Circuit - 27
5.2.1 Connecting the Calibrator....27
5.2.2 Conducting the Calibration....28
5.2.3 Disconnecting the Calibrator 31
5.3 Measuring - 32
5.3.1 Basic Information Regarding the Measurement Screen 32
5.3.2 Available diagram types 33
5.3.3 Setting the Measurement Parameters ....37
5.3.4 Performing the Measurement....40
5.3.4.1 Typical Procedure for PD Diagnosis with VLF Voltage....43
5.3.4.2 Typical Procedure for Monitored Withstand Testing 44
5.3.5 Stopping / Finishing a Measurement....45
6 Evaluating Measurement Results and Creating a Report....46
6.1 Manual Evaluation of Partial Discharges ....49
6.1.1 Determining Possible Sources of PD Faults 49
6.1.2 Analysing Individual PD Events 50
6.2 Preparing and Printing the Report....53
7 Configuring Settings and Managing Data....56
7.1 Adjusting the Settings - 56
7.1.1 Managing Devices....58
7.1.2 Managing Report Templates....59
7.2 Cable Manager - √ + 63
7.2.1 Viewing Cable Data and Administrating Measurement Tasks....63
7.2.2 Managing Cables 66
7.2.2.1 Entering / Changing General Cable Data....66
7.2.2.2 Specifying the Sections of the Cable 68
7.2.2.3 Saving Cable Data 72
7.2.2.4 Managing Segment Templates 73
7.2.3 Managing Measuring and Cable Data....74
7.2.3.1 Exporting Data....75
7.2.3.2 Importing Data....76
7.2.3.3 Backing Up Data 78
8 Storage and Transport....79
9 Maintenance and Care 80
10 Troubleshooting....81
1 Safety Instructions
1.1 General Notes
Safety precautions
This manual contains basic instructions for the commissioning and operation of the device / system. For this reason, it is important to ensure that the manual is always available to the authorised and trained operator. He needs to read the manual thoroughly. The manufacturer is not liable for damage to material or humans due to non-observance of the instructions and safety advices provided by this manual.
Locally applying regulations have to be observed!
Labelling of safety instructions
The following signal words and symbols are used in this manual and on the product itself:
| Signal word / symbol | Description |
| DANGER | Indicates a potential hazard which will result in death or serious injury if not avoided. |
| WARNING | Indicates a potential hazard which may result in death or serious injury if not avoided. |
| CAUTION | Indicates a potential hazard which may result in moderate or minor injury if not avoided. |
| NOTICE | Indicates a potential hazard which may result in material damage if not avoided. |
 | Serves to highlight warnings and safety instructions.As a warning label on the product it is used to draw attention to potential hazards which have to be avoided by reading the manual. |
 | Serves to highlight warnings and safety instructions that explicitly indicate the risk of an electric shock. |
 | Serves to highlight important information and useful tips on the operation of the device/system. Failure to observe may lead to unusable measurement results. |
Working with products from Megger
It is important to observe the generally applicable electrical regulations of the country in which the device will be installed and operated, as well as the current national accident prevention regulations and internal company directives (work, operating and safety regulations).
After working on the system, it must be voltage-free and secured against reconnection as well as having been discharged, earthed and short-circuited.
Use genuine accessories to ensure system safety and reliable operation. The use of other parts is not permitted and invalidates the warranty.
Operating staff
The system may only be installed and operated by an authorised electrician. DIN VDE 0104 (EN 50191), DIN VDE 0105 (EN 50110) and the German accident prevention regulations (UVV) define an electrician as someone whose knowledge, experience and familiarity with the applicable regulations enables him to recognise potential hazards.
Anyone else must be kept away!
Declaration of Conformity (CE) The product meets the following security requirements of the European Council Directives:
- EMC Directive
- Low Voltage Directive
1.2 General Safety Instructions and Warnings
Intended application
The operating safety is only guaranteed if the delivered system is used as intended (see page 11). Incorrect use may result in danger to the operator, to the system and the connected equipment.
The thresholds listed in the technical data may not be exceeded under any circumstances.
Five safety rules
The five safety rules must always be followed when working with HV (High Voltage):
- De-energise
- Protect against re-energising
- Confirm absence of voltage
- Earth and short-circuit
- Cover up or bar-off neighbouring energised parts

Fire fighting in electrical installations
- According to regulations, carbon dioxide (CO 2 ) is required to be used as extinguishing agent for fighting fire in electrical installations.
- Carbon dioxide is electrically non conductive and does not leave residues. It is safe to be used in energized facilities as long as the minimum distances are maintained. A CO2 fire extinguisher must be always available within electrical installations.
- If, contrary to the regulations, any other extinguishing agent is used for fire fighting, this may lead to damage at the electrical installation. Megger disclaims any liability for consequential damage. Furthermore, when using a powder extinguisher near high-voltage installations, there is a danger that the operator of the fire extinguisher will get an electrical shock from a voltage arc-over (due to the powder dust created).
- It is essential to observe the safety instruction on the extinguishing agent.
• Applicable is DIN VDE 0132.
2 Technical Description
2.1 Abbreviations
In this manual the following abbreviations are used:
PD Partial Discharge
DAC Damped AC
VLF Very Low Frequency
PDIV Partial Discharge Inception Voltage
PDEV Partial Discharge Extinction Voltage
TDR Time Domain Reflectometry (or Time Domain Reflectometer)
MWT Monitored Withstand Test
VWD Voltage Withstand Diagnosis
AKV Ankoppelvierpol (Quadripole)
2.2 System Description
Functional description
The PDS 62-SIN is a partial discharge coupler that – in combination with a VLF sine wave test voltage source – allows for the identification, classification and location of PD faults in the insulation and the accessories of all kinds of medium voltage cables.
Thanks to its versatile measurement software, it is suitable for pure PD diagnostics with VLF sinusoidal voltage as well as for a PD measurement during standard cable tests. This enables the user to perform highly accurate partial discharge measurements directly during a commissioning test or regularly performed testing with a VLF sinusoidal voltage, resulting in significant time savings and improved efficiency.
System configuration
The PDS 62-SIN acts as link between the voltage source and the test object and is responsible for the decoupling and capturing of the measurement signals. It consists of the components for the signal decoupling (coupling capacitor, measuring impedance, measurement amplifier) and the PD detector that is responsible for the signal processing.
Both the control of the voltage source and the visualization and analysis of the measurement data are made through a notebook that is connected via a network interface. All operational actions that are required for measuring and locating partial discharges can be executed with the help of the preinstalled software. The analysis and management of the measurement data can be conducted either immediately after the measurement or later in the office.
![graph TD A["Test Voltage Source"] --> B["Coating Capacitor"] B --> C["Measuring Impedance"] C --> D["PD Detector for Amplifying, Filtering and Processing the Decoupled PD Signals"] E["Attachmentable HF filter"] --> F["Measurement data"] G["Controlled of the voltage source"] --> A H["Laptop with wave…](/content/2026/05/852529/images/26d57123fc78e8baf3cd9ed9f361c92f60e609ade7f3fdad993906df8a1e34fd.jpg)
Features The system offers the following features and functions:
- Intuitive control and analysis software, suitable for the universal use with different systems
• Quick and fully automatic calibration in one step
• PD mapping and statistical evaluation in real time
• Fully automatic report generation directly after a measurement possible - Cable database with individually adaptable segment templates
- Import of measurement data from other PD measurement systems, e.g. Oscillating Wave Test System (OWTS) (optional)
Scope of delivery The scope of delivery of the system normally comprises the following components (it may deviate significantly in the case of test van installations):
| QTY | Component | Description | Article number |
| 1 | Partial discharge measurement system PDS 62-SIN | 1014867 | |
| 1 | Accessory bag 892480883 | ||
| 1 | Software license | 3 dongles included | 90011937 |
| 1 | Notebook | With pre-installed software and case | language-dependent |
| 1 | PD calibrator CAL1 | Conformity: IEC 60270PD range: 100 pC ... 100 nCPower supply: 9-volt battery | 2008807 |
| 1 | Attachable filter | HF filter | 2009631 |
| 1 | Power supply | 2009828 | |
| 1 | Mains supply line | region-dependent | |
| 1 | HV connection cable | 1.5 m | 138316094 |
| 1 | Operational earth connection cable | 1,6 m | 138316443 |
| 1 | HV alligator clip | Red | 810001055 |
| 1 | Short-circuit line | 0,5 m | 138316442 |
| 2 | Network cable | 890020825 (5 m)890023636 (3 m) | |
| 1 | USB-to-Ethernet-adapter | For notebooks with only one network socket | 90023850 |
| 1 | Manual | 85958 | |
Check contents Check the contents of the package for completeness and visible damage right after receipt. In the case of visible damage, the device must under no circumstances be taken into operation. If something is missing or damaged, please contact your local sales representative.
Optional accessories
Should the following optional accessories not be part of the scope of delivery, these can be ordered from sales:
| Accessory | Description | Article number |
| Software license for OWTS import | Enables the optional OWTS data import function | 2006507 (1 Dongle)2006509 (2 Dongles) |
| Longer HV connection cable | 3 m, 5 m, 10 m oder 15 m | 2005655 (3 m)890010915 (5 m)890023555 (10 m)890015603 (15 m) |
| Diagnostic connection set | Accessory set for a PD-free connection to the test object | 890017909 |
| Cleaning kit 890010922 | ||
| Transport case 90023948 | ||
| Longer network cable | 50 m on cable drum 820023868 | |
| TE PA-MC-UNI | PD-free connection adapter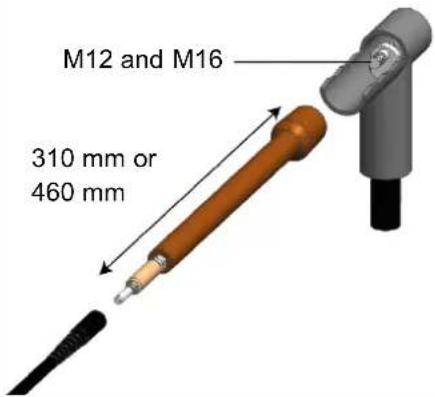 | 1013564 (460 mm)1013563 (310 mm) |
Suitable test voltage sources
In principle any Megger test voltage source with VLF sine wave output voltage is suitable to be the voltage source for the PDS 62-SIN.
If you have a VLF sine wave test voltage source from a different manufacturer, please contact the sales representative responsible for you to determine whether it can be used together with the PDS 62-SIN.
2.3 Technical Data
The partial discharge coupler and the included PD detector are specified by the following parameters 1 :
| Parameter Value | |
| Voltage range max. 62 kV | PEAK |
| Voltage waveform | VLF sine wave voltage |
| Frequency range | 0.01 Hz ... 0.1 Hz |
| PD measuring range | 2 pC .... >100 nC |
| System noise level <2 pC | |
| PD pulse repetition rate for charge evaluation | 100 kHz |
| Charge evaluation | according to IEC60270 |
| PD localisation | |
| • Range | 0 ... 16,000 m / v/2 = 80 m/μs |
| • Minimum cable length | 75 m |
| • Propagation velocity v/2 | 50 ... 120 m/μs |
| • Sample rate | 125 MHz (8 ns) |
| • Bandwith | 3 / 20 MHz (switchable) |
| • Accuracy | 1% of cable length |
| • Resolution | ±1 pC / ±1 m |
| Filterung | Attachable HF milter(max. permissible current 1 A) |
| Power supply | via supplied power supply with input voltage range 90 ... 264 VAC, 50/60 Hz |
| Weight | 16 kg |
| Dimensions (W x D x H) | 36 x 33 x 64 cm |
| Operating temperature | -20 °C ... 55 °C |
| Storage temperature | -40 °C ... 70°C |
| Relative humidity2 | 93% bei 30 °C (non-condensing) |
2.5 Technical Background
What is Partial Discharge and why test for it?
To be informed about the condition and residual life of their resources is increasingly important for network operators in order to be able to plan and optimise the investment and maintenance measures.
By the use of condition-based maintenance of medium voltage cable networks with the help of cable diagnosis and cable tests, it is possible to considerably reduce the costs for maintenance and renewal of the networks. Unnecessary repairs or renewals can be avoided and life expectancy can be maximized.
Moreover, the PD diagnosis also is an ideal method to verify the installation and assembly quality of a cable before commissioning.
The recognition, evaluation and location of PD faults has thereby been established as one of the most efficient and significant diagnostic methods. Partial Discharge activity is a localised electrical breakdown between two electrodes that does not completely bridge the gap between them. PD activity is an indication of incipient faults in the insulation and is widely regarded as one of the best indicators of potential weak spots in the accessories and insulation of medium and high voltage cables.
Inside cables, PD defects are generally ionisable, gas-filled voids, which were either developed during the production of the insulation or caused by one of the following events:
- Mechanical damage
- Incorrect installation of joints or terminations
- Thermal degradation processes inside joints due to improper conductor connections
Field of application
In principle, the system is designed for all kinds of medium voltage cables as long as the constructional requirements for the PD free connection of the test system are fulfilled. Depending on the test voltage source that is used, medium voltage cables with a rated voltage Uo/U of up to 25/45 kV can be diagnosed conforming to standards.
The measurable cable lengths strongly depend on the cable type as well as on the amount and the design of the joints. Faulty joints, joints of inferior quality and humid cable sections can lead to heavily attenuated propagation of the PD pulses which then can only be detected badly or not at all.
Experience has shown that for new XLPE cables with the necessary minimum of high quality joints, cable lengths of 5 to 6 km are measurable without any problems (in particular cases also longer lengths) if the measurement can be conducted from both cable ends.
In paper-insulated cables, the PD pulses are attenuated considerably stronger, so that the maximum length is 2 to 3 km. If the cable is humid or has many joints (in particular transition joints), very often only notably smaller lengths are measurable.
In locations where high interference voltages may obscure the measurement signal (e.g. in transformer stations), smaller PD levels are harder to identify. In these cases, a preferably short and direct earthing of the measurement system at the screen of the test object should be ensured.
How can PD be measured and located?
In order to measure partial discharges, the test object is applied with the required voltage. The generated high-frequency PD signals are decoupled by means of a special AKV.
By gradually raising the voltage it is possible to detect at which voltage the PD ignites (PDIV) and how the PD level changes with increasing voltage. Conclusions regarding the type of PD fault can be drawn from the phase angle of the test voltage at the moment of the PD event. In a similar way, also the extinction voltage (PDEV) of an already activated PD can be determined during the decay of the DAC voltage.
The fact that generated high-frequency pulses in cables propagate in both directions is used to locate PD faults. During the measurement process, the measurement system records the incoming signals and, thanks to appropriate algorithms and filters, is able to identify both the directly incoming PD pulses and the respective reflections.

The position of the PD fault can then be calculated from the time difference between pulse and reflection and from the known or in the previous calibration determined pulse propagation velocity.
2.6 Connection Elements and Status LEDs
The coupling unit has the following and connection elements and status LEDs:

| Element | Description | ||
| 1 | HV input (from test voltage source) | ||
| 2 | Mains socket | ||
| 3 | Protective earth connection | ||
| 4 | Network socket for communication with control notebook | ||
| 5 | Status LEDs indicating the following states: | ||
| Left LED Right LED | |||
| Green | Measurement underway | Software and PD detector connected | |
| Orange | Measurement stopped and not yet restarted | Software and PD detector are connecting | |
| Red | System error (see page 81) | ||
| 6 | HV output (to the test object) | ||
| 7 | Connection point for operational earth connection with test object | ||
| 8 | Connection point for operational earth connection with test voltage source | ||
| 9 | Eyelet for hooking the discharge rod | ||
3 Commissioning

General safety instructions for set-up and commissioning
- The safety guidelines for the operation of mobile testing systems often differ from one network operator to another and are frequently subject to national regulations (such as the German BGI 5191). Before the measurement session, find out what the applicable guidelines are and follow the rules set out therein precisely, in respect of the organisation of work and the commissioning of the mobile test system.
- Select a location which is sufficient for the weight and size of the system and ensures that it stands securely. The surface must be firm and level.
- When setting up or connecting the system, make sure that it does not impair the functional capability of any other systems or components. If other systems and components have to be modified, be sure to reverse these measures once the work has been completed. Always take the special requirements of these systems and components into account and only carry out work on them after consulting and obtaining approval from whoever is in charge of them.
- In the event of larger differences in temperature between the storage and installation locations (cold to warm) condensation may form on components carrying high voltage (condensation effect). To avoid any risk of damage to people and devices caused by voltage arcovers, the device must not be operated when in this condition. It should instead be left in the new environment for roughly one hour to acclimatise before it is then put into operation.
3.1 Electrical Connection

Safety instructions regarding the electrical connection
- The system may only be connected to de-energised equipment. The general safety instructions and, in particular, the five safety rules (see page 9) must always be followed prior to connection to the test object.
- Follow the specified connection sequence.
- All cables which are out of operation and not needed for the test must be shorted and earthed.
- Because the voltage applied to the device under test can exhibit values that represent a shock hazard, all cable ends must be shielded in accordance with DIN EN 50191 (VDE 0104) to prevent contact. Make sure that all cable branches are taken into account.
3.1.1 Electrical Connection in Combination with a Stand-Alone Test Voltage Source
Connection diagram
The following picture shows the electrical connection with a test voltage source suitable for direct connection (e.g. TDM45-P) dar:
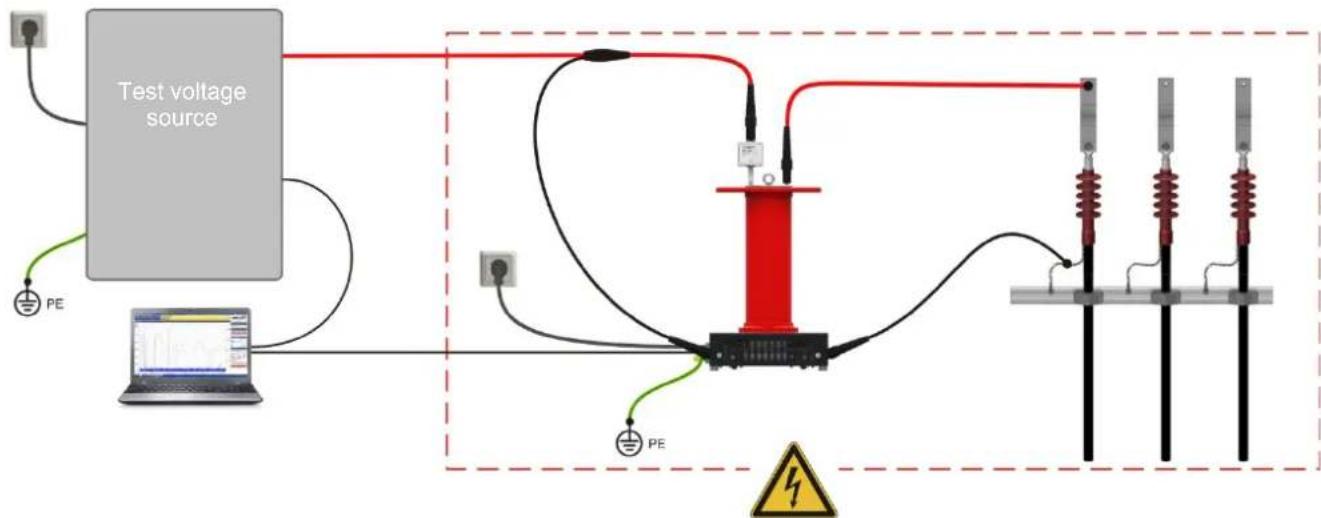
Prohibition zone and test area acc. to DIN EN 50191 (VDE 0104)
For test voltage sources without outer shield connection (e.g. VLF Sinus 62), the entire course of the HV connection cable is to be regarded as a prohibited zone as shown in the following figure:
![graph TD A["Test voltage source"] --> B["PE"] B --> C["Ground"] D["Laptop"] --> E["Ground"] E --> F["Electrical insulator"] F --> G["PE"] G --> H["Ground"] H --> I["Electrical insulator"] I --> J["PE"] J --> K["Ground"] style A fill:#f9f,stroke:#333 style D fill:#ccf,stroke:#333 style E fill:#cfc,st…](/content/2026/05/852529/images/15ab605652114c10cba83779fd0ed42237efe8f3f2eb75650d4c455224093679.jpg)
Prohibition zone and test area acc. to DIN EN 50191 (VDE 0104)
The measurement system including the unshielded connection cables are to be considered as live parts during the whole measurement. Dimensioning of prohibition zone and test area is to be carried out in accordance to DIN EN 50191 (VDE 0104).
Procedure Please perform the following steps for the electrical connection:
| Step | Action |
| 1 | Earth the test voltage source and, if necessary, plug the corresponding HV connection cable into the HV output on its backside. |
| For detailed information regarding the electrical connection of the test voltage source, please read the corresponding manual. | |
| 2 | Connect the protective earth connection 3 the coupling unit with Station earth or other suitable foundation earth electrode. |
| 3 | Plug the HF filter on the HV input 6 the coupling unit.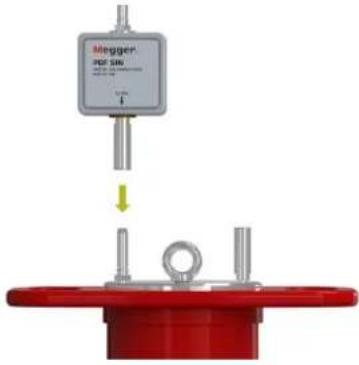 |
| 4 | Connect the inner conductor of the HV connection cable that comes from the test voltage source to the top of the HF filter. |
| 5 | Connect the shield of the HV connection cable coming from the test voltage source to the operational earth connection point 8.When using a test voltage source without outer shield connection, this step is omitted. |
| 6 | Make a connection between the operational earth connection point 7 the shield of the cable that is to be tested by means of the supplied connection cable. |
| The connection should be made directly at the cable shield and as close as possible to the point where the shield is fed out of the termination. This way, unnecessary high basic interference levels can be avoided. | |
| 7 | Connect the HV output6of the coupling unit with the phase conductor of the cable that is to be tested by means of the supplied HV connection cable. |
 In order to ensure a PD-free connection, keep sufficient distance between the earthed parts of the system and the cable. If possible, use the connection adapters and field control electrodes from the diagnostic connection set (see page 13) which is available as special accessory. In order to ensure a PD-free connection, keep sufficient distance between the earthed parts of the system and the cable. If possible, use the connection adapters and field control electrodes from the diagnostic connection set (see page 13) which is available as special accessory. | |
| 8 | Connect a notebook with latest version of the measurement software to the network socketthe coupling unit by means of the supplied network cable. |
| 9 | Connect the notebook also to the test voltage source using a network cable. Use the included USB to Ethernet adapter.If you are using a non-remotely controlled test voltage source with VLF sine wave output voltage, you don't need this connection, but need to make the voltage setting and enable the voltage directly at the source. |
| 10 | Connect the power supply socket2of the coupler with mains voltage (90 ... 264 VAC, 50/60 Hz) via the included power supply unit. |
3.2 Switching On
Switching on the test voltage source
After the electrical connection has been made as described, the test voltage source or the test van equipped with the test voltage source can be put into operation.

For more details about commissioning and operating the test voltage source / the test van, please read the accompanying instructions.
Switching on the notebook / starting the software
The partial discharge measurement software runs either directly on the central control unit of the test van or on a provided notebook. While the software opens automatically on the control unit once a corresponding operating mode has been activated, it needs to be started manually on the notebook. Proceed as follows:
| Step | Action |
| 1 | Switch on the notebook. |
| 2 | Plug the supplied dongle into a USB port of the notebook. |
| 3 | Start the measurement software by double-clicking the desktop icon. |
4 Basic Operation of the Software
4.1 Start Screen
After the PD measurement software has been opened, the main menu appears which enables the user to call up the individual modules of the software:
Main menu of the PC software

Main menu of the test van software

The following modules are available:
| Module | Description |
 | Measurement task (see page 25)Creating a new measurement task |
 | Calibration (see page 27)Calibrating the partial discharge test circuit |
 | Measurement (see page 32)Parameterisation and conducting of the PD measurement |
 | Report (see page 46)Evaluating the measurement data and creating a report |
 | Cable manager (see page 63)Administrating measurement and cable data sets |
 | Settings (see page 56)Adjusting the software settings |
4.2 Useful Features of the Software
Search and sort functions
In order to make the search in extensive lists (e.g. cable lists) easier there is always a search form near the list in which any character string can be entered. While entering, the list is immediately filtered by entries that contain this character string.

In order to cancel the filtering, either the character string needs to be deleted or, if available, the button needs to be clicked.
When clicking on the title of a table column, the rows of the table are sorted according to the content of this column. Clicking again changes the direction of sorting. The column currently used for sorting is always indicated by a ▲ (orientation depending on direction of sorting).
Adapting the screen layout
Where the symbol appears, it indicates that the screen layout can be adjusted to the personal requirements depending on the situation. For this purpose, the symbol needs to be clicked and – with the mouse pressed – moved into the required position.
![graph TD A["Rectangular Block"] --> B["Arrow pointing to '圆圈圈'"] B --> C["Crossing Arrow"] C --> D["Rectangular Panel"] style A fill:#f9f,stroke:#333 style D fill:#bbf,stroke:#333](/content/2026/05/852529/images/0a24a125f886d9c43e858b479fcde5b82450e6305f0fbf50437382b97aa00e26.jpg)
Administration of favourites
To guarantee quick access to frequently used cable templates, these can be added to the favourites (★) list by clicking on the ☆ symbol, or be removed from the list (☆) by clicking again.
The ☆ symbol which appears above the templates list allows you to toggle between the full view and the favourites view at any time.
![Search Description Insulation V/2 [m/us] PE Cable PE 83 XLPE Cable XLPE 83 PILC Cable PILC 80 EPR Cable EPR 80 PVC Cable PVC 76 TestTyp XLPE 91 Search Description Insulation V/2 [m/us] XLPE Cable XLPE 83 EPR Cable EPR 80](/content/2026/05/852529/images/2d0a314c0d297df9139ba7b2ed95a65f5ef7e47a7abb181323edcee1ae7a582f.jpg)
Notifications
All notifications that are generated by the software or by the devices involved in the measurement appear in the display as an overlay for a few seconds.
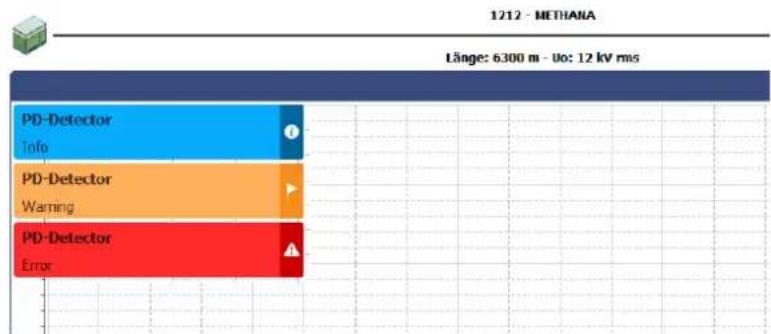
The messages are divided into the following classes:
| Class Description | |
 Info Info | Information about the status of the involved devices or necessary operational actions |
 Warning Warning | Messages about problems that occurred in the course of the measurement, which do require user action (see page 81). |
 Error Error | Problems (e.g. in the communication between the devices) that need to be resolved (see page 81) before continuing the measurement |
Warnings and errors are automatically stored in the notification list, which can be accessed using the menu item 📄 the top right of the screen or by clicking on one of the error messages.
5 Conducting Measurements
5.1 Starting or Resuming a Measurement Task -
Before starting the actual measurement, a measurement task must be created or opened in the first step, under which all recorded measurement data are stored until either the software is closed or a new measurement job is started.
You can either...
- continue a previous measurement task (see page 63) which had to be suspended due to lack of time or other reasons,
- clone a previous measurement task (see page 63), if e.g. a repeat measurement has to be performed on a cable already diagnosed (in this case the settings from the previous task are adopted and preset) or
- start a new measurement task.
When creating a new measurement task, proceed as follows:
| Step | Action |
| 1 | Call up the menu point from the main menu of the measurement software. |
Result: The following input mask opens. | |
| 2 | Enter the name of the responsible measurement technician into the input field Tester. |
| 3 | Select the appropriate entry from the list of the defined cable systems for the measurement task. If needed, use the search and sort functions (see page 23). Should the cable system not yet be stored in the system, it has to be created before the start of the measurement task (see page 63). |
| 4 | Select the cable end at which the current measurement is conducted under Measured at. |
| 5 | If required, select the used HV source from the HV source drop down list. The drop down list is only available if more than one HV source is configured in the software.If a suitable test voltage source from another manufacturer is used or if the source cannot be remote-controlled for other reasons, the option Manual controlled HV source is to be selected here. However, this option must have been activated (see page 56) beforehand in the software settings. |
| 6 | If required, select the version of the PD Detector in use from thePD Detector drop down list. The drop down list is only available if more than one PD detector is configured in the softwareInformation on the version of the PD Detector can be found on the type plate. |
| 7 | If required, enter a few useful details on the measurement task in theCommenttext field. |
| 8 | Click onApplyin order to confirm the selection. |
 Before starting a new measurement task, ensure that the measurement data recording has been completed for the measurement task currently in progress! Before starting a new measurement task, ensure that the measurement data recording has been completed for the measurement task currently in progress! | |
Result:The software jumps back to the start screen. The measurement task is initialised, and the cable allocated to the measurement task is displayed on top of the selection menu. | |
| 9 | Proceed with the calibration (see page 27). |
5.2 Calibrating the Partial Discharge Measuring Circuit -
Prerequisites
In order to be able to conduct a calibration, a new measurement task must have been started beforehand (see page 25). Otherwise the menu point 📁 in the start screen is greyed out.
It is recommended to use the supplied calibrator. In principle though, any other calibrator that is in accordance with the requirements of the IEC 60270 can be used.
Necessity
After the measurement system has been set up and connected to the test object, the partial discharge measuring circuit needs to be calibrated by measuring current pulses of known charge. Only this way, a reproducible measurement and a reliable evaluation on the basis of comparable measurement data can be ensured.
5.2.1 Connecting the Calibrator
Connection diagram The following picture shows the simplified connection diagram:

Procedure Proceed with the following steps to connect the calibrator:
| Step | Action |
| 1 | Connect the black connection line of the calibrator to the screen of the cable that is to be tested. |
| The connection should be made directly the cable screen and as close as possible to the point at which the screen is led out of the termination. That way an unnecessarily high base noise level can be avoided. | |
| 2 | Connect the red connection line of the calibrator to the phase conductor of the cable that is to be tested. |
| 3 | Switch the calibrator on by shortly pressing the button.With the help of the ▲ and ▼ button the calibration pulse level can be adapted if required. In most cases, however, the calibration can be completed successfully with the preset calibration value of 1 nC. |
| Step Action | |
| 4 Cancel the earthing and short circuiting measures on both ends of the cable that is to be tested. | |
| Since the supplied calibrator automatically switches off approx. 10 minutes after the last operational action, the actual calibration should be conducted directly after connecting the calibrator. | |
5.2.2 Conducting the Calibration
Preparing and starting the calibration In order to calibrate the partial discharge measuring circuit proceed with the following steps:
| Step | Action |
| 1 | Call up the menu point from the main menu of the measurement software. |
| Result: The connection to the PD detector is being established (the HV source must be switched on). As soon as there is a connection, the Start button is activated (with a green border). Otherwise, the cause for the failed connection needs to be determined. | |
| 2 | Adjust the PD detector settings. Select from the dropdown menu Phase either the phase of the test object that is currently connected to the measuring system or the option All Phases. Select from the dropdown menu Phase either the phase of the test object that is currently connected to the measuring system or the option All Phases. |
| For 3-core cable systems it is generally sufficient to calibrate the circuit only once and apply the data for all phases. Only if you expect differences between the single phases you should calibrate each phase individually prior to the measurement. | |
| The optimum Bandwidth setting is determined by the length of the cable. While a high bandwidth is recommended for short cables (up to 1 km), measuring with a low bandwidth is preferable for longer cables with higher attenuation. |
Step Action
3 Adjust the calibration settings.
![Megger Calibration setup Length v/2 Length [m] 150 Charge 1 nC](/content/2026/05/852529/images/18e2eada4226b4e742aa81af3d3af18b36c641e7626e9f924baf2c9b1514a16b.jpg)
The value in the input field Length has been adopted automatically from the cable data and normally does not have to be corrected.
Should the length value be uncertain and the exact pulse propagation velocity be known, then the velocity needs to be provided instead. To do so, check the radio box v/2 and enter the v/2 of the cable into the input field v/2 (in m/μs).
Select the calibration value that is set at the calibrator from the dropdown list Charge.
4 Click the Start button in order to start measuring the pulses.
Result: The PD detector measures the incoming pulses and tries to identify the calibration pulses the respective reflections from the far cable end.
If the pulses are successfully measured, a TDR trace and a charge diagram are displayed in the left area of the window. The calibration process finishes automatically after roughly 15 to 30 seconds, it may also be stopped manually ahead of time using the Stop button, provided the pulses and charge level have been successfully calibrated and the markers placed.
If no pulses could be measured, the message Calibration failed appears in the message list. Check the troubleshooting section for possible causes (see page 81).
Checking the markers
The quality of the subsequent measurement results depends on various factors, particularly the accuracy of calibration. It is therefore advisable to check the automatic positioning of the markers and correct them if necessary before applying the calibration data.
The propagation velocity or the length of the connected cable can be calibrated by means of the TDR trace. For this purpose, the peaks of both the original calibration pulse and the reflection need to be marked.
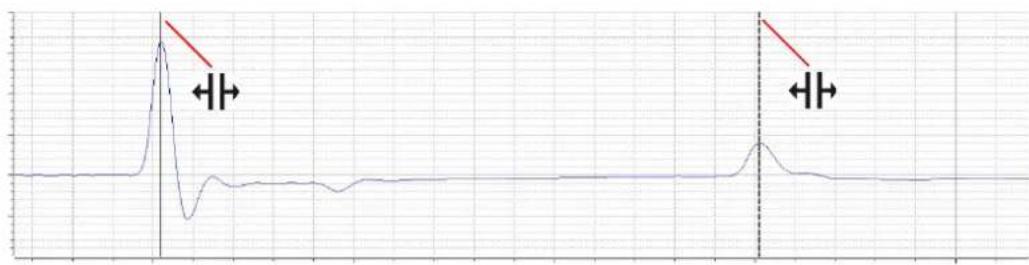
The Show distance cursor tickbox can be used to display an additional marker and move it along the curve. This allows, for example, the positions of joints to be measured and later entered manually into the cable plan.

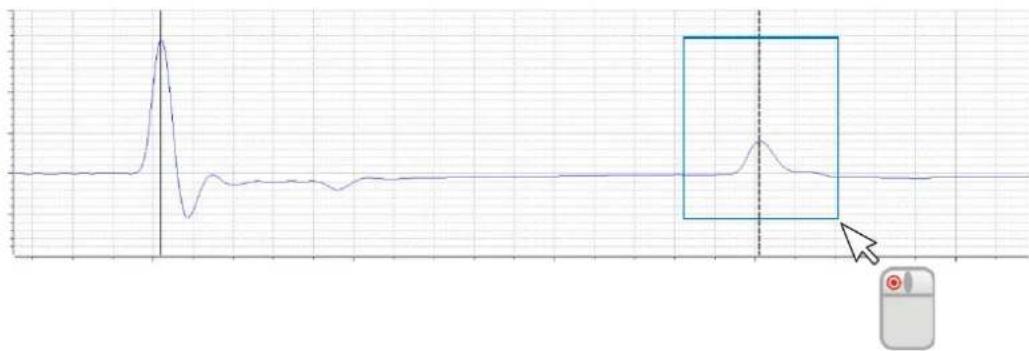
If need be, the mouse can be used to drag a box across a specific area, allowing the user to zoom into this range.
In the charge diagram, the line should mark roughly the average value of the periodically measured calibration pulses.
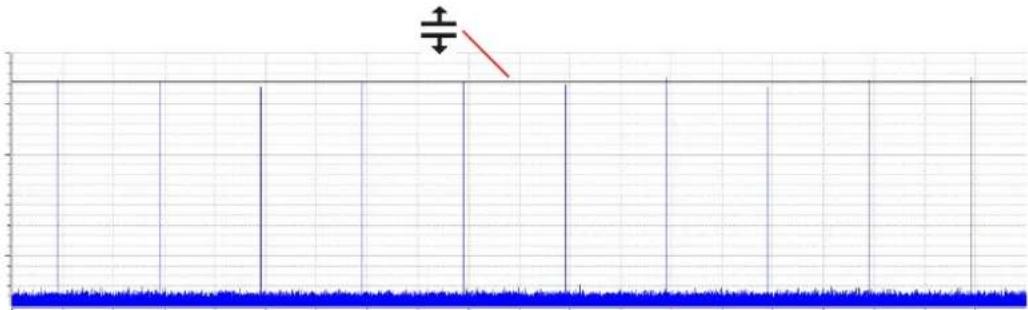
If a correction has to be made, the respective mark has to be clicked once with the left mouse button. As a result, the line width of the marker increases and the mouse pointer changes into the or / symbol. By clicking and holding the left mouse button again, the marker can be freely moved. As soon as the mouse button is released, the marker locks in the current position.
Applying the calibration data
After the markers have been checked and if required corrected, the calibration data can be applied by clicking on the Save Calibration button.
5.2.3 Disconnecting the Calibrator
Prior to the actual measurement, the calibrator has to be disconnected from the cable under test.

Follow the five safety rules (see page 9) before disconnecting the calibrator.
Afterwards, cancel the earthing and short circuiting measures on both ends of the cable that is to be tested. in order to be ready for the measurement.
5.3 Measuring -

Prerequisites
In order to conduct the measurement, a new measurement task must have been started (see page 25) beforehand and the partial discharge measuring circuit must have been calibrated (see page 27). Otherwise the menu point 📋 is greyed out in the start screen.
5.3.1 Basic Information Regarding the Measurement Screen
Measurement data display
In the course of the measurement all relevant measurement data / measurement parameters are displayed at the top left screen:

Depending on the set test parameters, a selection of the following values is displayed:
| Measurement value | Description |
| Max. Charge | Maximum charge value that has been measured during the last period |
| Test Voltage | Test voltage as peak value |
| Frequency | Frequency of the VLF polarity reversal |
| Remaining time | Remaining duration of the ongoing VLF test |
Cable plan
At the top side of the screen all relevant data regarding the currently connected cable are displayed.
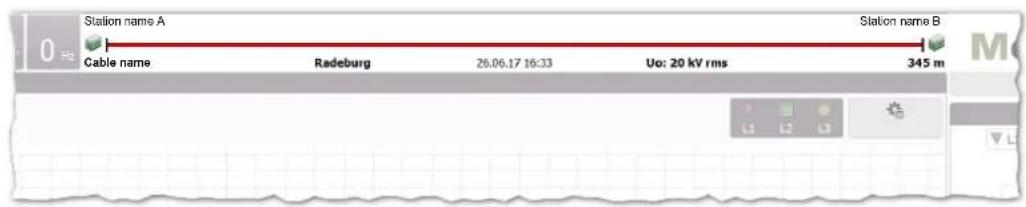
The cable end to which the measurement system is connected is shown on the left side.
5.3.2 Available diagram types
Introduction The measurement screen provides access to various diagrams during the measurement.

In the upper part of the screen, PD mapping with the previously recorded PD events is displayed by default. The diagram type directly below can be changed using the tabs at the bottom.

Using the ■■■ buttons between the diagrams, the proportions of the displayed diagrams can be adapted (see page 23) according to the own preferences.
PD mapping The PD mapping displays the measured partial discharge level in a location-resolved way over the length of the cable.
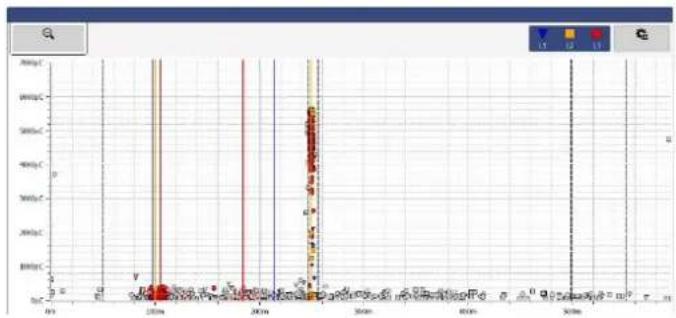
A localised cluster of PD events indicates actual PD faults. These events are shown with the colour and symbol of the respective phase. One-off events, which are most likely not the result of a PD fault, are shown in grey (or not displayed at all depending on the setting).
PD mapping displays the PD events of all measurements performed and saved during the measurement job. If a measurement is intentionally not saved, the corresponding events are removed from the PD mapping at the start of the next measurement.
Using the Advanced menu item, you can display the advanced view filters and the pulses in the PD mapping can be filtered as you wish to provide a better overview:

The following buttons are available for this purpose:
| Button Description | |
 | Filter view according to phase. |
| Classification | Show/hide pulses that were not identified (or not definitely identified) as PD. All pulses classified aspossible partial discharges(pale colours) are shown or hidden, respectively.[HC4H] All pulses classified asnegligible(grey) are shown or hidden, respectively.[VX2T] Pulses for which no reflection could be determined.These pulses are placed at the beginning of the cable by default. All pulses classified aspossible partial discharges(pale colours) are shown or hidden, respectively.[HC4H] All pulses classified asnegligible(grey) are shown or hidden, respectively.[VX2T] Pulses for which no reflection could be determined.These pulses are placed at the beginning of the cable by default. |
| View | With the aid of these checkboxes, the individual auxiliary indicators (joint markers, cluster markers, cable plan) can be shown or hidden respectively. |
In order to enlarge a certain area of the PD mapping, simply draw a frame around the area while holding the mouse button.
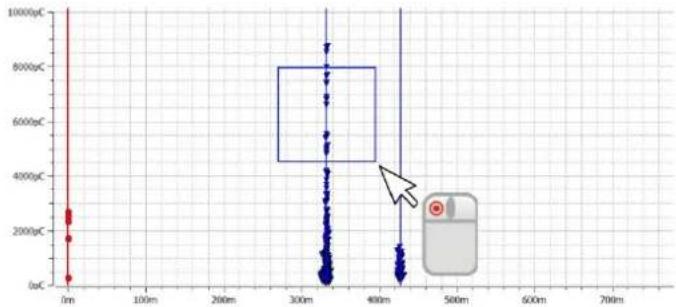
Clicking ⬤ removes the magnification.
Q(t)/U(t) The Q(t)/U(t) view displays the temporal profile of the measured charge level (the partial discharge pattern) and the excitation voltage.
This type of diagram is particularly suited to detecting partial discharge events and distinguishing them from periodic interference.
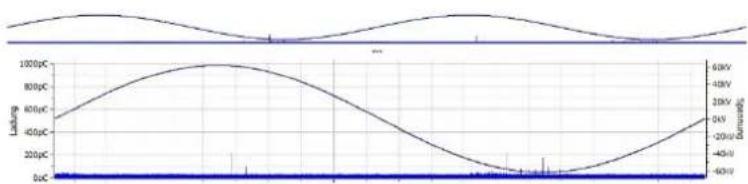
The overview diagram can be shown or hidden using the checkbox Show overview.
Localisation
Once a PD event is recorded during a measurement, the software automatically switches to the Localisation view, in which the associated reflection image (TDR image) is shown. The TDR image is updated accordingly whenever another PD event is detected.
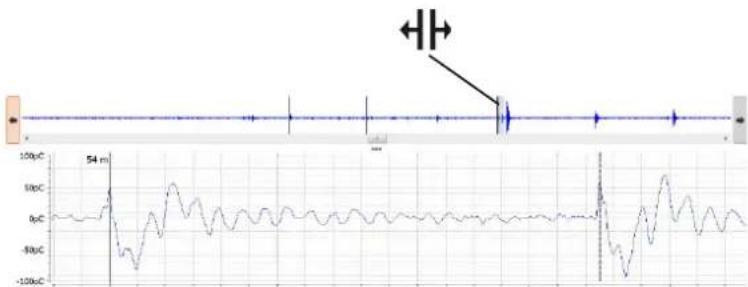
In the upper section of the display, the overview of the recorded measured data is shown. In it, all pulses identified as locatable PD events are marked with black lines. Using the ← and → buttons it is possible to switch back and forth between these positions. In the actual diagram, the associated curve is displayed. The displayed time range corresponds to about four times the cable length.
With the scrollbar, depending on the voltage waveform, you can switch back and forth between the recorded measurement windows (the individual shots for DAC, the polarity reversals for VLF-CR or the triggered PD pulses for VLF-SIN).
The checkbox Switch to this view on any new event can be used to determine whether the software automatically switches to the localisation diagram with each recorded PD event.
VWD diagram
The diagram, which can be called up via the VWD tab, shows the trend of the measured maximum charge levels over the course of the measurement. This makes it possible to draw conclusions about a possible change / conditioning of PD faults, in particular if the cable under test is subjected to prolonged voltage stress.

Phase-resolved diagram
Using the PRPD tab, the PRPD diagram (Phase Resolved Partial Discharge) can be displayed, showing the distribution of the charge pulses relative to the phasing of the excitation voltage.
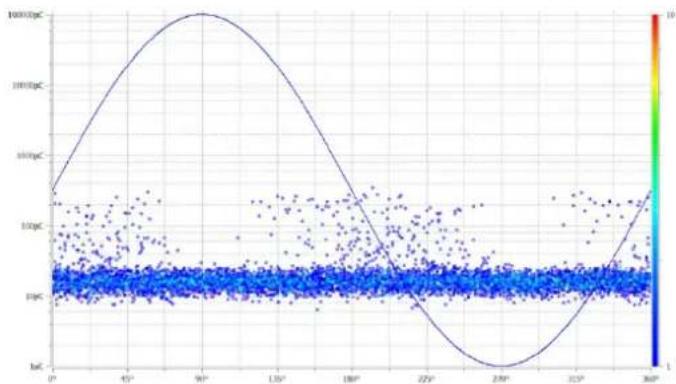
5.3.3 Setting the Measurement Parameters
Configuring the PD detector The configuration of the PD detector must be performed through the menu block specially provided for this purpose:
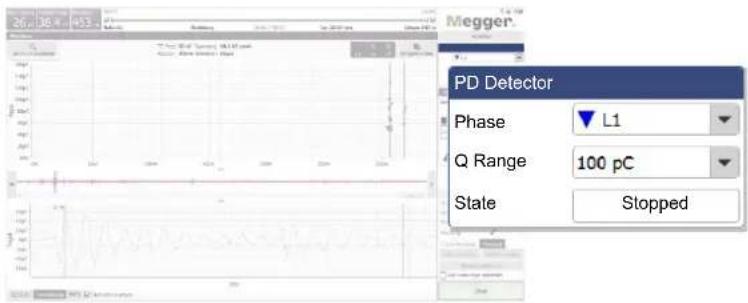
The following settings are possible:
| Parameter Description | |
| Phase | Phase of the cable system currently being measured. |
| Q range | An optimally set measuring range is critical for ensuring the accuracy of the measured charge values. Before beginning the first measurement, a relatively low measuring range should initially be selected.If the PD level exceeds the set measuring range during the measurement, the messageOverflowappears in the message list (see page 24). In this case, the measuring range should be increased incrementally and further test measurements performed until the message no longer appears. Each further increase would unnecessarily reduce the sensitivity. |
| Localisation level | Only configurable in the VLF sine wave operating modesThe localisation threshold identifies the charge threshold at which localisation data (TDR traces) for the measured charge pulses are recorded and saved.Due to the permanent measurement data acquisition in sine wave mode, depending on the duration of the test, a large amount of data to be stored may be generated. To prevent too much data from being generated, in particular for long tests, the localisation level should be set so that a localisation is only triggered and saved using TDR starting from a size that is of interest for the user. |
Configuring the test voltage source The configuration of the test voltage source must be performed through the menu block specially provided for this purpose:

The following settings are possible:
| Parameter | Description | |
| Operating mode | Selection of the desired operating mode:VLF Sinus PD diagnosis with VLF-SIN voltage and the possibility to adjust the test voltage while the measurement is running.VLF Sinus Standard-compliant monitored withstand test with Withstand VLF-SIN voltage and simultaneous measurement of the PD level. The duration of the measurement is specified in minutes and the voltage cannot be adjusted during the running measurement. | |
 | NOTICEDanger of damage to the partial discharge couplerEven if, depending on the connected source, other operating modes are offered, only the operating modes specified above may be used in combination with the partial discharge coupler! | |
| Test duration | Only configurable in test operating modesTest duration in minutes. | |
| Maximum required test voltage | Only configurable in diagnosis operating modesWhen it comes to the partial discharge diagnosis the initial measurements are usually conducted at very low voltage levels. However, in order to ensure from the start that the test voltage supply can charge the connected test object using the necessary maximum test voltage (usually 1.7Uo), this must be specified before starting the measurement. The test voltage supply will carry out a load detection right after the start of the measurement, taking into account the indicated maximum voltage, and will suspend the measurement with an error message if the capacity of the test object does not allow for such a high voltage. The test voltage supply will carry out a load detection right after the start of the measurement, taking into account the indicated maximum voltage, and will suspend the measurement with an error message if the capacity of the test object does not allow for such a high voltage. | |
| Voltage | Specification of the test voltage.The test voltage can be entered as peak value (kV peak), RMS value (kV rms) or multiple of Uo (x Uo).The actual test voltage (peak value) resulting from these settings is displayed at the bottom of the menu block. | |
If the test voltage source used cannot be controlled remotely (for example, in the case of devices from another manufacturer), the settings regarding the voltage level and duration must not be made in the software but instead directly at the test voltage source. If this was also specified accordingly when the measurement job was started, the following information is displayed in place of the control elements in the software:


NOTICE
Danger of damage to the partial discharge coupler
In order to avoid damage to the coupler and to obtain usable measuring results, a manually controlled source may only be used with sinusoidal VLF voltage, while also taking into account the maximum permissible voltage for the coupler!
5.3.4 Performing the Measurement
Starting the measurement
Directly from entering the measurement screen, the connection with all devices involved in the measurement is permanently checked. Deactivated buttons and the symbol indicate connection problems, which have to be solved before the test is started (see page 81).
Since a series of measurements should always be started with a disturbance level measurement ("zero shot"), the buttons to control the test voltage are not available when entering the measurement screen. They will, however, automatically show up as soon as the noise measurement has been conducted and saved or has manually been skipped by clicking on the Measurement tab (see next page).
As soon as the system is ready for measurement, the Start button lights up green and a single measurement can be started by clicking this button.
Releasing high voltage
If high voltage has not already been released during a previous measurement, it needs to be done right after a measurement (except of the noise measurement) has been started. Any deviations from the high voltage switching requirements are displayed in the Message list (see page 24) and the user must then eliminate them.

For more details about the high voltage switching requirements of the test voltage source, please read the accompanying operating manual.
If all high voltage switching requirements are met, the following symbol appears in the menu block:

Ten seconds remain in which to enable the high voltage using the green illuminated "HV ON" push-button. Normally, this button is located directly on the front plate of the testing system. For fixed components, the high voltage may need to be enabled through a button of equal priority on an external safety device or on the system control panel of the test van.
Directly after being activated, the button goes out and the red "HV OFF" push-button lights up. Load detection is performed automatically. If the capacitance of the connected cable is too high or too low, the measurement is ended directly and a corresponding error message (see page 81) is displayed.
If a non-remotely controllable test voltage source is used, the high-voltage release is not monitored by the software. The setting and release of the high voltage must be carried out by the user at the voltage source itself.

The red illuminated "HV OFF" push-button signals high voltage! The entire measuring circuit should be considered as "live" from this point onward.
In modes with VLF sine wave voltage, an automatic load detection is performed immediately after high voltage clearance. Should an adjustment of the test frequency be necessary due to a too high load capacity, this will be communicated by system message in the software.
Saving test data The saving of test data is initiated exclusively with the buttons of the menu block specially provided for this purpose.

By default, each completed individual measurement must be saved manually. Otherwise, the data are discarded when the next individual measurement is started! Certain defined parameters, such as PDIV and PDEV, are to be saved using specially dedicated buttons. These are accordingly labelled in the test data and output separately in the report. For this purpose, the following buttons are to be used:
| Button Description | |
| Save Disturbance level | This button must be clicked after the obligatory noise measurement ("zero shot") has been completed.Afterwards, the software automatically switches to the Measurement tab and by doing so activates the actual measurement mode. |
| Save measurement | Any meaningful measurement, with the exception of the noise, PDIV and PDEV measurements (which are saved through separate buttons), needs to be saved by clicking on this button. |
| Save all measurements | If this checkbox is checked, any completed individual measurement is automatically saved with no confirmation required. This increases the volume of test data, but also prevents the loss of relevant data due to negligence in saving.In order to save the PDIV or PDEV, the checkbox needs to be unchecked at least for this particular measurement. |
| Save PDIV | This button must be clicked if, during the previous measurement,initially critical PD of a defined strength were detected (PD inception).The voltage set prior to starting the measurement is saved as PDIV. |
| Set PDEV | This button for saving the PDEV should be clicked, if both the inceptionand the extinction of the PD can be clearly distinguished from the PDpattern of the previous measurement.Directly after clicking the button, the software automatically switches tothe Q(t)/U(t) view and places a marker on the last detectable PD pulse.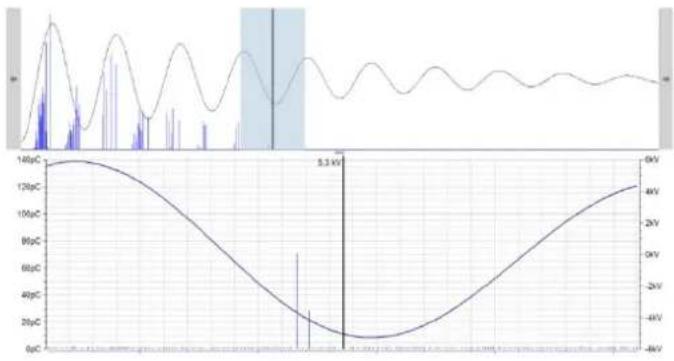 If further evident PD pulses can be identified to the right of the selectedpulse, the position of the marker needs to be manually corrected. Byclicking on the Save PDEV button, the positioning is concluded and themarked voltage value is saved as the PDEV. If further evident PD pulses can be identified to the right of the selectedpulse, the position of the marker needs to be manually corrected. Byclicking on the Save PDEV button, the positioning is concluded and themarked voltage value is saved as the PDEV. |
| Save VWD | If a meaningful VWD diagram has been recorded during ameasurement, the respective measurement should be saved byclicking this button.Basically, exactly the same information are saved as if the Savemeasurement button is clicked. The only difference is that the VWD diagram of this measurement is automatically included in the report(but can be manually removed, if required). |
Between the individual measurements, a summary of all data that has been saved as yet can be accessed by clicking on the :≡ button.

5.3.4.1 Typical Procedure for PD Diagnosis with VLF Voltage
Procedure
The following described procedure is a recommended, but by no means binding approach to PD diagnosis and can deviate from parts of the applicable company-internal guidelines or country-specific standards:
| Step | Action |
| 1 | Start the Disturbance level measurement to determine the disturbance level of the PD measuring circuit and save the result with the Save Disturbance level button. |
| 2 | Start the test at a low voltage level (e.g. 0.5Uo) in VLF Sinus mode. |
| 3 | While the test is running, increase the voltage in increments of 0.2Uo to 1.7Uo. |
| 4 | If PD activity sets in during the increase in voltage, stop the test immediately and save the voltage level as PDIV with the Save PDIV button.The test should be paused at selected voltage levels (in particular at Uo) in order to save the respective data with the Save Measurement button. |
| 5 | Resume the test with the Start button and increase the voltage to 1.7Uo. |
| 6 | Finish the test after some voltage periods at 1.7Uo. Save, save the measurement data with the Save Measurement button. |
| 7 In | the event that PD activity was detected during the previous measurements, the extinction voltage should also be determined in the course of a further measurement.Start the measurement at a high voltage level with PD activity (for example, 1.7Uo) and slowly reduce the voltage during the measurement until the partial discharges cease.Stop the measurement at this voltage level, click on the Set PDEV button, mark the last pulse in the diagram (see page 42) and save the measurement using the Save PDEV button. |
5.3.4.2 Typical Procedure for Monitored Withstand Testing
Proceed as follows to perform a withstand test:
| Step | Action | ||
| 1 | Start the Disturbance level measurement to determine the disturbance level of the PD measuring circuit and save the result with the Save Disturbance level button. | ||
| 2 | Switch to VLF Sinus Withstand operating mode and set the voltage and duration of the test.The requirements for a meaningful cable test are found in the harmonisation documents HD 620 S1 and HD 621 S1 and often in company-internal testing guidelines as well. These documents recommend, depending on the type of test, the following settings: | ||
| Application Test voltage | Test duration in minutes | ||
| Start-up test | 3Uo | 15 to 60 | |
| Testing of aged cables | 1.7 to 3Uo | 60 | |
| iIt is recommended to set the Q range parameter to 1 nC or 10 nC to make sure that the test must not be interrupted due to overflow. | |||
| 3 | Start the test with the Start button. | ||
| Result:The standard-compliant test starts and the test parameters can no longer be modified. Parallel to testing, the partial discharges are measured.In the case of a breakdown, the test is immediately aborted and the test voltage source is earthed. | |||
| 4 | After the test is concluded, save the results with the Save Measurement button. | ||
5.3.5 Stopping / Finishing a Measurement
Stopping a measurement
Each measurement is always ended automatically after the specified test cycles have run. In this case, the system lingers in the operating state of "Ready for switching on" after the measurement, which is indicated by the red illuminated "HV-OFF" button. Additional measurements can be started directly without renewed enabling of the high voltage.
A measurement in progress can be interrupted both through the software (Stop and HV OFF buttons) as well as through the available switching elements ("HV OFF" push-button, EMERGENCY OFF switch, key switch). In the event of such a manual interruption, the high voltage is always immediately deactivated and the high voltage output of the test voltage source discharged. This also occurs if the HV OFF button is clicked after conclusion of a measurement.
Switching off high voltage
If no further measurements need to be conducted at this phase, HV switch-off and discharging is to be initiated by pressing the "HV OFF" push-button or clicking on the HV OFF button.
For test voltage sources that cannot be remotely controlled by the software, the high voltage must be manually deactivated after completion of the measurement.
After high voltage has been switched off, the following safety measures must be taken:
- Earth and short-circuit the cable under test in accordance to the five safety rules (see page 9).
- The system components that were under voltage should only be touched once they have been earthed and short-circuited using a suitable earthing device. This applies in particular for the PDS 62-SIN itself!
Resuming a measurement job at another phase
After the measurement has been completed at the current phase and the high voltage has been switched off, the measurement job can be resumed at another phase of the same cable system. The electrical connection (see page 18) has to be adopted accordingly.
If no differences between the individual phases are expected, the measurement can be directly continued at the new phase with the existing calibration data. Otherwise, a new calibration of the PD measuring circuit should be performed (see page 27).

It is essential to adapt the phase selection before starting the measurement/calibration in order to avoid unintentional falsifying of existing measurements.
Finishing the measurement
After the measurement has been completed at all phases to be tested, the measurement screen can be closed with the Exit button.
When disconnecting the test system, proceed in reverse sequence to the manner in which the connection was made (see page 18). Directly after the reduction, the short-circuit line / short-circuit device must be installed (see page 79).
The evaluation of the test results and the creation of a report (see page 46) can be done either directly afterwards or at a later time (see page 64).
6 Evaluating Measurement Results and Creating a Report
Opening the evaluation screen
If the evaluation of the measurement results will be performed directly after the measurement, you can directly call up the menu item 📋 in the start screen.
However, if the software was closed in the meantime, the data of the measurement job being evaluated must first be loaded (see page 64) into memory before you can call up the menu item.
PD mapping
The already familiar PD mapping from the measurement screen (see page 35) forms the central element of the analysis screen. It provides the user with a location-resolved overview of the partial discharges identified by the PD evaluation algorithm.

To generate the PD mapping, the software applies suitable algorithms and filters while the measurement is in progress for an automated analysis of the measured charge pulses. In doing so, it not only considers the level, but also other characteristics of the pulse, such as the phasing and edges. In the evaluation results, the majority of interference has largely already been identified and thrown out.
Based on the time difference between the arrival of the actual pulse and its reflection from the cable end, the remaining pulse can then be correlated (see page 16) with a concrete position along the cable to a very high degree of accuracy. The now spatially resolved imaging is examined for localised clusters of PD events and colour-coded as follows:
| Colour Description | |
| Saturated colors | Pulses which were classified as a partial discharge.The clustering of PD pulses at this position points to a PD fault. These positions are additionally labelled in the PD mapping with a coloured marker matching the respective phase. |
| Pale colours | Pulses which were classified as a possible partial discharge.These pulses occur either at positions with a smaller pulse cluster or near larger clusters. Partial discharge cannot be excluded as the cause. |
| Grey | Pulses which were classified as negligible and are with considerable certainty not caused by a PD fault. |
View filter Using the Advanced menu item, you can display the advanced view filters and the pulses in the PD mapping can be filtered as you wish to provide a better overview:
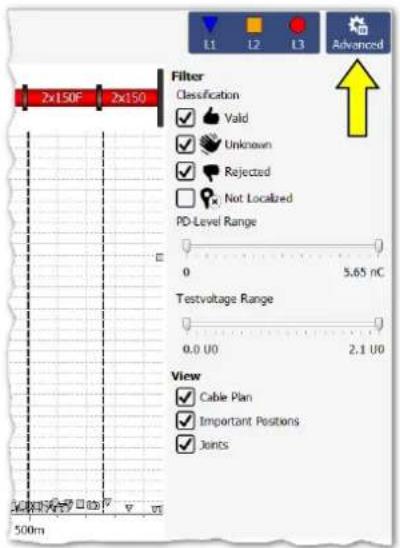
For this, the following buttons are available:
| Button Description | |
| Filter view according to phase. | |
| Classification | Show/hide pulses that were not identified (or not definitely identified) as PD.All pulses classified aspossible partial discharges(pale colours) are shown or hidden, respectively.All pulses classified asnegligible(grey) are shown or hidden, respectively.Pulses for which no reflection could be determined. These pulses are placed at the beginning of the cable by default. |
| Test voltage Range | With the aid of voltage limiting, the display can be restricted to the pulses that appear in a particular voltage range. |
| PD-Level Range | With the aid of charge limiting, the display can be restricted to the pulses that appear in a particular charge range. |
| View | With the aid of these checkboxes, the individual auxiliary indicators (joint markers, cluster markers, cable plan) can be shown or hidden respectively. |

The settings made with the aid of the functions described above have no effect on the PD pulses displayed in the report.
6.1 Manual Evaluation of Partial Discharges
Necessity
Generally, the automatic detection and location of partial discharges by the PD evaluation algorithm is very accurate. In most cases, a time-consuming post-processing of the measurement data is not needed and the report can be directly created (see page 53).
However, if there are reasonable doubts as to the position or "realness" of identified PD faults, the functions described in this section enable experienced users to manually analyze and correct the localization data.
6.1.1 Determining Possible Sources of PD Faults
Cable plan
If it has not been manually deactivated via the view filter, the layout of the diagnosed cable is displayed, true-to-scale and with the correct orientation, over the PD mapping.

Phase-resolved diagram
This view is ideally suited to identify any relations between the diagnosed PD faults certain characteristics (e.g. insulation types, joints) of the cable. A slight offset between the position of the accessory and the PD fault can often be attributed to an inaccurate cable plan or signal propagation velocity.
Using the PRPD tab at the bottom of the screen, the PRPD diagrams (Phase Resolved Partial Discharge) can be displayed under the PD mapping.

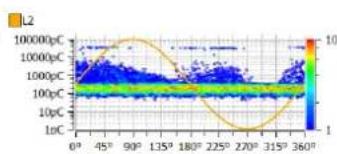


Using these diagrams, which display the distribution of charge pulses relative to the phasing, it is often possible to develop sound information about the characteristics and cause of a PD fault. The significance of the representation, however, depends greatly on the quantity of the recorded data.
To improve readability, phases can be shown or hidden as needed using the view filter. In addition, the quantity of the PD events used for the diagram can also be restricted (see next page).
6.1.2 Analysing Individual PD Events
Selecting a PD event
Each measured and automatically (via the software) classified pulse can be manually evaluated by the user and given a different classification, if necessary. In order to carry out a manual evaluation, the pulse must first be selected with a left mouse click.

The selection box on the top left of the PD mapping determines whether dragging a frame zooms in the marked area or selects the PD events within the marked area.

The zoom function makes it easier to find and click on pulses in areas of dense accumulations. By clicking on the button, the zoom can be canceled at any time.
After a number of PD events has been selected using the select function, only these events are considered for the phase-resolved diagram (PRPD).
Manual analysis
Directly after a PD event has been selected, it can be analysed more precisely using the diagrams available under the PD mapping and can be classified differently if necessary.
The Localisation tab can for example be used to call up the TDR image, which shows both the directly incoming pulse and its reflection at the far end of the cable.

The calibration pulse, shown in parallel with the PD pulse, serves particularly in uncovering system-inherent reflections (e.g. an impedance jump between high voltage connection cable and test object). It can be regarded as an undistorted reference pulse which was injected at the beginning of the cable and was not subjected to appreciable damping or dispersion. If, in comparison, the original PD pulse is visibly widened or damped, the PD certainly originates from within the cable. The calibration curve can be shown / hidden via the Show Calibration Curve checkbox.
For particularly experienced users, the software offers the option of checking the markings for the original pulse and its reflection which were automatically placed according to the algorithms so that corrections, if necessary, can be made. Should this be the case, the marker in question must be clicked briefly once with the left mouse button. The line thickness of the marker is thereby increased and the symbol is displayed instead of the mouse pointer. By clicking again and holding the mouse button depressed, you can now freely drag the marker along the X-axis. When you release the mouse button, the marker becomes fixed in the current position.
Furthermore, the time segment of exciter voltage during which the PD pulse was measured can be viewed under the Q(t)/U(t) tab.

Manual classification
If a more detailed analysis of PD events reveals doubts about the automatically performed classification and it needs to be corrected manually, an additional toolbar can be displayed using the Manual Analysis button.

Using the buttons in the toolbar, the events can be classified manually or even deleted. The change is applied to all currently selected events. Thus, for example, a group of PD events can be marked and in one step assigned the same classification.
The following functions are available:
| Button | Description |
| Jump to the event with the next highest pulse amplitude. | |
| Jump to the event with the next lowest pulse amplitude. | |
| Classify pulse as partial discharge. | |
| Classify pulse as possible partial discharge. | |
| Classify pulse as negligible. | |
| If a pulse appears very close to the near or far end of the cable, this button - in case of reasonable suspicion - can be used to "move" the pulse to the opposite cable end.The resulting change in position is immediately visible in the PD mapping. | |
| Discard pulse. This action cannot be reversed. |
6.2 Preparing and Printing the Report
Risk assessment / recommendation
The risk assessment for reliable network operation must be performed taking into account the respective isolating systems, the type of faults as well as the measured PD.
A recommendation on how to proceed based on the risk assessment can be entered in the text field available through the Recommendation tab.
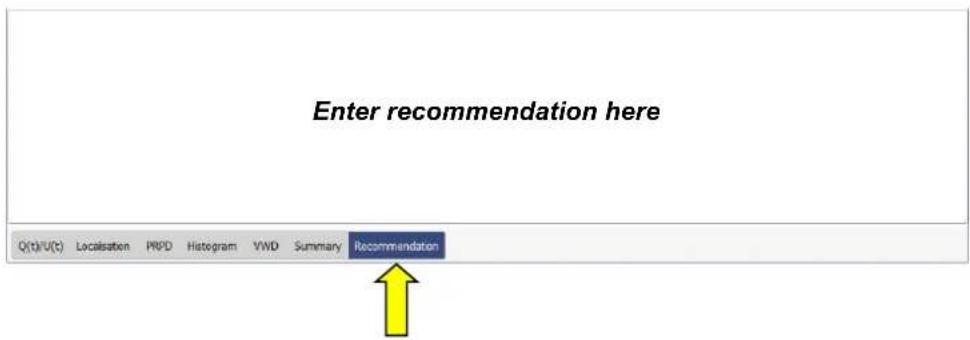
The recommendation could, for example, suggest a repeat measurement for trend analysis or even the replacement of an affected cable section / accessory. The text of this recommendation is also contained in the printed report.
Selecting additional diagrams to be included in the report
Depending on the selected template (see page 59) the report may already contain the cable plan, relevant PD mappings, the calibration curve, a tabular overview of the key measurement values and the recommendation.
In addition, individual TDR images may also be included in the report as required, e.g. if the original PD pulse and its reflection can be particularly well recognized in one of the reflectograms and, accordingly, a clear localization of the partial discharge fault can be made. To do so, you must first mark the respective pulse in the PD mapping and then click the Add button in the Selected plots menu block. A miniature view of the pulse appears directly superimposed in the menu window.
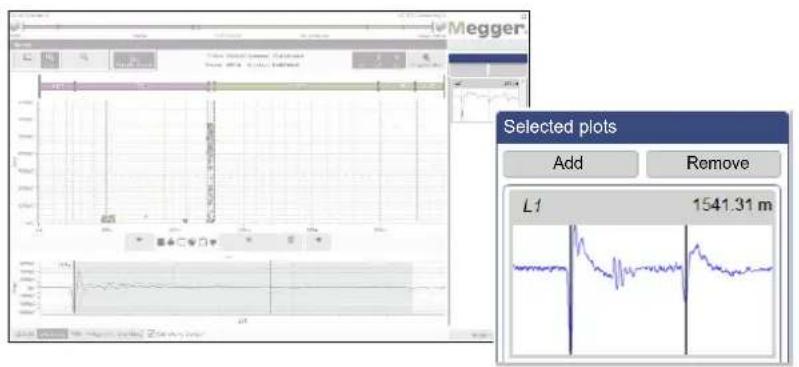
The pulses contained in the selection can be selected and brought to the display by clicking on them. Clicking the Remove button will remove them from the selection.
Even though any meaningful VWD diagram could have already been selected for inclusion in the report during the actual measurement, by saving the respective measurements using the Save VWD button, diagrams can still be added and removed during report creation. As soon as the VWD view is opened, the diagrams which are already included in the report are displayed in the VWD Measurements menu block on the right.
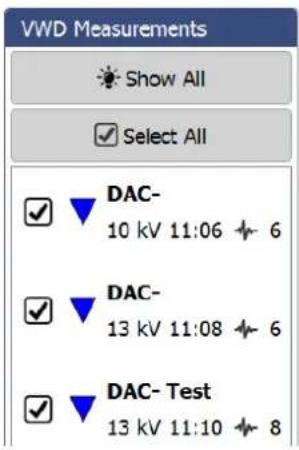
The Show All button can also be used to show and view all other available VWD diagrams. To include one of the VWD diagrams that has not yet been added to the report, tick the corresponding box.
Preparing the summary table
By clicking on the Summary tab, a table can be called up which, depending on the template used, will also be included in the report (exactly as it is shown here) and shows the most important data of the measurement task.
| L1 | L2 | L3 | |
| Disturbance level [pC] | 65 | 64 | 173 |
| PDIV [kV rms] | 7.8 | 7.8 | 7.8 |
| PDEV [kV rms] | 4.5 | - | - |
| PD max [pC] (PDIV) | 2529 | 4129 | 2834 |
| PD max [pC] (1.2 Uo) | 2529 | 4129 | 3239 |
| PD Level [pC] (1.2 Uo) | 1662 | 3357 | 2372 |
| PD max [pC] (1.6 Uo) | 11286 | 31732 | 9810 |
| PD Level [pC] (1.6 Uo) | 7974 | 23416 | 7677 |
| PD max [pC] (1.7 Uo) | 11286 | 31732 | 9810 |
| PD Level [pC] (1.7 Uo) | 7974 | 23416 | 7677 |
| Frequency [Hz] | 365 | 365 | 365 |
| Operating Mode | DAC- | DAC- | DAC- |

Use the buttons ▲ and ▼ in the first column of the table to specify up to three test voltage levels the PD values of which are displayed in the table. The setting is automatically applied to the generated report as well (if the summary table is included in the selected report template at all).
Printing/exporting a report
After completion of the analysis and risk assessment, using the Print Report button on the lower right, template management can be opened and the desired report template selected (the most recently used template is preselected). If the results of the measurement require it, the content of the template can still be changed at this time by enabling or disabling certain content elements (see page 59).
When the Create PDF button is pressed, a PDF report is generated based on the selected template. Depending on the size, this can take several minutes. The report is then displayed in a PDF viewer, where it can be saved or printed on the selected printer (see page 56). If a full version of the Megger Book Cable protocol software is installed on the same computer, the generated PDF report is automatically added to the list of previous measurement activities on the selected cable.
The report data can alternatively be exported in the CSV (comma-separated values) file format. To do so, select the CSV Export template, which can also be modified before the export but cannot be saved. The actual export is then initiated using the Save CSV button.
7 Configuring Settings and Managing Data
7.1 Adjusting the Settings - ⚙
The following software settings can be adjusted:
| Category Description | ||
| General | Language | Selection of menu language |
| Default printer | Printer that should print the created PDF reports | |
| Show Clock | These parameters can be used to specify whether and in what format the clock and date should be displayed on the upper right edge of the screen. This setting is especially important if the software is running in full-screen mode (as it is the case on a test van's IPC). | |
| Show Am/PM | ||
| Show Date | ||
| Initial nominal charge | Pre-selected charge level when entering calibration mode | |
| Database settings | Overview of database memory usage. If the database contains corrupt data sets, it is advisable to clean the database using the Start defragmentation button.Data sets can become corrupted if, for example, cables have been deleted from the cable database via another application. If this happens, the measurement data for the cables remains in the database without being assigned and must be cleaned using this function. | |
| Report | Select and manage report templates (see page 59) | |
| Devices | List of all devices configured in the software and available for a measurement.If necessary, devices can be added, deleted and edited (see the next section). | |
| Phases | To be able to distinguish the curves and PD events of the different phases, the colours and labels used for the display can be changed in this screen. | |
| Localisation | Polarity check | With the polarity check active, only those pulses for which the original pulse and the reflection have the same polarity are considered as possible partial discharge pulses. This procedure complies with the requirements of the normal partial discharge measurement, which is why the polarity check should not normally be disabled!For special applications, such as pinpointing partial discharges with a pulse generator, original pulse and reflection may have different polarities. In such cases, the polarity check must be disabled temporarily. |
| Dynamic Bandwidth | If this function is active, based on the cable length, the optimal bandwidth for the localisation is calculated and used.Otherwise, the localisation is always performed with the maximum bandwidth.Using dynamic bandwidth is recommended for measurements. | |
| Max Shots VLFSin Localization | In VLF sine wave modes, the amount of incoming and processed localization results can reach very high levels depending on the duration of the measurement.Though, a limitation of the maximum value is only necessary if the error message „Processing pipeline limit reached!“ is repeatedly displayed during measurement indicating that the processing power of the computer in use is not sufficient. | |
7.1.1 Managing Devices
Introduction
Under Devices, all devices configured in the software are listed. If one of the devices is selected, its settings are shown in the right section of the screen. In general, these settings (in particular the network and connection settings) should only be changed at the request of a service employee.
All changes that the user may make independently on the device configuration are described in the following sections.
Adding/removing devices
In general, the available devices are already added to the software in the factory. If, however, the software needs to be reinstalled or an additional device that can be used for the PD measurement is purchased, using the buttons directly under the device list the following changes can be made.
| Button | Description |
| Add new device to list.In addition to the device type, which must be set, a name or comment can also be added optionally.If the test voltage source is not in the list of supported devices (for example, because it is from another manufacturer), the optionManual controlled HV source should be selected. | |
| Change type, name or comment of the currently selected device. | |
| Delete currently selected device. |

It is recommended that the device list is kept as small as possible and that devices are only added that are actually used regularly in combination with this software installation. In this way, device selection is made faster and easier at the start of a new measurement task. When the device list only contains one voltage source and one PD detector, this selection becomes unnecessary.
Updating the firmware of a PD detector
To be able to update the firmware of a PD detector, it must first be selected in the list of devices. Preferably, a firmware update should be performed prior or subsequent to a measurement when the system is properly erected and connected.
After a network connection to the PD detector has been established (Connect), the firmware file (.pddfw) can be selected using the ... button. Only after a suitable file has been selected can the update process be started by clicking on the Update firmware button.

The system must not be switched off during the entire update process!
7.1.2 Managing Report Templates
Introduction
In the Report section the content of the diagnostic report can be freely modified to your needs and any number of templates can be created.
When the software is delivered, a template that satisfies the typical requirements for a diagnostics report is already included. However, this template cannot be modified or deleted.

Managing templates
Using the following buttons on the top of the screen, any number of individual templates can be created, edited, copied and also deleted:
| Button | Description |
| Create new template. | |
| Rename currently selected template. | |
| Delete currently selected template. | |
| Save changes to currently selected template. | |
| Duplicate currently selected template under new name. | |
| Import templates in *.pddt format from a local storage device. | |
| Save currently selected template to local storage device.This makes it possible for the local templates to be saved or transferred to other systems. |
Modifying the content of a template
Proceed as follows to modify the content of a template:
| Step Action | |
| 1 | Using the pull-down menu, select the template that you want to modify. |
| 2 | Customise the content that a report based on this template should include based on your needs (see below). |
| 3 | Save the changes using the button. |
The following contents can be added to or removed from the report template based on your needs:
| Category Content | |
| PDF Quality | Using these checkboxes it can be specified whether the PDF reports generated with this template should have a resolution of 100 DPI or 300 DPI. |
| Address / Logo | Address and logo that should appear in the header of the report. |
| General information about the cable | Data of the diagnosed cable.Cable data, cable plan and joint plan can be activated or deactivated individually. |
| Custom Text | This segment can be used to add any number of custom text modules to the template.For example, this could be frequently used phrases, hints or recommendations, which are then activated or deactivated as needed in preparation for the actual report creation.The order of the modules can be adjusted using the ↓ and ↑ buttons. Clicking on the button deletes the text module. |
| Summary | Tabular overview of the key measurement data (for example, PDEV, PDIV and charge level at various voltage levels).The voltage levels to be included in this summary table can be set during the preparation of the report (see page 54). |
| Calibration | The TDR images of the various phases recorded during calibration. |
| PD Mapping | List of the PD mappings to be included in the report.  The checkboxes in the first line can be used to specify which information is to be displayed in each of the PD mappings contained in the report (cable plan, histogram, important positions, non-relevant PD events and non-localized PD events).The list of PD mappings contained in the report can be shown using the↓To add a PD mapping to the list, the voltage range must first be configured and then the ➕ button pressed.Double-clicking in the corresponding table cell is sufficient to change the parameters (voltage values, phases) of an existing entry.Using the ↓ and ↑ buttons, the order in which the PD mappings appear within the report can be changed.To delete a PD mapping from the list, first select it and then press↓Using the ➕ and 🔥 buttons, you can also specify whether the pulses classified as insignificant should also be displayed. This setting applies for all PD mappings included in the report. The checkboxes in the first line can be used to specify which information is to be displayed in each of the PD mappings contained in the report (cable plan, histogram, important positions, non-relevant PD events and non-localized PD events).The list of PD mappings contained in the report can be shown using the↓To add a PD mapping to the list, the voltage range must first be configured and then the ➕ button pressed.Double-clicking in the corresponding table cell is sufficient to change the parameters (voltage values, phases) of an existing entry.Using the ↓ and ↑ buttons, the order in which the PD mappings appear within the report can be changed.To delete a PD mapping from the list, first select it and then press↓Using the ➕ and 🔥 buttons, you can also specify whether the pulses classified as insignificant should also be displayed. This setting applies for all PD mappings included in the report. |
| Q(t)/U(t) | List of the Q(t)/U(t) diagrams to be included in the report.[IMAGE]The Q(t)/U(t) diagrams for the inception voltage (PDIV) and the extinction voltage (PDEV) are included by default (but can be disabled by unchecking the individual phases).To add another diagram to the list, the voltage level must first be selected and then the ➕ button pressed.Double-clicking in the corresponding table cell is sufficient to change the parameters (voltage values, phases) of an existing entry.Using the ↓ and ↑ buttons, the order in which the diagrams appear within the report can be changed.To delete an entry from the list, first select it and then press [1X2K] |
| PRPD | PRPD diagrams of the individual phases. |
| Localization Diagrams | The TDR diagrams which have been selected during the preparation of the report (see page 53). |
| VWD Plots | The VWD diagrams which have been selected during the preparation of the report (see page 53). |
7.2 Cable Manager - +
Introduction
The cable manager serves for maintaining the cable data. These are stored in a local database, which is also used by the MeggerBook Cable protocol software (if also installed on the computer). This ensures that the cable data is consistent across all applications installed on the machine, i.e. any changes to the cable data will be effective in the other application as well.
In addition to the cable data, the cable manager also shows and manages all measurement tasks carried out on the respective cables.
7.2.1 Viewing Cable Data and Administrating Measurement Tasks
Selecting a cable
In order to be able to look at the technical details, the sections or the measurement tasks of one particular cable, this cable needs to be selected from the list of available cables first of all.
![Cable Summary Search... Cable Number Location Station A Station B Length [m] Uo [kV rms] Last Measurement K-LT-00223 Sundern Markkauf Lübke GmbH 2042 6 18/11/2019 15:55 Wittelstr 16 Röcklitzestr 1 Hommingberg Wittelstr 1 Röcklitzestr 1 413 6 07/08/2019 08:15 Bahnrecht(T233)-Vorstadt(T45) Dresden Hau…](/content/2026/05/852529/images/b4ed90b04b5209b8c30bdf247fdc989d0858a69240da76dae028485d39fa74d4.jpg)
If changes were made to the cable data in the MeggerBook Cable protocol software during the current session, the cable list displayed should be reloaded using the ↗ button.
If the cable list is very extensive, a filtering of the displayed cables can be conducted with the help of the search function (see page 23).
Details view
As soon as a cable has been selected, a table with the general cable data of the cable is displayed in the lower screen area (Details tab).
![Cable Number: Sec3_0078 CableType: Three-core U0 [kV rms] 22 Comment: Location: Dillon (Sec. 3) Installation Date: Length [m]: 1335 Main station Switchgear: SF6 Type: Termination: Unknown Oak St. Switchgear: SF6 Type: Termination: Unknown 1.33km PE Cable PILC Cable PE Cable Details Sections Measurem…](/content/2026/05/852529/images/bcff5d48afd9622e9961fe1f10a8289d596c9d82ea89de73cb80f9e89b2effb2.jpg)
Cable sections
Under the Sections tab, detailed information on the individual cable segments can be viewed:
| # | Joint | Insulation | Distance [m] | Length [m] | Installation Date | |
| PE Cable | PE | 0 | 870 | |||
| 1 | Heat-shrink | PILC Cable | PILC | 870 | 285 | |
| 2 | Heat-shrink | PE Cable | PE | 1155 | 180 |
Measurement tasks
The Measurement tasks tab provides a list of all measurements conducted on this cable system. An Active measurement task is marked in bold.

After an item of this list has been selected, the following functions can be called up:
| Button Description | |
| Load | The measurement data of the selected measurement task are loaded into the memory.After a previous measurement task has been loaded, the menu point can be called up via the start screen and the measurement data can be once again evaluated (see page 46). |
| If there is an active measurement task going on at that moment it will be closed. Therefore, current measurements should be finished before loading a previous measurement task. | |
| Delete | The measurement task including all corresponding measurement data is deleted. |
| Cleanup | This menu item can be used to delete the measurement data of the selected measurement task.This function can be used if, due to many previous measurements, the memory space on the data carrier becomes limited and the measured data are no longer needed.After the cleanup, the last saved state of the report can still be opened and exported.Measurement tasks for which no report has yet been created cannot be cleared. |
| Show report | Given that there has already been a report created for this measurement task, the corresponding PDF file is displayed. |
| Export report | Given that there has already been a report created for this measurement task, the corresponding PDF file can be exported to any target folder. |
| Resume Task | The measurement task is continued and further measurements can be added to the existing ones.This function is intended to resume interrupted measurements when e.g. the software was terminated unintentionally or a measurement must be completed on the following day. |
| Clone Task | A new measurement task with the exact same settings is started. |
7.2.2 Managing Cables
Functions With the help of the buttons of the Edit menu block, existing cables can be managed and new cables can be created.

The following functions are available:
| Button Description | |
| New | Create a new cable (see next section). |
| Edit | Edit the cable that is currently selected in the cable list (see next sections). |
| Delete | Delete the cable which is currently selected in the cable list. |
| When a cable is deleted, all measurement data of the cable is lost! | |
| Import | Import cable and measurement data (see page 76) |
| Export | Export cable and measurement data (see page 75) |
7.2.2.1 Entering / Changing General Cable Data
Directly after clicking the buttons New or Edit, the General mask that allows entering / correcting of the general cable data appears. Mandatory fields are marked by a coloured background.
![New Cable Cable Number: Uo [kV rms] 0.0 Location Cable Type: Three single-core Installation Date 26/11/2019 Unknown Comment Station A Name: Manufacturer: Insulation Default Termination Station B Name: Manufacturer: Insulation Default Termination General Sectures](/content/2026/05/852529/images/5a0be7c8a7f54565f2b1d0cf88cfaedccd1ccdab64cd8c4d930b13e780d2d5c7.jpg)
The following entry forms allow entering the cable parameters:
| Entry form Description | |
| Cable number | Number / designation of the cable systemThe cable number has to be unique and must not be used twice! |
| Uo [kV rms] Nominal voltage Uo of the cable (in kV RMS) | |
| Location Location of the cable | |
| Cable Type | Design of the cable system |
| It is important to select the three single-core option for cable systems which exhibit differences in the insulation type between the individual phases. Only then can this type of inhomogeneity actually be represented when entering the cable sections (see page 68). | |
| Installation Date | Date of the installation / initial operation |
| Comment | Helpful comments regarding the cable's history |
Beyond, with the help of the following buttons and entry forms, detailed information regarding the technical conditions on both ends of the cable can be entered.
| Entry forms / Buttons | Description |
| Name | Name of the respective switchgear / substation |
| Manufacturer | Type / manufacturer of the switchgear |
| Insulation | Insulation of the switchgear |
| Termination | Type of the cable termination |
| Browse | With this button, a meaningful picture of the switchgear can be imported into the software and can be saved with the cable data. |
| Default | With this button the picture of the switchgear is reset. |
7.2.2.2 Specifying the Sections of the Cable
Introduction
Via the tab Sections you get to the second entry form in which all cable types and joints of all cable sections have to be specified.
![New Cable Add Phase | Joint Insulation Position [m] Length [m] Installation Date General Sections](/content/2026/05/852529/images/be338051368176853108df6a6461107c2f48f9dd718b25b1df949e26a64e77e4.jpg)
General notes
In case of homogeneous cable systems without joints exactly one section with the total cable length needs to be specified. The individual sections of cables with several sections must be entered step-by-step (starting with the cable end defined as Station A). The individual section lengths and the respective insulation types must be specified as exactly as possible. This makes it easier to identify relationships between PD faults and joint positions following the measurement, and incorrect conclusions can be avoided.
Assuming that the individual phases are homogeneous, three-core type cable systems are shown as single-phase systems, exactly like single-core type cable systems. The characteristics of the individual cable sections are automatically applied to all phases of the cable system.

Three single-core type cable systems, in contrast, are shown as an actual three-phase system. Cable sections can be entered both for all three phases at the same time, as well as for each phase individually. However, after completing entry, it must be ensured that all three phases exhibit the same total length.

Adding / Editing a Section By means of three buttons placed above the list, cable sections can be added and edited according to the following scheme:
![Phase # Joint Insulation Distance [m] Length [m] Installation Date L1 PE 0 2112 L1 1 Slip-on PE Cable PE 2112 245 L2 PE Cable PE 0 2112 L2 1 Slip-on PE Cable PE 2112 245 L3 PE Cable PE 0 2112 L3 1 Heat-shrink PILC Cable PILC 2112 245 Edit Add](/content/2026/05/852529/images/ab56508b14086e0e980c3372c8a8f778c74d7253019cd2015750ace3fd18517a.jpg)
After pressing one of these buttons, a new window for entering/editing the section data opens.
![Add Cable Section Phase All Phases L1 L2 L3 Cable Section Search Description Insulation v/2 [m/μs] PE Cable PE 83 XLPE Cable XLPE 83 PILC Cable PILC 80 EPR Cable EPR 80 PVC Cable PVC 76 TestTyp XLPE 91 Length [m] 270 - Joint Installation Date 12.05.14 - Unknown Add additional segments Add Close](/content/2026/05/852529/images/3c130ff01821a06c466774fdf0a8a9235ee67b30b84cca8cbca3b269ff819cee.jpg)
The following properties can be defined:
| Parameter Description | |
| Phase | Phase(s) of the cable system to which the changes should be applied.Whether and how a selection can be made depends on the type of cable (single-core/three-core). |
| Cable Type | Cable type of the section.The type can be selected from all the cable templates created.When delivered, a number of typical cable types are already stored in the database. When required, the buttons can be used to add any number of templates of your own and to administrate existing templates (see page 73).When there are a large number of cable templates, the Search and Favourites functions (see page 23) can be used to help filter the templates displayed. |
| Length [m] | The length of the cable section in metres.When adding a new cable section before the marked section, an additional tickbox is made available in this line. If this box is ticked, the length of the new section is subtracted from the length of the marked section (which is equivalent to cutting the marked section). If this box is not ticked, the marked section retains its original length and the total length of the cable is extended by the length of the new section (which is equivalent to the actual insertion of a new piece of cable). |
| Joint | Type of joint connecting the current cable section with the previous cable section. Accordingly, no selection need be made for the first section of a cable.The joint type can be selected from all the templates created.When delivered, a number of typical joint types are already stored in the database. When required, the buttons can be used to add any number of joint templates of your own and to administrate existing templates (see page 73). |
| Installation Date | Date of the installation of the cable section. |
Editing is completed using the Edit, Insert or Add buttons, and the section is saved.
When adding new sections to the cable end, it is possible to continue adding another section directly when the Add additional segments checkbox has been activated upon saving.
Clicking on the Cancel button cancels the editing process and any changes made so far are discarded.
Cutting a section
If a cable was cut and a joint inserted during maintenance work, this change can also be made to the digital image of the cable with just a few clicks using the cutting tool.
To do this, proceed as follows:
| Step | Action |
| 1 | Select the cable section to be cut from the list or directly in the cable plan. The selected section is marked with a red triangle. |
| 2 | Using the buttons placed above the list, activate the desired cutting mode: [IMAGE] Cuts one phase of the selected section[IMAGE] Cuts all phases of the selected section |
| 3 | Select the position where the cut was made by hovering the mouse over the respective section/phase in the cable plan. Using the mouse wheel, the position can be finely adjusted. |
| 4 | Click to make the cut. |
Deleting a section
In order to delete an existing cable section, it has to be selected first and then the button Remove has to be clicked.
![Phase # Joint Insulation Distance [m] Length [m] Installation Date L1 PE Cable PE 0 2112 L1 1 Slip-on PE Cable PE 2112 245 L2 PE Cable PE 0 2112 L2 1 Slip-on PE Cable PE 2112 245 L3 PE Cable PE 0 2112 L3 1 Heat-shrink PILC Cable PILC 2112 245](/content/2026/05/852529/images/cb2f9a986c4a3b45a76cb137a5f658bfbb6ed2f8235d2b85a76b5dc46438625f.jpg)
7.2.2.3 Saving Cable Data
After the cable data have been entered as completely as possible, the new or edited cable can be saved via the button Apply at the right bottom side of the screen.
With the button Cancel the entry form will be closed without saving and all performed changes are discarded.
7.2.2.4 Managing Segment Templates
Introduction
To be able to specify the cable and joint types in a cable section explicitly, the corresponding templates must be filed in the database. A number of typical datasets are already stored in the database upon delivery. You can add/manage your own templates directly while editing a cable section (see page 68) by using the buttons provided for this.
![Add Cable Section Phase All Phases L1 L2 L3 Cable Section Search Description Insulation v2 [m/μs] PE Cable PE 83 XLPE Cable XLPE 83 PILC Cable PILC 80 EPR Cable EPR 80 PVC Cable PVC 76 TestTyp XLPE 91 Length [m] 270 Joint Installation Date 12.05.14 Unknown Add additional segments Add Close](/content/2026/05/852529/images/0b5a8464e9a2149b6989c245e94f79892bf76087181d83d5aa1323280781d025.jpg)
Creating/editing a cable template
A new cable template can be created, and the cable template currently selected can be edited, using the + / buttons. After clicking the button, a new window opens in which the following properties can be defined for the template:
| Parameter | Description |
| Insulation | Insulation of the cable type |
| v/2 | Signal propagation velocity of the cable type as a v/2 value |
| Description | Unique designation for the cable template |
| Favourite | The template can be added to the favourites list (★) be removed from the list (☆) by clicking on the respective symbol (see page 24). |
Creating/editing a joint template
A new joint template can be created, and the joint template currently selected can be edited, using the + / buttons. After clicking the button, a new window opens in which the following properties can be defined for the template:
| Parameter Description | |
| Description | Type or unique designation for the joint template |
| Default | When this checkbox has been activated, the template is specified as default template for new cable sections. |
Deleting a template
To delete an existing segment template, this template must be selected first, after which the button is clicked.
7.2.3 Managing Measuring and Cable Data
Introduction
With the aid of the import and export assistants, measuring and cable data can be exchanged between the databases of various TE detector software installations. There is also the possibility of importing the following non-system data:
- Measuring and cable data from a OWTS PD diagnostic system (optional function)
The assistants for the importing and exporting of data can be accessed via the Import and Export buttons in the Edit menu block.


When importing and exporting measurement data, very large amounts of data are copied. If an external storage device is used for export/import, it should be connected to the fastest USB interface (usually USB 3.0 or higher).
7.2.3.1 Exporting Data
Proceed as follows in order to export cable and measuring data from the local database to a data carrier of your choice:
| Step | Action |
| 1 | Click on Export in the Edit menu block. |
| Result: The export assistant is opened in a new window. | |
| 2 | Tick a cable that should be exported in the left side of the window.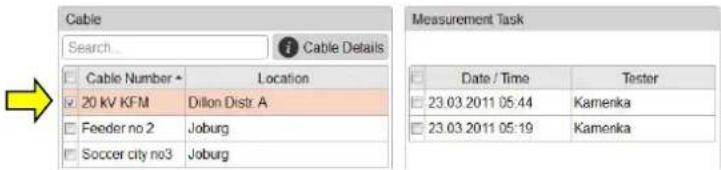 In the event of an especially comprehensive cable list, the displayed cables can be filtered with the aid of the search function (see page 23). In the event of an especially comprehensive cable list, the displayed cables can be filtered with the aid of the search function (see page 23). |
| 3 | Select all measuring tasks for this cable that should be exported in the right side of the window. |
| 4 | Repeat steps 2 to 3 if required for all further cables that should be exported. |
| 5 | Use the Browse button to select an empty directory into which the data should be exported. |
| 6 | Click on Next and then on Finish to export the selected data. |
| Result: The export is performed. |
7.2.3.2 Importing Data
- Step: Applying the import settings
Proceed as follows to prepare the import of cable and measuring data:
| Step | Action | |
| 1 | Click on theImportin theEditmenu block. | |
Result:The import assistant is opened in a new window. | ||
| 2 | Select the data format to be imported from the following options:PD Detector data Measuring and cable data from another TE detector software installationOWTS Measuring and cable data from a OWTS PD diagnostic system (optional function) | |
| 3 | Tick the data types (cable data, measuring data) that you would like to import.If the local database does not yet contain any cable data, the cables must be imported. | |
| 4 | Use theBrowse...button to select the file to be imported.Depending on the file type, the following file should be selected:PD Detector data Import file with the extension*.pddd(which was automatically created during data export)OWTS Import file StartMask.dat (which was automatically created during data export from the OWTS software) | |
| 5 | This setting is only required when OWTS data is to be importedUnderLanguage coding of import data, select the language that is set in the source system.This setting is required so the date information can be imported correctly. | |
| 6 | Click onNext. | |
- Step: If the import of cable data is activated in the import settings, an overview of the identified Selecting the cables cables appears. If required, the basic cable data can be adapted and cables can also be completely excluded from the import.
![Deselect to exclude the cable from the import Cable Number 20 kV KFM Location Dillon Distr A Uo [kV rms] 11.6 Station A Lighthouse Station Station B Stadium Cable Number Feeder no 2 Location Joburg Uo [kV rms] 6.4 Station A Crown Sds Station B Soccer city no 2 Preview of the complete cable data](/content/2026/05/852529/images/d01d3d01a88058099364e9627ce92a8f97e847fd2f14961acb55085d298bbf27.jpg)
Using the Next button, the next page of the import assistant can then be accessed.
- Step: Selecting and allocating the measuring tasks
If the import of measuring data is activated in the import settings, an overview appears of the identified measuring tasks that can be excluded from the import if required.
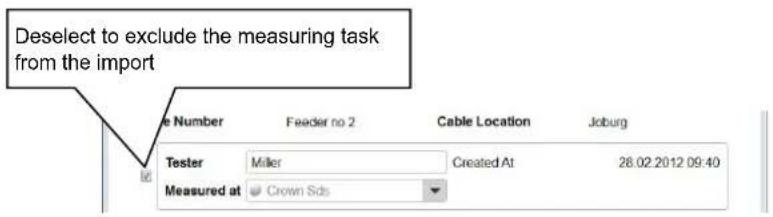
Measuring tasks that are imported without the associated cable data and cannot be automatically assigned to an existing cable are initially excluded from the import.
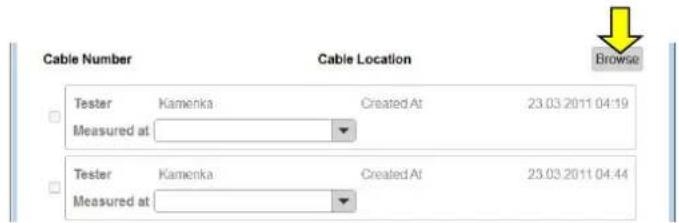
To be able to import these measurement tasks, the right cable must first be sought in the local database using the Browse button and selected by double clicking.
After the measuring tasks to be imported are selected and, where required, the general information (name of tester, cable end at which the measurement took place) is adapted, the next page of the import assistant can be accessed using the Next button.
- Step: Completing the import
Immediately after the selection of the data to be imported is completed, this is imported into the local database. A summary of the import process is displayed. By clicking on the Finish button, the displayed changes can be confirmed and the import completed.
Using the Cancel button, the import can also still be cancelled at this time. The displayed changes are discarded in this case.
7.2.3.3 Backing Up Data
To prevent loss of data (e.g. in the event of a hard drive defect), it is recommended to regularly perform a backup of the measuring and cable data.
The following data must be saved:
Cable data: File %installation folder%\Megger.mcb
Measuring data: Directory %installation folder%\data\
A suitable backup strategy should be developed by the responsible system administrator.
8 Storage and Transport
If the system is not used for a long period, it should be stored in a dust-free and dry environment. Continuous moisture (humidity) especially when combined with dust can reduce critical insulating clearances that are essential for safe high-voltage operation.
To prevent charging of the capacitor, the short-circuit line has to be installed as shown in the following picture both during storage and during transportation of the system:

Storage If the system is not used for a long period, it should be kept in the transport boxes and stored in a dust-free and dry environment. Continuous moisture (humidity) especially when combined with dust can reduce critical insulating clearances that are essential for safe high-voltage operation.
Transport The PDS 62-SIN is a highly sensitive measuring system which should always be moved with great care! Safe transport of the system can only be ensured if its components are properly stored in the respective transport boxes.
9 Maintenance and Care
Repair and maintenance
Repair and maintenance work has to be carried out by Megger or authorised service partners using original spare parts only. Megger recommends having the system tested and maintained at a Megger service centre once a year.
Megger also offers its customers on-site service. Please contact your service centre if needed.
Cleaning
In order to be able to guarantee a consistently high measuring precision at the same time as the lowest possible system-related partial discharge, the housing (in particular the surfaces painted red) and the connection cables of the PDS 62-SIN should be cleaned regularly.
No aggressive solvents or cleaning agents may be used for cleaning. Megger instead recommends using the cleaning set (see page 13) specifically intended for this purpose. In principle, cleaning can also be carried out with a soft, lint-free cloth and ethanol.
10 Troubleshooting
Independent If problems occur, these can - under certain circumstances - be diagnosed and solved troubleshooting using the following table:
| Problem / Error message Cause / Remedy | |
| Connection to test voltage source or PD detector cannot be established | · Restart the affected device· Restart notebook and measurement software· Check cabling· Make sure that the device is supplied with power and, if possible, measure the supply voltage |
| The system of the PD detector apparently crashed (LEDs light up red) | Briefly disconnect the PD detector from power to initiate a restart. |
| Software is very slow; delayed response to user actions | The processor is heavily utilized by other processes or running at reduced clock speed.· Close all other applications· Deactivate the virus scanner· Deactivate the power-saving mode |
| The software is slow to start and takes up a lot of space on the hard drive. | Large volumes of data may accumulate in the installation directory due to the amount of measurement data recorded. This depends on how long and how intensively the software is used and may also delay software start-up.· Cleaning measurement data (see page 63)· Defragmenting the database (see page 56) |
| When the software is opened for the first time, no new measurement job can be started | No devices have been configured (see page 56) in the software. |
| “Overflow” | Measured data exceeds the input data range.Increase the measuring range (Q range) in the software. |
| “Processing pipeline limit reached!” | The computing power of the computer used is not sufficient to process the amount of incoming measurement data.This problem can be counteracted by decreasing the maximum number of localizations during VLF sine wave voltage measurements (see page 56). |
| “Calibration failed” | The start and / or end reflection could not be unambiguously identified by the software.· Try again with low bandwidth setting· Check the electrical connection of the calibrator and whether it is still switched on· Make sure the cable under test is not earthed / short-circuited· Try to manually position the markers |
| „PD Detector protocol not supported!“„PD Detector software not supported!“„PD Detector firmware not supported!“ | The wrong PD Detector version may have been selected when the measurement task was started (see page 25).Otherwise, a firmware upgrade (see page 56) might solve the problem. |
Behaviour at persistent malfunction
When irregularities or malfunctions appear that cannot be solved consulting this manual, the equipment must immediately be put out of operation and marked as not functional. In this case inform the person in charge who should inform the Megger service to resolve the problem. The instrument may only be operated when the malfunction is resolved.
This symbol indicates that the product which is marked in this way should not be disposed of as normal household waste. As it is a B2B product, it may also not be disposed of at civic disposal centres. If you wish to dispose of this product, please do so properly by taking it to an organisation specialising in the disposal of old electrical equipment near you.


- PDS 62-SIN
- PARTIAL DISCHARGE MEASURING SYSTEM
- USER GUIDE
- CONSULTATION WITH MEGGER
- TERMS OF WARRANTY
- CONTENTS
- 1 SAFETY INSTRUCTIONS
- 1.1 GENERAL NOTES
- SAFETY PRECAUTIONS
- LABELLING OF SAFETY INSTRUCTIONS
- WORKING WITH PRODUCTS FROM MEGGER
- OPERATING STAFF
- 1.2 GENERAL SAFETY INSTRUCTIONS AND WARNINGS
- INTENDED APPLICATION
- FIVE SAFETY RULES
- FIRE FIGHTING IN ELECTRICAL INSTALLATIONS
- 2 TECHNICAL DESCRIPTION
- 2.1 ABBREVIATIONS
- 2.2 SYSTEM DESCRIPTION
- FUNCTIONAL DESCRIPTION
- SYSTEM CONFIGURATION
- 2.3 TECHNICAL DATA
- 2.5 TECHNICAL BACKGROUND
- 2.6 CONNECTION ELEMENTS AND STATUS LEDS
- 3 COMMISSIONING
- GENERAL SAFETY INSTRUCTIONS FOR SET-UP AND COMMISSIONING
- 3.1 ELECTRICAL CONNECTION
- SAFETY INSTRUCTIONS REGARDING THE ELECTRICAL CONNECTION
- 3.1.1 ELECTRICAL CONNECTION IN COMBINATION WITH A STAND-ALONE TEST VOLTAGE SOURCE
- 3.2 SWITCHING ON
- 4 BASIC OPERATION OF THE SOFTWARE
- 4.1 START SCREEN
- 4.2 USEFUL FEATURES OF THE SOFTWARE
- 5 CONDUCTING MEASUREMENTS
- 5.1 STARTING OR RESUMING A MEASUREMENT TASK
- 5.2 CALIBRATING THE PARTIAL DISCHARGE MEASURING CIRCUIT
- PREREQUISITES
- NECESSITY
- 5.2.1 CONNECTING THE CALIBRATOR
- 5.2.2 CONDUCTING THE CALIBRATION
- STEP ACTION
- CHECKING THE MARKERS
- 5.2.3 DISCONNECTING THE CALIBRATOR
- 5.3 MEASURING
- 5.3.1 BASIC INFORMATION REGARDING THE MEASUREMENT SCREEN
- 5.3.2 AVAILABLE DIAGRAM TYPES
- 5.3.3 SETTING THE MEASUREMENT PARAMETERS
- NOTICE
- DANGER OF DAMAGE TO THE PARTIAL DISCHARGE COUPLER
- 5.3.4 PERFORMING THE MEASUREMENT
- 5.3.4.1 TYPICAL PROCEDURE FOR PD DIAGNOSIS WITH VLF VOLTAGE
- 5.3.4.2 TYPICAL PROCEDURE FOR MONITORED WITHSTAND TESTING
- 5.3.5 STOPPING / FINISHING A MEASUREMENT
- 6 EVALUATING MEASUREMENT RESULTS AND CREATING A REPORT
- 6.1 MANUAL EVALUATION OF PARTIAL DISCHARGES
- 6.1.1 DETERMINING POSSIBLE SOURCES OF PD FAULTS
- 6.1.2 ANALYSING INDIVIDUAL PD EVENTS
- MANUAL ANALYSIS
- MANUAL CLASSIFICATION
- 6.2 PREPARING AND PRINTING THE REPORT
- 7 CONFIGURING SETTINGS AND MANAGING DATA
- 7.1 ADJUSTING THE SETTINGS - ⚙
- 7.1.1 MANAGING DEVICES
- INTRODUCTION
- ADDING/REMOVING DEVICES
- UPDATING THE FIRMWARE OF A PD DETECTOR
- 7.1.2 MANAGING REPORT TEMPLATES
- MANAGING TEMPLATES
- 7.2 CABLE MANAGER
- 7.2.1 VIEWING CABLE DATA AND ADMINISTRATING MEASUREMENT TASKS
- SELECTING A CABLE
- DETAILS VIEW
- CABLE SECTIONS
- MEASUREMENT TASKS
- 7.2.2 MANAGING CABLES
- 7.2.2.1 ENTERING / CHANGING GENERAL CABLE DATA
- 7.2.2.2 SPECIFYING THE SECTIONS OF THE CABLE
- GENERAL NOTES
- CUTTING A SECTION
- DELETING A SECTION
- 7.2.2.3 SAVING CABLE DATA
- 7.2.2.4 MANAGING SEGMENT TEMPLATES
- CREATING/EDITING A CABLE TEMPLATE
- CREATING/EDITING A JOINT TEMPLATE
- DELETING A TEMPLATE
- 7.2.3 MANAGING MEASURING AND CABLE DATA
- 7.2.3.1 EXPORTING DATA
- 7.2.3.2 IMPORTING DATA
- 7.2.3.3 BACKING UP DATA
- 8 STORAGE AND TRANSPORT
- 9 MAINTENANCE AND CARE
- 10 TROUBLESHOOTING
Brand : Megger
Model : PDS 62-SIN
Category : Meter