
9112 BK3R - Scale SALTER - Free user manual and instructions
Find the device manual for free 9112 BK3R SALTER in PDF.

| Product Type | Connected body composition scale |
| Brand | Salter |
| Model | 9112 BK3R |
| Maximum capacity | 150 kg / 330 lb / 23 st |
| Accuracy | 100 g / 0.2 lb |
| Weight units | kg, st, lb |
| Main functions | Weight, body fat, water mass, BMI, muscle mass, BMR (kcal), bone mass |
| User memory | 10 users |
| Child mode | 6-12 years (weight, fat, water only) |
| Athlete mode | 15-50 years, physical activity >12h/week |
| Power supply | Batteries (type not specified, pre-installed with insulating tab) |
| Platform material | Stainless steel (electrodes) |
| Display | LCD |
| Dimensions | Not specified, standard for bathroom scale |
| Net weight | Not specified |
| Warranty | 15 years (domestic use) |
| Maintenance | Clean with a damp cloth, no detergents |
| Safety | Do not use with pacemaker, pregnancy: weight function only |
| Special function | Quick weighing (step on directly if settings remembered) |
| Package contents | Scale, user manual |
Frequently Asked Questions - 9112 BK3R SALTER
User questions about 9112 BK3R SALTER
0 question about this device. Answer the ones you know or ask your own.
Ask a new question about this device
Download the instructions for your Scale in PDF format for free! Find your manual 9112 BK3R - SALTER and take your electronic device back in hand. On this page are published all the documents necessary for the use of your device. 9112 BK3R by SALTER.
USER MANUAL 9112 BK3R SALTER
Instructions and Guarantee

Register your product today at www.homedicsgroup.com/register
IMPÉDAN CEMÈTRE • KÖRPER-ANALYSE-WAAGE • BÁSCULA ANALIZADORA DEL CUERPO
PESAPERSONE RILEVA-GRASSO • BALANÇA DE ANÁLISE CORPORAL • KROPPSANALYSEVEKT
LICHAAMSANALYSE WEEGSCHAAL • KEHON KOOSTUMUKSEN ANALYYSIVAAKA • KROPPSANALYSVÄG
KROPSANALYSEVÆGT • TESTZSÍRANALIZÁTOROS MÉRLEG • VÁHA PRO ANALÝZU TĚLA
VÜCUT ANALİZ TARTISI • ZYΓAPIA ME ANALYTH ΣΩΜΑΤΟΣ • BEÇЫ-АНАЛИЗАТОР
WAGA BODY ANALYSER • OSOBNÁ VÁHA S ANALYZÁTOROM
GB
HOW DOES THIS SALTER SCALE WORK? This Salter scale uses BIA (Bio Impedance Analysis) technology which passes a tiny electrical impulse through the body to determine fat from lean tissue, the electrical impulse cannot be felt and is perfectly safe. Contact with the body is made via stainless steel pads on the platform of the scale.
This method simultaneously calculates your personal weight, body fat, total body water, BMI, Basal Metabolic Rate, bone mass and muscle mass, giving you a more accurate reading of your overall health and fitness.
This scale stores the personal data of up to 10 users. As well as being an analyser scale, this scale can be used as a conventional scale.
NEW FEATURE! This scale features our convenient step-on operation. Once initialised the scale can be operated by simply stepping straight on the platform – no more waiting!
PREPARING YOUR SCALE 1. Open the battery compartment on the scale underside.
- Remove isolating tab from beneath the battery (if fitted) or insert batteries observing the polarity signs (+ and -) inside the battery compartment. 3. Close the battery compartment. 4. Select kg, st or lb weight mode by the switch on the underside of the scale. 5. For use on carpet attach enclosed carpet feet. 6. Position scale on a firm flat surface.
INITIALISING YOUR SCALE 1. Press the platform centre and remove your foot.
- '0.0' will be displayed. 3. The scale will switch off and is now ready for use. This initialisation process must be repeated if the scale is moved.
At all other times step straight on the scale.
OPERATING YOUR SCALE 1. Step on and stand very still while the scale computes your weight. 2. Your weight is displayed. 3. Step off. Your weight will be displayed for a few seconds. 4. The scale will switch off.
PERSONAL DATA ENTRY
- Press the Ⓐ button to turn the scale on.
- While the user number is flashing, select a user number by pressing the > or < buttons. Press the Ⓐ button to confirm your selection.
- The male or female symbol will flash.
Press > button until the correct symbol is flashing, then press the button. - The age display will flash.
Press> and K as necessary to set your age, then press the Ⓞ button.
Child Mode: When the age is set from 6-12 years child mode is automatically selected.
NOTE: In child mode only weight, body fat and body water are displayed.
- The height display will flash.
Press > or < as necessary to set your height, then press the Ⓞ button. Athlete Mode: When the age is set from 15-50 years Athlete Mode is available.
To select Athlete Mode press the > button until displayed, then press the button. An athlete is defined as a person who is involved in intense physical activity of approximately 12 hours per week and who has a resting heart rate of approximately 60 beats per minute or less.
-
The display will show your settings, then switch off. The memory is set.
-
Repeat procedure for a second user, or to change user details.
Note: To update or overwrite the memorised data, follow the same procedure, making changes as required.
WEIGHT & BODY FAT READINGS
Position the scale on a flat level surface.
- Press the Ⓞ button.
- Select your user number by pressing the >or buttons.
- WAIT while the display reconfirms your personal data then shows a zero reading.
- When zero is displayed, WITH BARE FEET, step onto the platform and stand still. Ensure your feet are in good contact with the 2 metal pads on the platform.
- After 2-3 seconds your weight will be displayed.
- Remain standing on the scale while your other readings are taken.
- Your weight is displayed followed by your body fat %, total body water %, BMI, muscle mass, BMR and bone mass.
BODY FAT -WHAT DOES IT MEAN? The human body is made up of, amongst other things, a percentage of fat. This is vital for a healthy, functioning body - it cushions joints and protects vital organs, helps regulate body temperature, stores vitamins and helps the body sustain itself when food is scarce. However, too much body fat or indeed too little body fat can be damaging to your health. It is difficult to gauge how much body fat we have in our bodies simply by looking at ourselves in the mirror. This is why it is important to measure and monitor your body fat percentage. Body fat percentage gives you a better measure of fitness than weight alone - the composition of your weight loss could mean you are losing muscle mass rather than fat - you could still have a high percentage of fat even when a scale indicates 'normal weight'.
NORMAL HEALTHY RANGE OF BODY FAT PERCENTAGE
| BODY FAT % RANGES FOR BOYS*Age Low Optimal Moderate High | ||||
| 6 ≤12.4 12 | 5 -19.5 19.6 - 22.6 ≥22.7 | |||
| 7 ≤12.6 12 | 7 - 20.4 20.5 - 24.0 ≥24.1 | |||
| 8 ≤12.7 12 | 8 - 21.3 21.4 - 25.4 ≥25.5 | |||
| 9 ≤12.8 12 | 9 - 22.2 22.3 - 26.7 ≥26.8 | |||
| 10 ≤12.8 12 | 9 - 22.8 22.9 - 27.8 ≥27.9 | |||
| 11 ≤12.6 12 | 7 - 23.0 23.1 - 28.2 ≥28.3 | |||
| 12 ≤12.1 12 | 2 - 22.7 22.8 - 27.8 ≥27.9 | |||
| 13 ≤11.5 11 | 6 - 22.0 22.1 - 26.9 ≥27.0 | |||
| 14 ≤10.9 11 | 0 - 21.3 21.4 - 25.8 ≥25.9 | |||
| 15 ≤10.4 10 | 5 - 20.7 20.8 - 24.9 ≥25.0 | |||
| 16 ≤10.1 10 | 2 - 20.3 20.4 - 24.2 ≥24.3 | |||
| 17 ≤9.8 | 9.9 - 20.1 20.2 - 23.8 ≥23.9 | |||
| 18 ≤9.6 | 9.7 - 20.1 20.2 - 23.5 ≥23.6 | |||
| BODY FAT % RANGES FOR GIRLS* | ||
| Age Low Optimal | Moderate High | |
| 6 ≤14.4 14 | 5 - 23.0 23.1 - 26.1 ≥26.2 | |
| 7 ≤14.9 15 | 0 - 24.5 24.6 - 27.9 ≥28.0 | |
| 8 ≤15.3 15 | 4 - 26.0 26.1 - 29.6 ≥29.7 | |
| 9 ≤15.7 15 | 8 - 27.2 27.3 - 31.1 ≥31.2 | |
| 10 ≤16.0 16 | 1 - 28.2 28.3 - 32.1 ≥32.2 | |
| 11 ≤16.1 16 | 2 - 28.8 28.9 - 32.7 ≥32.8 | |
| 12 ≤16.1 16 | 2 - 29.1 29.2 - 33.0 ≥33.1 | |
| 13 ≤16.1 16 | 2 - 29.4 29.5 - 33.2 ≥33.3 | |
| 14 ≤16.0 16 | 1 - 29.6 29.7 - 33.5 ≥33.6 | |
| 15 ≤15.7 15 | 8 - 29.9 30.0 - 33.7 ≥33.8 | |
| 16 ≤15.5 15 | 6 - 30.1 30.2 - 34.0 ≥34.1 | |
| 17 ≤15.1 15 | 2 - 30.1 30.2 - 34.3 ≥34.4 | |
| 18 ≤14.7 14 | 8 - 30.8 30.9 - 34.7 ≥34.8 | |
| 19 - 39 | ≤8 | 8.1 - 19.9 | 20 - 24.9 | ≥25 |
| 40 - 59 | ≤11 | 11.1 - 21.9 | 22 - 27.9 | ≥28 |
| 60+ | ≤13 | 13.1 - 24.9 | 25 - 29.9 | ≥30 |
| 19 - 39 | ≤21 | 21.1 - 32.9 | 33 - 38.9 | ≥39 |
| 40 - 59 | ≤23 | 23.1 - 33.9 | 34 - 39.9 | ≥40 |
| 60+ | ≤24 | 24.1 - 35.9 | 36 - 41.9 | ≥42 |
*Source: Derived from; HD McCarthy, TJ Cole, T Fry, SA Jebb and AM Prentice: "Body fat reference curves for children". International Journal of Obesity (2006) 30, 598–602. **Source: Derived from; Dymna Gallagher, Steven B Heymsfield, Moonseong Heo, Susan A Jebb, Peter R Murgatroyd, and Yoichi Sakamoto: "Healthy percentage body fat ranges: an approach for developing guidelines based on body mass index1–3". Am J Clin Nutr 2000;72:694–701. The Body Fat % ranges published are for guidance only. Professional medical guidance should always be sought before embarking on diet and exercise programs.
BODY WATER -WHY MEASURE IT? Body water is the single most important component of body weight. It represents over half of your total weight and almost two thirds of your lean body mass (predominantly muscle). Water performs a number of important roles in the body: All the cells in the body, whether in the skin, glands, muscles, brain or anywhere else, can only function properly if they have enough water. Water also plays a vital part in regulating the body's temperature balance, particularly through perspiration. The combination of your weight and fat measurement could appear to be 'normal' but your body hydration level could be insufficient for healthy living.
NORMAL HEALTHY RANGE OF BODYWATER PERCENTAGE
| BODY WATER CHART*** | ||
| BF % Range | Optimal BW % Range | |
| Men | 4 to 14% | 70 to 63% |
| 15 to 21% | 63 to 57% | |
| 22 to 24% | 57 to 55% | |
| 25 and over | 55 to 37% | |
| Women | 4 to 20% | 70 to 58% |
| 21 to 29% | 58 to 52% | |
| 30 to 32% | 52 to 49% | |
| 33 and over | 49 to 37% |
***Source: Derived from Wang & Deurenberg: "Hydration of fat-free body mass". American Journal Clin Nutr 1999, 69 833-841.
For those using Athlete Mode: note that athletes may have a lower body fat range and a higher body water range than shown above, depending on their type of sport or activity. Body water measurement results are influenced by the proportion of body fat and muscle. If the proportion of body fat is high, or the proportion of muscle is low then the body water results will tend to be low. It is important to remember that measurements such as body weight, body fat and body water are tools for you to use as part of your healthy lifestyle. As short term fluctuations are normal, we suggest you chart your progress over time, rather than focus on a single days reading. The Body Water % ranges published are for guidance only. Professional medical guidance should always be sought before embarking on diet and exercise programmes.
WHY SHOULD I KNOW MY MUSCLE MASS? According to the American College of Sports Medicine (ASCM), lean muscle mass may decrease by nearly 50 percent between the ages of 20 and 90. If you don't do anything to replace that loss you're losing muscle and increasing fat. It is also important to know your muscle mass % during weight reduction. At rest, the body burns approximately 110 additional calories for each kilo of muscle gained. Some advantages of gaining muscle mass include:
- Reversing the decline in strength, bone density and muscle mass that accompanies age
• Maintenance of flexible joints
• Guide weight reduction when combined with a healthy diet.
This product is for domestic use only. Pregnant women should only use the weight function.
CAUTION : Do not use this product if you have a pacemaker or other medical device fitted. If in doubt, consult your doctor.
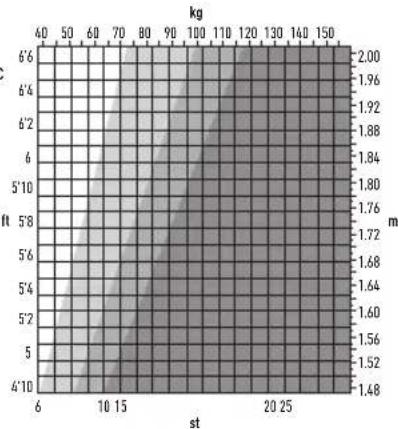
WHAT DOES MY BMI VALUE MEAN? Body Mass Index (BMI) is an index of weight-for-height that is commonly used to classify underweight, overweight and obesity in adults. This scale calculates your BMI value for you. The BMI categories shown in the chart and table below are recognised by the WHO (World Health Organisation) and can be used to interpret your BMI value.
Your BMI category can be identified using the table below.
| BMI Category | BMI Value Meaning Health Risk Based Solely On BMI | |
| < 18.5 | Underweight | Moderate |
| 18.6-24.9 | Normal | Low |
| 25-29.9 | Overweight | Moderate |
| 30+ | Obese | High |
IMPORTANT: If the chart/table shows that you are outside of a 'normal' healthy weight range, consult your doctor before taking any action. BMI classifications are for adults (age 20+ years) only.
BASAL METABOLIC RATE (BMR) - WHAT DOES IT
MEAN? Your Basal Metabolic Rate (BMR) is an estimation of the energy (measured in calories) expended by the body, at rest, to maintain normal body functions. This continual work makes up about 60-70% of the calories the body uses, and includes the beating of your heart, respiration, and the maintenance of body temperature. Your BMR is influenced by a number of factors, including age,
weight, height, gender, dieting and exercise habits.
BONE MASS -WHY MEASURE IT? Regular exercise and a balanced diet can help maintain healthy bones. Like muscle, bone is a living tissue that can respond to exercise by becoming stronger. For most people, bone mass peaks during their thirties. After that time, we can begin to lose bone. Regular exercise can help prevent that loss. Calcium and vitamin D contribute to healthy bones. Good sources of these are dairy products, green leafy vegetables and fish.
The bone mass readings given by this product are an estimation of the amount of bone in your body. Those with osteoporosis or low bone densities may not get accurate estimations. If you have concerns regarding your bones you should always consult your doctor.
QUESTIONS & ANSWERS
How exactly is my body fat and water being measured? This Salter Scale uses a measurement method known as Bioelectrical Impedance Analysis (BIA). A minute current is sent through your body, via your feet and legs. This current flows easily through the lean muscular tissue, which has a high fluid content, but not easily through fat. Therefore, by measuring your body's impedance (i.e. its resistance to the current), the quantity of muscle can be determined. From this, the quantity of fat and water can then be estimated.
What is the value of the current passing through me when the measurement is taken? Is it safe? The current is less than 1mA, which is tiny and perfectly safe. You will not be able to feel it. Please note however, that this device should not be used by anyone with an internal electronic medical device, such as a pacemaker, as a precaution against disruption to that device.
If I measure my body fat and water at different times during the day, it can vary quite considerably. Which value is correct? Your body fat percentage reading varies with body water content, and the latter changes throughout the course of the day. There is no right or wrong time of the day to take a reading, but aim to take measurements at a regular time when you consider your body to be normally hydrated. Avoid taking readings after having a bath or sauna, following intensive exercise, or within 1–2 hours of drinking in quantity or eating a meal.
My friend has a Body Fat Analyser made by another manufacturer. When I used it I found that I got a different body fat reading. Why is this?
Different Body Fat Analysers take measurements around different parts of the body and use different mathematic algorithms to calculate the percentage of body fat. The best advice is to not make comparisons from one device to another, but to use the same device each time to monitor any change.
How do I interpret my body fat and water percentage readings? Please refer to the Body Fat and Water tables included with the product. They will guide you as to whether your body fat and water reading falls into a healthy category (relative to your age and sex).
What should I do if my body fat reading is very 'high? A sensible diet, fluid intake and exercise program can reduce your body fat percentage. Professional medical guidance should always be sought before embarking on such a program.
Why are the body fat percentage ranges for men and women so different? Women naturally carry a higher percentage of fat than men, because the make-up of the body is different being geared towards pregnancy, breastfeeding etc.
What should I do if my water percentage reading is 'low'? Ensure that you are regularly taking sufficient water and work towards moving your fat percentage into the healthy range.
Why should I avoid using the Body Analyser Scale whilst pregnant? During pregnancy a woman's body composition changes considerably in order to support the developing child. Under these circumstances, body fat percentage readings could be inaccurate and misleading. Pregnant women should therefore only use the weight function.
ADVICE FOR USE AND CARE Always weigh yourself on the same scale placed on the same floor surface. Do not compare weight readings from one scale to another as some differences will exist due to manufacturing tolerances. • Placing your scale on a hard, even floor will ensure the greatest accuracy and consistency. • It is recommended that you measure at the same time of the day, preferably early evening before a meal for the most consistent results. • Your scale rounds up or down to the nearest increment. If you weigh yourself twice and get two different readings, your weight lies between the two. • Clean your scale with a damp cloth. Do not use chemical cleaning agents. • Do not allow your scale to become saturated with water as this can damage the electronics. • Treat your scale with care - it is a precision instrument. Do not drop it or jump on it. • Caution: the platform may become slippery when wet.
TROUBLESHOOTING GUIDE You must have bare feet when using body fat and total body water measurements. • The condition of your skin on the bottom of your feet can affect the reading. To get the most accurate and consistent reading, wipe your feet with a damp cloth, leaving them slightly moist before stepping on the scale.
WARNING INDICATORS
Lo Replace battery.
O-Ld Weight exceeds maximum capacity.
Err Out of range, incorrect operation or poor feet contact. Unstable weight. Stand still.
TECHNICAL SPECIFICATION
80 cm - 220 cm Athlete mode = 15-50 years
2'7" - 7'2" d = 0.1 % body fat
6 - 100 years d = 0.1 % body water
Male/Female d = 0.1 % muscle mass
10 user memory d = 1 kcal BMR
Child mode = 6-10 years
WEEE EXPLANATION This marking indicates that this product should not be disposed with other household wastes throughout the EU. To prevent possible harm to the environment or human health from uncontrolled waste disposal, recycle it responsibly to promote the sustainable reuse of material resources. To return your used device, please use the return and collection systems or contact the retailer where the product was purchased. They can take this product for environmental safe recycling.
BATTERY DIRECTIVE This symbol indicates that batteries must not be disposed of in the domestic waste as they contain substances which can be damaging to the environment and health. Please dispose of batteries in designated collection points.
GUARANTEE This product is intended for domestic use only. Salter will repair or replace the product, or any part of this product, (excluding batteries) free of charge if within 15 years of the date of purchase, it can be shown to have failed through defective workmanship or materials. This guarantee covers working parts that affect the function of the product. It does not cover cosmetic deterioration caused by fair wear and tear or damage caused by accident or misuse. Salter shall not be responsible for any type of incidental, consequential or special damages. Opening or taking apart the product or its components will void the guarantee. Claims under guarantee must be supported by proof of purchase and be returned carriage paid to Salter (or local Salter appointed agent if outside the UK). Care should be taken in packing the product so that it is not damaged while in transit. This undertaking is in addition to a consumer's statutory rights and does not affect those rights in any way. For UK Sales and Service contact HoMedics Group Ltd, HoMedics House, Somerhill Business Park, Five Oak Green Road, Tonbridge, Kent TN11 OGP, UK. Helpline Tel No: (01732) 360783. For Ireland, please contact Petra Brand Masters, Unit J4 Maynooth Business Campus, Maynooth, Co. Kildare, Ireland. Tel +00 353 (0) 1 6510660. e-mail sales@petrabrandmasters.ie.
www.salterhousewares.com/servicecentres
F
*Fonte: Adaptado de HD McCarthy, TJ Cole, T Fry, SA Jebb and AM Prentice: "Body fat reference curves for children", International Journal of Obesity (2006) 30, 598–602.
**Fonte: Adaptado de Dympna Gallagher, Steven B Heymsfield, Moonseong Heo, Susan A Jebb, Peter R Murgatroyd, and Yoichi Sakamoto: "Healthy percentage body fat ranges: an approach for developing guidelines based on body mass index1-3". Am J Clin Nutr 2000;72:694-701.
PERGUNTAS E RESPOSTAS
NORMAL SUNN KROPPSFETTPROSENT
| KROPPSFETT%NIVÄ FOR GUTTER ^+ | ||||
| Alder Lav Optimal Moderat | Høy | |||
| 6 | ≤12.4 | 12.5 - 19.5 | 19.6 - 22.6 | ≥22.7 |
| 7 | ≤12.6 | 12.7 - 20.4 | 20.5 - 24.0 | ≥24.1 |
| 8 | ≤12.7 | 12.8 - 21.3 | 21.4 - 25.4 | ≥25.5 |
| 9 | ≤12.8 | 12.9 - 22.2 | 22.3 - 26.7 | ≥26.8 |
| 10 | ≤12.8 | 12.9 - 22.8 | 22.9 - 27.8 | ≥27.9 |
| 11 | ≤12.6 | 12.7 - 23.0 | 23.1 - 28.2 | ≥28.3 |
| 12 | ≤12.1 | 12.2 - 22.7 | 22.8 - 27.8 | ≥27.9 |
| 13 | ≤11.5 | 11.6 - 22.0 | 22.1 - 26.9 | ≥27.0 |
| 14 | ≤10.9 | 11.0 - 21.3 | 21.4 - 25.8 | ≥25.9 |
| 15 | ≤10.4 | 10.5 - 20.7 | 20.8 - 24.9 | ≥25.0 |
| 16 | ≤10.1 | 10.2 - 20.3 | 20.4 - 24.2 | ≥24.3 |
| 17 | ≤9.8 | 9.9 - 20.1 | 20.2 - 23.8 | ≥23.9 |
| 18 | ≤9.6 | 9.7 - 20.1 | 20.2 - 23.5 | ≥23.6 |
KROPPSFETT%NIVÄ FOR JENTER*
| Alder Lav | Optimal Moderat | Høy | ||
| 6 | ≤14.4 | 14.5 - 23.0 | 23.1 - 26.1 | ≥26.2 |
| 7 | ≤14.9 | 15.0 - 24.5 | 24.6 - 27.9 | ≥28.0 |
| 8 | ≤15.3 | 15.4 - 26.0 | 26.1 - 29.6 | ≥29.7 |
| 9 | ≤15.7 | 15.8 - 27.2 | 27.3 - 31.1 | ≥31.2 |
| 10 | ≤16.0 | 16.1 - 28.2 | 28.3 - 32.1 | ≥32.2 |
| 11 | ≤16.1 | 16.2 - 28.8 | 28.9 - 32.7 | ≥32.8 |
| 12 | ≤16.1 | 16.2 - 29.1 | 29.2 - 33.0 | ≥33.1 |
| 13 | ≤16.1 | 16.2 - 29.4 | 29.5 - 33.2 | ≥33.3 |
| 14 | ≤16.0 | 16.1 - 29.6 | 29.7 - 33.5 | ≥33.6 |
| 15 | ≤15.7 | 15.8 - 29.9 | 30.0 - 33.7 | ≥33.8 |
| 16 | ≤15.5 | 15.6 - 30.1 | 30.2 - 34.0 | ≥34.1 |
| 17 | ≤15.1 | 15.2 - 30.1 | 30.2 - 34.3 | ≥34.4 |
| 18 | ≤14.7 | 14.8 - 30.8 | 30.9 - 34.7 | ≥34.8 |
KROPPSFETT%NIVÅ FOR MENN**
| Alder Lav Optimal Moderat | Høy | |||
| 19 - 39 | ≤8 | 8.1 - 19.9 | 20 - 24.9 | ≥25 |
| 40 - 59 | ≤11 | 11.1 - 21.9 | 22 - 27.9 | ≥28 |
| 60+ | ≤13 | 13.1 - 24.9 | 25 - 29.9 | ≥30 |
KROPPSFETT%NIVÄ FOR KVINNER**
| Alder Lav Optimal Moderat | Høy | |||
| 19 - 39 | ≤21 | 21.1 - 32.9 | 33 - 38.9 | ≥39 |
| 40 - 59 | ≤23 | 23.1 - 33.9 | 34 - 39.9 | ≥40 |
| 60+ | ≤24 | 24.1 - 35.9 | 36 - 41.9 | ≥42 |
NORMAL SUNN KROPPSVANNPROSENT
heatmap
| ft | 6 | 5 | 4 | 3 | 2 | 1 | 0 | | :--- | :--- | :--- | :--- | :--- | :--- | :--- | :--- | | 6'6 | 150 | 148 | 152 | 156 | 160 | 168 | 172 | | 6'4 | 150 | 148 | 152 | 156 | 160 | 168 | 172 | | 6'2 | 150 | 148 | 152 | 156 | 160 | 168 | 172 | | 6 | 150 | 148 | 152 | 156 | 160 | 168 | 172 | | 5'10 | 150 | 148 | 152 | 156 | 160 | 168 | 172 | | 5'8 | 150 | 148 | 152 | 156 | 160 | 168 | 172 | | 5'6 | 150 | 148 | 152 | 156 | 160 | 168 | 172 | | 5'4 | 150 | 148 | 152 | 156 | 160 | 168 | 172 | | 5'2 | 150 | 148 | 152 | 156 | 160 | 168 | 172 | | 5 | 150 | 148 | 152 | 156 | 160 | 168 | 172 | | 4'10 | 150 | 148 | 152 | 156 | 160 | 168 | 172 | The chart displays a single data series with no explicit title, axes labels, or legend are present. The values for the table represent the depth of the measurement at each depth level. There is only one data series plotted as a line on the graph. The x-axis label 'st' ranges from approximately from -6 to +25. The y-axis label 'ft' ranges from approximately from -6 to +25. There is no additional data series or labels provided in the image.WAARSCHUWINGSMELDINGEN
Lo Batterij vervangen.
*Lähde: Derived from; HD McCarthy, TJ Cole, T Fry, SA Jebb and AM Prentice; HD McCarthy, TJ Cole, T Fry, SA Jebb ja AM Prentice: "Body far reference curves for children". International Journal of Obesity (2006) 0, 598–602.
heatmap
| ft | 6 | 10 | 15 | 20 | 25 | |---|---|---|---|---|---| | 4'6 | 1.96 | 1.92 | 1.88 | 1.84 | 1.80 | | 6'4 | 1.92 | 1.88 | 1.84 | 1.80 | 1.76 | | 6'2 | 1.88 | 1.84 | 1.80 | 1.76 | 1.72 | | 6 | 1.84 | 1.80 | 1.76 | 1.72 | 1.68 | | 5'10 | 1.80 | 1.76 | 1.72 | 1.68 | 1.64 | | 5'8 | 1.76 | 1.72 | 1.68 | 1.64 | 1.60 | | 5'6 | 1.72 | 1.68 | 1.64 | 1.60 | 1.56 | | 5'4 | 1.68 | 1.64 | 1.60 | 1.56 | 1.52 | | 5'2 | 1.64 | 1.60 | 1.56 | 1.52 | 1.48 | | 5 | 1.52 | 1.56 | 1.52 | 1.48 | 1.44 | | 4'10 | 1.48 | 1.44 | 1.40 | 1.36 | 1.32 | The chart displays a single data series with 'ft' on the y-axis and 'st' on the x-axis, both ranging from -4 to +4 in units of kg and meters respectively. The color gradient indicates the value of the corresponding variable at each point, with darker shades representing higher values and lighter shades indicating lower values.BASALSTOFSKIFTE (BMR) - HVAD BETYDER DET?
MNOŽSTVÍ TUKU V TĚLE – CO TO ZNAMENÁ?
heatmap
| ft | 6 | 5 | 4 | 3 | 2 | 1 | 0 | |---|---|---|---|---|---|---|---| | 6'6 | 40 | 50 | 60 | 70 | 80 | 90 | 100 | | 6'4 | 50 | 60 | 70 | 80 | 90 | 100 | 110 | | 6'2 | 60 | 70 | 80 | 90 | 100 | 110 | 120 | | 6 | 70 | 80 | 90 | 100 | 110 | 120 | 130 | | 5'10 | 80 | 90 | 100 | 110 | 120 | 130 | 140 | | 5'8 | 90 | 100 | 110 | 120 | 130 | 140 | 150 | | 5'6 | 100 | 110 | 120 | 130 | 140 | 150 | 160 | | 5'4 | 110 | 120 | 130 | 140 | 150 | 160 | 170 | | 5'2 | 120 | 130 | 140 | 150 | 160 | 170 | 180 | | 5 | 130 | 140 | 150 | 160 | 170 | 180 | 190 | | 4'10 | 140 | 150 | 160 | 170 | 180 | 190 | 200 | The chart displays a single data series with x-axis labeled 'st' and y-axis labeled 'ft'. The values for each row are explicitly labeled as 'm', and the grid is colored based on the 'kg' value, with darker shades representing higher 'kg' values. There is no additional data series or labels provided in the image.WYKRES ZAWARTOŚCI WODY***
| Zakres % BF | Optymalny zakres % TBW | |
| Mężczyźni | 4 do 14% | 70 do 63% |
| 15 do 21% | 63 do 57% | |
| 22 do 24% | 57 do 55% | |
| 25 i więcej | 55 do 37% | |
| Kobiety | 4 do 20% | 70 do 58% |
| 21 do 29% | 58 do 52% | |
| 30 do 32% | 52 do 49% | |
| 33 i więcej | 49 do 37% |
This product is intended for domestic use.
ADVICE TO THE USER This product is a sensitive electronic instrument and as such may temporarily be affected by Radio Transmitting Devices being used in close proximity to it (such as Mobile Phones, Walkie Talkies, CB Radios, Radio Model Controllers, and some Microwave Ovens, etc.) Additionally, extreme levels of Electrostatic Interference may cause this product to temporarily malfunction. In such case it may be necessary to remove and re-install the battery to re-establish normal working. If the problem persists then contact your local agent.
F COMPATIBILITE ELECTROMAGNETIQUE
Address: HoMedics Group Ltd, HoMedics House, Somerhill Business Park, Five Oak Green Road, Tonbridge, Kent, TN11 OGP, UK Email: support@homedics.co.uk
_
| _
一
1
SALTER
HoMedics Group Ltd
Homedics House, Somerhill Business Park
Five Oak Green Road, Tonbridge,
Kent TN11 0GP
www.salterhousewares.co.uk IB-9112-0417-01