
MaxiSYS MS908CV - Car diagnostic tool Autel - Free user manual and instructions
Find the device manual for free MaxiSYS MS908CV Autel in PDF.


| Product Type | Professional Automotive Diagnostic Tablet |
| Brand | Autel |
| Model | MaxiSYS MS908CV |
| Display Size | 10.1-inch capacitive touchscreen |
| Resolution | 1920 x 1200 pixels |
| Dimensions (H x W x D) | 260 mm x 180 mm x 40 mm |
| Weight | 1.5 kg (approx.) |
| Power Supply | Internal rechargeable Li-ion battery, 12V DC adapter |
| Operating System | Android 4.4 (customized) |
| CPU | Quad-core 1.4 GHz processor |
| Storage | 32 GB internal memory |
| Connectivity | Wi-Fi, Bluetooth, USB, SD Card slot |
| Main Functions | Full system diagnostics, oscilloscope, multimeter, service reset, coding |
| Vehicle Coverage | OBD-II, CAN, and most domestic & import vehicles |
| Software Updates | Free updates for 1 year, subscription later |
| Languages | Multi-language interface (including EN) |
| Maintenance & Cleaning | Wipe with dry cloth; avoid liquids |
| Safety | Use only in ventilated areas; follow vehicle manufacturer warnings |
| Spare Parts & Repairability | Contact Autel service center; no user-serviceable parts |
| General Information | Designed for professional mechanics; includes diagnostic connector cables and accessories |
Frequently Asked Questions - MaxiSYS MS908CV Autel
User questions about MaxiSYS MS908CV Autel
0 question about this device. Answer the ones you know or ask your own.
Ask a new question about this device
Download the instructions for your Car diagnostic tool in PDF format for free! Find your manual MaxiSYS MS908CV - Autel and take your electronic device back in hand. On this page are published all the documents necessary for the use of your device. MaxiSYS MS908CV by Autel.
USER MANUAL MaxiSYS MS908CV Autel
Autel ^® , MaxiSys ^® , MaxiDAS ^® , MaxiScan ^® , MaxiTPMS ^® , MaxiRecorder ^® , and MaxiCheck ^® are trademarks of Autel Intelligent Technology Corp., Ltd., registered in China, the United States and other countries. All other marks are trademarks or registered trademarks of their respective holders.
Copyright Information
No part of this manual may be reproduced, stored in a retrieval system or transmitted, in any form or by any means, electronic, mechanical, photocopying, recording, or otherwise, without the prior written permission of Autel.
Disclaimer of Warranties and Limitation of Liabilities
All information, specifications and illustrations in this manual are based on the latest information available at the time of printing.
Autel reserves the right to make changes at any time without notice. While information of this manual has been carefully checked for accuracy, no guarantee is given to the completeness and correctness of the contents, including but not limited to the product specifications, functions, and illustrations.
Autel will not be liable for any direct damages or for any special, incidental, or indirect damages or for any economic consequential damages (including lost profits).
For Services and Support:

http://pro.autel.com
www.autel.com

1-855-288-3587/1-855-AUTELUS (North America)
0086-755-86147779 (China)

Support@autel.com
For technical assistance in all other markets, please contact your local selling agent.
Safety Information
For your own safety and the safety of others, and to prevent damage to the device and vehicles upon which it is used, it is important that the safety instructions herein presented throughout this manual be read and understood by all persons operating or coming into contact with the device.
There are various procedures, techniques, tools, and parts for servicing vehicles, as well as in the skill of the person doing the work. Because of the vast number of test applications and variations in the products that can be tested with this equipment, we cannot possibly anticipate or provide advice or safety messages to cover every circumstance. It is the automotive technician's responsibility to be knowledgeable of the system being tested. It is crucial to use proper service methods and test procedures. It is essential to perform tests in an appropriate and acceptable manner that does not endanger your safety, the safety of others in the work area, the device being used, or the vehicle being tested.
Before using the device, always refer to and follow the safety messages and applicable test procedures provided by the manufacturer of the vehicle or equipment being tested. Use the device only as described in this manual. Read, understand, and follow all safety messages and instructions in this manual.
Safety Messages
Safety messages are provided to help prevent personal injury and equipment damage. All safety messages are introduced by a signal word indicating the hazard level.

DANGER
Indicates an imminently hazardous situation which, if not avoided, will result in death or serious injury to the operator or to bystanders.

WARNING
Indicates a potentially hazardous situation which, if not avoided, could result in death or serious injury to the operator or to bystanders.
Safety Instructions
The safety messages herein cover situations Autel is aware of. Autel cannot know, evaluate or advise you as to all of the possible hazards. You must be
certain that any condition or service procedure encountered does not jeopardize your personal safety.
DANGER
When an engine is operating, keep the service area WELL VENTILATED or attach a building exhaust removal system to the engine exhaust system. Engines produce carbon monoxide, an odorless, poisonous gas that causes slower reaction time and can lead to serious personal injury or loss of life.

Do Not Turn the Volume Up Too Loud When Using Headphones
Listening at high volumes that over-stimulate the ear for long periods of time may result in loss of hearing.
SAFETY WARNINGS:
● Always perform automotive testing in a safe environment.
● Wear safety eye protection that meets ANSI standards.
- Keep clothing, hair, hands, tools, test equipment, etc. away from all moving or hot engine parts.
- Operate the vehicle in a well ventilated work area, for exhaust gases are poisonous.
- Put the transmission in PARK (for automatic transmission) or NEUTRAL (for manual transmission) and make sure the parking brake is engaged.
- Put blocks in front of the drive wheels and never leave the vehicle unattended while testing.
- Be extra cautious when working around the ignition coil, distributor cap, ignition wires and spark plugs. These components create hazardous voltages when the engine is running.
- Keep a fire extinguisher suitable for gasoline, chemical, and electrical fires nearby.
- Do not connect or disconnect any test equipment while the ignition is on or the engine is running.
- Keep the test equipment dry, clean, free from oil, water or grease. Use a mild detergent on a clean cloth to clean the outside of the equipment as necessary.
- Do not drive the vehicle and operate the test equipment at the same time. Any distraction may cause an accident.
- Refer to the service manual for the vehicle being serviced and adhere to all diagnostic procedures and precautions. Failure to do so may result in personal injury or damage to the test equipment.
- To avoid damaging the test equipment or generating false data, make sure the vehicle battery is fully charged and the connection to the vehicle DLC is clean and secure.
- Do not place the test equipment on the distributor of the vehicle. Strong electro-magnetic interference can damage the equipment.
CONTENTS
1 Using This Manual .... 1
CONVENTIONS....1
Bold Text....1
Terminology .... 1
Notes and Important Messages....1
Hyperlinks....2
Procedures 2
2 General Introduction....3
MAXISYS DISPLAY TABLET 4
Functional Description 4
Power Sources 6
Technical Specifications 6
VCI-J2534 ECU PROGRAMMING DEVICE....8
Functional Description 8
Power Sources 10
Technical Specifications 10
ACCESSORIES KIT 11
Main Cable....11
Other Accessories.... 13
3 Getting Started....15
POWERING UP 15
Application Buttons 16
Locator and Navigation Buttons....18
System Status Icons 19
POWERING DOWN....19
Reboot System 20
INSTALLING COMPUTER SOFTWARE 20
Printing Operation....20
4 CV Diagnostics Operations 22
ESTABLISHING VEHICLE COMMUNICATION 22
Vehicle Connection....22
VCI Connection....24
No Communication Message....26
GETTING STARTED 27
Vehicle Menu Layout 27
VEHICLE IDENTIFICATION 29
Auto VIN Detect 30
Manual VIN Input 31
Manual Vehicle Selection....32
Alternative Vehicle Identification 32
NAVIGATION 32
Diagnostics Screen Layout 33
Screen Messages 36
MAIN MENU 37
DIAGNOSIS....37
ECU Information 41
Trouble Codes 42
Live Data....43
Active Test....50
Special Functions....51
HOT FUNCTION....52
EXPERT 54
GENERIC OBD II OPERATIONS....55
General Procedure....55
Function Descriptions 57
EXITING CV DIAGNOSTICS....60
5 Data Manager Operations....61
OPERATIONS....61
Image Files 61
PDF Files 64
Review Data 64
Apps Uninstall....65
Data Logging 65
6 MaxiFix Operations 66
NAVIGATION 66
Terminology 68
OPERATIONS....69
Home 70
Search Fix Features....70
Ask....71
My MaxiFix....71
My Messages....73
Support 74
7 Settings Operations....76
OPERATIONS....76
Unit 76
Language....77
Printing Setting 77
Wired Network 77
Notification Center 78
Multitask....79
About 79
System Settings....80
8 Shop Manager Operations 81
VEHICLE HISTORY....82
Historical Test Record....83
WORKSHOP INFORMATION 85
CUSTOMER MANAGER....86
History Notes 87
9 Update Operations 90
10 VCI Manager Operations 93
BT PAIRING 94
UPDATE 95
11 Remote Desk Operations....96
OPERATIONS....96
12 Support Operations....98
PRODUCT REGISTRATION 98
SUPPORT SCREEN LAYOUT....99
MY ACCOUNT....100
USER COMPLAINT....100
DATA LOGGING....103
COMMUNITIES 104
TRAINING CHANNELS 106
FAQ DATABASE 106
13 Training Operations.... 108
14 Quick Link Operations.... 110
15 MaxiScope Operations....111
SAFETY INFORMATION....111
GLOSSARY 113
MAXISCOPE MODULE....116
Technical Specifications 118
SCREEN LAYOUT AND OPERATIONS 119
Top Toolbar 120
Functional Buttons 124
Measurement Grid 124
Measurement Rulers.... 126
Functional Buttons 127
TROUBLESHOOTING 128
MAXISCOPE FIRMWARE UPDATE....128
16 Digital Inspection Operations 130
ADDITIONAL ACCESSORIES 131
Accessory Assembly....132
Technical Specifications 134
OPERATIONS....134
17 Maintenance and Service.... 137
MAINTENANCE INSTRUCTIONS....137
TROUBLESHOOTING CHECKLIST 138
ABOUT BATTERY USAGE 139
SERVICE PROCEDURES 140
18 Compliance Information 142
19 Warranty....144
12-MONTH LIMITED WARRANTY 144
1 Using This Manual
This manual contains device usage instructions.
Some illustrations shown in this manual may contain modules and optional equipment that are not included in your system. Contact your sales representative for availability of other modules and optional tools or accessories.
Conventions
The following conventions are used.
Bold Text
Bold emphasis is used to highlight selectable items such as buttons and menu options.
Example:
Tap OK.
Terminology
The term “select” means highlighting a button or menu item and tapping it to confirm the selection.
Notes and Important Messages
The following messages are used.
Notes
A NOTE message provides helpful information such as additional explanations, tips, and comments.
Important
An IMPORTANT message indicates a situation which, if not avoided, may result in damage to the test equipment or vehicle.
Hyperlinks
Hyperlinks, or links, that take you to other related articles, procedures, and illustrations are available in electronic documents. Blue colored text indicates a selectable hyperlink.
Procedures
An arrow icon indicates a procedure.
Example:
To use the camera:
-
Tap the Camera button. The camera screen opens.
-
Focus the image to be captured in the view finder.
-
Tap the blue circle. The view finder now shows the captured picture and auto-saves the taken photo.
2 General Introduction
The MaxiSys ^® CV Diagnostic Platform is an evolutionary smart solution for specialized automotive diagnosis. Utilizing the powerful A9 quad-core 1.40GHz processor, and a 9.7 inch LED capacitive touch screen, combined with the best possible coverage of OE-level diagnostics, and based on the revolutionary multitask-capable Android Operating system, the MaxiSys organizes information with test instrumentation to help you diagnose symptoms, codes, and customer complaints easily, quickly and efficiently.
There are two main components to the MaxiSys system:
● MaxiSys Display Tablet -- the central processor and monitor for the system.
- Vehicle Communication Interface (VCI) -- the device for accessing vehicle data.
This manual describes the construction and operation of these devices and how they work together to deliver diagnostic solutions.
Functional Description

Figure 2-1 MaxiSys Tablet Front View
- 9.7" LED Capacitive Touch Screen
- Ambient Light Sensor – detects ambient brightness
- Microphone

Figure 2-2 MaxiSys Tablet Back View
-
Audio Speaker
-
Collapsible Stand – extends from the back to allow hands-free viewing of the Display Tablet at a 30 degree angle.
- Camera Lens
- Camera Flash

Figure 2-3 MaxiSys Tablet Left Side
- Mini SD (secure digital) Card Slot
- Mini USB (universal serial bus) OTG Port (It cannot be used at the same time with the No.4 Port in Figure 2-4 MaxiSys Tablet Top View)
- Head Phone Jack

Figure 2-4 MaxiSys Tablet Top View
- DC Power Supply Input Port
- HDMI (high-definition multimedia interface) Port
- USB Port
- USB Port (It cannot be used at the same time with the Mini USB Port in Figure 2-3 MaxiSys Tablet Left Side)
- Lock/Power Button –long press to turn on and off MaxiSys, or short press to lock the screen
Power Sources
The MaxiSys Display Tablet can receive power from any of the following sources:
- Internal Battery Pack
- AC/DC Power Supply
- Vehicle Power
IMPORTANT
Please charge the battery with the ambient temperature between 0^ C to 45^ C . If charge the battery when the temperature is out of range, the battery may catch on fire.
Internal Battery Pack
The Display Tablet can be powered with the internal rechargeable battery, which if fully charged can provide sufficient power for about 7.5 hours of continuous operation.
AC/DC Power Supply
The Display Tablet can be powered from a wall socket using the AC/DC power adapter. The AC/DC power supply also charges the internal battery pack.
Vehicle Power
The Display Tablet can be powered from the cigarette lighter or other suitable power port on the test vehicle through a direct cable connection. The vehicle power cable connects to the DC power supply port on the top side of the display unit.
Technical Specifications
Table 2-1 Specifications
| Item | Description |
| Operating System | Android^TM 4.4.2, KitKat |
| Processor | Samsung Exynos Six-core Processor (1.3GHzQuad-core ARM Cortex-A7 + 1.7GHz Dual-coreARM Cortex-A15) |
| Memory | 2GB RAM & 64GB On-board Memory |
| Display | 9.7 inch LED capacitive touch screen with 1024x768P resolution |
| Connectivity | WiFi (802.11 a/b/g/n)USB: 2.0BT v.2.1 + EDRSD Card (Support up to 32GB)HDMI |
| Camera (rear) | 8.0 Megapixel, AF with Flashlight |
| Sensors | Gravity Accelerometer, Ambient Light Sensor (ALS) |
| Audio Input/Output | MicrophoneDual Speakers3-Band 3.5 mm stereo/standard headset jack |
| Power and Battery | 11000 mAh 3.7 V lithium-polymer batteryCharging via 12 V AC/DC power supply with the temperature between 0 to 45°C |
| Input Voltage | 12 V (9-24 V) |
| Power Consumption | 6.5 W |
| Operating Temperature | 0 to 50°C (32 to 122°F) |
| Storage Temperature | -20 to 60°C (-4 to 140°F) |
| Dimensions (WXHXD) | 300 mm (11.81") x 220 mm (8.66") x 50 mm (1.97") |
| Weight | NW: 1.42 kg (3.13 lb), GW: 8.655 kg (19.08 lb) |
| Protocols | ISO 9142-2, ISO 14230-2, ISO 15765-4, K/L-Line, Flashing Code, SAE-J1850 VPW, SAE-J1850 PWM, CAN ISO 11898, Highspeed, Middlespeed, Lowspeed and Singlewire CAN, GM UART, UART Echo Byte Protocol, Honda Diag-H Protocol, TP 2.0, TP 1.6, SAE J1939, SAE J1708, Fault-Tolerant CAN |
VCI – J2534 ECU Programming Device
Functional Description
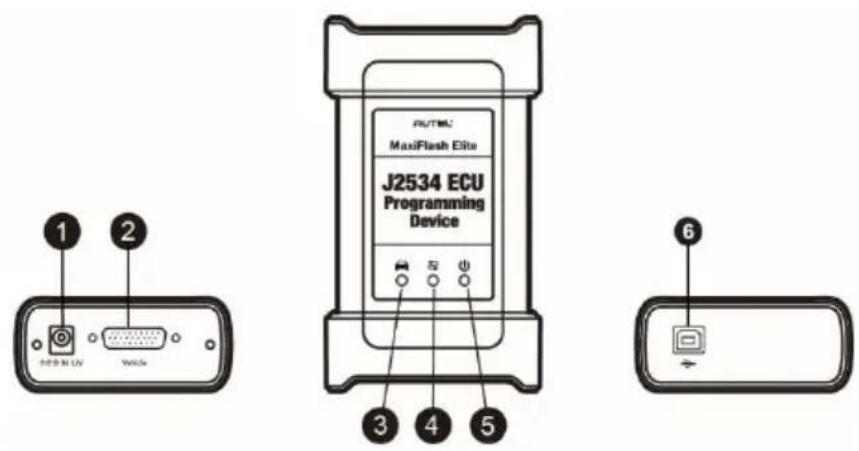
Figure 2-5 J2534 ECU Programming Device
- DC Power Supply Input Port
- Vehicle Data Connector
3. Vehicle LED
- Flashes green when the device communicates with the vehicle’s system
IMPORTANT
Do not disconnect the reprogramming device while this status light is on! If the flash reprogramming procedure is interrupted while the vehicle's ECU is blank or only partially programmed, the module may be unrecoverable.
4. Connection LED
- Illuminates solid green when the device is properly connected with the Display Tablet via the USB cable.
- Illuminates solid blue when the device is connected with the Display Tablet via wireless (BT) connection.
5. Power LED
- Illuminates solid green when the device is powered on.
● Flashes red when a system failure occurs. - Illuminates amber automatically at power up when the device is performing a self-test procedure.
6. USB Port
J2534 Reprogramming Capability
The J2534 ECU Programming Device is a SAE J2534-1 & -2 compliant PassThru reprogramming interface device. Using the updated OEM software, it is capable of replacing the existing software/firmware in the Electronic Control Units (ECU), programming new ECUs and fixing software-controlled drivability issues and emission issues.
Communication
The J2534 ECU programming device supports BT and USB communications. It can transmit vehicle data to the MaxiSys Display Tablet with or without a physical connection. The working range of the transmitter through BT communication is 210 feet (about 70 m). A signal lost due to the Display Tablet unit moving out of range automatically restores itself when the Display Tablet unit is brought closer to the VCI unit.
Power Sources
The J2534 programming device can receive power from both of the following sources:
- Vehicle Power
● AC/DC Power Supply
Vehicle Power
The J2534 programming device operates on 12-volt vehicle power, which it receives through the vehicle data connection port. The device powers on whenever it is connected to an OBD II/EOBD compliant data link connector (DLC). For non OBD II/EOBD compliant vehicles, the device can be powered from a cigarette lighter or other suitable power port on the test vehicle using the auxiliary power cable.
AC/DC Power Supply
The J2534 programming device can be powered from a wall socket using the AC/DC power adapter.
Technical Specifications
Table 2-2 Specifications
| Item | Description |
| Communications | Wireless BT V2.1 + EDRUSB 2.0 |
| Wireless Frequency | Wireless BT V2.1+EDR, 2.4GHz |
| Input Voltage Range | 12 VDC to 24 VDC |
| Supply Current | 170 mA @ 12 VDC100 mA @ 24 VDC |
| Operating | 0°C to +60°C (ambient) |
| Temperature | |
| Storage Temperature | -65°C to +100°C (ambient) |
| Dimensions (LxWx H) | 149mm (5.87") x 86mm (3.38") x 35mm (1.28") |
| Weight | 0.29 kg (0.64 lb) |

NOTE
For additional information please refer to the accompanied user manual for the J2534 ECU Programming Device.
Accessories Kit
Main Cable
The VCI device can be powered through the Main Cable when connected to an OBD II/EOBD compliant vehicle. The Main Cable connects the VCI device to the vehicle's data link connector (DLC), through which the VCI device can transmit vehicle data to the MaxiSys Display Tablet.

natural_image
Line drawing of a broadband cable with two VGA connectors (no text or symbols)Figure 2-6 Main Cable - 1.5 m in length
Non OBD II Adapters
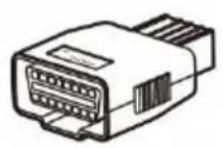
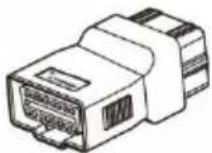
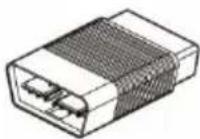
The adapter used depends on the type of vehicle being tested. The most common adapters are shown below (Some adapters are optional, please contact your distributor for details).
Volvo-8

Benz-14

Iveco-38

HALDEX-4

Scania/DAF-16

Volvo-14

Man-37

Deutsch-9

Iveco-30

Hitachi-4

Man-12

Isuzu-20

Hitachi-6

Cat-9

Komatsu-12

natural_image
Line drawing of a mechanical connector or connector with ports and connectors (no text or symbols)WABCO-KNORR-7
Renault-12

Deutsch-6
Hyundai CV
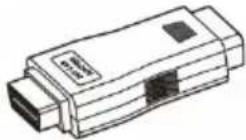
24V CAN Adapter

MITSUBISHI-
HYUNDAI-12+16

Unit-4

Cummins-8

JW1 x2

JW2 x2

JW3 x2

JW4 x2

JW5 x2

JW6 x2

JW7 x2

JW8 x2
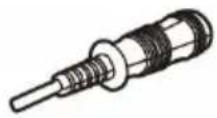
JW9 x2

JW10 x2

ABS-EBS-7
Other Accessories

MaxiFlash Elite
J2534 ECU programming device.

Standard USB Cable
Connects the Display Tablet to the VCI unit.

Mini USB Cable
Connects the Display Tablet to the PC.
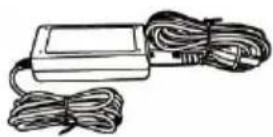
AC/DC External Power Adapter (12V)
Connects the Display Tablet to the external DC power port for power supply.

Cigarette Lighter
Provides power to the Display Tablet or the J2534 programming device through connection to the vehicle's cigarette lighter receptacle, as some non-OBD II vehicles cannot provide power via the DLC connection.

Clipper Cable
Provides power to the Display Tablet or the J2534 programming device, through connection to the vehicle's battery.

Light Fuse
A safety device for the cigarette lighter.
3 Getting Started
Make sure the MaxiSys Display Tablet has a charged battery or is connected to the DC power supply (see Power Sources on page 6).
Powering Up
Press the Lock/Power button on the top right side of the Display Tablet to switch the unit on. The system boots up, and shows the lock screen. Press and drag the inner ring to the edge of the circle to unlock the screen; the MaxiSys Job Menu is shown as below.
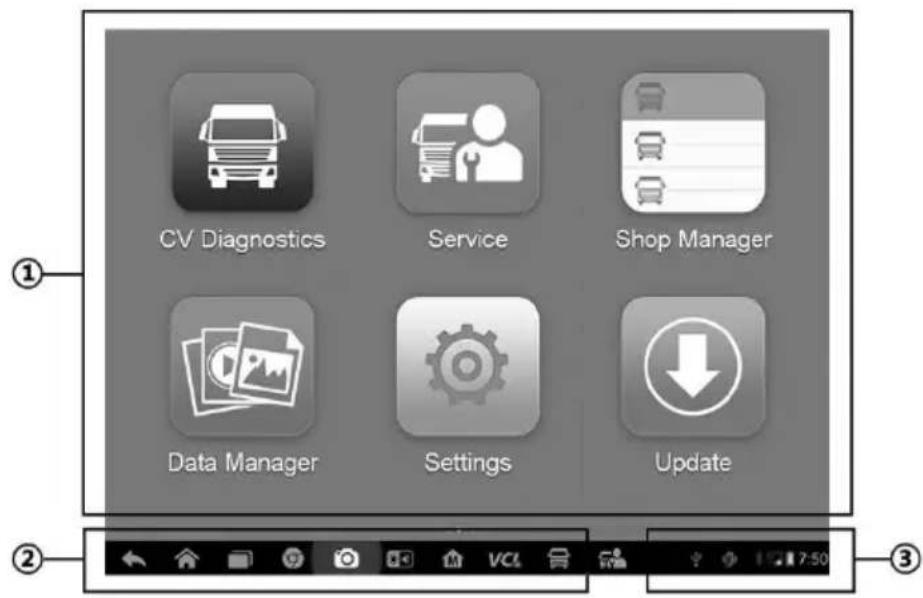
Figure 3-1 Sample MaxiSys Job Menu
- Application Buttons
- Locator and Navigation Buttons
- Status Icons

NOTE
The screen is locked by default when you first turn on the Display Tablet. It is recommended to lock the screen to protect information in the system and reduce battery usage.
Almost all operations on the Display Tablet are controlled through the touch screen. The touch screen navigation is menu driven, which allows you to quickly locate the test procedure, or data that you need, through a series of choices and questions. Detailed descriptions of the menu structures are found in the chapters for the various applications.
Application Buttons
The Application buttons configure the MaxiSys for the type of operation or activity to be performed. The table below gives brief descriptions of the available applications.
Use the stylus pen or your finger tip to select an application from the Job Menu.
Table 3-1 Applications
| Name | Button | Description |
| CV Diagnostics |  | Configures the unit to operate as a diagnostic tool. See CV Diagnostics Operations on page 22. |
| Data Manager |  | Opens the organization system for saved data files. See Data Manager Operations on page 61. |
| MaxiFix |  | Launches the MaxiFix platform which provides the most compatible and abundant repair techniques and diagnostics database. See MaxiFix Operations on page 66. |
| Settings |  | Allows you to set the MaxiSys system settings, and to view the general information about the Display Tablet. See Settings Operations on page 76. |
| Shop Manager |  | Allows you to edit and save workshop information and customer data, as well as reviewing test vehicle history records. See Shop Manager Operations on page 81. |
| Update |  | Checks for the latest update available for the MaxiSys system, and performs updatingprocedures. SeeUpdate Operationson page 90. |
| VCI Manager |  | Establishes and manages BT or wired connections to the VCI device. SeeVCI Manager Operationson page 93. |
| Remote Desk |  | Configures your unit to receive remote support using the TeamViewer application program. SeeRemote Desk Operationson page 96. |
| Support |  | Launches the Support platform which synchronizes Autel's on-line service base station with the MaxiSys tablet. SeeSupport Operationson page 98. |
| Training |  | Allows you to store and play technical tutorial and training videos about the device usage or vehicle diagnostic techniques. SeeTraining Operationson page 108. |
| Quick Link |  | Provides associated website bookmarks to allow quick access to product update, service, support and other information. SeeQuick Link Operationson page 110. |
| MaxiScope |  | Configures the unit to operate as an automotive oscilloscope to perform electrical and electronic circuit tests and monitor signal activities. SeeMaxiScope Operationson page 111. |
| Digital Inspection |  | Configures the unit to operate as a video scope device by connecting to an Imager head cable for close vehicle inspections. SeeDigital Inspection Operationson page 130. |
Locator and Navigation Buttons
Operations of the Navigation buttons at the bottom of the screen are described in the table below:
Table 3-2 Locator and Navigation Buttons
| Name | Button | Description |
| Locator |  | Indicates the location of the screen. Swipe the screen left or right to view the previous or next screen. |
| Back |  | Returns to the previous screen. |
| Android Home |  | Returns to Android System's Home screen. |
| Recent Apps |  | Displays a list of applications that are currently working. To open an app, touch it. To remove an app, swipe it to the right. |
| Browser | [XABH] | Launches the built-in Android browser. |
| Camera |  | Opens the camera with short press; takes and saves screenshot image with long press. The saved files are auto-stored in the Data Manager application for later reviews. See Data Manager Operations on page 61. |
| Display & Sound |  | Allows you to adjust the brightness of the screen and the volume of the audio output. |
| MaxiSys Home |  | Returns to MaxiSys Job Menu. |
| VCI |   | Opens the VCI Manager application. The tick icon at the bottom right corner indicates the Display Tablet is communicating with the VCI device, otherwise a cross icon displays. |
| MaxiSys Shortcut |  | Returns to the MaxiSys operation interface from other Android applications. |
| Multi Task |  | Tapping this button will open up a Multi Task menu, on which displays the active running application bookmarks. Tapping a specific bookmark enables you to switch directly to the selected application screen. |
| Service |  | Allows you to quickly operate the service functions such as oil reset, EPB, DPF, BMS and so on. |
To use the camera:
- Tap the Camera button. The camera screen opens.
- Focus the image to be captured in the view finder.
- Tap the inner blue circle. The view finder now shows the captured picture and auto-saves the taken photo.
- Tap the thumbnail image on the top right corner of the screen to view the stored image.
- Tap the Back or Home button to exit the camera application.
- Refer to Android documentation for additional information.
System Status Icons
These are the standard status icons of the Android operating system. Your MaxiSys Display Tablet is a fully functional Android Pad. Refer to Android documentation for additional information.
Powering Down
All vehicle communications must be terminated before you shut down the MaxiSys Display Tablet. A warning message displays if you attempt to shut it down while the VCI unit is communicating with the vehicle. A forced shutdown during the communication may lead to ECM problems on some vehicles. Make sure you exit the CV Diagnostics application before powering down.
To power down the MaxiSys Display Tablet:
- Press and hold the Lock/Power Button.
- Tap Power Off; the tablet will turn off in a few seconds.
Reboot System
In case of system crash, press and hold the Lock/Power button for 8 seconds to reboot the system.
Installing Computer Software
The MaxiSys Diagnostic Platform allows you to realize some of its functions on a computer to enhance capabilities and improve user experience. To realize these functions on a computer, you need to install certain software.
To install the MaxiSys Printer driver program:
- Download the Maxi PC Suite from www.autel.com > Support & Updates > Firmware & Downloads > Update Client, and install to your windows-based computer.
- Follow the pop-up instructions to install the Maxi PC Suit to your PC.
- After the Maxi PC Suite installation, the printer driver program will be installed into your PC automatically, which is call PC Link.
- Click on Finish to complete the whole installation procedure.
Printing Operation
This section describes how to receive files from the MaxiSys Tablet and perform printing through the windows-based computer:
To perform printing through the computer
- Make sure the Display Tablet is connected to the computer network, either via WiFi or LAN, before printing, See Printing Setting on page 76 for more information.
- Run the PC Link on the computer to open up the printer interface.
-
Click Test Print to make sure the printer is working successfully.
-
Tap the Print button on the toolbar displayed in various applications of the MaxiSys system. A temporary file will be created and sent to the computer for printing.
- The MaxiSys Printer will print the received file automatically when the Auto Print option is checked.
If you need to print the document later, click the Open PDF file and select the document, and double click the Print on the MaxiSys Printer interface to start the printing.

NOTE
Make sure the computer installed with the Printing Services program is connected to a printer.
4 CV Diagnostics Operations
By establishing a data link to the electronic control systems of the vehicle being serviced through the VCI device, the Diagnostics application allows you to retrieve diagnostic information, view live data parameters, and perform active tests. The Diagnostics application can access the electronic control module (ECM) for various vehicle control systems, such as engine, transmission, antilock brake system (ABS), airbag system (SRS) and more.
Establishing Vehicle Communication
The Diagnostics operations require the MaxiSys CV Diagnostic Platform connected to the test vehicle through the VCI device using the main cable, and test adapters (for non-OBD II vehicles). To establish proper vehicle communication to the MaxiSys Display Tablet, you need to perform the following steps:
- Connect the VCI device to the vehicle's DLC for both communication and power source.
- Connect the VCI device to the MaxiSys Display Tablet via BT pairing, or USB connection.
- When these are done, check the VCI navigation button at the bottom bar on the screen, if the button displays a green tick icon at the lower right corner, the MaxiSys CV Diagnostic Platform is ready to start vehicle diagnosis.
Vehicle Connection
The method used to connect the VCI device to a vehicle's DLC depends on the vehicle's configuration as follows:
- A vehicle equipped with an On-board Diagnostics Two (OBD II) management system supplies both communication and 12-volt power through a standardized J-1962 DLC.
● A vehicle not equipped with an OBD II management system supplies communication through a DLC connection, and in some cases supplies
12-volt power through the cigarette lighter receptacle or a connection to the vehicle battery.
OBD II Vehicle Connection
This type of connection only requires the main cable without any additional adapter.
To connect to an OBD II vehicle
- Connect the main cable's female adapter to the Vehicle Data Connector on the VCI device, and tighten the captive screws.
- Connect the cable's 16-pin male adapter to the vehicle's DLC, which is generally located under the vehicle dash.

NOTE
The vehicle's DLC is not always located under the dash; refer to the user manual of the test vehicle for additional connection information.
Non-OBD II Vehicle Connection
This type of connection requires both the main cable and a required OBD I adapter for the specific vehicle being serviced.
- There are three possible conditions for Non-OBD II vehicle connection:
● DLC connection supplies both communication and power. - DLC connection supplies communication and power is to be supplied via the cigarette lighter connection.
- DLC connection supplies communication and power is to be supplied via connection to the vehicle battery.
To connect to a Non-OBD II Vehicle
- Connect the main cable's female adapter to the Vehicle Data Connector on the VCI device, and tighten the captive screws.
- Locate the required OBD I adapter and connect its 16-pin jack to the main cable's male adapter.
- Connect the attached OBD I adapter to the vehicle's DLC.

NOTE
Some adapters may have more than one adapter or may have test leads instead of an adapter. Whatever the case, make the proper connection to the vehicle's DLC as required.
To connect the cigarette lighter
- Plug the DC power connector of the cigarette lighter into the DC power supply input port on the device.
- Connect the male connector of the cigarette lighter into the vehicle's cigarette lighter receptacle.
To connect the clipper cable
- Connect the tubular plug of the clipper cable to the male connector of the cigarette lighter.
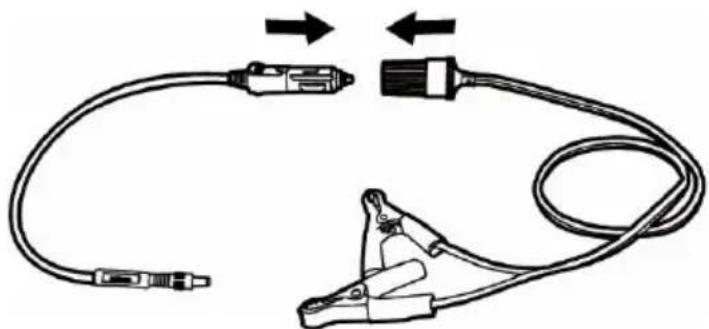
natural_image
Diagram of a cable and clamp device with two connectors, showing wiring connections (no text or symbols)Figure 4-1 Connection between Cigarette Lighter and Clipper Cable
- Plug the DC power connector of the cigarette lighter into the DC power supply input port of the J2534 programming device.
- Connect the clipper cable to the vehicle's battery.

NOTE
After the VCI device is successfully connected to the vehicle, the Power LED on the device illuminates, and a brief beep sound will be heard.
VCI Connection
After the VCI device is properly connected to the vehicle, the Power LED on the VCI device illuminates solid green light, and is ready to establish communication with the MaxiSys Display Tablet.
The J2534 ECU Programming Device supports 2 communication methods with the MaxiSys Display Tablet: BT, and USB.
Pairing Up via BT
Among all methods, BT pairing is recommended as the first choice for the communication between the MaxiSys Display Tablet and the VCI device. The working range for BT communication is about 210 feet (70 m); this means you can perform vehicle diagnosis freely around the workshop with greater convenience.
When your customers are more than one, you need to connect two or more VCI devices to test vehicles. In that case, BT connection is an optimal choice for you to pair the MaxiSys Display Tablet separately to each of the VCI devices on test vehicles. It saves you time and trouble to repeat the plugging and unplugging procedure, which is unavoidable through traditional wired connection. No doubt, it's more efficient and user-friendly.
To pair up the MaxiSys Display Tablet with the VCI device via BT
- If not already done, power up the MaxiSys Display Tablet.
- Select the VCI Manager application from the MaxiSys Job Menu.
- When the VCI Manager application is opened, the device automatically starts scanning for available VCI devices around for BT pairing. The found devices are listed in the Setting section on the right side of the screen.

NOTE
If no VCI device is found, this may indicate that the signal strength of the transmitter is too weak to be detected. In this case try to get closer to the device, or reposition the VCI device, and remove all possible objects that causes signal interference. When these are done, tap the Scan button at the top right corner to start searching again.
- Depending on the VCI type you use, the device name may display as Maxi suffixed with a serial number. Select the required device for pairing.
- When paring is successfully done, the connection status displayed to the right of the device name is shown as Paired.
- Wait for a few seconds, and the VCI button on the system Navigation bar at the bottom of the screen shall display a green tick icon, indicating the Display Tablet is connected to the VCI device, and is ready to perform vehicle diagnosis.
Refer to BT Pairing on page 94 for additional information.
USB Cable Connection
The USB cable connection is a simple and quick way to establish communication between the MaxiSys Display Tablet and the VCI device. After properly connecting the USB cable from the tablet to the VCI device, the VCI navigation button at the bottom bar of the screen shows a green tick icon in a few seconds, and the USB LED on the VCI device illuminates solid green light, indicating the connection between the devices is successful.
The MaxiSys CV Diagnostic Platform is now ready to perform vehicle diagnosis.

NOTE
Since the USB connection provides the most stable and fastest communication, it is highly recommended to apply this communication method when operating ECU programming or coding. When all the two communication methods are applied at the same time, the MaxiSys system will use the USB communication as the default priority.
No Communication Message
A: If the MaxiSys Display Tablet is not connected to the VCI device, an “Error” message displays. An “Error” message indicates the Display Tablet is not communicating with the VCI device, and so you cannot gain access to the vehicle control module. In this case, you need to do the following check-ups:
- Check if the VCI device is powered on.
- In case of wireless connection, check if the network is configured correctly, or if the right device has been paired.
- If during the diagnosis process, the communication is suddenly interrupted due to the loss of signal, check if there is any object that causes signal interruption.
- Check if the VCI device is properly positioned. It is recommended to put the VCI device with the front side up.
- Try standing closer to the VCI device to obtain more stable signals, and faster communication speed.
- In case of wired connection, check the cable connection between the Display Tablet and the VCI device.
- Check if the green LED on the VCI device is illuminated for BT or USB.
- Check if the Error LED on the VCI device is on, this may indicate there is a communication error between the devices, in this case try re-
establishing the connection again; if this does not work, there may be a hardware problem with the device, in this case contact for technical support.
B: If the VCI device is unable to establish a communication link, a prompt message displays with check instructions. The following conditions are the possible causes for this massage to display:
● The VCI device is unable to establish a communication link with the vehicle.
- You've selected a system for testing that the vehicle is not equipped with.
● There is a loose connection.
● There is a blown vehicle fuse.
● There is a wiring fault on the vehicle, or the data cable or adapter.
● There is a circuit fault in the data cable or adapter.
- Incorrect vehicle identification was entered.
Getting Started
Prior to first use of the CV Diagnostics application, the VCI device must be synchronized with the MaxiSys Display Tablet to establish communication. See VCI Manager Operations on page 93.
Vehicle Menu Layout
When the VCI device is properly connected to the vehicle, and paired to the MaxiSys Display Tablet, the platform is ready to start vehicle diagnosis. Tap on the CV Diagnostics application button on the MaxiSys Job Menu, the screen then opens the Vehicle Menu.

Figure 4-2 Sample Vehicle Menu Screen
- Top Toolbar Buttons
- CV Band Vehicles
- Locator and Navigation Buttons
- Manufacturer Buttons
Top toolbar Buttons
The operations of the Toolbar buttons at the top of the screen are listed and described in the table below:
Table 4-1 Top Toolbar Buttons
| Name | Button | Description |
| Home |  | Returns to the MaxiSys Job Menu. |
| VIN Scan |  | Touch this button to open a dropdown list; tap Auto Detect for auto VIN detection; tap Manual Input to enter VIN manually. |
| History |  | Displays the stored test vehicle history records. This option provides you direct access to the previously tested vehicle recorded during previous test sessions. See Vehicle History on page 82. |
| CV Band |  | Displays the CV band vehicles such as Truck, Light Duty, Bus, CONSTER, AGRIC, Trailer in the vehicle menu. |
| Expert |  | Displays the major automobile system manufacturers. |
| NE |  | Displays the new energy vehicles. |
| Search |  | Opens the virtual keyboard, allowing you to manually enter the specific vehicle make required. |
| Cancel |  | Touch this button to exit the search screen, or cancels an operation. |
Manufacturer Buttons
The Manufacturer buttons display the various vehicle logos and the brand names. To start a diagnostic session, select the required manufacturer button after the VCI device is properly connected to the test vehicle.
The information icon beside the vehicle brand name is tappable. Touch it, you will see an attached PDF file, showing relevant information, such as vehicle coverage and function list etc. for the corresponding vehicle make.
Vehicle Identification
The MaxiSys CV Diagnostics system supports four methods for Vehicle Identification.
- Auto VIN Scan
- Manual VIN Input
- Manual Vehicle Selection
- OBD Direct Entry
Auto VIN Detect
The MaxiSys CV Diagnostics system features the latest VIN-based Auto VIN Scan function to identify CAN vehicles in just one touch, which allows the technician to quickly detect vehicles, scan all the diagnosable ECUs on every vehicle and run diagnostics on the selected system.
To perform Auto VIN Scan
- Tap the CV Diagnostics application button from the MaxiSys Job Menu. The Vehicle Menu displays. (Figure 4-2)
- Tap the VIN Scan button on the top toolbar.
- Select Auto Detect. The tester starts VIN scanning on the vehicle's ECU. Once the test vehicle is successfully identified, the system will guide you to the CV Diagnostics screen directly.

Figure 4-3 Sample CV Diagnostics Screen
In some cases when you have selected the vehicle brand instead of performing Auto VIN Scan in the first place, the system still provides an option for vehicle VIN scan.

Figure 4-4 Sample Vehicle Selection Screen
Select Automatic Selection and the system will proceed to acquire VIN information automatically or allow you to input the VIN manually.
Manual VIN Input
For some vehicles that do not support the Auto VIN Scan function, the MaxiSys CV Diagnostics system allows you to enter the vehicle VIN manually, or simply take a photo of the VIN sticker for quick vehicle identification.
To perform Manual VIN Input
- Tap the CV Diagnostics application button from the MaxiSys Job Menu. The Vehicle Menu displays. (Figure 4-2)
- Tap the VIN Scan button on the top toolbar.
- Select Manual Input.
- Tap the input box and enter the correct VIN.
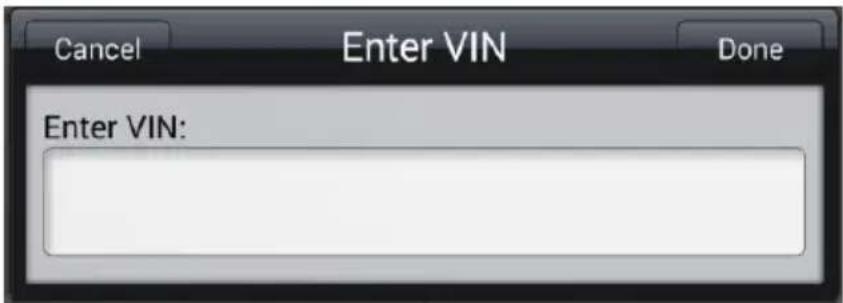
Figure 4-5 Manual VIN Input
- Tap Done. The vehicle will be identified in a few seconds, and once the matching is successful, the system will guide you to the CV Diagnostics screen directly. (Figure 4-3)
- Tap Cancel to exit Manual Input.
Manual Vehicle Selection
When the vehicle's VIN is not automatically retrievable through the vehicle's ECU, or the specific VIN is unknown, you can choose to select the vehicle manually.
Step-by-step Vehicle Selection
This mode of vehicle selection is menu driven; you simply follow the screen prompts and make a series of choices. Each selection you make advances you to the next screen. A Back button at the lower right corner of the screen returns you to the previous screen. Exact procedures may vary somewhat by vehicles serviced.
Alternative Vehicle Identification
Occasionally, you may identify a test vehicle that the tester does not recognize; the database does not support, or has some unique characteristics that prevent it from communicating with the tester through the normal channels. In these instances, you are provided with the OBD direct entry, through which you can perform generic OBD II or EOBD tests. See Generic OBD II Operations on page 55 for additional information.
Navigation
This section describes how to navigate the Diagnostics interface and select test options.
Diagnostics Screen Layout
The Diagnostics screens typically include four sections. (Figure 4-6)

Figure 4-6 Sample Diagnostics Screen
- Diagnostics Toolbar
- Status Information Bar
- Main Section
- Functional Buttons
Diagnostics Toolbar
The Diagnostics Toolbar contains a number of buttons that allow you to print or save the displayed data and make other controls. The table below provides a brief description for the operations of the Diagnostics toolbar buttons:
Table 4-2 Diagnostics Toolbar Buttons
| Name | Button | Description |
| Home |  | Returns to the MaxiSys Job Menu. |
| Vehicle Swap |  | Touching this button allows you to exit the diagnostic session of the currently identified test vehicle, and returns you to the vehicle menu screen to select another vehicle for testing. |
| Settings |  | Opens the setting screen. See Settings Operations on page 76. |
 | Saves and prints a copy of the displayed data. See Printing Operation for additional information on page 20. | |
| Help |  | Provides instructions or tips for operations of various diagnostic functions. |
| Save |  | Tapping this button opens a submenu, on which there are 3 options available to save the displayed data.Tap Save This Page to take a screenshot imageTap Save All Data to save a PDF file (mostly used to save data that cover more than 1 page)Tap Start Saving to record a video clip (only available for recording Live Data or special graph data)All saved data are stored in the Data Manager application for later reviews. See Data Manager Operations on page 61. |
| Data Logging |  | Records the communication data and ECU information of the test vehicle. The saved data can be reported and sent to the technical center via the internet.You can go to the Support application to follow up the processing progress, see Data Logging on page 103 for detailed information. |
| Send |  | Tapping this button submits the Data Logging report to the technical center via the internet. |
To print data in Diagnostics
- Tap the CV Diagnostics application button from the MaxiSys Job Menu. The Print button on the diagnostic toolbar is available throughout the whole CV Diagnostics operations.
- Tap Print and a drop-down menu appears.
a) Print This Page – prints a screenshot copy of the current screen
b) Print All Page – prints a PDF copy of all displayed data
3. A temporary file will be created and sent to the computer for printing.
4. When the file is transferred successfully, a confirmation message displays.

NOTE
Make sure the Display Tablet is connected to the computer network, either via Wi-Fi or LAN, before printing. For more instructions on printing, see Printing Operation on page 20 for details.
To submit Data Logging reports in Diagnostics
- Tap the CV Diagnostics application button from the MaxiSys Job Menu. The Data Logging button on the diagnostic toolbar is available throughout the whole CV Diagnostics operations.
- Tap the Data Logging button to display the error options. Select a specific error, and a submission form will display to let you fill in the report information.
- Tap the Send button to submit the report form via the internet, a confirmation message displays when sending is successful.
Status Information Bar
The Status Information Bar at the top of the Main Section displays the following items:
- Menu Title – indicates the menu subject of the Main Section
- VCI Icon – indicates the communication status between the tablet and the VCI device
- Battery Icon – indicates the battery status of the VEHICLE
Main Section
The Main Section of the screen varies depending on the stage of operations. The Main Section can show vehicle identification selections, the main menu, test data, messages, instructions and other diagnostic information.
Functional Buttons
The displayed Functional Buttons at this section of the screen varies depending on the stage of operations. They can be used to navigate, save or clear the diagnostic data, exit scanning as well as make other functional controls. The functions of these buttons will be introduced respectively in the following sections of the corresponding test operations.
Screen Messages
Screen messages appear when additional input is needed before proceeding. There are mainly three types of on-screen messages as to their purposes: Confirmation, Warning, and Error.
Confirmation Messages
This type of messages usually displays as an “Information” screen, which informs you when you are about to perform an action that cannot be reversed or when an action has been initiated and your confirmation is needed to continue.
When a user-response is not required to continue, the message displays briefly before automatically disappearing.
Warning Messages
This type of messages informs you when completing the selected action may result in an irreversible change or loss of data. The typical example for this is the “Erase Codes” message.
Error Messages
Error messages inform you when a system or procedural error has occurred. Examples of possible errors include a disconnected cable or communication interruption due to certain reasons.
Making Selections
The Diagnostics application is a menu driven program that presents a series of choices one at a time. As you select from a menu, the next menu in the series displays. Each selection narrows the focus and leads to the desired test. Use your fingertip or the stylus pen to make menu selections.
Main Menu
The CV Diagnostics application allows you to establish a data link to the electronic control systems of the test vehicle via the VCI device for vehicle diagnosis or service. You can operate functional tests, retrieve vehicle diagnostic information such as trouble codes, event codes and live data, and perform ECU reprogramming, for various vehicle control systems, such as engine, transmission, ABS and more.
The CV Diagnostics screen (Figure 4-3) has two main options:
- Diagnosis – a comprehensive section which includes all available functions: reading, clearing, saving and printing diagnostic information, as well as performing active tests and special functions
- Hot Function – a separate section designed to perform vehicle scheduled service and maintenance, such as to reset the service lights and perform calibration for various systems
After a section is selected and the tablet establishes communication with the vehicle via the VCI device, the corresponding function menu or selection menu displays.
Diagnosis
There are two options available after the access to the Diagnosis section:
- Auto Scan – starts auto scanning for all the available systems on the test vehicle
- Control Unit – displays a selection menu of all available control units of the test vehicle
Auto Scan
The Auto Scan function performs a comprehensive scanning over the test vehicle's ECUs in order to locate fault systems and retrieve DTCs. The sample operation interface of Auto Scan displays as below:

Figure 4-7 Sample Auto Scan Operation Screen
- Navigation Bar
- Main Section
- Functional Buttons
- Navigation Bar
-
List Tab – displays the scanned data in list format
-
Progress Bar – indicates the test progress
- Main Section
List Tab
Column 1 - displays serial numbers
Column 2 - displays the scanned ECUs
Column 3 - displays the diagnostic marks indicating different test results:
-!:- Indicates that the scanned unit may not support the code reading function, or there is a communication error between the tester and the control unit.
-?:- Indicates that the vehicle control unit has been detected, but the tester cannot accurately locate it.
Fault | #: Indicates there is/are detected fault code(s) present; “#” indicates the number of the detected faults.
Pass | No Fault: Indicates the system has passed the scanning process and no fault has been detected.
- Functional Buttons
The table below provides a brief operation description of the Functional Buttons in Auto Scan:
Table 4-3 Functional Buttons in Auto Scan
| Name | Description |
| Report | Displays the diagnostic data in the report form. |
| Quick Erase | Deletes codes. A warning message screen will display to inform you of possible data loss when this function is selected. |
| OK | Confirms the test result, and continues ECU diagnosis after selecting the required ECU by tapping the item in the Main Section. |
| Pause | Suspends scanning and changes to show the Continue button. |
| ESC | Returns to the previous screen or exits Auto Scan. |
Control Unit
This option allows you to manually locate a required control unit for test through a series of choices. You simply follow the menu driven procedure, and make your desired selection each time; after that, the program will guide you to the diagnostic Function Menu.
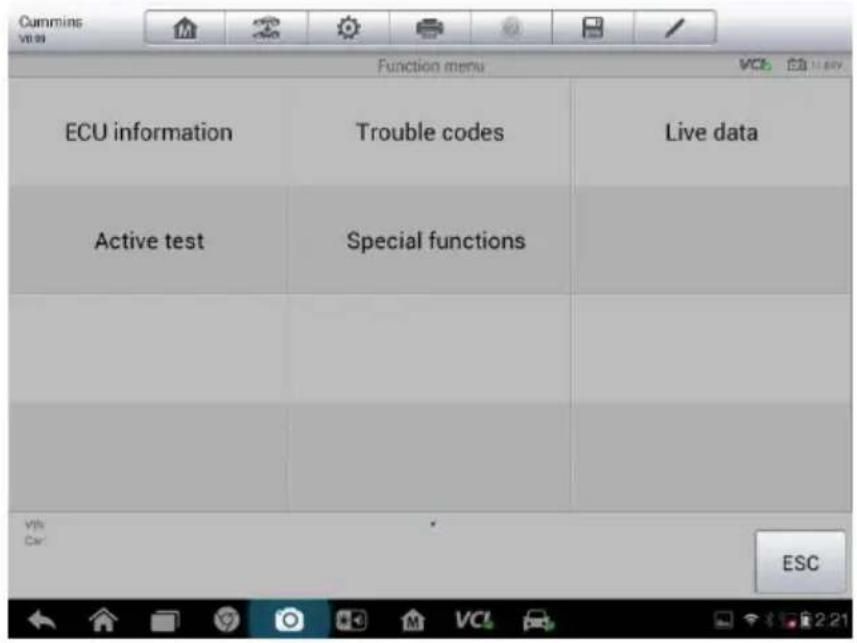
Figure 4-8 Sample Function Menu Screen
The Function Menu options vary slightly for different vehicles. Its major options include:
- ECU Information – provides the retrieved ECU information in details. A selection opens an information screen.
- Trouble Codes – contains Read Codes and Erase Codes. The former displays detailed information of DTCs retrieved from the vehicle control module; the latter facilitates you to erase DTCs and other data from ECM.
- Live Data – retrieves and displays live data and parameters from the vehicle’s ECU.
● Active Test – provides specific subsystem and component tests. The test options may include A/C Relay, Malfunction Indicator Lamp, Idle Spark and many others, and vary depending on the vehicle makes and models. - Special Functions – provide component adaptation for custom configurations, and also allows you to learn adaptive values for certain components after repairs. Depending on the test vehicle, this selection may sometimes appear as Fuel Trim Reset, Oil Life Reset, Throttle Position or something similar.

NOTE
With the diagnostic toolbar on top of the screen throughout the whole diagnostic procedures, you are allowed to make various controls of the diagnostic information at any time, such as printing and saving the displayed data, getting help information, or performing data logging, etc.
To perform a diagnostic function
- Establish communication with the test vehicle via the VCI device.
- Identify the test vehicle through step-by-step selections from the menu options.
- Select the Diagnosis section.
- Locate the required system for test by Auto Scan or through menu driven selections in Control Unit.
- Select the desired test from the Function Menu.
ECU Information
This function retrieves and displays the specific information for the tested control unit, including unit type, version numbers and other specifications. The sample ECU Information screen displays as below:

Figure 4-9 Sample ECU Information Screen
-
Diagnostics Toolbar Buttons – see Table 4-2 Diagnostics Toolbar Buttons on page 33 for detailed descriptions of the operations for each button.
-
Main Section – the left column displays the item names; the right column shows its specifications or descriptions.
- Functional Button – In this case, only an ESC (or sometimes a Back) button is available; tap it to exit.
Trouble Codes
Read Codes
This function retrieves and displays DTCs from the vehicle's control units. The Read Codes screen varies for each test vehicle. On some vehicles, the Help information and freeze frame data can also be retrieved for detailed view. The sample Read Codes screen displays as below:
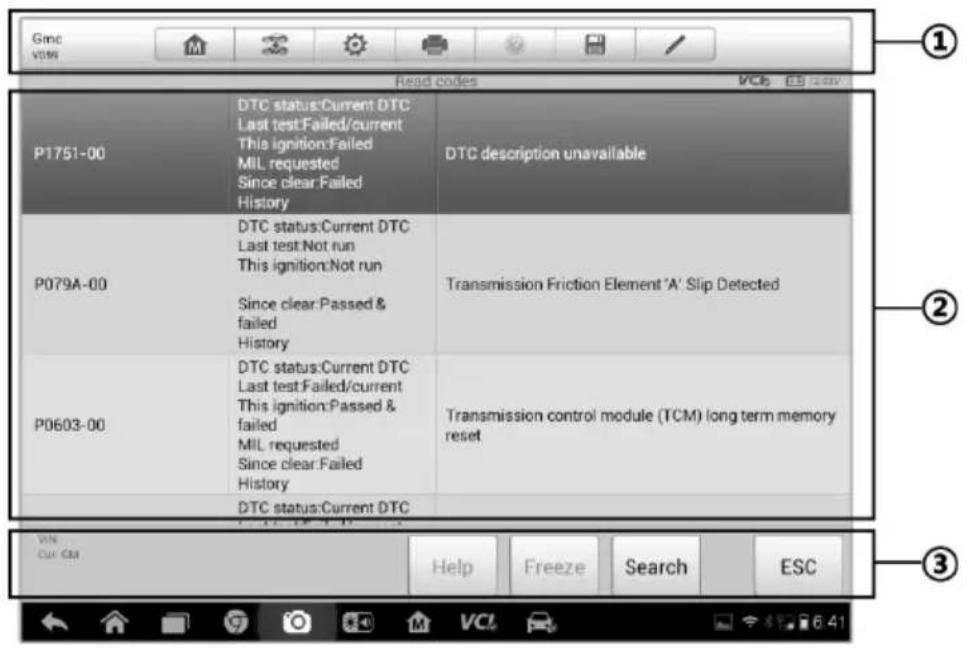
Figure 4-10 Sample Read Codes Screen
-
Diagnostics Toolbar Buttons – see Table 4-2 Diagnostics Toolbar Buttons on page 33 for detailed descriptions of the operations for each button.
-
Main Section
-
Code Column – displays the retrieved codes from the vehicle.
- Status Column – indicates the status of the retrieved codes.
- Description Column – displays detailed descriptions for the retrieved codes.
- Snowflake Icon – only displays when freeze frame data is available for viewing; tap it and a data screen, which looks very similar to the Read Codes interface, displays, therefore same operation method may be applied.
- Functional Button – in this case, only an ESC (or sometimes a Back) button is available; tap it to return to the previous screen or exit the function.
Erase Codes
After reading the retrieved codes from the vehicle and certain repairs have been carried out, you can decide to erase the codes from the vehicle using this function. Before performing this function, make sure the vehicle's ignition key is in the ON (RUN) position with the engine off.
To erase codes
- Tap Erase Codes from the Trouble Codes menu.
- A warning message displays to inform you of data loss when this function is applied.
a) Tap Yes to continue. A confirming screen displays when the operation is successfully done.
b) Tap No to exit. - Check the Read Codes function again to ensure the operation is successful.
Live Data
When this function is selected, the screen displays the data list for the selected module. The items available for any control module vary from one vehicle to another. The parameters display in the order that they are transmitted by the ECM, so that variations exist among vehicles.
Gesture scrolling allows you to quickly move through the data list. Simply touch the screen and drag your finger up or down to reposition the parameters being displayed if the data covers more than one screen. The figure below shows a typical Live Data screen:

Figure 4-11 Sample Live Data Screen
- Diagnostics Toolbar Buttons – tap the drop-down button at the top center of the screen displays the toolbar buttons. See Table 4-2 Diagnostics Toolbar Buttons on page 33 for detailed descriptions of the operations for each button.
2. Main Section
- Name Column – this column displays the parameter names.
a) Check Box - tap the check box at the left side of the parameter name to select a desired item. Tap the check box again to deselect the item.
b) Drop-down Button – tapping the drop-down button at the right side of the parameter name opens a submenu, which provides various choices for data display mode.
- Value Column – displays the values of the parameter items.
- Range Column - displays the minimum and the maximum limit value.
- Unit Column – displays the units for the parameter values.
To change the Unit mode, tap the Setting button on the top toolbar and select a required mode. See Unit on page 76 for more information.
3. Display Mode
There are 4 types of display modes available for data viewing, allowing you to view various types of parameters in the most suitable way for better data check-ups.
Tapping the drop-down button on the right side of the parameter name opens a submenu. There are 4 buttons to configure the data display mode, plus one Information button on the right, tappable when additional information is available for your reference.
Each parameter item displays the selected mode independently.
Analog Gauge Mode – displays the parameters in the form of an analog meter graph
Text Mode – this is the default mode which displays the parameters in texts and shows in list format.

NOTE
Reading of status parameters, such as a switch reading, which are mostly in word form, like ON, OFF, ACTIVE, and ABORT, etc., can only be displayed in Text Mode. Whereas reading of value parameters, such as a sensor reading, can be displayed in text mode and other graph modes.
Waveform Graph Mode - displays the parameters in waveform graphs
When displaying this mode, three control buttons will appear on the right side of the parameter item, allowing you to manipulate the display status.
- Text Button – resumes the Text Mode
- Scale Button – changes the scale values, which are displayed above the waveform graph. There are 4 scales available: x1, x2, x4 and x8.
- Zoom-in Button – tap once to display the selected data graph in full screen
Digital Gauge Mode— displays the parameters in the form of a digital gauge graph
Full Screen Display – this option is only available in the waveform graph mode, and mostly used in Graph Merge status for data comparison. There are three control buttons available on the top right side of the screen under this mode.
- Scale Button - changes the scale values, which are displayed below the waveform graph. There are 4 scales available: x1, x2, x4 and x8.
- Text Button – resumes the Text Mode
- Edit Button – tapping this button opens an edit window, on which you can set the waveform color and the line thickness displayed for the selected parameter item.
- Zoom-out Button – exits the full screen display.
To edit the waveform color and line thickness in a data graph
- Select 1 parameter item to display in Waveform Graph mode.
- Tap the Zoom-in Button on the right to display the data graph in full screen.
- Tap the Edit Button, and an edit window appears.
- Select a parameter item on the left column.
- Select a desired sample color from the second column.
- Select a desired sample line thickness from the right column.
- Tap Done to save the setting and exit, or tap Cancel to exit without saving.
4. Functional Buttons
The operations of all the available functional buttons on the Live Data screen are described as below:
Back – returns to the previous screen or exit the function.
Record – starts recording the retrieved live data; the recorded data is then stored as a video clip in the Data Manager application for future reviews. This function could be triggered automatically at a preset threshold value or manually as you choose, and the triggering mode and record duration can be configured in the Setting mode of Live Data.
Freeze – displays the retrieved data in freeze mode.
- Previous Frame – Moves to the previous frame in the freeze data.
- Next Frame – Moves to the next frame in the freeze data.
Resume – this button appears when the Record or Freeze function is applied. Tapping this button stops data recording, or exits freeze data mode, and resumes normal data display mode.
Flag – this button appears when the Record function is applied. Tapping this button sets flags for the recorded data at points wherever you choose, when playing back the recorded video clip later in Data Manager, the preset flag will enable a popup to allow input of text to take notes.
Clear Data –tapping this button clears all previously retrieved parameter values at a cutting point whenever you choose.
To Top – after tapping this button, you move the selected data item to the top of the list.
Graph Merge – tap this button to merge selected data graphs (for Waveform Graph Mode only). This function is very useful when making comparison for different parameters.

NOTE
This mode supports Graph Merge for 2 to 3 parameter items only. Select no less than 2 or more than 3 items each time when making graph merge.
To cancel the Graph Merge mode, tap the drop-down button on the right side of the parameter name, and select a data display mode.
Show Selected/Show All – tap this option to exchange between the two options; one displays the selected parameter items, and the other displays all the available items.
Setting – tapping this button opens a setting screen, which allows you to set the trigger mode, recording duration, and various threshold values for data recording, and make other controls.
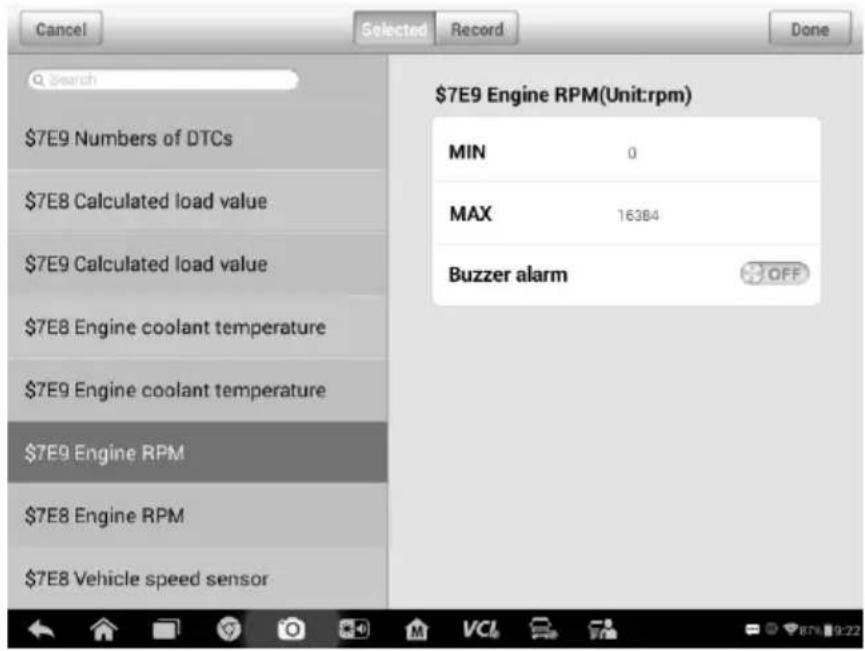
Figure 4-12 Sample Setting Mode in Live Data
There are 4 navigation buttons on top of the Setting mode screen.
- Selected Button – displays the configuration screen on which you can set an upper limit and a lower limit, for triggering the buzzer alarm. This function is only applied to the Waveform Graph display mode.
a) MIN – tapping it opens a virtual keyboard, and allows you to enter the required lower limit value
b) MAX – tapping it opens a virtual keyboard, and allows you to enter the required upper limit value
c) Buzzer Alarm – switches the alarm on and off. The alarm function makes a beep sound as a reminder whenever the data reading reaches the preset minimum or maximum point
To set threshold limits for the parameter values
- Tap the Setting functional button at the bottom of the Live Data screen.
- Tap the Selected navigation button.
- Select a parameter item on the left column, or enter the item name in the Search bar.
-
Tap on the right side of the MIN button, and enter the required minimum value.
-
Tap on the right side of the MAX button, and enter the required maximum value.
- Tap the ON/OFF button on the right side of the Buzzer Alarm button to turn it on or off.
- Tap Done to save the setting and return to the Live Data screen; or tap Cancel to exit without saving.
If the threshold limits are successfully set, two horizontal lines now appear on each of the data graphs (when Waveform Graph Mode is applied) to indicate the alarming point. The threshold lines are shown in different colors than the waveform of the parameters for distinction.
- Record Button – displays the configuration screen for Record Setting, on which you can set the trigger type, duration and trigger point for the data recording function.
a) Trigger Type – sets the trigger mode for data recording, mainly of two kinds: Manual and Auto. There are four options available:
1) Manual – allows you to manually start and stop data recording
2) DTC – auto triggers data recording when any DTC is detected
3) DTC Check Mode – auto triggers data recording when certain pre-selected DTC types are detected
4) Parameter - auto triggers data recording when any parameter value reaches the preset threshold
b) Duration – sets the recording time (for Auto trigger mode only)
c) Trigger Point – reserves a relative percentage of a record length before the data recording start point for reference (for Auto trigger mode only)
To perform setting for live data record
- Tap the Setting functional button at the bottom of the Live Data screen.
- Tap the Record navigation button.
- Tap the ○ button on the right of Trigger Type bar and select the required trigger mode.
-
Tap the ○ button on the right of Duration bar and select a length of time.
-
Tap the ○> button on the right of Trigger Point bar and select a relative percentage of a record length to be reserved before the data recording start point.
-
Tap Done to save the setting and return to the Live Data screen; or tap Cancel to cancel without saving and exit Setting.
-
Done Button - confirms and saves the setting, and returns to the Live Data screen.
- Cancel Button – cancels the setting operation, and returns to the Live Data screen.
Active Test
The Active Test function is used to access vehicle-specific subsystem and component tests. Available tests vary by manufacturer, year, and model, and only the available tests display in the menu.
During an active test, the tester outputs commands to the ECUs in order to drive the actuators. This test determines the integrity of the system or parts by reading the engine ECU data, or by monitoring the operation of the actuators, such as switching a solenoid, relay, or switch, between two operating states.
Selecting Active Test opens a menu of test options that varies by makes and models. Selecting a menu option activates the test. Follow all screen instructions while performing tests. How and what information is presented on the screen varies according to the type of test being performed. Some toggle and variable control tests display Active Test Controls at the top of the screen with data stream information below, or vice versa.
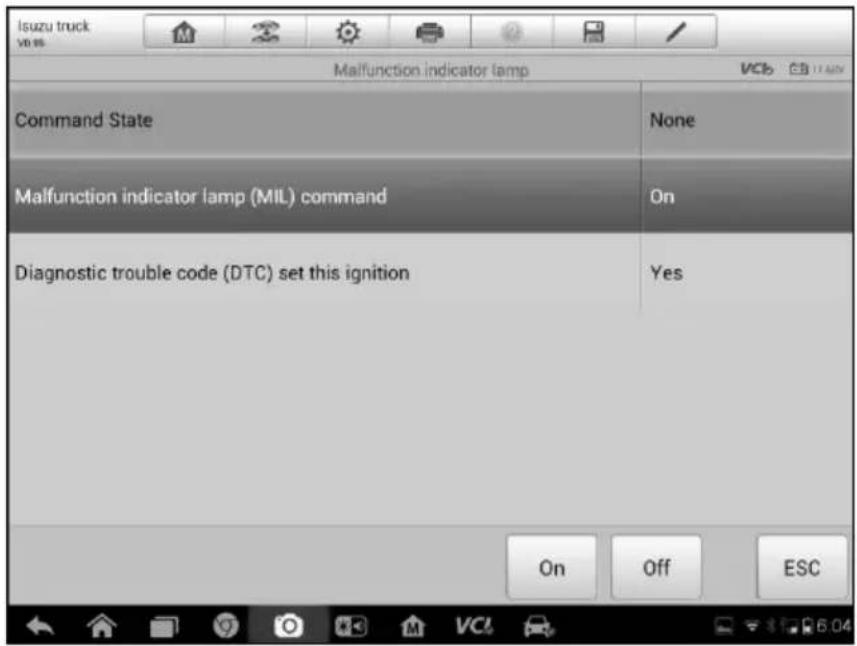
Figure 4-13 Sample Active Test Screen
The functional buttons at the lower right corner of the Active Test screen manipulate the test signals. The operational instructions are displayed on the main section of the test screen. Simply follow the on-screen instructions and make appropriate selections to complete the tests. Each time when an operation is successfully executed, a message such as “Command Finished”, “Activation Successful”, or something similar displays.
Tap the ESC functional button to exit the test when finished.
Special Functions
These functions are vehicle-specific. They allow you to perform various component adaptations, for example, to calibrate or reset certain components after repair or replacement. A sample Special Functions screen is given as below.

Figure 4-14 Sample Special Functions Screen
The typical screen usually consists of a series of specific component reset, learning and calibration. Select any sub-item, follow the on-screen instructions to select appropriate execution options, enter correct values or data, and perform necessary actions. The system will guide you throughout the complete performance.
When the operation is done, an execution status message such as Completed, Finished or Successful, displays.
Tap the ESC button to exit the function.
Hot Function
The Hot Function section is specially designed to provide you quick access to the vehicle systems for various scheduled service and maintenance. The typical service operation screen is a series of menu driven executive commands. By following the on-screen instructions to select appropriate execution options, enter correct values or data, and perform necessary actions, the system will guide you throughout the complete performance for various service operations.
The most commonly performed service functions include:
- Oil Reset
• EPB - Brake Bleeding
- DPF & SCR
- Immo & Keys
- Injector
- Throttle
This section describes the main hot functions for vehicle service:
Oil Reset
This function allows you to perform reset for the Engine Oil Life system, which calculates an optimal oil life change interval, dependent on the vehicle driving conditions and climate. The Oil Life Reminder must be reset every time the oil is changed, so that the system can calculate when the next oil change is required.
Electric Parking Brake (EPB)
This function has a multitude of usages to maintain the electronic braking system safely and effectively. The applications include deactivating and activating the brake control system, assisting with brake fluid control, opening and closing brake pads, and setting brakes after disc or pad replacement, etc.
Brake Bleeding
Most brakes should be bled in regular period to keep your brake system at optimum performance. Small amounts of air can become trapped in the brake line, creating a spongy feeling when you step on the pedal. If large amounts of air enter the brake line, your vehicle can suffer a complete braking failure. This function provides you the menu driven instructions which are usually vehicle-specific. Follow the instructed steps and you will remove the air from the brake lines. This helps ensure that your brakes are in top condition.
DPF & SCR
The Diesel Particulate Filter (DPF) service function performs regeneration procedure. It's to clear the blockage through continuous burning of the particulate matters captured in the DPF. If the DPF light on the vehicle comes on and you successfully complete a DPF regeneration cycle, you will notice that the DPF light will automatically turn off.
Whenever the Selective Catalytic Reduction (SCR) technology is constantly applied, the catalyst data is logged. This service function is to erase catalyst related records.
Immo & Keys
This function provides you two options, namely Transponder Code Erasure and Registration. The Erasure wizard guides you to erase all registered immobilizer keys except for the one you are using. The Registration wizard guides you to register the desired immobilizer keys. To complete either procedure successfully, you are strongly suggested to strictly follow the menu driven instructions.
Injector
This function is usually used to set the compensation code for the new injector assembly or the injectors to the Engine ECU after replacement.
Throttle
This function is used to make the engine ECU to learn the fully closed position of the electrically controlled throttle valve. Complete the learning by the on-screen instructions step by step.
Expert
The Expert function is quite a feature of MaxiSys CV Diagnostics system. The Expert menu, shown as below, presents you the majority world-wide manufacturers of gasoline and diesel engines, fully automatic transmissions, advanced driver assistance, braking, stability control and suspension systems for commercial vehicles. When you want to diagnose a specific auto component and know its model, this function can direct you directly to the desired unit.

Figure 4-15 Sample Expert Screen
After a desired manufacturer is selected, the system locates the required control unit for test either simply by one click of Automatic Selection or through a series of intended choices (Figure 4-4). After that, the program will guide you to the diagnostic Function Menu (Figure 4-8). See Diagnosis on page 37 for more.
Generic OBD II Operations
A fast-access option for OBD II/EOBD vehicle diagnosis is available on the Vehicle Menu screen (Figure 4-2). This option presents a quick way to check for DTCs, isolate the cause of an illuminated malfunction indicator lamp (MIL), check monitor status prior to emissions certification testing, verify repairs, and perform a number of other services that are emissions-related. The OBD direct access option is also used for testing OBD II/EOBD compliant vehicles that are not included in the Diagnostics database.
Functions of the diagnostics toolbar buttons at the top the screen are the same as those available for specific vehicle diagnostics. See Table 4-2 Diagnostics Toolbar Buttons on page 33 for details.
General Procedure
● To access the OBD II/EOBD diagnostics functions
-
Tap the CV Diagnostics application button from the MaxiSys Job Menu. The Vehicle Menu displays.
-
Tap the OBD button. There are two options to establish communication with the vehicle.
- Auto Scan – When this option is selected, the diagnostic tool attempts to establish communication by using each protocol in order to determine which one the vehicle is broadcasting on.
- Protocols – When this option is selected, the screen opens a submenu of various protocols. A communication protocol is a standardized way of data communication between an ECM and a diagnostic tool. Global OBD may use several different communication protocols.
- Select a specific protocol if the Protocol option is selected. Wait for the OBD II Diagnostic Menu to appear.

Figure 4-16 Sample OBD II Diagnostic Menu

NOTE
The i button displayed beside the function name is tappable. Tapping it opens a bubble with additional function information.
-
Select a function option to continue.
-
DTC & FFD
- I/M Readiness
- Live Data
-
O2 Sensor Monitor
-
On-Board Monitor
- Component Test
● Vehicle Information - Vehicle Status

NOTE
Some functions are supported only on certain vehicle makes.
Function Descriptions
This section describes the various functions of each diagnostic option:
DTC & FFD
When this function is selected, the screen displays a list of Stored Codes and Pending Codes. When detailed information of certain DTCs is available, a question mark icon displays beside the codes. Select a DTC with a question mark icon and click the Help button to check its additional information. When the Freeze Frame data of certain DTCs are available, a snowflake button displays on the right side of the DTC item. Select a DTC with a snowflake icon and click the Freeze button to check its freeze frame data. The Clear DTC button can be applied after repair.

Figure 4-17 Sample DTC & FFD Screen
- Stored Codes
Stored codes are the current emission related DTCs from the ECM of the vehicle. OBD II/EOBD Codes have a priority according to their emission severity, with higher priority codes overwriting lower priority codes. The priority of the code determines the illumination of the MIL and the codes erase procedure. Manufacturers rank codes differently, so expect to see differences between makes.
- Pending Codes
These are codes whose setting conditions were met during the last driving cycle, but need to be met on two or more consecutive driving cycles before the DTC actually sets. The intended use of this service is to assist the service technician after a vehicle repair and after clearing diagnostic information, by reporting test results after a single driving cycle.
a) If a test is failed during the driving cycle, the DTC associated with that test is reported. If the pending fault does not occur again within 40 to 80 warm-up cycles, the fault is automatically cleared from the memory.
b) Test results reported by this service do not necessarily indicate a faulty component or system. If test results indicate another failure after additional driving cycle, a DTC is set to indicate a faulty component or system, and the MIL is illuminated.
- Freeze Frame
In most cases the stored frame is the last DTC that occurred. Certain DTCs, those that have a greater impact on vehicle emission, have a higher priority. In these cases, the highest priority DTC is the one for which the freeze frame records are retained. Freeze frame data includes a “snapshot” of critical parameter values at the time the DTC is set.
- Clear DTC
This option is used to clear all emission related diagnostic data such as, DTCs, freeze frame data and manufacturer specific enhanced data from the vehicle's ECM, and resets the I/M Readiness Monitor Status for all vehicle monitors to Not Ready or Not Complete status.
A confirmation screen displays when the clear codes option is selected to prevent accidental loss of data. Select Yes on the confirmation screen to continue, or No to exit.
I/M Readiness
This function is used to check the readiness of the monitoring system. It is an excellent function to use prior to having a vehicle inspected for compliance to a state emissions program. Selecting I/M Readiness opens a submenu with two choices:
- Since DTCs Cleared – displays the status of monitors since the last time the DTCs are erased.
- This Driving Cycle – displays the status of monitors since the beginning of the current driving cycle.
Live Data
This function displays the real time PID data from ECU. Displayed data includes analog inputs and outputs, digital inputs and outputs, and system status information broadcast on the vehicle data stream.
Live data can be displayed in various modes, see Live Data on page 43 for detailed information.
O2 Sensor Monitor
This option allows retrieval and viewing of O2 sensor monitor test results for the most recently performed tests from the vehicle's on-board computer.
The O2 Sensor Monitor test function is not supported by vehicles which communicate using a controller area network (CAN). For O2 Sensor Monitor tests results of CAN-equipped vehicles, refer to On-Board Monitor.
On-Board Monitor
This option allows you to view the results of On-Board Monitor tests. The tests are useful after vehicle service or after erasing a vehicle's control module memory.
Component Test
This service enables bi-directional control of the ECM so that the diagnostic tool is able to transmit control commands to operate the vehicle systems. This function is useful in determining how well the ECM responds to a command.
Vehicle Information
The option displays the vehicle identification number (VIN), the calibration identification, and the calibration verification number (CVN), and other information of the test vehicle.
Vehicle Status
This item is used to check the current condition of the vehicle, including communication protocols of OBD II modules, retrieved codes amount, status of the Malfunction Indicator Light (MIL), and other additional information.
Exiting CV Diagnostics
The Diagnostics application remains open as long as there is an active communication with the vehicle. You must exit the diagnostics operation interface to stop all communications with the vehicle before closing the CV Diagnostics application.

NOTE
Damage to the vehicle electronic control module (ECM) may occur if communication is disrupted. Make sure the all connections, such as data cable, USB cable, and wireless or wired network, are properly connected at all times during test. Exit all tests before disconnecting the test cable or powering down the tool.
To exit the CV Diagnostics application
- From an active diagnostic screen, tap the Back or ESC functional button to exit a diagnostic session step-by-step; Or
- Tap the Vehicle Swap button on the diagnostics toolbar to return to the Vehicle Menu screen.
- From the vehicle menu screen, tap the Home button on the top toolbar; or tap the Back button on the navigation bar at the bottom of the screen. Or
- Tap the Home button on the diagnostics toolbar to exit the application directly to the MaxiSys Job Menu.
Now, the CV Diagnostics application is no longer communicating with the vehicle and it is safe to open other MaxiSys applications, or exit the MaxiSys CV Diagnostic System and return to the Android System's Home screen.
5 Data Manager Operations
The Data Manager application is used to store, print, and review the saved files. Most operations are controlled through the toolbar.
Selecting the Data Manager application opens the file system menu. Different file types are sorted separately under different options, there are six types of information files to be viewed or played back.

Figure 5-1 Sample Data Manager Main Screen
Operations
Data Manager Operations are based on toolbar controls, details are explained in the following sections.
Image Files
The Image section is a JPG database containing all captured screenshot images.
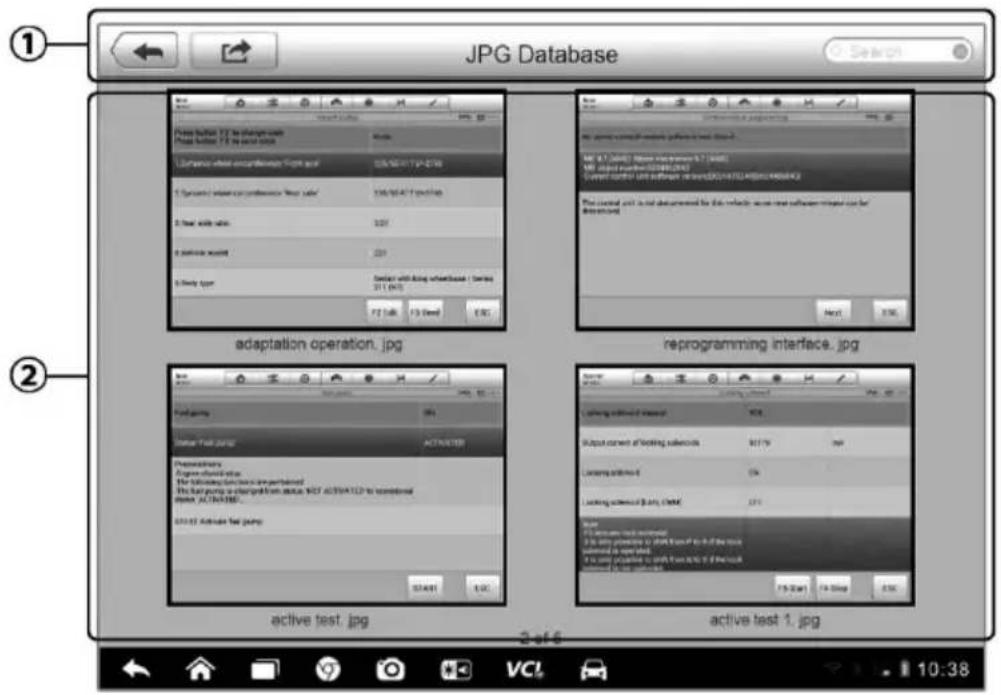
Figure 5-2 Sample Image Database Screen
- Toolbar Buttons – used to edit, print and delete the image files. See Table 5-1 Toolbar Buttons in JPG Database on page 62 for detailed information.
- Main Section – displays the stored images.
Table 5-1 Toolbar Buttons in JPG Database
| Name | Button | Description |
| Back |  | Returns to the previous screen. |
| Enter Edit |  | Touching this button shows the editing toolbar to print, delete or view image information. |
| Cancel |  | Touching this button close the editing toolbar or cancels file search. |
| Search |  | Quickly locates the image file by entering the vehicle name, test path, file name or file info. |
| Info |  | Touching this button opens a window displaying the detail information of the image. |
 | Touching this button prints the selected image. | |
| Delete |  | Touching this button deletes the selected image. |
To edit image information
-
Select the Data Manager application from the MaxiSys Job Menu.
-
Select Image to access the JPG database.
-
Select an image to display it in full screen.
-
Tapping the screen once displays the editing toolbar.
-
Tap the Info button to open a window displaying the image information.
-
Tap the Edit button on the top right corner of the window. The editing screen displays.
-
Edit the image information by entering the new file name, and file information.
-
Tap Done to save the information and exit, or tap Cancel to exit without saving.
To delete selected images
-
Select the Data Manager application from the MaxiSys Job Menu.
-
Select Image to access the JPG database.
-
Tap the Enter Edit button to display the editing toolbar.
-
Select the images that need to be deleted by tapping the thumbnail images, the selected thumbnail displays a tick icon at the bottom right corner.
-
Tap the Delete button, and then Delete Selected, now the selected images are deleted.
PDF Files
The PDF section stores and displays all PDF files of saved data. After entering the PDF database, select a PDF file to view the stored information.
This section uses the standard Adobe Reader application for file viewing and editing, please refer to the associated Adobe Reader manual for more detailed instructions.
Review Data
The Review Data section allows you to playback the recorded data frames of live data streams.
On the Review Data main screen, select a record file to playback.

Figure 5-3 Sample Data Playback Screen
- Drop-down Toolbar – tap the button at the top center of the screen to open the Drop-down Toolbar
- Main Section – displays the recorded data frames
- Navigation Toolbar – allows you to manipulate data playback
Use the Navigation Toolbar buttons to playback the record data from frame to frame.
Tap Back to exit data playback.
Apps Uninstall
This section allows you to manage the firmware applications installed on the MaxiSys CV Diagnostics System. Selecting this section opens a managing screen, on which you can check all the available vehicle diagnostic applications.
Select the vehicle firmware you want to delete by tapping on the car brand icon, the selected item will display a blue tick at the upper right corner. Tap the Delete button on the top bar to delete the firmware from the system database.
Data Logging
The Data Logging section allows you to launch Support platform directly to view all records of all sent or unsent (saved) data loggings on the diagnostic system. For more details, please refer to Data Logging on Page 103.
6
MaxiFix Operations
The MaxiFix application launches the on-line troubleshooter database, which not only provides you virtually all common diagnostic trouble code (DTC) database for most vehicles, but also serves as a forum allowing you to network with other MaxiSys users, and gives you access to a vast database of repair and diagnostic tips along with proven filed fixes.
While the MaxiFix provides the abundant troubleshooter information available, the database keeps growing with daily troubleshooting resources by recording the reported solution cases, and the advisory reports of the MaxiSys users from all over the world.
Information in the MaxiFix database is organized into a series of diagnostic tips that are designed to quickly lead you to the root cause of a particular problem on the test vehicle, which will help you quickly find solutions for various diagnostic problems.
Navigation
You need to register the device to your online account before launching the MaxiFix platform, see Product Registration on page 98 for details.
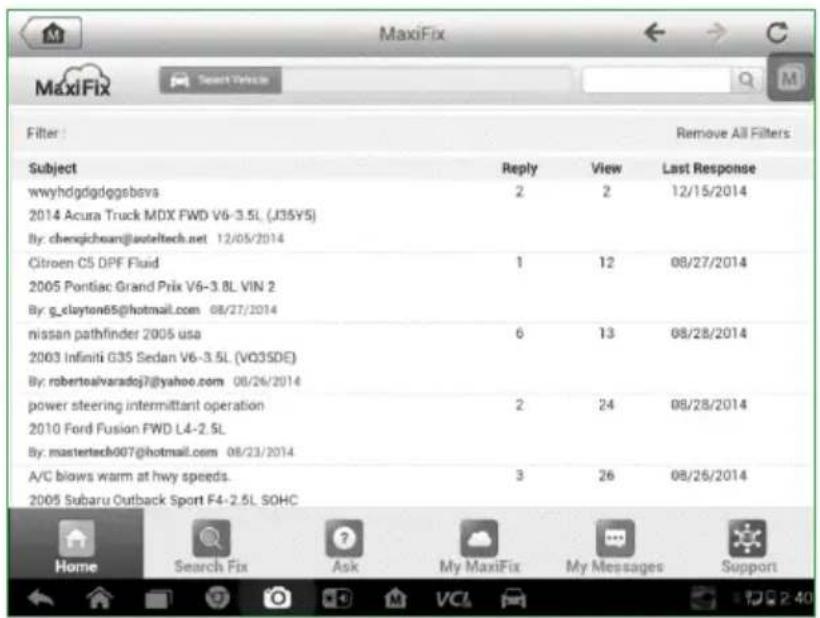
Figure 6-1 Sample MaxiFix Home Page
The MaxiFix screen layout consists of 3 main areas:
- The Header – the tool bar across the top of the screen which allows you to select vehicles and perform searches.
- The Main Screen – located at the center of the screen displaying content based on the vehicle attributes and keywords specified. The tabs on the main screen vary in accordance with the section selected on the Navigation Menu, allowing you to switch between functions.
- The Navigation Menu – the main menu at the bottom of the screen, which provides you access to different sections of MaxiFix.
The Header
The Header at the top of the screen, features:
- A Select Vehicle button to open the vehicle identification window, and vehicle information bar, for example "2014>Hyundai> Accord Coupe > L4-2.4L (K24W1)".
- A search field to find relevant information by entering keywords, codes, or problems.
Select Vehicle Button
The “Select Vehicle” button on the Header allows you to specify the vehicle which you want to reference on MaxiFix, by selecting each of the vehicle attribute from a sequence of option lists. This feature helps to filter out the searches that allow only the information that applies to the identified vehicle to display.

NOTE
All attributes must be specified to make a complete vehicle selection for the most efficient search results.
To select a vehicle
Follow the procedure below to select a vehicle:
- If you haven't already done so, click Select Vehicle button on the Header.
-
Select the year of the vehicle from the list.
-
Select the make of the vehicle from the list.
- Select the model of the vehicle from the list.
- Select the submodel of the vehicle from the list.
- Select the engine of the vehicle from the list.
After completing the vehicle selection procedure, the identified vehicle is shown on the Header.
Terminology
MaxiFix Tip
A MaxiFix Tip provides practical information of real fix of a specific vehicle repair issue with detailed descriptions. It is combined with proven fix and vehicle specific data, and filed into an all-in-one information source to provide you with quick and easy repair solutions.
On MaxiFix community you can find Tips or share your own Tip to help other community members solve vehicle issues.
To search for a MaxiFix Tip
- Select a Vehicle:
a) Click Select Vehicle button on the Header at the top of the page.
b) Select the year of the vehicle from the list.
c) Select the make of the vehicle from the list.
d) Select the model of the vehicle from the list.
e) Select the submodel of the vehicle from the list.
f) Select the engine of the vehicle from the list.
After completing the vehicle selection procedure, the identified vehicle is shown on the Header.
- Enter a Search Term.
MaxiFix has an exclusive one-stop lookup that helps you find all of MaxiFix resources by one click. Simply enter a search term into the search bar on the Header to begin the search.
3. Proven Results!
The powerful MaxiFix database gives you proven results! The typical MaxiFix Tips combine actual workshop fixes and data which may include:
a) OBDII Fault Codes description and reference—helps in diagnostic assessment by making clear the nature of an automotive problem so that beginner and advanced technicians can make effective repairs
b) Real Fix Tips—provides repair tips from actual shop practices and are presented in an easy to understand Complaint, Cause, Correction format.
If you still can't find the information you want, you can ask the MaxiFix community for help by clicking "Ask" on the Navigation Menu at the bottom of the screen.
Adopted!
The “Adopted!” icon that displays at the top right side of a Tip page indicates that the related Tip has been adopted by at least 1 technician in the community. If a tip has helped you to solve a repair problem, you are encouraged to give an Adopted! count to the tip. Each member is allowed to click the “Adopted!” once for a tip, and each click will add 1 count to the total number of “Adopted!”. The “Adopted!” count helps you easily identify which tips are really helpful for repairing vehicle issues. You can also post a comment about how the tip has helped you as reference to other members.
Operations
The Navigation Menu is at the bottom of the screen. Selecting the items on the Navigation Menu allows you to switch between the main sections on MaxiFix. These main sections include:
- Home –shows all questions and allows you to specify questions about one or multiple makes.
- Search Fix – allows you to search for information from all available resources on MaxiFix, including: Open Questions, Tips, and Real Fixes, and displays search results.
- Ask –allows you to ask a question in the community.
-
My MaxiFix –shows all your posts including Questions and Fixes in the community, and allows you to view your personal profile, select your vehicle preference, and share your tips.
-
My Messages – shows a list of message notifications which is relevant to your activities in the Question section.
- Support – opens the FAQ page, or a message box for contacting Customer Service by email.
Home
Home is the first option on the Navigation Menu at the bottom of the screen. Tapping it opens your MaxiFix home page. There is a list of questions posted on the community, and you can scroll down the page to the bottom and view more questions by tapping "View More". Click on any question and you will be linked to the detailed page in the Ask section.
You can configure your main screen to display questions only related to the vehicle makes you are interested in, by clicking the “Filter” button on the main page of Home, and select the desired vehicle makes. This filter can be canceled anytime by clicking the “Remove All Filters” button, and the default setting will be restored to display questions about all vehicle makes.
Search Fix Features
Search Fix, the second option on the Navigation Menu at the bottom of the screen, presents search results for the specified vehicle. Search results are listed in various categories:
- All – includes all search results, including related Questions, Tips, and Real Fixes to your search.
- Questions – presents a list of open Question discussed in the community that may be pertinent to your search.
- Tips – presents a list of Tips that directly correlate to your search criteria. Select a Tip from the list to open and review the complete Tip.
- Real Fixes – presents a list of Tips that have been collected from actual shop repair orders and are presented in an easy-to-understand Complaint, Cause, Correction format.
Ask
Ask, the third option on the Navigation Menu at the bottom of the screen, allows you to ask a question about a particular vehicle repair issue in the community.
To ask a MaxiFix Question
- If not already done, click Select Vehicle on the Header to specify the vehicle you are asking about.
- Click Ask on the Navigation Menu at the bottom of the screen to open the Ask page.
- On the Ask page find Ask for Help, fill in the following sections to ask a question.
The Ask page has 4 sections:
- Subject – this is where you enter a brief subject for the question.
- My Question – ask a clear and concise question that you want to ask the community. Be sure to be descriptive and concise when asking your question.
- Problem Description –describe how the vehicle is behaving.
- Repair History – include any previous diagnostic tests that you performed, including the results of the tests. Also list any parts that were replaced during previous diagnostic work.
Tap Cancel button to cancel your question and return to the Ask page.
Tap Submit button to post your question to the community.
Tap Attach File button to include images or reference files with your question.
You are requested to select one Adopted Answer from all of the responses and then close the question. For details, please refer to My Messages section.
My MaxiFix
My MaxiFix, the fourth option on the Navigation Menu at the bottom of the screen, opens your personal MaxiFix page. To access the features on My MaxiFix page you can select from the tabs:
- My Questions – opens a list with links to the opened questions that you have posted to the community
- My Cases – opens a list with links to the closed questions and tips that you have contributed to the community.
- Marked Posts – opens a list with links to Tips and discussions that you are actively participating in.
- My Profile – allows you to view your Autel account information including: your Autel ID, personal information, MaxiFix score, phone number and register time, and edit your portrait.
- Vehicle Preference –used to set up a list of preferred vehicles. The preferred list allows you to limit the choices that displayed on the “Select Vehicle” list to specific years, and makes. Click “Set Year” or “Set Make” to set your preferred models. The preferred makes will also be displayed in the “Filter” options on the Home page.
- Share a Tip – allows you to share your personal repair experience with the community.
Click My MaxiFix on the Navigation Menu at the bottom of the screen, to display all questions and tips that you have contributed to the community.
Create a Tip
A “Tip” is a concise and complete description of the fix for a particular vehicle repair issue.
To create a new MaxiFix Tip
- Select My MaxiFix from the Navigation Menu.
- Select Select Vehicle from the Header and enter the identifying attributes of the vehicle you are writing the Tip about.
- On the My MaxiFix page find Share a Tip; click this link to open the My Tips page.
- Enter the Tip subject in the Subject field.
- Compose your Tip in the Description field. Include as much information as possible, while keeping the information concise and to the point. A Tip should provide accurate information that is reader-friendly.
Use the Cancel button at the right-side bottom of the page to cancel your tip and return to the My MaxiFix page. Or,
Use the Submit button at the right-side bottom of the page to contribute your tips to the community.
Use the Attach File button at the left-side bottom of the page to include images or other supporting data with your question.
View Profile Information
You can view your personal profile by clicking on your account ID or "My Profile" in My MaxiFix section or edit portrait where applicable, and visit other community members' profile by clicking their portrait. Information included in your profile determines how you are presented to the community, and what type of information will be sent to you from the community.
My Messages
My Messages, the fifth option on the Navigation Menu at the bottom of the screen, shows a list of message notification which is relevant to your activities in the Question section. A notification icon will appear on the top-right corner of "My Messages" if there is any new or unread message in the Question section. The number on the notification icon indicates the total number of the new and unread messages. The displayed number will be reduced correspondingly after viewing. The message notification will appear under the following two conditions:
-
Your question or answer is replied by other MaxiFix community members.
-
Your answer is marked as the "Adopted!" by the MaxiFix community member who asked the question.
Tap My Messages, select and open the message you want to read from the list. If your problem is solved according to the reply, you should select one Adopted Answer and close the question. If your answer is marked as "Adopted!", the prompt "Adopted! + 4" will be displayed permanently.
Tap Clear to delete all message notifications.
Select "Adopted Answers"
Members are requested to select one Adopted Answer from all of the responses on “My Messages” page before closing a question. The community members who provided the Adopted Answer are rewarded with scores for their contribution.
About Adopted Answer:
- Only one answer can be selected as “Adopted Answer”.
- Answers can only be rated by the MaxiFix member who asked the question.
Close a Question
When a repair question that you've posted to the community is resolved, you are encouraged to write down the case as a way to share a good solution. This will help the other MaxiFix members to find useful information for practical fix.
To close a question, you need to select the question's response message from the message list on "My Messages" page first, then tap "Adopted Answer" and select "Close Question". Tap the "Cancel" button to cancel your submission and return to My Messages page. It is strongly recommended to share your repair solutions before closing a question. Your question will be converted to a MaxiFix Community Tip after closing.
Score Rewarding System
-
A score of 3 is awarded when you close a question.
-
A score of 2 is awarded if your closed question is marked as "Adopted!" by no less than 20 community members.
-
A score of 4 is awarded if your answer is selected as the "Adopted Answer".
-
A score of 1 is awarded if your answer is selected as the "Adopted Answer" for a closed question which is marked as "Adopted!" by no less than 20 community members.
-
A score of 1 is awarded to each of the first three respondents.
Support
Support, the last option on the Navigation at the bottom of the screen, opens a page that provides 2 ways to gain support from MaxiFix:
-
A message form to contact the administrator of MaxiFix.
-
A Frequently Asked Questions (FAQ) link that answers the most frequent questions we hear from MaxiFix community members.
If you wish to contact the administrator of this site please use the contact form. Select "Support" from the Navigation Menu to open the comment window. To
allow the administrator to respond to your question or issue, the following information should be provided:
- Your name
● A contact email address
● A contact phone number
7 Settings Operations
Selecting Settings application opens a setup interface, on which you can adjust default setting and view information about the MaxiSys system. There are eight options available for the MaxiSys system settings:
- Unit
- Language
- Printing Setting
- Wired Network
- Notification Center
- Multitask
- About
- System Settings
Operations
This section describes the operation procedures for the settings.
Unit
This option allows you to adjust the measurement unit for the diagnostic system.
To adjust the unit setting
- Tap the Settings application on the MaxiSys Job Menu.
- Tap the Unit option on the left column.
-
Select the required measurement unit, Metric or English. A tick icon will display to the right of the selected unit.
-
Tap the Home button on the top left corner to return to the MaxiSys Job Menu. Or select another setting option for the system setup.
Language
This option allows you to adjust the display language for the MaxiSys system.
To adjust the language setting
- Tap the Settings application on the MaxiSys Job Menu.
- Tap the Language option on the left column.
-
Select the required language. A tick icon will display to the right of the selected language.
-
Tap the Home button on the top left corner to return to the MaxiSys Job Menu. Or select another setting option for the system setup.
Printing Setting
This option allows you to print any data or information anywhere and anytime either via PC network or Wi-Fi. For more information about printing, see Printing Operation on page 20.
To setup the printer connection
- Tap the Settings application on the MaxiSys Job Menu.
-
Tap the Printing Setting option on the left column.
-
Tap the Print via Network item to activate the printing function, which enables the device to send files to the printer through the PC via Wi-Fi or Ethernet connection.
-
Tap the Home button on the top left corner to return to the MaxiSys Job Menu. Or select another setting option for the system setup.
Wired Network
This option allows you to enable or disable the wired network connectivity, as well as to perform Ethernet configuration.
To operate Ethernet configuration
- Tap the Settings application on the MaxiSys Job Menu.
-
Tap the Wired Network option on the left column.
-
Tap the ON/OFF button to enable the Wired Network connection. If the connectivity is enabled the button turns blue, or if disabled the button turns gray.
- Tap the ○> button to the right of the Ethernet Configuration option, a setup window displays.
- Select a connection type:
- DHCP – obtains the LAN IP address automatically
● Static IP – allows manual input of IP address
- If Static IP is selected, you need to enter the IP values manually.

NOTE
If you are not sure about the specific IP address values, please contact your network administrator.
- Tap Save to save the Ethernet configuration setting; or tap Cancel to exit without saving.
- Tap the Home button on the top left corner to return to the MaxiSys Job Menu. Or select another setting option for the system setup.
Notification Center
This option allows you to turn the Notification Center function on or off. The Notification Center function configures the MaxiSys tablet to receive regular online messages from the server for system update notifications or other service information via the Internet. It is highly recommended to keep this function on all the time, so you won't miss out any new update for MaxiSys or event from Autel. Internet access is required for receiving on-line messages.
To enable the Notification Center function
- Tap the Settings application on the MaxiSys Job Menu.
- Tap the Notification Center option on the left column.
- Tap the ON/OFF button to enable or disable the Notifications function. If the function is enabled the button turns blue, or if disabled the button turns gray.
- Tap the Home button on the top left corner to return to the MaxiSys Job Menu. Or select another setting option for the system setup.
When the Notification Center function is turned on, and new messages are received by the MaxiSys device, a notification message displays on the MaxiSys Job Menu. Press on the message bar and drag it down, and the received messages are shown in the list, slide the list up or down to view all if the message list covers more than one screen.
Tapping a specific message launches the corresponding application. For example, if you tap on an Update notification message, the Update application will be launched.
Multitask
The Multitask option allows you to turn Multitask function on or off. The Multitask feature enables you to browse and navigate more freely among different applications on the MaxiSys system. By simple tapping the Multi Task button, the Multi Task menu displays all bookmarks of the active applications; you can switch from one app to another in just 1 second.
To enable the Multitask function
- Tap the Settings application on the MaxiSys Job Menu.
- Tap the Multitask option on the left column.
- Tap the ON/OFF button to enable or disable the Multitask function. If the function is enabled the button turns blue, or if disabled the button turns gray.
- Tap the Home button on the top left corner to return to the MaxiSys Job Menu. Or select another setting option for the system setup.
About
The About option provides information of the MaxiSys diagnostic device regarding the product name, version, hardware, and serial number, etc.
To check the MaxiSys product information in About
- Tap the Settings application on the MaxiSys Job Menu.
- Tap the About option on the left column. The product information screen displays on the right.
- Tap the Home button on the top left corner to return to the MaxiSys Job Menu, or select another setting option for the system setup, after viewing.
System Settings
This option provides you a direct access to the Android background system setting interface, on which you can adjust various system settings for the Android system platform, regarding wireless and networks settings, various device settings such as sound and display, as well as system security settings, and check the associated information about the Android system, etc. Refer to Android documentation for additional information.
8
Shop Manager Operations
The Shop Manager application helps you to manage the workshop information, customer information records, and keep test vehicle history records, which can be a great assist in dealing with daily workshop business and improves customer service. There are three main functions available:
- Vehicle History
● Workshop Information - Customer Manager
The operations of these functions of the Shop Manager application are mainly manipulated by the toolbar buttons, which are listed and described in the table below:
Table 8-1 Top Toolbar Buttons in Shop Manager
| Name | Button | Description |
| Back |  | Returns to the previous screen. |
| Diagnostics |  | Touching this button directs you to the vehicle's Diagnostics screen to activate a direct test session. |
| Enter Edit |  | Touching this button shows the editing toolbar to print or delete the selected file. |
| Delete |  | Touching this button deletes the selected vehicle record item from the list. |
| Search |  | Quickly locates the vehicle record by entering the vehicle name or test path. |
| Cancel |  | Touching this button to cancel edit or file search. |
| Edit |  | Touching this button allows you to edit information for the displayed file. |
| Add Account |  | Touching this button to create a new customer account file. |
| History Notes |  | Touching this button opens a note form, which allows you to create audio record, attach picture or video, or edit text notes, etc. |
| Vehicle History |  | Touching this button opens the Vehicle History screen which displays the correlated test vehicle records. |
| Done |  | Saves the file when complete editing. |
Vehicle History
This function stores records of test vehicle history, including vehicle information and the retrieved DTCs from previous diagnostic sessions, and displays all information in an easy-to-check table list, on which you can view summarized details and manually input other information about the test vehicle and diagnostic loggings, etc. The Vehicle History also provides direct access to the previously tested vehicle and allows you to restart a diagnostic session without the need to do vehicle identification again.

Figure 8-1 Sample Vehicle History Screen
- Top Toolbar Buttons – navigates and makes various controls of the application.
- Main Section – displays all the vehicle history records information.
To activate a test session for the recorded vehicle
- Tap the Shop Manager application on the MaxiSys Job Menu.
- Select Vehicle History
- Tap the Diagnostics button at the bottom of the thumbnail of a vehicle record item. Or,
- Select a vehicle record item by tapping the thumbnail.
- A Historical Test record sheet displays, check the recorded information of the recorded test vehicle, and tap the Diagnostics button on the upper right corner.
- The vehicle's Diagnostics screen displays, now a new diagnostic session is activated, see Diagnosis on page 37 for detailed instructions on vehicle diagnostic operations.
Historical Test Record
The Historical Test record sheet of the tested vehicle is a detailed data form, which includes all general information of the vehicle such as vehicle year, make
and model, etc., and the diagnostic trouble codes retrieved from the previous test sessions, as well as other service details which can be added manually by the technician himself.
![Historical test Title Iveco truck VCM-Immobilizer Print E-mail Delete Vehicle information Year Make Iveco truck Model VCM-Immobilizer Sub model Engine VIN License Odometer Mileage Color Status Not started Service record Technician Technician Notes Customer information First name Last name Add to customer > DTC System Codes Description Status Autel_ABAC 0x10 Electronic control unit,internal fault [dtc:275-fmi:c] Present count: 1](/content/2026/06/1374135/images/b6ce8f3fce9d15a3f1a4be173a69e02ef5aac5720e78e12e7521a82bd765767c.jpg)
Figure 8-2 Sample Historical Test Record Sheet
To edit the Historical Test record sheet
- Tap the Shop Manager application on the MaxiSys Job Menu.
- Select Vehicle History.
- Select the specific vehicle history record thumbnail from the main section. The Historical Test record sheet displays.
- Tap the Edit button to start editing.
- Tap on each item to input the corresponding information or add attaching files or images.

NOTE
The vehicle VIN number, or license and the customer information account are correlated by default. Adding one of the information will automatically associate the other item in the record sheet, provided that the later one exists.
-
Tap Add to Customer to correlate the Historical Test record sheet to an existing customer account, or add a new associating account to be correlated with the test vehicle record. See Customer Manager on page 86 for more information.
-
Tap Done to save the updated record sheet, or tap Cancel to exit without saving.
Workshop Information
The Workshop Information form allows you to edit, input and save the detailed workshop information, such as shop name, address, phone number and other remarks, which, when printing vehicle diagnostic reports and other associated test file, will appear as the header of the printed documents.

Figure 8-3 Sample Workshop Information Sheet
To edit the Workshop Information sheet
-
Tap the Shop Manager application on the MaxiSys Job Menu.
-
Select Workshop Information.
-
Tap the Edit button on the top toolbar.
-
Tap on each field to input the appropriate information.
-
Tap Done to save the updated workshop information sheet, or tap Cancel to exit without saving.
The Customer Manager function allows you to create and edit customer accounts. It helps you to save and organize all customer information accounts that are correlated with the associated test vehicle history records, which is a great support for the arrangement of daily workshop business.
To create a customer account
- Tap the Shop Manager application on the MaxiSys Job Menu.
- Select Customer Manager.
- Tap the Add Account button. An empty information form displays, tap each field to input the appropriate information.

NOTE
The items that must be filled are indicated as required fields.
- Tap the ☐ photo frame beside the Name chart to add a photo. A sub menu displays, select Take Photo to take a new photo for the account, or select Choose Photo to choose from the existing files.
- Some customers may have more than one vehicle for service; you can always add new vehicle information to the account to be correlated. Tap Add New Vehicle Information, and then fill in the vehicle information. Tap the ☐x button to cancel adding.
- Tap Done to save the account, or tap Cancel to exit without saving.
To edit a customer account
- Tap the Shop Manager application on the MaxiSys Job Menu.
- Select Customer Manager.
- Select a customer account by tapping the corresponding name card. A Customer Information sheet displays.
- Tap the Edit button on the top toolbar to start editing.
- Tap on the input field where needs to be altered or supplemented, and enter updated information.
- Tap Done to save the updated information, or tap Cancel to exit without saving.
To delete a customer account
- Tap the Shop Manager application on the MaxiSys Job Menu.
- Select Customer Manager.
- Select a customer account by tapping the corresponding name card. A Customer Information sheet displays.
-
Tap the Edit button on the top toolbar to start editing.
-
Tap the Delete Customer Information button. A confirmation message displays.
-
Tap OK to confirm the command, and the account is deleted. Tap Cancel to cancel the request.
History Notes
The History Notes function allows you to add audio and video records, text notes and photos, to keep multi-media work logs for the associated customer account, which can be very helpful when dealing with repeat customers. Keeping notes for each vehicle serviced for each customer will keep you always on track and well organized in business.
To access History Notes
-
Tap the Shop Manager application on the MaxiSys Job Menu.
-
Select Customer Manager or Vehicle History.
-
Select a customer account by tapping the corresponding name card. A Customer Information sheet displays (if Customer Manager is selected). Or, select a vehicle history record item to open the Historical Test record sheet (if Vehicle History is selected).
-
Tap the History Notes button on the top bar. Now the History Notes screen displays.

Figure 8-4 Sample History Notes Screen
- Functional Buttons – navigates and make various controls of the function
- Main Section – displays the note list on the left column and the detail information of the selected note on the right column
Table 8-2 Function Buttons in History Notes
| Name | Button | Description |
| Back |  | Returns to the previous screen. |
| Delete |  | Touching this button deletes the selected note. |
| Search |  | Quickly locates the required note by entering the note title. |
| Cancel |  | Touching this button to cancel edit or file search. |
| Edit |  | Touching this button opens an edit window allowing you to edit notes and attach files. |
| Add Notes |  | Touching this button to add new note in History Notes. |
| Audio Record |  | Performs audio recording and creates audio files. |
| Add Photos |  | Opens the image file for selection, and adds the selected photos to History Notes. |
| Take a Video |  | Records a video and adds the file to History Notes. |
| Take a Photo |  | Takes photos and adds the files to History Notes. |
| Save |  | Saves notes. |
To add a note in History Notes
- Access History Notes.
- Tap the Add Notes button. An edit window displays.
- Tap on the Title bar to input a note title.
- Tap on the blank space below to edit a text note or remark.
- Select a function button on the top to add files in any form you choose.
- Tap Save to save the note; tap Discard or Cancel to exit without saving.
9
Update Operations
The internal programming of the MaxiSys Diagnostic System, known as the firmware, can be updated using the Update application. Firmware updates increase the MaxiSys applications' capabilities, typically by adding new tests, new models, or enhanced applications to the database.
The display device automatically searches for available updates for all of the MaxiSys components when it is connected to the internet. Any updates that are found can be downloaded and installed on the device. This section describes installing an update to the MaxiSys Diagnostic System firmware. A notification message displays if an update is available when the Notifications function is enabled in the Settings application (See Notification Center on page 78 for details).

Figure 9-1 Sample Update Screen
1. Navigation and Controls
- Home Button – returns to the MaxiSys Job Menu
- Update All – updates all available updates
- Search Bar – searches specific update item by inputting the file name, for example: a vehicle make
2. Status Bar
- Left Side – displays the MaxiSys device model information and serial number
- Right Side – displays an update progress bar indicating the completion status
3. Main Section
- Left Column – displays vehicle logos and update firmware version information; tap the About button displays a function list in PDF showing more details about the firmware
- Middle Column – displays a brief introduction about the new changes to the firmware operation or capabilities. Tap button to open an information screen to view more details, and tap the dim area around to close the window.
- Right Column – according to the operation status of each firmware item, the button displays differently.
a) Tap Update to update the selected item.
b) Tap Pause to suspend the updating procedure.
c) Tap Continue to go on updating the suspended update.
To update the firmware
- Power up the MaxiSys Display Tablet, and ensure that it is connected to a power source and with steady internet connection.
- Tap the Update application button from the MaxiSys Job Menu; or tap the update notification message when received one. The Update application screen displays.
- Check all available updates:
- If you decide to update all the items, tap the Update All button.
- If you only want to update some individual items, tap the Update button on the right column of the specific item.
- Tap the Pause button to suspend the updating process. When you tap Continue to renew the update, the updating process will resume from the break point.
- When the updating process is completed, the firmware will be installed automatically. The new version will replace the original version if there is one.
10 VCI Manager Operations
This application allows you to pair up the MaxiSys Display Tablet with the VCI device, either the J2534 Programming Device or the Wireless Diagnostic Interface, and to check the communication status.

Figure 10-1 Sample VCI Manager Screen
-
Connection Mode – there are two connection modes available for selection. The connection state is displayed alongside.
-
BT Paring – when paired to a wireless device, the connection state displays as Paired; otherwise it displays as Unpaired.
- Update (for VCI software only) – Update VCI software via internet through the MaxiSys tablet networking using USB connection.
Select a connection mode to manage and set up connection.
-
Settings – this section allows you to manage wireless pairing or set up network connection.
-
BT Setting – searches and displays the type and a partial serial number for all of the devices available for pairing. Tap a required device to start pairing. The BT status icon displayed to the left of the device name indicates the received signal strength.
- Ethernet Setting – allows you to perform network configuration.
BT Pairing
The VCI device needs to be either connected to a vehicle or to an available power source, so that it is powered up during the synchronization procedure. Make sure the MaxiSys Display Tablet has a charged battery or is connected to an AC/DC power supply.
To pair the VCI device with the Display Tablet
- Power on the MaxiSys Display Tablet.
- Connect the 26-pin end of the data cable to the J2534 ECU Programming Device's vehicle data connector.
- Connect the 16-pin end of the data cable to the vehicle data link connector (DLC).
- Tap the VCI Manager application on the MaxiSys Job Menu of the Display Tablet.
- Select BT from the connection mode list.
- Tap the Scan button at the top right corner. Now the device starts searching for available pairing units.
- Depending on the VCI type you use, the device name may display as Maxi suffixed with a serial number. Select the required device for pairing.
- When paring is successfully done, the connection status displayed to the right of the device name is shown as Paired.
- Wait a few seconds, and the VCI button on the system Navigation bar at the bottom of the screen shall display a green tick icon, indicating the Display Tablet is connected to the VCI device.
- Tap the paired device again to unpair it.
- Tap the Back button on the top left to return to the MaxiSys Job Menu.

NOTE
A VCI device can be paired to only one Display Tablet each time, and once it's been paired, the device will not be discoverable for any other unit.
Update
Before update the VCI software, please make sure the MaxiSys tablet network connection is stable.
To update the VCI device software
- Power on the MaxiSys Display Tablet.
- Connect the VCI device to MaxiSys tablet via USB.
- Tap the VCI Manager application on the MaxiSys Job Menu of the Display Tablet.
- Select Update from the connection mode list.
- The current version and the latest version of the VCI software will be displayed after a few seconds, click Update Now to update the VCI software if available.
11 Remote Desk Operations
The Remote Desk application launches the TeamViewer Quick Support program, which is a simple, fast and secure remote control interface. You can use the application to receive ad-hoc remote support from Autel's support center, colleagues, or friends, by allowing them to control your MaxiSys tablet on their PC via the TeamViewer software.
Operations
If you think of a TeamViewer connection as a phone call, the TeamViewer ID would be the phone number under which all TeamViewer Clients can be reached separately. Computers and mobile devices that run TeamViewer are identified by a globally unique ID. The first time the Remote Desk application is started, this ID is generated automatically based on the hardware characteristics and will not change later on.
Make sure the MaxiSys Display Tablet is connected to the Internet before launching the Remote Desk application, so that the Display Tablet is accessible to receive remote support from the third party.
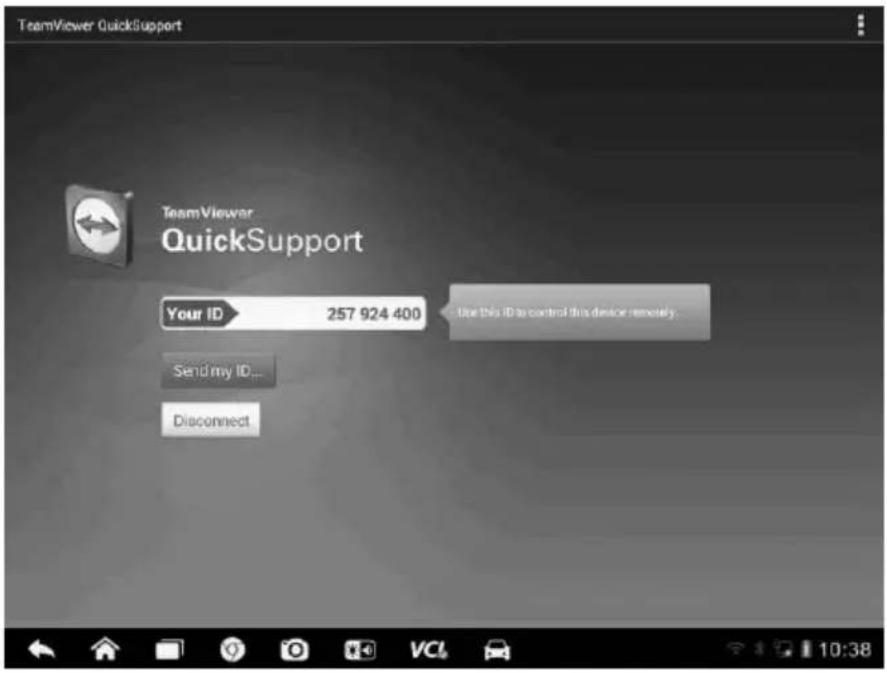
Figure 11-1 Sample Remote Desk Screen
To receive remote support from a partner
- Power on the MaxiSys Display Tablet.
- Tap the Remote Desk application on the MaxiSys Job Menu. The TeamViewer interface displays and the device ID is generated and shown.
- Your partner must install the Remote Control software to his/her computer by downloading the TeamViewer full version program online (http://www.teamviewer.com), and then start the software on his/her computer at the same time, in order to provide support and take control of the Display Tablet remotely.
- Provide your ID to the partner, and wait for him/her to send you a remote control request.
- A popup displays to ask for your confirmation to allow remote control on your device.
- Tap Allow to accept, or tap Deny to reject.
Refer to the associated TeamViewer documents for additional information.
12 Support Operations
This application launches the Support platform which synchronizes Autel's on-line service base station with the MaxiSys Display Tablet. In order to synchronize the device to your on-line account, you need to register the product through the Internet when you use it for the first time. The Support application is connected to Autel's service channel and on-line communities which provides the quickest way for problem solutions, allowing you to submit complaints or sent help requests to obtain direct services and supports.
Product Registration
In order to get access to the Support platform and obtain update and other services from Autel, you are required to register the MaxiSys Diagnostic Device the first time you use it.
To register the diagnostic device
- Visit the website: http://pro.autel.com on a personal computer.
- If you already have an Autel account, sign in with your account ID and password.
- If you are a new member to Autel, click on the Create Autel ID button on the left side to create an ID.
- Enter the required information in the input fields, read through Autel's Terms and Conditions and tick on Agree, and then click Create Autel ID at the bottom to continue.
- The online system will automatically send a confirmation email to the registered email address. Validate your account by clicking the link provided through the email. A product registration screen opens.
-
The device's serial number and password is located in the About section of the Settings application on the MaxiSys Display Tablet.
-
Select the product model of your device, enter the product serial number and password on the Product Registration screen, and click Submit to complete the registration procedure.
Support Screen Layout
The Support application interface is navigated by four simple buttons on the top navigation bar, operation of each is described below in turn from left to right:
- Home Button – returns to the MaxiSys Job Menu.
- Back – returns to the previous screen, each press takes you one step backwards.
- Forward – each press moves forward one screen until you’ve reached the last screen visited.
- Refresh – reload and update the screen.

Figure 12-1 Sample Support Application Screen
The main section of the Support screen is divided into two sections. The narrow column on the left is the main menu; selecting one subject from the main menu displays the corresponding functional interface on the right.
The My Account screen displays the comprehensive information of the user and the product, which is synchronized with the on-line registered account, including User Info, Device Info, Update Info and Service Info.
Personal Info
The User Info and Device Info are both included under the Personal Info section.
- User Info - displays detailed information of your registered on-line Autel account, such as your Autel ID, Name, Address and other contact information, etc.
● Device Info – displays the registered product information, including the Serial Number, Registration Date, Expire Date, and Warranty Period.
Update Info
The Update Info section displays a detailed record list of the product's software update history, including the product serial number, software version or name, and the update time.
Service Info
The Service Info section displays a detailed record list of the device's service history information. Every time the device has been sent back to Autel for repair, the device's serial number and the detailed repair information, such as the fault type, changed components, or system reinstallation, etc, will be recorded and updated to the associated online product account, which will be synchronized to the Service Info section.
User Complaint
The User Complaint screen allows you to establish a new complaint case, as well as to view historical complaint records.
Screen Layout

Figure 12-2 Sample Complaint Screen
The User Complaint screen consists of two parts.
1. Option Bar
- Period Filter – displays only the complaint records within the defined period on the list
- Status Filter – displays the corresponding complaint records according to the selected case status
- New Complaint Button – starts a new complaint case.
2. Complaint List
The complaint list normally displays all the complaint records of all time and all status by default. The summary information for each complaint item includes the Subject Name, Ticket ID, User's Account ID, Date, and the Case Status.
There are four kinds of the case status:
- Open – indicates the complaint case has been started but not processed yet
- Suspended – indicates the complaint case is being processed
- Waiting Customer Reply – indicates the complaint has been replied by the service personnel, and requires feedback from the customer
- Closed – indicates the complaint case has been processed, solved, and ended
To view the detailed complaint session, tap the ➤ button on the right side of the case item.
To establish a new complaint session
- Register the product online.
- Tap the Support application on the MaxiSys Job Menu. The device information is automatically synchronized with the online account.
- Tap Complaint on the Main Menu.
- Tap the New Complaint button at the upper right corner. A selection menu with a category of service channels displays.
- Select your target service channel and click Next to continue. A standard complaint form displays, on which you are allowed to enter detailed information, such as personal information, vehicle information, and device information, you can also attach image or PDF files with the form.
- Enter in each input field the appropriate information, in order to settle the complaint more efficiently, it is recommended to fill out the complaint form as detailed as possible.
- Select the required processing time on the last section according to the urgency of the case.
- Tap Submit to send the completed form to Autel's online service center, or tap Reset to refill it. The submitted complaints will be carefully read and handled by the service personnel, and the respond speed may depend on the processing time you've required.
To make a reply in a complaint session
- Register the product online.
- Tap the Support application on the MaxiSys Job Menu. The device information is automatically synchronized with the online account.
- Tap Complaint on the Main Menu.
-
Select an existing complaint case item on the record list by tapping the Ⓧ button on its right side. The screen displays the complaint session details.
-
Tap the Post Reply button on the upper right side after viewing, to make a reply. An edit screen displays.
- Input the content in the input field, and if necessary, upload an attaching file.
- Tap Submit to post the reply.
- Tap the States selection drop-down menu to reset a case state.
- Tap the Update button to commit the newest update.
Data Logging
The Data Logging section keeps records of all Feedback (submitted), Not Feedback (but saved) or History (up to the latest 20 test records) data loggings on the diagnostic system. The support personnel receive and process the submitted reports through the Support platform, and send back problem solutions within 48 hours to the corresponding Data Logging session, on which you are also allowed to have a direct conversation with the support personnel.

Figure 12-3 Sample Data Logging Screen
To make a reply in a Data Logging session
-
Tap on the Feedback tag to view a list of submitted data loggings.
-
Select a specific item to view the latest update of the processing progress.
- Tap on the input field at the bottom of the screen, and enter the texts. Or tap the Audio button to record a voice message, or camera button to take a picture.
- Tap Send to deliver your message to the technical center.
Communities
The Communities section launches and synchronizes with the Technical Forums on Autel's official website www.autel.com, where you are allowed to discuss technical topics or share information with, as well as ask for technical advices or offer technical supports to all other members in Autel's online support communities.
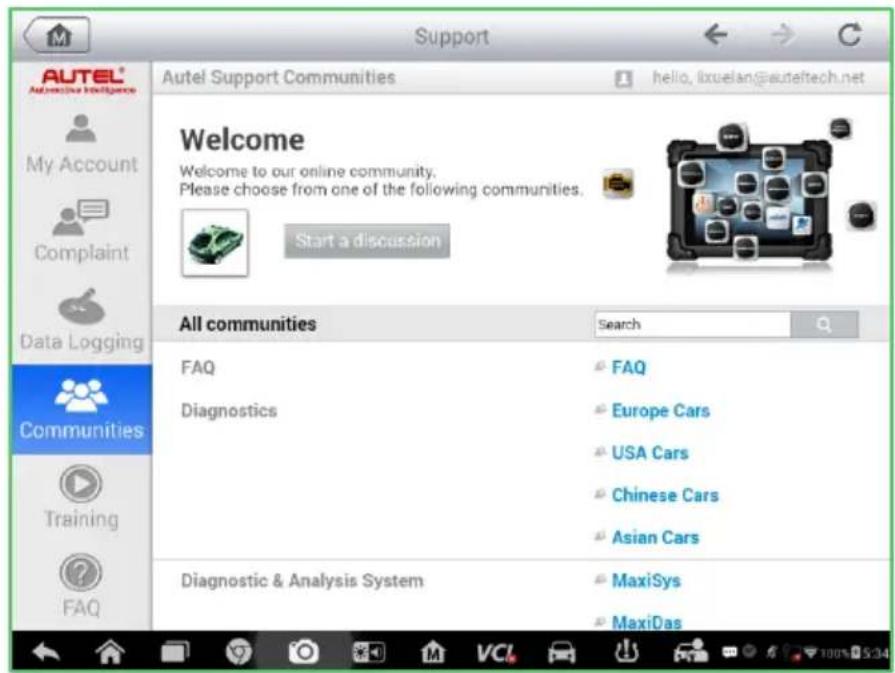
Figure 12-4 Sample Communities Home Screen
To start a discussion
- Tap Start a discussion on the Communities Home screen. A list of the major forums is displayed.
-
Select a desired group according to the subject you are about to discuss. For example, if you are going to ask a question about the MaxiSys tablet, tap MaxiSys to start a discussion.
-
Enter your topic and the discussion content in the appropriate input field.
-
Select a category or edit tags for the discussed post. This will help other members with similar interest to find your post.
-
Tap OK to submit the post.
To join and reply to a discussion post
- Select a forum group that you are interested in, whether by the product or the features, on the Communities Home screen. A list of the latest posts is displayed.
- Select a specific category on the Categories menu to better pinpoint the topics you are most interested with.
- Tap the ○ button on the right side of the topic item to view the discussion. The posts contents are displayed.
- Browse through all the posts by sliding the screen up and down. Tap Go to original post when reaching the end of the discussion to return to the first post.
- Tap Reply to reply a specific post, or tap Reply to original post to join and continue the whole discussion.
- Enter your comment in the input field, and tap OK to submit your post.
User Profile
The User Profile section allows you to set personal Avatar, check your member status and other information, as well as to review your personal posts in the communities.
Tap the Avatar image on the Communities screen to open the User Profile.

Figure 12-5 Sample User Profile Screen
- Profile – displays the user's personal information and member status. The Related links allow you to check the Top Users (ranked according to their points and levels) in the communities, as well as to find out other online users.
- Avatar – allows you to select an image to set as your personal Avatar to be displayed in the communities.
- Stuff – displays all the discussions you’ve posted at various forums in a list.
Training Channels
The Training section provides quick links to Autel's online video accounts. Select a video channel by the language to see all the available online tutorial videos from Autel for various technical supports, such as product usage techniques and vehicle diagnostics practice, etc, may be available for your interests.
FAQ Database
The FAQ section provides you comprehensive and abundant references for all kinds of questions frequently asked and answered about the use of Autel's online member account, and shopping and payment procedures.
- Account – displays questions and answers about the use of Autel’s online user account.
- Shopping & Payment – displays questions and answers about online product purchase and payment methods or procedures.
13 Training Operations
The Training application provides and allows you to play various tutorial videos stored on the device. The stored training materials mainly consists of product usage tutorials and vehicle diagnostic training videos, all produced by top-notch technicians and product experts. The application also allows you to download or watch more associated videos online, by providing quick links to Autel's online video database.

Figure 13-1 Sample Training Application Screen
-
Navigation Buttons – allows you to navigate the application interface.
-
Home Button – returns to the MaxiSys Job Menu
- Video Button– redirect user to YouTube for related videos.
-
Manuals Button – illustrate how to connect the wires.
-
Main Section – displays the available video files for watching
To play a video
- Tap the Training application on the MaxiSys Job Menu. The Training application screen displays.
- Select a video file from the main section.
- Select a Player from the popup window if necessary. Now you can watch the video, it is played in full screen mode.
14 Quick Link Operations
The Quick Link application provides you with convenient access to Autel's official website and many other well-known sites in automotive service, which offers you abundant information and resources, such as technical help, knowledge base, forums, training, and expertise consultations, etc.

Figure 14-1 Sample Quick Link Screen
To open a quick link
- Tap the Quick Link application on the MaxiSys Job Menu. The Quick Link application screen displays.
- Select a website thumbnail from the main section. The Chrome browser is launched and the selected website is opened.
- Now you can start exploring the website!
15 MaxiScope Operations
The MaxiScope application configures the MaxiSys Diagnostic Device to operate as an automotive oscilloscope when work in combination with the MaxiScope module. This function provides all the features needed for performing electrical and electronic circuit tests as well as monitoring signal activities on any modern vehicles, which shows you what is really going on with a vehicle's electrical system.
Safety Information
Follow these instructions to reduce the risk of injury from electric shock and prevent equipment damage.
A. Maximum Input Ranges
Observe all terminal ratings and warnings marked on the product.

DANGER
To prevent electric shock, operate within the safe input range for the scope, refer to Safety Information on page 111.
To prevent electric shock, take all necessary safety precautions when working on equipment where voltages above the specified input range may be present. Contact with voltages outside of the specified measuring range presents a risk of electric shock.
To prevent injury or death, the oscilloscope must not be directly connected to the mains (line power). To measure mains voltages, use a differential isolating probe specifically rated for mains use.

WARNING
Operation outside of the safe input range is likely to cause permanent damage to the oscilloscope and other connected equipment.
B. Grounding

DANGER
The scope's ground connection through the USB cable is for measurement purposes only. The oscilloscope does not have a protective safety ground.
Do not connect the ground input (chassis) to any electrical power source. To prevent personal injury or death, use a voltmeter to check that there is no significant AC or DC voltage between the oscilloscope ground and the point to which you intend to connect it.

WARNING
Applying a voltage to the ground input is likely to cause permanent damage to the oscilloscope, the attached computer, and other equipment.
To prevent measurement errors caused by poor grounding, always use the high-quality USB cable supplied with the oscilloscope.
C. External Connections

DANGER
To prevent injury or death, use only the power cord and adaptor supplied with the product.
D. Environment

DANGER
To prevent injury or death, do not use in wet or damp conditions, or around explosive gas or vapor.

WARNING
To prevent damage, always use and store your oscilloscope in appropriate environments. For detailed information on temperature and humidity specifications for both the storage and usage of the oscilloscope, see Safety Information on page 111.
E. Product Maintenance
The product contains no user-serviceable parts. Repair, servicing and calibration require specialized test equipment and must only be performed by Autel Tech Support or an approved service provider.

DANGER
To prevent injury or death, do not use the product if it appears to be damaged in any way, and stop use immediately if you are concerned by any abnormal operations.

WARNING
Do not tamper with or disassemble the oscilloscope, connectors or accessories. Internal damage will affect performance.
Do not block any of the instrument's air vents as overheating will cause damage to the oscilloscope.
When cleaning the oscilloscope, use wet soft cloth with mild detergent in water. Do not allow water to enter the oscilloscope casing, as this will cause damage to the electronics inside.
Glossary
AC/DC Control
Each channel can be set to either AC coupling or DC coupling. With DC coupling, the voltage displayed onscreen is equal to the true voltage of the signal with respect to ground. With AC coupling, any DC component of the signal is filtered out, leaving only the variations in the signal for the AC component.
Aliasing
When the signal frequency gets higher than half the scope's maximum sampling rate and exceeds the limit, a distorted waveform appears. This distortion is called aliasing.
Analog Bandwidth
All oscilloscopes have an upper limit to the range of frequencies at which they can measure accurately. The analog bandwidth of an oscilloscope is defined as the frequency at which a displayed sine wave has half the power of the input sine wave (about 71% of the amplitude).
Block Mode
A sampling mode in which the computer prompts the oscilloscope to collect a block of data into its internal memory before stopping the oscilloscope and transferring the whole block into computer memory. This mode of operation is effective when the input signal being sampled is high frequency.
Buffer Size/Cache Size
This term indicates the size of the oscilloscope's buffer memory. The buffer memory is used by the oscilloscope to temporarily store data. This helps to compensate for the differences in data transfer rate from one device to another.
Sampling Rate
This term is used to define the number of samples per second captured by the oscilloscope. The faster the sampling rate of the scope, the more frequently it measures the signal voltage, and so the more detailed will be the trace that appears on the scope screen.
Streaming Mode
This term indicates a sampling mode in which the oscilloscope samples data and returns it to the computer in an unbroken stream. This mode of operation is effective when the input signal being sampled is at low frequency.
Time Base
The time base controls the time interval across the scope display.
Voltage Range
The voltage range is the range between the maximum and minimum voltages that can be accurately captured by the oscilloscope.
Sinusoidal Waveform
This term describes the waveform characteristics typically found in circuits with large inductance and capacitance, and often referred to as an AC signal. The waveform alternates either side of 0 volts or may rise and fall creating a regular sinusoidal shape:

line
| Frequency (Hz) | Amplitude | | -------------- | --------- | | 0 | 0 | | 1 | 2.00 | | 2 | 0 | | 3 | -2.00 | | 4 | 0 | | 5 | 2.00 | | 6 | 0 | | 7 | -2.00 | | 8 | 0 | | 9 | 2.00 | | 10 | 0 | | 11 | -2.00 | | 12 | 0 | | 13 | 2.00 | | 14 | 0 | | 15 | -2.00 | | 16 | 0 | | 17 | 2.00 | | 18 | 0 | | 19 | -2.00 | | 20 | 0 | | 21 | 2.00 | | 22 | 0 | | 23 | -2.00 | | 24 | 0 | | 25 | 2.00 | | 26 | 0 | | 27 | -2.00 | | 28 | 0 | | 29 | 2.00 | | 30 | 0 | | 31 | -2.00 | | 32 | 0 | | 33 | 2.00 | | 34 | 0 | | 35 | -2.00 | | 36 | 0 | | 37 | 2.00 | | 38 | 0 | | 39 | -2.00 | | 40 | 0 | | 41 | 2.00 | | 42 | 0 | | 43 | -2.00 | | 44 | 0 | | 45 | 2.00 | | 46 | 0 | | 47 | -2.00 | | 48 | 0 | | 49 | 2.00 | | 50 | 0 | | Peak | Peak to peak voltage (approx.) | | Peak | Peak to peak voltage (approx.) | | Peak | Peak to peak voltage (approx.) | | Peak | Peak to peak voltage (approx.) | | Peak | Peak to peak voltage (approx.) | | Peak | Peak to peak voltage (approx.) | | Peak | Peak to peak voltage (approx.) | | Peak | Peak to peak voltage (approx.) | | Peak | Peak to peak voltage (approx.) | | Peak | Peak to peak voltage (approx.) | | Peak | Peak to peak voltage (approx.) | | Peak | Peak to peak voltage (approx.) | | Peak | Peak to peak voltage (approx.) | | Peak | Peak to peak voltage (approx.) | | Peak | Peak to peak voltage (approx.) | | Peak | Peak to peak voltage (approx.) | | Peak | Peak to peak voltage (approx.) | | Peak | Peak to peaked voltage (approx.) | | Peak | Peak to peak voltage (approx.) | | Peak | Peak to peak voltage (approx.) | | Peak | Peak to peak voltage (approx.) | | Peak | Peak to peak voltage (approx.) | | Peak | Peak to peak voltage (approx.) | | Peak | Peak to peak voltage (approx.) | | Peak | Peak to peak voltage (approx.) | | Peak | Peak to peak voltage (approx) |Figure 15-1 Sample Sinusoidal Waveform
Amplitude
This term indicates the maximum voltage generated from the zero volts line of the oscilloscope.
Frequency
This term describes the number of signal occurrences per second. Frequency is measured in Hz (hertz).
Square Waveform
This term describes the waveform characteristics normally generated by signals switching between clearly defined voltage levels, such as a Hal effect sensor signal may create by switching a voltage to ground. A typical digital square waveform is shown below:
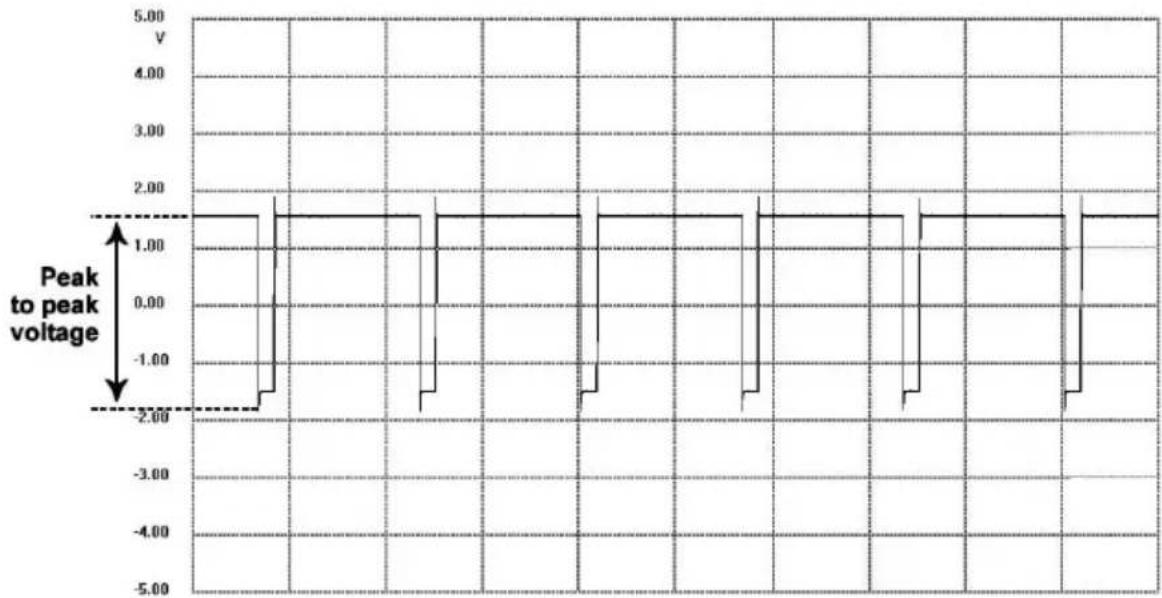
line
| Time | Voltage | |------|---------| | 0 | 1.5 | | 1 | -2.0 | | 2 | 1.5 | | 3 | -2.0 | | 4 | 1.5 | | 5 | -2.0 | | 6 | 1.5 | | 7 | -2.0 | | 8 | 1.5 | | 9 | -2.0 | | 10 | 1.5 | | 11 | -2.0 | | 12 | 1.5 | | 13 | -2.0 | | 14 | 1.5 | | 15 | -2.0 | | 16 | 1.5 | | 17 | -2.0 | | 18 | 1.5 | | 19 | -2.0 | | 20 | 1.5 | | 21 | -2.0 | | 22 | 1.5 | | 23 | -2.0 | | 24 | 1.5 | | 25 | -2.0 | | 26 | 1.5 | | 27 | -2.0 | | 28 | 1.5 | | 29 | -2.0 | | 30 | 1.5 | | 31 | -2.0 | | 32 | 1.5 | | 33 | -2.0 | | 34 | 1.5 | | 35 | -2.0 | | 36 | 1.5 | | 37 | -2.0 | | 38 | 1.5 | | 39 | -2.0 | | 40 | 1.5 | | 41 | -2.0 | | 42 | 1.5 | | 43 | -2.0 | | 44 | 1.5 | | 45 | -2.0 | | 46 | 1.5 | | 47 | -2.0 | | 48 | 1.5 | | 49 | -2.0 | | 50 | 1.5 | | 51 | -2.0 | | 52 | 1.5 | | 53 | -2.0 | | 54 | 1.5 | | 55 | -2.0 | | 56 | 1.5 | | 57 | -2.0 | | 58 | 1.5 | | 59 | -2.0 | | 60 | 1.5 | | 61 | -2.0 | | 62 | 1.5 | | 63 | -2.0 | | 64 | 1.5 | | 65 | -2.0 | | 66 | 1.5 | | 67 | -2.0 | | 68 | 1.5 | | 69 | -2.0 | | 70 | 1.5 | | 71 | -2.0 | | 72 | 1.5 | | 73 | -2.0 | | 74 | 1.5 | | 75 | -2.0 | | 76 | 1.5 | | 77 | -2.0 | | 78 | 1.5 | | 79 | -2.0 | | 80 | 1.5 | | 81 | -2.0 | | 82 | 1.5 | | 83 | -2.0 | | 84 | 1.5 | | 85 | -2.0 | | 86 | 1.5 | | 87 | -2.0 | | 88 | 1.5 | | 89 | -2.0 | | 90 | 1.5 | | 91 | -2.0 | | 92 | 1.5 | | 93 | -2.0 | | 94 | 1.5 | | 95 | -2.0 | | 96 | 1.5 | | 97 | -2.0 | | 98 | 1.5 | | 99 | -2.0 | | 100 | 1.5 |Figure 15-2 Sample Square Waveform
Peak to Peak Voltage
This term indicates the difference in voltage between the minimum and maximum voltages occurring in the waveform.
MaxiScope Module
The MaxiScope Automotive Oscilloscope tool kit is optional and available for purchase along with the MaxiSys package. There are 2 versions (basic and advanced versions) available.
The MaxiScope tool kit comes standard with:
- MaxiScope Module
- USB Cable
● Other probe accessories
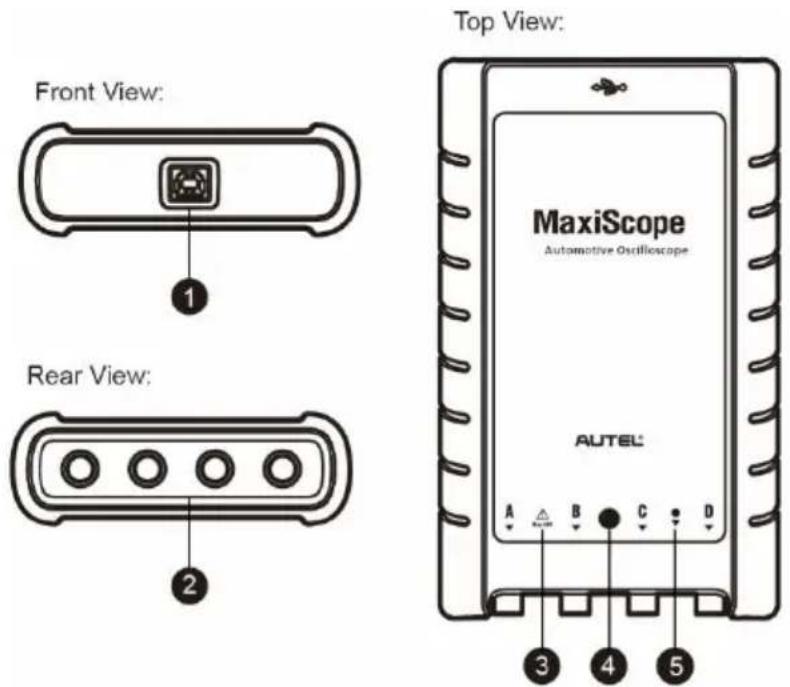
Figure 15-3 Front, Rear, and Top View
- USB Port Connector
- Input Channel A/B/C/D
- LED Indicator Light – lights up when powered on, blinks when communicating, and shimmers when error occurs
- Warning Triangle – indicates potential safety hazard that exists on the indicated connections, and appropriate precautions should be taken. Make sure you read through the Safety Information on page 111 before using.
- Equipotential Symbol – indicates the outer shells of the indicated BNC connectors are all at the same potential. Therefore, necessary precautions should be taken to avoid applying a potential through the return connections of the indicated BNC terminals, as this may result in a large current flow, causing damage to the product and the connected equipment.
Power Source
The MaxiScope MP408 Scope Module is powered directly by the USB port of the connected PC, no batteries or power leads are required, making it suitable for use both for workshop-based and mobile automotive diagnostics.
Technical Specifications
Table 15-1 Specifications
| Main Features | Description |
| Vertical resolution | 12 bits |
| Channels | 4 |
| Bandwidth | 20MHz |
| Accuracy | Voltage: 1%; Time: 50ppm |
| Sensitivity | 10mV/div to 20V/div |
| Input Ranges (full scale) | ±50mV to ±100V in 11 ranges |
| Input Impedance | 1MΩ in parallel with 22pF |
| Input Type | Single-ended, BNC connector |
| Input Coupling | Software selectable AC/DC |
| Overload Protection | ±200V on single input |
| Maximum Sampling Rate (Single Shot) | 80MS/s* |
| 1 or 2 channels in use | 20MS/s |
| 3 or 4 channels in use | |
| Buffer Memory | 32M samples shared among active channels |
| Waveform Buffer | Up to 1000 waveforms |
| Timebase Ranges | 100ns/div to 1000s/div |
| Advanced Features | Math channels, Measurements |
| Source | Any input channel |
| Basic Triggers | Auto, Normal, Single, None |
| Advanced Triggers | Rising edge, Falling edge |
| Operating Temperature Range | 0 to 50°C (15 to 40°C for quoted accuracy) |
| Storage Temperature Range | -20 to +60°C |
| Storage Humidity Range | 5 to 95%RH, Non-condensing |
| Dimensions (Protection rubber case included) | 190X115X38mm |
| Weight | <0.5kg |
| PC Interface | USB 2.0 – cable supplied |
| Power Requirements | Powered from USB port |
| Compliance | FCC (EMC), CE (EMC and LVD), RoHS |
| Warranty | 1 year |

NOTE
Reduced to 20MS/s if channels A and B, or C and D, are enabled.
Screen Layout and Operations
The MaxiScope application works as a signal processing program that displays the shape of electrical signals onscreen with a live graph showing voltage against time. The grid on the screen shows divisions of voltage and time to enable measurements to be made.
Units of voltage per division are shown down the side of the scope screen while units of time per division are shown along the bottom. The graph is referred to as a waveform and the scope repeatedly draws the trace across the screen from left to right.
Before performing the MaxiScope application, the MaxiScope Module must be connected to the Display Tablet. Apply appropriate probe accessories supplied with the MaxiScope tool kit for use in various tests.

Figure 15-4 Sample MaxiScope Application Screen Layout
- Top Toolbar – used for configurations of various settings and operations of the scope
- Functional Buttons on the top – used for configurations of channel activation, measurement scale and trigger settings
- Measurement Grid - displays measurements of voltage against time
- Functional Buttons at the bottom – used for configurations of trigger, time base, and measurement parameter display settings.
Top Toolbar
The top toolbar contains various functional buttons with options for operations and configurations of the MaxiScope, the operations of which are described in the table below:
Table 15-2 Toolbar Buttons
| Name | Button | Description |
| Car |  | This option provides a library of waveforms. Selecting one allows automatic set-up of the scope to capture a waveform of the specified waveform type. (Coming soon) |
 | Saves and prints a copy of the displayed data. See Printing Operation for additional information on page 20. | |
| Tool |  | Tapping this button opens a settings window with options to configure various measurement tools for reference and assessment of data analysis:● Tap Select a Math Channel option to select a match channel.● Tap Select a Probe option to select a predefined probe.● Tap Cache Setting to set the cache. |
| Save |  | Tapping this button opens a submenu, on which displays 5 options allowing you to save, record and plays back the waveform data.● Tap Save current page to take a screenshot image● Tap Record data to save the current waveform data.● Tap Save Ref to save a copy of an existing signal waveform as reference.● Tap Review data allows selecting and reviewing the previously stored waveform recordings.● Tap Recall Ref to retrieve the saved reference waveforms.All saved images are stored in the Data Manager application for later reviews. See Data Manager Operations on page 61. |
| Help |  | Provides instructions or tips for operations of various functions. |
| Scope Icon |  | Indicates the scope connection status. Tapping the icon allows to reset the USB connection when communication with the Scope Module fails. See Troubleshooting on page 128 for more information. |
Math Channel
A math channel is virtual channel generated by mathematical function of the input channel. It can be displayed in a scope or XY view in the same way as an input signal, and like an input signal it has its own measure axis, scaling and color. The MaxiScope module has a set of built-in math channels for the most important functions, including “A+B” (the sum of channels A and B) and “A-B” (the difference between channels A and B).
To use a math channel:
- Tap the Tool button in the Top Menu.
- Tap the Select a Math Channel option on the left column.
- Tap the desired option on the right column to enable the math channel in the channel list.
- The Math Channel displays on the MaxiScope screen
Probe
A probe is any transducer, measuring device or other accessory that you connect to an input channel of your MaxiScope module.
Reference Waveform
A Reference Waveform is a copy of an existing signal waveform saved as a reference. It can be retrieved to display as a comparative reference to examine a live signal. Up to 4 reference waveforms can be saved.
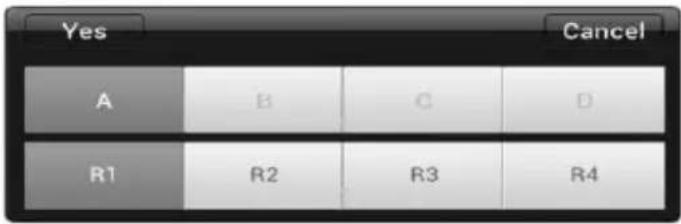
Figure 15-5 Ref. Waveform Save Window
To create a Reference Waveform:
- Tap the Save button in the Top Menu.
- Select Save Ref. in the dropdown menu.
- Select the channel to which the desired waveform belongs.
- Name the reference waveform by selecting R1, R2, R3 or R4 in the popup window.
- Tap on the Yes to save, or No icon to cancel.
Recall Reference
The saved reference waveforms can be retrieved by clicking Recall Ref in the dropdown menu of the Tool button.
To recall reference waveforms:
- Tap Tool button on the Top Menu.
- Select Recall Ref in the dropdown menu and a popup window will display. Available reference waveform items are highlighted in blue.
- Select the desired reference waveform by ticking the check box alongside.
- Tap Yes and the selected reference waveform will appear on the scope screen.
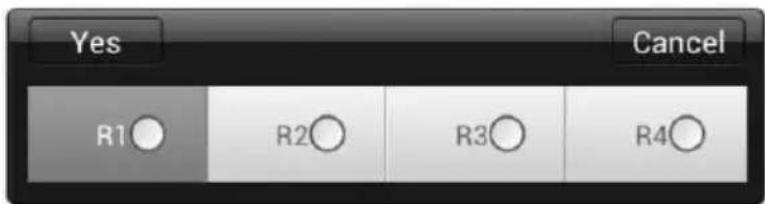
Figure 15-6 Recall Reference Waveform Window
Functional Buttons
This group of buttons is used for configurations of channel activation, measurement scale and trigger settings, the operations of which are described below:
- Channel Control Buttons A/B/C/D - tapping each button allows you to activate or deactivate the corresponding channel; long pressing the button opens a window, which allows you to select and configure appropriate probes for specific tests.
The Channel Control Buttons are displayed in different colors as follows:
- AC/DC Coupling and Voltage Scale Buttons – tapping this button opens a dropdown menu, on which you can select AC or DC measurements and adjust voltage measurement scales.
The Auto voltage scale option enables the scope to adjust the voltage scale automatically to capture the signal.
- AutoScale – tapping this button enables automatic set-up of the voltage scale and time base for the signals received.
- Start/Stop – tapping this button turns on/off the scope.
- Single – tapping this button activates the Single trigger mode when the trigger is on. The Single trigger mode configures the trigger to occur once when the scope captures the first signal waveform by the preset trigger point.
Measurement Grid
The 2 control features - Voltage per division and Time per division – enable you to adjust the scope settings to suit the particular test measurement.

line
| Time per division (X axis) | Voltage per division (Y axis) | | -------------------------- | ----------------------------- | | -25.00 | 0.00 | | -20.00 | 0.00 | | -15.00 | 0.00 | | -10.00 | 0.00 | | -5.00 | 0.00 | | 0.00 | 0.00 | | 5.00 | 0.00 | | 10.00 | 0.00 | | 15.00 | 0.00 | | 20.00 | 0.00 | | 25.00 | 0.00 |Figure 15-7 Sample Measurement Grid
- Voltage per division – shown down the left side of the screen, referred to as the Y-axis
- Time per division – shown along the bottom of the screen, referred to as the X-axis
Multiple Scope Channels
The MaxiScope software features multiple channel display which enables more than one waveform to be displayed at the same time. It is useful for making comparisons among different signals. The voltage per division for each channel is adjusted individually while the time base per division is the same for all channels.
To adjust the voltage scale
- Tap the specific Y-axis of the corresponding channel to enable scale adjustment. The selected Y-axis is highlighted with thicker dividing line.
- Adjust the voltage scale of the selected channel with the typical 2-finger zoom gestures.
- The 0 volts is hinted with a pointer reference line. Slide the pointer up and down to move and view different areas of the scale.
- Tap once on the screen area outside of the Y-axis to finish the voltage scale adjustment.
To adjust the time base scale
- Unselect the Y-axis if it's activated.
- Use your 2 fingers to adjust the time base with the typical zoom gestures on the measurement grid area.
Measurement Rulers
The Measurement Rulers allow the voltage and time duration of a waveform to be measured precisely. There are 2 kinds of measurement rulers: the vertical Time Ruler and the horizontal Voltage Ruler.
Tap on the Ruler Activator on the bottom right corner of the measurement grid and drag it across the screen to the desired position, a Time Ruler is generated.
The Voltage Ruler can be generated in the similar way by clicking the Ruler Activator on the top left corner and dragging it downwards.
When Measurement Rulers are generated, a Ruler Table showing time and voltage values for the corresponding channels will be displayed. The Delta icon refers to the absolute difference between the values of the 2 rulers, which can be locked by tapping the Lock icon.
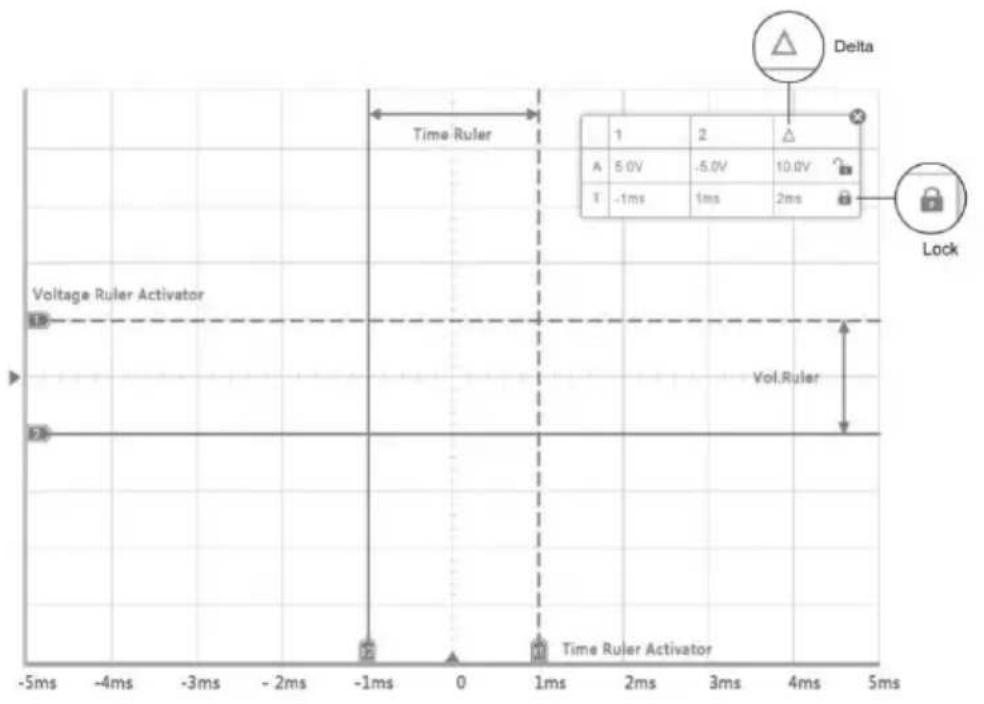
Figure 15-8 Measurement Rulers Display
Functional Buttons
This group of buttons includes trigger setting buttons allowing you to set trigger source and trigger mode, a Time base button for adjustment, and a Measurement button with options for various measurement types.
- Trigger On/Off – taps to turn on/off the trigger. The button displays as Trigger Off when it is activated, and vice versa.
Once the trigger is activated, a voltage scale reference line and a time base reference line will be displayed on the measurement grid, the cross point of the 2 lines indicates the trigger point, allowing you to adjust its position by moving each of the 2 lines.
- Trigger Source – assigns the trigger to a specific channel
- Trigger Slope – sets trigger to occur by rising or falling voltage edges
- Trigger Mode – configures the trigger mode:
a) Normal Mode – configures the trigger to occur every time when the captured signal waveform reaches the trigger point, so the scope starts to draw the waveform when the signal reaches the trigger point.
b) Auto Mode - configures the trigger to occur every time when the scope captures the signal waveforms by the preset trigger point. The scope continues to draw the waveforms even when the signal is not in the trigger point range.
- Main Time Base – allows you to select an appropriate time per division. The time per division (10 divisions) is displayed along the bottom of the screen. The time base adjustment affects all of the active scope channels at once.
● Measure - allows you to select various types of measurement parameters to be displayed at the right side of the screen for reference.
A maximum of 5 items each time are allowed to be selected.
To set a specific trigger point
- Tap the Trigger On button to activate the trigger.
-
Configures the specific trigger source, the trigger slope and the trigger mode according to the test demand.
-
Tap and slide the voltage scale reference line up or down to the desired voltage point. The voltage info is displayed in a small reference box.
- Tap and slide the time base reference line left or right to the desired point.
- Tap Start button on the top right side of the screen to activate the scope
Troubleshooting
If the MaxiScope is not communicating with the MaxiSys Display Tablet, you need to do the followings:
- Check if the MaxiScope is properly connected to the MaxiSys Display Tablet through the supplied USB cable.
- If the MaxiScope is already connected to the MaxiSys Display Tablet, but the communication between the devices has failed, tap the Scope Icon on the top right side of the screen to reset the USB connection.
IMPORTANT
All vehicle communications must be terminated before resetting the USB connection to avoid damage to the devices and the vehicle. The Internet connection may be aborted during USB reset.
- If the communication between the MaxiScope and the MaxiSys Display Tablet still fails after USB reset, restart the MaxiSys Display Tablet and reconnect the MaxiScope.
MaxiScope Firmware Update
The operating software of the MaxiScope is continuously being developed, and the update package can be downloaded free from the MaxiScope product webpage on Autel's website: http://www.autel.com.
To update the MaxiScope firmware
- Download the MaxiScope tool kit from our website www.autel.com > Support & Updates > UPDATE CLIENT to the computer. The installation wizard will load momentarily.
- Click on Next on the welcome page.
-
Click the Browse button, and select a destination folder to install the program, and click Next to continue. Or directly click Next to continue without changing the default installation folder.
-
Click Install and the Setup.exe program will be installed onto the computer.
- After the installation is completed, connect the MaxiScope to the computer using the USB cable provided by the tool kit.
- Locate and double click the MaxiScope Update icon on desktop.
- Click on Help > Check Update on the upper toolbar, an update selection pop-up window displays.
- You could select Online or Local to update. For Online update, it will automatically scan whether the current version is the latest one, then proceed to update or not. For Local update, you can download the firmware file on our website www.autel.com, then proceed.
16 Digital Inspection Operations
The Digital Inspection application configures the MaxiSys Diagnostic Device to operate as a digital video scope by simply connecting the tablet to a Digital Inspection Camera. This function allows you to examine difficult-to-reach areas normally hidden from sight, with the ability to record digital still images and videos, which offers you an economical solution to inspect machinery, facilities, and infrastructure in a safe and quick way.

WARNINGS & IMPORTANTS:
Follow these instructions to reduce the risk of injury from electric shock, entanglement and other causes and prevent tool damage.
- Do not place the imager head and cable into anything or anywhere that may contain a live electric charge or moving parts, which increases the risk of electric shock or entanglement injuries.
- Do not use the imager head cable to modify surroundings, clear pathways or clogged areas.
- When inspection is completed, carefully withdraw the imager head cable from the inspection area.
- The imager head cable were waterproof to a depth of 3m (10'), greater depths may cause leakage into the imager head cable and cause electric shock or damage the tool.
- The working temperature of the imager head is between 32^ (0 ° C) and 113^ (45 ° C).
Check-Ups:
FOR AUTOMOBILES: Ensure the automobile is not running during inspection. Metal and liquid under the hood may be hot. Don't get oil or gas on the imager head.
● FOR PIPES: If you suspect a metal pipe could contain an electric charge, have a qualified electrician to check the pipe before using.
● FOR WALLS: For inspecting the inside walls, be sure to shut off the circuit breaker to the whole house before using the tool.
● WORK AREA: Ensure the work area has sufficient light.
Additional Accessories
The Digital Inspection Camera and its fittings are the additional accessories. Both sizes (8.5 mm and 5.5 mm) of the imager head are optional and available for purchase along with the standard MaxiSys tool kit.
Digital Inspection Camera

Figure 16-1 Digital Inspection Camera
-
Removable Imager Head Cable – connects to the tool when performing digital inspections for image and video viewing
-
Handgrip – ergonomically designed handle for comfortable grips and agile operation
-
USB Cable – connects the Digital Inspection Camera to MaxiSys tablet
Imager Head Accessories

Figure 16-2 8.5mm Imager Head Accessories
- Magnet – picks up small metal objects, such as dropped rings or screws
- Hook – unclogs obstacles and picks up wires in the pipes or confined areas
- Mirror – helps to look around corners and see the unreachable areas

Figure 16-3 5.5mm Imager Head Accessories
- Mirror – helps to look around corners and see the unreachable areas
- Magnet - picks up small metal objects, such as dropped rings or screws
Accessory Assembly
For 8.5mm Imager Head
The three accessories, including the Magnet, Hook, and Mirror (Figure 16-2), can be attached to the Imager Head with the same manner described below:
- Hold the accessory and the imager head.

natural_image
Diagram of a cylindrical device with a separate internal component and an arrow indicating rotation (no text or symbols)- Slip the end of the accessory over the imager head and then fix the accessory.
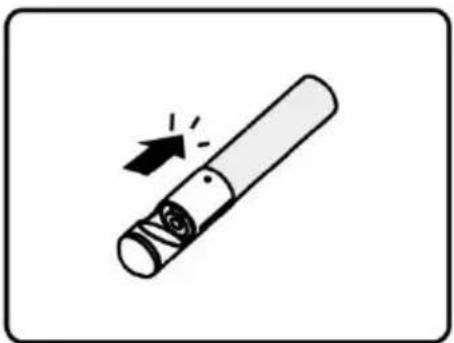
natural_image
Simple line drawing of a cylindrical object with a pointed tip and arrow indicating direction (no text or symbols)For 5.5mm Imager Head
The two accessories, including the Magnet and Mirror (Figure 16-3), can be attached to the Imager Head with the same manner described below:
- Hold the accessory and the imager head.
natural_image
Diagram of a cylindrical mechanical component with a rotating arrow indicating rotation (no text or symbols)- Screw the thread part of the accessory over the imager head to fix the accessory.

natural_image
Simple line drawing of a cylindrical object with a pointer and spark, no text or symbols present.Technical Specifications
Table 16-1 Specifications
| Item | Description |
| Optimal Viewing Distance | 1" to 14" (2.54cm to 35.56cm) with 8.5mm diameter imager head3/8" to 12" (0.95cm to 30cm) with 5.5mm diameter imager head |
| Image Capture | JPG images (640x480) AVI videos (320 x 240) |
| Operating Temperature | Main Unit: 0°C to 55°C (ambient)Cable: -10°C to 70°C |
| Storage Temperature | -20°C to 75°C (ambient) |
| Waterproof | Imager head and cable to 1m |
| Weigh | 0.3kg with 8.5mm diameter imager head0.2kg with 5.5mm diameter imager head |
Operations
Before performing the Digital Inspection application, the Imager Head Cable must be connected to the MaxiSys Display Tablet through the USB port. Install the correct imager head accessories for use in the appropriate application.

NOTE
When in operation, the imager head cable can be bent into a certain shape. This may help you operate the cable into confined areas.
To take pictures using the Digital Inspection application
- Connect the Imager Head Cable to the USB port on the top side of the MaxiSys Display Tablet.
- If not already done, power up the MaxiSys Display Tablet.
- Tap the Digital Inspection application on the MaxiSys Job Menu. The Digital Inspection application interface displays, showing a camera operating screen. The default camera is now the Imager head.
- Select the camera icon at the lower right corner to take photos.
- Focus the image to be captured in the view finder by adjusting and properly locating the imager head cable.
- Tap the blue ring on the operating screen. The view finder now shows the captured picture and auto-saves the taken photo.
- Tap the thumbnail image on the top right corner of the screen to view the stored image, slide the screen left and right to view the images one by one.
- Tap on the selected image and the edit toolbar instantly displays.
- Tap the appropriate button to Share, Delete, or Edit the image.
- Tap the Back or Home button on the Navigation bar at the bottom of the screen to exit the Digital Inspection application.
To record a video using the Digital Inspection application
- Connect the Imager Head Cable to the USB port on the top side of the MaxiSys Display Tablet.
- If not already done, power up the MaxiSys Display Tablet.
- Tap the Digital Inspection application on the MaxiSys Job Menu. The Digital Inspection application interface displays, showing a camera operating screen. The default camera is now the Imager head.
- Select the Video icon at the lower right corner to record a video.
-
Properly locate the imager head cable to focus the inspection scene for recording.
-
Tap the red ring on the operating screen to start recording.
- Tap the red circle again to stop recording. The recorded video is automatically saved to the system Gallery.
- Tap the thumbnail image on the top right corner to review the recorded video.
-
Tap the Play button to play the video.
-
Tap on the selected video and the edit toolbar instantly displays.
-
Tap the appropriate button to Share, Delete, or Edit the video.
-
Tap the Back or Home button on the Navigation bar at the bottom of the screen to exit the Digital Inspection application.
To configure various settings for the work mode of the imager head
- Tap button at the bottom edge of the circle.
- Select each item to make appropriate adjustments.
For more tips and detailed information about the camera application, please refer to associated Android documentations.
17
Maintenance and Service
To ensure that the MaxiSys diagnostic tablet and the combined VCI unit perform at their optimum level, we advise that the product maintenance instructions covered in this section is read and followed.
Maintenance Instructions
The following shows how to maintain your devices, together with precautions to take.
- Use a soft cloth and alcohol or a mild window cleaner to clean the touch screen of the tablet.
- Do not use any abrasive cleansers, detergent, or automotive chemicals to the tablet.
- Maintain the devices in dry conditions and keep them within normal operating temperatures.
- Dry your hands before using the tablet. The touch screen of the tablet may not work if the touch screen is moist, or if you tap the touch screen with wet hands.
- Do not store the devices in humid, dusty or dirty areas.
- Check the housing, wiring, and connectors for dirt and damage before and after each use.
- At the end of each work day, wipe the device housing, wiring, and connectors clean with a damp cloth.
- Do not attempt to disassemble your tablet or the VCI unit.
- Do not drop or cause severe impact to the devices.
-
Use only authorized battery chargers and accessories. Any malfunction or damage caused by the use of unauthorized battery charger and accessories will void the limited product warranty.
-
Ensure that the battery charger does not come in contact with conductive objects.
- Do not use the tablet beside microwave ovens, cordless phones and some medical or scientific instruments to prevent signal interference.
Troubleshooting Checklist
When the Display Tablet does not work properly:
● Make sure the tablet has been registered online.
● Make sure the system software and diagnostic application software are properly updated.
● Make sure the tablet is connected to the Internet.
- Check all cables, connections, and indicators to see if the signal is being received.
When battery life is shorter than usual:
- This may happen when you are in an area with low signal strength. Turn off your device if is not in use.
When you cannot turn on the tablet:
- Make sure the tablet is connected to a power source or the battery is charged.
When you are unable to charge the tablet:
- Your charger may be out of order. Contact your nearest dealer.
- You may be attempting to use the device in an overly hot/cold temperature. Try changing the charging environment.
- Your device may have not been connected to the charger properly. Check the connector.

NOTE
If your problems persist, please contact Autel's technical support personnel or your local selling agent.
Your tablet is powered by a built-in Lithium-ion Polymer battery. This means that, unlike other forms of battery technology, you can recharge your battery while some charge remains without reducing your tablet's autonomy due to the "battery memory effect" inherent in those technologies.

DANGER
The built-in Lithium-ion Polymer battery is factory replaceable only; incorrect replacement or tampering with the battery pack may cause an explosion.
- Do not use a damaged battery charger.
- Do not disassemble or open crush, bend or deform, puncture or shred.
- Do not modify or remanufacture, attempt to insert foreign objects into the battery, expose to fire, explosion or other hazard.
● Make sure to use the charger and USB cables only that come together in the package. If you use the other charger and USB cables, you might incur malfunction or failure of the device. - Only use the charging device that has been qualified with device per the standard. Use of an unqualified battery or charger may present a risk of fire, explosion, leakage, or other hazard.
- Avoid dropping the tablet. If the tablet is dropped, especially on a hard surface, and the user suspects damage, take it to a service center for inspection.
- The closer you are to your network's base station, the longer your tablet usage time because less battery power is consumed for the connection.
- The battery recharging time varies depending on the remaining battery capacity.
● Battery life inevitably shortens over time. - Since over charging may shorten battery life, remove the tablet from its charger once it is fully charged. Unplug the charger, once charging is complete.
● Leaving the tablet in hot or cold places, especially inside a car in summer or winter, may reduce the capacity and life of the battery. Always keep the battery within normal temperatures.
This section introduces information for technical support, repair service, and application for replacement or optional parts.
Technical Support
If you have any question or problem on the operation of the product, please:
- Call 1-855-288-3587/1-855-AUTELUS (North America), Or 0086-755-86147779 (China).
- Contact the local distributor or agent.
- Visit our website http://pro.autel.com or www.autel.com.
Repair Service
If it becomes necessary to return your device for repair, please download the repair service form from www.autel.com, and fill in the form. The following information must be included:
- Contact name
- Return address
- Telephone number
- Product name
- Complete description of the problem
● Proof-of-purchase for warranty repairs - Preferred method of payment for non-warranty repairs

NOTE
For non-warranty repairs, payment can be made with Visa, Master Card, or with approved credit terms.
Send the device to your local agent, or to the below address:
6th-10th Floor, Building B1, Zhiyuan,
Xueyuan Road, Xili, Nanshan,
Shenzhen, 518055, China
Other Services
You can purchase the optional accessories directly from Autel's authorized tool suppliers, and/or your local distributor or agent.
Your purchase order should include the following information:
- Contact information
● Product or part name - Item description
● Purchase quantity
18 Compliance Information
FCC Compliance
FCC ID: WQ8MAXISYSMY908
This equipment has been tested and found to comply with the limits for a Class B digital device, pursuant to Part 15 of the FCC Rules. These limits are designed to provide reasonable protection against harmful interference in a residential installation. This equipment generates uses and can radiate radio frequency energy and, if not installed and used in accordance with the instructions, may cause harmful interference to radio communications. However, there is no guarantee that interference will not occur in a particular installation. If this equipment does cause harmful interference to radio or television reception, which can be determined by turning the equipment off and on, the user is encouraged to try to correct the interference by one or more of the following measures:
● Reorient or relocate the receiving antenna.
- Increase the separation between the equipment and receiver.
- Consult the dealer or an experienced radio/TV technician for help.
This device complies with part 15 of the FCC Rules. Operation is subject to the following two conditions:
(1) This device may not cause harmful interference, and (2) this device must accept any interference received, including interference that may cause undesired operation.
Changes or modifications not expressly approved by the party responsible for compliance could void the user's authority to operate the equipment.
SAR:
The radiated output power of this device is below the FCC radio frequency exposure limits. Nevertheless, the device should be used in such a manner that the potential for human contact is minimized during normal operation.
The exposure standard for wireless devices employs a unit of measurement known as the Specific Absorption Rate, or SAR. The SAR limit set by the FCC
is 1.6 W/Kg. Tests for SAR are conducted using standard operating positions accepted by the FCC with the device transmitting at its highest certified power level in all tested frequency bands. Although the SAR is determined at the highest certified power level, the actual SAR level of the device while operating can be well below the maximum value. This is because the device is designed to operate at multiple power levels so as to use only the power required to reach the network. To avoid the possibility of exceeding the FCC radio frequency exposure limits, human proximity to antenna should be minimized.
19 Warranty
12-Month Limited Warranty
Autel Intelligent Technology Corp., Ltd. (the Company) warrants to the original retail purchaser of this MaxiSys Diagnostic Device, that should this product or any part thereof during normal consumer usage and conditions, be proven defective in material or workmanship that results in product failure within twelve (12) months period from the date of delivery, such defect(s) will be repaired, or replaced (with new or rebuilt parts) with Proof of Purchase, at the Company's option, without charge for parts or labor directly related to the defect(s).
The Company shall not be liable for any incidental or consequential damages arising from the use, misuse, or mounting of the device. Some states do not allow limitation on how long an implied warranty lasts, so the above limitations may not apply to you.
This warranty does not apply to:
- Products subjected to abnormal use or conditions, accident, mishandling, neglect, unauthorized alteration, misuse, improper installation or repair or improper storage;
- Products whose mechanical serial number or electronic serial number has been removed, altered or defaced;
- Damage from exposure to excessive temperatures or extreme environmental conditions;
- Damage resulting from connection to, or use of any accessory or other product not approved or authorized by the Company;
- Defects in appearance, cosmetic, decorative or structural items such as framing and non-operative parts.
- Products damaged from external causes such as fire, dirt, sand, battery leakage, blown fuse, theft or improper usage of any electrical source.
IMPORTANT
All contents of the product may be deleted during the process of repair. You should create a back-up copy of any contents of your product before delivering the product for warranty service.
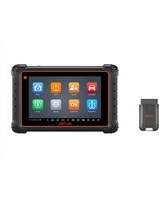
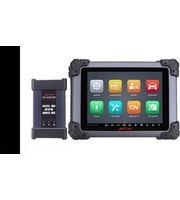

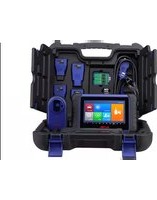
- Copyright Information
- Disclaimer of Warranties and Limitation of Liabilities
- For Services and Support:
- Safety Information
- Safety Messages
- DANGER
- WARNING
- Safety Instructions
- Do Not Turn the Volume Up Too Loud When Using Headphones
- SAFETY WARNINGS:
- CONTENTS
- Using This Manual .... 1
- CONVENTIONS....1
- General Introduction....3
- MAXISYS DISPLAY TABLET 4
- VCI-J2534 ECU PROGRAMMING DEVICE....8
- ACCESSORIES KIT 11
- Getting Started....15
- POWERING UP 15
- OPERATIONS....76
- Shop Manager Operations 81
- VEHICLE HISTORY....82
- WORKSHOP INFORMATION 85
- CUSTOMER MANAGER....86
- Update Operations 90
- VCI Manager Operations 93
- BT PAIRING 94
- UPDATE 95
- Remote Desk Operations....96
- OPERATIONS....96
- Support Operations....98
- PRODUCT REGISTRATION 98
- SUPPORT SCREEN LAYOUT....99
- MY ACCOUNT....100
- USER COMPLAINT....100
- DATA LOGGING....103
- COMMUNITIES 104
- Using This Manual
- Conventions
- Bold Text
- Terminology
- Notes and Important Messages
- Notes
- Important
- Hyperlinks
- Procedures
- To use the camera:
- General Introduction
- Functional Description
- Power Sources
- Internal Battery Pack
- AC/DC Power Supply
- Vehicle Power
- Technical Specifications
- VCI – J2534 ECU Programming Device
- Vehicle LED
- Connection LED
- Power LED
- USB Port
- J2534 Reprogramming Capability
- Communication
- NOTE
- Accessories Kit
- Main Cable
- Non OBD II Adapters
- Other Accessories
- MaxiFlash Elite
- Standard USB Cable
- Mini USB Cable
- AC/DC External Power Adapter (12V)
- Cigarette Lighter
- Clipper Cable
- Light Fuse
- Getting Started
- Powering Up
- Application Buttons
- Locator and Navigation Buttons
- System Status Icons
- Powering Down
- Reboot System
- Installing Computer Software
- Printing Operation
- CV Diagnostics Operations
- Establishing Vehicle Communication
- Vehicle Connection
- OBD II Vehicle Connection
- To connect to an OBD II vehicle
- Non-OBD II Vehicle Connection
- To connect to a Non-OBD II Vehicle
- To connect the cigarette lighter
- To connect the clipper cable
- VCI Connection
- Pairing Up via BT
- To pair up the MaxiSys Display Tablet with the VCI device via BT
- USB Cable Connection
- No Communication Message
- Getting Started
- Vehicle Menu Layout
- Top toolbar Buttons
- Manufacturer Buttons
- Vehicle Identification
- Auto VIN Detect
- To perform Auto VIN Scan
- Manual VIN Input
- To perform Manual VIN Input
- Manual Vehicle Selection
- Step-by-step Vehicle Selection
- Alternative Vehicle Identification
- Navigation
- Diagnostics Screen Layout
- Diagnostics Toolbar
- To print data in Diagnostics
- To submit Data Logging reports in Diagnostics
- Status Information Bar
- Main Section
- Functional Buttons
- Screen Messages
- Confirmation Messages
- Warning Messages
- Error Messages
- Making Selections
- Main Menu
- Diagnosis
- Auto Scan
- - Navigation Bar
- - Main Section
- List Tab
- - Functional Buttons
- Control Unit
- To perform a diagnostic function
- ECU Information
- Trouble Codes
- Read Codes
- Erase Codes
- To erase codes
- Live Data
- Main Section
- Display Mode
- To edit the waveform color and line thickness in a data graph
- Functional Buttons
- To set threshold limits for the parameter values
- To perform setting for live data record
- Active Test
- Special Functions
- Hot Function
- Oil Reset
- Electric Parking Brake (EPB)
- Brake Bleeding
- DPF & SCR
- Immo & Keys
- Injector
- Throttle
- Expert
- Generic OBD II Operations
- General Procedure
- Function Descriptions
- DTC & FFD
- - Pending Codes
- - Freeze Frame
- - Clear DTC
- I/M Readiness
- O2 Sensor Monitor
- On-Board Monitor
- Component Test
- Vehicle Information
- Vehicle Status
- Exiting CV Diagnostics
- To exit the CV Diagnostics application
- Data Manager Operations
- Operations
- Image Files
- To edit image information
- To delete selected images
- PDF Files
- Review Data
- Apps Uninstall
- Data Logging
- 6
- MaxiFix Operations
- Figure 6-1 Sample MaxiFix Home Page
- The Header
- Select Vehicle Button
- To select a vehicle
- MaxiFix Tip
- To search for a MaxiFix Tip
- Proven Results!
- Adopted!
- Home
- Search Fix Features
- Ask
- To ask a MaxiFix Question
- My MaxiFix
- Create a Tip
- To create a new MaxiFix Tip
- View Profile Information
- My Messages
- Select "Adopted Answers"
- About Adopted Answer:
- Close a Question
- Score Rewarding System
- Support
- Settings Operations
- Unit
- To adjust the unit setting
- Language
- To adjust the language setting
- Printing Setting
- To setup the printer connection
- Wired Network
- To operate Ethernet configuration
- Notification Center
- To enable the Notification Center function
- Multitask
- To enable the Multitask function
- About
- To check the MaxiSys product information in About
- System Settings
- 8
- Shop Manager Operations
- Vehicle History
- Historical Test Record
- To edit the Historical Test record sheet
- Workshop Information
- To edit the Workshop Information sheet
- To create a customer account
- To edit a customer account
- To delete a customer account
- History Notes
- To access History Notes
- To add a note in History Notes
- 9
- Update Operations
- Navigation and Controls
- Status Bar
- Main Section
- To update the firmware
- VCI Manager Operations
- BT Pairing
- To pair the VCI device with the Display Tablet
- Update
- To update the VCI device software
- Remote Desk Operations
- To receive remote support from a partner
- Support Operations
- Product Registration
- To register the diagnostic device
- Support Screen Layout
- Personal Info
- Update Info
- Service Info
- User Complaint
- Screen Layout
- Option Bar
- Complaint List
- To establish a new complaint session
- To make a reply in a complaint session
- To make a reply in a Data Logging session
- Communities
- To start a discussion
- To join and reply to a discussion post
- User Profile
- Training Channels
- FAQ Database
- Training Operations
- To play a video
- Quick Link Operations
- To open a quick link
- MaxiScope Operations
- Maximum Input Ranges
- Grounding
- External Connections
- Environment
- Product Maintenance
- Glossary
- AC/DC Control
- Aliasing
- Analog Bandwidth
- Block Mode
- Buffer Size/Cache Size
- Sampling Rate
- Streaming Mode
- Time Base
- Voltage Range
- Sinusoidal Waveform
- Amplitude
- Frequency
- Square Waveform
- Peak to Peak Voltage
- MaxiScope Module
- Power Source
- Screen Layout and Operations
- Top Toolbar
- Math Channel
- To use a math channel:
- Probe
- Reference Waveform
- To create a Reference Waveform:
- Recall Reference
- To recall reference waveforms:
- Measurement Grid
- Multiple Scope Channels
- To adjust the voltage scale
- To adjust the time base scale
- Measurement Rulers
- To set a specific trigger point
- Troubleshooting
- MaxiScope Firmware Update
- To update the MaxiScope firmware
- Digital Inspection Operations
- WARNINGS & IMPORTANTS:
- Check-Ups:
- Additional Accessories
- Digital Inspection Camera
- Imager Head Accessories
- Accessory Assembly
- For 8.5mm Imager Head
- For 5.5mm Imager Head
- To take pictures using the Digital Inspection application
- To record a video using the Digital Inspection application
- To configure various settings for the work mode of the imager head
- 17
- Maintenance and Service
- Maintenance Instructions
- Troubleshooting Checklist
- When the Display Tablet does not work properly:
- When battery life is shorter than usual:
- When you cannot turn on the tablet:
- When you are unable to charge the tablet:
- Technical Support
- Repair Service
- Send the device to your local agent, or to the below address:
- Other Services
- Compliance Information
- FCC Compliance
- FCC ID: WQ8MAXISYSMY908
- SAR:
- Warranty
- 12-Month Limited Warranty
- This warranty does not apply to:
Brand : Autel
Model : MaxiSYS MS908CV
Category : Car diagnostic tool