thEQorange - Audio software MAAT - Free user manual and instructions
Find the device manual for free thEQorange MAAT in PDF.

| Product Type | Audio Software (Equalizer Plugin) |
| Brand | MAAT |
| Model | thEQorange |
| Platform Compatibility | VST2, VST3, AU, AAX (64-bit) |
| Operating Systems | Windows 7+, macOS 10.10+ |
| Supported Sample Rates | Up to 192 kHz |
| Maximum Number of Bands | 20 bands (parametric + dynamic) |
| Filter Types | Bell, Shelf, High/Low Pass, Notch, Band Pass |
| Dynamic EQ Modes | Compressor, Expander, Gate modes per band |
| Processing Precision | 64-bit double precision internal processing |
| Preset Management | Built-in preset manager with import/export |
| Real-time Spectrum Analyzer | Built-in with adjustable resolution and range |
| Latency | Zero-latency processing mode available |
| License Type | Perpetual license with iLok or machine authorization |
| Minimum CPU | Intel Core i5 or equivalent |
| Minimum RAM | 4 GB |
| Disk Space | 200 MB free |
| Installation | Download with installer; requires internet for activation |
| User Manual | PDF included with product purchase |
| Support | Manufacturer website and email support |
Frequently Asked Questions - thEQorange MAAT
User questions about thEQorange MAAT
0 question about this device. Answer the ones you know or ask your own.
Ask a new question about this device
Download the instructions for your Audio software in PDF format for free! Find your manual thEQorange - MAAT and take your electronic device back in hand. On this page are published all the documents necessary for the use of your device. thEQorange by MAAT.
USER MANUAL thEQorange MAAT
More unique and essential tools and tips at:
www.maat.digital
Table of Contents
Installation & Setup 7
Licensing....7
Online Activation....8
Offline Activation 8
Introduction.... 10
thEQo Features 10
Unique Features 10
Main Features.... 10
Applications 11
The Interface....12
Overview 12
Linear-Phase 12
Invisible 13
What's So Special 13
Echo 14
Low Frequency Response 15
In Use 15
Filter Types 15
Edge Behavior 16
Baseband Oversampling 16
HRA 16
Latency 17
LF Response....17
The Controls 17
Left Control Cluster....17
Keyboard....17
SORT 18
OVERSAMPLE 18
f MODE....18
440 Hz (UI Detuning)....18
SONO PRE 18
The Sections 19
In Circuit/Bypass 19
Gain Field....19
Type 19
Q/Slope 19
Panorama Mode 20
Right Control Cluster 20
TPL Meter....20
Contribution Controls....21
AUTOGAIN 21
GAIN OUT 22
The Graph 22
Nodes 22
Textual vs Manual Frequency Settings 23
Response Curves....23
The Spectrogram....24
Analyzer Input 24
Shared Controls 24
Far Right Controls 25
Bar Graph Icon 25
Vertical Zoom 26
Color Mapping....26
Meter 26
Color-to-Gray Scale Transition....26
User Preferences 26
Preferences.... 26
General Tab 26
Spectrogram Tab....27
Colors Tab 28
Hot Keys Tab 28
License/Info Tab 29
Bypass 29
Undo/Redo 29
A/B 29
Presets 30
Specifications....30
Latency 30
Resonant Frequency 30
System Requirements 31
Supported Platforms.... 31
Supported Sample Rates.... 31
Supported Hosts 31
Updates 31
Credits.... 31
Support 32
Share The Love....32
About This Manual 33t
Installation & Setup
When preparing for installation of your MAAT thEQorange, we recommend that you quit all applications prior to proceeding. Also, after downloading the installer and prior to installation, let any anti-malware measures you may have running scan the installer. Then, temporarily disable all anti-malware measures once scanning is complete.
To install, simply double click on the downloaded Installer for your particular operating system. The installation process will guide you through the install procedure. If you have an older OS version, restarting your host may be required. Don't forget to reenable anti-malware measures or simply restart your host.
Licensing
MAAT software is licensed through our dongle-free, cloud-based license control framework. If your hosts are net-connected, our licenses "float," making it easy to move from one machine to another. All you have to do is close all MAAT stuff on one machine before you open anything on another. If you're going to use the laptop in an environment where internet is spotty or non-existent, you can also go offline temporarily for up to 30 days.
To license your MAAT purchase, open yours or instantiate an example in your preferred plug-in host. When licensing, we recommend you open a new session in your DAW just for this purpose.
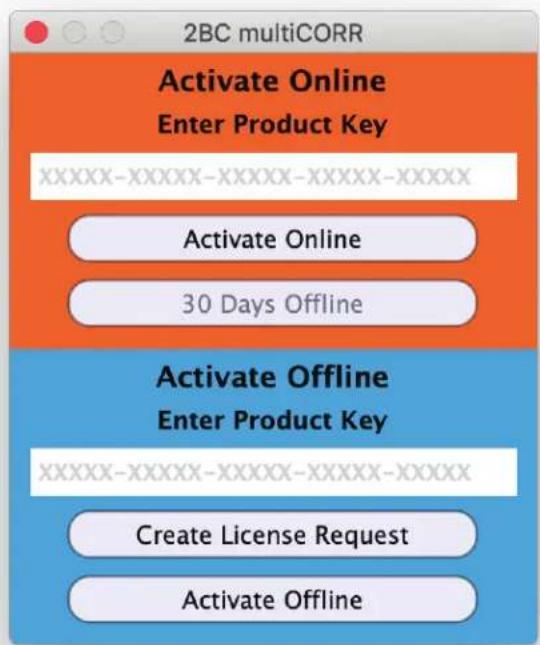
text_image
2BC multiCORR Activate Online Enter Product Key XXXXXXXX-XXXXXXXX-XXXXXXXX-XXXXX-XXXXX Activate Online 30 Days Offline Activate Offline Enter Product Key XXXXXXXX-XXXXXXXX-XXXXXXXX-XXXXX-XXXXX Create License Request Activate OfflineFigure 1: The initial Activation dialog
Online Activation
Once the Activation dialog appears, paste or type in your Product Key supplied at the time of purchase. Then click on Activate/Deactivate Online and follow the prompts.

NOTE: THE ONLINE PROCESS REQUIRES A LIVE INTERNET CONNECTION. YOU MUST HAVE AN ACTIVE INTERNET CONNECTION FOR ACTIVATION.
A feature of our cloud-connected system is that, if you close a DAW session that contains MAAT plug instances, then open that session on another host, the license will “follow” you onto the new host as long as you have live internet.
You can also return or park your license on our licensing server, and pick it up later on another host. Once your product is licensed, click the Activate/Deactivate Online button to deactivate your license, then repeat to reactivate.
Offline Activation
If, for security reasons you have an offline host computer or you plan on working without a reliable internet connection, it is best to go with an offline license. There are two offline options, temporary offline and full offline.
Temporary Offline
If you plan on working without a reliable internet connection, we designed the temporary offline option just for you. The temporary offline process also requires a live internet connection, but only during activation.
A temp offline license has two unique features:
- It can remain offline, without an internet connection, for up to 30 days
- It auto-renews its lease whenever it does make a server connection
So, if your internet is spotty or unreliable, or you're heading temporarily to a location where an internet connection isn't available, the temporary offline option let's you work untethered to the 'net for up to a month.
By clicking the "30 Days Offline" button, your online license will become temporarily offline for a maximum of 30 days. If, however, you use the product while connected to the internet at all during that time, the "lease" duration is automatically reset, extending another 30 days.

text_image
2BC multiCORR Activate Online Enter Product Key KYK20 - E-408 - LAG - WNT - WNT Deactivate Online 30 Days Offline Activate Offline Enter Product Key XXXXXXXX-XXXXXXXX-XXXXXXXX-XXXXX Create License Request Deactivate OfflineFigure 2: The 30 Days Offline activation option
Full Offline
This will license your MAAT product without the need to periodically contact our licensing server. If you anticipate working without the internet for more than a month at a time or, for security purposes, your studio machine is “air gapped” and has no internet, take a moment to surrender your online license, and replace it with an offline version.
Note: A full offline license does need to be explicitly renewed once a year.
To prepare for offline activation, you will need:
- Your Product Key!
- Some method to move your License Confirmation file to the offline host machine.
That latter requirement can be accomplished in any number of ways, but a USB flash drive is often readily available and most convenient. You will also need your Product Key that was supplied to you via e-mail when you purchased your MAAT product.
The offline activation process starts with generating a License Request, with a “maatr” file extension, which is submitted on-line to our server or via e-mail to MAAT Support <support@maatinc.
zohodesk.com>. A License Confirmation file, with a “maatc” extension, will be returned to you, which will activate your productt.
To proceed, click on the Activate/Deactivate Offline button, and follow the prompts.
In a year's time, 365 days from the date the maatr file is created, a full offline license must be renewed using the same maatr/maatc method.
Introduction
It's been a long journey to bring this incarnation of Algorithmix's Linear Phase PEQ Orange to life. We've done a lot of development in order to create an intuitive, useful and ultra-pure EQ tool. thEQorange fills a gap in the landscape of modern audio equalization, exceeding all current hardware and software solutions with practical visualization and superior fidelity.
Each member of our thEQ family fulfills a distinct purpose. thEQ-orange is best for analytical work, such as cleaning up unfortunate mix decisions, removing subsonics, and suppressing noise and clutter at frequency extremes. thEQred, though also linear phase, is for aesthetic applications, where you desire to improve material with spectral sculpting. If you need a low cut, reach for thEQorange. If you'd like to alter timbre or voicing, then reach for thEQred.
Moving away from linear phase operation is thEQblue. Think of blue as red with attitude. Each of thEQblue's twelve different flavors lend an individual vibe while still maintaining the cleanliness of all thEQ products. If you think a traditional EQ will do the trick, then thEQblue should be the first place you go.
thEQo Features
Unique Features
- Highly suppressed pre or post–echo; does not disperse signal over time, no transient smear
- Unique construction results in no unwanted sonic coloration or artifacts; more clarity, transparency, and definition
- 4 Contribution modes: positive-only, negative-only, total contribution (EQ solo) and traditional (EQ+direct)
Main Features
- Equal delay at all frequencies regardless of filter settings; perfectly preserves the time relationship of harmonics in original signal
- Operates at up to 384 kHz sampling rate; suitable for high resolution DSD or DXD post-production
-
Extended center (resonant) frequency up to 80 kHz; for processing in ultrasonic and near ultrasonic range for all HRA production and post
-
12 Sections with five freely assignable parametric filter types; bell, low shelf, high shelf, low cut, and high cut
Sections have solo and flip modes to quickly identify and handle problem frequencies - 5 Panorama modes: stereo, mono (L+R), difference (L-R), left-only and right-only
- Optional pre/post sonogram with zoom, adjustable amplitude mapping and adjustable temporal transition to gray scale
- Proprietary algorithms result in extremely low noise and vanishingly small nonlinear distortion
- Adjustable Q for shelving and cut filters make musical adjustments easy
- Additional low and high cut filter can be overlapped to achieve “brick-wall” slopes
- Special oversampling for analog–like filter characteristics when working with baseband sample rates (44.1 & 48 kHz)
- Double the stopband attenuation (ripple) compared to common filter implementations
- In-built keyboard with tone generator makes for quick location of trouble spots
- SORT function eliminates need for busy and fatiguing UI elements
- TUNE function aligns center frequencies to Western tuning and popular hardware emulation
• AutoGain for effortless A/B comparisons - All internal calculations are 80 bit floating point
- A re-sizable frequency response display for easy high precision adjustments
- A choice of parametric editing via numerical fields or directly on the graphical display
- Complete preset exchange among several simultaneously opened plug-ins
• Automatic latency compensation with all modern DAWs
Applications
- Mastering and re-mastering tasks on complex and high fidelity mixes
- Equalizing of instrumental group sub-mixes
- Clarifying and rescuing dense mixes
- Removing unwanted ultrasonic content from HRA recordings
The Interface
thEQorange's user interface (UI) may lack the eye candy associated with some products. For a pro user, in a dimly lit room who's face is pointing toward a display all day, the UI is designed to convey maximum information with minimum visual fatigue.
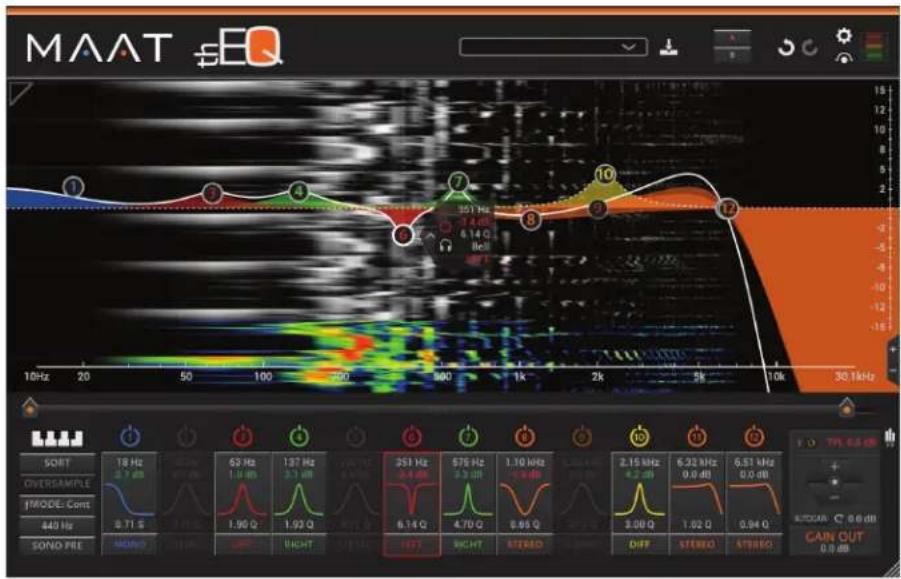
text_image
MAAT &EQ 10Hz 20 50 100 200 300 1k 2k 5k 10k 30.1kHz SOBT OVERSAMPLE MODE-Cont 440 Hz SONO PRE 18 Hz 2.7 dB 69 Hz 1.9 dB 137 Hz 2.1 dB 251 Hz 3.4 dB 575 Hz 3.3 dB 1.10 MHz -1.9 dB 2.15 kHz 4.2 dB 6.22 MHz 0.0 dB 6.51 MHz 0.0 dB DIFF STREEO STREEO STOCK: C 0.6 dB CAIN OUT 0.0 dBFigure 2: thEQorange's user interface
Overview
Linear-Phase
Every classic IIR-based (Infinite Impulse Response) parametric equalizer uses filters that apply phase shift. The original signal is added to its time-shifted version to get a certain amount of amplitude cancellation or reinforcement at the desired frequency. This procedure can be implemented in the analog domain with capacitors, resistors, inductors, and optional gain structures such as transistors or “valves.” In the digital domain, similar filter characteristic can be simulated by widely available “minimal phase,” IIR filter topologies.
Phase-shifting filters attenuate or amplify a desired frequency, but simultaneously affect the phase of all other frequencies. It causes the time relationship between harmonics to be destroyed which results in slurred and smudgy impulse response. The narrower the filter or higher the slope, the stronger the phase shift. A very narrow notch used for removing an unwanted tone from the mix does its job, but also changes, sometimes quite dramatically, the sound character of the whole mix. That's because the substantial phase shift affects all other regions of the original signal along with the target.
How to change the amplitude of certain signal components without destroying the whole harmonics relationship of a complex signal? The answer is linear phase (LP) filtering. The technology inside any LP filter, including thEQorange, is unique because of the need for complicated
proprietary algorithms. Only a very few of the known practical implementations have been accepted over time by professional mastering engineers. In addition, most of the existing digital implementations use linear frequency scaling that is quite unfamiliar to most audio engineers. Other manufacturers tout that a filter's frequency characteristic can be drawn freehand, while emphasizing it as a desirable feature. Actually, this makes sense only in very special cases. Typical applications need smooth, naturally originating curves that are related to acoustical phenomena in the real world.
Invisible
thEQorange is exotic in the world of commodity audio processing components. As mentioned earlier, most all equalizers in use today are implemented with filters that result in phase shift. Because the amount of phase shift is frequency dependent, some cancellation or reinforcement occurs, with the frequencies dependent on settings. This disadvantage, where different elements in a mix are spread out over time, destroys the temporal relationship between harmonics in the processed signal.
thEQorange is the only choice for difficult equalizing tasks: it cannot be “heard.” Due to equal delay for every frequency, thEQorange doesn’t smear transients nor add unwanted coloration. It successfully copes with sonic problems that cannot be solved by other equalizer without also producing deleterious side effects. You can boost lower frequency regions by 10 dB without mud, tubbiness, or loss of transient detail even at 10 Hertz. You can remove sibilance from a vocal with a narrow, deep notch without affecting the whole mix as with a minimum phase EQ.
Linear phase equalization has both a constant phase delay and a constant group delay, which better preserves the time relationships of harmonics in the original waveform. This translates into a smoother top end, sweeter and weightier mids, and a clearer, more distinct bottom as compared to phase shifting IIR EQs. The resulting sound seems less processed, clearer, and more natural. The mixes become more transparent, the instruments more defined and “real.”
We do not want you to throw out your old equalizers, but rethink their purpose and use them as an effects device or when you want to purposefully add color.
What's So Special
thEQorange is not a Finite Impulse Response (FIR) filter. Nor is it a frequency domain equalizer. thEQorange (thEQo) contains time-domain, linear phase filters based on carefully designed, classical recursive filters and existing forwards-backwards processes. Stanford University's Julius Smith expands on this "forward-backward" technique:
"There are no linear-phase recursive filters because a recursive filter cannot generate a symmetric impulse response. However, it is possible to implement a zero-phase filter offline using a recursive filter twice. That is, if the entire input signal...is stored in a computer memory or
hard disk, for example, then we can apply a recursive filter both forward and backward in time. Doing this squares the amplitude response of the filter and zeros the phase response." Emphasis is the author's own.
Using this method we not only get perfect linear phase, but also improved response in the stopband because of the amplitude squaring. The result is a very useful behavior for any kind of bandpass filter, including low pass and high pass types.
This method surely sounds like a perfect way to create linear phase filters. Unfortunately, as Smith implies, it is useless for real time or streaming applications. However, one can imagine chopping the continuous signal in chunks, and applying the forwards-backwards operation on them. Of course, cutting signals into pieces causes sharp discontinuities at each boundary. In turn, the resulting unacceptable audio artifacts make this methods completely useless...or does it?
With careful “windowing,” smoothing the transitions, we have achieved superior results, in real time no less! To employ this method for a very high quality result demands extremely elaborated methods to cut, window, and finally recombine the pieces back into a continuous signal.
Daniel Weiss' PEQ was the first commercial audio product using this forwards-backward method. The result was, at that time, very good but limited to the resolution of the hardware DSP used. Today's processors are equipped with very fast, high resolution processors allowing for 64 bit, double precision floating-point calculations. At MAAT, we go one further by utilizing 80 bit internal precision. This extremely high resolution, in conjunction with our fancy data handling, provides further improvement in the audio quality and greatly reduces possible artifacts.
By the way, linear phase processes do not exist in the natural world. Linear phase filters are created artificially by special mathematical operations. One of their inherent properties is long latency, astonishingly similar in duration for all the linear–phase filtering methods, be it FIR, frequency–domain or forwards–backwards.
Linear phase filters provides symmetrical impulse response which results in, yes, linear phase. The phase response of the filter is a linear function of frequency. The result is that all frequency components of the input signal are delayed in time, the “group delay,” by the same constant amount. And consequently, there is no phase distortion due to the time delay of frequencies relative to one another. All frequencies pass through the filter and arrive at the output at the same time.
Echo
Pre or post-echo and ringing, is also part of most minimal-phase filters. However it's not obviously audible outright, instead subtly degrading sound quality. Ripple and ringing are inherent, an unavoidable part of all digital filters. The “trick” is to decrease these processing artifacts by that clever chunk extraction, windowing and reconstruction we keep mentioning.
Low Frequency Response
To produce distortion-free low pass digital filters at low frequency, even in a normal equalizer, is a challenge. If you don't believe us, just check any parametric EQ (PEQ), graphic EQ or lesser EQ plug-in. As they say, the devil really is in the details. In the case of thEQorange, the low frequency behavior is also better that for classical filters. For practicality, we strategically limit the lowest resonant frequency to 10 Hz.
In Use
Despite its totally unique underlying technology, thEQorange is a linear phase equalizer that can be handled exactly like a classic parametric. The real difference is the sonic result: it equalizes without coloration or artifacts. That is what mastering engineers and other discerning practitioners have dreamed about. If you don't believe us, we wouldn't be surprised. The only way is to try it using difficult audio material, and then you'll believe that sometimes true miracles do happen.
thEQorange sounds more analytical than it's brother, the thEQred, and is therefore recommended particularly for difficult mastering and re-mastering tasks on dense mixes.
Filter Types
thEQorange has twelve bands or Sections. Every Section can be equipped with one of the following five filter types: Bell, Low Shelf, High Shelf, Low Cut or high pass, and High Cut or low pass. Their characteristics have been chosen to give maximum musicality and functionality for difficult EQing tasks.
The Bell is of a quasi-constant Q type, one that has been established as the most universal and best at responding to parameter changes. Low Shelf and High Shelf are filters which combine very well to generate a new, steeper slope when cascaded with the same resonant frequency. Unlike many other PEQs, thEQorange's shelving filters provide adjustable slope, from flat with a very long, smooth transient region to very steep and slightly resonant. The low and high cut filters are adjustable from maximally flat, with vanishingly low bandpass ripple, to resonant near cutoff.
You can select any filter constellation which helps you to solve your specific task. The most typical configuration consist of low cut and low shelf in Sections 1 and 2, high shelf and high cut in Sections 11 and 12, and multiple bells or peaking filters in the remaining middle Sections. For special tasks like rumble or hiss reduction, a few of the low or high cut filters can be cascaded. Using properly adjusted frequencies and Q factors, very steep brick-wall filters with desired characteristics like Bessel, Butterworth, or Elliptic can easily be created.
User Tip thEQorange uses special kinds of filters, a bit different from conventional ones. That said, sometimes you may want to emulate old skool filter types. For instance, the cut filters are equivalent to 12 dB/octave Butterworth if
the Q is set to 0.7071. With that information, you can build the equivalent of a 24 db/octave filter by cascading two 12 dB/octave “Butterworth” cut filters. By the way, you can get quite close to a 6 dB/octave slope by setting Q to 0.5.
Edge Behavior
Experts say that most digital equalizers do not sound like their analog predecessors, especially when working with 44.1 or 48 kHz sample rates. Spectral modifications at high frequencies perceptually sound improperly balanced. The reason is “frequency warping,” which makes the bells asymmetric and high shelves and high cut filters much steeper than what the numeric parameters imply. With experience, this problem can be partly corrected by parametric accommodation. That is, skewing the parameters to fit. However, bell asymmetry cannot be avoided.
Baseband Oversampling
To make our filters subjectively more “analog” for sample rates up to 64 kHz, we have enhanced thEQorange with low noise, low distortion oversampling. thEQorange uses two unique oversampling filters, each optimally calculated for the two baseband sample rates, 44.1 and 48 kHz. The THD+N (Total Harmonic Distortion plus Noise) of these filters is below the noise floor of perfectly recorded 24 bit audio. Because no degradation of the input occurs, we recommend keeping the oversampling option enabled. In the case when computational power in your system is overtaxed, you can disable oversampling.
HRA
For modern, “high rez” work, thEQorange offers filter setup up to 174.14 kHz, based on a 384 kHz sample rate. This means thEQo can tailor the ultrasonic range when mastering high resolution DSD and DXD projects.
User Tip Practical experience shows that, in many live recordings, there's a lot of disturbing signals above 20 kHz coming from switching power supplies, radio gear and lighting equipment. Such noises can significantly degrade the overall perceived transparency. Due to linear phase characteristic, thEQorange is able to effectively remove ultrasonic disturbances without affecting the music material in the audio passband. thEQo's spectrogram will display fixed frequency contamination as vertical spectral lines.
User Tip At 88.2 kHz sampling rates and above, the Nyquist frequency is shifted into the ultrasonic. For clean acoustical recordings with no environmental contamination, thEQo can be effectively applied at or near 20 kHz to reinforce a sense of “air” and spaciousness of the sound-stage.
User Tip Master mastering engineer David Glasser reminds us that “…recordings made on (the beloved Ampex) ATR-100 have tones at 29k, plus multiple harmonics from the logic circuits and timer display. Playing back any tape on an ATR introduces those tones as well.” A carefully placed high cut filter will de–clutter such tracks, and subjectively “open them up” by removing that bogus high frequency content. If possible, transfer the material at 88.2 kHz, then apply a low pass to reduce the intermodulation distortion caused by the HF hash.
Latency
Do not be angry with the unusual long latency when using thEQorange. It's simply the natural property of linear phase filters and nobody is able to further reduce the latency. The reason is that linear phase filters, independent of the way they are implemented, need a long chunk of the past and future signal for calculations. If you want to use linear phase filters, you must "pay" with increased latency. If your use case cannot tolerate longer latency, you should switch to a classic, minimal phase PEQ.
LF Response
A word on low frequency performance...Avoiding distortion in low pass digital filters at low frequencies is a challenge, even for an average equalizer. By paying attention to more than just the standard elements, thEQorange delivers better low end performance than even the cleanest competing filters.
The Controls
Let's start in the lower left corner of the user interface (UI). Then we'll jump to the right side of the UI, before covering the conspicuous graphical Section controls and spectrogram.
Left Control Cluster
At bottom left are six button, five of which have traditional rectangular appearance. The top button looks like a miniature keyboard.
Keyboard
The Keyboard button enables and disables the keyboard. When enabled, the keyboard is visible. Its purpose is to provide a musical and aural reference to quickly locate a tonal aspect or issue within your material. The frequency scale in Hertz, located above the keyboard when visible, directly corresponds to the keys on the Keyboard below.
When you mouse over the Keyboard, individual keys highlight in orange, while C keys are visually labeled along with the middle A at 440 Hz. Click on a key to hear that note played. Note that the keyboard-generated audio does not pass through the spectrogram, so any notes you play are not displayed.

NOTE: DUE TO A PECULIARITY OF WAVELAB, USERS SHOULD BE AWARE THAT THE KEYBOARD ONLY GENERATES SOUND ONCE PLAYBACK HAS STARTED.
SORT
The SORT button reorders all twelve filter Sections according to increasing resonant frequency. This Sort feature allows you to arbitrarily activate and use individual Sections, then sort them in ascending order after the fact.
OVERSAMPLE
As mentioned above, thEQorange employs a very low noise and low distortion oversampling technique for achieving analog–like filter characteristics when working with higher frequency EQ at low sample rates. When operating at baseband sample rates, 44.1 and 48 kHz, thEQo should be placed in Oversampling mode if host CPU resources permits.
f MODE
The fMODE or Frequency Selection mode button gives rise to a menu with six choices: Continuous (the default), semitones, whole tones, minor thirds, Maselec and Massive. With the exception of Continuous, these global modes simply “snap” or quantize the resonant frequency selection of all Sections. The last two menu choices, Maselec and Massive, impose the explicit frequency choices provided by popular hardware EQs from Maselec and Manley. For setting other than Continuous, holding down the shift key bypasses any frequency quantization as long it is held.
User Tip: A narrowed choice of frequencies can be useful for a faster decision making processes. Try it when working on aesthetic EQ tasks, with positive gain values and medium to low Q settings.
440 Hz (UI Detuning)
Defaulting to A4 at 440 Hz, this control is an adjustment for fine tuning the pitch-based elements, specifically the keyboard and fMODE snapping. Click–hold on the 440 Hz button, and drag up or down to tune off of the default 440 Hz. Use this feature to match material that was varispeeded or was recorded off speed. You can snap the active Section precisely to a note by right-clicking a key on the keyboard. The fMODE parameter can be automated.
SONO PRE
The SONO PRE button switches the sonogram from pre-EQ when enabled, as shown in orange, to post-EQ when disabled.
User Tip: Some users may prefer to see the effect of EQ settings on the sonogram, while others may prefer to “let their ears” take over without the EQ influencing the sonogram.
The Sections
There are twelve EQ Sections available. Resonant frequency, gain, topology, rate of change and panorama setting are all individually adjustable within each Section.
Sections are color-coded according to Panorama mode. Numeric fields in each Section can be altered by single or double-clicking within a field, which selects its contents. You can then replace the current value by typing. If you click-hold in a numeric field, you can also drag up or down to continuously change its value via mouse only. Holding down the shift key while mousing provides fine control of that parameter. An alt or option-click resets the value to the default.
In Circuit/Bypass
The button at the top of each Section serves two functions. It acts as an enable/disable switch, and it displays the current number of that Section. Clicking on the switch toggles the Section status from its current state, in circuit or bypassed, to the other.
Section numbers are also displayed in the Graph, discussed below, the filter response graphically superimposed on the spectrogram. The number represents the Section's current position in the group of twelve Sections. The Sort button, discussed above, may change a Section's position and thus, it's number.
Gain Field
The Gain field displays the current gain, positive or negative. Positive gain is shown in green, while negative gain is shown in red. Filters can have ± 12 dB of gain.
User Tip: If more gain or loss is needed for extreme situations, multiple Sections with identical settings can be cascaded.
Type
Below the Gain field is a glyph or dynamic symbol depicting the filter topology selected for that Section. Its function is twofold. First, it's a menu that provides selection of the three filter types or topologies: bell or peaking, shelf or cut. Click on the glyph to display the menu choices.
The glyph is also contextual in that its appearance changes as you alter the Section's parameters. This provides, at a glance, an easily understood visual overview of each Section's setting.
Q/Slope
The Q field displays the current Quality Factor (Q), a rate-of-change parameter. Bells and high/low cut filters are specified in Q, a dimensionless number representing resonant frequency divided by bandwidth, while shelving filters can also be thought of as dimensionless rather than the usual dB/octave metric. This is because it really is Q you're controlling “under the hood.”
When asked, Dr. Christoph said that, as expected, for higher Q values the slope is steeper. This holds true for bells and low or high cuts. For shelves with slope values greater than 0.7071, the default, the filter starts to create a “bump” or overshoot in both the pass and stop bands. For slope = 1, the overshoot is almost invisible, but for a slope of 3 (the maximum) the overshoot is clearly there. “We have similar definition problems if we want to speak about Q for bells with boost or cut values of less than ±3 dB,” Musialik said. “Mathematically, Q is defined as F_C /BW @ -3 dB below max but, in this case, the max is already below 3 dB!” He adds that, “For Bells, the Q is correct only for 6 dB of boost or cut at 3 dB above/below the peak value. For other gain settings, Q is different than what is shown in the Q field.” A simple way to think of this is that bandwidth is measured at -3 dB from the peak gain value for any given Bell filter configuration.
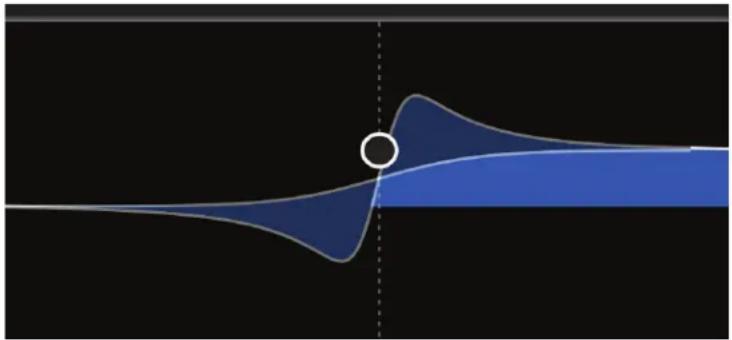
natural_image
Abstract blue wave-like shape with a white circular marker and dashed vertical line, no text or symbols presentFigure 3 — Superimposed low and high Q settings showing overshoot differences
Panorama Mode
There are five Panorama modes available in thEQorange; stereo, left-only, right-only, mono and difference. While mono is left plus right or mid in an M/S matrixed environment, difference can be thought of as left minus right or the “side” channel in an M/S world. In Stereo mode, both channels are processed by that Section. In Mono mode, “mid” in M/S, the sum of left plus right is processed by that Section. thEQorange processes left/right stereo first, then M/S second.
Right Control Cluster
To the right of Section 12 is another grouping of controls and displays...
TPL Meter
The top horizontal space in the right control cluster is occupied by an Input/Output switch, followed by a True Peak Level numeric field measured as dBTP. The Input/Output switch determines the source of the True Peak numeric display, either the plug-in's input or output. Values below zero dBTP are shown in green, while overs are displayed in red. Double clicking in the numeric field resets the display.
For those unfamiliar with True Peak measurements, there are some advantages of True Peak or TP measurement versus classical SPPM or
Sample Peak Program metering. In contrast to SPPM, TP will detect and display “inter-sample overs,” trains of samples that, when converted from the digital domain back into analog, may result in amplitudes in excess of a 0 dBFS sample and potentially an overload of a DAC’s output stage. Legacy DACs and many modern DACs will clip the output circuitry during an inter-sample over event, result in unintended distortion.

NOTE: THE TPL DISPLAY IS ONLY USEFUL IF IT IS THE LAST PLUG-IN IN A CHAIN AND THERE IS NO PROCESSING AFTER IT.
Also note that, in a floating point signal chain, values occasionally above zero decibels True Peak can be perfectly acceptable as long as there is attenuation before the final capture or output.
Contribution Controls
An exclusive four-state Contribution control determines what aspect of the equalizer is heard during playback. The upper + button allows you to hear only the positive contribution from the EQ; what is being increased. In reciprocal fashion, the lower - button allows you to hear only the negative contribution from the EQ; what is being reduced. The center • button let's you hear only the positive and negative gain contributions, an EQ-only solo if you will. With all three buttons off or disabled, the plug-in passes signal normally. That is, both the "dry" or direct signal, along with the gain changed aspects, are passed to the output.
AUTOGAIN
The Autogain function attempts to match gain in and out of bypass, so your ear/brain isn't fooled by differing loudness when the EQ is in circuit. Autogain relies on a Momentary Loudness measurement to provide a baseline at the moment the AUTOGAIN Button is clicked. This also enabled the function, as AUTOGAIN is then displayed in orange. Another click on the button will disable the function. At the moment the function is enabled, a “moving window” measurement compares pre-EQ with post and dynamically dials in gain compensation.
To the right of the AUTOGAIN button is an Autogain Reset button. Clicking on this button with the circular arrow symbol resets the baseline value. To the right of Autogain Reset is a numeric display of the current gain commanded by the Autogain function. As with other numeric fields in thEQorange, you can either click in the field to manually enter a value, or click-drag to continuously alter the value.
When making a critical Section adjustment and assuming Autogain is already enabled, initiate playback then click on Autogain Reset. From that reference, you can then enable and disable Sections without fear that the amplitude changes provided by your EQ settings will bias your judgment. Click on this button again when switching in and out of bypass produces a noticeable change in loudness.
GAIN OUT
Up to ±12 dB of output gain compensation is available here. Click or click–drag to alter the value.
The Graph
Above the left and right control clusters and center EQ Sections is the Graph or graphical display of the active filter characteristics. All active Sections are shown on the Graph, each with its corresponding shape, panorama color coding and Section number.
Underneath is a horizontal frequency scale, with thEQorange's lower frequency limit of 10 Hz at left, and the Nyquist limit for the current sample rate at right. A vertical amplitude scale at right indicates from ±9 dB up to ±21 dB of range, depending on zoom. For more information on zooming, see the discussion below on the far right controls.
Nodes
Double-click in the Graph to enable a new Section. When click-holding on an individual Section “node,” the circled Section number, a pennant appears that displays that Section’s parameters. Close to the apex of the pennant is a solo button with a headphone appearance, and an enable/ bypass control above it.
Gain Invert
When you need to ID or notch out a troublesome frequency, it's often easiest to sweep a narrow, high gain bell to aurally locate the frequency. The caret at the apex of the pennant is the Invert Gain button, which multiplies the active Section's gain by -1. This "flips" the action of the active Section, switching it from boost to cut and allowing you to quickly remove that frequency.

text_image
911 Hz 2.3 dB 2.30 Q Bell RIGHTFigure 4 — An active Section node with associated pennant
Active Node
The active node is shown with a color-coded box indicating the panorama mode surrounding the numeric controls, and a vertical dotted line that intersects the horizontal frequency scale. Control or right-click on a keyboard key to force the active node to snap to that keyboard key's frequency.
Once you have grabbed a node, you can move it vertically to change gain and horizontally to change resonant frequency. By holding down the alt or option key while in control of a node, you can change the Q or slope.
Selecting Multiple Nodes
In the Graph, you can marquee multiple nodes to temporarily “group” them. This is most useful for reducing the audibility of multiple Sections once you’ve gotten basic settings and would like to refine your EQ. Once grouped, you can scale the resonant frequency, Q and gain together as a group as long as you use only Node controls in the Graph, not the individual Section controls. Hold down the G key to deselect individual nodes. Shift–drag (marquee) to add more Sections to your current selection.
Textual vs Manual Frequency Settings
The visible resonant or center frequency numeric field is rounded to an integer. “Behind the scenes,” the software actually calculates using a 32 bit floating point value. The result is that, while textual frequency entries will be rounded, manual placement of nodes will not. The result is a possible mismatch of actual frequencies between multiple Sections that appear to be set to the same frequency value. This especially obvious when cascading multiple Sections for higher slopes.
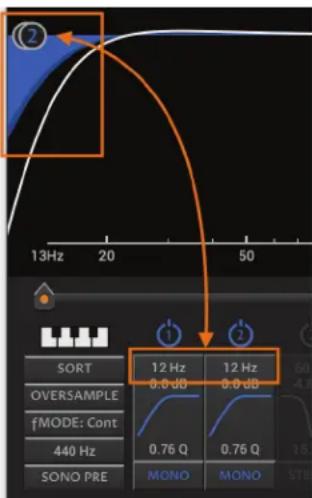
text_image
13Hz 20 50 SORT OVERSAMPLE fMODE: Cont 440 Hz SONO PRE 12 Hz 0.0 dB 12 Hz 0.0 dB 0.76 Q 0.75 Q MONO MONOFigure 5 — Two cascaded Sections with the "same" apparent f setting and differing actual frequencies
Use the numeric keys to select Sections 1 through 10. Simply type the Section number, and the corresponding Section becomes the active node. This selection method does not apply to Sections 11 or 12.
Response Curves
A solid white line graphs the aggregate response of all mono, stereo, left-only and right-only Sections currently active. A less heavy, dotted line displays the aggregate response of all DIFF or left minus right Sections currently active.

NOTE: THE HEAVY WHITE AGGREGATE RESPONSE CURVE, SHOWING THE COMBINED ACTION OF ALL THE SECTIONS, IS QUITE PRECISE BUT NOT 100% ACCURATE. THOUGH FUTURE RELEASES OF THEQBLUE WILL REFINE THAT FEATURE, IT'S ALWAYS BEST TO "USE YOUR EARS."
The Spectrogram
The optional spectrogram display provides real time visualization of amplitude versus frequency over time. The actual amount of time displayed depends on the size of the plug-in's UI, but a minimum of 2 seconds can be expected.
Analyzer Input
In the upper left corner of the spectrogram is a small equilateral triangle. When you mouse over the triangle, it lightens to indicate it's active.
Clicking in the triangle produces the Analyzer Input menu, which selects the source for the spectrogram. Four choices are available: Stereo Sum or left plus right, Stereo Difference or left minus right, Left-only and Right-only. Clicking outside the triangle or pressing the Escape key hides the Analyzer Input menu. The Analyzer Input setting are also available in User Preferences.

NOTE: THE ANALYZER INPUT MENU AND OPTIONS ARE HIDDEN WITH MONO PLUG-IN INSTANCES.
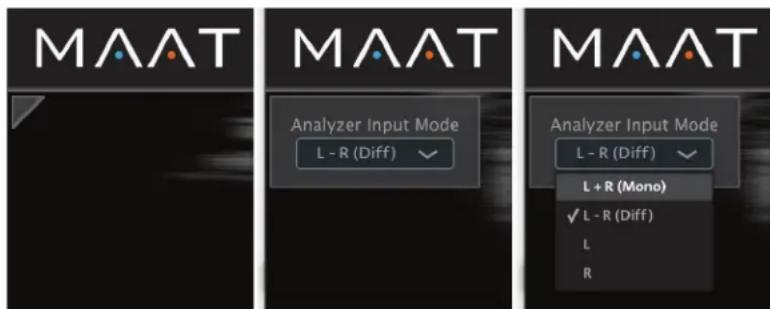
Figure 6 — The Analyzer Input menu: Mouse over, click & select
The spectrogram, when visible, is vertically divided into two areas; a color-mapped area, and a gray scale area. A subtle control determines the location of the transition from color to gray scale...see the far right controls discussion directly below.
Shared Controls
The horizontal frequency scale used by the Graph is shared by the spectrogram. Below the spectrogram, and keyboard when visible, are two horizontal, dotted arrow-shaped controls. These Limit Arrows determine the horizontal zoom, scope and position on the frequency axis of both the spectrogram and Graph. By click-dragging either control left or right, you can control the amount of zoom or scope; how wide a range of frequencies are visible at once.
By click–dragging the center of the bar connecting the two arrow controls, you control where on the frequency axis you are viewing. The center of the bar, the handle as it were, is marked by five small vertical bars.

text_image
100Hz 2 3 4 5 6 7 8Figure 7 — Controls shared by the spectrogram and Graph
In the illustration above, the left Limit Arrow is just left of 80 Hz, while the right Limit Arrow is set to 110 Hz. The handle is just above and slightly to the left of Section 5.
Far Right Controls
A small bar graph icon tucked above and to the right of the right hand control cluster hides or reveals a collection of controls and metering that resides at the far right of the UI.

text_image
E -10 -20 -30 -40 -50 -60 D B C AFigure 8 — The far right controls
Bar Graph Icon
The Bar Graph Icon controls visibility of several controls and a global Input Meter. In the figure above, the Bar Graph Icon is labeled "A".
Vertical Zoom
These plus and minus controls determine the amplitude scope of the Graph. Zoom ranges from ±3 dB to ±21 dB in six steps. In the above figure, the two Zoom controls are labeled “B”.
Color Mapping
The two arrows, labeled “C” and “E” above, control the color mapping of amplitude in the spectrogram. Arrow C controls the lowest amplitude limit, while arrow E controls the upper amplitude limit. The lowest amplitudes are displayed in the spectrogram as black. Low amplitude is shown in blue. The largest or highest amplitude is displayed in red, while relatively loud material is shown in orange.
Meter
To the right of the Color Mapping controls is a Input Meter. It displays joint left plus right amplitude of the plug-in input, and also shares an amplitude scale with the Color Mapping controls to it's left.
The Meter takes its input from the Fast Fourier Transform (FFT) that is used to generate the spectrogram, along with pink noise weighting and RMS-style temporal smoothing. The weighting imparts a better match between subjective levels and what the meter displays.
A word about the presence of the Meter...since all DAWs and many audio suites are equipped with multiple amplitude and Loudness meters, we thought it unnecessary to include yet another fancy meter in the EQ-orange. This reduces visual clutter and also CPU utilization. After all, doesn't everyone own at least one copy of DRMeter MkII? ;)
Color-to-Gray Scale Transition
The last control shown in the above illustration, labeled “D”, determines the Color-to-Gray Scale Transition. This horizontal arrow dictates the visual transition of recent aural events, shown in color, with earlier more removed aural events shown in gray scale. Click-drag the control up or down to move that transition earlier or later “in time.”
User Preferences
Preferences
Clicking on the gear icon in the upper right corner opens the user preferences...
General Tab
DSP Resolution
The DSP Resolution preference is related to the internal accuracy of the linear–phase algorithm, hence the “Quality” label. There are four resolution settings: low, med(ium), high, and (e)xtra. A higher resolution setting may improve the sound quality, especially for extremely well recorded pieces, but at the cost of additional computational power. Be aware that latency doubles with every increase
in quality level and can reach approximately one second, the exact value depending on all the plug-in's settings. Also, excessive Resolution will result in dropouts.
User Tip In general, use medium or low settings and switch to higher ones only if your original material demands it and/or your host can supply the necessary cycles.
Keyboard Gain
The Gain adjustment sets the repro level for the keyboard sound generator. A range of ±12 dB is available.
fMODE Root Note
In this tab, you can define the root note for the Semitone, Whole Tone and Minor Third fMODE settings. fMODE and fMode Root Note parameters are automatable.
CPU Saving Mode
To reduce your CPU load, this check box bypasses five subsystems and disabling the following features:
1) Spectrogram
2) Autogain
3) DIFF Monitoring
4) TPL metering
5) keyboard
Spectrogram Tab
This tab contains three settings; an on/off switch, a brightness setting, and a menu to select which channel to display.
Enabled
The Enable/Disable check box allows you to make the spectrogram disappear if you find it distracting. When the spectrogram is disabled, a vertical frequency grid replaces the spectrogram.
User Tip Disabling the spectrogram stops the FFT calculation and, for the graphical interface calculations, it stops mapping and sending info to the GPU. So, if your CPU utilization is taxed, you might try disabling the spectrogram.
Continuous
The Continuous check box enables the spectrogram to continue to scroll even when your DAW playback is paused or stopped.
Brightness
The Brightness control sets spectrogram brightness, from off at 0.0 and barely visible at 0.1, to moderately bright at 0.5 and crazy bright at the 1.0 setting.
Displayed Channel
Finally, for specialized work, the Displayed Channel menu offers L+R, Left-only and Right-only display modes. This setting is also available in the upper left corner of the spectrogram itself.
FFT Size
The FFT (window) Size parameter represents the number of samples or, interchangeably, a duration. The FFT Size also expresses into how many frequency bands the analysis window will be cut to set the frequency resolution of the window. Window size influences the temporal or frequency resolution of the analysis. Larger sizes result in improved resolution at the expense of CPU utilization.
Colors Tab
The Colors tab allows you to map or define the Panorama colors for each of the five settings. This is useful if you are color-impaired or find one or more of the factory default colors to be unacceptable.
At the upper left of the tab is a menu with the five Panorama modes. When you first open the tab, this menu defaults to STEREO. From this menu, choose any one of the five Pano modes, and map a color of your choosing. You can restore the factory color mapping using the Reset button at upper right.
Current Color/Color Chooser
A banner along the top is filled with the current color, and includes the hexadecimal descriptor for that color. Two digits are shown, for alpha or transparency followed by red, then green, and finally blue.
There are several tools for choosing your color choice. You also have a gamut box, with the current color indicated by a small white circle with black surround. To the right of the gamut box is a hue ramp, with double arrows indicating the current hue. Finally, along the bottom are RGBA controls with their current individual hex values.
Hot Keys Tab
This tab contains a reminder list of keyboard shortcuts in thEQorange.
fMODE:
For setting other than Continuous, the shift key bypasses frequency quantization
Sections:
Numeric keys:
Select Sections 1 through 10
Numeric fields:
Shift & drag for fine control of setting
Alt/option-click to reset value to default
Enable/Disable (Section On/Off)
Control/right-click to reset Section to default
Mouse wheel:
Change hover-over value
Section Nodes:
Alt/option & drag to change Q or slope
Control/right-click to reset Section to default
Shift & drag to override fMODE
Mouse wheel to change Q or slope
Control & drag constrains the frequency
Command + arrow keys cycle between solo'd bands
The s key in Band Solo Lock mode toggles solo'd band(s) on and off
Keyboard:
Control/right click to snap active Section to key frequency
Bypass:
Right click disables all Sections
License/Info Tab
This tab contains a link to open this, the user manual; a link to activate or deactivate (“park”) your license along with a list of the contributors and their roles. Note that the current version number and installed CPU architecture, 32 or 64 bit, is shown at bottom.
Bypass
Below the Preferences gear icon is an “eye” icon. This is a global bypass button that takes all Sections “out of circuit” and removes their DSP load. Right-click on the Bypass button to disable all Sections. This will not reset the Section settings, it will simply turn them off.
User Tip The Bypass/Disable feature allows you to switch off all active bands when adapting your setup from a finished song to a new song. With all Sections disabled, you can “walk through” the Sections, evaluating each one in turn to decide on the needed contribution.
Undo/Redo
To the left of the User Preferences and Bypass buttons are individual Undo and Redo buttons. These circular arrow buttons provide at least 24 levels of undo and redo, though the actual number depends on available memory.
A/B
To the left of the Undo/Redo buttons are two buttons labeled A and B. These buttons continuously save into two respective registers or digital data stores, allowing you to switch between them for aural and visual comparison.
When first opened, an instance starts copying the current state into the A register. The first time that you click on B, the state saved in A is copied into B's register. From then on, the states will diverge based on which button is selected. The selected button label is colored, while the unselected's label is white. If a button is selected, then the plug-in's current state is continuously saved into that button's register. Those registers are not persistent, and are only active during an individual DAW session.
NOTE: A AND B REGISTERS ARE NOT SAVED AS PART OF YOUR DAW SESSION.
Presets
To the left of the Undo/Redo buttons is a User Preset menu and a right flanking Save button. The Save button allows you to store a state, while the Preset menu allows you to recall saved settings.
thEQorange presets are stored as cross-platform XML files. For migrating presets from one host to another, you'll find them at...
macOS /Applications/MAAT/thEQorange/Presets
Windows C:\Program Files\MAAT\thEQorange\Presets
Specifications
Latency
The latency, specified as number of samples, actually depends only on the Resolution setting, regardless of sample rate or any other parameter.
Latency:
- For resolution 0 (xtra), latency = 36938
- For resolution 1 (high), latency = 20554
• For resolution 2 (med), latency = 12362 - For resolution 3 (low), latency = 8266
User Tip Since sample rate dictates the number of samples per second passing through the plug-in, the latency will be halved for each step up in sample rate, from 1x to 2x, 2x to 4x, et cetera. If latency becomes a problem and it makes sense in your workflow, try increasing the sample rate.
Resonant Frequency
Effective processing bandwidth per Sample Frequency:
• For 44,100: 20 kHz
• For 48,000: 21.77 kHz
• For 88,200: 40 kHz
• For 96,000: 43.54 kHz
• For 176,400: 80 kHz
• For 192,000: 87.07 kHz
• For 352,800: 160 kHz
• For 384,000: 174.14 kHz
System Requirements
• Mac: macOS 10.8 and newer
• Win: Windows 7 and newer, 32 & 64 bit
• Pro Tools 10.3.10 and newer
- 4GB RAM minimum
Supported Platforms
• AAX, AU, VST2/3 Mac, VST2/3 Win
Supported Sample Rates
• 44.1 to 384 kHz
Supported Hosts
Ableton Live, Cubase, Logic, Nuendo, Pro Tools, Sequoia, Studio One, Wavelab
Updates
Please always use the latest version of the software! You can find your current version on the Info Tab of the back panel. You can download the latest version simply by visiting:
http://maat.digital/support/#installers
For optimal security and stability, you should always stay up to date with Operating System revisions, and we keep up with compatibility changes to our products. We also continue to optimize for reduced CPU load, and this very user manual gets its own improvements.
To stay up to date with the latest version and product releases, please subscribe to our occasional newsletter. You'll find a opt-in form on our Contact page, or sign up for a copy of our free and very handy 2BusControl plug-in which will also subscribe you. Don't worry, we know you are busy so we only send out an average of 10 or 12 mailings a year.
Credits
Initiator & UX Concept
DSP Concept & Algorithms
Dr. Christoph M. Musialik
Product Management & UX
Oliver Masciarotte
Plug-In Programming
Agent Tad Nicol, MAAT Inc.
Legacy "LinearPhase PEQ Orange" programming
Dr. Ulrich Hatje/Algorithmix GmbH
VST is a trademark of Steinberg Media Technologies GmbH
Support
For product support, please visit:
https://www.maat.digital/supports
Would you like to help MAAT? Help support MAAT by sharing the love...Like us on Facebook:
https://www.facebook.com/maatdigital/
and Tw it ter :
https://twitter.com/maat_digital
and tell your friends about us
Share The Love
Would you like to help us in our quest for better sound quality? Help support MAAT by sharing the love...Like us on Facebook!
https://www.facebook.com/maatdigital/
and Twitter too:
https://twitter.com/maat_digital
Please tell your friends and colleagues about us. We really appreciate it, and thank you for supporting better quality audio.
About This Manual
This manual was written in Adobe InDesign 15.1.1, and is set in Robert Slimbach's Minion Pro and Myriad Pro. The cover page is set in Aldo Novarese's modernist geometric Eurostyle. Dr. Christoph Musialik supplied the original LP PEQ Orange from which some material was adapted for this thEQorange user guide.
This documentation, as well as the software described in it, is furnished under license and may only be used or copied in accordance with the terms of such license. The information in this manual is furnished for informational use only, is subject to change without notice, and should not be construed as a commitment by MAAT Incorporated. MAAT Incorporated assumes no responsibility or liability for any errors or inaccuracies that may appear in this document.
Except as permitted by such license, no part of this publication may be reproduced, stored in a retrieval system, or transmitted, in any form or by any means, electronic, mechanical, recording, or otherwise, without the prior written permission of MAAT Incorporated.
Notice of Liability
The author and publisher have made every effort to ensure the accuracy of the information herein. However, the information contained in this document is provided without warranty, either express or implied. Neither the authors, MAAT Incorporated, nor its dealers or distributors will be held liable for any damages to be caused either directly or indirectly by the instructions contained in this document, or by the software or hardware products described herein.
MAAT INCORPORATED MAKES NO WARRANTIES, EXPRESS OR IMPLIED, INCLUDING WITHOUT LIMITATION THE IMPLIED WARRANTIES OF MERCHANTABILITY AND FITNESS FOR A PARTICULAR PURPOSE, REGARDING THE SOFTWARE. MAAT INCORPORATED DOES NOT WARRANT, GUARANTEE, OR MAKE ANY REPRESENTATIONS REGARDING THE USE OR THE RESULTS OF THE USE OF THE MAAT INCORPORATED SOFTWARE IN TERMS OF ITS CORRECTNESS, ACCURACY, RELIABILITY, CURRENTNESS, OR OTHERWISE. THE ENTIRE RISK AS TO THE RESULTS AND PERFORMANCE OF THE MAAT INCORPORATED SOFTWARE IS ASSUMED BY YOU. THE EXCLUSION OF IMPLIED WARRANTIES IS NOT PERMITTED BY SOME STATES. THE ABOVE EXCLUSION MAY NOT APPLY TO YOU.
IN NO EVENT WILL MAAT INCORPORATED, ITS DIRECTORS, OFFICERS, EMPLOYEES, OR AGENTS BE LIABLE TO YOU FOR ANY CONSEQUENTIAL, INCIDENTAL, OR INDIRECT DAMAGES (INCLUDING DAMAGES FOR LOSS OF BUSINESS PROFITS, BUSINESS INTERRUPTION, LOSS OF BUSINESS INFORMATION, AND THE LIKE) ARISING OUT OF THE USE OR INABILITY TO USE THE MAAT INCORPORATED SOFTWARE EVEN IF MAAT HAS BEEN ADVISED OF THE POSSIBILITY OF SUCH DAMAGES. BECAUSE SOME STATES DO NOT ALLOW THE EXCLUSION OR LIMITATION OF LIABILITY FOR CONSEQUENTIAL OR INCIDENTAL DAMAGES, THE ABOVE LIMITATIONS MAY NOT APPLY TO YOU.
©2018 - 2020 MAAT Incorporated — All rights reserved.
MAAT, thEQ, thEQorange and the MAAT logo are trademarks of MAAT Incorporated. All other company or product names are either trademarks or registered trademarks of their respective owners.