
LT-Q6000 - Gps Qstarz - Free user manual and instructions
Find the device manual for free LT-Q6000 Qstarz in PDF.

| Product Type | GPS Lap Timer and Logger |
| Brand | Qstarz |
| Model | LT-Q6000 |
| Dimensions (L x W x H) | 100 x 59 x 28 mm |
| Weight (without bracket) | 107 g |
| Display | 2.4" TFT color, 320x240 px, 65K colors |
| GPS Chipset | High sensitivity, -165 dBm, 66-channel |
| Log Rate | Up to 10 Hz (1 point per 0.1 sec) |
| Battery Life | Up to 10 hours (backlight on) |
| Charging Time | 5 hours (power off) / 10 hours (power on) |
| Water Resistance | IPX-3 |
| Operating Temperature | -10°C to +60°C |
| Storage Temperature | -20°C to +60°C |
| Charging Temperature | 0°C to +45°C |
| Memory | Built-in large internal memory |
| Functions | Drag Race, Circuit Race, GPS Logger, Speedometer, G-Meter, History |
| Buttons | 8 function buttons (4 direction, Back, Enter, Multi-function, Power) |
| LED Indicators | Green (screen saving), Orange (charging), Red (alert) |
| Accelerometer | Built-in 3-axis for G-force and auto start |
| Firmware | Upgradable via USB |
| Mounting | Car windscreen mount (included), motorcycle mount (optional) |
| Included Accessories | Mounting bracket, mini USB cable, car charger, software CD, sticker, warranty card |
| Software | QRacing (lap analysis) and QTravel (geo-tagging) |
| Safety Notes | Keep away from heat >60°C, avoid moisture, do not disassemble |
| Cleaning | Use dry clean cloth; no harsh chemicals |
Frequently Asked Questions - LT-Q6000 Qstarz
User questions about LT-Q6000 Qstarz
0 question about this device. Answer the ones you know or ask your own.
Ask a new question about this device
Download the instructions for your Gps in PDF format for free! Find your manual LT-Q6000 - Qstarz and take your electronic device back in hand. On this page are published all the documents necessary for the use of your device. LT-Q6000 by Qstarz.
USER MANUAL LT-Q6000 Qstarz
natural_image
Red sports car speeding on a track with motion blur, no visible text or symbolsLT-Q6000 GPS Lap Timer COLOR User's Guide
■ A. LT-Q6000 Package Contents:
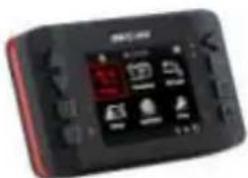
1) QSTARZ LT-Q6000 unit
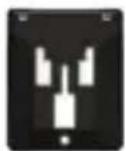
2) Device moun ng bracket
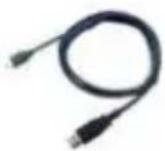
3) Mini USB cable
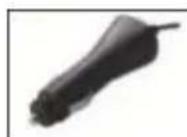
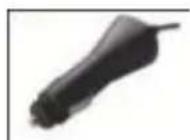
4) Car charger
5) So ware CD
6) User's Guide
7) Exclusive S cker + Warranty card
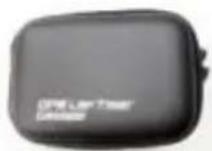
8) LT-Q6000 protec ve case (Op onal)
9) Car windscreen mount kit or Motorcycle mount kit (Op onal)
(1)
(2)
(3)
(4)
(5)

(6)


(7)
(8) op onal
Main func ons:
● eXtreme 10Hz Log to record 10 mes per second
● Real- me perform and display Lap Timing analysis
● 2.4" True color and wide display to illustrate racing data precisely
● Real me Lap/Spilt/Sector Comparison
- Mul -Func on Device – Lap Timer and GPS Logger
● Auto Start-Run a er device senses forward mo on
● Diversified Drag Race modes selected by speed/distance and kph/mph
● Flexible Circuit Race selected by Lap with splits or Simple Lap
● Performance Test On-the-Go
● Large memory capacity never worry full memory
● History database well organized as Calendar and table type for easily review
● G-force meter to plot G-force status
● Smart speedometer to show real- me speed informa on
● Device con gurable such as unit, backlight, brightness, me zone, or me format
● Flexible Track Manager – On-Device created to User track, and QRacing Sync to Shared track
Speci ca ons:
- Adopt high sensi vity GPS chipset with -165dBm and 66-Channel tracking
● 2.4" (320x240) TFT Color display with 65K color
● Ultra lower power consump on up to 10hrs opera on (under LCD backlight on)
● Log rate up to 10Hz excellent for High speed Racing (recording 1 waypoint per 0.1 second) - Including 8 Func on bu ons – 4 Direc on Bu ons, Back, Enter, Multi-func on, and Power Bu ons
● 3 LED Indicators – Green for Screen Power Saving, Orange for Charging, and Red for Alert
● Built-in 3-axis accelerometer for G-force measurement and Auto Start trigger
● Built-in large memory and view history data easily
● Device recognized as USB removable disk for data access with computer conveniently
- Raise beeper func on to no ce some status of device
- IPX-3 water resistance
● Less than 15-Sec. AGPS x support to realize faster TTFF and positioning under warm start
● Mini-USB interface for charging, data download and rmware update
- Firmware upgradable
● Environment temperature- Opera on: -10°C to +60°C / Storage: -20°C to +60°C / Charging: 0°C to +45°C
● Device Dimension (LxWxH): 100 x 59 x 28mm / Weight: 107 grams (Moun ng bracket excluded)
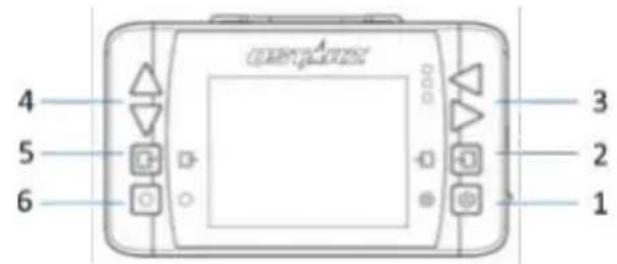
■ B. Appearance
natural_image
Line drawing of a handheld electronic device with control buttons and a screen (no text or symbols)| Name | Icon | Func on |
| 1. Power bu on |  | ● Press for 3 seconds to power on or power o LT-Q6000● Press to return to Main Menu when device is on |
| 2. Enter/Set bu on |  | Press to con rm the op ons selec on |
| 3. Le /Right Naviga on bu on |  | Press to switch among di erent op ons |
| 4. Up/Down Naviga on bu on |  | Press to switch among di erent op ons |
| 5. Back/Cancel bu on |  | Press to cancel func on and go back to previous screen |
| 6. Mul -func on bu on: |  | Press to start the race and log |
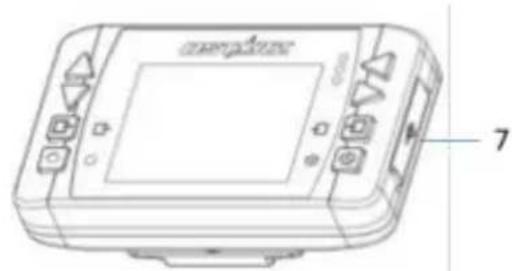
| 7. -Mini USB port-Reset bu on | ● For Charging device● For Data download to PC● For Firmware Upgrade |
■ C. Icon de ni on
| Icon | Descrip on | Icon | Descrip on |
| GPS is not connected, searching for GPS signals |  | Ba ery full | |
| GPS is connected with 2D x |  | Low ba ery ( less than 15% ba ery me) (Red color) | |
| GPS is connected with 3D x |  | Low ba ery (less than 5% ba ery me) (Red color) | |
| GPS engine close (Red color) | [2DSW] | Device is logging (Green color) Device is not logging (Red color) | |
| Drag Race Mode |  | Circuit Race Mode | |
| GPS logger Mode |  | History Mode | |
| Applica on Mode |  | Se ng Mode |
■ D. LED Signal de ni on
| LED | Red | When the memory is full or fail to read/write memory, the Red LED will ash once per 3 seconds.When the ba ery is in low status below 15%, Red LED will ash once per 3 seconds. When low below 5%, Red LED will be steady ON for alert. |
| Orange | When device is under charging mode, the Orange LED will be steady ON. When device ba ery is fully charged, the Orange LED will be OFF. | |
| Green | When device is under Screen power saving mode (backlight o ), Green LED will ash once per 3 seconds. |
■ E. Safety No ce
Note: Please read this sec on carefully before start opera ng the LT-Q6000.
- Keep the LT-Q6000 far from heat or high temperature environment. We recommend not to expose your LT-Q6000 in temperature higher than 145°F/60°C to prevent the device from overhea ng, exploding or mel ng itself.
- When car interior temperature is too high, is likely to result in product failure or damage. When device is not in use or driver leaves the car, we suggest disconnecting the device and place in the car glove box.
● To reduce the risk of re or shock hazard, do not expose this product to rain or moisture. - Do not mount the devices in a place where the driver or passengers may receive injury during vehicle opera on or collision. For your safety, take care to route all cables away from shi ers, pedals, accessory controls and mechanisms
The manufacturer assumes no responsibility for any damages and loss resulting from the use of this manual, or from dele on of data as a result of malfunc on, dead ba ery, or from misuse of the
product in any way.
- Please clean the unit with a dry and clean so close. Do not use harsh cleaning solvents, chemicals, or strong detergents.
- Do not a empt to open LT-Q6000 by yourself. Unauthorized hacking may damage the unit, and void your warranty.
■ F. Charging LT-Q6000
Please charge the ba ery fully before the rst use.
LT-Q6000 comes with a built-in rechargeable Li-Ion battery that can be charged through the PC using the USB cable provided and car cigarette adaptor. Charging device is 5 hours typically with Power OFF mode and 10 hours with Power On mode, a fully charged battery will last about 10 hours operation.
Note: To avoid damage to the ba ery, please do not overcharge the ba ery for more than 10 hours. The ba ery will stop charging if it's overheated for safety reason.
■ G. Device bracket moun ng
(1)
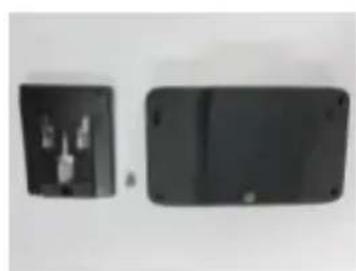
natural_image
Two black rectangular electronic devices with visible internal components, placed side by side on a plain white surface (no text or symbols)● Q6000 moun ng bracket with provided screw.
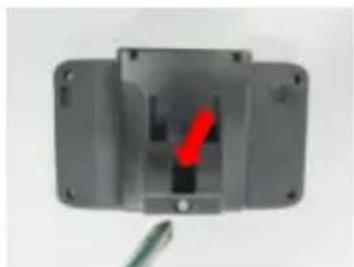
(2)

natural_image
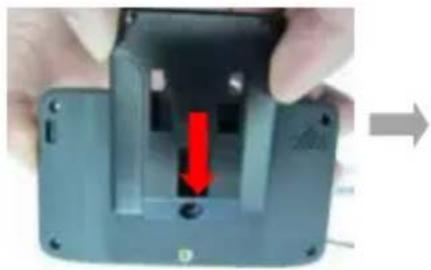
Close-up of hands holding a gray electronic device with a red arrow pointing to a black hole (no text or symbols visible)● Lining up the bracket with the screw hole.
(3)
natural_image
Close-up of a gray plastic enclosure with a red indicator light and a green tool inserted (no text or symbols visible)- Secure the moun ng bracket in place with the provided screw.
■ H. Moun ng the LT-Q6000 in the vehicle
- Locate the area on the vehicle windshield where you want to mount the LT-Q6000.
- Press the suc on cup mount against the glass and lower the locking lever into place to secure the mount to the windshield rmly.
Note: Clean Surface of windshield rst by rubbing alcohol or dry cloth before moun ng the device.

natural_image
Hand holding a black car head-mounted sensor device outdoors, with trees and a sunset sky in the background (no visible text or symbols)
natural_image
Hand holding a black remote control device outdoors, with trees and a sunset sky in the background (no text or symbols visible)- Snap the moun ng bracket onto the suc on cup arm.

natural_image
Close-up of a car's front-mounted camera module with a red directional arrow indicating left angle (no text or symbols visible)- Please make sure the LT-Q6000 is installed as straight and ver cal as possible. So the internal 3-axis G-Force sensor is able to perform more accurately.

natural_image
Top-down view of a car's front suspension system mounted on a black sensor device, with red arrows and a red circle highlighting the components (no text or symbols visible)
natural_image
Top-down view of a car's rear windshield-mounted sensor device, showing no text or symbols on the device itself.■ I. Ge ng Started
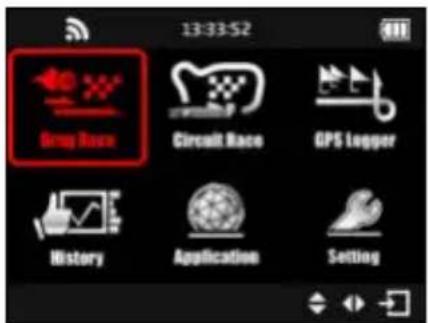
To power on your unit, press and hold the power bu on for 3 seconds un I it turns on. A startup screen will prompt to indicate system is loading for a few seconds, and then you will see the Main Menu screen.
Main Menu is contained Six (6) Opera on Modes:
- Drag Race Mode
- Circuit Race Mode
- GPS Logger Mode
- History Mode
- Applica on Mode
- Se ng Mode
Select one of Opera on Modes to execute required func on.

Startup screen

Main Menu
LT-Q6000 is for outdoor use; an open sky outdoor environment will enable faster satellite acquisition and provide better positioning accuracy. If GPS is not 3D xed, a “Wai ng for GPS Signal...” screen will be prompt to no ce that now you are unable to start race.

I-1. Drag Race mode

The Drag race mode allows you to measure your vehicle's accelera on by Speed or Distance with various different tests.

- Session Name: The system will automa cally create the session name with YYMMDDXX format.
- Session Type: User may select to measure by Speed or Distance Racing type.
● Racing type:
-By Speed: Select from pre-de ned tests (0-30mph, 0-60mph, 0-100mph) or you can create your own test speed by selec ng "Create".
-By Distance: Select from pre-de ned (1/16mile, 1/8mile, 1/4mile, 1mile) or you can create your own test distance by selec ng "Create".
*Measurement Unit can be switched between Metric or Imperial in Se ng Mode.
- Compare: Compare the current run with your Best or Last run.
● Field Op on: Select the display op on: ( SPSpeed), ( DDistance), ( BBest run) or ( ▪Last run) on the top right of ming screen. - Press ● bu on and the device will automa cally start/stop ming and logging your run once you have reached the preset test ranges.
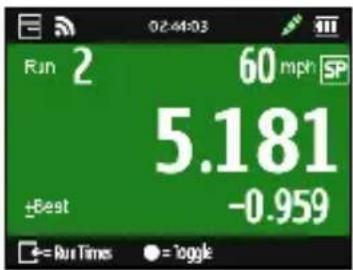
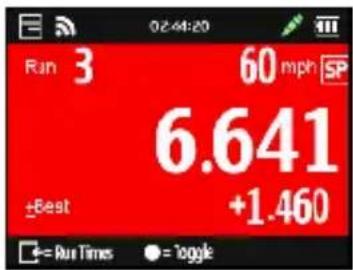
☆ Run me screen for Drag race (tested with speed 0-60mph).
If you were going faster than best run or last run (depend on which one you compare to), the run me will be shown in Green background. Or if you were going slower, and the run me will be shown in Red background. The ming di erence between your current run and your best or last run will be shown at the bo om of the screen. You can also press the ●you on to switch the eld op on on the top right corner of ming screen.
Press ←= Run Times bu on to view the Session's result:
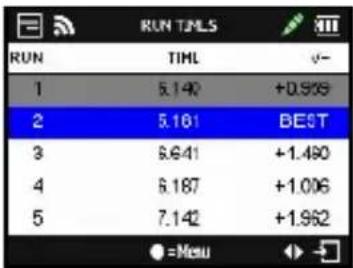
Press ●=Menu button, you can select to con nue to Next Run, view your Run Detail or Stop Session to back to Main Menu.


1-2. Circuit Race mode

In Circuit race mode, user can select two race types: Lap with Splits or Simple Lap.

- Lap with Splits:
- Create Closed Track: Start/Finish lines are in the same place.
- Create Open Track: Start/Finish lines are not in the same place.
You will need either create a start/ nish lines & split lines, or load the previously saved or imported start/ nish & split lines from the device memory. (See How to setup Start/Finish and Split lines below)
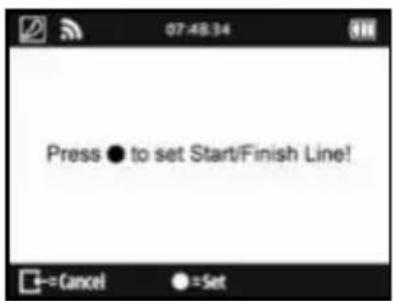
● Simple Lap: Just press the ● bu on to set up the Start/Finish line and ready to race.
Note: Please drive forward 3 meters then set up the Start/Finsh line. This can increase the accuracy.
- Field Op on: Select the display op on: ( speed), ( distance), ( best run), ( last run) or ( Splits) on the top right of ming screen.
- Beacon Width: Beacon is commonly referred to as the virtual start, nish and split lines. The default beacon width is set to 30 meters (15m from each side of the vehicle) and the Beacon line is placed in a straight angle to your current bearing (see below picture), you may adjust the beacon width according to your track width.

How to setup Start/Finish and Split lines?
- By driving slowly (at least 25 mph) on the track, press ● bu on when you are on the spot that you want to mark as Start/Finish line.
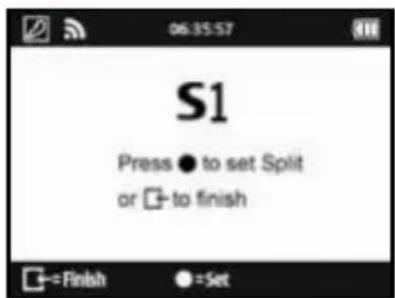
- A er you have created the Start/Finish line, press ●bu on to mark the split line.
(Note: Max 25 split lines can be add for each track)

-
Press ←=Finish bu on to nish crea ng the Start/Finish and Splits lines. The Track will be saved automa cally in the memory of Q6000/BEACON/USER folder once nished; you can re-load it later or share it with other users.
-
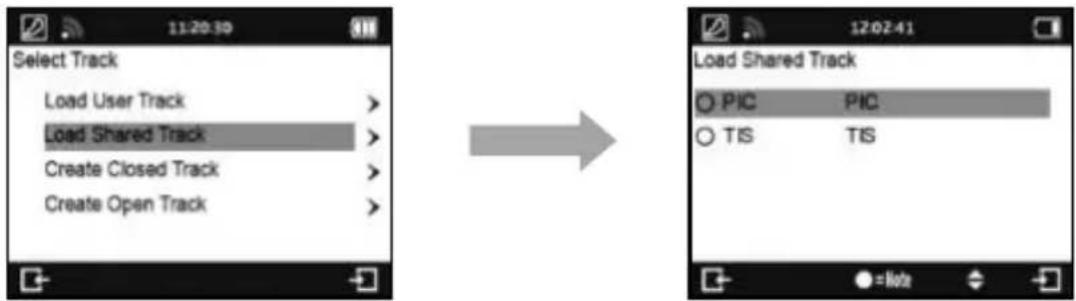
You can load the beacon from User Track you previously created. Or you can load it from Shared Track you imported via QRacing or downloaded via website.
*Load User Track:
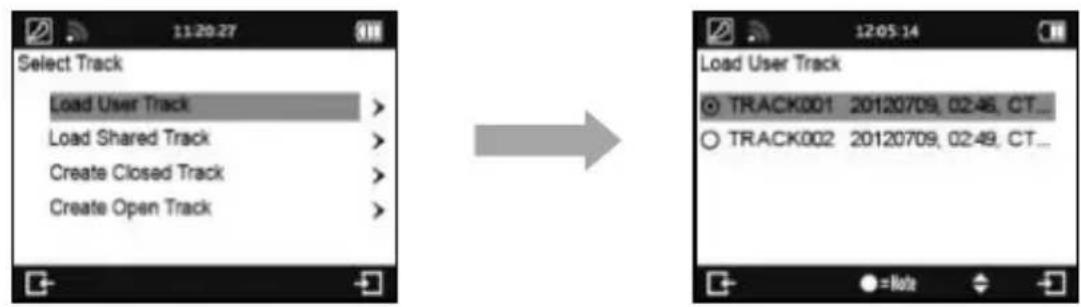
*Load Shared Track:
- Press ● bu on to start logging and ming your lap.
Note1: The vehicle must be moving for be er precision when se ng the Start/Finish line.
Note2: In some cases it may not be feasible or safe to add Start/Finish Splits line while driving. Users can use alterna ve way by QRacing so ware to edit the Start/Finish and Split lines, then export them to LT-Q6000 for race (Please see K-2 Edit Beacon).
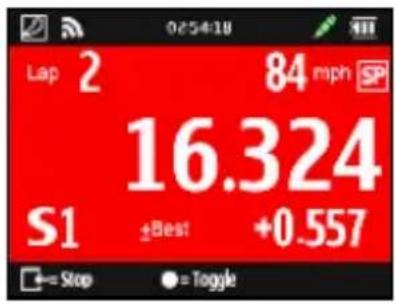
Lap Time screen for Circuit Race mode: (tested with Lap with Splits)
For Lap with Splits, if you were passing spilt and going faster than the same spilt of best lap, the Rolling me and Split ming di erence will be shown in Green background. Or if slower, the Rolling me and Split ming di erence will be shown in Red background. You can also press the ●bu on to switch the eld op on on the top right corner of ming screen.

Press ←=Stop bu on to Stop the race and view this Session's each Lap Time result.

other
LAP TIMLS (Sector) | Category | Full | +/- | |---|---|---| | Opt | 14.673 | -1.651 | | 1 | 16.324 | BEST | | *2 | 12.364 | -3.960 | | *3 | 12.831 | -3.493 | | *4 | 11.547 | -4.777 | =MenuPress ●=Menu bu on and select Display mode to analyze your session lap in detail:
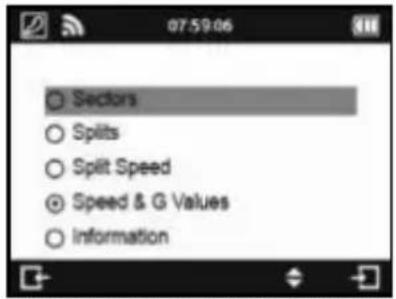
- Sectors: The me from one split point to the next split point. Press the bu on to navigate and view each sector's me.
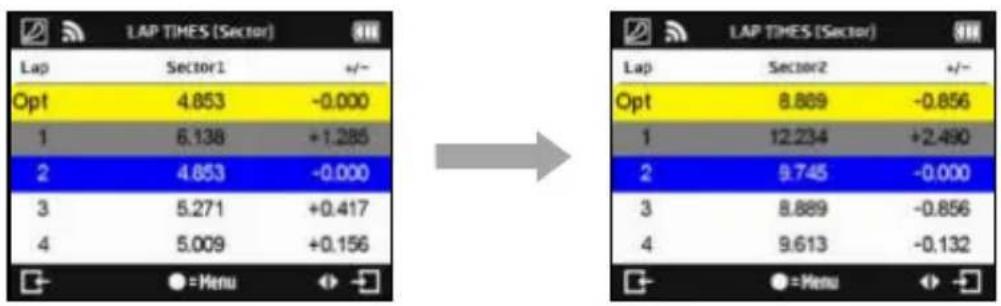
other
| | Lap Sector1 | +/- | | ------ | ----------- | ----- | | Opt | 4.853 | -0.000 | | 1 | 6.138 | +1.285 | | 2 | 4.853 | -0.000 | | 3 | 5.271 | +0.417 | | 4 | 5.009 | +0.156 |- Splits: The cumula ve me from start point to a split Point. Press the bu on to navigate and view each split's me.
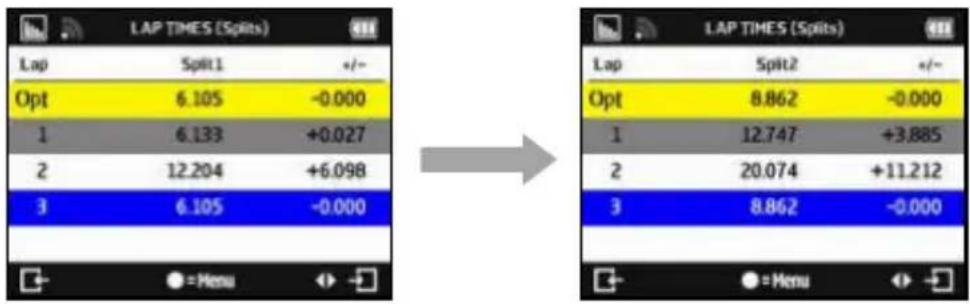
other
| | Lap | Split1 | +/- | | ------ | ---- | ------ | ----- | | | | | | | | | 6.105 | -0.000 | | | 1 | 6.133 | +0.027 | | | 2 | 12.204 | +6.098 | | | 3 | 6.105 | -0.000 | | | | | | | | | | =Menu | | | | | | | | | | | | | | | | | | | | | | | | | | | | | | | | | | | | | | | | | | | | | | | | | | | | | | | | | | | | |Split Speed: The speed when across the split line.
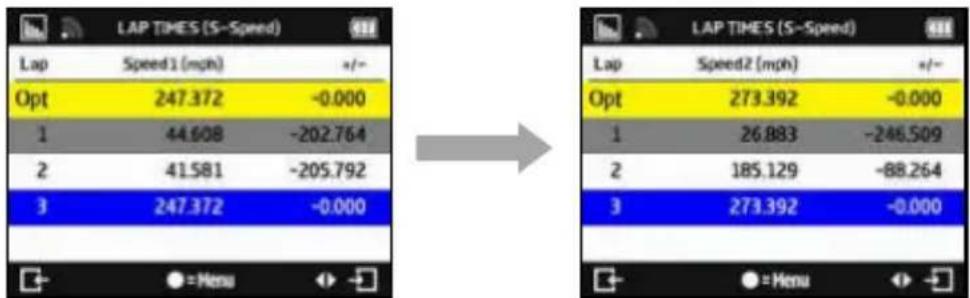
other
| Item | Lap Times (S-Speed) | Value | |---|---|---| | Lap | Speed1 (mph) | +/- | | Opt | 247.372 | -0.000 | | 1 | 44.608 | -202.764 | | 2 | 41.581 | -205.792 | | 3 | 247.372 | -0.000 | The image contains two separate panels: the left panel shows a table for lap time values with 'Opt' and 'Red' labels, while the right panel shows a table for lap time values with 'Opt' and 'Red' labels. The arrow indicates transformation from the left to the right panel.- Speed & G Value: Display the session lap's Max/Min/Avg Velocity (Speed) and Max G Value.

other
| Lap | Vmax (mph) | +/- | | --- | --- | --- | | Opt | 155.314 | -0.000 | | 1 | 145.020 | -10.294 | | 2 | 125.783 | -29.530 | | 3 | 155.314 | -0.000 | | 4 | 10.019 | +3.682 | LAP TIMES (S-G) Lap | Vmin (mph) | +/- | | Opt | 6.336 | -0.000 | | 1 | 11.089 | +4.752 | | 2 | 12.372 | +6.036 | | 3 | 6.336 | -0.000 | | 4 | 10.019 | +3.682 | LAP TIMES (S-G) Lap | Gmax | +/- | | Opt | 0.000 | -0.765 | | 1 | 0.577 | -0.188 | | 2 | 0.845 | +0.080 | | 3 | 0.765 | -0.000 | =MenuI-3. GPS logger mode

You can also use LT-Q6000 as a GPS Data logger to record your travel route.
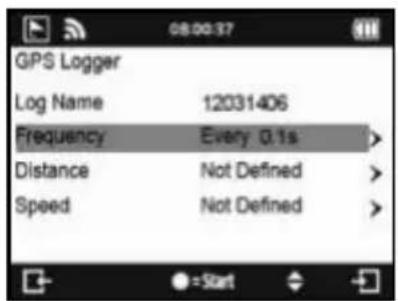

Log name: The system will automa cally create the Log name with YYMMDDXX format.
Frequency: Select the log frequency (1Hz, 5Hz, 10Hz or user de ne 0\~99 seconds)
Distance: Select to log by distance (0\~9999 meters).
➢ Speed: Select to log by speed (0\~999 kph).
➢ Press ● button to start logging.
Note: If log frequency is set to 5Hz or 10Hz, distance and speed criteria will be disable.
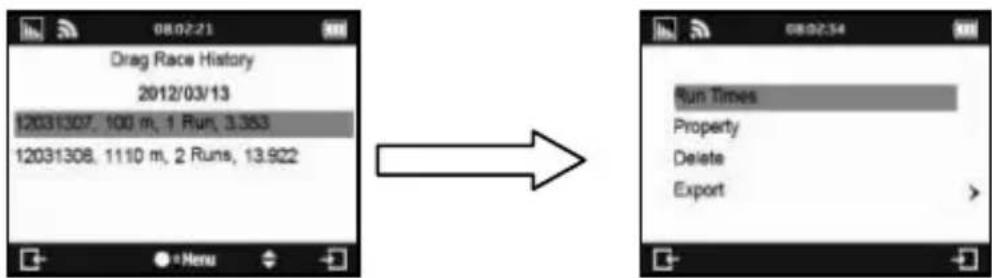
1-4. History Mode

You can review all the data recorded with LT-Q6000 in History mode. When the calendar day shows up in Red, it means there's racing record. Or you may review by Track name with Circuit race mode only.

Press ●=Menu Bu on can view the selected session's Run (Lap) Times, Property, Delete session or Export track. Track export le format can be selected with KML, CSV or GPX le. A er track export succeeded, the exported le can be found on the device memory of the Q6000\Exports folder.
1-5. Applica on Mode

In Applica on mode, you will be able to perform LT-Q6000 as a Speedometer or G-meter. And also you can view device's current GPS signal status and perform the Cold start func on.
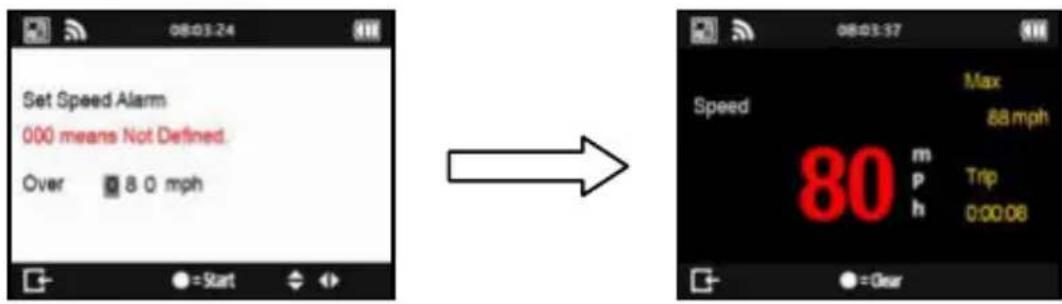
✨ Speedometer:
The speedometer can display your current driving speed in real- me, Max speed and Trip me traveled. And it addi onally has an over speed alarm func on. When the vehicle exceeds the se ng speed, driving speed will be shown in red and device will make beeping sound to warn the driver.
G-Meter:
G-Meter uses Q6000's built in 3-axial accelerometers to provide accurate real- me G-force results with graphics.

GPS Cold Start:
Performing the Cold Start func on will clear the GPS engine of the device's list of old satellite informa on. Under normal opera ng condi ons, the last satellite lock computed before the unit was turned o is stored into memory and will be used as the reference when the next me the unit is turned on. Also, if you travel for more than 500 miles with it turned o , it will s ll have the reference point but it may be too inaccurate to be useful and result in longer me to get a satellite lock. In this case you may want to perform a cold start.
1-6. Set ng mode

In the Se ng mode, op on such as Unit of Measure (mph/kph), Backlight, Brightness, Time Zone, Time format, Daylight Saving and Language op ons can be adjusted, or reset device to factory default.
1


✿ Memory Status: You can know the percentage of Used Memory. Select ● bu on and is able to clear all memory. But make sure you have saved log data in advance.
✿ GPS Engine: Regular use of GPS posi oning will increase ba ery consump on. You may turn o the GPS engine when not in racing to save ba ery power.
✿ G-Sensor Threshold: When start trigger by G-sensor is too sensi ve, you may increase the G-Sensor threshold to make the trigger less sensi ve. Default G-sensor threshold is 0.1G.
Language: Select the desired language and press Enter Bu on, and wait un l the language loading is completed. Please make sure the ba ery power is su cient up to 80%, and do not turn o or press the reset bu on while loading the language.
■ J. Upgrading Firmware
Qstarz will frequently update the rmware to provide new features and bugs x; it is advisable to visit Qstarz website (h p://www.qstarz.com/download.php) regularly for rmware updates.
Please check the unit's current version at Se ng Mode >> About. If the current version is older than the one published in our website, please download the latest version and follow the steps below to
upgrade rmware:
Step1. Turn OFF the device and connect to the USB port of computer. LT-Q6000 will enter into USB ACCESS MODE automa cally.
Step2. Extract the downloaded rmware le Q6000.qst and copy to the root directory of the device memory.
Step3. Unplug the USB cable and press both "ENTER" and "POWER" bu ons at the same me un I the "CHECK FILE" screen prompts. And it will start upda ng the rmware. Once the rmware upda ng process is complete, device will restart automa cally.
Cau on 1: Please make sure your battery power is sufficient up to 80% before updating your rmware.
Cau on 2: Do not press the reset bu on while upda ng the rmware.
■ K. Data Download and Data Analysis
LT-Q6000 comes with dual so ware (QRacing™ and QTravel™) inside the package.
-QRacing™ lap timing analysis so ware allows you to download and analyze the data stored in LT-Q6000. You can manage your racing tracks as database structure and analyze with graph sta s cs.
K-1. Import data from Q6000.
- Install QRacing so ware from Qstarz so ware CD. Input product key at rst me use. (The product key is located in the envelope of the so ware CD)
● "Power o" the unit and connect the supplied USB cable to the computer. - Run QRacing so ware
- Click on "Read Log" from Menu >> File
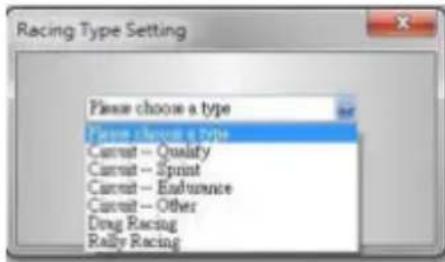
- Select the Racing Type
- Select the session to import

- If you haven't loaded the beacon previously, QRacing will ask you to edit beacon. Click "Yes" and will load the beacon from Q6000, or you may click "Cancel" to edit the beacon by you.
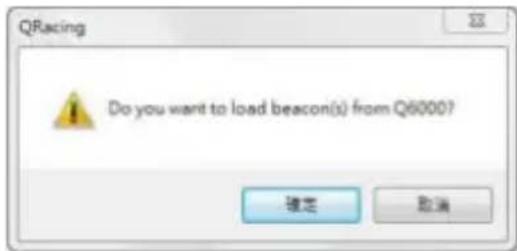
Note: Once loading beacon from Q6000, QRacing will remember this beacon set and use it for all other sessions with the same track. If you want to load another different set of beacon, please "Delete All Beacon" in Beacon page and select the session to load the beacon again from Q6000.
K-2. Edit Beacon
- Please go to QRacing Beacon page and edit the Start/Finish and Splits line for your track. Once nished, you may also export it into Q6000 device by clicking on Beacon Export >> Export Beacon to Q6000. You can then load the exported track in LT-Q6000 Circuit Race mode >> Track Name >> Load Shared Track later on for race.
K-3. Analyze Data
- Once beacon is loaded or edited, you may start to analyze and view your racing data. Switch to Analysis page to view and analyze your lap me and the best result will be highlighted in blue.
| Lap | Time (Diff) | Max Speed (Diff) | Min Speed (Diff) | Average Speed (Diff) | Distance |
| Lap1 | 00:58 431 (+00:13 km) | 47.63 km/h (-10.34) | 12.49 km/h (-4.67) | 30.81 km/h (-8.88) | 496.42 m |
| Lap2 | 00:51 149 (+00:06 sec) | 54.64 km/h (-3.33) | 11.40 km/h (-5.76) | 35.27 km/h (-4.42) | 499.69 m |
| Lap3 | 00:47 884 (+00:02 sec) | 56.26 km/h (-1.71) | 14.60 km/h (-2.56) | 38.07 km/h (-1.62) | 497.07 m |
| Lap4 | 00:47 877 (+00:02 sec) | 55.20 km/h (-2.77) | 16.02 km/h (-1.14) | 38.18 km/h (-1.51) | 498.52 m |
| Lap5 | 00:45 692 (+00:01 sec) | 57.97 km/h | 17.16 km/h | 38.93 km/h (-0.76) | 497.40 m |
| Lap6(best) | 00:45 036 | 57.22 km/h (-0.75) | 16.86 km/h (-0.30) | 39.45 km/h (-0.24) | 493.10 m |
| Lap7 | 00:45 649 (+00:00 s11) | 55.77 km/h (-2.20) | 16.10 km/h (-1.06) | 39.59 km/h | 496.10 m |
| Lap8 | 00:45 727 (+00:01 sec) | 56.11 km/h (-1.86) | 13.36 km/h (-3.80) | 38.95 km/h (-0.84) | 496.38 m |
| avg | 00:48 636 | 55.10 | 14.75 | 37.41 | 496.84 |
Sector View
Sector = the me from one split point to next split point.
| Sector View (Split-to-Split) | ||||||
| Lap | Time (Diff) | 0-1 (Diff) | 1-2 (Diff) | 2-3 (Diff) | 3-4 (Diff) | 4-5 (Diff) |
| Last | 00:56 adj (+08 13 sec) | 00:13 adj (+00 sec) | 00:18 adj (+05 sec) | 00:07 adj (+02 sec) | 00:05 adj (+01 sec) | 00:14 adj (+02 sec) |
| Last2 | 00:51 adj (+00 06 sec) | 00:14 adj (+02 sec) | 00:12 adj (+01 sec) | 00:05 adj (+00 sec) | 00:04 adj (+03 sec) | 00:13 adj (+01 sec) |
| Last3 | 00:67 adj (+09 02 sec) | 00:13 adj (+01 sec) | 00:19 adj (+06 sec) | 00:05 adj (+00 sec) | 00:04 adj (+05 sec) | 00:12 178 (+09 sec) |
| Last4 | 00:47 adj (+26 02 sec) | 00:12 adj (+01 sec) | 00:12 adj (+01 sec) | 00:05 adj (+08 sec) | 00:04 adj (+03 sec) | 00:12 188 (+09 sec) |
| Last5 | 00:48 adj (+26 21 sec) | 00:13 adj (+01 sec) | 00:11 adj (+08 sec) | 00:24 adj | 00:24 sec | 00:12 888 (+26 157) |
| Last(Debt) | 00:45 adj | 00:31 adj (+98 sec) | 00:32 adj | 00:04 adj (+29 sec) | 00:04 adj (+89 sec) | 00:12 adj (+96 sec) |
| Last7 | 00:45 adj (+26 36 sec) | 00:12 adj (+98 sec) | 00:11 adj (+98 sec) | 00:05 adj (+88 sec) | 00:84 adj (+95 sec) | 00:12 +12 |
| Last8 | 00:46 127 (-26 37 sec) | 00:17 adj. | 00:11 adj (-98 37%) | 99.89 ± 7% ( +99.sec) | 99.84 mm( +99. sec) | 99.13 mm( +91. sec) |
| Best Theoretical Time | 99.64 mm | 99.31 mm | 99.33 mm | 99.84 mm | 99.64 mm | 99.12 m |
| Best Rolling Time | 99.64 ms | 99.31 ms | 99.33 mm | 99.84 mm | 99.64 mm | 99.12 mm |
Spilt View (Cumula ve)
Split = the cumula ve me from start point to a split Point
| Lap | Time (Diff) | S-1 (Diff) | S-2 (Diff) | S-3 (Diff) | S-4 (Diff) | S-F (Diff) |
| Lap1 | 00:58 adj (+00:13 adj) | 00:13 adj (+02 adj) | 00:35 adj (+07 adj) | 00:37 adj (+08 adj) | 00:43 adj (+11 adj) | 00:58 adj (+12 adj) |
| Lap2 | 00:51 adj (+00:09 adj) | 00:14 adj (+02 adj) | 00:26 adj (+04 adj) | 00:32 adj (+04 adj) | 00:37 adj (+05 adj) | 00:51 adj (+05 adj) |
| Lap3 | 00:47 adj (+00:02 adj) | 00:13 adj (+01 adj) | 00:26 adj (+02 adj) | 00:38 adj (+02 adj) | 00:35 adj (+02 adj) | 00:47 adj (+02 adj) |
| Lap4 | 00:47 adj (+00:02 adj) | 00:12 adj (+01 adj) | 00:24 adj (+02 adj) | 00:36 adj (+02 adj) | 00:35 adj (+02 adj) | 00:47 adj (+02 adj) |
| Lap5 | 00:48 adj (+00:01 adj) | 00:12 adj (+01 adj) | 00:24 adj (+01 adj) | 00:29 adj (+01 adj) | 00:33 adj (+01 adj) | 00:46 adj (+01 adj) |
| Lap6(adj) | 00:45 adj | 00:11 adj (+06 adj) | 00:22 adj | 00:27 adj | 00:32 adj | 00:45 adj |
| Lap7 | 00:45 adj (+00:99 adj) | 00:12 adj (+06 adj) | 00:23 adj (+06 adj) | 00:28 adj (-30 adj) | 00:33 adj (-30 adj) | 00:45 adj (+03 adj) |
| Lap8 | 00:46 adj (+00:91 adj) | 00:11 adj | 00:23 adj (+96 adj) | 00:26 adj (-56 adj) | 00:32 adj (-51 adj) | 00:46 adj (+91 adj) |
Point Current Speed View
| Lap | Time (Diff) | 1 (Diff) | 2 (Diff) | 3 (Diff) | 4 (Diff) | F (Diff) |
| Last | 00:58 am (+00.13 am) | 50.64 km/h (-13.13) | 24.54 km/h (-8.7%) | 32.07 km/h (-15.43) | 45.14 km/h (-11.46) | 13.82 km/h (-8.52) |
| Last2 | 00:51 am (+00.06 am) | 47.45 km/h (-4.12) | 31.74 km/h (-2.1%) | 41.18 km/h (-6.32) | 53.85 km/h (-2.75) | 14.60 km/h (-7.74) |
| Last3 | 00:47 am (+00.03 am) | 42.59 km/h (-5.98) | 33.22 km/h (-5.67) | 43.03 km/h (-4.47) | 54.52 km/h (-2.08) | 20.31 km/h (-2.03) |
| Last4 | 00:47 am (+00.02 am) | 43.67 km/h (-6.10) | 31.68 km/h (-2.20) | 43.04 km/h (-4.46) | 53.36 km/h (-3.24) | 22.34 km/h |
| Last5 | 00:46 am (+00.01 am) | 49.75 km/h (-2.83) | 33.89 km/h | 47.50 km/h | 56.60 km/h | 18.08 km/h (-4.26) |
| Last(Rest) | 00:45 am | 49.57 km/h | 33.37 km/h (-0.52) | 47.02 km/h (-0.88) | 56.56 km/h (-1.04) | 10.99 km/h (-5.48) |
| Last7 | 00:45 am (+00.00 am+) | 48.49 km/h (-1.88) | 33.64 km/h (-0.41) | 48.81 km/h (-1.89) | 54.31 km/h (-2.29) | 20.83 km/h (-1.51) |
| Last9 | 00:45 am (+00.01 am) | 49.36 km/h (-0.21) | 30.46 km/h (-3.43) | 45.11 km/h (-1.39) | 54.33 km/h (-2.37) | 19.52 km/h (-2.92) |
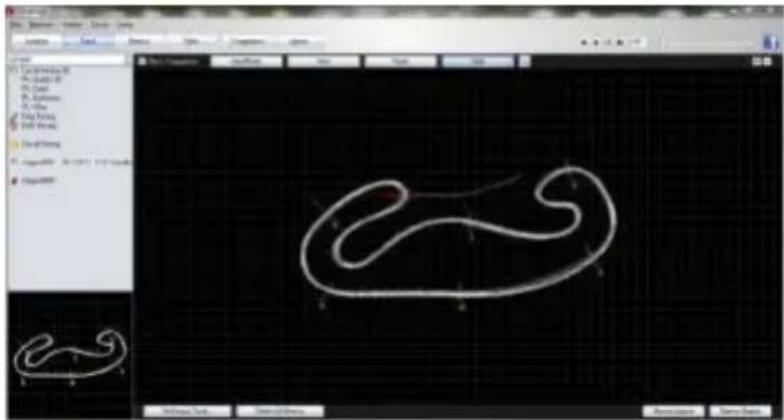
K-4. Track-Map view
- In Track page, you can select three laps for showing and compare the data. You can also compare the laps by line graph with Distance-base or Time-base.
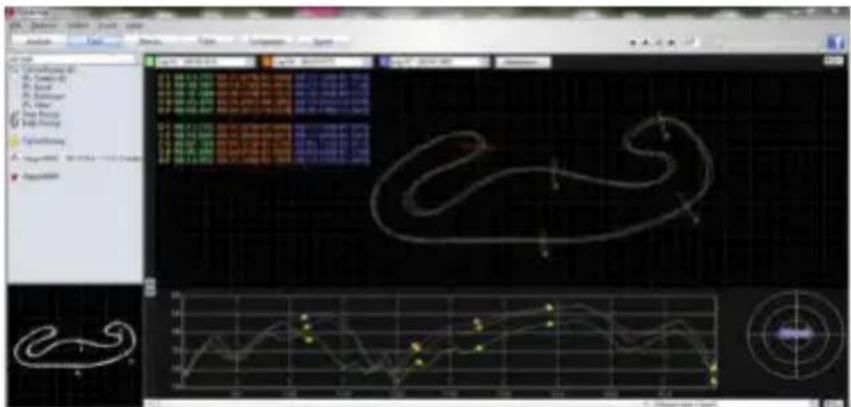
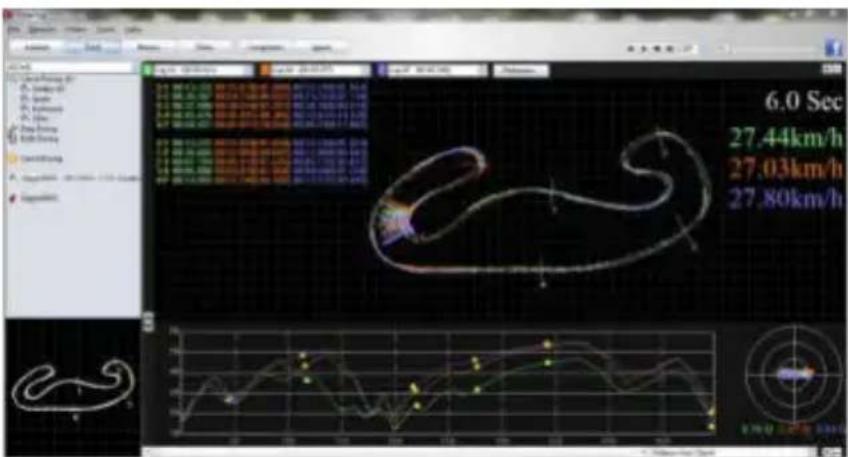
- QRacing will display the vehicle's braking zone with a thick line and accelera on zone with a thinner line; which can be bene cial for driver to improve their lap mes. Click the play bu on on the status bar. It can replay the selected 3 laps and display the racing informa on by me and speed simultaneously.
- In the Menu > Tool > Preference or click on the Preference bu on on Track page will allow user to select their preference se ng when playing the track.

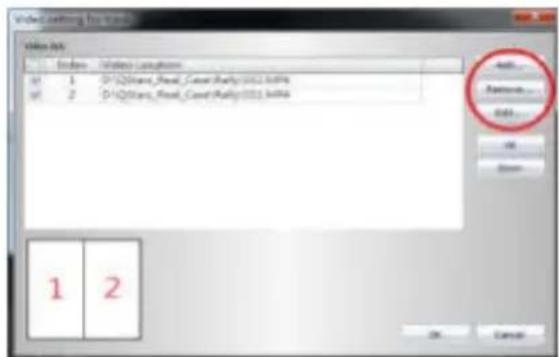
K-6. Video
- QRacing can sync the racing video with the track. In Video page; click on the button "Set video for track..." the video setting dialog will pop out. You can add, remove and edit the videos.
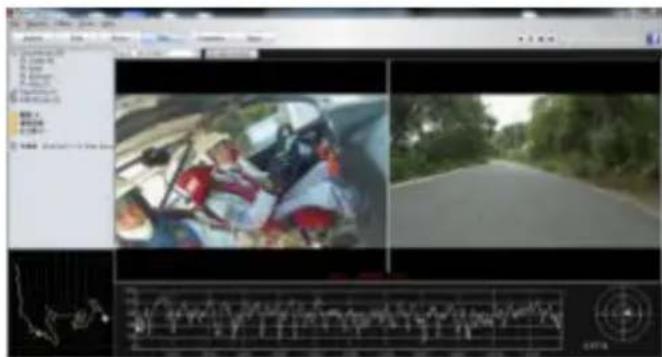
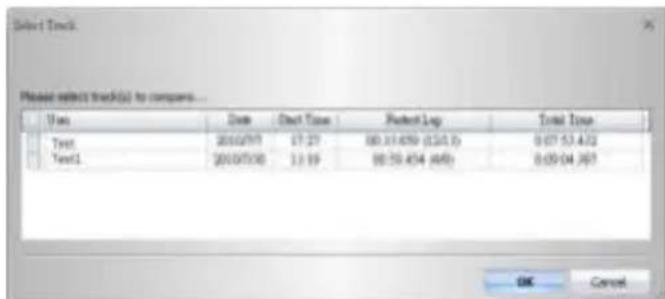
K-7. Compare with other users
- Click on "Comparison", you can choose tracks belong to the same racing type (Circuit, Drag or Rally racing) and compare with other user's track.
*For detailed instruc ons, please refer to QRacing's user manual a ached with the so ware.
*Or visit our online tutorial video at: h p://www.qstarz.com/Products/So ware%20Products/QRacingVideo.html
-QTravel™ supports Geo-tagging func on with build-in Google map, you can easily import and export you can also share routes from your favorite trips with friends and family.
■ L. Register your product
Register your Qstarz product to get the latest news, so ware update, event, and product informa on. http://www.qstarz.com/reg.php
■ M. Update the So ware:
Please always go to Qstarz download page to check if there is any latest so ware update. h p://www.qstarz.com/download.php
■ N. Frequently asked Ques ons
1. Why is my unit not receiving a satellite signal?
- Although the LT-Q6000 will normally pick up a satellite signal within 1-2 minutes a er powering on the device, it may take longer me if you are in an area with more geographic obstruc ons.
Please make sure you have placed it in a posi on that has clear view to the sky and not obstructed by metal objects.
2. My LT-Q6000 crashed. How can I make get it back to normal status?
-You can nd the Reset bu on beside USB connector, a small hole which can be pressed by pen p or pin to reset your device. (Hard reset will not erase the memory data.)
3. I have set up my Start/Finish line, but it does not show any lap mes?
-Please make sure the unit is mounted ver cally straight as possible to your car's windshield and you have driven a complete lap around passed the Start/Finish line.
4. How long is the ba ery life of LT-Q6000?
Depending on how you are using the unit, your average ba ery life will be 8 \~10 hours. Using the device in a poor environment, having the backlight always on will decrease ba ery life.
LT-Q6000 極速計時器 使用手冊
A. 盒裝標準配備:
natural_image
Black and red handheld device with digital display and control buttons (no visible text or symbols)(1)
(2)
(3)
(4)

(5)
(6)

(7)
(8)選配
主要功能:
natural_image
Line drawing of a handheld electronic device with labeled ports and a screen (no readable text or symbols)natural_image
Two black rectangular electronic devices on a plain white surface, one with a small inset showing internal components (no visible text or symbols)● LT-Q6000 盒裝內含有螺絲和車架轉接板
(2)
natural_image
Close-up of a hand holding a gray electronic device with a red arrow pointing to a black hole (no text or symbols visible)natural_image
Close-up of a black plastic electrical contactor with a red arrow pointing to its side (no text or symbols visible)natural_image
Close-up of a car's front-mounted camera module with a red directional arrow indicating left side (no visible text or symbols)natural_image
Top-down view of a car front-mounted sensor or camera mounted on the hood, with red arrows and a red circle highlighting the component (no text or symbols visible)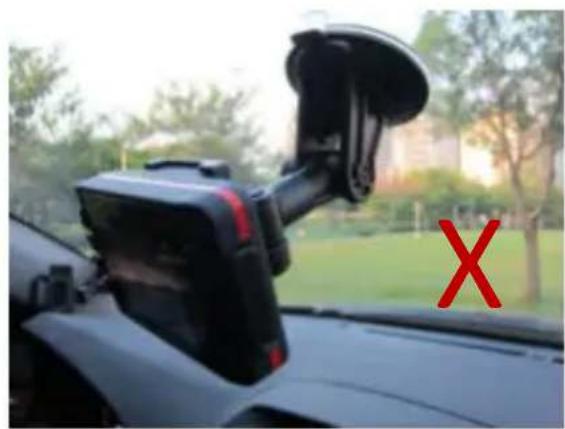
natural_image
Top view of a black navigation device mounted on a car, with a red 'X' symbol visible on the side (no text or symbols on the device itself)I. 開始使用
natural_image
Camera image showing a red object on a black background with concentric circles and a 0.2G label (no readable text or symbols beyond measurement indicators)✨ 將裝置冷啟動:
| 區段檢視 (分段-到-分段) | |||||||
| 審議 | 時間(推廣) | S-1(差異) | 1-2(差異) | 2-3(差異) | 3-4(差異) | 4-5(差異) | 5-F(差異) |
| LapT | 02:09:288 (+00.01 mm) | 00:10:144 (+00.186) | 00:12:418 (+00.126) | 00:29:247 | 00:17:126 | 00:32:483 (+01.696) | 00:27:641 (+01.676) |
| LapT(承認) | 02:07:441 | 00:11:402 (+00.636) | 00:12:604 (+00.114) | 00:29:388 (+00.138) | 00:17:899 (+00.161) | 00:31:381 | 00:26,186 (190,176) |
| LapT | 02:10:443 (+00.03 mm) | 00:13:564 | 00:11:899 | 00:32:164 (+02.896) | 00:17:752 (+00.664) | 00:32:483 (+01.311) | 00:25:971 |
| 最往理論時間 | 02:06:211 | 00:10:564 | 00:11:899 | 00:29:247 | 00:17:126 | 50:31:381 | 00:25:971 |
| 最往連絡時間 | 02:06:889 | 00:13:564 | 00:11:899 | 00:29:365 | 00:17:899 | 50:31:381 | 50:26,156 |
分段檢視 (起始-到-分段)
K-7. 與其他車手比較
http://www.qstarz.com/Products/Software%20Products/QRacingVideo.html
http://www.qstarz.com/reg.php
■ M.軟體更新
http://www.qstarz.com/download.php
N. 疑難排解


- LT-Q6000 GPS Lap Timer COLOR User's Guide
- ■ A. LT-Q6000 Package Contents:
- Main func ons:
- Speci ca ons:
- ■ B. Appearance
- ■ C. Icon de ni on
- ■ D. LED Signal de ni on
- ■ E. Safety No ce
- ■ F. Charging LT-Q6000
- ■ G. Device bracket moun ng
- ■ H. Moun ng the LT-Q6000 in the vehicle
- ■ I. Ge ng Started
- I-1. Drag Race mode
- ☆ Run me screen for Drag race (tested with speed 0-60mph).
- 1-2. Circuit Race mode
- How to setup Start/Finish and Split lines?
- Lap Time screen for Circuit Race mode: (tested with Lap with Splits)
- I-3. GPS logger mode
- 1-4. History Mode
- 1-5. Applica on Mode
- ✨ Speedometer:
- G-Meter:
- GPS Cold Start:
- 1-6. Set ng mode
- ■ J. Upgrading Firmware
- ■ K. Data Download and Data Analysis
- K-1. Import data from Q6000.
- K-2. Edit Beacon
- K-3. Analyze Data
- Sector View
- Spilt View (Cumula ve)
- Point Current Speed View
- K-4. Track-Map view
- K-6. Video
- K-7. Compare with other users
- ■ L. Register your product
- ■ M. Update the So ware:
- ■ N. Frequently asked Ques ons
- Why is my unit not receiving a satellite signal?
- My LT-Q6000 crashed. How can I make get it back to normal status?
- I have set up my Start/Finish line, but it does not show any lap mes?
- How long is the ba ery life of LT-Q6000?
- LT-Q6000 極速計時器 使用手冊
- 盒裝標準配備:
- 主要功能:
- 開始使用
- ✨ 將裝置冷啟動:
- 分段檢視 (起始-到-分段)
- K-7. 與其他車手比較
- ■ M.軟體更新
- 疑難排解
Brand : Qstarz
Model : LT-Q6000
Category : Gps