
KEW 2510 - Multimeter Kyoritsu - Free user manual and instructions
Find the device manual for free KEW 2510 Kyoritsu in PDF.


| Product Type | Power Quality Analyzer / Multimeter |
| Model | KEW 2510 |
| Brand | Kyoritsu |
| Measurement Functions | Voltage, Current, Power, Harmonics (via software) |
| Voltage Range | 600 V (selectable) |
| Current Range | 500 A / 50 A (depending on sensor) |
| CT Ratio | 1.00 / 1.00 (configurable) |
| VT Ratio | 1.00 (configurable) |
| DC Range | 1.000 V / 1.000 A (configurable) |
| Data Storage | Internal memory (192,000 records) |
| Communication | Bluetooth |
| Software | KEW Windows for KEW2510 (Windows 10/8.1, 32/64-bit) |
| System Requirements (PC) | CPU: Pentium 4 1.6 GHz, RAM: 1 GB, HDD: 1 GB, Display: 1024x768 |
| Dimensions (approx.) | 200 x 100 x 50 mm |
| Weight (approx.) | 0.5 kg |
| Power Supply | Batteries (type not specified) |
| Operating Temperature | 0°C to 40°C (assumed) |
| Storage Temperature | -20°C to 60°C (assumed) |
| Humidity | 80% RH max (assumed) |
| Safety Rating | CAT III 600V (assumed for multimeter) |
| Accessories Included | Voltage test leads, current clamp (model 8125?), software CD, USB/Bluetooth dongle? |
| Maintenance | Keep clean, replace batteries when low |
| Repairability | Contact Kyoritsu service center |
Frequently Asked Questions - KEW 2510 Kyoritsu
User questions about KEW 2510 Kyoritsu
0 question about this device. Answer the ones you know or ask your own.
Ask a new question about this device
Download the instructions for your Multimeter in PDF format for free! Find your manual KEW 2510 - Kyoritsu and take your electronic device back in hand. On this page are published all the documents necessary for the use of your device. KEW 2510 by Kyoritsu.
USER MANUAL KEW 2510 Kyoritsu
KEW Windows for KEW2510 Quick Start Guide
| Starting KEW Windows for KEW2510 | |
| Next page | |
| Data Analysis | |
| Analysis of data stored in KEW2510 | P.6 |
| Analysis of downloaded data | P.9 |
| Data analysis | P.11 |
| Data save to PC | |
| Data import from KEW2510 internal memory to PC | P.18 |
| KEW2510 Setting | |
| Showing KEW2510 setting window on PC | P.21 |
| Setting data readout from KEW2510 | P.22 |
| Reflecting edited setting data on KEW2510 | P.23 |
| Other Functions | |
| Saving data in CSV format | P.24 |
| Saving data in Excel format | P.25 |
| Environmental Setting | |
| Changing application settings | P.28 |
| Trouble-shooting | |
| P.29 | |
Starting KEW Windows for KEW2510
Environmental requirements
System requirements:
| CPU | : Pentium 4 1.6GHz or more |
| Memory | : 1Gbyte or more (for Windows 10 / 8.1) |
| OS | : Windows 10 / 8.1(32bit/64bit) |
| HDD | : 1Gbyte or more(including size of .NET Framework redistributable package)(Hard-disk space required) |
| CD or DVD drive | : For installing applications |
| Display | : 1024 x 768 dots, 65536 colors or more |
| Version of Excel : Microsoft Excel 2007 or later | |
Recommended system:
Pentium processor of 2GHz or more
Starting KEW Windows for KEW2510
Without connecting PC and KEW2510:
Can perform:
[Data Analysis (P.6)]
STEP 1
Start "KEW Windows".
1 Double-click the short-cut icon on the desktop, or click "Start" -> "All programs" -> "KEW" -> "KEW WindowsV2".

STEP 2
Start "KEW Windows for KEW2510".
1 Click [Start] button for KEW2510.

Starting KEW Windows for KEW2510
With PC and KEW2510 connected:
Can perform the followings:
[Data Analysis (P.6)]
[Saving data to PC (P.38)]
[KEW2510 Setting (P.46)]
STEP 1
Connect KEW2510 and PC.
1 Power on KEW2510.

2 Connect KEW2510 and PC via Bluetooth.
STEP 2
Start "KEW Windows".
1 Double-click the short-cut icon on the desktop, or click "Start" -> "All programs" -> "KEW" -> "KEW WindowsV2".

Starting KEW Windows for KEW2510
STEP 3
Start "KEW Windows for KEW2510".
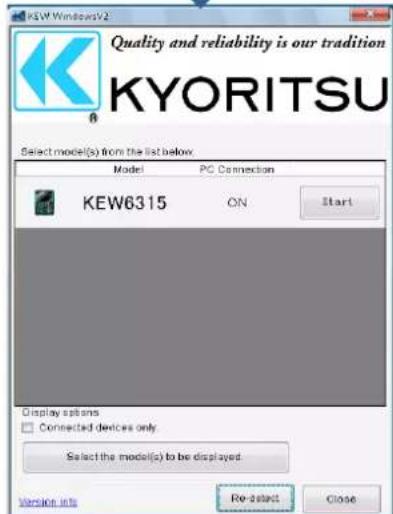
1 Click [Start] button for KEW2510.
![Model PC Connection KEW6315 ON Start Windows for KEW6315 - [Data management card] Environmental setting(S) Date Download 10 card Model Start downloads Folder - Start Model Sitting/Exchange Environment Save the counted data in PC 1070842 Analysis of accounted data 09:00 19 KB 2013/10/17 14:45:33 09:00 8 KB 2013/10/17 14:45:32 09:01 702 KB 2013/09/18 15:10:19 09:02 5,706 KB 2013/09/18 01:12:19 09:03 1,281,186 KB 2014/09/18 14:24:24 09:17 5,128,811 KB 2014/09/18 14:17:33 09:49 589 KB 2013/09/18 03:30:42 09:50 4 KB 2013/09/18 03:35:34 09:51 142 KB 2013/09/18 03:38:48 09:52 148 KB 2013/09/18 03:39:56 09:53 158 KB 2013/09/18 03:40:15 09:54 162 KB 2013/09/18 03:40:42 09:55 156 KB 2013/09/18 03:45:14 09:56 521 KB 2013/09/18 03:45:48 09:57 167 KB 2013/09/18 12:14:29 09:58 142 KB 2013/09/18 10:20:48 09:59 158 KB 2013/09/18 10:24:28 09:76 204 KB 2014/09/18 14:27:43](/content/2026/05/956510/images/bacad4301903a88f24b59edcf4eb8a06d8bf40a13182f07964ddb1103df45a25.jpg)
If "ON" is not displayed for the connected status although KEW2510 is being connected to PC, click [Re-detect].
If "ON" is still not displayed, see "Trouble-shooting".
Data Analysis
Analysis of data stored in KEW2510
STEP 1
Open the Menu
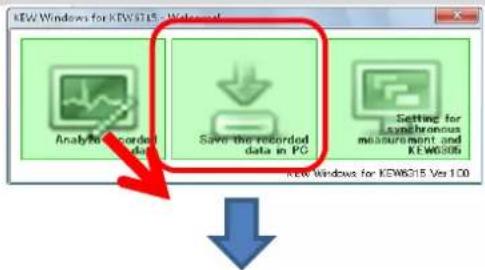
1 Click [Open menu] icon on "Data management viewer".
![KEW Windows for KEW6315 - [Data management viewer] File: Environmental setting (i) Open menu Detect KEW6315 Setting/Synchronous measurement Save the recorded data in PC 10780567 Analysis of measured data Set SD For M S0.0 S0.0 S0.0 S0.0 S0.0 S0.0 KEW Windows for KEW6315 - Welcome! Analyze recorded data Save the recorded data in PC Setting for synchronous measurement and KEW6315 KEW Windows for KEW6315 Ver1.00](/content/2026/05/956510/images/1c05d6c1fb82a4a1c284169fbd5a0f12321faafd52c12d071216f45c8655cd27.jpg)
STEP 2
Show the list of data stored in PC
1 Click [Analyze recorded data] icon.
![KELV Windows for KELV125 - [Data management window] File(F) - Environmental setting(G) Open name - Dact KELV125 Set time: Postcode data session Save the recorded data in GB Analysis of amounted data By serial to By 10 number By wire's system List of data in PC Data Analysis: Direct service: Hardware & Cloud Audio: Sound File Insert data: Data Download Data Serial no. 10 ns Wiring system Size Updated GND 1780637 00-001 SP50A 4.000 00 2014/9/20 13:33:38 GND 1780637 00-001 SP50-1 1,241.146 00 2013/12/29 9:48:44 GND 00169912 00-001 SP50-1 164.371 00 2013/12/24 9:22:29 GND 1780637 00-001 SP50-1 1,123.811 00 2013/12/24 9:14:19 GND 1780637 00-001 SP50-1 368 00 2013/12/24 14:54:58 GND 00169912 00-001 SP50-1A 58 00 2013/12/24 14:55:58 GND 00169912 00-001 SP50-1A 6 00 2013/12/24 14:55:58 GND 00169912 00-001 SP50-1A 78 00 2013/12/24 14:55:58 V Range : 1.00V Counting Interval : 5 sec. VT range : 1.00 Demand Target : 148.6x8 Sensor : $125/8/325/8/325 /8/325 Demand Rate : 36 sec. X Range : 66.4 /66.4 / A / 66.4 / A /66.4 / A / 66.4 / A /66.4 / A / 66.4 / A /66.4 / A / 66.4 / A /66.4 / A / 66.4 / A /66.4 / A / 66.4 / A /66.4 / A / $6 ST range : 1,097/7,975/7,975/7,975 FWD Data : 716-7 DC range : 1,097/7,975/7,975/7,975 RED START : 2918/9/7/7_39:13:51 Maided Y : 1.00V NET END OF : 2318/9/7/7_39:17:38 Frequency : MHz CD sec. : 98-461 Firing : EPSPSA DP Data : DNP2003.439, '2355' Transient : I NM Data : DNP2003.439, '1920' Intermittent : I GST Data : BNTNQOJ .A## , '188' Size : I NAV Data : NAVDQOJ .A## , '1'##, '6'# Seed : I YAL Data : YALDQOJ .A## , '2562' Starch current : I File ID : EOS Serial No. : 17876937 Version : E,39,78 Bluetooth address : 98.89.37_47_37_32 Analyze the data downloaded into PC. Site / Office](/content/2026/05/956510/images/9f86992918c4a1794abe287fb95df2ba3b933f854f6f0648a2d0bd0af8d92219.jpg)
Data Analysis
STEP 3
View the data stored in KEW2510
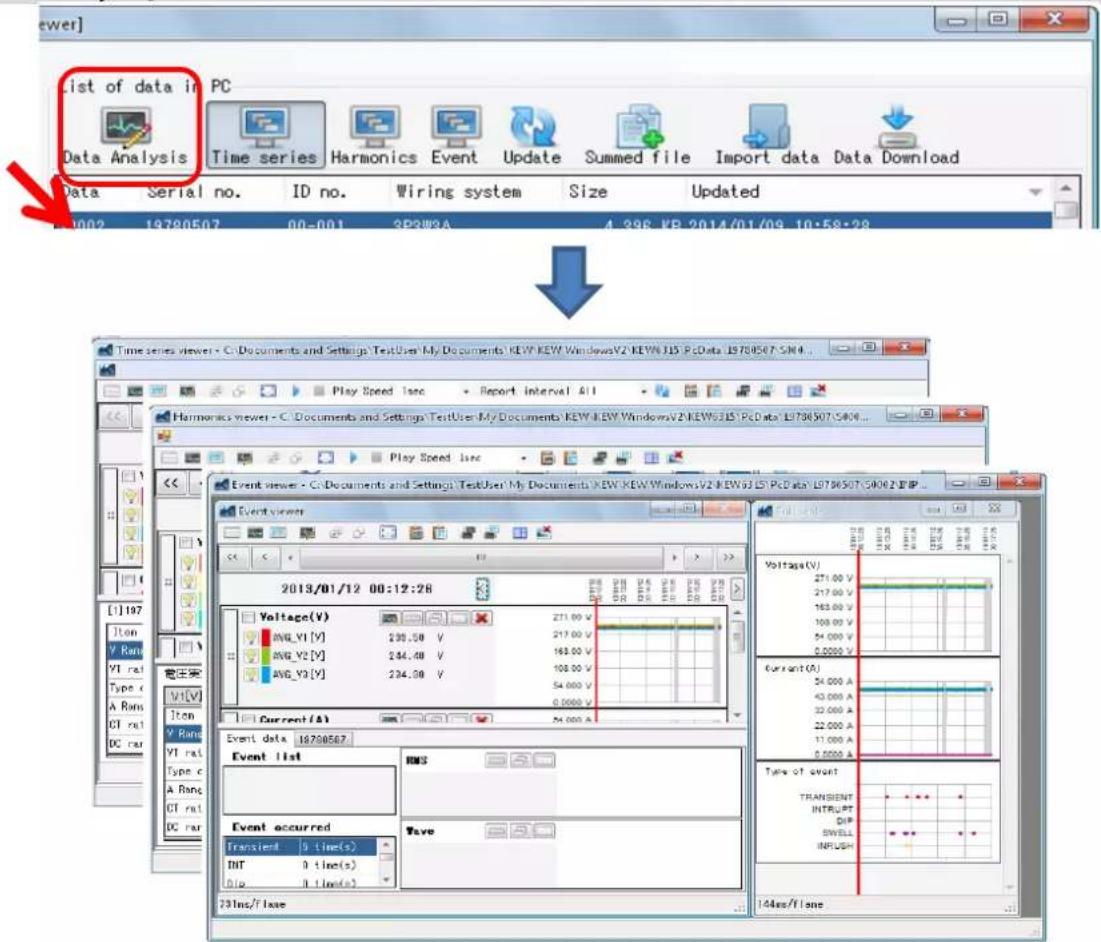
1 Click [Data Download] icon.

2 Click on the serial no of KEW2510 for analysis, and then click [Start downloading] icon.

3 Data Analysis Window will appear when data download to PC completes.


![Time series viewer - C:\Documents and Settings\TestUser\My Documents\KEW\KEW\Windows\V2\KEW\6315\rPData\L9736507-5004 Play Speed 1sec Report interval All Harmonics viewer - C:\Documents and Settings\TestUser\My Documents\KEW\KEW\Windows\V2\KEW\6315\rPData\L9736507-5004 Play Speed 1sec Event viewer - C:\Documents and Settings\TestUser\My Documents\KEW\KEW\Windows\V2\KEW\6315\rPData\L9736507-5004 2013/01/12 00:12:28 Voltage(V) AVG_V1 [V] 236.50 V 271.00 V AVG_V2 [V] 244.40 V 217.00 V AVG_V3 [V] 284.50 V 163.00 V Current(A) Event data 19/30/07 Event list RMS Event occurred Transient 5 times) INT 0 time(s) Bip 0 time(s) Wave 73Ins/Flase Voltage(V) 271.00 V 217.00 V 163.00 V 108.00 V 54.000 V 0.0000 V Current(A) 54.000 A 43.000 A 32.000 A 22.000 A 11.000 A 0.0000 A Type of event TRANSIENT INTERRUPT DIP SWELL IMPLUSH 144ms/Flase](/content/2026/05/956510/images/e1d67da2f0b0c8073ad229ac1efe52db4a997d0ed0cd55e7fa9c2159b2d542f1.jpg)
Data Analysis
Analysis of downloaded data
STEP 1
Open the Menu
1 Click [Open menu] icon on "Data management viewer".
![KEW Windows for KEW6315 - [Data management viewer] File Edit Environmental setting (0) Open menu Select KEW6315 Setting/Synchronous measurement Save the recorded data in PC 19700507 Analysis of measured data KEW Windows for KEW6315 - Welcome! Analyze recorded data Save the recorded data in PC Setting for synchronous measurement and KEW6315 KEW Windows for KEW6315 Ver1.00](/content/2026/05/956510/images/0891ad2726f1006fee6389e7cd15b9a1961feca1778f2cd3fe771c5fcd6df6d1.jpg)
STEP 2
Show the list of data stored in PC
1 Click [Analyze recorded data] icon.


Data Analysis
2 Select the items to be analyzed.
![Management viewer] List of data in PC Data Analysis Time series Harmonics Event EN50160 Update Summed file Import data Data Download Data Serial no ID no Wiring system Size Updated 2014 06 05 10 20 36-S000 00-001 1P2W-1 5 KB 2014/06/05 10:20:39](/content/2026/05/956510/images/21dd6d6e05245fab0bed2c6a11e6a6c2819f386e79cbbd35a416b002703b3b84.jpg)
3 Click [Data Analysis] icon.
Data Analysis
Data Analysis
STEP 1
Displayed items
![Time series viewer - C:\Documents and Settings\TestUser\My Documents\KEW\KEW\Windows\V2\KEW6315\PcData\L9780507\S000... Play Speed 1sec Report interval All 1/12/2013 00:12:26 1/12/2013 1/12/2013 1/12/2013 1/12/2013 1/12/2013 1/12/2013 00:12:26 00:13:26 00:14:26 00:15:26 00:16:26 00:17:26 Voltage(V) [1]AVG_V1 239.50 V [1]AVG_V2 244.40 V [1]AVG_V3 234.90 V [1]MAX_V1 241.30 V 272.00 V 218.00 V 163.00 V 109.00 V 54.000 V 0.0000 V Current(A) 54.000 A [1]19780507 Item Value V Range 600V VT ratio 1.00 Type of sensor 8125/8125/... A Range 500.0 A/50... CT ratio 1.00/1.00/... DC range 1.000 V/1.... DATE TIME ELAPSED TIME AVG_V1[V] MAX_V1[V] MIN_V1[V] AVG_V2[V] 1/12/2013 00:12:26 00:00:00:05 239.50 241.30 238.80 244.40 1/12/2013 00:12:31 00:00:00:10 239.30 241.10 237.80 245.00 1/12/2013 00:12:36 00:00:00:15 238.80 240.00 237.70 245.00 1/12/2013 00:12:41 00:00:00:20 239.60 241.90 238.20 244.90 1/12/2013 00:12:46 00:00:00:25 238.70 240.20 237.80 245.40 1/12/2013 00:12:51 00:00:00:30 239.90 241.40 237.70 245.50](/content/2026/05/956510/images/5cbc0b2da96eb2a80a01e422b9d9663d219abfe7fa7e9613819dd09e58249f0d.jpg)
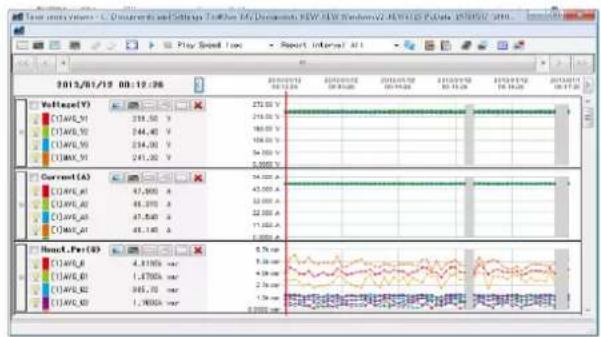
1 Data recorded time
Time when the oldest data recorded Time when the latest data recorded

Time for the cursor location. Time axis on the graph
2 Time Series Graph
Graph Name

line
| Time | Voltage (V) | |------|-------------| | 0 | 239.50 | | 1 | 244.40 | | 2 | 234.90 | | 3 | 241.30 |Parameter Measured value axis
Values where cursor is located.
Data Analysis
3 Time Series List
Serial no of KEW2510
[1]19780507
| Item | Value |
| V Range | 600V |
| VT ratio | 1.00 |
| Type of sensor | 8125/8125/... |
| A Range | 500.0 A/50... |
| CT ratio | 1.00/1.00/... |
| DC range | 1.000 V/1.... |
Measurement info Time Series List
STEP 2
![Functions 1 2 3 4 5 6 7 8 9 Time series viewer - E:\Documents and Settings\TestUser\My Documents\KEY\KEW\Windows\V2\KEW63L5\PcData\19780507\S000... Play Speed 1sec Report interval All 1/12/2013 00:12:26 Voltage(V) [1]AVG_V1 239.50 V [1]AVG_V2 244.40 V [1]AVG_V3 234.90 V [1]MAX_V1 241.30 V Current(A) 1/12/2013 00:12:26 1/12/2013 00:12:26 1/12/2013 00:12:26 1/12/2013 00:12:26 1/12/2013 00:12:26 1/12/2013 00:12:26 1/12/V1 [V] 272.00 V 218.00 V 163.00 V 108.00 V 54.000 V 0.0000 V 54.000 A 1/12/2013 00:12:26 1/12/2013 00:12:26 1/12/2013 00:12:26 1/12/2013 00:12:26 1/12/2013 00:12:26 AVG_V1 [V] MAX_V1 [V] MIN_V1 [V] AVG_V2 [V] M VT ratio 1.00 Type of sensor 8125/8125/... A Range 500.0 A/50... CT ratio 1.00/1.00/... DC range 1.000 V/1.... 12 [1]19780507](/content/2026/05/956510/images/5a17a660f9d1954d0f665675b2f1396548a5d7da7ca976de33752b34c343690f.jpg)
Data Analysis
1 Changing the display layout.
To display graph and list on one screen at the same time: Split the screen in two sections and display Time Series graph in the upper area and list data in the lower area.

To display graph only
Time Series graphs are arranged and displayed on one screen.
To display list only
Show the list data on one screen.

Data Analysis
2 Displaying graph in full-scale
To display the selected graphs in full-scale. All data recorded in the specific period can be displayed on graphs.
![Time series viewer - C:\Documents and Settings\TestUser\My Documents\KEY KEY Windows\V2 KEY\4315 P\Data 19704567-53642 Play Speed 100 Report Interval 1/12/2013 00:12:26 Voltage(V) [1]AVG_V1 203.50 V 218.00 V [1]AVG_V2 244.40 V 163.00 V [1]AVG_V3 284.90 V 109.00 V [1]MAX_V1 241.30 V 54.000 V Current(A) [1]19760567 Value V Range 800V VT ratio 1.00 Type of sensor 8125/8125/... A Range 500.0 A/50... VT ratio 1.00/1.00/... DATE TIME ELAPSED TIME AVG 1/12/2013 09:12:26 ¥00:00:00:85 1/12/2013 09:12:31 ¥00:00:00:10 1/12/2013 09:12:36 ¥00:00:00:15 1/12/2013 09:12:41 ¥00:00:00:20 Voltage(V) 272.00 V 218.00 V 163.00 V 109.00 V 54.000 V 0.000 V Current(A) 54.000 A 43.000 A 32.000 A 22.000 A 11.000 A 0.000 A Reset, Power(Ω) 6.7kvar 5.3kvar 4.0kvar 2.7kvar 1.3kvar 0.000 var Area.For(S) 50.00kVA 70ms/Hz](/content/2026/05/956510/images/1ff78cf0022d3d98ba57ed78c6f94ab2c19a37d8f99847c6171f03c9b7fbf062.jpg)
*Depending on the size of the recorded data, it may take a long time to create full-scale data.
3 Copying to clipboard
To copy graph: Copy all the displayed Time Series graphs to the clipboard as an image.
To copy list: Copy the selected list data to the clipboard with headers for each item as tab-delimited text data.
4 Printing
To print graph: Print all the displayed Time Series graphs.
To print list: Print the lists of the specified time period.

5 Arranging sub-graphs
To arrange the displayed sub-graphs: Tidy up the displayed Time Series viewers and sub graphs.

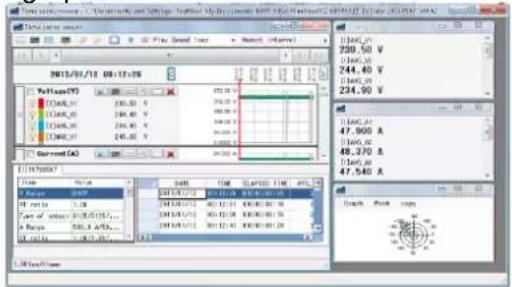
6 Saving files
To save CSV files Save the currently displayed data in CSV format.
To save Excel files Save the currently displayed data in Excel format.
8 Changing the graph display format
To change the color of parameter temporally:
![Voltage(¥) [1] AVG_V1 [1] AVG_V2 [1] AVG_V3 [1] MAX_V1](/content/2026/05/956510/images/1de5e82b44b7cc62f40596f8a07b2ddd4ca32744ec7aa27c287bc160a89ca0e5.jpg)
Click the colored boxes for each parameter to show the dialog box for color setting.

9 Moving cursor
![1/12/2013 00:12:26 Voltage(V) [1]AVG_Y1 235.90 V [1]AVG_Y2 244.46 V [1]AVG_Y3 284.90 V [1]NVG_Y1 241.90 V 272.00 V 318.00 V 165.00 V 109.00 V 54.00 V 0.0000 V 5/12/2013 00:12:26 5/12/2013 00:13:26 5/12/2013 00:14:26 5/12/2013 00:15:26 5/12/2013 00:16:26 5/12/2013 00:17:26 Move the cursor by one interval back and forth.](/content/2026/05/956510/images/8dfd0da55ed1f513a7f1f39c1b0b40760fbc8f86fb3a8856737f264c5b199f95.jpg)
Data Analysis
10 Changing the graph display area

bar
| Date | Value ($) | |---|---| | 1/12/2013 00:00:26 | 272.00 | | 1/12/2013 00:15:28 | 316.00 | | 1/12/2013 00:14:26 | 183.00 | | 1/12/2013 00:19:26 | 109.00 | | 1/12/2013 00:19:26 | 54.00 | | 1/12/2013 00:17:26 | 0.000 | | 1/12/2014 00:17:26 | 1 |Enlarge the time axis
(Shorten the period to be displayed.)

Click and drag the tick to right.
Shorten the time axis
(Expand the period to be displayed.)

Click and drag the tick to left.
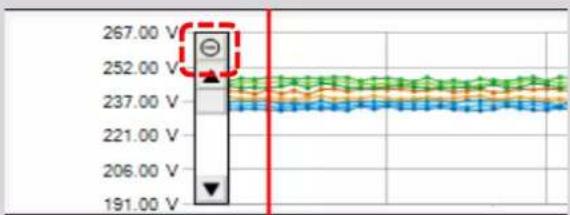
Enlarge the measured value axis
Click and drag the tick to down or up.

line
| Voltage (V) | |-------------| | 27.00 | | 218.00 | | 163.00 | | 109.00 | | 54.00 | | 0.0000 |* The yellow area will be enlarged.
Restore the enlarged axis to the original scale.
line
| Voltage (V) | Current (V) | |-------------|-------------| | 267.00 | - | | 252.00 | - | | 237.00 | - | | 221.00 | - | | 206.00 | - | | 191.00 | - |Data save to PC
Data import from KEW2510 internal memory to PC
STEP 1
Open the Menu
1 Click [Open menu] icon on "Data management viewer".
![KEW Windows for KEW6315 - [Data management server] ENESC - Environmental setting (I) Open menu Detect KEW6315 Set Line/Synchronous measurement Save the recorded data in PC 19780507 Analysis of measured data KEW Windows for KEW6315 - Welcome! Analyze recorded data Save the recorded data in PC Setting for synchronous measurement and KEW6305 KEW Windows for KEW6315 Ver100](/content/2026/05/956510/images/da398871c9ac7a2b82c51b1cca27b1785ae8beb5dce12bf4be3eb0b12b1d8dc4.jpg)
STEP 2
Show the list of data stored in the internal memory.
1 Click [KEW2510 Info] icon.

Data save to PC
STEP 3
Save the recorded data to PC.
1 Select the data you want to save to PC, and click [Start downloading].

2 Name the file and click [Save].

Showing KEW2510 setting window on PC
STEP 1
Open the Menu
1 Click [Open menu] icon on "Data management viewer".
![KEW Windows for KEW63.15 - [Data management viewer] File Edit Environmental setting(0) Open menu Detect KEW63.15 Setting/Synchronous measurement! Save the recorded data in PC 19780607 Analysis of measured data KEW Windows for KEW63.15 - Welcome! Analyze recorded data Save the recorded data in PC 給付 for synchronous measurement and KEW6308 KEW Windows for KEW63.15 Ver 100](/content/2026/05/956510/images/be5737cc13f4d318c7baff108b2708003cb44c87778ce3f86901bf17b93a4c76.jpg)
STEP 2
Show the KEW2510 settings.
1 Click [KEW2510 Info] icon.

![EBIT (Windows for: drive13) - [Data management system] File(E): Environmental settings(S) Open name Detect EBIT25 Set up/ synchronized measurement Save the recorded data in PC Details of measured data Start measurement Stop measurement Start monitoring List of setting files Create new details Basic set up (EBIT25_014_01_09_10_07) Measurement set Recording Others Basic set (EBIT25_014_01_09_10_07) Starting system (SPB2) - Diagram V Range: 0.00V ST ratio: 1.00 Drive: 0.155 A Range: 0.01x ST ratio: 1.00 PC Ranges: 1,800 Y - Neutral: 100 Frequency: 0.01x Setting new Updated EBIT25_2012_EI_01_09_07_rms 17/7/2014 1:30:14 PM EBIT25_2012_EI_01_09_07_rms 17/7/2014 1:30:14 PM EBIT25_2012_EI_01_09_07_rms 17/7/2014 1:30:14 PM Notes settings for synchronous measurement, shortening and Instrumenting Using Blankets or USB communication. File / EBITes](/content/2026/05/956510/images/9a6561ed61ca4f5f6dc792609e6eaa09126ecc18c7225f28fe2cd3a8a8ab8f38.jpg)
Setting data readout from KEW2510
STEP 1
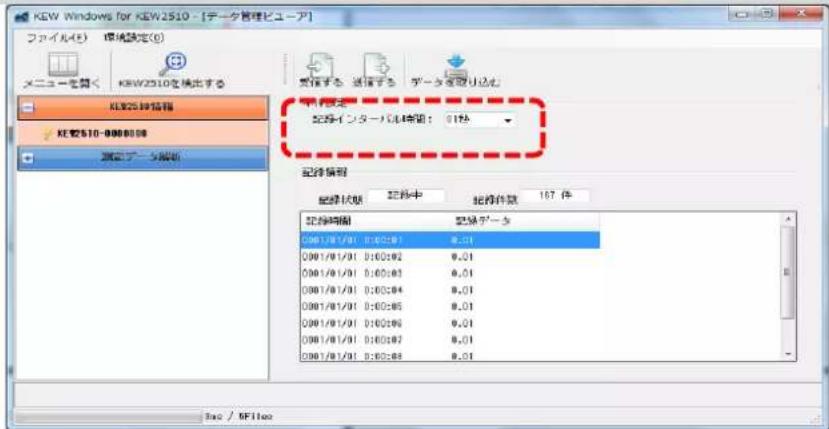
Readout the Setting data from KEW2510.
1 Select the serial no. of target KEW2510, and click [Receive] icon.

2 Setting data will be displayed.
Reflecting edited setting data on KEW2510
STEP 1
Edit setting data of KEW2510.
1 Select the serial no. of target KEW2510, and click [Receive] icon.
![F20 Windows for network (F20) - Data table generation File12 - Environmental settings(S) Open name: Detect E20103 Test file/Combination announcement Test file, generated data, on PS Analysis of measured data Start consensus Stop consensus Start monitoring List of setting files Balance Sheet Reset E20103 Test setting Data set to: [E20103_2014_0] 68.35.48.00 Basic settings Measurement set: Recording Other Data set: 1.00 Size: 1.00 A space DSS DSS ratio DC space Maximal Y Frequency 1.000 V 100 MHz OK OK OK OK OK OK OK OK OK OK OK OK OK OK OK OK OK OK OK OK OK OK OK OK OK OK OK OK OK OK OK OK OK OK OK OK OK OK OK OK OK OK OK OK OK OK OK OK OK OK Ok Ok Ok Ok Ok Ok Ok Ok Ok Ok Ok Ok Ok Ok Ok Ok Ok Ok Ok Ok Ok Ok Ok Ok Ok Ok Ok Ok Ok Ok Ok Ok Ok Ok Ok Ok Ok Ok Ok Ok Ok Ok Ok Ok Ok Ok Ok Ok Ok Ok](/content/2026/05/956510/images/a6dedc023556c064ff16feb7223a4009e4c7c1526b554d433dc2a5e77d3a52a4.jpg)
STEP 2
Reflect the edited setting to KEW2510.
1 Edit settings, and then click [Send] icon.
![E2W Wireless/EB2WJ5 - [Data measurement (vsc)] File(E) Environmental setting(S) Open name DetectEB2WJ5 Setting/Synchronous measurement Save the recorded data in PC Analysis of measurement data Start measurement Stop measurement Start monitoring List of settings files Create new Delete Basic setting [EM2018_2018_01_09_10_08_09] Basic setting Measurement set Recording Others Frame select: 3F7A2 Clearer Y Range: 100V Yt ratio: 1.00 ZAR(1,20A) AM213.Ash Change: 0.15 A Range: 100A Yt ratio: 1.00 DC Range: 1,600 V Normal Y: 100 Frequency: 50Hz Edit new: AM213 EB2WJ5_2018_01_09_10_08_09.exe / 17/2018 1:40:14 PM EB2WJ5_2018_01_09_10_08_09.exe / 17/2018 1:40:14 PM EB2WJ5_2018_01_09_10_08_09.exe / 17/2018 0:26:14 PM Notes settings for synchronous measurement, monitoring and instrument using Bluetooth or USB classification. Other / OFFlist](/content/2026/05/956510/images/40a407a801c7666bf13532189ea68a693bb7496db36710ab06af63e314b01b57.jpg)
Other Functions
Saving data in CSV format
STEP 1
Opening Time series viewer window
1 Open Time series viewer window.

line
| 时间 | 电压 (mA) | | ---------- | --------- | | 00:00 | 600.00 | | 12:00 | 480.00 |2 Click [Save as CSV] button.
![時系列ピューワ - C:\Users\TestUser\Documents\KEW\KEW WindowsV2\KEW2510\PcData\No00000000.KEW - [時... 000000:00:01 000000:00:01 000000:00:01 000000:00:21 000000:00:41 000000:01:01 000000:01:21 mA [1]mA 600.00m mA 800.00m mA 720.00m mA 640.00m mA 560.00m mA 480.00m mA 400.00m mA KEW2510-000000 項目名 項目値 モデル名 KEW2510 シリアル番号 KEW2510-000000 記録インタ... 01 記録件数 192000 本体のモデル名 経過時間 計測値 000 00: 1 1 1 000 00: 1 1 1 1 1 1 2 2 2 3 3 3 4 4 4 5 5 5 6 6 6 7 7 7 8 8 8 9 9 9 10 11 11 11 12 12 12 13 13 13 14 14 14 15 15 15 16 16 16 17 17 17 18 18 18 19 19 19 20 20 20 21 21 21 22 22 22 23 23 23 24 24 24 25 25 25 26 26 26 27 27 27 28 28 28 29 29 29 30 30 30 31 31 31 32 32 32 33 33 33 34 34 34 35 35 35 36 36 36 37 37 37 38 38 38 39 39 39 40 40 40 41 41 41 42 42 42 43 43 43 44 44 44 45 45 45 46 46 46 47 47 47 48 48 48 49 49 49 50 50 51.5M M M M KEW2510-000000](/content/2026/05/956510/images/eeb32e89f6ad2c6704bae4c7c21d7fbb2e5e538c7ad0c09ea9256e2ffef683f5.jpg)
Other Functions
Saving data in CSV format
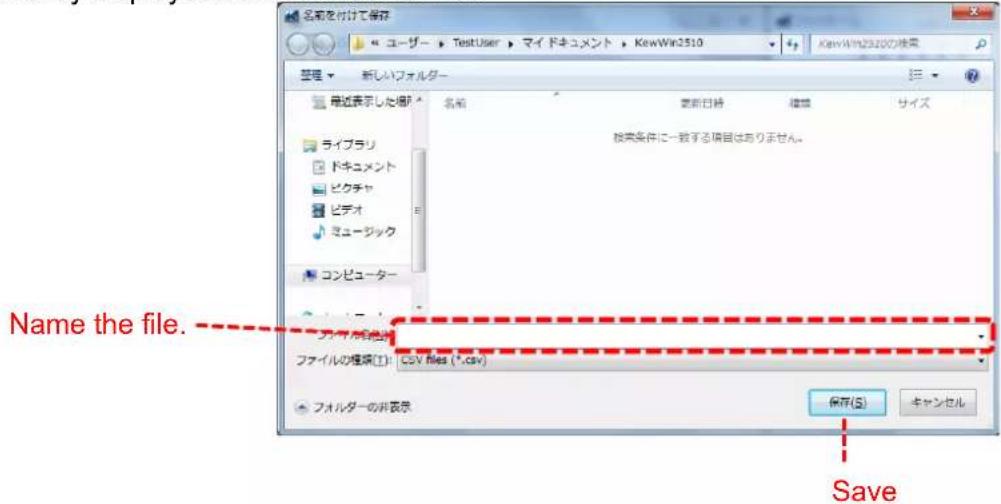
3 Name the file, and click [Save].
4 Click [Yes] on confirmation window.
Other Functions
Saving data in Excel format
STEP 1
Opening Time series viewer window
1 Open Time series viewer window.

line
| 时间 | 电压 (mA) | | :--- | :--- | | 000000:00:01 | 600.00 | | 000000:00:21 | 720.00 | | 000000:00:41 | 640.00 | | 000000:01:01 | 560.00 | | 000000:01:21 | 480.00 | | 未标注 | 未标注 |2 Click [Save as Excel] button.
![Kyoritsu KEW 2510 - Click [Save as Excel] button. - 1](/content/2026/05/956510/images/03573181a92b0ea16eeb33ff68e168888b7694bb6afa6385896edfa743eb581d.jpg)
Saving data in Excel format
3 Name the file, and click [Save].
![Kyoritsu KEW 2510 - Name the file, and click [Save]. - 1](/content/2026/05/956510/images/fd8edd1dd429e1e0100e1889650a4bbe468e75b4a046527b98d6b2c82152b964.jpg)
4 Click [Yes] on confirmation window.
![Kyoritsu KEW 2510 - Click [Yes] on confirmation window. - 1](/content/2026/05/956510/images/e1de5399c2f2f133bb07e4f2ccba38c39d29da4b40358b9e1213ecb3d7cfbe7a.jpg)
Environmental Setting
Changing the Operation setting for KEW Windows for KEW2510
STEP 1
Show the Environmental setting change screen.
1 Click [Environmental Setting] on Menu bar.

Change the Environmental settings.
1 Change the destination to save each data.
![Click on [Save to:] tab. フォルダ PC取込フォルダ C:\Users\TestUser\Documents\KEW\KEW Windows\2\KEW2510\PcData 参照 開く unloaded data: ...Destination to save the data downloaded from KEW2510 to PC Specify the folder to save the data. Open explorer and go to the folder to save the data.](/content/2026/05/956510/images/42e0ba1343cba78e5e1418f9d66cc56b007ec53cc24f68644719f27cb9316acc.jpg)
Trouble-shooting
* KEW2510 and PC are connected via Bluetooth, but KEW2510 is not displayed on the list of connected device.
Check if KEW2510 and your PC have been paired or not.
For the detailed pairing procedures, please refer to the manual of your Bluetooth device, or "Bluetooth pairing manual.pdf" which can be accessed from Start menu-> All programs -> KEW.
* KEW2510 and PC are connected via Bluetooth, but communication fails.
If communication such as data download and instrument settings fails, while connecting them via Bluetooth, power off KEW2510 and then power on it again.
Then click "Detect KEW2510".
Confirm that the serial no. of the connected KEW2510 is displayed under "Data download".
* Downloading time
Downloading time will be longer when file size becomes bigger.
Bluetooth transfer rate : approx. 15 min. for transferring 192,000 files
- KEW Windows for KEW2510 Quick Start Guide
- Starting KEW Windows for KEW2510
- Environmental requirements
- Recommended system:
- Without connecting PC and KEW2510:
- Start "KEW Windows".
- Start "KEW Windows for KEW2510".
- With PC and KEW2510 connected:
- STEP 1
- Connect KEW2510 and PC.
- STEP 2
- STEP 3
- Data Analysis
- Analysis of data stored in KEW2510
- Open the Menu
- Show the list of data stored in PC
- View the data stored in KEW2510
- Analysis of downloaded data
- Select the items to be analyzed.
- Click [Data Analysis] icon.
- Data recorded time
- Time Series Graph
- Time Series List
- Changing the display layout.
- To display graph only
- To display list only
- Displaying graph in full-scale
- Copying to clipboard
- Printing
- Arranging sub-graphs
- Saving files
- Changing the graph display format
- Moving cursor
- Data save to PC
- Data import from KEW2510 internal memory to PC
- Show the list of data stored in the internal memory.
- Save the recorded data to PC.
- Showing KEW2510 setting window on PC
- Show the KEW2510 settings.
- Setting data readout from KEW2510
- Readout the Setting data from KEW2510.
- Reflecting edited setting data on KEW2510
- Edit setting data of KEW2510.
- Reflect the edited setting to KEW2510.
- Other Functions
- Saving data in CSV format
- Opening Time series viewer window
- Open Time series viewer window.
- Click [Save as CSV] button.
- Saving data in Excel format
- Click [Save as Excel] button.
- Name the file, and click [Save].
- Click [Yes] on confirmation window.
- Environmental Setting
- Trouble-shooting
Brand : Kyoritsu
Model : KEW 2510
Category : Multimeter