Studio 9 - Audio software CEDAR - Free user manual and instructions
Find the device manual for free Studio 9 CEDAR in PDF.


| Product Type | Audio Restoration Software |
| Brand | CEDAR |
| Model | Studio 9 |
| Version | 9 |
| Category | Audio Software |
| File Size (Estimated) | 500 MB |
| Supported Platforms | Windows, macOS |
| Key Features | Noise reduction, click removal, hum reduction, de-clipping, spectral editing |
| User Manual | PDF format, 96 pages |
| Manual Languages | English (other languages available on request) |
| Rating | 8.5 / 10 |
| Release Year (Estimated) | 2020 |
| License Type | Commercial |
Frequently Asked Questions - Studio 9 CEDAR
User questions about Studio 9 CEDAR
0 question about this device. Answer the ones you know or ask your own.
Ask a new question about this device
Download the instructions for your Audio software in PDF format for free! Find your manual Studio 9 - CEDAR and take your electronic device back in hand. On this page are published all the documents necessary for the use of your device. Studio 9 by CEDAR.
USER MANUAL Studio 9 CEDAR
CEDAR Studio 9 manual v2.01 - 30 May 2022
This page left blank.
Table Of Contents
Getting Started 5
Installing CEDAR Studio 9 – Mac....6
Installing CEDAR Studio 9 – PC....7
Adaptive Limiter 2....9
Adaptive Limiter 2....10
Adaptive Limiter 2 Tutorial....14
Adaptive Limiter 2 Quantisation....15
Adaptive Limiter 2 Time Adjuster....16
Auto Dehiss.... 17
Auto Dehiss....18
Auto Dehiss Time Adjuster 23
Debuzz 25
Introduction to Debuzz 26
Debuzz Tutorial 28
Declick 29
Declick....30
Declick Time Adjuster....31
Declip 2....33
Declip 2....34
Declip 2 Tutorial....36
Declip Time Adjuster....38
Decrackle 39
Decrackle 40
Decrackle Time Adjuster 41
DNS One 43
Introduction to DNS One....44
Using the standalone version of DNS One....45
DNS One Tutorials ....48
Suppressing traffic noise and other ambient sounds....49
Suppressing tape hiss....51
Suppressing excessive reverberation....52
DNS Two 53
DNS Two ....54
Dethump 59
Dethump 60
Manual declick.... 61
Manual Declick....62
Retouch 63
Introduction to Retouch....64
Getting started with Retouch....65
The Retouch Spectrogram....67
Examples of sounds that can be Retouched....70
Defining sounds to be processed (1) Manually....71
Defining sounds to be processed (2) Matching....74
Interpolate mode....76
Patch mode 81
Copy mode 83
Erase mode....85
Volume mode....87
Repair mode 88
Cleanse mode....89
Revert mode....90
Additional Information 91
Contact Information and Support....93
Licence and Limited Warranty....94
Getting Started
CEDAR Studio 9 incorporates many award-winning processes derived from the flagship CEDAR Cambridge™ system. These can process your audio in many desirable ways and are capable of correcting all manner of problems without damaging the desired audio or introducing unwanted side-effects and artefacts.
Unpacking and licensing
CEDAR Studio 9 is supplied electronically for Mac and PC hosts using an iLok, so no physical objects are necessary or supplied.
Licensing of CEDAR Studio 9 is achieved using the iLok licence manager. Please refer to your iLok documentation.
Assumed Knowledge
CEDAR Studio 9 conforms to the 64-bit AAX Native and 64-bit VST 2.4, VST 3 and AU plug-in formats. It is not compatible with 32-bit operating systems or hosts.
This manual assumes that you are fully conversant with your host computer, and that you know how to operate the host software onto which you're loading CEDAR Studio 9. It will refer to operations that are common to these products, but will not attempt to explain them.
Troubleshooting Non-CEDAR Components
If you encounter problems with your Macintosh®, OS X®, your PC, Microsoft Windows®, or any 3 ^rd party host system, please refer to the relevant manuals or contact the dealer that supplied these to you. Unless appointed independently as authorised dealers for the following products, CEDAR Audio's dealers will not attempt to provide technical support for:
• Macintosh computers
- Mac OS X
• PCs of any description
- Microsoft Windows
- 3^rd party host hardware
- 3^rd party host software
Installing CEDAR Studio 9 – Mac
■ Before proceeding, ensure that any older versions of the plug-in (if any) are archived and removed from the plug-in folder.
■ Double-click on the installer package:
■ Follow the instructions offered by the installer.
CEDARAudioLtd-CEDARStudio9.pkg
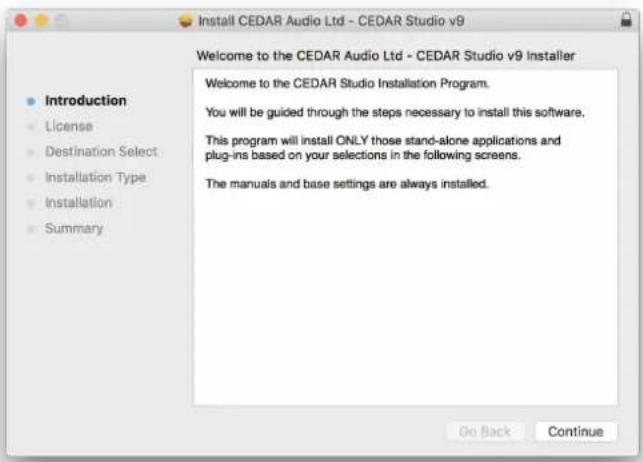
■ Ensure that you have sufficient space on your drive and then press Install to install the complete package or press the Customise button to select which format and/or selection of modules are loaded.
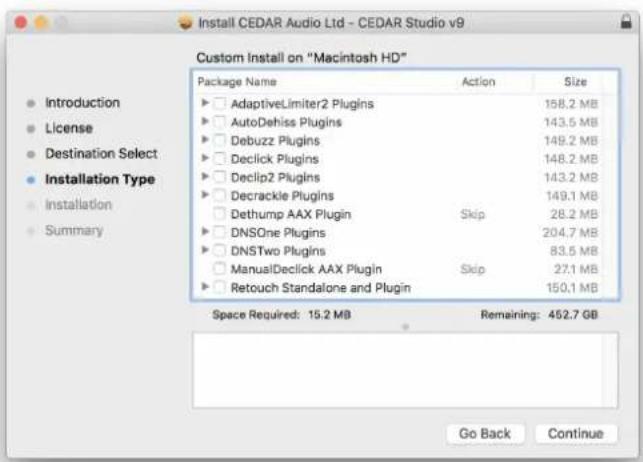
■ A message will appear to tell you that installation was completed successfully.
Installing CEDAR Studio 9 – PC
■ If necessary, uninstall any previous version of CEDAR Studio.
■ Double-click on the installer package: setup.exe
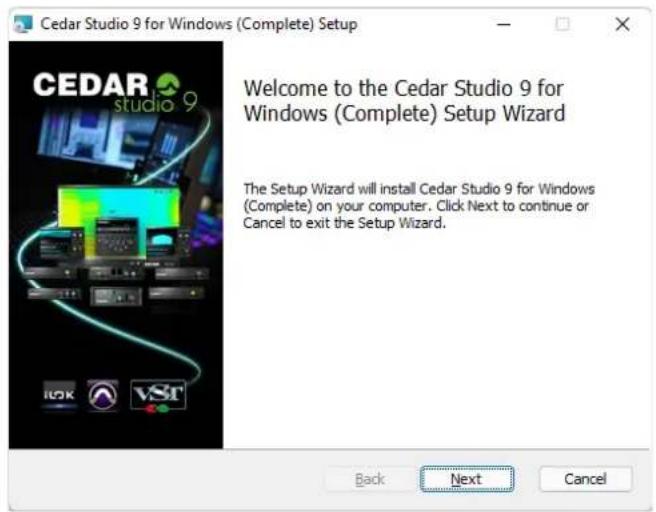
■ Follow the instructions offered by the installer.
■ Ensure that you have sufficient space on your drive and then select the processes you wish to install in the required plug-in format(s).
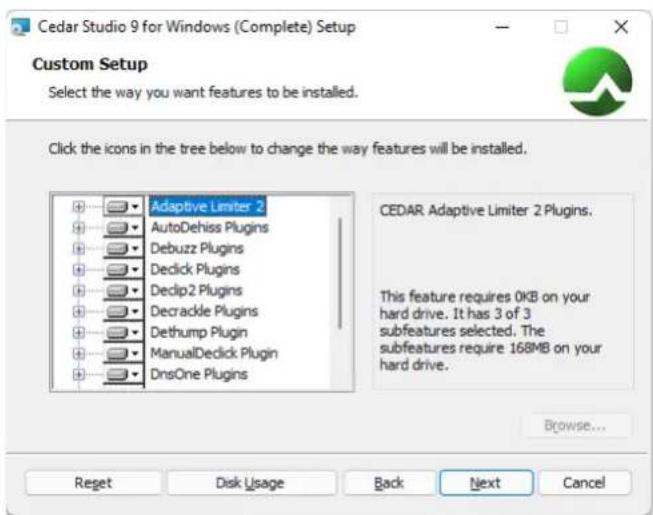
A message will appear to tell you that installation and, if selected, the driver update was completed successfully. Click on OK and Finish.
This page left blank.
Adaptive Limiter 2
Adaptive Limiter 2
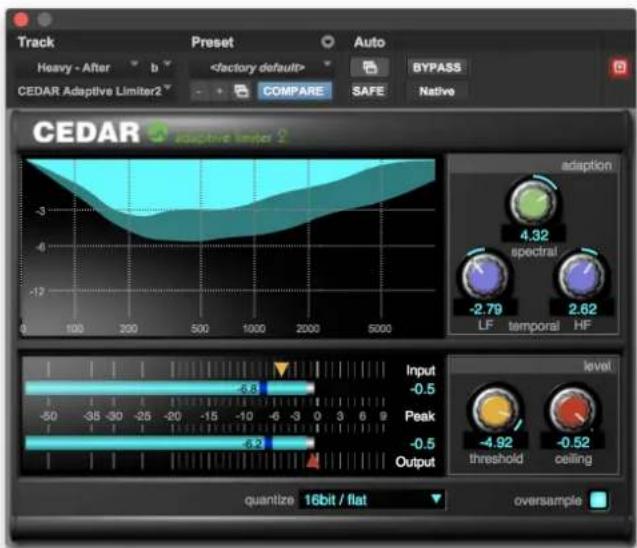
Dynamics processes such as limiters are used extensively in a creative fashion to obtain desirable characteristics within a given piece of audio.
Most commonly, they are used to increase the average signal level (with respect to the maximum signal level) and to set that maximum to the desired level - most usually 0dB or a little below. Capable of doing both simultaneously, CEDAR's Adaptive Limiter 2 therefore fulfills the functions of a very transparent loudness maximiser and a flexible peak limiter.
Why "Adaptive"?
A conventional limiter controls the loudness of a signal by observing the peak amplitude and suppressing this when it would otherwise exceed a user-defined threshold. A multi-band limiter does the same thing in discrete parts of the spectrum after dividing the signal into multiple bands.
Adaptive Limiter 2 does neither of these, instead using a unique algorithm that calculates a continuingly varying EQ profile that constrains the amplitude of the output while retaining the integrity of the input signal.
Controlling the attenuation profile
The attenuation profile is constrained in two ways: the rate at which it is permitted to vary in time, and the amount by which it is permitted to vary from frequency to frequency across the spectrum. The three Adaption parameters control this.
area
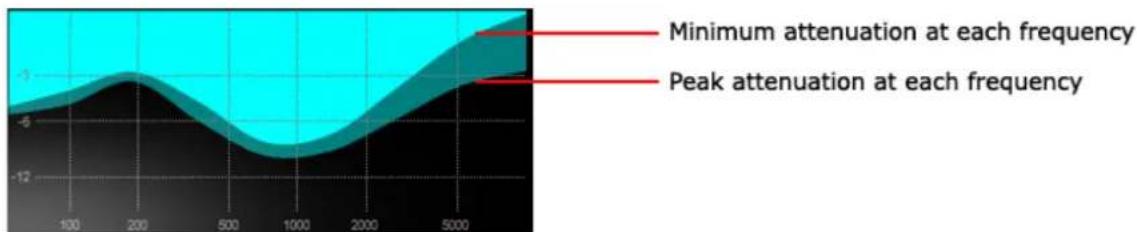
| Frequency Range | Minimum attenuation at each frequency | Peak attenuation at each frequency | | --------------- | ------------------------------------- | ---------------------------------- | | 0 | -6 | -6 | | 100 | -4 | -4 | | 200 | -2 | -2 | | 500 | -4 | -4 | | 1000 | -6 | -6 | | 2000 | -4 | -4 | | 5000 | -2 | -2 | | >5000 | 3 | 3 |The action of the Adaptive Limiter is shown by the two lines in the display.
- The upper line (the boundary between the cyan and the turquoise regions) shows the minimum attenuation at each frequency within a small temporal window.
- The lower line (the boundary between the turquoise and the black regions) shows the peak attenuation at each frequency within a small temporal window.
The lines may develop more 'bumps' as the Spectral value increases.
The distance between the lines increases as the Temporal values increase.
The table below explains the responses obtained at the upper and lower extremes of these controls. A wide variety of useful and unique responses may be obtained between these extremes.
| Spectral = low | Spectral = high | |
| TemporalLF & HF= low | The response is maximally constrained in both time and frequency.The attenuation will be close to flat across all frequencies and it will vary relatively slowly. The difference between the peak attenuation and the minimum attenuation at any given frequency will be small.This is similar to the action of a single-band limiter with a slow release.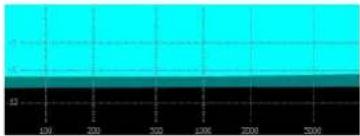 | The response is minimally constrained in frequency but maximally constrained in time.The attenuation is allowed to vary considerably across the spectrum, but will vary relatively slowly in time. The difference between the peak and minimum attenuations at any given frequency will be small.This is similar to the action of a multi-band limiter with a slow release.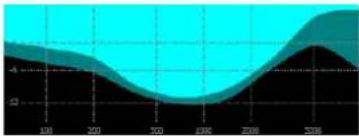 |
| TemporalLF & HF= high | The response is maximally constrained in frequency but minimally constrained in time.The peak attenuation will be close to flat across much of the spectrum but may vary quickly.The difference between the peak attenuation and the minimum attenuation at any given frequency will be greater than if the temporal response were slower.This response is similar to the action of a limiter with a frequency-dependent response.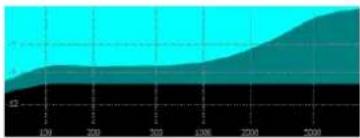 | The response is minimally constrained in both time and frequency.The attenuation profile will vary considerably across the spectrum and will be free to vary quickly in time. The difference between the peak attenuation and the minimum attenuation at any given frequency will be greater than if the temporal response were slower.These settings maximise the perceived loudness of the output but with an increased change in the character of the output.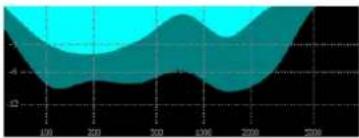 |
Dual temporal controls
Adaptive Limiter 2 offers two temporal controls that constrain the rate at which the attenuation profile changes. These specify the rate at very low frequencies (LF Temporal) and very high frequencies (HF Temporal). If the two are not the same, a suitable profile will be generated across the spectrum.
Note that:
- With the LF temporal control set to -10, the response of Adaptive Limiter 2 mimics the original CEDAR Adaptive Limiter.
• As you increase the LF temporal value, the process allows you to obtain greater perceived loudness, but at the possible expense of audible distortion at high values.
Controlling the gain
line
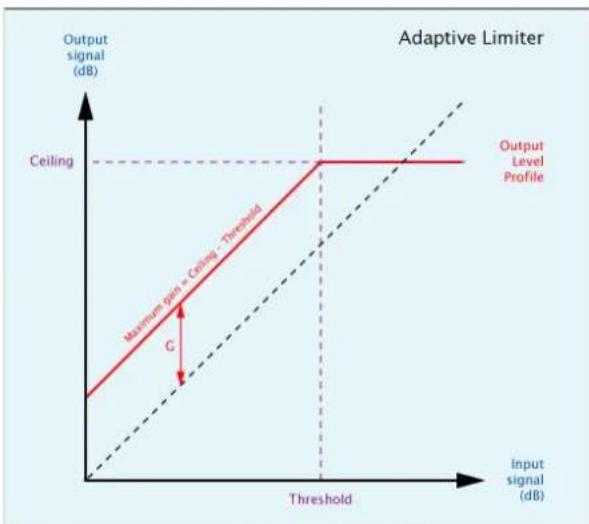
Adaptive Limiter | Input signal (dB) | Output Signal (dB) | | :--- | :--- | | 0 | 0 | | Threshold | C | | Maximum gain + Ceiling - Threshold | 0 | | Ceiling | 0 | | Output Level Profile | 0 | The chart plots a red line representing the output level profile against the input signal on the x-axis. The y-axis is labeled 'Output signal (dB)' and 'Ceiling'. The dashed diagonal line indicates the threshold of maximum gain.This above illustrates the relationship between the input signal level and the output signal level, and shows how this is affected by the Threshold and Ceiling controls. These can be defined as follows:
Threshold
The input signal level above which limiting occurs.
Ceiling
The maximum output signal level, which is the output level of any limited signal.
Oversampling
With Oversample ON, the incoming signal is oversampled and all subsequent calculations are carried out taking into account the inter-sample peaks.
Controls
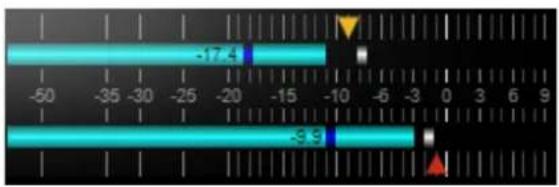
Level
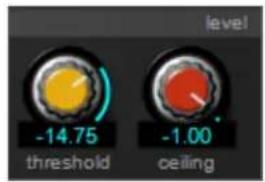
You can determine the values of the following parameters by adjusting the knobs or by clicking on and sliding the triangles in the meter display from side to side.
Threshold
Determines the input amplitude at which limiting is applied.
Ceiling
This sets the maximum level output by the limiter.
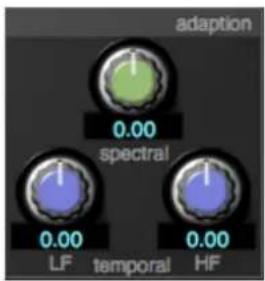
Adaption
Temporal
Determines the rate at which the profile is permitted to change at very low frequencies (LF) and very high frequencies (HF). If the two are not the same value, a suitable profile is generated across the spectrum, allowing you to obtain an even wider range of limiting effects.
Spectral
Determines the degree by which the profile can change from one frequency to the next. At its lowest setting, the action of the Adaptive Limiter approaches that of a single-band limiter. At its highest setting, it is free to calculate a complex attenuation profile.
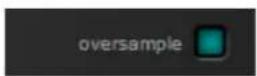
Oversample
Turn this on to take into account inter-sample peaks in the incoming signal.
Adaptive Limiter 2 Tutorial
Limiting or Maximising?
The peak level of a digital waveform determines the maximum amount by which you can amplify it before clipping occurs. However, many signals contain high peak levels of short duration, and these can restrict the RMS (i.e. average) level to a low figure. The ratio of peak level to RMS level is called the 'crest factor' of the waveform. Since, to a first approximation, it is the RMS level and not the peak level that determines how loud we perceive a sound to be, signals with high crest factors can sound disproportionately quiet. To overcome this, limiting can be used to reduce the crest factor and thus increase the apparent loudness of the signal without increasing the peak level.
Limiting the signal in this way often introduces distortions of its own, but Adaptive Limiter 2 is a sophisticated algorithm that can constrain the peak level to a user-defined limit while, at the same time, increasing the apparent loudness in an audibly transparent fashion such that no undesirable artefacts are heard. A limiter capable of doing this is also referred to as a 'loudness maximiser'.
Processing audio
Pass some audio through Adaptive Limiter 2.
Now set the Ceiling to 0dB. It is common to set the Ceiling (or Limit) of limiters to a little below 0dB to ensure that no clipping occurs, but when oversampling is switched on, Adaptive Limiter 2 is so accurate that you can safely set it to precisely 0dB if that is the maximum level desired.
Next, set the Threshold such that the level of the input signal is sometimes (but not always) higher than the Threshold. When this occurs, you will see the curve appear in the profile window, and limiting is being applied.
Decrease the Threshold. You will see increased activity in the profile window and the loudness of the signal will increase. This is because the difference between the Ceiling (in dBs) and the Threshold (in dBs) is the gain applied to any input signal lying below the Threshold. Any input signal above the Threshold will be limited.
Adaptive Limiter 2 Quantisation
We anticipated that you will often choose to use Adaptive Limiter 2 as the last process in your audio chain, so it allows you to quantise the audio output at a desired wordlength and offers sophisticated noise shaping capabilities.

Select the following options from the drop-down menus:
No re-quantisation applied
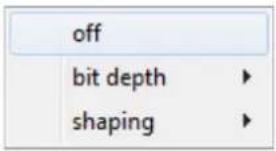
When OFF is selected, no re-quantisation is applied.
Word length (bit depth)
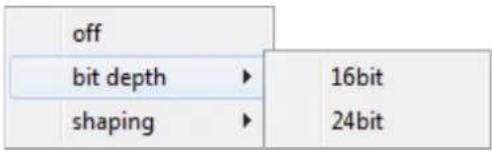
You may select the output wordlength to be either 16-bit or 24-bit.
Dithering and noise shaping are applied whenever OFF is not selected, even if the wordlength selected is the same as that of the input audio.
Shaping
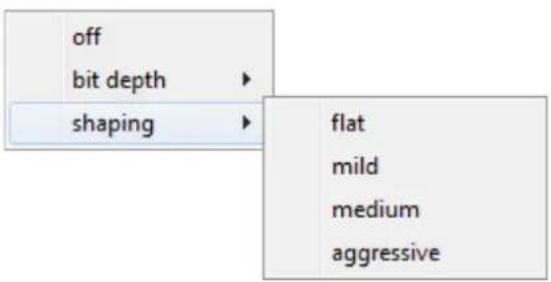
Audio may be dithered and, if desired, noise-shaped, by selecting one of the four options. Choose 'flat' for TPDF dithering, or one of the three forms of noise shaping as desired.
Adaptive Limiter 2 Time Adjuster
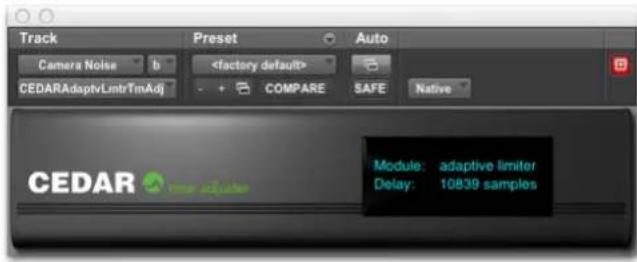
The plug-in delay compensation in some versions of Pro Tools is limited to a maximum of 4,095 samples. However, the propagation delay through Adaptive Limiter 2 is longer than this, which can lead to loss of synchronisation if one or more tracks are passing through the process, and others are not.
To correct this, insert the Adaptive Limiter 2 Time Adjuster as a plug-in on all tracks that are NOT being processed by Adaptive Limiter 2. This will insert a sample-accurate correct delay so that synchronisation is preserved.
Controls
There are no controls. The Adaptive Limiter 2 Time Adjuster detects the correct delay at any sample rate and applies this.
Auto Dehiss
Auto Dehiss
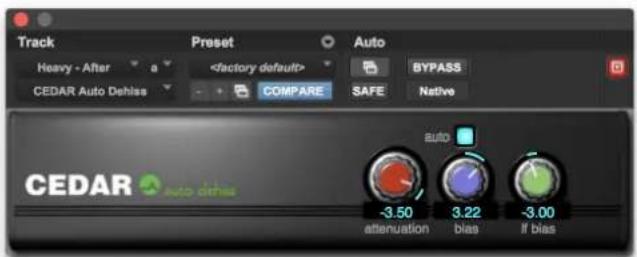
Auto Dehiss embodies an advanced algorithm that offers a unique Auto mode that enables the software to determine the noise content of the recording and remove this with minimal loss of high frequencies and without the introduction of unwanted artefacts. It offers two modes:
Auto
The process automatically determines the noise level contained within the signal.
Manual
The noise level is set by the user.
Auto Mode
There are three controls: Attenuation, Bias and LF bias.
Bias
The Bias control allows you to tune the automatic algorithm for different applications and tastes; for example a broadcaster may want a very clean, dry result, but for a CD remaster a more transparent sound (but with a little more residual noise) may be more appropriate. A positive Bias ensures that more noise is removed, but runs the risk of slight signal compression. A negative Bias may retain more ambience in the signal, but at a slightly increased risk of pumping.
Note: Bias is a multiplying factor that affects the noise level calculated during the course of the signal. It is not the same as the Threshold in Manual mode, which sets an absolute value for the noise content of the recording.
LF Bias (dB at 0Hz)
This provides fine control of the algorithm below 5kHz. It has no effect on higher frequencies. Use positive values for material that exhibits prominent low- and mid-frequency noise.
Examples of this may include 78rpm records and microgroove LPs. Use negative values when there is relatively little low- and mid-frequency noise, and the noise content is predominantly hissy.
Attenuation (dB)
This is the maximum amount of noise attenuation applied at any given frequency at any given moment. If the algorithm determines that the noise attenuation at any moment should be less than the attenuation that you select, the lesser figure will be applied.
Manual Mode
In Manual mode, the Bias control becomes inactive, and the Threshold control becomes active. The three controls are now:
Threshold
This allows you to determine the amount of noise contained within the signal. It operates across the entire signal spectrum. It is critical that this is set correctly, or undesirable side-effects may occur. If the Threshold is slightly too low, auto dehiss will not remove all the noise and may generate short noise bursts that sound a little like noise pumping. If it is far too low, it will be difficult to obtain any noise reduction. If the Threshold is too high, auto dehiss will treat some low-level signal as if it was noise and attenuate it. This may make the signal sound muffled.
LF Bias (dB at 0Hz)
This provides fine control of the algorithm below 5kHz. It has no effect on higher frequencies. Use positive values for material that exhibits prominent low- and mid-frequency noise.
Examples of this may include 78rpm records and microgroove LPs. Use negative values when there is relatively little low- and mid-frequency noise, and the noise content is predominantly hissy.
Attenuation (dB)
This is the maximum amount of noise attenuation applied at any given frequency at any given moment. If the algorithm determines that the noise attenuation at any moment should be less than the attenuation that you select, the lesser figure will be applied.
Tutorials
It is important that the audio presented to Auto Dehiss is free from clicks and crackle. This is because these degradations will interfere with the dehissing process and prevent you from reaching an optimal result. If necessary, you should pass the signal through the Declick and Decrackle modules before applying the auto dehisser.
Auto Mode
Ensure that the process is active. Now set the Attenuation to -40dB and the Bias and LF Bias to zero, and follow the instructions in sequence.
Bias
While the theoretical ideal value for the Bias in Auto mode is zero and it should in most cases be unnecessary to adjust it, there are occasions where you may wish to bias the operation toward identifying greater or lesser amounts of noise in the signal.
With the signal playing, leave the controls at the values selected above, and press the bypass button a few times to compare the untreated and treated material. Now increase the Bias so that Auto Dehiss errs on the side of identifying more noise in the signal. You will hear the amount of noise reduction increase, but possibly at the expense of making the wanted material sound a little muffled. Now decrease the Bias below zero, so that the dehisser identifies less noise, and compare. You will hear that the amount of noise reduction decreases, but with some audio you may find that the wanted signal benefits from increased ambience and 'air'. If necessary, find the best compromise for your material.
LF Bias
At this point, you may wish to modify the process to accommodate broadband noise with differing frequency characteristics. You do so by accentuating or suppressing the amount of noise identified at Low+Mid frequencies.
Switch the processing off, and listen to the source material. Does the noise appear to be present at all frequencies? If not, is it predominantly high frequency hiss or low frequency rumble? If the former, turn the processing on again, and reduce the LF Bias. This will reduce the amount of noise detected below 5kHz, and you should hear the Low+Mid frequency signal content 'open up', allowing you to increase the Bias without risk of damaging the desired signal at Low+Mid frequencies.
If the noise appears to be predominantly in the lower frequencies, you should increase the LF Bias to tell Auto Dehiss that there is more noise below 5kHz. This will increase noise suppression below 5kHz without increasing it at high frequencies, reducing the risk of dullness when removing large amount of noise.
Adjust the LF Bias to obtain a good balance between high- and low-frequency noise attenuation.
Attenuation
With the Bias and LF Bias set to suitable values, adjust the Attenuation to determine the amount of noise removed.
Decrease the amount of attenuation from -40.0 to 0.0. The processed signal will now be identical to the unprocessed signal because the Attenuation control is limiting the amount of noise removal to 0dB - i.e. there is no effect. Now increase the amount of Attenuation as defined by the material and your taste.
You may find that, if the Bias is too high, you can only increase the Attenuation by a few dBs before the signal starts to sound muffled. If the Bias is too low, you can have more Attenuation, but with reduced effect.
Iterating the Procedure
You may now wish to attempt to find a better value for the Bias. Having done this you may wish to modify the LF Bias and Attenuation values further. Fine-tuning these controls will lead to excellent noise removal with few or no side-effects. However, Auto Dehiss is not a magic wand, and it may not be possible to restore some badly degraded material beyond a certain point. Experience will enable you to judge whether you have removed as much noise as possible without unacceptable consequences.
Manual mode
Ensure that the process is active. Now set the Attenuation to -40dB and the Threshold and LF Bias to zero, and follow the instructions in sequence.
Threshold
Your first task will be to find the most appropriate setting for the Threshold. This will be the biggest influence on the quality of the processed signal. Starting with the Threshold at zero and the Attenuation at -40dB, increase the value of the Threshold.
At first, you will notice very little happening. Next, you enter a region in which there may be noise bursts and an artefact similar to noise pumping. Increase the Threshold further and these side effects will begin to disappear and, at some point determined by the nature of the signal, the noise will decrease rapidly. Because the Attenuation is set to maximum, you will in all likelihood now find the signal to be somewhat muffled. The optimal value of the Threshold is approximately the crossover point between the noise artefacts and the muffled sound.
LF Bias
At this point, you may wish to modify the process to accommodate broadband noise with differing frequency characteristics. You do so by accentuating or suppressing the amount of noise identified at Low+Mid frequencies.
Switch the processing off, and listen to the source material. Does the noise appear to be present at all frequencies? If not, is it predominantly high frequency hiss or low frequency rumble? If the former, turn the processing on again, and reduce the LF Bias. This will reduce the amount of noise detected below 5kHz, and you should hear the Low+Mid frequency signal content 'open up', allowing you to increase the Threshold without risk of damaging the desired signal at Low+Mid frequencies.
If the noise appears to be predominantly in the lower frequencies, you should increase the LF Bias to tell Auto Dehiss that there is more noise below 5kHz. This will increase noise suppression below 5kHz without increasing it at high frequencies, reducing the risk of dullness when removing large amount of noise.
Adjust the LF Bias to obtain a good balance between high- and low-frequency noise attenuation.
Attenuation
With the Threshold and LF Bias set to suitable values, adjust the Attenuation to determine the amount of noise removed.
Decrease the amount of attenuation from -40.0 to 0.0, at which point you will hear that the processed signal is identical to the unprocessed signal. This is because the Attenuation control is limiting the amount of noise removal to 0dB - i.e. there is no effect.
Now increase the amount of Attenuation as defined by the material and your taste. You may find that, if the Threshold is too high, you can only increase the Attenuation by a few dBs before the signal starts to sound muffled. If the Threshold is too low, you can have more Attenuation, but with reduced effect.
Iterating the Procedure
You may now wish to attempt to find a better value for the Threshold. Having done this you may wish to modify the LF Bias and Attenuation values. Fine-tuning these controls will lead to excellent noise removal with few or no side-effects. However, Auto Dehiss is not a magic wand, and it may not be possible to restore some badly degraded material beyond a certain point. Experience will enable you to judge whether you have removed as much noise as possible without unacceptable consequences.
Noise Reduction in an MS environment
Our research has shown that, with stereo material, it is sometime beneficial to perform noise reduction in MS mode. This means that, instead of adjusting the Threshold (or Bias), LF Bias and Attenuation values independently for the left and right channels, you adjust them for the monophonic content within the signal (M) and for the content that is only present in the left or right channels (S).
Please refer to your host system documentation to determine whether you are able to set up an MS environment within it.
Signals with a high Mid (M) noise component
If you perceive that the worst of the noise is coming from the centre of the stereo image, process the M channel more heavily that the S channel. You will find that you can apply a considerable amount of noise reduction in this way without affecting the perceived width or ambience of the wanted signal.
Signals with a high Side (S) noise component
Sometimes you will find that loud, wanted signals in the centre of the stereo image mask the noise, so that it is more noticeable at the sides. Reduce the Attenuation in the M channel and process the S channel more heavily. You will find that you can apply a considerable amount of noise reduction without affecting the wanted signal at the centre of the soundstage.
Emphasis and De-emphasis
You can create an EQ curve and its inverse to set up emphasis and de-emphasis curves that can benefit other processes.
Controls
 | ModeChoose whether to process in Auto or Manual mode. |
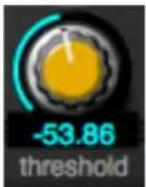 | Threshold (manual mode only)This tells Auto Dehiss how much noise is present in the signal. It is important that the Threshold is set correctly, or undesirable side-effects may occur.Threshold too low:The system will not remove all the noise and may generate an artefact from residual noise pulses let through by the process.Threshold too high:Auto Dehiss may treat some low-level signal as if it was noise and attenuate it. This results in a muffled signal. |
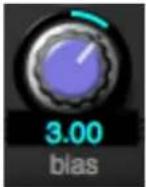 | Bias (auto mode only)Biases the operation of Auto Dehiss toward identifying greater or lesser amounts of noise in the signal. The theoretical ideal for any given signal is zero. |
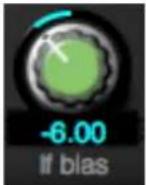 | LF BiasAllows you to accommodate broadband noise with differing frequency characteristics by accentuating or suppressing the amount of noise identified at Low+Mid frequencies.Reduce the LF Bias value to reduce the amount of noise detected below 5kHz.Increase the LF Bias value to increase the amount of noise detected below 5kHz. |
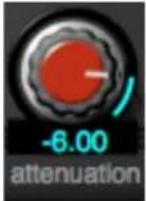 | AttenuationThis is the maximum amount of noise attenuation (in dB) applied at any given frequency at any given moment. If the algorithm determines that the noise attenuation at any moment should be less than the Attenuation that you select, the lesser figure will be applied. |
Auto Dehiss Time Adjuster
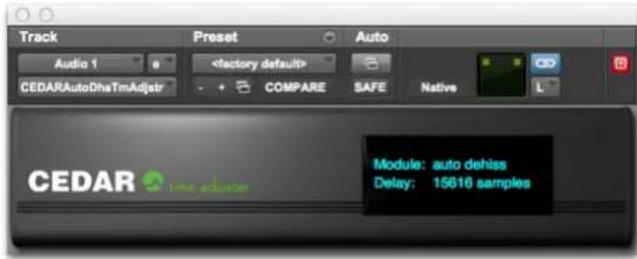
The plug-in delay compensation in some versions of Pro Tools is limited to a maximum of 4,095 samples. However, the propagation delay through Auto Dehiss is longer than this, which can lead to loss of synchronisation if one or more tracks are passing through the process, and others are not.
To correct this, insert the Auto Dehiss Time Adjuster as a plug-in on all tracks that are NOT being processed by Auto Dehiss. This will insert a sample-accurate correct delay so that synchronisation is preserved.
Controls
There are no controls. The Auto Dehiss Time Adjuster detects the correct delay at any sample rate and applies this.
This page left blank.
Debuzz
Introduction to Debuzz
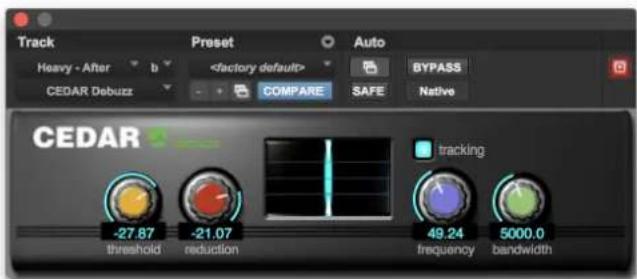
The family of degradations known as buzz includes many audio phenomena that are characterized by having a large number of strong, closely spaced harmonics and, prior to modern signal processing techniques, audio engineers used conventional filters to remove these. The simplest of these is the high-pass filter, which attenuates the signal at all frequencies below a specified cut-off point. This can be used to eliminate harmonically simple mains hums which, because of the mains frequencies of most countries, have fundamentals of 50Hz or 60Hz. Unfortunately, such a filter will also eliminate some of the desired sound, resulting in a signal that lacks bass.
Some complex buzzes and hums exhibit harmonics reaching up to many kHz, so a high-pass filter is inappropriate for removing them. A more sophisticated approach therefore involves the use of comb filters. These allow you to remove signal components at a number of regularly spaced frequencies. But if, at a given frequency, you remove an offending noise, you also remove any genuine signal that may exist at the same point in the spectrum. Comb filters also introduce a characteristic hollow sound that can make the genuine signal seem distant and indistinct, and this problem becomes worse the more precise the filter becomes. What's more, the offending frequencies may not always remain constant, so the attenuation may not always be appropriate, and you will hear the buzz come and go during the course of the material you are playing.
In contrast, Debuzz analyses the dynamics of the wanted signal and the buzz, optimally detecting and reducing the buzz with minimal side effects. It provides full-bandwidth processing, removes components across the entire audio spectrum, and it is capable of removing all manner of buzzes and hums with fundamental frequencies as high as 500Hz. It also has the ability to cope with jittery buzzes, and will generally remove the buzz even if the fundamental drifts by as much as 0.5Hz at 50Hz at 44.1kHz sample rate.
Controls
Defining the buzz
Buzz Bandwidth
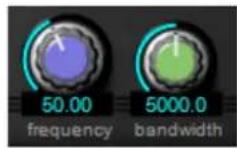
You may limit the processing bandwidth to reduce or eliminate the chance of damage to the upper frequencies of the genuine signal. You should attempt to find the lowest bandwidth that eliminates all the buzz harmonics. This has the added benefit of making the detector more accurate.
Fundamental Frequency
Use the Frequency control to tell the module to expect a buzz with a fundamental frequency close to, or precisely at, the chosen setting. The algorithm will then determine the frequencies and amplitudes of the harmonics up to the bandwidth limit chosen.
If the control is set wrongly, Debuzz will not be able to detect the buzz and will be unable to remove it.
Tracking
Tracking on/off
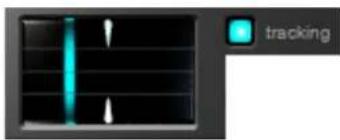
With this button lit, Debuzz will track jittery fundamentals within a range of up to 2% of the chosen frequency.
Confidence Meter
When the blue line lies on the white sights, the algorithm is reporting that the true fundamental lies on the chosen Fundamental Frequency. As the blue line moves to the left or right, the system is reporting that the fundamental is lower or higher than the chosen frequency, respectively. The intensity of the line represents the algorithm's confidence in the measurement.
Removing the buzz
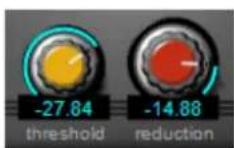
Threshold
The Threshold tells the module the level of the buzz within the signal. It is essential to set this correctly because Debuzz may miss buzz if the control is set too low, or the signal could become coloured if the control is set too high. It should be set as low as possible consistent with removing the buzz.
Reduction
Use the Reduction control to determine how much buzz the process removes. This control should be set as high as possible (i.e. as close to 0dB) consistent with removing the buzz.
Debuzz Tutorial
To begin processing you will need to find the fundamental frequency of the buzz.
Locating the fundamental frequency
Switch Tracking off, then set the Threshold to 0dB and the Reduction to -96dB so that the effect of the process is maximised. Now determine the Frequency using a spectrum analyser (or judge a likely frequency from your knowledge of the signal), set the Frequency control, and wait for a few seconds for the detection filters to settle. If, after a few moments, the buzz is not attenuated, try sweeping very slowly around the chosen frequency. If you cannot find the fundamental, you may have to sweep the frequency control over a wide range of frequencies. This can be laborious because you must do so slowly, allowing the detector to settle. The Confidence Meter will become brighter when the fundamental frequency is correctly set.
If this still does not have the desired effect, you may have a signal containing a complex buzz with numerous fundamentals and associated harmonic series. In these cases, you will only achieve an optimal result using a number of Debuzz modules in series.
Removing the buzz
When you have found the Frequency reduce the Threshold until you reach the point at which the buzz begins to reappear, then increase it again until the buzz disappears.
With the Threshold correctly set, you should reduce the Bandwidth to the point where you begin to hear the highest buzz harmonics reappear, and then increase it again until the buzz disappears. This will ensure that processing is concentrated in the correct region.
Finally, set the Reduction control to the appropriate level. This will be the level at which Debuzz removes the buzz without degrading the original ambience and harmonics of the signal.
If you hear the buzz reappear and disappear during the course of the material being processed, it may be that its frequency is not stationary. In this case, switch on Tracking. Debuzz will now track the fundamental within a range of approximately +/- 2% of the selected frequency.
Declick
Declick
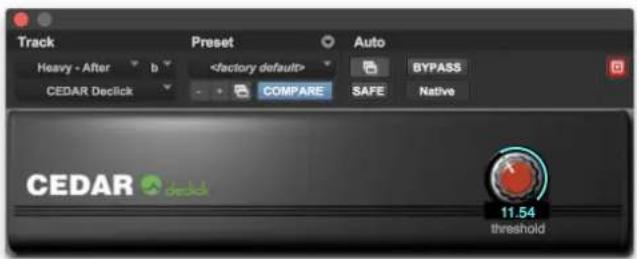
Declick removes clicks from a wide range of material without introducing unwanted distortion or artefacts. For most material, you will obtain excellent results if you follow the following operating instructions.
In Use
For each piece of material that you process, you must find a suitable value for the threshold. You can often leave this at its default value of 10.
Controls
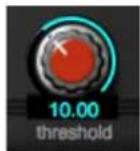
Threshold
The threshold ranges from 3 to 100 on an arbitrary scale and controls the sensitivity of the process. With the threshold set high, Decickle will remove only the largest clicks and scratches. A lower threshold will also remove smaller ticks and clicks.
If you reduce the value too far, the wanted audio may exhibit mild damage in the form of a slight instability in the background signal. You should, therefore, always attempt to find the highest value at which the unwanted noise is removed.
Declick Time Adjuster
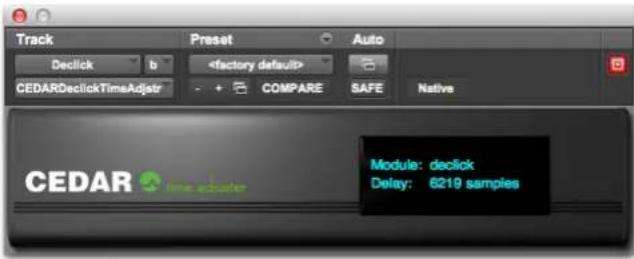
The plug-in delay compensation in some versions of Pro Tools is limited to a maximum of 4,095 samples. However, the propagation delay through Declick is longer than this, which can lead to loss of synchronisation if one or more tracks are passing through the process and others are not.
To correct this, insert the Declick Time Adjuster as a plug-in on all tracks that are NOT being processed by Declick. This will insert a sample-accurate correct delay so that synchronisation is preserved.
Controls
There are no controls. The Declick Time Adjuster detects the correct delay at any sample rate and applies this.
This page left blank.
Declip 2
Declip 2
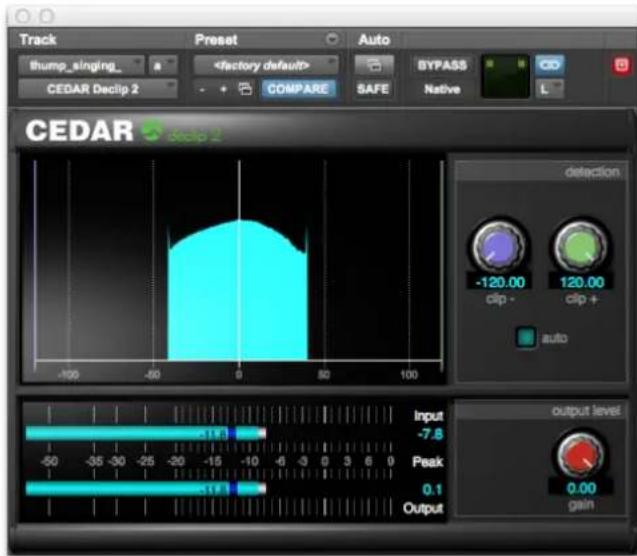
Clipping occurs when a piece of equipment or a medium carrying a signal is unable to handle a high level presented at its input, and will usually be heard as a harsh distortion that increases in intensity as the clipping becomes heavier. In all cases of clipping, it is the portions of the waveform near its extremities that are affected, while portions of the waveform closer to zero are unaffected.
Viewing the audio on an amplitude vs. time graph shows 'flat tops' where the genuine signal is destroyed and replaced by false samples at the maximum amplitude. A negative gain applied after clipping has occurred will affect the signal amplitude (and, therefore, the sample value of the flattened regions) but will not restore the original data.
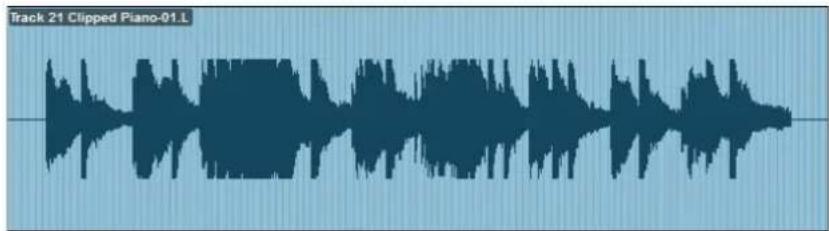
Declip 2 identifies and removes most instances of clipping in a single pass. It does so by presenting a visual indication of the density of sample values in the signal. If the Signal Analysis window displays 'hard' vertical edges it demonstrates that the signal has been clipped at that sample value and that you may use Declip to remove the offending samples and reconstruct the signal.
Controls
area
| x | y | | ---- | ----- | | -100 | 0.0 | | -80 | 50.0 | | -60 | 75.0 | | -40 | 90.0 | | -20 | 95.0 | | 0 | 100.0 | | 20 | 95.0 | | 40 | 75.0 | | 60 | 50.0 | | 80 | 25.0 | | 100 | 0.0 |Signal Analysis Window
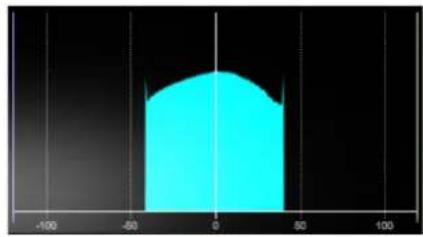
This displays the signal represented as the likelihood of a given sample value (the vertical axis) plotted against the sample value (the horizontal axis). Sample values that occur frequently will have greater values on the vertical axis than those that appear on few or no occasions. Clipping is visible as peaks at one or both sides of the signal display.
The vertical lines are the Clip Markers. Any samples lying outside these (i.e. further from the centre line) are removed from the signal and replaced with 'good' signal generated by the algorithm.
Clip Detection
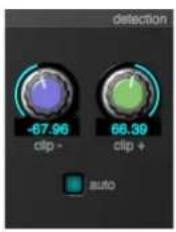
Use these controls to move the Clip Markers into position.
Auto
Click on the Auto button to allow the process to place the markers and to track any changes in the clipping level.
Output Gain
Allows you to attenuate the declipped audio to fit the available headroom.
Declip 2 Tutorial
Before processing, you must identify the amplitude at which clipping has occurred. You do this by considering the number of occurrences of each sample value in a given period of time. We call this measurement the 'sample likelihood', and the graph produced when plotting the sample likelihood (the vertical axis) against the sample value itself (the horizontal axis, shown as a proportion of full-scale digital) is called the 'sample density curve'.
Using the Signal Analysis Window
If you observe the sample density curve of unclipped audio you will see that it exhibits a reasonably smooth distribution across the sample range. An example of this appears below.
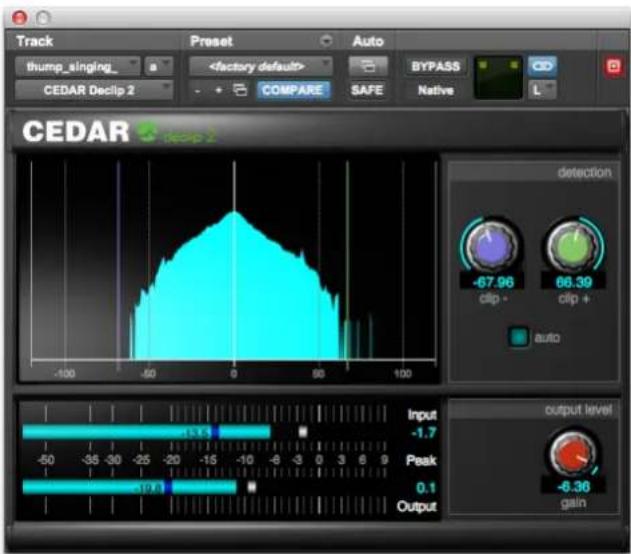
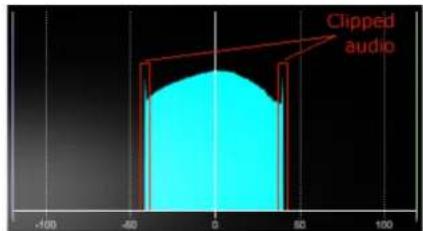
However, when the audio is clipped, this curve assumes a truncated shape, with peaks at one or both edges. This is because the number of times that this sample value has occurred is unexpectedly high. In the case of hard clipping these peaks will be sharp and well-defined; in the case of soft clipping they may be more rounded. There are many different types of analogue clipping, and these will usually be less obvious than digital clipping. This means that the hard edges shown below will be replaced by a more rounded profile. Nonetheless, the method for identifying and correcting the clipping remains the same as for digital clipping.
Removing the clipping
When you are happy that you have identified the sample values at which clipping has occurred, you should use the Clip + and Clip - knobs to move the Clip Markers 'inside' that amplitude. In many cases, you will see that there are valleys that differentiate the damaged data from the good data and these will most likely be the ideal places to position the markers. Alternative, the Auto function will allow the algorithm to determine these values and to track any changes in the clipping level, which will be of great benefit if any types of dynamics processes have been applied to the audio after clipping occurred.
Output Gain
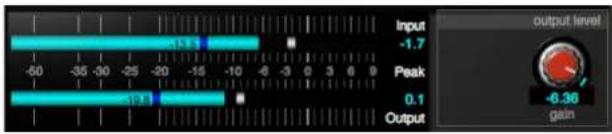
The peak amplitude of a declipped signal can be significantly greater than that of the incoming signal. To output this without reintroducing clipping, it may be necessary to attenuate the signal. Use the Output Gain control to fit the restored signal into the available headroom.
The associated meters show the peak amplitude of the incoming (upper meter) and outgoing (lower meter) signals.
Declip Time Adjuster
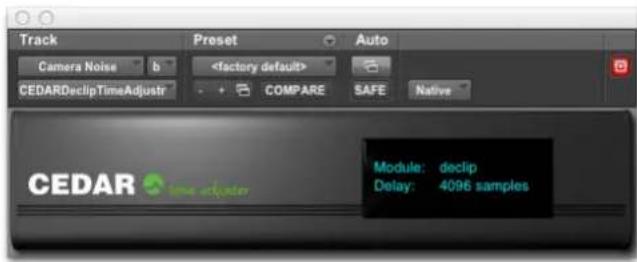
The plug-in delay compensation in some versions of Pro Tools is limited to a maximum of 4,095 samples. However, the propagation delay through Declip is longer than this, which can lead to loss of synchronisation if one or more tracks are passing through the process and others are not.
To correct this, insert the Declip Time Adjuster as a plug-in on all tracks that are NOT being processed by Declip. This will insert a sample-accurate correct delay so that synchronisation is preserved.
Controls
There are no controls. The Declip Time Adjuster detects the correct delay at any sample rate and applies this.
Decrackle
Decrackle
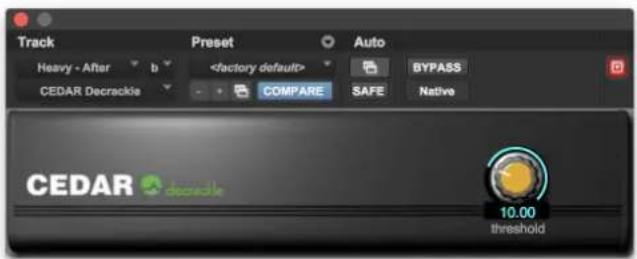
Decrackle is based on a process invented by CEDAR called 'Split & Recombine'. It removes surface noise, crackles, and some types of buzz. You may also use it to reduce the audible effects of some amplitude distortions.
In Use
Crackle removal is an almost foolproof process. However, it will only function correctly if there are no major ticks or clicks received at the input. If obvious clicks exist within your material they must be removed before processing the audio using Decrackle.
Controls
Threshold
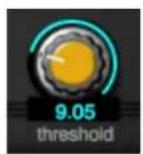
The threshold controls the sensitivity of the process. A high threshold tells the system to remove only the most obvious crackles and buzzes, while a lower threshold also removes fine crackle, buzz, and distortion.
Find a threshold level that removes as much of the crackle/distortion as possible without introducing unwanted side-effects. Low thresholds (4 or 5) can be most effective, but a higher threshold is advisable if processing begins to introduce unwanted side-effects. In general, no artefacts will be introduced with a threshold of 8 or above.
Decrackle Time Adjuster
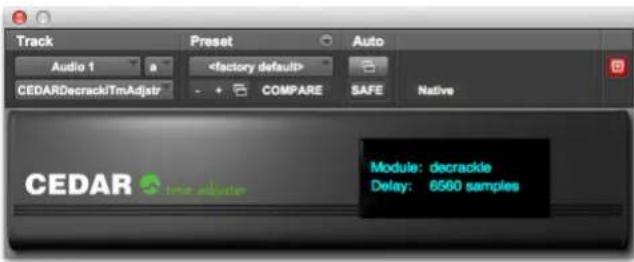
The plug-in delay compensation in some versions of Pro Tools is limited to a maximum of 4,095 samples. However, the propagation delay through Decrackle at high sample rates is longer than this, which can lead to loss of synchronisation if one or more tracks are passing through the process and others are not.
To correct this, insert the Decrackle Time Adjuster as a plug-in on all tracks that are NOT being processed by Decrackle. This will insert a sample-accurate correct delay so that synchronisation is preserved.
Controls
There are no controls. The Decrackle Time Adjuster detects the correct delay at any sample rate and applies this.
This page left blank.
DNS One
Introduction to DNS One
Noise is all around us: traffic, aircraft, the noise inside vehicles, air conditioning, wind, rain and other water noises, the noise from domestic appliances and even excessive reverberation. It annoys people and it can render many recordings unusable. So noise suppression techniques are used to clean up noisy dialogue for film production, suppress ambient noise for live TV and radio broadcasting, revitalise sound effects libraries, and enhance speech for forensic audio investigations.
In the past, engineers were forced to use processes such as low-pass and other filters, noise gates, dynamics processes, or processes developed from analogue encode/decode noise reduction systems to remove these noises, but they often proved to be inadequate. Filtering is not selective about what it removes, and there is no relationship between the input and the filtering effect. Gates have no effect when the desired signal is present and can lead to unnatural gaps in the signal. Other dynamics processes generate pumping, distortion, and other unnatural effects, and encode/decode processes, when used in this way, simply act as dynamics processors. So we developed the CEDAR DNS (dialogue noise suppression) process, which reduces background noise without introducing unacceptable side-effects. This first appeared in hardware as the DNS1000. Later, we introduced the DNS2000, the DNS1500 and the DNS3000. The latest addition to the family is the direct line of descent from these is DNS One, which runs in software on the host computer.
Using the standalone version of DNS One
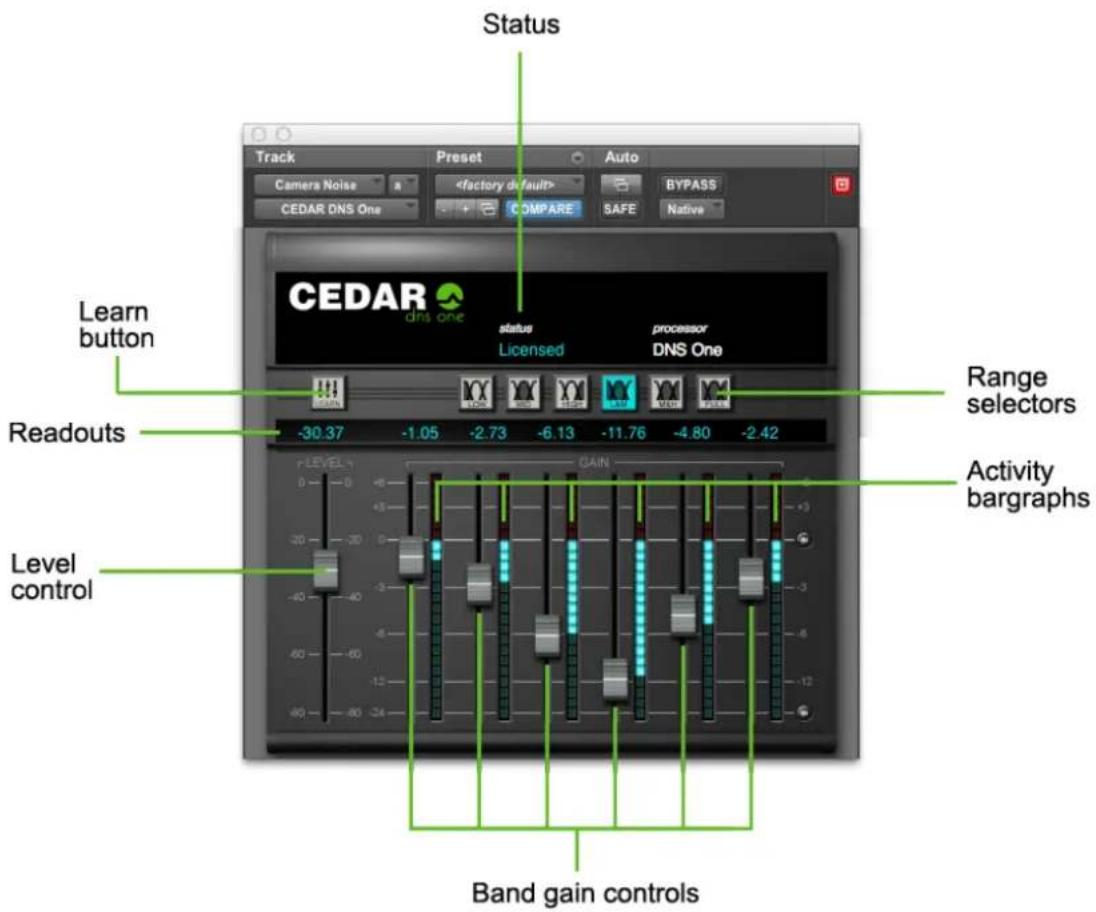
Range Selectors
The Range Selectors concentrate the unit's activity into the desired part of the audio spectrum. Selecting any of these ranges concentrates all of the filters within DNS One's filter bank across that part of the audio spectrum.
Level Control
The Level Control tells DNS One how much noise is present in the input.
Band Gain Controls
DNS One divides a signal into a large number of well-defined bands. Sophisticated digital filters analyse each of these bands and suppress the noise independently in each. The innovative design of this filter bank allows you to adjust DNS One using relatively few controls.
The Band gain controls determine the maximum amount of processing that DNS One will apply in each band.
Learn
When On, DNS One calculates an estimate of the Level and determines suitable Band Gains. The seven faders will be represented semi-transparently, indicating that you are unable to adjust these. You may, however, continue to choose the Range in which processing is applied.
You may use Learn to take a snapshot of the Level then switch it off to adjust the Band Gains. Alternatively, you may leave it On to adapt to changing conditions.
Note: The Learn function is not a noise fingerprint, as found in some spectral subtractive noise reduction systems. You may switch it on/off before or during playback, and it will quickly adapt to the noise in the recording. You do NOT need to find a section of the audio that contains little or no wanted signal.
Activity Bargraphs
These offer a visual indication of the activity in each of the bands.
Status
The following status messages may appear:
| Message | Explanation |
| Licensed | DNS One is licensed and working correctly. |
| Pending | A licence has been issued to start at some point in the future. |
| Timed | A timed demonstration licence is being used. |
| Expires in xx days | A timed licence is nearing its expiry. |
| Expired | A timed licence has expired. |
| Disabled | The ability to host timed licences has been disabled. This message will appear if you are running timed licences and the battery in the dongle has failed. |
| Unlicensed | The dongle does not contain a licence for DNS One. |
| Detached | The dongle was removed while DNS One was running – please reinsert. |
Error messages
If there is a problem when you launch DNS One, please follow the instructions on the error message that appears.
Generic Plug-in Controls
Standard plug-in facilities are provided. These have generic operation, and will be described in the relevant host software documentation.
Automation
The Level, Band Gain settings, and Range Selectors appear in the plug-in automation screens of the host software (where provided) and may be automated in standard fashion.
When Learn is On and your host system is recording automation, the Level and Gain values calculated within DNS One are provided to the automation system and recorded if the host is capable of doing so.
When Learn is On and the host system is replaying automation, the Level and Gain values calculated within DNS One are used and those replayed by the automation system are ignored.
Controls
| Range SelectorsThese concentrate the DNS One's activity into the desired part of the audio spectrum, and selecting one of these concentrates all of the filters within the filter bank across that part of the audio spectrum.Low 20Hz - 400HzMid 200Hz - 6kHzHigh 4kHz - 18kHzLow+Mid 20Hz - 6kHzMid+High 200Hz - 18kHzFull range 20Hz - 18kHz | |
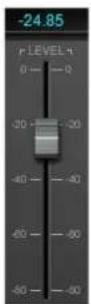 | LevelTells the DNS One how much noise is present in the input. This figure is displayed in decibels in the numeric field. |
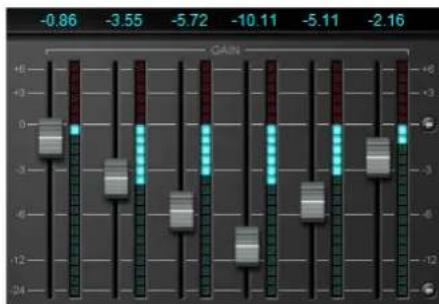 | Band Gain ControlsThe six faders represent six frequency bands distributed from lower frequencies (left) to higher frequencies (right) across the selected range, and determine the maximum amount of processing that the DNS One will apply in each band. The maximum gain is displayed in decibels in the numeric fields.Adjust these to suppress as much noise as possible without introducing unwanted artefacts into the desired signal.The bar graphs offer a visual indication of the activity in each of the Bands.Thetons move all six Band Gain controls to 0dB (upper button) or to -24dB (lower button). |
| [648W] | LearnWhen On, DNS One calculates an estimate of the Level and determines suitable Band Gains. |
DNS One Tutorials
The following tutorial and examples teach you how to adjust DNS One's settings manually, without recourse to the Learn function.
Range Selector
Your first job for any noise reduction will be to identify the frequency range or ranges in which the unwanted noise lies, and select any of six possible processing ranges by clicking on the appropriate buttons.
With practice, you will be able to identify the range by ear. Until then, you may prefer to use the methods described in the following case studies.
Level Control
Next, you should identify the noise level within the audio. With the appropriate range selected, pull all six Band Gain controls and the Level control down fully. (When using the AAX version, you may use the DNSQuickStart preset to do so.) Now increase the Level slowly. At first, you will hear very little happen but, at some point determined by the noise content of the recording, you will hear the noise disappear. You should attempt to determine the point at which this occurs.
When the Band Gain controls are fully down, maximum processing occurs for any given Level setting, thus making identification of the noise easier.
Band Gain Controls
Once you have chosen the Range and determined the Level, you control the action of DNS One's filter bank using the Band Gain controls.
The six faders represent six frequency bands (each containing multiple filters) distributed from lower frequencies (left) to higher frequencies (right) across the selected range.
You will use the Band Gain controls to control the amount of noise attenuation performed in each band, adjusting them to suppress as much noise as possible without introducing unwanted artefacts into the desired signal.
Noise suppression occurs in a given band when the fader is below 0dB. However, there are occasions when you might wish to boost the signal in a given band, and you can do this by moving the appropriate fader above 0dB.
You can move all the Band Gain controls to 0dB or to -24dB by pressing the appropriate reset arrow to the right of the faders themselves.
Case studies
The following three examples illustrate ways to use DNS One. They may not be the ways that you choose to operate it for all jobs, but they will get you started.
Suppressing traffic noise and other ambient sounds
The DNS One can suppress background noises such as road traffic, aircraft, air conditioning, wind, rain, and many other common soundstage, location, and outside broadcast (remote) problems that contaminate audio. If your signal exhibits any of these problems, you can suppress them as follows.
First, identify the frequency range(s) in which the noise lies.
You should be able to do this by listening to the problem. However, if this proves difficult, you can use the following method.
It is not important that you find the perfect settings at the first attempt. In particular, you will be able to refine your Level and Band Gain settings once you have found the correct range.
Begin as follows:
• Ensure that the DNS One is not in Bypass and then select Full Range.
- Set all six Band Gain controls to -24dB by clicking on the lower button.
- Move the Level control to -80 and then raise it until the noise disappears.
At this point you have determined an approximate setting for the Level. This is necessary for determining the range but it is likely that you will refine this later in the procedure.
When the Level is close to the ideal setting, you should see the bar graphs flicker in response to the signal content.
- Raise the Band Gain controls to 0dB by pressing the upper button (no processing occurs) and then adjust the Band Gain controls individually to suppress the noise. You should always attempt to suppress the noise with the minimum of damage to the desired signal.
In all likelihood, you will find that the leftmost Band Gain controls are pulled down significantly, whereas the central and rightmost are close to 0dB. This tells you that the problem does not lie in the upper frequencies, so you should use the Range Selectors to select Low+Mid. Then repeat the steps marked “••”.
If you now find that you are using all six faders in similar fashion, it is likely that the noise is distributed across the entire Low+Mid range. However, if the suppression is still heavily biased towards the left hand faders, you should now select the Low range alone and repeat the procedure. If you select Low alone and cannot suppress the noise, it is probable that there is considerable noise energy in the Mid band, so you should return to using Low+Mid ranges. For many problems such as traffic noise, the noise will lie primarily in the range 50Hz - 1.5kHz. In this case, Low+Mid will be the correct choice.
Second, optimise the Level control.
Listening carefully to the audio, refine the Level setting so that the noise is identified correctly without introducing audible artefacts. If this proves difficult, you can return the Band Gain controls to -24dB for this stage.
Note that the DNS One takes a short period to settle after moving the Level control (especially in the lower ranges) so you should not adjust it rapidly.
Third, refine the Band Gain controls for optimum suppression.
Press to set all six Band Gain controls to 0dB. Now increase and decrease the Gain in each band separately while listening to the effect that each has on the noise. This will identify the bands that contain the majority of the noise. (Do not be alarmed if all six bands contain significant noise. This is not unusual.)
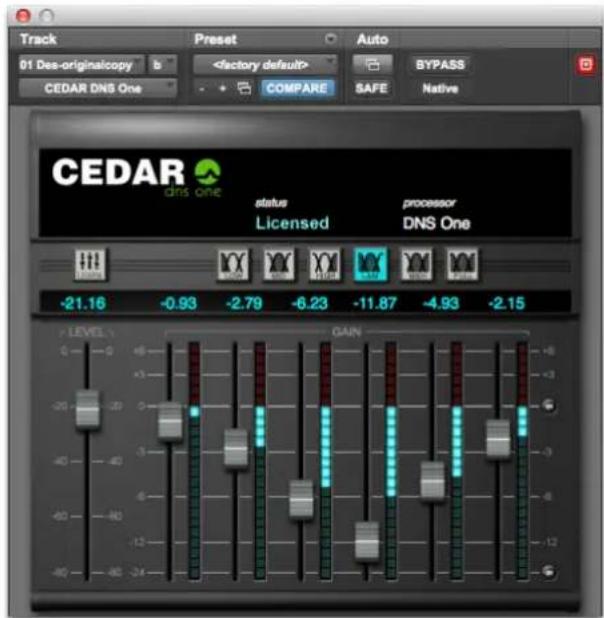
Let's assume that the greatest improvement occurs when you reduce the gain in bands 3 and 4. This suggests that the noise is concentrated in an approximate range of 200Hz to 1kHz. You should now find the optimum positions for all six faders. The greatest cuts will lie in bands 3 and 4, whereas bands 1, 2, 5 and 6 should remain as close to 0dB as possible to ensure that minimal signal damage occurs in the bands that do not contain much noise. The final configuration might look as shown above.
Suppressing tape hiss
The DNS One can suppress the tape hiss that mars many older recordings. It will also improve the signal/noise ratio of dialogue tapes that have been poorly copied as well as those that are many generations old.
First, identify the frequency range(s) in which the noise lies.
You should follow the procedure laid down in case 1 (traffic noise) to determine the range(s) in which the problem lies. For most instances of tape hiss, you will find that the Mid+High ranges are most appropriate. In a few cases you may find that the High range alone is most suitable. It is not as common to require suppression in the Low range because hiss is usually less prominent at lower frequencies, and it may also be masked by the genuine audio in the range.
Second, optimise the Level control.
To determine the correct Level, you should again follow the procedure described in the first tutorial.
Third, refine the Band Gain controls for optimum suppression.
As in the first tutorial, you should start with all six Band Gain controls at 0dB. You should then increase and decrease each control individually to find the bands that contribute most hiss to
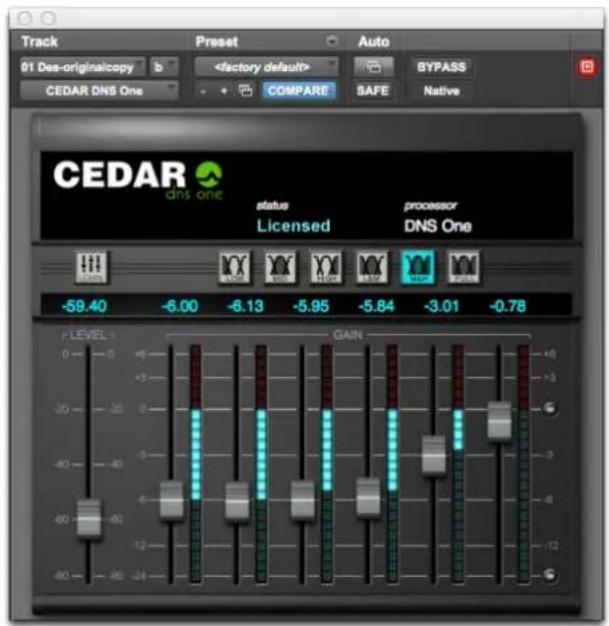
the signal. Because tape hiss often exhibits a white profile at Mid and High frequencies, you may find that satisfactory results are achieved with the Band Gain controls set in a horizontal line.
However, hiss is generally less annoying at very high audio frequencies. Consequently, you may be able to reduce the amount of processing in the uppermost bands. This will help to ensure that any low amplitude signal components lying at high frequencies (which provide much of the "air", "ambience" or "life" in a signal) are passed with little or no attenuation.
The final configuration might look like this:
Suppressing excessive reverberation
In many situations, the DNS One can suppress excessive reverberation. This can be useful in TV production when you need to match the audio from a large recording studio or soundstage to visual images set in a small room or other enclosed space. Suppressing reverberation can also be beneficial in increasing the intelligibility of poor dialogue recordings.
The method used to suppress reverberation is quite different from that applied in the previous examples, and is as follows:
First, set the range in which the reverberation lies.
In general, reverberant spaces include soft materials that absorb high frequencies more rapidly than middle and lower frequencies. Even bare rooms with hard walls include these materials; they are the people who are speaking. Consequently, you will find that Low+Mid is almost always the most appropriate combination of ranges for suppressing reverberation.
Second, set the Band Gain controls.
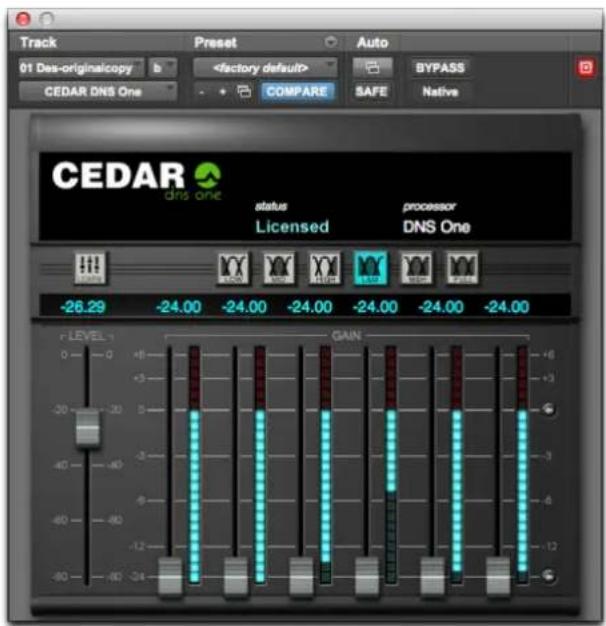
You should set all six Band Gain controls to -24dB. This will ensure that (if the Level is set correctly) the DNS One applies maximum suppression to the tails of the sound.
Third, optimise the Level control.
Starting at its minimum position, increase the Level control slowly. At some point before full noise suppression becomes apparent, you will hear the tails of louder sounds become truncated. You can adjust the amount of truncation of the reverb using the Level control rather than the Band Gain controls.
The final configuration might look like this:
DNS Two
DNS Two
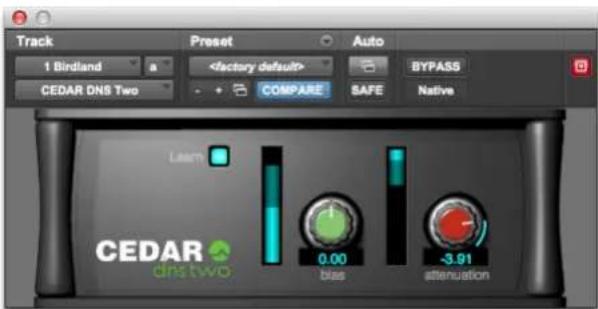
DNS Two is a further development of our DNS technology. It dispenses with the manual control offered by DNS One's range selectors and band gain controls and uses an enhanced Learn function to analyse the noise and then calculates the internal parameters necessary to suppress it. DNS Two is not a cut-down version of DNS One; you will find many cases in which it's not only quicker and simpler to use, but will obtain superior results to DNS One.
In use
Using DNS Two is often as simple as switching on Learn and adjusting the attenuation to obtain the desired amount of noise reduction. If desired, you can also use the bias control to bias the process toward detecting more noise in the signal (a drier output) or less noise in the signal (more retained 'atmos' but with less noise reduction). You should find the correct bias and attenuation to obtain the optimum amount of noise reduction for each piece of audio.
Note about noise fingerprints:
When LEARN is switched off, the noise detector does not respond to changes in the signal, so the internal parameters determined at the moment you switch it off are frozen as a noise fingerprint. This is NOT good practice; using a noise fingerprint only ensures that the amount of noise believed present by the process is incorrect at all other times. In almost all cases, you will obtain optimum results by leaving Learn switched on even when the wanted signal is present.
Controls
| Icon | Description |
 | LearnUse the Learn button to control whether or not the noise detector in DNS Two adapts continuously to the audio signal. Switching Learn off freezes the noise detector; it is reset when the Learn is switched back on.In almost all cases, optimum results are obtained by leaving Learn switched On, even when the wanted signal is present. |
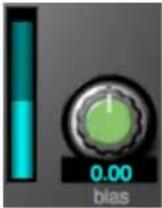 | BiasRaise the Bias to increase the amount of noise detected. This will allow the process to remove more noise, but may make the signal sound dry.Lower the Bias to decrease the amount of noise detected. This will allow the process to retain more atmos, but it will remove less noise.MeteringThe bar graph illustrates the detected long-term signal to noise ratio (SNR). The lighter bar shows the detected noise level, and the darker bar shows the detected long-term signal level; consequently, the difference between the heights of the lighter and darker bars indicates the long-term SNR. When the Bias is above or below zero, it biases the noise detector either upward or downward. You can see this reflected in the height of the lighter bar, which rises as you raise the Bias (and vice-versa). |
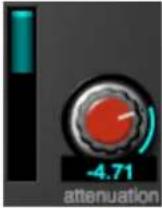 | AttenuationAdjusts the amount of noise attenuation applied to the signal.MeteringThe bar graph shows the instantaneous amount of attenuation being applied to the signal. The lighter bar shows the average attenuation across all frequencies, and the darker bar shows the maximum attenuation across all frequencies. |
This page left blank.
Off-line processes
This page left blank.
Dethump
(Pro Tools AAX only)
Dethump
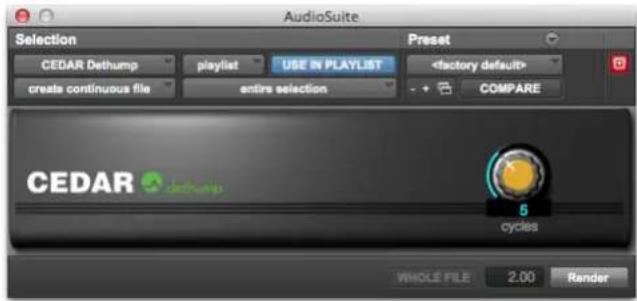
Dethump should be used to remove low frequency disturbances. The maximum thump length handled is approximately 1s irrespective of sample rate.
Identifying a thump
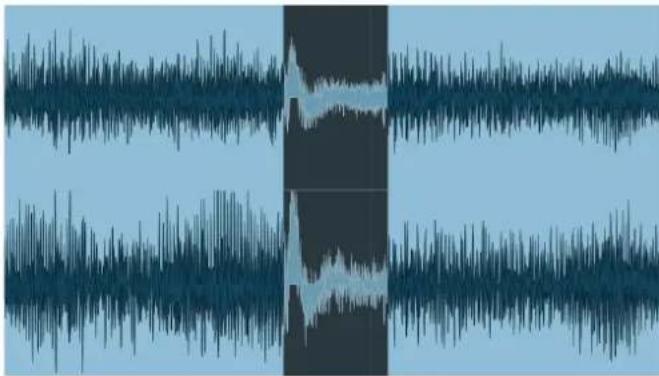
Identify the audio that contains the thump and zoom in to identify the thump itself. If you have correctly identified the problem, you should see an easily recognisable thump superimposed upon the desired audio waveform.
If the thump has a sharp transient at its start, it may be beneficial to remove this using Declick or Manual Declick before proceeding with Dethump.
Drag the cursor over the area of damaged audio. If your host system allows, fine-tune the selection by dragging either edge using the mouse.
natural_image
Audio waveform visualization showing two vertical panels with varying amplitude and frequency patterns (no text or symbols)Removing the thump
Invoke Dethump and use the knob to tell the process how many low-frequency cycles exist within the thump. In this example, there are two clearly visible cycles.
Click on Render to restore the audio.
If the selection is either too long or too short, a warning will appear. Pressing Render will then result in the original audio being reinserted into the marked region.
If the thump is of a suitable length but you are not happy with the result, undo the processing and attempt it again with slightly different start and end points, or select a different number of cycles to achieve the desired result.
Manual declick
(Pro Tools AAX only)
Manual Declick
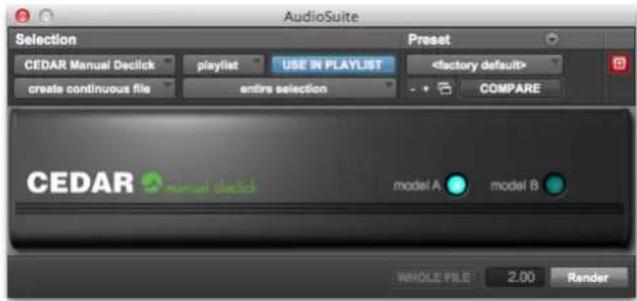
Manual declick should be used to remove extended clicks. It allows you to specify the audio that constitutes the click and restores the audio using an interpolator that is optimised for longer clicks and scratches. The maximum click length handled is approximately 0.1s irrespective of sample rate.
Identifying a click
Identify the audio that contains the click and zoom in to find the click itself. All being well, you will see an easily recognisable click superimposed upon the desired audio waveform. Drag the cursor over the area of damaged audio and, if your host allows, fine-tune the selection by dragging either edge of the selected region using the mouse.
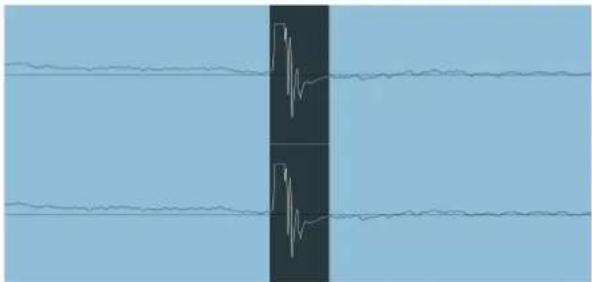
natural_image
Abstract diagram with two vertical dark bands and horizontal lines, no text or symbols presentRemoving the click
Invoke Manual Declick and select the desired algorithm.
Manual declick A:
The general purpose manual declicker; the optimal choice for most situations.
Manual Declick B:
Optimised for long clicks in the presence of a high noise floor.
Press Render to process.
If the selection is too long, a warning will appear. Pressing Render will then result in the original audio being reinserted into the marked region. If you find that a click is too long to remove using Manual Declick, you should consider using Retouch and/or Dethump to restore the audio.
Retouch
Introduction to Retouch
In photography, retouching is the art of identifying and removing unwanted blemishes from a picture to produce a perfect image. Retouch brings this concept into the audio world, allowing you to remove unwanted acoustic events from a signal.
■ A tool for removing unwanted noises
Until CEDAR Audio invented the spectrographic editing system, audio restoration systems were limited as to the types of noises that they could remove: clicks and scratches, crackle and buzz, hiss, pops and thumps, and so on. But the release of Retouch offered a huge leap forward in processing technology, allowing users to identify and eliminate sounds as varied as coughs, record scuffs, squeaky chairs, page turns, the creak of a piano pedal, and even a car horn.
Before Retouch, some engineers attempted to use techniques such as severe EQ to remove these types of noise. Others used (and misused) harsh compression, tight editing, and signal interpolators that affect the whole frequency spectrum. All of these methods damage good signal that should be left untouched, and can introduce unwanted side-effects such as ringing and drop-outs.
In contrast, Retouch offers tools that localise unwanted sounds accurately in both time and frequency. Once identified, those sounds are replaced with audio derived from the surrounding, good signal. All other audio remains untouched.
■ A tool for editing sounds in both time and frequency space
Because of its ability to identify audio both in terms of time and frequency, Retouch is able to move precisely defined audio from one location to another, either overlaying the new audio over the old, or mixing the existing audio with the sound you are moving. There are many uses for this, including noise elimination, editing, correcting the pitch of (or eliminating) incorrectly played notes, and the creation of sound effects.
■ A tool for revealing wanted sounds and suppressing unwanted background
Retouch allows you to reveal individual sounds or utterances within a file, either by amplifying the wanted sounds or by suppressing the rest of the audio, or both simultaneously. You can also use this to retain only the sounds or words wanted within an audio file.
Getting started with Retouch
Retouch provides eight audio processing modes that you access by clicking on the name of the currently selected mode. These are:
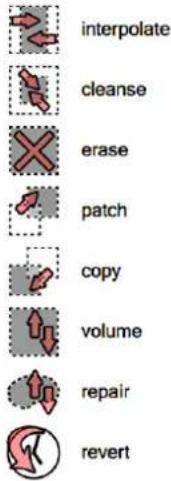
The use of these is broadly similar but, for any given job, you should choose the appropriate mode to achieve optimal results.
These Help files will guide you through the use of the first of these - the Interpolate mode - before proceeding to describe the use of each of the others.
Invoking Retouch
Standalone version:
Find the CEDAR Retouch application on your hard disk.

CEDARRetouch
Launch this in the usual fashion and then use the File menu to load the .WAV audio file(s) that contains the problem that you wish to correct.
Within AudioSuite (Pro Tools users only).
Select the audio that contains the problem that you wish to correct, plus a significant duration either side of the noise itself. As a guideline, you should mark at least three times as much signal as the extent of the unwanted sound itself, with the sound centred in the region.
If you select no audio, the whole track will be loaded into Retouch.
When you have done this, select Retouch from the AudioSuite menu to invoke the process and display its user interface.
Depending upon the host, CEDAR Studio's implementation of Retouch will process up to 48 tracks simultaneously.
The Transport Controls (standalone version only)

Use the transport controls to play the audio. You may use the Spacebar in the common fashion to start/stop playback. (See Hot Keys.)
When run within Pro Tools, you must use the playback and preview features of the host system.
Undo and Redo
Step forward and backward through your actions in the usual fashion.
Reveal menus

As well as right-clicking in the axes and on the spectrogram itself, you can click on the three-dot icons in these locations to reveal the contextual menus.
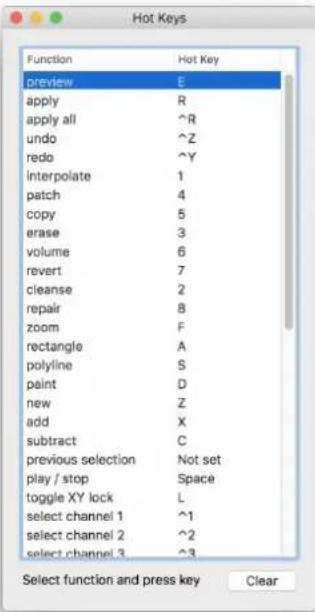
Hot Keys
You may create a personalised set of Hot Keys to help you navigate and process more quickly and efficiently within Retouch.

Invoke the Hot Key editor by pressing on the hot key icon.
To change a Hot Key definition, simply highlight the wanted action and then press the desired key or key combination. There is no need to save the definition file, which is contained within Retouch.
Resizing
In addition to the standalone version, which you can resize in the usual fashion, it is possible to resize Retouch within Pro Tools by grabbing and dragging the handle in the lower right-hand corner of the Retouch window.
The Retouch Spectrogram
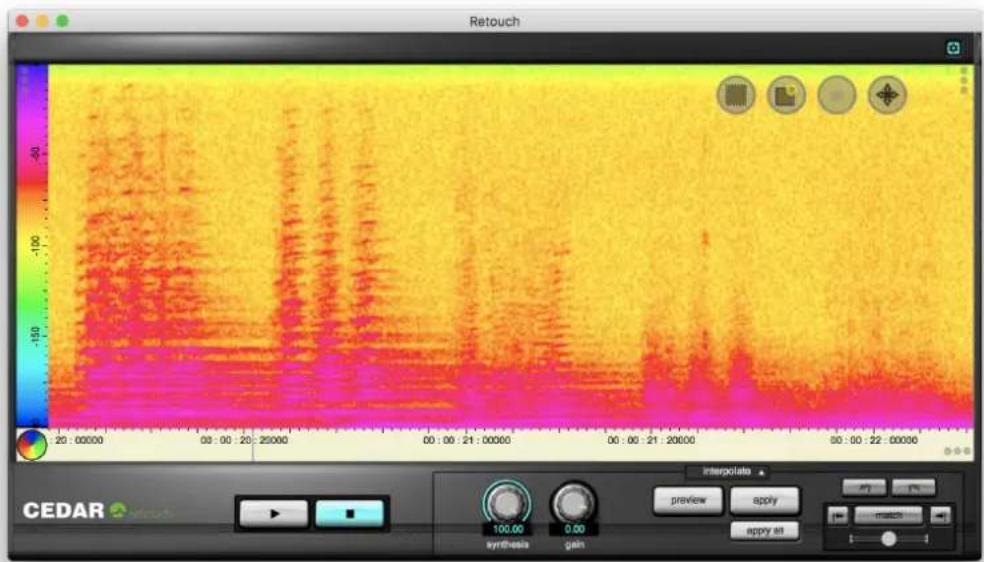
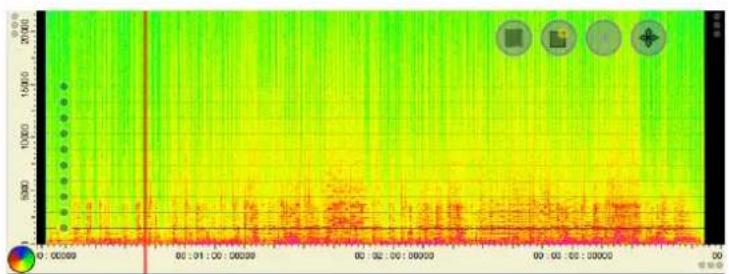
The spectrogram represents audio in three dimensions:
■ The horizontal ('X') axis is time.
■ The vertical axis ('Y') is frequency.
■ The colours represent the Z-axis, and are amplitude in dB.
The spectrogram is, therefore, a representation of the amplitudes of all frequencies at all times within the region selected. (This is not a complete representation of the signal because no phase information is shown.)
Controlling the spectrogram
When you first invoke Retouch, the signal amplitude will be displayed using the standard colour-set. This choice is suitable for displaying signals with a wide dynamic range, but may not be ideal when signal amplitudes occupy a narrower range. To help you differentiate signals of similar amplitude, Retouch provides various means for changing the colour-set.
The Colour Wheel

Click and hold on the colour wheel. The colour map will be displayed on the Y axis and you can then drag your mouse to rotate the colour map. You may also click on the wheel and then drag the upper and lower extremes of the map upward or downward as desired, or slide the whole of the active area up and down the axis by clicking and dragging upon it.
As you change the colour map, you will notice that the detail on the spectrogram can change considerably. For some signals, events (i.e. areas of distinct colour changes) can appear and disappear depending on the position of the colour map. This is a valuable tool that allows you to identify the positions and frequencies of sounds that might otherwise be invisible.
Colour clipping
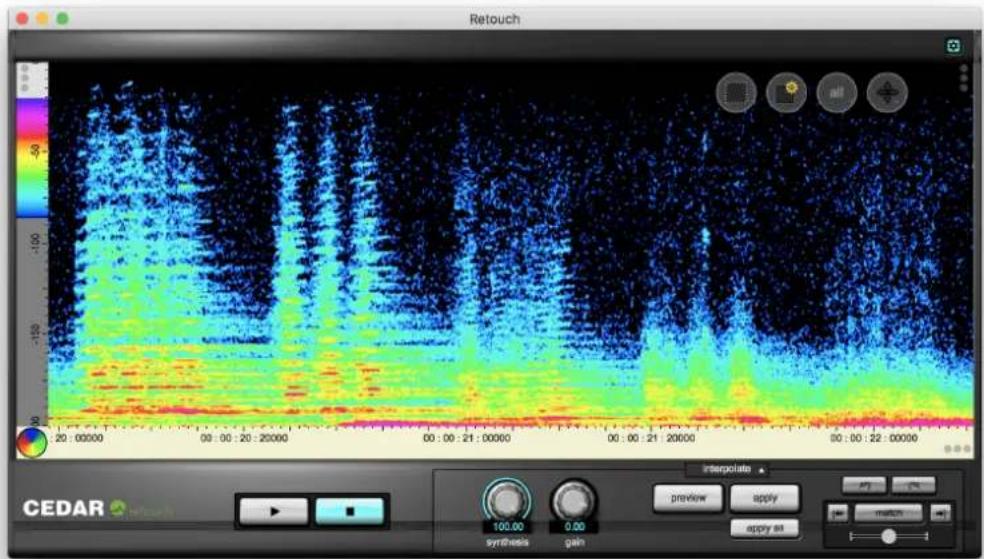
To maximise the resolution on the colour axis, it is useful to fit the entire range of the colour wheel within the highest and lowest amplitudes in the Retouch window. Furthermore, it is often useful to represent low amplitudes as black areas on the spectrogram, and high amplitudes in white. You may make these adjustments (which can be thought of as zooming on the Z axis) using the Amplitude Bounds controls and menu.
To access these, right-click on the colour wheel. The Y axis will now show the colour map. You may adjust the upper and lower bounds by left-clicking and dragging its upper and lower extremes.
Right-click within the map or click on the menu selector to reveal the colour map menu.
Set to default
Set to full
Set to visible range
Set to default
A default setting – found by CEDAR to be useful in many instances – is loaded.
Set to full
The colour map is distributed between the maximum and minimum possible amplitudes.
Set to visible range
Sets the colour map such that the colours are distributed between the greatest and lowest amplitudes contained within the visible part of the signal.
None of these operations affect the underlying audio data. They simply alter the visual representation to accentuate details within it.
Having selected the desired colour map, click again on the colour wheel to return the Y axis to a frequency display.
Zooming, scales and harmonic markers
Y-axis menu X-axis menu Spectrogram menu
Zooming
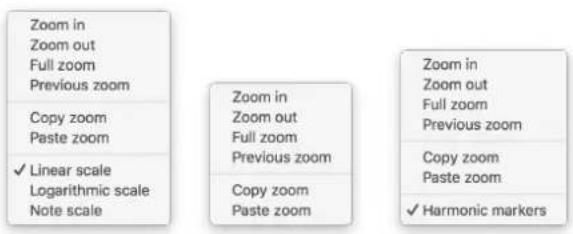
Zooming is very important when identifying sounds. You can zoom using the mouse wheel, the trackpad (zooming is centred on the "+" cursor), the right-click commands, and by right-clicking and dragging within the axes to select the desired area of the audio. You may also copy a zoom level and paste this into another instance of Retouch.
Scales
You may display the frequency (Y) axis in linear or logarithmic modes, or as MIDI notes based upon A440. This parameter changes the visual representation of the audio, but does not affect it in any other way.
The play region
heatmap
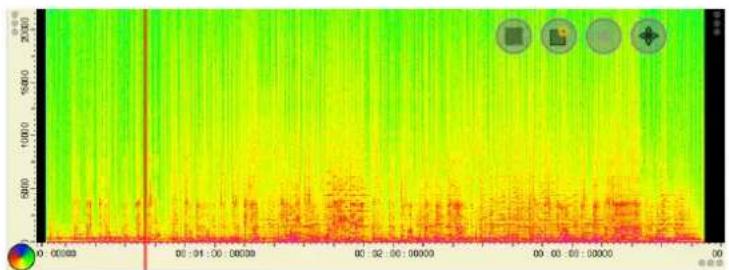
| Time | Value | | -------- | ----- | | 00:00 | 0 | | 01:00 | 500 | | 02:00 | 1000 | | 03:00 | 1500 | | 04:00 | 2000 | | 05:00 | 1500 | | 06:00 | 1000 | | 07:00 | 500 | | 08:00 | 100 | | 09:00 | 50 | | 10:00 | 10 | | 11:00 | 5 | | 12:00 | 1 | | 13:00 | 5 | | 14:00 | 10 | | 15:00 | 15 | | 16:00 | 20 | | 17:00 | 15 | | 18:00 | 10 | | 19:00 | 5 | | 20:00 | 1 | | 21:00 | 5 | | 22:00 | 10 | | 23:00 | 15 | | 24:00 | 20 | | 25:00 | 15 | | 26:00 | 10 | | 27:00 | 5 | | 28:00 | 1 | | 29:00 | 5 | | 30:00 | 10 | | 31:00 | 15 | | 32:00 | 20 | | 33:00 | 15 | | 34:00 | 10 | | 35:00 | 5 | | 36:00 | 1 | | 37:00 | 5 | | 38:00 | 10 | | 39:00 | 15 | | 40:00 | 20 | | 41:00 | 15 | | 42:00 | 10 | | 43:00 | 5 | | 44:00 | 1 | | 45:00 | 5 | | 46:00 | 10 | | 47:00 | 15 | | 48:00 | 20 | | 49:00 | 15 | | 50:00 | 1 | | 51:00 | 5 | | 52:00 | 10 | | 53:00 | 15 | | 54:00 | 20 | | 55:00 | 15 | | 56:00 | 1 | | 57:00 | 5 | | 58:00 | 10 | | 59:00 | 15 | | 60:00 | 20 | | 61:00 | 15 | | 62:00 | 1 | | 63:00 | 5 | | 64:00 | 10 | | 65:00 | 15 | | 66:00 | 20 | | 67:00 | 15 | | 68:00 | 1 | | 69:00 | 5 | | 70:00 | 10 | | 71:00 | 15 | | 72:00 | 20 | | 73:00 | 15 | | 74:00 | 1 | | 75:00 | 5 | | 76:00 | 10 | | 77:00 | 15 | | 78:00 | 20 | | 79:00 | 15 | | 80:00 | 1 | | 81:00 | 5 | | 82:00 | 10 | | 83:00 | 15 | | 84:00 | 20 | | 85:00 | 15 | | 86:00 | 1 | | 87:00 | 5 | | 88:00 | 10 | | 89:00 | 15 | | 90:00 | 20 | | 91:00 | 15 | | 92:00 | 1 | | 93:00 | 5 | | 94:00 | 10 | | 95:00 | 15 | | 96:00 | 20 | | 97:00 | 15 | | 98:00 | 1 | | 99:00 | 5 | | Note: The actual values are not provided in the code. The data is presented as a table with three columns labeled 'Time' and 'Value'.Standalone version only: When you play audio within Retouch, it will loop around the region of audio selected in the time (X) axis at the moment that you press Play. You may change the zoom after this, and the same piece of audio will continue to play until stopped. To select a point from which playback will start, double-click in the time axis to locate the vertical play cursor.
Harmonic markers
heatmap
| Time | Value | | -------- | ------ | | 00:00 | 1500 | | 01:00 | 1000 | | 02:00 | 500 | | 03:00 | 250 | | 04:00 | 100 | | 05:00 | 50 | | 06:00 | 25 | | 07:00 | 10 | | 08:00 | 5 | | 09:00 | 2.5 | | 10:00 | 1.0 | | 11:00 | 0.5 | | 12:00 | 0.25 | | 13:00 | 0.1 | | 14:00 | 0.05 | | 15:00 | 0.025 | | 16:00 | 0.01 | | 17:00 | 0.005 | | 18:00 | 0.0 | | 19:00 | 0.0 | | 20:00 | 0.0 | | 21:00 | 0.0 | | 22:00 | 0.0 | | 23:00 | 0.0 | | 24:00 | 0.0 | | 25:00 | 0.0 | | 26:00 | 0.0 | | 27:00 | 0.0 | | 28:00 | 0.0 | | 29:00 | 0.0 | | 30:00 | 0.0 | | 31:00 | 0.0 | | 32:00 | 0.0 | | 33:00 | 0.0 | | 34:00 | 0.0 | | 35:00 | 0.0 | | 36:00 | 0.0 | | 37:00 | 0.0 | | 38:00 | 0.0 | | 39:00 | 0.0 | | 40:00 | 0.0 | | 41:00 | 0.0 | | 42:00 | 0.0 | | 43:00 | 0.0 | | 44:00 | 0.0 | | 45:00 | 0.0 | | 46:00 | 0.0 | | 47:00 | 0.0 | | 48:00 | 0.0 | | 49:00 | 0.0 | | 50:00 | 0.0 | | 51:00 | 0.5 | | 52:00 | 1.5 | | 53:00 | 3.5 | | 54:00 | 6.5 | | 55:00 | 11.5 | | 56:00 | 18.5 | | 57:00 | 27.5 | | 58:00 | 38.5 | | 59:00 | 49.5 | | 60:00 | 61.5 | | 61:00 | 73.5 | | 62:00 | 86.5 | | 63:00 | 111.5 | | 64:00 | 146.5 | | 65:00 | 192.5 | | 66:00 | 243.5 | | 67:00 | 317.5 | | 68:00 | 414.5 | | 69:00 | 532.5 | | 78:31* | - | | | |Invoked within the spectrogram menu, harmonic markers allow you to view the first ten harmonics of a given fundamental frequency. Drag any of the markers to adjust the fundamental and, therefore, the other nine harmonics. Markers can be very useful when, for example, identifying the harmonics of a tone that you wish to remove or shift in frequency to correct a wrongly played note.
Examples of sounds that can be Retouched
Recognising a Sound
You now need to identify the unwanted sound within the spectrogram. This can take the form of tonal events (for which you may need to remove individual harmonics or partials from the spectrum), short transient events such as clicks, reverberant events, and noisy events.
The following graphics show three common (and easily recognised) types of noise that can be addressed using Retouch:
Clicks:
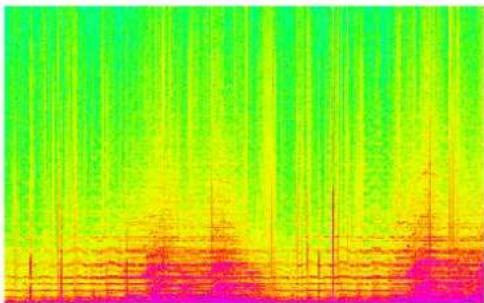
natural_image
Thermal or heat map image showing vertical striations in green, yellow, and pink tones (no text or symbols)This dense pattern of thin, vertical bars is a series of loud clicks. Retouch may be useful for eliminating those that are resistant to standard methods of declicking.
Noise burst (or 'chuff'):
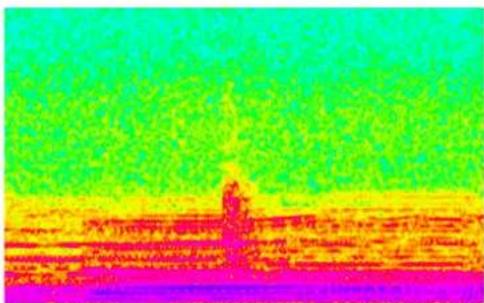
natural_image
Thermal or heat map image showing a gradient from yellow-green to purple, with no visible text or symbols.This vertical band is far too wide to be a well-defined click, but is a burst of broadband noise (sometimes called a 'chuff').
Tonal noise:
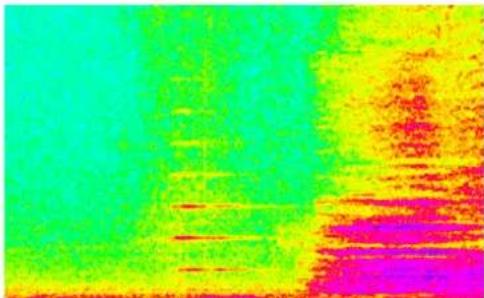
natural_image
Thermal image showing heat distribution with color gradient from green to red (no text or symbols)The harmonically related horizontal bars in the centre of this spectrogram demonstrate that there's a tone – which may be wanted or unwanted – present. In this case, it is a car horn contaminating a quiet passage of choral music.
Defining sounds to be processed (1) Manually
When you have located a sound of interest, you will often find that it exhibits more detail than you may have thought, and you may then wish to zoom more closely to identify it more accurately. When you have identified it, you may define the region to be processed.
Defining a region
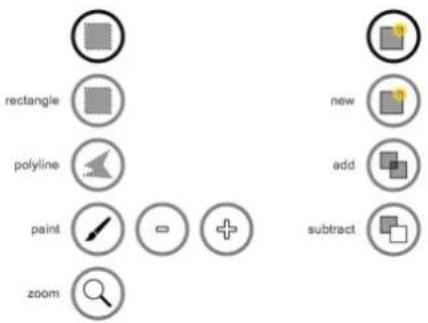
First, ensure that the Interpolate Tool is selected, then decide how you wish to define the region to be Retouched. There are two related menus that assist you; the selection tool menu and the selection mode menu.
Simple rectangular regions

You can mark many unwanted sounds using a simple rectangle. Click on the Rectangle and New Selection icons, then click and drag over the noise. Retouch will mark a rectangular region by greying out the area you describe. This is the area of audio that Retouch will process.
Complex regions
You may define complex shapes using three additional tools:

Use Polyline to click around a complex shape. You can left-double-click to close the loop, or right-click to cancel an incomplete shape.

Use the Paintbrush to paint a shape. Adjust the width of the brush using the + and - keys, by using

Click on this icon to create complex shapes by adding to an existing defined region. You may add rectangles using the Rectangle tool or add complex shapes defined using the Polyline and Paintbrush tools. Press and hold
It is advisable to work in Add mode when defining complex regions to avoid the risk of accidentally starting a new region and deleting the existing one.

Click on this icon to create complex shapes by subtracting from an existing defined region. You may subtract rectangles using the Rectangle tool or subtract complex shapes defined using the Polyline tool.
Press and hold
Zooming (again)

Associated with the region tools, you'll find a further means to zoom within the spectrogram. When you click and drag across the audio, the upper and lower frequencies (or notes) and the start and end times of the selection will be displayed until you release the mouse button.
Resizing a region
Having defined a region, you may adjust its duration and the frequency range it covers by dragging its grab handles.
Multiple separate regions
It is possible to mark multiple, separate regions in the same way as adding to, or subtracting from, existing regions. This technique works well for multiple objects separated in frequency (along the Y axis) but is not appropriate for interpolating multiple objects - such as a succession of clicks - separated in time (along the X axis).
Defining the Wings
Depending upon the processing mode selected it's possible that, when you have defined the region to Retouch and released the mouse button, it will be greyed out, and 'wings' will appear on either side of it. These show the audio data that will be used to calculate the audio within the region. The example below shows a simple marquee around a click with the default wings on either side.
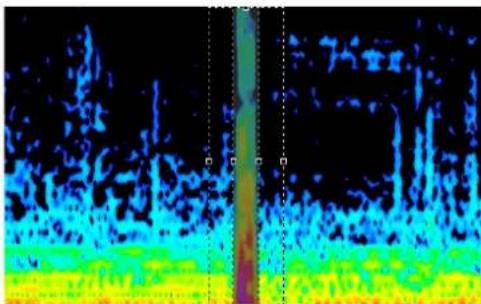
natural_image
Color-coded scientific visualization with vertical gradient bar and horizontal bands (no text or symbols)It is important that the wings contain audio that is representative of the audio that you wish to have fill the selected area. Therefore, they should not include other unwanted noises, or inappropriate – for the purposes of reconstruction – musical events such as the transients of following notes. In order to ensure that the wings contain suitable data, you may adjust their durations using the grab handles.
When first displayed, each wing occupies a theoretically optimal area. If you choose to adjust either or both of them, bear in mind that:
■ if the wings are too small, there may be insufficient data to rebuild the signal correctly, and you may introduce an artefact.
■ if the wings are too large, you may include inappropriate data that is not suitable for rebuilding the signal, and this too may introduce artefacts.
There is no reason why the wings need to be equal in duration. Defining them unequally can be useful when, for example, two unwanted events are close together.
Channel Activation
Click on a channel button to activate a channel for display and processing. Click on the 'all' button to activate all channels.
If a single channel is selected in the channel selector, the data contained within that channel alone is displayed in the spectrogram window. If multiple channels are selected, the spectrogram shows the average value of the data in the selected channels.
If you are processing a multichannel clip, the process region(s) and wings will be defined identically in all channels, and you should flip between channels to ensure that they are appropriate to all. You should perform multiple mono processes if you are unable to define an area that is appropriate for all channels.
Defining sounds to be processed (2) Matching
Once you have learned to recognise unwanted sounds, you can proceed to identify them individually and use the appropriate tools to process them. However, there are many occasions when you might encounter repeating sounds of similar type - things such as a crack in a vintage disc or the background noise caused by a piece of machinery in a modern recording.
The following image shows part of a recording of a live performance. The vertical lines are hand claps caused by a single person sited too close to one of the microphones; the general applause appears as a more diffuse cloud within the spectrogram.
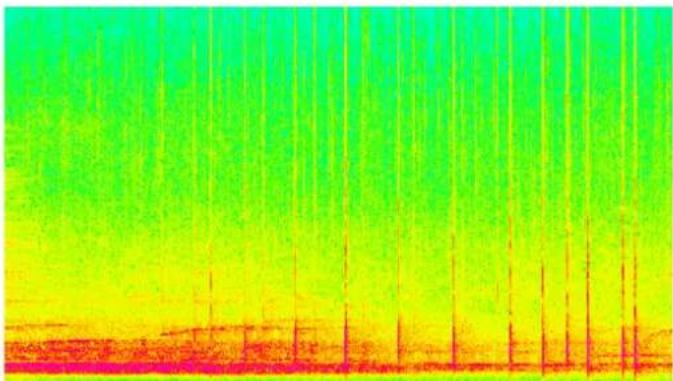
natural_image
Thermal or heat map image showing vertical gradient from green to red, with no visible text or symbolsOne way to approach this would be to identify each clap visually and then define each one individually prior to processing. A better approach would be to use the Match facility. This allows you to mark one of the offending sounds (preferably the one that best typifies of all of them) and ask Retouch to find the other instances within the recording.
Finding matches
Use the selection tools to define a suitable instance of the unwanted sound and then click on the now illuminated Match button to initiate identification. In the following screen, the darker instance in the centre of the screen is the one selected by the user, and the other grey areas are those identified by Retouch.
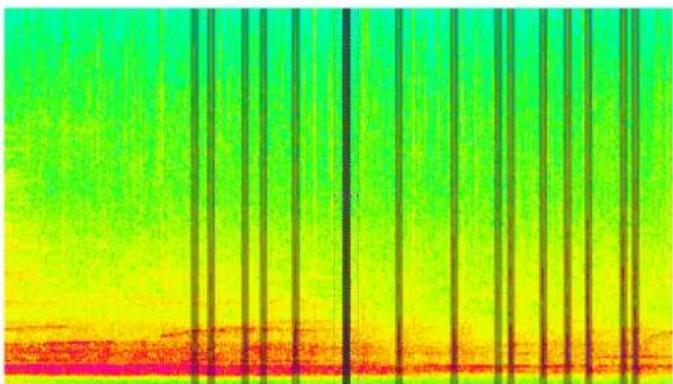
natural_image
Thermal or heat map image showing vertical lines transitioning from green to red, with no visible text or symbolsThreshold
These matches were obtained with the match probability threshold in its central, default position. If you feel that too few instances are being identified, you can slide the Threshold to the right to accept more matches. If you feel that events that do not match the defined instance are being included when they should not, you can slide it to the left.
Clearing matches

Sometimes you may choose an instance that, while visually similar, does not allow the system to identify other instances of the sound correctly. In this case, clear the current matching by pressing the Clear button and then try selecting another region containing a typical instance of the sound to be processed.
Individual or group processing
Having correctly identified the matches, you can process them individually or as a group.
Individual processing

Press Preview to see and hear the effect of the chosen process upon the area that you highlighted. If this is acceptable, click on Apply. If it's not, you may wish to redefine the unwanted sound and create new matches, or you may choose to leave this instance unprocessed and return to it later.

Now press the Next Instance button. This will take you to the next best match for the defined sound, NOT the next match in the timeline. Repeat the Preview and Apply cycle for this instance, and so on. At some point, you may decide that the less likely matches are not the same sound as the one that you defined and, at this point, you may choose to stop processing any further matches.

You can step back though the matches using the Previous Instance button.
Processing all matches

Having identified all of the matches, ensure that Preview is switched off and then press the Apply All button to process every accepted match in the file. (Note: this will create a single event in the Undo stack and a compound event in any reports you might generate.) The following image shows the file above processed in this way using the Interpolation tool.
After processing

Press Clear to remove the matches but leave the original selection in place.
Interpolate mode
Interpolate mode allows you to replace a region of audio with the best estimate of the audio that would have existed had that region (and the unwanted sound within it) not occurred.

The controls
Synthesis
This determines how close the sound of the replaced signal is to the sound of the original, unwanted signal.
At Synthesis = 0 (minimum) the marked region is replaced with the original signal: i.e. there is no change.
At Synthesis = 100 (maximum) the marked region is replaced with the calculated samples determined from the data contained in the wings, and the original signal has no influence on the result.
At Synthesis settings between 0 and 100, the original data are included in the calculation to a greater or lesser extent. You may ask why you would want to use any of the information contained in the unwanted noise. The answer is that it can help to create synthesised audio that best matches the true audio either side of the unwanted noise. This can be particularly useful at low frequencies.
Gain
This applies gain to the replacement audio in the range -150dB to +20dB. However, the edges of the replacement audio remain correctly matched to the original signal either side of the process area, so that there are no clicks or pops introduced.
There are a number of reasons why you may wish to apply gain to the replacement audio. For example, the data in the wings may be louder than the required data in the process region, and a small attenuation may enable you to match the calculated audio to the desired result. You can also use reduction with the Synthesis set to zero to attenuate or accentuate small areas of signal such as individual harmonics or breath noise.
The default settings [synthesis = 100 and reduction = 0] remove the audio in the process area and replace it with synthesised data. These are appropriate for removing loud, unwanted noises.
Preview and Apply
When you are happy with your settings, press the Preview button to invoke processing, which will be performed on the active channel(s). The progress bar within the button will show how much of the calculation has been completed. The larger the process area or wings, the longer the process will take. You can abort the process by clicking on Preview a second time.
Depending upon the size of the process area, it may take a few moments for the command to take effect. Sometimes the progress bar will move backwards. This indicates that the process has rejected a given set of synthesised data, and is recalculating a better solution.
If you are not happy with the result, you can pick up and move the marked region or adjust it and its wings using the grab handles. You need not press Preview again - as soon as you have finished adjusting the region, the existing preview will be dumped and the audio will be reprocessed.
When you are happy with the result obtained, press the Apply button to lay the corrected audio back into the file processor. You may also ignore the Preview stage and immediately press Apply to process the audio and lay it back in a single action. The figures below show the result of interpolating the marked click.
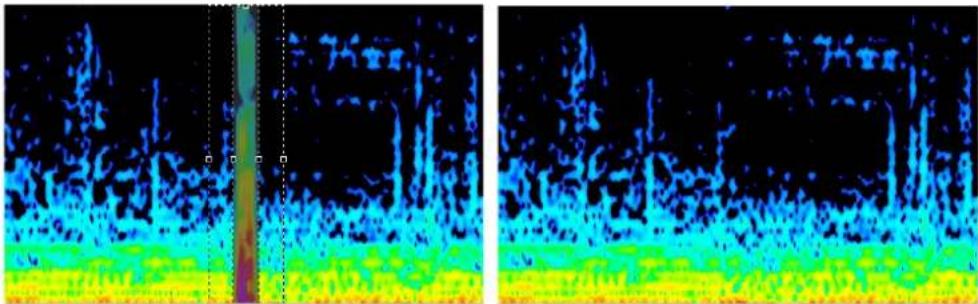
natural_image
Two side-by-side heatmaps showing temperature distribution across a dark field, with color gradient from yellow to blue indicating intensity (no text or symbols)Interpolation example #1: Removing a Noise Burst
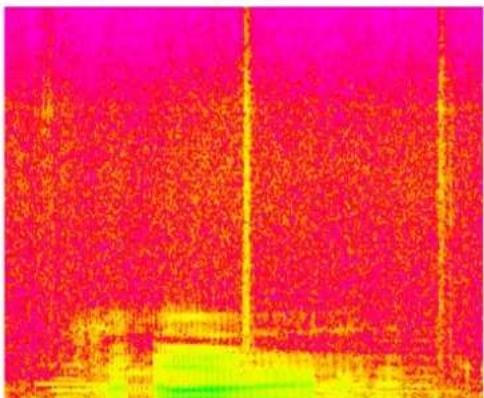
natural_image
Thermal imaging view showing heat distribution with red, orange, and green zones (no text or symbols)This spectrogram shows about two seconds of 44.1kHz audio. You can see two yellow vertical bars that represent two loud events, one in the centre, and one to the far right. We will concentrate on removing the one in the centre.
At first sight this appears to stretch across all frequencies. However, if you look at the low end, you can see the presence of two musical tones (which appear as the green areas). These tones do not appear to be affected by the disturbance, suggesting that, even though we cannot see it, the lowest extent of the unwanted noise is between 1kHz and 3.5kHz.
Too diffuse and far too long to be a distinct click, experience tells us (even without hearing the audio) that this event is a "chuff" of mid- and high-frequency noise, probably from a transcribed disc. We will now use the information gained from this spectrogram to help remove the noise without damaging the desired signal.
Marking the Burst
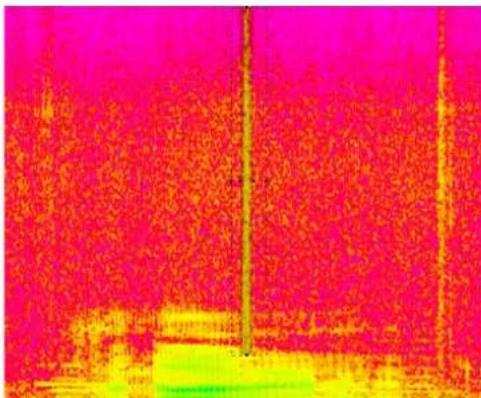
natural_image
Thermal imaging view showing heat distribution with red and yellow regions (no text or symbols)On this occasion, it is not necessary to zoom into the spectrogram to identify the chuff. However, if you wish to do so, you could zoom in on the time axis.
The chuff is short and has little internal structure, so we can expect a single application of Retouch to remove it successfully. This would not necessarily be the case if, for example, it showed a resonant tail.
Having located the chuff, mark it using the interpolate tool. In this example, the durations of the wings have been adjusted such that more audio is included after the chuff than before. This is because there is a signal before the chuff (in the region 4kHz to 5kHz) that could adversely affect the synthesis of the replacement audio.
Furthermore, the chuff has not been marked below 3kHz. This is because the low frequency content of the recording will in all likelihood mask any residual noise if it exists.
Removing the Burst
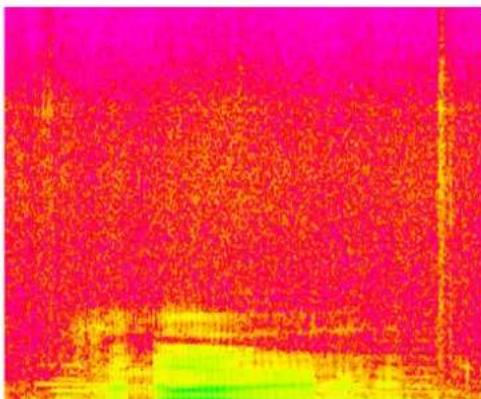
natural_image
Thermal imaging view showing heat distribution with red, orange, and yellow regions (no text or symbols)Select an appropriate value for Synthesis. In this example, the maximum value of 100 is correct because (i) there is no obvious meaningful signal within the marked region, and (ii) the audio adjacent to the marked region appears to be consistent and therefore a good model for the replacement.
Because the surrounding signal appears consistent in amplitude, and because we are not incorporating any of the original data in the calculation, it is unnecessary to match the replacement audio using the Gain control. Consequently, set the gain to 0dB.
Now click on Preview. Retouch will remove the chuff, substitute synthesised audio, and re-display the spectrogram with the new audio inserted. As you can see, the chuff has disappeared and the marked region contains audio that is indistinguishable from the surrounding area.
Click on the Play button to audition the result. If it's acceptable, click on Apply. You may now proceed to process other areas of the spectrogram, or close Retouch as desired.
Interpolation example #2: Removing a Horn
Not all noises are as obvious as the burst in the previous example, and not all can be removed using a single application of Retouch. The following example demonstrates how you may need to use multiple applications to eliminate sounds buried within the signal.
heatmap
| Value Range | Color Intensity | |-------------|-----------------| | Low | Red | | Medium | Orange | | High | Green |This spectrogram shows the sound of a car horn that occurred during a piece of otherwise wanted signal. You can see this as a small region of green horizontal lines in the centre/bottom of the display.
The sound underneath the car horn is that of a choir inhaling prior to singing the notes that appear as the large green and cyan area on the right of the display. It is important that the horn is removed without damaging the delicate breath sound represented by the diffuse yellow areas.
natural_image
Thermal or heat map image with gradient color bands from red to green and yellow (no text or symbols)Zooming in on the region containing the horn yields the spectrogram above, and shows the harmonic structure of the noise more clearly. You can see a significant region of audio on either side of the horn; this allows you space to place and manipulate the wings.
The next spectrogram shows how you can remove each of the harmonics individually.
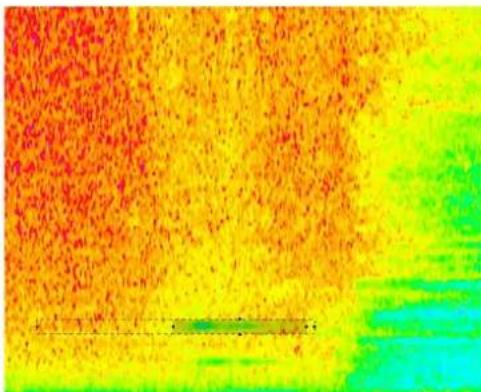
natural_image
Thermal or heat map image showing a gradient from red-orange to green-blue, with no visible text or symbols.There is nothing to stop you from processing the unwanted noise in one application of Retouch, mapping out the whole area in a single sweep of the Interpolate tool, but you will achieve better results if you apply the process individually to each harmonic. This is because, if you mark the whole region as unwanted, you will be including much of the breath sound as 'bad', when it clearly is not. A more precise approach ensures that you remove the bad sound with minimum impact upon the good.
Removing the harmonics individually
Having decided to remove each harmonic individually, you can mark the first, choose the extent of the wings, choose suitable settings for Synthesis and Gain, and then apply Retouch. If the result of this appears satisfactory, you then select the second harmonic and repeat the process. Do this a third time, and a fourth, and so on until all the harmonics have been eliminated.
It is important that the wings are appropriate for each application of the process, and what is suitable for one harmonic may not be suitable for another (although it often is). If you study the spectrogram above you can see that the wing to the left has been extended, while the one to the right has been truncated. This ensures that none of the audio in the sung notes to the right is used in the synthesis. (The horn is superimposed only on breath sounds, not the notes.)
Removing the harmonics as a set of separated composite shapes
It is possible to remove all the harmonics in a single application of Retouch by marking them as a set of separated composite shapes.
Mark the first harmonic that you wish to remove. Then, while holding down the
This technique works well for multiple objects separated in frequency (along the Y axis) but is not appropriate for restoring multiple objects - such as a succession of clicks - separated in time (along the X axis). To use Retouch as a declicker, you should mark and process each event individually.
natural_image
Thermal or heat map image showing a gradient from red to green-yellow with no visible text or symbolsThis spectrogram shows the audio with all the harmonics removed.
Patch mode
Patch mode allows you to replace an area of audio with another of the same duration and the same range of frequencies (although not necessarily of the same frequencies). Think of this as copying the data from elsewhere in the spectrogram to the region that you initially defined.

To replace an unwanted burst of noise with some audio from nearby, select Patch mode and define the region that you are going to patch. No wings will appear because they are not appropriate for this operation.
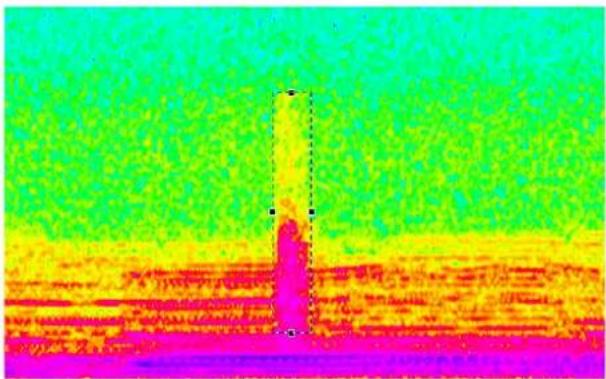
natural_image
Thermal or heat map visualization showing a vertical bright region against a green-to-red gradient background (no text or symbols)Having marked the audio you will find that the cursor turns into a hand icon when you move it over the marked area. You can now move the selection area to a new position to determine what audio will be substituted into the marked area.
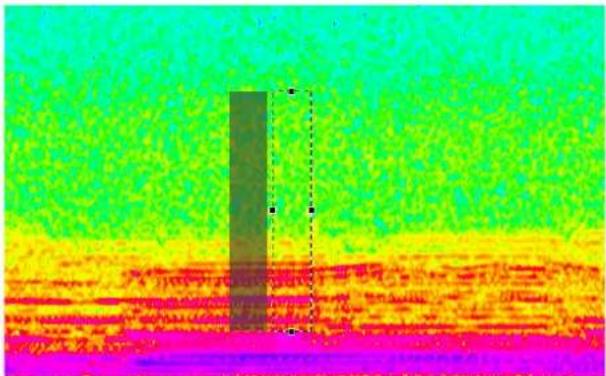
natural_image
Thermal or heat map image showing a vertical gradient bar and horizontal bands, with no visible text or symbols.Click on Preview to perform the substitution and, if you are happy with the result, click on Apply to lay the audio back.
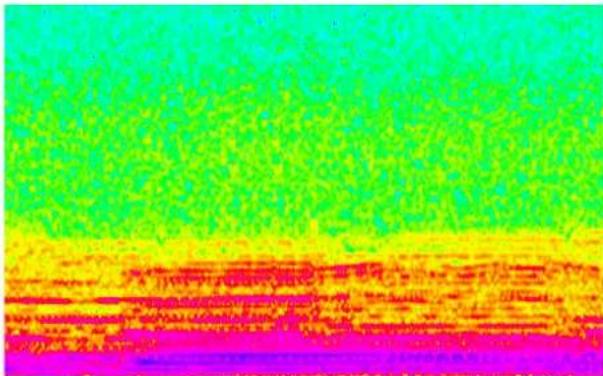
natural_image
Thermal or heat map image showing a gradient from green to red, with no visible text or symbolsYou may click anywhere outside the source or destination areas to clear the marquee. Otherwise, click within the greyed out area to move the source and/or the marqueed area to find a more appropriate substitution.
Lock direction

Often, you will want to patch a block of audio from one point in time to another, but with the same range of frequencies. Click on the lock icon to constrain the movement of the marked area to either up/down or left/right. The direction will be determined when you first move the area.
When lock is On, the arrows change colour, as below.

Linear shift
The source and destination marquees cover the same number of frequencies. For example, a marked area covering the range 1,000Hz - 1,100Hz will cover the range 10,000Hz - 10,100Hz if patched to those frequencies.
Selecting this option is appropriate when the material has no discernible tonal content.
Pitch shift
The marked areas take account of the relative pitch of the components within them. For example, a marked area covering the range 1,000Hz - 1,100Hz will cover the range 10,000Hz - 11,000Hz if patched to those frequencies.
This option invokes a pitch shift algorithm appropriate for harmonically rich material.
Match edges
The amplitude of the patched audio is adjusted to best fit the amplitude of the surrounding audio. Retouch achieves this by 'tilting' the new audio to accommodate changes on the time axis (for example, a fade out) and changes on the frequency axis (for example, to match audio that has been subjected to low-pass filtering).
Copy mode
Copy mode allows you to move an area of audio to another position. You can think of this as copying the data from a defined region to anywhere else in the spectrogram. In this example, we will use a region of typical background to overwrite an unwanted audio event (which is a noise burst).

To begin, select Copy mode, and define the region that you are going to copy. No wings will appear because they are not appropriate for this operation.
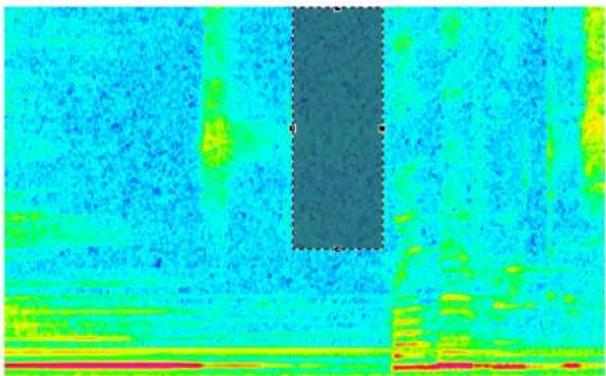
natural_image
Thermal or heat map image showing a dark rectangular region with a dashed line and scattered blue and green areas, no visible text or symbols.Having marked the audio you will find that the cursor turns into a hand icon when you move it over the marked area. You can now move the audio, depositing it in a new position as you choose.
You may now determine the proportions in which the original (base) signal and the copy are mixed, applying gains to each in the range -150dB to +20dB.
For example, to overlay the copy at the same amplitude as the region from which it was copied, set the Copy Gain to 0dB. To eliminate the underlying signal completely, set the Base Gain to -150dB.
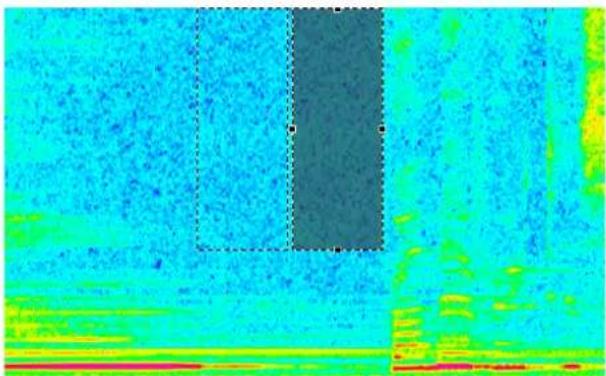
natural_image
Thermal or heat map image showing a dark rectangular region within a blue-to-green gradient background, with no visible text or symbols.Click on Preview to perform the substitution and, if you are happy with the result, click on Apply to confirm the change.
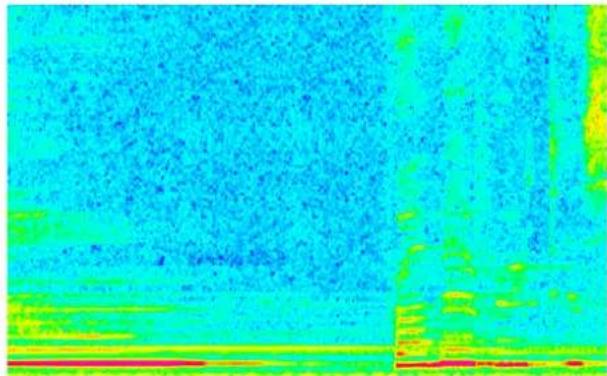
natural_image
Thermal or heat map image showing a gradient from blue to yellow-green, with no visible text or symbolsYou may click anywhere outside the source or destination areas to clear the marquees. Otherwise, click within the greyed out area to move the source and/or the marqueed area to find a more appropriate substitution.
Lock direction

Often, you will want to copy a block of audio from one point in time to another, but with the same range of frequencies. Click on the lock icon to constrain the movement of the marked area to either up/down or left/right. The direction will be determined when you first move the area.
When lock is On, the arrows change colour, as below.

Linear shift
The source and destination marquees cover the same number of frequencies. For example, a marked area covering the range 1,000Hz - 1,100Hz will cover the range 10,000Hz - 10,100Hz if copied to those frequencies.
Selecting this option is appropriate when the material has no discernible tonal content.
Pitch shift
The marked areas take account of the relative pitch of the components within them. For example, a marked area covering the range 1,000Hz - 1,100Hz will cover the range 10,000Hz - 11,000Hz if patched to those frequencies.
This option invokes a pitch shift algorithm appropriate for harmonically rich material.
Erase mode
This mode provides a quick and simple way to erase unwanted events and replace them with background (atmos) calculated from the surrounding audio.

In this example, you will replace the harmonics of a car horn with background generated by Retouch.
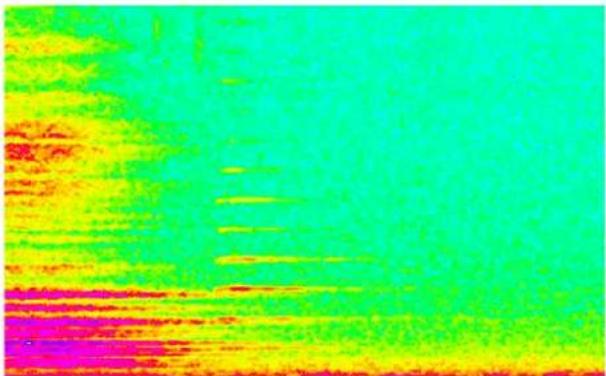
natural_image
Thermal or heat map image with gradient colors from green to red, no visible text or symbolsHaving identified the harmonics by eye, mark them as shown using the Add to Existing Selection tool or by pressing
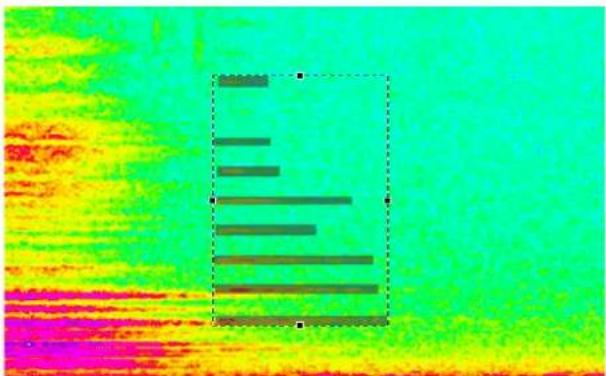
natural_image
Thermal or heat map image with horizontal green lines and a dashed box, no visible text or symbolsHaving done so, click on Preview to erase the audio in the marked regions and substitute background calculated by the process.
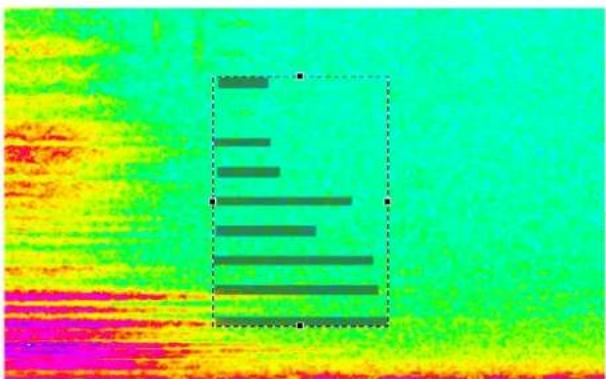
If you are happy with the result of the erase, click on Apply to confirm the change.
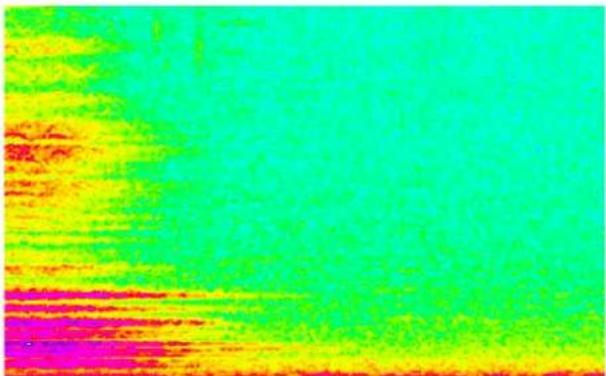
natural_image
Thermal or heat map image with color gradient from green to red, no visible text or symbolsFlat
The amplitude of the audio generated to replace the event in the marked region will be flat on both the time and frequency axes.
Tilted
The amplitude of the audio generated to replace the event in the marked region may have a gradient on the X-axis and/or on the Y-axis. This is calculated such that the edges of the generated audio best match the amplitude of the surrounding audio.
Volume mode
You may affect the amplitude of the signal within a region, and independently affect the amplitude of the signal lying outside that region. This allows you, for example, to reveal individual sounds or utterances within a file, either by amplifying the wanted sounds or by suppressing the rest of the audio, or both simultaneously. By marking multiple regions simultaneously and reducing the amplitude of the 'outside' to its minimum, you can also use this to retain only the sounds or words wanted in an audio file.

The example below shows a number of wanted sounds within a noisy background.
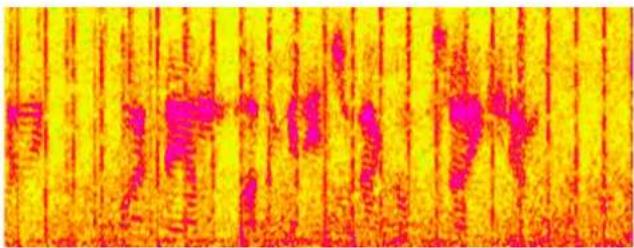
natural_image
Thermal image showing vertical yellow and orange lines with magenta overlay, no text or symbols presentUse the Polyline or paintbrush tools to select these in the usual fashion.
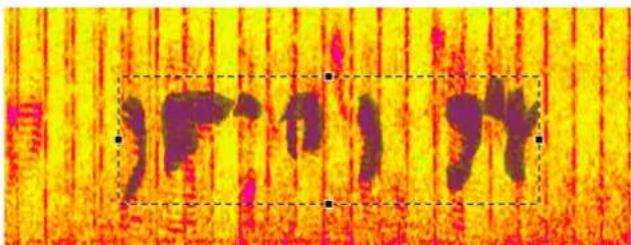
natural_image
Thermal imaging view of a human head with visible thermal gradient and no text or symbolsNow choose appropriate value for the Inner (marked) and Outer (unmarked) volumes. In this example, we have left the amplitude of the wanted sounds unaffected but attenuated the background by 50dB.
Press Preview and audition the result. Note that, to eliminate the introduction of artefacts, a short fade is applied to the edges of each of the regions. If you are not happy with this, leave Preview On, adjust the volume controls, wait for Preview to recalculate the audio, and audition again. When you are happy, click on Apply to confirm the change.
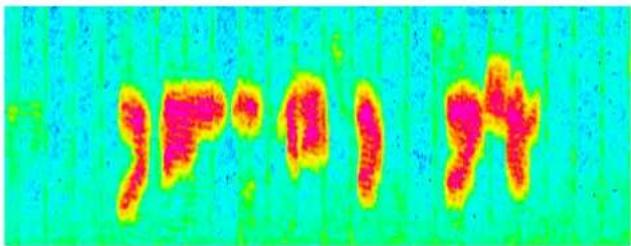
natural_image
Thermal or heat map-style image showing two distinct, irregularly shaped regions in red and yellow against a green background (no text or symbols)Now click on the spectrogram window to release the marquee.
Repair mode
Repair employs sophisticated AI techniques that allow you to affect the amplitude of loud events within a marked region without affecting the lower level signal and noise within that region.

To amplify or, more usually, suppress or eliminate an individual sound, select a region that contains it. The image below shows a large 'chuff' of sound during dialogue. Mark this is the usual fashion using one of the marquee tools. You should not mark the entire frequency spectrum or processing artefacts may result. In this example, the chuff reaches to around 20kHz in a recording with a 24kHz bandwidth.
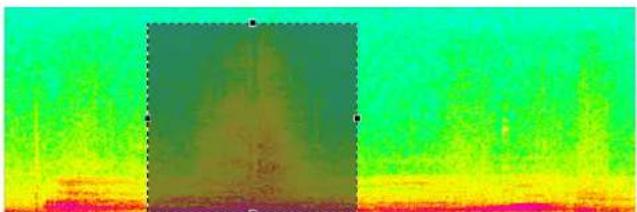
natural_image
Thermal or heat map image showing a vertical rectangular region with a central dark structure, surrounded by green and yellow gradients (no text or symbols)Having identified the unwanted sound, ensure that Preview is switched on and then use the gain control to attenuate or eliminate it. (If the sound is something that you would like to amplify, use the gain control to boost the signal by up to 20dB.) Unlike the Volume tool, only the significant signal within the marquee is identified and processed. Low level signals and ambient sound are left unaffected.
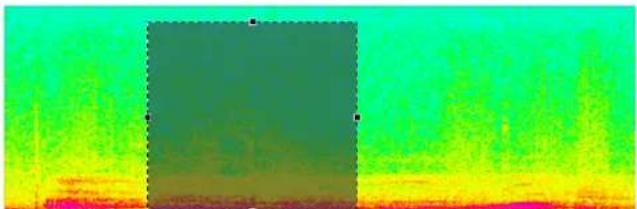
natural_image
Thermal or heat map image with a central rectangular block and gradient color bands (no text or symbols)Audition the result. If you are happy with this, press Apply to save the new data within the working copy of the file. (The source file is unaffected unless you save your work and overwrite it.) Alternatively, if you feel that a better result might be obtained, adjust the marquee and try again. You can do this while Preview is active and even while the audio is being played. A suitable loop will help you to audition your changes as you make them.
Cleanse mode
Despite the power of Interpolation, Patching and Copying, there are times when they are unable to eliminate unwanted sounds quickly and efficiently. Examples of this include a chuff of noise in a dense cluster of notes, or wind roar during speech. Cleanse was developed specifically to help in these situations, and may achieve results that cannot be obtained using the other methods.

In this example, we drastically reduce low frequency wind roar in the presence of speech. The first image shows the original audio. In the second, the roar has been identified and marked.
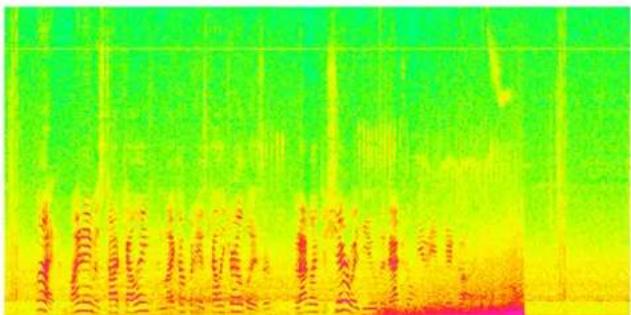
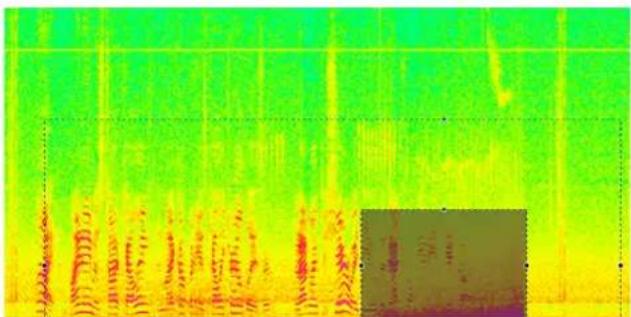
A large area has been marked around the region containing the roar. Retouch uses the information in this to build a model of 'good' audio which will be used to retain those elements in the marked region that are also deemed to be good, while attenuating those that are not.
Press Preview to audition the result. Click on Apply to confirm the change.
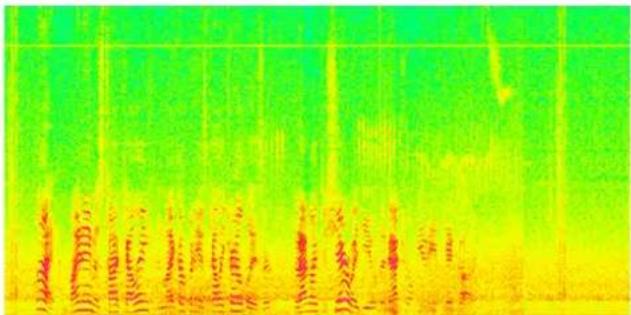
Revert mode
Undoing and redoing allows you step through the history of your actions. However, there may be many occasions when you want to undo an action (or actions) at one point in the timeline while leaving later actions elsewhere unscathed. Revert allows you to do so by replacing the current audio within a region with the audio from the original file.

In this example, we will reintroduce a transient sound that has been mistaken for a click. The first image below shows audio that appears to be affected by four clicks. In the second, these have been Retouched out from left to right using Interpolate mode.
natural_image
Thermal imaging view showing heat distribution with color gradient from green to red (no text or symbols)
natural_image
Thermal gradient image showing heat distribution with green, yellow, orange, and red zones (no text or symbols)Let's now suppose that, on playback, you have discovered that the third Retouch removed a genuine sound. You could Undo two stages to reintroduce this, and then reprocess the fourth sound as before. However, it's much quicker and more efficient to cause that area of the spectrogram to Revert to the original audio.
To do so, mark the region that you would like to Revert.
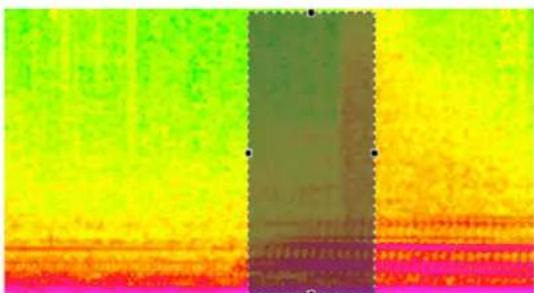
natural_image
Thermal or heat map image with vertical color bands and a central rectangular overlay (no text or symbols)
natural_image
Thermal or heat map image with gradient colors from green to red, no visible text or symbolsPress Preview to audition the result. Click on Apply to confirm the change.
Note: The area reverted does not need to contain all of a previous Retouch (or selection of Retouches). You can cause part of a Retouched region to revert to its original audio content.
Additional Information
This page left blank.
Contact Information and Support
Headquarters
| Address: | CEDAR Audio Ltd, 20 Home End, Fulbourn, Cambridge, CB21 5BS, UK |
| Telephone and Fax: | T: +44 1223 881771 F: +44 1223 881778 |
| Email: | support@cedaraudio.com |
USA Office
| Address: | CEDAR Audio USA, 82 Gilman Street, Portland, ME 04102, USA |
| Telephone and Fax: | T: +1 207 828 0024 F: +1 207 773 2422 |
| Email: | cedarusa@cedaraudio.com |
German Office
| Address: | CEDAR Deutschland, Görlitzer Str 3, D-49525 Lengerich, Deutschland |
| Telephone and Fax: | T: +49 5481 945087 F: +49 5481 945088 |
| Email: | info@cedaraudio.de |
Web
| English language: | www.cedaraudio.com |
| German language: | www.cedaraudio.de |
Worldwide Dealer List
For an up-to-date dealer list, please visit www.cedaraudio.com.
Technical Support
Should you experience difficulties with CEDAR Studio 9, please contact your local dealer or CEDAR office. Alternatively, you may send an email to support@cedaraudio.com. In either case, please provide the following details:
■ Your software version number.
■ Details of the host system and version numbers.
■ A precise description of the problem.
Licence and Limited Warranty
1. DEFINITIONS
In this Licence and Limited Warranty the following words and phrases shall bear the following meanings:
'the Company' is CEDAR Audio Limited of 20 Home End, Fulbourn, Cambridge, CB21 5BS, UK;
'the System' means any instance of the CEDAR Studio products developed by the Company, including but not limited to the Adaptive Limiter 2, Adaptive Limiter Time Adjuster, Auto Dehiss, Auto Dehiss Time Adjuster, Debuzz, Declick, Declip, Declip 2, Declip Time Adjuster, Decrackle, DNS One, DNS Two, Manual Declick, Dethump and Retouch;
'this Document' means this Licence and Limited Warranty.
2. ISSUE AND USE OF THE SYSTEM
2.1 The terms and conditions of this Document are implicitly accepted by any person or body corporate who shall at any time use or have access to the System, and are effective from the date of supply of the System by CEDAR Audio Limited to its immediate customer.
2.2 The Company hereby grants to the Licensee and the Licensee agrees to accept a non-exclusive right to use the System.
3. PROPERTY AND CONFIDENTIALITY
3.1 The System contains confidential information of the Company and all copyright, trade marks, trade names, styles and logos and other intellectual property rights in the System including all documentation and manuals relating thereto are the exclusive property of the Company. The Licensee acknowledges that all such rights are the property of the Company and shall not question or dispute the ownership of any such rights nor use or adopt any trading name or style similar to that of the Company.
3.2 The Licensee shall not attempt to reverse engineer, modify, copy, merge or transcribe the whole or any part of the System or any information or documentation relating thereto.
3.3 The Licensee shall take all reasonable steps to protect the confidential information and intellectual property rights of the Company.
4. LIMITED WARRANTY AND POST-WARRANTY OBLIGATIONS
4.1 The Company warrants that the System will perform substantially in accordance with the appropriate section of its accompanying product manual for a period of one year from the date of supply to the Company's immediate customers.
4.2 The Company will make good at its own expenses by repair or replacement any defect or failure that develops in the System within one year of supply to the Company's immediate customer.
4.3 The Company shall have no liability to remedy any defect, failure, error or malfunction that arises as a result of any improper use, operation or neglect of the System, or any attempt to repair or modify the System by any person other than the Company or a person appointed with the Company's prior written consent.
4.4 In the case of any defect or failure in the System occurring more than twelve months after its supply to the Company's immediate customer the Company will at its option and for a reasonable fee make good such defect or failure by repair or replacement (at the option of the Company) subject to the faulty equipment having first been returned to the Company. The Company will use reasonable efforts to return repaired or replacement items promptly, all shipping, handling and insurance costs being for the account of the Licensee.
4.5 The above undertakings 4.1 to 4.4 are accepted by the Licensee in lieu of any other legal remedy in respect of any defect or failure occurring during the said period and of any other obligations or warranties expressed or implied including but not limited to the implied warranties of saleability and fitness for a specific purpose.
4.6 The Licensee hereby acknowledges and accepts that nothing in this Document shall impose upon the Company any obligation to repair or replace any item after a time when it is no longer produced or offered for supply by the Company or which the Company certifies has been superseded by a later version or has become obsolete.
5. FORCE MAJEURE
The Company shall not be liable for any breach of its obligations hereunder resulting from causes beyond its reasonable control including, but not limited to, fires, strikes (of its own or other employees), insurrection or riots, embargoes, container shortages, wrecks or delays in transportation, inability to obtain supplies and raw materials, or requirements or regulations of any civil or military authority.
6. WAIVER
The waiver by either party of a breach of the provisions hereof by the other shall not be construed as a waiver of any succeeding breach of the same or other provisions, nor shall any delay or omission on the part of either party to exercise any right that it may have under this Licence operate as a waiver of any breach or default by the other party.
7. NOTICES
Any notices or instruction to be given hereunder shall be delivered or sent by first-class post or telecopier to the other party, and shall be deemed to have been served (if delivered) at the time of delivery or (if sent by post) upon the expiration of seven days after posting or (if sent by telecopier) upon the expiration of twelve hours after transmission.
8. ASSIGNMENT AND SUB-LICENSING
The Licensee may at his discretion assign the System and in doing so shall assign this Licence its rights and obligations to the purchaser who shall without reservation agree to be bound by this Licence. The original Licensee and any subsequent Licensees shall be bound by the obligations of this Licence in perpetuity.
9. LIMITATION OF LIABILITY
The Company's maximum liability under any claim including any claim in respect of infringement of the intellectual property rights of any third party shall be, at the option of the Company either:
(a) return of a sum calculated as the price received for the System by the Company from its immediate customer depreciated on a straight line basis over a one year write-off period; or
(b) repair or replacement of those components of the System that do not meet the warranties contained within this Document.
The foregoing states the entire liability of the Company to the Licensee.
10. CONSEQUENTIAL LOSS
Even if the Company has been advised of the possibility of such damages, and notwithstanding anything else contained herein the Company shall under no event be liable to the Licensee or to any other persons for loss of profits or contracts or damage (whether direct or consequential) arising in connection with the System or any modification, variation or enhancement thereof and including any documentation or data provided by the Company or for any other indirect or consequential loss.
11. ENTIRE AGREEMENT
The Company shall not be liable to the Licensee for any loss arising in connection with any representations, agreements, statements or undertakings made prior to the date of supply of the System to the Licensee.
12. TERMINATION
This Licence may be terminated forthwith by the Company if the Licensee commits any material breach of any terms of this Licence. Forthwith upon such termination the Company shall have immediate right of access to the System for the purpose of removing it.
13. SEVERABILITY
Notwithstanding that the whole or any part of any provision of this Document may prove to be illegal or unenforceable the other provisions of this Document and the remainder of the provision in question shall remain in full force and effect.
14. HEADINGS
The headings to the Clauses are for ease of reference only and shall not affect the interpretation or construction of this Document.
15. LAW
This Document shall be governed by and construed in accordance with English law and all disputes between the parties shall be determined in England in accordance with the Arbitration Act 1950 and 1979.
CEDAR Studio 9
CEDAR Audio Limited
20 Home End
Fulbourn
Cambridge
CB21 5BS
United Kingdom
t: +44 1223 881771
e: info@cedaraudio.com
w: www.cedaraudio.com
- Table Of Contents
- Retouch 63
- Additional Information 91
- Getting Started
- Unpacking and licensing
- Assumed Knowledge
- Troubleshooting Non-CEDAR Components
- Installing CEDAR Studio 9 – Mac
- CEDARAudioLtd-CEDARStudio9.pkg
- Installing CEDAR Studio 9 – PC
- Adaptive Limiter 2
- Why "Adaptive"?
- Controlling the attenuation profile
- Dual temporal controls
- Controlling the gain
- Threshold
- Ceiling
- Oversampling
- Controls
- Level
- Adaption
- Temporal
- Spectral
- Oversample
- Adaptive Limiter 2 Tutorial
- Limiting or Maximising?
- Processing audio
- Adaptive Limiter 2 Quantisation
- No re-quantisation applied
- Word length (bit depth)
- Shaping
- Adaptive Limiter 2 Time Adjuster
- Auto Dehiss
- Auto
- Manual
- Auto Mode
- Bias
- LF Bias (dB at 0Hz)
- Attenuation (dB)
- Manual Mode
- Tutorials
- LF Bias
- Attenuation
- Iterating the Procedure
- Noise Reduction in an MS environment
- Signals with a high Mid (M) noise component
- Signals with a high Side (S) noise component
- Emphasis and De-emphasis
- Auto Dehiss Time Adjuster
- Debuzz
- Introduction to Debuzz
- Defining the buzz
- Buzz Bandwidth
- Fundamental Frequency
- Tracking
- Tracking on/off
- Confidence Meter
- Removing the buzz
- Reduction
- Debuzz Tutorial
- Locating the fundamental frequency
- Declick
- In Use
- Declick Time Adjuster
- Declip 2
- Signal Analysis Window
- Clip Detection
- Output Gain
- Declip 2 Tutorial
- Using the Signal Analysis Window
- Removing the clipping
- Declip Time Adjuster
- Decrackle
- Decrackle Time Adjuster
- DNS One
- Introduction to DNS One
- Using the standalone version of DNS One
- Range Selectors
- Level Control
- Band Gain Controls
- Learn
- Activity Bargraphs
- Status
- Error messages
- Generic Plug-in Controls
- Automation
- DNS One Tutorials
- Range Selector
- Case studies
- Suppressing traffic noise and other ambient sounds
- First, identify the frequency range(s) in which the noise lies.
- Second, optimise the Level control.
- Third, refine the Band Gain controls for optimum suppression.
- Suppressing tape hiss
- Suppressing excessive reverberation
- First, set the range in which the reverberation lies.
- Second, set the Band Gain controls.
- Third, optimise the Level control.
- DNS Two
- Note about noise fingerprints:
- Off-line processes
- Dethump
- Identifying a thump
- Removing the thump
- Manual declick
- Identifying a click
- Removing the click
- Manual declick A:
- Manual Declick B:
- Retouch
- Introduction to Retouch
- ■ A tool for removing unwanted noises
- ■ A tool for editing sounds in both time and frequency space
- ■ A tool for revealing wanted sounds and suppressing unwanted background
- Getting started with Retouch
- Invoking Retouch
- Standalone version:
- CEDARRetouch
- Within AudioSuite (Pro Tools users only).
- The Transport Controls (standalone version only)
- Undo and Redo
- Reveal menus
- Hot Keys
- Resizing
- The Retouch Spectrogram
- Controlling the spectrogram
- The Colour Wheel
- Colour clipping
- Set to default
- Set to full
- Set to visible range
- Zooming, scales and harmonic markers
- Zooming
- Scales
- Examples of sounds that can be Retouched
- Recognising a Sound
- Clicks:
- Noise burst (or 'chuff'):
- Tonal noise:
- Defining sounds to be processed (1) Manually
- Defining a region
- Simple rectangular regions
- Complex regions
- Zooming (again)
- Resizing a region
- Multiple separate regions
- Defining the Wings
- Channel Activation
- Defining sounds to be processed (2) Matching
- Finding matches
- Clearing matches
- Individual or group processing
- Individual processing
- Processing all matches
- After processing
- Interpolate mode
- The controls
- Synthesis
- Gain
- Preview and Apply
- Interpolation example #1: Removing a Noise Burst
- Marking the Burst
- Removing the Burst
- Interpolation example #2: Removing a Horn
- Removing the harmonics individually
- Removing the harmonics as a set of separated composite shapes
- Patch mode
- Lock direction
- Linear shift
- Pitch shift
- Match edges
- Copy mode
- Erase mode
- Flat
- Tilted
- Volume mode
- Repair mode
- Cleanse mode
- Revert mode
- Additional Information
- Contact Information and Support
- Worldwide Dealer List
- Technical Support
- Licence and Limited Warranty
- DEFINITIONS
- ISSUE AND USE OF THE SYSTEM
- PROPERTY AND CONFIDENTIALITY
- LIMITED WARRANTY AND POST-WARRANTY OBLIGATIONS
- FORCE MAJEURE
- WAIVER
- NOTICES
- ASSIGNMENT AND SUB-LICENSING
- LIMITATION OF LIABILITY
- CONSEQUENTIAL LOSS
- ENTIRE AGREEMENT
- TERMINATION
- SEVERABILITY
- HEADINGS
- LAW
- CEDAR Studio 9
Brand : CEDAR
Model : Studio 9
Category : Audio software