
Bit Tune - Car audio system AUDISON - Free user manual and instructions
Find the device manual for free Bit Tune AUDISON in PDF.


| Product Type | Digital Signal Processor (DSP) for car audio |
| Brand | Audison |
| Model | Bit Tune |
| Dimensions (W x H x D) | 7.1 x 1.4 x 5.5 inches (180 x 35 x 140 mm) |
| Weight | 0.55 kg (1.21 lbs) |
| Power Supply | 12V DC (car battery), negative ground |
| Current Consumption | 1.2 A max |
| Sampling Frequency | 96 kHz |
| Bit Depth | 24-bit |
| Input Channels | 8 high-level/speaker-level inputs, 2 RCA inputs |
| Output Channels | 8 RCA pre-outs |
| Equalizer | 31-band graphic EQ + parametric EQ |
| Time Alignment | Up to 15 ms delay per channel |
| Crossover | Butterworth, Linkwitz-Riley, Bessel (12/18/24 dB/oct) |
| Remote Control | Optional DRC remote (sold separately) |
| Software | PC/Mac tuning software via USB |
| Maintenance | Clean with a soft, dry cloth; avoid liquids and abrasives |
| Safety | Professional installation recommended; disconnect battery before wiring |
| Spare Parts & Repairability | Contact authorized Audison dealer; no user-serviceable parts inside |
| Country of Origin | Italy |
Frequently Asked Questions - Bit Tune AUDISON
User questions about Bit Tune AUDISON
0 question about this device. Answer the ones you know or ask your own.
Ask a new question about this device
Download the instructions for your Car audio system in PDF format for free! Find your manual Bit Tune - AUDISON and take your electronic device back in hand. On this page are published all the documents necessary for the use of your device. Bit Tune by AUDISON.
USER MANUAL Bit Tune AUDISON
bit Tune
USER'S
MANUAL
rev. 3.0a
Index
1. BIT TUNE DESCRIPTION 4
1.1 PRECAUTIONARY NOTES 5
1.2 PACKAGING CONTENTS 6
2. DIMENSIONS 7
2.1 BIT TUNE DIMENSIONS 7
2.2 MICROPHONES-SIZE AND MOUNTING....7
3. DESCRIPTION OF BIT TUNE CONNECTION PANELS AND CONTROLS 8
3.1 FRONT PANEL 8
3.2 REAR PANEL 9
3.3 CONTROL PANEL 10
3.4 HSM MICROPHONE ("HEARING SIMULATION MICROPHONE"). 11
3.5 LPM MICROPHONE("LEVEL POLARITY MICROPHONE"). 12
4. CONNECTIONS 13
4.1 POWER SUPPLY AND SWITCHING ON 13
4.2 PERSONAL COMPUTER....14
4.3 MEASUREMENT MICROPHONE INPUTS 15
4.4 INPUT SIGNALS 16
4.5 OUTPUT SIGNALS....17
5. SOFTWARE AND DRIVERS INSTALLATION 19
5.1 PC SOFTWARE AND DRIVER INSTALLATION WIZARD....19
5.2 UNINSTALLING BIT TUNE SOFTWARE AND DRIVER....26
6. BIT TUNE DESKTOP 27
6.1 SOFTWARE START IN OFFLINE MODE....28
6.2 SOFTWARE START IN BIT TUNE + PROCESSOR MODE 29
6.2.1 CONNECTION STATUS MENU 31
6.2.2 SESSION NOTE MENU 31
6.2.3 "FILE" MAIN MENU 32
6.2.4 "TOOLS" MAIN MENU 34
- Oscilloscope 34
- Real time analyzer....36
- Generator 41
-
Player 42
-
Polarity check....43
- Battery Scope 44
- Target curve 45
- Source check 47
- Create report 49
6.2.5"SETTINGS" MAIN MENU....50
- MIC calibration....50
- Connect to 50
- Disconnect to 50
- Company info....51
- Language 51
6.2.6 PROCESSOR AUTO SETUP MENU....51
6.2.7 SESSION TOOLS MENU 52
6.3 SOFTWARE START IN BIT TUNE MODE....52
7. USING BIT TUNE WITH THE HELP OF A PC 53
7.1 SOURCE CHECK....53
7.2 AUTOMATIC CALIBRATION OF THE HSM MICROPHONE 56
7.3 PHASE DETECTION OF SPEAKERS: POLARITY CHECK....58
7.3.1 ELECTRICAL PHASE DETECTION OF SPEAKERS IN A SYSTEM WITH AUDISON bit PROCESSOR....59
7.3.2 ELECTRICAL PHASE DETECTION OF SPEAKERS IN AN AUDIO SYSTEM 61
7.4 CALIBRATION OF THE SYSTEM'S SENSITIVITY LEVEL 62
7.4.1 SETTING THE SENSITIVITY LEVEL OF AMPLIFIERS WITH Audison bit PROCESSOR 62
7.4.2 CHECKING THE SIGNAL LEVELS IN AUDIO SYSTEMS: LEVEL CHECK....65
7.5 CALIBRATION OF THE SENSITIVITY LEVEL OF A SYSTEM WITHOUT Audison bit PROCESSOR....67
7.6 AUTOMATIC CALIBRATION OF THE PROCESSOR: AUTO EQ + AUTO TIME ALIGNMENT....69
7.6.1 DSP CONNECT MODE....69
7.6.2 BIT ONE HD VIRTUOSO OFFLINE MODE DATA PROCESS 73
7.7 AUTOMATIC CALCULATION OF TIME DELAYS: AUTO TIME ALIGNMENT....76
7.8 RTA MEASUREMENT 79
7.8.1 RTA OF AN AUDIO SYSTEM WITH Audison bit PROCESSOR....79
7.8.2 RTA: CALIBRATION OF AN AUDIO SYSTEM WITHOUT AUDISON BIT PROCESSOR AUTOMATIC OF THE HMS MICROPHONE....82
7.9 BATTERY SCOPE 84
7.10 MEASUREMENTS WITH AN OSCILLOSCOPE....86
7.10.1 MEASUREMENTS ON A POWER AMPLIFIER 86
- USING BIT TUNE WITHOUT A PC 89
8.1 LOAD SIMULATOR SPEAKER IN....89
8.2 SPEAKER IN SIMULATOR....91
8.3 LINE ANALYZER 92
8.3.1 ANALOG LINE PRE 92
8.3.2HI-LEVEL ANALOG LINE....93
8.3.3 OPTICAL S/PDIF DIGITAL LINE 94
8.4 ELECTROMAGNETIC NOISE ANALYZER....95
- TROUBLESHOOTING 96
9.1 SYNC WITH THE PC 96
9.2 DEVICE NOT RECOGNIZED DURING INSTALLATION 96
9.3 REPLACEMENT OF BNC INPUT FUSE 97
9.4 BIT TUNE and BIT TUNE + Processor MODE FIRMWARE UPGRADE 98
9.5 "RESCUE MODE" FIRMWARE UPGRADE 100
9.6 "RESCUE MODE UPGRADE MODE ON" FIRMWARE UPGRADE 101
9.7 REPLACEMENT OF THE INTERNAL POWER SUPPLY FUSE 105
- TECHNICAL SPECIFICATIONS 106
1. BIT TUNE DESCRIPTION
The bit Tune is a set of electronic tools that improve and simplify audio installations in cars.
The system consists of an audio interface featuring a set of microphones, various connections and a connection to the PC where the software is the user interface and provides for the management and analysis of the audio system.
The tools are mainly divided into two groups, requiring a connection to the PC: self-calibration of Audison bit processors, and electrical and acoustic analysis tools.
There is an additional group of tools that do not require a PC and that can help in solving some of the problems that are often encountered in car audio installations.
The bit Tune, in addition to being a valuable tool to optimally and quickly calibrate the Audison bit signal processors, is also a very useful set of electronic tools which, in audio applications, replaces several bulky, expensive and complex traditional instruments that are often not available.
With the bit Tune there is considerable support for increasing audio knowledge, finding solutions to complex issues and experiment according to your creativity.
AUTOMATIC CALIBRATION OF AUDISON BIT PROCESSORS
The PC software, through the hardware acquisition system connected to the PC via USB, performs the analysis of the acoustic response of the car's passenger compartment and it sets, through a Target curve, the optimal acoustic response and time delays that the installed processor will store in memory.
The Target curve is a goal to be achieved taking into account several factors:
A) Type of vehicle's passenger compartment.
B) Type of amplification system installed.
C) Response of the speakers.
D) Type of processor installed.
The Target curve can be linear (Flat curve) ensuring a linear response that can be measured with specific tools through the RTA measurement. Experience suggests that a certain degree of coloration of the response gives greater pleasure to the listening. There are therefore three other Target curves (HAC- Harmonized Acoustic Curve) that can be selected according to personal tastes.
The Target curve can also be modeled at will (Custom) to allow sound characterization according to personal listening experience.
In order to listen to the different target curves it is necessary to allow the bit Tune to program the processor using its available memory. Sound processing is performed by the processor, following the instructions provided by the bit Tune.
1.1 PRECAUTIONARY NOTES
Before using the bit Tune, please refer to all instructions contained in the manual. We recommend to closely follow the instructions. Failure to comply with these instructions could result in unintentional injuries or damage to equipment or devices connected to it.
WARNING: do not connect the bit Tune probes to the mains voltage. The product is not designed for measuring the mains voltage (110/220 VAC). Such connection, in addition to damaging the device, it could be very dangerous to the user!
- In order to use the measurement tools of the bit Tune, you must install the software on a personal computer running Windows XP, Windows Vista or Windows 7, with a 1.5 GHz processor or higher, 1 GB of RAM and a graphics card with minimum resolution of 1024 x 600 pixels.
Note: - The bit Tune PC software might show malfunctioning with some PCs manufactured before 2006 even with processors running at higher speed than the minimum required. It is recommended to check using "Windows Update" and make sure that the available updates are installed in the PC. - Before performing the measurements, check that the Antivirus is not scanning the PC. If you experience any problems, it is advisable to disable the Antivirus, even if it is not scanning the PC, and close all the other running programs.
- Please use only the specific power adapters provided in the package.
- For use in the car please check that the vehicle's electrical system has a supply voltage of 12 VDC with negative to ground. If you are using the network adapter, select the power supply connector suitable for the country of use (provided in the package).
- Do not perform any measurement in the engine compartment and in locations exposed to water, excessive moisture, dust and dirt.
- Take measurements in places where the temperature does not go below 0 °C (32 °F) and does not exceed 55 °C (131 °F).
- Make sure that the positioning of the device does not interfere with the proper functioning of the car's electrical or mechanical devices.
- Make sure you do not short the power cord during the measurement.
- In order to facilitate the measurement, route the cables the best possible way, using cables supplied with the product and referring to instructions provided in the USER'S MANUAL.
1.2 PACKAGING CONTENTS
- BIT TUNE
- HSM microphone:
- LPM microphone:
- LPM microphone fixing strap:
- HSM microphone bracket mount + rubber support:
- N.1 EMS: ELECTROMAGNETIC SNIFFER
- N.2 Passive Voltage Probe 1X - 10X:
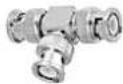
- N.1 BNC T adapter:
- N. 4 Kit of cables and adapters for measurements:
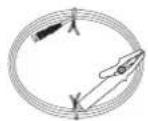
- N.1 Ground cable with alligator connector:
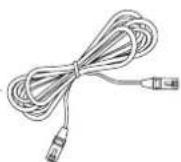
- 3.0 m USB cable:
- N.2 Fuse:
- 12 V plug-in car power cord:
- Power supply adapter, with adapters:
- ABS carrying case:
- CD ROM, containing: bit Tune Software This User Guide (.pdf) Audio test tracks
- Quick start guide
- Warranty


natural_image
Pure diagram of a circular device with internal components and a pointer, no text or symbols present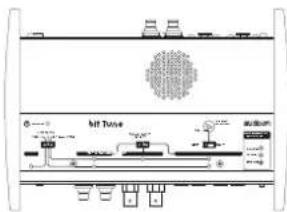


natural_image
Illustration of a handheld device with a U-shaped cable and a rectangular connector (no text or symbols)

X4

natural_image
Pure electrical component diagram showing a battery, diode, and plug (no text or symbols)


2. DIMENSIONS
2.1 BIT TUNE DIMENSIONS
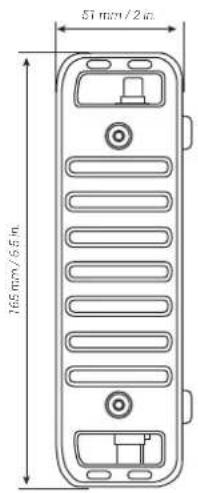

2.2 MICROPHONES-SIZE AND MOUNTING
HSM


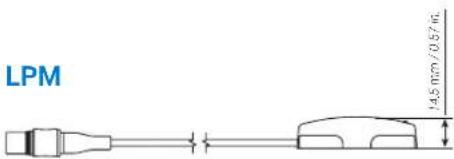
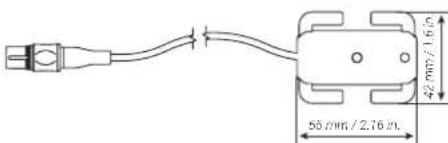
700 mm / 27.55 in

natural_image
Diagram of a black wristband with a rectangular grip and a circular head, shown with measurement lines (no text or symbols)2000 mm / 78.74 in

natural_image
Diagram of a cylindrical object with segmented bands and a handle, no text or symbols present3. DESCRIPTION OF BIT TUNE CONNECTION PANELS AND CONTROLS
3.1 FRONT PANEL

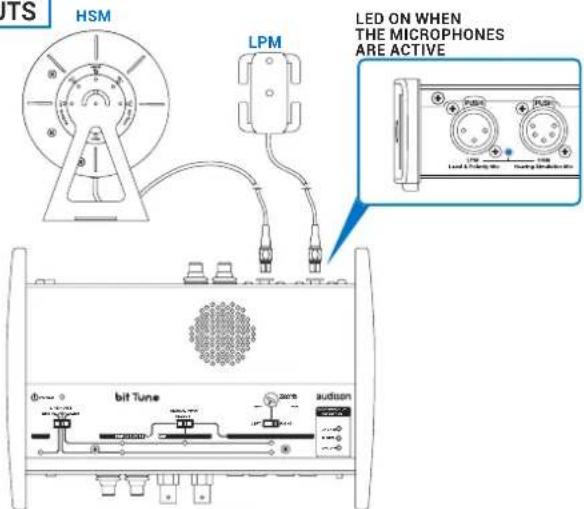
- LPM Level Polarity Mic: LPM Microphone input. (see sect. 3.5).
- HSM Hearing Simulation Mic: Microphone input for HSM multi-microphone. (see sect. 3.4).
- Check MIC: Indicator of microphone sockets activation during measurement.
- PRE OUT L-R: Low-level analog signal output.
- OPTICAL OUT: S/PDIF digital optical output STEREO 192 kHz/24bit MAX.
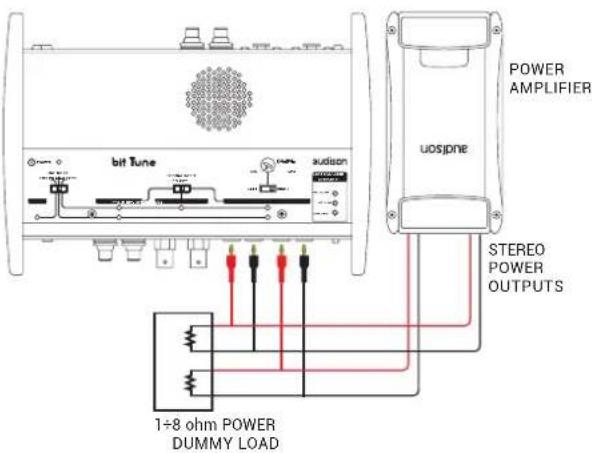
- SPEAKER OUT R + - L + -: High-level outputs that can be activated to test the ART function of amplifiers, processors.
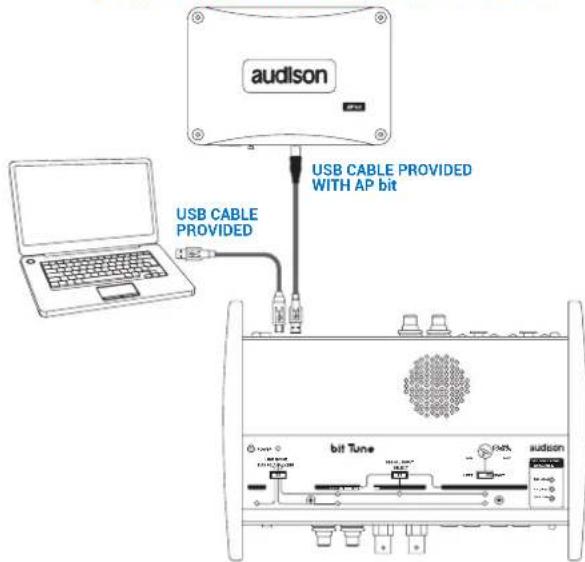
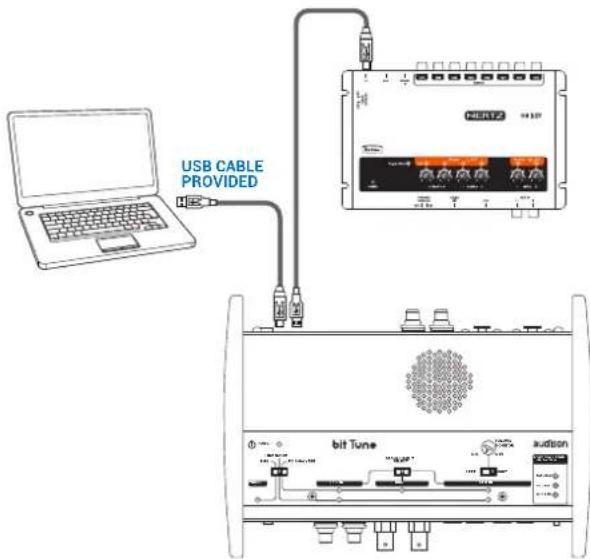
- USB OUT: USB (A) connection socket, to connect an Audison processor (bit One, bit Ten, bit Ten D) to the bit Tune and manage the calibration functions. The connection standard is USB 1.1 / 2.0 compatible.
- USB IN: USB (B) connection socket, to connect the processor to a PC and manage functions via the bit Tune PC software. The connection standard is USB 1.1 / 2.0 compatible.
- DC 12V: Jack for external power supply. Please use the power adapters supplied with the product.
WARNING: Observe the polarity and supply voltage (12 V DC) provided on the product's screen print label. An

- POWER ON/OFF: Button for turning the product on and off. The blue POWER LED indicates that the product is switched on (see sect. 4.1.3).
3.2 REAR PANEL

- EMS COIL PICK-UP: Input for inductive probe (see sect. 8.4).
- OPTICAL IN: Optical S/PDIF Digital input stereo 192 kHz/24bit MAX.
- PRE IN L R: Measurement input with RCA connectors. Input sensitivity 70 V RMS max. (see sect 6.2.4.1, sect 6.2.4.8). These jacks are used for measuring pre-amplified signals.
- BNC PROBE L R: Measurement input with BNC connectors. Input sensitivity 70 V RMS max (see sect. 6.2.4.1, sect. 6.2.4.8) and 700 V RMS activating the attenuator on probe X10. The BNC PROBE L R inputs are internally protected by a T0.5A micro-fuse (see section 9.3) To connect to these inputs, use Probes provided inside the product's packaging:
WARNING: Do not use these jacks to:
Measure the outputs of bridge tied amplifiers (btl).
- Measure mains voltage (110 - 240 V) and devices connected directly to the mains.

natural_image
Pure electrical circuit lines without any symbols- SPEAKER IN L - R: Measurement input with 4 mm banana sockets.
Input Sensitivity max 700 V RMS (see sect. 6.2.4.1, sect. 6.2.4.8). Use these jacks for level and power measurements. e package includes terminated cables with 4 mm banana plugs with different types of termination:
a. 2 pairs; 4 mm Banana / 2 mm Banana
b. 2 pairs, 4 mm Banana / Alligator
c. 2 pairs; 4 mm Banana / Spade connector
d. 1 pair; 4 mm Banana / Measuring probe

- SPEAKER LOAD SIMULATOR-SELECTOR: Button for the selection of the simulated load on a OEM source. Through the SPEAKER LOAD SIMULATOR LEDs (see sect. 3.3.12-13) you can check the need of the source to have a load (speaker) in order to operate (see sect. 8.1).
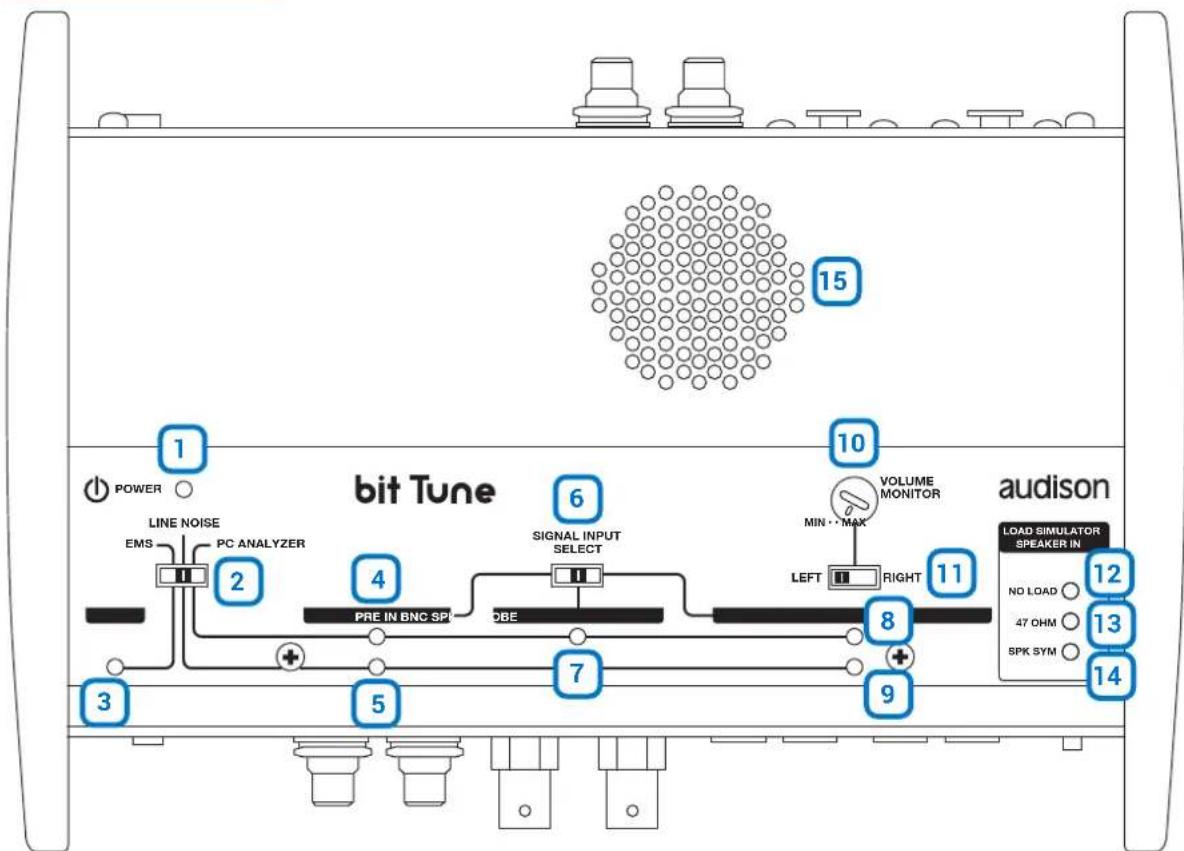
3.3 CONTROL PANEL
flowchart
graph TD
    A["1"] --> B["LINE NOISE"]
    B --> C["EMS"]
    C --> D["PC ANALYZER"]
    D --> E["2"]
    E --> F["PRE IN BNC SPI"]
    F --> G["OBE"]
    G --> H["6"]
    H --> I["SIGNAL INPUT SELECT"]
    I --> J["7"]
    J --> K["8"]
    K --> L["9"]
    L --> M["10 VOLUME MONITOR"]
    M --> N["LEFT"]
    N --> O["RIGHT"]
    O --> P["11"]
    P --> Q["12 LOAD SIMULATOR SPEAKER IN"]
    Q --> R["13 NO LOAD"]
    Q --> S["14 47 OHM"]
    Q --> T["15 SPK SYM"]
- POWER: The blue LED indicates that the bit Tune is powered on.
- EMS - LINE NOISE - PC ANALYZER: Switch for selecting measurement settings.
- PROBE: The yellow LED indicates that the EMS socket is activated (see sect. 8.4).
- PRE IN PC ANALYZER LED: Green LED, indicates the PRE IN input selection for measurements performed through the bit Tune PC software (see sect. 7).
- PRE IN LINE NOISE LED: Yellow LED, indicates the PRE IN input selection for the measurement of noise through the internal speaker monitor of the bit Tune.
- SIGNAL INPUT SELECT: Switch for the selection of PRE IN, BNC, SPK IN measurement inputs of the bit Tune.
- BNC PC ANALYZER LED: Green LED, indicates the PRE IN input selection for measurements performed through the bit Tune PC software.
- SPK IN PC ANALYZER LED: Green LED, indicates the SPK IN input selection for measurements performed through the bit Tune PC software.
- SPK IN LINE NOISE LED: Yellow LED, indicates the SPK IN input selection for measurements performed through the bit Tune PC software
- VOLUME: Volume control of the internal speaker monitor of the bit Tune.
- Ch LEFT Ch RIGHT: Switch for selecting the SPK IN Left or Right input in line noise analyzer mode.
12-13-14. LOAD SIMULATOR SPEAKER IN: Through the SPEAKER IN LOAD SIMULATOR-SELECTOR button (see sect. 3.2.6); it is possible to verify, through the switching of the LEDs, if the source requires a load for operating properly ____ (see sect. 8.1).
NO LOAD: Green LED. No load.
47 OHM: Yellow LED. Requires a 47 Ohm - 5 W resistance.
SPK IN: Orange LED. Requires an inductive load. - SPEAKER MONITOR: Internal speaker for monitoring audio signal inputs to the bit Tune.
3.4 HSM MICROPHONE ("HEARING SIMULATION MICROPHONE")
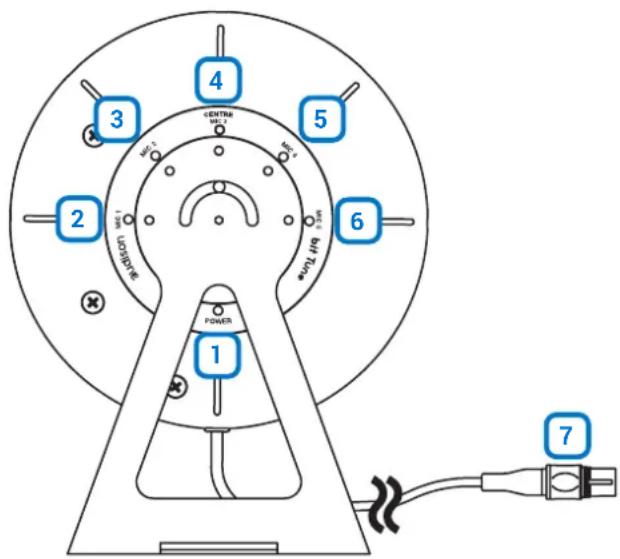
The HSM microphone is a measurement kit composed of 5 condenser microphones, designed to be interfaced only to the bit Tune. The HSM microphone is used to perform RTA measurements, self-equalization of the system and calculation of time delays.
The HSM microphone is provided with a metal fixing to be applied to the headrest of the seat and an elastic fastening bracket which adapts to any car, using the rubber plug provided in the package if needed.
Description
- POWER: Green LED, indicates the HSM measurement microphone being powered on.
- Mic 1: Yellow LED, indicates the activation of the microphone during the measurement phase.
- Mic 2: Yellow LED, indicates the activation of the microphone during the measurement phase.
- Centre Mic 3: Yellow LED, indicates the activation of the microphone during the measurement phase.
- Mic 4: Yellow LED, indicates the activation of the microphone during the measurement phase.
- Mic 5: Yellow LED, indicates the activation of the microphone during the measurement phase.
- XLR plug: 5-pin XLR connector for connecting to the bit Tune.
Installation

WARNING: The maximum sensitivity is 100 dB SPL: In this condition you have dynamic compression with

ment alteration.
Sound pressure levels over 120 dB SPL may damage the microphones.
Condenser microphones are extremely sensitive to moisture, so you should put them back in their special carrying case after use and store them in a dry place.
Always prevent the microphone from falling, as this may cause irreversible damage. Never remove the capsule protection.
3.5 LPM MICROPHONE ("LEVEL POLARITY MICROPHONE")
The LPM microphone is a measurement microphone designed to be interfaced only to the bit Tune. The LPM microphone is used to perform level and phase measurements of the audio system speakers. It is supplied with an elastic fastening bracket that adapts to any car.
Description
- POWER: Yellow LED, indicates the LPM measurement microphone being powered on.
- Mic: Microphone for level and phase measurement.
- XLR plug: 3-pin XLR connector for connecting to the bit Tune.

Installation

WARNING: The maximum sensitivity is 100 dB SPL: In this condition you have dynamic compression with

ment alteration.
Sound pressure levels over 120 dB SPL may damage the microphones.
Condenser microphones are extremely sensitive to moisture, so you should put them back in their special carrying case after use and store them in a dry place.
Always prevent the microphone from falling, as this may cause irreversible damage. Never remove the capsule protection.
4. CONNECTIONS
4.1 POWER SUPPLY AND SWITCHING ON
- POWER SUPPLY BY 12V DC PLUG IN

Note: The bit Tune is protected internally with a 2A Cylindrical fuse inside the product. For its replacement, see section 9.5 of this manual.
- POWER SUPPLY BY POWER ADAPTER

*The 110 - 220 VAC universal adapter comes with adapters for sockets in EUROPE, UK, USA, ASIA.
WARNING: If you use mains adapter for
Certain measurements it could be necessary to connect the ground cable (supplied in the product packaging), between the car battery and the bit Tune (see section 7.9).
- SWITCHING ON THE BIT TUNE

4.2 PERSONAL COMPUTER
- PERSONAL COMPUTER E bit Tune 2. PERSONAL COMPUTER bit Tune + bit Ten

flowchart
graph TD
    A["User Laptop"] -->|USB CABLE PROVIDED| B["Audio System"]
    C["User Laptop"] -->|USB CABLE PROVIDED| D["Audio System"]
    B --> E["Bit Tune"]
    D --> F["bit Tune"]
    style A fill:#f9f,stroke:#333
    style C fill:#f9f,stroke:#333
    style E fill:#ccf,stroke:#333
    style F fill:#ccf,stroke:#333
- PERSONAL COMPUTER bit Tune + bit One 4. PERSONAL COMPUTER bit Tune + bit One HD / Virtuoso

- PERSONAL COMPUTER bit Tune + bit Nove

- PERSONAL COMPUTER bit Tune + AP bit
- PERSONAL COMPUTER bit Tune + AP F8.9 bit

- PERSONAL COMPUTER bit Tune + H8 DSP
4.3 MEASUREMENT MICROPHONE INPUTS
4.4 INPUT SIGNAL S
1. PRE IN: HEAD UNIT PRE OUT ANALYZER
(see sect. 7.1 - 8.3)

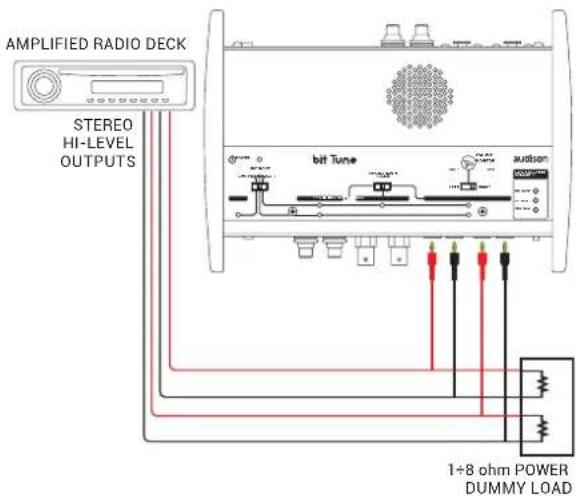
3. SPEAKER IN: HEAD UNIT HI LEVEL ANALYZER
(see sect. 7.1 - 8.3)

5. SPEAKER IN: AMPLIFIER POWER ANALYZER
(see sect. 7.10)
2. PRE IN: AMPLIFIER PREOUT ANALYZER
(see sect. 7.1 - 8.3)

(see sect. 7.1 - 8.3)
6. OPTICAL IN: HEAD UNIT OPTICAL TEST
(see sect. 8.3)

- BNC PROBE: ELECTRICAL CIRCUIT CHECK

- EMS PROBE: ELECTROMAGNETIC SNIFFER

4.5 OUTPUT SIGNALS
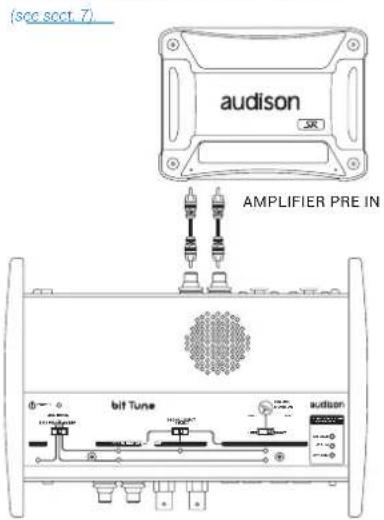
- PRE OUT: AMPLIFIER PRE IN
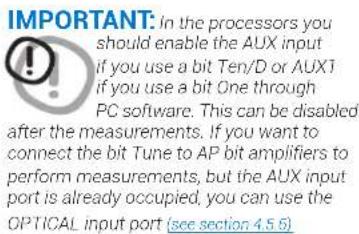
- PRE OUT: BIT TEN AUX INPUT

- PRE OUT: BIT ONE AUX INPUT

- PRE OUT: AP bit AUX INPUT
(vedi sez 72/7.3/7.4/7.5/7.6/7.7)

5. OPTICAL OUT: BIT ONE OPTICAL INPUT 6. OPTICAL OUT: BIT TEN OPTICAL INPUT

7. OPTICAL OUT: AP bit OPTICAL INPUT
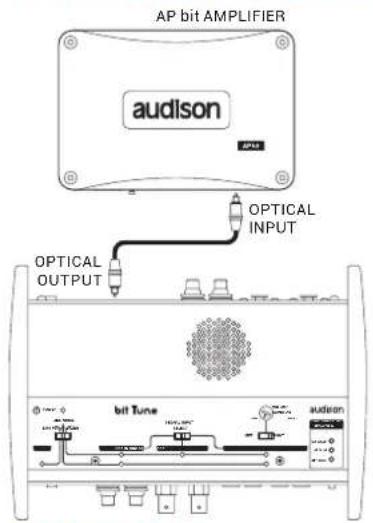
9. SPEAKER OUT:
AMPLIFIER HI LEVEL INPUT (see sect. 8.2)
10. SPEAKER OUT: BIT ONE
HI LEVEL INPUT (see sect. 8.2)

8. OPTICAL OUT: AMPLIFIER OPTICAL INPUT
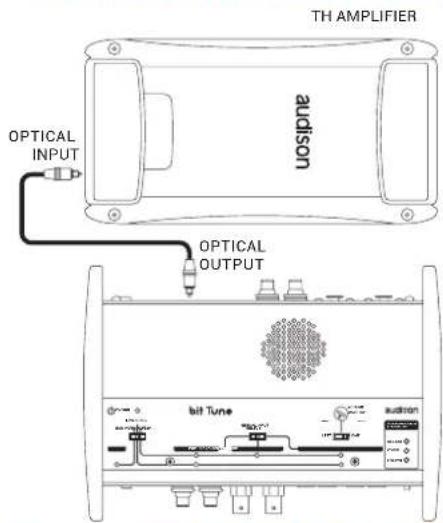
11. SPEAKER OUT: BIT TEN
HI LEVEL INPUT (see sect. 8.2)

* Note: using the SPEAKER OUT output it is possible to test both the audio operation and the ART ON function (if available) of the amplifier / processor.


5. SOFTWARE AND DRIVERS INSTALLATION
5.1 PC SOFTWARE AND DRIVER INSTALLATION WIZARD
- Insert the "bit Tune Setup CD 2.0" in the CD-ROM player of the PC that you intend to use.
- Windows XP: go to My Computer in the START menu;
Windows Vista: go to Computer in the START menu;
Windows 7: go to Computer in the START menu;
Windows 8 / 10: click on the DESKTOP icon;


Windows XP Windows Vista Windows 7 Windows 8 / 10
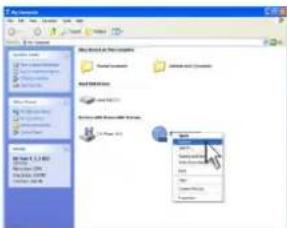
- Windows XP. with the right mouse button select the "bit Tune Setup CD 2.0" icon and click Browse;
Windows Vista: with the right mouse button select the "bit Tune Setup CD 2.0" icon and click Browse;
Windows 7: with the right mouse button select the "bit Tune Setup CD 2.0" icon and click Open;
Windows 8 / 10: double click on the Computer icon

natural_image
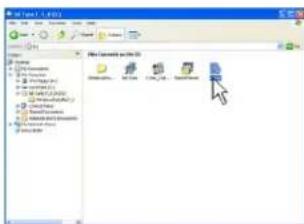
Close-up of white daisies against a blue sky background (no text or symbols visible)- Windows XP: double click on setup icon;
Windows Vista: double click on setup icon;
Windows 7: double click on setup icon;
Windows 8 / 10: select the CD ROM drive an double click on setup icon
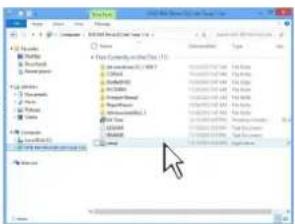
Windows XP Windows Vista Windows 7 Windows 8 / 10
- Windows XP: select ACCEPT;
Windows Vista: select ACCEPT;
Windows 7: select ACCEPT;
Windows 8 / 10: select ACCEPT;
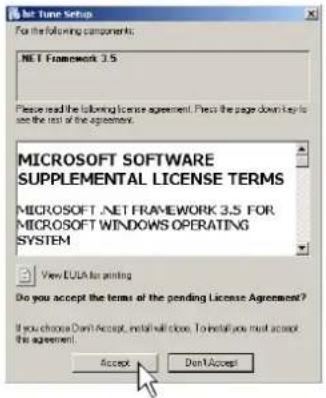
- Windows XP: select ACCEPT and wait for the installation;
Windows Vista: select ACCEPT and wait for the installation;
Windows 7: select ACCEPT and wait for the installation;
Windows 8 / 10: select ACCEPT and wait for the installation;

- Windows XP: select NEXT to continue with the installation, CANCEL to stop it;
Windows Vista: select NEXT to continue with the installation, CANCEL to stop;
Windows 7: select NEXT to continue with the installation, CANCEL to stop;
Windows 8 / 10: select NEXT to continue with the installation, CANCEL to stop;

- Windows XP: select I Agree, then NEXT;
Windows Vista: select I Agree, then NEXT;
Windows 7: select I Agree, then NEXT;
Windows 8 / 10: select I Agree, then NEXT;
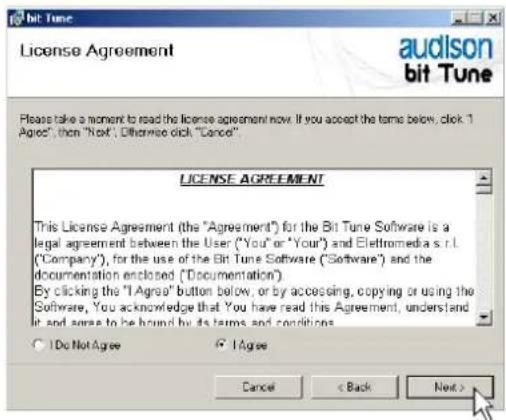
- Windows XP: select NEXT.
Windows Vista: select NEXT.
Windows 7: select NEXT.
Windows 8 / 10: select NEXT.

- Windows XP: Choose NEXT to start the installation of audio codecs.
Windows Vista: Choose NEXT to start the installation of audio codecs.
Windows 7: Select NEXT to start the installation of audio codecs.
Windows 8 / 10: Select NEXT to start the installation of audio codecs.

11. Windows XP: select
- Everyone if you have administration rights for the system, so that the program, once installed, can be accessed by all users of the PC.
- Just me if you want the program, once installed, to be accessed by the current user only. Then click NEXT.
Windows Vista: select
- Everyone sif you have administration rights for the system, so that the program, once installed, can be accessed by all users of the PC.
- Just me if you want the program, once installed, to be accessed by the current user only. Then click NEXT.
Windows 7: select
- Everyone if you have administration rights for the system, so that the program, once installed, can be accessed by all users of the PC.
- Just me if you want the program, once installed, to be accessed by the current user only. Then click NEXT.
Windows 8 / 10: select
- Everyone if you have administration rights for the system, so that the program, once installed, can be accessed by all users of the PC.
- Just me if you want the program, once installed, to be accessed by the current user only. Then click NEXT.

- Windows XP: Select NEXT to start the installation.
Windows Vista: Select NEXT to start the installation.
Windows 7: Select NEXT to start the installation.
Windows 8 / 10: Select NEXT to start the installation.

- Windows XP: Select NEXT to start the installation of the audio driver, turn the bit Tune on and connect it to the USB port of your PC.
Windows Vista: Select NEXT to start the installation of the audio driver, turn the bit Tune on and connect it to the USB port of your PC.
Windows 7: Select NEXT to start the installation of the audio driver, turn the bit Tune on and connect it to the USB port of your PC.
Windows 8 / 10: Select NEXT to start the installation of the audio driver, turn the bit Tune on and connect it to the USB port of your PC.

Possible error message:
If the bit Tune is not recognized by PC, make sure that the bit Tune is turned on and connected to the PC via USB, then select NEXT. If the problem persists, see section 9.2 on troubleshooting the installation.
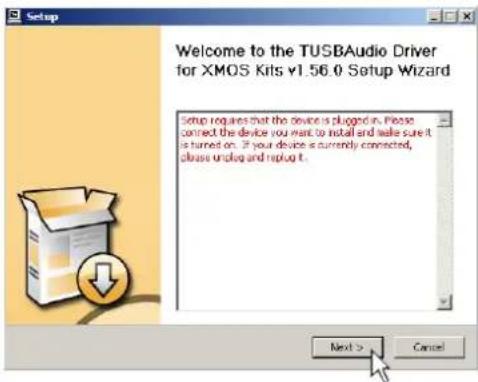
- Windows XP: Select NEXT to start the installation.
Windows Vista: Select NEXT to start the installation.
Windows 7: Select NEXT to start the installation.
Windows 8 / 10: Select NEXT to start the installation.
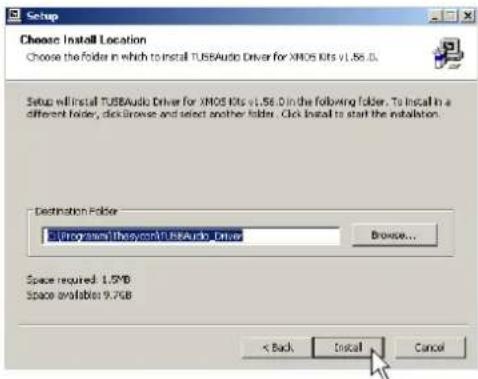
- Windows XP: Select NEXT to complete the installation of the audio driver and then select FINISH.
Windows Vista: Select NEXT to complete the installation of the audio driver and then select FINISH.
Windows 7: Select NEXT to complete the installation of the audio driver and then select FINISH.
Windows 8 / 10: Select NEXT to complete the installation of the audio driver and then select FINISH.


- Windows XP: select "No, not now" and click "Next";
Windows Vista: will not ask for confirmation; drivers will be installed automatically;
Windows 7: will not ask for confirmation; drivers will be installed automatically;
Windows 8 / 10: will not ask for confirmation; drivers will be installed automatically;
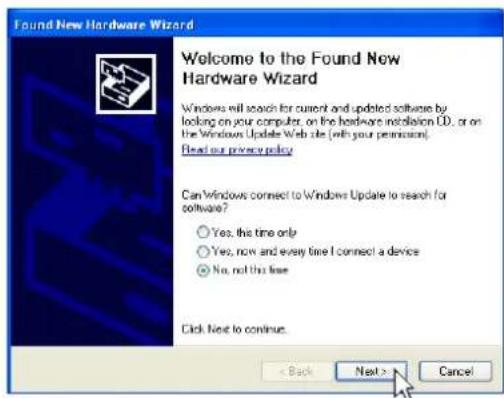
- Windows XP: select "Install the software automatically" and click "Next";
Windows Vista: will not ask for confirmation; drivers will be installed automatically;
Windows 7: will not ask for confirmation; drivers will be installed automatically;
Windows 8 / 10: will not ask for confirmation; drivers will be installed automatically;

- The system will install the XMOS interface drivers.

- If the procedure is successful, the system will notify that the driver installation is complete.
Windows XP: click "Finish";
Windows Vista: will not ask for confirmation; drivers will be installed automatically;
Windows 7: will not ask for confirmation; drivers will be installed automatically;
Windows 8 / 10: will not ask for confirmation; drivers will be installed automatically;

- If the procedure is successful, the system will notify that the driver installation is complete.
Windows XP: click "CLOSE";
Windows Vista: click "CLOSE";
Windows 7: click "CLOSE";
Windows 8 / 10: click "CLOSE";
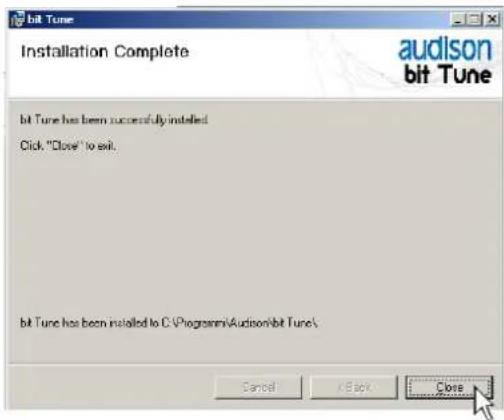
- The installation of the bit Tune software and drivers is now complete.
At this point the bit Tune is ready for use (see sect. 6).
5.2 UNINSTALLING BIT TUNE SOFTWARE and DRIVER
- To uninstall the bit Tune PC software you can use the command uninstall.

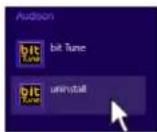
- Windows XP: click "YES"; Windows Vista: click "YES"; Windows 7: click "YES"; Windows 8 / 10: click "YES";
Windows XP, Windows Vista, Windows Y Windows 8
- Windows XP: click "UNINSTALL"; Windows Vista: click "UNINSTALL"; Windows 7: click "UNINSTALL"; Windows 8 / 10: click "UNINSTALL";

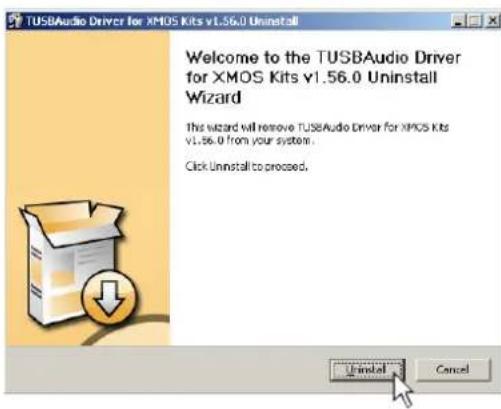
- Windows XP: click "NEXT"; Windows Vista: click "NEXT"; Windows 7: click "NEXT"; Windows 8 / 10: click "NEXT"
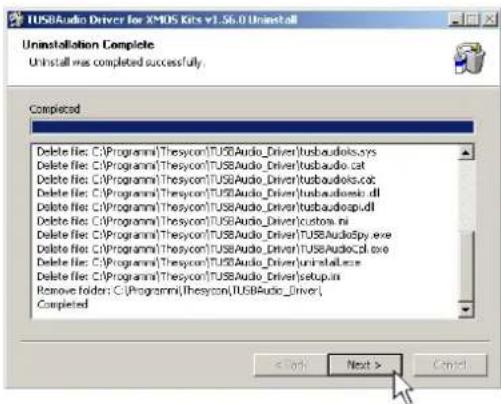
- Windows XP: click "FINISH" to complete the uninstall process;
Windows Vista: click "FINISH" to complete the uninstall process;
Windows 7: click "FINISH" to complete the uninstall process;
Windows 8 / 10: click "FINISH" to complete the uninstall process;

6. BIT TUNE DESKTOP
In order to use the main tools of the bit Tune you must install the software on your PC (see sect. 5). The bit Tune must be connected to the PC and be turned on by setting the measurement selection switch in the PC analyzer position (see sect. 3.3.2). Start the software by clicking the icon on your desktop.

bit Tune
The first screen that appears is the starting screen, where you need to select one of the following modes:
- APM: starts the APM measurement software (see Advanced Manul APM);
- bit Tune (see sect 6.2.3);
- bit Tune + Processor: bit Tune connected and interfaced to a bit line processor (see section 6.2);
- Rescue Mode: Firmware upgrade recovery (see sect. 9.3). The softwares in OFF LINE mode are also available for the three operating modes (see section 6.1).
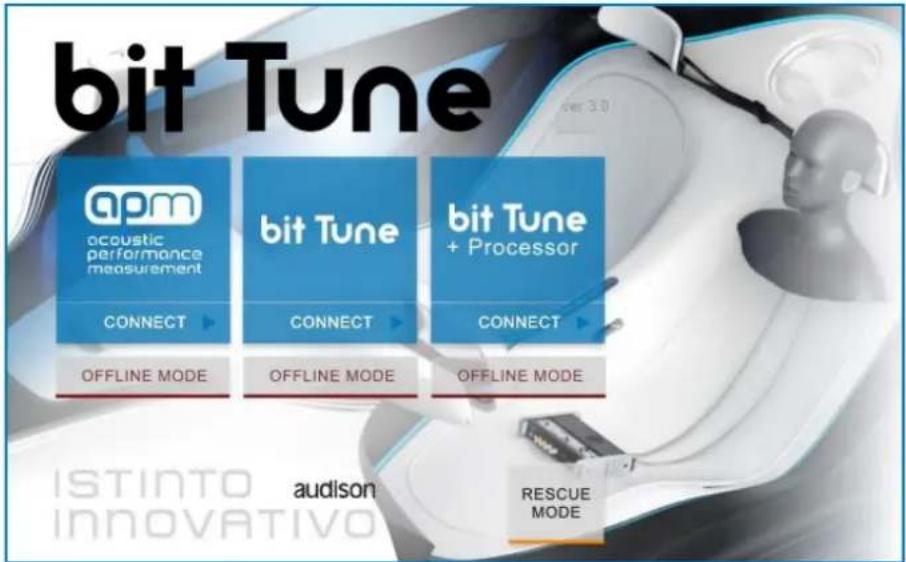
To select the starting mode, go to the drop-down menu, select the appropriate entry and press ENTER or click on the window.
6.1 SOFTWARE START IN OFFLINE MODE

In this mode, the bit Tune, even if connected to the PC, does not interact with the software's functions. The OFFLINE mode can be used to analyze the software without connecting the product to the PC, in order to become familiar with some of the product's functions, and in particular it allows the use of the processing of the acquired measurements to carry out new Percept Calibration setups exclusively with the bit One HD Virtuoso.

How the bit Tune software looks in the OFFLINE startup mode.
How to change the size of the PC software window
- To make the window full-screen, click on the Enlarge button ☐ double click on the title bar of the PC software window.
- To restore the previous size from full-screen, click on the Reset button for double click on the title bar on the window.
- To resize the PC software window (make it smaller or larger), position the mouse pointer on one edge or corner of the window. When the mouse pointer becomes an arrow with a double point, drag the edge or corner to make the window larger or smaller.

natural_image
Pure geometric corner alignment diagram without any text, numbers, or symbols6.2 SOFTWARE START IN BIT TUNE + PROCESSOR MODE

The use of the bit Tune in this mode is primarily for refining the configuration of the frequency response of an audio system that uses an processor (bit One, bit Ten D, bit Ten, bit One HD Virtuoso, bit Nove, AP bit, AP F8.9 bit, H8 DSP).

The software recognizes features and settings that have been designed into the connected processor. The bit Tune is preset for optimum configuration of the frequency response for the type of processor connected.

If the Processor is not found by the scanning:
- Make sure the Processor is turned on;
- Check the correct connection of the USB cable;
- Press OK to start the program in "bit Tune" mode (see sect. 6.3) and connect the processor manually (see sect. 6.2.2.2).
Connect the bit Tune Pre Out L-R outputs to the Aux inputs (shown in the window) of the processor interfaced with the bit Tune.
- bit One: connect the Aux1/Optical input to the bit Tune L-R/Optical outputs, ensuring that the processor's inputs are enabled.
- bit One HD: connect the AUX/Optical 1/Optical 2 input to the bit Tune L-R/Optical outputs, ensuring that the processor's inputs are enabled.
- bit Ten / bit Ten D: connect the Aux/Optical input to the bit Tune L-R/Optical outputs, ensuring that the processor's inputs are enabled.
- bit Nove: connect the Aux/Optical 1 input to the bit Tune L-R/Optical outputs, ensuring that the processor's inputs are enabled.
- Ap bit: connect the Aux/Optical input to the bit Tune L-R/Optical outputs, ensuring that the processor's inputs are enabled.
- APF8.9 bit: connect the Optical input to the bit Tune Optical output, ensuring that the processor's inputs are enabled.
- H8 DSP: connect the Aux/Optical input to the bit Tune L-R/Optical outputs, ensuring that the processor's inputs are enabled.


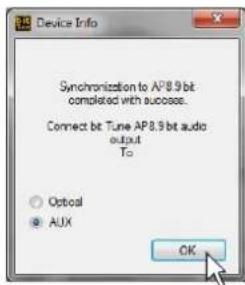
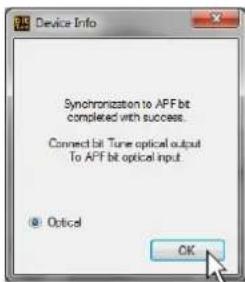

The first time the product will be turned on you will be prompted for information regarding the user. Fill in the fields and then click OK. You need to fill in at least the Organization field. These data may be completed or changed later (see 6.2.5.5). They will be used for the compilation of the report.
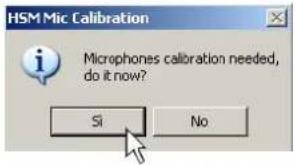
Long periods of inactivity can change the characteristics of the HSM microphone. Calibration must performed at the time of first use, and then repeated at least every 3 months of activity or after long periods of non-use. Calibrate the HSM microphone (see sect 7.2) otherwise select NO.

The following paragraphs will describe the functions that allow the adjustment of the system and its acoustic refinement.

6.2.1 CONNECTION STATUS MENU

When the bit Tune is connected to the processor the message not connected will disappear from this bar, and the bar will display information on serial numbers, firmware versions and type of connected processor.
bt Tune: fw ver. 1.0.0.0, SN 00000000000000
bit Ten: fw ver. 1.2.1.0, SN
6.2.2 SESSION NOTE MENU

This active window allows you to customize the information concerning the measurement being performed.
The data entered will be included in the final measurement report (see sect. 6.2.4.9).
Description of functions:
- Processor: This window shows whether the bit Tune is connected to an Audison processor.
- Active button to connect / disconnect the Audison processor to the bit Tune.
- Vehicle Type: Enter the model of the car in which you are performing a measurement /acoustic refinement session.
- Customer: Enter the name of the owner of the car in which you are performing the measurement /acoustic refinement session.
- Date: Shows the date of the measurement session.
-
Operator: Enter the name of the operator performing the measurements.
-
Note: Enter comments about the measurement session or the system being measured.

6.2.3 "FILE" MAIN MENU

Clicking the button opens a drop down menu with the items shown in the figure:
-
New: opens a new measurement session.
-
Load: downloads the complete bit Tune configuration from a previously saved measurement session file (e.g. "BMW E60 Walter.ses").
This function is useful if you want to install the same audio system on an identical car, without repeating the calibration procedures. If you save a work session using an Audison Virtuoso processor, the data can be used and subsequently processed in OFFLINE mode.
Once the file is uploaded, the name of the uploaded file will appear in the upper left corner.


bit Tune - BMW E60 Walter
- Save: Saves the complete bit Tune configuration of the current measurement session in a file that exists or that must be replaced (e.g. "BMW E60 Walter.ses"), which can be reloaded at a later time within the bit Tune via the Load function.
If you save a work session using an Audison Virtuoso processor, the data can be used and subsequently processed in OFFLINE mode.

-
Save as: Saves the complete bit Tune configuration of the current measurement session in a new file (e.g. "BitTuneConfig.ses") renaming it each time with a different name.
-
Registration: The Registration command opens the system browser with the page that allows you to register the product and create your own personal account on the "bit" portal. This must be done only once, after which you can access your account via the Login Account command.

Note: for the use of these commands, you must have an active Internet connection.
6. Software Updates.
Update firmware: Updates the firmware of the bit Tune (see sect. 9.6).
Check for Updates: it checks in real-time the availability of new firmware/PC Software updates.
Autocheck for Updates: when enabled availability of firmware/PC Software updates is checked automatically each time you start the program.

Note: in order to use these commands you must have an active Internet connection.
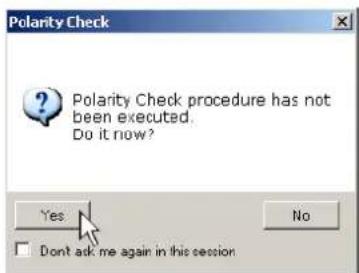
- Reset Default Answer: This command resets the display of warning messages if they have been previously disabled by checking "Don't ask me again".
- Credits: Displays information about the bit Tune software in use.
- EXIT: Used to exit the PC software.
6.2.4 "TOOLS" MAIN MENU

Clicking the button opens a drop down menu with the items shown in the figure on the right:
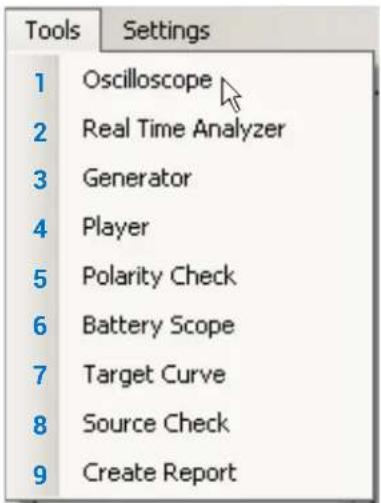
1. OSCILLOSCOPE:
| T | S | SP | P | PP see sect. 1.1 | |
| √ | √ | √ | √ |
F
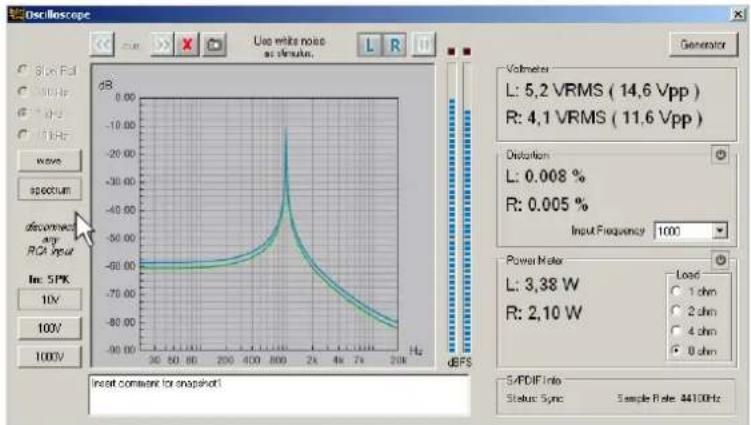
The bit Tune features an oscilloscope for the audio frequency band (20 KHz).
This tool can be used to view the signals coming from preamp power outputs or to perform measurements and checks of circuit parts.
This window also includes a series of tools such as: AC/DC Voltmeter, Distortion meter, Wattmeter, Spectrum analyzer, optical S/PDIF Audio signal analyzer.
WARNING: When testing power output of an amplifier, it is recommended to disconnect the speakers from the
amplifier and replace them with an appropriate resistive load capable of handling the output of the amplifier. Otherwise, the speakers may be damaged.

Description of functions:
1-2-3: Buttons for changing the full-scale sensitivity of the oscilloscope.
Depending on the selected inputs (see sect. 3.3 point 6) the sensitivity values are pre-set:
RCA inputs: 1 V - 10 V - 100 V.
BNC inputs: 1 V - 10 V - 100 V.
SPK IN inputs: 10 V - 100 V - 1000 V.
Use 1 - 2 - 3 buttons to best display the amplitude of the signal being examined without it exceeding the full-scale amplitude.
- IN: Indicates the active input selected for the measurement (see sect. 3.3 point 6).
- LEFT: activates the measurement of the signal on the LEFT input channel. The track displayed on the screen is blue.
- RIGHT: activates the measurement of the signal on the RIGHT input channel. The track displayed on the screen is green.
-
PAUSE: blocks the acquisition of the input signal, freezing the acquired signal on the screen.
-
SLOW ROLL: Sets the "time/div" time base for the signal acquisition to a slow pace. Acquires the signal whose cycle is less than 5 seconds.
9 -10 -11. Depending on the frequency of the signals to be displayed, you need to set the time base to the optimal frequency for a correct visualization.
100 Hz: 0.0025 sec/division (2.5 ms/div.)
1 KHz: 0.00025 sec/division (0.25 ms/div.)
10 KHz: 0.00025 sec/division (0.025 ms/div.)
Through the time display of the cyclic (periodic) signal, you can know its frequency:
$$ \text { Frequency (Hz) } = \frac {1}{\text { Period (ms) }} $$
The period is the time that the signal takes to complete a cycle. The period's time is measured by adding the number of divisions in a signal's cycle.
-
WAVE: Enables the oscilloscope function.
-
SPECTRUM: Enables the spectrum analyzer function.
line
| Parameter | Value | | --------- | ----- | | L: 5.2 VRMS (14.6 Vpp) | 5.2 | | R: 4.1 VRMS (11.6 Vpp) | 4.1 | | Distortion | 0.008 % | | R: 0.005 % | 0.005 % | | Input Frequency | 1000 | | Power Factor | L: 3.38 W, R: 2.10 W | | S/PDIF Info Status: Sync Sample Rate: 44100Hz-
Snap acquisition: captures the image on the screen, which can be included in the measurement report (see sect 6.2.4.9). To save the image, enter a comment regarding the measurement (see point 16).
-
Scroll view: after selecting PAUSE (see point 7), by selecting these buttons repeatedly, you can view the captured images one at a time (see point 12).
-
Snapshot Text: this box is used to enter a comment on the acquisition made by the snap acquisition function (see point 14).

Save the comment by selecting ,or delete the acquisition by selecting the button.
-
GENERATORS: activates the programmable frequency generator (see sect. 6.2.4.3).
-
BAR GRAPH AMPLITUDE: displays, via a bar viewer, the level of the input signal. The lighting of the red LEDs indicates full scale (over range). The bar graph scale is logarithmic.
-
VOLTMETER: Displays the voltage value (RMS) and the Peak to Peak voltage of the input channels.
-
DISTORTION: Selecting the button activates the window that displays the distortion value (THD) expressed as a percentage (%). The measurement can be made with 3 sinusoidal sample frequencies (Input frequency Hz) 100 Hz, 1000 Hz, 10000 Hz. The measurement can be performed using the internal generator (see point 17) and by setting a sinusoidal signal on one of the sample frequencies (100 Hz, 1000 Hz, 10000 Hz). You can use an external generator or the sinusoidal signal supplied by a CD player which is able to provide the three sinusoidal frequencies (100 Hz, 1000 Hz, 10000 Hz).
- POWER METER: Selecting the button activates the window that displays the value of the Power (Watt) with a continuous sinusoidal. The measurement can be carried out on four resistive load values. Select the value of the resistive load (Load: 1 ohm, 2 ohm, 4 ohm, 8 ohm) on which to perform the measurement. Insert a load resistance at the amplifier's output with the previously selected value with a dissipation capacity in Watts proportionate to the amplifier's power. Connect the heads of the resistances to the SPK-IN inputs (see sect. 3.2.5) of the bit Tune.
- S/PDIF Info: Displays information of the optical digital signal (S/PDIF) if an optical cable is connected to the TOS LINK connector input (OPTICAL IN see sect. 3.2.2).
Status Sync: Sync. Presence of a digital signal.
Status Sync: - Absence of a digital signal.
Sample Rate: frequency of the digital signal. You can visualize frequencies up to 192 kHz.
Sample Rate: - Absence of a digital signal.
-
Screen: Shows the time progress of the signal applied to the input of the bit Tune, activating the Wave or Spectrum function.
-
Close: Closes the oscilloscope measurement window.
Refer to section 7.9 with measurement examples.
2. REAL TIME ANALYZER:
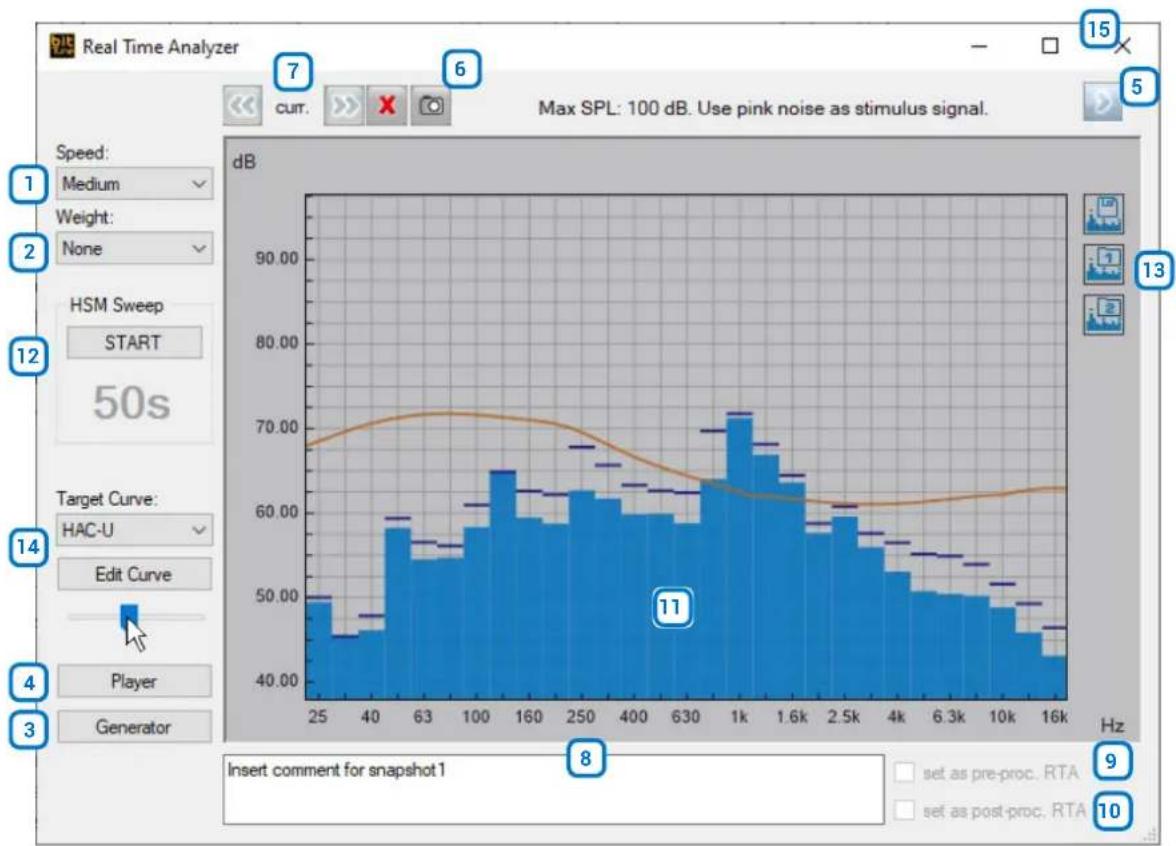
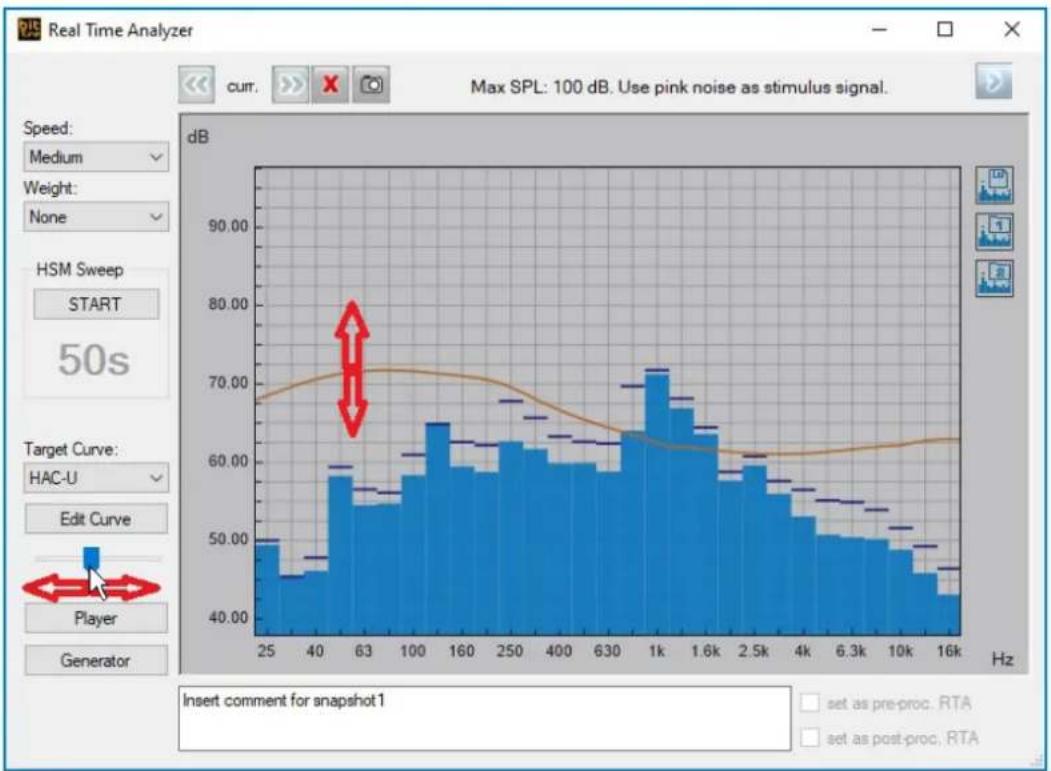
The Real Time Analyzer is an audio spectrum analyzer that, for the measurement, uses the signal acquired by the HSM microphone in two different modes or by the TMD microphone. The Real Time Analyzer is an audio spectrum analyzer that uses the signal acquired from the HSM microphone for the measurement. The frequency response is shown in a logarithmic scale with 30 bands on the horizontal axis and a level from 40 dB> to 96 dB> on the vertical axis. With this tool you can measure the frequency response of audio systems installed in the car. In addition to the measuring instrument, there are also signal generators and the possibility of saving the acquired curves and viewing them later.
bar_line
| Frequency (Hz) | Signal Strength (dB) | |---|---| | 25 | 48.00 | | 30 | 49.00 | | 35 | 50.00 | | 40 | 52.00 | | 45 | 55.00 | | 50 | 57.00 | | 55 | 58.00 | | 60 | 60.00 | | 65 | 62.00 | | 70 | 63.00 | | 75 | 64.00 | | 80 | 65.00 | | 85 | 66.00 | | 90 | 67.00 | | 95 | 68.00 | | 100 | 69.00 | | 105 | 70.00 | | 110 | 71.00 | | 115 | 72.00 | | 120 | 73.00 | | 125 | 74.00 | | 130 | 75.00 | | 135 | 76.00 | | 140 | 77.00 | | 145 | 78.00 | | 150 | 79.00 | | 155 | 80.00 | | 160 | 81.00 | | 165 | 82.00 | | 170 | 83.00 | | 175 | 84.00 | | 180 | 85.00 | | 185 | 86.00 | | 190 | 87.00 | | 195 | 88.00 | | 200 | 89.00 | | 205 | 90.00 | | 210 | 91.00 | | 215 | 92.00 | | 220 | 93.00 | | 225 | 94.00 | | 230 | 95.00 | | 235 | 96.00 | | 240 | 97.00 | | 245 | 98.00 | | 250 | 99.00 | | 255 | 100.00 | | 260 | 101.00 | | 265 | 102.00 | | 270 | 103.00 | | 275 | 104.00 | | 280 | 105.00 | | 285 | 106.00 | | 290 | 107.00 | | 295 | 108.00 | | 300 | 109.00 | | 305 | 110.00 | | 310 | 111.00 | | 315 | 112.00 | | 320 | 113.00 | | 325 | 114.00 | | 330 | 115.00 | | 335 | 116.00 | | 340 | 117.00 | | 345 | 118.00 | | 350 | 119.00 | | 355 | 120.00 | | 360 | 121.00 | | 365 | 122.00 | | 370 | 123.00 | | 375 | 124.00 | | 380 | 125.00 | | 385 | 126.00 | | 390 | 127.00 | | 395 | 128.00 | | 400 | 129.00 | | 405 | 130.00 | | 410 | 131.00 | | 415 | 132.00 | | 420 | 133.00 | | 425 | 134.00 | | 430 | 135.00 | | 435 | 136.00 | | 440 | 137.00 | | 445 | 138.00 | | 450 | 139.00 | | 455 | 140.00 | | 460 | 141.00 | | 465 | 142.00 | | 470 | 143.00 | | 475 | 144.00 | | 480 | 145.00 | | 485 | 146.00 | | 490 | 147.00 | | 495 | 148.00 | | 500 | 149.00 | | Note: The chart displays the frequency of signal at each frequency point, with a highlighted annotation for HAC-U and Edit Curve, and a note indicating it is set as pre-proc. RTA or set as post-proc. RTA.Description of functions:
- Speed: Sets the refresh rate of the spectral measurement displayed for a good balance between accuracy and ease of reading.

- Weight: Select the type of weighting filter for the measurement.
None: Excludes any weighting filter in the signal acquisition. Expresses the absolute value but does not take into account the acoustic perception of the human ear.
A-weight: Suggested. Enables a type A weighting filter. Inserts a filter that simulates the perception of the human ear with a low background noise. It is the curve used for signal to noise ratio(S/N ratio) measurements.
B-weight: Enables a type B weighting filter. It is used with medium level background noise.
C-weight: Enables a type C weighting filter. It is used with high level background noise.

- GENERATORS: Activates the programmable frequency generator (see sect. 5.2.4.3), to generate measurement signals.
- PLAYER: Activates the player for audio tracks playback (see sect 6.2.1.4).
- ☐ PAUSE/PLAY: Blocks the acquisition of the input signal, freezing the acquired signal on the screen.
- Snap acquisition: Captures the picture on the screen that can be included in the measurement report (see sect. 6.2.4.9). To save the image, enter a comment regarding the measurement (see point 8).
- SCROLL VIEW: After selecting PAUSE (see point 5), by selecting these buttons repeatedly you can view the captured images one at a time (see point 8).
- Snapshot Text: Enter a comment on the acquisition made by the snap acquisition function (see point 6). Save the comment by selecting ,or delete the acquisition by selecting the button.

Sine wave 1000 Hz
- Set as pre-proc. RTA: The box is active when selecting the Snapshot Text. Its function is to store an RTA curve acquired prior to the Processor Auto Setup (see sect. 6.2.6). The image of the graph(Snapshot) will be shown on the Report ____ (see sect. 6.2.4.9).
- Set as post-proc RTA: The box is active when selecting the Snapshot Text. Its function is to store an RTA curve acquired after the Processor Auto Setup (see sect. 6.2.6). The image of the graph (Snapshot) will be shown on the Report ____ (see sect. 6.2.4.9).
- Screen: Displays the progress of the signal according to the frequency applied to the input of the bit Tune.
- Target Curve: allows the user to load a target curve of the final result after having acquired the environmental response of the passenger compartment. The default curve provides the ability to achieve an optimal listening ambience by operating manually on the DSP.
Functions:
a) Target Curve: allows the user to load Audison preset curves. More specifically:
-HAC-U▶ Harmonized Acoustic Curve Universal
-HAC-R▶ Harmonized Acoustic Curve Rock
-HAC-J▶ Harmonized Acoustic Curve Jazz
- Flat▶ Flat Curve.

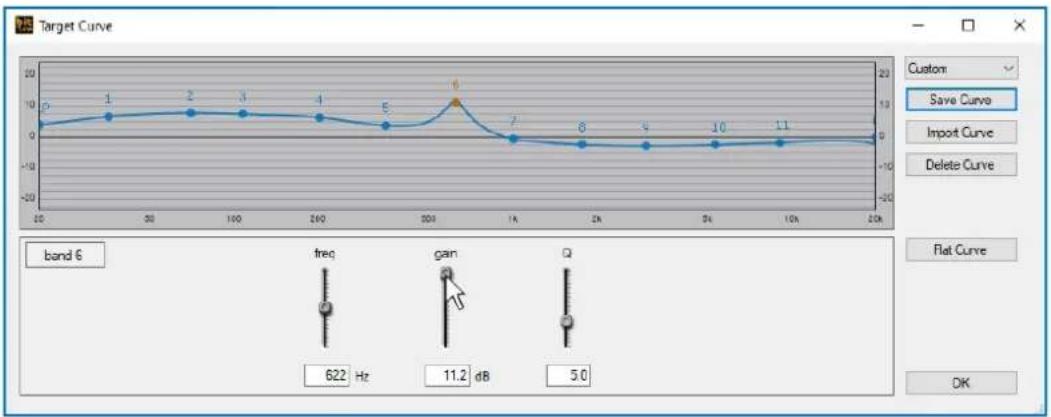
b) Edit Curve: allows the user to edit an existing curve, or create their own using an 11-pole parametric equalizer.
line
| Frequency | Value | | --------- | ----- | | 0 | 0 | | 30 | 1 | | 60 | 2 | | 90 | 3 | | 120 | 4 | | 150 | 5 | | 180 | 6 | | 210 | 7 | | 240 | 8 | | 270 | 9 | | 300 | 10 | | 330 | 11.2 | | 360 | 11.2 | | 390 | 5.0 |c) Move target curve: allows the user to move the target curve during the RTA acquisition on the Y axis, to center the acquisition sensitivity.
bar_line
| Frequency (Hz) | Value (dB) | |---|---| | 25 | 49.00 | | 40 | 45.00 | | 63 | 58.00 | | 100 | 55.00 | | 160 | 65.00 | | 250 | 62.00 | | 400 | 60.00 | | 630 | 63.00 | | 1k | 71.00 | | 1.6k | 67.00 | | 2.5k | 60.00 | | 4k | 53.00 | | 6.3k | 50.00 | | 10k | 48.00 | | 16k | 44.00 | Adjustments: - Red arrows indicate direction of the HAC-U target curve; - Orange line represents peak signal amplitude at max SPL: 100 dB; - Red arrow indicates peak amplitude at 50s; - Black squares represent peak signal amplitude at peak amplitude; - Blue dashed lines represent post-proc. RTA values for each cycle.13. Save/load RTA curve:
Save: allows the user to save a curve during the RTA acquisition. It can later be viewed during a new acquisition.
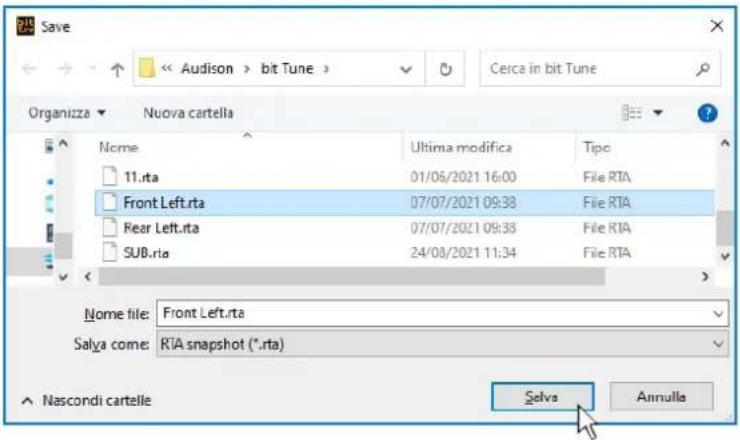


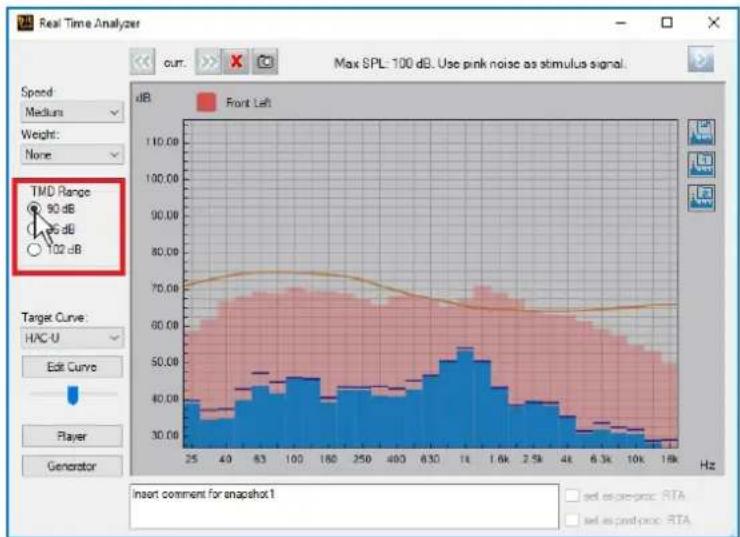
Load Curve: allows the user to load previously acquired curves in the background of the RTA acquisition.

bar_line
| Frequency (Hz) | Front Left (dB) | Rear Left (dB) | | -------------- | --------------- | -------------- | | 25 | 40.00 | 60.00 | | 40 | 45.00 | 65.00 | | 63 | 50.00 | 70.00 | | 100 | 55.00 | 75.00 | | 150 | 60.00 | 78.00 | | 250 | 65.00 | 76.00 | | 400 | 62.00 | 74.00 | | 630 | 60.00 | 72.00 | | 1k | 58.00 | 70.00 | | 1.6k | 55.00 | 68.00 | | 2.5k | 52.00 | 65.00 | | 4k | 50.00 | 62.00 | | 6.3k | 48.00 | 60.00 | | 10k | 45.00 | 58.00 | | 16k | 42.00 | 55.00 |14. MIC AQUIRE:
The RTA function of the bit Tune can be performed using two types of microphones, and depending on the microphone connected, the measurement can be made as follows:
a) HSM: by connecting this microphone, it will be possible to carry out the conventional measurement using the 3 HSM microphone (default) or using all the 5 microphones (HSM Sweep). The HSM Sweep function is based on the average calculated for an acquisition of 10 seconds for each microphone for a maximum duration of 50 seconds. By selecting the Start button, the measurement will start automatically and at the end the result will be accessible

bar_line
| Frequency (Hz) | Peak Value (dB) | | -------------- | --------------- | | 25 | 40.00 | | 40 | 50.00 | | 63 | 60.00 | | 93 | 70.00 | | 120 | 75.00 | | 150 | 80.00 | | 180 | 75.00 | | 210 | 70.00 | | 240 | 65.00 | | 270 | 60.00 | | 300 | 55.00 | | 330 | 50.00 | | 360 | 45.00 | | 390 | 40.00 | | 420 | 35.00 | | 450 | 30.00 | | 480 | 25.00 | | 510 | 20.00 | | 540 | 15.00 | | 570 | 10.00 | | 600 | 5.00 | | 630 | 2.50 | | 660 | 1.25 | | 690 | 0.625 | | 720 | 0.3125 | | 750 | 0.15625 | | 780 | 0.078125 | | 810 | 0.0390625 | | 840 | 0.01953125 | | 870 | 0.011765625 | | 900 | 0.0058828125 | | 930 | 0.00294140625 | | 960 | 0.001970753125 | | 990 | 0.0014853765625 | | 1K | 95.00 | | 1.6K | 92.50 | | 2.1K | 89.75 | | 2.6K | 86.38 | | 3.1K | 82.94 | | 3.6K | 79.48 | | 4K | 75.94 | | 4.4K | 72.38 | | 5K | 68.74 | | 5.6K | 65.12 | | 6K | 61.48 | | 6.3K | 57.84 | | 7K | 54.12 | | 7.6K | 49.56 | | 8K | 45.88 | | 8.6K | 42.34 | | 9K | 38.74 | | 9.6K | 35.12 | | 1K | 31.36 | | 1.6K | 27.56 | | 2.1K | 23.78 | | 2.6K | 20.94 | | 3K | 18.12 | | 3.6K | 15.28 | | 4K | 12.44 | | 4.6K | 9.56 | | 5K | 7.72 | | 5.6K | 6.88 | | 6K | 5.94 | | 6.6K | 5.12 | | 7K | 4.28 | | 7.6K | 3.44 | | 8K | 2.52 | | 8.6K | 1.68 | | 9K | 1.04 | | 9.6K | 0.38 | | >1K | <1 |b) TMD+Beringher: The use of the TMD interface allows the user to reach, unlike the HSM microphone, higher SPL values (up to 102 dB) and have greater accuracy on the positioned listening point. As shown in the figure below, select the maximum SPL level with which you want to perform the acquisition.
- ✗ Close: Closes the measurement window of the Real Time Analyzer. Refer to section 7.7 with measurement examples.
3. GENERATOR
The bit Tune has a signal generator, which can be programmed in frequency and amplitude. The active outputs of the generator are: PRE OUT L - R, SPEAKER OUT L - R, OPTICAL OUT in bit Tune mode and on the speakers selected in bit Tune + Processor mode.
"bit Tune" mode "bit Tune + Processor" mode

Description of functions:
- Pure Tone Burst: Generates a programmable pulse modulated frequency from 1 Hz to 20 KHz 10 Oms ON 300 ms OFF. The output signal level is programmable from -48 dB to 0 dB (0 ÷ 3.8 V RMS).
- Pure Tone Continuous: Generates a programmable frequency from 1 Hz to 20 KHz. The output signal level is programmable from -48 dB to 0 dB (0 ÷ 3.8 V RMS).
- White noise: Activate the generation of a pseudo-random white noise. The output signal level is programmable from -48 dB to 0 dB (0 ÷ 3.8 V RMS).
-
Pink Noise: Activate the generation of a pseudo-random pink noise. The output signal level is programmable from -48 dB to 0 dB (0 ÷ 3.8 V RMS).
-
Sweep: Activates a frequency modulated signal. Set the duration of the generated signal by setting the time in box A, the starting frequency in box B and the maximum frequency in box C. The type of signal progress can be logarithmic by clicking on box D or linear by clicking on box E.

The output signal level is programmable from -48 dB to 0 dB (0 ÷ 3.8 V RMS).
- Play/Stop: ☐ PLAY activates the signal on the outputs. ☐ STOP deactivates the signal on the outputs.
- Close ✗ : Closes the Generator window.
- Select channel(s): selects the system channel where the signal is generated.
- Processor Volume: Adjusts the output level of the generator on the selected speakers (see point 8).
WARNING: A continuous signal level which is too high may cause permanent damage to the speakers and especially to the unfiltered tweeters.

eed to measure high signal levels we strongly recommend to disconnect the speakers.
- Select Memory: Selects one of the available processor memories during the use of the generator.
4. PLAYER
The bit Tune has an audio interface for playing back music files with extension *.Wav, *.Wma, *.Mp3, *.Flv, *.Flac. The active outputs of the generator are:
PRE OUT L - R, SPEAKER L - R and OPTICAL OUT (see sect. 3.1).
OPTICAL OUT can provide an optical digital signal with a frequency of 192 kHz/24 bit that allows to leave any music file unchanged.

Description of functions:
- Play: Starts the playback of the selected file / ☐ PAUSE: Pauses the playback of a track.
- Fast Forward: Fast-forwards a track.
- Fast Rewind: Fast return to the start of the selected track.
- Repeat: Repeats the track from the start.
- Stop: Stops the playback of the current track.
- Open Folder: Open files saved on your PC.
- Track Info: Window containing information about the selected track.
- bit Tune Volume: Sets the output volume of the player with the exception of the OPTICAL OUT output.
- Bar Graph: VU meter, active during playback.
- Close: Closes the Player window.
5. POLARITY CHECK
Using this tool you can check the electrical phase of the audio system speakers. The measurement is carried out through guided steps using the LPM microphone placed at a distance of 15 - 20 cm from the loudspeaker.
Polarity Check in "bit Tune + Processor" mode:
- Select a loudspeaker: At the end of the measurement the following symbols will appear:
: Speaker in electrical phase.
: Speaker in electrical counter-phase.
Modify the installation by reversing the electrical phase and repeat the operation for verification. All results of Polarity Check measurement will be available in the final measurement report Create a Report
(see sect. 6.2.4.9)

- Processor volume: Test volume adjustment. Set the starting measurement volume at about -26 dB.
- Close: ✗ Closes the Polarity Check window.
Polarity Check in "bit Tune" mode:
- Single Speaker: Checks the electrical phase of a single speaker of the system.
- Select a Speaker: Select the speakers manually, laying down your audio system by hand.
- Channel Map: Select the speaker where to verify the electrical phase in the audio system.
At the end of the measurement the following symbols will appear :
: Speaker in electrical phase.
: Speaker in electrical counter-phase.
Modify the installation by reversing the electrical phase and repeat the operation for verification. All results of Polarity Check measurement will be available in the final measurement report Create a Report (see sect. 6.2.4.9)

- bit Tune volume: Test volume adjustment. Set the starting measurement volume at about -26 dB.
- Close: ✗ Closes the Polarity Check window.
Refer to section 7.3 with measurement examples.
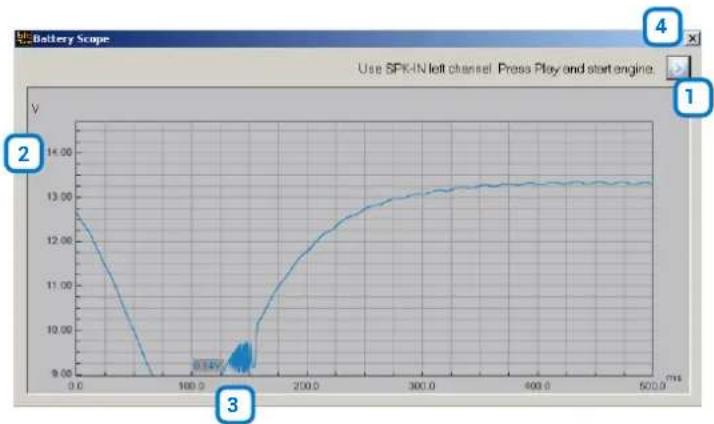
6. BATTERY SCOPE
This tool implements a VDC oscilloscope, which monitors the behavior of the vehicle's battery voltage during engine start or during the audio system operation.
The active inputs for this type of measurement are:
SPK Left+ SPK Left -
line
| Time (ms) | Voltage (V) | | --------- | ----------- | | 0 | 14.00 | | 100 | 9.00 | | 200 | 12.00 | | 300 | 13.00 | | 400 | 13.50 | | 500 | 13.50 |Purpose of the measurement:
In audio installations some malfunction or unwanted noise on the speakers may occur, especially when starting the engine.
When starting the engine, the vehicle's battery voltage may drop, for a few moments, below 8 Volts. This can compromise the normal operation of some audio device.
The Battery Scope allows to measure, by displaying it, this phenomenon, which otherwise is not detectable by an ordinary tester, given the brevity of the duration. Once you have found that the problem is caused by low battery voltage, proceed to battery recharging or replacement.
Control panel description:
- Play: Starts the measurement, start the car subsequently.
- Maximum battery voltage before starting the car.
- Minimum battery voltage peak reached during ignition.
- ✗ Close: Closes the Battery Scope measurement window.
Remark: when the Battery Scope instrument is used, power the bit Tune using the mains adapter. While performing the measurement, connect the alligator supplied in the packaging between the car chassis and the BNC PROBE LEFT connector.
Refer to section 7.9 with measurement examples.
- TARGET CURVE

line
| Frequency | Value | | --------- | ----- | | 20 | 3 | | 50 | 1 | | 100 | 2 | | 200 | 3 | | 500 | 4 | | 800 | 5 | | 1k | 6 | | 2k | 7 | | 5k | 8 | | 10k | 9 | | 20k | 10 | | 50k | 11 |When you start the Processor Auto Setup function (see sect. 6.2.6) you are prompted to set a Target curve.
The PC software, through the hardware acquisition system connected to the PC via USB, performs the analysis of the acoustic response of the passenger compartment and sets, using a Target curve, the optimal acoustic response and time delays that the installed processor will store.
The Target curve is a goal to be achieved taking into account several factors:
A) Type of vehicle's passenger compartment.
B) Type of amplification system installed.
C) Response of the speakers.
D) Type of processor installed.
In order to listen to the different target curves it is necessary to allow the bit Tune to program the processor using its available memories. Sound processing is performed by the processor, following the instructions provided by the bit Tune.
Description of functions:
-
Target Curve Setting: Open the window to select a Target curve:
-
HAC-U ▶ Harmonized Acoustic Curve Universal
- HAC-R ▶ Harmonized Acoustic Curve Rock
- HAC-J ▶ Harmonized Acoustic Curve Jazz
- Flat ▶ Flat Curve.

Custom: The Target curve can also be modeled at will to allow sound characterization according to personal listening experience.
Flat Curve: does not apply any equalization, ensuring a linear response that can be measured instrumentally through the RTA measurement.
Experience suggests that a degree of coloring of the response confers greater pleasantness to the listening experience. Below are three other Target curves, optimized for a pleasant acoustic response and which can be chosen according to personal taste.
During the Auto Eq + Auto Time Alignment procedure you can select two preset target curves (see sect. 7.6.9).
The software provides an 11-pole parametric equalizer. To vary the equalizer parameters, in order to set a Target equalization curve, it is possible to operate in two ways:
a) position the mouse cursor at the pole to be set and model the curve using the mouse.
b) Draw Curve: select a pole with the mouse and manually set the Frequency, Gain and Q values.
After modeling the equalization curve, disable the Draw Curve function button.
Save the curve using the Save Curve function.

line
| Frequency (Hz) | Value | | -------------- | ----- | | 622 | 1 | | 11.2 | 2 | | 5.0 | 3 | | 6 | 4 | | 7 | 5 | | 8 | 6 | | 9 | 7 | | 10 | 8 | | 11 | 9 |- Flat Curve: Restores the equalizer linearly (Flat) for a curve that was created earlier.
- OK: Confirms the changes entered for the Target curve, making it available to the Processor Auto setup, without saving it to your PC.
- Edit Curve / Save Curve: Srecalls a preloaded or new curve and then saves it. The saving of the set curve is stored in a file (eg: "curve.srv"), which can be later reloaded in the bit Tune or Virtuoso, using the Load Curve function.
- Delete a Curve ☒ Deletes a previously saved response curve.
- Import Curve: Loads a Target Curve previously saved on the PC.
- Close: Closes the window without making any change/variations to the Target Curve. Refer to section 7.6 with measurement examples.
8. SOURCE CHECK
The tool allows you to analyze signals from an amplified or pre-amplified source measuring amplitude distortion and frequency response using the audio tracks provided in the bit Tune Setup CD.
WARNING: When testing power output of an amplifier, it is recommended to disconnect the speakers from the amplifier and replace them with an appropriate resistive load capable of handling the output of the amplifier. Otherwise, the speakers may be damaged.
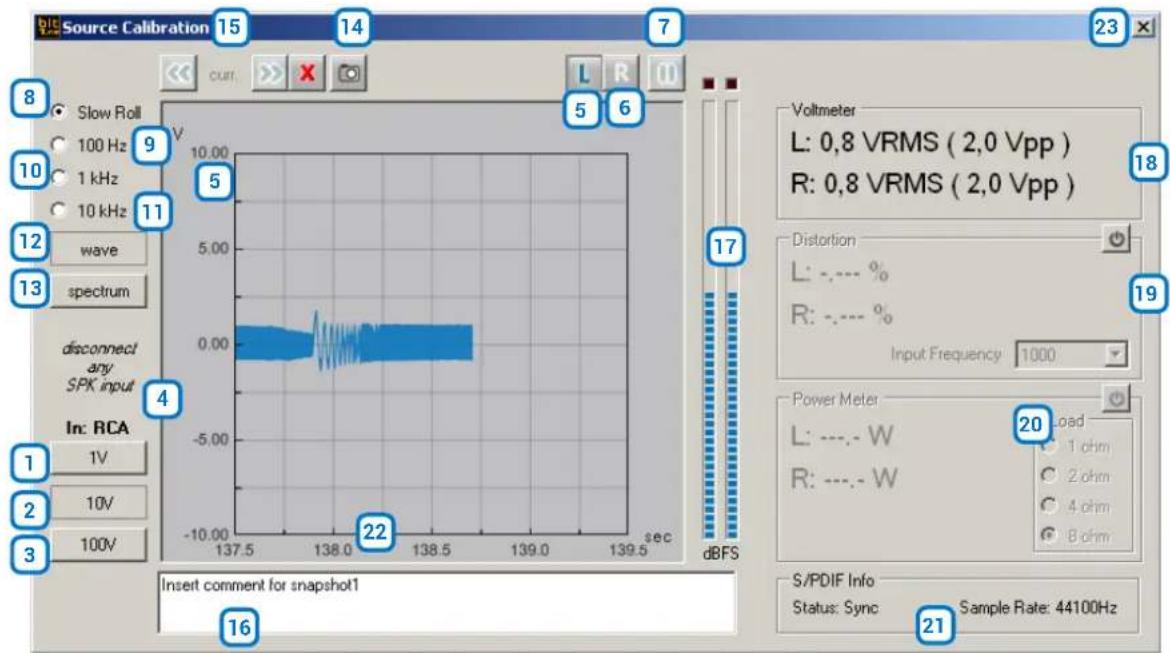
Description of functions:
1-2-3. Buttons for changing the full-scale sensitivity of the oscilloscope.
Depending on the selected inputs (see sect. 3.3 point 6) the sensitivity values are pre-set:
RCA inputs: 1 V - 10 V - 100 V.
BNC inputs: 1 V - 10 V - 100 V.
SPK IN inputs: 10 V - 100 V - 1000 V.
Use buttons 1 - 2 - 3 to best display the amplitude of the signal being examined without it exceeding the full-scale amplitude.
- IN: Indicates the active input selected for the measurement (see sect. 3.3 point 6).
- LEFT: Activates the measurement of the signal on the LEFT input channel. The track displayed on the screen is blue.
- RIGHT: Activates the measurement of the signal on the RIGHT input channel. The track displayed on the screen is green.
- PAUSE: Blocks the acquisition of the input signal, freezing the acquired signal on the screen.
- Slow Roll: Sets the "time/div" time base for the signal acquisition to a slow pace. Acquires the signal whose cycle is less than 5 seconds.
9 -10 -11. Depending on the frequency of the signals to be displayed, you need to set the timebase to the optimal frequency for a correct visualization.
100 Hz: 0.0025 sec/division (2.5 ms/div.)
1 KHz: 0.00025 sec/division (0.25 ms/div.)
10 KHz: 0.00025 sec/division (0.025 ms/div.)
Through the time display of the cyclic (periodic) signal, you can know its frequency:
$$ \text { Frequency (Hz) } = \frac {1}{\text { Period (ms) }} $$
The period is the time that the signal takes to complete a cycle. The period's time is measured by adding the number of divisions in a signal's cycle.
- WAVE: Enables the oscilloscope function.
- SPECTRUM: Enables the spectrum analyzer function.

- Capture acquisition: saves the acquisition of the active measurement channel. After the acquisition please type a comment on the measurement (see point 14).
- Scroll view: function activated by selecting the acquisition pause button (see point 7). Allows you to view the waveforms captured using the snap acquisition function (see point 12).
- Snapshot Text: This box is used to enter a comment on the acquisition made with the snap function (see point 12).

Save the comment by selecting or delete the acquisition by selecting the button.
- BAR GRAPH AMPLITUDE: Displays, through a bar graph meter, the signal level at the input, warning about the over range of the full scale through the switching of red LEDs. The bar graph scale is logarithmic.
- VOLTMETER: Displays the value of the RMS voltage and the Peak to Peak voltage of the input channels.
- THD: Activating this window will show the amount of distortion in % of input channels compared to a sample frequency generated by the audio source inserting the setup CD at 1 kHz.
- Power Meter: This tool is not available in the Source Check.
- S/PDIF Info: Shows the sampling sequence of the signal available on the Optical Input socket.
- Screen: Displays the time progress or the spectrum of the signal applied to the input of the bit Tune.
- Close: Closes the Calibration Source measurement window.
Refer to section 7.1 with measurement examples.
9. CREATE REPORT
This function automatically creates a PDF spreadsheet, containing the information regarding the installer, the client, adjustments made through the Processor Auto Setup and any performed measurement.
Donald Duck
1113 Quack Street
Duckburg, Calisota
USA
audison
bit Tune v. 3.0
Vehicle Type:
BMW E60
Date:
venerdì 09/14/2021
Customer:
WALTER
Operator:
MIKE
Processor:
bit Ten D. fw. 1.2.1.0
S/N: 13100003
Note:
Full DA with AV amplifiers
System Setup:

natural_image
Top-down line drawing of a car with sensor icons and antenna array (no text or symbols)| Ch | Speaker | Polarity |
| 1 | Front WF Left | Ok |
| 2 | Front WF Right | Ok |
| 3 | Front TW Left | Ok |
| 4 | Front TW Right | Ok |
| 5 | Subwoofer | Ok |
| 6 | - | - |
| 7 | - | - |
| 8 | - | - |
Memory Status:
| Mem | Measure | Level Check | Position | Target Curve | Eq Type |
| A | AutoEQ+AutoTA | OK | Front Left | Flat Curve | Soft |
| Note: Memory B | |||||
| B | AutoEQ+AutoTA | OK | Front Left | Flat Curve | Soft |
| Note: Memory B | |||||
Data export in config file: C:\Documents and Settings\vincenzo-c.CORPORATE\Desktop\bit tune files\222.dip
RTA pre-processing
current preset: A

bar
| Frequency (Hz) | Value (dB) | |---|---| | 25 | 50.00 | | 40 | 52.00 | | 63 | 53.00 | | 100 | 54.00 | | 160 | 55.00 | | 250 | 56.00 | | 400 | 58.00 | | 630 | 60.00 | | 14 | 62.00 | | 19k | 65.00 | | 2.5k | 67.00 | | 49 | 69.00 | | 8.3k | 71.00 | | 13n | 68.00 | | 168 | 58.00 |RTA post-processing
current preset: A

bar
| Frequency (Hz) | Value (dB) | |---|---| | 25 | 67.0 | | 30 | 65.0 | | 35 | 64.0 | | 40 | 63.0 | | 45 | 62.0 | | 50 | 61.0 | | 55 | 60.0 | | 60 | 59.0 | | 65 | 58.0 | | 70 | 57.0 | | 75 | 56.0 | | 80 | 55.0 | | 85 | 54.0 | | 90 | 53.0 | | 95 | 52.0 | | 100 | 51.0 | | 105 | 50.0 | | 110 | 49.0 | | 115 | 48.0 | | 120 | 47.0 | | 125 | 46.0 | | 130 | 45.0 | | 135 | 44.0 | | 140 | 43.0 | | 145 | 42.0 | | 150 | 41.0 | | 155 | 40.0 | | 160 | 39.0 | | 165 | 38.0 | | 170 | 37.0 | | 175 | 36.0 | | 180 | 35.0 | | 185 | 34.0 | | 190 | 33.0 | | 195 | 32.0 | | 200 | 31.0 | | 205 | 30.0 | | 210 | 29.0 | | 215 | 28.0 | | 220 | 27.0 | | 225 | 26.0 | | 230 | 25.0 | | 235 | 24.0 | | 240 | 23.0 | | 245 | 22.0 | | 250 | 21.0 | | 255 | 20.0 | | 260 | 19.0 | | 265 | 18.0 | | 270 | 17.0 | | 275 | 16.0 | | 280 | 15.0 | | 285 | 14.0 | | 290 | 13.0 | | 295 | 12.0 | | 300 | 11.0 | | 305 | 10.0 | | 310 | 9.0 | | 315 | 8.0 | | 320 | 7.0 | | 325 | 6.0 | | 330 | 5.0 | | 335 | 4.0 | | 340 | 3.0 | | 345 | 2.0 | | 350 | 1.0 | | 355 | 0.5 | | 360 | -0.5 | | 365 | -1.0 | | 370 | -1.5 | | 375 | -2.0 | | 380 | -2.5 | | 385 | -3.0 | | 390 | -3.5 | | 395 | -4.0 | | 400 | -4.5 | | 405 | -5.0 | | 410 | -5.5 | | 415 | -6.0 | | 420 | -6.5 | | 425 | -7.0 | | 430 | -7.5 | | 435 | -8.0 | | 440 | -8.5 | | 445 | -9.0 | | 450 | -9.5 | | 455 | -10.0 | | 460 | -10.5 | | 465 | -11.0 | | 470 | -11.5 | | 475 | -12.0 | | 480 | -12.5 | | 485 | -13.0 | | 490 | -13.5 | | 495 | -14.0 | | 500 | -14.5 | | 505 | -15.0 | | 510 | -15.5 | | 515 | -16.0 | | 520 | -16.5 | | 525 | -17.0 | | 530 | -17.5 | | 535 | -18.0 | | 540 | -18.5 | | 545 | -19.0 | | 550 | -19.5 | | 555 | -20.0 | | 560 | -20.5 | | 565 | -21.0 | | 570 | -21.5 | | 575 | -22.0 | | 580 | -22.5 | | 585 | -23.0 | | 590 | -23.5 | | 595 | -24.0 | | 600 | -24.5 | | 605 | -25.0 | | 610 | -25.5 | | 615 | -26.0 | | 620 | -26.5 | | 625 | -27.0 | | 630 | -27.5 | | 635 | -28.0 | | 640 | -28.5 | | 645 | -29.0 | | 650 | -29.5 | | 655 | -30.0 | | 660 | -30.5 | | 665 | -31.0 | | 670 | -31.5 | | 675 | -32.0 | | 680 | -32.5 | | 685 | -33.0 | | 690 | -33.5 | | 695 | -34.0 | | 700 | -34.5 | | 705 | -35.0 | | 710 | -35.5 | | 715 | -36.0 | | 720 | -36.5 | | 725 | -37.0 | | 730 | -37.5 | | 735 | -38.0 | | 740 | -38.5 | | 745 | -39.0 | | 750 | -39.5 | | 755 | -40.0 | | 760 | -40.5 | | 765 | -41.0 | | 770 | -41.5 | | 775 | -42.0 | | 780 | -42.5 | | 785 | -43.0 | | 790 | -43.5 | | 795 | -44.0 | | 800 | -44.5 | | 805 | -45.0 | | 810 | -45.5 | | 815 | -46.0 | | 820 | -46.5 | | 825 | -47.0 | | 830 | -47.5 | | 835 | -48.0 | | 840 | -48.5 | | 845 | -49.0 | | 850 | -49.5 | | 855 | -50.0 | | 860 | -50.5 | | 865 | -51.0 | | 870 | -51.5 | | 875 | -52.0 | | 880 | -52.5 | | 885 | -53.0 | | 890 | -53.5 | | 895 | -54.0 | | 900 | -54.5 | | 905 | -55.0 | | 910 | -55.5 | | 915 | -56.0 | | 920 | -56.5 | | 925 | -57.0 | | 930 | -57.5 | | 935 | -58.0 | | 940 | -58.5 | | 945 | -59.0 | | 950 | -59.5 | | ... (Repeated multiple times) between frequencies of the frequency spectrum and their corresponding values for each frequency spectrum are shown in the chart as a series of bars with labels 'a' and 'b' respectively at the bottom.User Snapshot:
[snapshot 1] - Left Channel
Note:
[snapshot 2] - Left Channel
Note:
6.2.5 "SETTINGS" MAIN MENU
Clicking on the Settings button opens a drop down menu as shown on the right:

1. MIC CALIBRATION
This function starts a wizard for calibrating the HSM microphone. The procedure must be performed when using the instrument for the first time and periodically according to use (see sect. 7.1).
2. CONNECT TO
This feature allows to connect and synchronize the PC Software to the bit Tune or to the Audison bit processor, connecting it via the USB OUT port of the bit Tune. When the Audison processor connection is active (see sect. 6.2.6), it will not be possible to interact with the PC software of the Audison processor.

Select Connect to -> bit Tune to connect the PC Software to the bit Tune. Select Connect to -> Processor to connect the PC Software to an Audison bit processor.

3. DISCONNECT TO
This feature allows you to disconnect from the bit Tune PC Software a previously interfaced Audison processor or the bit Tune itself. When the processor is DISCONNECTED from the Tune bit PC Software, but is still connected via the USB cable, you can use the processor's PC software in conjunction with the software of the bit Tune.
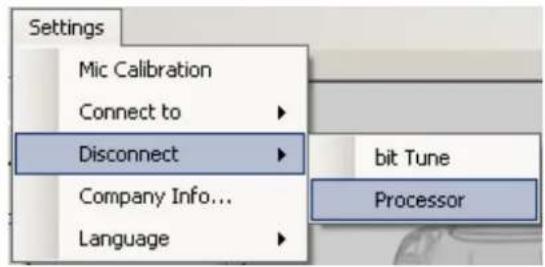
Select Disconnect -> bit Tune to disconnect the bit Tune from the PC Software. Select Disconnect -> Processor to disconnect the Audison bit processor from the PC Software.
4. COMPANY INFO
Customizes the bit Tune through the user's personal data. This information will be printed on the header of the final report (see sect 6.2.4.9).

5. LANGUAGE
Allows you to display context messages in the selected language (Italian or English). By default, the PC software is automatically set to the English language. To change the language, select language from the menu and restart the PC software.
Note: Additional languages may be available in the future. Please check through "Check for Updates" (see sect. 6.2.3.6).

6.2.6 PROCESSOR AUTO SETUP MENU
Using the "Processor Auto Setup" function you can automatically set time delays, equalization curve and output levels of an Audison bit connected to the bit Tune, setting the processor memories according to your needs. For best acoustic results, the placement of the speakers and their orientation is very important. In fact, no equalizer can improve "fuzzy" sounds or rich in unwanted harmonics, resulting from internal reflections in the vehicle. Before the Processor auto Setup, make sure that the audio system is characterized in the most appropriate manner possible.

MENU description
- CHANNEL MAP: This window is active, and corresponds to the CHANNEL MAP of the processor connected and previously configured. The window contains the listening position indicator (selected in green). The diagram shows four positions: driver (Front Left), passenger (Front Right), center front (Front) and rear passengers (Rear). The indication is acting solely as a reference, allowing you to view the listening point on which the calculation of time delays and equalization has been optimized. During the measurements the HSM microphone will be positioned on the selected listening point.
REMARK: if the central zone is selected as the listening point, through a guided procedure the software will manage the positioning of the HSM microphone step by step through messages, in order to recreate an Overall listening based on several measures inside the passenger compartment of the car. The maximum performance of the Overall processing will be obtained using the bit One HD Virtuoso, where it will be possible to take advantage of the "Percept Ⓞ" algorithm that will exploit the FIR platform of the dsp in use.
If you select the calibration of a listening point of the "Driver" or "Passenger" type, the software will instruct you to place the HSM microphone in the position corresponding to the listening point.
-
Auto EQ + Auto Time Alignment: This function starts the wizard for the complete automatic setting of the Audison bit processors for the equalization, the time delays and the amplifiers sensitivity check (see sect. 7.6).
-
Auto Time Alignment: This function (included in the function described in point 2) only starts the wizard for calibrating automatically, inside the Audison bit processor, the time delays of the system (see sect. 7.7).
After the Auto EQ + Auto Time Alignment procedure, or in the case of previously calibrated processors, it can be useful to check or edit the time delays. - Level Check: This function (included in point 2) only starts the wizard for controlling the level of the system's audio channels. The system warns you in case of major differences in the acoustic level, suggesting to tweak the sensitivity of the amplifiers. Small variations in level between different channels and the stereo balance will be corrected automatically connected to the outputs of the processor. The Level Check can be useful if you want to check the correct sensitivity level of the amplifier, without starting the Auto EQ + Auto Time Alignment procedure.
- Position: Next to this tag is the name of the listening point chosen in the Channel Map.
- Level Check: The LED lighting up indicates that the "Level Check" procedure has been performed.
- Auto EQ + Auto Time Alignment: The LED lighting up indicates that the "Auto EQ + Auto Time Alignment" procedure has been performed.
- Auto Time Alignment: The LED lighting up indicates that the "Auto Time Alignment" procedure has been performed.
- Memory Status: Displays operations performed on the memories of the connected processor.
- Save Config: Saves the memory configurations of the connected processor.
- Finalize: Transfers calibration adjustments to the memories of the connected processor.
6.2.7 SESSION TOOLS MENU
This is a menu for immediate access to the functions described in the "Config" menu.
Description of functions:
- Oscilloscope: see sect. 6.2.4.1
- RTA: see sect. 6.2.4.2
- Generators: see sect 5.2.4.3
- Player: see sect. 6.2.4.4
- Polarity Check: see sect. 6.2.4.5
- Source Check: see sect 6.2.4.8
- Battery Scope: see sect. 6.2.4.6
- Create Report: see sect 5.2.4.9

6.3 SOFTWARE START IN BIT TUNE MODE
The launch of the PC Software in "bit Tune" mode provides all the tools described in section 6.2, relating the "TOOLS", section, except the functionalities of interfacing to an Audison bit processor: AUTO EQ+AUTO TIME ALIGNMENT, AUTO TIME ALIGNMENT, LEVEL CHECK, POLARITY CHECK.
7. USING BIT TUNE WITH THE HELP OF A PC
7.1 SOURCE CHECK
Analyzes, through electrical measurements, the characteristics of an audio source connected to the bit Tune. It is possible to measure the maximum output voltage, the maximum undistorted level (value required for connecting to a processor), the distortion, or to check for any malfunctions.
It is also possible to display the presence of equalization on the output signal of the source, and determine the need to perform the de-equalization process in the processor.
It is necessary to perform this analysis when connecting a processor to a source in order to ensure the highest level of undistorted signal. This allows to avoid any background noise at the output of the processor, and in general, to ensure the highest undistorted level at the input of any audio device, and obtain the best acoustic response.
Connection diagram:
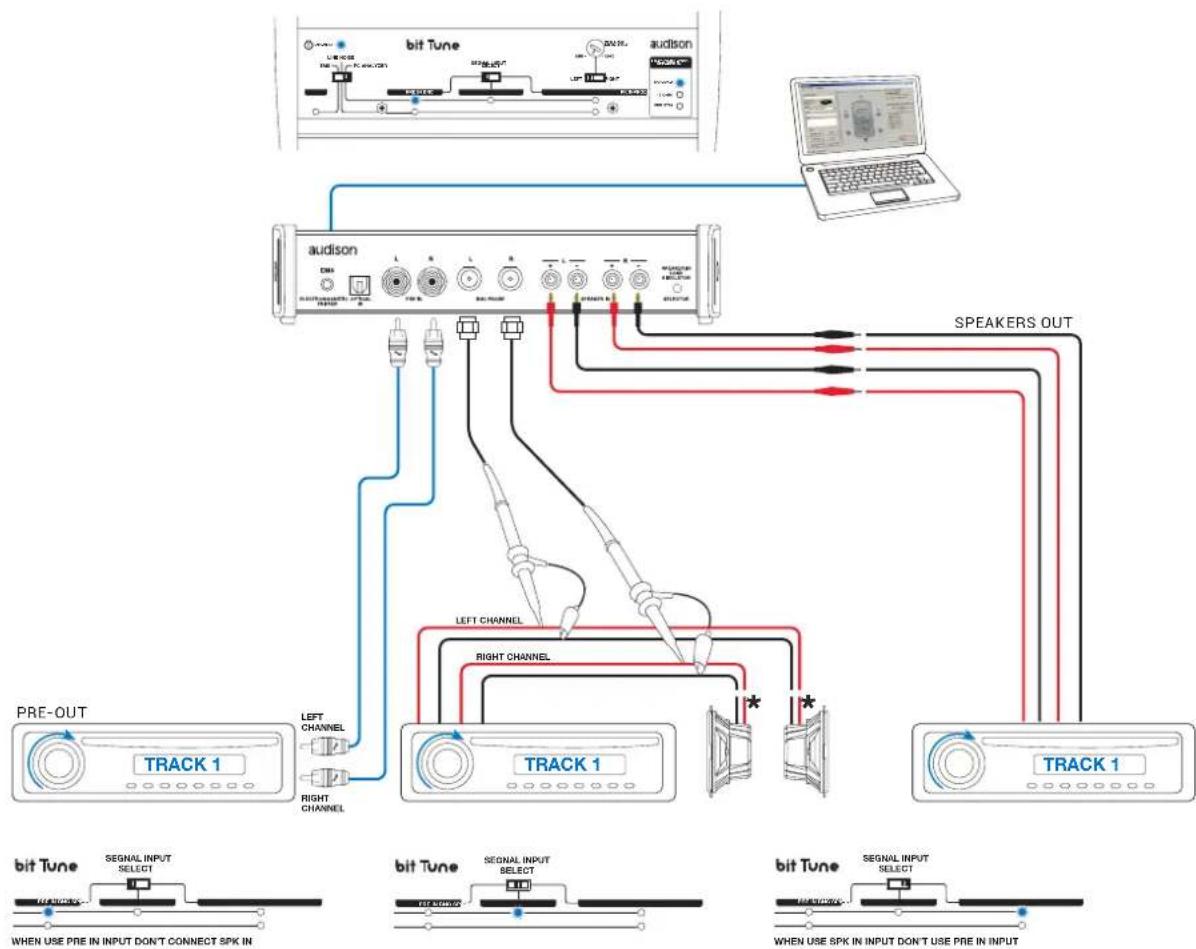
flowchart
graph TD
    A["PRE-OUT TRACK 1"] --> B["RIGHT CHANNEL"]
    B --> C["LEFT CHANNEL"]
    C --> D["RIGHT CHANNEL"]
    D --> E["SPEAKERS OUT"]
    E --> F["TRACK 1"]
    F --> G["RIGHT CHANNEL"]
    G --> H["SPEAKERS OUT"]
    H --> I["TRACK 1"]
    I --> J["SPEAKERS OUT"]
    J --> K["SPEAKERS OUT"]
    K --> L["TRACK 1"]
    L --> M["SPEAKERS OUT"]
    M --> N["SPEAKERS OUT"]
    N --> O["SPEAKERS OUT"]
    O --> P["SPEAKERS OUT"]
    P --> Q["SPEAKERS OUT"]
    Q --> R["SPEAKERS OUT"]
    R --> S["SPEAKERS OUT"]
    S --> T["SPEAKERS OUT"]
    T --> U["SPEAKERS OUT"]
    U --> V["SPEAKERS OUT"]
    V --> W["SPEAKERS OUT"]
    W --> X["SPEAKERS OUT"]
    X --> Y["SPEAKERS OUT"]
    Y --> Z["SPEAKERS OUT"]
    Z --> AA["SPEAKERS OUT"]
    AA --> AB["SPEAKERS OUT"]
    AB --> AC["SPEAKERS OUT"]
    AC --> AD["SPEAKERS OUT"]
    AD --> AE["SPEAKERS OUT"]
    AE --> AF["SPEAKERS OUT"]
    AF --> AG["SPEAKERS OUT"]
    AG --> AH["SPEAKERS OUT"]
    AH --> AI["SPEAKERS OUT"]
    AI --> AJ["SPEAKERS OUT"]
    AJ --> AK["SPEAKERS OUT"]
    AK --> AL["SPEAKERS OUT"]
    AL --> AM["SPEAKERS OUT"]
    AM --> AN["SPEAKERS OUT"]
    AN --> AO["SPEAKERS OUT"]
    AO --> AP["SPEAKERS OUT"]
    AP --> AQ["SPEAKERS OUT"]
    AQ --> AR["SPEAKERS OUT"]
    AR --> AS["SPEAKERS OUT"]
    AS --> AT["SPEAKERS OUT"]
    AT --> AU["SPEAKERS OUT"]
    AU --> AV["SPEAKERS OUT"]
    AV --> AW["SPEAKERS OUT"]
    AW --> AX["SPEAKERS OUT"]
    AX --> AY["SPEAKERS OUT"]
    AY --> AZ["SPEAKERS OUT"]
    AZ --> BA["SPEAKERS OUT"]
    BA --> BB["SPEAKERS OUT"]
    BB --> BC["SPEAKERS OUT"]
    BC --> BD["SPEAKERS OUT"]
    BD --> BE["SPEAKERS OUT"]
    BE --> BF["SPEAKERS OUT"]
    BF --> BG["SPEAKERS OUT"]
    BG --> BH["SPEAKERS OUT"]
    BH --> BI["SPEAKERS OUT"]
    BI --> BJ["SPEAKERS OUT"]
    BJ --> BK["SPEAKERS OUT"]
    BK --> BL["SPEAKERS OUT"]
    BL --> BM["SPEAKERS OUT"]
    BM --> BN["SPEAKERS OUT"]
    BN --> BO["SPEAKERS OUT"]
    BO --> BP["SPEAKERS OUT"]
    BP --> BQ["SPEAKERS OUT"]
    BQ --> BR["SPEAKERS OUT"]
    BR --> BS["SPEAKERS OUT"]
    BS --> BT["SPEAKERS OUT"]
    BT --> BU["SPEAKERS OUT"]
    BU --> BV["SPEAKERS OUT"]
    BV --> BW["SPEAKERS OUT"]
Fig. 1A Fig. 1B Fig. 1C
* Disconnect the speaker
- The measurement operation must be performed with the vehicle's engine turned off and without any radio frequency devices in the measurement area.
- Turn the bit Tune on and connect the USB cable to the PC.
- Set the function switch of the bit Tune on PC ANALYZER.
- Start the bit Tune software by clicking the icon on the PC desktop and launch the software in bit Tune mode or bit Tune + Processor if a processor is present in your system
- Set the measurement input by the "SIGNAL INPUT SELECT" switch.
PRE IN: for analyzing signals from preamplified sources (fig. 1A). Disconnect the SPK IN and BNC inputs.
BNC: for analyzing signals from preamplified or amplified sources (fig. 1B). Disconnect the SPK IN and RCA inputs.
SPK IN: for analyzing signals from preamplified sources (fig. 1C). Disconnect the PRE IN and BNC inputs.
WARNING: A continuous signal level that is too high may cause permanent damage to the speakers.
strongly recommended to disconnect the speakers, if present, during the measurement.

- Choose the Source Check function from the main menu of the bit Tune's PC Software.
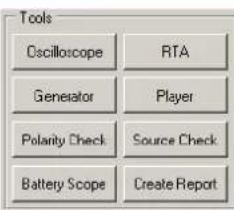
-
-Insert the supplied "bit Tune setup" CD into the AUDIO CD player.
-
Playback track 1 (press Play);
- Set all tone controls to zero (0);
- Adjust balance and fader to the center (0);
- Adjust the source volume to the minimum.
Press OK on the PC Software to continue the configuration.
Press Cancel to exit the SOURCE CHECK.

- Adjust the source volume towards the maximum (90% of the maximum range).
a) In the event of the voltmeter (Bar Graph) showing the message OVER in red, switch the input sensitivity to the next less sensitive scale (e.g. from 1 V to 10 V). Once the OVER red message disappears, the display shows a waveform of the selected range.
b) In case the display shows a waveform similar to the one shown on the right, we are in the presence of an equalized source.
Subsequently, in the processor configuration phase you will need to perform the de-equalization procedure.
In case the display shows a linear waveform like the one in the figure, we are in the presence of a non-equalized signal. The de-equalization procedure should not be carried out.


Note: To insert the figure in the Final report, save the snapshot (see sect. 6.2.4.1).
- Adjustment of maximum undistorted volume of the source.
- Bring the time base to 1 kHz or 10 kHz.
- If the display shows saturated waveforms (clipping) as shown below (fig 1, fig. 2) decrease the source volume so that the signal does not show any saturation (fig. 3, fig. 4). Select the Right channel and repeat the measurement.

Fig. 1
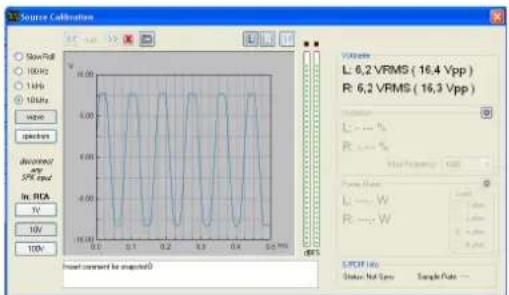
Fig. 2

Fig. 3
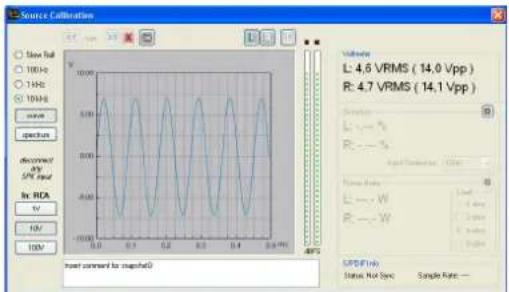
Fig. 4
- Measurement of the source's output level. Play track 5 on the CD: 1 kHz sine, in the Voltmeter section the value of the undistorted output signal will be shown in Volts RMS and Volts peak-to-peak.
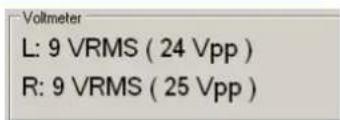
- Measurement of the source's distortion level.
- In the Distortion section the distortion value of the two channels will be shown automatically.
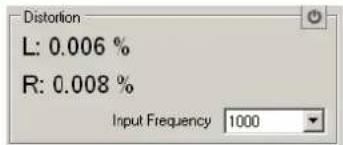
- Visualizing the source's pass-band.
- Play track 3 on the CD: White noise.
- Select the Spectrum function.
This will display the signal's FFT, non-equalized fig. 1, or equalized fig. 2.

Fig 1

line
| Time (ms) | Voltage | | --------- | ------- | | 0 | 40 | | 10 | 38 | | 20 | 36 | | 30 | 34 | | 40 | 32 | | 50 | 30 | | 60 | 28 | | 70 | 26 | | 80 | 24 | | 90 | 22 | | 100 | 20 | | 110 | 18 | | 120 | 16 | | 130 | 14 | | 140 | 12 | | 150 | 10 | | 160 | 8 | | 170 | 6 | | 180 | 4 | | 190 | 2 | | 200 | 0 | | 210 | -2 | | 220 | -4 | | 230 | -6 | | 240 | -8 | | 250 | -10 | | 260 | -12 | | 270 | -14 | | 280 | -16 | | 290 | -18 | | 300 | -20 | | 310 | -22 | | 320 | -24 | | 330 | -26 | | 340 | -28 | | 350 | -30 | | 360 | -32 | | 370 | -34 | | 380 | -36 | | 390 | -38 | | 400 | -40 | | 410 | -42 | | 420 | -44 | | 430 | -46 | | 440 | -48 | | 450 | -50 | | 460 | -52 | | 470 | -54 | | 480 | -56 | | 490 | -58 | | 500 | -60 | | 510 | -62 | | 520 | -64 | | 530 | -66 | | 540 | -68 | | 550 | -70 | | 560 | -72 | | 570 | -74 | | 580 | -76 | | 590 | -78 | | 600 | -80 | | 610 | -82 | | 620 | -84 | | 630 | -86 | | 640 | -88 | | 650 | -90 | | 660 | -92 | | 670 | -94 | | 680 | -96 | | 690 | -98 | | 700 | -100 | | 710 | -102 | | 720 | -104 | | 730 | -106 | | 740 | -108 | | 750 | -110 | | 760 | -112 | | 770 | -114 | | 780 | -116 | | 790 | -118 | | 800 | -120 | | 810 | -122 | | 820 | -124 | | 830 | -126 | | 840 | -128 | | 850 | -130 | | 860 | -132 | | 870 | -134 | | 880 | -136 | | 890 | -138 | | 900 | -140 | | 910 | -142 | | 920 | -144 | | 930 | -146 | | 940 | -148 | | 950 | -150 | | 960 | -152 | | 970 | -154 | | 980 | -156 | | 990 | -158 | | 1000 | -160 | | 11E-1 | -162 | | 12E-1 | -164 | | 13E-1 | -166 | | 14E-1 | -168 | | 15E-1 | -170 | | 16E-1 | -172 | | 17E-1 | -174 | | 18E-1 | -176 | | 19E-1 | -178 | | 2E-1 | -180 | | 3E-1 | -182 | | 4E-1 | -184 | | 5E-1 | -186 | | 6E-1 | -188 | | 7E-1 | -190 | | 8E-1 | -192 | | 9E-1 | -194 | | 1E-2 | -196 | | 2E-2 | -198 | | 3E-2 | -200 | | 4E-2 | -202 | | 5E-2 | -204 | | 6E-2 | -206 | | 7E-2 | -208 | | 8E-2 | -210 | | 9E-2 | -212 | | 1E-3 | -214 | | 2E-3 | -216 | | 3E-3 | -218 | | 4E-3 | -220 | | 5E-3 | -222 | | 6E-3 | -224 | | 7E-3 | -226 | | 8E-3 | -228 | | 9E-3 | -230 | | 1E-4 | -232 | | 2E-4 | -234 | | 3E-4 | -236 | | 4E-4 | -238 | | 5E-4 | -240 | | 6E-4 | -242 | | 7E-4 | -244 | | 8E-4 | -246 | | 9E-4 | -248 | | 1E-5 | -250 | | 2E-5 | -252 | | 3E-5 | -254 | | 4E-5 | -256 | | 5E-5 | -258 | | 6E-5 | -260 | | 7E-5 | -262 | | 8E-5 | -264 | | 9E-5 | -266 | | 1E-6 | -268 | | 2E-6 | -270 | | 3E-6 | -272 | | 4E-6 | -274 | | 5E-6 | -276 | | 6E-6 | -278 | | 7E-6 | -280 | | 8E-6 | -282 | | 9E-6 | -284 | | 1E-7 | -286 | | 2E-7 | -288 | | 3E-7 | -290 | | 4E-7 | -292 | | 5E-7 | -294 | | 6E-7 | -296 | | 7E-7 | -298 | | 8E-7 | -300 | | 9E-7 | -302 | | 1E-8 | -304 | | 2E-8 | -306 | | 3E-8 | -308 | | 4E-8 | -310 | | 5E-8 | -312 | | 6E-8 | -314 | | 7E-8 | -316 | | 8E-8 | -318 | | 9E-8 | -320 | | 1E-9 | -322 | | Note: The data is extracted from the Source Calibration. Values are calculated based on the formula of the plot. The data is presented in the table above as follows: Values: L=0.7, VRMS(3.8 Vpp) Values: R=0.7, VRMS(3.9 Vpp) Value: L=-∞, % Value: R=-∞, % Value: L=∞, % Value: R=∞, % Value: L=∞, % Value: R=∞, % Value: L=∞, % Value: L=∞, % Value: L=∞, % Value: L=∞, % Value: L=∞, % Value: L=∞, % Value: L=∞, % Value: L=∞, % Value: L=∞, % Value: L=∞, % Value: L=∞, % Value: L=∞, % Value: L=∞, %. Value: L=∞, %. Value: L=∞, %. Value: L=∞, %. Value: L=∞, %. Value: L=∞, %. Value: L=∞, %. Value: L=∞, %. Value: L=∞, %. Value: L=∞, %. Value: L=∞, %. Value: L=∞, %. Value: L=∞, %. Value: FV# No. Status: No Spec Sample Rate [ ]Fig. 2
Note: To insert the figure in the Final report, save the snapshot (see sect 6.2.4.1).
- The output level of the source adjusted this way is set for optimal connection to the processor. Leave the source's volume unchanged, or take note of its set value, making sure that with the start of the processor configuration procedure it remains in the same position.
7.2 AUTOMATIC CALIBRATION OF THE HSM MICROPHONE
This section highlights the HSM microphone calibration stages in a system that includes an Audison bit processor.
Connection diagram:

flowchart
graph TD
    A["Car with Seat"] --> B["Switch"]
    B --> C["Laptop"]
    C --> D["Digital Signal Outputs"]
    D --> E["AUX INPUTS"]
    E --> F["SIGNAL INPUTS"]
    F --> G["Switch"]
    G --> H["Laptop"]
    H --> I["Digital Signal Outputs"]
    I --> J["AUX INPUTS"]
    J --> K["SIGNAL INPUTS"]
    K --> L["Laptop"]
    L --> M["Digital Signal Outputs"]
    M --> N["AUX INPUTS"]
    N --> O["SIGNAL INPUTS"]
    O --> P["Laptop"]
    P --> Q["Digital Signal Outputs"]
    Q --> R["AUX INPUTS"]
    R --> S["SIGNAL INPUTS"]
Fig. 1
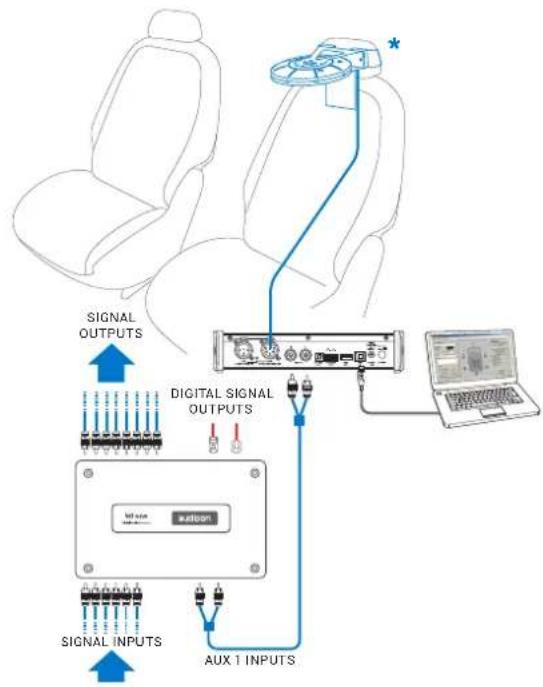
flowchart
graph TD
    A["SIGNAL INPUTS"] --> B["Digital Signal Outputs"]
    B --> C["Laptop"]
    D["SIGNAL OUTPUTS"] --> B
    E["AUX 1 INPUTS"] --> B
    B --> F["Network Interface"]
Fig. 2

flowchart
graph TD
    A["Car's Seat"] --> B["SIGNAL OUTPUTS"]
    B --> C["Central Device"]
    C --> D["Laptop"]
    C --> E["Signal INPUTS"]
    E --> F["AUX INPUTS"]
    F --> G["Output"]
    style A fill:#f9f,stroke:#333
    style B fill:#ccf,stroke:#333
    style C fill:#cfc,stroke:#333
    style D fill:#fcc,stroke:#333
    style E fill:#cff,stroke:#333
    style F fill:#ffc,stroke:#333
    style G fill:#fcf,stroke:#333
Fig. 3
IMPORTANT: In the processors you
Should enable the AUX input if you use a bit Ten/D or AUXT if you use a bit One through
PC software. This can be disabled after the measurements. If you want to connect the bit Tune to AP bit amplifiers to perform measurements, but the AUX input port is already occupied, you can use the OPTICAL input port (see section 4.5.6).
* Install the HSM microphone in the passenger compartment as described in section 3.4, and proceed to its calibration as follows:
- Connect the bit Tune to the Audison bit product, as shown in fig. 1 or 2.
The calibration procedure must be performed in an environment that is as little noisy as possible, with the car's engine off, air conditioning off, doors and windows tightly closed and radio frequency devices away from the car's passenger compartment.
- Turn the bit Tune on and connect the USB cable to the PC.
- Set the bit Tune function switch on PC ANALYZER.
- Turn on the Audison bit processor and connect the USB cable to the bit Tune.
- Attach the HSM microphone inside the passenger compartment of the vehicle as shown in the figure in section. 3.4, and connect it to the HSM input of the bit Tune.
- Start the bit Tune software by clicking the icon on the PC desktop and launch the software in bit Tune + Processor mode.
- Click on the Settings menu and select Mic. Calibration
A window will appear that will prompt you to place the HSM microphone in the MIC 1 position.
Rotate the HSM microphone to the MIC 1 position as shown in the figure below.
Press Start to continue the calibration procedure.
If you wish to stop, press Cancel to exit the procedure.

natural_image
Pure technical diagram of a circular device with internal components and a pointer, no text or symbols presentThe software displays the status of the calibration procedure though a progress bar.


- Rotate the HSM microphone to the MIC 2 position as shown in the figure below and repeat the same procedure. Perform the same procedure for MIC 3, MIC 4 and MIC 5.

natural_image
Pure technical diagram of a circular device with internal components and no text or symbols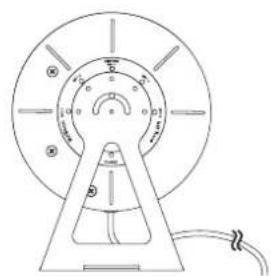
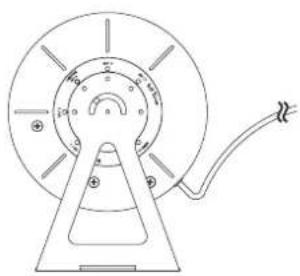
natural_image
Pure technical diagram of a circular device with internal components and a cable, no text or symbols present
- Microphone calibration successfully completed. Place the microphone back to the CENTER MIC 3 position and press OK.

natural_image
Technical line drawing of a circular mechanical component with mounting holes and a triangular base (no text or symbols)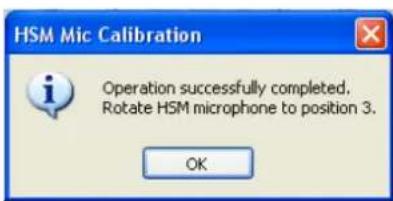
The HSM microphone is ready to be used for the measurements. Long periods of inactivity can change the characteristics of the HSM microphone. The calibration must performed at the time of first use, and then repeated at least every 3 months of activity or after long periods of non-use.
7.3 PHASE DETECTION OF SPEAKERS: POLARITY CHECK
The measurement checks the correct polarity connection of the speakers or amplifiers. The operation can be performed with an Audison bit processor connected to the audio system (fig. 1, 2 and 3) or simply by connecting the output of the bit Tune to the input of the amplifiers (fig. 4).

flowchart
graph TD
    A["20 cm / 7.9 in."] --> B["LPM"]
    B --> C["bit Tune"]
    C --> D["Laptop"]
    C --> E["SIGNAL OUTPUTS"]
    C --> F["SIGNAL INPUTS"]
    C --> G["DIGITAL SIGNAL OUTPUTS"]
    G --> H["AUX INPUTS"]
    H --> I["SIGNAL INPUTS"]
    H --> J["SIGNAL OUTPUTS"]
    J --> K["SIGNAL INPUTS"]
    style A fill:#f9f,stroke:#333
    style B fill:#ccf,stroke:#333
    style C fill:#cfc,stroke:#333
    style D fill:#fcc,stroke:#333
    style E fill:#cff,stroke:#333
    style F fill:#ffc,stroke:#333
    style G fill:#fcf,stroke:#333
    style H fill:#cff,stroke:#333
    style I fill:#ffc,stroke:#333
    style J fill:#cff,stroke:#333
    style K fill:#ffc,stroke:#333
Fig 1
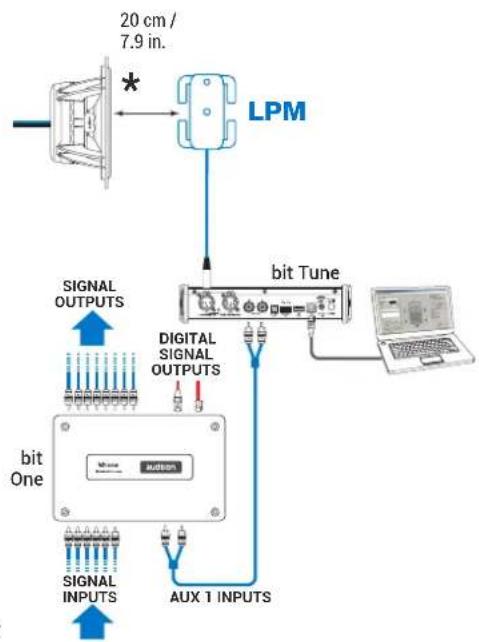
flowchart
graph TD
    A["20 cm / 7.9 in."] --> B["LPM"]
    B --> C["bit Tune"]
    C --> D["AUX 1 INPUTS"]
    C --> E["SIGNAL OUTPUTS"]
    C --> F["SIGNAL INPUTS"]
    C --> G["SIGNAL OUTPUTS"]
    G --> H["BIT"]
    C --> I["DIGITAL SIGNAL OUTPUTS"]
    I --> J["BIT"]
    C --> K["AUX 1 INPUTS"]
    K --> L["BIT"]
    style A fill:#f9f,stroke:#333
    style B fill:#ccf,stroke:#333
    style C fill:#cfc,stroke:#333
    style D fill:#fcc,stroke:#333
    style E fill:#cff,stroke:#333
    style F fill:#ffc,stroke:#333
    style G fill:#fcf,stroke:#333
    style H fill:#cff,stroke:#333
    style I fill:#ffc,stroke:#333
    style J fill:#cff,stroke:#333
    style K fill:#ffc,stroke:#333
    style L fill:#fcc,stroke:#333
Fig 2
IMPORTANT: In the processors you
Should enable the AUX input if you use a bit Ten/D or AUX1 If you use a bit One through PC software. This can be disabled after the measurements. If you want to connect the bit Tune to AP bit amplifiers to perform measurements, but the AUX input port is already occupied, you can use the OPTICAL input port (see section 4.5.6).
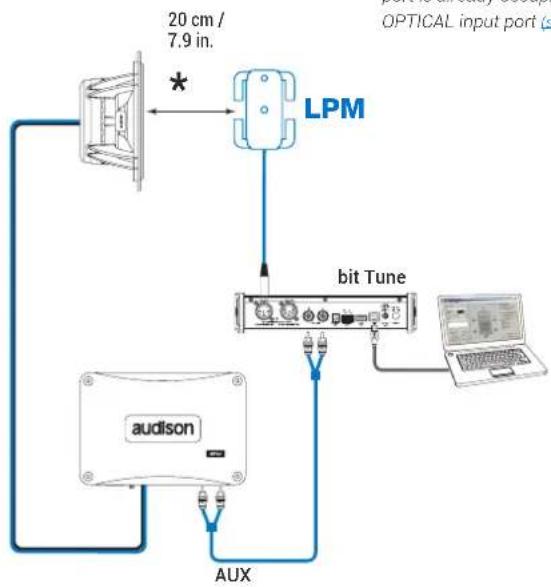
flowchart
graph TD
    A["OPTICAL input port (a)"] --> B["LPM"]
    B --> C["bit Tune"]
    C --> D["audison"]
    C --> E["AUX"]
    F["20 cm / 7.9 in."] --> B
    G["Computer"] --> A
Fig 3

flowchart
graph TD
    A["20 cm / 7.9 in."] --> B["LPM"]
    B --> C["bit Tune"]
    C --> D["Laptop"]
    C --> E["PRE INPUTS"]
    E --> F["auditor"]
    F --> G["Antenna"]
    style A fill:#f9f,stroke:#333
    style B fill:#bbf,stroke:#333
    style C fill:#bfb,stroke:#333
    style D fill:#ffb,stroke:#333
    style E fill:#fff,stroke:#333
    style F fill:#fff,stroke:#333
    style G fill:#fff,stroke:#333
Fig 4
* Connect the LPM microphone cable to the corresponding Bit tune connector. The LPM microphone is placed at about 20 cm from the speaker to be measured.
7.3.1 ELECTRICAL PHASE DETECTION OF SPEAKERS IN A SYSTEM WITH AN AUDISON BIT PROCESSOR
- Connect the bit Tune to the Audison bit processor, as shown in fig. 1 or 2 (see points A and B). The speakers' phase detection procedure must be performed in an environment that is not noisy, with the car's engine off, air conditioning off, doors and windows tightly closed and radio frequency devices away from the car's passenger compartment
- Turn the bit Tune on and connect the USB cable to the PC.
- Set the function switch of the bit Tune on PC ANALYZER.
- Turn on the Audison bit processor and connect the USB cable to the bit Tune.
- Start the bit Tune software by clicking the icon on the PC desktop created by the installation and launch the software in bit Tune + Processor mode.
A. bit Ten: Connect the AUX Left and Right inputs of the bit Ten to the Pre Out Left and Right outputs of the bit Tune, and set the level of the AUX inputs to position 1.
B. bit One: Connect the AUX1 Left and Right inputs of the bit Ten to the Pre Out Left and Right outputs of the bit Tune.

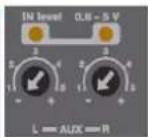
- Choose the Polarity Check function from the main menu of the bit Tune's PC Software.

- Set the Processor Volume level at about -26 dB.
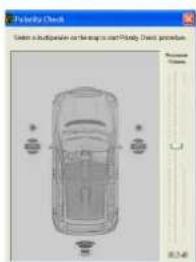
-
Select the system speaker in the CHANNEL MAP.
-
Place the LPM microphone about 20 cm (7.9 in) from the speaker.
- Select one of the available memories on the processor with which to perform the measurement.
- Click Start to start the measurement.
- Click Cancel to exit the measurement.

- At the end of the speaker's phase measurement procedure the following symbols may appear on the channel map:
- The green indicates that the speaker is wired in phase. Repeat the measurement for the other speakers in your system by repeating step 4. Once the phase measurements on the system's speakers close the Polarity Check window.
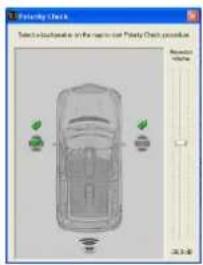
- The red symbol: indicates that the speakers are not wired in phase. Work on the wiring of the speakers or amplifiers, bringing them back in phase with the audio system, or proceed with the measurement of the phases.

- A message indicating that the level of the measurement signal is too low. In this case, repeat from step 3, raising the level by 5 dB.

- A message indicating that the level of the measurement signal is too high. In this case, repeat step 3 lowering the volume by 5 dB.

Note: The speakers' phase information will be automatically saved in the final Report of the measurement session.
7.3.2 ELECTRICAL PHASE DETECTION OF SPEAKERS IN AN AUDIO SYSTEM
- Connect the bit Tune to the audio system, as shown in fig. 3. The speakers' phase detection procedure must be performed in an environment that is not noisy, with the car's engine off, air conditioning off, doors and windows tightly closed and radio frequency devices away from the car's passenger compartment.
- Turn the bit Tune on and connect the USB cable to the PC.
- Set the function switch of the bit Tune on PC ANALYZER.
- Connect the PRE OUT LEFT - RIGHT outputs of the bit Tune to the input of the audio system.
- Start the bit Tune software by clicking the icon on the PC desktop created by the installation and launch the software in bit Tune mode.
-
- Choose the Polarity Check function from the main menu of the bit Tune's PC Software.
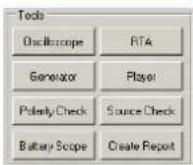
-
- Select the speakers in the system. Set the level of bit Tune Volume to about -26 dB.

- Select the system speaker in the CHANNEL MAP.
- Place the LPM microphone about 20 cm from the speaker.
- Click Start to start the measurement.
- Click Cancel to exit the measurement.
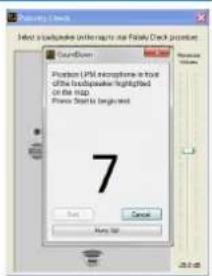
- At the end of the speaker's phase measurement procedure the following symbols may appear on the channel map:
- The green symbol: indicates that the speaker is wired in phase. Repeat the measurement for the other speakers in your system by repeating step 4. Once the phase measurements on the system's speakers close the Polarity Check window.
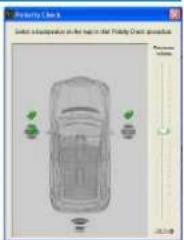
- The red symbol: indicates that the speakers are not wired in phase. Work on the wiring of the speakers or amplifiers, bringing them back in phase with the audio system, or proceed with the measurement of the phases.
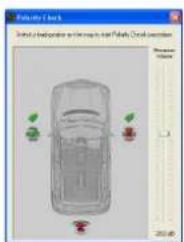
- A message indicating that the level of the measurement signal is too low. In this case, repeat from step 3, raising the level by 5 dB.

- A message indicating that the level of the measurement signal is too high. In this case, repeat step 3 lowering the volume by 5 dB.

Note: The speakers' phase information will be automatically saved in the final Report of the measurement session.
7.4 CALIBRATION OF THE SYSTEM'S SENSITIVITY LEVEL
7.4.1 SETTING THE SENSITIVITY LEVEL OF AMPLIFIERS WITH AUDISON BIT PROCESSOR
This section describes the steps for calibrating the sensitivity levels of the amplifiers.
The operation is performed with a system that includes an Audison bit processor, appropriately configured.

flowchart
graph TD
    A["bit Tune"] --> B["audison"]
    B --> C["Laptop"]
    C --> D["AUX 1 INPUTS"]
    D --> E["Signal Inputs"]
    E --> F["audison"]
    F --> G["PRE INPUTS"]
    G --> H["audison"]
    H --> I["DISCONNECT THE SPEAKER"]
    I --> J["DON'T CONNECT PRE IN CABLE INPUTS WHEN USING SPK IN INPUTS"]
    J --> K["LED Speaker"]
    style A fill:#f9f,stroke:#333
    style B fill:#ccf,stroke:#333
    style C fill:#cfc,stroke:#333
    style D fill:#fcc,stroke:#333
    style E fill:#cff,stroke:#333
    style F fill:#ffc,stroke:#333
    style G fill:#cfc,stroke:#333
    style H fill:#cfc,stroke:#333
    style I fill:#cfc,stroke:#333
    style J fill:#fcc,stroke:#333
    style K fill:#ffc,stroke:#333
Fig 1

flowchart
graph TD
    A["bit Tune"] --> B["audison"]
    B --> C["Laptop"]
    C --> D["AUX INPUTS"]
    D --> E["SIGNAL INPUTS"]
    E --> F["audison"]
    F --> G["PRE INPUTS"]
    G --> H["audison"]
    H --> I["DISCONNECT THE SPEAKER"]
    style A fill:#f9f,stroke:#333
    style B fill:#ccf,stroke:#333
    style C fill:#cfc,stroke:#333
    style D fill:#fcc,stroke:#333
    style E fill:#cff,stroke:#333
    style F fill:#ffc,stroke:#333
    style G fill:#cfc,stroke:#333
    style H fill:#cfc,stroke:#333
    style I fill:#cfc,stroke:#333
Fig. 2
-
Connect the bit Tune to the Audison bit processor, as shown in fig. 1 or 2 (see points A and B).
-
Disconnect all speaker wires from the system's speakers.
- Set the sensitivity level of the amplifiers to the minimum (5 V RMS).
- Turn the bit Tune on and connect the USB cable to the PC.
- Set the function switch of the bit Tune to PC ANALYZER.
- Set the SIGNAL INPUT SELECT switch on SPEAKER IN.
- Turn on the Audison bit processor and connect the USB cable to the bit Tune.
- Start the bit Tune software by clicking the icon on the PC desktop created by the installation and launch the software in bit Tune + Processor mode.
A. bit Ten: Connect the AUX Left and Right inputs of the bit Ten to the Pre Out Left and Right outputs of the bit Tune, and set the level of the AUX inputs to position 1.

B. bit One: Connect the AUX1 Left and Right inputs of the bit Ten to the Pre Out Left and Right outputs of the bit Tune.
- Select the Oscilloscope function from the "Tools" menu of the PC software or click on Oscilloscope from the main menu.
- Select the Generator tool and set it as shown on the right. The suggested value of the generator's output voltage is approximately 3V RMS. This value can be reduced to increase the sound impact at a low listening volume. It should be considered that the reduction of the voltage results in an increase of the amplifiers' input sensitivity, with consequent increase of the background noise. If you want to change the suggested voltage, evaluate the best compromise between the acoustic situations.


- Connect the SPK IN LEFT and/or RIGHT inputs of the bit Tune to the STEREO or MONO channels of the amplifier being tested using the cables supplied with the product. Set the generator's Processor Volume to 0 dB. Verify that the sine wave shown on the screen is within the maximum width displayed, otherwise change the scale (1 V, 10 V, 100 V). Increase the level of sensitivity of the amplifier connected to the SPK IN inputs of the bit Tune until you see on the oscilloscope a sine wave on the edge of clipping, as shown here.

line
| Time (ms) | Value | | --------- | ----- | | 0.0 | 6.0 | | 0.5 | -6.0 | | 1.0 | 6.0 | | 1.5 | -6.0 | | 2.0 | 6.0 | | 2.5 | -6.0 | | 3.0 | 6.0 | | 3.5 | -6.0 | | 4.0 | 6.0 | | 4.5 | -6.0 | | 5.0 | 6.0 |- Repeat the adjustment described in section 4 on the remaining outputs of the audio system's amplifiers.
-
Set the generator's Processor Volume to -60 dB.
-
Turn off the audio system's amplifiers acting on the remote switch.
- Disconnect the SPK IN inputs of the bit Tune from the outputs of the amplifiers.
-
Reconnect to the amplifiers the speakers previously disconnected and turn them on again.
-
After this operation the sensitivity levels of the amplifiers are fine tuned. In the next Processor Auto Setup, the Level Check of the bit Tune will further correct the level of the processor's outputs in order to refine the remaining level differences of the system.
7.4.2 CHECKING THE SIGNAL LEVELS IN AUDIO SYSTEM: LEVEL CHECK
The Level Check verification procedure must be performed in systems where the sensitivity of the amplifiers has already been set in an optimum manner, see sect 7.4.1. The Level Check is part of the Auto EQ + Auto Time Alignment procedure, but can be used independently for further verifications.

flowchart
graph TD
    A["SIGNAL INPUTS"] --> B["Digital Signal Outputs"]
    B --> C["Laptop"]
    D["AUX INPUTS"] --> B
    E["SIGNAL INPUTS"] --> F["Wireless Cable"]
    G["AUX INPUTS"] --> H["Wireless Cable"]
    I["SIGNAL INPUTS"] --> J["Wireless Cable"]
    K["AUX INPUTS"] --> L["Wireless Cable"]
    M["SIGNAL INPUTS"] --> N["Wireless Cable"]
    O["AUX INPUTS"] --> P["Wireless Cable"]
    Q["SIGNAL INPUTS"] --> R["Wireless Cable"]
    S["AUX INPUTS"] --> T["Wireless Cable"]
    U["SIGNAL INPUTS"] --> V["Wireless Cable"]
    W["AUX INPUTS"] --> X["Wireless Cable"]
    Y["SIGNAL INPUTS"] --> Z["Wireless Cable"]
    AA["SIGNAL INPUTS"] --> AB["Wireless Cable"]
    AC["SIGNAL INPUTS"] --> AD["Wireless Cable"]
    AE["SIGNAL INPUTS"] --> AF["Wireless Cable"]
Fig 1. Fig 2.
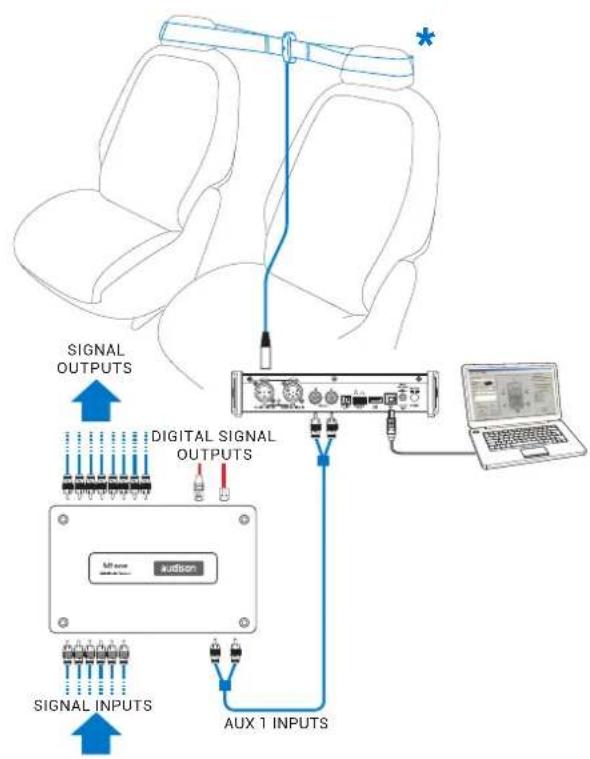
flowchart
graph TD
    A["SIGNAL INPUTS"] --> B["Digital Signal Outputs"]
    B --> C["AUX 1 INPUTS"]
    C --> D["Laptop"]
    style A fill:#f9f,stroke:#333
    style D fill:#ccf,stroke:#333
    note1["*"]
    note2["*"]
    note3["*"]
    note4["*"]
    note5["*"]
    note6["*"]
    note7["*"]
    note8["*"]
    note9["*"]
    note10["*"]
    note11["*"]
    note12["*"]
    note13["*"]
    note14["*"]
    note15["*"]
    note16["*"]
    note17["*"]
    note18["*"]
    note19["*"]
    note20["*"]
    note21["*"]
    note22["*"]
    note23["*"]
    note24["*"]
    note25["*"]
    note26["*"]
    note27["*"]
    note28["*"]
    note29["*"]
    note30["*"]
    note31["*"]
    note32["*"]
    note33["*"]
    note34["*"]
    note35["*"]
    note36["*"]
    note37["*"]
    note38["*"]
    note39["*"]
    note40["*"]
    note41["*"]
    note42["*"]
    note43["*"]
    note44["*"]
    note45["*"]
    note46["*"]
    note47["*"]
    note48["*"]
    note49["*"]
    note50["*"]
    note51["*"]
    note52["*"]
    note53["*"]
    note54["*"]
    note55["*"]
    note56["*"]
    note57["*"]
    note58["*"]
    note59["*"]
    note60["*"]
    note61["*"]
    note62["*"]
    note63["*"]
    note64["*"]
    note65["*"]
    note66["*"]
    note67["*"]
    note68["*"]
    note69["*"]
    note70["*"]
    note71["*"]
    note72["*"]
    note73["*"]
    note74["*"]
    note75["*"]
    note76["*"]
    note77["*"]
    note78["*"]
    note79["*"]
    note80["*"]
    note81["*"]
    note82["*"]
    note83["*"]
    note84["*"]
    note85["*"]
    note86["*"]
    note87["*"]
    note88["*"]
    note89["*"]
    note90["*"]
    note91["*"]
    note92["*"]
    note93["*"]
    note94["*"]
    note95["*"]
    note96["*"]
    note97["*"]
    note98["*"]
    note99["*"]
IMPORTANT: In the processors you
should enable the AUX input if you use a bit Ten/D or AUX1 if you use a bit One through PC software. This can be disabled after the measurements. If you want to connect the bit Tune to AP bit amplifiers to perform measurements, but the AUX input port is already occupied, you can use the OPTICAL input port (see section 4.5.6).
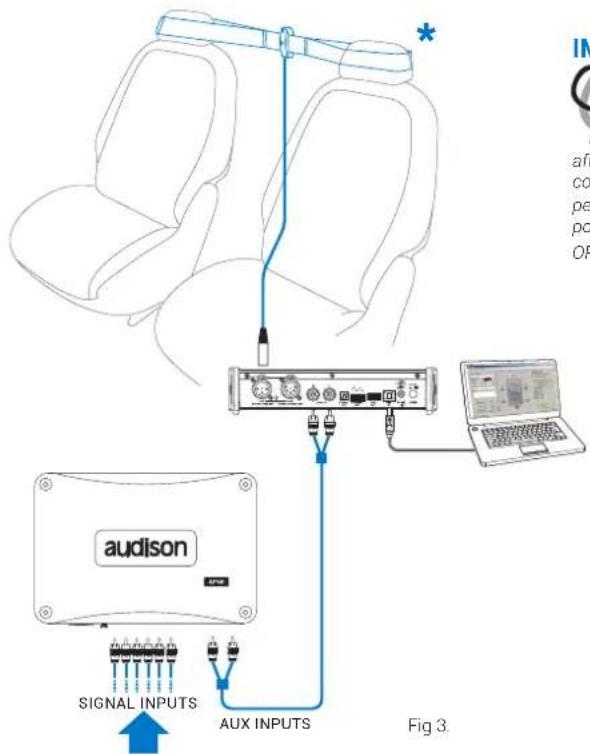
- Connect the bit Tune to the Audison bit processor, as shown in fig. 1, 2 or 3 (see points A, B and C). The Level Check procedure must be performed in an environment that is not noisy, with the car's engine off, air conditioning off, doors and windows tightly closed and radio frequency devices away from the car's passenger compartment
- Turn the bit Tune on and connect the USB cable to the PC.
- Set the function switch of the bit Tune on PC ANALYZER.
- Turn on the Audison bit processor and connect the USB cable to the bit Tune.
- Start the bit Tune software by clicking the icon on the PC desktop and start the bit Tune + Processor mode.
A. bit Ten: Connect the AUX Left and Right inputs of the bit Ten to the Pre Out Left and Right outputs of the bit Tune, and set the level of the AUX inputs to position 1.
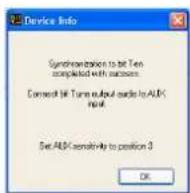

B. bit One: Connect the AUX1 Left and Right inputs of the bit One to the Pre Out Left and Right outputs of the bit Tune
C. AP bit: connect the Aux input to the L-R outputs of the bit Tune, ensuring that the AUX input is enabled. If you want to connect the bit Tune to AP bit amplifiers to perform measurements, but the AUX input port is already occupied, you can use the OPTICAL input (see section 4.5.6).
- Choose the Level Check tool from the main menu of the PC Software.

-
The system will ask if you want to perform a phase measurement of the system's speakers (Polarity Check).
-
Choose YES to perform a phase measurement of the speakers (see sect. 7.3).
- Choose NO to skip this operation if you already performed it earlier.
- Choose Don't ask me again, to cancel the request for future measurements.
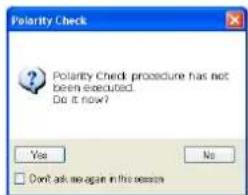
-
Place the LPM microphone in the elastic fastening bracket as shown in figure 1.
-
Select one of the available processor memories to save the measurement settings.
- Click Start to start the measurement.
- Click Cancel to abort the measurement.

-
At the end of the measurement procedure of the speakers' levels you will see one of the following messages:
-
A message indicating that the measurement operation was successful.
Click OK to confirm the measurement operation.
- A message indicating that the level of the measurement signal is too low. In this case, repeat the operation by checking the connections of the audio system and repeat the amplifier calibration procedure if needed (see sect. 7.41).

-
Select the FINALIZE function from the main menu of the bit Tune PC software if you want to store the calibration data.
-
The Level Check verification is completed. If you were performing the Auto EQ + Auto Time Alignment or Auto Time Alignment automatic calibration procedure, continue with it (see sect. 7.5–7.7).
7.5 CALIBRATION OF THE SENSITIVITY LEVEL OF A SYSTEM WITHOUT AUDISON BIT PROCESSOR
This section describes the steps for the calibration and sensitivity check of the amplifiers in an audio system without Audison bit processors.

flowchart
graph TD
    A["bit Tune"] --> B["LED HOURS"]
    B --> C["PC PUEVATION"]
    C --> D["SOLVENT INPUTS"]
    D --> E["RESET"]
    E --> F["LIFT"]
    F --> G["START"]
    G --> H["SLC TOW"]
    H --> I["POWER"]
    J["audison"] --> K["PRE INPUTS"]
    K --> L["DISCONNECT SOURCE PREOUT"]
    L --> M["TRACK 1"]
    M --> N["SOURCE"]
    O["DISCONNECT THE SPEAKER"] --> P["NOTED CABLE INPUTS WHEN USING SPK IN INPUTS"]
    Q["DON'T CONNECT PRE IN CABLE INPUTS WHEN USING SPK IN INPUTS"] --> R["NOTED CABLE INPUTS WHEN USING SPK IN INPUTS"]
    S["PRE OUT"] --> T["OPTICAL OUT"]
    T --> U["SPREAD OUT"]
    U --> V["USB OUT"]
    V --> W["SLC TOW"]
    W --> X["POWER"]
-
Connect the PRE OUT L-R outputs of the bit Tune to the input of the amplifier/s for which you need to adjust the input sensitivity.
-
Disconnect all speaker wires from the amplifiers.
- Set the sensitivity level of the amplifiers to the minimum (5 V RMS).
-
Turn the bit Tune on and connect the USB cable to the PC.
-
Set the function switch of the bit Tune on PC ANALYZER.
- Set the SIGNAL INPUT SELECT switch on SPK IN.
- Turn on the Audison bit processor and connect the USB cable to the bit Tune.
-
Start the bit Tune software by clicking the icon on the PC desktop created by the installation and launch the software in bit Tune mode.
-
Select the Oscilloscope function from the "Tools" menu of the PC software or click on Oscilloscope from the main menu.
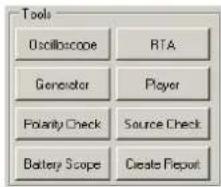
- Select the Generator tool and set it as shown on the right. The suggested value of the generator's output voltage is approximately 3V RMS. This value can be reduced to increase the sound impact at a low listening volume. It should be considered that the reduction of the voltage results in an increase of the amplifiers' input sensitivity, with consequent increase of the background noise. If you want to change the suggested voltage, evaluate the best compromise between the acoustic situations.

- Connect the SPK IN LEFT and/or RIGHT inputs of the bit Tune to the STEREO or MONO channels of the amplifier being tested using the cables supplied with the product.
Activate the signal on the bit Tune outputs. Verify that the sine wave shown on the screen is within the maximum width displayed, otherwise change the scale (1 V, 10 V, 100 V). Increase the level of sensitivity of the amplifier connected to the SPK IN inputs of the bit Tune until you see on the oscilloscope a sine wave on the edge of clipping, as shown here.

line
| Time (ms) | Voltage (V) | | --------- | ----------- | | 0.0 | 0.0 | | 0.5 | 6.0 | | 1.0 | -6.0 | | 1.5 | 6.0 | | 2.0 | -6.0 | | 2.5 | 6.0 | | 3.0 | -6.0 | | 3.5 | 6.0 | | 4.0 | -6.0 | | 4.5 | 6.0 | | 5.0 | -6.0 |- Repeat the adjustment described in section 4 on the remaining outputs of the audio system's amplifiers.
- Set the output level control of the generator to -60 dB (see point 4).
- Turn off the audio system's amplifiers acting on the remote switches.
- Disconnect the SPK IN inputs of the bit Tune from the outputs of the amplifiers.
-
Reconnect to the amplifiers the speakers previously disconnected and turn them on again.
-
After this operation the sensitivity levels of the amplifiers are electrically tuned in an optimal way.
Note: The acoustic levels of the different channels depend not only on the sensitivity of the amplifiers, but also on the efficiency of the speakers. For optimal acoustic calibration of the audio system you must proceed to the measurement of the response curve (RTA). After this measurement you may also need to tweak the sensitivity of the amplifier in order to compensate for the efficiency of the speakers (see sect. 7.8.2).
7.6 AUTOMATIC CALIBRATION OF THE PROCESSOR: AUTO EQ + AUTO TIME ALIGNMENT
7.6.1 DSP CONNECT MODE
This section highlights the calibration phases of an Audison bit processor interfaced to the system with the aid of the bit Tune. The process includes the use of a series of instruments also available separately:
Auto EQ+ Auto Time Alignment, Polarity Check, Level check.
At the end of the process the system will perform the automatic calibration of the equalizer (Auto EQ).
The calibration is performed with a system including an Audison processor previously configured (finalized), and after having performed the procedures described in sections (see sect. 7.3 - 7.4).

flowchart
graph TD
    A["SIGNAL INPUTS"] --> B["Digital SIGNAL OUTPUTS"]
    C["AUX INPUTS"] --> B
    B --> D["Laptop"]
    style A fill:#f9f,stroke:#333
    style C fill:#bbf,stroke:#333
    style D fill:#dfd,stroke:#333

flowchart
graph TD
    A["SIGNAL INPUTS"] --> B["Digital Signal Outputs"]
    B --> C["AUX 1 INPUTS"]
    C --> D["Laptop"]
    E["SIGNAL OUTPUTS"] --> F["Signal Inputs"]
    G["DIGITAL SIGNAL OUTPUTS"] --> H["Signal Inputs"]
    I["+"] --> J["Output Line"]
    style A fill:#f9f,stroke:#333
    style B fill:#ccf,stroke:#333
    style C fill:#cfc,stroke:#333
    style D fill:#fcc,stroke:#333
    style E fill:#cff,stroke:#333
    style F fill:#ffc,stroke:#333
    style G fill:#ffc,stroke:#333
    style H fill:#cfc,stroke:#333
    style I fill:#cfc,stroke:#333

- Connect the bit Tune to the Audison bit processor, as shown in fig. 1, 2 or 3 (see points A, B and C). The AUTO EQ+ AUTO TIME ALIGNMENT procedure must be performed in an environment that is not noisy, with the car's engine off, air conditioning off, doors and windows tightly closed and radio frequency devices away from the car's passenger compartment.
- Turn the bit Tune on and connect the USB cable to the PC.
- Set the function switch of the bit Tune on PC ANALYZER.
- Turn on the Audison bit processor and connect the USB cable to the bit Tune.
- Start the bit Tune software by clicking the icon on the PC desktop created by the installation and launch the software in bit Tune + Processor mode.
A. bit Ten: Connect the AUX Left and Right inputs of the bit Ten to the Pre Out Left and Right outputs of the bit Tune, and set the level of the AUX inputs to position 1.


B. bit One: Connect the AUX1 Left and Right inputs of the bit Ten to the Pre Out Left and Right outputs of the bit Tune.
C. AP bit: connect the Aux input to the L-R outputs of the bit Tune, ensuring that the AUX input is enabled. If you want to connect the bit Tune to AP bit amplifiers to perform measurements, but the AUX input port is already occupied, you can use the OPTICAL input (see section 4.5.6).
-
- Select Auto EQ + Auto Time Alignment to start the complete wizard of the automatic calibration process of the Audison bit processors for equalization and time delays.
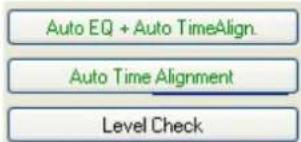
-
The system will ask if you want to perform a phase measurement of the system's speakers (Polarity Check) via the LPM microphone, placed near the speakers.
-
Choose YES to perform a phase measurement of the speakers (see sect. 7.3).
- Choose NO to skip this operation if it was already performed earlier.
- Choose Don't ask me again, to cancel the request for future measurements.

-
The system will ask if you want to measure the levels of the system's speakers (Level Check) via the LPM microphone positioned as shown in fig. 1,2.
-
Choose YES to perform a measurement of the speakers' levels (see sect. 7.4.2)
- Choose NO to skip this operation if it was already performed earlier.
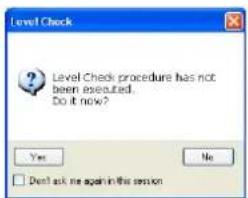
-
Place the HSM microphone in the fastening bracket on the headrest corresponding to the listening point chosen on the Channel Map.
-
Select one of the available memories of the processor.
- Click Start to start the measurement. This may take several minutes.
- Click Cancel to exit the measurement.

- At the end of the measurement you will see:
- A window asking for the presence of hidden speakers in the listening system:
- Choose Yes, to select the real distance of the hidden speakers.
- Choose NO, to continue with the calibration procedure (point 15).
Note: Hidden speaker. It is a speaker positioned behind a barrier which is almost closed with respect to the HSM microphone. The barrier may prevent the microphone from properly calculating the distance through the time delay. Generally, the hidden speaker is a Subwoofer located in the luggage compartment of the vehicle.


- Click on hidden speakers respect to the listening point and manually enter the correct distance.
WARNING: If your system has a Subwoofer, enter the distance in cm or inch measuring it manually.

- Choose OK to continue;
-
Choose CANCEL to exit the process.
-
Proceed as follows:
- Tick the "Enable phase correction" box if you want to enable the loudspeakers phase automatic correction.
WARNING: do not confuse the "Enable
"phase correction" with the "Polarity Check" instrument
(see section 5.2.4.5)

The "Enable phase correction" suggests the possibility to improve the acoustic response by inverting some louspeakers' phase.
The acoustic improvement offered by the phase inversion depends on multiple, also subjective, factors. Therefore its effectiveness needs to be in any case verified from an acoustics point of view (see point 9) compared
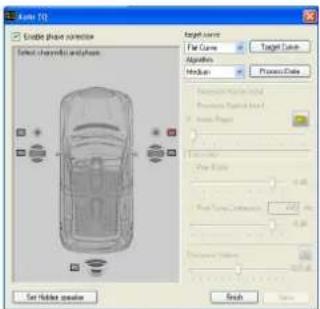
- Select the type of equalization curve to apply to the system by choosing a preset curve from the "Target Curve" menu, or create a custom curve by clicking on the "Target Curve" button
(see section 6.2.4.7).
There are three preset Target Curves: HAC-U (default), HAC-R, HAC-J, Flat.
- HAC-U: applies an optimized equalization for standard listening.
- HAC-R: applies an optimized equalization for listening to rhythmic music.
- HAC-J: applies an optimized equalization for listening to instrumental music.
Flat Curve: it doesn't apply any equalization to the system, ensuring linear response that can be measured with the RTA instrument. Acoustically, it does not guarantee any improvement for the listening in the car passenger compartment
- Select on the "Algorithm" menu the type of algorithm to apply to the audio system frequency response (suggested: Medium).


Remark: Three algorithms are selectable: Soft, Medium, Hard. The algorithm processes the data that the bit Tune measures making the response curve similar to the Target Curve. This approximation can be either less strict (Soft) or more precise (Hard). The choice of the algorithm type depends on many factors, such as the passenger compartment's structure, the audio system setup, etc.
Your experience will suggest the best type of algorithm, to customize the type of music. The suggested choice constituting the best compromise is the Medium algorithm.
- Select Process Data to process the entered information.
- For an acoustic response, choose from the following options:
- Processor Master Input to select the Master input of the processor and perform a listening test of the processed settings through the main source of the sound system. - Processor Optical Input to select the Master input of the processor and perform a listening test of the processed settings through the source equipped with an optical output.
- Audio Player to perform a listening test of the processed settings through the bit Tune player (see sect. 6.2.4.4)
- Pink Noise for an acoustic test of the processed settings.
- Pink Noise Continuous for an acoustic test of the processed settings.
- Processor Volume adjusts the listening volume of the system.
- Save to save the equalization settings. If this operation is not performed the changes will not be allocated to the DSP memory.
- Finish to complete the calibration procedure. Otherwise repeat step 9.
- Choose the FINALIZE function from the main menu of the bit Tune PC software to avoid losing the data stored during the calibration phase and store them in one of the memories of the processor.

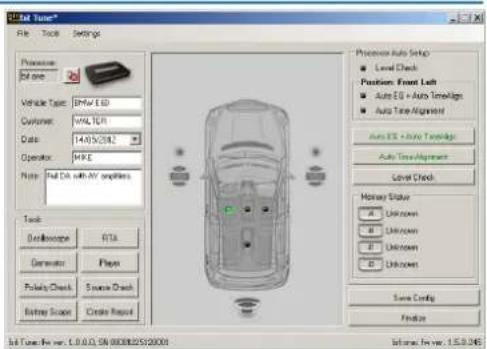
- At the end of the calibration procedure, save the measurement session carried out, in order to be able to subsequently recall the measurements performed, without having to repeat them again in "CONNECT" mode.
Remark: in the next paragraph, we will see how it will be possible to use the measurements made to process the measurements in off-line mode (without connecting the bit Tune), to perform new setups with the Virtuoso.
7.6.2. BIT ONE HD VIRTUOSO OFFLINE MODE DATA PROCESS.
The OFF line mode allows, if you have previously saved a measurement session of a system with bit One HD Virtuoso, the processing of environmental measurements, without having to connect the bit Tune and the DSP. The procedure will automatically generate a setup file, which will need to be reloaded on the bit One HD Virtuoso.
- Open the bit Tune software in OFF line mode.

- Load a previously saved work session where measurements were acquired with the bit One HD Virtuoso (see section 6.2.3.2).
- As soon as the work session is opened, the software will show the Percept processing page. At this point, as described in section 7.6.1.8/9, carry out new processing, for example by varying the target curve or the algorithm.

- By clicking on the Process Data button, the bit Tune will create a virtual setup.
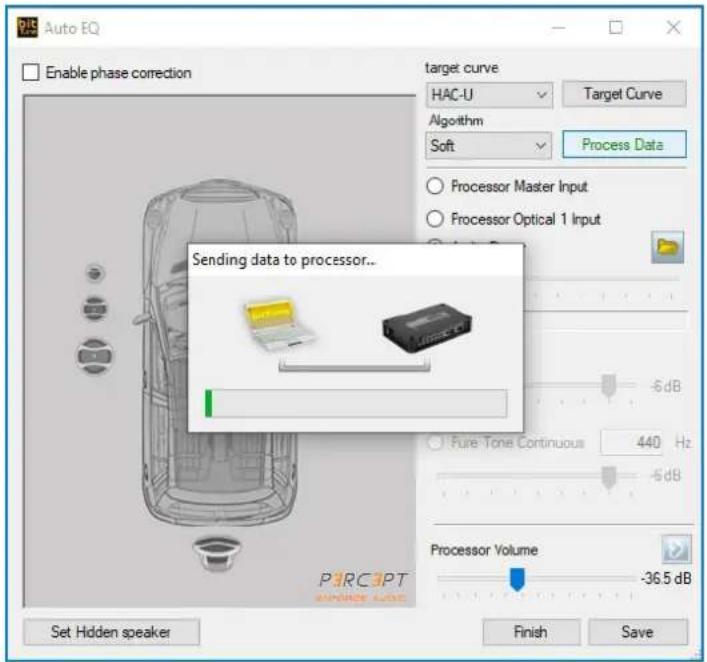
- At the end of the processing, select the SAVE button, choose the memory where the setup just processed should be saved and select "OK" and "FINISH."

- When finished, choose Save config.

The software will create a new setup to be loaded into the bit One HD Virtuoso.
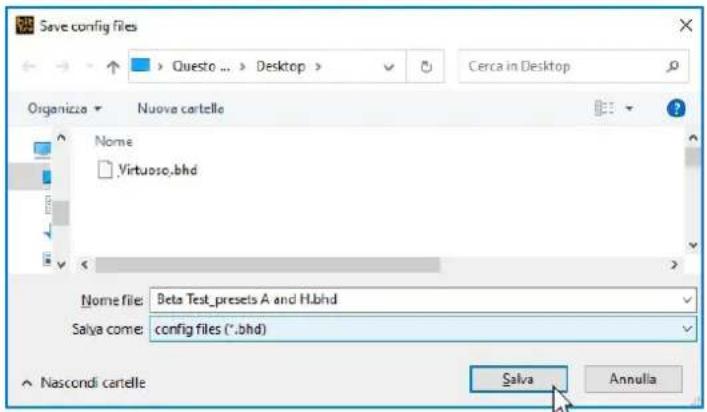
- The setup just generated can be loaded into the bit One HD Virtuoso at the end of the operation.
7.7 AUTOMATIC CALCULATION OF TIME DELAYS: AUTO TIME ALIGNMENT
This section highlights the calibration phases of the time delays of an Audison bit processor interfaced to the system with the aid of the bit Tune.
The process is included in the AUTO EQ + AUTO TIME ALIGNMENT procedure (see sect. 7.6). It can be run separately to set the time delays of the speakers through an Audison bit processor.
The operation is performed with a system including an Audison processor previously finalized.
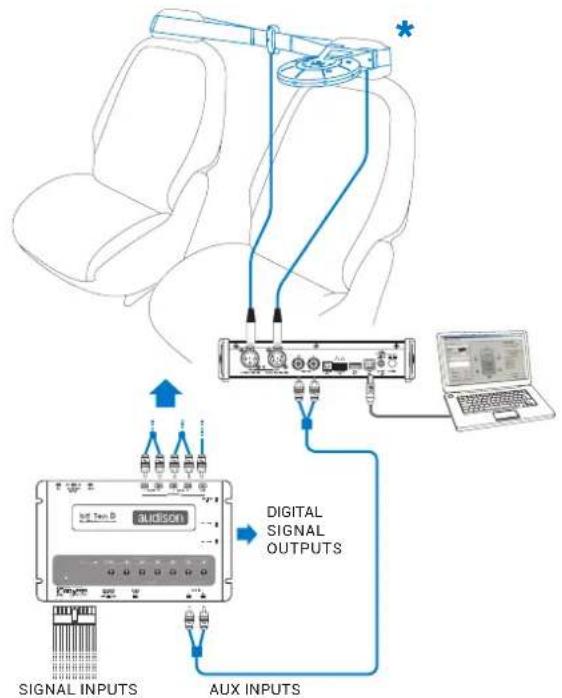
flowchart
graph TD
    A["Signal INPUTS"] --> B["UX INPUTS"]
    B --> C["Digital Signal Outputs"]
    C --> D["Laptop"]
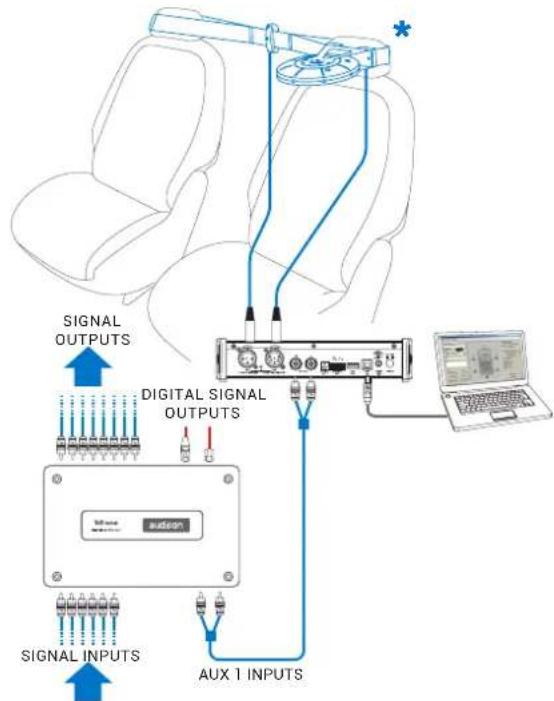
flowchart
graph TD
    A["SIGNAL INPUTS"] --> B["Digital Signal Outputs"]
    C["SIGNAL OUTPUTS"] --> B
    D["AUX 1 INPUTS"] --> B
    B --> E["Laptop"]
    style A fill:#f9f,stroke:#333
    style C fill:#bbf,stroke:#333
    style D fill:#bfb,stroke:#333
    style E fill:#fff,stroke:#333
Fig. 1 Fig. 2

IMPORTANT: In the processors you should enable the AUX input if you use a bit Ten/D or AUX1 if you use a bit One through PC software. This can be disabled after the measurements. If you want to connect the bit Tune to AP bit amplifiers to perform measurements, but the AUX input port is already occupied, you can use the OPTICAL input port (see section 4.5.6).
*Install the HSM and LSM inside the passenger compartment of the vehicle as described in section 4.
- Connect the bit Tune to the Audison bit processor, as shown in fig. 1, 2 or 3 (see points A, B and C). The AUTO TIME ALIGNMENT procedure must be performed in an environment that is not noisy, with the car's engine off, air conditioning off, doors and windows tightly closed and radio frequency devices away from the car's passenger compartment.
- Turn the bit Tune on and connect the USB cable to the PC.
- Set the function switch of the bit Tune on PC ANALYZER.
- Turn on the Audison bit processor and connect the USB cable to the bit Tune.
- Start the bit Tune software by clicking the icon on the PC desktop and launch the software in bit Tune + Processor mode.
A. bit Ten: Connect the AUX Left and Right inputs of the bit Ten to the Pre Out Left and Right outputs of the bit Tune, and set the level of the AUX inputs to position 1.


B. bit One: Connect the AUX1 Left and Right inputs of the bit One to the Pre Out Left and Right outputs of the bit Tune.
C. AP bit: connect the Aux input to the L-R outputs of the bit Tune, ensuring that the AUX input is enabled. If you want to connect the bit Tune to AP bit amplifiers to perform measurements, but the AUX input port is already occupied, you can use the OPTICAL input (see section 4.5.6).
-
- Choose Auto Time Alignment from the main menu of the PC Software, if you want to perform the automatic calibration of the system's time delays.

-
The system will ask if you want to perform a phase measurement of the system's speakers (Polarity Check) via the LPM microphone, placed near the speakers.
-
Choose YES to perform a phase measurement of the speakers (see sect. 7.3).
- Choose NO to skip this operation if it was already performed earlier.
- Choose Don't ask me again, to cancel the request for future measurements.

-
The system will ask if you want to measure the levels of the system's speakers (Level Check) via the LPM microphone positioned as shown in fig. 1,2.
-
Choose YES to perform the measurement of the speakers' levels (see sect. 7.5)
- Choose NO to skip this operation if it was already performed earlier.
- Choose Don't ask me again, to cancel the request for future measurements.

-
Place the HSM microphone in the fastening bracket on the headrest corresponding to the listening point chosen on the system's Channel Map.
-
Select one of the available processor memories for saving the measurement settings.
- Click Start to start the measurement. This may take several minutes.
- Click Cancel to quit the measurement.

- At the end of the procedure for measuring the time delays of the system you will see:
- A window with the system's time delays measured by the bit Tune.
WARNING: If your system has a hidden subwoofer or speaker (see sect. 7.6.7) enter the distance in cm (inch) measuring it manually. Compare the measured distance with the distance detected by the bit Tune and correct it if necessary.
- Play a track loaded from the PC using the Player function. Modify the time delays values (ms, cm, inch) to verify and tweak acoustically the listening environment.

-
After that, you can choose:
-
Save: saves measured distances storing them in a file (e.g. "BittenConfig1.dip").
- Restore: resets the value of measured distances.
- Finish: This function is used to exit the calibration procedure of time delays with a reminder for saving data.

- Choose the FINALIZE function from the main menu of the bit Tune PC software to transfer measured and previously stored values to the processor's memory.

7.8 RTA MEASUREMENT
The RTA (Real Time Analyzer) measurement is the fundamental measurement for audio systems in that, through the microphone, checks the acoustic effect that reaches the ears of the listener.
It takes into account all the parameters of the audio system, including the acoustic response of the vehicle's passenger compartment. However, a linear response does not indicate good listening, because the human ear perceives sounds in a nonlinear way.
But it represent an essential starting point for the acoustic refinement of the audio system.
The RTA measurement is appropriately considered in the calibration procedure (Auto Eq + Auto Time Alignment).
7.8.1 RTA OF AN AUDIO SYSTEM WITH AUDISON BIT PROCESSOR

flowchart
graph TD
    A["SIGNAL INPUTS"] --> B["UX/DC"]
    B --> C["Digital SIGNAL OUTPUTS"]
    C --> D["Laptop"]
    style A fill:#f9f,stroke:#333
    style D fill:#bbf,stroke:#333
    note1["Signal Inputs"] --> A
    note2["AUX INPUTS"] --> C
    note3["Top Input"] --> B
    note4["Bottom Input"] --> C

flowchart
graph TD
    A["SIGNAL INPUTS"] --> B["Digital Signal OUTPUTS"]
    C["SIGNAL OUTPUTS"] --> B
    D["AUX 1 INPUTS"] --> B
    B --> E["Laptop"]
    style A fill:#f9f,stroke:#333
    style C fill:#f9f,stroke:#333
    style D fill:#f9f,stroke:#333
    style E fill:#ccf,stroke:#333
Fig 1. Fig 2.
IMPORTANT: In the processors you

uld enable the AUX input
u use a bit Ten/D or AUX1
u use a bit One through
PC software. This can be disabled after the measurements. If you want to connect the bit Tune to AP bit amplifiers to perform measurements, but the AUX input port is already occupied, you can use the OPTICAL input port (see section 4.5.6).

* Install the HSM inside the passenger compartment of the vehicle as described in section 4
- Connect the bit Tune to the Audison bit processor, as shown in fig. 1, 2 or 3 (see points A, B and C). The AUTO TIME ALIGNMENT procedure must be performed in an environment that is not noisy, with the car's engine off, air conditioning off, doors and windows tightly closed and radio frequency devices away from the car's passenger compartment.
- Turn the bit Tune on and connect the USB cable to the PC.
- Set the function switch of the bit Tune on PC ANALYZER.
- Turn on the Audison bit processor and connect the USB cable to the bit Tune.
- Start the bit Tune software by clicking the icon on the PC desktop and launch the software in bit Tune + Processor mode.
A. bit Ten: Connect the AUX Left and Right inputs of the bit Ten to the Pre Out Left and Right outputs of the bit Tune, and set the level of the AUX inputs to position 1.
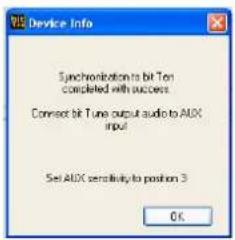

B. bit One: Connect the AUX1 Left and Right inputs of the bit One to the Pre Out Left and Right outputs of the bit Tune.
C. AP bit: AP bit: connect the Aux input to the L-R outputs of the bit Tune, ensuring that the AUX input is enabled. If you want to connect the bit Tune to AP bit amplifiers to perform measurements, but the AUX input port is already occupied, you can use the OPTICAL input (see section 4.5.6).
-
- Select the RTA function from the "Tools" menu of the PC software or click on RTA from the main menu.

-
- Set the resolution speed by the Speed menu.
- Set the acquisition weighing by the Weight -> A-weigh menu.
Select the Generators function from the Real Time Analyzer menu.
- Set the processor's volume to -60 dB.
- Activate the Pink Noise generator.
- Set the generator's volume to -48 dB.
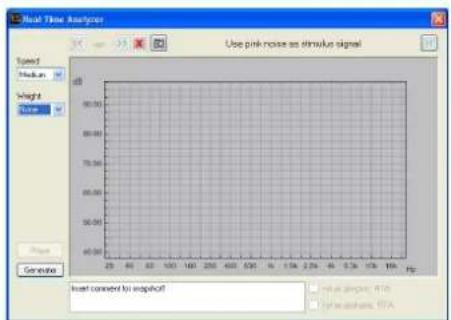

-
Activate the system's speakers by clicking on them on the channel map.
-
Set the output level of the Pink Noise generator to about -20 dB.
- Increase the level of the Processor Volume until visualizing the spectrum with maximum peaks centered around to 60 dB.
- Select the previously saved memory of the Audison bit processor during its configuration in order to analyze the frequency response by the RTA.

- The snapshot of the measurement can be saved ☐ to store the measurement graph that will also appear in the final report.

bar
| Time (Hz) | Value | | --------- | ----- | | 20 | 50 | | 30 | 45 | | 40 | 55 | | 50 | 60 | | 60 | 65 | | 70 | 70 | | 80 | 75 | | 90 | 80 | | 100 | 85 | | 110 | 90 | | 120 | 95 | | 130 | 100 | | 140 | 105 | | 150 | 110 | | 160 | 115 | | 170 | 120 | | 180 | 125 | | 190 | 130 | | 200 | 135 |-
If you want to fine-tune the acoustic response of your audio system, proceed as follows:
-
Close the measurement window of the Real Time Analyzer.
- From the main menu of the bit Tune PC software select the following command: Settings-> Disconnect->
Processor.
- Open the PC software of the Audison bit processor and select:
- The previously used memory to perform the RTA with the bit Tune.
- For acoustic refinement play a reference song with:
A. The bit Tune Player. Select from the control panel the AUX input for the bit Ten and Aux 1 for the bit One.
B. Audio source (CD). Select one of the inputs of the processor (Master, Optical.) where the source is connected.
- Modify on the levels of the sliders of the processor's equalizer to change the acoustic response to suit your musical taste.

- Perform the equalizer's adjustments, save the settings using the FINALIZE function from the PC Processor Software.
- It is useful to make a new RTA measurement repeating the operation from step 1 to verify the changes made after the manual acoustic refinement.
7.8.2 RTA: CALIBRATION OF AN AUDIO SYSTEM WITHOUT AUDISON BIT PROCESSOR AUTOMATIC OF THE HSM MICROPHONE
In order to proceed with this operation, you must have performed the calibration of the sensitivity level of the amplifiers (see sect. 7.5.1). Once the measurement RTA has been performed, in order to act on the audio system you need to distinguish the speaker systems with a passive crossover from those driven by multi-amplification.

flowchart
graph TD
    A["Pre INPUTS"] --> B["audison"]
    B --> C["Laptop"]
    C --> D["Laptop with monitor"]
    D --> E["Laptop with microphone"]
    E --> F["Laptop with keyboard"]
    F --> G["Laptop with speaker"]
    G --> H["Laptop with microphone"]
    H --> I["Laptop with laptop"]
    I --> J["Laptop with microphone"]
    J --> K["Laptop with keyboard"]
    K --> L["Laptop with microphone"]
    L --> M["Laptop with keyboard"]
    M --> N["Laptop with microphone"]
    N --> O["Laptop with keyboard"]
    O --> P["Laptop with microphone"]
    P --> Q["Laptop with keyboard"]
    Q --> R["Laptop with microphone"]
    R --> S["Laptop with keyboard"]
    S --> T["Laptop with microphone"]
    T --> U["Laptop with keyboard"]
    U --> V["Laptop with microphone"]
    V --> W["Laptop with keyboard"]
    W --> X["Laptop with microphone"]
    X --> Y["Laptop with keyboard"]
    Y --> Z["Laptop with microphone"]
    Z --> AA["Laptop with keyboard"]
-
Connect the PRE OUT L-R outputs of the bit Tune to the input of the amplifier/s of the audio system.
-
Disconnect all speaker wires from the system's amplifier/s.
-
Turn the bit Tune on and connect the USB cable to the PC.
-
Set the function switch of the bit Tune on PC ANALYZER.
- Set the SIGNAL INPUT SELECT switch on SPK IN.
- Turn on the Audison bit processor and connect the USB cable to the bit Tune.
-
Start the bit Tune software by clicking the icon on the PC desktop created by the installation and launch the software in bit Tune mode.
-
Select the RTA function from the "Tools" menu of the PC software or click on RTA from the main menu.
| Tools | |
| Oscilloscope | RTA |
| Generator | Player |
| Polarity Check | Source Check |
| Battery Scope | Create Report |
- Select the Generator tool and set it as shown on the right.

-
- Set the visualization speed with the Speed menu choosing Medium.
- Set the acquisition weighing with the Weight menu choosing A-weigh (see sect. 6.2.3.2).

- Activate the signal on the outputs of the bit Tune and increase the level of the Pink Noise until the response curve is centered around 60 dB.
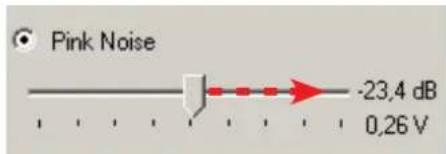
- The snapshot of the measurement can be saved ☐ to store the measurement graph that will also appear in the final report.

bar
| Time (Hz) | Amplitude (dB) | | --------- | -------------- | | 25 | 60.00 | | 30 | 55.00 | | 35 | 58.00 | | 40 | 62.00 | | 45 | 65.00 | | 50 | 68.00 | | 55 | 70.00 | | 60 | 69.00 | | 65 | 67.00 | | 70 | 65.00 | | 75 | 63.00 | | 80 | 61.00 | | 85 | 59.00 | | 90 | 57.00 | | 95 | 55.00 | | 100 | 53.00 | | 105 | 51.00 | | 110 | 49.00 | | 115 | 47.00 | | 120 | 45.00 | | 125 | 43.00 | | 130 | 41.00 | | 135 | 39.00 | | 140 | 37.00 | | 145 | 35.00 | | 150 | 33.00 | | 155 | 31.00 | | 160 | 29.00 |- In order to intervene on the audio system we must distinguish between these two cases:
A. Multi-amplification system. Intervene on the sensitivity levels of the amplifiers or on the level of cutoff frequencies of the electronic crossovers, to compensate for the excessive level differences appearing in the RTA.
B. System with a passive crossover. Intervene on the passive crossovers attenuators or replace the speaker, to compensate for the excessive level differences appearing in the RTA.
For the noise testing system, use a reference sound track, using the bit Tune Player or the audio system source (CD).
7.9 BATTERY SCOPE
This section highlights the steps for measuring the voltage drop of the car's battery, during the engine ignition phase or during the operation of the audio system (see sect. 6.2.4.6).

flowchart
graph TD
    A["Input: laptop with monitor, connected via cable to system"] --> B["bit Tune"]
    B --> C["audison"]
    C --> D["BATTERY SUPPLY AC ADAPTOR"]
    D --> E["Ground"]
    C --> F["Switch: 12V battery"]
    F --> G["FUSE HOLDER"]
    G --> H["TO THE SYSTEM POWER SUPPLY"]
    H --> I["LED Switch: 12V battery"]
    I --> J["Ground"]
    style A fill:#f9f,stroke:#333
    style B fill:#ccf,stroke:#333
    style C fill:#cfc,stroke:#333
    style D fill:#fcc,stroke:#333
    style E fill:#ffc,stroke:#333
    style F fill:#fcc,stroke:#333
    style G fill:#ffc,stroke:#333
    style H fill:#fcc,stroke:#333
    style I fill:#cff,stroke:#333
    style J fill:#ffc,stroke:#333
- The measurement operation has to be performed with the car engine off, with battery chargers disconnected from the car battery and with radio-frequency devices away from the passenger compartment.
- Turn on the bit Tune powering it with the power supply adapter and connect the USB cable to the PC.
- Open the bit Tune PC software clicking on the icon on the PC Desktop selecting either the "bit Tune + Processor" mode, or the "bit Tune" mode.
-
- Disconnect any devices connected to the PRE IN inputs.
-
Set the function switch of the bit Tune on PC ANALYZER.
- Set the SIGNAL INPUT SELECT switch on SPK IN.
-
Connect the cables with an alligator terminal from the SPK IN Left input to the terminals of the power supply to be analyzed (battery, power supply terminals of the amplifier). SPEAKER IN LEFT + to the positive terminal, SPEAKER IN LEFT - to the negative terminal.
-
- Choose Battery Scope from the main menu of the bit Tune's PC Software.
-
- Select the acquisition button to start the measurement, then start the car's engine.

- The display will show a signal similar to the one shown on the right, in which:
A. represents the battery voltage before the starting of the car.
B. The voltage drop that the battery reaches during the ignition phase.
- Turn off the car
- Disconnect the measurement terminals from the power sources.
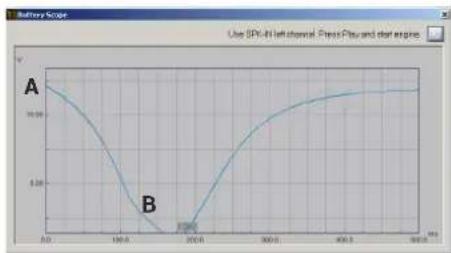
line
Before Scope | Time (min) | Value | | :--- | :--- | | 0.0 | 10.0 | | 10.0 | 5.0 | | 20.0 | 2.0 | | 30.0 | 5.0 | | 40.0 | 8.0 | | 50.0 | 9.0 | | 60.0 | 9.5 | | 70.0 | 10.0 | | 80.0 | 10.5 | | 90.0 | 11.0 | | 100.0 | 11.5 | | 110.0 | 12.0 | | 120.0 | 12.5 | | 130.0 | 13.0 | | 140.0 | 13.5 | | 150.0 | 14.0 | | 160.0 | 14.5 | | 170.0 | 15.0 | | 180.0 | 15.5 | | 190.0 | 16.0 | | 200.0 | 16.5 | | 210.0 | 17.0 | | 220.0 | 17.5 | | 230.0 | 18.0 | | 240.0 | 18.5 | | 250.0 | 19.0 | | 260.0 | 19.5 | | 270.0 | 20.0 | | 280.0 | 20.5 | | 290.0 | 21.0 | | 300.0 | 21.5 | | 310.0 | 22.0 | | 320.0 | 22.5 | | 330.0 | 23.0 | | 340.0 | 23.5 | | 350.0 | 24.0 | | 360.0 | 24.5 | | 370.0 | 25.0 | | 380.0 | 25.5 | | 390.0 | 26.0 | | 400.0 | 26.5 | | 410.0 | 27.0 | | 420.0 | 27.5 | | 430.0 | 28.0 | | 440.0 | 28.5 | | 450.0 | 29.0 | | 460.0 | 29.5 | | 470.0 | 30.0 | | 480.0 | 30.5 | | 490.0 | 31.0 | | 500.0 | 31.5 |- It is possible to monitor the different power supply points of vehicle, in order to choose the most suitable position to power the amplification electronics (see sect 6.246).
Note: if you have a car equipped with the START & STOP function, it is necessary to perform the measurement while driving.
- Save the snapshot to be able to visualize it in the final report of the measurement session. Close the Battery Check window.
7.10 MEASUREMENTS WITH AN OSCILLOSCOPE
A digital oscilloscope draws a graph of the electrical signal, providing an image of its progress over time. It is essential to analyze the proper functioning of electronic devices.
Note: The measurements can be performed on the bench using the universal network adapter.
7.10.1 MEASUREMENTS ON A POWER AMPLIFIER

flowchart
graph TD
    A["bit Tune"] --> B["audison"]
    B --> C["PRE INPUTS"]
    C --> D["4 Ohm Power dummy load"]
    D --> E["OPTICAL INPUT"]
    E --> F["LAMP"]
    F --> G["PRE INPUTS"]
    G --> H["OPTICAL OUTPUT"]
    H --> I["LAMP"]
    I --> J["PRE INPUTS"]
    J --> K["OPTICAL OUTPUT"]
    K --> L["LAMP"]
    L --> M["PRE INPUTS"]
    M --> N["OPTICAL OUTPUT"]
    N --> O["LAMP"]
    O --> P["PRE INPUTS"]
    P --> Q["OPTICAL OUTPUT"]
    Q --> R["LAMP"]
    R --> S["PRE INPUTS"]
    S --> T["OPTICAL OUTPUT"]
    T --> U["LAMP"]
    U --> V["PRE INPUTS"]
    V --> W["OPTICAL OUTPUT"]
    W --> X["LAMP"]
    X --> Y["PRE INPUTS"]
    Y --> Z["OPTICAL OUTPUT"]
    Z --> AA["LAMP"]
    AA --> AB["PRE INPUTS"]
    AB --> AC["OPTICAL OUTPUT"]
    AC --> AD["LAMP"]
    AD --> AE["PRE INPUTS"]
    AE --> AF["OPTICAL OUTPUT"]
    AF --> AG["LAMP"]
    AG --> AH["PRE INPUTS"]
    AH --> AI["OPTICAL OUTPUT"]
    AI --> AJ["LAMP"]
    AJ --> AK["PRE INPUTS"]
Fig 1.
-
- Turn the bit Tune on and connect the USB cable to the PC.
- Set the function switch of the bit Tune on PC ANALYZER.
-
Start the software in bit Tune mode by clicking the icon on the PC desktop.
-
Connect the SPK IN LEFT and RIGHT inputs of the bit Tune to the power outputs using the (supplied) connection cables (see fig. 1) and turn on the amplifier.
WARNING: A continuous signal level which is too high may cause permanent damage to the speakers.
! Disconnect the speakers and connect the amplifier's outputs to a power resistive load properly sized to the power of the amplifier.
-
Using the "SIGNAL INPUT SELECT" switch set the SPK IN measurement input and disconnect the PRE IN and BNC inputs, if connected.
-
- Choose the Oscilloscope tool from the main menu of the bit Tune's PC Software
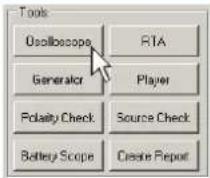
- Select the Generator tool and set it as shown on the right.
- Activate the signal on the bit Tune outputs.

-
- Set the time base as shown in the window on the right.
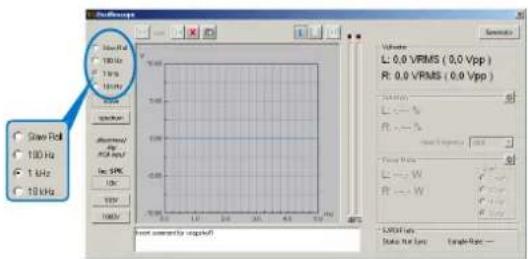
Increase the level of Pure Tone Continuous until the oscilloscope shows a sine wave at the edge of clipping, as in the graph shown below.
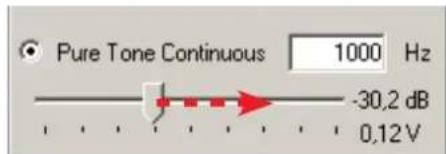
Verify that the sine wave shown on the screen is within the maximum width displayed, otherwise change the scale (1 V, 10 V, 100 V).
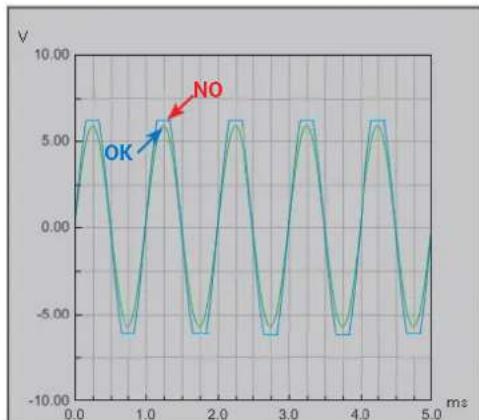
line
| Time (ms) | Value | | --------- | ----- | | 0.0 | 0.0 | | 0.5 | 6.0 | | 1.0 | -7.0 | | 1.5 | 6.0 | | 2.0 | -7.0 | | 2.5 | 6.0 | | 3.0 | -7.0 | | 3.5 | 6.0 | | 4.0 | -7.0 | | 4.5 | 6.0 | | 5.0 | -7.0 |- The snapshot of the measurement can be saved to store the measurement graph that will also appear in the final report.
- Measurement of the amplifier's output level. The Voltmeter section the value of the undistorted output signal will be shown in Volts RMS and Volts peak-to-peak.
- Measurement of the distortion. The Distortion section will show the distortion value of the two channels.
- Power measurement. Select Power Meter and on the Load table choose the value of the resistive load (1-2-4-8 ohms), corresponding to the value of the load connected to the amplifier. The Power Meter section will show the value of the power supplied by the amplifier according to the applied load.
After the measurement, disable the signal on the Tune bit outputs.


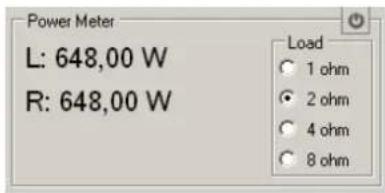
8. USING BIT TUNE WITHOUT A PC
The bit Tune allows to perform a series of measurements without the aid of a PC, in order to identify critical points in the audio system.
8.1 LOAD SIMULATOR SPEAKER IN
Allows to check whether, for the correct operation, the amplified outputs of the OEM source need a connection to a speaker. The OEM sources requiring a load on the outputs do not allow to draw from them the audio signal needed to drive the input of other devices. The test is performed from the bit Tune by inserting a resistive or inductive load. After verification, you will need to connect a load similar to the OEM source outputs in order to connect it to an amplifier or processor (see sect. 3.3.12).

flowchart
graph TD
    A["bit Tune"] --> B["LED Noise"]
    B --> C["EMS"]
    C --> D["PC Analyzer"]
    D --> E["Signal Input Select"]
    E --> F["VIN"]
    F --> G["VOU/UN MONITOR"]
    G --> H["NEXT"]
    H --> I["LEFT"]
    I --> J["RIGHT"]
    J --> K["PX IM/SD"]
    K --> L["audison"]
    L --> M["LOAD SEVOLATOR STREAM/IN"]
    M --> N["NO LOAD"]
    N --> O["4T OEM"]
    N --> P["SIN SNV"]
    Q["audison"] --> R["EMS"]
    R --> S["ELECTROMAGNETIC ENIFIER"]
    S --> T["OPTICAL IN"]
    T --> U["L"]
    U --> V["R"]
    V --> W["L"]
    W --> X["R"]
    X --> Y["BNC PROSE"]
    Y --> Z["L"]
    Z --> AA["R"]
    AA --> AB["SPEAKER IN"]
    AB --> AC["LOAD SIMULATION"]
    AC --> AD["SELECTOR"]
    AD --> AE["PUSH TO SET"]
    AE --> AF["OEM SOURCE"]
    AG["DISCONNECT THE SPEAKERS"] --> AH["X"]
    AH --> AI["X"]
    AI --> AJ["X"]
    AJ --> AK["X"]
    AK --> AL["X"]
    AL --> AM["X"]
    AM --> AN["X"]
    AN --> AO["X"]
    AO --> AP["X"]
    AP --> AQ["X"]
    AQ --> AR["X"]
    AR --> AS["X"]
    AS --> AT["X"]
Acting on the LOAD SIMULATOR SPEAKER IN button, find out in which condition you have an acoustic signal on the bit Tune's internal speaker, selecting the L/R switch.
Repeat for the REAR section, if present.
NO LOAD: The source does not require any load.

47 OHM: The source requires a 47 Ohm - 5 W resistance on the outputs.

SPK SYM: The source requires an inductive load simulating the speaker's impedance.
One possible solution is to interpose a Connection SLI 2/4 decoupling-transformer between the source and the device equipped with PRE inputs.

8.2 SPEAKER IN SIMULATOR
Check the activation of devices with Hi-Level (Speaker In) inputs, equipped with automatic ignition (ART: Automatic Remote Turn On).
Connect the SPEAKER OUT output of the bit Tune to the HI-Level input of the device under test and verify its activation. No need to send a signal to the bit Tune, you can still generate a signal from the PC via the Player function (see sect. 6.2.4.4).
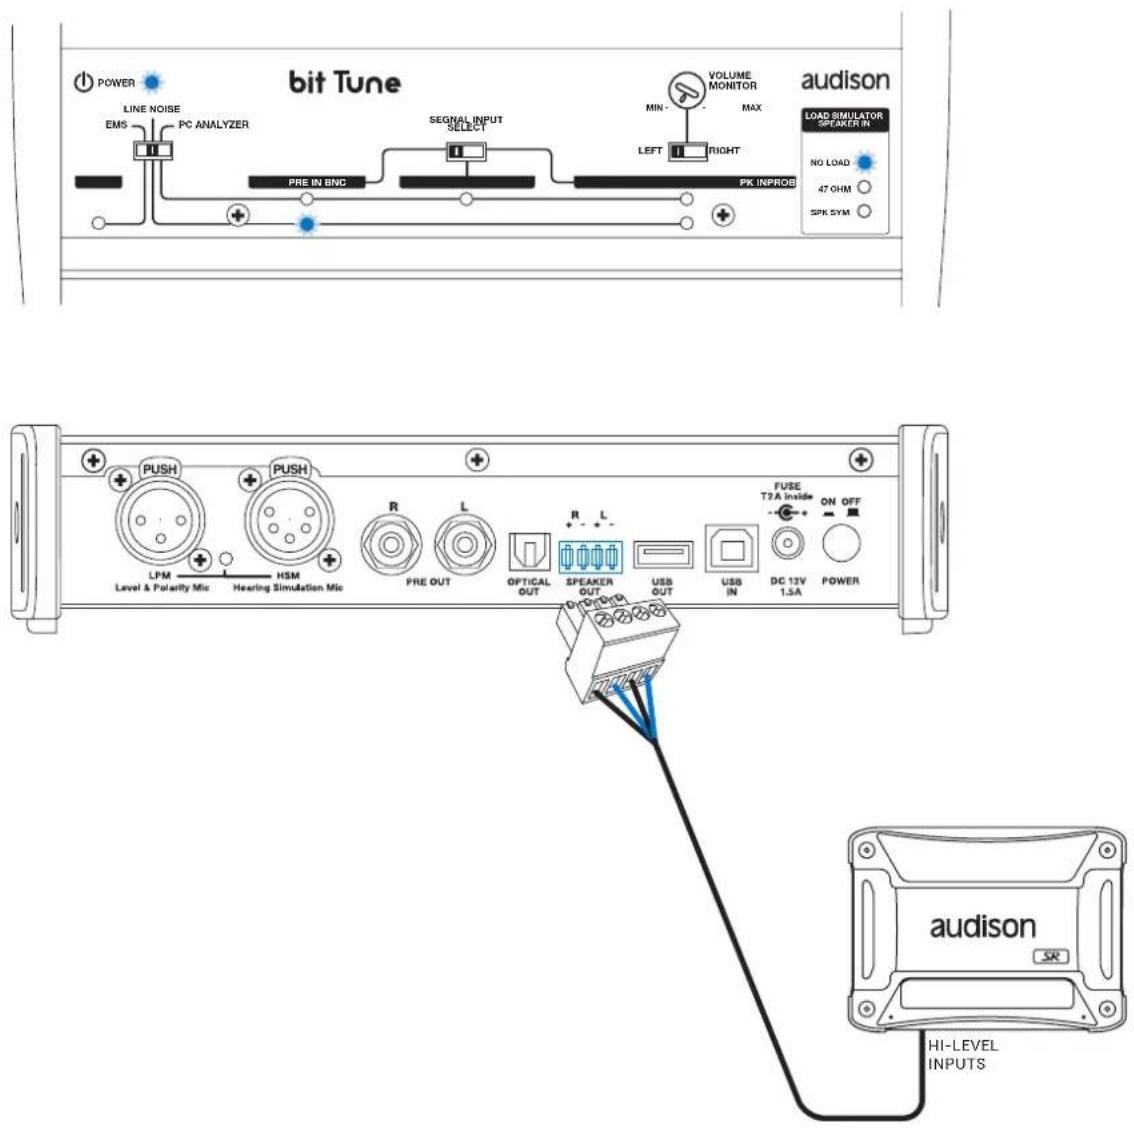
8.3 LINE ANALYZER
Check for an audio signal and any noise on the analog audio line at Hi level or Low level (Pre/Hi Level) or on the optical digital line (S/PDIF). This check is performed by listening to the signal on the internal speaker.
8.3.1 ANALOG LINE PRE
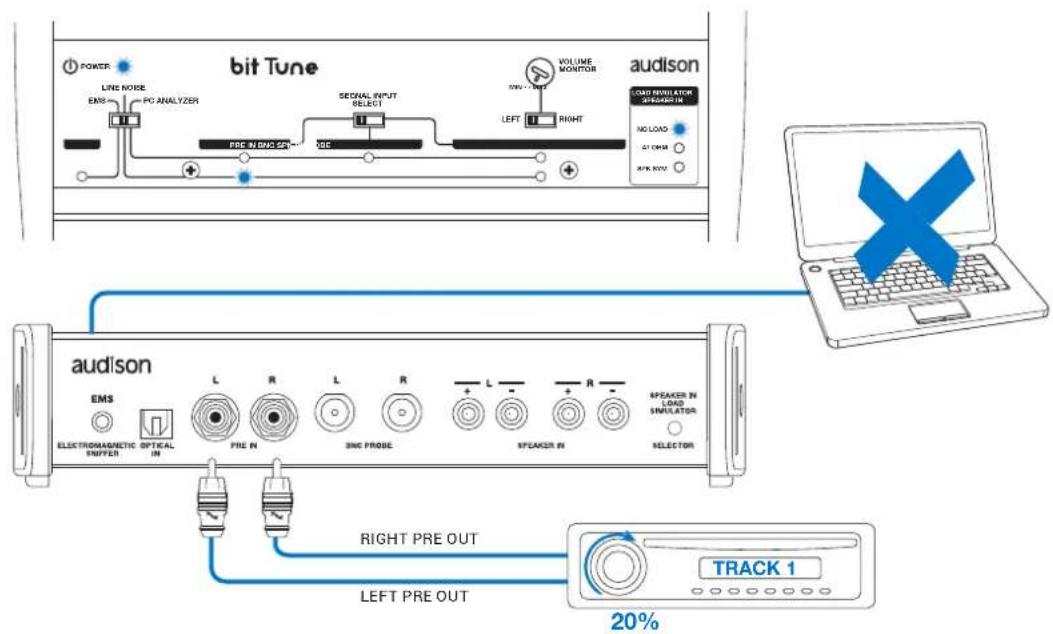

flowchart
graph TD
    A["Speaker Array"] --> B["VOLUME MONITOR"]
    B --> C{OK?}
    C --> D["CHECK INPUTS CONNECTIONS\nCHECK RCA CABLES\nCHECK SOURCE"]
    B --> E{MIN?}
    E --> F["CHECK INPUTS CONNECTIONS\nCHECK RCA CABLES\nCHECK SOURCE"]
    B --> G{LEFT?}
    G --> H["CHECK INPUTS CONNECTIONS\nCHECK RCA CABLES\nCHECK SOURCE"]
    B --> I{RIGHT?}
    I --> J["CHECK INPUTS CONNECTIONS\nCHECK RCA CABLES\nCHECK SOURCE"]
    B --> K["CHECK THE RIGHT CHANNEL"]
8.3.2 HI-LEVEL ANALOG LINE
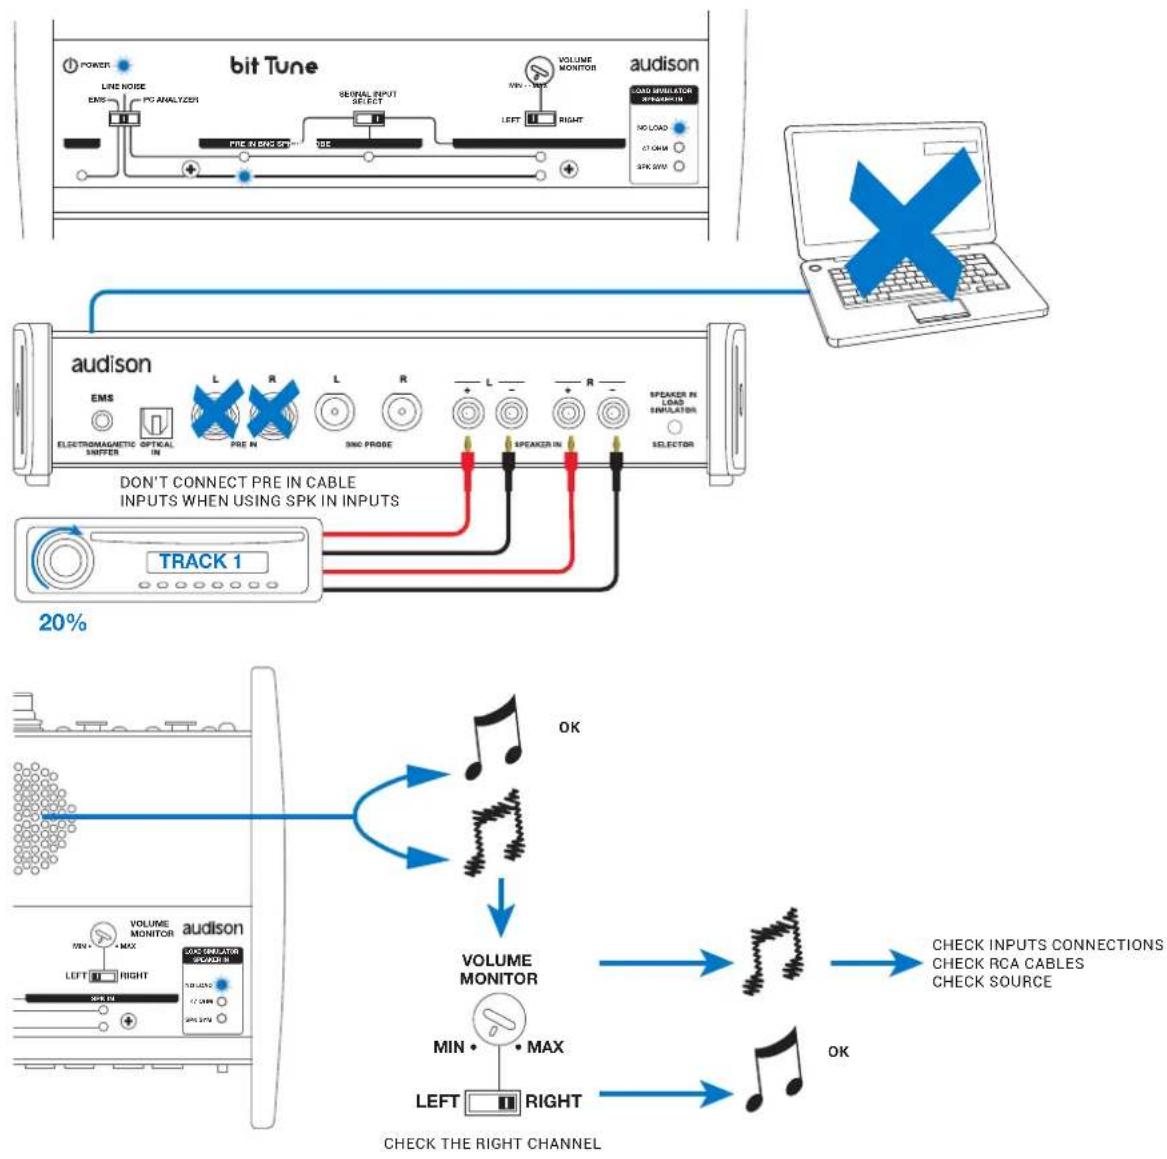
flowchart
graph TD
    A["bit Tune"] --> B["LED LINE NODE"]
    B --> C["PG ANALYZER"]
    C --> D["PRE SING SPK"]
    D --> E["SE"]
    E --> F["VOLUME MONITOR"]
    F --> G["LOAD SIMULATOR"]
    G --> H["NO LOAD"]
    G --> I["ST CHAM"]
    G --> J["STK SWI"]
    K["audison"] --> L["LED ELECTRONOMATIC INVERTER"]
    L --> M["L"]
    L --> N["R"]
    M --> O["L"]
    N --> P["R"]
    O --> Q["L"]
    P --> R["R"]
    Q --> S["L"]
    R --> T["R"]
    S --> U["SNG PROSE"]
    T --> V["SPEAKER IN"]
    U --> W["SPEAKER IN"]
    V --> X["SPEAKER IN"]
    W --> Y["SPEAKER IN"]
    X --> Z["SPEAKER IN"]
    Y --> AA["SPEAKER IN"]
    Z --> AB["SPEAKER IN"]
    AA --> AC["SPEAKER IN"]
    AB --> AD["SPEAKER IN"]
    AC --> AE["SPEAKER IN"]
    AD --> AF["SPEAKER IN"]
    AE --> AG["SPEAKER IN"]
    AF --> AH["SPEAKER IN"]
    AG --> AI["SPEAKER IN"]
    AH --> AJ["SPEAKER IN"]
    AI --> AK["SPEAKER IN"]
    AJ --> AL["SPEAKER IN"]
    AK --> AM["SPEAKER IN"]
    AL --> AN["SPEAKER IN"]
    AM --> AO["SPEAKER IN"]
    AN --> AP["SPEAKER IN"]
    AO --> AQ["SPEAKER IN"]
    AP --> AR["SPEAKER IN"]
    AQ --> AS["SPEAKER IN"]
    AR --> AT["SPEAKER IN"]
    AS --> AU["SPEAKER IN"]
    AT --> AV["SPEAKER IN"]
    AU --> AW["SPEAKER IN"]
    AV --> AX["SPEAKER IN"]
    AW --> AY["SPEAKER IN"]
8.3.3 OPTICAL S/PDIF DIGITAL LINE

flowchart
graph TD
    A["bit Tune"] --> B["Line Noise"]
    B --> C["PC Analyzer"]
    C --> D["Signal Input Select"]
    D --> E["MIN"]
    E --> F["VOLUME MONITOR"]
    F --> G["MAX"]
    G --> H["PC (see NOTE)"]
    I["audison"] --> J["LED L"]
    J --> K["PRE IN"]
    K --> L["BNC PROSE"]
    L --> M["L"]
    M --> N["SPEAKER IN"]
    N --> O["Speaker In"]
    O --> P["LOAD SIMULATOR"]
    P --> Q["SELECTOR"]
    R["TOSLINK CONNECTOR"] --> S["Optical Fiber"]
    S --> T["PC (see NOTE)"]
    U["VOLUME MONITOR"] --> V["MIN • MAX"]
    V --> W["LEFT RIGHT CHECK THE RIGHT CHANNEL"]
    X["CHECK TOSLINK CABLES CHECK SOURCE"] --> Y["Blue Arrow"]
    Z["OK"] --> AA["Blue Arrow"]
NOTES: you do not need a connection with the PC in order to verify the correct operation of the optical digital output of a source.
By connecting a PC, you can analyze the type of digital signal that you are looking at (see sect. 6.2.4.1).
The measurement of the digital signal on the output of a source allows you to verify the actual resolution according to the type of track being played. For example:
Track resolution 96/192 kHz - 24-bit -> 48 kHz - 24 bit output.
In this case, the source has applied a resolution downgrade to the signal, reducing quality. The same measuring operation can be performed on a device equipped with a digital input and output. You just need to drive the device with the bit Tune's PLAYER (OPTICAL OUT), play a high-resolution track stored on your PC and connect the output of the device to the OPTICAL IN input of the bit Tune.
8.4 ELECTROMAGNETIC NOISE ANALYZER
Placing the EMS probe in the vicinity of electrical parts or on the car's wiring with the engine running, you can identify acoustically, through the internal speaker, the higher sources of electromagnetic interference.
Locate the noisiest areas, avoid them when wiring audio cables. Prefer the less disturbed areas for the installation of audio equipment (amplifiers, processors, passive crossovers, etc.).
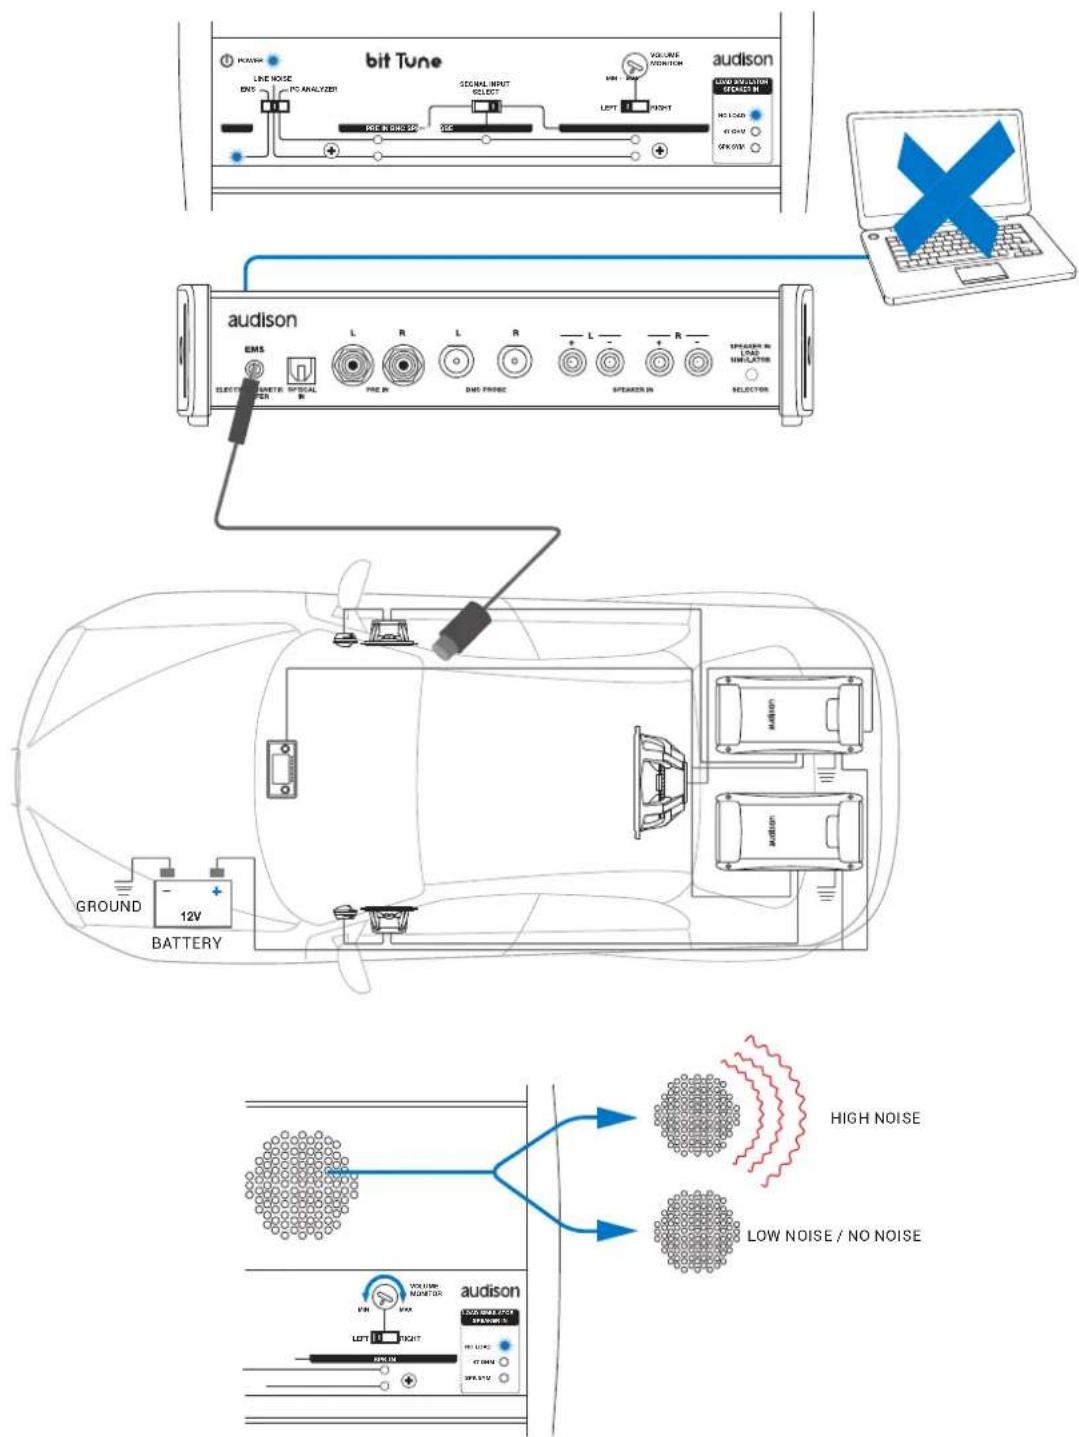
flowchart
graph TD
    A["bit Tune"] --> B["audison"]
    B --> C["Ground"]
    B --> D["BATTERY"]
    C --> E["LED/AMETER"]
    D --> F["Amplifier"]
    E --> G["LINE NOISE"]
    E --> H["PC ANALYZER"]
    E --> I["SECIMAL INPUT SELECT"]
    E --> J["VOLUME VOLTATION"]
    E --> K["LIGHT"]
    E --> L["RIGHT"]
    E --> M["AVG RIVALATOR SELECTION"]
    E --> N["INCH RISK"]
    E --> O["INCH RISK"]
    B --> P["EDUSTRY INCH RISK"]
    B --> Q["LIP"]
    B --> R["RIP"]
    B --> S["LIP"]
    B --> T["RIP"]
    B --> U["LIP"]
    B --> V["RIP"]
    B --> W["LIP"]
    B --> X["RIP"]
    B --> Y["LIP"]
    B --> Z["RIP"]
    B --> AA["LIP"]
    B --> AB["RIP"]
    B --> AC["LIP"]
    B --> AD["RIP"]
    B --> AE["LIP"]
    B --> AF["RIP"]
    B --> AG["LIP"]
    B --> AH["RIP"]
    B --> AI["LIP"]
    B --> AJ["RIP"]
    B --> AK["LIP"]
    B --> AL["RIP"]
    B --> AM["LIP"]
    B --> AN["RIP"]
    B --> AO["LIP"]
    B --> AP["RIP"]
    B --> AQ["LIP"]
    B --> AR["RIP"]
    B --> AS["LIP"]
    B --> AT["RIP"]
    B --> AU["LIP"]
    B --> AV["RIP"]
    B --> AW["LIP"]
    B --> AX["RIP"]
    B --> AY["LIP"]
    B --> AZ["RIP"]
    B --> BA["LIP"]
    B --> BB["RIP"]
    B --> BC["LIP"]
    B --> BD["RIP"]
    B --> BE["LIP"]
    B --> BF["RIP"]
    B --> BG["LIP"]
    B --> BH["RIP"]
    B --> BI["LIP"]
    B --> BJ["RIP"]
    B --> BK["LIP"]
    B --> BL["RIP"]
    B --> BM["LIP"]
    B --> BN["RIP"]
    B --> BO["LIP"]
    B --> BP["RIP"]
    B --> BQ["LIP"]
    B --> BR["RIP"]
    B --> BS["LIP"]
    B --> BT["RIP"]
    B --> BU["LIP"]
    B --> BV["RIP"]
    B --> BW["LIP"]
    B --> BX["RIP"]
9. TROUBLESHOOTING
9.1 SYNCRONIZATION WITH THE PC
1. Loss of connection between bit Tune and the PC.
- If while using the PC in connection to the bit Tune, you turn the bit Tune off and on again, the connection is lost. In order not to lose any information regarding the measurement session, proceed as follows:
a. Save the setup in a file on the PC using the FILE / SAVE AS function.
b. Exit the software.
c. Turn on the bit Tune.
d. Restart the software.
e. Reload the saved setup using the FILE / LOAD function.
2. The bit Tune is unresponsive.
- If, during the calibration of the system with the PC connected to the bit Tune, the bit Tune no longer responds to commands, proceed as follows:
a. Turn off the bit Tune.
b. Save the setup in a file on the PC using the FILE / SAVE AS function.
c. Exit the software.
d. Turn on the bit Tune
e. Restart the software.
f. Reload the saved session using the FILE / LOAD function.
3. The bit Tune doesn't connect to the PC in "bit Tune + Processor" mode, using the bit One.
a. Turn off the bit Tune
b. Exit the software
c. Uninstall the bit One AC LINK drivers installed in your PC, following the procedure that can be found in the bit One ADVANCED MANUAL:
- Windows XP: section 5.2;
- Windows Vista: section 5.2
- Windows 7: section 5.2.
- Windows 8: section 5.2.
d. Once the uninstallation has been completed, restart the PC and re-install the AC LINK 1.1 drivers that can be found in the bit Tune setup CD, following the procedure in section 6.2 of the bit One ADVANCED MANUAL.
f. Reload the saved session using the FILE / LOAD function.
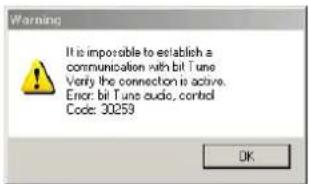
9.2 DEVICE NOT RECOGNIZED DURING INSTALLATION
If during the installation of the driver you see the window shown here, proceed as recommended by one of the two options described below:
-
- Turn off the bit Tune and disconnect the USB plug.
- Connect the USB plug to another available port in the PC and turn on the bit Tune.
- Click NEXT to continue the installation. If the problem persists, go to step 2.
-
- Access the CONTROL PANEL and click SYSTEM; select the Hardware folder and click DEVICE MANAGER;
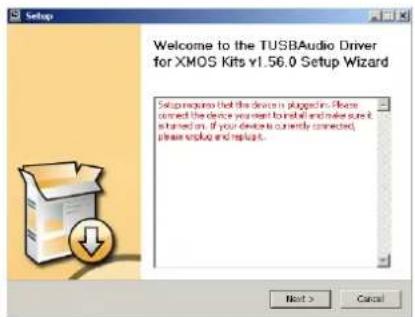

-
- Under USB CONTROLLER click with the right mouse button on UNKNOWN USB DEVICE, choose uninstall and then confirm.
Exit the DEVICE MANAGER and the CONTROL PANEL and perform step 1.
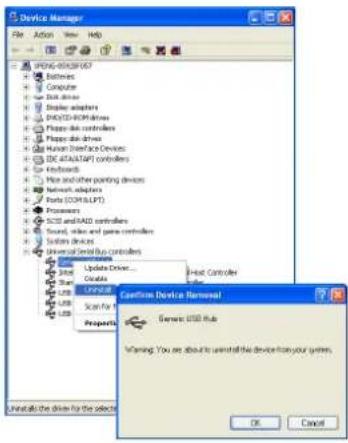
9.3 REPLACEMENT OF BNC INPUT FUSE
If the PC, while it is connected to the bit Tune, shows a Warning message suggesting that the BNC input fuse should be replaced, or if the green LED for the BNC plug selection is blinking, proceed as follows:

- Exit the bit Tune PC software.
- Turn off the bit Tune, unplug the power connector and the USB plug.
- Remove the bit Tune side ends as well as the top cover.
- Remove the fuse indicated in the image below and replace it with a T500mA 250V microfuse with same value (supplied in the product packaging).
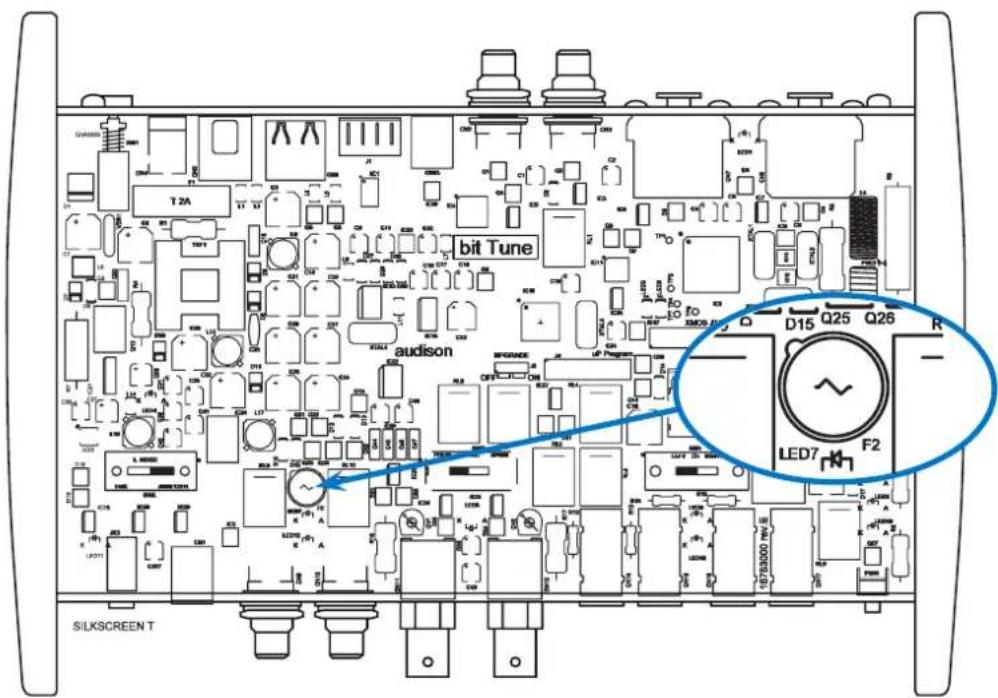
If there is any product UPGRADE available online, proceed as follows:
- Save the configuration previously set (for future reference/use).
- Connect the bit Tune to the USB port of your PC.
- Disconnect all audio inputs of the bit Tune.
- Turn on the bit Tune.
Start the PC software for the bit Tune and select the "bit Tune" mode.

- Access the "FILE" menu of the software on your PC and click "Check for Updates". This will open the Internet browser on your PC and it will automatically start to search for the bit Drive Portal URL: www.audisonbitdrive.eu
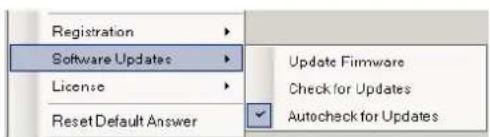
WARNING: The files have to be manually downloaded from the bit Drive Portal. The access method to the software may be different from the one described as follows. Please always refer to the instructions available on the bit Drive Portal.
- In order to access the Download page with the updated versions of documentation, Software and Firmware, you must enter the LOGIN and PASSWORD; insert bittune in both fields.
- Find the latest file whose name contains the word Firmware followed by four digits and click on its symbol to start the download. When prompted, save the file on your PC.
- Exit the browser.
WARNING: The procedure for updating the bit Tune firmware can be tricky. It is of the utmost importance that
this is done in the best possible conditions: if the operation should be initiated but prematurely interrupted (not locked computer, power failure of the bit Tune, accidental disconnection of the USB cable during the update), you may need to reprogram the bit Tune in "Rescue Mode". In extreme cases, send the bit Tune to technical assistance for its reprogramming.
- Select "Update Firmware" from the "SETTINGS" menu. The program will ask you to select the file you just saved from the Download area or previously saved to your PC.


- Before starting the update of the bit Tune, the program provides the following warnings:
- Do not disconnect the bit Tune from the PC.
- Do not disconnect the bit Tune from power supply.
- Temporarily disable the automatic suspension processes on your PC.
- Temporarily disable the Screen Saver processes on your PC.
- Close any other open application.
- Temporarily disable anti-virus and anti-spy ware software.

- Once the OK is given, start the Firmware update of the bit Tune This process takes from 30 seconds to 1 minute and its correct progress will be indicated by the time bar.
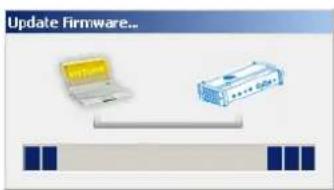
WARNING: During the upgrade, the progress of the bar may stop for a few seconds.

- The successful update is indicated by the message window.

-
Turn the bit Tune off and on.
-
Repeat the HSM microphone calibration (see sect. 7.2)
9.5 "RESCUE MODE" FIRMWARE UPGRADE
If, when launching the bit Tune PC software the "bit Tune Warning" window appears, you can choose between the following two ways to proceed:
A. Use a previous version of the PC software.
E.g.: if you are using PC software v.1.2, open v.1.1;
B. Update the bit Tune firmware. In this case you will have to proceed as follows:
- Restart the bit Tune PC software and select RESCUE MODE.
The screenshot on the right shows the Boot Loader version currently installed on the processor, which allows you to access the menu for the update.
- Access the "FILE" menu of the software on your PC and click "Check for Updates". This will open the Internet browser on your PC and it will automatically start to search for the bit Drive Portal URL: www.audisonbitdrive.eu

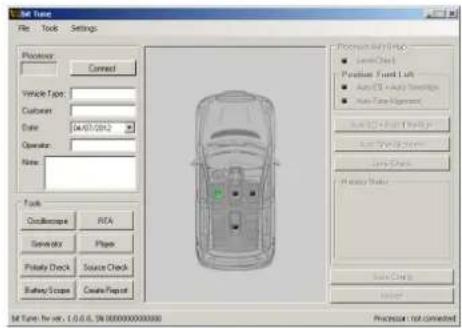

WARNING: The files have to be manually downloaded from the bit Drive Portal. The access method to the software may be different from the one described as follows. Please always refer to the instructions available on the bit Drive Portal.
-
In order to access the download page that contains the updated versions of documentation, Software and Firmware, you must enter the LOGIN and PASSWORD created during product registration (see sect. 5.2.3.5).
-
Find the latest file whose name contains the word "Firmware" followed by four digits and click on its symbol to start the download. When prompted, save the file on your PC.
-
Select "Update Firmware" from the "SETTINGS" menu. The program will ask you to select the file you just saved from the Download area or previously saved to your PC.


-
Before starting the update of the bit Tune, the program provides the following warnings:
-
Do not disconnect the bit Tune from the PC.
- Do not disconnect the bit Tune from power supply.
- Temporarily disable the automatic Stand-by in your PC.
- Temporarily disable the Screen Saver in your PC.
- Close any other open application.
- Temporarily disable anti-virus and anti-spyware softwares

WARNING: The procedure to update the bit Tune firmware can be tricky. It is of utmost importance that it is
performed in the best possible conditions: if the operation is initiated but prematurely interrupted (e.g. locked computer, power failure of the bit Tune, accidental disconnection of the USB cable during the update), you may need to reprogram the bit Tune in "Rescue Mode". In extreme cases, contact our Customer Service to have your bit Tune reprogrammed.
- Once the OK is given, start the Firmware update of the processor. This process takes from 30 seconds to 1 minute and its correct progress will be indicated by the green bar.

WARNING: During the upgrade, the progress of the bar may stop for a few seconds.

- The successful update is indicated by the message window.
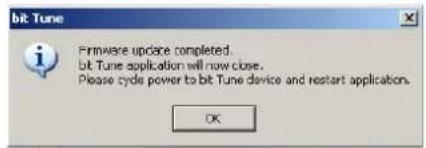
- Turn the bit Tune off and back on.
- Repeat the HSM microphone calibration (see sect. 7.2).
9.6 "RESCUE MODE UPGRADE MODE ON" FIRMWARE UPGRADE
If, after an unsuccessful firmware upgrade, you want to update the bit Tune, proceed as follows:
- Connect the bit Tune to the USB port of your PC.
- Disconnect all audio inputs of the bit Tune.
- Turn on the bit Tune.
Start the PC software for the bit Tune and select the RESCUE MODE.
- The screen on the right shows the version of the Boot Loader in the processor, the program will only be able to access the menu for the update.
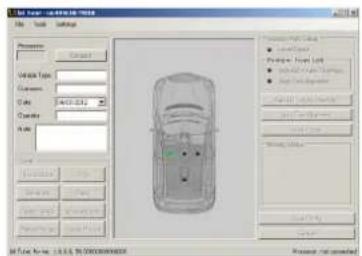
- Access the "FILE" menu of the software on your PC and click "Check for Updates". This will open the Internet browser on your PC and it will automatically start to search for the bit Drive Portal URL: www.audisonbirdrive.eu

WARNING: The files have to be manually downloaded from the bit Drive Portal. The access method to the software may be different from the one described as follows. Please always refer to the instructions available on the bit Drive Portal.
- In order to access the download page that contains the updated versions of documentation, Software and Firmware, you must enter the LOGIN and PASSWORD created during product registration (see sect. 6.2.3.5).
- Find the latest file whose name contains the word Firmware followed by four digits and click on its symbol to start the download. When prompted, save the file on your PC.
- Exit the browser and the PC software of the bit Tune.
- Remove the power connector of the bit Tune and the USB port.
- Remove the side panels and top cover of the bit Tune.
- Switch the JUMPER to ON as shown in the figure below.
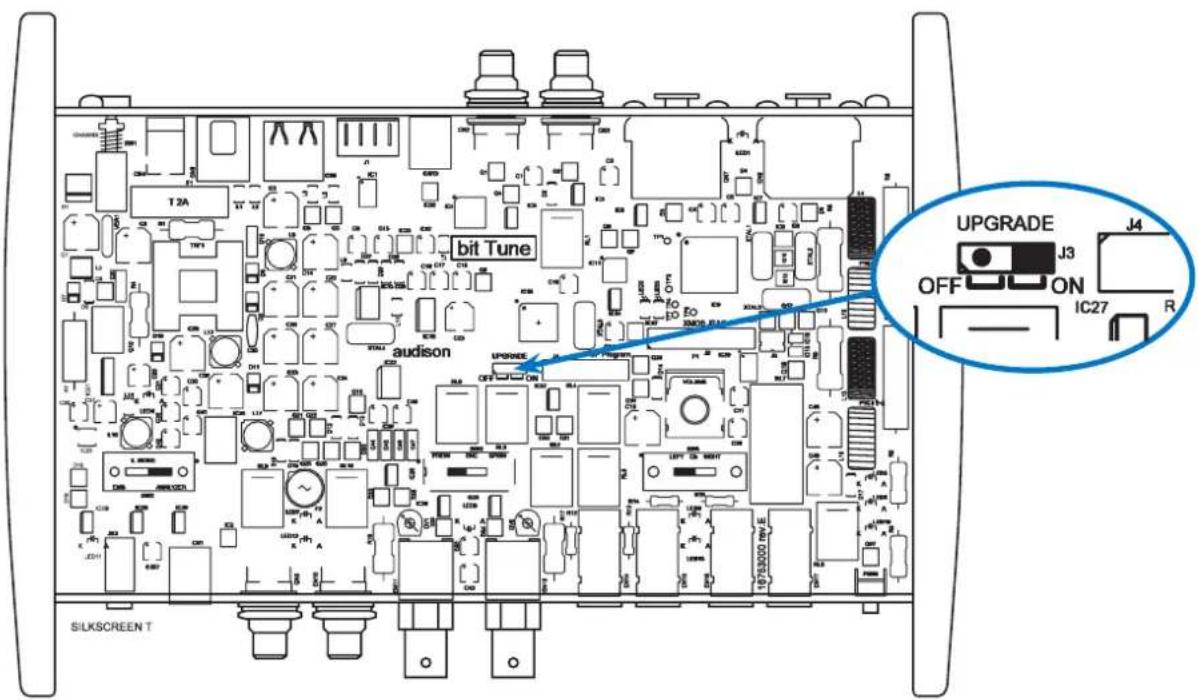
- Reconnect the mains socket and the USB port to the bit Tune
- Turn on the bit Tune.
- Restart the PC software of the bit Tune and select the RESCUE MODE.

WARNING: The procedure for updating the bit Tune firmware can be tricky. It is of the utmost importance that this is done in the best possible conditions: if the operation should be initiated but prematurely interrupted (e.g. locked computer, power failure of the bit Tune, accidental disconnection of the USB cable during the update), you may need to reprogram the bit Tune in "Rescue Mode". In extreme cases, send the bit Tune to technical assistance for its reprogramming.
- Select "Update Firmware" from the "SETTINGS" menu. The program will ask you to select the file you just saved from the Download area or previously saved to your PC.


-
Before starting the update of the bit Tune, the program provides the following warnings:
-
Do not disconnect the Tune-bit from the PC.
- Do not disconnect the bit Tune from power supply.
- Temporarily disable the automatic suspension processes on your PC.
- Temporarily disable the Screen Saver processes on your PC.
- Close any other open application.
- Temporarily disable anti-virus and anti-spy ware software.
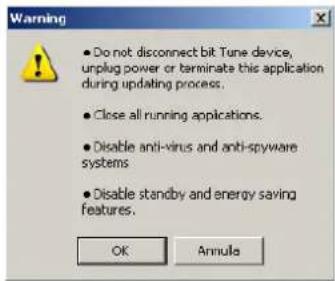
- Once the OK is given, start the Firmware update of the processor. This process takes from 30 seconds to 1 minute and its correct progress will be indicated by the green bar.

WARNING: During the upgrade, the progress of the bar may stop for a few seconds.

- The successful update is indicated by the message window.
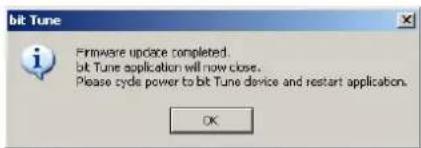
- Disconnect the power cord and the USB cable from the bit Tune.
- Replace the JUMPER internal to the PCB as shown in the figure.

- Assemble the top cover and side panels of the bit Tune.
- The product is updated.
- Repeat the HSM microphone calibration (see sect 7.2).
9.7 REPLACEMENT OF THE INTERNAL POWER SUPPLY FUSE
The bit Tune is protected internally with a T2A Cylindrical fuse inside the product. For its replacement, proceed as follows.
- Remove the side panels and cover of the bit Tune.
- Remove the fuse and replace it with one with the same T2A 250 V value.
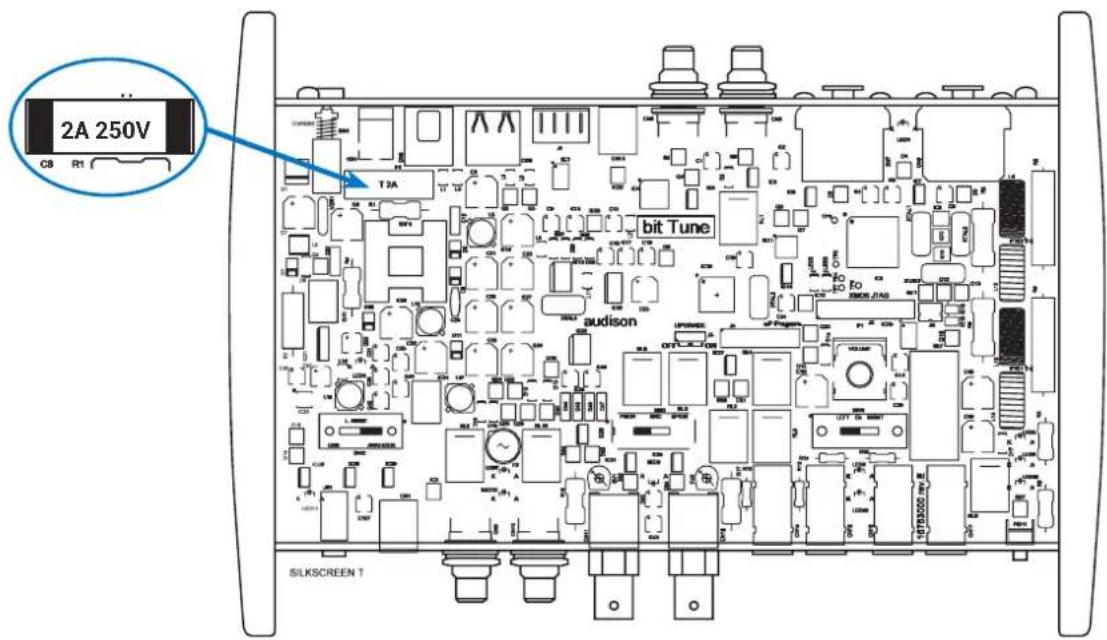
10. TECHNICAL SPECIFICATIONS
POWER SUPPLY
| Voltage 11 + 15 VDC | |
| Idling current 0.8 A | |
| Internal fuse (Cylindrical fuse) 2 A delayed | |
| INPUT STAGE | |
| Input sensitivity max ± 100 V pp | |
| Bandwidth | 20 kHz |
| INPUT BNC STAGE | |
| Input sensitivity max ± 100 V pp | |
| Bandwidth | 20 kHz |
| INPUT HI LEVEL STAGE | |
| Input sensitivity max ± 1000 V pp | |
| Bandwidth 20 kHz | |
| INPUT OPTICAL IN STAGE | |
| Optical S/PDIF Max 192 KHz/24bit, PCM | |
| INPUT MICROPHONE STAGE | |
| Input for HSM microphone 1 | |
| Input for LPM microphone | 1 |
| OUTPUT STAGE | |
| 2 x Analog Pre Out | 4 V RMS |
| 2 x Hi-Level Out 5.5 V RMS | |
| 1 x Optical digital Out S/PDIF Max 192 kHz/24bit, PCM | |
| FUNCTION AVAILABLE WITH PC | |
| Processor Auto Setup | |
| Source Check | |
| RTA | |
| Polarity Check | |
| Oscilloscope | |
| Power Meter | |
| Distortion Meter | |
| Generator | |
| Player | |
| Battery Test | |
| Optical Cable Test | |
| FUNCTION AVAILABLE WITH OUT PC | |
| Load Simulator Speaker In | |
| Hi-Level AER Test | |
| Source Line Analyzer | |
| Electromagnetic Sniffing Test | |
| PC connections USB 1.0 / 2.0 | |
| Software/PC requirements Microsoft Windows (32 / 64 bit) XP, Vista, Windows 7 / 8 / 10 | |
| Graphic card min. resolution 1024 x 600 | |
| Temperature range Operating: 0 °C to 55 °C (32°F to 131°F) | |
| SIZE | |
| W (Width) x H (Height) x D (Depth) mm/inch 232 x 165 x 51 / 9.13 x 6.49 x2 | |
| Weight kg/lb 1.24 / 2.73 | |
www.audison.eu

- bit Tune
- USER'S
- MANUAL
- Index
- BIT TUNE DESCRIPTION 4
- DIMENSIONS 7
- DESCRIPTION OF BIT TUNE CONNECTION PANELS AND CONTROLS 8
- CONNECTIONS 13
- SOFTWARE AND DRIVERS INSTALLATION 19
- BIT TUNE DESKTOP 27
- USING BIT TUNE WITH THE HELP OF A PC 53
- BIT TUNE DESCRIPTION
- AUTOMATIC CALIBRATION OF AUDISON BIT PROCESSORS
- PRECAUTIONARY NOTES
- PACKAGING CONTENTS
- - BIT TUNE
- - HSM microphone:
- - LPM microphone:
- - LPM microphone fixing strap:
- - HSM microphone bracket mount + rubber support:
- - N.1 EMS: ELECTROMAGNETIC SNIFFER
- - N.2 Passive Voltage Probe 1X - 10X:
- - N.1 BNC T adapter:
- - N. 4 Kit of cables and adapters for measurements:
- - N.1 Ground cable with alligator connector:
- - 3.0 m USB cable:
- - N.2 Fuse:
- - 12 V plug-in car power cord:
- - Power supply adapter, with adapters:
- - ABS carrying case:
- - CD ROM, containing: bit Tune Software This User Guide (.pdf) Audio test tracks
- - Quick start guide
- - Warranty
- DIMENSIONS
- DESCRIPTION OF BIT TUNE CONNECTION PANELS AND CONTROLS
- FRONT PANEL
- REAR PANEL
- WARNING: Do not use these jacks to:
- HSM MICROPHONE ("HEARING SIMULATION MICROPHONE")
- Description
- Installation
- LPM MICROPHONE ("LEVEL POLARITY MICROPHONE")
- CONNECTIONS
- POWER SUPPLY AND SWITCHING ON
- PERSONAL COMPUTER
- INPUT SIGNAL S
- PRE IN: HEAD UNIT PRE OUT ANALYZER
- SPEAKER IN: HEAD UNIT HI LEVEL ANALYZER
- SPEAKER IN: AMPLIFIER POWER ANALYZER
- PRE IN: AMPLIFIER PREOUT ANALYZER
- OPTICAL IN: HEAD UNIT OPTICAL TEST
- OUTPUT SIGNALS
- OPTICAL OUT: BIT ONE OPTICAL INPUT 6. OPTICAL OUT: BIT TEN OPTICAL INPUT
- OPTICAL OUT: AP bit OPTICAL INPUT
- SPEAKER OUT:
- SPEAKER OUT: BIT ONE
- OPTICAL OUT: AMPLIFIER OPTICAL INPUT
- SPEAKER OUT: BIT TEN
- SOFTWARE AND DRIVERS INSTALLATION
- PC SOFTWARE AND DRIVER INSTALLATION WIZARD
- Windows XP: select
- Windows Vista: select
- Windows 7: select
- Windows 8 / 10: select
- Possible error message:
- UNINSTALLING BIT TUNE SOFTWARE and DRIVER
- BIT TUNE DESKTOP
- SOFTWARE START IN OFFLINE MODE
- How to change the size of the PC software window
- SOFTWARE START IN BIT TUNE + PROCESSOR MODE
- CONNECTION STATUS MENU
- SESSION NOTE MENU
- Description of functions:
- "FILE" MAIN MENU
- Software Updates.
- "TOOLS" MAIN MENU
- OSCILLOSCOPE:
- REAL TIME ANALYZER:
- Functions:
- Save/load RTA curve:
- MIC AQUIRE:
- GENERATOR
- PLAYER
- POLARITY CHECK
- Polarity Check in "bit Tune + Processor" mode:
- Polarity Check in "bit Tune" mode:
- BATTERY SCOPE
- Purpose of the measurement:
- Control panel description:
- SOURCE CHECK
- CREATE REPORT
- Donald Duck
- audison
- bit Tune v. 3.0
- "SETTINGS" MAIN MENU
- MIC CALIBRATION
- CONNECT TO
- DISCONNECT TO
- COMPANY INFO
- LANGUAGE
- PROCESSOR AUTO SETUP MENU
- MENU description
- SESSION TOOLS MENU
- SOFTWARE START IN BIT TUNE MODE
- USING BIT TUNE WITH THE HELP OF A PC
- SOURCE CHECK
- AUTOMATIC CALIBRATION OF THE HSM MICROPHONE
- PHASE DETECTION OF SPEAKERS: POLARITY CHECK
- ELECTRICAL PHASE DETECTION OF SPEAKERS IN A SYSTEM WITH AN AUDISON BIT PROCESSOR
- ELECTRICAL PHASE DETECTION OF SPEAKERS IN AN AUDIO SYSTEM
- CALIBRATION OF THE SYSTEM'S SENSITIVITY LEVEL
- SETTING THE SENSITIVITY LEVEL OF AMPLIFIERS WITH AUDISON BIT PROCESSOR
- CHECKING THE SIGNAL LEVELS IN AUDIO SYSTEM: LEVEL CHECK
- CALIBRATION OF THE SENSITIVITY LEVEL OF A SYSTEM WITHOUT AUDISON BIT PROCESSOR
- AUTOMATIC CALIBRATION OF THE PROCESSOR: AUTO EQ + AUTO TIME ALIGNMENT
- DSP CONNECT MODE
- BIT ONE HD VIRTUOSO OFFLINE MODE DATA PROCESS.
- AUTOMATIC CALCULATION OF TIME DELAYS: AUTO TIME ALIGNMENT
- RTA MEASUREMENT
- RTA OF AN AUDIO SYSTEM WITH AUDISON BIT PROCESSOR
- IMPORTANT: In the processors you
- Processor.
- RTA: CALIBRATION OF AN AUDIO SYSTEM WITHOUT AUDISON BIT PROCESSOR AUTOMATIC OF THE HSM MICROPHONE
- BATTERY SCOPE
- MEASUREMENTS WITH AN OSCILLOSCOPE
- USING BIT TUNE WITHOUT A PC
- LOAD SIMULATOR SPEAKER IN
- SPEAKER IN SIMULATOR
- LINE ANALYZER
- ANALOG LINE PRE
- OPTICAL S/PDIF DIGITAL LINE
- ELECTROMAGNETIC NOISE ANALYZER
- TROUBLESHOOTING
- SYNCRONIZATION WITH THE PC
- Loss of connection between bit Tune and the PC.
- The bit Tune is unresponsive.
- The bit Tune doesn't connect to the PC in "bit Tune + Processor" mode, using the bit One.
- DEVICE NOT RECOGNIZED DURING INSTALLATION
- REPLACEMENT OF BNC INPUT FUSE
- "RESCUE MODE" FIRMWARE UPGRADE
- "RESCUE MODE UPGRADE MODE ON" FIRMWARE UPGRADE
- REPLACEMENT OF THE INTERNAL POWER SUPPLY FUSE
- TECHNICAL SPECIFICATIONS
Brand : AUDISON
Model : Bit Tune
Category : Car audio system