
SDS5032E-V - Mètre Owon - Free user manual and instructions
Find the device manual for free SDS5032E-V Owon in PDF.


| Product Type | Handheld Digital Storage Oscilloscope & Multimeter |
| Model | SDS5032E-V |
| Brand | Owon |
| Dimensions | 18 cm x 11.5 cm x 4 cm |
| Weight | 645 g |
| Power Supply | AC adapter 100-240 V, 50/60 Hz; Built-in 7.4 V Li-ion battery |
| Display | 3.7" color LCD, 640 x 480 pixels, 65536 colors |
| Oscilloscope Bandwidth | 30 MHz |
| Sampling Rate (max) | 1 GS/s (single channel) |
| Record Length | 6k points per channel |
| Multimeter Functions | DC/AC voltage, DC/AC current, resistance, capacitance, diode, continuity |
| Multimeter Resolution | 3 3/4 digits (4000 counts) |
| Input Impedance (Scope) | 1 MΩ ± 2% in parallel with 15 pF ± 5 pF |
| Max Input Voltage (Scope) | 400 V peak (CAT II) |
| Multimeter Max Voltage | 1000 V DC / 750 V AC RMS |
| Multimeter Max Current | 10 A |
| Trigger Types | Edge, Video, Alternate |
| Automatic Measurements | 20 parameters (frequency, period, peak-peak, etc.) |
| Connectivity | USB host, USB device, RS-232C |
| Included Accessories | 2 oscilloscope probes (10X), 2 multimeter test leads, AC adapter, USB cable, capacitance module, quick guide, CD-ROM |
| Warranty | 3 years (main unit), 12 months (accessories) |
| Cleaning | Use a soft, damp cloth with mild detergent; avoid abrasives and liquids entering the device |
| Safety Standards | EN61010-1, EN61326-1; CE marked |
Frequently Asked Questions - SDS5032E-V Owon
User questions about SDS5032E-V Owon
0 question about this device. Answer the ones you know or ask your own.
Ask a new question about this device
Download the instructions for your Mètre in PDF format for free! Find your manual SDS5032E-V - Owon and take your electronic device back in hand. On this page are published all the documents necessary for the use of your device. SDS5032E-V by Owon.
USER MANUAL SDS5032E-V Owon
Note: "I" indicates that the two channels are isolated electrically.
Dec. 2016 edition Ver1.6.0
Copyright © LILLIPUT Company. All rights reserved.
The LILLIPUT's products are under the protection of the patent rights, including ones which have already obtained the patent rights and those which are applying for. The information in this manual will replace all that in the materials published originally.
The information in this manual was correct at the time of printing. However, LILLIPUT will continue to improve products and reserves the rights to change specification at any time without notice.
owon ^® is the registered trademark of the LILLIPUT Company.
Fujian LILLIPUT Optoelectronics Technology Co., Ltd.
No. 19, Heming Road
Lantian Industrial Zone, Zhangzhou 363005 P.R. China
Tel: +86-596-2130430
Fax: +86-596-2109272
Web: www.owon.com.cn
E-mail: info@owon.com.cn
General Warranty
OWON warrants that the product will be free from defects in materials and workmanship for a period of 3 years from the date of purchase of the product by the original purchaser from the OWON Company. The warranty period of accessories such as probe, battery, adapter is 12 months. This warranty only applies to the original purchaser and is not transferable to the third party.
If the product proves defective during the warranty period, OWON either will repair the defective product without charge for parts and labor, or will provide a replacement in exchange for the defective product. Parts, modules and replacement products used by OWON for warranty work may be new or reconditioned like new performance. All replaced parts, modules and products become the property of OWON.
In order to obtain service under this warranty, Customer must notify OWON of the defect before the expiration of the warranty period. Customer shall be responsible for packaging and shipping the defective product to the service center designated by OWON, and with a copy of customer proof of purchase.
This warranty shall not apply to any defect, failure or damage caused by improper use or improper or inadequate maintenance and care. OWON shall not be obligated to furnish service under this warranty a) to repair damage resulting from attempts by personnel other than OWON representatives to install, repair or service the product; b) to repair damage resulting from improper use or connection to incompatible equipment; c) to repair any damage or malfunction caused by the use of non-OWON supplies; or d) to service a product that has been modified or integrated with other products when the effect of such modification or integration increases the time or difficulty of servicing the product.
Please contact the nearest OWON's Sales and Service Offices for services or a complete copy of the warranty statement.
For better after-sales service, please visit www.owon.com.cn and register the purchased product online.
Excepting the after-sales services provided in this summary or the applicable warranty statements, OWON will not offer any guarantee for maintenance definitely declared or hinted, including but not limited to the implied guarantee for marketability and special-purpose acceptability. OWON should not take any responsibilities for any indirect, special or consequent damages.
Table of Contents
1. DECLARATION OF CONFORMITY ....1
1.1 Declaration of Conformity ....1
1.2 Package Contents 2
2. SAFETY INFORMATION ....3
2.1 Safety Symbols and Terms 3
2.1.1 Safety Symbols 3
2.1.2 Safety Terms 3
2.2 General Safety Information ....3
3. GENERAL CHARACTERISTICS ......6
4. PERFORMING THE GENERAL INSPECTION ......7
4.1 Performing the General Inspection 7
4.1.1 Check whether there is any Damage on it Due to Transportation 7
4.1.2 Make a Check on Accessories....7
4.1.3 Make a Check on the Complete Instrument 7
5. INPUT CONNECTIONS 8
5.1 Input Connections......8
5.1.1 Input connections 8
5.1.2 The connection of 1 kHz/5 V Square-wave test signal 9
5.2 Front Panel and Keys Overview 9
6. USING THE OSCILLOSCOPE 12
6.1 About this Chapter....12
6.2 Powering Up the Oscilloscope 12
6.3 Oscilloscope Operation Window 12
6.4 Menu Description....14
6.5 Manually Setting the Vertical System, Horizontal System and Trigger Position ……15
6.5.1 Setting the Vertical System....15
6.5.2 Setting the Horizontal System and Trigger Position....15
6.6 Recall factory settings 19
6.7 Input Connections....19
6.8 Displaying an Unknown Signal with Auto Set 20
6.9 Automatic Zero-returning of Trigger Horizontal Position and Trigger Level Position…20
6.10 Automatic Measurements....20
6.11 Freezing the Screen 21
6.12 Using Average for Smoothing Waveforms 22
6.13 Using Persistence to Display Waveforms 22
6.14 Using Peak Detection to Display Glitches 23
6.15 Selecting AC-coupling 24
6.16 Reversing the Polarity of the Displayed Waveform 25
6.17 Using Waveform Mathematics Functions ......26
6.18 Use USB mass storage device to save waveform data 27
7. USING THE MULTIMETER 32
7.1 About this Chapter 32
7.2 Making Meter Connections....32
7.3 Multimeter Operation Window 32
7.4 Making Multimeter Measurements 33
7.4.1 Measuring Resistance Values....33
7.4.2 Measuring Diode 34
7.4.3 On-off Test 35
7.4.4 Measuring Capacitance 35
7.4.5 Measuring DC Voltage 36
7.4.6 Measuring AC Voltage 37
7.4.7 Measuring DC Current 38
7.4.8 Measuring AC Current 39
7.5 Freezing the Readings 40
7.6 Taking a Relative Measurement 41
7.7 Selecting Automatic/ManualRange Adjustment 42
8. ADVANCED FUNCTION OF OSCILLOSCOPE 43
8.1 About this Chapter 43
8.2 Setting the Vertical CH1 and CH2 43
8.2.1 Setting the Channel Coupling 44
8.2.2 Open and Close Settings on Channel 45
8.2.3 Setting the probe attenuation....45
8.2.4 Setting of Inverted Waveform 46
8.3 Make the Math Function Menu Setting 46
8.4 Setting the Trigger System 47
8.5 Triggering Control 48
8.5.1 Edge Trigger....48
8.5.2 Video Trigger 49
8.5.3 Alternate Trigger 51
8.6 Setting the Acquiring Mode 53
8.7 Display Setting 54
8.7.1 Display Style....54
8.7.2 Persistence....55
8.7.3 XY Mode 55
8.7.4 Cymometer 56
8.8 Waveform Saving Setups 56
8.8.1 Waveform Saving Setups in normal mode 56
8.8.2 Waveform Saving Setups in FFT mode 58
8.9 Function Setting Menu....59
8.10 Making Automatic Measurements....59
8.11 Setting the Cursor Measurements 61
8.11.1 Setting the cursor measurement in normal mode....61
8.11.2 Setting the cursor measurement in FFT mode 64
8.12 Autoscale 65
8.13 Record....67
8.14 Using FFT 70
8.15 System State Menu 76
8.15.1 Real time clock....77
8.16 Setting of Time Base Mode....77
8.17 Data Transmission 79
9. TROUBLE SHOOTING 80
10. APPENDIX......81
10.1 Appendix A: Specifications 81
10.1.1 Oscilloscope 81
10.1.2 Meter 84
10.1.3 General Specifications....86
10.2 Appendix B: Maintenance and Cleaning 87
10.2.1 Maintenance....87
10.2.2 Storage of Oscilloscope 87
10.2.3 Replacing the Lithium Battery Unit 87
1. Declaration of Conformity
1.1 Declaration of Conformity
HDS-N Series Handheld Digital Storage Oscilloscope & Multimeter
Manufacturer: Fujian LILLIPUT Optoelectronic Technology Co., Ltd.
Statement of Conformity
Base on the result using appropriate standards, the product is in conformity with
Electromagnetic Compatibility Directive 2004/108/EC
Low Voltage Directive 2006/95/EC
Sample tests
Standards used:
EN61010-1: 2001 (2nd edition)
Safety Requirements for Electrical Equipment for Measurement, Control, and
Laboratory use-part 1: General Requirements
EN61326-1: 2006
Electrical Equipment for Measurement, Control and Laboratory use-EMC
Requirements-part 1: General Requirements
EN61000-3-2: 2000+A2: 2005
Electromagnetic Compatibility (EMC)-part 3: Limits-Section 2: Limits for Harmonic
Current Emissions (Equipment Input Current less than/equal to 16A per phase)
EN61000-3-3: 1995+A1: 2001
Electromagnetic Compatibility (EMC)-part 3: Limits-Section 3 Limitation of Voltage
Fluctuations and Flicker in Low-Voltage Supply systems for Equipment with Rated
Current less than or equal to 16A
The tests have been performed in typical configuration.
This conformity is indicated by the symbol CE, i.e. "Conformite Europeenne".
1.2 Package Contents
See the picture below. This picture is only for your reference. If any discrepancy found between certain picture and product, please look the actual product.
| # | Description | Standard | Optional |
| 1 | Oscilloscope and Battery ● | ||
| 2 | AC-DC adapter | ● | |
| 3 | Oscilloscope Probe × 2 (grey) | ● | |
| 4 | Multimeter test lead × 2 (black and red) | ● | |
| 5 | USB Mass Storage connect cable | ● | |
| 6 | Extension module for capacitance measurement | ● | |
| 7 | Probe adjustment tools | ● | |
| 8 | USB communication cable or RS-232C communication cable | ● | |
| 9 | Quick Guide | ● | |
| 10 | CD-ROM (software) | ● | |
| 11 | Metal carrying case | ● | |
| 12 | Soft carrying case | ● | |
| 13 | The output terminal of 1 kHz 5 V square-wave test signal | ● |
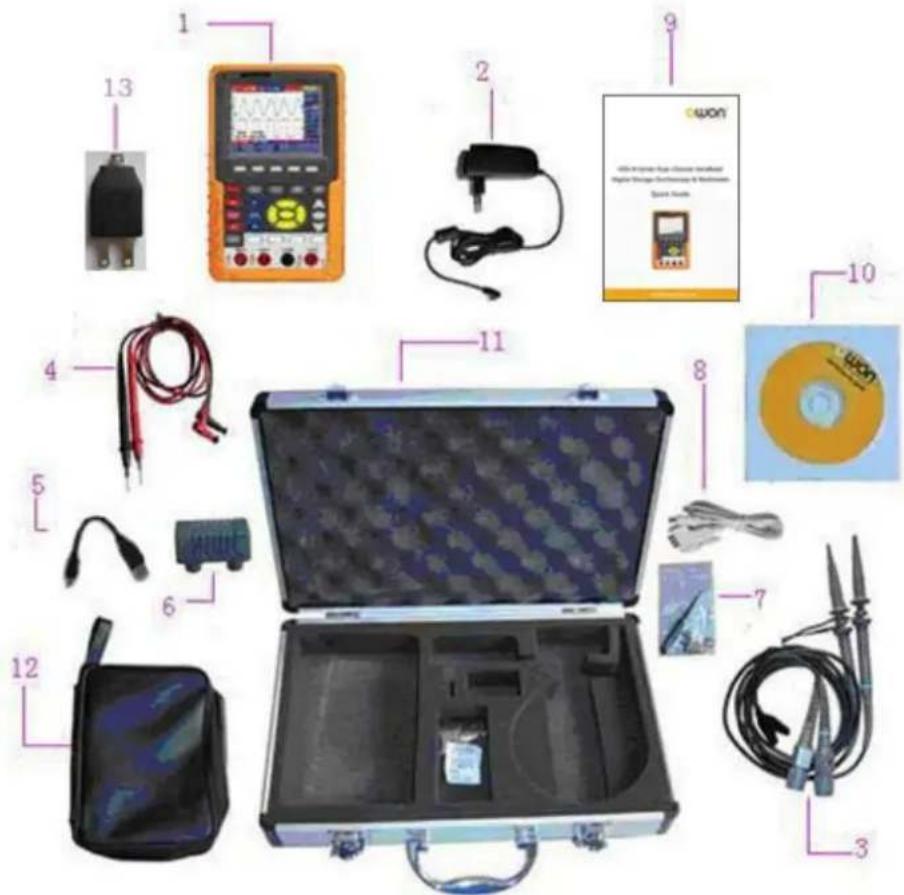
Figure 1: Digital Oscilloscope Parts
2. Safety Information
In order to ensure the correct using and the best efficient service, please carefully read this user's manual.
2.1 Safety Symbols and Terms
2.1.1 Safety Symbols
These symbols may appear in this manual or on the instrument.

Warning: "Warning" identifies conditions and actions that pose hazards to the users.

Caution: "Caution" identifies conditions and actions that may damage the product or other properties.
DANGER:
High Voltage
Refer to the Manual
Protective Conductor Terminal
Chassis Ground
Earth (ground) Terminal


2.1.2 Safety Terms
The following terms may appear on the instrument:
Danger: The term "Danger" is used in this manual to indicate that when you read this mark, personal injury may be caused to you immediately.
Warning: The term "Warning" is used in this manual to indicate that when you read this mark, personal injury may not be caused to you immediately, but you need to be cautionary.
Notice: The term "Notice" is used in this manual to indicate that damages may be caused on this product or other properties.
2.2 General Safety Information
Carefully read the following safety information in order to avoid any personal injury and damage on this product or any products connected with it. This product can only be used in the specified
applications to prevent any possible dangers.

Warning:
To avoid fire or electrical shock, please use proper power adapter. Use only the power adapter appointed by the manufacturer and subject to approval of being used in the user's country.

Warning:
The two channels of the oscilloscope are non-isolated electrically. The channels should adopt common basis during measuring. To prevent short circuits, the 2 probe ground must not be connected to 2 different non-isolated DC level.

Warning:
The channels should adopt common basis during measuring. To prevent short circuits, the 2 probe ground must not be connected to 2 different non-isolated DC level.
The diagram of the oscilloscope ground wire connection:

flowchart
graph LR
    A["Signal Input"] --> B["Probe"]
    B --> C["Oscilloscope"]
    C --> D["AC Adapter"]
    D --> E["Electrical Outlet"]
    F["Ground Clip"] --> B
The diagram of the ground wire connection when the battery-powered oscilloscope is connected to the AC-powered PC through the ports:

flowchart
graph LR
    A["Signal Input"] --> B["Probe"]
    B --> C["Oscilloscope (Battery-power)"]
    C --> D["PC"]
    D --> E["Electrical Outlet"]
    F["Ground Clip"] --> B
    G["USB/COM Cable"] --> C
It is not allowed to measure AC power when the oscilloscope is AC powered through the adapter, or when the battery-powered oscilloscope is connected to the AC-powered PC through the ports.

Warning:
To avoid fire or electrical shock if a test tool input is connected to more 42V peak (30Vrms) or on circuits of more than 4800VA:
- Use only insulated voltage probes, test leads and adapter supplied with the test tool, or indicated by OWON as suitable for the Oscilloscope & Multimeter.
● Before use, inspect voltage probes, test leads and accessories for mechanical damage and replace when damaged. - Remove all probes, test leads and accessories that are not in use.
● Always connect the power adapter first to the AC outlet before connecting it to the Oscilloscope & Multimeter.
- Do not apply voltages that differ more than 400 V from earth ground to any input when measuring in a CAT II environment.
- Do not apply voltages that differ more than 400 V from each other to the isolated inputs when measuring in a CAT II environment.
- Do not apply input voltages above the rating of the instrument Use caution when using 1:1 test leads because the probe tip voltage will be directly transmitted to the Oscilloscope & Multimeter.
- Do not use exposed metal BNC or banana plug connectors.
- Do not insert metal objects into connectors.
● Always use the Oscilloscope & Multimeter only in the manner specified.
- Voltage ratings that are mentioned in the warning are given as limits for "working voltage". The represent V ac rms (50-60Hz) for AC sine wave applications and as V dc for DC applications. Overvoltage Category II refers to local level, which is applicable for appliances and portable equipment.
Only qualified technical personnel are permitted to perform maintenance.
Pay attention to the nominal values of all terminals: To avoid fire or electric shock, please keep a watchful eye on all nominal values and marks specified for this product. Before any connection performed on this product, carefully read the user's manual of the product for further information of nominal values.
No operation is allowed without the instrument cover plate: If the cover plate or panel has been removed, do not perform any operation on this product.
No touch is allowed on bare conductors: When the product is powered on, do not touch any bare joints or parts of the scope meter.
Operation is prohibited in case of any undetermined failure: When in doubt any damage on this product, consult the qualified personnel for checking on it.
Keep ventilation in good condition: Refer to the user manual for detail installation instructions in order to fix this product correctly and provide it with good ventilation conditions.
No operation is allowed under a humid environment.
No operation is allowed under an explosive environment.
Keep clean and dry on the product surface.
Using the Oscilloscope & Multimeter in a manner not specified may impair the protection provided by the equipment.
3. General Characteristics
Oscilloscope
■ 2 in 1 (Multimeter function support);
■ Record length of 6,000 points for each channel;
■ Reading-out with the cursor;
■ Twenty automatic measurement functions;
■ Autoscale function;
■ Color liquid crystal display of high resolution and high contrast with adjustable back light;
■ Storage and call-out of waveforms;
■ Automatic setting function provided capable of fast setting;
■ Multiple-waveform calculation function;
■ Implementation of detecting the average and peak values of the waveform;
■ Edge, video and alternate triggering function;
■ RS232 or USB communication ports;
■ Multiple Language User Interface.
Multimeter
■ 3 and 3/4 digits;
■ Volts, Amps, Ohms, Diode, Capacitance, Continuity measurement;
■ 10A maximum amplitude;
■ Isolated inputs between oscilloscope and multimeter.
4. Performing the General Inspection
4.1 Performing the General Inspection
When you have got a new HDS-N series oscilloscope, it is suggested that you should perform a general inspection on the instrument according to the following steps.
4.1.1 Check whether there is any Damage on it Due to Transportation
If the packing boxes or foam cushions are found in serous damage, keep them in a proper place until the complete instrument and accessories have passed the electrical and mechanical tests.
4.1.2 Make a Check on Accessories
The accessory list has been described in the picture of Digital Oscilloscope Parts of this manual. You can make a check and find whether there is any accessory loss with reference to the Appendix. In case of any accessory loss or damage, consult the OWON dealer responsible for such a business or the local office of OWON.
4.1.3 Make a Check on the Complete Instrument
If the instrument is damaged in its appearance or it fails in normal operation or performance test, consult the OWON dealer responsible for such a business or the local office of OWON. If the instrument is damaged due to transportation, keep the packing in a proper place and consult the transportation department and the OWON dealer responsible for such business, who will provide an instrument replacement or maintenance.
5. Input Connections
5.1 Input Connections
5.1.1 Input connections
See the following Figure 2:
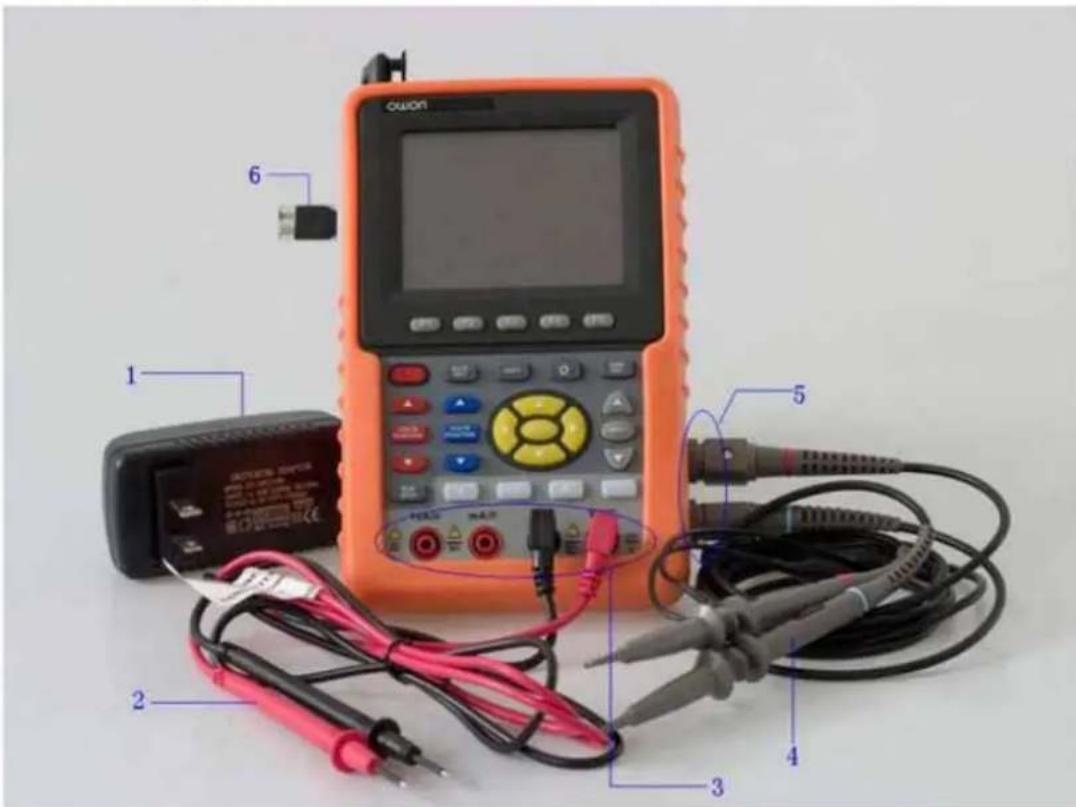
Figure 2: Input connections
Description:
-
The power adapter is supplied for AC power supply and battery recharging.
-
Multimeter test lead.
-
Multimeter input jacks, including four circular banana jacks. The first jack measuring the current 2 A-10A, the second jack on the current Measurement, the third COM ground input, and the fourth measuring voltage, resistance, Capacitance input.
-
Oscilloscope probes.
-
Oscilloscope channel inputs: the upper one is for Channel 1 (CH1), while the lower one is for Channel 2 (CH2).
-
The output terminal of 1 kHz/5 V square-wave test signal.
5.1.2 The connection of 1 kHz/5 V Square-wave test signal
At the left side of the oscilloscope, it is a port for testing 1 kHz/5 V square-wave signal which is used to adjust the probe, shown as Fig.3
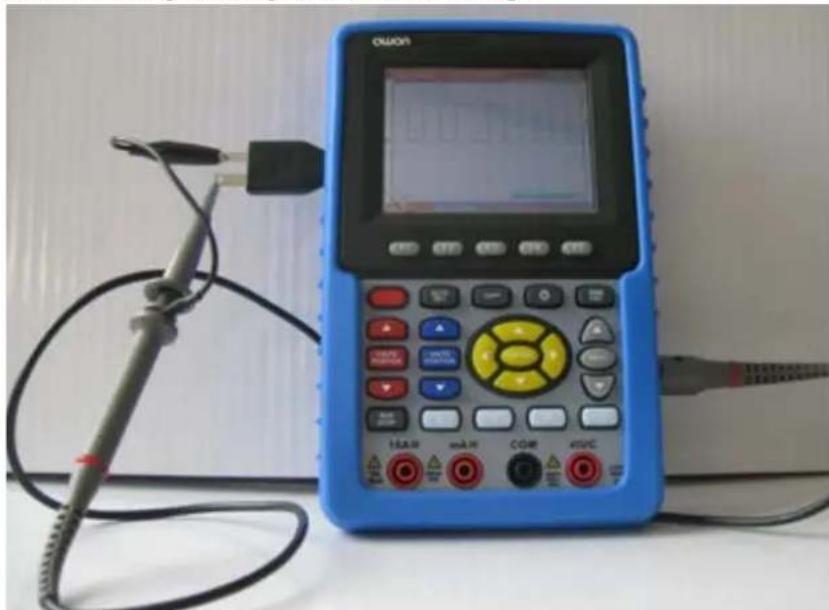
Fig.3. The connection of Square-wave test signal
5.2 Front Panel and Keys Overview
See the following Figure 4:
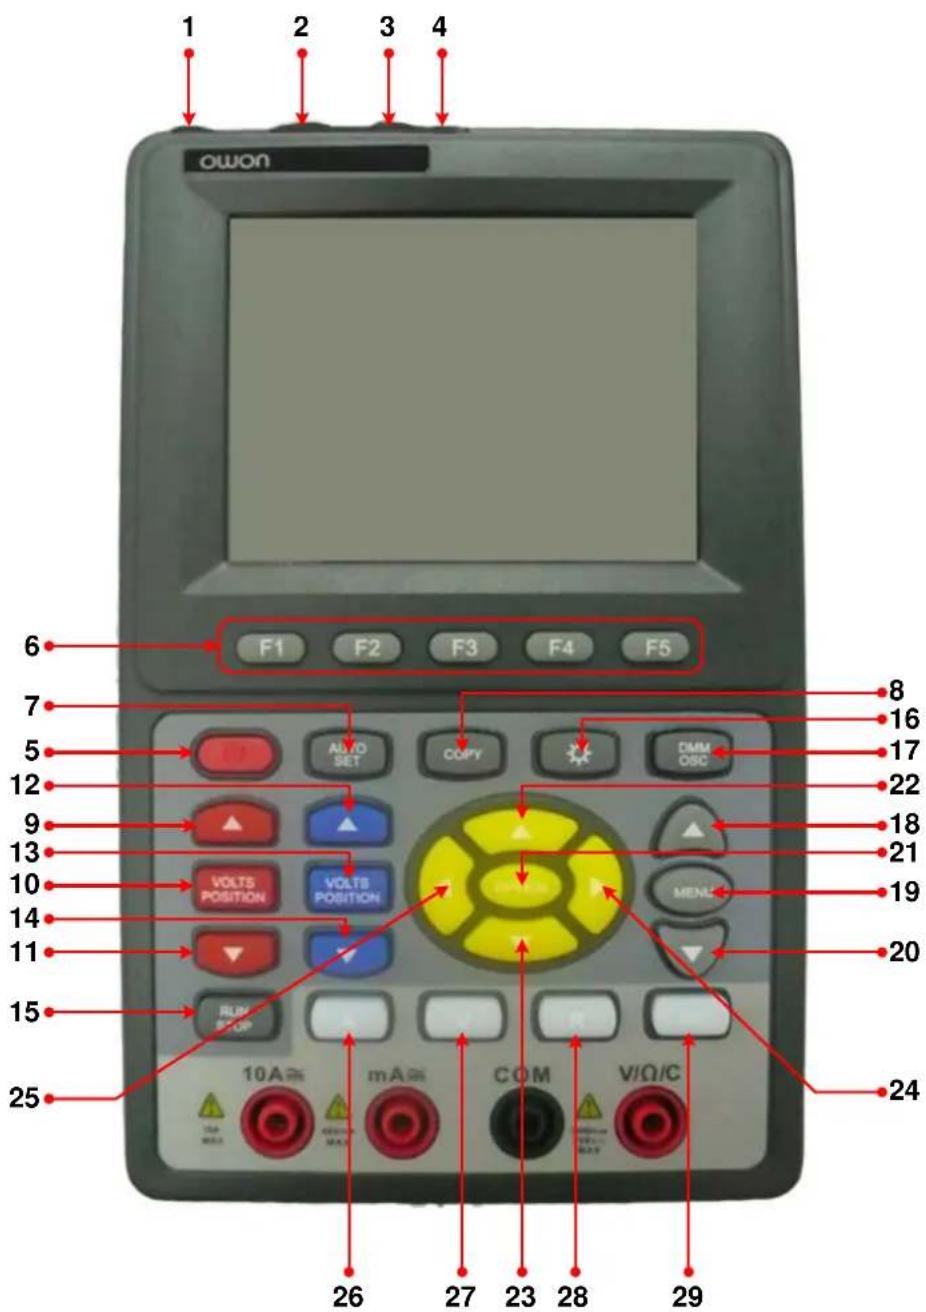
Figure 4: Front Panel
Description:
- AC adapter Port
- RS-232C Port.
- USB Port.
- USB Mass Storage Port.
- Power switch.
-
F1 - F5: Switch or Adjust options for each menu.
-
AUTO SET: Under DSO mode, automatically selects the horizontal scales, vertical scale, and trigger level according to the input signal.
- COPY: Press to save the waveform data into the USB Mass Storage Device.
- ▲ (red): Adjust voltage scale or vertical position in Channel 1.
- VOLTS POSITION (red): Switch between voltage scale and vertical position in Channel 1.
- ▼ (red): Adjust voltage scale or vertical position in Channel 1.
- ▲ (blue): Adjust voltage scale or vertical position in Channel 2.
- VOLTS POSITION (blue): Switch between voltage scale and vertical position in Channel 2.
- ▼ (blue): Adjust voltage scale or vertical position in Channel 2.
- RUN/STOP: key for running or stopping the operation
- LIGHT: Light switch.
- DMM/OSC: Operation mode switching key between oscilloscope and multimeter.
- MENU ▲: Choose the upper item on the menu list.
- MENU: Show / Hide the menu
- MENU ▼: Choose the lower item on the menu list.
- OPTION: the key for DSO setting and combines with four arrow keys. Then to set main time base, trigger horizontal position and trigger vertical position. Furthermore the keys possible to adjust the display multiplying factors of M waveform (CHMath Volts/Div) and display vertical position (CHM Zero) during waveform calculation and to adjust cursor 1 (V1 or T1) and cursor 2 (V2 or T2) position during cursor measurement.
- ▲ (yellow): Oscilloscope display upward adjustment key.
- ▼ (yellow): Oscilloscope display downward adjustment key.
- ▶ (yellow): Oscilloscope right-direction adjustment key.
- ◀ (yellow): Oscilloscope left-direction adjustment key.
- A: Selects DMM current measurement
- V: Selects DMM voltage measurement
- R: Selects DMM impedance, diode, continuity and capacitance measurement
- SET: convert AC and DC during measure current or voltage in Multi-meter; convert resistance, diode, on-off and capacitance measure during resistance measuring.
6. Using the Oscilloscope
6.1 About this Chapter
This chapter provides a step-by-step introduction to the scope functions. The introduction does not cover all of the capabilities of the scope functions but gives basic examples to show how to use the menus and perform basic operations.
6.2 Powering Up the Oscilloscope
Connect oscilloscope to AC power via AC-DC adapter as shown in Figure 1. (The oscilloscope may still work with built-in Li-ion battery even without AC power supply).
Turn the oscilloscope on by pressing down the power on/off key ⏻.
The instrument then performs self checking after power on. A greeting window and a sentence "Press any key to continue." will display on the screen when the system finishes self checking.
The users can press any key to enter the measuring function.
The oscilloscope is powered up in its last setup configuration.
6.3 Oscilloscope Operation Window
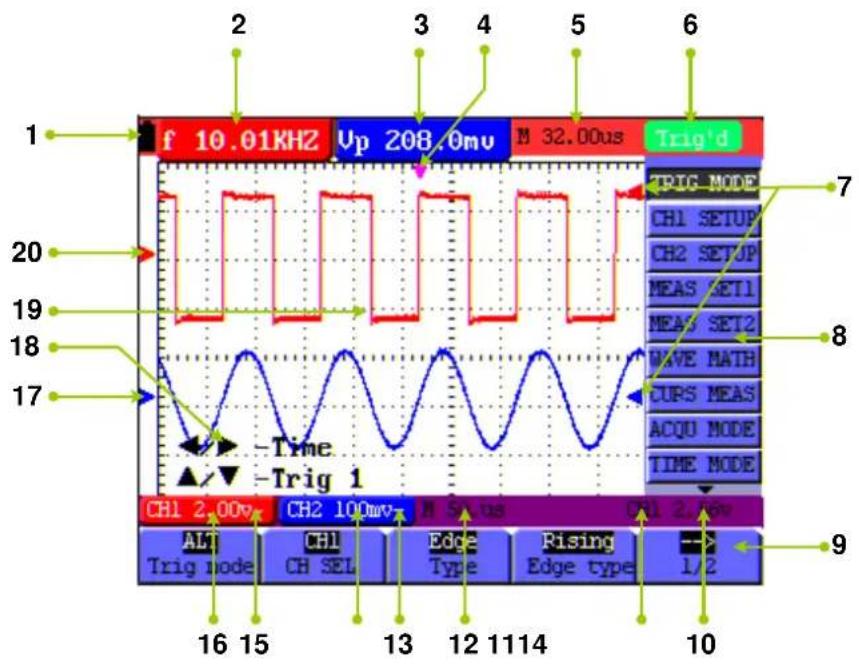
See the following figure 5:
line
| Time | Value | |------|-------| | 1 | 10.01KHZ | | 2 | Up 208.0mu | | 3 | Trig'd | | 4 | Trig'd | | 5 | Trig'd | | 6 | Trig'd | | 7 | Trig'mode | | 8 | CH1 SETUP | | 9 | CH2 SETUP | | 10 | MEAS SET1 | | 11 | MEAS SET2 | | 12 | WAVE MATH | | 13 | CURS MEAS | | 14 | ACQU MODE | | 15 | TIME MODE | | 16 | -Time | | 17 | -Trig 1 | | 18 | -Trig 1 | | 19 | -Trig 1 | | 20 | -Trig 1 | | 21 | -Trig 1 | | 22 | -Trig 1 | | 23 | -Trig 1 | | 24 | -Trig 1 | | 25 | -Trig 1 | | 26 | -Trig 1 | | 27 | -Trig 1 | | 28 | -Trig 1 | | 29 | -Trig 1 | | 30 | -Trig 1 | | 31 | -Trig 1 | | 32 | -Trig 1 | | 33 | -Trig 1 | | 34 | -Trig 1 | | 35 | -Trig 1 | | 36 | -Trig 1 | | 37 | -Trig 1 | | 38 | -Trig 1 | | 39 | -Trig 1 | | 40 | -Trig 1 | | 41 | -Trig 1 | | 42 | -Trig 1 | | 43 | -Trig 1 | | 44 | -Trig 1 | | 45 | -Trig 1 | | 46 | -Trig 1 | | 47 | -Trig 1 | | 48 | -Trig 1 | | 49 | -Trig 1 | | 50 | -Trig 1 | | 51 | -Trig 1 | | 52 | -Trig 1 | | 53 | -Trig 1 | | 54 | -Trig 1 | | 55 | -Trig 1 | | 56 | -Trig 1 | | 57 | -Trig 1 | | 58 | -Trig 1 | | 59 | -Trig 1 | | 60 | -Trig 1 | | 61 | -Trig 1 | | 62 | -Trig 1 | | 63 | -Trig 1 | | 64 | -Trig 1 | | 65 | -Trig 1 | | 66 | -Trig 1 | | 67 | -Trig 1 | | 68 | -Trig 1 | | 69 | -Trig 1 | | 70 | -Trig 1 | | 71 | -Trig 1 | | 72 | -Trig 1 | | 73 | -Trig 1 | | 74 | -Trig 1 | | 75 | -Trig 1 | | 76 | -Trig 1 | | 77 | -Trig 1 | | 78 | -Trig 1 | | 79 | -Trig 1 | | 80 | -Trig 1 | | 81 | -Trig 1 | | 82 | -Trig 1 | | 83 | -Trig 1 | | 84 | -Trig 1 | | 85 | -Trig 1 | | 86 | -Trig 1 | | 87 | -Trig 1 | | 88 | -Trig 1 | | 89 | -Trig 1 | | 90 | -Trig 1 | | 91 | -Trig 1 | | 92 | -Trig 1 | | 93 | -Trig 1 | | 94 | -Trig 1 | | 95 | -Trig 1 | | 96 | -Trig 1 | | 97 | -Trig 1 | | 98 | -Trig 1 | | 99 | -Trig 1 | | Note: The "Time" label indicates the time period from the start of the cycle (e.g., 'Up' or 'Up' in the frame [0] to 'Up' in the frame [5]) and the corresponding "Time" values are not explicitly provided in the code.Figure 5: Oscilloscope Operation Window
Description:
- Battery electric quantity indicating symbols.
- Auto measurement window 1, in which "f" means frequency, "T" means cycle, "V" means the average value, "Vp" the peak-peak value, "Vk" the root-mean-square value, "Ma" the maximum amplitude value, "Mi" the minimum amplitude value, "Vt" the Voltage value of the waveform's flat top value, "Vb" the Voltage value of the waveform's flat base, "Va" the amplitude value, "Os" the overshoot value, "Ps" the Preshoot value, "RT" the rise time value, "FT" the fall time value, "PW" the +width value, "NW" the -Width value, "+D" the +Duty value, "-D" the -Duty value, "PD" the Delay A→B √ value, and "ND" the Delay A→B √ value.
- Auto measurement window 2.
- The pointer indicates the horizontal triggering position.
- This reading gives the Time Difference between the horizontal triggering position and the screen centerline. It reads zero when the pointer is in the center of the screen.
- The trigger state indicates the following information.
Auto: The oscilloscope is working in the automatic mode and displaying the waveform under the non-trigger state.
Trig'd: The oscilloscope has detected a trigger and collecting the information generated after the trigger.
Ready: All pre-triggered data have been captured and the oscilloscope has been ready to receive trigger signals.
Scan: The oscilloscope can gather and display the waveform data continuously in scanning mode.
Stop: The oscilloscope has stopped collecting the waveform data.
- Red and blue index display triggers vertical position during alternate trigger and triggers index become green when it reaches edge trigger or video trigger.
- A hidden-style menu: With the MENU key pressed, you can view or hide the menu.
- Menu setting options: There are different setting options for different menus.
- It reads the value of trigger voltage level.
- The display shows the trigger signal source.
- The reading gives the value of primary time base.
- These graphics present the coupling modes of channel 2(CH2). The graphic "\~" indicates AC, the graphic "—" indicates DC, the graphic " 1= " indicates GND.
-
This reading shows the vertical Voltage Unit Scale of CH2.
-
These graphics show the coupling mode of CH1, among which the graphic "\~" express indicates AC, the graphic "-" indicates DC, the graphic " 1= " indicates GND.
- This reading shows the vertical Voltage Unit Scale of CH1.
- The blue pointer gives the grounding datum point of the waveform on CH2, which is the zero position of CH2. No display of this pointer indicates that the channel has not been opened.
- OPTION operation prompt: There are different prompts for different OPTION operations.
- Waveform display area. Red waveform represent CH1, blue waveform represent CH2.
- The red pointer gives the grounding datum point of the waveform on CH1, which is the zero position of CH1. No display of this pointer indicates that the channel has not been opened.
6.4 Menu Description
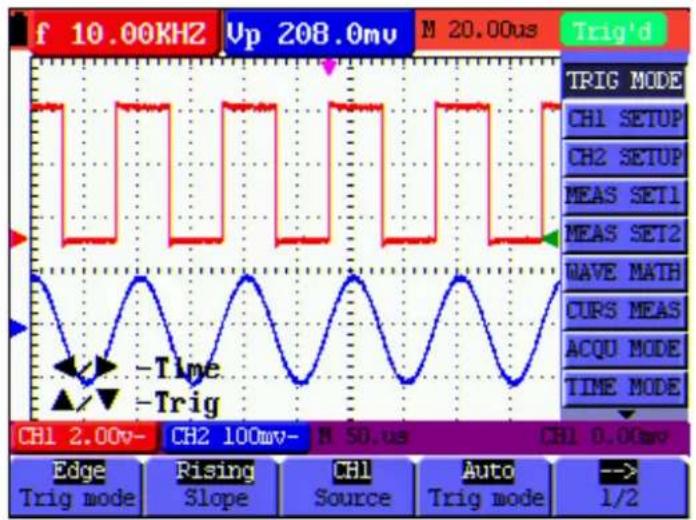
The following example shows how to use the tool's menus to select a function, as shown in the following figure.
- Press the MENU key to display the Function Menu on the right of the screen and the corresponding optional settings on the bottom. Press MENU again will hide the Function Menu.
- Press the MENU ▲ or MENU ▼ key to select different function menus.
- Choose one key from F1 to F5 and press it to change function setting.
See the following figure 6:
line
| Signal | Time (ms) | |-------------|-----------| | CH1 | 2.00 | | CH2 | 100 | | CH3 | 50 | | CH4 | 0 | | CH5 | 1/2 | | CH6 | 1/2 | | CH7 | 0 | | CH8 | 1/2 | | CH9 | 0 | | CH10 | 1/2 | | CH11 | 0 | | CH12 | 1/2 | | CH13 | 0 | | CH14 | 1/2 | | CH15 | 0 | | CH16 | 1/2 | | CH17 | 0 | | CH18 | 1/2 | | CH19 | 0 |Figure 6: the Tool's Menus
6.5 Manually Setting the Vertical System, Horizontal System and Trigger Position
6.5.1 Setting the Vertical System
To set the vertical system of CH1:
(1) Press VOLTS POSITION (rcd) key to toggle between bellows displayed at the bottom left of the screen:
$$ \begin{array}{l} \blacktriangle / \blacktriangledown - \mathrm{CH1Zero} \ \blacktriangle / \blacktriangledown - \mathrm{CH1Volts/Div} \ \end{array} $$
(2) When "▲/▼ - CH1 Zero" is displayed, ▲ (red) and ▼ (red) can be used to adjust the vertical position of CH1; the relevant information will be displayed.
(3) When "▲/▼ - CH1 Volts/Div" is displayed, ▲ (red) and ▼ (red) can be used to adjust the voltage scale of CH1; the relevant information will be displayed.
Note: A long press on the VOLTS POSITION (red) key can set the vertical display position of CH1 back to 0. (Only for some model)
To set the vertical system of CH2:
(1) Press VOLTS POSITION (blue) key to toggle between bellows:
$$ \begin{array}{l} \blacktriangle / \blacktriangledown - \mathrm{CH2Zero} \ \blacktriangle / \blacktriangledown - \mathrm{CH2Volts/Div} \ \end{array} $$
(2) When "▲/▼ - CH2 Zero" is displayed, ▲(blue) and ▼(blue) can be used to adjust the vertical position of CH2, the relevant information will be displayed;
(3) When "▲/▼ - CH2 Volts/Div" is displayed, ▲ (blue) and ▼ (blue) can be used to adjust the voltage scale of CH2, the relevant information will be displayed.
Note: A long press on the VOLTS POSITION (blue) key can set the vertical display position of CH2 back to 0. (Only for some model)
6.5.2 Setting the Horizontal System and Trigger Position
OPTION key is a multiple setting key to set trigger vertical position, main time base and horizontal position (trigger horizontal position) during edge trigger and video trigger; or to set trigger vertical position for Horizontal time base and trigger vertical position and horizontal level position during alternate trigger.
The following example shows how to use OPTION key to make a setting.
The following guidance is for the operation on the mode of edge triggering and video
triggering.
- Press once the OPTION key; the following is displayed at the bottom left side of the screen, as shown in the figure below.
◀/▶ – Time Base
▲/▼ - Trig
See the following figure 7:
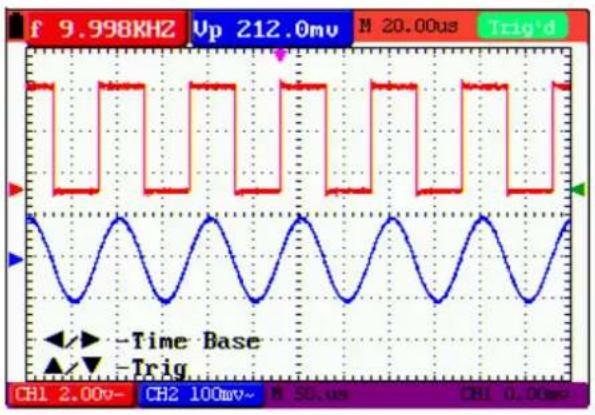
Figure 7
-
Press ◀ (yellow) or ▶ (yellow) to adjust the main time base; press ▲ (yellow) or ▼ (yellow) to adjust trigger level position, press R key to "zero" the trigger level position.
-
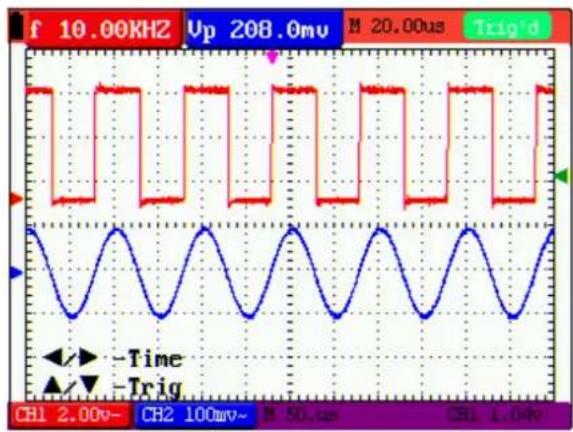
Press OPTION again and left bottom side display as
◀/▶ - Time
▲/▼ - Trig
See the following figure 8:
line
| Time (ns) | Voltage (mV) | Time (ms) | |-----------|--------------|-----------| | 0 | 208 | 50 | | 1 | 208 | 50 | | 2 | 208 | 50 | | 3 | 208 | 50 | | 4 | 208 | 50 | | 5 | 208 | 50 | | 6 | 208 | 50 | | 7 | 208 | 50 | | 8 | 208 | 50 | | 9 | 208 | 50 | | 10 | 208 | 50 | | 11 | 208 | 50 | | 12 | 208 | 50 | | 13 | 208 | 50 | | 14 | 208 | 50 | | 15 | 208 | 50 | | 16 | 208 | 50 | | 17 | 208 | 50 | | 18 | 208 | 50 | | 19 | 208 | 50 | | 20 | 208 | 50 | | 21 | 208 | 50 | | 22 | 208 | 50 | | 23 | 208 | 50 | | 24 | 208 | 50 | | 25 | 208 | 50 | | 26 | 208 | 50 | | 27 | 208 | 50 | | 28 | 208 | 50 | | 29 | 208 | 50 | | 30 | 208 | 50 | | 31 | 208 | 50 | | 32 | 208 | 50 | | 33 | 208 | 50 | | 34 | 208 | 50 | | 35 | 208 | 50 | | 36 | 208 | 50 | | 37 | 208 | 50 | | 38 | 208 | 50 | | 39 | 208 | 50 | | 40 | 208 | 50 | | 41 | 208 | 50 | | 42 | 208 | 50 | | 43 | 208 | 50 | | 44 | 208 | 50 | | 45 | 208 | 50 | | 46 | 208 | 50 | | 47 | 208 | 50 | | 48 | 208 | 50 | | 49 | 208 | 50 | | 50 | 208 | 50 | | CH1 | - | - | | CH2 | - | - | | CH3 | - | - | | CH4 | - | - | | CH5 | - | - | | CH6 | - | - | | CH7 | - | - | | CH8 | - | - | | CH9 | - | - | | CH10 | - | - | | CH11 | - | - | | CH12 | - | - | | CH13 | - | - | | CH14 | - | - | | CH15 | - | - | | CH16 | - | - | | CH17 | - | - | | CH18 | - | - | | CH19 | - | - | | CH20 | - | - | | CH21 | - | - | | CH22 | - | - | | CH23 | - | - | | CH24 | - | - | | CH25 | - | - | | CH26 | - | - | | CH27 | - | - | | CH28 | - | - | | CH29 | - | - | | CH30 | - | - | | CH31 | - | - | | CH32 | - | - | | CH33 | - | - | | CH34 | - | - | | CH35 | - | - | | CH36 | - | - | | CH37 | - | - | | CH38 | - | - | | CH39 | - | - | | CH40 | - | - | | CH41 | - | - | | CH42 | - | - | | CH43 | - | - | | CH44 | - | - | | CH45 | - | - | | CH46 | - | - | | CH47 | - | - | | CH48 | - | - | | CH49 | - | - | | CH50 | - | - | | CH51 | - | - | | CH52 | - | - | | CH53 | - | - | | CH54 | - | - | | CH55 | - | - | | CH56 | - | - | | CH57 | - | - | | CH58 | - | - | | CH59 | - | - | | CH60 | - | - | | CH61 | - | - | | CH62 | - | - | | CH63 | - | - | | CH64 | - | - | | CH65 | - | - | | CH66 | - | - | | CH67 | - | - | | CH68 | - | - | | CH69 | - | - | | CH70 | - | - | | CH71 | - | - | | CH72 | - | - | | CH73 | - | - | | CH74 | - | - | | CH75 | - | - | | CH76 | - | - | | CH77 | - | - | | CH78 | - | - | | CH79 | - | - | | CH80 | - | - | | CH81 | - | - | | CH82 | - | - | | CH83 | - | - | | CH84 | - | - | | CH85 | - | - | | CH86 | - | - | | CH87 | - | - | | CH88 | - | - | | CH89 | - | - | | CH90 | - | - | | CH91 | - | - | | CH92 | - | - | | CH93 | - | - | | CH94 | - | - | | CH95 | - | - | | CH96 | - | - | | CH97 | - | - | | CH98 | - | - | | CH99 | - | - | | CH100 | + |\n- | The data is presented in two rows: the left row contains the voltage waveforms (Up to V) for each of the cycles (e.g., THI, THI', U to V) for each of the cycles (e.g., THI, THI'). The right row contains the corresponding time intervals (e.g., THI, THI') for each of the cycles (e.g., THI, THI'). The bottom row contains the corresponding time intervals (e.g., THI, THI').Figure 8
- Press ◀(yellow) or ▶(yellow) to adjust time base horizontal position, press V key to "zero" the horizontal position; press ▲(yellow) or ▼(yellow) to adjust trigger level position, press R key to "zero" the trigger level position.
- Press OPTION again to back up operation 1.
The following guidance is for the operation on the mode of alternative triggering.
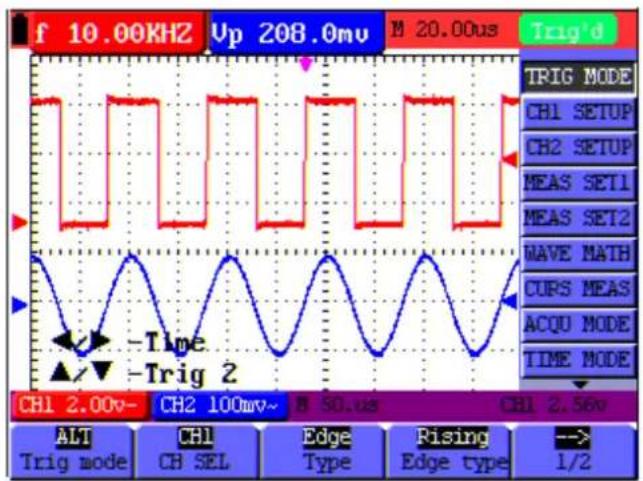
- Press OPTION and left bottom display as:
◀/▶—Time
▲/▼—Trig 2 (or Trig 1)
See the following figure 9:
line
| Signal | Value | | ----------- | --------- | | CH1 Setup | 2.00 | | CH2 Setup | 100 | | MEAS SET1 | 50 | | MEAS SET2 | 20 | | WAVE MATH | 5 | | CURS MEAS | 2 | | ACQU MODE | 1 | | TIME MODE | 2 |Figure 9: Adjust Time and Trig 2
- Press ◀ (yellow) or ▶ (yellow) to adjust time base horizontal position, press V key to "zero" the horizontal position; press ▲ (yellow) or ▼ (yellow) to adjust trigger level position in Channel 2
(or Channel 1), press R key to "zero" the trigger level position.
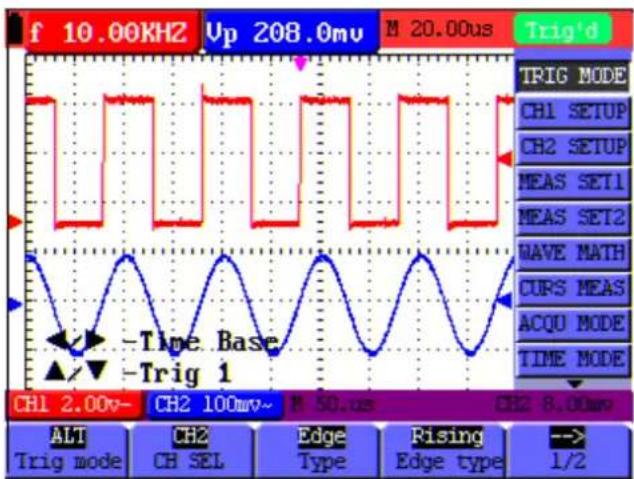
- Press OPTION again and left bottom display as:
◀/▶— Time Base
▲/▼— Trig 1 (or Trig 2)
See the following Figure 10:
line
| Signal | Time (ms) | |------------|-----------| | CH1 | 2.00 | | CH2 | 100 | | CH3 | 50 | | CH4 | 8.00 |Figure 10: Adjust Time Base and Trig 1
-
Press ◀(yellow) or ▶ (yellow) to adjust main time base; press ▲(yellow) or ▼(yellow) to adjust trigger level position in Channel 1 (or Channel 2), press R key to "zero" the trigger level position.
-
Press OPTION again to back up operation 1.
Term interpretation
- Vertical scale factor: It stands for the voltage amplitude represented by a division in the vertical direction of the display area, through the adjustment of which you can amplify or attenuate the signal and thus regulate the signal amplitude into the expected measurement range.
- Vertical zero position: It is referred to as the grounding datum point, through the adjustment of which you can regulate the display position of the waveform on the screen.
- Main time base: It means the time values represented by a division in the horizontal direction of the display area.
- Trigger horizontal position: It means the time deviation between the actual trigger point and the screen central line, which will be displayed as 0 at the center point of the screen.
- Trigger level position: It represents the voltage deviation between the actual trigger level and the zero position of the triggering signal source channel.
6.6 Recall factory settings
If you want to reset the Oscilloscope to the factory settings, do the following:
- Press MENU key and the function menu appears on the right side of the screen
-
Press the MENU ▲ or MENU ▼ key to select FUNCTION setting and three options are visible at the bottom of the screen.
-
Press F1 key to select "Recall Factory" to recall the factory settings.
-
Press F2 key to select "Auto calibration". If the ambient temperature variation is up to or larger than 5 Celsius degree, the Auto calibration function should be performed. But this will not affect the using and capability by the heat from LCD and electronic component
See the following Figure 11:
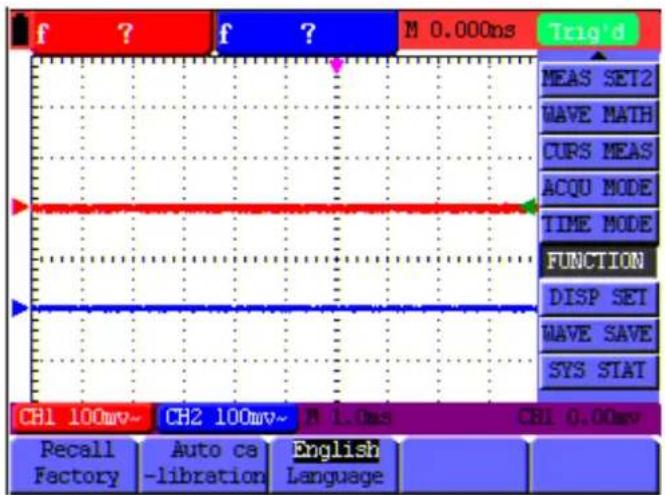
Figure 11: Reset the Oscilloscope
6.7 Input Connections
See Figure 2 on P8.
Look at the bottom and the right of the Oscilloscope. The Oscilloscope has six signal inputs: two safety BNC jack inputs (CH1 and CH2) for scope measurements, four safety 4-mm banana jack inputs for Multimeter R, V and A measurements.
Isolated input allows independent floating measurements between Multimeters and Scopes.
6.8 Displaying an Unknown Signal with Auto Set
The Auto-Set feature lets the Oscilloscope display and measure unknown signals automatically. This function optimizes the position, range, time base and triggering, assures a stable display of virtually any waveform. This feature is especially useful for quickly checking several signals.
To enable the Auto-Set feature, do the following:
- Connect the test probe to the tested signals.
- Press the AUTO SET key and the Oscilloscope is under the automatic measurement condition. The tested signals appear on the screen.
6.9 Automatic Zero-returning of Trigger Horizontal Position and Trigger Level Position
When we adjust the trigger horizontal position and trigger level position to be maximal to make it off the screen center remotely, then we perform the following steps to make trigger horizontal position and trigger level position return to zero automatically.
- Press V key, the trigger horizontal position automatically returns to zero.
- Press R key, the trigger level position automatically returns to zero.
6.10 Automatic Measurements
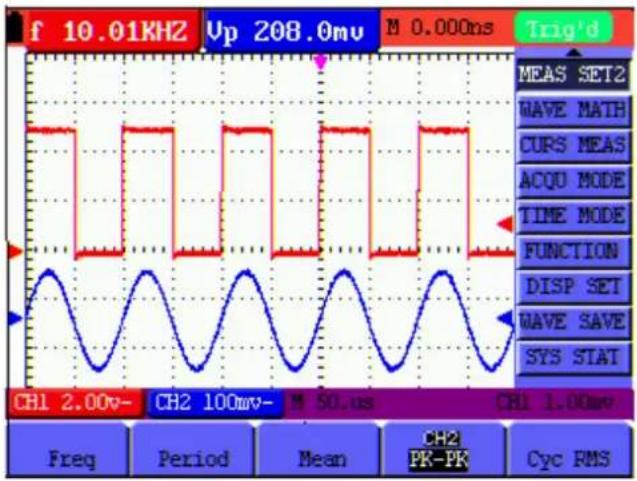
The Oscilloscope offers 20 ranges of automatic scope measurements. Your can display two numeric readings: measurement 1 and measurement 2. These readings are selectable independently, and the measurements can be done on the input CH1 or input CH2 waveform.
To choose a frequency for CHI1, do the following:
- Press MENU key and the function menu appears on the right side of the screen.
- Press MENU ▲ or MENU ▼ key to select MEAS SET1. Five items selectable are visible at the bottom of the screen.
- Press F1 key and select Freq CH1 from the mean square root value item. The measurement 1 window turns its color into red and shows the frequency for input CH1.
To choose a Peak-Peak measurement for Input CH2, do the following:
- Press MENU key and the function menu are displayed on the right side of the screen.
- Press MENU ▲ or MENU ▼ key and select MEAS SET2, with 5 items selectable displayed at the bottom of the screen.
- Press F4 key to select PK-PK CH2. The measurement 2 window turns its color to be blue and shows the peak-peak value for input CH2.
See the following figure 12:
line
| Parameter | Value | | --------------- | --------- | | Freq | 2.00v | | Period | 100mv | | Mean | 50.0us | | CH2 PK-PK | 50.0us | | Cyc RMS | 1.00mv |Figure 12: Automatic Scope Measurements
6.11 Freezing the Screen
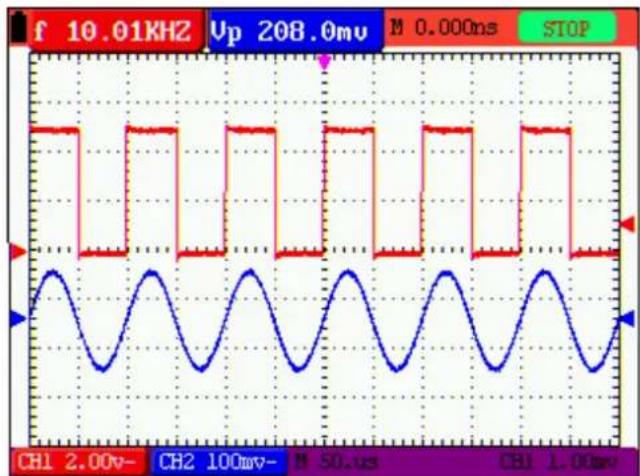
You can freeze the screen (all readings and waveforms)
-
Press the RUN/STOP key to freeze the screen and STOP appears at top right side of the screen.
-
Press the RUN/STOP key once more to resume your measurement.
See the following figure 13:
line
| Time (ms) | Voltage (mV) | Current (mV) | |-----------|--------------|--------------| | 0 | 10.01 | 2.00 | | 1 | 10.01 | 100 | | 2 | 208.0 | 50 | | 3 | 208.0 | 1.00 | | 4 | 208.0 | 2.00 | | 5 | 208.0 | 100 | | 6 | 208.0 | 50 | | 7 | 208.0 | 1.00 | | 8 | 208.0 | 2.00 | | 9 | 208.0 | 100 | | 10 | 208.0 | 50 | | 11 | 208.0 | 1.00 | | 12 | 208.0 | 2.00 | | 13 | 208.0 | 100 | | 14 | 208.0 | 50 | | 15 | 208.0 | 1.00 | | 16 | 208.0 | 2.00 | | 17 | 208.0 | 100 | | 18 | 208.0 | 50 | | 19 | 208.0 | 1.00 | | 20 | 208.0 | 2.00 | | 21 | 208.0 | 100 | | 22 | 208.0 | 50 | | 23 | 208.0 | 1.00 | | 24 | 208.0 | 2.00 | | 25 | 208.0 | 100 | | 26 | 208.0 | 50 | | 27 | 208.0 | 1.00 | | 28 | 208.0 | 2.00 | | 29 | 208.0 | 100 | | 30 | 208.0 | 50 | | 31 | 208.0 | 1.00 | | 32 | 208.0 | 2.00 | | 33 | 208.0 | 100 | | 34 | 208.0 | 50 | | 35 | 208.0 | 1.00 | | 36 | 208.0 | 2.00 | | 37 | 208.0 | 100 | | 38 | 208.0 | 50 | | 39 | 208.0 | 1.00 | | 40 | 208.0 | 2.00 | | 41 | 208.0 | 100 | | 42 | 208.0 | 50 | | 43 | 208.0 | 1.00 | | 44 | 208.0 | 2.00 | | 45 | 208.0 | 100 | | 46 | 208.0 | 50 | | 47 | 208.0 | 1.00 | | 48 | 208.0 | 2.00 | | 49 | 208.0 | 100 | | 50 | - | - | | Peak | - | - | | Low | - | - | | High | - | - | | End | - | - |Figure 13: Freezing the Screen
6.12 Using Average for Smoothing Waveforms
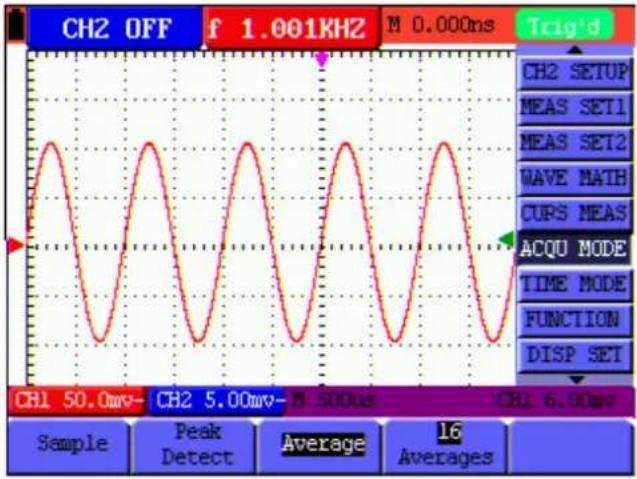
Using the Average acquisition mode, you can smooth out the displayed waveform by averaging multiple data samples. The number of averaging is selectable from 4, 16, 64, and 128.
Note: In order for average mode to work in the best way, the waveform must be repetitive; As the number of averaging increases, the slower the waveform update becomes.
-
Press the MENU key and the function menu appears on the right side of the screen.
-
Press MENU ▲ or MENU ▼ key to select ACQU MODE, with four items selectable displayed at the bottom of the screen.
-
Press the F3 key to select Average, then, press F4 key to jump to Averages 16 item. This averages the outcomes of 16 acquisitions and shows the final averaging result on the screen, shown as the following figures.
See the following figure 14:
line
| Measurement | Value | |-------------|-----------| | CH2 OFF | 1.001KHz | | f | 0.000ns | | CH1 50.0mv | Peak Detect | | CH2 5.00mv | Average | | CH1 6.00mv | Averages |Figure 14: Average Factor Sampling Mode
6.13 Using Persistence to Display Waveforms
You can use Persistence to observe dynamic signals.
-
Press MENU key and the function menu appears on the right side of the screen.
-
Press MENU ▲ or MENU ▼ key to select DISP SET.
-
Press F2 key to select Persist 1 sec, 2 sec, 5 sec, Infinite or OFF. In this case, jump to Infinite and the observed dynamic is kept on the screen continuously. When the item OFF is selected, the Persistence function is closed.
Look at the display, a screen like the following figure 15 can be shown.
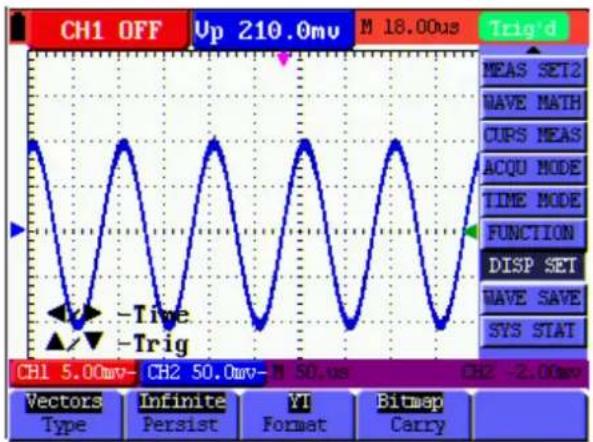
Figure 15: Persistence to Observe Dynamic Signals
6.14 Using Peak Detection to Display Glitches
You can use this function to display events (glitches or other asynchronous waveforms) of 50 ns or wider.
- Press MENU key and the function menu appear at the right side of the screen.
- Press MENU ▲ or MENU ▼ key to select the ACQU MODE. Four items selectable are displayed at the bottom of the screen.
- Press F2 key and jump to Peak Detect. In this case, you can test the glitch.
Now, you can see a screen that looks like the following figure 16.
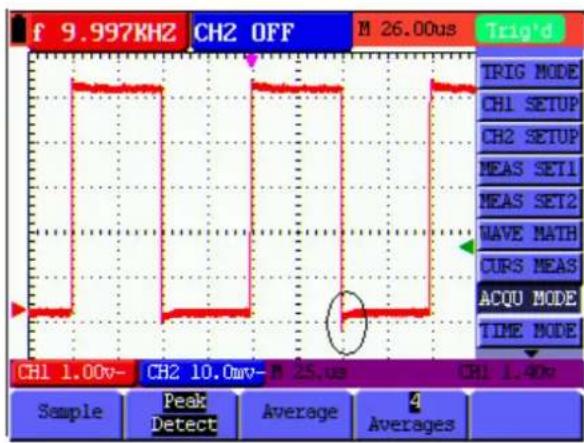
Figure 16: Peak Detection
Term interpretation
Collecting mode: The oscilloscope transforms the collected analog data into a digital form after they are gathered in the following three different modes, that is, sampling, peak value detection and averaging values.
Sampling: The oscilloscope takes samples from the signal at a equal time interval to reconstruct the waveform in this mode, by which the analog signal can be expressed correctly in most cases, yet, the rapid changes can not be collected between two sampling time intervals, causing the confusion and loss the narrow pulse in the signal probably.
Peak value detection: The oscilloscope takes samples from the maximum and minimum of signals in each sampling interval and shows the waveform with the sampled data in this mode, thus, by which the oscilloscope may collect the possibly lost narrow pulse in the sampling mode but the noise is obvious.
Averaging values: the oscilloscope collects several waveforms and average over them, and displays the averaged waveform in this mode, by which the random noise can be reduced.
Duration time: When a new waveform is displayed, the previous waveform shown on the screen does not disappear immediately only to be displayed for a period of time, that is, the duration time, by setting which, the waveform can be displayed more continuously and thus a display similar to that shown by the analog oscilloscope can be achieved.
Roll scan mode: The oscilloscope updates the waveform sampling points by scrolling display through a screen from left to right in this mode, which is only applicable to the primary time base setting of above 50ms.
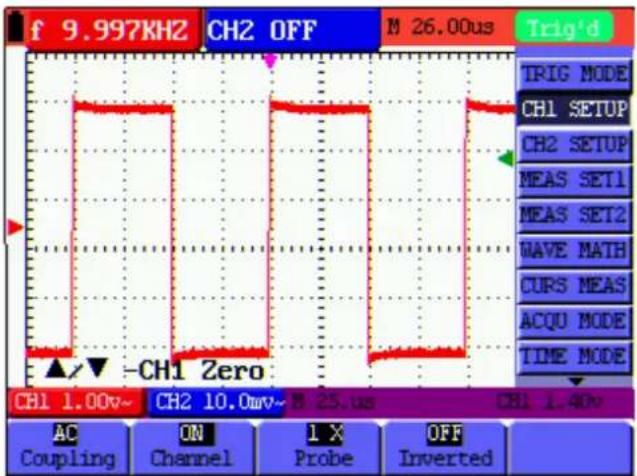
6.15 Selecting AC-coupling
After a reset, the Oscilloscope is dc-coupled so that ac and dc voltages appear on the screen. Use ac-coupling when you wish to observe a small ac signal that rides on a dc signal. To select ac-coupling, do the following:
-
Press MENU key and the function menu appear at the right side of the screen.
-
Press MENU ▲ or MENU ▼ key to select CH1 SETUP. Four items selectable are visible at the bottom of the screen.
-
Press the F1 key and jump to AC. The bottom left side of the screen displays the ac-coupling icon.
Now, you can see a screen that looks like the following figure 17.
line
| Signal | Frequency (μs) | |--------|----------------| | CH1 | 1.00 | | CH2 | 10.00 | | CH1 Zero | -CH1 | | CH2 OFF | 26.00 | | CH1 Setup | 1.40 | | CH2 Setup | 1.40 | | MEAS SET1 | 1.40 | | MEAS SET2 | 1.40 | | WAVE MATH | 1.40 | | CURS MEAS | 1.40 | | ACQU MODE | 1.40 | | TIME MODE | 1.40 |Figure 17: AC-Coupling
6.16 Reversing the Polarity of the Displayed Waveform
To invert the input CH1 waveform, do the following:
- Press the MENU key and the function menu appears at the right side of the screen.
- Press the MENU ▲ or MENU ▼ key to select CH1 SETUP. Four items selectable are displayed at the bottom of the screen.
- Press F4 key to jump to Inverted, set it as ON. The inverted waveform of CH1 is displayed on the screen.
Now, you can see a screen that looks like the following figure 18.
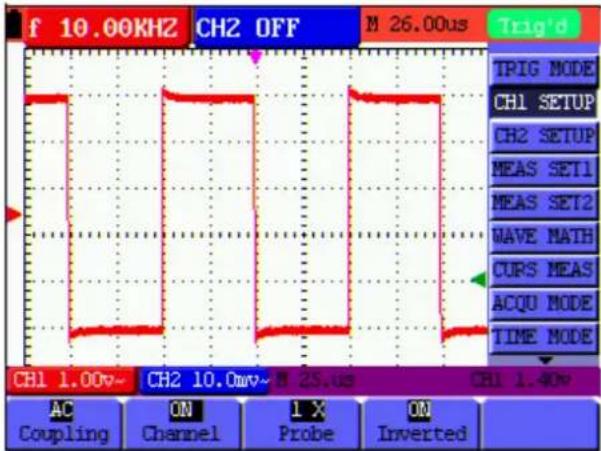
Figure 18: Inverted On
6.17 Using Waveform Mathematics Functions
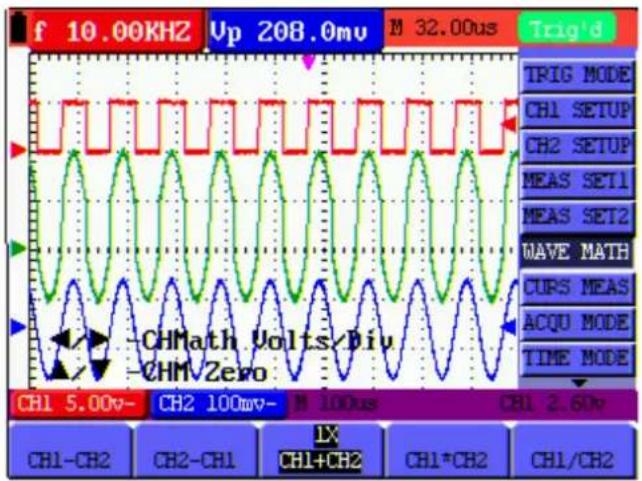
When adding (CH1 + CH2), subtracting (CH1 - CH2, CH2 - CH1), multiplying (CH1 * CH2) or dividing (CH1 / CH2) the input waveforms of CHI and CH2, the Oscilloscope will display the mathematical result waveform M and the input waveforms of CH1 and CH2 on the screen. The Mathematics functions perform a point-to-point calculation on the waveforms CH1 and CH2.
To use a Mathematics function, do the following:
- Press the MENU key and the function menu is displayed at the right side of the screen.
- Press the MENU ▲ or MENU ▼ key to select the WAVE MATH. Five items selectable appears at the bottom of the screen.
- Press F3 key to select CH1+CH2 and the calculated waveform M (green) appears on the screen.
- Press OPTION until left bottom display as
◀/▶—CHMath Volts/Div
▲/▼—CHM Zero
- Press ▲ (yellow) or ▼ (yellow) to adjust vertical display position of waveform M.
Press ◀ (yellow) or ▶ (yellow) to adjust display times factor of waveform M.
Now, you can see a screen that looks like the following figure 19.
line
| Signal | Value | |-----------------|-----------| | CH1-CH2 | 5.00V | | CH2-CH1 | 100mV | | CH1+CH2 | 100mV | | CH1*CH2 | 2.60V | | CH1/CH2 | 2.60V |Figure 19: Waveform Mathematics
- Press the F3 key to close Waveform Calculation.
6.18 Use USB mass storage device to save waveform data
Insert the USB mass storage device into the USB port and press copy key, then the current waveform data will be saved into the USB mass. The save waveform has two format, one is vector format and another is bitmap format, according to the display settings from the choice of the communication settings. Then the file name in sequence will be WAVE1.BIN、WAVE2.BIN、WAVE3.BIN... or WAVE1.BMP、WAVE2.BMP、WAVE3.BMP..... Then connect the USB mass storage device with the computer after data is saved, and open the data of vector format with OWON analysis software, or direct open the bitmap.
Note: It has clew in a series of process USB operation storage, such as "USB save successfully".
USB disk Requirements
The supported format of the USB disk: The storage capacity should not exceed 8G, FAT32 file system, the allocation unit size cannot exceed 4K, mass storage USB disk is also supported. If the USB disk doesn't work properly, format it into the supported format and try again. Follow any of the following two methods to format the USB disk: using system-provided function and using the formatting tools.
Use system-provided function to format the USB disk
- Connect the USB disk to the computer.
- Right click Computer→Manage to enter Computer Management interface.
- Click Disk Management menu, and information about the USB disk will display on the right side with red mark 1 and 2.
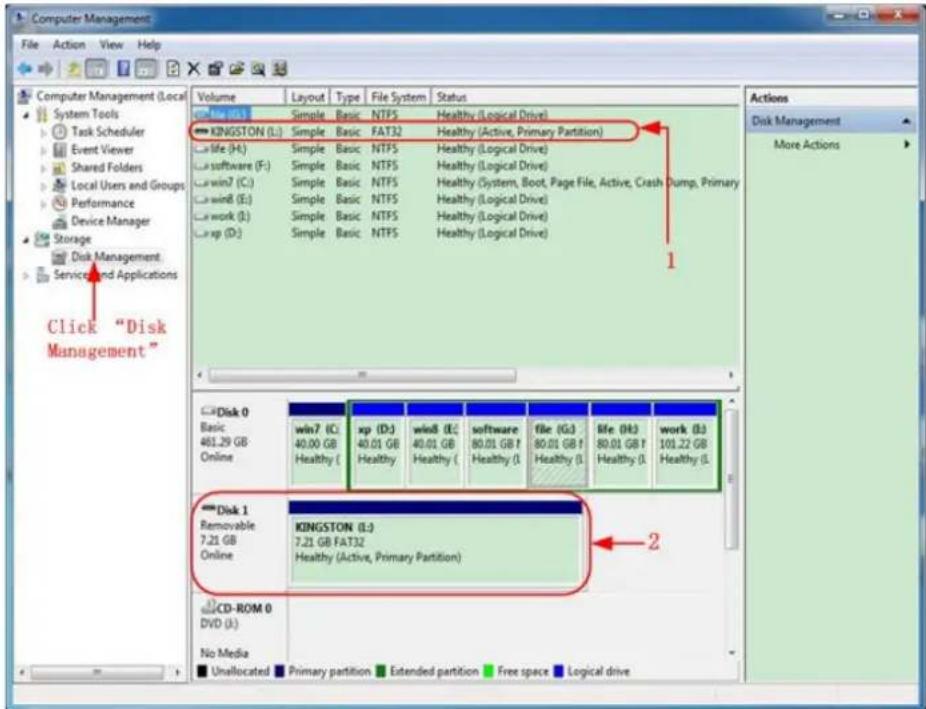
Disk Management of computer
- Right click 1 or 2 red mark area, choose Format. And system will pop up a warning message, click Yes.
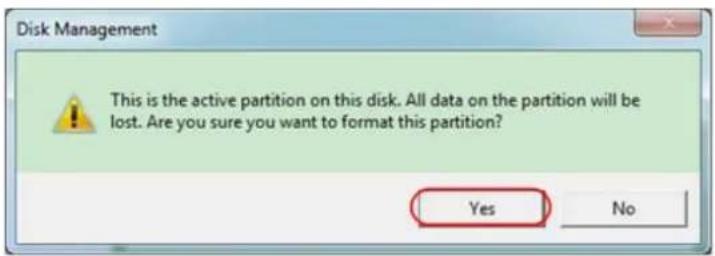
Format the USB disk warning
- Set File System as FAT32, Allocation unit size 4096. Check "Perform a quick format" to execute a quick format. Click OK, and then click Yes on the warning message.
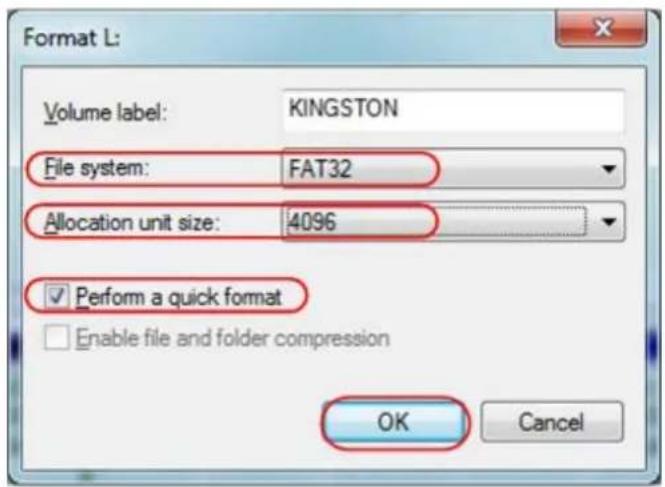
Formatting the USB disk setting
- Formatting process.
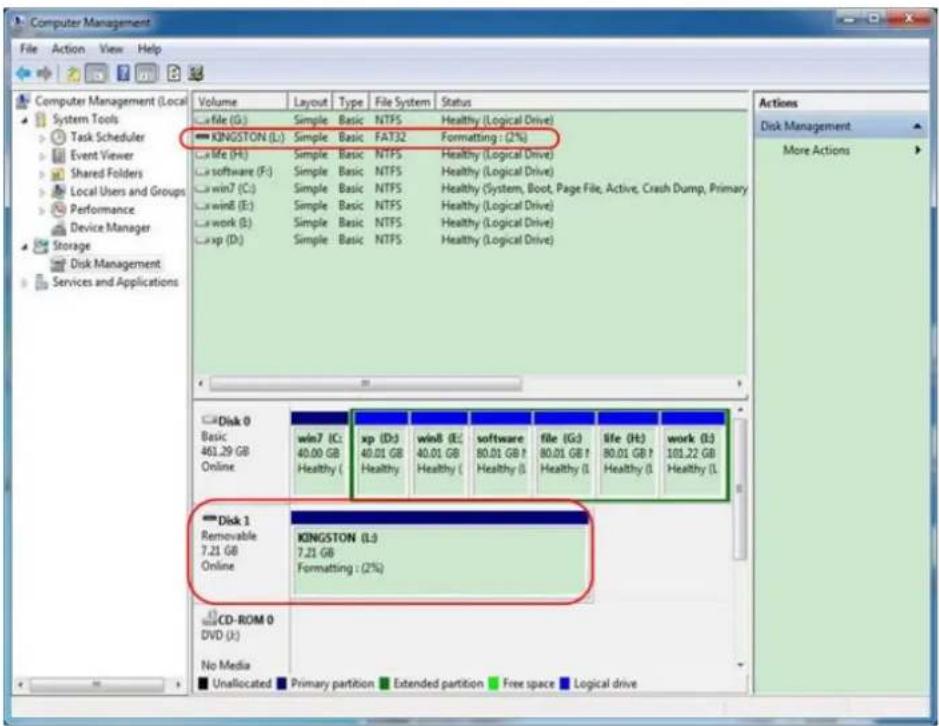
Formatting the USB disk
- Check whether the USB disk is FAT32 with allocation unit size 4096 after formatting.
Use Minitool Partition Wizard to format
Download URL: http://www.partitionwizard.com/free-partition-manager.html
Tip: There are many tools for the USB disk formatting on the market, just take Minitool Partition Wizard for example here.
- Connect the USB disk to the computer.
- Open the software Minitool Partition Wizard.
- Click Reload Disk on the pull-down menu at the top left or press keyboard F5, and information about the USB disk will display on the right side with red mark 1 and 2.
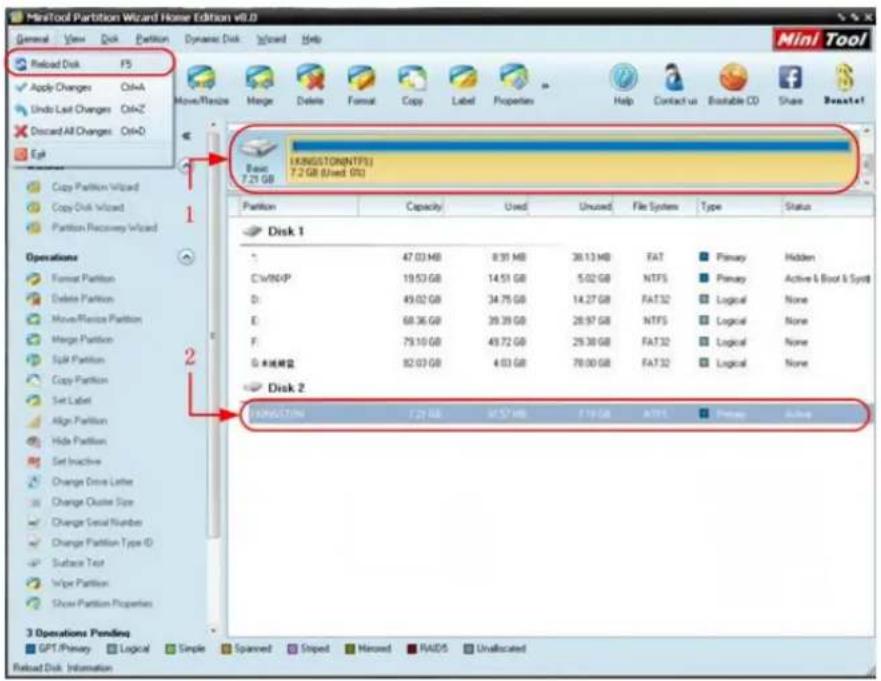
Reload Disk
- Right click 1 or 2 red mark area, choose Format.
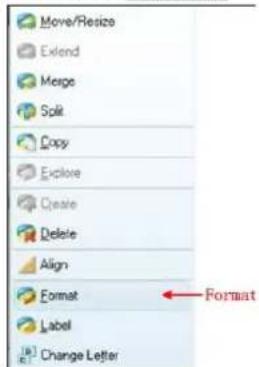
Choose format
- Set File System FAT32, Cluster size 4096. Click OK.
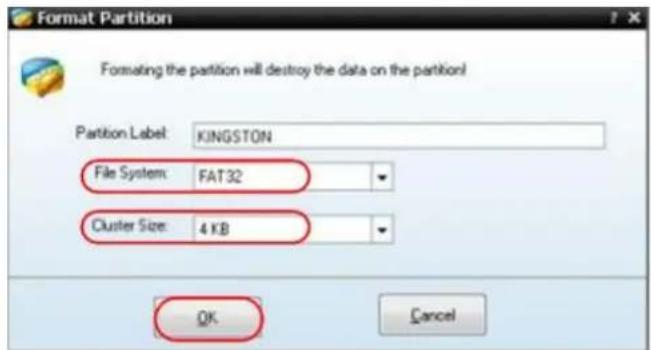
Format setting
- Click Apply at the top left of the menu. Then click Yes on the pop-up warning to begin formatting.
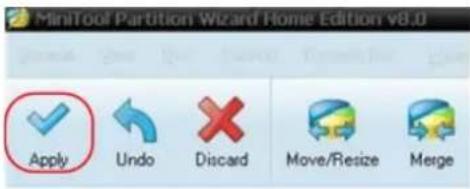
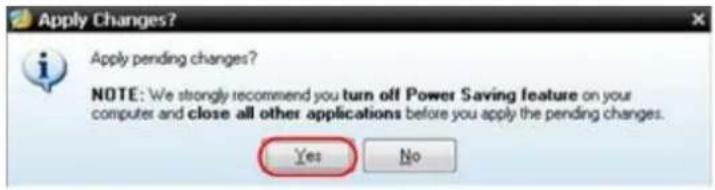
Apply setting
7. Formatting process
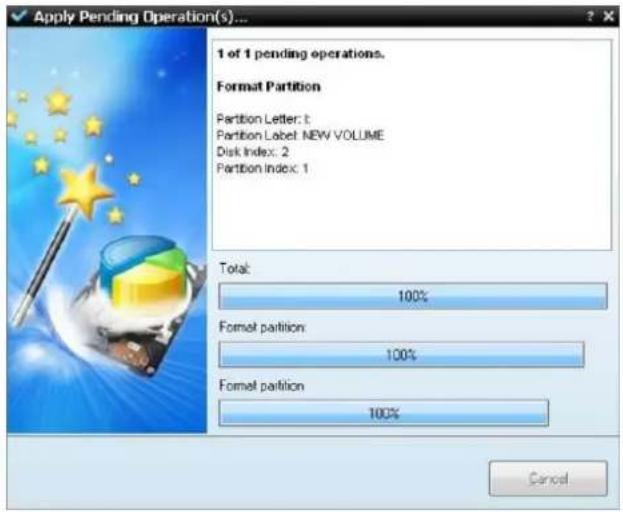
Format process
8. Format the USB disk successfully
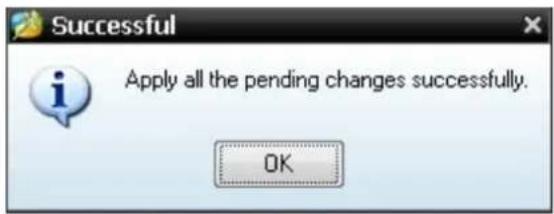
Format successfully
7. Using the Multimeter
7.1 About this Chapter
This chapter provides a step-by-step introduction to the multi-meter functions of the test tool hereafter. The introduction gives basic examples to show how to use the menus and perform basic operations.
7.2 Making Meter Connections
Use the four 4-mm safety banana jack inputs for the Meter functions: 10A, mA, COM, V/Ω/C.
See Figure 2 on P8 for the connections.
7.3 Multimeter Operation Window
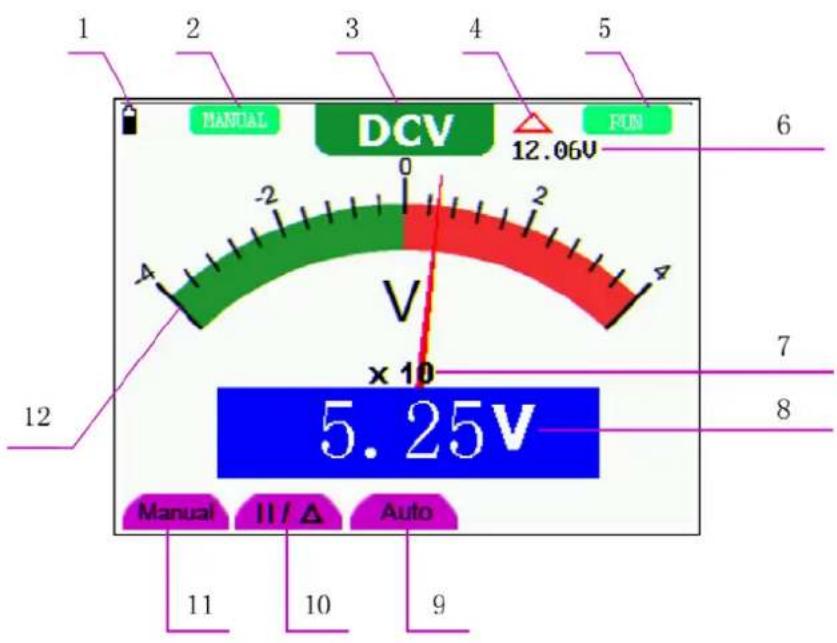
Figure 20: Multimeter Operation Window
Description
-
Battery electric quantity indicator.
-
Manual/Auto range indicators, among which the MANUAL means measuring range in manual operation mode and AUTO refers to the measuring range in automatic operation mode.
-
Measurement mode indicators:
DCV: Direct voltage measurement
ACV: Alternating voltage measurement
DCA: Direct current measurement
ACA: Alternating current measurement
R: Resistance measurement
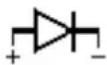
: Diode measurement

: On/Off measurement
C: Capacitance measurement
- The relative magnitude measurement indicator.
- Running state indicators, among which RUN expresses continuous update and STOP represents the screen locking.
- The reference value of the relative magnitude measurement.
- The multiplying power of the dial indication. To multiply the reading of dial pointer by multiplying power will get the measurement result.
- The main reading of measurement
- Automatic control measuring range.
- Absolute/ relative magnitude measuring control: The sign "||" expresses the absolute magnitude measuring control and "△" represents the relative magnitude measuring control.
Manually measuring range control.
-
Manual measurement control.
-
Test lead indicated the scale of test reading; different test modes display different colors.
7.4 Making Multimeter Measurements
Press DMM/OSC key, the oscilloscope will switch to the multimeter measure; the screen will display the multimeter windows.
7.4.1 Measuring Resistance Values
To measure a resistance, do the following:
-
Press the R key and R appears at the top of the screen.
-
Insert the black lead into the COM banana jack input and the red lead into the V/Ω/C banana jack input.
- Connect the red and black test leads to the resistor. The resistor value readings are shown on the screen in Ohm.
Now, you can see a screen that looks like the following figure 21.
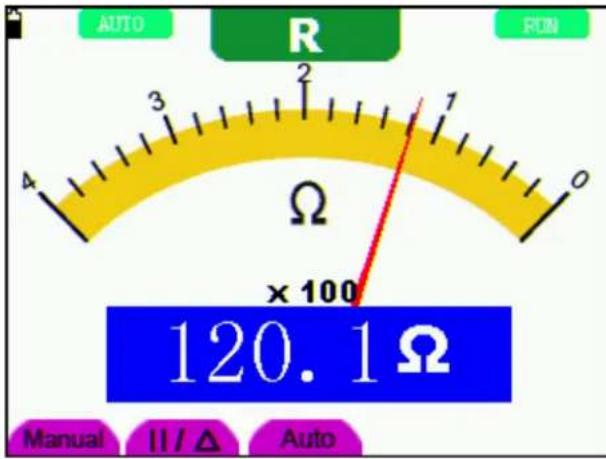
Figure 21: Resistance Measurement
7.4.2 Measuring Diode
To make a measurement on the diode, do the following:
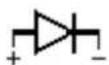
- Press the R key and R appears at the top of the screen.
- Press SET key until the following is displayed on the screen
- Insert the black lead into the COM banana jack input and the red lead into the V/Ω/C banana jack input.
- Connect the red and black leads to the resistor and the diode resistor readings are displayed on the screen in V.
Now, you can see a screen that looks like the following figure 22.
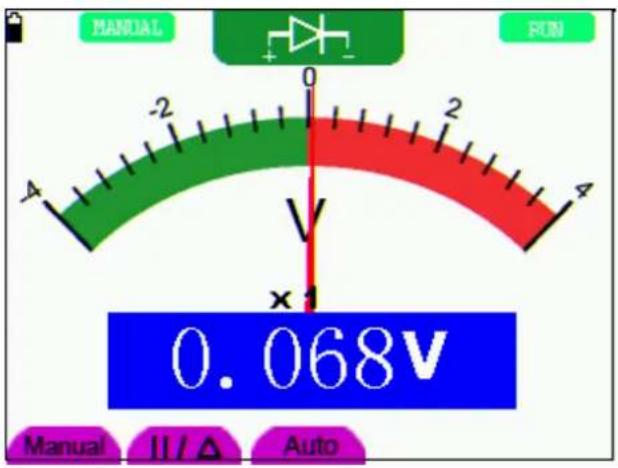
Figure 22: Diode Measurement
7.4.3 On-off Test
To perform an On-off test, do the following:
- Press the R key and R appears on the top of the screen.

- Press the SET key until the following is shown on the screen.
- Insert the black lead into the COM banana jack input and the red lead into the V/Ω/C banana jack input.
- Connect the red and black leads to the test point. If the resistance value of the tested point is less than 50 , you will hear beep sound from the test tool.
Now, you can see a screen that looks like the following figure 23.
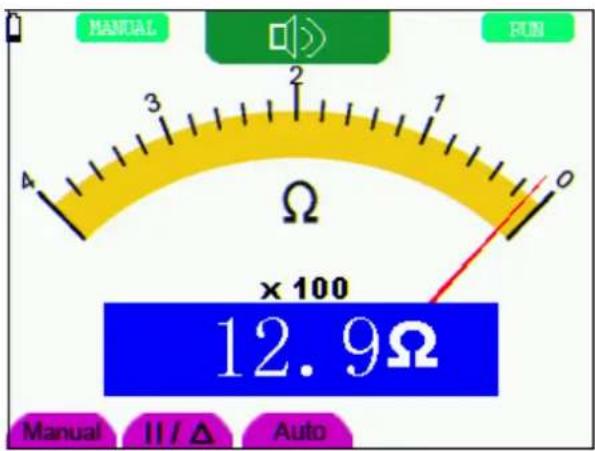
Figure 23: On-off Test
7.4.4 Measuring Capacitance
To measure a capacitance, do the following:
- Press the R key and R appears on the top of the screen
- Press the SET key until C appears at the top of the screen.
- Insert the capacitance measurer of this multimeter to COM jack and V/Ω/C jack.
- Insert the capacitance to the capacitance measurer, then screen shows the capacitance reading.
Notice: when measured value is less than 5 nF capacitance, please use relative value measuring mode to improve measuring precision. It will take about 30 seconds if capacitance measurement is larger than 40 uF.
Now, you can see a screen that looks like the following figure 24.
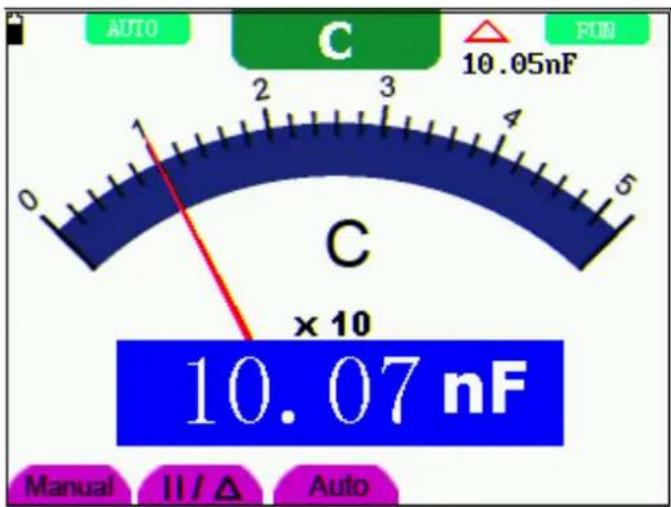
Figure 24: Capacitance Measurement
7.4.5 Measuring DC Voltage
To measure a DC voltage, do the following:
- Press the V key and DCV appears at the top of the screen.
- Insert the black lead into the COM banana jack input and the red lead into the V/Ω/C banana jack input.
- Connect the red and black leads to the measured point and the measured point voltage value is displayed on the screen.
Now, you can see a screen that looks like the following figure 25.
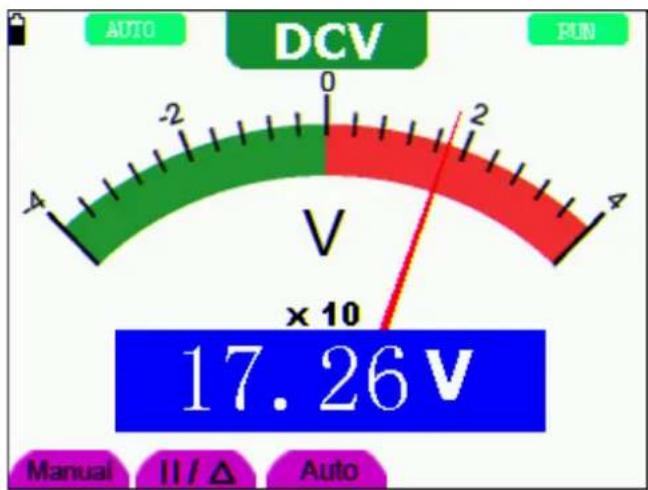
Figure 25: DC Voltage Measurement
7.4.6 Measuring AC Voltage
To measure the AC voltage, do the following:
- Press the V key and DCV appears at the top of the screen.
- Press the SET key and ACV appears at the top of the screen.
- Insert the black lead into the COM banana jack input and the red lead into the V/Ω/C banana jack input.
- Connect the red and black leads to the measured points and the AC voltage values of measured points will be displayed on the screen.
Look at the display; you can see a screen that looks like the following figure 26.
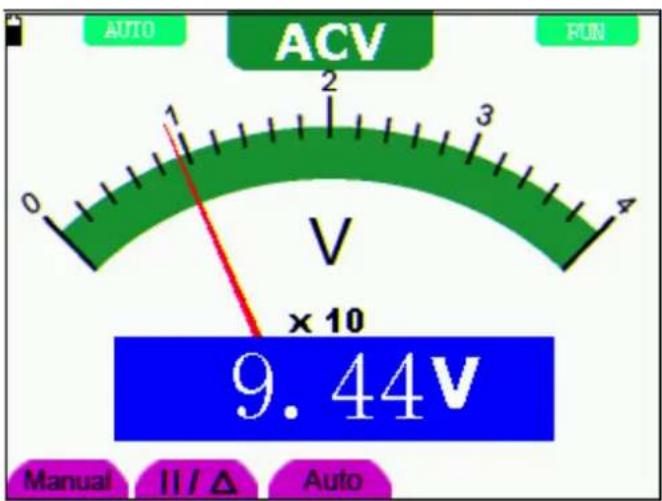
Figure 26: AC Voltage Measurement
7.4.7 Measuring DC Current
To measure a DC current which is less than 400 mA, do the following:
- Press the A key and DCA appears at the top of the screen. The unit on the main reading screen is mA. mA and 10A will display on the right bottom of screen, press F4 and F5 to switch the measurement between mA and 10A. 400mA is acquiescently.
- Insert the black lead into the COM banana jack input and the red lead into the mA banana jack input.
- Connect the red and black leads to the measured points and the DC current values of measured points will be displayed on the screen.
Look at the display; you can see a screen that looks like the following figure 27.
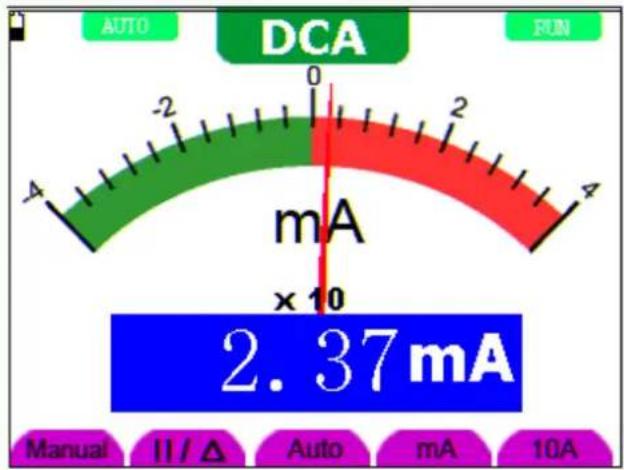
Figure 27: DC Current Measurement for 400 mA
To measure a DC current which is larger than 400 mA, do the following:
- Press the A key and DCA appears at the top of the screen. The unit on the main reading screen is mA.
- Press F5 key change to 10A measurement, the unit on the main reading screen is A.
- Insert the black lead into the COM banana jack input and the red lead into the 10A banana jack input.
- Connect the red and black leads to the measured point and the DC current value of the measured point will be displayed on the screen.
- Press F4 return to 400 mA measure.
Look at the display; you can see a screen that looks like the following figure 28.
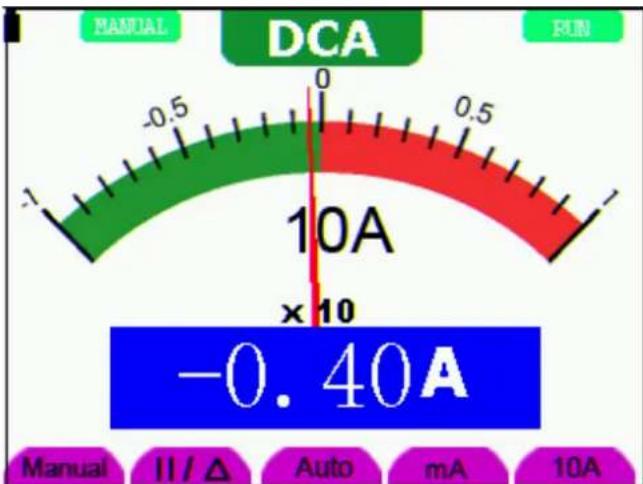
Figure 28: DC Current Measurement for 10A
7.4.8 Measuring AC Current
To measure an AC current which is less than 400 mA, do the following:
- Press the A key and DCA appears at the top of the screen. The unit on the main reading screen is mA. mA and 10A will display on the right bottom of screen, press F4 and F5 to switch the measurement between mA and 10A. 400mA is acquiescently.
- Press the SET key once and ACA is visible at the top of the screen.
- Insert the black lead into the COM banana jack input and the red lead into the mA banana jack input.
- Connect the red and black leads to the measured point and the AC current value of the measured point will be displayed on the screen.
Look at the display; you can see a screen that looks like the following figure 29.
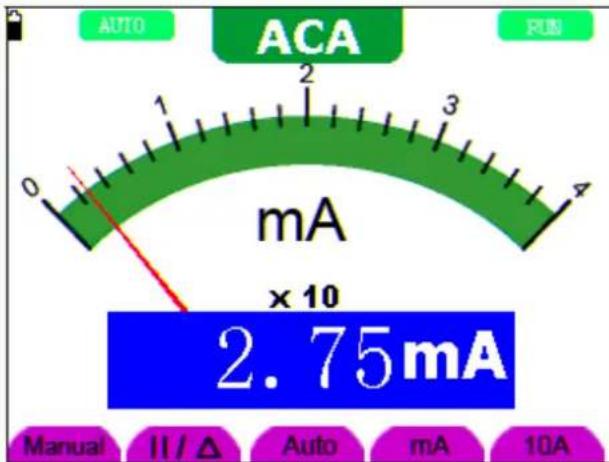
Figure 29: AC Current Measurement for 400mA
To measure an AC current which is larger than 400 mA, do the following:
- Press the A key, an instruction prompt you to plug the multimeter test leads in the right position. After check, press any key to enter into multimeter measure and DCA appears at the top of the screen. The unit on the main reading screen is mA.
- Press the SET key once and ACA is visible at the top of the screen.
- Press F5 to select 10A measure, the unit of main reading window is A.
- Insert the black lead into the COM banana jack input and the red lead into the 10A banana jack input.
- Connect the red and black leads to the measured point and the AC current value of the measured point will be displayed on the screen.
- Press F4 return to 400mA measure.
Look at the display, you can see a screen that looks like the following figure 30.
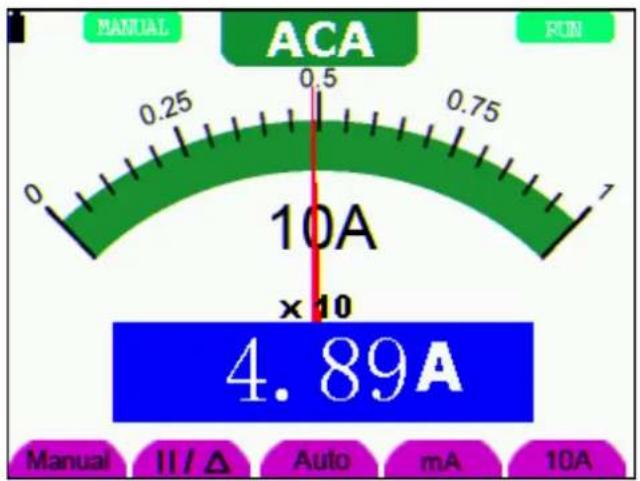
Figure 30: AC Current Measurement for 10A
7.5 Freezing the Readings
You can freeze the displayed readings at any time.
-
Press the RUN /STOP key to freeze the screen and STOP will be displayed at the top right of the screen.
-
Again, press the RUN /STOP key, you can resume your measurement.
Look at the display; you can see a screen that looks like the following figure 31.
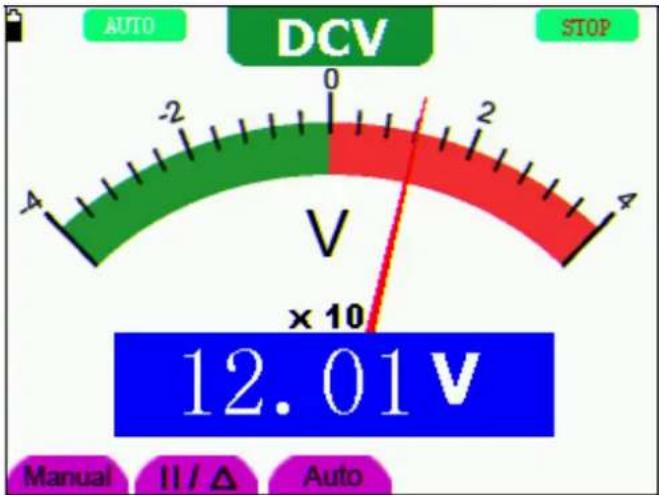
Figure 31: Freezing the Readings
7.6 Taking a Relative Measurement
A currently measured result relative to the defined reference value is displayed in a relative measurement.
The following example shows how to take a relative measurement. At first, it is required to acquire a reference value.
- Press R key and R is displayed on the top side of the screen.
- Press the SET key until C appears at the top of the screen.
- Plug capacitance extended module in capacitance measure jack.
- When the reading leveling off, press F2 key and is displayed on the top side of the screen. The saved reference value is displayed below .
- Plug capacitance, the displayed major reading on the screen is actual the capacitance value.
Look at the display; you can see a screen that looks like the following figure 32.
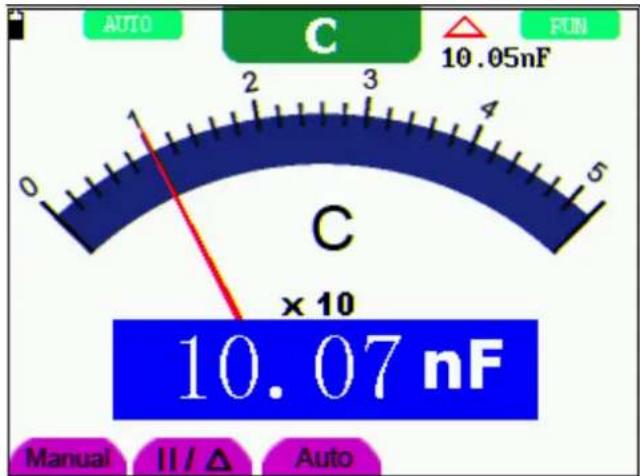
Figure 32: Relative Measurement
7.7 Selecting Automatic/ManualRange Adjustment
The defaulted range mode of the instrument is automatic range. To switch to the manual range, perform the following steps:
- Press F1 key and MANUAL is displayed on the top left side of the screen to enter the manual range mode.
- Under the manual range mode, the measuring range is increased by a stage when pressing F1 key each time, and when reaching the highest stage, it jumps to the lowest stage by pressing F1 key once again. To multiply the reading of dial pointer by multiplying power and the unit of main reading on the screen will get the measurement result.
- Press F3 key and AUTO is displayed on the top left side of the screen to switch back to the automatic range mode.
Look at the display; you can see a screen that looks like the following figure 33.
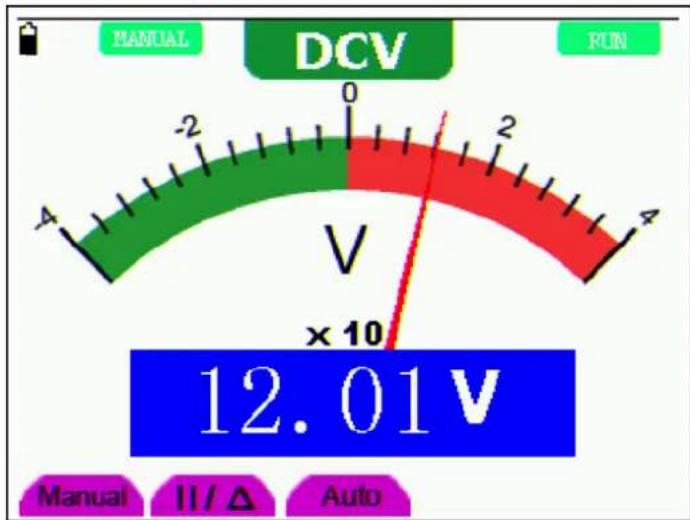
Figure 33: Automatic/Manual Range Adjustment
Attention: capacitance measurement without manual range mode.
8. Advanced Function of Oscilloscope
8.1 About this Chapter
This chapter will detail the oscilloscope function of the test tool.
8.2 Setting the Vertical CH1 and CH2
Each channel has its own independent vertical menu and each item can be set respectively based on the specific channel.
To make vertical CH1 and CH2 settings, do the following:
- Press the MENU key and the function menu appears at the right of the screen.
- Press the MENU ▲ or MENU ▼ key to jump to CH1 SETUP and 4 options appears at the bottom of the screen.
- Select key from F1 to F4 to make different settings.
Now, you can find a screen that looks like the following figure 34.
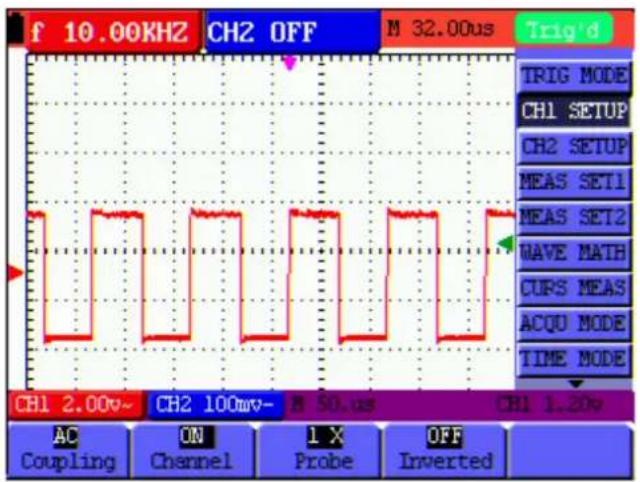
Figure 34: Setting the Vertical
The following Table describes the Vertical Channel menu:
| Function menu | Setting | Description |
| Coupling | AC | The dc component in the input signal is blocked. |
| DC | The ac and dc components of the input signal are allowed. | |
| Ground | Input signal is interrupted. | |
| Channel | OFF | Close the channel. |
| ON | Open the channel. | |
| Probe | 1 X | Select one according to the probe attenuation level to ensure a correct vertical scale reading. |
| 10 X | ||
| 100 X | ||
| 1000 X | ||
| Inverted | OFF | Waveform is displayed normally. |
| ON | Open the Invert function of the waveform setting. |
8.2.1 Setting the Channel Coupling
Take CH1 for example:
Press F1 key, set Coupling as AC to make an AC coupling setting. The DC component contained in the tested signal is blocked.
Press F1 key, set Coupling as DC to make a DC coupling setting. Both DC and AC components contained in the tested signal are permitted.
Press F1 key, set Coupling as Ground to make a Ground coupling setting. Input signal is interrupted.
The waveform is displayed as the following figure 35, figure 36, and figure 37.
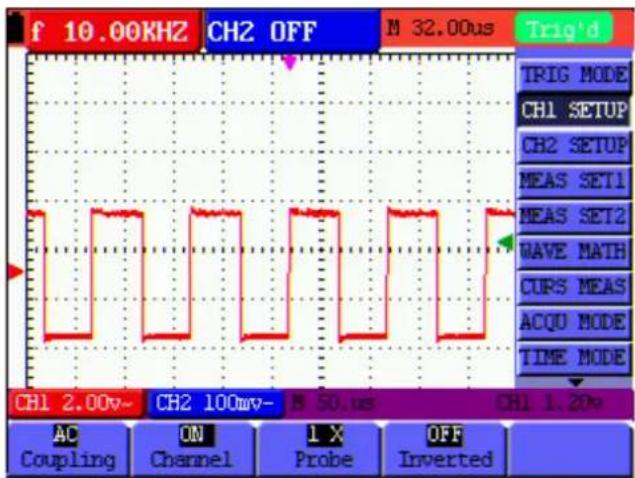
Figure 35: AC Coupling
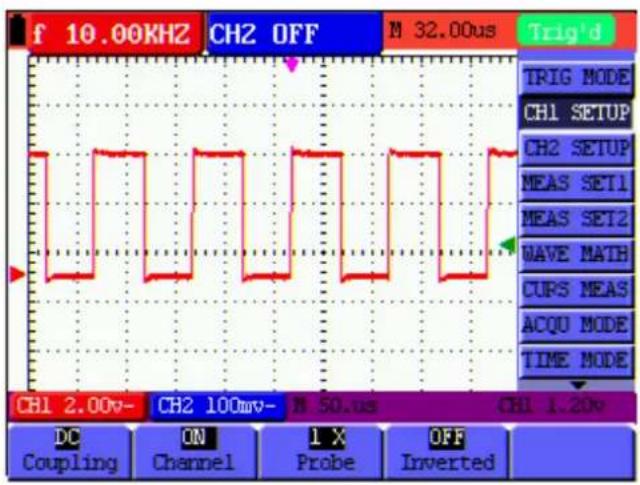
Figure 36: DC Coupling
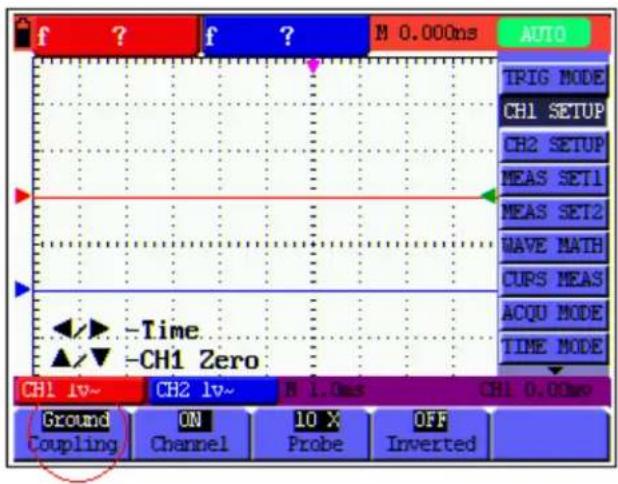
Figure 37: Ground Coupling
8.2.2 Open and Close Settings on Channel
Take CH1 for example:
Press F2 Channel key first, and then OFF to make a Close setting on CH1.
Press F2 Channel key first, and then ON to make an Open setting on CH1.
8.2.3 Setting the probe attenuation
To prevent excessive input voltage, we recommend you to set the probe attenuation level to the 10X position to prevent excessive voltage.
After attenuating the probe level by 10:1, you also need to magnify the display level by 10 X to match the displayed amplitude with the real amplitude.
Press F3 Probe to adjust the probe attenuation level.
Table: Probe attenuation level and the corresponding menu setting
| Probe attenuation level | Corresponding Menu Setting |
| 1:1 1 X | |
| 10:1 10 X | |
| 100:1 100 X | |
| 1000:1 1000 X |
8.2.4 Setting of Inverted Waveform
Inverted waveform: The displayed signal reverses 180 degrees relatively to the ground potential.
Press F4 to set Inverted as ON to start Invert; as OFF to close Invert.
8.3 Make the Math Function Menu Setting
The WAVE MATH functions in showing the result of adding, subtracting, multiplying or dividing calculation on CH1 and CH2 channel waveforms. Also, the result of arithmetic operation can be measured with grid or cursor. The amplitude of the calculated waveform can be adjusted with CHM VOL, which is displayed in the scale factor form. The amplitude ranges from 0.001 through 10 and steps in the 1-2-5 form, that is, it can be expressed as 0.001X, 0.002X, 0.005X…10X. The position of the calculated waveform can be adjusted up and down with the CHM ZERO key used.
The corresponding operation function table
| Setting Description | |
| CH1-CH2 | CH1 waveform minus CH2 waveform. |
| CH2-CH1 | CH2 waveform minus CH1 waveform |
| CH1+CH2 | Add CH1 waveform into CH2 waveform. |
| CH1*CH2 | Multiply CH1 waveform and CH2 waveform. |
| CH1/CH2 | Divide CH1 waveform by CH2 waveform |
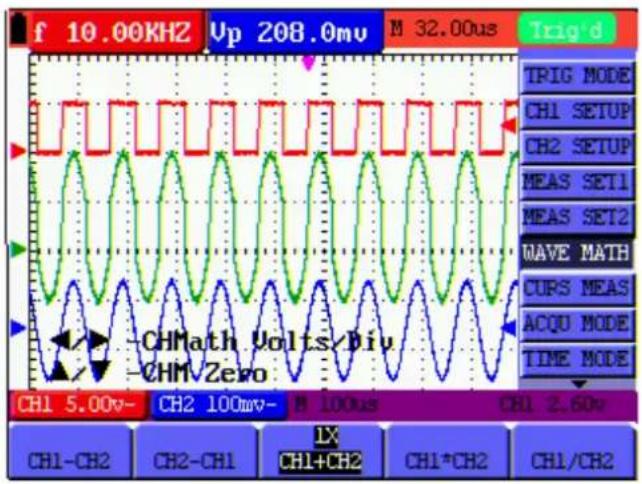
To perform the CH1+CH2 waveform calculation, do the following:
- Press the MENU key and the function menu appears at the right of the screen.
- Press the MENU ▲ or MENU ▼ key to select WAVE MATH and 5 options are displayed at the bottom of the screen.
- Press the F3 CH1+CH2 key and the obtained waveform M appears on the screen.
- Press OPTION until left bottom display as
◀/▶— CHMath Volts/Div
▲/▼— CHM Zero
Press ◀ (yellow) or ▶ (yellow) to adjust the range of M waveform
Press ▲ (yellow) or ▼ (yellow) to adjust the position of M waveform
Now, look at the display and you will find a screen that looks like the following figure 38.
line
| Signal | Time (ms) | |-----------------|-----------| | THI | 10.00 | | CHI | 5.00 | | CHM Zero | 0 | | CHM Volts/Div | 100 | | CHM Volts/Div | 2.60 | | CHI+CH2 | 32.00 | | CHI*CH2 | 32.00 | | CHI/CH2 | 32.00 |Figure 38: Waveform Mathematics
- Press the F3 key and Close the waveform M.
8.4 Setting the Trigger System
The Trigger defines the time when the acquisition of data and display of waveform. If it is set correctly, the trigger can turn an unstable display into a significant waveform.
When starting the acquisition of data, the oscilloscope collects sufficient data to draw the waveform at the left side of the triggering point. With waiting for the triggering condition, the oscilloscope is gathering data continuously. After a trigger is detected, the oscilloscope gathers enough data continuously to draw the waveform at the right side of the triggering point.
To make a trigger mode setting, do the following:
- Press the MENU key and the function menu appears at the right of the screen.
- Press the MENU ▲ or MENU ▼ key to select TRIG MODE and five options are displayed at the bottom of the screen.
- Select from F1 to F5 key to make a different setting.
- Press OPTION and left bottom display as below during edge trigger and video trigger:




Left bottom display as below during alternate trigger:

- Press ▲ (yellow) or ▼ (yellow) to adjust trigger vertical position, Press ◀ (yellow) or ▶ (yellow) to adjust time base horizontal position or adjust horizontal position.
8.5 Triggering Control
There are three trigger modes including Edge trigger, Video trigger and Alternate trigger. Each trigger mode is set by different function menu.
Edge trigger: The edge trigger type triggers on the incoming signal edge. Use the edge trigger for all signals except for video related ones.
Video trigger: Perform video field trigger or line trigger on the standard video signals.
Alternate trigger: When the signal frequency different in Channel 1 and 2, it can also guarantee the stability approaching in two channels.
The following describes Edge trigger, Video trigger and Alternating trigger menus respectively.
8.5.1 Edge Trigger
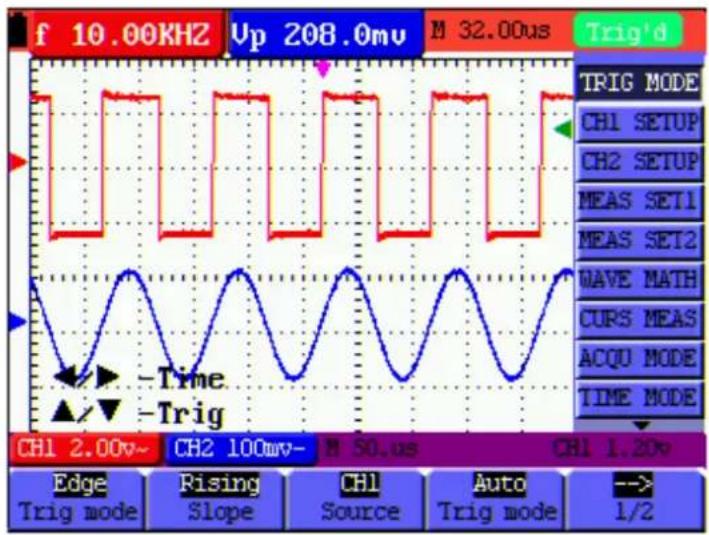
The Edge trigger is a mode by which trigger occurs at the triggering threshold value of the input signal edge. With the Edge trigger selected, the trigger happens on the rise or fall edge of the input signal, shown as the figure 39.
line
| Signal | Time (ms) | |------------|-----------| | CH1 | 2.00 | | CH2 | 100 | | CH1 | 50 | | CH2 | 32.00 | | CH1 | 1.20 | | CH2 | - | | CH1 | - | | CH2 | - | | CH1 | - | | CH2 | - | | CH1 | - | | CH2 | - | | CH1 | - | | CH2 | - | | CH1 | - | | CH2 | - | | CH1 | - | | CH2 | - | | CH1 | - | | CH3 | - | | CH4 | - | | CH5 | - | | CH6 | - | | CH7 | - | | CH8 | - | | CH9 | - | | CH10 | - | | CH11 | - | | CH12 | - | | CH13 | - | | CH14 | - | | CH15 | - | | CH16 | - | | CH17 | - | | CH18 | - | | CH19 | - | | CH20 | - | | CH21 | - | | CH22 | - | | CH23 | - | | CH24 | - | | CH25 | - | | CH26 | - | | CH27 | - | | CH28 | - | | CH29 | - | | CH30 | - | | CH31 | - | | CH32 | - | | CH33 | - | | CH34 | - | | CH35 | - | | CH36 | - | | CH37 | - | | CH38 | - | | CH39 | - | | CH40 | - | | CH41 | - | | CH42 | - | | CH43 | - | | CH44 | - | | CH45 | - | | CH46 | - | | CH47 | - | | CH48 | - | | CH49 | - | | CH50 | - | | CH51 | - | | CH52 | - | | CH53 | - | | CH54 | - | | CH55 | - | | CH56 | - | | CH57 | - | | CH58 | - | | CH59 | - | | CH60 | - | | CH61 | - | | CH62 | - | | CH63 | - | | CH64 | - | | CH65 | - | | CH66 | - | | CH67 | - | | CH68 | - | | CH69 | - | | CH70 | - | | CH71 | - | | CH72 | - | | CH73 | - | | CH74 | - | | CH75 | - | | CH76 | - | | CH77 | - | | CH78 | - | | CH79 | - | | CH80 | - | | CH81 | - | | CH82 | - | | CH83 | - | | CH84 | - | | CH85 | - | | CH86 | - | | CH87 | - | | CH88 | - | | CH89 | - | | CH90 | - | | CH91 | - | | CH92 | - | | CH93 | - | | CH94 | - | | CH95 | - | | CH96 | - | | CH97 | - | | CH98 | - | | CH99 | - | | CH100 | 2.00 |The Edge trigger menu is described in the following table.
| Function menu | Settings | Description |
| Slope | Rising | Triggering on the rise edge of the signal. |
| Falling | Triggering on the fall edge of the signal. | |
| Source | CH1 | CH1 is used as the trigger source. |
| CH2 | CH2 is used as the trigger source. | |
| Trig mode | Auto | Acquisition of waveforms is possible even if there is no triggering condition detected. |
| Normal | Acquisition of waveforms can only be done when the triggering condition is satisfied. | |
| Single | Sampling on a waveform when one trigger is detected, and then stop sampling. | |
| --->1/2 | To next menu | |
| Coupling | AC | With this mode selected, the DC component is prevented from passing-though. |
| DC | All components are allowed. | |
| HF Rjc | The HF part of the signal is prohibited and only the LF component is allowed. | |
| LF Rjc | The LF part of the signal is prohibited and only the HF component is allowed.(HDS1022M-I, HDS4202M-N have no HF and LF rejection) | |
| Holdoff | To go to holdoff menu | |
| --->2/2 | Back to previous menu | |
8.5.2 Video Trigger
The video trigger type is designed to capture the video signal format, NTSC, PAL or SECAM. For any other signal type, use the edge trigger.
Figure 40 and figure 41 is the Video Odd Field Trigger. Figure 42 and figure 43 is the Video Line trigger.
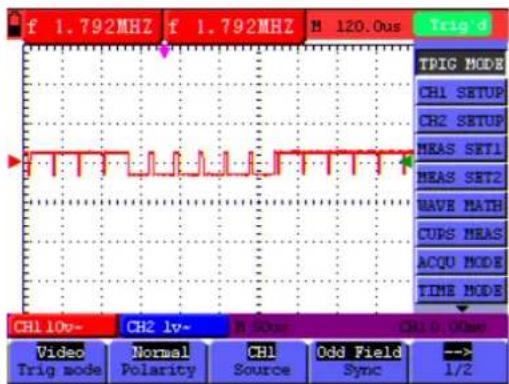
Figure 40: Video Odd Field Trigger (Page 1)
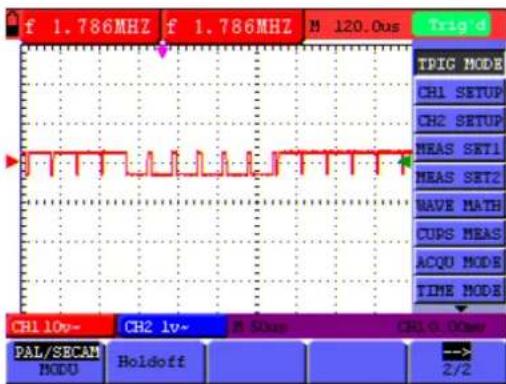
Figure 41: Video Odd Field Trigger (Page2)
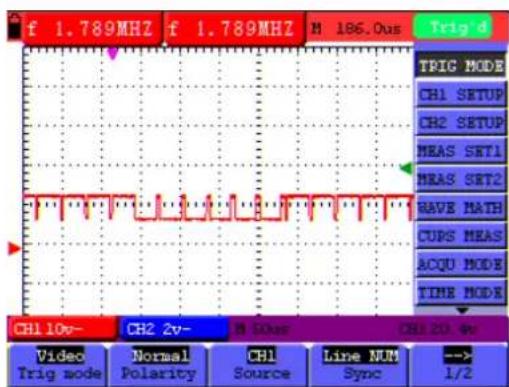
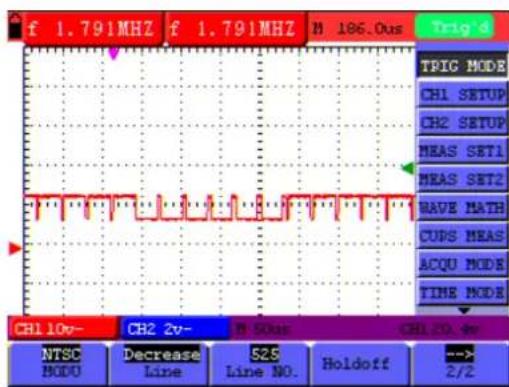
Figure 42: Video Designed Line trigger (Page1) Figure 43: Video Designed Line trigger (Page2)
The Video trigger menu is described in the following table (First page):
| Function menu | Settings | Description |
| Source | CH1 | Select CH1 as the trigger source. |
| CH2 | Select CH2 as the trigger source. | |
| Sync | Line | Make a video line trigger synchronization setting. |
| Field | Make a video field trigger synchronization setting. | |
| Odd Field | Make a video odd field trigger synchronization setting. | |
| Even Field | Make a video even field trigger synchronization setting. | |
| Line NUM | Make a video designed line synchronization setting. | |
| --> 1/2 | To next menu |
The Video triggering menu (Second page):
- When the sync is Line, Field, Odd Field, Even Field, the second page menu is shown as bellow.
| MODU | NTSCPAL/SECAM | Video format setting |
| Holdoff | To go to holdoff menu | |
| -->2/2 | Back to previous menu |
- when the sync is Line NUM, the second page menu is shown as bellow.
| MODU | NTSCPAL/SECAM | Video format setting |
| Line | IncreaseDecrease | Set the line value to increaseSet the line value to decrease |
| Line No. | Set and Show the line valve | |
| Holdoff | To go to holdoff menu | |
| -->2/2 | Back to previous menu | |
8.5.3 Alternate Trigger
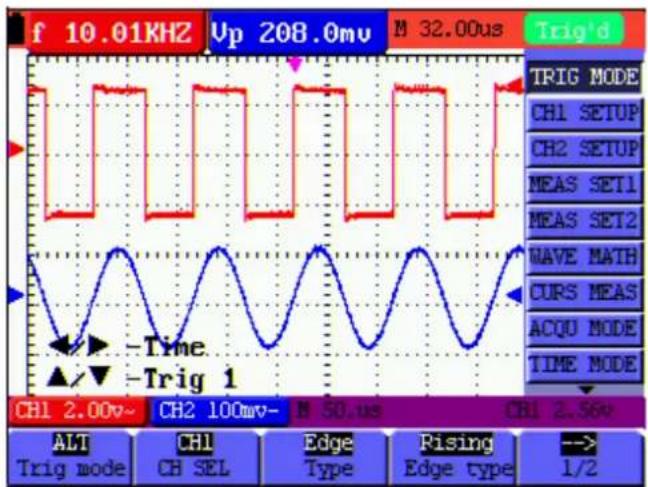
During alternate trigger, the trigger signal mainly comes from two vertical channels and it can be used to observe two irrelevant signals. You can set different trigger type for two vertical channels in this menu (optional for edge trigger and video trigger).
Now, you can see a screen that looks like the figure 44.
line
| Signal | Time (μs) | |------------|-----------| | -Time | 0 | | -Trig 1 | 208.0 |Figure 44 Alternate Trigger
The Alternate triggering menu is described in the following table.
When the type is set as Edge trigger,
| Function menu | Settings Description | |
| CH SEL | CH1 | Setting trigger type and others info for Channel 1 |
| CH2 | Setting trigger type and others info for Channel 2 | |
| Type | Edge | Set vertical channel trigger as edge trigger |
| Video | Set vertical channel trigger as video trigger | |
| Edge type | Rising | Triggering on the rise edge of the signal. |
| Falling | Triggering on the fall edge of the signal. | |
| -->1/2 | To next menu | |
| Coupling | AC | With this mode selected, the DC component is prevented from passing-though. |
| DC | All components are allowed. | |
| HF Rjc | The HF part of the signal is prohibited and only the LF component is allowed. | |
| LF Rjc | The LF part of the signal is prohibited and only the HF component is allowed.(HDS1022M-I, HDS4202M-N has no HF and LF rejection)To go to holdoff menu | |
| Holdoff | ||
| --->2/2 | Back to previous menu | |
When the type is set as video type,
| Function menu Settings | Description | |
| CH SEL | CH1CH2 | Setting trigger type and others info for Channel 1. Setting trigger type and others info for Channel 2. |
| Type | EdgeVideo | Set vertical channel trigger as edge trigger. Set vertical channel trigger as video trigger |
| Sync(Synchronization) | LineFieldOdd fieldEven fieldLine NUM | Set synchronous trigger in video line. Set synchronous trigger in video field. Set synchronous trigger in video odd line. Set synchronous trigger in video even line. Set synchronous trigger in video Line NUM |
| when the sync is Line, Field, Odd Field, Even Field, the following menu is shown as below: | ||
| MODU(Modulation) | NTSCPAL/SECAM | Set synchronization and account choose video standard Set synchronization and account choose video standard |
| Holdoff To go to holdoff menu. | ||
| when the sync is Line NUM, the following menu is shown as below: | ||
| MODU(Modulation) | NTSCPAL/SECAM | Set synchronization and account choose video standard Set synchronization and account choose video standard |
| Line | IncreaseDecrease | Set the line value to increase. Set the line value to decrease. |
| Line No. Set and Show the line valve. | ||
| Holdoff To go to holdoff menu. | ||
When you go to the holdoff menu, you can see a screen in the following figure45.
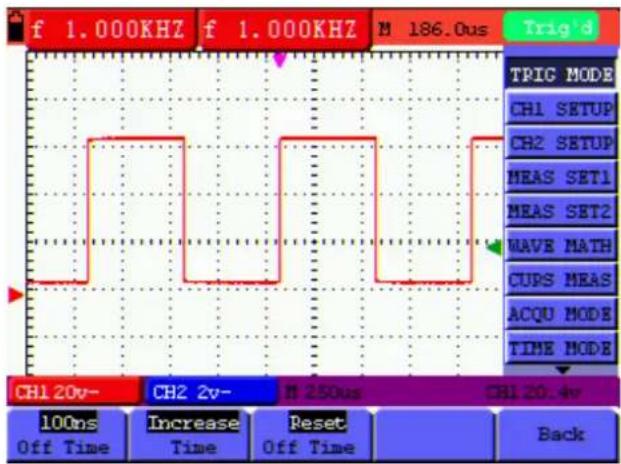
Figure 45: Trigger Holdoff
the Holdoff menu is described in the following table:
| Function menu | Settings | Description |
| Off Time | Set time slot before another trigger event. | |
| Time | Increase | Set the off time to increase. |
| Decrease | Set the off time to decrease. | |
| ResetOff Time | Reset Holdoff time to100ns. | |
| Back Back to previous | menu. | |
Note:
Trigger Holdoff can stabilize complex waveform, such as the pulse range. Holdoff time is the oscilloscope's waiting period before starting a new trigger. During Holdoff, oscilloscope will not trigger until Holdoff ends.
Term interpretation
Holdoff: Set time slot before another trigger event.
Trigger modes: There are three kinds of trigger modes available for this oscilloscope, they are, Auto (acquires signal continuously), Normal (acquires signal when trigger conditions are met) and Single (manually triggers the signal).
Automatic trigger mode: The oscilloscope can acquire the waveform without any triggering condition detected in this mode, in which it will be triggered compulsively when waiting for a specified period of time without any triggering condition ignited. When an invalid trigger is enforced, the oscilloscope can not keep the waveform in phase.
Normal trigger mode: In this mode, the oscilloscope cannot acquire the waveform until it is triggered. When there is not any trigger, the oscilloscope will display the original waveform without new waveforms captured.
Single mode: In this mode, the oscilloscope will detect a trigger and capture a waveform at each time when the customer presses the RUN/STOP key.
8.6 Setting the Acquiring Mode
The ACQU MODE menu is described in the list shown as below.
| Function menu | Settings | Description |
| Sample | The waveform data is sampled at an equal time interval. The sample mode accurately reconstructs the waveform, but cannot respond to rapid changes and sudden peaks. | |
| Peak Detect | The maximum and minimum data in the sampling interval are picked up. The peak detect mode captures rapid changes and sudden peaks, but the waveform becomes noisy. | |
| Average | Multiple samples are averaged together. The average mode reduces the noise level, but the waveform must be repetitive. | |
| Averages | 4, 16, 64 or 128 | Select the average number. |
8.7 Display Setting
The DISP SET menu is described in the following table.
| Function menu | Settings | Description |
| Type | Vectors | The vector drawing mode shows the waveform as a smooth line, connecting each data point. |
| Dots | The dot drawing mode shows the waveform as a collection of independent data points. | |
| Persist | OFF | The persistence setting sets how long the old waveforms remain in the display, useful for observing the waveform variations. |
| 1sec | ||
| 2sec | ||
| 5sec | ||
| Infinite | ||
| Format | YT | Display the relative relationship between vertical voltage and horizontal time. |
| XY | Display CH1 on the horizontal axis and CH2 on the vertical axis. | |
| Carry | Bitmap | The data transmitted in communication are bitmaps. |
| Vectors | The data transmitted in communication are vectors. | |
| Cymometer | ON | to set up cymometer limit to "ON" status. |
| OFF | to set up cymometer limit to "OFF" status. |
8.7.1 Display Style
The display style includes Vectors and Dots displays, shown as the following figure 46, figure 47.
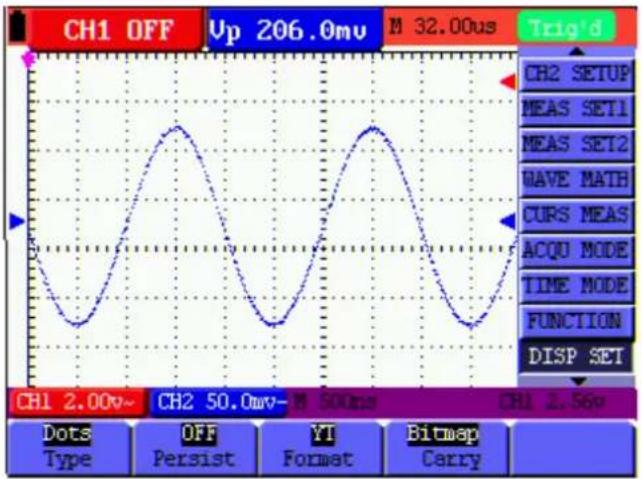
Figure 46: Dots Style
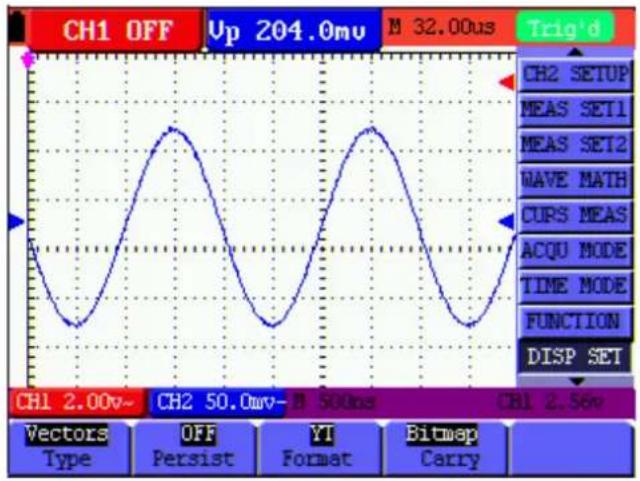
Figure 47: Vectors Style
8.7.2 Persistence
With Persist function selected, the displayed saved original data gradually decay in color and the new data are bright in color; with infinite persistence mode selected, the oscilloscope keeps all past traces of the displayed waveform.
8.7.3 XY Mode
This mode is only applicable to CH1 and CH2. The X-Y format plots the CH1 input as X-axis and CH2 input as Y-axis. This display mode is convenient for viewing the phase relationship between CH1 and CH2; when the oscilloscope is under the sampling mode in which no trigger is found, the data appear in light spots.
Operations for various control keys are shown as below:
The CH1 Volts/Div and CH1 Zero for CH1 (see "6.5.1 Setting the Vertical System" on P15) are used to set the horizontal scale and position.
The CH2 Volts/Div and CH2 Zero for CH2 (see above) are used to set the vertical scale and position continuously.
The following functions do not work in the XY display mode:
■ Reference or digital value waveform
Cursor
■ Time base control
■ Trigger control
8.7.4 Cymometer
It is a 6 digits cymometer. Its measurement range of frequency is 2Hz to full bandwidth.
Set up cymometer limit to "ON" status.
When the triggering mode is edge triggering, it is a one channel cymometer and it can only measure the frequency of the triggering channel.
When the triggering mode is alternating triggering, it is a two channel cymometer and it can measure the frequency of two channels.
To make a cymometer setting, do the following:
If you want to measure frequency of the two Channels, you can do as the follows:
-
Press MENU, the function menu will appear on the right of the screen.
-
Press MENU ▲ or MENU ▼ and choose DISP SET, five options will show at the bottom of the screen.
-
Press F5 and choose ON.
See the following figure 48:
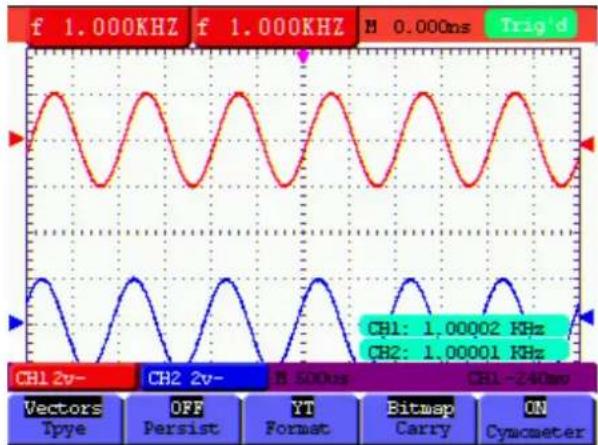
line
| Signal | Frequency (kHz) | | ---------- | --------------- | | CH1 | 1.00002 | | CH2 | 1.00001 |Figure 48 Cymometer
8.8 Waveform Saving Setups
The oscilloscope can save 4 waveforms, which can be displayed on the screen with the present waveform. The recalled waveform saved in the memory cannot be adjusted.
8.8.1 Waveform Saving Setups in normal mode
The WAVE SAVE menu is described in the following list.
| Function menu | Setups | Description |
| Source | CH1CH2Math | Make sure the waveform you want to save appears in the display. Select the displayed waveform which you want to save. |
| WAVE | A, B, C and D | Select the address for saving or recalling a waveform. |
| Save | Store the waveform of a selected signal source into the selected address. | |
| Show | ONOFF | Close or start displaying the waveforms stored in address A, B, C or D. |
To save a waveform on CH1 in address A, do the following:
- Press the MENU key and the function menu appears at the right of the screen.
- Press the MENU ▲ or MENU ▼ key to select the WAVE SAVE. Four options are displayed at the bottom of the screen.
- Press the F1 key to select the signal source CH1.
- Press the F2 key to select the address A.
- Press the F3 key to save the waveform on CH1 in address A.
To display the saved waveform on the screen, do the following:
- Press the F4 key to select ON for the address A. The waveform saved in address A will be displayed on the screen in green color.
The display color is green, and the zero point of waveform, voltage and time is purple
Now, you can see a screen that looks like the following figure 49.
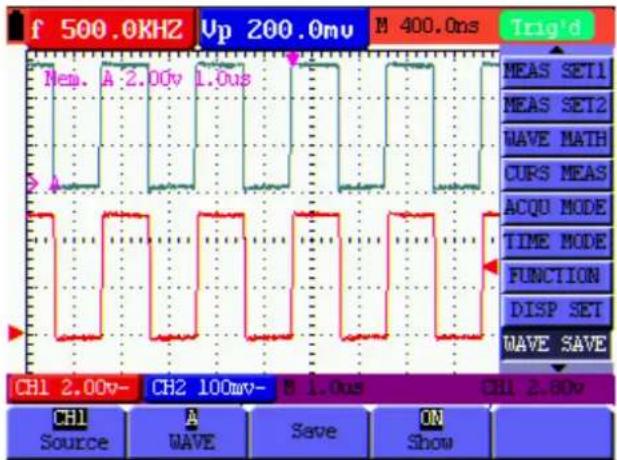
line
| Signal | Time (ms) | |--------|-----------| | CH1 | 2.00 | | CH2 | 100 | | CH3 | 2.00 |Figure 49: Waveform Saving
8.8.2 Waveform Saving Setups in FFT mode
FFT being on, the WAVE SAVE is described in the following list.
| Function menu | Setups | Description |
| Source | CH1 OFFCH2 OFFFFT | Only FFT waveform you can to save appears in the display. |
| WAVE | A, B, C and D | Select the address for saving or recalling a waveform. |
| Save | Store the waveform of a selected signal source into the selected address. | |
| Show | ONOFF | Close or start displaying the waveforms stored in address A,B,C or D. |
To save a waveform on CH1 in address A, do the following:
-
Press the MENU key and the function menu appears at the right of the screen.
-
Press the MENU ▲ or MENU ▼ key to select the WAVE SAVE. Four options are displayed at the bottom of the screen.
-
Press the F1 key to select FFT.
-
Press the F2 key to select the address A.
-
Press the F3 key to save the waveform on CH1 in address A
To display the saved waveform on the screen, do the following:
- Press the F4 key to select ON for the address A. The waveform saved in address A will be displayed on the screen in green color and the zero point of waveform, Vamp and Freq is purple.
Now, you can see a screen that looks like the following figure50
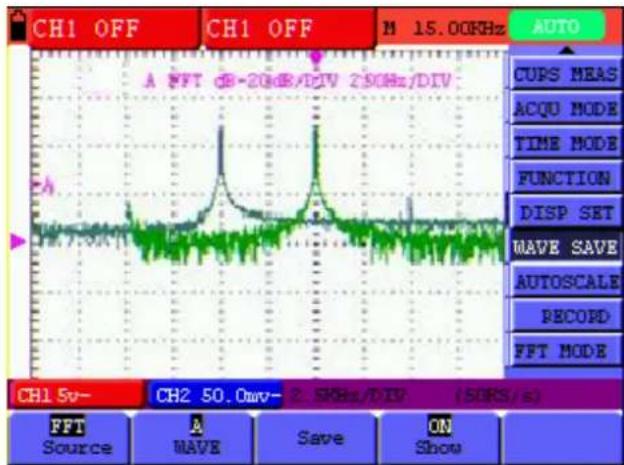
Figure 50: Waveform Saving in FFT Mode
8.9 Function Setting Menu
The FUNCTION menu is described in the following list.
| Function menu | Setting | Description |
| Recall Factory | Resume the instrument to its factory settings. | |
| Auto calibration | Perform the Auto-calibration procedure. | |
| Language | ChineseEnglishOther | Select the display language. |
Auto-calibration
The Auto-calibration function automatically configures internal parameters to maintain the accuracy. Run the Auto-calibration in the following cases:
The temperature fluctuates more than 5 degrees Celsius during operations.
Operate the oscilloscope in a new bench top or field environment.
Procedure:
- Press the MENU key and select the FUNCTION menu using MENU ▲ or MENU ▼ key.
- Press F2 (Auto calibration). A message appears on the display, asking you to remove all cables and probes from oscilloscope.
- After removing all cables, press F2 (Auto calibration) again. The Auto-calibration automatically starts and a message appears, showing that the calibration is ongoing.
To interrupt calibration, press any key during the calibration.
8.10 Making Automatic Measurements
The oscilloscope can perform 20 types automatic measurements such as frequency, cycle, average value, peak-to-peak value, root mean square value, Vmax, Vmin, Vtop, Vbase, Vamp, Overshoot, Preshoot, Rise Time, Fall Time, +Width, -Width, +Duty, -Duty, Delay A→B and Delay A→B; and gives two kinds of measurement results simultaneously on the screen.
The function menu for automatic measurements is described in the following list.
| Function menu | Settings | Description |
| Freq | CH1 | Measure the frequency of CH1. |
| CH2 | Measure the frequency of CH2. | |
| Period | CH1 | Measure the period of CH1. |
| CH2 | Measure the period of CH2. | |
| Mean | CH1 | Measure the average value of CH1. |
| CH2 | Measure the average value of CH2. | |
| PK-PK | CH1 | Measure the peak-to-peak value of CH1. |
| CH2 | Measure the peak-to-peak value of CH2. | |
| Cyc RMS | CH1 | Measure Root Mean Square (RMS) value of CH1. |
| CH2 | Measure Root Mean Square (RMS) value of CH2. | |
| Vmax | CH1 | Measure the Vmax of CH1 |
| CH2 | Measure the Vmax of CH2 | |
| Vmin | CH1 | Measure the Vmin of CH1 |
| CH2 | Measure the Vmin of CH2 | |
| Vtop | CH1 | Measure the Vtop of CH1 |
| CH2 | Measure the Vtop of CH2 | |
| Vbase | CH1 | Measure the Vbase of CH1 |
| CH2 | Measure the Vbase of CH2 | |
| Vamp | CH1 | Measure the Vamp of CH1 |
| CH2 | Measure the Vamp of CH2 | |
| Overshoot | CH1 | Measure the Overshoot of CH1 |
| CH2 | Measure the Overshoot of CH2 | |
| Preshoot | CH1 | Measure the Preshoot of CH1 |
| CH2 | Measure the Preshoot of CH2 | |
| Rise Time | CH1 | Measure the Rise Time of CH1 |
| CH2 | Measure the Rise Time of CH2 | |
| Fall Time | CH1 | Measure the Fall Time of CH1 |
| CH2 | Measure the Fall Time of CH2 | |
| +Width | CH1 | Measure the +Width of CH1 |
| CH2 | Measure the +Width of CH2 | |
| -Width | CH1 | Measure the -Width of CH1 |
| CH2 | Measure the -Width of CH2 | |
| +Duty | CH1 | Measure the +Duty of CH1 |
| CH2 | Measure the +Duty of CH2 | |
| -Duty | CH1 | Measure the -Duty of CH1 |
| CH2 | Measure the -Duty of CH2 | |
| Delay A→B | CH1 | Measure the Delay A→B of CH1 |
| CH2 | Measure the Delay A→B of CH2 | |
| Delay A→B | CH1 | Measure the Delay A→B of CH1 |
| CH2 | Measure the Delay A→B of CH2 |
To measure the frequency of CH1 with Measurement 1 and the peak-to-peak value of CH2 with Measurement 2, do the following:
- Press the MENU key and the function menu is shown at the right of the screen.
- Press the MENU ▲ or MENU ▼ key to select MEAS SET 1. Five options appear at the bottom of the screen.
-
Press the F1 key to select the frequency measurement as CH1. The measurement window on the screen turns into one red in color and shows the frequency of CH1.
-
Press the MENU ▲ or MENU ▼ key to select MEAS SET 2. Five options appear at the bottom of the screen.
- Press the F4 key to jump to the PK-PK measurement as CH2. The measurement window on the screen turns into one blue in color and shows the peak-to-peak value of CH2.
Now, you can see a screen that looks like the following figure 51.
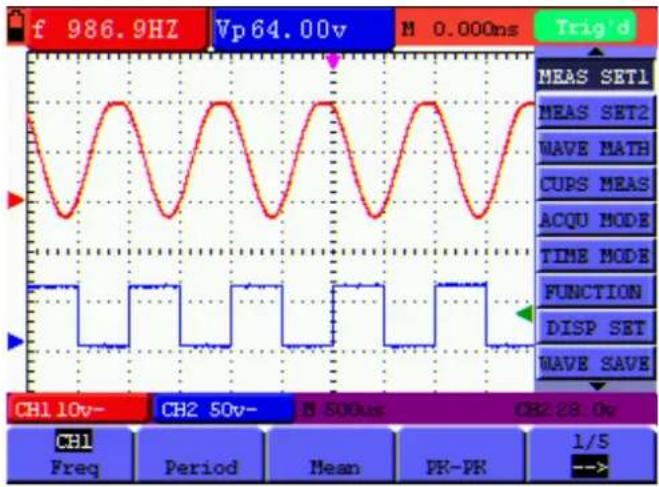
line
| Parameter | Value | | --------------- | --------- | | CH1 Freq | 986.9HZ | | CH2 50v | 64.00V | | CH2 28.0v | 28.00V | | CH1 Freq | 986.9HZ | | CH2 50v | 64.00V | | CH2 28.0v | 28.00V | | CH1 Freq | 986.9HZ | | CH2 50v | 64.00V | | CH2 28.0v | | CH1 Freq | 986.9HZ | | CH2 50v | 64.00V | | CH2 28.0v | 28.00V | | CH1 Freq | 986.9HZ | | CH2 50v | 64.00V | | CH2 28.0v (approx) | 28.00V |Figure 51: Automatic Measurements
8.11 Setting the Cursor Measurements
This oscilloscope allows you to make manual cursor measurements on time and voltage. The signal sources include Channel 1(CH1), Channel 2 (CH2).
8.11.1 Setting the cursor measurement in normal mode
The cursor measurement menus are listed and described in the following table.
| Function menus | Settings Description | |
| Type | OFFVoltageTime | Close the cursor measurement.Display the voltage measurement cursor and menu.Display the time measurement cursor and menu. |
| Source CH1, | CH2. | Select the waveform channel on which the cursor measurement will be performed. |
| Delta | Display the difference of measured value between the two channels | |
| Cur1 | Display the relating measured value of Cursor 1 | |
| Cur2 | Display the relating measured value of Cursor 2 |
To make a voltage measurement on CH1, doing the following:
-
Press the MENU key and the function menus are displayed at the right of the screen.
-
Press the MENU ▲ or MENU ▼ key to select CURS MEAS. Five options are shown at the bottom of the screen.
-
Press F1 key to select the measurement type Voltage. Two purple crossing dashed lines V1 and V2 are shown on the screen.
-
Press the F2 key to select the measured channel CH1.
-
Press OPTION and display as
◀/▶—Cursor 1
▲/▼—Cursor 2
When setting OPTION ▲ or OPTION ▼, V2 will move up and down and the relating voltage value to the zero position of Channel 1 will show at the bottom of the screen. Setting OPTION ◀ or OPTION ▶, V1 will move up and down and the relating voltage value to the zero position of Channel 1 will show at the bottom of the screen, at the same time the increment shows the absolute value of V1-V2 shown as Fig 52:
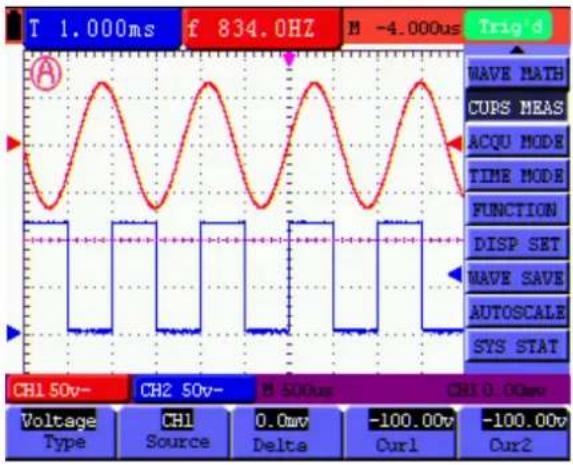
Figure 52: Use the Cursor for a Voltage Measurement
When log out submenu, every value will show on the right bottom of the screen as figure 53:
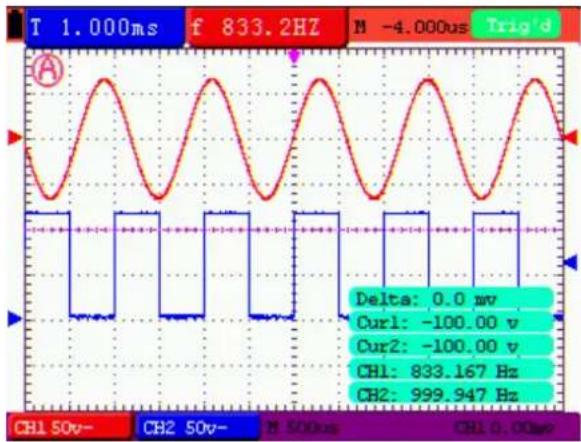
line
| Parameter | Value | | --------- | ------------ | | Delta | 0.0 mv | | Cur1 | -100.00 v | | Cur2 | -100.00 v | | CH1 | 833.167 Hz | | CH2 | 999.947 Hz |Figure 53
To use the cursor for a time measurement on CH1, do the following:
- Press the MENU key and the function menus are displayed at the right of the screen.
- Press the MENU ▲ or MENU ▼ key to select CURS MEAS.
- Press the F1 key to select the measurement type as Time. Two vertical dashed lines T1 and T2 appear on the screen.
- Press the F2 key and jump to the measured channel CH1.
- Press OPTION and display as


Press ▲(yellow) or ▼(yellow) and see T1 move left and right and LCD display the time value match T1 to point position in panel; press ◀(yellow) or ▶(yellow) and see T2 move left and right and LCD display the time value match T2 to point position in panel.
Now, you can see a screen that looks like the following figure 54.
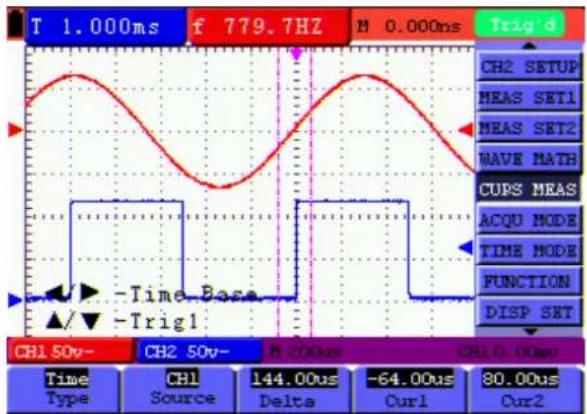
line
| Time Type | CH1 Source | CH2 Setup | ΔDelta | ΔCurs | ΔCQU MODE | ΔCQU MODE | ΔCQU MODE | |-----------|------------|----------|--------|-------|-----------|-----------|-----------| | CH1 | - | - | - | - | - | - | - | | CH2 | - | - | - | - | - | - | - | | Δ | - | - | - | - | - | - | - | | Δ | - | - | - | - | - | - | - | | Δ | - | - | - | - | - | - | - | | Δ | - | - | - | - | - | - | - | | Δ (Time Base) | - | - | - | - | - | - | - | | Δ (Time Base) | - | - | - | - | - | - | - | | Δ (Time Base) | - | - | - | - | - | - | - | | Δ (Time Base) | - | - | - | - | - | - | - |Figure 54: Cursor time measurement
When log out submenu, every value will show on the right bottom of the screen as figure 55:
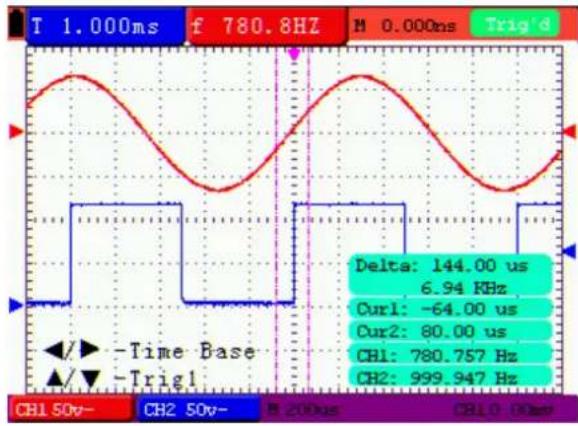
line
| Parameter | Value | | --------------- | --------- | | Delta | 144.00 us | | Curl | -64.00 us | | Cur1 | 80.00 us | | CH1 | 780.757 Hz| | CH2 | 999.947 Hz|Figure 55: Use the Cursor for a Time Measurement
8.11.2 Setting the cursor measurement in FFT mode
FFT being on, the cursor measurement menus are listed and described in the following table.
| Function menus | Settings Description | |
| Type | OFFRangeFrequency | Close the cursor measurement.Display the vamp measurement cursor and menu.Display the freq measurement cursor and menu. |
| Source | CH1, CH2 | Display the selected source in the FFT MODE menu, unable to change here. |
| Delta | Display the difference of measured value between the two channels | |
| Curs1 | Display the relating measure of Cursor 1 | |
| Curs2 | Display the relating measure of Cursor 2 | |
To make a range measurement on CH1, doing the following:
- Press the MENU key and the function menus are displayed at the right of the screen.
- Press the MENU ▲ or MENU ▼ key to select CURS MEAS. Five options are shown at the bottom of the screen.
- Press F1 key to select the measurement type Range. Two purple crossing dashed lines V1 and V2 are shown on the screen.
- The channel which FFT operates is the measured channel CH1.
- Press OPTION and display as
▲/▼—Cursor 2
Press ▲ (yellow) or ▼ (yellow) to see V1 move up and down and the panel will display the voltage value match V1 and Channel 1 Zero; Press ◀ (yellow) or ▶ (yellow) to see V2 move up and down and panel will display the voltage value match V2 to Channel 1 Zero. LCD panel also displays the absolute value of V1-V2.
Now, you can see a screen that looks like the following figure 56.
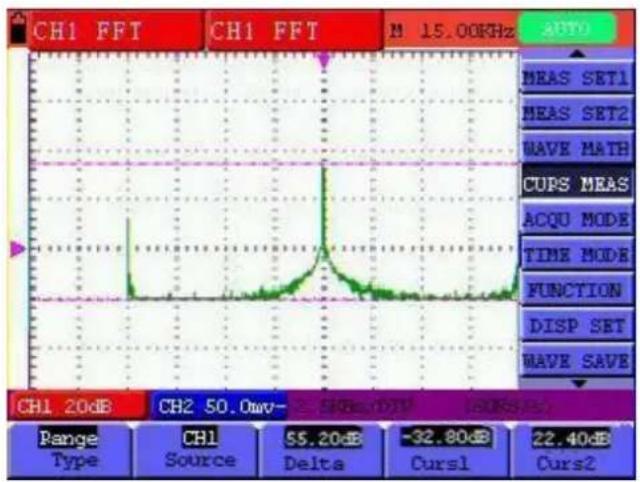
line
| Metric | Value | | ---------------- | --------- | | CH1 FFT | 20dB | | CH2 50.0μW | 50.0μW | | CH1 Source | 55.20dB | | CH1 Delta | Delta | | CH1 Delta | -32.80dB | | CH1 Delta | -32.80dB | | CH1 Delta | -32.80dB | | CH1 Delta | -32.80dB | | CH1 Delta | -32.80dB | | CH1 Delta | -32.80dB | | CH1 Delta | -32.80dB | | CH1 Delta | -36.0μW | | CH1 Delta | -36.0μW | | CH1 Delta | -36.0μW | | CH1 Delta | -36.0μW | | CH1 Delta | -36.0μW | | CH1 Delta | -36.0μW | | CH1 Delta | -36.0μW | | CH1 Delta | -32.40dB | | CH1 Delta | -32.40dB | | CH1 Delta | -32.40dB | | CH1 Delta | -32.40dB | | CH1 Delta | -32.40dB | | CH1 Delta | -32.40dB | | CH1 Delta | -32.40dB | | CH1 Delta | -36.0μW | | CH1 Delta | -36.0μW | | CH1 Delta | -36.0μW | | CH1 Delta | -36.0μW | | CH1 Delta | -36.0μW | | CH1 Delta | -36.0μW | | CH1 Delta (Curs1)| -32.80dB | | CH1 Delta (Curs1)| -32.80dB | | CH1 Delta (Curs1)| -32.80dB | | CH1 Delta (Curs1)| -32.80dB | | CH1 Delta (Curs1)| -32.80dB | | CH1 Delta (Curs1)| -32.80dB | | CH1 Delta (Curs2)| -32.40dB | | CH1 Delta (Curs2)| -32.40dB | | CH1 Delta (Curs2)| -32.40dB | | CH1 Delta (Curs2)| -32.40dB | | CH1 Delta (Curs2)| -32.40dB | | CH1 Delta (Curs2)| -36.0μW | | CH1 Delta (Curs2)| -36.0μW | | CH1 Delta (Curs2)| -36.0μW | | CH1 Delta (Curs2)| -36.0μW | | CH1 Delta (Curs2)| -36.0μW | | CH1 Delta (Curs2)| -36.0μW |Figure 56: Cursor range measurement
8.12 Autoscale
The function is applied to follow-up signals automatically even if the signals change at any time. Autoscale enables the instrument to set up trigger mode, voltage division and time scale automatically according to the type, amplitude and frequency of the signals.
The menu is as follows:
| Function menus | Settings Description | |
| Autoscale | OFFON | Turn off AutoscaleTurn on Autoscale |
| Mode | HorizontalVerticalHORI—VERT | Only adjust vertical scale according to input signal.Only adjust horizontal scale according to input signal.Adjust both vertical and horizontal scales according to input signal.Display only one or two cycles in waveform. |
 | Display Multi-cycles in waveform. | |
If you want to measure voltage of Channel 1, you can do as the follows:
- Press MENU, the function menu will appear on the right of the screen.
- Press MENU ▲ or MENU ▼ and choose AUTOSCALE, three options will show at the bottom of the screen.
- Press F1 and choose ON.
- Press F2 and choose HORI-VERT.
- Press F3 and displays on the screen as figure 57:
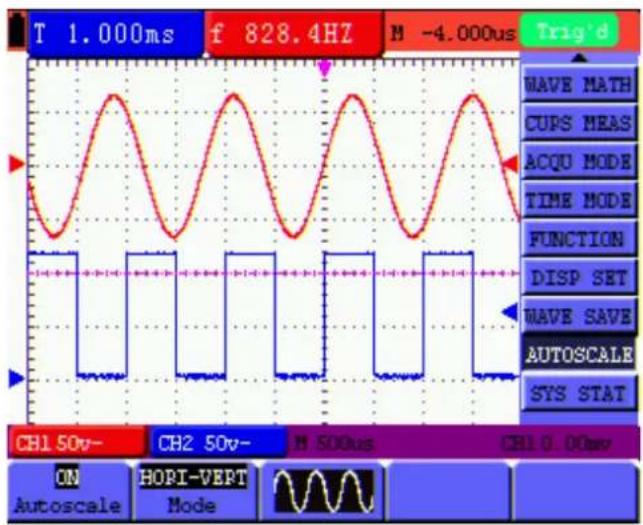
line
| Wave Type | Time (ms) | | --------------- | --------- | | CH1 50v- | 1.000 | | CH2 50v- | 828.4 | | N 500us | 828.4 | | CH1 0.00uv | 1.000 |Figure 57: Autoscale Horizontal- Vertical multi-period waveforms
Note: Things you should be ware when turning on Autoscale.
- The symbol is flickering on the top left corner of screen every half second.
- The oscilloscope is setting Triggers automatically for the incoming signal based on its best approach. Access from front panel to trigger controls is disabled. A warning message will be displayed on the bottom left corner of the screen when trying to change submenus of Trigger controls.
- If the display mode is in XY and STOP is turned on, pressing AUTO SET to enter into Autoscale. The oscilloscope will be set to YT mode and ATUO triggering.
- Oscilloscope is set as DC coupling with AUTO Triggering. A warning message is displayed when trying to change these settings.
- The oscilloscope will turn off Autoscale if user is trying to adjust vertical position, voltage
division, trigger level or time scale for CH1 or CH2. To back to Autoscale, Press AUTOSET.
- The oscilloscope is always on main time base.
- The oscilloscope is turned into Peak Detection mode if it is in Average mode.
- When video triggering, the horizontal time scale is 50us. If one channel is showing edge signal, the other channel is showing video one, the time scale refers to 50us as video one as standard.
8.13 Record
Waveform record: The function provides you to set the time interval between the frames and record the waveform up to 1000 numbers and get the better analysis effect more than before through Playback and Save functions.
Four record modes: Record, Play back, Storage, OFF.
Record: Record the waveforms up until the set number of frames at specified time intervals.
Record menu list:
| Menu Setting Instruction | ||
| Mode | Record | Select record mode. |
| Play back | Select play back mode. | |
| Storage | Select storage mode. | |
| OFF | Turn off all recorder functions. | |
| End frame 1-1000 | Set number of record frames. | |
| Operate | Play | Press to start recording. |
| Stop | Press to stop recording. | |
| Interval | 1 ms - 1000s | Set time interval between record frames. |
| 1/2 | To next menu | |
| Refreshed | ON | The waveforms are in the state of refreshing when recording. |
| OFF | The waveforms stop refreshing when recording. | |
| Direction | Increase | The value increases from that of end frame to time interval |
| Decrease | The value decreases from that of end frame to time interval | |
| 1/2 | Back to previous menu. | |
Note: Both the waveforms are recorded at record mode. If one channel is off when recording, the channel data is not available at Playback mode.
Play back: Play back the recorded waveforms.
Play back menu list:
| Menu Setting Instruction | ||
| Play mode | LoopSingle | Set repeat play mode.Set single time play mode. |
| Operate | PlayStop | Press to start playback.Press to stop playing. |
| Interval | 1ms-20s | Set up interval value between frames. |
| 1/2 | To next menu | |
| Start Frame | 1-1000 | Set start frame. |
| Cur frame 1- | 1000 | Select current frame to be played. |
| End frame | 1-1000 | Set End frame. |
| Direction | IncreaseDecrease | The value increases at the mode of setting start frame, cur frame and end frameThe value decreases at the mode of setting start frame, cur frame and end frame |
| 2/2 | Back | to previous menu. |
Note: the Run/Stop button can also replay or continue the waveform display.
Storage: Store recorded waveforms in non-volatile memory according to the setup frames.
Storage menu list:
| Menu Setting Instruction | ||
| Start Frame | 1-1000 | Set first frame to be saved. |
| End frame | 1-1000 | Set last frame to be saved. |
| Direction | IncreaseDecrease | The value increases from the set start frame to the end frameThe value decreases from the set start frame to the end frame |
| --> 1/2 | To next menu | |
| Save | Save recorded waveform to internal memory location. | |
| Load | Recall recorded waveform from internal memory location. | |
| 2/2 | Back to previous menu. |
Record the waveform as follows:
- Press the MENU key and the function menu appears at the right of the screen.
- Press the MENU ▲ or MENU ▼ key to select RECORD and five options are displayed at the bottom of the screen.
- Press the F1 key to select the Record mode.
- Press F2 and set the End frame at 300 (select the direction as Increase or Decrease in the second menu before step4).
- Press F4 and set the time Interval to 1.00ms.
- Press F5 to enter into the second menu.
- Press F1 and select OFF to stop refreshing waveforms.
- Press F5 to back up to the first menu.
- Press F3 and select Play to operate.
Shown as Fig.58 and Fig.59
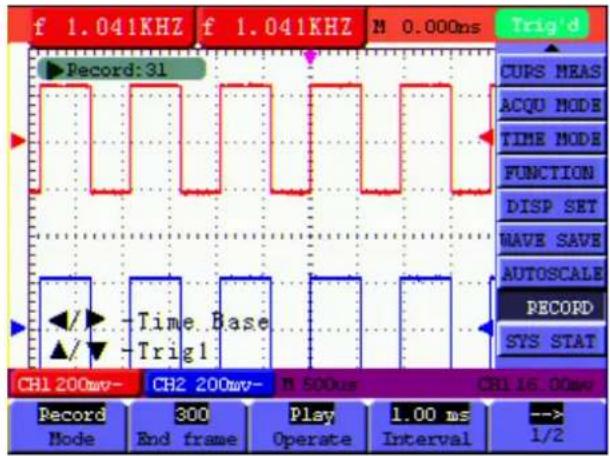
Fig.58: the first page of the record
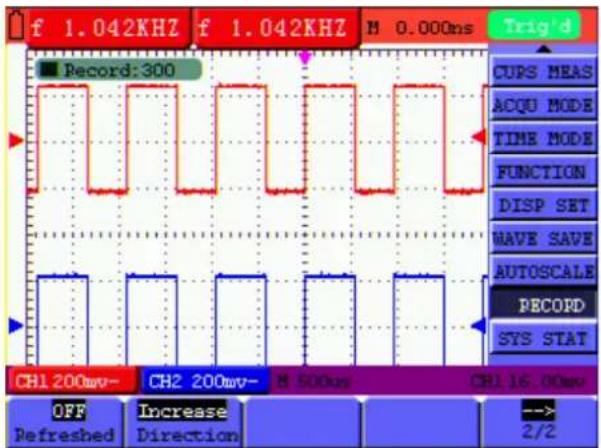
line
| Signal | Value | |--------|-------| | CH1 200wt- | 300 | | CH2 200wt- | 300 | | M 500wt | 300 | | CH1 16.00wt | 300 |Fig.59: the second page of the record
8.14 Using FFT
An FFT breaks down signals into component frequencies, which the oscilloscope uses to display a graph of the frequency domain of a signal, as opposed to the oscilloscope's standard time domain graph. You can match these frequencies with known system frequencies, such as system clocks, oscillators, or power supplies.
FFT in this oscilloscope can transform 2048 points of the time-domain signal into its frequency components and the final frequency contains 1024 points ranging from 0Hz to Nyquist frequency.
The following table describes the FFT menu:
| Function Menu Setting Instruction | ||
| FFT | ON | Turn on FFT function |
| OFF | Turn off FFT function | |
| Source | CH1 | Select CH1 as FFT source |
| CH2 | Select CH2 as FFT source | |
| Window | Rectangle | Select window for FFT. |
| Blackman | ||
| Hanning | ||
| Hamming | ||
| Format | dB | Set Vrms as vertical scale unit |
| Vrms | Set dBVrms as vertical scale unit | |
| Zoom | ×1 | Set multiple ×1 |
| ×2 | Set multiple ×2 | |
| ×5 | Set multiple ×5 | |
| ×10 | Set multiple ×10 | |
Taking the FFT operation for example, the operation steps are as follows:
- Press MENU key and the function menu appear on the right side of the screen.
- Press MENU ▲ or MENU ▼ key to select FFT MODE. Five items selectable are available
at the bottom of the screen.
- Press F1 to set ON. The green waveform F is shown in the screen after calculation.
- Press F2 to switch between channel CH1 and CH2 and the current status of channel shows on the top left.
- Press F3 to switch over Window including Hamming, Rectangle, Blackman and Hanning.
- Press F4 to switch over Format dB and Vrms.
- Press F5 to zoom in or out the waveform, the magnification includes ×1 , ×2 , ×5 , ×10 .
- ① If the FFT source is CH1, press VOLTS POSITION (red),
- One of the following three prompts circularly will show at the bottom-left of the screen when the format is dB.
▲/▼—CH1 Volts/Div
▲/▼ — FFT Zero
▲/▼ — FFT dB Scale
- One of the following two prompts circularly will display at the bottom-left of the screen when the format is Vrms.
▲/▼—CH1 Volts/Div
▲/▼ — FFT Zero
Press VOLTS POSITION (blue) and the screen show as follows:
▲/▼ — CH2 OFF
② If FFT source is CH2, press VOLTS POSITION (blue),
- One of the following three prompts circularly will display at the bottom-left of the screen when the format is dB.
▲/▼—CH2 Volts/Div
▲/▼ — FFT Zero
▲/▼ — FFT dB Scale
- One of the following two prompts circularly will display at the bottom-left of the screen when the format is Vrms.
▲/▼—CH2 Volts/Div
▲/▼ — FFT Zero
Press VOLTS POSITION (red) and the screen show as follows:
▲/▼—CH1 OFF
-
When FFT source is CH1:
-
If left bottom of the screen displays "▲/▼—FFT dB Scale", press ▲(red) and ▼(red) button to adjust dB value of each DIV, including 1dB, 2dB, 5dB, 10dB, 20dB;
- If left bottom of the screen displays "▲/▼—CH1 Volts/Div", press ▲(red) and ▼(red) button to adjust voltage of CH1, and "CH1 2v\~" shows in left bottom of the screen;
- If left bottom of the screen displays "▲/▼—FFT Zero", press ▲ (red) and ▼ (red) button to adjust the position of the waveform along the vertical position such as "FFT 1.20 divs" which means the pink cursor departures from the center line for 1.20 DIV, press VOLTS POSITION (red) to display "▲/▼—FFT dB Scale ", "CH1 20dB" shows on the left bottom, that is the arithmetic product is 24.0dB.
The operation steps are the same as FFT source CH2.
- Press OPTION (yellow), the following prompts shows on the left bottom on the screen.
◀/▶— Time Base
▲/▼—Trig
Or
◀/▶— Time
▲/▼—Trig
When "◀/▶— Time" is displayed, press OPTION ◀ and OPTION ▶ menu
button to adjust the position of the waveform along the horizontal position. "FFT
-2.00divs" shown on the left bottom means the section start of the waveform
departures from the Origin for 2.00DIV. The shown frequency of M is the exact
frequency of the cursor point in the middle of spectrum. Shown as Figure.60.
When "◀/▶— Time Base" is displayed, press OPTION ◀ and OPTION ▶ to
adjust horizontal base on horizontal base, such as "250Hz/DIV (5KS/s)" will be
shown on the bottom status bar.
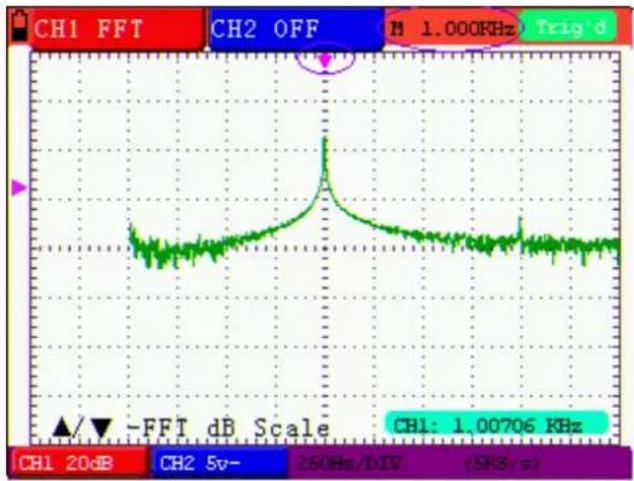
line
| Frequency (kHz) | Amplitude | | --------------- | --------- | | 1.00706 | Peak |Figure 60 The Shown Frequency of M
Selecting an FFT Window
■ The FFT feature provides four windows. Each is a trade-off between frequency resolution and magnitude accuracy. What you want to measure and your source signal characteristics help determine which window to use. Use the following guidelines to select the best window.
| Type | Description | Window |
| Rectangle | This is the best type of window for resolving frequencies that are very close to the same value but worst for accurately measuring the amplitude of those frequencies. It is the best type for measuring the frequency spectrum of nonrepetitive signals and measuring frequency components near DC.Use rectangle for measuring transients or bursts where the signal level before and after the event are nearly equal. Also, use this window for equal-amplitude sine waves with frequencies that are very close and for broadband random noise with a relatively slow varying spectrum. |  |
| Hamming | This is a very good window for resolving frequencies that are very close to the same value with somewhat improved amplitude accuracy over the rectangle window. It has a slightly better frequency resolution than the Hanning.Use Hamming for measuring sine, periodic and narrow band random noise. This window works on transients or bursts where the signal levels before and after the event are significantly different. | 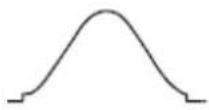 |
| Hanning | This is a very good window for measuring amplitude accuracy but less so for resolving frequencies.Use Hanning for measuring sine, periodic and narrow band random noise. This window works on transients or bursts where the signal levels before and after the event are significantly different. | 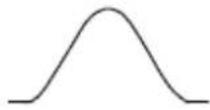 |
| Blackman | This is the best window for measuring the amplitude of frequencies but worst at resolving frequencies.Use Blackman-Harris for measuring predominantly single frequency waveforms to look for higher order harmonics. | 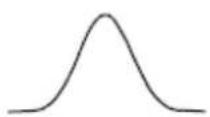 |
Fig 61, 62, 63, 64 show four kinds of window function referring to sine wave of 1 kHz.
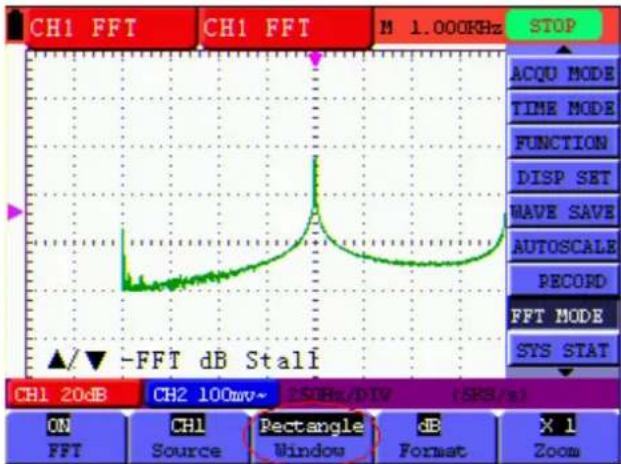
line
| Time (s) | Amplitude (dB) | |----------|----------------| | 0 | -FFT | | 1.000 | 1.000 |Fig 61: Rectangle window
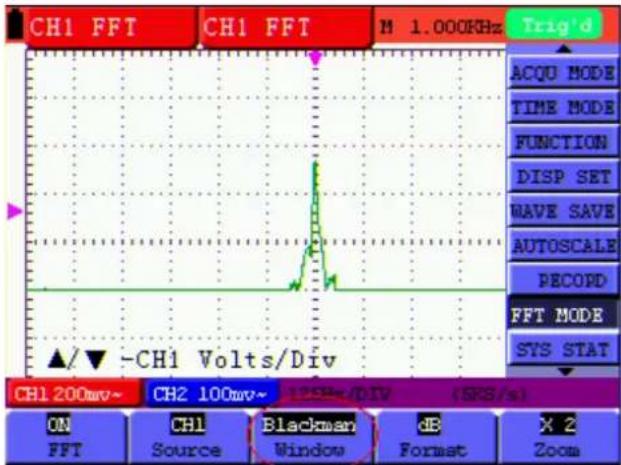
line
| Measurement | Value | |-------------|-----------| | CH1 FFT | -CH1 Volts/Div | | CH2 100mv~ | 1.000KHz |Fig 62: Blackman window
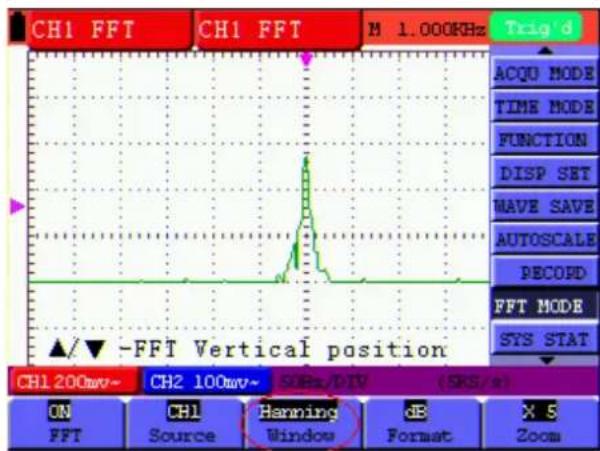
line
| Metric | Value | | ---------------- | --------- | | ACQU MODE | 1.000KHz | | TIME MODE | 1.000KHz | | FUNCTION | 1.000KHz | | DISP SET | 1.000KHz | | WAVE SAVE | 1.000KHz | | AUTOSCALE | 1.000KHz | | RECORD | 1.000KHz | | FFT MODE | 1.000KHz | | SYS STAT | 1.000KHz | | ON FFT | 1.000KHz | | CH1 Source | 1.000KHz | | Hanning Window | 1.000KHz | | dB Format | 1.000KHz | | X S Zoom | 1.000KHz |Fig.63. Hanning window
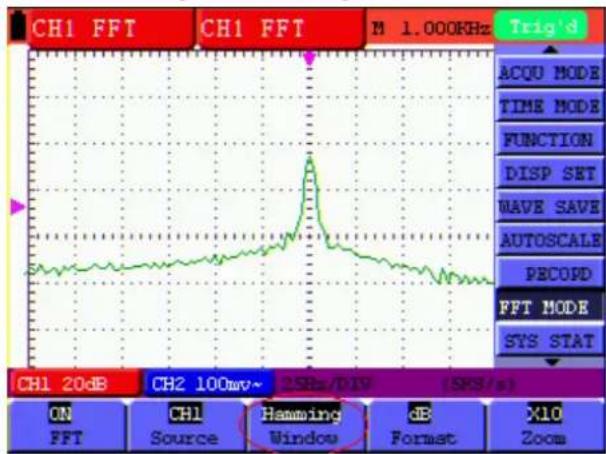
line
| Feature | Value | | ----------------- | --------- | | ACQU MODE | 2.5Hz/div | | TIME MODE | 2.5Hz/div | | FUNCTION | 2.5Hz/div | | DISP SET | 2.5Hz/div | | WAVE SAVE | 2.5Hz/div | | AUTOSCALE | 2.5Hz/div | | PECOPD | 2.5Hz/div | | FFT MODE | 2.5Hz/div | | SYS STAT | 2.5Hz/div | | ON FFT | 2.5Hz/div | | CH1 Source | 2.5Hz/div | | Hamming Window | 2.5Hz/div | | dB Format | 2.5Hz/div | | X10 Zoom | 2.5Hz/div |Fig.64. Hamming window
Quick Tips
■ If desired, use the zoom feature to magnify the FFT waveform.
■ Use the default dB scale to see a detailed view of multiple frequencies, even if they have very different amplitudes. Use the Vrms scale to see an overall view of how all frequencies compare to each other.
■ Signals that have a DC component or offset can cause incorrect FFT waveform component magnitude values. To minimize the DC component, choose AC Coupling on the source signal.
■ To reduce random noise and aliased components in repetitive or single-shot events, set the oscilloscope acquisition mode to average.
Term interpretation
Nyquist frequency: The highest frequency that any Real Time Digital Oscilloscope can measure is exactly half of the sampling rate under the condition of no mistakes, which is called Nyquist frequency. If under-sampling occurs when the frequency sampled is higher than Nyquist frequency,
"False Wave" phenomenon will appear. So pay more attention to the relation between the frequency being sampled and measured.
NOTE:
While FFT mode is turned on, DO NOT USE THESE SETTINGS:
1) Horizontal window setting.
2) Change source channel in CH1/CH2 Setup menu
3) Turn on XY Format
4) Trigger control "SET 50%"
5) Auto-scale function
6) Wave record;
7) Measure 1 and Measure 2.
8.15 System State Menu
The system state menu is used to display information about the present horizontal system, vertical system, trigger system and others. The operation steps are shown as below.
- Press the MENU key and the function menu is displayed at the right of the screen.
- Press the MENU ▲ or MENU ▼ key to select the SYS STAT. Four options appear at the bottom of the screen.
- Sequentially press F1 to F4 key and the corresponding state information will be shown on the screen.
- The screen that looks like the following figure 65 will be displayed.
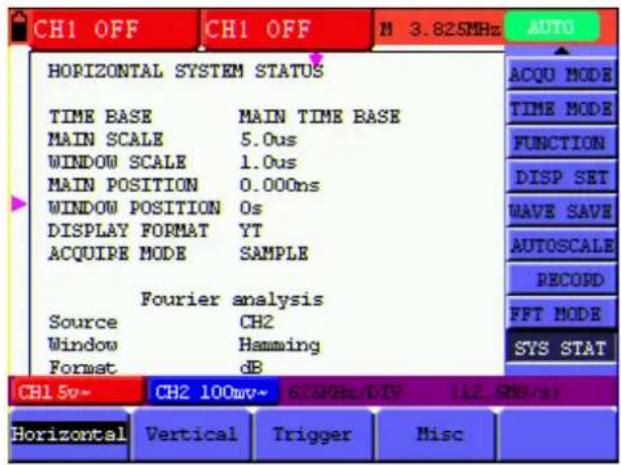
Figure 65: System State
8.15.1 Real time clock
Function: Be synchronous with the U disk storage time.
Do below steps to set up the real time clock:
-
Press MENU key and the function menu is displayed on the right side of the screen.
-
Press MENU ▲ or MENU ▼ key and select SYS STAT and there will be 4 items displayed at the bottom of the screen.
-
Press F4 key and select Misc to display the system time, see Fig.66.
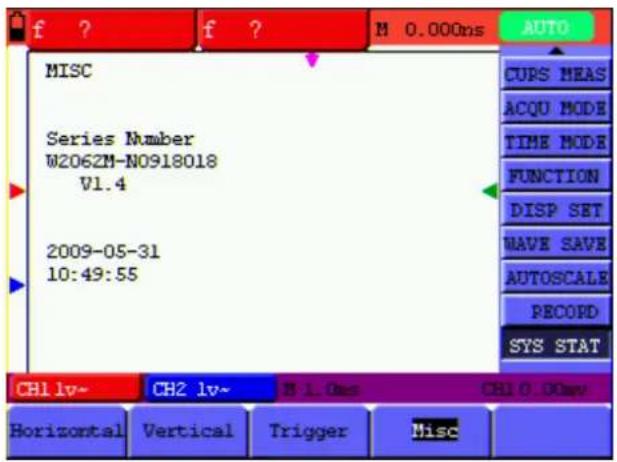
Fig.66: System Time
- Press OPTION to enter into timing mode and if that the background color of the year, month, date, hour, minute, second which are in need of correct be deepened, the value can be adjusted.
- Press OPTION▲ or OPTION▼ to change the corresponding value of the year, month, date, hour, minute and second effectively.
- Press OPTION ◀ or OPTION ▶ to switch to the year, month, date, hour, minute and second that are in need of adjustment.
- Press OPTION to enter into normal time mode after timing.
- If need to timing, please kindly repeat the above steps.
Note: The digital clock stops working when in timing mode.
8.16 Setting of Time Base Mode
The time base mode menu is explained as the following table.
| Function menu Setting Explanation | ||
| Main TimeBase | Horizontal main time base is used to wave display | |
| Zone Window | Use two cursors to define a window area | |
| Window Expand the defined window to full-screen display | ||
For the operation of window extension, please execute the following steps:
- Press MENU key, display the function menu on the right side of the screen.
- Press MENU ▲ or MENU ▼ key to select TIME MODE, display three options at the bottom.
- Press F2 key to select Zone Window.
- Press OPTION key to pop up TIME BASE, at this time, then press ◀ (yellow) and ▶ (yellow) key to adjust the time base window area defined by two cursors, the window size will vary.
- Press OPTION key and call TIME, at this time, press ◀(yellow) and ▶(yellow) to adjust the window position defined by two cursors, the window position is the time difference of the window center to main time base's horizontal pointer.
- Press F3 key, select Window, the defined window extends into the full-screen display.
The screen that looks like the following figure 67, 68 will be displayed.
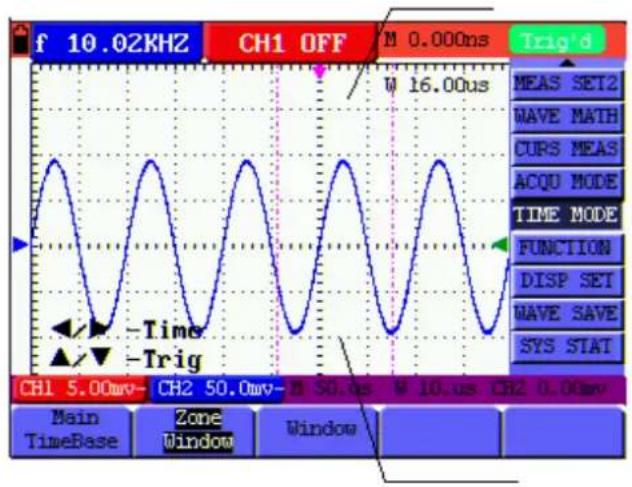
line
| Measurement | Value | |-------------|-----------| | CH1 OFF | 0.000ns | | Time | -16.00us | | CH1 5.00mv | 5.00mV | | CH2 50.0mv | 50.0mV | | CH3 50.0mV | 100.0mV | | CH4 50.0mV | 10.0mV | | CH5 50.0mV | 10.0mV | | CH6 50.0mV | 10.0mV | | CH7 50.0mV | 10.0mV | | CH8 50.0mV | 10.0mV | | CH9 50.0mV | 10.0mV | | CH10 50.0mV | 10.0mV | | CH11 50.0mV | 10.0mV | | CH12 50.0mV | 10.0mV | | CH13 50.0mV | 10.0mV | | CH14 50.0mV | 10.0mV | | CH15 50.0mV | 10.0mV | | CH16 50.0mV | 10.0mV | | CH17 50.0mV | 10.0mV | | CH18 50.0mV | 10.0mV | | CH19 50.0mV | 10.0mV | | CH20 50.0mV | 10.0mV | | CH21 50.0mV | 10.0mV | | CH22 50.0mV | 10.0mV | | CH23 50.0mV | 10.0mV | | CH24 50.0mV | 10.0mV | | CH25 50.0mV | 10.0mV | | CH26 50.0mV | 10.0mV | | CH27 50.0mV | 10.0mV | | CH28 50.0mV | 10.0mV | | CH29 50.0mV | 10.0mV | | CH30 50.0mV | 10.0mV | | CH31 50.0mV | 10.0mV | | CH32 50.0mV | 10.0mV | | CH33 50.0mV | 10.0mV | | CH34 50.0mV | 10.0mV | | CH35 50.0mV | 10.0mV | | CH36 50.0mV | 10.0mV | | CH37 50.0mV | 10.0mV | | CH38 50.0mV | 10.0mV | | CH39 50.0mV | 10.0mV | | CH40 50.0mV | 10.0mV | | CH41 50.0mV | 10.0mV | | CH42 50.0mV | 10.0mV | | CH43 50.0mV | 10.0mV | | CH44 50.0mV | 10.0mV | | CH45 50.0mV | 10.0mV | | CH46 50.0mV | 10.0mV | | CH47 50.0mV | 10.0mV | | CH48 50.0mV | 10.0mV | | CH49 50.0mV | 10.0mV | | CH5_5: TimeBase | Main | | Zone Window | Window | | Windows | | | System | | | System | | | System | | | System | | | System | | | System | | | System | | | System | | | System | | | System | | | System | | | System | | | System | | | System | | | System (Main) | | | Zone Window | Window | | System | | | System | | | System | | | System | | | System (Chase) | | | Zone Window | Window | | System | | | System | | | System | | | System (Chase) | | | Zone Window | Window | | System | | | System (Chase) | | | System (Chase) | | | System (Chase) | | | System (Chase) + Window (Main) | | | (Chase) + Window (Zone) + Window (System) | (Chase) + Window (Main) + Window (Zone) + Window (Windows) + Window (System) + Window (Windows) + Window (Windows) + Window (Windows) + Window (Windows) + Window (Windows) + Window (Windows) + Window (Windows) + Window (Windows) + Window (Windows) + Window (Windows) + Window (Windows) + Window (Windows) + Window (Windows) + Window (Windows) + Window (Windows) + Window (Windows) + Window (Windows) + Window (Windows) + Window (Windows) + Window (Windows) + Window (Win) + Window (Win) + Window (Win) + Window (Win) + Window (Win) + Window (Win) + Window (Win) + Window (Win) + Window (Win) + Window (Win) + Window (Win) + Window (Win) + Window (Win) + Window (Win) + Window (Win) + Window (Win) + Window (Win) + Window (Win) + Window (Win) + Window (Win) + Window (W) + Window (Win) + Window (Win) + Window (Win) + Window (Win) + Window (Win) + Window (Win) + Window (Win) + Window (Win) + Window (Win) + Window (Win) + Window (Win) + Window (Win) + Window (Win) + Window (Win) + Window (Win) + Window (Win) + Window (Win) + Window (Win) + Window (Win) + Window (WIN) + Window (WIN) + Window (WIN) + Window (WIN) + Window (WIN) + Window (WIN) + Window (WIN) + Window (WIN) + Window (WIN) + Window (WIN) + Window (WIN) + Window (WIN) + Window (WIN) + Window (WIN) + Window (WIN) + Window (WIN) + Window (WIN) + Window (WIN) + Window (WIN) + Window (WIN) + Window (MIN) CH3_5: TimeBase CH2_5: TimeBase CH3_5: TimeBase CH3_5: TimeBase CH3_5: TimeBase CH3_5: TimeBase CH3_5: TimeBase CH3_5: TimeBase CH3_5: TimeBase CH3_5: TimeBase CH3_5: TimeBase CH3_5: TimeBase CH3_5: TimeBase CH3_5: TimeBase CH3_5: Trough | CH3_5: Trough | CH3_5: Trough | CH3_5: Trough | CH3_5: Trough | CH3_5: Trough | CH3_5: Trough | CH3_5: Trough | CH3_5: Trough | CH3_5: Trough | CH3_5: Trough | CH3_5: Trough | CAE | CEA | CAE | CAE | CAE | CAE | CAE | CAE | CAE | CAE | CAE | CAE | CAE | CAE | CAE | CAE | CAE | CAE | CAE | CAE | CAE | CAE | CAE | CAE | CAE | CAE | CAE | CAE | CAe | CAe | CAe | CAe | CAe | CAe | CAe | CAe | CAe | CAe | CAe | CAe | CAe | CAe | CAe | CAe | CAe | CAe | CAe | CAe | CAe | CAe | CAe | CAe | CAe | CAe | CAi | CAi | CAi | CAi | CAi | CAi | CAi | CAi | CAi | CAi | CAi | CAi | CAi | CAi | CAi | CAi | CAi | CAi | CAi | CAi | CAi | CAi | CAi | CAi | CAi | CAi | CAj | CAj | CAj | CAj | CAj | CAj | CAj | CAj | CAj | CAj | CAj | CAj | CAj | CAj | CAj | CAj | CAj | CAj | CAj | CAj | CAk | CAk | CAk | CAk | CAk | CAk | CAk | CAk | CAk | CAk | CAk | CAk | CAk | CAk | CAk | CAk | CAk | CAk | CAk | CAk | CAk | CAk | CAk | CAk | CAk | CAk | CAl | CAl | CAl | CAl | CAl | CAl | CAl | CAl | CAl | CAl | CAl | CAl | CAl | CAl | CAl | CAl | CAl | CAl | CAl | CAl | CAl | CAl | CAl | CAl | CAl | CAl : | Note: - The chart displays the frequency of a sine wave signal in MHz for each phase of the wave. - The frequency values are explicitly labeled as "CHI OFF" or "CHI Max" for each phase of the wave. - The system parameters are defined by the formula "MEAS SET2" and "WAVE MATH". The data is presented in a table format with columns for 'Main' and 'Zone' categories.Figure 67: Zone Window
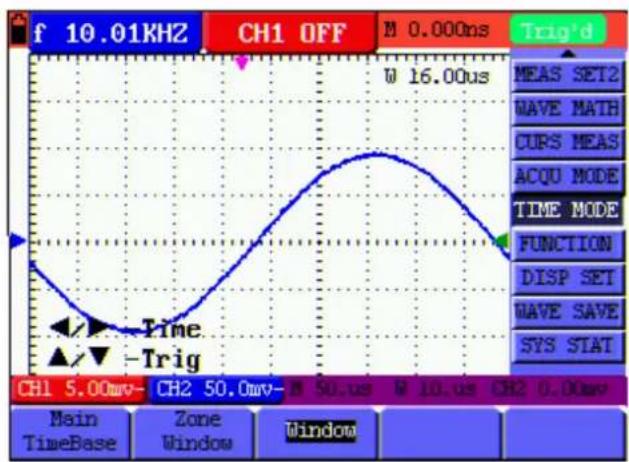
line
| Time (us) | Value | |-----------|-----------| | 0 | 0 | | 5 | 16.00 | | 10 | 0 | | 15 | 16.00 | | 20 | 0 | | 25 | 16.00 | | 30 | 0 | | 35 | 16.00 | | 40 | 0 | | 45 | 16.00 | | 50 | 0 | | 55 | 16.00 | | 60 | 0 | | 65 | 16.00 | | 70 | 0 | | 75 | 16.00 | | 80 | 0 | | 85 | 16.00 | | 90 | 0 | | 95 | 16.00 | | 100 | 0 | | 105 | 16.00 | | 110 | 0 | | 115 | 16.00 | | 120 | 0 | | 125 | 16.00 | | 130 | 0 | | 135 | 16.00 | | 140 | 0 | | 145 | 16.00 | | 150 | 0 | | 155 | 16.00 | | 160 | 0 | | 165 | 16.00 | | 170 | 0 | | 175 | 16.00 | | 180 | 0 | | 185 | 16.00 | | 190 | 0 | | 195 | 16.00 | | 200 | 0 | | 205 | 16.00 | | 210 | 0 | | 215 | 16.00 | | 220 | 0 | | 225 | 16.00 | | 230 | 0 | | 235 | 16.00 | | 240 | 0 | | 245 | 16.00 | | 250 | 0 | | 255 | 16.00 | | 260 | 0 | | 265 | 16.00 | | 270 | 0 | | 275 | 16.00 | | 280 | 0 | | 285 | 16.00 | | 290 | 0 | | 295 | 16.00 | | 300 | 0 | | | |Figure 68: Window
8.17 Data Transmission
For the operation of data transmission, please execute the following steps:
- Press MENU key, display the function menu on the right side of the screen.
- Press MENU ▲ or MENU ▼ key to select DISP SET.
- Press F4 key, select the Bitmap or Vectors for data transmission.
- Use a data line to connect the oscilloscope and the PC.
- Open the OWON software that had been installed completely.
- Setting the parameter under the use's manual, and then starts data transmission.
9. Trouble Shooting
1. The oscilloscope does not power up
It may be caused by the dead battery. At this time, the oscilloscope will not start even if it is powered by the battery charger. Firstly, charge the battery and supply the oscilloscope with power through the battery charger. However, don't switch on the oscilloscope until waiting for 15 minutes. If the oscilloscope still cannot start, please contact OWON for service.
2. The oscilloscope stops working only after operating for several seconds
Probably the battery is dead; Check the battery symbol at the upper left of the screen. The □ symbol indicates that the battery has been run out of power and must be charged.
3. The measurement type displays ERR when you switch to the Multimeter mode.
Probably you do not select the measuring mode. In this case, push down any key of the three keys A, V or R. Thus, the relative measuring mode will be shown on the screen. If the ERR is still displayed, restart the oscilloscope.
4. The measured voltage amplitude value is 10 times larger or smaller than the real value under the oscilloscope mode.
Check whether the channel attenuation level matches the actual probe attenuation ratio.
5. The waveform is displayed on the screen but is not stable under the oscilloscope mode.
- Check whether the signal item in the trigger mode menu matches the actually used signal channel.
- Check on the trigger mode: The edge trigger mode is applicable to the universal single and the video trigger mode applicable to the video signal. Only when the proper trigger mode is applied, can the waveform be in stable.
- Try to change the trigger coupling into the HF rejection and LF rejection to filter the HF or LF noise trigger by the interference. (Only for the models that have this function.)
6. There is no display on the screen when you push down RUN/STOP key under the oscilloscope mode.
Check whether the trigger mode in the trigger mode menu is in normal or single shot and whether the trigger level is out of the waveform range.
In such condition, adjust and make the trigger level in the middle or select the non-auto trigger mode. Additionally, press the AUTO SET key and complete the above setting
7. When select the average sampling in the sampling mode or select a longer display time in the display mode under the oscilloscope, the display speed is slow.
It is normal in the above case.
10. Appendix
10.1 Appendix A: Specifications
10.1.1 Oscilloscope
Only if other instructions are provided, are all technical specifications applicable to the probe with the 10X attenuation switch setting and the HDS-N series digital type oscilloscope. In order to be up to these specifications, the oscilloscope should meet the following requirement.
The instrument should operate continuously for more than 30 minutes under the specified operating temperature.
If the operating temperature is up to or larger than 5 Celsius degrees, the system function menu must be opened to make the system perform a "Auto- calibration" procedure (see "calibration" on P59).
Except those specifications marked with the word Typical, all specifications can be up to.
Sampling
| Sampling modes | Normal samplingPeak detectionAverage value | |
| Sampling rate | HDS1022M-NHDS1022M-I | 100 MS/s |
| HDS2062M-NHDS3102M-N | Max 1 GS/s | |
| HDS4202M-N Single channel 1 GS/s | ||
Input
| Input coupling | DC, AC, Ground | |
| Input impedance | HDS1022M-NHDS1022M-I | 1 MΩ±2% connected in parallel with 20 pF±5 pF |
| HDS2062M-NHDS3102M-NHDS4202M-N | 1 MΩ±2% connected in parallel with 15 pF±5 pF | |
| Probe attenuation coefficient | 1X, 10X, 100X, 1000X | |
| Max. Input voltage | 400 V (peak) | |
| Channel-channel isolation (HDS1022M-I only) | 1000 : 1 | |
| Channel delay time (typical) | 150 ps | |
Horizontal
| Sampling rate range | HDS1022M-NHDS1022M-I | 0.25 S/s - 100 MS/s |
| HDS2062M-NHDS3102M-NHDS4202M-N | 0.25 S/s - 1 GS/s | |
| Waveform interpolation | (sin x) /x | |
| Record length 6k points on each channel | ||
| Scanning speed range(S/div) | HDS1022M-NHDS1022M-I | 5ns/div - 100s/div, stepping in the "1-2.5-5" mode |
| HDS2062M-NHDS3102M-N | 5ns/div - 100s/div, stepping in the "1-2-5" mode | |
| HDS4202M-N | 2ns/div - 100s/div, stepping in the "1-2-5" mode | |
| Sampling rate and delay time accuracy | ±100ppm(any time interval which is equal to or larger than 1ms) | |
| Time interval (△T)measurement accuracy(full bandwidth) | Single:±(1 sampling interval time +100ppm×reading+0.6ns)>average 16 :±(1 sampling interval time +100ppm×reading+0.4ns) | |
Vertical
| Analog digital converter (A/D) | With the resolution of 8 bits, make sampling on both channels synchronously. | |
| Displacement range | HDS1022M-N | ±10 div |
| HDS1022M-I | ±2 V (5 mV/div - 200 mV/div), ±50 V (500 mV/div - 5 V /div) | |
| HDS2062M-N | ||
| HDS3102M-N | ||
| HDS4202M-N | ±1 V (5 mV/div - 100 mV/div) ±10 V (200 mV/div - 1 V /div) ±50 V (2V/div - 5 V /div) | |
| Analog bandwidth | HDS1022M-N | 20 MHz |
| HDS1022M-I | ||
| HDS2062M-N 60 MHz | ||
| HDS3102M-N 100 MHz | ||
| HDS4202M-N 200 MHz | ||
| Single bandwidth Full bandwidth | ||
| Low frequency response (AC coupling, -3dB) | ≥10 Hz (at the BNC) | |
| Rise time (typical one at the BNC) | HDS1022M-NHDS1022M-I | ≤slant 17.5 ns |
| HDS2062M-N | ≤slant 5.8 ns | |
| HDS3102M-N | ≤slant 3.5 ns | |
| HDS4202M-N | ≤slant 1.7 ns | |
| DC gain accuracy | ± 3% | |
| DC measurement accuracy( average value sampling mode) | The voltage difference ( V ) between any two points on the waveform after averaging the captured waveforms more than 16: ± (5% reading + 0.05 divisions) . | |
Trigger
| Triggering level range | ±6 divisions from the screen center |
| Triggering level accuracy (typical) which is applicable to the signal with rise and fall time equal to or longer than 20ns | ±0.3 divisions |
| Trigger displacement | 655 divisions for pre-triggering and 4 divisions for post-triggering. |
| Trigger Holdoff range 100 ns – 10 s | |
| Make a 50% level setting (Typical). | Operation with the input signal frequency equal to or larger than 50Hz. |
| Signal system and line/field frequency (Video triggering mode) | Support the NTSC, PAL and SECAM broadcasting systems of any field or line frequency. |
| Cymometer | |
| Readout resolution 6 digits | |
| Frequency range | AC coupling, 2 Hz to full bandwidth |
| Single source | when the triggering mode is edge triggering, it is a one channel Cymometer.When the triggering mode is alternating triggering, it is a two channel cymometer.When the triggering mode is video triggering, the cymometer will not work.. |
Measurement
| Cursor measurement | Voltage difference ( V ) and time difference ( T ) between cursors |
| Auto measurement | Peak-to-peak value, average value, root mean square value, frequency , period, Vmax, Vmin, Vtop, Vbase, Vamp, Overshoot, Preshoot, Rise Time, Fall Time, +Width, -Width, +Duty, -Duty, Delay A B and Delay A B |
Probe
| 1X position 10X position | ||
| Bandwidth | Up to 6 MHz (DC) | Up to full bandwidth (DC) |
| Attenuation rate | 1: 1 | 10: 1 |
| Compensation range | 15 pf – 35 pf | |
| Input resistance | 1 MΩ ± 2% | 10 MΩ ± 2% |
| Input Capacitance | 85 pf – 115 pf | 14.5 pf - 17.5 pf |
| Input voltage | <200 V DC + Peak AC | <600 V DC + Peak AC |
10.1.2 Meter
Voltage (VDC)
Input Impedance: 10 MΩ.
Max. Input Voltage: 1000 V (DC or AC peak value)
| Range Accuracy Resolution | ||
| 400.0 mv | ±1%±2 digits | 100 uV |
| 4.000 V 1 mV | ||
| 40.00 V 10 mV | ||
| 400.0 V 100 mV | ||
| 1000 V | 1 V | |
Voltage (VAC)
Input Impedance: 10 MΩ
Max Input Voltage: 750 V (AC, RMS value)
Frequency range: from 40 Hz to 400 Hz
Display: RMS value of the sine wave
| Range | Accuracy | Resolution |
| 4.000 V | ±1%±3 digits | 1 mV |
| 40.00 V 10 mV | ||
| 400.0 V 100 mV | ||
| 750 V | ±1.5%±3 digit | 1 V |
Direct Current (DC)
| Range | Accuracy | Resolution |
| 40.00 mA | ±1.5%±1 digit | 10 uA |
| 400.0 mA | ±1.5%±1 digit | 100 uA |
| 10 A | ±3%±3 digits | 10 mA |
Alternating Current (AC)
| Range Accuracy Resolution | ||
| 40.00 mA | ±1.5% ±3 digits | 10 uA |
| 400.0 mA | ±2% ±1 digit | 100 uA |
| 10 A | ±5% ±3digits | 10 mA |
Resistance
| Range Accuracy Resolution | ||
| 400.0 Ω | ±1%±3 digits | 0.1 Ω |
| 4.000 kΩ | ±1%±1 digit | 1 Ω |
| 40.00 kΩ 10 Ω | ||
| 400.0 kΩ 100 Ω | ||
| 4.000 MΩ 1 kΩ | ||
| 40.00 MΩ | ±1.5%±3 digits | 10 kΩ |
Capacitance
| Range Accuracy Resolution | ||
| 51.20 nF | ±3%±3 digits | 10 pF |
| 512.0 nF 100 pF | ||
| 5.120 uF 1 nF | ||
| 51.20 uF | 10 nF | |
| 100 uF | 100 nF | |
Diode
Voltage reading: 0 V - 1.5 V.
On-off Test
There is a beep sound when the on-resistance is less than 50 Ω.
10.1.3 General Specifications
Basic parameter
| Mechanical dimension | 18 cm×11.5 cm×4 cm | |
| Weight 645 g | ||
| Power consumption | HDS1022M-NHDS1022M-I | < 6 W |
| HDS2062M-NHDS3102M-N | < 7 W | |
| HDS4202M-N | < 8 W | |
| Display type | 3.7" color liquid crystal display | |
| Display resolution | 640 (horizontal) ×480 (vertical) pixels | |
| Display color 65536 colors | ||
Power Adapter
| Power supply | 100 - 240 V AC 50/60Hz | |
| Voltage output | HDS1022M-NHDS1022M-I | 8.5 VDC |
| HDS2062M-NHDS3102M-N | 9 VDC | |
| HDS4202M-N 10 | VDC | |
| Current output | HDS1022M-NHDS1022M-I | 1500 mA |
| HDS2062M-NHDS3102M-NHDS4202M-N | 3000 mA | |
Battery type: 7.4V built-in Li-ion battery.
Working environment
Temperature
| Operation | Used battery 0 to 50 °C (32 to 122 °F) |
| Power adapter 0 to 40 °C (32 to 104 °F) | |
| Storage -20 to 60 °C (-4 to 140 °F) | |
Humidity
| Operation | 0 to 10 °C (32 to 50 °F) no condensation | |
| 10 to 30 °C (50 to 86 °F) 95 % | ||
| 30 to 40 °C (86 to 104 °F) 75 % | ||
| 40 to 50 °C (104 to 122 °F) 45 % | ||
| Storage -20 to 60 °C (-4 to 140 °F) no condensation | ||
10.2 Appendix B: Maintenance and Cleaning
10.2.1 Maintenance
Do not store or place the instrument in locations where the liquid crystal display (LCD) may be directly exposed to the sunshine for a long time.
Be careful: Do not spray liquid into the instrument.
Cleaning
Inspect the instrument and the probe frequently in accordance with operating conditions. Clean the outer surface of the instrument according to the following steps:
- Wipe off the floating dust outside of the instrument and the probe by using soft cloth. When cleaning the LCD, do not scuff the transparent LCD protective screen.
- Wipe the instrument in power off status by soft cloth that is moist but not dripping. It is allowed to be cleaned by soft detergent or fresh water. Do not use any abrasive chemical detergent to avoid the instrument or the probe being damaged.

Warning: Before running, please confirm that the instrument has been dried out so as to
avoid electrical short circuit and personal injury caused by moisture.
10.2.2 Storage of Oscilloscope
If the test tool is to be stored for a long time, it is required to charge the lithium battery before storage.
Charging the oscilloscope
The lithium battery is possibly not charged when delivery. To make the battery with enough electric quantity, it must be charged for 4 hours (the test tool must be turned off during charging). The battery can supply power for 4 hours after being charged completely.
When supplying power by using the battery, a battery indicator is displayed on the top of the screen to show the consumption condition of electric quantity. 📋 shows that the battery can only be used for about 5 minutes. To charge the battery and power the instrument, connect the oscilloscope using a power adapter according to Figure 1 to charge the battery. The charging speed can be increased by turning off the test tool.
Notice
To avoid superheat of battery during charging, the environment temperature is not allowed to exceed the permissible value given in technical specification.
Note:
No hazard will occur even connecting the charger for a long time, e.g. during a whole weekend. The instrument can automatically switch to slowly charging status.
10.2.3 Replacing the Lithium Battery Unit
It is usually not required to replace the battery unit. But when it is required to replace it, only qualified personnel can carry out this operation, and only use the same specification lithium battery.


- Dec. 2016 edition Ver1.6.0
- General Warranty
- Table of Contents
- DECLARATION OF CONFORMITY ....1
- SAFETY INFORMATION ....3
- GENERAL CHARACTERISTICS ......6
- PERFORMING THE GENERAL INSPECTION ......7
- INPUT CONNECTIONS 8
- USING THE OSCILLOSCOPE 12
- USING THE MULTIMETER 32
- ADVANCED FUNCTION OF OSCILLOSCOPE 43
- TROUBLE SHOOTING 80
- APPENDIX......81
- Declaration of Conformity
- Declaration of Conformity
- Package Contents
- Safety Information
- Safety Symbols and Terms
- Safety Symbols
- Safety Terms
- General Safety Information
- Warning:
- General Characteristics
- Oscilloscope
- Multimeter
- Performing the General Inspection
- Performing the General Inspection
- Check whether there is any Damage on it Due to Transportation
- Make a Check on Accessories
- Make a Check on the Complete Instrument
- Input Connections
- Input Connections
- Input connections
- Description:
- The connection of 1 kHz/5 V Square-wave test signal
- Front Panel and Keys Overview
- Using the Oscilloscope
- About this Chapter
- Powering Up the Oscilloscope
- Oscilloscope Operation Window
- Menu Description
- Manually Setting the Vertical System, Horizontal System and Trigger Position
- Setting the Vertical System
- To set the vertical system of CH1:
- To set the vertical system of CH2:
- Setting the Horizontal System and Trigger Position
- triggering.
- Term interpretation
- Recall factory settings
- Input Connections
- Displaying an Unknown Signal with Auto Set
- Automatic Zero-returning of Trigger Horizontal Position and Trigger Level Position
- Automatic Measurements
- Freezing the Screen
- Using Average for Smoothing Waveforms
- Using Persistence to Display Waveforms
- Using Peak Detection to Display Glitches
- Selecting AC-coupling
- Reversing the Polarity of the Displayed Waveform
- Using Waveform Mathematics Functions
- Use USB mass storage device to save waveform data
- USB disk Requirements
- Use system-provided function to format the USB disk
- Use Minitool Partition Wizard to format
- Formatting process
- Format the USB disk successfully
- Using the Multimeter
- About this Chapter
- Making Meter Connections
- Multimeter Operation Window
- Description
- Making Multimeter Measurements
- Measuring Resistance Values
- Measuring Diode
- On-off Test
- Measuring Capacitance
- Measuring DC Voltage
- Measuring AC Voltage
- Measuring DC Current
- Measuring AC Current
- Freezing the Readings
- Taking a Relative Measurement
- Selecting Automatic/ManualRange Adjustment
- Advanced Function of Oscilloscope
- About this Chapter
- Setting the Vertical CH1 and CH2
- Setting the Channel Coupling
- Open and Close Settings on Channel
- Setting the probe attenuation
- Setting of Inverted Waveform
- Make the Math Function Menu Setting
- The corresponding operation function table
- Setting the Trigger System
- Triggering Control
- Edge Trigger
- Video Trigger
- Alternate Trigger
- Note:
- Setting the Acquiring Mode
- Display Setting
- Display Style
- Persistence
- XY Mode
- Operations for various control keys are shown as below:
- The following functions do not work in the XY display mode:
- Cymometer
- Waveform Saving Setups
- Waveform Saving Setups in normal mode
- Waveform Saving Setups in FFT mode
- Function Setting Menu
- Making Automatic Measurements
- Setting the Cursor Measurements
- Setting the cursor measurement in normal mode
- Setting the cursor measurement in FFT mode
- ▲/▼—Cursor 2
- Autoscale
- Record
- Using FFT
- Selecting an FFT Window
- Quick Tips
- System State Menu
- Real time clock
- Setting of Time Base Mode
- Data Transmission
- Trouble Shooting
- The oscilloscope does not power up
- The oscilloscope stops working only after operating for several seconds
- The measurement type displays ERR when you switch to the Multimeter mode.
- The measured voltage amplitude value is 10 times larger or smaller than the real value under the oscilloscope mode.
- The waveform is displayed on the screen but is not stable under the oscilloscope mode.
- There is no display on the screen when you push down RUN/STOP key under the oscilloscope mode.
- When select the average sampling in the sampling mode or select a longer display time in the display mode under the oscilloscope, the display speed is slow.
- Appendix
- Appendix A: Specifications
- Oscilloscope
- Meter
- Voltage (VDC)
- Voltage (VAC)
- Diode
- On-off Test
- General Specifications
- Working environment
- Appendix B: Maintenance and Cleaning
- Maintenance
- Cleaning
- Storage of Oscilloscope
- Charging the oscilloscope
- Replacing the Lithium Battery Unit
Brand : Owon
Model : SDS5032E-V
Category : Mètre