NIM0O1-WW - Weather Station NETATMO - Free user manual and instructions
Find the device manual for free NIM0O1-WW NETATMO in PDF.
User questions about NIM0O1-WW NETATMO
0 question about this device. Answer the ones you know or ask your own.
Ask a new question about this device
Download the instructions for your Weather Station in PDF format for free! Find your manual NIM0O1-WW - NETATMO and take your electronic device back in hand. On this page are published all the documents necessary for the use of your device. NIM0O1-WW by NETATMO.
USER MANUAL NIM0O1-WW NETATMO
Netatmo Weather Station NWS01
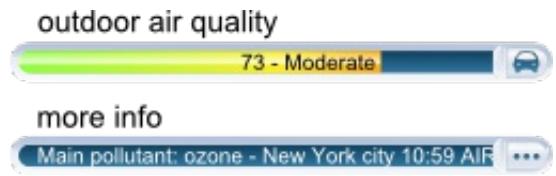
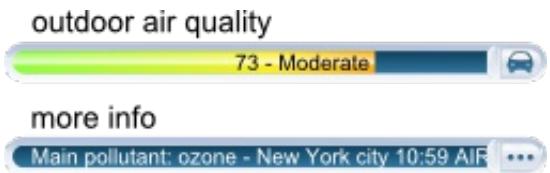
Outdoor air quality index
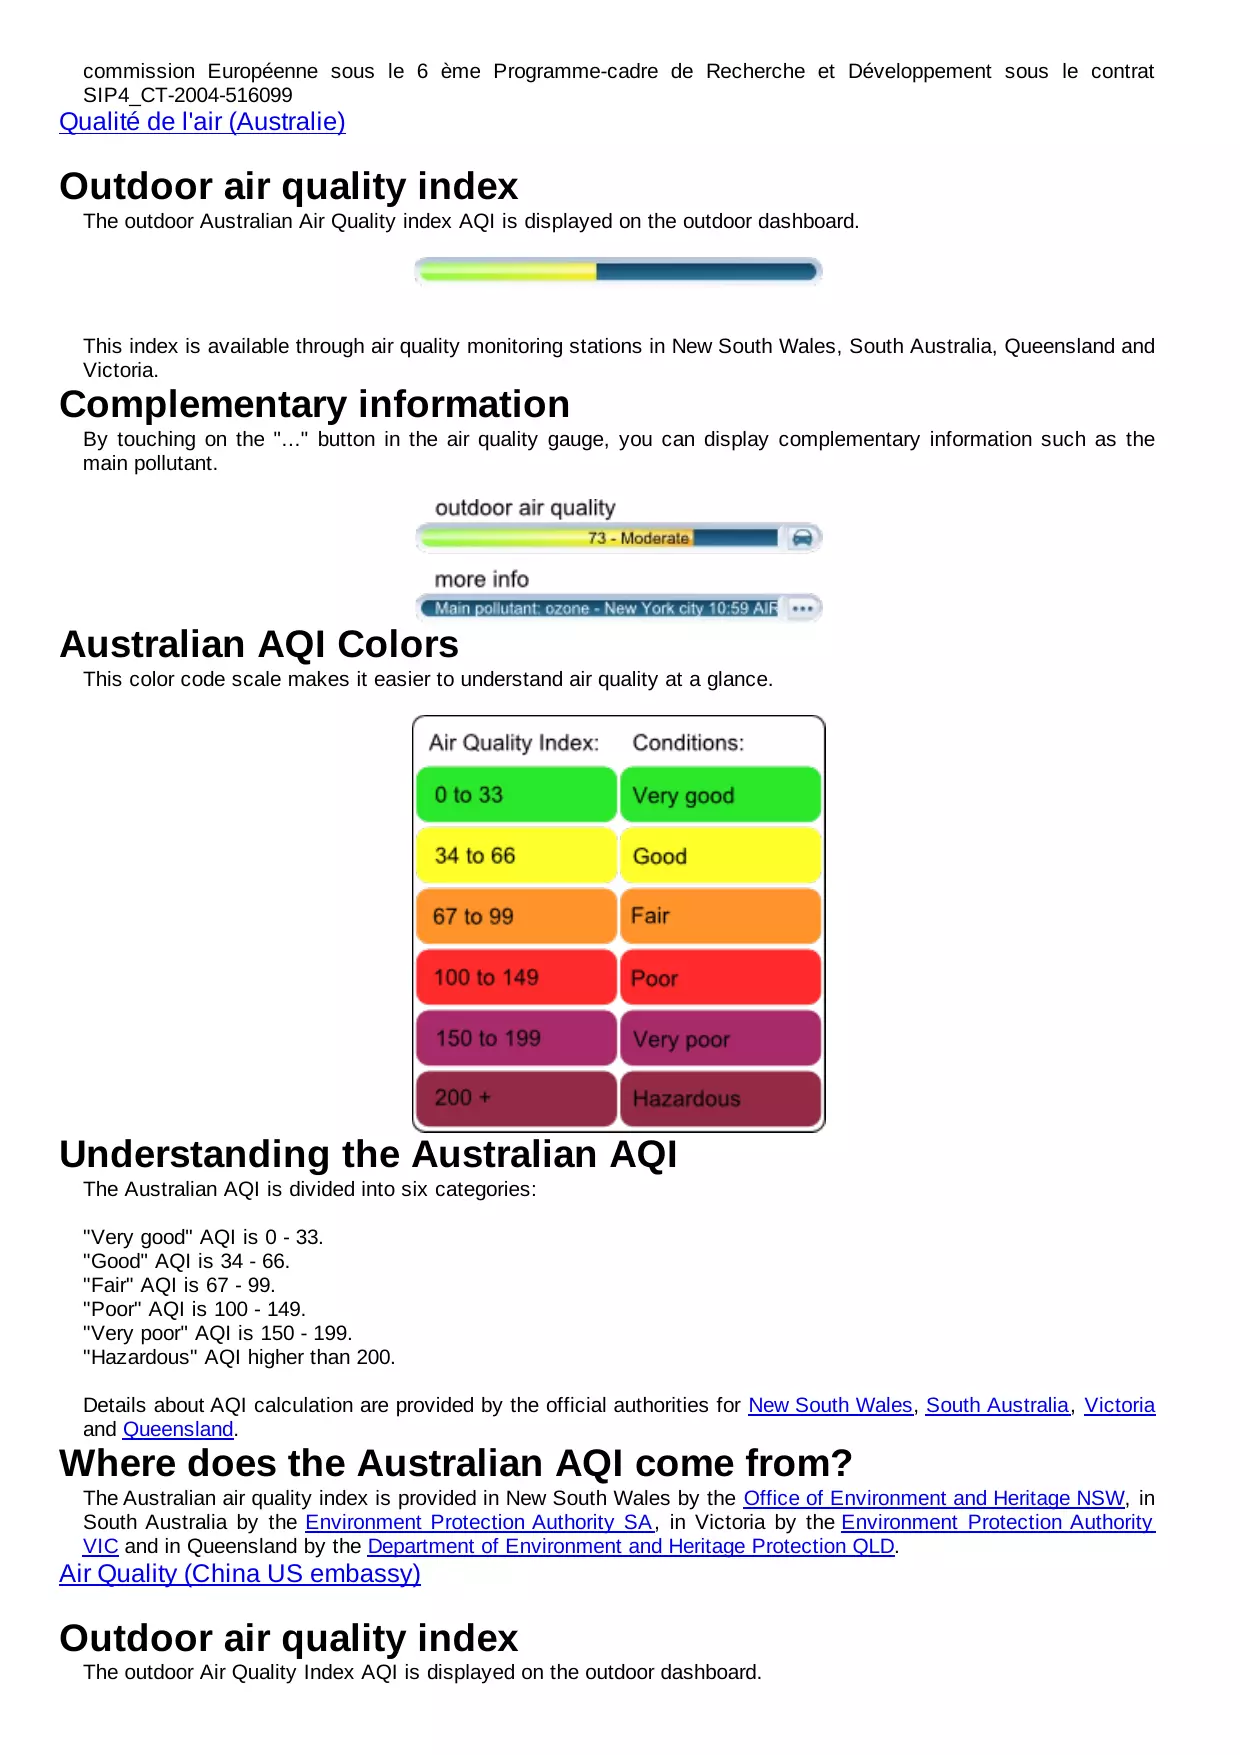
The outdoor Australian Air Quality index AQI is displayed on the outdoor dashboard.

This index is available through air quality monitoring stations in New South Wales, South Australia, Queensland and Victoria.
Complementary information
By touching on the "... button in the air quality gauge, you can display complementary information such as the main pollutant.

Australian AQI Colors
This color code scale makes it easier to understand air quality at a glance.
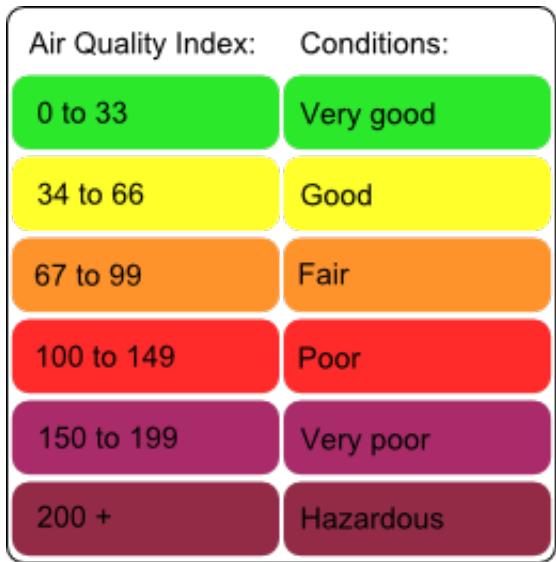
Understanding the Australian AQI
The Australian AQI is divided into six categories:
"Very good" AQI is 0 - 33.
"Good" AQI is 34 - 66.
"Fair" AQI is 67 - 99.
"Poor" AQI is 100 - 149.
"Very poor" AQI is 150 - 199.
"Hazardous" AQI higher than 200.
Details about AQI calculation are provided by the official authorities for New South Wales, South Australia, Victoria and Queensland.
Where does the Australian AQI come from?
The Australian air quality index is provided in New South Wales by the Office of Environment and Heritage NSW, in South Australia by the Environment Protection Authority SA, in Victoria by the Environment Protection Authority VIC and in Queensland by the Department of Environment and Heritage Protection QLD.
Air Quality (China US embassy)
Outdoor air quality index
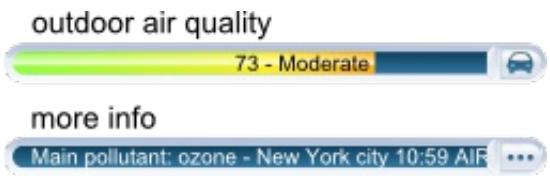
The outdoor Air Quality Index AQI is displayed on the outdoor dashboard.

This index is made available by the US embassy's air quality monitoring stations.
Complementary information
By touching on the "... button in the air quality gauge, you can display complementary information (when available): main pollutant, hour and location of the report.

AQI colors
This color code scale makes it easier for anyone to understand quickly whether air pollution is reaching unhealthy levels in their communities. For example, the color orange means that conditions are "unhealthy for sensitive groups," while the color red means that conditions may be "unhealthy for everyone," and so on.
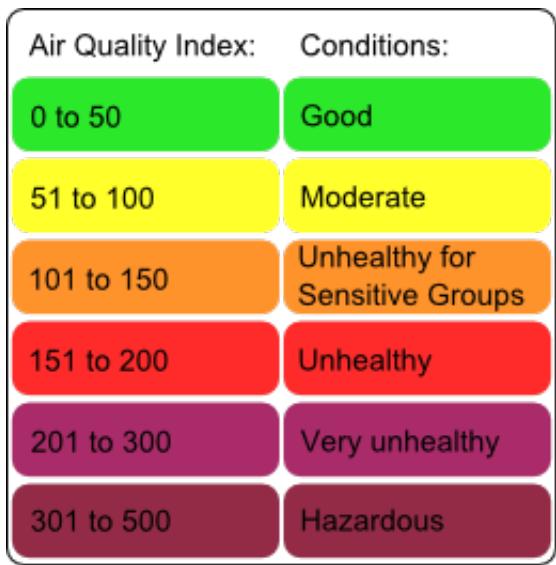
Understanding the AQI
The AQI is divided into six categories:
"Good" AQI is 0 - 50. Air quality is considered satisfactory, and air pollution poses little or no risk.
"Moderate" AQI is 51 - 100. Air quality is acceptable; however, for some pollutants there may be a moderate health concern for a very small number of people. For example, people who are unusually sensitive to ozone may experience respiratory symptoms.
"Unhealthy for Sensitive Groups" AQI is 101 - 150. Although general public is not likely to be affected at this AQI range, people with lung disease, older adults and children are at a greater risk from exposure to ozone, whereas persons with heart and lung disease, older adults and children are at greater risk from the presence of particles in the air.
"Unhealthy" AQI is 151 - 200. Everyone may begin to experience some adverse health effects, and members of the sensitive groups may experience more serious effects.
"Very Unhealthy" AQI is 201 - 300. This would trigger a health alert signifying that everyone may experience more serious health effects.
"Hazardous" AQI higher than 300. This would trigger a health warning of emergency condition. The entire population is then more likely to be affected.
Where does the outdoor AQI come from?
The AQI in China is provided by the United States Embassy in Beijing, the US Consulate in Guangzhou and the US Consulate in Shanghai. More information can be found here for Beijing, here for Guangzhou. Air Quality (China)
Outdoor Air Pollution Index
The Outdoor Air Pollution Index is displayed on the outdoor dashboard.

Complementary information
By touching on the "... button in the air quality gauge, you can display complementary information (when available): main pollutant, hour and location of the report.
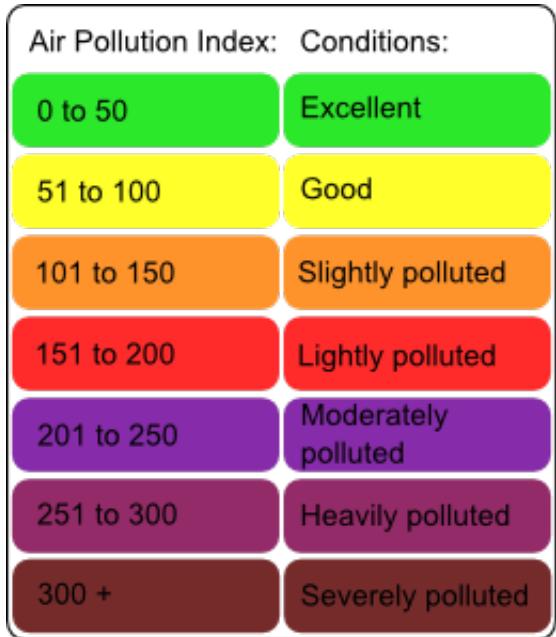
Air pollution colors
This color code scale makes it easier for anyone to understand quickly whether the air is polluted.
Understanding the Air Pollution Index
The Air Pollution Index is divided into seven categories:
"Excellent" Air Pollution Index is 0 - 50. No health implications.
"Good" Air Pollution Index is 51 - 100. No health implications.
"Slowly Polluted" Air Pollution Index is 101 - 150. Slight irritations may occur, individuals with breathing or heart problems should reduce outdoor activities.
"Lightly Polluted" Air Pollution Index is 151 - 200. Slight irritations may occur, individuals with breathing or heart problems should reduce outdoor activities.
"Moderately Polluted" Air Pollution Index is 201 - 250. Healthy people will be noticeably affected. People with breathing or heart problems will experience reduced endurance in activities. These individuals and elders should remain indoors and restrict activities.
"Heavily Polluted" Air Pollution Index is 251 - 300. Healthy people will be noticeably affected. People with breathing or heart problems will experience reduced endurance in activities. These individuals and elders should remain indoors and restrict activities.
"Severely Polluted" Air Pollution Index higher than 300. Healthy people will experience reduced endurance in activities. There may be strong irritations and symptoms and this may trigger other illnesses. Elders and the sick should remain indoors and avoid exercise. Healthy individuals should avoid outdoor activities.
Where does the outdoor Air Pollution Index come from?
The Air Pollution Index in China is provided by the Ministry of Environmental Protection of the People's Republic of China. More information can be found here.
Outdoor Air Pollution Index (API)
The Outdoor Air Pollution Index (API) is displayed on the outdoor dashboard.

Complementary information
By touching on the "... button in the air quality gauge, you can display complementary information (when available): main pollutant, hour and location of the report.

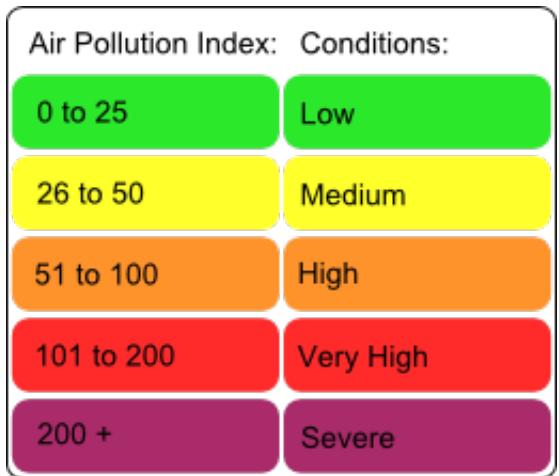
API colors
This color code scale makes it easier for anyone to understand quickly whether the air is polluted.
Understanding the Air Pollution Index
The Air Pollution Index is divided into seven categories:
"Low" API is 0 - 25. No response action required.
"Medium" API is 26 - 50. No response action required.
"High" API is 51 - 100. No immediate response action is suggested. Long-term effects may, however, be observed if exposed at such level persistently for months or years.
"Very High" API is 101 - 200. Persons with existing heart or respiratory illnesses, childrens and the elderly are advised to reduce physical exertion and outdoor activities. They are also advised to seek advice from a medical doctor before participating in sport activities and take more breaks during the activities.
"Severe" API higher than 200. Persons with existing heart or respiratory illnesses, childrens and the elderly are advised to avoid physical exertion and outdoor activities. The general public is advised to reduce physical exertion and outdoor activities. They are also advised to seek advice from a medical doctor before participating in sport activities and take more breaks during the activities.
Where does the outdoor API come from?
The API in Hong Kong is provided by the Environmental Protection Department of the Government of the Hong Kong Administrative Special Region. More information can be found here.
Air Quality (Japan)
Outdoor Air Pollution Index (AQI)
The Outdoor Air Pollution Index (AQI) in Japan is displayed on the outdoor dashboard.
Complementary information

By touching on the "... button in the air quality gauge, you can view complementary information (when available): main pollutant, hour and location of the report.
AQL colors
This color code scale makes it easier for anyone to understand quickly whether the air is polluted.
Understanding the Air Pollution Index
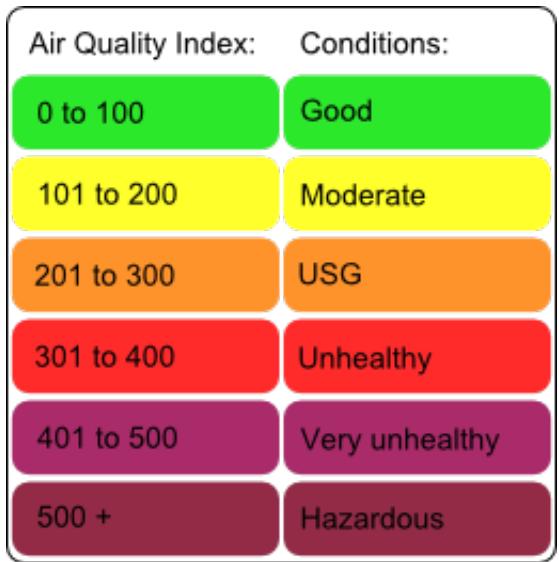
The Air Pollution Index is based on the following pollutants: SO2, NO, NO2, OX, NMHC, PM10 and PM2.5. It is divided into seven categories:
"Good" AQI is 0 - 100. Air quality is considered satisfactory, and air pollution poses little or no risk.
"Moderate" AQI is 101 - 200. Air quality is acceptable; however, for some pollutants there may be a moderate health concern for a very small number of people. For example, people who are unusually sensitive to ozone may experience respiratory symptoms.
"Unhealthy for Sensitive Groups" AQI is 201 - 300. Although general public is not likely to be affected at this AQI range, people with lung disease, older adults and children are at a greater risk from exposure to ozone, whereas persons with heart and lung disease, older adults and children are at greater risk from the presence of particles in the air.
"Unhealthy" AQI is 301 - 400. Everyone may begin to experience some adverse health effects, and members of the sensitive groups may experience more serious effects.
"Very Unhealthy" AQI is 401 - 500. This would trigger a health alert signifying that everyone may experience more serious health effects.
"Hazardous" AQI higher than 500. This would trigger a health warning of emergency condition. The entire population is then more likely to be affected.
Where does the outdoor AQI in Japan come from?
The AQI in Japan is based on Air Pollution data provided by the Atmospheric Environmental Regional Observation System : AEROS. This Air Pollution data is summed-up as a comprehensive Air Quality Index (AQI) using formulae similar to American and European standard formulae. The Air Pollution data can be found here.
Air Quality (Taiwan)
Outdoor Pollutant Standards Index (PSI)
The Pollutant Standards Index (PSI) in Taiwan is displayed on the outdoor dashboard.
Complementary information
By touching on the "... button in the air quality gauge, you can view complementary information (when available): main pollutant, hour and location of the report.
PSI colors
This color code scale makes it easier for anyone to understand quickly whether the air is polluted.
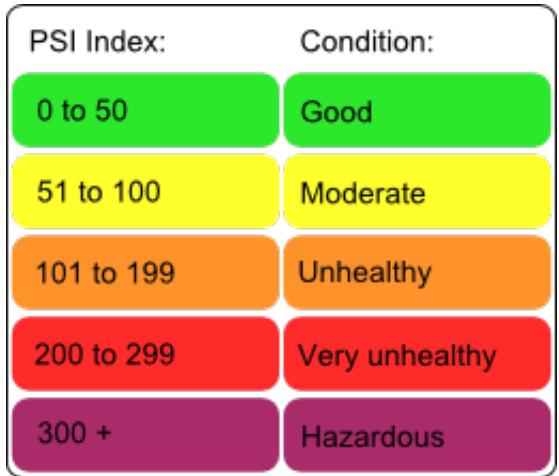
Understanding the Pollutant Standards Index
The Air pollution index (PSI) is based on air monitoring station on the same day PM10 (does not include the 10-micron particle size of suspended particles than coarse-grained) values, the concentration of sulfur dioxide, nitrogen dioxide, carbon monoxide and ozone concentrations.
It is divided into 5 categories:
"Good" PSI is 0 - 50.
"Moderate" PSI is 51 - 100.
"Unhealthy" PSI is 101 - 199.
"Very Unhealthy" PSI is 200 - 299.
"Hazardous" PSI higher than 300.
Where does the outdoor PSI in Taiwan come from?
The PSI in Taiwan is provided by the Environmental Protection Administration, Executive Yuan R.O.C. (Taiwan). More information can be found here. Air Quality (Greater Mexico City)
Metropolitan Air Quality Index (IMECA)
Metropolitan Air Quality Index (IMECA) in Mexico is displayed on the outdoor dashboard.

Complementary information
By touching on the "... button in the air quality gauge, you can view complementary information (when available): main pollutant, hour and location of the report.

IMECA colors
This color code scale makes it easier for anyone to understand quickly whether the air is polluted.
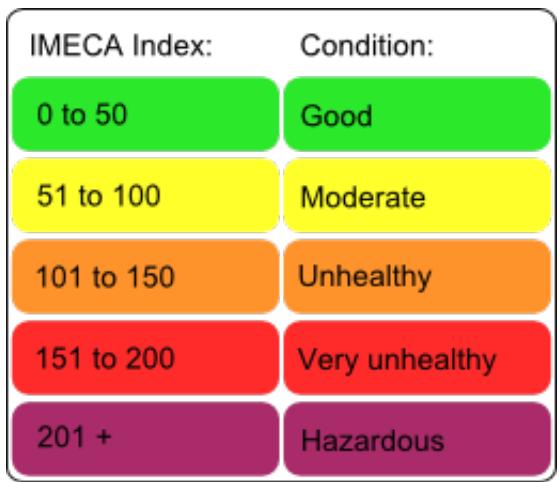
Understanding the IMECA index
The IMECA index is calculated using the Air Quality measurements by SIMAT (Sistema de Monitoreo Atmosférico de la Ciudad de México). The IMECA is calculated using averaged measurements of ozone (O3), sulphur dioxide (SO2), nitrogen dioxide (NO2), carbon monoxide (CO) and particles lower than 10 micrometers (PM10).
It is divided into 5 categories:
"Good" IMECA is 0 - 50.
"Moderate" IMECA is 51 - 100.
"Unhealthy" IMECA is 101 - 150.
"Very Unhealthy" IMECA is 151 - 200.
"Hazardous" IMECA higher than 200.
Where does the IMECA in Mexico come from?
The IMECA in Mexico is provided by SIMAT. More information can be found here. Confort interieur
NOAA Weather Alerts (US)
Weather alerts from the National Weather Service are sent as notifications to your Netatmo app. They are selected according to your station's location.
Typical message will look like "Dense Fog Advisory issued February 01 at 4:18AM AKST until February 01 at 12:00PM AKST by NWS".
More information about those alerts and sources can be found on the National Weather Service Website.