USER MANUAL GRAPH 35+E II CASIO
ACCESSORIES AND OPTIONS
PAPER
| Model | P1 (58mmW) | P-58807 (58mmW) |
| Applicable model | DR-models except DR-T1230-D140/DTR-T220All HR/FR-models | DR-T1230DR-T140DR-T220 |
INK-ROLL/INK RIBBON
INK-BOLL
| Model | IR-40 | IR-40T | |
| Applicable model | HR-BTE | FR-26500T | HR-100T |
| HR-BTM | FR-26500PLUS HR-26500T | HR-150T |
| FR-26500T | HR-100T |
| HR-100T | |
Standard accessory
included with product
Commercially available
no CASIO brand available)
Optionally available
BATTERY
SILVER OXIDE BATTERY
| Model | LR44/G-13 | LR45/LR41130/G-10 |
| Applicable model | AX-12V | DF-120T | DS-3V | Tx-85MS | Tx-3956P | MJ-100T | GX-12V | DW-120T | LC-160L | MS-87G | OH-300MS | SL-300TV | SL-797TV | |
| AX-120T | DF-320TM | DS-10V | Tx-115MS | J-120T | MJ-120T | GX-14V | HL-4T | LC-160VL | MS-107V | SL-100L | SL-315TE | SL-910TM | |
| AX-120T | DJ-20T | DS-10V | JS-120T | JS-120T | JP-130T | VS-120T | HL-4T | LC-160VL | MS-107V | SL-100L | SL-315TE | SL-910TM | |
| D-20L | DJ-120T | DX-12V | SX-570MS | JF-200T | MS-170T | GX-120V | HL-820L | LC-401VL | MS-207V | SL-160L | SL-320TE | SX-100 | |
| D-40L | DM-1200T | DX-120T | SX-820MS | JS-10T | MS-270T | | HL-820L | LC-403.0L | MS-80T | SL-300TE | SL-320TE | SX-220 | |
| D-40M | DM-1200T | DX-120T | JS-10T | JS-10T | JS-207T | | HL-820L | LC-403.0VL | MS-170T | SL-320VL | SL-320VL | SX-100 | |
| D-20M | DM-1400T | FC-200N | XJ-991E5 | FS-40V | MS-470LB | | HS-8LL | LC-1000T | MS-190TV | SL-220TE | SL-340TE | SX-300P | |
| D-40M | DM-1600T | x-T60P PLUS | XJ-991MS | JS-110T | NS-10T | | HS-8LL | LC-1000V | MS-150V | SL-240LB | SL-787L | SX-320P | |
| D-20M | DS-170T | XS-67S | JS-991E5 | JS-10T | NS-207T | | HS-8ML | MC-190L | MS-170L | SL-240ML | SL-787L | SX-320P | |
| D-120VT | DS-21V | x-J65ES | XJ-3650P | JS-140T | NS-310TM | | JW-120VT | MS-5VC | MX-120V | SL-300L | SL-797L | | |
LITHIUM BATTERY
| Model | CR2032 | CR2825 |
| Applicable model | ALGEBRA FX 2.0 PLUS | DR-1710 | tx-4800P | tx-9865G SD | FC-100 |
| CFX-9850GB PLUS | DR-1740 | tx-5000F | MJ-100 | SF-799 |
| CFX-9850GB PLUS | DR-1740 | tx-5000F | MJ-100 | WV-200 |
| CFX-9850GB PLUS | DS-120TV | tx-7400G Plus | SF-2000 | WM-200T |
| DL-120 | FC-200 | tx-9750G | SF-2500 | WM-220T |
| DL-220 | TX-1.5 Plus | SF-2500 | SF-3900 | |
| DL-240 | tx-4500PA | tx-9860G | SF-4990 | |
DRY BATTERY
| Model | AA | AAA |
| Applicable model | EA-100 | HL-4 | HR-8TM | KL-K65R | OH-9860 | ALGEBRA FX 2.0 PLUS | FX-9800P |
| Tx-B200 | HL-100LB | HR-100TE | KL-170 | CFX-9850GB PLUS | FX 1.0 PLUS |
| Tx-B25M | HL-120LB | HR-100TM | KL-780 | CFX-9850GC PLUS | yx-82ES |
| Tx-B25N | HL-120LB | HR-100TM | KL-780 | CFX-9850GC PLUS | yx-82ES |
| Tx-M95M | HL-815L | HR-150TM | MW-8V | ClassPad 300 | yx-9860G |
| Tx-100MIS | HR-815L | KL-60 | OH-10 | ClassPad 300PLUS | yx-9860S |
| | | | ClassPad 300PLUS | yx-9860D |
= 3 (UM-3), AAA=AM4(UM-4)
AC ADAPTOR
CABLE
| Model | AD-A60024 | AD-A60024 | AD-A60050B | AD-A95100 |
| Applicable model | EA-100 | HR-87M | HR-150TE | RM-7000 SET |
| EA-200 | HR-100TE | HR-150MT | RM-9000 SET |
| HR-80T | HR-100MT | RM-ClassPad Plus 1/85 | RM-ALGEBRA FX 2.0 SET |
PC-LINK CABLE
| Model | SB-87 | SB-87 |
| Applicable model | RAL-GEBRAF IX 2.0 SETRWA-9000 SETRWA-9000 SET | AL-GEBRAF FX 2.0 PLUSCFX-9650G PLUS FCFX-9650G PLUSCFX-9650G PLUSFX-9650G PLUSFXT-740G PLUS |
INTERFACE UNIT
| Model | FA-123/FA-123USB | FA-124USB | FA-129 | FA-129 |
| Applicable model | ALGEBRA FX 2.0 PLUSFX-985GGB PLUSFX-985GGB PLUSFX-91.0 PLUSFX-7400G PLUSFX-975G0FX-975G0 PLUS | 1x-986G0x-986GSD | SF-4990 SF-4990 SF-7990 | |
DATA TRANSFER CABLE
| Model | SB-62 | SB-62 |
| model | CFX-9850GB PLUS | ALGEBRA FX 2.0 PLUS |
| CFX-9850GC PLUS | FX 1.0 PLUS |
| CFX-9850GB PLUS | tx-9860 |
| EA-20 | ALGEBRA SD |
| EA-200 | RM7000 SET |
| tx-7400G PLUS | RM7000 SET |
| tx-7400G | RM-ALGEBRA FX 2.0 SET |
| tx-9750G PLUS | RM-ClassPad Plus SET |
| tx-580GP | |
CASIO
CASIO COMPUTER CO.,LTD.
Tokyo, Japan
*Designs and specifications are subject to change without notice.
BS0608-035001A DI Printed in Japan/Printed on recycled paper
CASIO


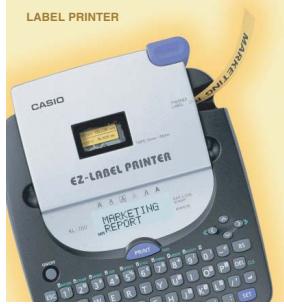
LABEL PRINTER
OFFICE & SCHOOL & HOUSEHOLD EQUIPMENT
ELECTRONIC
CALCULATORS
General Catalogue 2006-2007
http://world.casio.com
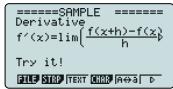
FUNCTION SYMBOLS
Scientific Calculator / Financial Consultant

Number of functions

Natural textbook display
Natural textbook display Display expression same as textbook

S-V.P.A.M.
The CASIO S-V.P.A.M. series was developed with
the mathematics classroom in mind . It gives youall the features of the existing V P A M series .
plus a new 2-line display and a useful Replay
function. All this helps to make mathematics
easier to use and easier to understand than

V.P.A.M.
V.P.A.M. models let you input calculations exactly
as they are written. Calculation status symbols and intermediate display capabilities help make
and intermediate display capabilities help make calculations easier.

STAI-data editor
Back-step viewing and editing of input data

10
10+2 10-digit mantissa + 2-digit exponential display.
Colour Colour display
Data is shown in three colours for quick and
easy comprehension.
MENI Specify the operation you want to perform by
selecting an icon or inputting a number.
Dot Dot matrix display
MATBIX High-resolution screen provides beautiful
looking graphs every
Two-way power (Solar + Battery)
Solar powered in sunlight, battery powered when lighting is low.
when lighting is low.
Data communication with a
personal computer
Allows data communication with a personal computer.

Best view
Larger display characters are easier on the eyes.
aking some of the fatigue out of your work.
Super solar
Solar cell powers calculations even when lighting is
relatively dim.
Plastic keys
Designed and engineered for easy operation.
Profit margin percent
key gives quick access to prices and profits, and
also delivers add-ons, discounts, ratios,

n command signs
A symbol (+, -, +, +) on the display indicates the type of operation you are currently performing.
Practical Calculator / Printing Calculator
Larger display makes more data easier to read.

Big display
Big, easy-to-read display

Best view
Larger display characters are easier on the eyes, taking some of the features out of various ways.
taking some of the fatigue out of your work.
Two-way power (Solar + Battery)
Solar powered in sunlight, battery powered when lighting in law.

Super solar Solar cell powers
lighting is relatively dim.

Key rollover
Key operations are stored in a buffer, so
nothing is lost even during high-speed input.

Plastic keys


Rough cover status up to rough treatment

Tax & exchange function
Exchange Tax calculation and currency conversion functions.
TAY Tax cal
TAX Automatic calculation and printout of price also tax price loss tax discount or津贴
plus tax, price less tax, discount, selling price, tax amount, discount amount, and
price; tax amount margin amount
Time calculation
Time calculation allows easy input and
calculation of hour, minute, and second values.
Conversion Metric conversion function
Conversion between metric units and another
measurement unit.
Profit margin percent
%key gives quick access to prices and
96 profits, and also delivers add-ons, discounts
ratios and increase/decre
MARK-UP MARK-UP PERCENT 86
%Key provides instant access to prices and profits, mark up, add one, discounts
and profits, mark-ups, add-ons, discounts ratios and increase/decrease values.
Regular percent
Regular percentage calculations
Regular percentage data
× 1 Function command signs
A symbol (+, -, ×, +) on the display indicates
the type of operation you are currently
performing

Super command signs
Big, easy-to-read command signs show your current position at a glance.

Mark-up / Mark-down
MD All the mark-up/mark-down capabilities of

profit calculation

steps check
Displays up to 120 previous calculation steps.

inting
Line printing for higher speed, superior print
quality, and quieter operation.
2-colour printing
Positive values are shown in black, and
values are shown in red for easy checking.

values are displayed in red for easier
negative value understanding.

- per-second printing indicates the number of ink

a.
Double-injection keys
Keys are produced by injecting plastic of two different
colours: Keymarkings are plastic, which means they do not wear or fade with use.
is not weak or dense with use.
Digital Diary

Multi-lingual messages

In addition to English, you get a choice of

other languages for message displays.

Backlight display

Easy reading, even in the dark.

m - 1 0 ;

Telephone directory
Enter the first letter of a name to recall
the name in an instant (Initial
Data is sorted auto
alphabetical order.
Schedule Schedule keeper
Keep track of appointments by entering the
day, month, and year
Memo Memo function
Store text data such as price lists, airplane
schedules, movies schedules, conc
schedules, anniversaries, and more.

Keep track of daily tasks, checking off
items as you complete them
Calendar function
A collection of calendars up to the year 2099.
World time
Find out the current time in virtually any
location on the globe
Data communicati
personal computer
Allows data communication with a personal
computer.

Secret memory area
The secret memory area keeps personal data
private. Once a password is registered, data
is locked away until the password is used to access the secret area.
access the secret area.

Alarm
A message appears and a buzzer sounds
when a scheduled appointment time arrives.
Metric conversion function
Conversion between metric units and another
measurement unit.

cy conversion function

inversion between two monetary units.

on command signs.
A symbol (+, -, ×, +) on the display indicates the
type of operation you are currently performing.
CATEGORY INDEX
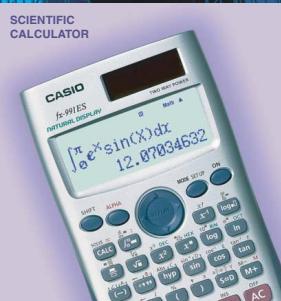
SCIENTIFIC CALCULATORS
Scientific Calculator
Scientific Advisor Financial Consultant
Tools for the classroom, the research laboratory, and everywhere in I
Tools for the classroom , the research laboratory , and everywhere in IQuick solutions to complex financial calculations at your fingertips
Quick solutions to complex financial calculations at your fingertips.


PAGE3
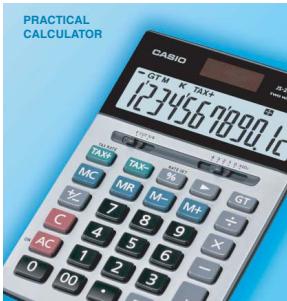
PRACTICAL CALCULATORS
A full lineup of easy-to-use models to meet a variety of different needs.

PAGE14
PRINTING CALCULATORS
Printouts of results along with each calculation step can be attached to documents.

PAGE27
DIGITALDIARY
Packed with a host of powerful data management features.

PAGE28
OTHER PRODUCT INFORMATION
PAGE29
MODEL INDEX Red numbers indicate new models.
| Model | Page | Model | Page |
| A | | DX-120V | 23 |
| ALGEBRA FX 2.0 PLUS...6 | | B | |
| AX-12V | 24 | EA-2 | 10 |
| AX-20TV | 24 | EA-200 | 10 |
| AX-120V | 24 | F | |
| C | | FA-123USB | 10 |
| CFX-9850GC PLUS...6 | | FA-129 | 27 |
| ClassPad 300Plus...3 | | FA-CP300A/B Ver. 3.0 | 10 |
| CD | | FC-100V | 7 |
| DL | | FC-200V | 7 |
| D-40L | 18 | FR-2650DT | 25 |
| D-60L | 18 | FR-2850T | 25 |
| D-120TV | 18 | f-CC-SUS L | 7 |
| DF-120TV | 18 | f-85 | 9 |
| DF-320TM | 15 | f-82ES | 8 |
| DF-32T | 15 | f-82BS | 9 |
| DJ-120T | 15 | f-82MS-BU | 8 |
| DJ-220 | 15 | f-85ES | 8 |
| DJ-240 | 15 | f-85MS | 9 |
| DJ-220T | 17 | f-95MS | 9 |
| DM-120TEV | 18 | f-100MS | 9 |
| DM-1400TV | 18 | f-104MS | 9 |
| DM-1600TV | 17 | f-350ES | 8 |
| DR-120LB BY... | 25 | f-350MS | 9 |
| DR-120LB WE... | 25 | f-350ES | 8 |
| DR-40L | 26 | f-570ES | 8 |
| DR-210HT | 26 | f-570MS | 9 |
| DR-220HD | 26 | f-820MS | 9 |
| DR-240HT | 26 | f-90MS | 9 |
| DR-270HT | 26 | f-991ES | 8 |
| DR-121CLA | 26 | f-991MS | 9 |
| DR-121DZ | 26 | f-992E | 9 |
| DR-114Q | 26 | f-3650P | 7 |
| DR-722Q | 26 | f-3950P | 7 |
| DS-TV | 17 | f-4580TA | 7 |
| DS-TV | 17 | f-4800P | 7 |
| DS-3V | 17 | f-5500LA | 7 |
| DS-3V | 17 | f-7500PT | 7 |
| DS-10TV | 17 | f-7400 PLUS | 6 |
| DS-120TV | 17 | f-9750SO | 6 |
| DS-120TV | 16 | f-9880SO | 5 |
| DS-120TV | 16 | f-9880G Manager Plus...10 | 5 |
| DS-120TV | 16 | f-9880SD | 5 |
| Model | Page |
| G | |
| GX-12V | 23 |
| GX-14V | 23 |
| GX-17V | 23 |
| GX-120V | 23 |
| H | |
| HL-4 | 22 |
| HL-100LB | 22 |
| HL-80LB | 22 |
| HL-81SLBK | 22 |
| HL-81SL WE | 22 |
| HL-81SL AB | 22 |
| HL-820VL we | 22 |
| HL-820VA | 22 |
| HL-87M-8K | 25 |
| HL-87M-GY | 25 |
| HL-100TML | 25 |
| HL-100TML | 25 |
| HS-8LV we | 22 |
| HS-8LV we | 22 |
| HS-8VA | 22 |
| JF-20TV | 19 |
| JF-120TV | 19 |
| JF-200TV sk | 14 |
| JF-200TV W | 14 |
| JF-200TV RD | 14 |
| JS-10TV | 19 |
| JS-10TV | 19 |
| JS-40V | 19 |
| JS-110TV | 19 |
| JS-110TV | 19 |
| JS-140V | 19 |
| JW-120TV | 19 |
| JZ-12W | 15 |
| X | |
| HX-60 | 28 |
| KL-60SR | 28 |
| KL-170 | 28 |
| KL-780 | 28 |
| Model | Page |
| L |
| LC-160VLw | 21 |
| LC-160VLwve | 21 |
| LC-160VLwve | 21 |
| LC-401LVw | 21 |
| LC-403VT | 21 |
| LC-100VT | 21 |
| M |
| MC-100 | 15 |
| MJ-100T | 15 |
| MJ-120T | 15 |
| MC-VS | 14 |
| MS-VSCON | 14 |
| MS-VSCPL | 14 |
| MS-VCT | 14 |
| MS-8VT | 20 |
| MS-10VT | 20 |
| MS-120VT | 20 |
| MS-10VCN | 14 |
| MS-10VCe | 14 |
| MS-120C | 14 |
| MS-20VT | 20 |
| MS-80VT | 20 |
| MS-120VT | 20 |
| MS-120VT | 20 |
| MS-170T | 20 |
| MS-170T | 20 |
| MS-310TM | 16 |
| MS-470LB | 20 |
| MK-20VT | 20 |
| MW-SVw | 20 |
| MW-8VTw | 20 |
| MW-8VTwve | 20 |
| MX-12VT | 24 |
| MX-120VT | 24 |
| N |
| N-10T | 20 |
| NS-20T | 20 |
| NS-310TM | 16 |
| O |
| OH-300ES | 10 |
| OH-300ESw | 10 |
| OH-9860 | 10 |
| Model | Page |
| B |
| RM-ALGEBRA FX 2.0 SET 10 |
| RM-ClassPad PLUS SET 10 |
| RM-9000 SET 10 |
| RM-9000 SET 10 |
| S |
| SF-2500 | 27 |
| SF-2501 | 27 |
| SF-4990 | 27 |
| SF-6990 | 27 |
| SF-8990 | 27 |
| SL-100L | 21 |
| SL-100VCse | 14 |
| SL-100Vcc | 14 |
| SL-200TE | 27 |
| SL-210TE | 21 |
| SL-220TE | 21 |
| SL-300LB | 21 |
| SL-300LV | 21 |
| SL-300TV | 21 |
| SL-320TV | 21 |
| SL-320TV | 21 |
| SL-340VA | 21 |
| SL-340VB | 21 |
| SL-760LB ax | 22 |
| SL-760LB bcc | 22 |
| SL-760LB bcc | 22 |
| SL-767TV cc | 22 |
| SL-767TV cc | 22 |
| SL-767TV bc | 22 |
| SL-910TM | 16 |
| SL-1000TV ac | 14 |
| SL-1000TV ab | 14 |
| SL-1000TV ro | 14 |
| SX-100 | 24 |
| SX-300 | 24 |
| SX-300P | 24 |
| SX-320P | 24 |
| SX-320P | 24 |
| MX-220T | 16 |
| WM-200T | 16 |
| WM-220T | 16 |
SCIENTIFIC CALCULATORS
Scientific Calculator Tools for the classroom, the research laboratory, and everywhere in between.
Financial Consultant Quick solutions to complex financial calculations at your fingertips.
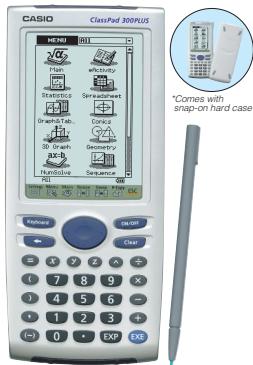
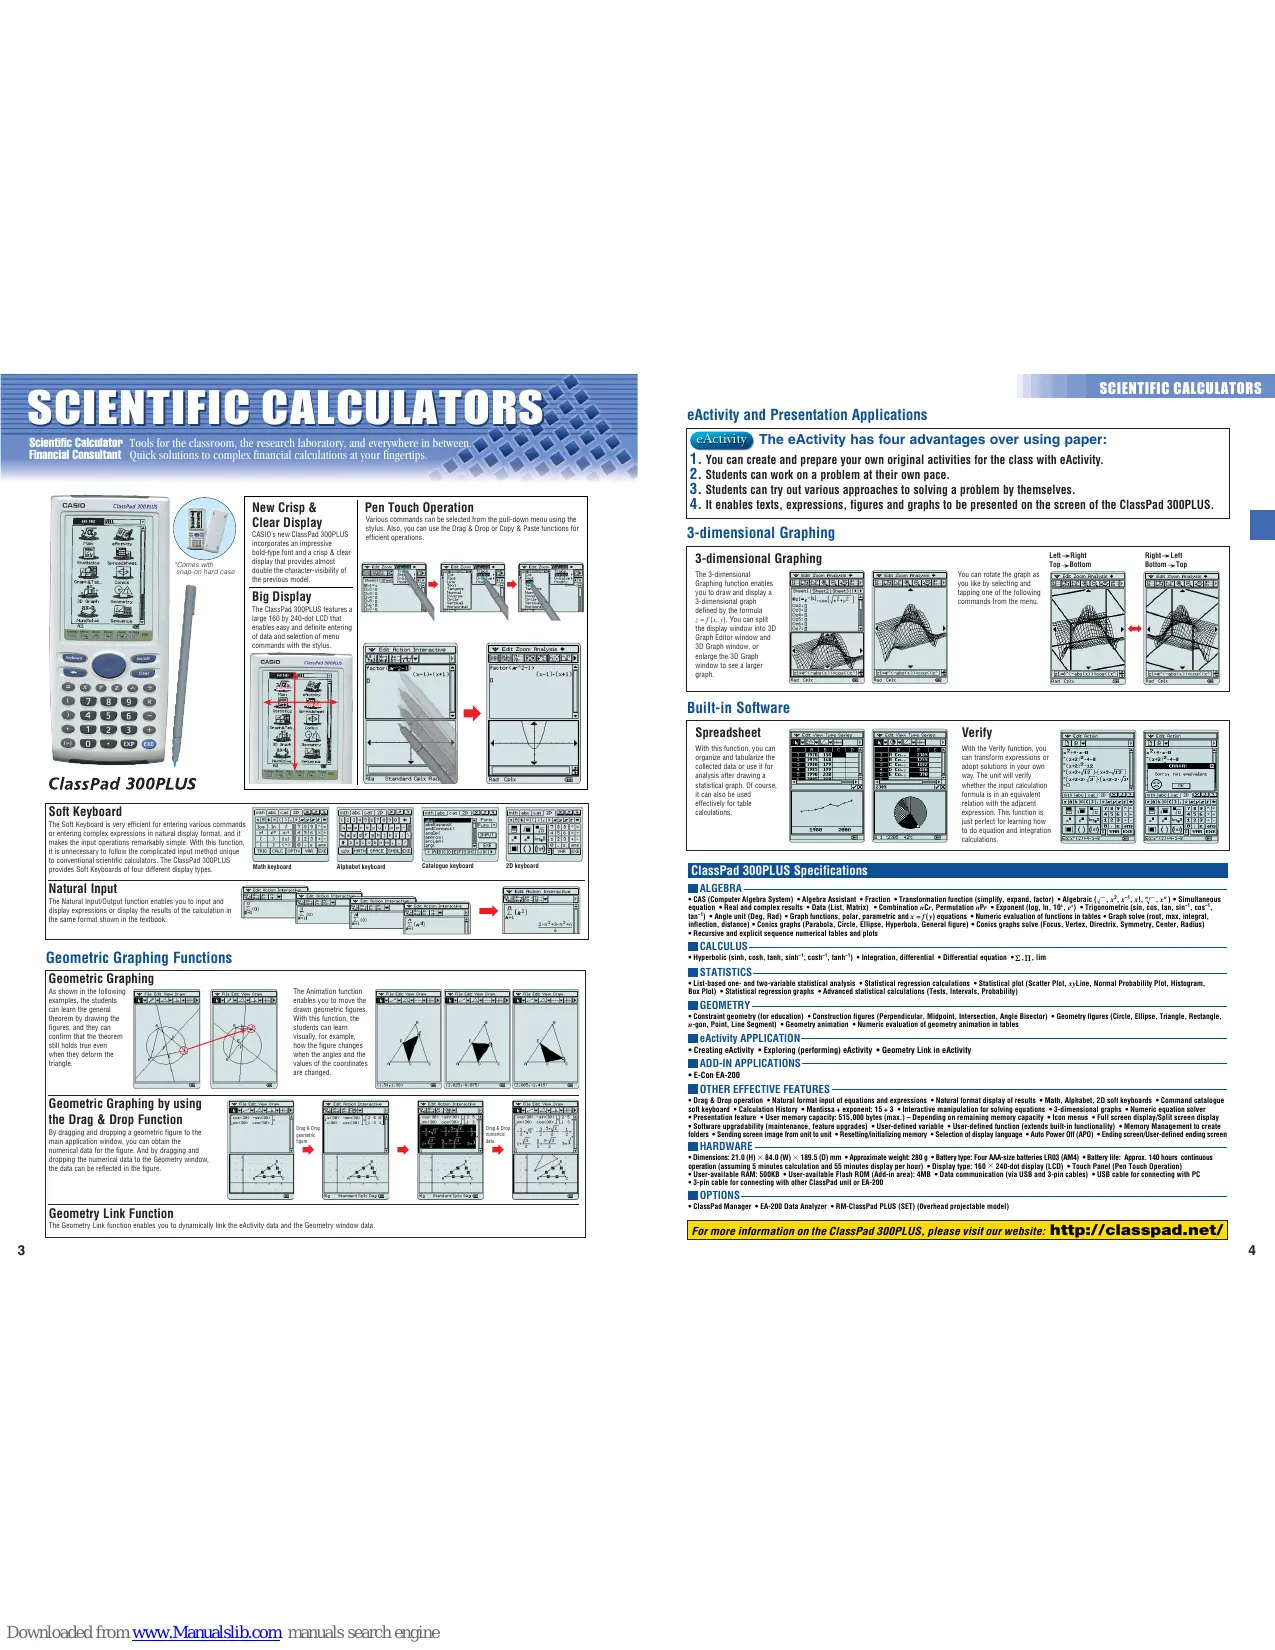
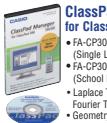
ClassPad 300PLUS
New Crisp & Clear Display CASIO's new ClassPad 300PLUS incorporates an impressive bold-type font and a crisp & clear display that provides almost comparable the visibility of the previous model.
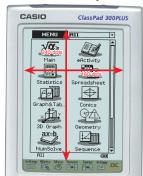
Big Display The ClassPad 300PLUS features a large 160 by 240-dot LCD that enables easy and definite entering and exit of the menu commands with the stylus.
Pen Touch Operation
Various commands can be selected from the pull-down menu using the Command面板 to use the Drag & Drop or Copy & Paste functions for efficient operations.
:
Catalogue keyboard
2D keyboard
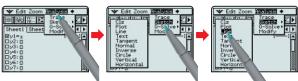
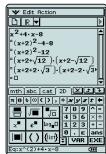
Soft Keyboard
The Soft Keyboard is very efficient for entering various commands or entering complex expressions in natural display format, and it makes the input operations remarkably simple. With this function, it is unnecessary to follow the complicated input method unique to conventional scientific calculators. The ClassPad 300PLUS provides Soft Keybords of four different display types.
The Natural Input/Output function enables you to input and output data in a single step. The use of the calculation in the same format shown in the textbook.

Math keyboard
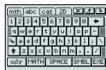
Alphabet keybarn
Catalogue keyboard
2D keyboard
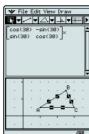
Geometric Graphing Functions
Geometric Graphing
As shown in the following examples, the students can learn the general theorem by drawing the theorem on them. They can confirm that the theorem still holds true even when they deform the triangle.
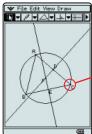
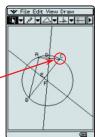
The Animation function enables you to move the drawn geometric figures. The students can learn
visually, for example, how the figure changes when the angles and the coordinates of the coordinates are changed.


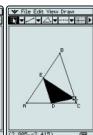
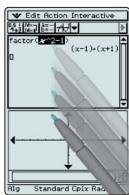
Geometric Graphing by using the Drag & Drop Function
By dragging and dropping a geometric figure to the main application window, you can obtain the numerical data for the figure. And by dragging and dropping a geometric figure to the main geometry window, the data can be reflected in the figure.


Geometry Link Function
The Geometry Link function enables you to dynamically link the eActivity data and the Geometry window data
eActivity and Presentation Applications
eActivity
The eActivity has four advantages over using paper:
- You can create and prepare your own original activities for the class with eActivity.
- Students can work on a problem at their own pace
- Students can try out various approaches to solving a problem by themselves.
- It enables texts, expressions, figures and graphs to be presented on the screen of the ClassPad 300PLUS.
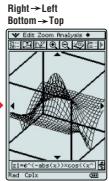
3-dimensional Graphing
3-dimensional Graphing
The 3-dimensional Graphing function enables you to draw and display a 3-dimensional graph defined by the formula z = f(x,y) . You can split the display window into 3D Graph Editor window and 3D Graph window, or the 3D Graph Editor window to see a larger graph.

You can rotate the graph as you like by selecting and tapping one of the following commands from the menu.

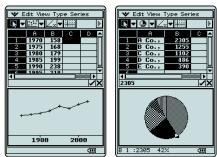
Built-in Software
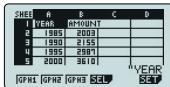
Spreadsheet
With this function, you can organize and tabulate the collected data or use it for analysis after drawing a statistical graph. Of course it can also be used effectively for table calculations.
Verify
With the Verify function, you can transform expressions or adopt solutions in your own way. The unit will verify whether the input calculation formula is in an equivalent relation with the adjacent equation. This function is just perfect for learning how to do equation and integration calculations.

ClassPad 300PLUS Specifications
ALGEBRA
C (Computer Algebra System) · Algebra Assistant · Fraction · Transformation function (simplicity, expand, factor) · (Algebra^-1, x^2, x^3, x^4, x^5, x^6, x^7, x^8, x^9) · Simultaneous equation · Real and complex results · Data (List, Matrix) · Combination n , Permutation n , · Exponent (log, In, 10, e^x ), Trigonometric (sin, cos, tan, sin, cos), ^x , ^x · Angle unit (Deg, Rad) · Graph functions, polar, parametric and x = f(x) equations · Numerical evaluation of functions in tables + Graph root (slope, max, integral, inflection, distance) · Conics graphs (Parabola, Circle, Ellipse, Hyperbola, General figure) · Conics graphs solve (Focus, Vertex, Directria, Symmetry, Center, Radius)
CALCULUS
Hyperbolic (sinh, cosh, tanh, sinh ^-1 , cosh ^-1 , tanh ^-1 ) Integration, differential Differential equation , ,
STATISTICS:
- List-based one- and two-variable statistical analysis · Statistical regression calculations · Statistical plot (Scatter Plot, xyLine, Normal Probability Plot, Histogram, Box Plot) · Statistical regression graphs · Advanced statistical calculations (Tests, Intervals, Probability)
GEOMETBY
- Constraint geometry (for education) Construction figures (Perpendicular, Midpoint, Intersection, Angle Bisector) Geometry figures (Circle, Ellipse, Triangle, Rectangle, n -gon, Point, Line Segment) Geometry animation Numeric evaluation of geometry animation in tables
eActivity APPLICATION
- Creating eActivity - Exploring (performing) eActivity - Geometry Link in eActivity
ADD-IN APPLICATIONS
E-Con EA-200
OTHER EFFECTIVE FEATURES
- Drag & Drop Operation → Natural format input of equations and expressions → Natural format display of results of * Math, Alphabet, 2D soft keyboards → Command catalogue soft keyboard → Calculation History → Mantissa + exponent: 15 + 3 → Interactive manipulation for solving equations → 3-dimensional graphs → Numeric equation solver → Presentation feature → User memory capacity: 515,000 bytes (max.) - Depending on remaining memory capacity · Icon menus → Full screen display/Spilt screen display → Displaying the user's name → Displaying the user's address → Displaying the user's phone number → Displaying screen image → Setting screen image from unit to unit → Resetting/initializing memory → Selection of display language → Auto Power Off (APD) → Ending screen/User-defined ending scre
HARDWARE
Dimensions: 21.0 (H) × 84.0 (W) × 199.5 (D) mm × Approximate weight 280g Battery Type: Four AAA-size batteries LR30 (AM4) Battery life: Approx. 140 hours continuous operation (assuming 5 minutes calculation and 55 minutes display per hour) × Display type: 160 × 240-dot display (LCD) × Touch Panel (Pen Touch Operation) × User-available RAM: 500KB × User-available Flash ROM (Add-in area): 4MB × Data communication (via USB and 3-pin cables) × USB cable for connecting with PC × 3-pin cable for connecting with other ClassPad unit or EA-200
OPTIONS
ClassPad Manager EA-200 Data Analyzer RM-ClassPad PLUS (SET) (Overhead projectable model)
For more information on the ClassPad 300PLUS, please visit our website: http://classpad.net/
Graphic Models with Flash Memory
An innovative approach for the
math & science class environment


*Comes with new slide-on hard case
Free Add-in software for fx-9860G series
E-CON2 Physium Geometry
fx-9860G SD fx-9860G
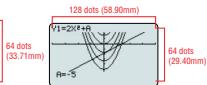
Hardware Features: High-resolution LCD
The xf-9860 series features a sharp, crisp display of the high-resolution LCD with enlarged display area and a wide range of display settings. The display is also suitable for large displays. The clear, eye-friendly, large-sized 64 × 128 dot display improves the efficiency of study.

128 dots (67.44mm)
1x-9750G PLUS
tx-9860G series
Software Features
Just like writing in a notebook, fractions, roots, powers and integrals can be input and display to the student. The first part of this text is organized as follows: "I want to show you how to use the student. Also, it displays the result of the fraction calculation as it is shown in the textbook."
eActivity
This unit is equipped with the popular eActivity function of the ClassPad 300. The innovative eActivity functions of the ix-980G series allow the students, not to mention teachers, to create their own problems or study materials. With this function, students can learn at their own pace and complete a variety of tasks. The main purpose of this unit is to develop the concept of the eActivity function, motivation for learning and understanding can be greatly improved.

Built-in Software
Table calculations come easy with the built-in Spreadsheet function Since the multi-function Spreadsheet ever includes a built-in Graphing Function, it can be used to create a variety of graphical functions.

High-speed CPU
By employing high-performance, high-speed CPU, the fx-9860G series remarkably accelerated the processing speed. The speed increased dramatically compared to conventional models.
A large capacity 1.5MB Flash Memory
With an ample 1.5MB Flash Memory, various data and applications can be downloaded and stored without worrying about memory capacity.
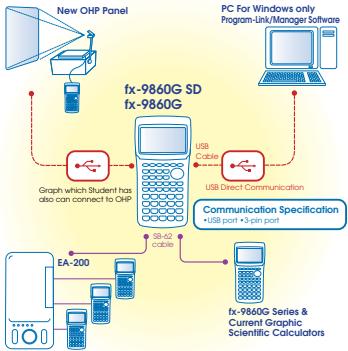
- Ready-to-use USB functions
Since USB cable, unit-to-unit cable and Program-Link Software are included in the package, the USB cable is not included in the package. The USB cable can be used for communication and program exchange can be performed immediately from the day of purchase.
-SD Card Slot (SD model only)
The fx-9860G SD is equipped with a SD card slot which allows easy data exchange.

Peripheral environment

Large display (128x64 dots)
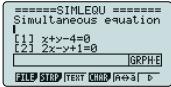
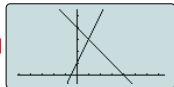
Algebra Applications (Computer Algebra System, Algebra, Tutor) Graphic functions & Graph solve functions Dynamic graph Dual graph (Graph & Table, Graph & Graph) Convex functions Linear equations List function & list-based statistics Statistic calculations & graphs Graph solve Integrations Differential and quadratic differential calculations BASIC-like program functions Linear equations from 2 to 30 unknowns 2 to 30 order equations Matrix operations with complex numbers Base- n calculations/conversions Add-in application with Flash Memory Includes a connecting cable for data transfer between two units Data communications (requires separately available FA-123/FA-123/USB)

*Comes with slide-on hard case
Main Functions
Algebra Applications
Compute
compdor
Using the Computer Algebra System (CAS), students can factor expressions, find limits of functions and calculate derivatives. The CAS is a computer program that uses a set of rules. CASO's CAS is based on the CASO's original algebra system and enhanced by our R & D team. Professor John Kenely and other researchers have contributed to the development of this system.

Algebra
Application helps students manipulate equations.
ALOEBNOLM is a tool that helps students to solve themselves in an attempt to arrive at the correct solutions.
ALOEBNOLM can be used in Turtor application, they can

Tutor —

Auto Mode Material Mode -Verity Mode
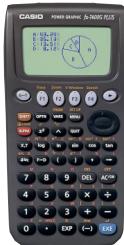
Graphic Models
COLOUR POWER GRAPHIC

*User memory capacity 61,000 bytes
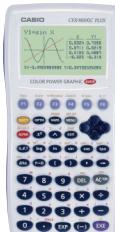
CFX-9850GC PLUS

*Comes with snap-on hard case
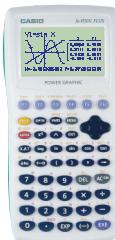
POWERGRAPHIC


Main Ei


aph
List-based statistics
Store a list of values in memory for us when performing function and statistics, when drawing graphs, or when generating tables of numeric values.
Advanced statistics
t-test, confidence interval, probability analysis, and other calculations and graphing

2-sample F-test graphing
Displays shown are CFX-9850GC PLUS
POWERGRAPHIC

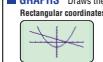
Large display (80 x 48 dots) Graphic functions (Rectangular coordinate graph, Parameter graph, Inequality graph, Integration graph, Statistical analysis, Graphical analysis, Graphics, Sketch function) Table and graph List data function & list-based statistics -Differentials -Fraction function BASIC-like program functions -Basic-like program
*Corres with snap-on hard case
fx-7400G PLUS
Large 3-color display (128 x 64 dots) (CFX-9850GC PLUS) × Large display (128 x 64 dots) (bx-9750G PLUS) × Graphic functions (Rectangular coordinate graph, Polar coordinate graph, Parameter graph, Inequality graph, Integration graph, Statistical graph) × Dynamic graph × Dual graph × Conic graph × Regression graph (Logistic regression graph, Sinusoidal regression graph, Linear regression graph, and more) × Graph solve × Integrations × Differential and quadratic differential calculations × Complex analysis × Convex analysis × Advanced statistics × Advanced statistics × BASGE-like program functions × Linear equations from two to six unknowns × Quadratic equations, Cubic equations × Matrix operations × Base-n calculations/conversions × Financial function × Data communications
Main Functions
■GRAPH

using types of graphs.

TRIGONOMETRY Perform calculations for trigonometric & inverse trigonometric functions.
■ STATISTICS
Standard Deviation
Performs calculations of single-variable statistical data and graphs the result.

1 Histogram


Regression
Performs calculations of paired-variable statistical data and graphs the result
SCIENTIFIC CALCULATORS
SCIENTIFIC CALCULATORS
Programmable Models
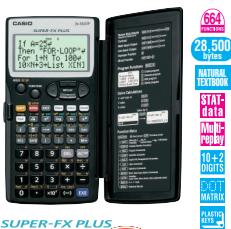

SUPER-FX PLUS
fx-5800P
Natural Textbook Display & MORE POWERFUL Program Functions
-
Program function Matrix calculations Differential and integration Recursions Solve function Analysis Simulation
-
Data transmission between two × 5000 computers
26 - 2398 variable memories Fraction calculations
10.4 Scientific correlations 22 decade in formulation Standard deviation, Regression analysis) An inte
hard case swings back a full 360 degrees.
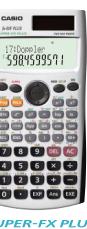

SUPER-FX PLUS fxF-50F PLUS NEI
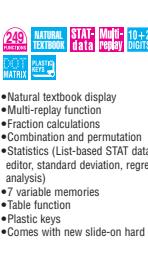
BASIC-like Program, Perfect Algebraic Method, 2-line Display, Multi-replay Function
- Program function - Multi-replay function
- 2-line display - Fraction calculations
- Combination and permutation - 23 built-in formulas - 40 scientific constants - Statistics
(S)TAI-RAID editor, Shiftdown command.
(S)TAI-RAID editor, Shiftdown and Open/Close memories.
Plastic keys Comes with slide-on hard case

SUPER-FX
fx-3650P

SUPER-FX f_x - 3950P
Multi-replay Function, 2-line Display, Perfect Algebraic Method
- Program function Multi-replay function 2-line display
- Fraction calculations Combination and permutation Differential equations Linear equations Matrix calculation Regression analysis Base-n calculations/ conversions Logical operations Complex number calculations 7 variable memories Linear algebra Linear algebra
fx-4500PA
2-line display and program file system
-2-line display shows formulas and results simultaneously.
- High utility variation of program steps (1,103 - 7) and data memories (26 - 163) + Program file system for storing multiple programs - Replay function - Engineering symbol calculations - Formula memory - Integrations - Statistics - Programming language - Programming language - Code - Calculations/conversions - Logical operations
School Cal
Plastic keys and protective hardcase provide the best of operation and durability

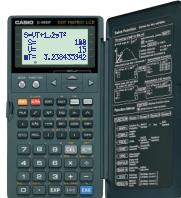
fx-4800P
Easy-to-read 4-line display and solve function
- Solve function Formula storage and Table function Programming function with filename Analysis Analysis with calculations Differential and integration Sigma calculation Recursions An integrated hard case Simulation Analysis
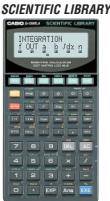

fx-5500LA
6-function scientific library built into 2-line display shows formulas and results.
simultaneously. Reply function Engineering Analysis Modeling Analysis (10 steps) Matrix operations Equations Integrations Complex number calculations Base- n calculations Matrix calculation Statistics (Standard deviation, Regression analysis).
Financial Consultant

The new Financial Consultant solves the riddles of financial calculations with its powerful & exclusive built-in functions.
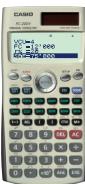

FINANCIAL CO EC-201
ULTANT FINANCIAL CONSULTANT V EC-100V
SL-450L
Display:LCD ± Digit8:Simple algebraic logic ± Independent memory % ^+ Profit margin % . · -+3-digit comma markers Power supply: solar
Dimensions:7.8(H) × 67(W)× 120(D) mm Approximate weight:47 g
- Plastic keys - Comes with new slide on hard case - Power supply: Solar cell and a single G3 type button battery (LR44) (FC-200V)/ One AAA-size battery (FC-100V) - Approximate battery life: 3 years (1 hour of operation per day) (FC-200V) 17,000 hours continuous display of flashin the camera. Battery power: FC-12/12 h (80W×60W×1610 mm). Anapproximate weight:FC-200V 105 g, FC-100V 110 g
Direct mode key and new operation By pressing these built-in Direct Mode Keys, you can swiftly enter into exclusive modes when executing each command. The first two keys are the same as in the above, incorporate a full-dot-4 line display allowing easy input, confirmation, change and correction of each parameter. The third key is also convenient 3-digit comma-markers display function.


Standard Models
Natural Textbook Display Models
CASIO's unique "Natural Expression Input Display" and "Natural Expression Result Display" functions allow the display of expressions of fractions, exponents, logarithms, powers and square roots just as they are written in the textbook. As a result, it enhances the comprehension of the students and improves the efficiency of the math class.
Natural input
Allows the natural input of exotics to be used, but they are
··
Natural output Allows the natural display of the natural system.
Full dot display
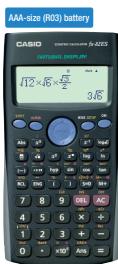
f_x - 82ES

f_x - 85ES
fx-350ES
nctions of 500ES:
Equation calculations


1:snx+bnY+cnz=dn 2:anx+bnY+cnz=dn
A=

A1
A2
-1+1414213562j
-1=1.414213562i

1
A1
A. 2^k = 1
A3

14 10 12 15 17 19 20
13/14
Added functions of the Fe - 99ESI/570EIS
Equation calculations · Integration/differential calculations
- Matrix calculations - Vector calculations - Complex number calculations
CALC function · SOLVE function · Base- n calculation

21%dx
1 + u1 - 1 = ( 1 + u) u1 < 1 = u
Complex number calculations
BIMOL
3+2 2+i
-+

(sinx))x=
Matrix operations
MACCIMX2 1:3x3 2:3x2
3:3x1 4:2x3
5:2x2 6:2x1

1
-1
中
1
1 4 9 5j
SCIENTIFIC CALCULATORS
SCIENTIFIC CALCULATORS
Standard Models
AA-size battery
fx-82MS

fx-82MS-BU
Button-type battery
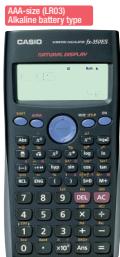
fx-350MS

Two-way power
fx-85MS

240 S-VAMI STATE MULTI-PL ay
Multi-replay function
-2-line display
Fraction calculations
Combination and permutation Statistic (STAT) data editor
- Statistics (STAT) data editor, Standard deviation. Regression
analysis)
9 variable memories
Plastic keys
- Comes with slide-on hard case
AA-size battery
fx-95MS

241 $VAM STATIAN
STO 10,Short Term Trading
Added functions of
the fx-95MS:

Two-way power
fx-991MS

AA-size battery
fx-100MS

Two-way power
fx-115MS

600.SVLAJSTAT1-1M
Added functions of
the fx-100MS/115MS.
Equation calculations

two-way power
f_x - 992s

12x - 1 > 0
mes with slide-on
t-in complex
t-III complex
ner calculations, 128 scientific
126 Solving 3stants
Stints
Statistical calculations, engineering symbol
lations · Base- n lations/conversions
Two-way power
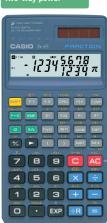
fx-65

The scientific
calculator with true
fraction display
Fraction reduction
Permutation and combination
Intense division
- Integer division
-
Cube roots
-
Back space key -Cube
-
Comes with slide-on hard
Two-way power
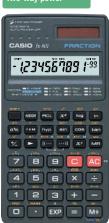
fx-901

150 10+2 FIGURES DIGITS
hard case
Calculators in the Classroom
Supporting options for graphic scientific calculators
SUPPORT
CLASSROOM
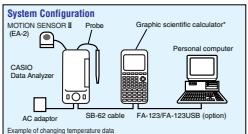
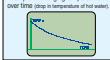
Data Analysis System
Quick and accurate data accumulation assists analysis in intensive studies.
Collect data at rates of up to 50,000
per second for up to 120,000 points. aAll flash DPM for recording function running
- All flash-Row for upgrading function version.
- Compatible with the CASIO by 7400 series.
Compatible with the CASIO 1x-7400 series, CFX-9850 series, ALGEBRA FX 2.0 series.
x-8060 series, ALGELNA 1X 20 series, xh-9860 series, and ClassPad 300 series.
Includes:
CASIO Data Analyzer
- Temperature probe
Optical probe
Voltage probe
- Data communication c
- AC adaptor: AD-A6002
- AB adaptor
- Soft case
Four AA-size alkaline batteries
C:\test\2009\US\1000\Windows-2009\Linux\Windows-2009\Windows-2009\Windows-2009\Windows-2009\US\1.0\CSF\Windows-2009\US\48652.CSF
C:\test\2009\US\1000\Windows-2009\Linux\Windows-2.0
C:\test\2009\US\1000\Windows-2009\Linux\Windows-2.0
C:\test\2009\US\1000\Windows-2009\C\US\1.0\CSF\Windows-2009\C
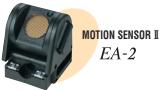

The EA-2 emits ultrasonic pulses and detects the presence of a 3D waveguide. The waveguide can be connected to the CASIQ EA-200 Data Analyzer (CASIQ) software [1].
Graphic Scientific Calculator Projection Set
All the functions of the CharDB 30qnpUS

All the definitions of the CEPRA E2.0 plus
Includes:
=1000000000000000000000000000
- Graphic scientific unit: 211-01-P-211-01
HM-ClassPad PLUS (same functions as
functions as ClassPad 300Plus (US)
Projection unit OH-30
- Data transfer cable: SB-62
PC-Link cable:USB
- Carrying bag
- Graphic scientific unit: 211-01-P-211-01
HM-ClassPad PLUS (same functions as
functions as ClassPad 300Plus (US)
Projection unit OH-30
PC-Link cable
- Carrying bag

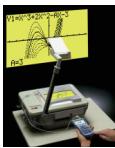
This optional set allows
the displayed contents of the
the calculation to be projected onto a wall.
projected onto a wallscreen , an effective
function in classrooms.
The set unit mounts on 1-20V units
the OHP and can beremate controlled by a
Remote controlled by a hand-held calculator.
OHP Projection Model
All the functions of the CCK-RESOPLC PLUS
H-9860
OH-9860 activates
class activity
By connecting the fx-9860G SD or
fx-9860G to the optional OHP unit
with a USB cable, you can project
the displayed contents of the fx-unit
on the screen. With this function,each student can make a
each student can make apresentation in the class or teacher
presentation in the class of teacherscan use it as a powerful tool for
teaching. Thus, the application of the
unit broadens, class activities will be
activated, and the efficiency of homogenized oil production.
learning and the student's understanding will be improved.
Includes:
- Graphic scientific unit:
RM-9000 (same functions)
as CXF-9850G PLUS) "CEK-9650G PLUS functions can be
replaced with fo-7400G PLUS
Functions using data on the funded CD-ROM
Projection unit: OH-15 Data transfer cable: SB-63
PC-Link cable:SB-87 AC adaptor:AD-A60024
CD-ROM for Windows"Program Link software, 474002 PLUS and CFX-085002 PLUS function d
X7400PLU5和CFA-98500PLU5 function d-Carrying bag
RM-9000 SET RM-7000 SET
Project display contents onto a big screen using
an OHP! A powerful classroom presentation tool
OH-300ES provides the same powerf
2-25 functions of fx-82ES/85ES/350ES. 100001999
The Educator OH-300MS provides the same power functions of fx-82MS/85MS/250MS.

S-V.P.A.M. The transparent properties of this product let you place it onto an
OH-300MS OHP to explain both screen contents and key operations
Software
Differential Equation Application
- Spreadsheet Application
Data communication with Class C service calculations
series calculators
System Requirements Computer:Recommended IntelPentium
with USB Operating Systems:Windows 98SE/M
2000/XP 174
Disk Space: 100 MB available for installation.
Memory: Recommended for operating systems

x-9860G Manager
PLUS
Simulates the functions
of the fx-9860G series .
on your PC!
Classroom
Classroom Activity Support Functions of the fx-9860G
series: Key-Log File Creation
and Screen Capture Functions as Functions
Reproduction of the fx-98600
on your PC screen.
ds
Pended Intel® Pentium® III 500 MHz
Windows® 98SE/Me or Windows® 2000.xxP
available for installation
used for operating system
FA-123USB Data Communication Package
des:
ram-Link software for Windows® PC (CD-ROM), SB-88 PC-Link cable
Chem Requirements
Computer: IBM PC/AT or compatible Operating Systems: Windows® OR Mir
Building System: Windows 80/Windows MerWindows 2000 SP3000 Windows XP SP1
Monitor: Colour (256 colours or more)
Imum free space on hard drive: 1MB
1 free - CD-ROM drive - USB port : 1 port free
The Program-I Link software can be
wloaded from the WEB
:/world.casio.com/edu/
The Program-Link software needs the SB-88 PC-Link file. Those users who had downloaded the software
from the WEB are asked to purchase the cable.
This is a registered trademark of Microsoft Corporation.

Scientific Calculators Specification Table
| Graphs Models | | | | |
| Tr-9886G SD | Tr-9886G | ALGERA F.X.S PLUS | 27.4856G PLUS | Tr-7750G PLUS | Tr-7400G PLUS | Tr-5880P | Tr-50F PLUS | Tr-3650P | Tr-3950P | | | | | |
| Over 1,000 | Over 1,000 | Over 1,500 | 905 | 900 | 406 | 664 | 406 | 279 | 279 | | | | | |
| AAA x 4 | AAA x 4 | AAA x 4 | AAA x 4 | AAA x 4 | AAA x 2 | AAA x 1 (LR3) | AAA x 1 (LR3) | Two-way power (Solar + LR4) x 1 | Two-way power (Solar + LR4) x 1 | LR4 x 1 | | | | |
| CR2032 x 1 | CR2032 x 1 | CR2032 x 1 | CR2032 x 1 | CR2032 x 1 | CR2032 x 1 | — | — | — | — | | | | | |
| 300 (LR303)x1 | 300 (LR303)x1 | 140 (R03)x1/2 | 180 (R03)x1/2 | 240 (R03)x1/2 | 900 (R03)x1/2 | 1 year | 3 years (LR4)x1 | 3 years (LR4)x1 | 9.000** | 3 years** | | | | |
| 230 (LR303)x1 | 320 (LR303)x1 | 420 (LR303)x1 | 1,500 (LR303)x1 | 1 | 3 years (LR4)x1 | 3 years (LR4)x1 | 3 years** | 3 years** | | | | |
| 5 | 5 | 2 | 2 | 2 | 2 | — | — | — | — | | | | | |
| 24 x 92.5 x 184.5 | 24 x 92.5 x 184.5 | 19.5 x 82 x 178 | 24.5 x 80 x 182.5 | 24.5 x 80 x 182.5 | 23 x 85.5 x 169 | 15.1 x 81.5 x 163 | 12.2 x 80 x 161 | 11.8 x 80 x 159 | 11.8 x 80 x 159 | | | | | |
| 265 | 260 | 213 | 215 | 215 | 185 | 150 | 105 | 100 | 100 | | | | | |
| Slide-on hard | Slide-on hard | Slide-on hard | Snap-on hard | Snap-on hard | Snap-on hard | Integrated hard | Slide-on hard | Snap-on hard | Snap-on hard | | | | | |
| 64 x 128 dots | 64 x 128 dots | 64 x 128 dots | 64 x 128 dots | 64 x 128 dots | 48 x 80 dots | 31 x 96 dots | 5 x 7 dots | 5 x 6 dots | 5 x 6 dots | | | | | |
| 21 x 8 | 21 x 8 | 21 x 8 | 21 x 8 | 21 x 8 | 13 x 6 | 16 | 16 | 12 | 12 | | | | | |
| 10 x 2 | 10 x 2 | 10 x 2 | 10 x 2 | 10 x 2 | 10 (9 x 2) | 10 x 2 | 10 x 2 | 10 x 2 | 10 x 2 | | | | | |
| ● | ● | ● | ● | ● | ● | — | — | — | — | | | | | |
| 15 | 15 | 15 | 15 | 15 | 15 | 15 | 15 | 12 | 12 | | | | | |
| 26 | 26 | 26 | 26 | 26 | 26 | 26 | 24 | 24 | 24 | | | | | |
| ● (BASIC-like) | ● (BASIC-like) | (BASIC-like) | (BASIC-like) | (BASIC-like) | (BASIC-like) | (BASIC-like) | (BASIC-like) | (BASIC-like) | (BASIC-like) | | | | | |
| 64,000 | 64,000 | 146,000 | 61,000 | 28,000 | 20,000 | 28,500 | 28,500 | 680 | 360 | 360 | | | | |
| Limited to memory capacity | Limited to memory capacity | Limited to memory capacity | Limited to memory capacity | Limited to memory capacity | Limited to memory capacity | Limited to memory capacity | Limited to memory capacity | 4 | 4 | 4 | | | | |
| 1.5MB | 1.5MB | 768KB | — | — | — | ● | ● | ● | ● | | | | | |
| — | — | — | — | — | — | 128 | 23 | — | — | | | | | |
| ● | ● | ● | ● | ● | ● | ● | ● | ● | ● | | | | | |
| ● | ● | ● | ● | ● | ● | ● | ● | ● | ● | | | | | |
| ● | ● | ● | ● | ● | ● | ● | ● | ● | ● | | | | | |
| ● | ● | ● | ● | ● | ● | ● | ● | ● | ● | | | | | |
| ● | ● | — | — | — | — | ● | ● | ● | ● | | | | | |
| ● | ● | ● | ● | ● | ● | ● | ● | ● | ● | | | | | |
| ● | ● | ● | ● | ● | ● | ● | ● | ● | ● | | | | | |
| ● | ● | ● | ● | ● | ● | ● | ● | ● | ● | | | | | |
| ● | ● | ● | ● | ● | ● | ● | ● | ● | ● | | | | | |
| ● | ●
● | ●
● | ●
● | ●
● | ●
● | ●
● | ●
● | ●
● | ●
● | | | | | |
| 3x-1 only | 3x-1 only | 3x-1 only | 3x-1 only | 3x-1 only | 3x-1 only | 3x-1 only | 3x-1 only | ●
●
●
●
●
●
●
●
●
●
●
●
●
●
●
●
●
●
●
●
●
●
●
●
●
●
●
●
●
●
●
●
●
●
●
●
●
●
●
●
●
●
●
●
●
●
●
●
●
●
● | ●
●
●
●
●
●
●
●
●
●
●
●
●
●
●
●
●
●
●
●
●
●
●
●
●
●
●
●
●
●
●
●
●
●
●
●
●
●
●
●
●
●
●
●
●
●
●
●
●
★
●
●
●
●
●
●
●
●
●
●
●
●
●
●
●
●
●
●
●
●
●
●
●
●
●
●
●
●
●
●
●
●
●
●
●
●
●
●
●
●
●
●
●
●
●
●
●
●
●
★ | ●
●
●
●
●
●
●
●
●
●
●
●
●
●
●
●
●
●
●
●
●
●
●
●
●
●
●
●
●
●
●
●
●
●
●
●
●
●
●
●
●
●
●
●
●
●
●
●
●
— | ●
●
●
●
●
●
●
●
●
●
●
●
●
●
●
●
●
●
●
●
●
●
●
●
●
●
●
●
●
●
●
●
●
●
●
●
●
●
●
●
●
●
●
●
●
●
●
●
●
▲
●
●
●
●
●
●
●
●
●
●
●
●
●
●
●
●
●
●
●
●
●
●
●
●
●
●
●
●
●
●
●
●
●
●
●
●
●
●
●
●
●
●
●
●
●
●
●
●
●
—
—
—
—
—
—
—
—
—
—
—
—
—
—
—
—
—
—
—
—
—
—
—
—
—
—
—
—
—
—
—
—
—
—
—
—
—
—
—
—
—
—
—
—
—
—
—
—
—
—
★
★
★
★
★
★
★
★
★
★
★
★
★
★
★
★
★
★
★
★
★
★
★
★
★
★
★
★
★
★
★
★
★
★
★
★
★
★
★
★
★
★
★
★
★
★
★
★
★
★
★★★
★
★
★
★
★
★
★
★
★
★
★
★
★
★
★
★
★
★
★
★
★
★
★
★
★
★
★
★
★
★
★
★
★
★
★
★
★
★
★
★
★
★
★
★
★
★
★
★
★ | ●
●
●
●
●
●
●
●
●
●
●
●
●
●
●
●
●
●
●
●
●
●
●
●
●
●
●
●
●
●
●
●
●
●
●
●
●
●
●
●
●
●
●
●
●
●
●
●
★
★
★
★
★
★
★
★
★
★
★
★
★
★
★
★
★
★
★
★
★
★
★
★
★
★
★
★
★
★
★
★
★
★
★
★
★
★
★
★
★
★
★
★
★
★
★
★
★
±
±
±
±
±
±
±
±
±
±
±
±
±
±
±
±
±
±
±
±
±
±
±
±
±
±
±
±
±
±
±
±
±
±
±
±
±
±
±
±
±
±
±
±
±
±
±
±
±
±
★
★
★
★
★
★
★
★
★
★
★
★
★
★
★
★
★
★
★
★
★
★
★
★
★
★
★
★
★
★
★
★
★
★
★
★
★
★
★
★
★
★
★
★
★
★
★
★
★
× 30 unknowns | ●
●
●
●
●
●
●
●
●
●
●
●
●
●
●
●
●
●
●
●
●
●
●
●
●
●
●
●
●
●
●
●
●
●
●
●
●
●
●
●
●
●
●
●
●
●
●
●
●
±
±
±
±
±
±
±
±
±
±
±
±
±
±
±
±
±
±
±
±
±
±
±
±
±
±
±
±
±
±
±
±
±
±
±
±
±
±
±
±
±
±
±
±
±
±
±
±
±
× 30 unknowns | ●
●
●
●
●
●
●
●
●
●
●
●
●
●
●
●
●
●
●
●
●
●
●
●
●
●
●
●
●
●
●
●
★
★
★
★
★
★
★
★
★
★
★
★
★
★
★
★
★
★ |
| Model | Programmable Models | Standard Models |
| tx-4500PA | tx-480P | tx-5500LA | tx-82ES | tx-85ES | tx-350ES | tx-500ES | tx-991ES | tx-578ES |
| Specifications | Number of functions | 242 | 297 | 250 | 249 | 249 | 249 | 253 | 403 | 403 |
| Power supply (Main) | CR2032 x 1 | CR2032 x 1 | CR2032 x 2 | AAA x (R03) | Two-way power (Solar + LHM4 x 1) | AAA x (L03) | AAA x (R03) | Two-way power (Solar + LHM4 x 1) | AAA x (R03) |
| Power supply (Backup) | CR2032 x 1 | CR2032 x 1 | CR2032 x 1 | — | — | — | — | — | — |
| Approximate battery life. Main (hours) | 5,000+4 | 900+4 | 350+2 | 17,000+4 | 3 years (LH44)+4 | 8,700+4 | 17,000+4 | 3 years (LH44)+4 | 17,000+4 |
| Approximate battery life Backup (years) | 2 | 2 | 2 | — | — | — | — | — | — |
| Dimensions H × W × D (mm) | 9.9 × 73 × 141.5 | 15 × 81.5 × 157 | 9.9 × 73 × 141.5 | 13.7 × 80 × 161 | 12.2 × 80 × 161 | 13.7 × 80 × 161 | 13.7 × 80 × 161 | 13.7 × 80 × 161 | 13.7 × 80 × 161 |
| Approximate weight (g) | 85 | 133 | 85 | 110 | 105 | 110 | 110 | 105 | 110 |
| Case style | Wallet | Integrated hard | Wallet | Slide-on hard | Slide-on hard | Slide-on hard | Slide-on hard | Slide-on hard | Slide-on hard |
| Dot matrix display | 5 × 7 dots × 12 digits | 5 × 7 dots × 16 digits × 4 lines | 5 × 7 dots × 16 digits × 2 lines | 31 × 96 dots | 31 × 96 dots | 31 × 96 dots | 31 × 96 dots | 31 × 96 dots | 31 × 96 dots |
| Display capacity (characters) | 12 | 16 | 16 | 15 | 15 | 15 | 15 | 15 | 15 |
| Mantissia + exponent digits | 10 × 2 | 10 × 2 | 10 × 2 | 10 × 2 | 10 × 2 | 10 × 2 | 10 × 2 | 10 × 2 | 10 × 2 |
| Icon menus | — | — | — | — | — | — | — | — | — |
| Internal operation digits | 12 | 15 | 12 | 15 | 15 | 15 | 15 | 15 | 15 |
| Parentheses level | 24 | 26 | 26 | 24 | 24 | 24 | 24 | 24 | 24 |
| Programming Functions | Program topic | # | # | # | — | — | — | — | — | — |
| Memory (bytes) | 1,103 | 4,500 | 1,095 | — | — | — | — | — | — |
| Program areas | Limited to memory capacity | Limited to memory capacity | — | — | — | — | — | — | — |
| Storage memory area (Flash memory) | — | — | — | — | — | — | — | — | — |
| Built-in formulas | — | — | — | — | — | — | — | — | — |
| Utilities | Natural textbook display | — | — | — | # | # | # | # | # | # |
| Key rollover function | # | # | # | # | # | # | # | # | # |
| Replay function | # | # | # | # | # | # | # | # | # |
| Multi-repl functions | — | — | — | # | # | # | # | # | # |
| Replay copy | — | — | — | — | — | — | — | — | — |
| Backups | # | — | # | # | # | # | # | # | # |
| CALC function | # | # | # | — | — | — | — | # | # |
| SOLVE function | — | # | — | — | — | — | — | # | # |
| Answer function | # | # | # | # | # | # | # | # | # |
| Variable memory | 26 - 163 | 26 - 476 | 26 | 7 | 7 | 7 | 7 | 7 | 7 |
| Auto power off | # | # | # | # | # | # | # | # | # |
| Special Features | Base-α calculations (Binary/Octal/Hexadecimal) | # | # | # | — | — | — | — | # | # |
| Logical operations | # | # | # | — | — | — | — | # | # |
| Complex number calculation | — | # | # | — | — | — | — | # | # |
| Engineering symbol calculations | # | # | # | # | # | # | # | # | # |
| Engineering notations (NRC/CSE) | # | # | # | # | # | # | # | # | # |
| Scientific constants | — | 20 | — | — | — | — | — | 40 | 40 |
| Metric conversions | — | — | — | — | — | — | — | 40 | 40 |
| Basic Functions | Trigonometric, inverse trigonometric (sin/ctan/tan -sec -tan-) | # | # | # | # | # | # | # | # | # |
| Hyperbolic, inverse hyperbolic (sinh/ath/tanh -rash /dash ) | # | # | # | # | # | # | # | # | # |
| Exponential, logarithmic (log, ln, 10, e") | # | # | # | # | # | # | # | # | # |
| Base specified logarithmic | — | — | — | # | # | # | # | # | # |
| Square and square root (x/√ , ) | # | # | # | # | # | # | # | # | # |
| Cubic and cubic root (x/√ , ) | 3√ only | 3√ only | 3√ only | # | # | # | # | # | # |
| Power and radical root (x/√ , ) | # | # | # | # | # | # | # | # | # |
| Independent key for x/√2+1 | — | — | — | # | # | # | # | # | # |
| Fraction | # | # | # | # | # | # | # | # | # |
| Percentage calculation (%) | # | # | # | # | # | # | # | # | # |
| Rounding | # | # | # | # | # | # | # | # | # |
| Simplification | — | — | — | — | — | — | — | — | — |
| Integer division | — | — | — | — | — | — | — | — | — |
| Sexagesimal - decimal | # | # | # | # | # | # | # | # | # |
| Display format (FEX, SCI) | # | # | # | # | # | # | # | # | # |
| Angle unit (Deg, Rad, Grad) | — | — | — | # | # | # | # | # | # |
| Angle unit conversion (Deg, Rad, Grad) | — | — | — | # | # | # | # | # | # |
| Differentiation calculation | # | # | # | — | — | — | — | # | # |
| Integration calculation | # | # | # | — | — | — | — | # | # |
| Algebra | Simultaneous equation | — | — | # (unknowns) | — | — | — | # (Unknowns) | # (Unknowns) | # (Unknowns) |
| Polynomial equation | — | — | # (Degree 2) | — | — | — | # (Degree 2, 3) | # (Degree 2, 3) | # (Degree 2, 3) |
| Table function | — | # | — | # | # | # | # | # | # |
| Matrix calculations | — | — | — | — | — | — | — | # | # |
| Geometry | Coordinate conversion (Pol, Rec) | # | # | # | # | # | # | # | # |
| Vector calculations | — | — | — | — | — | — | — | # | # |
| Probability | Combination, permutation (nCr, nPr) | # | # | # | # | # | # | # | # | # |
| Statistics | Random numbers | # | # | # | # | # | # | # | # | # |
| List-based STAT data editor | — | — | — | # | # | # | # | # | # |
| Standard deviation | # | # | # | # | # | # | # | # | # |
| Regression analysis | # | # | # | # | # | # | # | # | # |
| Linear regression | # | # | # | # | # | # | # | # | # |
| a,b Exponential regression | — | — | — | # | # | # | # | # | # |
| Other regressions | — | — | — | Log, Exp, Pwr, Imv, Guard | Log, Exp, Pwr, Imv, Guard | Log, Exp, Pwr, Imv, Guard | Log, Exp, Pwr, Imv, Guard | Log, Exp, Pwr, Imv, Guard | Log, Exp, Pwr, Imv, Guard |
| Others | eActivity | — | — | — | — | — | — | — | — | — |
| Data communication | — | — | — | — | — | — | — | — | — |
| Label printer link | — | — | — | — | — | — | — | — | — |
| Others | — | — | — | — | — | — | — | — | — |
5 When left with power turned off 6 Continuous display of "0." *7 Continuous use F Folded Unfolded
SCIENTIFIC CALCULATORS
Scientific Calculators Specification Table
Standard Model
| Model | t-82MS | t-350MS | t-85MS | t-96MS | t-108MS | t-115MS | t-570MS | t-991MS | t-820MS | t-992MS | t-65 | t-991 |
| Specifications | Number of functions | 240 | 240 | 240 | 244 | 300 | 300 | 401 | 401 | 353 | 158 | 150 |
| Power supply (Main) | AA x 1 | LN44 x 1 | Two-way power Siter x 1(844 x 1) | AA x 1 | AA x 1 | Two-way power Siter x 1(844 x 1) | LN44 x 1 | Two-way power Siter x 1(844 x 1) | Two-way power Siter x 1(844 x 1) | Two-way power Siter x 1(844 x 1) | Two-way power Siter x 1(844 x 1) |
| Power supply (Backup) | — | — | — | — | — | — | — | — | — | — | — |
| Approximate battery life Main (hours) | 17,000x42years | 9,000x42years | 3 years (844x42years) | 17,000x42years | 17,000x42years | 9,000x42years | 3 years (844x42years) | 3 years (844x42years) | 3 years (844x42years) | 3 years (844x42years) | 3 years (844x42years) |
| Approximate battery life Backups (years) | 18.8 x 85 x 150x22 x 85 x 150x22 x 85 x 150x22 x 85 x 150x22 x 85 x 150x22 x 85 x 150x22 x 85 x 150x22 x 85 x 150x22 x 85 x 150x22 x 84 x 150x22 x 85 x 150x22 x 85 x 150x22 x 85 x 150x22 x 85 x 150x22 x 85 x 150x22 x 85 x 150x22 x 85 x 150x22 x 85 x 145x22 x 85 x 145x22 x 85 x 145x22 x 85 x 145x22 x 85 x 145x22 x 85 x 145x22 x 85 x 145x22 x 85 x 145x22 x 85 x 145x22x 85 x 145x22 x 85 x 145x22 x 85 x 145x22 x 85 x 145x22 x 85 x 145x22 x 85 x 145x22 x 85 x 145x22 x 85 x 145x22 x 85x 145x22 x 85 x 145x22 x 85 x 145x22 x 85 x 145x22 x 85 x 145x22 x 85 x 145x22 x 85 x 145x22 x 85 x 145x22 x 85 x 144x150x22 x 85 x 150x22 x 85 x 150x22 x 85 x 150x22 x 85 x 150x22 x 85 x 150x22 x 85 x 150x22 x 85 x 150x22 x 85 x 150 | 125 | 100 | 130 | 133 | 105 | 105 | 105 | 120 | 74.3 | 67 |
| Case style | Slide-on hard | Slide-on hard | Slide-on hard | Slide-on hard | Slide-on hard | Slide-on hard | Slide-on hard | Slide-on hard | Hard case | Slide-on hard | Slide-on hard |
| Dot matrix display | 5 x 6 dots x 12 digits | 5 x 6 dots x 12 digits | 5 x 6 dots x 12 digits | 5 x 6 dots x 12 digits | 5 x 6 dots x 12 digits | 5 x 6 dots x 12 digits | 5 x 6 dots x 12 digits | 5 x 6 dots x 12 digits | 5 x 6 dots x 12 digits | 5 x 6 dots x 12 digits | |
| Display capacity (characters) | 12 | 12 | 12 | 12 | 12 | 12 | 12 | 12 | 12 | 12 | 12 |
| Mantela - exponent digits | 10 x 2 | 10 x 2 | 10 x 2 | 10 x 2 | 10 x 2 | 10 x 2 | 10 x 2 | 10 x 2 | 10 x 2 | 10 x 2 | 10 x 2 |
| Icon menus | — | — | — | — | — | — | — | — | — | — | — |
| Internal operation digits | 12 | 12 | 12 | 12 | 12 | 12 | 12 | 12 | 12 | 14 | 12 |
| Parentheses level | 24 | 24 | 24 | 24 | 24 | 24 | 24 | 24 | 18 | 18 | 18 |
| Programming Functions | Program logic | — | — | — | — | — | — | — | — | — | — | — |
| Memory (bytes) | — | — | — | — | — | — | — | — | — | — | — |
| Storage memory area (Flash memory) | — | — | — | — | — | — | — | — | — | — | — |
| Built-in formulas | — | — | — | — | — | — | — | — | — | — | — |
| Utilities | Natural texture and display | — | — | — | — | — | — | — | — | — | — | — |
| Key rollover function | ● | ● | ● | ● | ● | ● | ● | ● | ● | ● | ● |
| Replay function | ● | ● | ● | ● | ● | ● | ● | ● | ● | — | — |
| Multi-repaly functions | ● | ● | ● | ● | ● | ● | ● | ● | ● | — | — |
| Multi-repaly copy | — | — | — | — | ● | ● | ● | ● | ● | — | — |
| Backpass | ● | ● | ● | ● | ● | ● | ● | ● | ● | ● | ● |
| CALC function | — | — | — | — | ● | ● | ● | ● | — | — | — |
| SOLVE function | — | — | — | — | ● | ● | ● | ● | — | — | — |
| Answer function | ● | ● | ● | ● | ● | ● | ● | ● | ● | ● | — |
| Variable memory | 9 | 9 | 9 | 9 | 9 | 9 | 9 | 9 | 7 | 1 | 3 |
| Auto power off | ● | ● | ● | ● | ● | ● | ● | ● | ● | ● | ● |
| Special Features | Basic calculations (Binary/Octal/Hexadecimal) | — | — | — | — | ● | ● | ● | ● | ● | ● | ● |
| Logical operations | — | — | — | — | ● | ● | ● | ● | ● | — | — |
| Complex number calculation | — | — | — | — | ● | ● | ● | ● | ● | — | — |
| Engineering symbol calculations | — | — | — | — | ● | ● | ● | ● | ● | ● | ● |
| Engineering notations (ENO/ERG) | ● | ● | ● | ● | ● | ● | ● | ● | ● | ● | ● |
| Scientific constants | — | — | — | — | — | — | 40 | 40 | — | 128 | — |
| Metric conversions | — | — | — | — | — | — | 40 | 40 | — | — | — |
| Basic Functions | Trigonometric, inverse/trigonometric (pi/obit/area) "loss" factor" hyperbolic, hyperbolic (independent) "tanh" "tanh" "tanh" Exponential, logarithmic (log, ln, 18, e") | ● | ● | ● | ● | ● | ● | ● | ● | ● | ● | ● |
| Base specified logarithmic expansion | — | — | — | — | — | — | — | — | — | — | — |
| Square and square root (e^x / e^-x) | ● | ● | ● | ● | ● | ● | ● | ● | ● | ● | ● |
| Power and radical root (e^x / e^-x) | ● | ● | ● | ● | ● | ● | ● | ● | ● | 3√-only | ● |
| Independent key for x^2/√-x^2/√-x^2/√-x^2/√-x^2/√-x^2/√-x^2/√-x^2/√-x^2/√-x^2/√-x^2/√-x^2/√-x^2/√-x^2/√-x^2/√-x^2/√-x^2/√-x^2/ √-x^2/√-x^2/√-x^2/√-x^2/√-x^2/√-x^2/√-x^2/√-x^2/√-x^2/√-x^2/√-x^2/√-x^2/√-x^2/√-x^2/√-x^2/√-x^2/√-x^3/√-x^3/√-x^3/√-x^3/√-x^3/√-x^3/√-x^3/√-x^3/√-x^3/√-x^3/√-x^3/√-x^3/√-x^3/√-x^3/√-x^3/√-x^3/√-x^3/√-×^3/√-×^3/√-×^3/√-×^3/√-×^3/√-×^3/√-×^3/√-×^3/√-×^3/√-×^3/√-×^3/√-×^3/√-×^3/√-×^3/√-×^3/√-×^3/√-×^3/ √-x^3/√-x^3/√-x^3/√-x^3/√-x^3/√-x^3/√-x^3/√-x^3/√-x^3/√-x^3/√-x^3/√-x^3/√-x^3/√-x^3/√-x^3/√-x^3/√-x^4/√-x^4/√-x^4/√-x^4/√-x^4/√-x^4/√-x^4/√-x^4/√-x^4/√-x^4/√-x^4/√-x^4/√-x^4/√-x^4/√-x^4/√-x^4/√-x^4/√-×^4/√-×^4/√-×^4/√-×^4/√-×^4/√-×^4/√-×^4/√-×^4/√-×^4/√-×^4/√-×^4/√-×^4/√-×^4/√-×^4/√-×^4/√-×^4/√-×^4/ √-x^4/√-x^4/√-x^4/√-x^4/√-x^4/√-x^4/√-x^4/√-x^4/√-x^4/√-x^4/√-x^4/√-x^4/√-x^4/√-x^4/√-x^4/√-x^4/√-x^3/√-x^3/√-x^3/√-x^3/√-x^3/√-x^3/√-x^3/√-x^3/√-x^3/√-x^3/√-x^3/√-x^3/√-x^3/√-x^3/√-x^3/√-x^3/√-X^3/√-X^3/√-X^3/√-X^3/√-X^3/√-X^3/√-X^3/√-X^3/√-X^3/√-X^3/√-X^3/√-X^3/√-X^3/√-X^3/√-X^3/√-X^3/√-X^3/ √-X^3/√-X^3/√-X^3/√-X^3/√-X^3/√-X^3/√-X^3/√-X^3/√-X^3/√-X^3/√-X^3/√-X^3/√-X^3/√-X^3/√-X^3/√-X^3/√-X^4/√-X^4/√-X^4/√-X^4/√-X^4/√-X^4/√-X^4/√-X^4/√-X^4/√-X^4/√-X^4/√-X^4/√-X^4/√-X^4/√-X^4/√-X^4/√-X^4/√-×^4/√-×^4/√-×^4/√-×^4/√-×^4/√-×^4/√-×^4/√-×^4/√-×^4/√-×^4/√-×^4/√-×^4/√-×^4/√-×^4/√-×^4/√-×^4/×^4/√-×^4/√-×^4/√-×^4/√-×^4/√-×^4/√-×^4/√-×^4/√-×^4/√-×^4/√-×^4/√-×^4/√-×^4/√-×^4/√-×^4/√-×^4/√-×^4/x^4/√-×^4/x^4/√-×^4/x^4/√-×^4/x^4/√-×^4/x^4/√-×^4/x^4/√-×^4/x^4/√-×^4/x^4/√-×^4/x^4/√-×^4/x^4/√-×^4/x^4/√-×^4/x*4/√-×^4/x*4/√-×^4/x*4/√-×^4/x*4/√-×^4/x*4/√-×^4/x*4/√-×^4/x*4/√-×^4/x*4/√-×^4/x*4/√-×^4/x*4/√-×^4/x*4/√-×^4/x*⁴/√-×^4/x*⁴/√-×^4/x*⁴/√-×^4/x*⁴/√-×^4/x*⁴/√-×^4/x*⁴/√-×^4/x*⁴/√-×^4/x*⁴/√-×^4/x*⁴/√-×^4/x*⁴/√-×^4/x*⁵/√-×^4/x*⁵/√-×^4/x*⁵/√-×^4/x*⁵/√-×^4/x*⁵/√-×^4/x*⁵/√-×^4/x*⁵/√-×^4/x*⁵/√-×^4/x*⁵/√-×^4/x*⁵/√-×^4/x*⁴/√-×^4/x*⁴/√-×^4/x*⁴/√-×^4/x*⁴/√-×^4/x*⁴/√-×^4/x*⁴/√-×^4/x*⁴/√-×^4/x*⁴/√-×^4/x*⁴/√-×^4/x*⁸/√-×^4/x*⁸/√-×^4/x*⁸/√-×^4/x*⁸/√-×^4/x*⁸/√-×^4/x*⁸/√-×^4/x*⁸/√-×^4/x*⁸/√-×^4/x*⁸/√-×^4/x*⁸/√-×^4/x*⁹/√-×^4/x*⁹/√-×^4/x*⁹/√-×^4/x*⁹/√-×^4/x*⁹/√-×^4/x*⁹/√-×^4/x*⁹/√-×^4/x*⁹/√-×^4/x*⁹/√-×^4/x*⁹/√-×^4/x*⁸/√-×^4/x*⁸/√-×^4/x*⁸/√-×^4/x*⁸/√-×^4/x*⁸/√-×^4/x*⁸/√-×^4/x*⁸/√-×^4/x*⁸/√-×^4/x*⁸/√-×^4/x*⁶/√-×^4/x*⁶/√-×^4/x*⁶/√-×^4/x*⁶/√-×^4/x*⁶/√-×^4/x*⁶/√-×^4/x*⁶/√-×^4/x*⁶/√-×^4/x*⁶/√-×^4/x*⁶/√-×^4/x*⁸/√-×^4/x*⁸/√-×^4/x*⁸/√-×^4/x*⁸/√-×^4/x*⁸/√-×^4/x*⁸/√-×^4/x*⁸/√-×^4/x*⁸/√-×^4/x*⁸/√-×^4/x*⁷/√-×^4/x*⁸/√-×^4/x*⁸/√-×^4/x*⁸/√-×^4/x*⁸/√-×^4/x*⁸/√-×^4/x*⁸/√-×^4/x*⁸/√-×^4/x*⁸/√-×^4/x*⁸/√-×^4/x*⁵/√-×^4/x*⁵/√-×^4/x*⁵/√-×^4/x*⁵/√-×^4/x*⁵/√-×^4/x*⁵/√-×^4/x*⁵/√-×^4/x*⁵/√-×^4/x*⁵/√-×^4/x*⁶/√-×^4/x*⁶/√-×^4/x*⁶/√-×^4/x*⁶/√-×^4/x*⁶/√-×^4/x*⁶/√-×^4/x*⁶/√-×^4/x*⁶/√-×^4/x*⁶/√-×^4/x*/√-×^4/x*/√-×^4/x*/√-×^4/x*/√-×^4/x*/√-×^4/x*/√-×^4/x*/√-×^4/x*/√-×^4/x*/√-×^4/x*/√-×^4/x*⁴/√-×^4/x*⁴/√-×^4/x*⁴/√-×^4/x*⁴/√-×^4/x*⁴/√-×^4/x*⁴/√-×^4/x*⁴/√-×^4/x*⁴/√-×^4/x*⁴/√-×^4/x*/√-×^4/x*/√-×^4/x*/√-×^4/x*/√-×^4/x*/√-×^4/x*/√-×^4/x*/√-×^4/x*/√-×^4/x*/√-×^4/x*⁶/√-×^4/x*⁶/√-×^4/x*⁶/√-×^4/x*⁶/√-×^4/x*⁶/√-×^4/x*⁶/√-×^4/x*⁶/√-×^4/x*⁶/√-×^4/x*⁶/√-×^4/x*⁅/√-×^4/x*⁅/√-×^4/x*⁅/√-×^4/x*⁅/√-×^4/x*⁅/√-×^4/x*⁅/√-×^4/x*⁅/√-×^4/x*⁅/√-×^4/x*⁅/√-×^4/x*⁅/√-×^4/x*⁸/√-×^4/x*⁸/√-×^4/x*⁸/√-×^4/x*⁸/√-×^4/x*⁸/√-×^4/x*⁸/√-×^4/x*⁸/√-×^4/x*⁸/√-×^4/x*⁸/√-×^4/x*/√-×^4/x*⁵/√-×^4/x*⁵/√-×^4/x*⁵/√-×^4/x*⁵/√-×^4/x*⁵/√-×^4/x*⁵/√-×^4/x*⁵/√-×^4/x*⁵/√-×^4/x*⁵/√-×^4/x*⁸/√-×^4/x*⁸/√-×^4/x*⁸/√-×^4/x*⁸/√-×^4/x*⁸/√-×^4/x*⁸/√-×^4/x*⁸/√-×^4/x*⁸/√-×^4/x*⁸/√-×^4/x*⁴/√-×^4/x*⁴/√-×^4/x*⁴/√-×^4/x*⁴/√-×^4/x*⁴/√-×^4/x*⁴/√-×^4/x*⁴/√-×^4/x*⁴/√-×^4/x*⁴/√-×^4/x*⁶/√-×^4/x*⁶/√-×^4/x*⁶/√-×^4/x*⁶/√-×^4/x*⁶/√-×^4/x*⁶/√-×^4/x*⁶/√-×^4/x*⁶/√-×^4/x*⁶/√-×^4/x*⁵/√-×^4/x*⁵/√-×^4/x*⁵/√-×^4/x*⁵/√-×^4/x*⁵/√-×^4/x*⁵/√-×^4/x*⁵/√-×^4/x*⁵/√-×^4/x*⁵/√-×^4/x*/√-×^4/x*/√-×^4/x*/√-×^4/x*/√-×^4/x*/√-×^4/x*/√-×^4/x*/√-×^4/x*/√-×^4/x*/√-×^4/x*⁹/√-×^4/x*⁹/√-×^4/x*⁹/√-×^4/x*⁹/√-×^4/x*⁹/√-×^4/x*⁹/√-×^4/x*⁹/√-×^4/x*⁹/√-×^4/x*⁹/√-×^4/x*⁴/√-×^4/x*⁴/√-×^4/x*⁴/√-×^4/x*⁴/√-×^4/x*⁴/√-×^4/x*⁴/√-×^4/x*⁴/√-×^4/x*⁴/√-×^4/x*⁴/√-×^4/x*⁹/√-×^4/x*⁹/√-×^4/x*⁹/√-×^4/x*⁹/√-×^4/x*⁹/√-×^4/x*⁹/√-×^4/x*⁹/√-×^4/x*⁹/√-×^4/x*⁹/√-×^4/x*/√-×^4/x*/√-×^4/x*/√-×^4/x*/√-×^4/x*/√-×^4/x*/√-×^4/x*/√-×^4/x*/√-×^4/x*/√-×^4/x*⁸/√-×^4/x*⁸/√-×^4/x*⁸/√-×^4/x*⁸/√-×^4/x*⁸/√-×^4/x*⁸/√-×^4/x*⁸/√-×^4/x*⁸/√-×^4/x*⁸/√-×^4/x*⁰/√-×^4/x*⁰/√-×^4/x*⁰/√-×^4/x*⁰/√-×^4/x*⁰/√-×^4/x*⁰/√-×^4/x*⁰/√-×^4/x*⁰/√-×^4/x*⁰/√-×^4/x*⁰/√-×^4/x*⁴/√-×^4/x*⁴/√-×^4/x*⁴/√-×^4/x*⁴/√-×^4/x*⁴/√-×^4/x*⁴/√-×^4/x*⁴/√-×^4/x*⁴/√-×^4/x*⁴/√-×^4/x*⁁/√-×^4/x*⁁/√-×^4/x*⁁/√-×^4/x*⁁/√-×^4/x*⁁/√-×^4/x*⁁/√-×^4/x*⁁/√-×^4/x*⁁/√-×^4/x*⁁/√-×^4/x*⁁/√-×^4/x*⁴/√-×^4/x*⁴/√-×^4/x*⁴/√-×^4/x*⁴/√-×^4/x*⁴/√-×^4/x*⁴/√-×^4/x*⁴/√-×^4/x*⁴/√-×^4/x*⁴/√-×^4/x*/√-×^4/x*⁴/√-×^4/x*⁴/√-×^4/x*⁴/√-×^4/x*⁴/√-×^4/x*⁴/√-×^4/x*⁴/√-×^4/x*⁴/√-×^4/x*⁴/√-×^4/x*⁴/√-×^4/x*ⁱ/√-×^4/x*ⁱ/√-×^4/x*ⁱ/√-×^4/x*ⁱ/√-×^4/x*ⁱ/√-×^4/x*ⁱ/√-×^4/x*ⁱ/√-×^4/x*ⁱ/√-×^4/x*ⁱ/√-×^4/x*ⁱ/√-×^4/x*⁴/√-×^4/x*⁴/√-×^4/x*⁴/√-×^4/x*⁴/√-×^4/x*⁴/√-×^4/x*⁴/√-×^4/x*⁴/√-×^4/x*⁴/√-×^4/x*⁴/√-×^4/x*⁉/√-×^4/x*⁹/√-×^4/x*⁹/√-×^4/x*⁹/√-×^4/x*⁹/√-×^4/x*⁹/√-×^4/x*⁹/√-×^4/x*⁹/√-×^4/x*⁹/√-×^4/x*⁹/√-×^4/x*ⁿ/√-×^4/x*⁸/√-×^4/x*⁸/√-×^4/x*⁸/√-×^4/x*⁸/√-×^4/x*⁸/√-×^4/x*⁸/√-×^4/x*⁸/√-×^4/x*⁸/√-×^4/x*⁸/√-×^4/x*⁽/√-×^4/x*⁹/√-×^4/x*⁹/√-×^4/x*⁹/√-×^4/x*⁹/√-×^4/x*⁹/√-×^4/x*⁹/√-×^4/x*⁹/√-×^4/x*⁹/√-×^4/x*⁹/√-×^4/x*/√-×^4/x*⁹/√-×^4/x*⁹/√-×^4/x*⁹/√-×^4/x*⁹/√-×^4/x*⁹/√-×^4/x*⁹/√-×^4/x*⁹/√-×^4/x*⁹/√-×^4/x*⁹/√-×^4/x*⁼/√-×^4/x*⁹/√-×^4/x*⁹/√-×^4/x*⁹/√-×^4/x*⁹/√-×^4/x*⁹/√-×^4/x*⁹/√-×^4/x*⁹/√-×^4/x*⁹/√-×^4/x*⁹/√-×^4/x*⁶/√-×^4/x*⁶/√-×^4/x*⁶/√-×^4/x*⁶/√-×^4/x*⁶/√-×^4/x*⁶/√-×^4/x*⁶/√-×^4/x*⁶/√-×^4/x*⁶/√-×^4/x*⁹/√-×^4/x*⁹/√-×^4/x*⁹/√-×^4/x*⁹/√-×^4/x*⁹/√-×^4/x*⁹/√-×^4/x*⁹/√-×^4/x*⁹/√-×^4/x*⁹/√-×^4/x*ⁱ/√-×^4/x*ⁱ/√-×^4/x*ⁱ/√-×^4/x*ⁱ/√-×^4/x*ⁱ/√-×^4/x*ⁱ/√-×^4/x*ⁱ/√-×^4/x*ⁱ/√-×^4/x*ⁱ/√-×^4/x*⁵/√-×^4/x*⁵/√-×^4/x*⁵/√-×^4/x*⁵/√-×^4/x*⁵/√-×^4/x*⁵/√-×^4/x*⁵/√-×^4/x*⁵/√-×^4/x*⁵/√-×^4/x*⁹/√-×^4/x*⁹/√-×^4/x*⁹/√-×^4/x*⁹/√-×^4/x*⁹/√-×^4/x*⁹/√-×^4/x*⁹/√-×^4/x*⁹/√-×^4/x*⁹/√-×^4/x*⁺/√-×^4/x*⁸/√-×^4/x*⁸/√-×^4/x*⁸/√-×^4/x*⁸/√-×^4/x*⁸/√-×^4/x*⁸/√-×^4/x*⁸/√-×^4/x*⁸/√-×^4/x*⁸/√-×^4/x*ⁱ/√-×^4/x*ⁱ/√-×^4/x*ⁱ/√-×^4/x*ⁱ/√-×^4/x*ⁱ/√-×^4/x*ⁱ/√-×^4/x*ⁱ/√-×^4/x*ⁱ/√-×^4/x*ⁱ/√-×^4/x*⁸/√-×^4/x*⁸/√-×^4/x*⁸/√-×^4/x*⁸/√-×^4/x*⁸/√-×^4/x*⁸/√-×^4/x*⁸/√-×^4/x*⁸/√-×^4/x*⁸/√-×^4/x*⁻/√-×^4/x*⁸/√-×^4/x*⁸/√-×^4/x*⁸/√-×^4/x*⁸/√-×^4/x*⁸/√-×^4/x*⁸/√-×^4/x*⁸/√-×^4/x*⁸/√-×^4/x*⁸/√-×^4/x*/√-×^4/x*⁵/√-×^4/x*⁵/√-×^4/x*⁵/√-×^4/x*⁵/√-×^4/x*⁵/√-×^4/x*⁵/√-×^4/x*⁵/√-×^4/x*⁵/√-×^4/x*⁵/√-×^4/x*⁷/√-×^4/x*⁸/√-×^4/x*⁸/√-×^4/x*⁸/√-×^4/x*⁸/√-×^4/x*⁸/√-×^4/x*⁸/√-×^4/x*⁸/√-×^4/x*⁸/√-×^4/x*⁹/√-×^4/x*⁸/√-×^4/x*⁹/√-×^4/x*⁹/√-×^4/x*⁹/√-×^4/x*⁹/√-×^4/x*⁹/√-×^4/x*⁹/√-×^4/x*⁹/√-×^4/x*⁹/√-×^4/x*⁸/√-×^4/x*⁹/√-×^4/x*⁹/√-×^4/x*⁹/√-×^4/x*⁹/√-×^4/x*⁹/√-×^4/x*⁹/√-×^4/x*⁹/√-×^4/x*⁸/√-×^4/x*⁸/√-×^4/x*⁹/√-×^4/x*⁹/√-×^4/x*⁹/√-×^4/x*⁹/√-×^4/x*⁹/√-×^4/x*⁹/√-×^4/x*⁹/√-×^4/x*⁸/√-×^4/x*⁹/√-×^4/x*⁸/√-×^4/x*⁹/√-×^4/x*⁹/√-×^4/x*⁹/√-×^4/x*⁹/√-×^4/x*⁹/√-×^4/x*⁹/√-×^4/x*⁸/√-×^4/x*⁸/√-×^4/x*⁸/√-×^4/x*⁹/√-×^4/x*⁹/√-×^4/x*⁹/√-×^4/x*⁹/√-×^4/x*⁹/√-×^4/x*⁹/√-×^4/x*⁸/√-×^4/x*⁸/√-×^4/x*⁹/√-×^4/x*⁸/√-×^4/x*⁸/√-×^4/x*⁸/√-×^4/x*⁸/√-×^4/x*⁸/√-×^4/x*⁸/√-×^4/x*⁸/√-×^4/x*⁸/√-×^4/x*⁹/√-×^4/x*⁶/√-×^4/x*⁶/√-×^4/x*⁶/√-×^4/x*⁶/√-×^4/x*⁶/√-×^4/x*⁶/√-×^4/x*⁶/√-×^4/x*⁶/√-×^4/x*⁸/√-×^4/x*⁹/√-×^4/x*⁹/√-×^4/x*⁹/√-×^4/x*⁹/√-×^4/x*⁹/√-×^4/x*⁹/√-×^4/x*⁹/√-×^4/x*⁹/√-×^4/x*⁴/√-×^4/x*⁵/√-×^4/x*⁵/√-×^4/x*⁵/√-×^4/x*⁵/√-×^4/x*⁵/√-×^4/x*⁵/√-×^4/x*⁵/√-×^4/x*⁵/√-×^4/x*⁶/√-×^4/x*⁸/√-×^4/x*⁸/√-×^4/x*⁸/√-×^4/x*⁸/√-×^4/x*⁸/√-×^4/x*⁸/√-×^4/x*⁸/√-×^4/x*⁸/√-×^4/x*⁹/√-×^4/x*⁴/√-×^4/x*⁵/√-×^4/x*⁵/√-×^4/x*⁵/√-×^4/x*⁵/√-×^4/x*⁵/√-×^4/x*⁵/√-×^4/x*⁵/√-×^4/x*⁶/√-×^4/x*⁶/√-×^4/x*⁷/√-×^4/x*⁸/√-×^4/x*⁸/√-×^4/x*⁸/√-×^4/x*⁸/√-×^4/x*⁸/√-×^4/x*⁸/√-×^4/x*⁸/√-×^4/x*⁸/√-×^4/x*⁶/√-×^4/x*⁸/√-×^4/x*⁸/√-×^4/x*⁸/√-×^4/x*⁸/√-×^4/x*⁸/√-×^4/x*⁸/√-×^4/x*⁸/√-×^4/x*⁸/√-×^4/x*⁶/√-×^4/x*⁹/√-×^4/x*⁹/√-×^4/x*⁹/√-×^4/x*⁹/√-×^4/x*⁹/√-×^4/x*⁹/√-×^4/x*⁹/√-×^4/x*⁹/√-×^4/x*⁸/√-×^4/x*⁶/√-×^4/x*⁶/√-×^4/x*⁶/√-×^4/x*⁶/√-×^4/x*⁶/√-×^4/x*⁶/√-×^4/x*⁶/√-×^4/x*⁶/√-×^4/x*⁸/√-×^4/x*⁶/√-×^4/x*⁶/√-×^4/x*⁶/√-×^4/x*⁶/√-×^4/x*⁶/√-×^4/x*⁶/√-×^4/x*⁶/√-×^4/x*⁶/√-×^4/x*⁹/√-×^4/x*⁸/√-×^4/x*⁸/√-×^4/x*⁸/√-×^4/x*⁸/√-×^4/x*⁸/√-×^4/x*⁸/√-×^4/x*⁸/√-×^4/x*⁸/√-×^4/x*⁶/√-×^4/x*⁵/√-×^4/x*⁵/√-×^4/x*⁵/√-×^4/x*⁵/√-×^4/x*⁵/√-×^4/x*⁵/√-×^4/x*⁵/√-×^4/x*⁵/√-×^4/x*⁶/√-×^4/x*⁵/√-×^4/x*⁵/√-×^4/x*⁵/√-×^4/x*⁵/√-×^4/x*⁵/√-×^4/x*⁵/√-×^4/x*⁵/√-×^4/x*⁵/√-×^4/x*⁴/√-×^4/x*⁵/√-×^4/x*⁵/√-×^4/x*⁵/√-×^4/x*⁵/√-×^4/x*⁵/√-×^4/x*⁵/√-×^4/x*⁵/√-×^4/x*⁵/√-×^4/x*⁴/√-×^4/x*⁶/√-×^4/x*⁶/√-×^4/x*⁶/√-×^4/x*⁶/√-×^4/x*⁶/√-×^4/x*⁶/√-×^4/x*⁶/√-×^4/x*⁶/√-×^4/x*⁸/√-×^4/x*⁷/√-×^4/x*⁸/√-×^4/x*⁸/√-×^4/x*⁸/√-×^4/x*⁸/√-×^4/x*⁸/√-×^4/x*⁸/√-×^4/x*⁸/√-×^4/x*⁹/√-×^4/x*⁹/√-×^4/x*⁸/√-×^4/x*⁸/√-×^4/x*⁸/√-×^4/x*⁸/√-×^4/x*⁸/√-×^4/x*⁸/√-×^4/x*⁸/√-×^4/x*⁹/√-×^4/x*⁹/√-×^4/x*⁴/√-×^4/x*⁵/√-×^4/x*⁵/√-×^4/x*⁵/√-×^4/x*⁵/√-×^4/x*⁵/√-×^4/x*⁵/√-×^4/x*⁶/√-×^4/x*⁶/√-×^4/x*⁶/√-×^4/x*⁸/√-×^4/x*⁸/√-×^4/x*⁸/√-×^4/x*⁸/√-×^4/x*⁸/√-×^4/x*⁸/√-×^4/x*⁹/√-×^4/x*⁹/√-×^4/x*⁹/√-×^4/x*⁸/√-×^4/x*⁸/√-×^4/x*⁸/√-×^4/x*⁸/√-×^4/x*⁸/√-×^4/x*⁸/√-×^4/x*⁹/√-×^4/x*⁹/√-×^4/x*⁹/√-×^4/x*⁴/√-×^4/x*⁵/√-×^4/x*⁵/√-×^4/x*⁵/√-×^4/x*⁵/√-×^4/x*⁵/√-×^4/x*⁴/√-×^4/x*⁵/√-×^4/x*⁵/√-×^4/x*⁵/√-×^4/x*⁴/√-×^4/x*⁵/√-×^4/x*⁵/√-×^4/x*⁵/√-×^4/x*⁵/√-×^4/x*⁵/√-×^4/x*⁴/√-×^4/x*⁵/√-×^4/x*⁵/√-×^4/x*⁴/√-×^4/x*⁵/√-×^4/x*⁵/√-×^4/x*⁵/√-×^4/x*⁵/√-×^4/x*⁵/√-×^4/x*⁵/√-×^4/x*⁴/√-×^4/x*⁵/√-×^4/x*⁵/√-×^4/x*⁴/√-×^4/x*⁴/√-×^4/x*⁵/√-×^4/x*⁵/√-×^4/x*⁵/√-×^4/x*⁵/√-×^4/x*⁵/√-×^4/x*⁵/√-×^4/x*⁵/√-×^4/x*⁴/√-×^4/x*⁵/√-×^4/x*⁴/√-×^4/x*⁵/√-×^4/x*⁵/√-×^4/x*⁵/√-×^4/x*⁵/√-×^4/x*⁵/√-×^4/x*⁵/√-×^4/x*⁵/√-×^4/x*⁴/√-×^4/x*⁴/√-×^4/x*⁵/√-×^4/x*⁵/√-×^4/x*⁵/√-×^4/x*⁵/√-×^4/x*⁵/√-×^4/x*⁴/√-×^4/x*⁵/√-×^4/x*⁵/√-×^4/x*⁶/√-×^4/x*⁶/√-×^4/x*⁶/√-×^4/x*⁶/√-×^4/x*⁶/√-×^4/x*⁶/√-×^4/x*⁶/√-×^4/x*⁸/√-×^4/x*⁸/√-×^4/x*⁹/√-×^4/x*⁹/√-×^4/x*⁹/√-×^4/x*⁹/√-×^4/x*⁹/√-×^4/x*⁹/√-×^4/x*⁹/√-×^4/x*⁴/√-×^4/x*⁴/√-×^4/x*⁵/√-×^4/x*⁵/√-×^4/x*⁵/√-×^4/x*⁵/√-×^4/x*⁵/√-×^4/x*⁵/√-×^4/x*⁵/√-×^4/x*⁶/√-×^4/x*⁵/√-×^4/x*⁶/√-×^4/x*⁶/√-×^4/x*⁶/√-×^4/x*⁶/√-×^4/x*⁶/√-×^4/x*⁶/√-×^4/x*⁶/√-×^4/x*⁶/√-×^4/x*⁸/√-×^4/x*⁵/√-×^4/x*⁵/√-×^4/x*⁵/√-×^4/x*⁵/√-×^4/x*⁵/√-×^4/x*⁵/√-×^4/x*⁵/√-×^4/x*⁵/√-×^4/x*⁶/√-×^4/x*⁷/√-×^4/x*⁸/√-×^4/x*⁸/√-×^4/x*⁸/√-×^4/x*⁸/√-×^4/x*⁸/√-×^4/x*⁸/√-×^4/x*⁸/√-×^4/x*⁹/√-×^4/x*⁸/√-×^4/x*⁸/√-×^4/x*⁸/√-×^4/x*⁸/√-×^4/x*⁸/√-×^4/x*⁸/√-×^4/x*⁹/√-×^4/x*⁹/√-×^4/x*⁸/√-×^4/x*⁹/√-×^4/x*⁹/√-×^4/x*⁹/√-×^4/x*⁹/√-×^4/x*⁹/√-×^4/x*⁹/√-×^4/x*⁸/√-×^4/x*⁹/√-×^4/x*⁹/√-×^4/x*⁸/√-×^4/x*⁸/√-×^4/x*⁸/√-×^4/x*⁸/√-×^4/x*⁸/√-×^4/x*⁸/√-×^4/x*⁹/√-×^4/x*⁸/√-×^4/x*⁸/√-×^4/x*⁹/√-×^4/x*⁹/√-×^4/x*⁹/√-×^4/x*⁹/√-×^4/x*⁹/√-×^4/x*⁹/√-×^4/x*⁸/√-×^4/x*⁹/√-×^4/x*⁸/√-×^4/x*⁸/√-×^4/x*⁸/√-×^4/x*⁸/√-×^4/x*⁸/√-×^4/x*⁸/√-×^4/x*⁸/√-×^4/x*⁹/√-×^4/x*⁸/√-×^4/x*⁷/√-ײ⁄₄=0.0000000000000000000000000000000000000000000000000000000000000000000000000000000000000000000000000000 | | | | | | | | | | | |
PRACTICAL CALCULATORS
A full lineup of easy-to-use models to meet a variety of different needs.
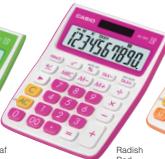
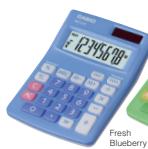
CASIO's unique value added calculators
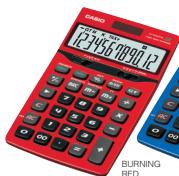
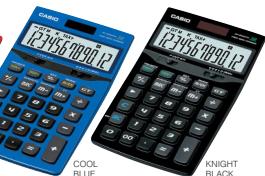
Colourful & Friendly Design
Choose from a selection of fresh colours.


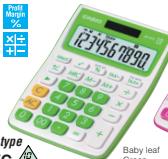


Mini desk type
MS-10VC 2


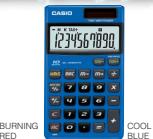
Portable type
SL-100VC 8


Mini desk type
MS-5VC 8
MS-3VC DIGIT


Stylish & Cool Design
The stylish calculator with the look and feel of a finely tuned sports car!

Portable type SL-1000TV
Compact desk type
JE-200TV

| Model | Digits | Independent memory | GT | % | Profit margin % | √+/- | 3-digit comma markers | H/M/S | Tax calculation | Exchange calculation | S/4 | Cut | Decimal selector | ADD mode | Power supply | Dimensions H-W-D (mm) | Approximate weight (g) | Case | |
| MS-10VC | 10 | ● | — | ● | ● | ● | ● | ● | ● | ● | — | — | — | — | Two-way power | 26.2×105.5×144 | 100 | — | |
| SL-100VC | 8 | ● | — | ● | ● | — | ● | ● | ● | — | ● | — | — | — | Two-way power | 29.3×107.5×115.5 | 55 | — | |
| MS-SVC | 8 | ● | — | ● | ● | — | ● | — | ● | — | ● | — | — | — | Two-way power | 25.8×86×118 | 60 | — | |
| JF-Z00TV | 12 | ● | ● | ● | ● | — | ● | ● | ● | — | ● | ● | ● | 0.1,2.3,4 | ● | Two-way power | 29.3×107.7×155 | 165 | — |
| SL-1000TV | 10 | ● | — | ● | ● | — | ● | — | ● | ● | ● | — | — | — | — | Two-way power | 7.5×70×118 | 50 | Wallet |
Folded Unfolded
Check Calculator
D. 24h

DJ-240 ZRR SANS
DJ-220
STEP01 EX0X DISPLAY RALIVER KEY
Metal Cover TAX 100% 200% 300%

DJ-120T
TAX % 费用MU
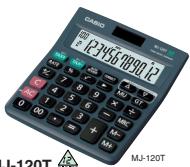
MJ-120T

MJ-100T
TAX % 费 MU

120 Steps CHECK
100 STEPSDJ-20T/DJ-120TMJ-100TMJ-120T
Review and Auto Review
Review and Auto Review
A

三
123+458+321=149703 Step 1 Step 2 Step 119 Step 120

(1) ( 2x - 1) ^2 = x^2 + 4x + 3


Correct (all models)
CORRECT


Double Check (DJ-220 / DJ-240 only).
CHECK


A


You can add steps to or delete steps from Calculation Memory.
Also, remember that if the number of steps in Calculation Memory sequence ABO very well will not be able to review them later.

exceeds 120, you will not be able to review them at all.
Current ca


Metric Converter
MC-100

Wireless Calculator

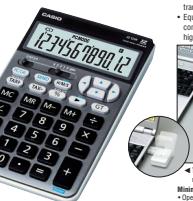
* This calculator is not sold in some countries in accordance with the restrictions of radio laws.
A wireless & trouble-free PC compatible calculator.
- Just plug in the accessory receiver in the USB port on the PC. It allows
wireless data communication between the calculator unit and PC, and easy transmitting of input numbers, calculation results and operation symbols.
- Equipped with Tab, Backspace and Cursor keys for smooth and easy data
communications using Microsoft™ Excel and Microsoft™ Words, providing higher affinity with the PC.

The angle of the receiver can be adjusted to The receiver can be stored inside the unit when inductance-free mode current suppression solution port in turn.
HannanovatalandeweRice Minimum System Requirements
Operating System: Pre-Installed WindowsXP/2000 Professional/Me98.
Computer: IBM PC/AT or compatible PC (DUSV) which meets the following requirements: Run on Windows XP/2000 Professional/Me/98, with a bus
- Microsoft and Windows are registered trademarks of Microsoft Corporation in the
United States and other countries. 1004 DC/NT is an unreported treatment.
ISIM PC/AT is a registered trademark of International Business Machines Corporation.
| Model | Digital | Independent memory | GT | % | Profit margin % | z/- | 3-digit comma numbers | H/M/S | Tax calculation | 5/4 | Cut | Up | Decimal separator | AID mode | Power supply | Dimensions H-W-D (mm) | Approximate weight (g) | Case | Others | | |
| DJ-260 | 14 | ● | ● | ● | ● | ● | ● | ● | ● | ● | ● | ● | ● | 0.1,2.3,4 | ● | Two-way power | 35.7e-147-203.5 | 250 | — | 105 STEPS-CHO | |
| DJ-220 | 14 | ● | ● | ● | ● | ● | ● | ● | ● | ● | ● | ● | ● | 0.1,2.3,4 | ● | Two-way power | 35.7e-147-203.5 | 250 | — | 105 STEPS-CHO | |
| DJ-120T | 12 | ● | ● | ● | ● | ● | ● | ● | ● | ● | ● | ● | ● | 0.1,2.3,4 | ● | Two-way power | 35e-140+191 | 205 | — | 105 STEPS-CHO | |
| DJ-20T | 12 | ● | ● | ● | ● | ● | ● | ● | ● | ● | ● | ● | ● | 0.1,2.3,4 | ● | Two-way power | 35e-123.5e-165.5 | 150 | — | 105 STEPS-CHO | |
| MJ-120T | 12 | ● | ● | ● | ● | ● | ● | ● | ● | ● | ● | ● | ● | — | — | — | Two-way power | 30.1e-123+140 | 130 | — | 105 STEPS-CHO |
| MJ-190T | 10 | ● | ● | ● | ● | ● | ● | ● | ● | ● | ● | ● | ● | — | — | — | Two-way power | 30.1e-123+140 | 130 | — | 105 STEPS-CHO |
| MC-100 | 8 | ● | — | ● | ● | — | — | ● | ● | — | — | — | — | — | — | — | Two-way power | 6.1e-70+117 | 42 | Wallie | Metric conversion |
| JZ-12W | 12 | ● | ● | ● | ● | ● | ● | ● | ● | ● | ● | ● | ● | 0.1,2.3,4 | ● | Two-way power | 35e-110+176.5 | 225 | — | USB receiver | |
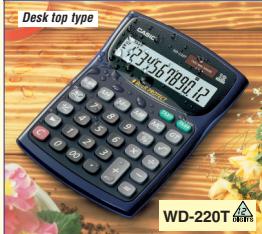
Water-protected and Dust-proof Calculator
Durability and endurance for professional and general users
Complies with IEC 60529 IP 54
(water protect and dust proof)
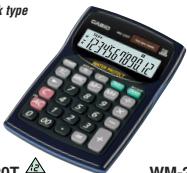
Mini desk type


3-Line Diaplay Calculator
Desk top type
BIC Tax & X=
BIG 1000+
Date
m = 311
D
Key De La Roche
NO1081 %
PLASTICKEYS
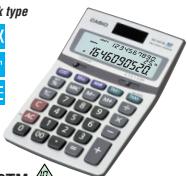
Mini desk type
BIG TAI
DISPL ay TAX
000
100 48 Margin
R 70%
Key X+ Poler 1
002017 单位:元
PLASTIC
Portable type
BIG TAX
BIC DRSIPAY TAX
D1A3T
702 84318388 Margin
p80% 70
Key X
101004
ZUSTING
NS-310TM
range Calculations (OF-320TM only)
Mrs. Restaurant & Bar
The result is obtained in accordance with the

Tax Calculations
Jing & Bookkeeper, Retailer
ation and display of price plus tax, price
In price, tax amount, discount amount, and
DF-320TM

For Shopkeepers


For Personnel Department & Internet Cafe

Currency Conversion
For Money Exchanger, Bank & Travel Agent
You can have up to seven currency conversion rates regu
memory for instant recall whenever you need them. Add a currency name and register a rate, you can use it for your own purposes.
Feml:Currency A1.234 8
P. 291399922
Change Calculations (UF-320TM only)
For Retailers, Restaurant & Bar
The calculation result is obtained in accordance with the following formula:
Tax Calculations
Ling & Bookkeeper, Retailer
lation and display of price plus tax, prior

Cost, Selling Price and
Margin Calculator
Portable type
The only business calculator you'll ever
。

Calculation Examples
Cost
What is the cost of an item that costs for?
What is the cost of an item that sells for $2,550 after a 30% margin is added?
2550
3568
255u.
1 255
2550
30
2550
39
3u
2556
HAR 30%
185

Selling Price
What would the collar price be for an item?
What would the selling price be for an item?
0700
1325
1785.
GSE
1785
1785
00f785
39
3a + 3 = 5 + 2k ,
0007 m85
MATH+ 30%
255u

What is the margin on an item that costs 1,785 and sells for2,550?
1785
(1)
185
001
085
1785
2050
085
3550
C33u.
005
S
Example displays are from NS-310TM.
| Model | Digits | Independent memory | GT | % | Profit margin % | √ | +/- | 3-digit comma markers | H/M/S | Tax calculation | Exchange calculation | S/4 | Cut | Up | Decimal selector | ADD mode | Power supply | Dimensions H-M/D (mm) | Approximate weight (g) | |
| WD-220T | 12 | ● | ● | ● | ● | ● | ● | ● | ● | ● | ● | — | — | — | — | — | Two-way power | 34.1×139×187.5 | 255 | |
| WM-220T | 12 | ● | — | ● | ● | ● | ● | ● | ● | ● | ● | — | — | — | — | — | Two-way power | 34.6×104×153.5 | 135 | |
| WM-200T | 10 | ● | — | ● | ● | ● | ● | ● | ● | ● | ● | — | — | — | — | — | Two-way power | 34.6×104×153.5 | 135 | |
| DF-320TM | 12 | ● | ● | ● | ● | — | ● | ● | ● | ● | ● | ● | ● | ● | ● | 0.1,2,3,4 | ● | Two-way power | 32.3×124×179.5 | 200 |
| MS-310TM | 10 | ● | — | ● | ● | — | ● | — | ● | — | ● | ● | ● | ● | ● | 0.1,2,3,4 | ● | Two-way power | 30×103×156 | 120 |
| NS-310TM | 10 | ● | — | ● | ● | — | ● | — | ● | — | ● | ● | ● | ● | — | 0.1,2,3,4 | ● | Two-way power | 11×87×149.5 | 95 |
| SL-910TM | 10 | ● | — | ● | ● | — | ● | ● | ● | — | ● | — | — | — | — | — | — | Two-way power | 9.9×73×125 | 55 |
PRACTICAL CALCULATORS
Desk Top Type
EXPA Metal X+
BIG DSPLAY COVER +1
pR 102
Key Profit Margin Reliever
PEAK
F
Professional Calculator

DS-3V
EXTRA BIGTAY
DISCUIT
Time 10:40 Date
Key Margin Rolfver %
PLASTIC
RENTS
Metal
M
SPLY Cover
TAY
0000
Key Profit Margins
control %
PLASTIC KEYS
ver +1
X图
DS-2TV
D3-21N
DS-1TV
一
B
D
Prlnt Mags
%
Key X Pellewes
PLASTIC
PS
Professional Calculator
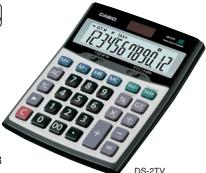
Adding Machine
一

一
1
。
告
Deci
sele 112
1.1.2
1.1.2
Decir
sele 112
1.1.2
Decir
sele 112
1.1.2
Deci
sele 112
Deci
The degree of display can be adjusted freely.
can be adjusted freely
| Model | Digits | Infernal memory | GT % | Profilin % | Mark-up % | 3-digit markers | H/M/S | Taxiation | Exchange | p/4 | Cut | Up | Decimal | Add model | Power supply | Dimensions (mm) | Approximate weight (g) |
| DM-1400V | 14 | ● | ● | ● | ● | ● | ● | ● | ● | ● | ● | ● | ● | 0.1,2,4 | Two-way power | 35.5×150×210 | 273 |
| DM-1200EV | 12 | ● | ● | ● | ● | ● | ● | ● | ● | ● | ● | ● | ● | 0.1,2,3,4 | Two-way power | 35.5×155×210 | 265 |
| D-60L | 16 | ● | ● | ● | ● | ● | ● | ● | ● | ● | ● | ● | ● | 0.1,2,4 | Two-way power | 32×151×158 | 195 |
| D-40L | 14 | ● | ● | ● | ● | ● | ● | ● | ● | ● | ● | ● | ● | 0.1,2,4 | Two-way power | 32×151×158 | 195 |
| D-20L | 12 | ● | ● | ● | ● | ● | ● | ● | ● | ● | ● | ● | ● | 0.1,2,4 | Two-way power | 32×151×158 | 195 |
| DL-170V | 12 | ● | ● | ● | ● | ● | ● | ● | ● | ● | ● | ● | ● | 0.1,2,3 | Two-way power | 35.5×150×210 | 172 |
| DF-120V | 12 | ● | ● | ● | ● | ● | ● | ● | ● | ● | ● | ● | ● | 0.1,2,3,4 | Two-way power | 35×126×175 | 195 |
| DW-120V | 12 | ● | ● | ● | ● | ● | ● | ● | ● | ● | ● | ● | ● | 0.1,2,3,4 | Two-way power | 32.7×122.5×177.5 | 195 |
PRACTICAL CALCULATORS
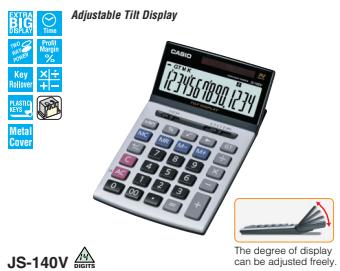
Compact Desk Type

Adjustable Tilt Display
JS-120TV
JS-110TV


Professional Calculator


Adjustable Tilt Display
| Model | Digits | Independent memory | GT | % | Profit margin | +/- | 3-digit
markers | H/M/S | TaxExhaustion
markers | Exchange
5/4 | Cat | Decimal
selector | ADD
mode | Power supply | Dimensions
H-W-D (mm) | Approximate
weight (g) |
| JS-140V | 14 | ● | ● | ● | ● | ● | ● | ● | ● | — | ● | ● | 0.1,2,3,4 | ● | Two-way power | 24.6x107×176.5 |
| JS-120V | 12 | ● | ● | ● | ● | — | ● | ● | ● | — | ● | ● | 0.1,2,3,4 | ● | Two-way power | 24.6x107×176.5 |
| JS-110V | 10 | ● | ● | ● | ● | — | ● | ● | ● | — | ● | ● | 0.1,2,3,4 | ● | Two-way power | 24.6x107×176.5 |
| JS-40V | 14 | ● | ● | ● | ● | ● | ● | ● | ● | — | ● | ● | 0.1,2,3,4 | ● | Two-way power | 24.2x107×174.5 |
| JS-20V | 12 | ● | ● | ● | ● | — | ● | ● | ● | — | ● | ● | 0.1,2,3,4 | ● | Two-way power | 24.2x107×174.5 |
| JS-10V | 10 | ● | ● | ● | ● | — | ● | ● | ● | — | ● | ● | 0.1,2,3,4 | ● | Two-way power | 24.2x107×174.5 |
| J-120V | 12 | ● | ● | ● | ● | — | ● | ● | ● | ● | — | ● | 0.1,2,3,4 | ● | Two-way power | 25x107x176 |
| JF-120V | 12 | ● | ● | ● | ● | — | ● | ● | ● | — | ● | ● | 0.1,2,3,4 | ● | Two-way power | 29.3x107×175.5 |
| JW-120V | 12 | ● | ● | ● | ● | ● | ● | ● | ● | — | ● | ● | 0.1,2,3,4 | ● | Two-way power | 26.1x107×178.5 |
PRACTICAL CALCULATORS
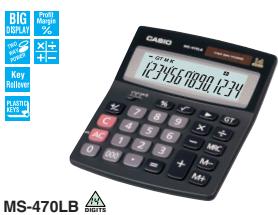
Mini Desk Type


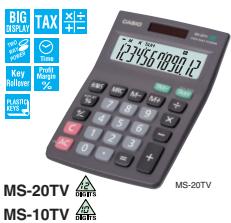


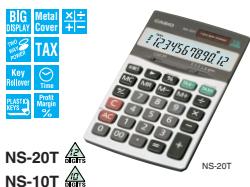
| Model | Digits | Independent memory | GT | % | Profit margin (%) | √ | f+/- | 3-digits zucchini mosaics | H/M/S | Tax calculation | Exchange calculation | S/4 | Cut | Decimal | Add mode | Power supply | Approximate battery life (years) | Dimensions H-W-O (mm) | Approximate weight (g) | |
| MS-470B | 14 | ● | ● | ● | ● | ● | ● | ● | ● | ● | ● | ● | ● | ● | ● | — | — | 32-111±133.5 | 110 | |
| MS-120V | 12 | ● | ● | ● | ● | ● | ● | ● | ● | ● | ● | ● | ● | ● | ● | — | — | 30.7±103±145 | 120 | |
| MS-100T | 10 | ● | ● | ● | ● | ● | ● | ● | ● | ● | ● | ● | ● | ● | ● | — | — | 30.7±103±145 | 120 | |
| MS-80T | 8 | ● | ● | ● | ● | ● | ● | ● | ● | ● | ● | ● | ● | ● | ● | — | — | 30.7±103±145 | 120 | |
| MS-20T | 12 | ● | ● | ● | ● | ● | ● | ● | ● | ● | ● | ● | ● | ● | ● | — | — | 31.7±103±145 | 100 | |
| MS-107T | 6 | ● | ● | ● | ● | ● | ● | ● | ● | ● | ● | ● | ● | ● | ● | — | — | 31.7±103±145 | 100 | |
| MS-81T | 8 | ● | ● | ● | ● | ● | ● | ● | ● | ● | ● | ● | ● | ● | ● | — | — | 31.7±103±145 | 100 | |
| MS-270T | 12 | ● | ● | ● | ● | ● | ● | ● | ● | ● | ● | ● | ● | ● | ● | — | — | 32-111±133.5 | 110 | |
| MS-170T | 10 | ● | ● | ● | ● | ● | ● | ● | ● | ● | ● | ● | ● | ● | ● | — | — | 32-111±133.5 | 110 | |
| MS-7T | 8 | ● | ● | ● | ● | ● | ● | ● | ● | ● | ● | ● | ● | ● | ● | — | — | 32-111±133.5 | 110 | |
| MM-8V | 8 | ● | ● | ● | ● | ● | ● | ● | ● | ● | ● | ● | ● | ● | ● | AA:1.1×10⁻¹¹ | 2 | 28.8±103±145 | 120 | |
| MM-10V | 9 | ● | ● | ● | ● | ● | ● | ● | ● | ● | ● | ● | ● | ● | ● | AA:1.1×100×11 | 2 | 25.1±104±115 | 125 | |
| NS-20T | 12 | ● | ● | ● | ● | ● | ● | ● | ● | ● | ● | ● | ● | ● | 0.1,2.3,4 | ● | Two-way power | — | 10.7-87±145 | 90 |
| NS-10T | 10 | ● | ● | ● | ● | ● | ● | ● | ● | ● | ● | ● | ● | ● | 0.1,2.3,4 | ● | Two-way power | — | 10.7-87±145 | 90 |
R6P=UM-3
PRACTICAL CALCULATORS
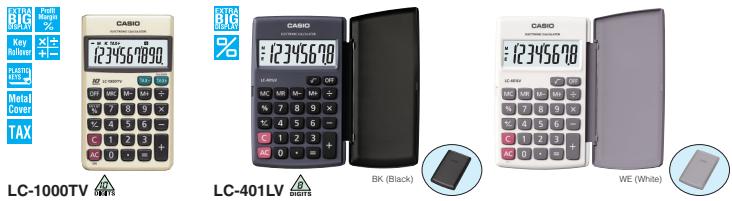
Portable Type

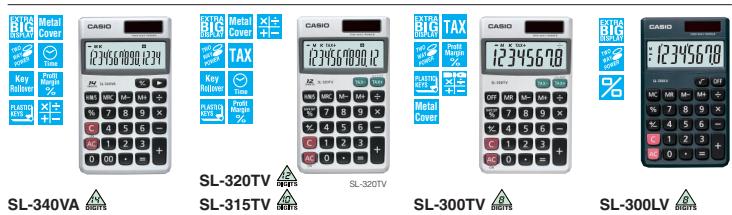

| Model | Digits | Independent memory | GT | % | Profit margin % | □ | -/- | [3] | 3-digit comma punctuation | H/M/S | Tax calculation | Exchange calculation | S/K | Cat | Decimal power | Supply power | Approximate battery life (hours) | Dimensions H-W-O (mm) | Approximate weight (g) | Case | |
| LC-1000VT | 10 | ● | ● | ● | ● | ● | ● | ● | ● | ● | ● | ● | ● | ● | — | — | LRS4×1 | 5,500 | 7.5×70=118.5 | 50 | Wallet |
| LC-401LV | 8 | ● | ● | ● | ● | ● | ● | ● | ● | ● | ● | ● | ● | ● | — | — | LRS4×1 | 4,500 | 0.12,7×70=120; 0.16,1×100 | 70 | Hard |
| LC-403VT | 8 | ● | ● | ● | ● | ● | ● | ● | ● | ● | ● | ● | ● | ● | — | — | LRS4×1 | 7,500 | 7.5×70=118.5 | 50 | Wallet |
| LC-160LV | 8 | ● | ● | ● | ● | ● | ● | ● | ● | ● | ● | ● | ● | ● | — | — | LRS4×1 | 6,500 | 0.10,2×70=96; 0.16,1×17.6 | 35 | Hard |
| SL-340VA | 14 | ● | ● | ● | ● | ● | ● | ● | ● | ● | ● | ● | ● | ● | — | — | Two-way power | — | 7.5×70=118.5 | 50 | Wallet |
| SL-320VT | 12 | ● | ● | ● | ● | ● | ● | ● | ● | ● | ● | ● | ● | ● | — | — | Two-way power | — | 7.5×70=118.5 | 50 | Wallet |
| SL-315VT | 10 | ● | ● | ● | ● | ● | ● | ● | ● | ● | ● | ● | ● | ● | — | — | Two-way power | — | 7.5×70=118.5 | 50 | Wallet |
| SL-300VT | 8 | ● | ● | ● | ● | ● | ● | ● | ● | ● | ● | ● | ● | ● | — | — | Two-way power | — | 7.5×70=118.5 | 50 | Wallet |
| SL-300LV | 8 | ● | ● | ● | ● | ● | ● | ● | ● | ● | ● | ● | ● | ● | — | — | Two-way power | — | 7.5×70=118.5 | 50 | Wallet |
| SL-240LB | 14 | ● | ● | ● | ● | ● | ● | ● | ● | ● | ● | ● | ● | ● | 2 | Two-way power | — | 0.12,5×120×73; 0.16,1×100; 0.16,1×141 | 76 | — | |
| SL-220TE | 12 | ● | ● | ● | ● | ● | ● | ● | ● | ● | ● | ● | ● | ● | 2 | Two-way power | — | 0.12,5×120×73; 0.16,1×100; 0.16,1×141 | 76 | — | |
| SL-210TE | 10 | ● | ● | ● | ● | ● | ● | ● | ● | ● | ● | ● | ● | ● | 2 | Two-way power | — | 0.12,5×120×73; 0.16,1×100; 0.16,1×141 | 75.5 | — | |
| SL-200TE | 8 | ● | ● | ● | ● | ● | ● | ● | ● | ● | ● | ● | ● | ● | — | — | Two-way power | — | 0.12,5×120×73; 0.16,1×100; 0.16,1×141 | 76 | — |
| SL-100L | 8 | ● | ● | ● | ● | ● | ● | ● | ● | ● | ● | ● | ● | ● | — | — | Two-way power | — | 0.13,5×91×56; 0.16,1×100; 0.16,1×141 | 55 | — |
LR54=LR1130
Folded
PRACTICAL CALCULATORS

Portable Type
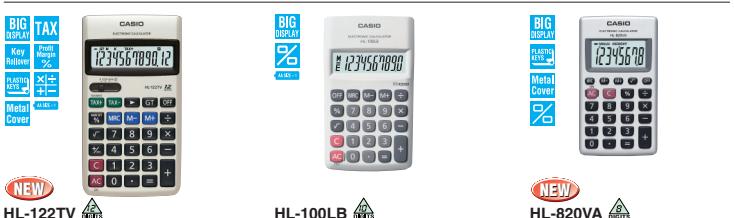

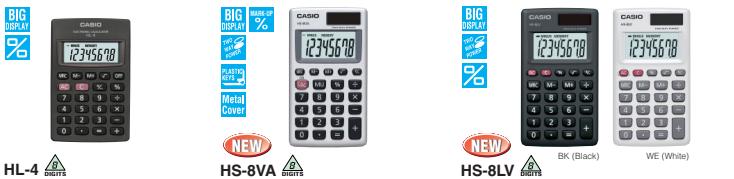
| Model | Digits | Independent memory | GT | % | Profit margin % | Mark-up % | √ | +/- | (3) digit comma punctuation | Tax calculation | Exchange calculation | 5/4 | Cut | Decimal selected | Power supply | Approximate battery life (hours) | Dimensions H-W-0 (mm) | Approximate weight (g) | Case |
| SL-797TV | 8 | ● | — | ● | ● | — | — | — | ● | ● | ● | — | — | — | Two-way power | 6.9×57=102 | 35 | Wallet | |
| SL-787TV | 8 | ● | — | ● | ● | — | — | — | ● | ● | ● | — | — | — | Two-way power | 6.3±9.15=58 | 30 | Wallet | |
| SL-760LB | 8 | ● | — | ● | ● | — | ● | — | ● | — | — | — | — | — | Solar | 2.9~85.5=54 | 15 | Soft | |
| HL-122TV | 12 | ● | ● | ● | ● | — | ● | ● | ● | ● | ● | ● | ● | 2 | LR6×1(RSP×1) | 17,500 | 19.5×77=141 | 115 | Soft |
| HL-100LB | 10 | ● | — | ● | — | — | ● | — | ● | — | — | — | — | — | LR6×1(RSP×1) | 2 yrs. | 18~69.5×118 | 65 | — |
| HL-820VA | 8 | ● | — | ● | — | — | ● | — | ● | — | — | — | — | — | LR54×1 | 2 yrs. | 6.9×57=102 | 35 | Wallet |
| HL-820VL | 8 | ● | — | ● | — | — | ● | — | ● | — | — | — | — | — | LR54×1 | 6,500 | Q1~82.5×1104 | 45 | Hard |
| HL-815L | 8 | ● | — | ● | — | — | ● | — | ● | — | — | — | — | — | LR6×1(RSP×1) | 2 yrs. | 18~69.5×118 | 65 | — |
| HL-4 | 8 | ● | — | ● | — | — | ● | ● | — | — | — | — | — | — | LR54×1 | 6,500 | 8.8×56=87 | 25 | — |
| HS-SVA | 8 | ● | — | ● | — | ● | ● | ● | — | — | — | — | — | — | Two-way power | 6.9×57=102 | 35 | Wallet | |
| HS-8LV | 8 | ● | — | ● | — | — | ● | ● | ● | ● | — | — | — | — | Two-way power | 6.7~57×102 | 35 | Wallet | |
| Model | Digits | Independent memory | GT | % | Mark-up % | \( \square \) | +/- | \( \boxed{\mathbf{E}} \) | 3-digit chat markers | Item counter | 5/4 | Cut | Up | Decimal identifier | ADD mode | Power supply | Dimensions H-W-D (mm) | Approximate weight (g) |
| GX-16V | 16 | ● | — | ● | ● | ● | ● | ● | ● | — | ● | ● | ● | 0,1,2,4 | ● | Two-way power | 34.5×155×210 | 230 |
| GX-14V | 14 | ● | — | ● | ● | ● | ● | ● | ● | ● | ● | ● | ● | 0,1,2,4 | ● | Two-way power | 34.5×155×210 | 230 |
| GX-120V | 12 | ● | — | ● | ● | ● | ● | ● | ● | ● | ● | ● | ● | 0,1,2,4 | ● | Two-way power | 35.5×155×210 | 260 |
| GX-12V | 12 | ● | — | ● | ● | ● | ● | ● | ● | ● | ● | ● | ● | 0,1,2,4 | ● | Two-way power | 34.5×155×210 | 230 |
| DX-120TV | 12 | ● | ● | ● | ● | ● | ● | ● | ● | — | ● | ● | ● | 0,1,2,4 | ● | Two-way power | 32.7×122.5×177.5 | 195 |
| DX-120V | 12 | ● | ● | ● | ● | ● | ● | ● | ● | — | ● | ● | ● | 0,1,2,4 | ● | Two-way power | 36×126×175 | 190 |
| DX-12V | 12 | ● | ● | ● | ● | ● | ● | ● | ● | — | ● | ● | ● | 0,1,2,4 | ● | Two-way power | 35×126×175 | 170 |
PRACTICAL CALCULATORS

Compact Desk Type


Mini Desk Type


Portable Type

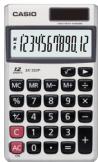

MX-120V
SX-320P


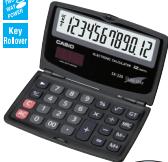


SX-300P

DUAL LEAF SX-220

DUAL LEAF SX-100 8 DIGITS
| Model | Digits | Independent memory | GT | % | Mark-up % | ☑ | -/- | ☐ | 3-digit comma markers | S/4 | Cut | Up | Decimal selector | ADD mode | Power supply | Dimensions H-W-D (mm) | Approximate weight (g) | Case | | | | | | | | | | | | | | | | | | |
| AX-120TV | 12 | ● | ● | ● | ● | ● | ● | ● | ● | ● | ● | ● | ● | 0,1,2,4 | ● | Two-way power | 26.1×107×178.5 | 170 | — | | | | | | | | | | | | | | | | | |
| AX-120V | 12 | ● | ● | ● | ● | ● | ● | ● | ● | ● | ● | ● | ● | 0,1,2,4 | ● | Two-way power | 29.3×107×175.5 | 165 | — | | | | | | | | | | | | | | | | | |
| AX-12V | 12 | ● | ● | ● | ● | ● | ● | ● | ● | ● | ● | ● | ● | 0,1,2,4 | ● | Two-way power | 25×107×176 | 145 | — | | | | | | | | | | | | | | | | | |
| MX-120V | 12 | ● | — | ● | ● | — | ● | ● | ● | — | — | — | — | — | — | Two-way power | 30.7×103×145 | 120 | — | | | | | | | | | | | | | | | | | |
| MX-12V | 12 | ● | — | ● | ● | — | ● | ● | ● | — | — | — | — | — | — | Two-way power | 31.7×103×145 | 100 | — | | | | | | | | | | | | | | | | | |
| SX-320P | 12 | ● | — | ● | — | ● | ● | ● | ● | — | — | — | — | — | — | Two-way power | 7.5×70×118.5 | 50 | Wallet | | | | | | | | | | | | | | | | | |
| SX-300P | 8 | ● | — | ● | — | ● | ● | — | ● | — | — | — | — | — | — | Two-way power | 7.5×70×118.5 | 50 | Wallet | | | | | | | | | | | | | | | | | |
| SX-300 | 8 | ● | — | ● | — | ● | ● | — | ● | — | — | — | — | — | — | Two-way power | 7.5×70×118.5 | 50 | Wallet | | | | | | | | | | | | | | | | | |
| SX-220 | 12 | ● | ● | ● | — | ● | ● | ● | ● | — | — | — | — | — | — | Two-way power | 0.12×12×27×27×27×27×27×27×27×27×27×27×27×27×27×27×27×27×27×27×27×27×27×27×27×27×27×27×27×27×27×27×27×27×27×27 | 80 | — | | | | | | | | | | | | | | | | | |
| SX-100 | 8 | ● | — | ● | — | ● | ● | — | ● | — | — | — | — | — | — | Two-way power | 0.13×5×9×15×15×15×15×15×15×15×15×15×15×15×15×15×15×15×15×15×15×15×15×15×15×15×15×15×15×15×15×15×15×15×15×15×15 × 15×15×15×15×15×15×15×15×15×15×15×15×15×15×15×15×15×15×15×15×15×15×15×15×15×15×15×15×15×15×15×15×15×27×27×27×27×27×27×27×27×27×27×27×27×27×27×27×27×27×27×27×27×27×27×27×27×27×27×27×27×27×27×27×27×27 × 15×15×15×15×15×15×15×15×15×15×15×15×15×15×15×15×15×15×15×15×15×15×15×15×15×15×15×15×15×15×15×15×16×16×16×16×16×16×16×16×16×16×16×16×16×16×16×16×16×16×16×16×16×16×16×16×16×16×16×16×16×16×16×16×16×16 × 16×16×16×16×16×16×16×16×16×16×16×16×16×16×16×16×16×16×16×16×16×16×16×16×16×16×16×16×16×16×16×16×16×27×27×27×27×27×27×27×27×27×27×27×27×27×27×27×27×27×27×27×27×27×27×27×27×27×27×27×27×27×27×27×27×27X27X27X27X27X27X27X27X27X27X27X27X27X27X27X27X27X27X27X27X27X27X27X27X27X27X27X27X27X27X27X27X27X27X |
Folded Unfolded
PRINTING CALCULATORS
Printouts of results along with each calculation step can be attached to documents.
Mini-printer

BK (Cool blac
m = 311 ;

HR-8TM
Main Functions & Printing Sample
Cost, Selling Price and Margin Calculations
For Shopkeepers & Traders
Perform the operations shown to the right to calculate cost, selling price, and margin.
Exchange Functions
Present rates for converting between U.S. dollars and up to three national currencies at the touch of a key. A simple operation also converts between national currencies, with intermediate conversion to U.S. dollars.
Tax Calculations
Set the rate you want for easy calculation of amount plus tax, amount less tax, and tax amount.
Desk-top Type

MU
MDI
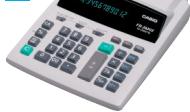
FR-2650T

FR-2650DT


GY (Gray)
DR-120LB
Price
he selling p
ts $120 aft
三
OST
A
A
EL
0.0 < 0
180·Cost
00
x
Selling price
m - 1 0 ;
40-M Margin (%)
Margin amount
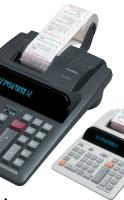
图3
What is the margin on an item that costs
1,000 and sells for2,000?
| Model | Display | Eighty | Singleprocessor Lg | Adding machine | Subtotal | GT | Independent memory | Cell/ Speed | Memory | % | Port load | MΩ | MHz | +/- | 3-digit marks | p-reading | 2-color coloration | Exhaust coloration | Item number | S/R | Cell | Up | Derived serial | AD mode | Power supply | I/O buffer | Inlet-to- port | Pw (mm) | Dimensions H-W (mm) | Approximate weight | Others |
| HR-8TM | LCD | 12 | ● | — | — | ● | ● | ● | ● | ● | ● | ● | ● | ● | ● | ● | ● | ● | ● | ● | ● | ● | 0,2 | ▲ AA = 4A:402000 (R-40) | Rb-bit/s | Raw cell size (mm) | 56 | 41.1×99×196 | 340g | Function of the analog circuit | |
| HR-100TM | LCD | 12 | — | ● | ● | ● | ● | ● | ● | ● | ● | ● | ● | ● | ● | ● | ● | ● | ● | ● | ● | ● | 0,23 | ▲ AA = 4A:402000 (R-40) | Rb-50 | 58 | 67×185×585 | 520g | Average utilization | | |
| HR-150TM | LCD | 12 | — | ● | ● | ● | ● | ● | ● | ● | ● | ● | ● | ● | ● | ● | ● | ● | ● | ● | ● | ● | 0,23 | ▲ AA = 4A:402000 (R-40) | Rb-50 | 58 | 67×195×517 | 700g | Average utilization | | |
| FR-2605DT | Digiton | 12 | — | ● | ● | ● | ● | ● | ● | ● | ● | ● | ● | ● | ● | ● | ● | ● | ● | ● | ● | ● | 4,3,2,0 | ▲ AC only | Rb-40 | 58 | 76/266/635 | 1.1kg | — | | |
| FR-2605DT | Digiton | 12 | — | ● | ● | ● | ● | ● | ● | ● | ● | ● | ● | ● | ● | ● | ● | ● | ● | ● | ● | ● | 4,3,2,0 | ▲ AC only | Rb-40 | 58 | 78/233/343 | 1.3kg | — | | |
| DR-128L/B | Digiton | 12 | — | ● | ● | ● | ● | ● | ● | ● | ● | ● | ● | ● | ● | ● | ● | ● | ● | ● | ● | ● | 0–6 | ▲ AC only | Rb-02 | 58 | 75/212/358 | 1.5kg | — | | |
PRINTING CALCULATORS
Desk-top Type

LINE PRINT

DR-140I


DF

21

H


13/14
m = 311
DB-2


m = 311
1 + u7 = 70%
m = 311 ;
13/14
m = 311
D.
答:
/
%
/
m = 311
13/14
13/14
13/14
.
B
A
19
1
m = 311 ;
rinter
High-speed printing (approximately 8 lines/sec.) & quiet printing


DIGITALDIARY
Packed with a host of powerful data management features.
Digital Diary with PC-link

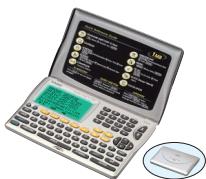

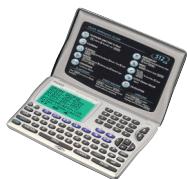


Main Functions (SF-7990/6990/4990)


Digital Diary


950 Telephone Directory records!
SF-2500


Digital Diary Specifications
| Model | SF-7950 | SF-6950 | SF-4950 | SF-3950 | SF-7500 |
| Memory | 1M8 | 512Kb | 256Kb | 128Kb | 229Kb |
| Speech | 1.6 × 6 | 1.7 × 6 | 1.7 × 6 | 1.3 × 12 × 3 | 1.2 × 12 × 2 |
| Backlight | ● | ● | ● | | |
| Data communications with a PC | ● | ● | Option | | — |
| Telephone directory (uR, v-mail address) | ● | ● | ● | ● | ● |
| Calendar | ● | ● | ● | | — |
| Schedule | ● | ● | ● | ● | ● |
| Leisure | ● | ● | ● | | — |
| Anniversary | ● | ● | ● | ● | ● |
| Conversion (currency:metric) | ● | ● | ● | ● | ● |
| Home | ● | ● | ● | ● | ● |
| To Do | ● | ● | ● | ● | |
| Clock | ● | ● | ● | ● | ● |
| World time | ● | ● | ● | ● | ● |
| Access | ● | ● | ● | ● | — |
| Calculator | 10-digit | 10-digit | 10-digit | 10-digit | 12-digit |
| Secret | ● | ● | ● | ● | ● |
| Multi-lingual messages (B languages for message displays) | ● | ● | ● | ● | — |
| Data exchange between two digital display systems (A&D or SBI) | ● | ● | ● | | — |
| Power supply | OR2002 × 2 | OR2002 × 2 | OR2002 × 3 | OR2002 × 2 | OR2002 × 2 |
| Approximate battery life | 1 year−1 | 1 year+1 | 1 year+1 | 2 years+1 | 1 year+1 |
| Dimensions H × W × D (mm) | 14.7 × 14.5 × 91 | 14.7 × 14.5 × 91 | 14.7 × 14.5 × 91 | 13.9 × 14.5 × 91 | 14.7 × 18.5 × 8.5 |
| Dimensions H × D × S (mm) | 11.1 × 11.1 × 178 | 11.1 × 11.1 × 178 | 11.1 × 11.1 × 178 | 10.9 × 10.9 × 178 | 11.0 × 11.0 × 18.5 |
| Approximate weight (g) | 130 | 130 | 130 | 120 | 110 |
*1 Unit turned on one hour each day (5 minutes operation, 55 minutes no operation), with two backlight operations, one Daily Alarm operation per day and Hourly Time Signal turned on.
Unit turned on.
Personal Computer Link for Windows
The easiest way to exchanwith your CASIO Digital I
- Loading of data to a computer from a Digital Diary for hard disk or hard disk drive
- Input and editing of data on a computer for the following downloading to a Digital Diary

Model Supported
Minimum System Requirements
| Operating System | RAM | Processor |
| Windows*XP Home Edition/Professional | 64MB | Pentium 230MHz |
| Windows*8 | 32MB | Pentium 150MHz |
| Windows*2000 Professional | 64MB | Pentium 150MHz |
| Windows*98/98 Second Edition | 24MB | Pentium 150MHz |
| Windows*95 | 16MB | Pentium 75MHz |
| Windows* NT Workstation 4.0 (Service Pack 3 or later) | 32MB | Pentium 150MHz |
LABEL PRINTERS
The CASIO EZ-LABEL PRINTER has something for just about every type of office or household labeling needs.
EZ-Label Printer


Introducing a new compact & handy label printer...
A useful tool for the home or office
- Supports label tape sizes: 18m/12mm
- Simple and easy to use
- 12mm printer head
- Big easy-to-read 10-digit × 2-line display
- Prints up to 3 lines on a single label
- 85 characters memory
- 400 pages of paper
- Barcode printing
KL-780
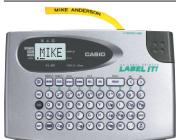


KL-60
KL-60SR
Create your own original labels anytime, anywhere!
Supports label tape sizes: 12mm / mm / 6mm Prins up to 2 lines on a single label Characters for 14 languages 6 character sizes 3 text effects


KL-170
The portable, easy-to-use Chinese label printer
Supports label tape sizes: 18mm/12mm/9mm/6mm •Prints up to 2 lines on a single label • Character styles: Normal outline • Character effects: Rox
Supports label tape four sizes
(18mm/12mm/9mm/6mm)
24 character sizes
3 text effects
14 character styles Standard outline subway mixed
4 1
- Barcode printing - Print barcodes using LAN-0 or LAN-15 format
12mm印刷头
The 12mm printer head ensures that large font sizes are crisp and clear
Prints up to 3 lines on a single label
Up to 5 lines of text makes available more useful
and informative
Characters for 14 languages
Support for a wide range of alphabet-based text input and printing
Five Chinese input methods
Beijing Pin-yin, Canton Pin-yin, Zhu-yin, Chang-ji, Simplified Chang-ji
Ming Chao and five English fonts built in
明,MingChao,Logo style,Roman,Sans-serif,Stencil

6 character sizes
Cute illustrations of the 12 signs of the zodiac built in

| Printing Mirrster Direction | Languaging source** | Power supply | Approximate battery life*** | Aioo power (W - W 0) | Approximate weight (g), (mm) |
| ● Horizontal | 14 | AA + 6 | 3 tape cartridges [L.Rb(AM)] | 51.5 × 168 × 217 | 470 |
| ● Horizontal | 14 | AA + 6 | 3 tape cartridges [L.Rb(AM)] | 51.5 × 168 × 114 | 300 |
| ● Horizontal, Vertical | 2 | AA + 2 | 3 tape cartridges | 53 × 178 × 111 | 370 |
i
Label Printer Options
Basic Colour Tape (8m)
| BLACK ON WHITE | XR-24W1 (24mm) XR-9WE (3mm) XR-12W1 (12mm) XR-12WE (12mm) XR-12W1 (12mm) |
| BLACK ON YELLOW | XR-24W1 (24mm) XR-9W1 (3mm) XR-18W1 (18mm) XR-6W1 (6mm) XR-12W1 (12mm) |
| BLACK ON GOLD | XR-18D21 (18mm) XR-9GD1 (9mm) XR-12GD1 (12mm) |

XR-241(240) XR-98(310) XR-106(310) XR-121(120)

XR-24D1 (24mm) XR-9d1 (9mm) XR-6d1 (6mm) XR-12d1 (12mm)
Basic Colour Tape (Colour letter·8m)
| RED on WHITE | XR-18WER1 (18mm) XR-9WER1 (9mm) |
| XR-12WER1 (12mm) |

XR-18WEB1 (18mm) XR-9WEB1 (9mm)
XR-12WEB1 (12mm)
on-on Transfer Tape (5m)
| BLACK INK | X8-118 BX1 (18mm) |
Printing samples are smaller than actual size
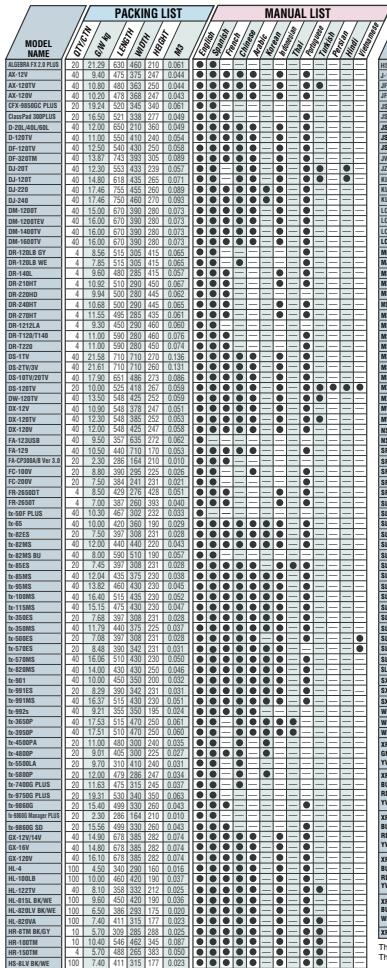
PACKING AND MANUAL Lists

The above model names are listed in alphabetic order. The contents of the above packing list and manual list are subject to change without notice.
SALES PROMOTION MATERIALS
Display Tool Kit for Practical Calculators
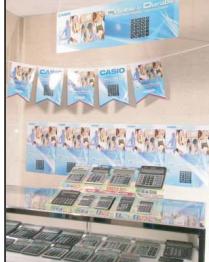
- Display stand (200H + 580W × 400Dmm) × 1
- Function stickers × 1
- Poster × 5
- Catalogue × 1
- Panel × 1
- Banner × 1
Note:
Display Tool Kit for Scientific Calculators ES Series NEW

- Poster x 2
- Panel x 1
- Stuffer (with box) x 100 pcs/box
- Banner x 1
- POP product advertisement x 5
- Card for sales staff explanations x 1
Note: The calculator units themselves are not included in this kit.
Unit Stand (PPSD7)
Size: 160x160, 66W, 95Dmm Weight: 25g
CASIO Logo Sticker

Size: 210 × 297mm
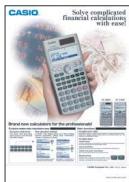
FC-200V/100V Artwork
NEWSPAPER/MAGAZINE ADVERTISMENT
Scientific Calculator Artwork
ES Series NEW

3-line Display Calculator Artwork

Printing Calculator Artwork
ACTIVITIES
Scientific Calculator Activities for ES Series
(Activities for MS Series are also available.)

"Your Partner to Explore Math"
Activities for fx-3850P
Graphic Calculator Activities for fx-9860 Series

Financial Calculator Calculation Examples for FC-200/100V