
DMT340 - Humidity and temperature sensor VAISALA - Free user manual and instructions
Find the device manual for free DMT340 VAISALA in PDF.
| Brand | VAISALA |
| Model | DMT340 |
| Product type | Humidity and temperature measurement sensor / Dew point transmitter |
| Category | Humidity and temperature measurement sensor |
| Dimensions (L x W x H) | Approx. 120 x 80 x 60 mm |
| Weight | Approx. 300 g |
| Power supply | 24 VAC/VDC (separate mains module) |
| Power consumption | Less than 10 W |
| Temperature measurement range | -40 to +80 °C |
| Humidity measurement range | 0 to 100 % RH |
| Dew point measurement range | -60 to +60 °C |
| Typical accuracy (dew point) | ±0.2 °C |
| Main functions | Measurement of dew point, temperature and relative humidity; analog outputs (4-20 mA) and digital outputs (RS-485); optional graphical display; configurable alarms |
| Communication interface | RS-485 (Modbus RTU); analog output 2 x 4-20 mA |
| Housing material | Reinforced polycarbonate, IP65 (NEMA 4X) |
| Maintenance and cleaning | Clean with a soft cloth and mild detergent; check sensor periodically; replace sensor filter as recommended |
| Safety | Electrical connection by a qualified electrician; mandatory grounding; do not disconnect the power module while energized |
| Spare parts and repairability | User-replaceable sensor and filter; separate power module; Vaisala technical support |
| General information | Compliant with Canadian standard NMB-003; class B (domestic and industrial use) |
Frequently Asked Questions - DMT340 VAISALA
User questions about DMT340 VAISALA
0 question about this device. Answer the ones you know or ask your own.
Ask a new question about this device
Download the instructions for your Humidity and temperature sensor in PDF format for free! Find your manual DMT340 - VAISALA and take your electronic device back in hand. On this page are published all the documents necessary for the use of your device. DMT340 by VAISALA.
USER MANUAL DMT340 VAISALA
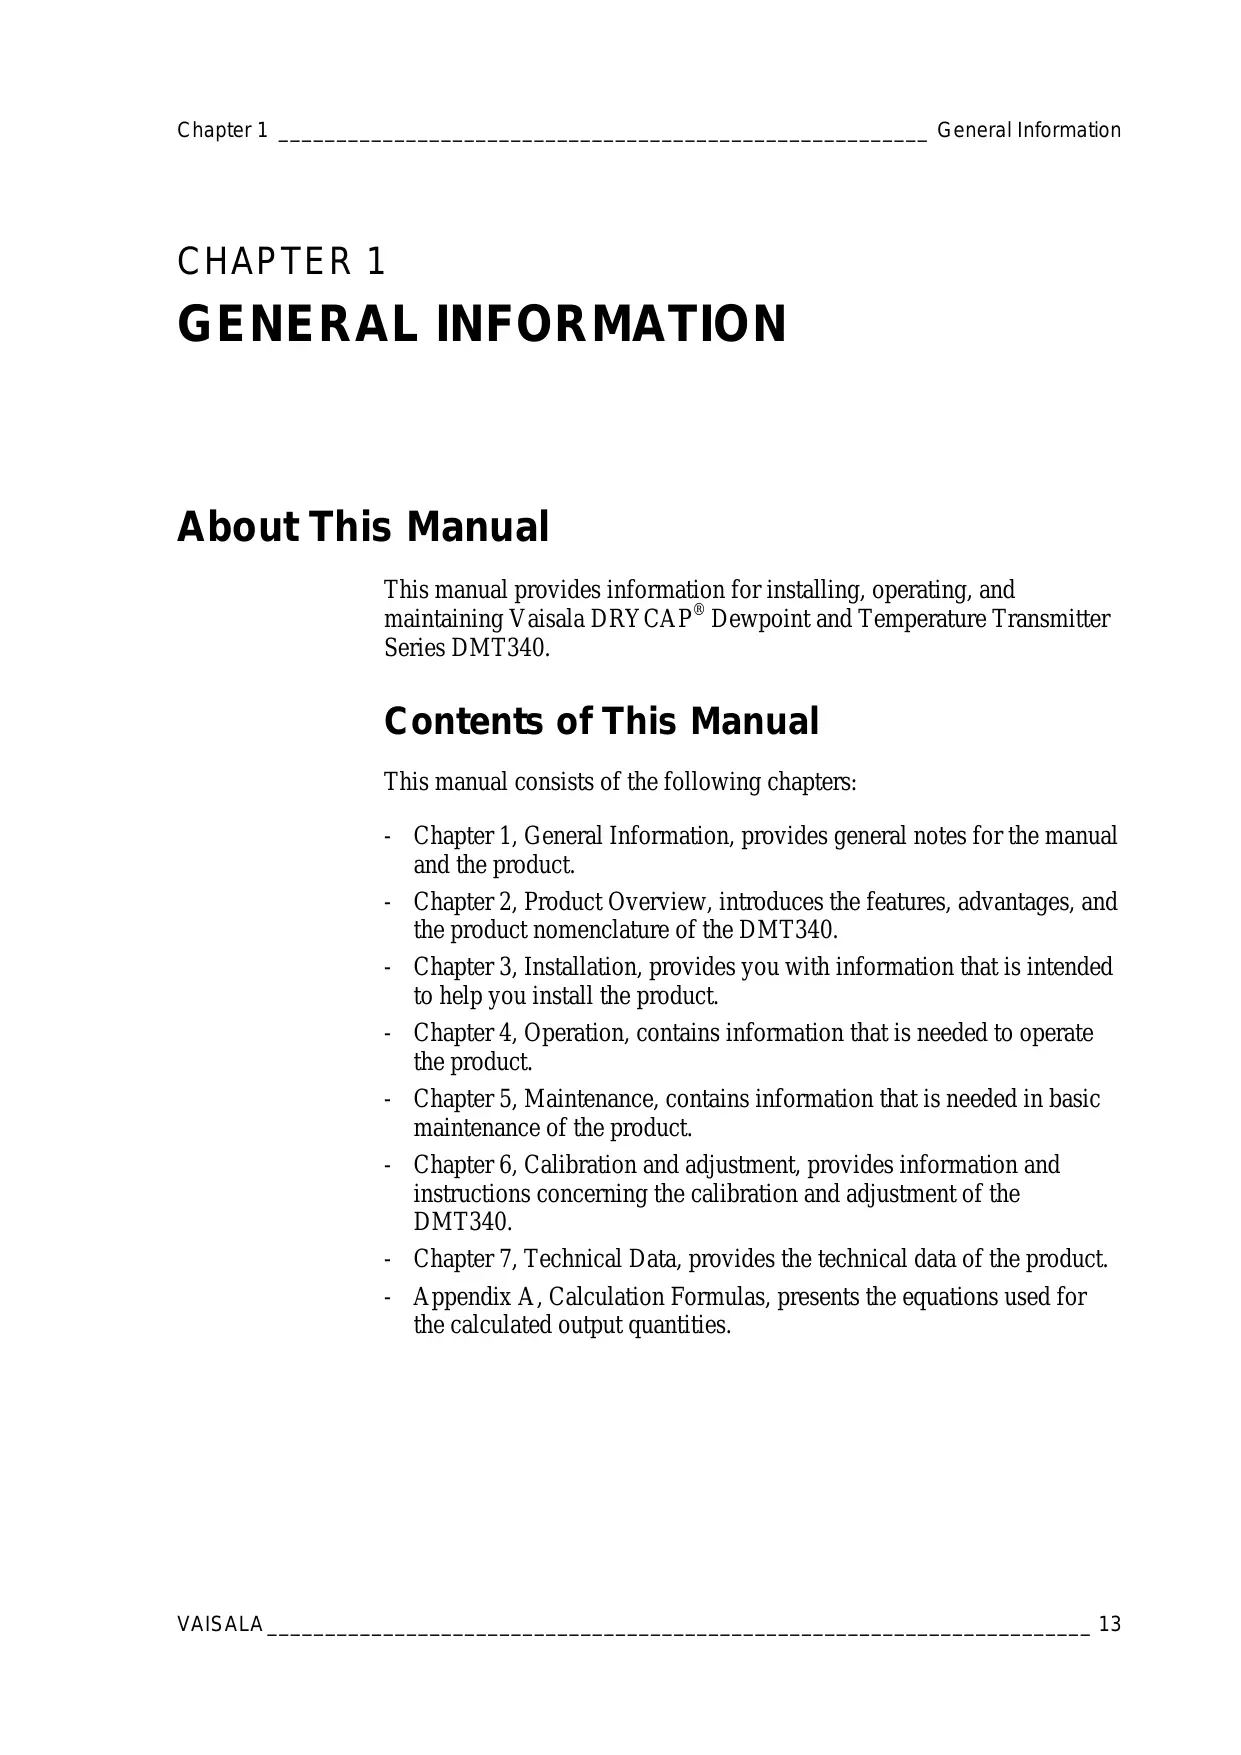
Vaisala DRYCAP® Dewpoint and Temperature Transmitter Series DMT340
PUBLISHED BY
Vaisala Oyj
Phone (int.): +358 9 8949 1
P.O.Box 26
Fax: +358 9 8949 2227
FI-00421 Helsinki
Finland
Visit our Internet pages at http://www.vaisala.com/
© Vaisala 2009
No part of this manual may be reproduced in any form or by any means, electronic or mechanical (including photocopying), nor may its contents be communicated to a third party without prior written permission of the copyright holder.
The contents are subject to change without prior notice.
Please observe that this manual does not create any legally binding obligations for Vaisala towards the customer or end user. All legally binding commitments and agreements are included exclusively in the applicable supply contract or Conditions of Sale.
C E
Table of Contents
CHAPTER 1
GENERAL INFORMATION 13
About This Manual 13
Contents of This Manual 13
Version Information 14
General Safety Considerations 14
Feedback. 14
Product Related Safety Precautions 15
ESD Protection. 15
Recycling 15
Regulatory Compliances 16
DNV Type Approval 16
Transmitters with LAN or WLAN Interface 16
Transmitters with WLAN Interface 17
Patent Notice 17
Trademarks 17
License Agreement 18
Warranty 18
CHAPTER 2
PRODUCT OVERVIEW 19
Introduction to DMT340 19
Basic Features and Options 20
Structure of the Transmitter 21
Probe Options 23
CHAPTER 3
INSTALLATION 25
Mounting the Housing 25
Standard Mounting without Mounting Plate 25
Wall Mounting with Wall Mounting Kit 26
Mounting with DIN Rail Installation Kit 28
Pole Installation with Installation Kit for Pole or Pipeline .... 29
Mounting the Rain Shield with Installation Kit 30
Panel Mounting Frame 30
Wiring 32
Cable Bushings 32
Grounding the Cables 33
Transmitter Housing Grounding 34
Signal and Power Supply Wiring 34
Connections to a 24 VAC Power Supply 35
Probe Mounting 36
DMT342 Small-size Flanged Probe for Use with Sampling
Cell 37
DMT344 For High-pressure Applications 39
DMT347 Small Pressure-tight Probe. 41
Pressure-Tight Swagelok Installation Kits for DMT347.....41
DMT348 For Pressurized Pipelines. 43
Tightening the Clasp Nut 45
Ball Valve Installation Kit for DMT348 46
Leak Screw Installation 49
Mounting the Probe Directly to the Process. 50
Sampling Cell for DMT348 52
Optional Modules 54
Power Supply Module 54
Installation 55
Warnings 55
Galvanic Isolation for Output 58
Installation 58
Third Analog Output 59
Installation and Wiring 59
Alarm Relays 60
Installation and Wiring 60
Selecting the Activation State of the Relay 61
RS-422/485 Interface 62
Installation and Wiring 62
LAN Interface 64
WLAN Interface 65
Attaching the WLAN Antenna 66
Data Logger Module 66
8-pin Connector 69
CHAPTER 4
OPERATION 71
Getting Started 71
Display/Keypad 71
Basic Display 71
Graphic History 72
74
Changing the Language 75
Rounding Setting 76
Display Backlight Setting 76
Display Contrast Setting 76
Keypad Lock (Keyguard) 76
Menu PIN Lock. 77
Factory Settings. 77
Display Alarms. 78
Configuring a Display Alarm. 78
MI70 Link Program for Data Handling 80
Serial Line Communication 80
User Port Connection 81
Service Port Connection. 82
Connection Cables 82
Installing the Driver for the USB Cable 82
Using the Service Port. 83
LAN Communication 84
IP Configuration. 84
Using Display/Keypad 85
Using Serial Line 86
Wireless LAN Configuration 87
Using Display/Keypad 87
Using Serial Line 89
Telnet Settings 89
Web Configuration for LAN and WLAN. 90
Terminal Program Settings 91
Opening a Serial/USB connection 91
Opening a Telnet session (LAN/WLAN) 92
List of Serial Commands 94
Getting the Measurement Message from Serial Line 96
Starting Continuous Outputting 96
R. 96
Stopping Continuous Outputting 96
S. 96
Formatting Serial Line Message 97
FTIME and FDATE. 97
FST 97
General Settings. 98
Changing the Quantities and Units 98
Using Display/Keypad 98
Using Serial Line 99
FORM 99
UNIT 100
Pressure Compensation Setting 101
Using Display/Keypad 101
Using Buttons on the Motherboard 102
Using Serial Line 102
XPRES and PRES 102
Date and Time. 103
Using Display/Keypad 103
Using Serial Line 104
User Port Serial Settings. 104
SERI 105
SMODE 105
INTV 106
ECHO 106
Data Filtering. 106
FILT 107
Device Information 107
? 108
HELP 109
ERRS 109
VERS 109
Resetting the Transmitter Using Serial Line 110
RESET 110
Locking Menu/Keypad by Using Serial Line 110
LOCK 110
Data Recording 111
Selecting the Data Recording Quantities 111
DSEL 111
View Recorded Data 111
DIR 112
PLAY 113
Deleting the Recorded Files 114
UNDELETE 114
Analog Output Settings 114
Changing the Output Mode and Range 114
Analog Output Quantities 116
AMODE/ASEL 117
Analog Output Tests. 118
ITEST 118
Analog Output Fault Indication Setting 119
AERR. 119
Operation of Relays 120
Quantity for Relay Output 120
Measurement-Based Relay Output Modes 120
Relay Setpoints 120
Hysteresis 121
Relay Indicating Transmitter Error Status 122
Enabling/Disabling the Relays. 123
Operation of the Indication LEDs 124
Setting the Relay Outputs 124
RSEL 125
Testing the Operation of Relays 126
RTEST 127
Operation of the RS-485 Module 127
Networking Commands 127
SDELAY 128
SERI 128
ECHO 128
SMODE 128
INTV 129
ADDR 129
OPEN [nn] 130
CLOSE 130
Sensor Functions 130
AutoCal 130
Automatic AutoCal. 131
Manual AutoCal. 131
Sensor Purge. 131
Manual Sensor Purge 132
Interval Purge 132
Power-up Purge 133
PUR. 133
PURGE. 133
Sensor Warming. 134
CHAPTER 5
MAINTENANCE. 135
Periodic Maintenance. 135
Cleaning 135
Changing the Probe Filter 135
Calibration and Adjustment 135
Error States 136
Technical Support 138
Return Instructions 138
Vaisala Service Centers 139
CHAPTER 6
CALIBRATION AND ADJUSTMENT 141
Calibration 141
User Calibration and Adjustment 141
Opening and Closing the Adjustment Mode. 142
Adjustment Information 143
CTEXT and CDATE 143
Adjusting Dewpoint T_d / f 144
Two-point Relative Humidity Adjustment using
Display/Keypad 144
Two-point Relative Humidity Adjustment Using Serial Line146
One-point Dewpoint Adjustment Using Display/Keypad... 146
One-point Dewpoint Adjustment Using Serial Line 148
Adjusting Temperature 149
Adjusting Temperature Using Display/Keypad 149
Adjusting Temperature Using Serial Line 150
CT 150
Adjusting Analog Outputs 151
Adjusting Analog Outputs using Display/Keypad. 151
Adjusting Analog Outputs using Serial Line 152
ACAL 152
CHAPTER 7
TECHNICAL DATA 153
Specifications 153
Performance 153
Operating Environment 154
Inputs and Outputs 154
Mechanics 155
Probe Specifications 155
Technical Specifications of Optional Modules 156
Power Supply Module 156
Analog Output Module 156
Relay Module 156
RS-485 Module 157
LAN Interface Module 157
WLAN Interface Module. 157
Data Logger Module 157
Options and Accessories 158
Dimensions (mm/inch) 160
APPENDIX A
CALCULATION FORMULAS 165
This page intentionally left blank.
List of Figures
Figure 1 Transmitter Body. 21
Figure 2 Inside the Transmitter. 22
Figure 3 Probe Options 23
Figure 4 Standard Mounting 25
Figure 5 Mounting with Wall Mounting Kit 26
Figure 6 Dimensions of the Plastic Mounting Plate (mm/inch) 26
Figure 7 Mounting with Metal Wall Mounting Plate 27
Figure 8 Dimensions of Metal Mounting Plate (mm/inch) 27
Figure 9 Mounting with DIN Rail Installation Kit 28
Figure 10 Vertical Pole 29
Figure 11 Horizontal Pole 29
Figure 12 Mounting the Rain Shield with Installation Kit 30
Figure 13 Panel Mounting Frame 31
Figure 14 Panel Mounting Dimensions (mm/inch) 31
Figure 15 Cable Bushings 32
Figure 16 Grounding the Screen of Electrical Cable 33
Figure 17 Screw Terminal Block on the Motherboard 34
Figure 18 Connections to 24 VAC Power Supply. 36
Figure 19 DMT342 Installation (without the Sampling Cell) 37
Figure 20 HMP302SC Optional Sampling Cell. 38
Figure 21 DMT344 Probe 39
Figure 22 Tightening the Nut 40
Figure 23 Cleaning of the Tightening Cone. 40
Figure 24 DMT347 Probe with Swagelok Installation Kit 41
Figure 25 DMT347 Probe Installation to Pipeline with Swagelok
Installation Kit 42
Figure 26 DMT348 Probe 43
Figure 27 Leak Screw in the DMT348 Probe 44
Figure 28 Sealing of Fitting Body into Process 44
Figure 29 Tightening the Clasp Nut. 45
Figure 30 Installing the DMT348 Probe Through a Ball Valve Assembly 47
Figure 31 Probe in Leak Screw Installation 49
Figure 32 DM240FA with Probe 50
Figure 33 Example of Installing the Probe Directly on the Process Pipe.51
Figure 34 Sampling Cells DMT242SC2 and DMT242SC 52
Figure 35 Installing the Probe in High Temperatures. 53
Figure 36 Power Supply Module 54
Figure 37 Galvanic Output Isolation Module 58
Figure 38 Third Analog Output 59
Figure 39 Third analog output selection 60
Figure 40 Relay Module 61
Figure 46 Wiring of the Optional 8-pin Connector 69
Figure 47 Basic Display. 72
Figure 48 Graphical Display 72
Figure 49 Graphical Display with Data Logger. 73
Figure 50 Main Views 75
Figure 51 Display Alarm Active 78
Figure 52 Display Alarms 79
Figure 53 Modifying an Alarm Limit. 79
Figure 54 Service Port Connector and User Port Terminal on the Mother Board 81
Figure 55 Connection Example Between PC Serial Port and User Port...82
Figure 56 Network Interface Menu .85
Figure 57 IP Configuration Menu. 85
Figure 58 Wireless LAN Settings. 88
Figure 59 Entering Network SSID. 88
Figure 60 Selecting the Wireless Network Type. 88
Figure 61 Web Configuration Interface for WLAN. 91
Figure 62 Opening a Serial Connection. 92
Figure 63 Opening a Telnet Connection. 93
Figure 64 Pressure Set Buttons on the Motherboard 102
Figure 65 Following Device Information on the Display 107
Figure 66 Current/Voltage Switches of Output Modules 115
Figure 67 Measurement-Based Relay Output Modes 120
Figure 68 FAULT/ONLINE STATUS Relay Output Modes. 123
Figure 69 Relay Availability 124
Figure 70 Following AutoCal on the Display. 131
Figure 71 Performing Manual Purge. 132
Figure 72 Activating Start-up Purge. 133
Figure 73 Error Indicator and Error Message 136
Figure 74 Starting the Adjustment 144
Figure 75 Performing Purge 144
Figure 76 Following the RH Trend on Graphical Display 145
Figure 77 Ending Adjustment of Point 1 145
Figure 78 Proceeding to Adjustment of Point 2 145
Figure 79 Completing Adjustment of Point 2 145
Figure 80 Following Stabilization 147
Figure 81 Proceeding with T_d / f Adjustment. 147
Figure 82 Completing T_d / f Adjustment. 147
Figure 83 Dewpoint Accuracy Graph. 153
Figure 84 DMT340 Transmitter Body Dimensions 160
Figure 85 WLAN Antenna Dimensions 161
Figure 86 Sampling Cell Dimensions. 161
Figure 87 DMT342 Probe Dimensions 162
Figure 88 DMT344 Probe Dimensions 162
Figure 89 DMT347 Probe Dimensions 163
Figure 90 DMT348 Standard Probe Dimensions. 163
Figure 91 NPT 1/2" Nut Dimensions. 164
Figure 92 DMT348 Optional 400mm Probe Dimensions. 164
List of Tables
Table 1 Manual Revisions 14
Table 2 Application, Location Classes 16
Table 2 Quantities and Their Abbreviations. 19
Table 3 Optional Quantities and Their Abbreviations 20
Table 4 DMT348 Probe Dimensions 44
Table 5 Connecting the Twisted Pair Wires to the Screw Terminals....63
Table 6 4-Wire (Switch 3:On) 64
Table 7 2-Wire (Switch 3:Off) 64
Table 8 Observation Periods and Resolution 67
Table 9 Wiring of the 8-pin connector 69
Table 10 Periods for Trend and Max/Min Calculations 73
Table 11 Graph Information Messages. 74
Table 12 Default Serial Communication Settings for the User Port. 81
Table 13 Communication Settings for the Service Port 83
Table 14 IP Settings for the LAN and WLAN Interfaces 84
Table 15 Wireless LAN Settings. 87
Table 16 Measurement Commands 94
Table 17 Formatting Commands. 94
Table 18 Data Recording Commands. 94
Table 19 Purge Commands 95
Table 20 Autocalibration Commands 95
Table 21 Calibration and Adjustment Commands. 95
Table 22 Setting and Testing the Analog Outputs 95
Table 23 Setting and Testing the Relays 95
Table 24 Other Commands 95
Table 25 FORM Command Modifiers. 99
Table 26 Multiplication Factors. 103
Table 27 Selection of Output Modes. 105
Table 28 Filtering Levels 106
Table 29 Error Messages 137
Table 30 Indicator Led Functions. 142
Table 31 Options and Accessories. 158
This page intentionally left blank.
CHAPTER 1
GENERAL INFORMATION
About This Manual
This manual provides information for installing, operating, and maintaining Vaisala DRYCAP® Dewpoint and Temperature Transmitter Series DMT340.
Contents of This Manual
This manual consists of the following chapters:
- Chapter 1, General Information, provides general notes for the manual and the product.
- Chapter 2, Product Overview, introduces the features, advantages, and the product nomenclature of the DMT340.
- Chapter 3, Installation, provides you with information that is intended to help you install the product.
- Chapter 4, Operation, contains information that is needed to operate the product.
- Chapter 5, Maintenance, contains information that is needed in basic maintenance of the product.
- Chapter 6, Calibration and adjustment, provides information and instructions concerning the calibration and adjustment of the DMT340.
- Chapter 7, Technical Data, provides the technical data of the product.
- Appendix A, Calculation Formulas, presents the equations used for the calculated output quantities.
Version Information
Table 1 Manual Revisions
| Manual Code | Description |
| M210704EN-A | April 2005 - First release |
| M210704EN-B | November 2006 |
| M210704EN-C | June 2007 - Data logger module and USB-RJ45 cable added as new options. Support for Chinese language. |
| M210704EN-D | May 2008 – New options added: LAN Interface, WLAN Interface. Display Alarm feature added. |
| M210704EN-E | June 2009 – Added PuTTY terminal application instructions, revised description of the MI70 Link software. Removed instructions for HyperTerminal. |
General Safety Considerations
Throughout the manual, important safety considerations are highlighted as follows:
WARNING
Warning alerts you to a serious hazard. If you do not read and follow instructions very carefully at this point, there is a risk of injury or even death.
CAUTION
Caution warns you of a potential hazard. If you do not read and follow instructions carefully at this point, the product could be damaged or important data could be lost.
NOTE
Note highlights important information on using the product.
Feedback
Vaisala Customer Documentation Team welcomes your comments and suggestions on the quality and usefulness of this publication. If you find errors or have other suggestions for improvement, please indicate the chapter, section, and page number. You can send comments to us by e-mail: manuals@vaisala.com
Product Related Safety Precautions
The DMT340 Dewpoint and Temperature Transmitter delivered to you has been tested for safety and approved as shipped from the factory. Note the following precautions:
WARNING
Ground the product, and verify outdoor installation grounding periodically to minimize shock hazard.
CAUTION
Do not modify the unit. Improper modification can damage the product, lead to malfunction, or make the product noncompliant with applicable legislation.
ESD Protection
Electrostatic Discharge (ESD) can cause immediate or latent damage to electronic circuits. Vaisala products are adequately protected against ESD for their intended use. However, it is possible to damage the product by delivering electrostatic discharges when touching, removing, or inserting any objects inside the equipment housing.
To make sure you are not delivering high static voltages yourself:
- Handle ESD sensitive components on a properly grounded and protected ESD workbench. When this is not possible, ground yourself to the equipment chassis before touching the boards. Ground yourself with a wrist strap and a resistive connection cord. When neither of the above is possible, touch a conductive part of the equipment chassis with your other hand before touching the boards.
- Always hold the boards by the edges and avoid touching the component contacts.
Recycling

Recycle all applicable material.

Dispose of batteries and the unit according to statutory regulations. Do not dispose of with regular household refuse.
Regulatory Compliances
DNV Type Approval
The Vaisala DRYCAP® Dewpoint and Temperature Transmitter Series DMT340 is found to comply with Det Norske Veritas' Rules for Classification of Ships, High Speed & Light Craft and Det Norske Veritas' Offshore standards.
Applicable tests carried out according to Standard for Certification No. 2.4, April 2006.
Table 2 Application, Location Classes
| Type | DMT340 |
| Temperature | B |
| Humidity | B |
| Vibration | A |
| EMC | B |
| Enclosure | B/IP65 |


TYPE APPROVED PRODUCT
CERTIFICATE NO.: A-11440
Transmitters with LAN or WLAN Interface
This equipment has been tested and found to comply with the limits for a Class B digital device, pursuant to Part 15 of the FCC Rules. These limits are designed to provide reasonable protection against harmful interference in a residential installation. Operation is subject to the following two conditions: (1) this device may not cause interference, and (2) this device must accept any interference, including interference that may cause undesired operation of the device.
This equipment generates, uses and can radiate radio frequency energy and, if not installed and used in accordance with the instructions, may cause harmful interference to radio communications. However, there is
no guarantee that interference will not occur in a particular installation. If this equipment does cause harmful interference to radio or television reception, which can be determined by turning the equipment off and on, the user is encouraged to try to correct the interference by one or more of the following measures:
- Reorient or relocate the receiving antenna.
- Increase the separation between the equipment and receiver.
- Connect the equipment into an outlet on a circuit different from that to which the receiver is connected.
- Consult the dealer or an experienced radio/TV technician for help.
Transmitters with WLAN Interface
This device has been designed to operate with a 2 dBi half-wave antenna. Antennas with a gain greater than 2 dB are strictly prohibited for use with this device. The required antenna impedance is 50 ohms.
To reduce potential radio interference to other users, the antenna type and its gain should be so chosen that the equivalent isotropically radiated power (e.i.r.p.) is not more than that permitted for successful communication.
This Class [B] digital apparatus complies with Canadian ICES-003.
The Vaisala DRYCAP® Dewpoint and Temperature Transmitter Series DMT340 is protected by, for example, the following patents and their corresponding national rights:
Finnish patents 98861 and 99164, French patents 6650303 and 9504397, German patents 69418174 and 19513274, Japanese patents 3585973 and 2801156, UK patents 0665303 and 2288465, U.S. patent 5607564.
Trademarks
DRYCAP® is a registered trademark of Vaisala Oyj.
Windows® is a registered trademark of Microsoft Corporation in the United States and/or other countries.
License Agreement
All rights to any software are held by Vaisala or third parties. The customer is allowed to use the software only to the extent that is provided by the applicable supply contract or Software License Agreement.
Warranty
For certain products Vaisala normally gives a limited one-year warranty. Please observe that any such warranty may not be valid in case of damage due to normal wear and tear, exceptional operating conditions, negligent handling or installation, or unauthorized modifications. Please see the applicable supply contract or Conditions of Sale for details of the warranty for each product.
CHAPTER 2
PRODUCT OVERVIEW
This chapter introduces the features, advantages, and the product nomenclature of the Vaisala DRYCAP® Dewpoint and Temperature Transmitter DMT340 Series.
Introduction to DMT340
The DMT340 transmitter measures dewpoint temperature accurately in a measurement range from -60^ to +80^ (-76 ... +176 °F). The AutoCal feature provides excellent long term stability of the measurement. DMT340 incorporates the advanced DRYCAP® technology, which enables reliable and high-performance dewpoint measurement.
Apart from the extended dewpoint measurement range the optional modules provide for more flexibility. See Table 3 below for the quantities that DMT340 measures and calculates. See Table 4 below for the optional quantities measured by DMT340.
Table 3 Quantities and Their Abbreviations
| Quantity | Abbreviation | Metric Unit | Non Metric Unit |
| Dewpoint/frost point temperature (Td/f) | TDF | °C | °F |
| Mixing ratio (x) | X | g/kg | gr/lb |
| Parts per million | H2O | ppmv/ ppmw | ppmv/ ppmw |
Table 4 Optional Quantities and Their Abbreviations
| Quantity | Abbreviation | Metric Unit | Non Metric Unit |
| Relative humidity RH | RH | %RH | %RH |
| Temperature T | T | °C | °F |
| Dewpoint/frost point in the atmospheric pressure (Td/f) | TDFA | °C atm | °F atm |
| Absolute humidity (a) | A | g/m3 | gr/ft3 |
| Absolute humidity in standard pressure and temperature (NTP) | ANTP | g/m3 | gr/ft3 |
| Wet bulb temperature (Tw) | TW | °C | °F |
| Water vapor pressure (Pw) | PW | hPa | lb/in2 |
| Water vapor saturation pressure (Pws) | PWS | hPa | lb/in2 |
| Enthalpy (h) | H | kJ/kg | Btu/lb |
| Difference of T and Td/f (ΔT) | DT | °C | °F |
| Dewpoint temperature (Td)* | TD | °C | °F |
| Dewpoint in the atmospheric pressure (Td)* | TDA | °C atm | °F atm |
- use these parameters only if you need dewpoint over water below 0^ / 32^ and not over ice (industry standard)
Basic Features and Options
DMT340 has the following basic features and options:
- Dewpoint measurement with AutoCal and sensor purge features
- Sensor warming in high humidities
- Two analog outputs and a serial interface
- Several probes for different applications
- User friendly multilingual display option
- Calculated output quantities available.
- Different probe mounting kits, sensor protection options and probe cable lengths 2m , 5m or 10m .
- USB connectivity for service connections via the optional USB-RJ45 cable
-
Optional modules:
-
galvanic isolation for outputs
- AC mains power supply
- RS-485 serial line
- LAN and WLAN interfaces
- data logger module with real time clock
- additional analog output module
- alarm relay module
Structure of the Transmitter

0604-005
Figure 1 Transmitter Body
The numbers refer to Figure 1:
1 = Signal + powering cable gland
2 = Cable gland for optional module, or WLAN antenna connector
3 = Cable gland for optional module
4 Cover screw (4 pcs)
5 = Display with keypad (optional)
6 Cover LED
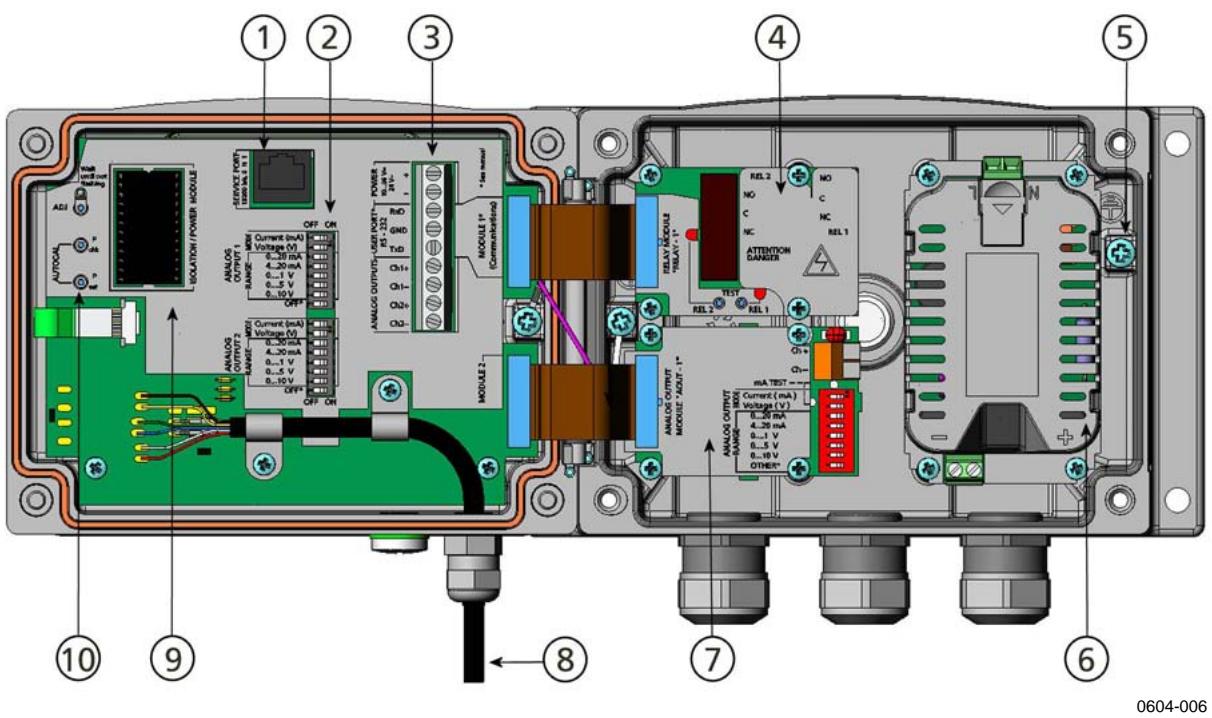
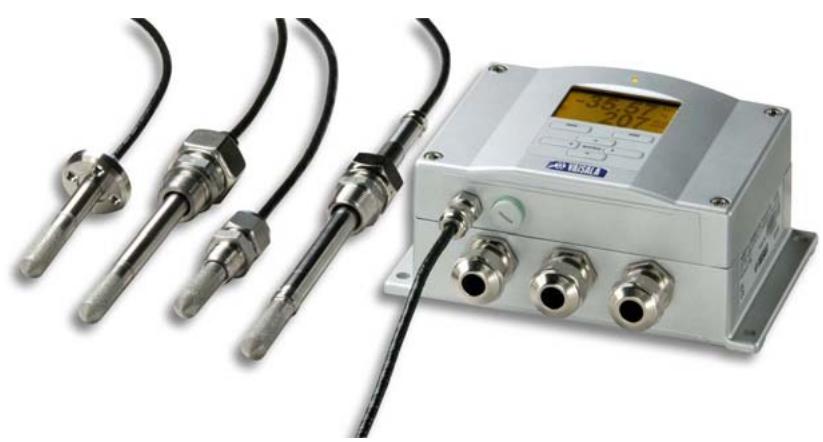
Figure 2 Inside the Transmitter
Numbers refer to Figure 2:
1 = Service port (RS-232)
2 = Dip switches for analog output settings
3 = Power supply and signal wiring screw terminals
4 = Relay, data logger, RS-422/485, LAN, or WLAN module (optional)
5 = Grounding connector
6 = Power supply module (optional)
7 = Relay, data logger, or analog output module (optional)
8 = Dewpoint probe
9 = Output isolation module (optional)
10 = Adjustment button (Purge button) with indicator led and pressure set buttons.
Probe Options

Figure 3 Probe Options
DMT342
small-size
flanged probe for use with sampling cell
DMT344
for high pressure applications
DMT347
probe with Swagelok connector
DMT348
for pressurized pipelines
0503-019
Probe cable lengths are 2m , 5m and 10m .
This page intentionally left blank.
CHAPTER 3
INSTALLATION
Mounting the Housing
The housing can be mounted either without the mounting plate or with optional mounting plates.
Standard Mounting without Mounting Plate
Mount the housing without the mounting plate by fastening the transmitter to the wall with 4 screws, for example M6 (not provided).
Figure 4 Standard Mounting
Wall Mounting with Wall Mounting Kit
When mounting with wall mounting kit the mounting plate (Vaisala order code 214829) can be installed directly on wall or onto a standard wall box (also US junction box). When wiring through back wall, remove the plastic plug from the wiring hole in the transmitter before mounting.
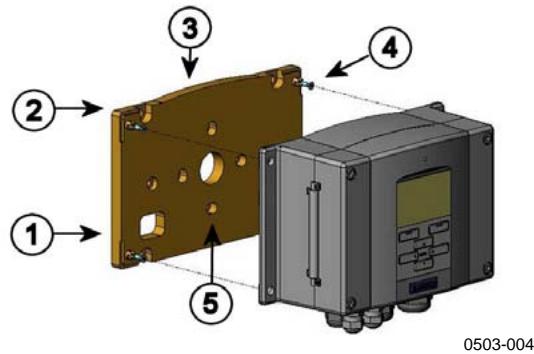
Figure 5 Mounting with Wall Mounting Kit
The numbers refer to Figure 5 above:
1 = Plastic mounting plate
2 = Mount the plate to wall with 4 screws M6 (not provided)
3 = The arched side up
4 = Fasten DMT340 to the mounting plate with 4 fixing screws M3 (provided)
5 = Holes for wall/junction box mounting

Figure 6 Dimensions of the Plastic Mounting Plate (mm/inch)
Metal mounting plate is included in rain shield with installation kit and installation kit for pole or pipeline.
0503-041
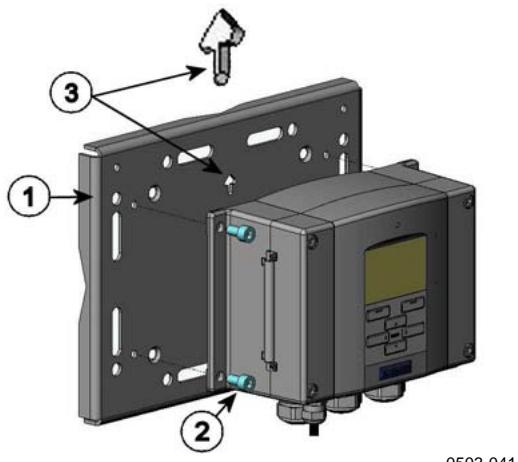
Figure 7 Mounting with Metal Wall Mounting Plate
Numbers refer to Figure 7:
1 = Mount the plate to wall with 4 screws M8 (not provided)
2 = Fasten DMT340 to the mounting plate with 4 fixing screws M6 (provided)
3 = Note the position of the arrow when mounting. This side must be up when mounting.
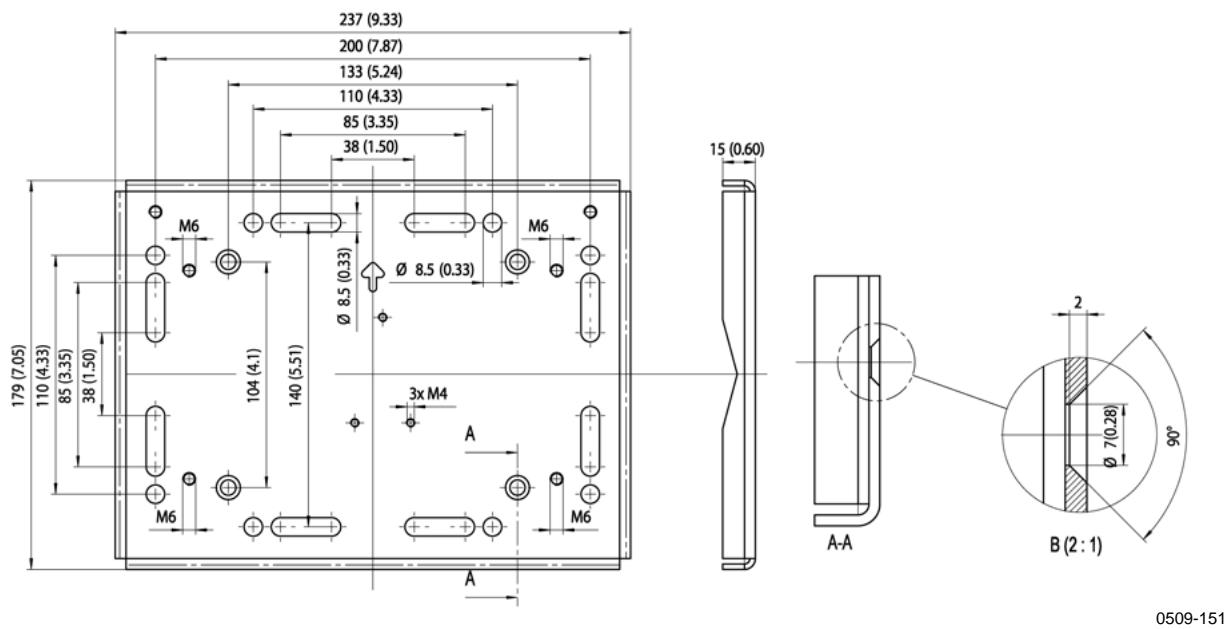
Figure 8 Dimensions of Metal Mounting Plate (mm/inch)
Mounting with DIN Rail Installation Kit
DIN rail installation kit includes a wall mounting kit, 2 clip-fasteners and 2 screws M4 x 10 DIN 7985 (Vaisala order code 215094).
- Attach two spring holders to the plastic mounting plate by using the screws provided in the installation kit.
- Fasten DMT340 to the plastic mounting plate with 4 screws provided for that purpose.
- Press the transmitter onto the DIN rail so that the clip-fasteners snap into the rail.
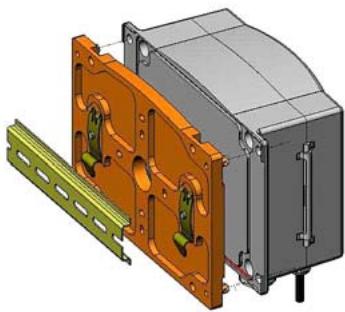
0503-002
Figure 9 Mounting with DIN Rail Installation Kit
Pole Installation with Installation Kit for Pole or Pipeline
Installation kit for pole or pipeline (Vaisala order code: 215108) includes the metal mounting plate and 4 mounting nuts for pole mounting. When mounting, the arrow in the metal mounting plate must point upwards, see Figure 7 on page 27.
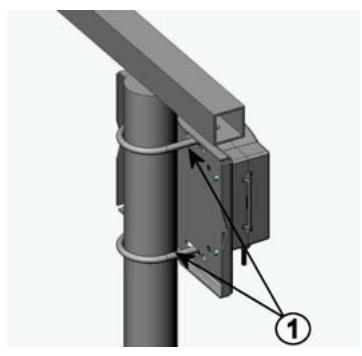
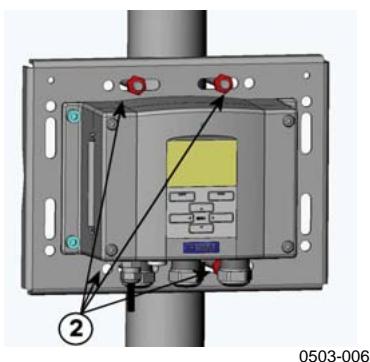
Figure 10 Vertical Pole
Numbers refer to Figure 10 above.
Fixing brackets (2 pcs) M8 (provided) for 30 ... 102 mm poles.
2 = Mounting nuts M8 (4 pcs)
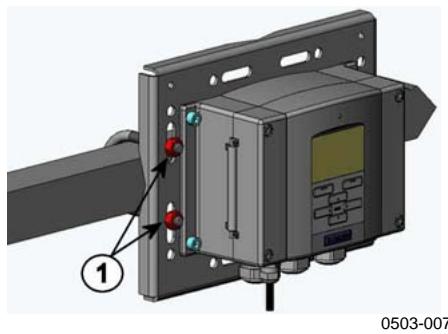
Figure 11 Horizontal Pole
Number refers to Figure 11 above.
1 = Mounting nuts M8 (4 pcs)
Mounting the Rain Shield with Installation Kit
Vaisala order code: 215109

0503-008
Figure 12 Mounting the Rain Shield with Installation Kit
Numbers refer to Figure 12 above.
1 = Fasten the rain shield with installation kit to the metal mounting plate with 2 (M6) mounting screws (provided).
2 = Fasten the mounting plate with rain shield with installation kit to the wall or to the pole (see pole installation).
3 = Fasten DMT340 to the mounting plate with 4 fixing screws (provided).
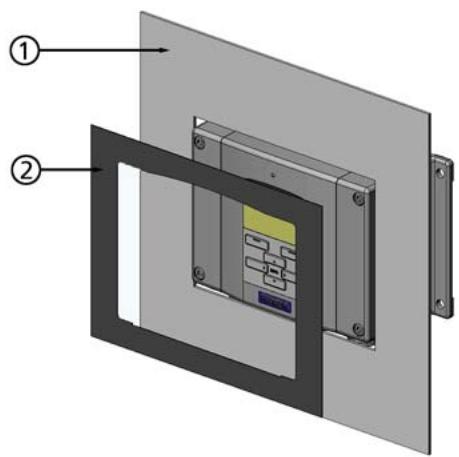
Panel Mounting Frame
To enable a neat and dirt free embedded installation of the transmitter, a panel mounting frame is available as an option (Vaisala order code: 216038). The frame is a thin, flexible plastic frame for the transmitter, with adhesive tape on one side.
The frame is used to hide any rough edges of the installation hole, and provide a more finished look. Note that the panel mounting frame is not intended to bear the weight of the transmitter, and does not include any mounting supports.
Use the panel mounting frame as follows:
- Use the frame as a template to mark the required size for the installation hole in the panel.
- Cut the hole in the panel.
-
Mount the transmitter through the panel with suitable supports.
-
Remove the paper protecting the adhesive tape on the frame, and attach the frame around the transmitter. Refer to Figure 13 below.

0704-002
Figure 13 Panel Mounting Frame
The following numbers refer to Figure 13 above:
1 = Panel (not included)
2 = Panel mounting frame

Figure 14 Panel Mounting Dimensions (mm/inch)
Wiring
Cable Bushings
A single electrical cable with a screen and three to ten wires is recommended for power and analog/serial connections. The cable diameter should be 8...11 mm. The number of cable bushings depends on the transmitter options. See the following recommendations for the cable bushings:

0503-010
Figure 15 Cable Bushings
Numbers refer to Figure 15 above:
1 = Cable for signal/powering 8 ... 11mm
2 = Cable for optional module 8 11mm
3 = Cable for optional power module 8 11mm
NOTE
When there is high electric noise level (for example near powerful electric motor) in the operating environment it is recommended to use shielded cable or take care that the signal cables are separated from other cables.
Grounding the Cables
Ground the screen of the electrical cable properly to achieve the best possible EMC performance.

Fig. 1
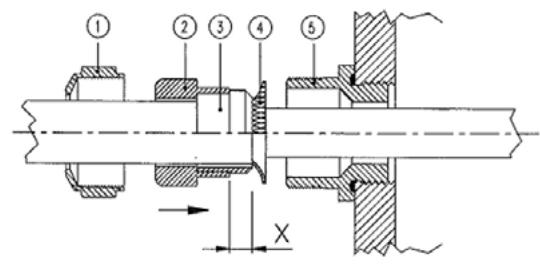
Fig. 2
Fig. 3
Figure 16 Grounding the Screen of Electrical Cable
0504-049
- Cut back outer sheath to desired length.
- Cut back screen braiding or screen foil to dimension X (see figure 3).
- Push the domed cap nut (item 1) and the seal insert with contact socket of the gland (item 2 + 3 ) onto the cable as shown in the diagram
- Bend over the screen braiding or screen foil by about 90^ (item 4).
- Push the seal insert with the contact socket of the gland (item 2+3) up to the screen braiding or screen foil.
-
Mount the lower part (item 5) on the housing
-
Push the seal with the contact socket of the gland and (item 2+3) flush into the lower part (item 5).
- Fasten the domed cap nut (item 1) onto the lower part (item 5).
Transmitter Housing Grounding
In case you need to ground the transmitter housing, the grounding connector is found inside the housing (see Figure 1 on page 21) Note anyhow that the probe is connected to the same potential as the housing. Make sure that different groundings are made to the same potential. Otherwise harmful ground currents may be generated.
If it is needed to have galvanic isolation of the power supply line from the output signals, DMT340 can be ordered with optional output isolation module. This module prevents harmful grounding loops.
Signal and Power Supply Wiring
When connecting transmitter with 8-pin connector, see section 8-pin Connector on page 69.
0605-028
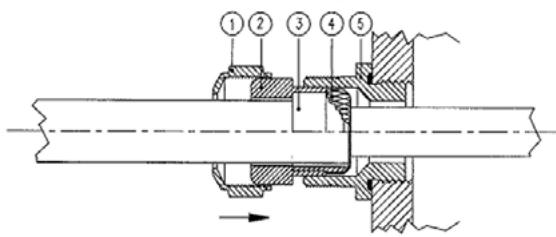
Figure 17 Screw Terminal Block on the Motherboard
Numbers refer to Figure 17 on page 34:
1 = Power supply terminals 10 ... 35 VDC, 24 VAC
2 = User port (RS-232 terminals)
3 Analog signal terminals
WARNING Make sure that you connect only de-energized wires.
- Open the transmitter cover by taking out the four cover screws.
- Insert the power supply wires and signal wires through the cable bushing in the bottom of the transmitter; see the grounding instructions in the previous sections.
- Connect the analog output cables to terminals: Ch1+, Ch1-, Ch2+, Ch2-. Connect the RS-232 user port cables to terminals RxD, GND and TxD, more about the RS-232 connection in Section Serial Line Communication on page 80.
-
When wiring the optional modules, see the corresponding section for instructions:
-
RS-422/485 Interface on page 62
- Alarm Relays on page 60
Third Analog Output on page 59 - LAN Interface on page 64
-
WLAN Interface on page 65
-
Connect the power supply wires to the connectors: POWER 10...35V+ 24V~ (+) and (-) terminals. (If using AC voltage, connect always phase to power supply (+) and 0 to power supply (-)). When wiring the power supply module, see section Power Supply Module on page 54.
- Turn on the power. The indicator led on the cover lit continuously during normal operation.
- Close the cover and replace the cover screws. The transmitter is ready for use.
Connections to a 24 VAC Power Supply
Separate floating supply for each transmitter is recommended (see the upper part of Figure 18 on page 36). If you have to connect several transmitters or other instruments to one AC supply, the phase () must always be connected to the (+) connector of each transmitter (see the lower part of Figure 18).
CAUTION 24 VAC POWER SUPPLY USE
To prevent fire and/or damage, if either 24 VAC wire is grounded or connected to a "-", "0", or "GND" terminal of any other device, you must connect the same wire on the "-" terminal also on this instrument.
No common loop - RECOMMENDED!


Figure 18 Connections to 24 VAC Power Supply

0703-041
Common loop formed - NOT recommended!
Probe Mounting
NOTE
When measuring temperature dependent quantities make sure that the temperature at the measurement point is equal to that of the process, otherwise the moisture reading may be incorrect.
DMT342 Small-size Flanged Probe for Use with Sampling Cell
The DMT342 probe is a small pressure-tight probe equipped with installation flange. When sampling in pressurized processes, the sampling cell HMP302SC is available as an optional accessory. It may be necessary to use the sampling cell if the process (for example a pipe) is too small for the DMT342 probe. Furthermore, if the process is very hot (>80^) or particularly dirty, the probe is installed in a sampling cell behind a cooling coil and/or filter. In this case, the ambient temperature must be at least 10^ warmer than the process dewpoint in order to avoid condensation in the sample tubing.
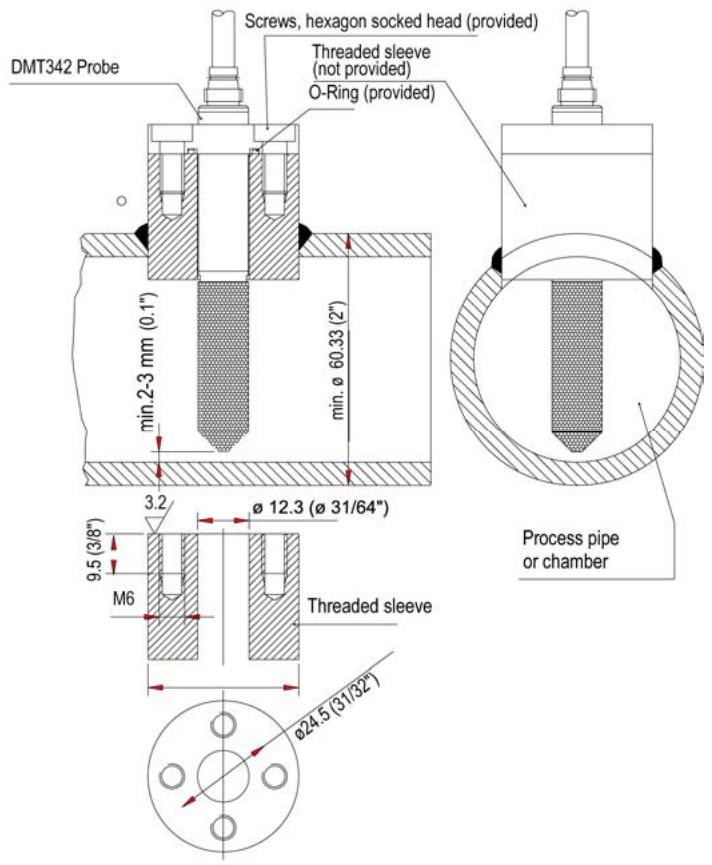
Figure 19 DMT342 Installation (without the Sampling Cell)
0503-018

0503-017
Figure 20 HMP302SC Optional Sampling Cell
Numbers refer to Figure 20 above.
1 = Gas in
2 = Probe
3 = Gas out
4 = Probe
5 Sampling cell
6 = Clamp (not needed if sampling cell is supported on the piping)
CAUTION
In pressurized processes it is essential to tighten the supporting nuts and screws very carefully to prevent loosening of the probe by the action of pressure.
NOTE
When the DMT340 is installed in a process with a pressure differing from the selected operating pressure at the time of ordering, please enter the pressure value of the process into the transmitter memory, see section Pressure Compensation Setting on page 101. Use the serial line commands XPRES and PRES or the display/Keypad. The pressure set buttons on the motherboard inside the transmitter can also be used to set pressure compensation.
DMT344 For High-pressure Applications
The DMT344 probe is for the dewpoint measurements in pressurized rooms and industrial processes. The probe is provided with a nut, a fitting screw and a sealing washer. Keep the fitting screw and the nut in place on the body of the probe during handling to prevent damage to the highly polished surface of the probe. Follow the instructions below to achieve a leak-tight assembly:
- Remove the fitting screw from the nut and the probe.
- Fasten the fitting screw to the chamber wall with a sealing washer. Tighten the fitting screw into the threaded sleeve with a torque spanner. The tightening torque is 150 ± 10 Nm ( 110 ± 7 ft-lbs).
- Insert the body of the probe into the fitting screw and install the nut manually to the fitting screw so that the connection feels tight.
- Mark both the fitting screw and the nut hex.
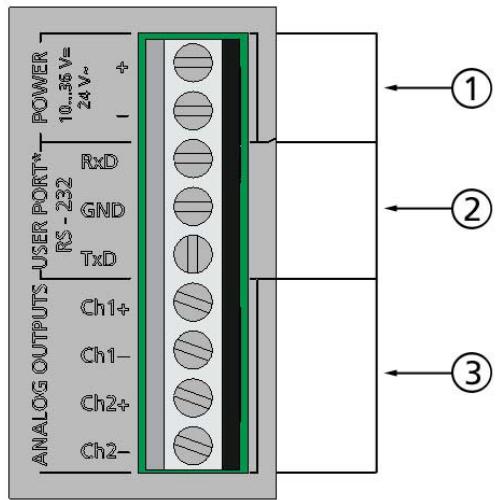
Figure 21 DMT344 Probe
0506-029
Numbers refer to Figure 21 above:
1 Tightening cone
2 = Nut
3 = Fitting screw, M22x1.5 or NPT 1/2"
4 = Sealing washer
5 = Probe; 12mm
- Tighten the nut a further 30^ (1/12) turn or if you have a torque spanner tighten it with a torque of 80 ± 10 Nm ( 60 ± 7 ft-lbs).
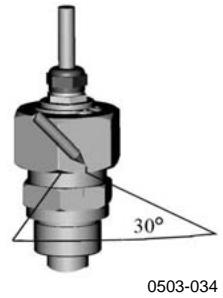
Figure 22 Tightening the Nut
NOTE
When re-tightening the nut after detachment the nut must be tightened without increased effort.
- Clean and grease the tightening cone of the fitting screw after every tenth detachment. Change the sealing washer every time the fitting screw is detached. Use high-vacuum grease (for example Dow Corning) or a similar grease.

Figure 23 Cleaning of the Tightening Cone
Numbers refer to Figure 23 above:
1 Fitting screw
2 = Sealing washer
3 Tightening cone
4 Clean cotton stick
CAUTION
In pressurized processes it is essential to tighten the supporting nuts and screws very carefully to prevent loosening of the probe by the action of pressure.
NOTE
When the DMT340 is installed in a process with a pressure differing from the selected operating pressure at the time of ordering, please enter the pressure value of the process into the transmitter memory, see section Pressure Compensation Setting on page 101. Use the serial line commands XPRES and PRES or the display/Keypad. The pressure set buttons on the motherboard inside the transmitter can also be used to set pressure compensation.
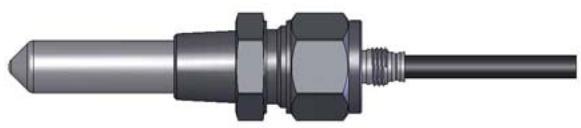
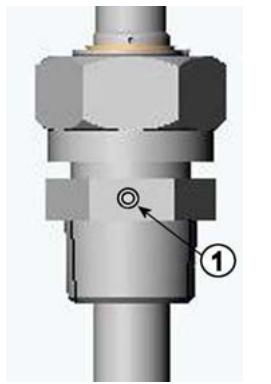
DMT347 Small Pressure-tight Probe
The DMT347 is ideal for tight spaces with threaded connection. The small probe is installed using the threaded fitting bodies, see below.
Pressure-Tight Swagelok Installation Kits for DMT347
Swagelok installation kit for the dewpoint probe includes Swagelok connector with ISO1/2" thread (Vaisala order code: SWG12ISO12), ISO3/8" thread (Vaisala order code: SWG12ISO38) or NPT1/2" thread (Vaisala order code: SWG12NPT12).
0503-042
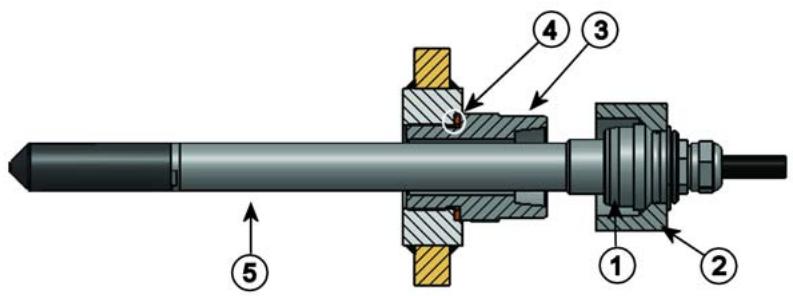
Figure 24 DMT347 Probe with Swagelok Installation Kit

Figure 25 DMT347 Probe Installation to Pipeline with Swagelok Installation Kit
Numbers refer to Figure 25 above:
1 = Probe
2 Duct connector
3 = ISO1/2", ISO3/8" or NPT1/2" thread
4 = Swagelok connector
5 = Ferrules
- Preparing Installation. The connector options are the following:
a. R3/8" ISO (Swagelok code SS-12M0-1-6RTBT)
b. 1/2" NPT (Swagelok code SS-12M0-1-8BT)
c. 1 / 2'' ISO (Swagelok code SS-12M0-1-8RPBT)
Note that the connector inner diameters extend for 12mm probe.
- Probe position. Before the final tightening check that the upper edge of the connector nut is in line with the upper edge of the probe. Otherwise the sealing may not be gas tight.
- Gas tight sealing
a. Turn the connector nut finger tight and draw a vertical mark on the nut and the fitting body.
b. Be sure that the probe position follows step 2.
c. Tighten the connector nut with a wrench 1 and 1/4 turns (360^ + 90^) with the help of marks you drew. The connector has now a gas tight connection to the probe. Excess tightening can damage the probe.
d. Connector can be disconnected and re-installed. In re-installation first turn the connector nut finger tight and then with wrench 1/4 turn (90^) .
Use teflon tape or thread sealant to seal the connection between the Swagelok connector and the process, see Figure 28 on page 44.
NOTE
If the Swagelok connector is tightened at an incorrect position, it is possible that the probe will not fit the calibration station. Be sure that the probe position follows step 2 above.
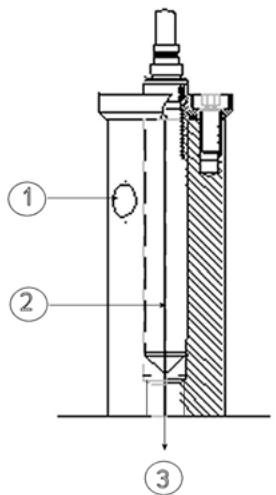
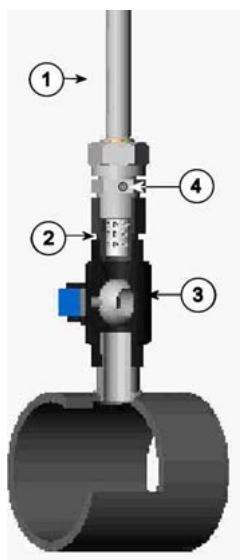
DMT348 For Pressurized Pipelines
Due to the sliding fit the DMT348 is easy to install into and remove from the pressurized process. The probe is especially suitable for the measurements in pipelines. See section Ball Valve Installation Kit for DMT348 on page 46.
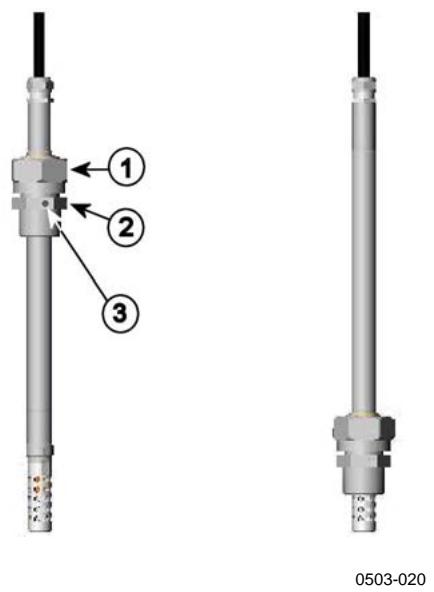
Figure 26 DMT348 Probe
Numbers refer to Figure 26 above.
1 = Clasp nut, 27 mm hex nut
2 = Fitting body, 24mm hex head
3 Leak screw
The following three fitting body options are available:
- Fitting Body Set ISO1/2 with leak screw
- Fitting Body ISO1/2 solid structure (without leak screw)
- Fitting Body NPT1/2 solid structure (without leak screw)
0503-005
Figure 27 Leak Screw in the DMT348 Probe
Number refers to Figure 27 above:
1 = Non-leaking screw (A) (factory setting) or leak screw (B) (included in the package)
Table 5 DMT348 Probe Dimensions
| Probe type | Probe Dimension | Adjustment Range |
| Standard | 178 mm | 120 mm |
| Optional | 400 mm | 340 mm |
fitting body
hex = 24mm
tapered thread
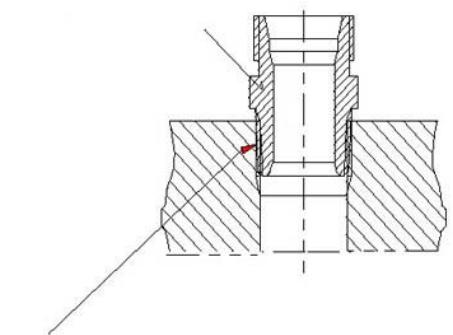
Figure 28 Sealing of Fitting Body into Process
sealing with:
- LOCTITE® No 542 + activ. No 7649 (t=-55...+150 °C)
- MEGA-PIPE EXTRA No 7188 (t=-55...+170 °C)
- PTFE tape (t = -60 +210^) NOTE: the tape does not lock the parts together. Therefore, use two fork spanners (hex 24 and 27mm for tightening and opening the clasp nut of the probe
0506-031
Tightening the Clasp Nut
- Adjust the probe to a suitable depth according to the type of installation.
- Tighten the clasp nut first manually.
- Mark the fitting screw and the clasp nut.
- Tighten the nut a further 50 ... 60^ (ca. 1/6 turn) with a wrench. If you have suitable torque spanner, tighten the nut to max 45 ± 5 Nm ( 33 ± 4 ft-lbs).
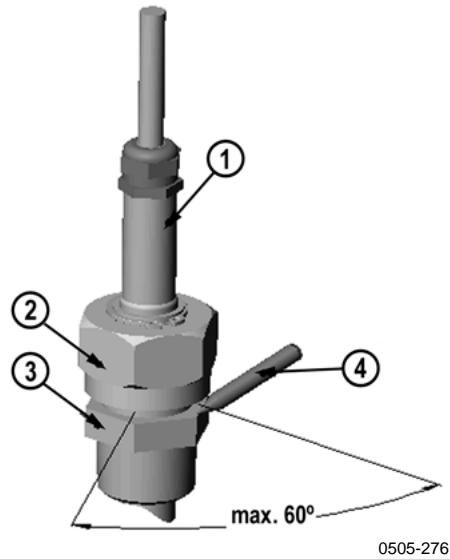
Figure 29 Tightening the Clasp Nut
The following numbers refer to Figure 29 above:
1 = Probe
2 = Clasp nut
3 = Fitting screw
4 = Pen
NOTE
Take care not to over tighten the clasp nut to avoid difficulties when opening it.
CAUTION
Take care not to damage the probe body. A damaged body makes the probe less tight and may prevent it from going through the clasp nut.
CAUTION
In pressurized processes it is essential to tighten the supporting nuts and screws very carefully to prevent loosening of the probe by the action of pressure.
NOTE
When the DMT340 is installed in a process with a pressure differing from the selected operating pressure at the time of ordering, please enter the pressure value of the process into the transmitter memory, see section Pressure Compensation Setting on page 101. Use the serial line commands XPRES and PRES or the display/Keypad. The pressure set buttons on the motherboard inside the transmitter can also be used to set pressure compensation.
Ball Valve Installation Kit for DMT348
The ball valve installation kit (Vaisala order code: BALLVALVE-1) is preferred when connecting the probe to a pressurized process or pipeline. Use the ball valve set or a 1/2'' ball valve assembly with a ball hole of 14 mm or more. If you install the probe ( 12 mm ) in a process pipe, please note that the nominal size of the pipe must be at least 1 inch (2.54 cm). Use the manual press handle to press the probe into the pressurized ( < 10 bar) process or pipeline.

0507-043
Figure 30 Installing the DMT348 Probe Through a Ball Valve Assembly
The following numbers refer to Figure 30 above:
1 = Manual press tool
2 = Handle of the ball valve
3 = Probe
4 = Process chamber or pipeline
5 Groove on the probe indicates the upper adjustment limit
6 Filter
7 = Ball of the ball valve
8 = Fitting screw
NOTE
The probe can be installed in the process through the ball valve assembly provided that the process pressure is less than 10 bars. This way, the process does not have to be shut down when installing or removing the probe. However, if the process is shut down before removing the probe, the process pressure can be max. 20 bars.
NOTE
When measuring temperature dependent quantities make sure that the temperature at the measurement point is equal to that of the process, otherwise the moisture reading may be incorrect.
Follow the steps below to install the DMT348 probe through a ball valve assembly. After the installation, the probe should be sitting in the process chamber or pipeline as shown in Figure 30 on page 47.
- Shut down the process if the process pressure is more than 10 bars. If the pressure is lower there is no need to shut down the process.
- Close the ball valve.
- Seal the threads on the fitting body; refer to Figure 28 on page 44.
- Attach the fitting body to the ball valve and tighten it.
- Slide the clasp nut of the probe toward the filter, as far as it will go.
- Insert the probe to the fitting body, and manually tighten the clasp nut to the fitting body.
- Open the ball valve.
- Push the probe through the ball valve assembly into the process. If the pressure is high, use the pressing handle that is provided with the probe. If you push the probe hard without using the handle, you may damage the cable.
Note that the probe must be pushed so deep that the filter is completely inside the process flow.
- Mark the fitting screw and the clasp nut.
- Tighten the clasp nut with a fork spanner a further 50 ... 60^ (ca. 1/6 turn). If you have a suitable torque spanner, tighten the nut to max 45 ± 5 Nm ( 33 ± 4 ft-lbs). Refer to Figure 29 on page 45.
NOTE
Take care not to tighten the clasp nut more than 60^ to avoid difficulties when opening it.
If you wish to remove the probe from the process, note that you have to pull the probe out far enough. You cannot close the valve if the groove on the probe body is not visible.
Leak Screw Installation
When the probe cannot be installed directly in the pressurized process or process pipe, a leak screw installation can be used.
In this installation method, you must install the DMT348 probe using a fitting body with leak screw, see Figure 27 on page 44. A small sample flow from the process goes through the probe and via the leak screw out to atmospheric pressure enabling a fast response time although the probe is not installed in the process.
0503-036
Figure 31 Probe in Leak Screw Installation
Numbers refer to Figure 31 above:
1 = Probe
2 = Filter
3 = Ball of the ball valve
4 = Leak screw
Mounting the Probe Directly to the Process
Select a point, which gives a true picture of the process. The transmitter can be installed directly in the process wall, especially if the pressure of the process is 1 bar (atmospheric processes).
It may be necessary to use the sampling cell if the process (for example a pipe) is too small for the DMT348 probe. Furthermore, if the process is very hot ( >80^ ) or particularly dirty, the probe is installed in a sampling cell behind a cooling coil and/or filter. In this case, the ambient temperature must be at least 10^ warmer than the process dewpoint in order to avoid condensation in the sample tubing.

0503-016
Figure 32 DM240FA with Probe
Numbers refer to Figure 32 above:
1 = measured gas
2 = probe
3 DM240FA flange (thread G1/2" ISO)
4 = use R1/2" ISO fitting body for DMT348 probe with DM240FA flange
5 recommended additional hole (plugged) for Td field check reference measurement probe (for example, Vaisala DM70)
If the probe is installed in process pipes where the water is likely to collect at the measurement point, take care to install the probe so that it will not be immersed in water.
When the probe is installed directly on the process wall or pipe, note that a closing valve may be needed on both sides of the installed probe so that the probe can be removed from the process for calibration or maintenance.
If the probe is installed in a pressurized chamber, always make sure that the pressure of the chamber is equalized with the ambient pressure prior to removing the probe. When the probe is pulled out for maintenance, cap the hole with a capped nut. This way, the process can be running although the probe is not in place. For ISO threaded connections, a plug (Vaisala order code 218773) is available.

Figure 33 Example of Installing the Probe Directly on the Process Pipe
Sampling Cell for DMT348
It may be necessary to use a sampling cell if the process (for example a pipe) is too small for the DMT348 probe. Furthermore, if the process is very hot ( >80^ ) or particularly dirty, the probe is installed in a sampling cell behind a cooling coil and/or filter. In this case, the ambient temperature must be at least 10^ warmer than the process dewpoint in order to avoid condensation in the sample tubing.
Sampling Cell with Swagelok Connectors (Vaisala order code: DMT242SC2) and Sampling Cell with Female Connectors (Vaisala order code: DMT242SC) are available as an option.

Figure 34 Sampling Cells DMT242SC2 and DMT242SC
Numbers refer to Figure 34 above:
1 = Male pipe weld connector Swagelok 1/4"
2 = G1/2"
3 = G1/4"
4 = G3/8"
An overpressure in the process is necessary to create a flow through the sampling cell. Note that the pressure of the sampling cell must not differ from that of the process because dewpoint temperature changes with pressure. In dirty processes, it may be necessary to use a filter between the cooling coil and the sampling cell. One more simple way of using the sampling cell with user provided accessories is shown in the figure below. The flow through the sampling cell is controlled with the needle valve and the pressure is kept equal to that of the process.
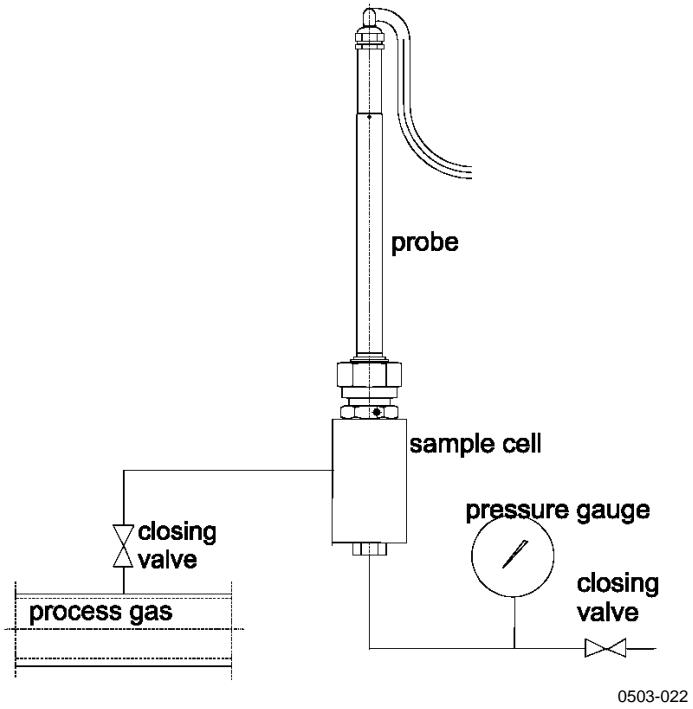
Figure 35 Installing the Probe in High Temperatures
Optional Modules
Power Supply Module
The mains power connection may be connected to the power supply module only by an authorized electrician. A readily accessible disconnect device shall be incorporated in the fixed wiring.
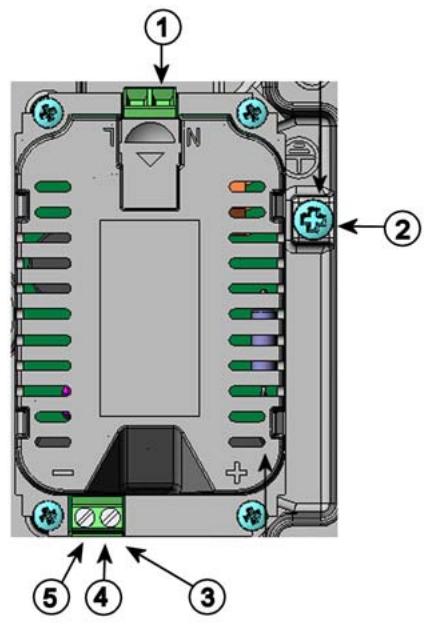
Figure 36 Power Supply Module
0506-027
Numbers refer to Figure 36 above:
1 = Connect AC mains voltage wires to these terminals
2 = Grounding terminal
3 = In case the module is not installed in the factory: Connect wires from these terminals to the POWER 10 ... 35V 24V terminals of the mother board.
4 = +
5
Installation
- Disconnect the power.
- Remove the protective plug from the cable gland and thread the wires. In case the power supply module is installed in the factory, continue with the step 5.
- To attach the module, open the transmitter cover and fasten the power module to the bottom of the housing with four screws. See the position on page 20.
- Connect the wires from the terminals of the power supply module marked with + and - to the terminals POWER 10 ... 35 V 24V on the motherboard of the transmitter.
- Connect the AC mains voltage wires to the power supply module terminals marked with N and L .
- Attach the grounding wire to the grounding terminal on the right-hand side of the transmitter.
- Connect the power. The LED on the cover of the transmitter is lit continuously during normal operation.
WARNING Do not detach the power supply module from the transmitter when the power is on.
WARNING Do not connect the mains power to power supply module when it is not installed in the transmitter.
WARNING Always connect protective ground terminal.
Warnings
Galvanic Isolation for Output
If galvanic isolation of the power supply line from the output signals is needed, DMT340 can be ordered with optional output isolation module. This module prevents harmful grounding loops.
Installation
NOTE
Output isolation module is not needed when using the power supply module.
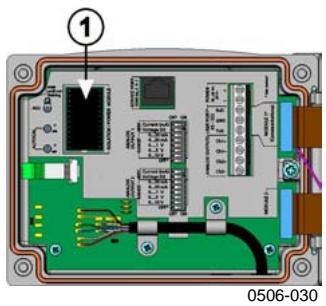
Figure 37 Galvanic Output Isolation Module
Number refers to Figure 37 above:
1 = Output isolation module
Third Analog Output
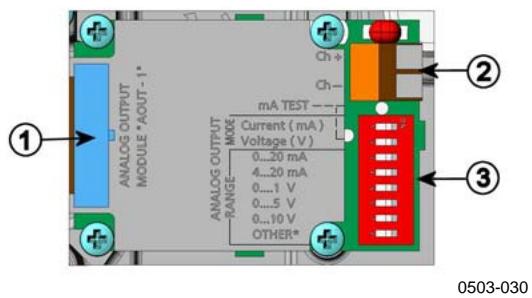
Figure 38 Third Analog Output
Numbers refer to Figure 38 above.
1 = Flat cable pins
2 = Screw terminals for signal line
3 = Dip switches to select the output mode and range
Installation and Wiring
- Disconnect the power. In case the analog output module is installed in the factory, continue with the step 4.
- To attach the module, open the transmitter cover and fasten the analog output module to the position for MODULE 2 with four screws. Refer to Figure 2 on page 22.
- Connect the flat cable between the analog output module and the motherboard's connector for MODULE 2.
- Take out the protective plug from the cable gland and thread the wires.
- Connect the wires to the screw terminals marked with Ch+ and Ch- .
- Select the current/voltage output by setting ON either of the switches 1 or 2.
- Select the range by setting ON one of the switches 3 ... 7.
NOTE
Only one of the switches 1 and 2 can be ON at a time.
Only one of the switches 3 ... 7 can be ON at a time.

Figure 39 Third analog output selection
- Connect the power.
- Select the quantity and scale the channel via the serial line or display/Keypad, see section Analog Output Quantities on page 116. For testing the analog output, see section Analog Output Tests on page 118. For fault indication setting, see section Analog Output Fault Indication Setting on page 119.
Alarm Relays
DMT340 can be equipped with one or two configurable relay modules. Each module contains two configurable relays. See the contact ratings in section Technical Specifications of Optional Modules on page 156.
Installation and Wiring
- Disconnect the power. In case the relay-module is installed in the factory, continue with the step 5.
- To attach the module, open the transmitter cover and fasten the relay module to the bottom of the housing with four screws. See the position in Figure 2 on page 22.
- When the mains power is in use attach the grounding wire to the grounding terminal.
- Connect the flat cable between the relay module and the motherboard's pins MODULE 2 or MODULE 1.
- Take out the protective plug from the cable gland and thread the relay wires.
- Connect the wires to the screw terminals: NO, C, NC.
CAUTION
For installations in the USA: If your transmitter has both the relay module and a LAN or WLAN module, the maximum voltage you are allowed to connect to the relay module is 50V .
Selecting the Activation State of the Relay
The middlemost C terminal and either one of the terminals NO/NC shall be connected. The polarity can be freely selected.
| NO | Normally open |
| C | Common relay |
| NC | Normally closed |
Relay NOT activated:
C and NC outputs are closed, NO is open
Relay IS activated:
C and NO outputs are closed, NC is open.
Connect the power and close the cover. For instructions on how to operate the relay (for example, select quantity for the relay output and set the relay setpoints) see section Operation of Relays on page 120.

Figure 40 Relay Module
Numbers refer to Figure 40 above:
1 = Indication led for the relay 1 or 3
2 = Relay test buttons
3 = Flat cable pins
4 = Indication led for relay 2 or 4
WARNING
The relay module may contain dangerous voltages even if the transmitter power has been disconnected. Before working on the relay module you must switch off both the transmitter and the voltage connected to the relay terminals.
WARNING
Do not connect the mains power to relay unit without grounding the transmitter.
RS-422/485 Interface
Numbers refer to Figure 41 above:
1 = Flat cable pins
2 = Selection switches
3 = Screw terminals for wiring
NOTE
The markings on the module and in this manual are according to the line driver manufacturers' application notes, where A is positive against B when measured with a voltmeter.
When connecting the module, be prepared to swap the A and B wires if you have a communication problem.
Installation and Wiring
- Disconnect the power. In case the RS-485-module is installed in the factory, continue with the item 4.
- To attach the module, open the transmitter cover and fasten the RS-485 module to the bottom of the housing with four screws.
- Connect the flat cable between the RS-485 module and the motherboard's pins MODULE1 (Communications).
- Pull the network wirings through the cable gland.
- Connect the twisted pair wires (1 or 2 pairs) to the screw terminals as presented in Table 6:
Table 6 Connecting the Twisted Pair Wires to the Screw Terminals
| Screw terminal | Data line (2-wire RS-485) | Data line (4-wire RS-485/422) |
| 1 | (not connected) | RxB |
| 2 | (not connected) | RxA |
| 3 | Data pair shield | Data pair shield |
| 4 | B | TxB |
| 5 | A | TxA |
- If you use RS-485 (or RS-422) to connect just one DMT340 to a master computer, enable the internal termination of DMT340 by switching switches 1 and 2 ON. Make sure that the master's end of the line is also terminated (by using master's internal termination or with a separate terminator).
If you are connecting many transmitters to the same RS-485 bus, make sure that switches 1 and 2 are OFF and terminate the bus with separate terminators at both ends. This allows removing any transmitter without blocking the bus operation.
NOTE
If you use the internal termination of the transmitter at the end of the RS-485 bus (instead of using separate terminators) removing that transmitter will block the bus operation.
- Use the bus type (4-wire/2-wire) to select the selection switch 3. In 4-wire mode RS-485 master sends data to the DMT340 through terminals RxA and RxB and receives data from DMT340 through terminals TxA and TxB.

Figure 42 4-Wire RS-485 Bus
Table 7 4-Wire (Switch 3:On)
| RS-485 master | Data | DMT340 |
| TxA | → | RxA |
| TxB | → | RxB |
| RxA | ← | TxA |
| RxB | ← | TxB |
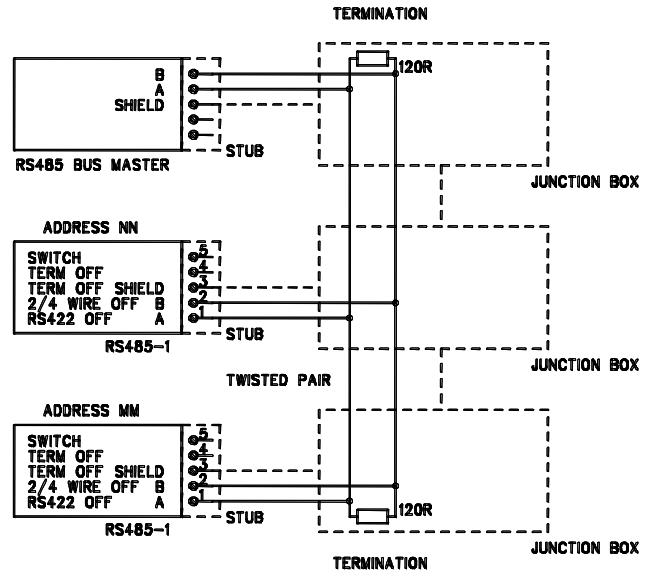
Table 8 2-Wire (Switch 3:Off)
| RS-485 master | Data | DMT340 |
| A | ← | A |
| B | ← | B |
- When operating in communication mode RS-422, set both switches 3 and 4 to ON position (4-wire wiring is required for RS-422 mode).
- Connect the power and close the cover.
LAN Interface
The optional LAN interface enables an Ethernet connection to the transmitter. The user can establish a virtual terminal session using a telnet client program such as PuTTY. When the LAN Interface is in use, serial communication using the User Port is disabled.
The LAN interface module must be installed at the factory (when ordering the transmitter), or by a Vaisala Service Center. Once installed, the module is automatically used by the transmitter. The physical connection to the network is made to the RJ45 connector on the LAN interface module, using a standard twisted pair Ethernet cable (10/100Base-T). Transmitters with the optional LAN interface are delivered pre-installed with a suitable cable and cable gland.
The LAN interface can use both static and dynamic network settings. If the interface is configured to use dynamic settings, the network where the LAN interface is connected must have a DHCP server that provides the settings.
The network configuration can be done using the optional display and keypad, or by using the service port. For instructions, see section LAN Communication on page 84. The LAN interface also provides a web configuration interface, which you can access by entering the IP address of the LAN interface in the address field of a web browser. For instructions on how to verify the current settings and status of the LAN interface, see section Device Information on page 107.
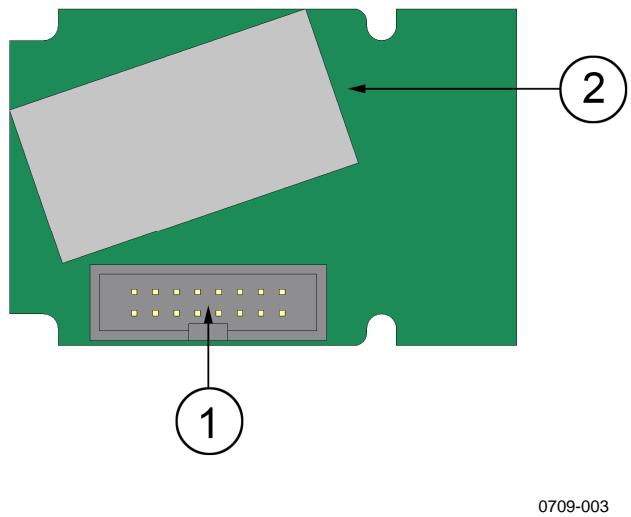
Figure 43 LAN Interface Module
The following numbers refer to Figure 43 above:
1 = Flat cable connector
2 RJ45 connector with indicator LEDs for link and activity
WLAN Interface
The optional WLAN interface enables a wireless Ethernet connection (IEEE 802.11b) to the transmitter. The user can establish a virtual terminal session using a telnet client program such as PuTTY. The interface supports Wired Equivalent Privacy (WEP) and Wi-Fi Protected Access (WPA). For WEP, 64 and 128 bit encryption is supported, with open system or shared key authentication. WPA is used in the Pre-Shared Key (PSK) mode, with either TKIP or CCMP protocol.
When the WLAN Interface is in use, serial communication using the User Port is disabled.
Similarly to the LAN Interface, the WLAN interface can use both static and dynamic network settings. If the interface is configured to use
dynamic settings, the network where the WLAN interface is connected must have a DHCP server that provides the settings.
The WLAN interface also provides a web configuration interface, which you can access by entering the IP address of the WLAN interface in the address field of a web browser.
0802-103
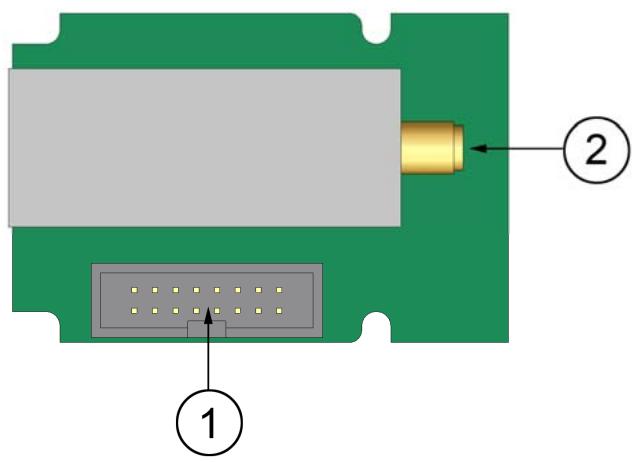
Figure 44 WLAN Interface Module
The following numbers refer to Figure 44 above:
1 = Flat cable connector
2 = Connector for antenna cable (connected to transmitter cover)
Attaching the WLAN Antenna
The LAN interface module must be installed at the factory (when ordering the transmitter), or by a Vaisala Service Center. Before taking the transmitter into use, the user must attach the antenna of the WLAN interface into the RP-SMA connector on the transmitter cover. The location of the antenna is shown in Figure 85 on page 161.
Data Logger Module
The optional data logger module extends the data storage for the measurement data. When the data logger is present, this storage is automatically used by the transmitter. The stored data can be browsed using the optional display module, and accessed through the serial connections. See sections Graphic History on page 72 and Data Recording on page 111.
The data logger module contains non-volatile flash memory providing 4 years 5 months of storage for 3 parameters at a 10 second sampling interval. When the memory is full, the data recording will not stop. Instead, the oldest data is overwritten. For each parameter and
observation period, the module stores the minimum and maximum values during the interval, as well a data trend value that is averaged from samples taken during the interval (see Table 9 on page 67).
Table 9 Observation Periods and Resolution
| Observation Period | Period for Trend/Max/Min Calculations (Resolution) |
| 3 hours | 90 seconds |
| 1 day | 12 minutes |
| 10 days | 2 hours |
| 2 months | 12 hours |
| 1 year | 3 days |
| 4 years | 12 days |
The quantities that are logged are the same that have been selected for measurement using the display/Keypad or the serial line. When taking the transmitter into use, verify that the desired quantities are selected. If you change the quantities later, the transmitter will start logging the new quantities, and stop logging the quantities that are no longer selected. Changing the quantities does not delete any measurement data that is already in memory.
The data logger module has a real time clock with a battery back-up. The clock has been set to the Coordinated Universal Time (UTC) at the factory, and its time cannot be set by the user. The data that is stored in the logger's memory is timestamped using the logger's clock.
When date and time are set on the transmitter, they are stored to the transmitter's memory as an offset from the time on the logger's clock. When browsing the stored data, the time offset is applied to the timestamps shown in the graphical history, and data outputted from the serial port. The timestamps in the data logger's memory remain as they were originally stored.
You can compensate for the clock drift (less than ± 2 min/year) by setting the time on the transmitter. This updates the time offset used on the display and the serial port. You can set the time by using the keypad/display or the serial commands.

Figure 45 Data Logger Module
The following numbers refer to Figure 45 above:
1 = Flat cable pins
2 = Battery
After a reset or a power up, it will usually take at least 10 seconds before the data logger module is initialized. The real time clock and the data logging and reading functions are not available before the initialization is complete.
The indicator LED on the module will blink green during normal operation. If the LED is lit in red color, there is a problem with the module. The transmitter will also indicate the problem by activating the "Add-on module connection failure" error. If the module is not operating correctly, the transmitter must be sent to Vaisala for maintenance.
The data logger module must be installed at the factory (when ordering the transmitter), or by a Vaisala Service Center. Once installed, the module is automatically used by the transmitter. When the module requires a new battery, the transmitter must be sent to Vaisala for maintenance.
8-pin Connector
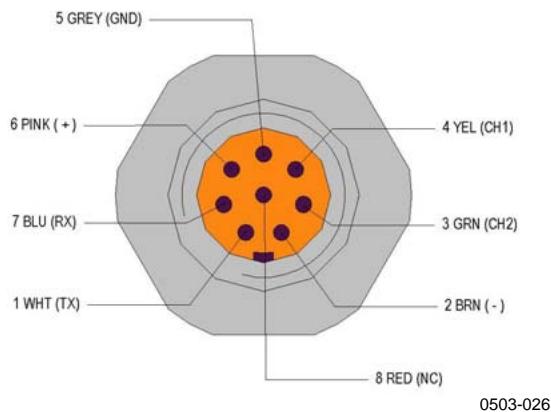
Figure 46 Wiring of the Optional 8-pin Connector
Table 10 Wiring of the 8-pin connector
| PIN/Terminal | Wire | Serial Signal | Analog Signal | |
| RS-232 (EIA-232) | RS-485 (EIA-485) | |||
| 1 | White | Data out TX | A | - |
| 2 | Brown | (series GND) | (series GND) | Signal GND(for both channels) |
| 3 | Green | - | - | Ch 2+ |
| 4 | Yellow | - | - | Ch 1 + |
| 5 | Grey | Supply - | Supply - | Supply - |
| 6 | Pink | Supply + | Supply + | Supply + |
| 7 | Blue | Data in RX | B | - |
| 8 | Shield/Red | Cable shield | Cable shield | Cable shield |
This page intentionally left blank.
CHAPTER 4
OPERATION
This chapter contains information that is needed to operate this product.
Getting Started
Within a few seconds after power-up the LED on the cover of the transmitter is lit continuously indicating normal operation. When the transmitter is turned on the first time, the language selection window opens: Select the language with arrow buttons and press the SELECT button (the left-hand button).
The pressure has an effect on humidity calculations and accuracy. Therefore, accurate calculations can be achieved only when the ambient pressure is taken into consideration. See page 101 for instructions on how to set the pressure.
Start-up time for DMT340 transmitter is in total about 6 minutes. The outputs (serial and analog) are activated 3 seconds after powering up the DMT340. In addition, 10 seconds after the measurement the outputs will freeze for about 6 minutes due to the sensor self diagnostics procedure (Sensor Purge and Autocal). The frozen output value will be the value the DMT340 transmitter reached during the 10 seconds of measurement. After the self diagnostics procedure the outputs are operational again.
Display/Keypad
Basic Display
Display shows you the measurement values of the selected quantities in the selected units. You can select 1... 3 quantities for the numerical basic display (see section Changing the Quantities and Units on page 98).

Figure 47 Basic Display
The numbers refer to Figure 47 above:
1 = The Info shortcut button
2 = The Graph shortcut button changes the display into a curve mode
3 Selected quantities
Press the INFO button (in the basic display) to see the device information views, see section Device Information on page 107.
NOTE
From any view, in the absence of an EXIT button, a four-second press on the right-hand function button takes you directly to the basic display.
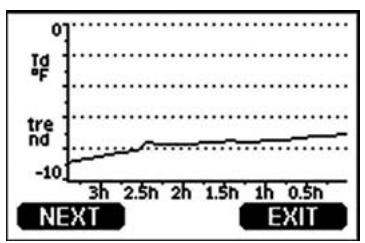
Graphic History
The graphical display shows the data trend or min/max graph of the selected quantities, one at a time. The graph is updated automatically while measuring.

0706-01
Figure 48 Graphical Display
Trend graph: Shows you a curve of average values. Each value is a calculated average over a period. See Table 11.
Max/min graph: Shows you the minimum and maximum values in a form of curve. Each value is max/min over a time period. See Table 11 below. The period for the trend and max/min calculations depends on the selected graph window as follows:
Table 11 Periods for Trend and Max/Min Calculations
| Observation Period | Period for Trend/Max/Min Calculations (Resolution) |
| 3 hours | 1,5 minutes |
| 1 day | 12 minutes |
| 10 days | 2 hours |
| 2 months | 12 hours |
| 1 year | 3 days |
| 4 year* | 12 days |
- Shows the maximum logging period of the data logger module (available when data logger module is installed)
Use the following functions in the graphical display:
- Press the NEXT button to change between the trend graph and max/min graph for the quantities selected for display.
- Press the EXIT button to return to the basic display.
- Press the arrow buttons to zoom in and out in the graph window.
- Press the arrow buttons move the cursor (vertical bar) along the time axis. The cursor mode allows you to observe individual measuring points. The numerical value at the cursor position is shown at the left upper corner. The right upper corner shows the time from the present to the chosen moment (without the logger module), or the date and time at the cursor position (when the logger module is installed).
- If the optional data logger module is installed, you can scroll the cursor off the screen to move to a new point on the time axis. The new date will be displayed, and the cursor will be centered at the date where the cursor scrolled off the screen.

Figure 49 Graphical Display with Data Logger
The time that is shown below the graph is adjusted with the current time offset of the transmitter. If you change the transmitter's date and time setting, the displayed timestamps in the history graph change accordingly. For an explanation of the effect of changing the date and time manually, see section Data Logger Module on page 66.
Table 12 Graph Information Messages
| Failure Message | Interpretation |
| Power outage | Power failure (marked also with dashed vertical line) |
| No data | Quantity has not been selected for the display |
| Device failure | General device failure. |
| T meas. failure | Temperature measurement/sensor failure |
| RH meas. failure | Humidity measurement/sensor failure |
| Adj. mode active | Adjustment mode active (data recorded in the adjustment mode is not displayed) |
| Autocal | Autocal performed (only shown in 3 h graphs) |
A question mark after time tells you that at least one power failure (dashed vertical line) has occurred after the chosen moment. In this case, the actual time difference between the present and the cursor position is not exactly known.
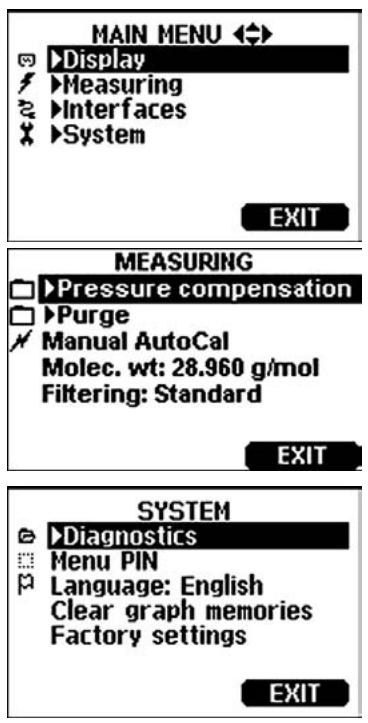
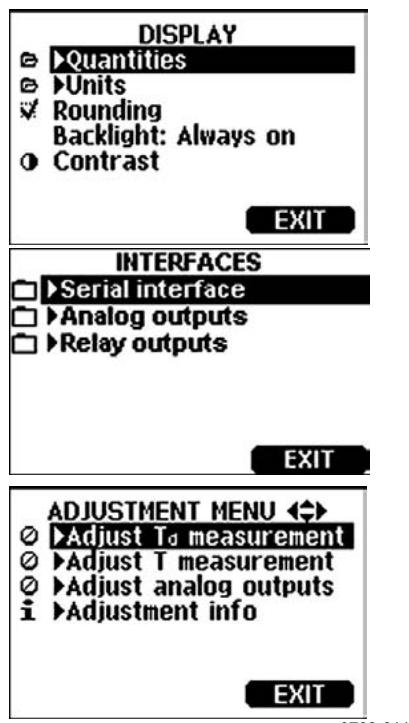
Menu and Navigation
You can change settings and select functions in the menus.
- Open the MAIN MENU by pressing any of the arrow buttons in the basic (numeric) display mode.
- Move in the menus by using the arrow buttons.
- Open a submenu with button.
- Press to return to the previous level.
- Function button EXIT returns you back to the basic display.
Adjustment menu is displayed only when ADJ button (on the motherboard inside the transmitter) is pressed.
0706-011
Figure 50 Main Views
Some menu items, such as Relay outputs in the Interfaces menu, are only shown if supported by the transmitter and the installed options.
Changing the Language
- Go back to the basic display by keeping the right-hand button pressed for four seconds.
- Open the Main menu by pressing any of the buttons.
- Scroll to the System menu option, and press the button. The menu option is indicated with the wrench × symbol.
- Scroll to the Language menu option, and the left-hand = button. The menu option is indicated with the flag symbol.
- Select the language with the buttons, and confirm the selection by pressing the left-hand button.
- Press the right-hand button to exit to the basic display.
Rounding Setting
Round off one decimal by using the Rounding function. The default setting is rounding on. Rounding has no effect on quantities without decimals.
- Open the MAIN MENU by pressing any of the arrow buttons.
- Select Display and confirm by pressing the arrow button.
- Select Rounding and press ON/OFF button.
- Press EXIT to return to the basic display.
Display Backlight Setting
As a default the display backlight is always on. In the automatic mode the backlight stays on for 30 seconds from the last press of the button. When pressing any button, the light turns on again.
- Open the MAIN MENU by pressing any of the arrow buttons
- Select Display, press the arrow button.
- Select Backlight, press the CHANGE button.
- Select On/Off/ Automatic, press the SELECT button.
- Press EXIT to return to the basic display.
Display Contrast Setting
- Open the MAIN MENU by pressing any of the arrow buttons.
- Select Display, press the arrow button.
- Select Contrast, press the ADJUST button.
- Adjust the contrast by pressing the arrow buttons.
- Press OK and EXIT to return to the basic display.
Keypad Lock (Keyguard)
This function locks the keypad and prevents unintentional key presses.
- Keep pressing the left-hand function button for 4 seconds to lock the keypad (at any display).
- To unlock the keypad, press the OPEN button for 4 seconds.
Menu PIN Lock
You can prevent unauthorized changes of the device settings by activating the menu PIN lock. When this function is activated, the basic display and graphical view are available but access to the menus is locked. The key symbol indicates the activation of this feature.
- Open the MAIN MENU by pressing any of the arrow buttons.
- Select System, press the arrow button.
- Select Menu PIN, press the ON button.
- Enter a PIN code by using the arrow buttons. Press OK to confirm the setting. Now the PIN lock is on and a key symbol is shown in a display.
- Press EXIT to return to the basic display. Returning to the menu is possible only by entering the correct PIN code.
When you want to turn off the PIN lock, go to the menu by giving the PIN code and select System, Menu PIN, press OFF button.
In case you have forgotten the PIN code, open the transmitter cover and press the ADJ button once. Wait for a few seconds and the adjustment menu opens. Select Clear menu PIN, press CLEAR.
NOTE
You can also disable the keypad completely with serial command LOCK.
Factory Settings
Use the display/Keypad to restore the factory settings. This operation does not affect the adjustments. Only settings available in the menus are restored.
- Press any of the arrow buttons to open the MAIN MENU.
- Select System by pressing the arrow button.
- Select Factory settings and press the REVERT button to confirm your selection. Press the YES button to reset all settings to the factory defaults.
See section General Settings on page 98 for a description of the other menu options.
Display Alarms
The Display Alarm feature provides two independently configurable alarms for transmitters with the display/Keypad option. Each alarm tracks a selected quantity, with a freely configurable low and high limit. Each alarm also has a configurable hysteresis value to prevent unnecessary triggering when the measurement fluctuates around an alarm limit. The alarms can be configured for any quantity supported by the transmitter. The configuration of the Display Alarms can only be done using the display/Keypad option.
An alarm is activated when the selected quantity goes higher than the high limit, or lower than the low limit, much in the same way as the relays. When an alarm is activated, an alarm note is displayed on the display, and the lights of the display will blink.

0802-041
Figure 51 Display Alarm Active
Multiple alarms can be active at the same time; the alarm that was triggered first will be shown on the display. The next active alarm is revealed when the currently shown alarm is acknowledged by pressing the OK button.
Note that activated alarms are only shown on the screen. There are no alarm messages output to the serial line, or markers placed in the graph data. After an alarm has been acknowledged, you must refer to the data graphs to see when the measured quantities have exceeded the limits.
Configuring a Display Alarm
- Enter the Main Menu by pressing an arrow key on the keypad.
- Use the arrow keys to select Display, followed by Alarms, to open the Display Alarms menu. The Display Alarms menu shows the currently enabled and disabled alarms.
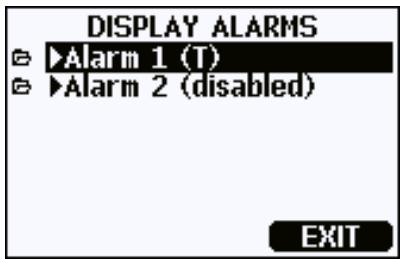
0802-069
Figure 52 Display Alarms
- Use the arrow keys to select an alarm to configure. The alarm editing page opens.
NOTE
Changes you do on the alarm editing page will take effect immediately, and may cause an alarm to appear on the screen.
- To select a quantity for the alarm, press the Change button and select the quantity from the list.
- To modify or remove the alarm limit values, move the selection over the Act. above or Act. below field and press the Set button. You will be prompted to Modify or Remove the value.
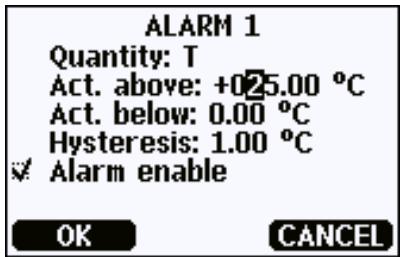
0802-070
Figure 53 Modifying an Alarm Limit
When modifying the value, use the arrow up and down buttons to change the value under the cursor. Left and right arrow buttons move the cursor. Select the OK button to accept the modified value, or Cancel to undo the modification.
- Set a suitable Hysteresis value to prevent the alarm from being triggered unnecessarily by small measurement changes that pass the alarm limit repeatedly.
- Set or clear the Alarm enable checkbox to enable or disable the alarm.
- Press the Exit button to leave the alarm configuration screen and return to the basic view.
MI70 Link Program for Data Handling
The real-time window function of the MI70 Link program allows you to monitor transmitter readings directly with a PC when transmitter is connected with a serial or USB cable. You can also transfer recorded data from the main transmitter memory in numeric or graphical format, for further use in a spreadsheet program (such as Microsoft Excel) or virtually any other application.
Follow the steps below to connect your transmitter to the MI70 Link program using the serial interface:
- Connect your PC to the transmitter. Refer to section Serial Line Communication on page 80.
- Check that the DMT340 is powered.
- Start the MI70 Link program.
- Start using the program. There is usually no need to select a COM port manually, the MI70 Link software can detect it automatically.
The MI70 Link program, and the optional connection cables, are available from Vaisala. See list of accessories in section Options and Accessories on page 158.
Serial Line Communication
Connect the serial interface by using either the user port or the service port.
For permanent interfacing to host system, use the user port. You can change the serial settings and operate in RUN, STOP and POLL modes.
For temporary connections use the service port. Service port is always available with fixed serial settings.
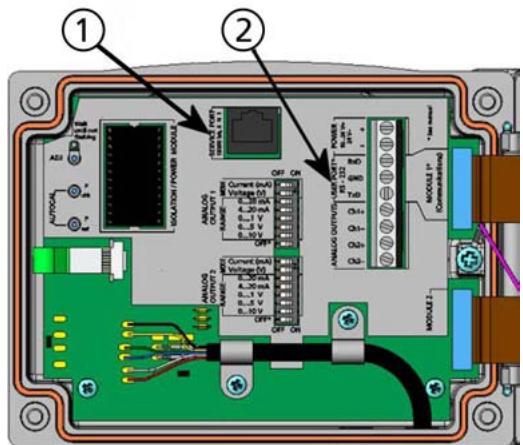
0605-039
Figure 54 Service Port Connector and User Port Terminal on the Mother Board
Numbers refer to Figure 54 above:
1 = Service port connector
2 = User Port Terminals
User Port Connection
Use suitable serial cable between the user port RxD, GND and TxD screw terminals and the PC serial port.
Table 13 Default Serial Communication Settings for the User Port
| Parameter | Value |
| Bauds | 4800 |
| Parity | Even |
| Data bits | 7 |
| Stop bits | 1 |
| Flow control | None |
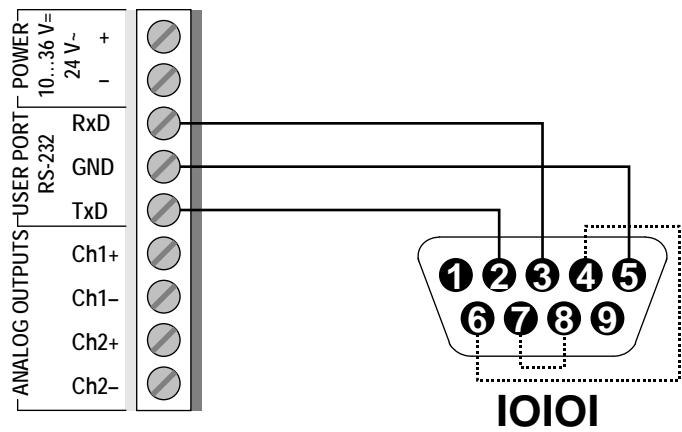
0506-033
Figure 55 Connection Example Between PC Serial Port and User Port
Connections to pins 4,6,7 and 8 are required only if your software requires hardware handshaking.
NOTE
User port cannot be used when the RS-485 module is connected.
Service Port Connection
Connection Cables
To connect to the service port, you need a suitable cable with an RJ45 connector. Depending on the connections of your PC, you can either use the Serial Connection Cable (optional accessory 19446ZZ) or the USB-RJ45 Serial Connection Cable (optional accessory 219685). The USB cable enables you to connect the transmitter to a PC via a standard type A USB port. Note that the USB cable does not enable high speed data transfer, since the bit rate is limited by the serial interface of the service port.
Installing the Driver for the USB Cable
Before taking the USB cable into use, you must install the provided USB driver on your PC. When installing the driver, you must acknowledge any security prompts that may appear. The driver is compatible with Windows® 2000, Windows® XP, Windows Server® 2003, and Windows® Vista.
-
Check that the USB cable is not connected. Disconnect the cable if you have already connected it.
-
Insert the media that came with the cable, or download the driver from www.vaisala.com.
- Execute the USB driver installation program (setup.exe), and accept the installation defaults. The installation of the driver may take several minutes.
- After the driver has been installed, connect the USB cable to a USB port on your PC. Windows will detect the new device, and use the driver automatically.
- The installation has reserved a COM port for the cable. Verify the port number, and the status of the cable, using the Vaisala USB Instrument Finder program that has been installed in the Windows Start menu.
Windows will recognize each individual cable as a different device, and reserve a new COM port. Remember to use the correct port in the settings of your terminal program. If you are using the Vaisala MI70 Link application, you do not need to check the COM port, as the MI70 Link detects the USB connection automatically.
There is no reason to uninstall the driver for normal use. However, if you wish to remove the driver files and all Vaisala USB cable devices, you can do so by uninstalling the entry for Vaisala USB Instrument Driver from the Add or Remove Programs (Programs and Features in Windows Vista) in the Windows Control Panel.
Using the Service Port
- Unfasten the screws on the transmitter cover, and open the transmitter.
- Connect the desired cable (serial interface cable or USB cable) to your PC and the service port connector on the transmitter. For location of the service port, refer to Figure 54 on page 81.
- Open a terminal program and set the communication settings as follows:
Table 14 Communication Settings for the Service Port
| Parameter | Value |
| Bauds | 19200 |
| Parity | None |
| Data bits | 8 |
| Stop bits | 1 |
| Flow control | None |
For a detailed explanation of using a terminal program, see section Terminal Program Settings on page 91.
- Power-up the DMT340.
LAN Communication
To enable LAN communication, a LAN or WLAN interface must be physically connected to the network, and the networking settings must be suitable for your network. For a description of interfaces, see sections LAN Interface on page 64 and WLAN Interface on page 65.
The LAN and WLAN interfaces both operate by accessing the serial interface (User Port) of the transmitter. All commands that are available using the serial interface are available through the LAN and WLAN interfaces; refer to section List of Serial Commands on page 94. For instructions on how to connect using a terminal program, see section Terminal Program Settings on page 91.
IP Configuration
The IP settings of the LAN and WLAN interfaces are described in Table 15. The current settings can be viewed on the serial line or using the device information display; see section Device Information on page 107.
Table 15 IP Settings for the LAN and WLAN Interfaces
| Parameter | Description |
| Automatic configuration (DHCP) | If enabled, the transmitter will retrieve its network settings (including the IP Address) from a server in the network. If disabled, static network settings are used instead. |
| Web configuration | If enabled, the settings of the interface can be changed using a web browser. The configuration page can be accessed by browsing to the IP address of the transmitter. |
| IP Address | The four part network ID of the transmitter. Must be set manually if automatic configuration is not used.Example value: 192.168.0.222 |
| Netmask | Used together with the IP address to determine which network the transmitter is a part of. Must be set manually if automatic configuration is not used.A common netmask is 255.255.255.0. |
| Gateway | IP address of the server that enables the transmitter to access other networks. Must be set manually if automatic configuration is not used.Example value: 192.168.0.1 |
| MAC | The MAC address is the unique hardware address of the LAN or WLAN interface. Cannot be changed. |
Using Display/Keypad
You can configure the IP settings of the LAN and WLAN interfaces using the display/Keypad as follows:
- Press any of the arrow buttons to open the MAIN MENU.
- Press the arrow button to select Interfaces.
- Press arrow button to select Network settings. There will be a delay as the transmitter refreshes the network information.
- You are now in the Network Interface menu. Selecting the IP configuration option opens the IP configuration menu.
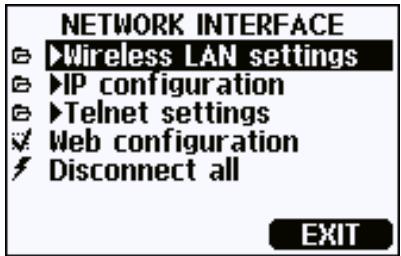
0802-113
Figure 56 Network Interface Menu
The Network Interface menu also allows you to enable or disable the Web configuration option, or Disconnect all users that are currently accessing the LAN or WLAN interface.
- In the IP configuration menu, select Automatic configuration (DHCP), or enter the IP address, Netmask and Gateway manually. If automatic configuration is enabled, manual configuration cannot be done.
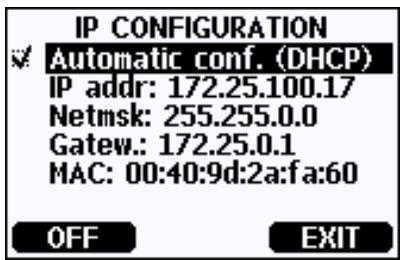
0709-004
Figure 57 IP Configuration Menu
To enter a value manually, use the the arrow buttons to select the parameter to change, and press Change. A cursor will appear in the first digit. Move the cursor using the arrow buttons, and change the value under the cursor using the arrow buttons. Confirm the selection by pressing OK.
- After configuring the desired parameters, press EXIT to return to the basic display.
Using Serial Line
Use the serial line command NET to view or set the network settings for the LAN and WLAN interfaces. You can also refresh the network information or disconnect all active connections.
NET [REFRESH] [DISCONNECT] [DHCP WEB] [DHCP IP SUBNET GATEWAY WEB]
where
REFRESH = Updates the network information and displays it
DISCONNECT = Disconnects all current sessions
DHCP = ON or OFF. Enables or disables the automatic IP configuration.
WEB = ON or OFF. Enables or disables the Web Configuration page.
IP = The four part network ID of the transmitter. Must be set manually if automatic configuration is not used.
SUBNET = Used together with the IP address to determine which network the transmitter is a part of. Must be set manually if automatic configuration is not used.
GATEWAY = IP address of the server that enables the transmitter to access other networks. Must be set manually if automatic configuration is not used.
Examples:
>net refresh OK DHCP : OFF IP address : 192.168.0.101 Subnet mask : 255.255.255.0 Default gateway: 192.168.0.1 Web config. : OFF MAC address : 00:40:9d:2c:d2:05 Telnet : Not connected >
>net on off
DHCP : ON
IP address : 192.168.0.104
Subnet mask : 255.255.255.0
Default gateway: 192.168.0.1
Web config. : OFF
MAC address : 00:40:9d:2c:d2:05
Telnet : Connected
OK
>
| >net off 192.168.0.101 255.255.255.0 192.168.0.1 off |
| DHCP : OFF |
| IP address : 192.168.0.101 |
| Subnet mask : 255.255.255.0 |
| Default gateway: 192.168.0.1 |
| Web config. : OFF |
| MAC address : 00:40:9d:2c:d2:05 |
| Telnet : Connected |
| OK |
| > |
Wireless LAN Configuration
The settings of the WLAN interface are described in Table 16. The current settings can be viewed on the serial line or using the device information display; see section Device Information on page 107.
Table 16 Wireless LAN Settings
| Parameter | Description |
| SSID | The service set identifier (i.e. network name) of the wireless network to connect to. 1 ... 32 characters. |
| Security type | The security type of the wireless network. The options are: |
| OPEN | |
| OPEN/WEP | |
| WPA-PSK/TKIP | |
| WPA-PSK/CCMP | |
| All other choices except OPEN require a security key; see below. | |
| Security key | The encryption key or passphrase that is used with an encrypted network. |
Using Display/Keypad
You can configure the Wireless LAN settings using the display/keyboard as follows:
- Press any of the arrow buttons to open the MAIN MENU.
- Press the arrow button to select Interfaces.
- Press the arrow button to select Network settings. There will be a delay as the transmitter refreshes the network information.
- Press the arrow button to select Wireless LAN settings.
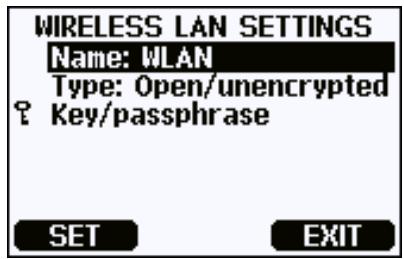
0802-111
Figure 58 Wireless LAN Settings
- The Name entry on the page shows the SSID of the currently selected wireless network. To change the SSID, press the SET button. Use the arrow buttons to change the character under the cursor, and arrow buttons to more the cursor. Press the OK button when done.

0802-110
Figure 59 Entering Network SSID
- To change the currently selected Network type, select the Type entry and press the Change button. Select the new type from the list and press the Select button.

0802-112
Figure 60 Selecting the Wireless Network Type
-
If you have selected an encrypted network type (WEP or WPA), you must enter the security key to be used. Select the Key/passphrase entry and press the Set button. Enter the key in the same way as the SSID, and press the OK button. With the WEP encryption you must enter the encryption key in hexadecimal (10 hexdecimals for 64-bit encryption or 26 hexadecimal for 128-bit encryption). A WPA key must be 8 ... 63 ASCII characters.
-
After setting the wireless network parameters, press the Exit button in the Wireless Network Settings menu. You will be asked to confirm the new settings. Note that when new settings are saved, all currently active WLAN connections are disconnected.
Using Serial Line
Use the serial line command WLAN to view or set the wireless network settings. If you set an encrypted network type, you will be asked to enter the security key. With the WEP encryption you must enter the encryption key in hexadecimal (10 hexadecimal for 64-bit encryption or 26 hexadecimal for 128-bit encryption) or with plain ASCII characters (5 characters for 64-bit encryption or 13 characters for 128-bit encryption). A WPA key must be 8 ... 63 ASCII characters.
WLAN [SSID TYPE]
Where
SSID = The network name in 1 ... 32 characters
TYPE = The security type of the wireless network. The options are:
OPEN OPEN/WEP WPA-PSK/TKIP WPA-PSK/CCMP
Examples:
> wlan ?
Network SSID : WLAN-AP
Type : OPEN
>
> wlan accesspoint wpa-psk/tkip
Network SSID : accesspoint
Type : WPA-PSK/TKIP
WPA-PSK phrase ? thequickbrownfox
Warning: Active connection will be disconnected. Save changes (Y/N) ? y OK
Telnet Settings
When a telnet connection is established via the LAN or WLAN interface, the session has the same communication mode, run interval, poll address and echo settings as the serial port (user port) session would have.
These settings can be changed using the display/Keypad, using the serial line (user port or service port), or on-the-fly during the telnet session.
The display menu path to the telnet settings is:
Main menu Interfaces Network Interface Telnet settings.
The commands for changing the settings are SMODE, INTV, ADDR, and ECHO.
Web Configuration for LAN and WLAN
The LAN and WLAN interfaces both have a web configuration page that is accessible using a browser. If you have not disabled the page from the network settings, you can access it with a web browser at the IP address of the interface.
When accessing the web configuration page, you must first log in.
Username: user
Password: vaisala
The web configuration page provides similar network configuration options as the serial line and the display/Keypad. It also has additional options for advanced users. For example, there are more options for securing the wireless network.
If these additional options are used, they will appear as custom configurations when viewed from the serial line or the display/Keypad.
VAISALA Vaisala WLAN Interface Configuration and Management
Home
Configuration
No
System
Management
Connections
Administration
Update Firmware
Factory Default
Settings
Reboot
Logout
Network Configuration
IP Settings
Configure the network below. IPv6 settings are shown here for informational purposes.
Link Local Address:
FE80::240:9DFF:FE2C:D1DF
Local Adress: none
m = 311
IPv4 and DNS
Obtain an IP address automatically using DHCP
Use the following IP address:
* IP Address:
- Subnet Mask:
Default Gateway:
-
Primary DNS:
-
Secondary DNS:
192.168.11.8
255.255.255.0
192.168.11.1
192.168.11.1
:FFFF:0:0
- Changes to DHCP, IP address, Subnet Mask, and DNS may effect your browser connection.
Apply
reless LAN Settings
eless Security Settings
less 802.1x Authentication Settings
Fanced Network Settings
0802-114
Figure 61 Web Configuration Interface for WLAN
Terminal Program Settings
The instructions below describe how to connect to the DMT340 using the PuTTY terminal application for Windows. Perform the necessary cabling and configuration of the transmitter before following the instructions.
PuTTY is available for download at www.vaisala.com.
Opening a Serial/USB connection
- Power up the DMT340 and start the PuTTY application.
- Select the Serial & USB settings category, and check that the correct COM port is selected in the Serial or USB line to connect to field. Change the port if necessary.
If you are using a Vaisala USB cable, you can check the port that it uses by clicking the USB Finder... button. This opens the Vaisala USB Instrument Finder program that has been installed along with the USB drivers.
- Check that the other serial/USB line settings are correct for your connection, and change if necessary. The default settings (shown in Figure 1) are used by the Service Port of the DMT340.

Figure 62 Opening a Serial Connection
- Click the Open button to open the connection window and start using the serial line.
If PuTTY is unable to open the serial port you selected, it will show you an error message instead. If this happens, restart PuTTY and check the settings.
Opening a Telnet session (LAN/WLAN)
NOTE
The instructions below assume that the LAN/WLAN interface on the transmitter is correctly configured and the network connection is already done.
- Power up the instrument and start the PuTTY application. If your transmitter acquires a network address using DHCP, wait for a minute for this to complete, then verify the address from the transmitter.
-
In the Session window, select the Telnet connection type.
-
Enter the IP address of your transmitter in the Host Name (or IP address) field. If you do not know the port, the default port 23 is likely correct.
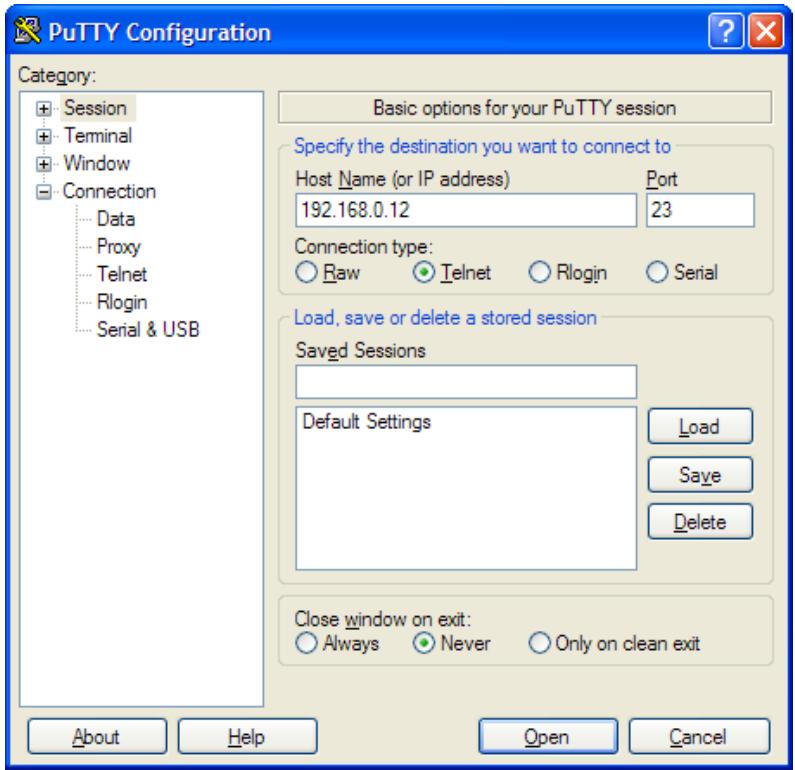
0810-071
Figure 63 Opening a Telnet Connection
- Click the Open button to open the connection window and start using the telnet session.
If PuTTY is unable to connect the IP address you entered, it will show you an error message instead. If this happens, check the IP address and the connections, restart PuTTY, and try again.
List of Serial Commands
The bold text in the brackets is the default setting. Enter commands by typing them on your computer and pressing the Enter key.
Table 17 Measurement Commands
| Command | Description |
| R | Start the Continuous Outputting |
| S | Stop the Continuous Outputting |
| INTV [0 ... 255 S/MIN/H] | Set the Continuos Output Interval (for RUN mode) |
| SEND [0 ... 99] | Output the Reading once |
| SMODE [STOP/RUN/POLL] | Set the Serial Interface mode |
| SDELAY | View or set user port (RS232 or RS485) answer minimum delay |
| SERI [baud p d s] | User Port Settings (Default: 4800 E 7 1) |
| ADDR [0 ... 99] | Set the Transmitter Address (for POLL Mode) |
| NET | View or set networking parameters for LAN and WLAN interfaces |
| WLAN | View or set wireless network parameters for WLAN interface |
| OPEN [0 ... 99] | Open Temporarily Connection to a POLL Mode Device |
| CLOSE | Close the Temporary Connection (Back to POLL Mode) |
Table 18 Formatting Commands
| Command | Description |
| FORM | Set the output format of SEND and R commands |
| FST | Add the state of Autocal, purge and sensor warming in connection with SEND and R commands |
| FDATE | Add date to R and SEND outputs |
| FTIME | Add time to output to SEND and R outputs |
Table 19 Data Recording Commands
| Command | Description |
| DIR | Lists trend log files |
| PLAY[0 ... 21] [START END] | Output recorded data file. Start and end times can only be specified if the data logger module is installed. The times must be given in the following format:yyyy-mm-dd hh:mm:ss |
| DSEL | Select logged (and displayed) quantities |
| DELETE | Delete all data files, including the memory of the optional data logger module |
| UNDELETE | Recover the deleted files that have not been overwritten |
Table 20 Purge Commands
| Command | Description |
| PUR | Purge settings |
| PURGE | Start manual purge |
Table 21 Autocalibration Commands
| Command | Description |
| AUTO | Autocal settings |
| AUTOCAL | Start manual autocal |
Table 22 Calibration and Adjustment Commands
| Command | Description |
| FCRH | RH 2-point-adjustment |
| IKØ | Td/f 1-point-adjustment |
| CT | T 1/2-point-adjustment |
| ACAL | Perform analog output adjustment |
Table 23 Setting and Testing the Analog Outputs
| Command | Description |
| ASEL | Configure analog output quantities and scales |
| ITEST | Test analog outputs |
| AMODE | Display analog output mode |
| AERR | Change the error output |
| ASCL | Analog output scaling |
Table 24 Setting and Testing the Relays
| Command | Description |
| RSEL | Configure relay settings |
| RTEST | Test relays |
Table 25 Other Commands
| Command | Description |
| ? | Output the information about the device |
| ?? | Output the information about the device in POLL-state |
| CDATE | Adjust the output date/set date when adjustment enabled |
| CODE | Display the order configuration code of the transmitter |
| CTEXT | Display the adjustment information text/set information text when adjustment enabled |
| DATE | Set date. |
| DSEND | Output the reading, also in poll mode. |
| ECHO | Turn the serial interface echo ON/OFF |
| ERRS | Display transmitter error messages |
| FIND | All devices in POLL mode send their addresses |
| HELP | List the most common commands |
| LOCK | Lock the menu/Keypad |
| MODS | Display module status |
| PRES | Set the value for pressure compensation |
| RESET | Reset the device |
| TEST | Self-diagnostics information |
| TIME | Set time. |
| UNIT | Display output units |
| VERS | Display the software version information |
| XPRES | Set pressure (temporarily) |
| MOL/MOLI | View/set molecular weight parameter |
Getting the Measurement Message from Serial Line
Starting Continuous Outputting
R
Enter the R command to start the continuous output of measurements.
Example:
>r Tdf=-20.6 C H20= 958 ppmV x= 0.6 g/kg
> r
Tdf=-20.7 'C H2O= 958 ppmV T= 23.8 'C RH= 3.3 %RH
If a value is too long to fit to the allocated space in the output, or if there is an error in outputting the quantity, the value is displayed with stars * .
You can change the format of the output with the following commands:
- Outputting interval can be changed with the INTV command.
- Output message format can be changed with the FORM command.
- Status of purge, sensor warming and AutoCal can be added with the FST command.
- Date and time information can be added with commands FDATE and FTIME
Stopping Continuous Outputting
S
Use the S command to end the RUN mode. After this command all other commands can be used. You can also press the Esc button or reset the transmitter to stop the outputting.
See command SMODE to change the default (power-up) operation mode.
Formatting Serial Line Message
FTIME and FDATE
FTIME and FDATE commands will enable/disable output of time and date to the serial line. To add time to R and SEND outputs press FTIME [x] .
FTIME
To add date to R and SEND outputs press FDATE [x]
FDATE
where
x = ON or OFF
Example:
>send
Tdf=-20.6 'C H2O= 959 ppmV T= 23.9 'C RH= 3.3 %RH
>ftime on
Form. time : ON
>send
23:08:27 Tdf=-20.6 'C H2O= 959 ppmV T= 23.9 'C RH= 3.3 %RH
>fdate on
Form. date : ON
>send
2000-01-31 23:08:46 Tdf=-20.6 'C H2O= 960 ppmV T= 23.9 'C RH= 3.3 %RH
>
FST
To output the state of purge, sensor warming and AutoCal in connections with SEND and R commands press FST [x] .
Where
x = ON or OFF (default)
Example:
>fst on
Form. status : ON
>send
N 0 RH= 40.1 %RH T= 24.0 'C Td= 9.7 'C Tdf= 9.7 'Ca=
8.7 g/m3 x= 7.5
g/kgTw=15.6'Cppm=11980pw= 12.00 hPa pws= 29.91 hPa
h=43.2 kJ/kg
>purge
Purge started,press any key to abort.
>send
S134RH=40.2%RH T=24.1'C Td=9.8'C Tdf=9.8'C a=
8.8 g/m3 x=7.5
g/kgTw=15.7'C ppm=12084pw=12.10 hPa pws=30.11 hPa
h=43.5 kJ/kg
>
Where the state of the probe is indicated by the following letters and values:
N...xxx = Normal operation where xxx = Probe heat power
H...xxx = Purge where xxx = Sensor temperature (^)
S...xxx = Sensor cooling where xxx = Sensor temperature (^) after purge
A...xxx = AutoCal where xxx = Sensor temperature (^)
w...xxx = Sensor warming where xxx = Sensor heat power
See section General Settings on page 98 for a description of the other serial commands.
General Settings
Changing the Quantities and Units
To change quantities and units use serial commands or the optional display/Keypad. See Table 3 on page 19 for available quantities and Table 4 on page 20 for optional quantities.
NOTE
Only the quantities selected when ordering the device can be selected as an output quantity.
Using Display/Keypad
Use display/Keypad to select the display output quantities.
- Press any of the arrow buttons to open the MAIN MENU.
- Press the arrow button to select Display.
- Press arrow button to select Quantities.
-
Select the quantity by using the arrow buttons. Confirm the selection by pressing SELECT. You can select 1 ... 3 display quantities at a time.
-
Press EXIT to return to the basic display.
To select display units:.
- Press any of the arrow buttons to open the MAIN MENU.
- Press the arrow button to select Display.
- Use the arrow buttons to select Units. Confirm the selection by pressing the right-hand arrow button.
- Use the arrow buttons to select display units. Confirm the selection by pressing CHANGE. The unit changes from metric to non-metric or the other way round.
- Press EXIT to return to the basic display.
NOTE
Changing the units by using the display/Keypad has no effect on the serial output units.
Using Serial Line
Use the serial line command FORM to change the format, and the command UNIT to select metric or non-metric output units.
FORM
Use the serial line command FORM to change the format or select a certain quantities for the output commands SEND and R.
FORM [x]
where
$$ x = \text {F o r m a t t e r} $$
Theformatter string consists of quantities and modifiers. If noformatter string is entered, the command will display the currently activeformatter string. Note that the hash symbol "#" is shown as a backslash "\" when viewing the currentformatter string.
When entering the command, use the abbreviations of the quantities. For more information on quantities, see Table 3 on page 19 and Table 4 on page 20.
The modifiers are presented in Table 26 below.
Table 26 FORM Command Modifiers
| Modifier | Description |
| x.y | Length modifier (number of digits and decimal places) |
| #t | Tabulator |
| #r | Carriage-return |
| #n | Line feed |
| "\" | String constant |
| #xxx | Special character, code "xxx" (decimal), for example #027 for ESC |
| U5 | Unit field and length |
| ADDR | Transmitter address with two characters [00...99] |
| ERR | Error flags for P, T, Ta, RH [0000 ... 1111], 0 = no error |
| STAT | Transmitter status in 7 character field, for example: N 0 no heating h 115 probe heating active, power 115/255 H 159.0 purge heating active, temperature 159°C S 115.0 purge cooling active, temperature 115°C X 95.0 sensor heating active, temperature 95°C |
| SN | Transmitter serial number |
| TIME | Time [hh:mm:ss] |
| DATE | Date [yyyy-mm-dd] |
| OK | Pressure stability indicator, two characters [OK or ""] |
| CS2 | Modulus-256 checksum of message sent so far,ascii encoded hexadecimal notation |
| CS4 | Modulus-65536 checksum of message sent so far,ascii encoded hexadecimal notation |
| CSX | NMEA xor-checksum of message sent so far,ascii encoded hexadecimal notation |
| A3H | Pressure tendency [* or 0...8] |
Example:
form "Td=" 4.2 rh U5 #t "T=" t U3 #r #n
Td= 3.30°C T= 22.18'C
send
Td= 3.30°C T= 22.18'C
form "Tfrost=" tdf U3 #t "Temp=" t U3 #r#n
Tfrost= -21.6'C Temp= 22.2'C
Command 'FORM /' will return the default output format. The default output format depends on the device configuration.
form /
Tdf=-21.6 'C H2O= 874 ppmV T= 22.2 'CRH= 3.3 %RH
UNIT
Use the command UNIT [x] to select metric or non-metric output units.
where
$$ x \quad = \quad \mathrm {M} \text {o r} \mathrm {N} $$
where
M = Metric units
N = Non-metric units
NOTE
This command changes both the serial output and display units to either metric or non-metric units. When you want to output both metric and non-metric units simultaneously on the display, select the display units by using the display/Keypad.
Use UNIT H_2O [ppmv/ppmw] to change H_2O units.
Use the MOL/MOLI command to view/set mole weight parameter that will be used in calculating H2O~ppmw
Pressure Compensation Setting
The pressure has an effect on humidity calculations and accuracy. Therefore, accurate calculations can be achieved only when the process pressure is taken into consideration.
Note that conversions from mmHg and inHg are defined at 0^ and for mmH_2O and inH_2O at 4^ .
NOTE
Pressure compensation is intended to be used in normal air only. When measuring in other gases, please contact Vaisala for further information.
NOTE
Fixed pressure compensation value of 1013.25hPa is used when in adjustment mode.
Using Display/Keypad
Use display/Keypad to set the pressure compensation. To select the pressure unit using display/Keypad see section Changing the Quantities and Units on page 98.
-
Press any of the arrow buttons to open the MAIN MENU.
-
Select Measuring and press the arrow button to confirm your selection.
- Select Pressure compensation and press the arrow button to confirm you selection.
- Press SET and enter the pressure value by using the arrow buttons.
- Press OK and EXIT to return to the basic display.
Using Buttons on the Motherboard
Pressure set buttons (P_chk and P_set) can be used to set the process pressure.

Figure 64 Pressure Set Buttons on the Motherboard
Numbers refer to Figure 64 above:
1 = Pressure set button
2 = Pressure check button
Press check button (P_chk) and a red led will flash the current pressure setting in bar_a .
Press the set button (P_set) to set the pressure value. The number of presses equals the number of bar a to be set (for example, three presses = three bar). After a few seconds, the red led will confirm the setting by flashing the new pressure value.
Using Serial Line
XPRES and PRES
Command XPRES should be used if the value is changed frequently. Its value is not retained at reset, and when set to 0, last value set with PRES is used instead. Use the serial line and do the following:
PRES [aaa.a]
XPRES [aaaa.a]
where
aaaa.a = Absolute process pressure (hPa)
Example:
>pres Pressure : 1013.00 hPa ?
>pres 2000 Pressure : 2000.00 hPa >
Table 27 Multiplication Factors
| From | To: hPa |
| mbar | 1 |
| PaN/m2 | 0.01 |
| mmHg torr | 1.333224 |
| inHg | 33.86388 |
| mmH2O | 0.09806650 |
| inH2O | 2.490889 |
| atm | 1013.25 |
| at | 980.665 |
| bar | 1000 |
| psia 1) | 68.94757 |
1) Psia = psi absolute.
Example:
29.9213 inHg = 29.9213 x 33.86388 hPa = 1013.25 hPa
Date and Time
Using Display/Keypad
If the optional Data Logger Module is installed, you can change the time and date using the display/Keypad.
- Press any of the arrow buttons to open the MAIN MENU.
- Select System and press the arrow button to confirm your selection.
- Select Date and time and press the arrow button.
- Press the SET button to enter the adjustment mode, and use the arrow buttons to select and change the values.
-
You can also change the date and time formats that are shown in the graphs. The selected formats are only used in graphical display, they do not change the formats that are used in the serial communication.
-
Press EXIT to return to the basic display.
Using Serial Line
To set time enter the TIME command. To set date enter the DATE command.
TIME
DATE
These time and date settings are shown on the timestamps of PLAY command. When you want to include time and date in the R and SEND commands, use the FTIME and FDATE commands.
Example:
TIME Time :13:42:49?
DATE Date :2007-05-31?
NOTE
If the optional Data Logger Module is not installed, time and date are cleared to 2000-01-01 00:00:00 at reset or at power failure.
User Port Serial Settings
The communication settings for the user port can be changed via the serial line or by using the optional display/Keypad. The communication settings for the service port are fixed and not changeable.
- Press any of the arrow buttons to open the MAIN MENU.
- Select Interfaces and press the arrow button to confirm your selection.
- Select Serial interface and press the arrow button to confirm your selection.
- Select Bit rate/Serial format/Comm. mode by pressing the CHANGE button. Use the arrow buttons to select and press SELECT to confirm your selection.
- Select RUN interval for RUN communication mode and press SET to confirm your selection.
- Use the arrow buttons to set the measuring interval and the unit. Press OK to confirm your settings.
-
Select POLL address for POLL communication mode. Press SET to confirm your selection.
-
Use the arrow buttons to set the transmitter address. Press OK to confirm the setting.
- Use the arrow buttons to select ECHO. Press ON to turn to it on. Press OFF to turn it off.
- Press EXIT to return to the basic display.
SERI
Use the serial line command SERI [b p d s] to set communication settings for the user port.
SERI [b p d s]
where
$$ \begin{array}{l} \begin{array}{r c l} \text {b} & = & \text {B a u d s (1 1 0 , 1 5 0 , 3 0 0 , 6 0 0 , 1 2 0 0 , 2 4 0 0 , 4 8 0 0 , 9 6 0 0 , 1 9 2 0 0 ,} \ & & 3 8 4 0 0, 5 7 6 0 0, 1 1 5 2 0 0) \end{array} \ p = \text {P a r i t y} (n = n o n e, e = e v e n, o = o d d) \ \mathrm {d} = \text {D a t a b i t s (7 o r 8)} \ s = \text {S t o p} (1 \text {o r} 2) \ \end{array} $$
Example:
SERI 600 N81
600 N 81
SMODE
Use the command SMODE [xxxx] to set the user port start-up operating mode.
SMODE [xxxx]
where
$$ \mathrm {x x x} = \text {S T O P , R U N o r P O L L} $$
Table 28 Selection of Output Modes
| Mode | Output | Commands used |
| STOP | Only by command | All (default mode) |
| RUN | Automatic output | Only command S |
| POLL | Only with command SEND [addr] | Use with RS-485 buses, see RS-422/485 Interface on page 62. |
Selected output mode will be activated after power outages.
INTV
Use the command INTV[xxx yyy] to set the outputting interval for the RUN mode.
where
xxx = Output inerval (0 ... 255). 0: the fastest possible output rate.
yyy = Unit (s,min or h)
Example:
INTV 10 min
Output intrv. : 10 min
ECHO
Use the command ECHO [x] to set the user port echo. The command either enables or disables echo of characters received.
ECHO [x]
where
$$ \begin{array}{l} \mathrm {x} \quad = \quad \text {O N} (\text {d e f a u l t}) \text {o r} \ = \quad \text {O F F} \ \end{array} $$
NOTE
You can use the SERI, SMODE, INTV and ECHO commands to change/view the user port settings even if you are currently connected to the service port.
Data Filtering
The averaging data filter calculates a average over a certain period of time. The lowest measurement noise is achieved with the extended filtering. There are three filtering levels available.
Table 29 Filtering Levels
| Setting | Filtering level |
| OFF | No filtering |
| ON (default) | Standard = short filtering (about 15 s moving average) |
| EXTENDED | Extended filtering (default: 1 min average) |
Use display/Keypad to set the filtering level.
- Press any of the arrow buttons to open the MAIN MENU.
- Select Measuring by pressing the arrow button.
- Select Filtering and press CHANGE to confirm your selection.
- Select Off/Standard/Extended and press SELECT to confirm your selection.
- Press EXIT to return to the basic display.
FILT
Use the serial line to set the filtering level. Use the FILT [xxx] command where
$$ \mathrm {x x x} = \text {O F F , O N o r E X T (d e f a u l t = O N)} $$
Device Information
Use the display/Keypad or the serial line to display the device information.
Press the INFO button in the basic display to see the following information:
- current sensor operation (for example, AutoCal or Purge) in progress
- present or past unacknowledged errors
device information - adjustment information fed by the user
- measuring settings
- information on Purge settings
- Display Alarm settings
- serial interface information
- network settings and status of the LAN and WLAN interfaces
- analog output information
- relay output information
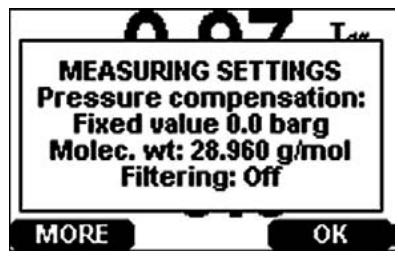
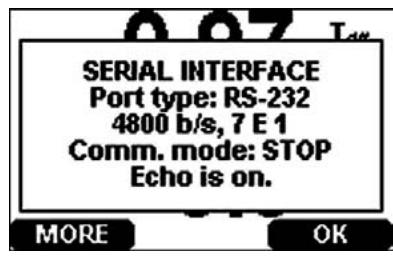
0706-012
Figure 65 Following Device Information on the Display
Proceed in the information views by pressing the MORE button as many times as you get the desired information. You can browse through the information displays also with arrow buttons. Press OK to return to the basic display.
?
Use the serial line command? to check the current transmitter configuration. Command ?? is similar but can also be used if the transmitter is in POLL mode.
>?
DMT340 / 2.02
Serial number : A2150004
Batch number : A1450004
Adjust. date : 2005-06-20
Adjust. info : Vaisala/HEL
Date : 2000-01-01
Time : 00:00:23
Serial mode : STOP
Baud P D S : 4800 E 7 1
Output interval: 0 s
Address : 0
Echo : ON
Pressure : 1000.00 hPa
Filter : ON
Ch1 output : 4...20mA
Ch2 output : 4...20mA
Ch1 RH low : 0.00 %RH
Ch1 RH high : 100.00 %RH
Ch2 T low : -40.00 'C
Ch2 T high : 180.00 'C
Module 1 : not installed
Module 2 : not installed
HELP
Use the command HELP to list the commands.
>help
? ACAL ADDR AERR ALSEL
ASCL ASEL CDATE CLOSE CODE
CRH CT CTA CTEXT DATE
DELETE DIR DSEL DSEND ECHO
ERRS FCRH FDATE FILT FORM
FST FTIME HELP INTV ITEST
MODS NET OPEN PLAY PRES
R RESET SEND SERI SMODE
TEST TIME UNDELETE UNIT VERS
WLAN XPRES
ERRS
Use the command ERRs to display transmitter error messages, see Table 30 on page 137.
Example:
>ERRS NO ERRORS
Example:
>ERRS
FAIL
Error: Temperature measurement malfunction
Error: Humidity sensor open circuit
VERS
Use the command VERS to display software version information.
Example:
>vers DMT340 / 2.02 >
Resetting the Transmitter Using Serial Line
RESET
The RESET command resets the transmitter. The user port switches to start-up output mode selected with command SMODE.
Locking Menu/Keypad by Using Serial Line
LOCK
Use the LOCK command to prevent the user from entering the menu using the keypad, or to lock the keypad completely. You can optionally set a 4-digit PIN code, for example 4444.
If a PIN code has been set, the user will be prompted to enter the code when trying to access the menu. Entering the code correctly will disable the lock until the user returns back to the basic view.
LOCK [x] [yyyy]
where
x = Keypad locking level, range 0...2. The options are:
0 - No lock (enables full access)
1 - Menu locked, but graphs are accessible
2 - Keypad completely disabled
yyyy = 4-digit PIN code. The code can only be set when keypad locking level is 1.
Examples:
>lock 1 4444
Keyboard lock : 1 [4444]
>
>lock 1
Keyboard lock : 1
>
<h1 id="data-recording">Data Recording</h1>
Data recording function is always on and collects data automatically into the memory of the device. If the optional data logger module is installed, the transmitter uses it automatically. Recorded data does not disappear from the memory when the power is switched off. Collected data can be observed in a form of a graph in the graphical view of the display or it can be listed out by using the serial line or MI70 Link program.
<h1 id="selecting-the-data-recording-quantities">Selecting the Data Recording Quantities</h1>
If the device is provided with the optional display, the recorded quantities are always those selected for the display. Up to three quantities can be recorded at a time. See section Changing the Quantities and Units on page 98 for instructions on how to select the display quantities with the keypad.
<h1 id="dsel">DSEL</h1>
Use the serial line command DSEL [xxx] to select the quantities to be recorded if the transmitter is not equipped with display/Keypad.
You may also dump the logged data to the serial line in numeric form with the following commands.
DSEL [xxx]
where
xxx = Data recording quantity. See Table 3 and Table 4 on page 19 for the quantities.
Enter the command without parameters and press ENTER to display current recording parameters.
Example:
>dsel rh t tdf RH T Tdf
<h1 id="view-recorded-data">View Recorded Data</h1>
If the device is provided with the optional display, the graphical display shows the data of the selected quantities, one at a time. See section Graphic History on page 72 for details about graphical display.
<h1 id="dir">DIR</h1>
Use the serial line and enter the DIR command to check the available files.
Without the data logger module, the transmitter records five files (five observation periods) for each selected quantity. The data logger raises the number of recorded files to six for each quantity. Thus, the total amount of the files varies between 5 and 18. See Table 11 on page 73.
Select, for example, two quantities (T and Tdf). The last column illustrates the number of data points that has been stored in the file.
Example (data logger module installed):
<table><tr><td colspan="5">>dir</td></tr><tr><td></td><td>File description</td><td>Oldest data available</td><td>No. of points</td><td></td></tr><tr><td>1</td><td>T (90 s intervals)</td><td>2007-05-30 05:25:30</td><td>1555200</td><td></td></tr><tr><td>2</td><td>T (12 min intervals)</td><td>2007-05-29 05:48:00</td><td>194400</td><td></td></tr><tr><td>3</td><td>T (2 h intervals)</td><td>2007-05-19 02:00:00</td><td>19440</td><td></td></tr><tr><td>4</td><td>T (12 h intervals)</td><td>2007-03-23 12:00:00</td><td>3240</td><td></td></tr><tr><td>5</td><td>T (3 d intervals)</td><td>2006-04-20 00:00:00</td><td>540</td><td></td></tr><tr><td>6</td><td>T (12 d intervals)</td><td>2002-12-16 00:00:00</td><td>135</td><td></td></tr><tr><td>7</td><td>Tdf (90 s intervals)</td><td>2007-05-30 05:25:30</td><td>1555200</td><td></td></tr><tr><td>8</td><td>Tdf (12 min intervals)</td><td>2007-05-29 05:48:00</td><td>194400</td><td></td></tr><tr><td>9</td><td>Tdf (2 h intervals)</td><td>2007-05-19 02:00:00</td><td>19440</td><td></td></tr><tr><td>10</td><td>Tdf (12 h intervals)</td><td>2007-03-23 12:00:00</td><td>3240</td><td></td></tr><tr><td>11</td><td>Tdf (3 d intervals)</td><td>2006-04-20 00:00:00</td><td>540</td><td></td></tr><tr><td>12</td><td>Tdf (12 d intervals)</td><td>2002-12-16 00:00:00</td><td>135</td><td></td></tr><tr><td>></td><td></td><td></td><td></td><td></td></tr></table>
Example (without data logger module):
<table><tr><td colspan="5">>dir</td></tr><tr><td></td><td>File description</td><td>Oldest data available</td><td>No. of points</td><td></td></tr><tr><td>1</td><td>T (90 s intervals)</td><td>2008-04-11 20:41:11</td><td>135</td><td></td></tr><tr><td>2</td><td>T (12 min intervals)</td><td>2008-04-10 21:03:41</td><td>135</td><td></td></tr><tr><td>3</td><td>T (2 h intervals)</td><td>2008-03-31 18:03:41</td><td>135</td><td></td></tr><tr><td>4</td><td>T (12 h intervals)</td><td>2008-02-04 12:03:41</td><td>135</td><td></td></tr><tr><td>5</td><td>T (3 d intervals)</td><td>2007-03-04 00:03:41</td><td>135</td><td></td></tr><tr><td>6</td><td>Tdf (90 s intervals)</td><td>2008-04-11 20:41:11</td><td>135</td><td></td></tr><tr><td>7</td><td>Tdf (12 min intervals)</td><td>2008-04-10 21:03:41</td><td>135</td><td></td></tr><tr><td>8</td><td>Tdf (2 h intervals)</td><td>2008-03-31 18:03:41</td><td>135</td><td></td></tr><tr><td>9</td><td>Tdf (12 h intervals)</td><td>2008-02-04 12:03:41</td><td>135</td><td></td></tr><tr><td>10</td><td>Tdf (3 d intervals)</td><td>2007-03-04 00:03:41</td><td>135</td><td></td></tr><tr><td>></td><td></td><td></td><td></td><td></td></tr></table>
<h1 id="play">PLAY</h1>
Use the PLAY command to output the selected file to the serial line. If the data logger module is installed, you can specify an interval to be outputted.
Data in the output is TAB delimited. This is compatible with most spreadsheet programs. Before giving the command, set the local date and time with TIME and DATE commands, if needed.
PLAY [x] [start_date start_time end_date end_time]
where
```txt
x = Number of the data file that will be outputted, range 0...18. The numbers correspond to the output of the DIR command; refer to the example on page 112. Selecting number 0 will output all data files.
start_date = Starting date of the interval to be outputted. Must be given in the following format: yyyy-mm-dd
start_time = Starting time of the interval to be outputted. Must be given in the following format: hh:mm:ss
end_date = Ending date of the interval to be outputted. Must be given in the following format: yyyy-mm-dd
end_time = Ending time of the interval to be outputted. Must be given in the following format: hh:mm:ss
Example:
>play 7 2007-05-05 00:00:00 2007-05-06 00:00:00
Tdf (12 min intervals) 2007-05-05 00:00:00 121
Date Time trend min max
yyyy-mm-dd hh:mm:ss 'C 'C 'C
2007-05-05 00:00:00 -22.60 -22.63 -22.57
2007-05-05 00:12:00 -22.55 -22.58 -22.53
2007-05-05 00:24:00 -22.50 -22.53 -22.45
2007-05-05 00:36:00 -22.43 -22.45 -22.41
2007-05-05 00:48:00 -22.35 -22.41 -22.32
2007-05-05 01:00:00 -22.31 -22.33 -22.29
.
NOTE
Output of large amounts of recorded data can result in huge data files and take a long time, up to several days for the entire memory of the data logger. To make it easier to process the data it is recommended to select the largest suitable data interval, and to specify the start and end times carefully.
Deleting the Recorded Files
You can delete the recorded data files using the keypad/display, or the DELETE command on the serial line. The deletion is always done for all data; you cannot delete individual files.
Note that the transmitter automatically overwrites the old data when the memory is full, so manual deletion of the recorded files is not necessary in normal use.
To delete the data files using the keypad/display:
- Press any of the arrow buttons to open the MAIN MENU.
- Select System by pressing the arrow button.
- Select Clear graph memories by pressing the CLEAR button. Press the YES button to confirm the selection.
CAUTION
This function clears the entire data history of the transmitter, including all graphs and the content of the optional data logger module.
UNDELETE
Similarly to the DELETE command, the UNDELETE command is used without any arguments. It will recover all deleted data that has not been overwritten yet.
Analog Output Settings
The analog outputs are set in the factory according to the order form. In case you want to change the settings, follow these instructions. See section Third Analog Output on page 59.
Changing the Output Mode and Range
Both output channels have their own dip switch module with 8 switches, see the position in Figure 2 on page 22 (dip switches for analog output settings).
- Select the current/voltage output, switch ON either of the switches, 1 or 2.
- Select the range, switch ON one of the switches from 3 to 7.
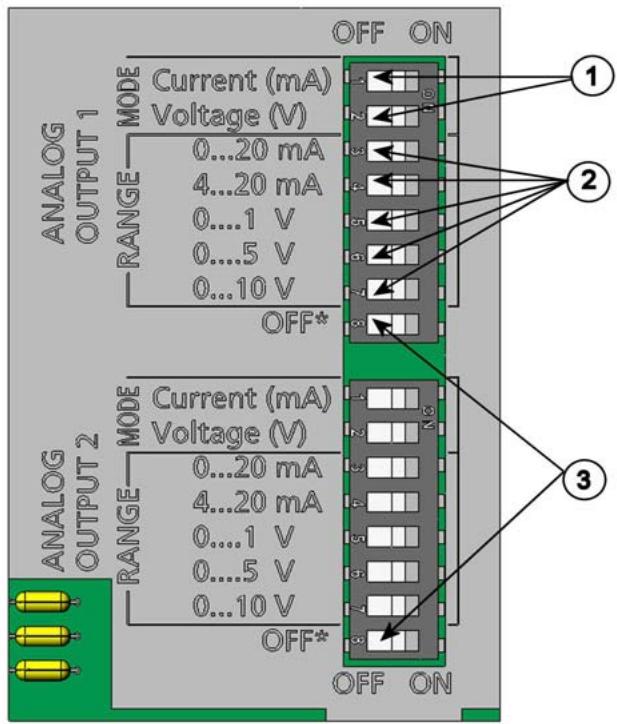
0503-045
Figure 66 Current/Voltage Switches of Output Modules
Numbers refer to Figure 66 above:
1 = Current/voltage selection output switches (from 1 to 2)
2 = Current/voltage range selection switches (from 3 to 7) in analog output 1 and 2.
3 = Switches for service use only. Keep in OFF position always.
NOTE
Only one of the switches, 1 or 2, must be ON at a time.
Only one of the switches, 3 to 7, must be ON at a time.
Example: 0 5V voltage output selected for channel 1 and 4 20mA selected for channel 2.
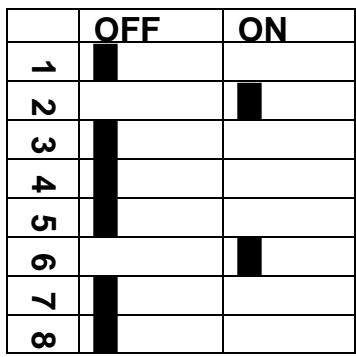
Selection
Voltage output selected
0 ... 5 V selected

Current output selected
4 ... 20mA selected
NOTE
If you have customized the error output setting (AERR), check that the set error values are still valid after changing the output mode/range, see section Analog Output Fault Indication Setting on page 119.
Analog Output Quantities
Use the display/Keypad to change and scale the analog output quantities.
- Press any of the arrow buttons to open the MAIN MENU.
- Select Interfaces by pressing the arrow button.
- Select Analog outputs by pressing the arrow button.
- Select Output 1/2/3 by pressing the arrow button.
- Select Quantity by pressing the arrow buttons. Confirm your selection by pressing CHANGE.
- Select the quantity by using the arrow buttons. Press SELECT to confirm your selection.
-
Select Scale, lower limit, by pressing the arrow buttons. Press SET to confirm your selection. Press OK to confirm your setting.
-
Select the upper limit by pressing the arrow buttons. Use the arrow buttons to set the upper limit value. Press SET to confirm your selection. Press OK to confirm your setting.
- Press EXIT to return to the basic display.
AMODE/ASEL
Use the serial line to select and scale the analog output quantities. Connect the transmitter to the PC. Open the terminal connection between your PC and the transmitter.
- Check the analog outputs with the AMODE command.
Example:
>amode Ch1 output :0...1V Ch2 output :0...1V >
- Select and scale the quantities for the analog outputs with the command ASEL [xxx yyy zzz]. Note that the optional quantities can be selected only if they have been selected when ordering the device.
where
Quantity of channel 1
Quantity of channel 2
zzz = Quantity of the optional analog output channel 3
Always enter all the quantities for all outputs. For quantities and their abbreviations see Table 3 on page 19.
Use the command ASEL [xxx yyy] as shown in the example below when using a device with two analog outputs.
Example:
>asel td t
Ch1 Td low : -20.00 'C ?
Ch1 Td high : 100.00 'C ?
Ch2 T low : -40.00 'C ?
Ch2 T high : 180.00 'C ?
>
Analog Output Tests
Use the display/Keypad for testing to test the operation of the analog by forcing the outputs to known values. Measure then the values with a current/voltage meter.
Use the display/keyboard for testing.
- Press any of the arrow buttons to open the MAIN MENU.
- Select System by pressing the arrow button.
- Select Diagnostics by pressing the arrow button.
- Select Analog output tests by pressing the arrow button.
- Select one of the testing options Force 0 % / 50% / 100% of scale. Press TEST to confirm your selection. All outputs are tested simultaneously. The actual output value depends on the selected range.
- Press OK to stop testing. Press EXIT to return to the basic display.
ITEST
Use the serial line to test the operation of the analog outputs. Use the command ITEST [aa.aaa bb.bbb] to force the analog outputs to entered values. The set values remain valid until you enter the command ITEST without parameters or RESET the transmitter.
I TEST [aa.aaa bb.bbb]
where
aaaaa = Current or voltage value to be set for channel 1 (mA or V)
bb.bbb = Current or voltage value to be set for channel 2 (mA or V)
Example:
| >itest 20 5 | ||||
| Ch1 (Td) | : | * | 20.000 mA | H'672A |
| Ch2 (T) | : | * | 5.000 mA | H'34F9 |
| >itest | ||||
| Ch1 (Td) | : | -23.204 'C | 16.238 mA | H'FFFE |
| Ch2 (T) | : | 22.889 'C | 8.573 mA | H'5950 |
| > | ||||
Analog Output Fault Indication Setting
Factory default state for analog outputs during error condition is 0V/ 0mA. Please be careful when selecting the new error value. The error state of the transmitter should not cause unexpected problems in process monitoring.
Use the display/Keypad to set the analog output fault indication.
- Press any of the arrow buttons to open the MAIN MENU.
- Select Interfaces by pressing the arrow button.
- Select Analog Outputs by pressing the arrow button.
- Select Output 1/2/3 by pressing the arrow button.
- Select Fault indication. Press SET to confirm your selection. Enter the fault indication value by using the arrow buttons. Press OK to confirm your setting. This value is outputted if a transmitter error occurs.
- Press EXIT to return to the basic display.
AERR
Use the serial line AERR command to change the error output.
AERR
Example:
>aerr Ch1 error out : 0.000V ? 5.0 Ch2 error out : 0.000V ? 5.0 >
NOTE
The error output value must be within a valid range for the output type.
NOTE
The error output value is displayed only when there are minor electrical faults such as a humidity sensor damage. When there is a severe device malfunction, the error output value is not necessarily shown.
Operation of Relays
Quantity for Relay Output
A relay monitors the quantity chosen for the relay output. Any of the quantities available can be chosen.
Measurement-Based Relay Output Modes
Relay Setpoints
When the measured value is in between the "above" and "below" values, the relay is passive. When choosing lower value as "above" value and higher value as "below" value, the relay is passive when the measured value is not between the setpoints. You can also set only one setpoint. See Figure 67 below for illustrative examples of the different measurement-based relay output modes.

Mode 1: Only "above" setpoint set
Relay is active when value is above the setpoint.

Mode 2:Only "below" setpoint set
Relay is active when value is below the setpoint.
Legend
A "Active above" setpoint value
B "Active below" setpoint value
h Hysteresis value
Relay is active (NO-C connected)
Relay is released
Relay is activated
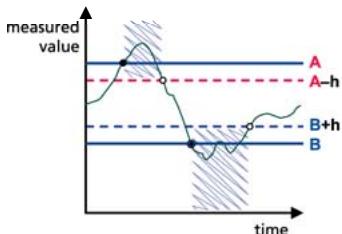
Mode 3: Both setpoints set, "above" > "below"
Relay is active when value is outside the setpoints.
Mode 4: Both setpoints set, "above" < "below"

Figure 67 Measurement-Based Relay Output Modes
Relay is released when value is outside the setpoints.
0610-076
Mode 4 is usually used if an alarm needs to be triggered when the measured value exceeds a safe range. The relay is active when measurement is in range, and is released if the value goes out of range or the measurement fails.
NOTE
If the measurement of the selected quantity fails or the transmitter loses its power, the relay is released.
Hysteresis
Hysteresis function is to prevent the relay switching back and forth when measured value is near to the setpoint values.
Relay is activated when the measured value passes the exact value of the setpoint. When returning and passing the setpoint again relay is released only until the value reaches the setpoint increased/decreased by the hysteresis value.
Hysteresis should be smaller than difference of the setpoints.
Example: When the 'active above' value is -30^ and the hysteresis value is 2^ , relay activates when the dewpoint reaches -30^ . As the dewpoint then decreases, relay releases at -32^ .
>rsel tdf t
Rel1 Tdf above: -? -30
Rel1 Tdf below: -30.00 'C ? -
Rel1 Tdf hyst : 5.00 'C ? 2
Rel1 Tdf enabl: ON ?
Rel2 T above: 30.00 'C ?
Rel2 T below: 20.00 'C ?
Rel2 T hyst : 1.00 'C ?
Rel2 T enabl: ON ?
>
NOTE
If both setpoints are specified and "above" setpoint is lower than "below" setpoint, the hysteresis works in the opposite direction, that is, relay is released when the measured value passes the exact value of the setpoint.
Relay Indicating Transmitter Error Status
You can set a relay to follow the operation status of the device. By selecting FAULT/ONLINE STATUS for output quantity a relay changes state on the basis of the operation status as follows:
FAULT STATUS
Normal operation: relay active (C and NO outputs are closed)
Not measuring state (error state or power off): relay released (C and NC outputs are closed)
ONLINE STATUS
Live measurement (data available): relay active (C and NO outputs are closed)
No live data (for example: error state, chemical purge or adjustment mode): relay released (C and NC outputs are closed)
See Figure 68 on page 123 for illustrative examples of the FAULT/ONLINE STATUSrelay output modes.
Analog output vs. "FAULT STATUS" relay
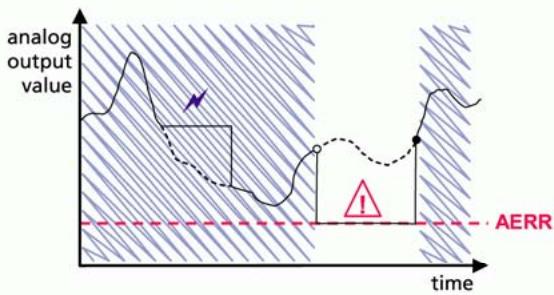
Relay is released in case of a measurement failure only.

Legend
Analog output vs. "ONLINE STATUS" relay
Figure 68 FAULT/ONLINE STATUS Relay Output Modes
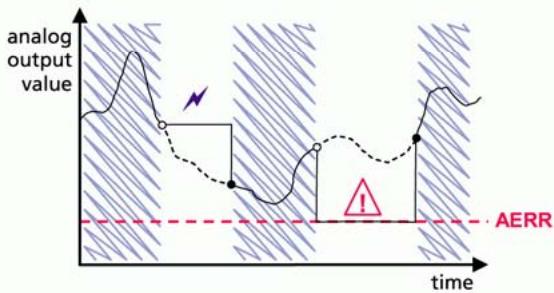
Relay is released when the output values are frozen, the adjustment mode is activated, or an instrument failure is detected
0610-077
FAULT/ONLINE STATUS relays are usually used in conjunction with an analog output to obtain validity information for the output value.
NOTE
If transmitter loses its power, all status-based relays are released similarly to the case of an instrument failure.
Enabling/Disabling the Relays
You can deactivate the relay outputs for example for service purposes of your system.
Operation of the Indication LEDs
Relay is activated: LED is lit.
Relay is not activated: LED is not lit.
Setting the Relay Outputs
NOTE
When having only one relay module installed, its relays are called 'relay 1' and 'relay 2'.
When having two relay modules, the relays of the module connected to slot MODULE 1 (communications) are called 'relay 1' and relay 2' and relays connected to slot MODULE 2 are called 'relay 3' and 'relay 4'
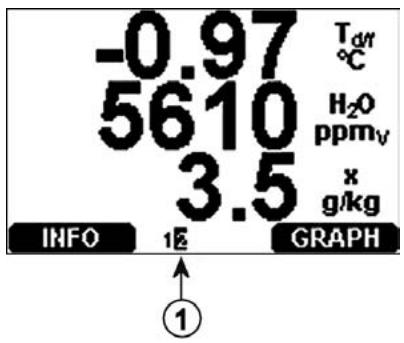
0706-013
Figure 69 Relay Availability
Number refers to Figure 69 above:
1 = Lists enabled relays. Activation state shown in black. Disabled relays are not shown.
Use the display/Keypad to set the relay outputs.
- Press any of the arrow buttons to open the MAIN MENU.
- Select Interfaces, confirm by pressing the arrow button.
- Select Relay outputs, confirm by pressing the arrow button.
- Select Relay 1/2/3/4, confirm by pressing the arrow button.
- Select the Quantity, confirm by pressing Change. Select the Quantity by using the arrow buttons. Confirm your selection by pressing Select. (Press Fault Status when the relay follows the transmitter error.) Press Change to set the value.
- Select Act. above / Act. below. Press SET to confirm your selection. If asked, select MODIFY if you want to set the setpoint
by using the arrow buttons. Select REMOVE if you want to remove the setpoint.
- Select Hysteresis Press SET. Set the hysteresis by using the arrow buttons. Press OK.
- Select Relay enable, press ON/OFF to enable/disable the relay.
RSEL
Use the serial line to select the quantity, setpoints and hysteresis or enable/disable the relay outputs. Enter the RSEL command.
RSEL [q1 q2 q3 q4]
where
q1 = quantity for the relay 1 or Fault/Online
q2 = quantity for the relay 2 or Fault/Online
q3 = quantity for the relay 3 or Fault/Online
q4 quantity for the relay 4 or Fault/Online
Factory setting: all relays disabled.
Use the quantity abbreviations presented above. See Table 3 on page 19 and Table 4 on page 20.
Example of window limit switch (upper and lower setpoints for control parameter): Selecting relay 1 to follow dewpoint/frost point temperature measurement and relay 2 to follow temperature measurement. Two relay setpoints are set for both relays.
>rsel tdf t
Rel1 Tdf above: - ? -10
Rel1 Tdf below: - ? -30
Rel1 Tdf hyst : 0.00 'C ? 5
Rel1 Tdf enabl: OFF ? on
Rel2 T above: - ? 30
Rel2 T below: - ? 20
Rel2 T hyst : 0.00 'C ? 1
Rel2 T enabl: OFF ? on
>
Example of normal limit switch (one setpoint for relay activation/deactivation): Selecting relay 1 to follow relative humidity, relay 2 to follow temperature, relay 3 to follow dewpoint and relay 4 to follow dewpoint. One setpoint is chosen for all the outputs.
>rsel rh t td td
Rel1 RH above: 60.00 %RH ? 70
Rel1 RH below: 70.00 %RH ? -
Rel1 RH hyst : 2.00 %RH ? 2
Rel1 RH enabl: ON ? on
Rel2 T above: 50.00 'C ? 60
Rel2 T below: 40.00 'C ? -
Rel2 T hyst : 2.00 'C ? 2
Rel2 T enabl: ON ? on
Rel3 Td above: 5.00 'C ? 10
Rel3 Td below: 0.00 'C ? -
Rel3 Td hyst : 1.00 'C ? 1
Rel3 Td enabl: OFF ? on
Rel4 Td above: 0.00 'C ? 20
Rel4 Td below: 0.00 'C ? -
Rel4 Td hyst : 0.00 'C ? 2
Rel4 Td enabl: OFF ? on
>
Example of using relay 1 as fault alarm: selecting relay 1 to follow the fault status and relay 2 to follow the temperature measurement.
>rsel fault t
Rel1 FAUL above: -
Rel1 FAUL below: -
Rel1 FAUL hyst : -
Rel1 FAUL enabl: ON ?
Rel2 T above: 0.00 'C ? 30
Rel2 T below: 0.00 'C ? -
Rel2 T hyst : 0.00 'C ? 2
Rel2 T enabl: OFF ? ON
Testing the Operation of Relays
Testing activates relays even if they are disabled.
Use the module push buttons to activate the relays. Press the REL 1 or REL 2 button to activate the corresponding relay.
Use the display/keyboardpad to test the operation of relays.
- Open the MAIN MENU by pressing any of the arrow buttons.
- Select System, press the arrow button.
- Select Diagnostics, press the arrow button.
-
Select Relay tests, press the arrow button.
-
Select Invert relay 1... , press TEST. Now the selected relay output is forced to opposite state. Press OK to return to normal operation.
- Press EXIT to return to the basic display.
RTEST
Use the serial line command RTEST [ON/OFF ON/OFF] to test the operation of the relays.
Example: Testing all four relays.
> rtest on on on on ON ON ON ON
>
> rtest off off off off OFF OFF OFF
Enter the command RTEST to stop testing.
Operation of the RS-485 Module
RS-485 interface enables communication between RS-485 network and DMT340 transmitter. The RS-485 interface is isolated and offers a maximum communications rate of 115 200 bits/s. (For maximum bus length of 1km , use bit rate 19200b / s or less.)
When selecting an RS-232-RS-485 converters for the network, avoid self powered converters as they don't necessarily support the needed power consumption.
Echo function shall be always disabled (OFF) when using the 2-wire connection. When using the 4-wire connection you can disable/enable the echo setting.
NOTE
User port on DMT340 main board cannot be used and connected when RS-485 module is connected. Service port is operating normally.
Networking Commands
Set the RS-422/485 interface by using the following commands. The other serial line commands are presented in section List of Serial Commands on page 94.
RS-485 configuration commands SERI; ECHO; SMODE; INTV and ADDR may be entered by using either the service port or RS-422/485 port. Also the optional display/Keypad can be used, see section Display/Keypad on page 71.
SDELAY
With the SDELAY command you can set delay (response time) for user port (RS232 or RS485), or view currently set delay value. Value corresponds to tens of milliseconds (e.g. 5 = 0.050 s minimum answer delay). The value can be set between 0...254.
Example:
> delay
Serial delay : 0 ? 10
> delay
Serial delay : 10 ?
SERI
Use the SERI [b p d s] command to input RS-485 bus settings. where
$$ \begin{array}{r c l} b & = & \text {b a u d r a t e (3 0 0 , 6 0 0 , 1 2 0 0 , 2 4 0 0 , 4 8 0 0 , 9 6 0 0 , 1 9 2 0 0 , 3 8 4 0 0 ,} \ & & \text {5 7 6 0 0 , 1 1 5 2 0 0)} \end{array} $$
p = parity (n = none,e = even,o = odd) d = data bits (7 or 8) s = stop bits (1 or 2)
ECHO
Use the ECHO [x] command to enable/disable echo of characters received over the serial line.
where
$$ x = \text {O N / O F F} (\text {d e f a u l t} = \text {O F F}) $$
When using 2-wire connection, echo must be always disabled.
SMODE
Use the SMODE [xxxx] command to set the serial interface mode.
where
$$ x x x x = \text {S T O P , R U N o r P O L L} $$
where
In STOP mode: measurements output only by command, all commands can be used
In RUN mode: outputting automatically, only command S can be used to stop, see command INTV below.
In POLL mode: measurements output only with command SEND. See command ADDR below.
When several transmitters are connected to the same line, each transmitter must be entered an own address in the initial configuration, and POLL mode must be used.
INTV
Use the INTV [n xxx] command to set the RUN mode output interval.
where
$$ \begin{array}{l} n = 1 - 2 5 5 \ x x x = \mathrm {S}, \text {M I N o r H} \ \end{array} $$
Sets the RUN mode output interval. The time interval is used only when the RUN mode is active. For example, the output interval is set to 10 minutes.
>INTV 10 min
Output intrv. : 10 min >
Setting RUN output interval to zero enables the fastest possible output rate.
ADDR
Addresses are required only for POLL mode (see serial line command SMODE on page 105). Use the ADDR [aa] command to input the RS-485 transmitter address.
where
$$ a a = \text {a d d r e s} (0 \dots 9 9) (\text {d e f a u l t} = 0) $$
Example: the transmitter is entered the address 99.
>ADDR <cr> Address : 2 ? 99
OPEN [nn]
When all transmitters on the RS-485 bus are in POLL mode the OPEN [nn] command sets one transmitter temporarily to STOP mode so that other commands can be entered.
where
nn = address of the transmitter (0 ... 99)
CLOSE
The CLOSE command switches the transmitter back to the POLL mode.
Example:
>OPEN 2 (opens the line to transmitter 2, other transmitters stay in POLL mode)
>CRH(for example, calibration performed)
...
>CLOSE (line closed)
Sensor Functions
AutoCal
To obtain the best possible accuracy in measurements taken in dry environments, DMT340 has a built-in AutoCal. During the AutoCal, DMT340 adjusts the dry-end reading to correspond to the calibrated values. This is a unique and patented method to avoid errors in accuracy when monitoring low dewpoints.
The AutoCal is carried out if the following criteria for the measurement environment are fulfilled:
- Relative humidity must be < 2% (DMT340 M-sensor).
- Temperature must be 0 < T < 80^ (or sensor warming activated for -40 < T < 80^ ).
- Humidity environment must be stable. The maximum change in the dewpoint can be 2^ in 15 seconds.
NOTE
AutoCal cannot operate if the above conditions are not fulfilled.
If the adjustment in the AutoCal reaches a preset maximum value or if the AutoCal correction fails, for example, because of unstable conditions, a new AutoCal will take place later (if the automatic AutoCal is turned on).
Automatic AutoCal
As a default, the automatic AutoCal in DMT340 is turned on. In this mode, the calibration takes place automatically if the dewpoint or temperature changes significantly, typically more than 10^ . However, if there are no changes in the conditions, the AutoCal will take place repeatedly after one hour from the last AutoCal.
Manual AutoCal
To check that AutoCal has taken place for obtaining the most accurate measurement in a very dry environment, you can perform Autocal manually before measuring as follows:
- Open the MAIN MENU by pressing any of the arrow buttons.
- Select Measuring, press the arrow button.
- Select Manual AutoCal, press the arrow button.
- Press START to start AutoCal. If the AutoCal conditions are not fulfilled, a note appears on the display informing that the calibration cannot be made.
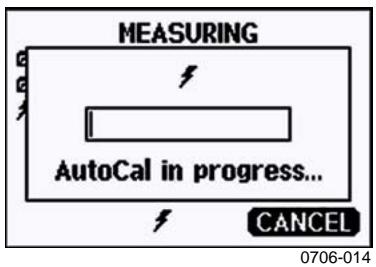
Figure 70 Following AutoCal on the Display
- Press EXIT to return to the basic display.
You can also perform Autocal manually by using the pressure set and check buttons on the motherboard. By pressing both buttons simultaneously, Autocal is performed, see Figure 64 on page 102.
Sensor Purge
Sensor Purge is a feature available for the DMT340 M-sensor. The Purge should be carried out to achieve the shortest response times and the best long-term stability.
Sensor Purge is an automatic procedure, in which the sensor is dried. Thus, the sensor will response very fast when installing the probe from an ambient to a dry gas. This will also ensure together with AutoCal the best measurement accuracy and long-term stability.
As a default, the interval Purge and power-up Purge are turned on automatically in DMT340. It is recommended not to turn them off. The automatic sensor Purge can also be started manually. If enabled, power-up Purge will start always about 10 seconds after reset. If the power is continuously turned on in DMT340, the automatic sensor Purge will be performed at an interval of 24 hours.
Manual Sensor Purge
The Purge should be performed always before calibration (see the calibration instructions) or when there is a reason to believe that a sensor has become exposed to an interfering chemical.
- Open the MAIN MENU by pressing any of the arrow buttons.
- Select Measuring, press the arrow button.
- Select Purge, press the arrow button.
- Select Manual Purge using the arrow buttons.


Figure 71 Performing Manual Purge
- Press START to start manual Purge. Press CANCEL to interrupt the manual sensor Purge.
- Press EXIT to return to the basic display.
Interval Purge
When the DMT340 leaves the factory the interval Purge takes place repeatedly with the time intervals set in the factory. The user can change the interval in which the purge takes place by using serial commands or with the optional display/Keypad. This can be needed if the measuring environment contains high concentrations of interfering chemicals.
Power-up Purge
Purge can be set to start within 10 seconds from the power-up of the device. This function can be enabled by using the serial line or the display/Keypad.
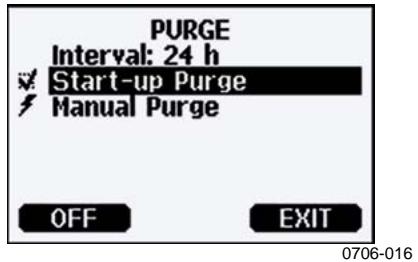
Figure 72 Activating Start-up Purge
- Press ON to activate Start-up Purge. Pressing OFF disables the function.
- Press EXIT to return to the basic display.
PUR
With the PUR command you can enable or disable interval and power-up Purge and set the interval for interval purge. The default purge interval is 24 hours.
It is not recommended to change these settings.
Type PUR and press ENTER to proceed.
Example:
>pur
Interval Purge : OFF ?
Interval : 1440 min ?
Power-up Purge : OFF ?
Duration : 60 s ?
Settling : 240 s ?
Temperature : 180 'C ?
Temp. diff. : 0.5 'C ?
Trigger Purge : OFF ?
RH trigger : 0 %RH ?
NOTE
When Purge in power up is enabled, wait about 5min after power up before taking measurements. The output channels are locked for the first operation minutes to the initial measured values.
PURGE
Use the command PURGE to start the manual Purge. Enter PURGE to start Purge immediately.
Example:
purge
Purge started, press any key to abort.
The prompt '> appears when the heating period is over. However, the transmitter outputs are locked to values measured before purge until the settling time is over.
Sensor Warming
DMT340 contains a sensor warming function, that is, when humidity reaches a set limit (default: 70% RH ), sensor warming operation is activated automatically. Sensor warming continues as long as the humidity is above that limit.
When the warming starts, the sensor operation indicator is displayed on the optional display and relays configured as "online status" (if any) will be released. Warming does not affect T_d / f,T_d / f atm,T_d,T_d atm,x , H2O and Pw quantities, all others will be frozen.
CHAPTER 5
MAINTENANCE
Periodic Maintenance
Cleaning
Clean the transmitter enclosure with a soft, lint-free cloth moistened with mild detergent.
Changing the Probe Filter
- Turn the filter counter-clockwise to loosen it.
- Remove the filter from the probe. Be careful not to touch the sensor with the filter. Without the filter in place, the sensor is easily damaged – handle the probe carefully.
- Install a new filter on the probe. When using the stainless steel filter, take care to tighten the filter properly (recommended force 5Nm ).
New filters can be ordered from Vaisala, see Available Options and Accessories Table 32 on page 158.
Calibration and Adjustment
The DMT340 is fully calibrated and adjusted as shipped from factory. Typical calibration interval is two years. Depending on the application it may be good to make more frequent checks. Calibration must be done always when there is a reason to believe that the device is not within the accuracy specifications.
It is recommended that calibration and adjustment should be carried out in Vaisala Service Centers (contact information on page 139).
Error States
In error state the quantity is not measured and the output is shown as follows:
- analog channel outputs 0mA or 0V (you can use the serial line command AERR or display/Keypad to change this fault indication value, see section Analog Output Fault Indication Setting on page 119)
- the serial port outputs stars (^***)
- the cover LED is blinking
-
optional display: error indicator is lit.
-
The error indicator disappears when the error state is over and you have checked the error message. Press the INFO button to display the error message.


Figure 73 Error Indicator and Error Message
Number refers to Figure 73 above:
1 = Error Indicator
You can also check the error message via the serial interface by using the command ERRs. In case of constant error, please contact the Vaisala Service Centers (contact information on page 139).
Table 30 Error Messages
| Error Code | Error Message | Action |
| 0 | Humidity sensor measurement malfunction. | Check the integrity of the humidity probe and the probe cable. Clean the probe from dirt, water, ice or other contaminants. |
| 1 | Humidity sensor short circuit | Check the integrity of the humidity probe and the probe cable. Clean the probe from dirt, water, ice or other contaminants. |
| 2 | Humidity sensor open circuit | Check the integrity of the humidity probe and the probe cable. |
| 3 | Temperature sensor open circuit. | Check the integrity of the humidity probe and the probe cable. |
| 4 | Temperature sensor short circuit. | Check the integrity of the humidity probe and the probe cable. Clean the probe from dirt water, ice or other contaminants. |
| 5 | Temperature measurement malfunction | Check the integrity of the humidity probe and the probe cable. Clean the probe from dirt water, ice or other contaminants. |
| 6 | Temperature sensor current leak. | Check the integrity of the humidity probe and the probe cables. Clean the probes from dirt, water, ice or other contaminants. |
| 7 | Internal ADC read error | Internal transmitter failure. Remove the transmitter and return the faulty unit to Vaisala Service. |
| 9 | Checksum error in the internal configuration memory | Internal transmitter failure. Remove the transmitter and return the faulty unit to Vaisala Service. |
| 10 | Internal EEPROM read error | Internal transmitter failure. Remove the transmitter and return the faulty unit to Vaisala Service. |
| 11 | Internal EEPROM write error | Internal transmitter failure. Remove the transmitter and return the faulty unit to Vaisala Service. |
| 12 ... 13 | Add-on module 1 (or 2) connection failure | Turn off the power and check the module connection. Turn on the power. |
| 14 | Device internal temperature out of range | Ensure that the operating temperature is within the valid range. |
| 15 | Operating voltage out of range | Ensure that the operating voltage is within the valid range. |
| 18 | Internal ADC reference voltage out of range | Internal transmitter failure. Remove the transmitter and return the faulty unit to Vaisala Service. |
| 19 | Internal analog output reference voltage out of range | Internal transmitter failure. Remove the transmitter and return the faulty unit to Vaisala Service. |
| 20 ... 23 | Configuration switches for analog output 1/2/3 set incorrectly | Check and re-set the switches, see Analog Output Settings on page 114. |
| 24 ... 25 | EEPROM failure on add-on module 1 (or 2) | Disconnect the power and check the analog output module connection. |
| 26 | Communication module installed in incorrect add-on module slot | Disconnect the power and change the communication module to another module slot. |
| 28 ... 29 | Unknown/incompatible module installed in add-on module slot 1 (or 2) | Ensure that the module is compatible with the DMT340. |
| 30 | Internal analog voltage out of range | Internal transmitter failure. Remove the transmitter and return the faulty unit to Vaisala Service. |
| 31 | Internal system voltage out of range | Internal transmitter failure. Remove the transmitter and return the faulty unit to Vaisala Service. |
Technical Support
For technical questions, contact the Vaisala technical support:
E-mail helpdesk@vaisala.com
Fax +358989492790
Return Instructions
If the product needs repair, please follow the instructions below to speed up the process and to avoid extra costs to you.
- Read the section Warrantyon page 18.
- Contact a Vaisala Service Center or a local Vaisala representative. The latest contact information and instructions are available from www.vaisala.com. Addresses of the Service Centers are provided in section Vaisala Service Centers on page 139.
Please have the following information on hand:
- serial number of the unit
- date and place of purchase or last calibration
- description of the fault
- circumstances in which the fault occurs/occurred
-
name and contact information of a technically competent person who can provide further information on the problem
-
Pack the faulty product in a strong box of adequate size, with proper cushioning material to avoid damage.
- Include the information specified in step 2 in the box with the faulty product. Also include a detailed return address.
- Ship the box to the address specified by your Vaisala contact.
Vaisala Service Centers
Vaisala Service Centers perform calibrations and adjustments as well as repair and spare part services. See contact information below.
Vaisala Service Centers also offer accredited calibrations, maintenance contracts, and a calibration reminder program. Do not hesitate to contact them to get further information.
NORTH AMERICAN SERVICE CENTER
Vaisala Inc., 10-D Gill Street, Woburn, MA 01801-1068, USA.
Vaisala China Ltd., Floor 2 EAS Building, No. 21 Xiao Yun Road, Dongsanhuan Beilu,
Chaoyang District, Beijing, P.R. CHINA 100027.
Phone: +86 10 8526 1199, Fax: +86 10 8526 1155
E-mail: china.service@vaisala.com
www.vaisala.com
This page intentionally left blank.
CHAPTER 6
CALIBRATION AND ADJUSTMENT
Calibration
DMT340 is fully calibrated and adjusted as shipped from the factory. The typical calibration interval is two years. Calibration must always be done when there is reason to believe that the device is not within the accuracy specifications.
It is recommended that the device should be sent to Vaisala Service Centers for calibration and adjustment, see contact information on page 139.
(Vaisala hand-held dewpoint meter DM70 can also be used).
User Calibration and Adjustment
When adjusting DMT340, the reading is changed to correspond to the reference value. After the adjustment, the original calibration certificate shipped with the product is no longer valid.
NOTE
Dewpoint calibration should be carried out in Vaisala or in other laboratory conditions.
The reference condition of the dewpoint must be traceable to the appropriate standards. The user adjustment requires a stable humidity generator capable of producing the required humidities and a calibrated reference dewpoint meter. For adjustment, the probe and the reference dewpoint meter are connected to the humidity generator output, the reference condition is adjusted and let to stabilize. After the probe and the reference dewpoint meter are stabilized, the DMT340 reading is adjusted to correspond the reference value.
For the adjustment of DMT340 equipped with DRYCAP^® 180M-sensor, the reference low dewpoint temperature should be between -57^ and -67^ (-70.6 F ... -88.6 F) in the gas temperature of approx. +20 °C.
To ensure the correctness of the adjustment, the reference dewpoint meter must be calibrated at a recognized laboratory with a known uncertainty and traceability to national or international standards.
To see when the adjustment was made last, select Adjustment information (with keypad INFO button in the main view, or with serial commands ? and CDATE) or check the date from the Device information. See section Device Information on page 107.
Opening and Closing the Adjustment Mode
Open the transmitter cover. The buttons needed in the adjustment are on the left-hand side of the motherboard, see Figure 2 on page 22.
Press the ADJ button to enable the adjustment mode. The indicator led indicates the adjustment availability.
Table 31 Indicator Led Functions
| Indicator Led Function | Description |
| LED off | adjustment locked |
| LED on | adjustment available |
| LED blinking evenly | measurement not stabilized |
| LED blinking with short pulses | performing Purge/Autocal |
Press the ADJ key again to disable the adjustment mode.
NOTE
Fixed pressure compensation of 1013.25hPa is used when in adjustment mode. Adjustments should be performed at ambient pressures.
Adjustment Information
These data are shown on the device information. (see section Device Information on page 107. Use the display/Keypad to feed the adjustment information.
- If you are not in the adjustment menu, press the ADJ button on the motherboard to open the ADJUSTMENT MENU.
- Press the arrow button to select Adjustment info.
- Select Date, press SET. Enter the date by using the arrow buttons. Press OK.
- Select i, press CHANGE. Enter information text including 17 characters at maximum by using the arrow buttons. Press OK.
- Press EXIT to return to the basic display.
CTEXT and CDATE
Use the serial line command CTEXT to enter text in to the adjustment information field. First press the adjustment button on the motherboard inside the transmitter.
Example:
>ctext
Adjust. info : (not set) ? -60°C IKØ >
Use the command CDATE to input date to the adjustment information field. Set the adjustment date in format YYYY-MM-DD.
Example:
>cdate
Adjust. date : (not set) ? 2004-05-21
Press the adjustment button on the motherboard inside the transmitter to disable the adjustment function.
Adjusting Dewpoint T_d / f
Before adjusting dewpoint, first carry out the two-point relative humidity adjustment, which will ensure the basic adjustment level. After that, continue with the actual T_d / f adjustment.
Two-point Relative Humidity Adjustment using Display/Keypad
For DMT340 M-sensor, the humidity references of 0% (for example Nitrogen) and 10 20% are required.
NOTE
For the DMT340 M-sensor both reference humidities must be below 20% RH.
To make the adjustment, follow the instructions below. Use preferably the display keypad and let the display information guide you through the two-point RH adjustment process.
- Press the Adjustment button ADJ on the motherboard inside the transmitter to enable adjustments.
- Select Adjust Td measurement, press the arrow button.
- Select 2-point RH adjustment, press Start. Press OK to perform purge of point 1.


0706-018
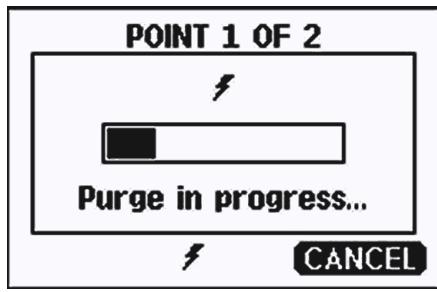
Figure 74 Starting the Adjustment

Figure 75 Performing Purge
- Press GRAPH to follow the RH and T stabilization on graphical display:


Figure 76 Following the RH Trend on Graphical Display
- Follow the instructions on the display. Use the arrow buttons to enter the actual humidity of the reference used.
Figure 77 Ending Adjustment of Point 1
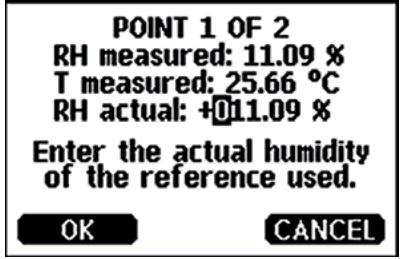
0706-021
- Continue adjustment of point 2 as instructed by the display:
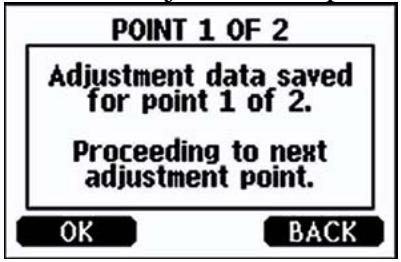

Figure 78 Proceeding to Adjustment of Point 2
- Follow the purge progress and wait for stabilization of Point 2 as in Figure 75 on page 144. Press READY when stabilized.
- Use the arrow buttons to enter the actual humidity of the reference used. Follow the instructions on the display to complete the RH adjustment.

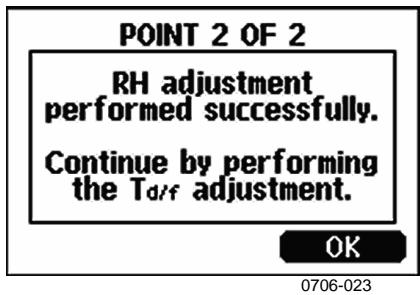
Figure 79 Completing Adjustment of Point 2
Two-point Relative Humidity Adjustment Using Serial Line
Perform purge before adjustment. Use the PURGE command. See section PURGE on page 133.
Then press adjustment button on the motherboard inside the transmitter to enable adjustments
Perform adjustment with the FCRH command. Wait at least 1 hour before adjusting each point.
FCRH
Example:
> fcrh
RH : 3.90 Ref1 ? 0
Press any key when ready ...
RH : 3.90 Ref2 ? 15
OK
>
One-point Dewpoint Adjustment Using Display/Keypad
Before proceeding with the T_d / f adjustment you must perform the RH adjustment. For DMT340 M-sensor, the reference temperature of the dewpoint should be -57^ ... -67^ (-70.6 F ... -88.6 F).
Use preferably the display/Keypad to perform one-point dewpoint T_d / f adjustment. To adjust the dewpoint, follow the instructions below:
- Press the ADJ button on the motherboard to open the ADJUSTMENT MENU.
- Press the arrow button to select Adjust T_d measurement.
- Select by pressing 1-point T_d adjustment. Press START to start adjusting.
- Leave the sensor to stabilize for at least 5 hours. Follow the instructions on the display.

Figure 80 Following Stabilization
- Purge will be performed next. Follow the purge progress on the display.
- Let the sensor stabilize for at least 1 hour after the purge before proceeding with the adjustment. Press READY when stabilized.

Figure 81 Proceeding with T_d / f Adjustment
- Enter the actual reference frostpoint temperature.
- The transmitter performs T_d / f adjustment. This may take up to one minute.

Figure 82 Completing T_d / f Adjustment
- After adjustment wait for sensor to cool down which will take 2 minutes at the maximum. The adjustment is now completed.
NOTE
Several AutoCals can be necessary after this adjustment has been performed until the transmitter reaches full accuracy.
One-point Dewpoint Adjustment Using Serial Line
- Let the sensor stabilize for at least 5 hours.
- Use the command PURGE to start the manual Purge. See section PURGE on page 133.
- Wait at least 1 hour. Then press adjustment button on the motherboard inside the transmitter to enable adjustments.
- Use the IKO command to perform the adjustment. IKO
Example:
>ik0
Tf : -19.74 'C Ref ? -60
Wait for AutoCal data...OK
- Press the adjustment button on the motherboard inside the transmitter to disable adjustments.
NOTE
Several AutoCals can be necessary after this adjustment has been performed until the transmitter reaches full accuracy.
Adjusting Temperature
Adjusting Temperature Using Display/Keypad
Use preferably the display/Keypad to adjust the temperature.
- Press the ADJ button on the motherboard to open the ADJUSTMENT MENU
- Press the arrow button to select Adjust T measurement.
- Select by pressing 1-point or 2-point adjustment. Press START to start adjusting.
- Remove the filter from the probe and insert the probe into a reference temperature.
- Wait at least 30 minutes for the sensor to stabilize. Follow the stabilization from the GRAPH display.
- Press READY when stabilized. Enter the reference temperature by using the arrow buttons.
When carrying out the 2-point adjustment proceed to the next adjustment point and carry out the procedure as described in the previous item. Note that the difference between the two temperature references must be at least 30^ .
- Press OK. Press YES to confirm the adjustment.
- Press OK to return to the adjustment menu
- Press EXIT to return to the basic display.
Adjusting Temperature Using Serial Line
CT
Use the serial line command CT to adjust the temperature.
- Press the ADJ button on the motherboard to open the adjustment mode.
- Remove the probe filter and insert the probe into the reference temperature.
- Use the command CT and press ENTER.
Type C and press ENTER to check if the reading is stabilized
4. Let the reading stabilize, enter the reference temperature after the question mark and press ENTER three times.
When having another reference temperature (2-point calibration) press ENTER twice and insert the probe to the second reference. When the reading is stabilized, enter the second reference temperature after the question mark and press ENTER. Please, note that the difference between the two temperature references must be at least 30^ .
Example (1-point adjustment):
OK indicates that the calibration has succeeded.
- Press the ADJ button on the motherboard to close the adjustment mode.
- Take the probe out of the reference conditions and replace the filter.
Adjusting Analog Outputs
In the analog output calibration the analog output is forced to the following values:
current output = 2mA and 18mA
voltage output = 10% and 90% of the range
Connect DMT340 to a calibrated current/voltage meter in order to measure either current or voltage depending on the selected output type. Use the display/Keypad or the serial line to do this.
Adjusting Analog Outputs using Display/Keypad
- Press the ADJ button on the motherboard to open the ADJUSTMENT MENU.
- Press the arrow button to select Adjust analog outputs.
- Select the output to be adjusted Adjust analog output 1/2/3, press START.
- Measure the first analog output value with a multimeter. Enter the measured value by using the arrow buttons. Press OK.
- Measure the second analog output value with a multimeter. Enter the measured value by using the arrow buttons. Press OK.
- Press OK to return to the adjustment menu.
- Press EXIT to close the adjustment and to return to the basic display.
Adjusting Analog Outputs using Serial Line
ACAL
Use the serial line to perform the analog output adjustment. Use the ACAL command and enter the multimeter reading.
Example (current outputs):
| >ACAL | |||
| Ch1 | I1 | (mA) ? | 2.046 |
| Ch1 | I2 | (mA) ? | 18.087 |
| Ch2 | I1 | (mA) ? | 2.036 |
| Ch2 | I2 | (mA) ? | 18.071 |
| > | |||
Press the adjustment button on the motherboard inside the transmitter again to disable the adjustment function.
CHAPTER 7
TECHNICAL DATA
Specifications
Performance
Measured variables
Dewpoint
Sensor Vaisala DRYCAP®180M
Measurement range -70 ... +80 °C (-94 ... +176 °F) Td For continuous use -70 ... +45 °C (-94 ... +113 °F) Td
Accuracy
up to 20 bar / 290 psia see the accuracy graph
20 ... 50 bar / 290 ... 725 psia +1 °C Td
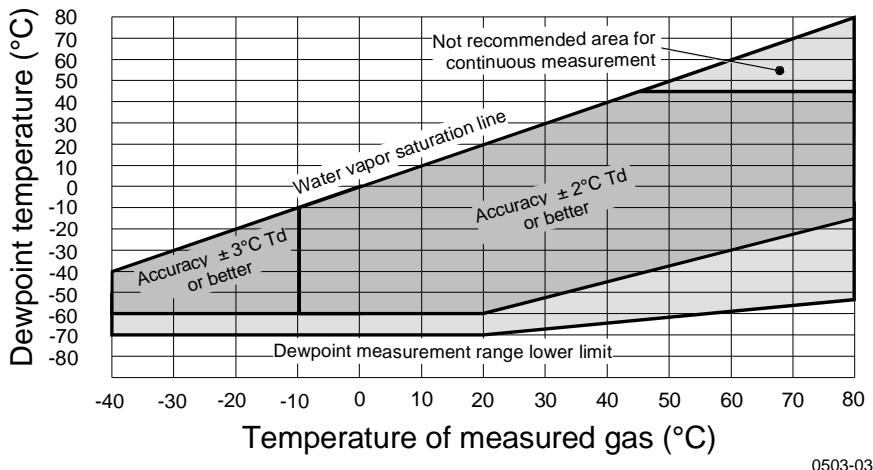
Figure 83 Dewpoint Accuracy Graph
Response time 63% [90%] at +20^ gas temperature
Flow rate 1 l/min and 1 bar pressure
$$ \begin{array}{l} - 6 0 - > - 2 0 ^ {\circ} \mathrm {C T d} (- 7 6 - > - 4 ^ {\circ} \mathrm {F T d}) \quad 5 \mathrm {s} [ 1 0 \mathrm {s} ] \ - 2 0 - > - 6 0 ^ {\circ} \mathrm {C T d} (- 4 - > - 7 6 ^ {\circ} \mathrm {F T d}) \quad 4 5 \mathrm {s} [ 1 0 \mathrm {m i n} ] \ \end{array} $$
Temperature
Measurement range 0 +80^(+32 +176^)
Accuracy ±0.2°C at room temperature
Temperature sensor Pt 100 IEC 751 1/3 class B
Relative humidity
Measurement range 0..70%RH
Accuracy (RH < 10 % RH, at + 20 °C) ±0.004 % RH + 20% of reading
ppmv (dry)
Measurement range (typical) 10 ... 2500 ppm Accuracy (at + 20^,1 bar) 1ppm + 20% of reading
Other measurement parameters available (depends on model)
mixing ratio, absolute humidity, pressure dewpoint calculated to 1 bar, temperature difference (T-Td), water vapor pressure
Operating Environment
Mechanical durability Up to +180^ (+356^)
for transmitter body -40 ... +60 °C (-40 ... +140 °F)
with display 0 +60^ (32 ... +140 F)
Storage temperature range -55 ... +80 °C (-67 ... +176 °F)
Pressure and temperature range for probes
Measured gases
Complies with EMC standard EN61326-1:1997 +
Industrial Environment
See probe specifications
non corrosive
Am1:1998 + Am2:2001
Inputs and Outputs
Operating voltage 10 ... 35 VDC, 24 VAC
with optional power supply module
100 ... 240 VAC 50 / 60Hz
Default start-up time after sensor Purge and Autocal
About 6 min
Start-up time after power-up
3s
Power consumption @ 20^ (Uin 24VDC)
RS-232
max 25mA
Uout 2 x 0 ... 1V / 0 ... 5V / 0 ... 10V
max 25mA
Iout 2× 0 20mA
max 60mA
display and backlight
+20mA
during sensor purge
+110mA max
Analog outputs (2 standard, 3rd optional)
current output
0 ... 20 mA, 4 ... 20 mA
voltage output
0 ... 1 V, 0 ... 5 V, 0 ... 10 V
Accuracy of analog outputs at 20^
± 0.05% full scale
Temperature dependence of the analog outputs
± 0.005%/C full scale
External loads
current outputs
RL < 500 ohm
0 ... 1V output
0.5 mm2 (AWG 20) stranded wires recommended
RS-232, RS-485 (optional)
0.5 A, 250 VAC, SPDT
LCD with backlight, graphic trend display
English, French, Spanish, German, Japanese, Russian, Swedish, Finnish, Chinese
Mechanics
Cable bushing
Conduit fitting
User cable connector (optional)
option 1
option 2
Probe cable diameter
Probe cable lengths
Probe tube material
Housing material
Housing classification
Housing weight
M20x1.5 For cable diameter
8...11mm/0.31..0.43"
1/2"NPT
M12 series 8-pin (male)
with plug (female) with 5m /
16.4 ft black cable
with plug (female) with screw terminals
5.5 mm
2m,5m or 10m
AISI 316L
G-AlSi 10Mg (DIN 1725)
IP 65 (NEMA 4X)
1.2 kg
Probe Specifications
Operating temperatures
for probes*
-40...+80°C(-40...+176°F)
Pressure ranges for probes
DMT342
DMT344
DMT347
DMT348
with Ball Valve
- Mechanical durability
0 ... 50 bar / 0 ... 725 psia
0 ... 50 bar / 0 ... 725 psia
0 ... 10 bar / 0 ... 145 psia
0 ... 40 bar / 0 ... 580 psia
0 ... 20 bar / 290 psia
up to +180^ (+356^)
Technical Specifications of Optional Modules
Power Supply Module
Operating voltage
Connections
100 ... 240 VAC 50 / 60Hz
screw terminals for
0.5 ... 2.5 mm² wire
(AWG 20 ... 14)
Bushing
for 8 ... 11 mm diameter cable
Operating temperature
-40 ... +60 °C (-40 ... +140 °F)
Storage temperature
-40 ... +70°C (-40 ... +158 °F)
UL file number
E249387
Analog Output Module
Outputs
0 ... 20 mA, 4 ... 20 mA,
0 ... 1 V, 0 ... 5 V, 0 ... 10 V
-40 ... +60°C (-40 ... +140°F)
Operating temperature range
max 30mA
Power consumption
max 30mA
U_out0 1V
max 60mA
U_out0 5V / 0 10V
I_out0 20mA
External loads
current outputs
Max load + cable loop resistance
0...1V
0 ... 5 V and 0 ... 10 V
R_L < 500 ohms
540 ohms
R_L > 2000 ohms
R_L > 10000 ohms
Storage temperature range
-55 ... +80 °C (-67 ... +176 °F)
3-pole screw terminal
1.5mm^2 (AWG16)
Max wire size
Relay Module
Operating temperature range
-40 ... +60°C (-40 ... +140°F)
Operating pressure range
500 ... 1300 mmHg
Power consumption @24 V
max 30mA
Contacts SPDT (change over), for example,
Contact arrangement Form C
Imax
Imax
0.5 A 250 VAC
0.5 A 30 VDC
Safety standard for the relay component
IEC60950 UL1950
Storage temperature range
-55 ... +80°C (-67 ... +176°F)
3-pole screw terminal / relay
2.5mm2 (AWG14)
Max wire size
RS-485 Module
Operating temperature range
Operating modes
Operating speed max
Bus isolation
Power consumption @ 24V
External loads
standard loads
Storage temperature range
Max wire size
-40 ... +60 °C (-40 ... +140 °F)
2-wire (1-pair) half duplex
4-wire (2-pair) full duplex
115.2 kbaud
300VDC
max 50mA
Operating temperature range
Storage temperature range
Operating humidity range
Power consumption @ 24V
Ethernet type
Connector
Supported protocols
Supported protocols
-40 ... +60 °C (-40 ... +140 °F)
-40 ... +85 °C (-40 ... +185 °F)
5 ... 95%RH
max 60mA
10/100Base-T
RJ45
Telnet, HTTP
Telnet
WLAN Interface Module
Operating temperature range
Storage temperature range
Operating humidity range
Power consumption @ 24V
Supported standards
Connector
Protocols
Supported protocols
Security
-20 ... +60°C (-4 ... +140°F)
-40 ... +85 °C (-40 ... +185 °F)
5...95%RH
max 80mA
802.11b
RP-SMA
Telnet
Telnet, HTTP
WEP 64/128,WPA
Data Logger Module
Operating temperature range
Storage temperature range
Power consumption @ 24V
Logged parameters
Logging interval
Maximum logging period
Logged points
Accuracy of the clock
Battery lifetime
at -40 +30^ (-40 +86^)
at +30 ... +60^ (+86 +140^)
-40 ... +60 °C (-40 ... +140 °F)
-55 ... +80°C (-67 ... +176°F)
max 10mA
up to three with trend/min/max values for each
10 s (fixed)
4 years 5 months
13.7 million points / parameter
better than ± 2 min/year
7 years
5 years
Options and Accessories
Table 32 Options and Accessories
| Description | Order Code |
| MODULES | |
| Relay module | RELAY-1 |
| Analog Output Module | AOUT-1 |
| Isolated RS485 Module | RS485-1 |
| Power Supply Module | POWER-1 |
| Galvanic Isolation Module | DCDC-1 |
| FILTERS | |
| Sintered Filter AISI 316L | HM47280SP |
| Stainless Steel Filter | HM47453SP |
| TRANSMITTER MOUNTING ACCESSORIES | |
| Wall Mounting Kit | 214829 |
| Installation Kit for Pole or Pipeline | 215108 |
| Rain Shield with Installation Kit | 215109 |
| DIN Rail Clips with Installation Plate | 215094 |
| Panel Mounting frame | 216038 |
| PROBE MOUNTING ACCESSORIES | |
| Sampling Cell with ISO1/2" Female Connectors | DMT242SC |
| Sampling Cell with ISO1/2" Swagelok Connectors | DMT242SC2 |
| Installation Flange ISO1/2 | DM240FA |
| DMT342 | |
| Sampling Cell for Probe with Flange | HMP302SC |
| 5 pcs O-ring Set Size 14.1x1.6 | 216026 |
| DMT344 | |
| Fitting Body M22x1.5 | 17223SP |
| Fitting Body NPT1/2 | 17225SP |
| DMT347 | |
| Swagelok for 12mm Probe 3/8" ISO Thread | SWG12ISO38 |
| Swagelok for 12mm Probe 1/2" ISO Thread | SWG12ISO12 |
| Swagelok for 12mm Probe 1/2" NPT Thread | SWG12NPT12 |
| DMT348 | |
| Fitting Body ISO1/2 Solid Structure (without leak screw) | DRW212076SP |
| Fitting Body NPT1/2 Solid Structure (without leak screw) | NPTFITBODASP |
| Fitting Body Set ISO 1/2 (with leak screw) | ISOFITBODASP |
| Fitting Body Set (ISO 1/2 + NPT 1/2) | THREADSETASP |
| Ball Valve ISO1/2 with Welding Joint | BALLVALVE-1 |
| Manual Press | HM36854SP |
| Leaking Screw with Allen Key | 216027 |
| Thread Adapter ISO1/2 to NPT1/2 | 210662SP |
| Plug Kit (ISO 1/2) | 218773 |
| CONNECTION CABLES | |
| Serial Interface Cable | 19446ZZ |
| USB-RJ45 Serial Interface Cable | 219685 |
| MI70 Connection Cable with RJ45 Connector | 211339 |
| OUTPUT CABLES for 8-pin connector | |
| Connection Cable 5m 8-pin M12 Female, Black | 212142 |
| Female Connector 8-pin M12 with Screw Terminals | 212416 |
| Male Connector 8-pin M12 with Cable and Adapter | 214806SP |
| CABLE BUSHINGS | |
| Cable Gland M20x1.5 for 8 ... 11mm Cable | 214728SP |
| Cable Gland M20x1.5 for 11 ... 14mm Cable | 214729 |
| Conduit Fitting M20x1.5 for NPT1/2 Conduit | 214780SP |
| Dummy Plug M20x1.5 | 214672SP |
| WINDOWS SOFTWARE | |
| Software Interface Kit | 215005 |
| OTHER | |
| HMK15 Calibration Adapter for 12 mm Probes with >7 mm Sensor Pins | 211302SP |
Dimensions (mm/inch)
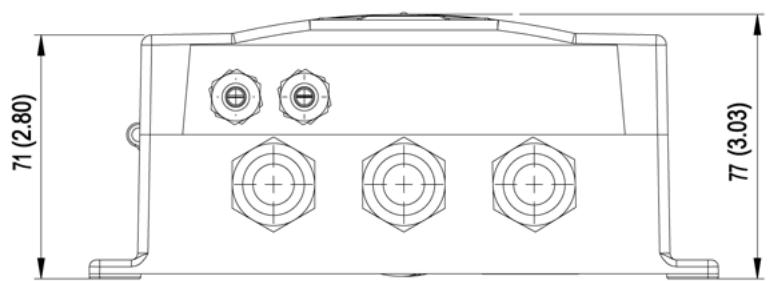
Figure 84 DMT340 Transmitter Body Dimensions
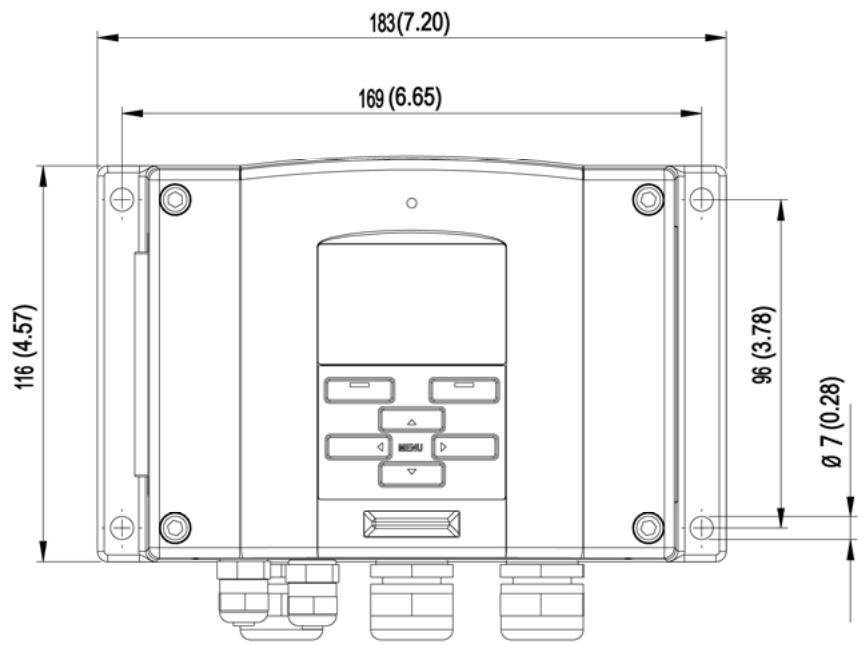
0506-035

Figure 85 WLAN Antenna Dimensions

Figure 86 Sampling Cell Dimensions
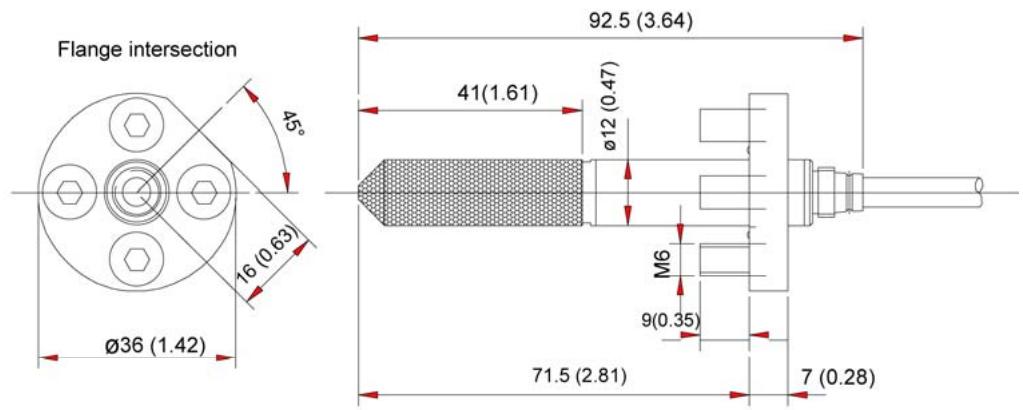

0503-044
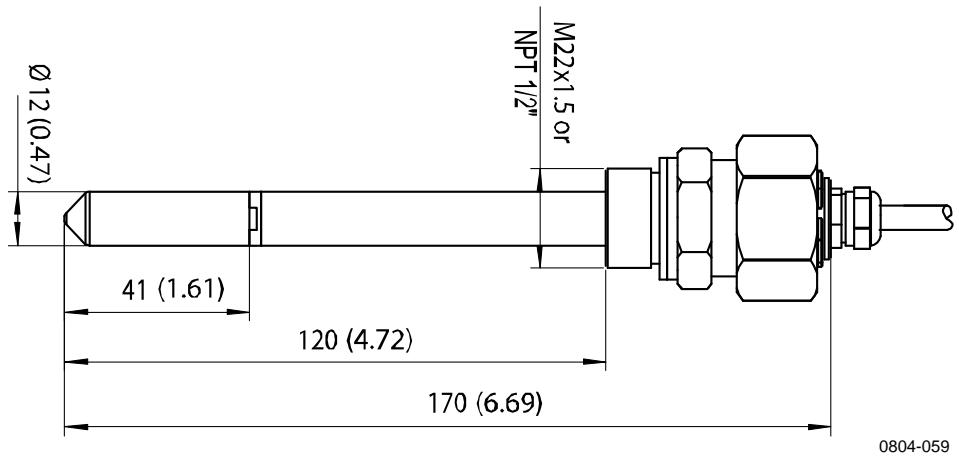
Figure 87 DMT342 Probe Dimensions
Figure 88 DMT344 Probe Dimensions
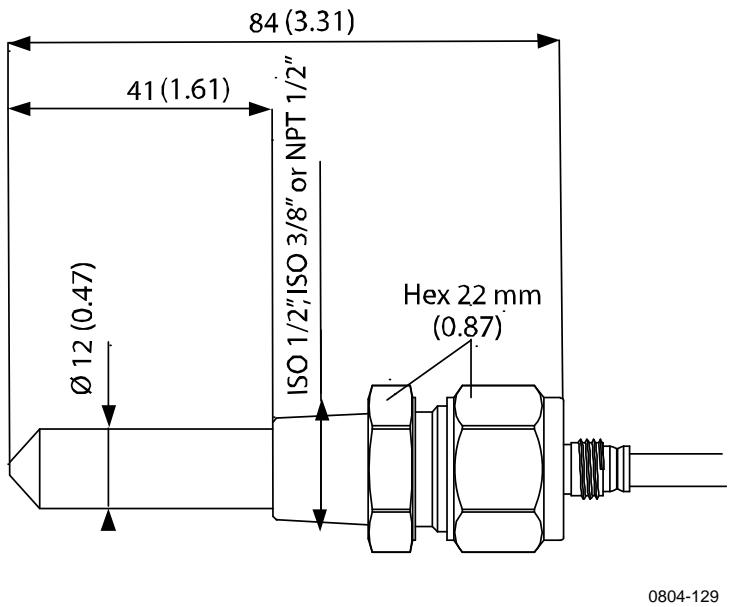
Figure 89 DMT347 Probe Dimensions
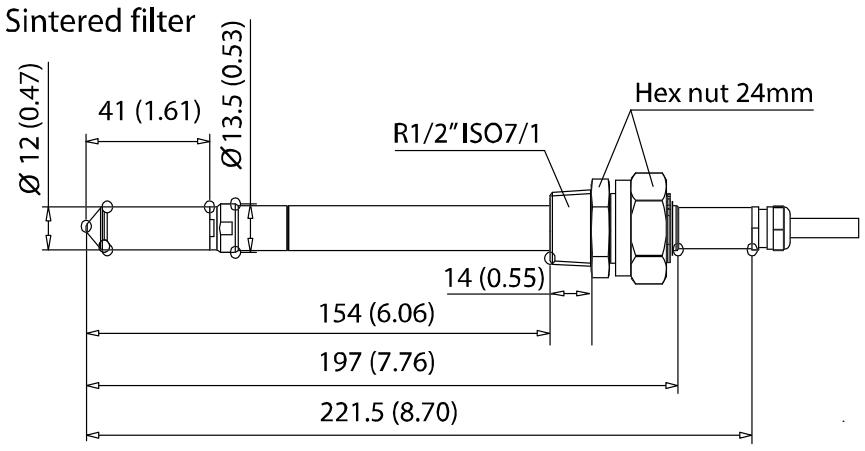

Figure 90 DMT348 Standard Probe Dimensions

Figure 91 NPT 1/2" Nut Dimensions

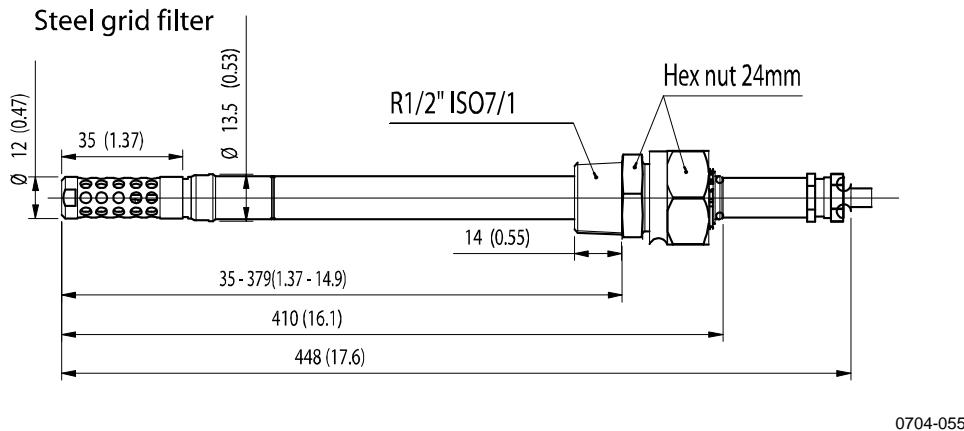
Figure 92 DMT348 Optional 400mm Probe Dimensions
APPENDIX A
CALCULATION FORMULAS
This Appendix contains the formulas used for the calculated output quantities.
The DMT340 series transmitters measure relative humidity and temperature. From these values dewpoint, mixing ratio, absolute humidity and enthalpy in normal pressure are calculated using the following equations:
Dewpoint:
$$ T _ {d} = \frac {T _ {n}}{\frac {m}{\log \left(\frac {P w}{A}\right)} - 1} \tag {1} $$
P_w is the water vapor pressure. The parameters A, m, and Tn depend on temperature according to the following table:
| t | A | m | Tn |
| <0 °C* | 6.1134 | 9.7911 | 273.47 |
| 0 ... 50 °C | 6.1078 | 7.5000 | 237.3 |
| 50 ... 100 °C | 5.9987 | 7.3313 | 229.1 |
| 100 ... 150 °C | 5.8493 | 7.2756 | 225.0 |
| 150 ... 180 °C | 6.2301 | 7.3033 | 230.0 |
1) Used for frostpoint calculation if the dewpoint is negative
Mixing ratio:
$$ x = 6 2 1. 9 9 \cdot \frac {P _ {w}}{p - P _ {w}} \tag {2} $$
Absolute humidity:
$$ a = 2 1 6. 6 8 \cdot \frac {P _ {w}}{T} \tag {3} $$
Enthalpy:
$$ h = (T - 2 7 3. 1 5) \cdot (1. 0 1 + 0. 0 0 1 8 9 \cdot x) + 2. 5 \cdot x ^ {(4)} $$
The water vapour saturation pressure P_ws is calculated by using two equations (5 and 6):
$$ \Theta = T - \sum_ {i = o} ^ {3} C _ {i} T ^ {i} \tag {5} $$
where:
T = temperature in K
C_i = coefficients
C_0 = 0.4931358
C_J = -0.46094296 * 10^-2
C_2 = 0.13746454 * 10^-4
C_3^- = -0.12743214 * 10 ^-7
$$ \ln P _ {w s} = \sum_ {i = - 1} ^ {3} b _ {i} \Theta^ {i} + b _ {4} \ln \Theta \tag {6} $$
where:
b_i = coefficients
b_-1 = -0.58002206*10^4
b_0 = 0.13914993*10^1
b_I^J = -0.48640239 * 10^-1
b_2 = 0.41764768*10^-4
[ b_{3} = -0.14452093 * 10^{-7} ]
b_4 = 6.5459673
The water vapor pressure is calculated using:
$$ P _ {w} = R H \cdot \frac {P _ {w s}}{1 0 0} \tag {7} $$
Parts per million by volume is calculated using:
$$ p p m _ {v} = 1 0 ^ {6} \cdot \frac {P _ {w}}{\left(p - P _ {w}\right)} \tag {8} $$
Symbols:
$$ T d = \text {d e w p o i n t} (^ {\circ} \mathrm {C}) $$
$$ P _ {W} = \text {w a t e r v a p o u r p r e s s u r e (h P a)} $$
$$ P _ {W S} = \text {w a t e r v a p o u r s a t u r a t i o n p r e s s u r e (P a)} $$
$$ R H = \text {relative humidity} (\%) $$
$$ x = \text {m i x i n g r a t i o} (\mathrm {g / k g}) $$
$$ p = \text {a t m o s p h e r i c p r e s s u r e (h P a)} $$
$$ a = \text {a b s o l u t e h u m i d i t y (g / m 3)} $$
$$ T = \text {t e m p e r a t u r e} (\mathrm {K}) $$
$$ h = \text {e n t h a l p y} (\mathrm {k J / k g}) $$
This page intentionally left blank.

www.vaisala.com
- Vaisala DRYCAP® Dewpoint and Temperature Transmitter Series DMT340
- PUBLISHED BY
- Table of Contents
- CHAPTER 1
- GENERAL INFORMATION 13
- CHAPTER 2
- PRODUCT OVERVIEW 19
- CHAPTER 3
- INSTALLATION 25
- Optional Modules 54
- CHAPTER 4
- OPERATION 71
- Getting Started 71
- Display/Keypad 71
- MI70 Link Program for Data Handling 80
- Serial Line Communication 80
- LAN Communication 84
- Operation of Relays 120
- Operation of the RS-485 Module 127
- Sensor Functions 130
- CHAPTER 5
- Periodic Maintenance. 135
- CHAPTER 6
- Calibration 141
- Adjusting Dewpoint T_d / f 144
- Adjusting Temperature 149
- Adjusting Analog Outputs 151
- CHAPTER 7
- TECHNICAL DATA 153
- Specifications 153
- Options and Accessories 158
- Dimensions (mm/inch) 160
- APPENDIX A
- CALCULATION FORMULAS 165
- List of Figures
- List of Tables
- GENERAL INFORMATION
- About This Manual
- Contents of This Manual
- Version Information
- General Safety Considerations
- WARNING
- CAUTION
- NOTE
- Feedback
- Product Related Safety Precautions
- ESD Protection
- Recycling
- Regulatory Compliances
- DNV Type Approval
- Transmitters with LAN or WLAN Interface
- Transmitters with WLAN Interface
- Trademarks
- License Agreement
- Warranty
- PRODUCT OVERVIEW
- Introduction to DMT340
- Basic Features and Options
- Structure of the Transmitter
- INSTALLATION
- Mounting the Housing
- Standard Mounting without Mounting Plate
- Wall Mounting with Wall Mounting Kit
- Mounting with DIN Rail Installation Kit
- Pole Installation with Installation Kit for Pole or Pipeline
- Mounting the Rain Shield with Installation Kit
- Panel Mounting Frame
- Wiring
- Cable Bushings
- Grounding the Cables
- Transmitter Housing Grounding
- Signal and Power Supply Wiring
- WARNING Make sure that you connect only de-energized wires.
- Connections to a 24 VAC Power Supply
- CAUTION 24 VAC POWER SUPPLY USE
- Probe Mounting
- DMT342 Small-size Flanged Probe for Use with Sampling Cell
- DMT344 For High-pressure Applications
- DMT347 Small Pressure-tight Probe
- Pressure-Tight Swagelok Installation Kits for DMT347
- DMT348 For Pressurized Pipelines
- Tightening the Clasp Nut
- Ball Valve Installation Kit for DMT348
- Leak Screw Installation
- Mounting the Probe Directly to the Process
- Sampling Cell for DMT348
- Optional Modules
- Power Supply Module
- Warnings
- Galvanic Isolation for Output
- Third Analog Output
- Installation and Wiring
- Alarm Relays
- Selecting the Activation State of the Relay
- RS-422/485 Interface
- LAN Interface
- WLAN Interface
- Attaching the WLAN Antenna
- Data Logger Module
- 8-pin Connector
- OPERATION
- Getting Started
- Display/Keypad
- Basic Display
- Graphic History
- Menu and Navigation
- Changing the Language
- Rounding Setting
- Display Backlight Setting
- Display Contrast Setting
- Keypad Lock (Keyguard)
- Menu PIN Lock
- Factory Settings
- Display Alarms
- Configuring a Display Alarm
- MI70 Link Program for Data Handling
- Serial Line Communication
- User Port Connection
- Service Port Connection
- Connection Cables
- Installing the Driver for the USB Cable
- Using the Service Port
- LAN Communication
- IP Configuration
- Using Display/Keypad
- Using Serial Line
- NET [REFRESH] [DISCONNECT] [DHCP WEB] [DHCP IP SUBNET GATEWAY WEB]
- Examples:
- Wireless LAN Configuration
- WLAN [SSID TYPE]
- Telnet Settings
- Web Configuration for LAN and WLAN
- VAISALA Vaisala WLAN Interface Configuration and Management
- Network Configuration
- Terminal Program Settings
- Opening a Serial/USB connection
- Opening a Telnet session (LAN/WLAN)
- List of Serial Commands
- Getting the Measurement Message from Serial Line
- Starting Continuous Outputting
- Stopping Continuous Outputting
- Formatting Serial Line Message
- FTIME and FDATE
- FTIME
- FDATE
- Example:
- FST
- General Settings
- Changing the Quantities and Units
- FORM
- UNIT
- Pressure Compensation Setting
- Using Buttons on the Motherboard
- XPRES and PRES
- Date and Time
- TIME
- DATE
- User Port Serial Settings
- SERI
- SERI [b p d s]
- SMODE
- SMODE [xxxx]
- INTV
- ECHO
- ECHO [x]
- Data Filtering
- FILT
- Device Information
- ?
- HELP
- ERRS
- VERS
- Resetting the Transmitter Using Serial Line
- RESET
- Locking Menu/Keypad by Using Serial Line
- LOCK
- LOCK [x] [yyyy]
- Deleting the Recorded Files
- UNDELETE
- Analog Output Settings
- Changing the Output Mode and Range
- Selection
- Analog Output Quantities
- AMODE/ASEL
- Analog Output Tests
- ITEST
- I TEST [aa.aaa bb.bbb]
- Analog Output Fault Indication Setting
- AERR
- Operation of Relays
- Quantity for Relay Output
- Measurement-Based Relay Output Modes
- Relay Setpoints
- Legend
- Hysteresis
- Relay Indicating Transmitter Error Status
- FAULT STATUS
- ONLINE STATUS
- Enabling/Disabling the Relays
- Operation of the Indication LEDs
- Setting the Relay Outputs
- RSEL
- RSEL [q1 q2 q3 q4]
- Testing the Operation of Relays
- RTEST
- Operation of the RS-485 Module
- Networking Commands
- SDELAY
- ADDR
- OPEN [nn]
- CLOSE
- Sensor Functions
- AutoCal
- Automatic AutoCal
- Manual AutoCal
- Sensor Purge
- Manual Sensor Purge
- Interval Purge
- Power-up Purge
- PUR
- PURGE
- Sensor Warming
- MAINTENANCE
- Periodic Maintenance
- Cleaning
- Changing the Probe Filter
- Calibration and Adjustment
- Error States
- Technical Support
- Return Instructions
- Vaisala Service Centers
- NORTH AMERICAN SERVICE CENTER
- Calibration
- User Calibration and Adjustment
- Opening and Closing the Adjustment Mode
- Adjustment Information
- CTEXT and CDATE
- Adjusting Dewpoint T_d / f
- Two-point Relative Humidity Adjustment using Display/Keypad
- Two-point Relative Humidity Adjustment Using Serial Line
- FCRH
- One-point Dewpoint Adjustment Using Display/Keypad
- One-point Dewpoint Adjustment Using Serial Line
- Adjusting Temperature
- Adjusting Temperature Using Display/Keypad
- Adjusting Temperature Using Serial Line
- CT
- Adjusting Analog Outputs
- Adjusting Analog Outputs using Display/Keypad
- Adjusting Analog Outputs using Serial Line
- ACAL
- TECHNICAL DATA
- Specifications
- Performance
- Measured variables
- Dewpoint
- Temperature
- Relative humidity
- ppmv (dry)
- Operating Environment
- Inputs and Outputs
- Mechanics
- Probe Specifications
- Technical Specifications of Optional Modules
- Analog Output Module
- Relay Module
- RS-485 Module
- WLAN Interface Module
- Options and Accessories
- Dimensions (mm/inch)
- CALCULATION FORMULAS
Brand : VAISALA
Model : DMT340
Category : Humidity and temperature sensor