NL-507TTL - Gps Navilock - Free user manual and instructions
Find the device manual for free NL-507TTL Navilock in PDF.

User questions about NL-507TTL Navilock
0 question about this device. Answer the ones you know or ask your own.
Ask a new question about this device
Download the instructions for your Gps in PDF format for free! Find your manual NL-507TTL - Navilock and take your electronic device back in hand. On this page are published all the documents necessary for the use of your device. NL-507TTL by Navilock.
USER MANUAL NL-507TTL Navilock
u-center ANTARISTM Edition GPS Evaluation Software
User's Guide

text_image
p. Custer File Edit View Receive Drive Tools Window Help Map (Framble TargetMap) Status (All Options) (Current) Longitude: 8.56208 Latitude: 27°25'21' Longitude: 8.56208 Latitude: 27°25'21' Longitude: 8.56208 Latitude: 27°25'21' Longitude: 8.56208 Latitude: 27°25'21' Longitude: 8.56208 Latitude: 27°25'21' Longitude: 8.56194 Latitude: 27°25'21' Longitude: 8.56194 Latitude: 27°25'21' Longitude: 8.56194 Latitude: 27°25'21' Longitude: 8.56194 Latitude: 27°25'21' Longitude: 8.56194 Latitude: 27°16'19" Longitude: 8.56194 Latitude: 27°16'19" Longitude: 8.56194 Latitude: 27°16'19" Longitude: 8.56194 Latitude: 27°16'19" Longitude: 8.56194 Latitude: 27°16'19" Longitude: 8.56000 Latitude: 27°16'19" Longitude: 8.56000 Latitude: 27°16'19" Longitude: 8.56000 Latitude: 27°16'19" Longitude: 8.56000 Latitude: 27°16'19" Longitude: 8.56000 Latitude: 27°00'00" Longitude: 8.56000 Latitude: 27°00'00" Longitude: 8.56000 Latitude: 27°00'00" Longitude: 8.56000 Latitude: 27°00'00" Longitude: 8.56000 Latitude: 27°00'00" Longitude: 8.55999 Latitude: 27°00'00" Longitude: 8.55999 Latitude: 27°00'00" Longitude: 8.55999 Latitude: 27°00'00" Longitude: 8.55999 Latitude: 27°00'00" Longitude: 8.55999 Latitude: 27°33'33" Longitude: 8.55999 Latitude: 27°33'33" Longitude: 8.55999 Latitude: 27°33'33" Longitude: 8.55999 Latitude: 27°33'33" Longitude: 8.55999 Latitude: 27°33'33" Longitude: 8.54999 Latitude: 27°33'33" Longitude: 8.54999 Latitude: 27°33'33" Longitude: 8.54999 Latitude: 27°33'33" Longitude: 8.54999 Latitude: 27°33'33" Longitude: 8.54999 Latitude: 13°16'54" Longitude: 8.54999 Latitude: 13°16'54" Longitude: 8.54999 Latitude: 13°16'54" Longitude: 8.54999 Latitude: 13°16'54" Longitude: 8.54999 Latitude: 13°16'54" Longitude: 8.53999 Latitude: -13°16'54" Longitude: 8.53999 Latitude: -13°16'54" Longitude: 8.53999 Latitude: -13°16'54" Longitude: 8.53999 Latitude: -13°16'54" Longitude: 8.53999 Latitude: -13°16'53" Longitude: 8.53999 Latitude: -13°16'54" Longitude: 8.53999 Latitude: -13°16'54" Longitude: 8.53999 Latitude: -13°16'54" Longitude: 8.53999 Latitude: -13°16'54" Longitude: 8.52999 Latitude: -13°16'54" Longitude: 8.52999 Latitude: -13°16'54" Longitude: 8.52999 Latitude: -13°16'54" Longitude: 8.52999 Latitude: -13°16'54" Longitude: 8.52999 Latitude: -7°44'44" Longitude: -7°44'44" Longitude: -7°44'44" Longitude: -7°44'44" Longitude: -7°44'44" Longitude: -7°44'44" Longitude: -7°44'44" Longitude: -7°44'44" Longitude: -7°44'44" Longitude: -7°44'44" Longitude: SW_26 SW_26 SW_26 SW_26 SW_26 SW_26 SW_26 SW_26 SW_26 SW_26 SW_26 SW_26 SW_26 SW_26 SW_26 SW_26 SW_26 SW_26 SW_26 SW_26 SW_26Abstract
This document guides you to an efficient use of the u-center ANTARISTM Edition GPS Evaluation software, an efficient and easy to use tool for the evaluation and test of GPS receivers.
u-blox AG
Zürcherstrasse 68
8800 Thalwil
Switzerland
www.u-blox.com
Phone +41 1722 7444
Fax +41 1722 7447
info@u-blox.com
| Title | u-center ANTARISTM Edition | ||
| Subtitle | GPS Evaluation Software | ||
| Doc Type | User's Guide | ||
| Doc Id | GPS-SW-02001-1 | ||
| Revision Index | Date Name Status / Comments | ||
| 1 11/06/2003 Thomas Nigg GPS Configuration added | |||
| Initial Version 5/12/2002 Thomas Nigg | |||
We reserve all rights in this document and in the information contained therein. Reproduction, use or disclosure to third parties without express authority is strictly forbidden.
For most recent documents, please visit www.u-blox.com
This software uses parts of source code developed by other companies or groups.
JPG and JPEG graphics import filter:
Copyright © the Independent JPEG Group's software
PNG graphics import filter:
Copyright © 1998-2000 Glenn Randers-Pehrson,
Copyright (c) 1996, 1997 Andreas Dilger,
Copyright © 1995, 1996 Guy Eric Schalnat, Group 42, Inc.
TIFF graphics import filter:
Copyright © 1988-1997 Sam Leffler,
Copyright © 1991-1997 Silicon Graphics, Inc.
Docking views:
Copyright © 1998, 1999 by Cristi Posea
Regular Expression Filter:
Copyright © 1986, 1993, 1995 by University of Toronto
Microsoft Foundation Class MFC4.2:
Copyright © Microsoft Corporation
All trademarks mentioned in this document are property of their respective owners.
Copyright © 2002, u-blox AG
THIS DOCUMENT CONTAINS INFORMATION ON u-blox PRODUCTS IN THE SAMPLING AND INITIAL PRODUCTION PHASES OF DEVELOPMENT. THE SPECIFICATIONS IN THIS DOCUMENT ARE SUBJECT TO CHANGE AT u-blox' DISCRETION. u-blox ASSUMES NO RESPONSIBILITY FOR ANY CLAIMS OR DAMAGES ARISING OUT OF THE USE OF THIS DOCUMENT, OR FROM THE USE OF MODULES BASED ON THIS DOCUMENT, INCLUDING BUT NOT LIMITED TO CLAIMS OR DAMAGES BASED ON INFRINGEMENT OF PATENTS, COPYRIGHTS OR OTHER INTELLECTUAL PROPERTY RIGHTS. u-blox MAKES NO WARRANTIES, EITHER EXPRESSED OR IMPLIED WITH RESPECT TO THE INFORMATION AND SPECIFICATIONS CONTAINED IN THIS DOCUMENT. PERFORMANCE CHARACTERISTICS LISTED IN THIS DOCUMENT ARE ESTIMATES ONLY AND DO NOT CONSTITUTE A WARRANTY OR GUARANTEE OF PRODUCT PERFORMANCE.
u-center ANTARISTM Edition - User's Guide
GPS-SW-02001-1
Contents
1 Preface ....5
1.1 Intended Audience 5
1.2 Features....5
2 Getting Started....6
2.1 General Information about displayed values 6
2.2 Connecting a GPS Receiver to the PC 6
2.3 Installing u-center 6
2.4 Starting u-center....6
2.5 Configuring the Serial Connection....7
2.5.1 COM-Port 7
2.5.2 Baudrate 7
3 Concept and Philosophy ....9
3.1 Color coding scheme.... 10
3.2 Operating Modes.... 11
3.2.1 Online Mode 11
3.2.2 Stop Mode 11
3.2.3 Record Mode.... 11
3.2.4 Player Mode 12
3.2.5 Database Limitation....12
3.2.6 Relations between Modes 13
4 Menu Structure....15
4.1 The Main Frame.... 15
4.2 The Menu Bar.... 16
4.3 File Menu and Standard Tool Bar 16
4.4 Edit Menu.... 17
4.5 View Menu and Views Tool Bar 17
4.5.1 Text Console 17
4.5.2 Packet Console....20
4.5.3 Binary Console 20
4.5.4 Message View 21
4.5.5 Statistic View....24
4.5.6 Table View 24
4.5.7 Chart View 25
4.5.8 Histogram View.... 28
4.5.9 Deviation Map.... 30
4.5.10 Map View....30
4.5.11 Sky View 35
4.6 Receiver Menu and Receiver Toolbar 36
4.7 Player Menu and Player Toolbar 37
4.8 View Menu: Docking Windows.... 38
4.9 Tools Menu 39
4.9.1 Firmware Update....39
4.9.2 GPS Configuration 41
4.9.3 Hotkeys 42
4.10 Window Menu 42
4.11 Help Menu 42
5 Troubleshooting....43
A Index....44
B Lists 45
B.1 List of Figures 45
B.2 List of Tables....46
C Glossary 47
1 Preface
1.1 Intended Audience
This user's guide provides a description of the features of the u-center GPS evaluation software. It will allow GPS end users to evaluate and test u-blox GPS receivers for navigation and positioning performance. This guide assumes, the user has basic computer skills and is familiar with the Windows Graphical User Interface (GUI) and GPS receiver environments.
If you have questions about installing or using u-center please:
- Read this user's guide carefully.
- Refer to the ANTARISTM EvalKit User's Guide for an introduction to the ANTARISTM GPS Technology and an overview about how to evaluate GPS receivers.
- Read the System Integration Manual of the u-blox GPS receiver used in your application.
- Check on our web page (www.u-blox.com) in the support section to ensure the GPS receiver and the u-center software are the latest versions.
• Refer to our web based Frequently Asked Questions Database (FAQ).
1.2 Features
The u-center GPS Evaluation Software provides system integrators and end users with a quick and simple way to interface with a u-blox OEM board or sensor product. It enables easy evaluation, performance testing, development and debugging of GPS receivers. u-center GPS Evaluation Software allows easy connection to u-blox products and provides a suite of features to view, log, and analyze performance. The features include:
- Support for the latest u-blox receivers using the ANTARISTM GPS technology, which has excellent acquisition and tracking performance at very low power consumption. u-center can communicate with these receivers using either the UBX protocol, or the NMEA-0183 standard protocol.
• Support for receivers that utilize standard NMEA strings. - u-center presents all the information that can be collected during the operation of a GPS receiver. All aspects of GPS data (position, velocity, time, satellite tracking, etc.) can be monitored and logged under various test scenarios for the evaluation of a receiver. u-center software allows analysis of the collected data in order to investigate performance issues such as accuracy, road test position and trajectory, satellite tracking, time to first fix, etc. All processed data can be captured in ASCII format and ported into popular spreadsheets (e.g. Microsoft Excel) for creating additional plots and statistics.
This guide explains how to use u-center to communicate with a GPS receiver for collection, visualization and analysis of GPS receiver data. Please refer to the ANTARIST™ EvalKit User's Guide for an introduction to the ANTARIST™ GPS Technology as well as a description of how to evaluate a GPS receiver.
2 Getting Started
2.1 General Information about displayed values
• Longitude and latitude are displayed according to the datum selected in the GPS receiver (usually: WGS-84).
• Time is displayed with reference to UTC
- Height is displayed with reference to either MSL (Height above mean sea level or Orthometric Height) or to HAE (Height above WGS-84-Ellipsoid). The reference is controlled by the GPS configuration.
2.2 Connecting a GPS Receiver to the PC
This section assumes that you have purchased a u-blox EvalKit. Should you try to connect a GPS receiver to a PC without using the EvalKit, make sure you use appropriate RS-232 level shifters. Connect a serial cable between a communications port (COM-port) of a PC and the EvalKit.
2.3 Installing u-center
The u-center installation program guides you through the necessary steps for a successful program installation.
! Warning u-center uses dynamic link libraries (DLL). The installation program will automatically install the required DLL's into the u-center program directory. Should you try to copy a u-center installation from one location to another after the installation, make sure you copy the DLL files as well.
2.4 Starting u-center
After a successful installation, u-center will start up as shown in Figure 1:

text_image
Up Center File Edit View Receiver Player Tools Window Help 00 - 00 - Longitude Latitude Longitude Latitude Altitude 11PF Fis Mode 3D Acc. 2D Acc. P0OP H0 D.F. Satellites 65 dB 20 55 dB 20 55 dB 20 55 dB 20 55 dB 20 55 dB 100/20 50° 200 0 250 9.2.1 96° 7.2 6 5.4 20 55 dB 20 55 dB 20 Ready 0.9 No port open No file open LBX 00:00:00 09:54:13Figure 1: Start Display
u-center ANTARISTM Edition - User's Guide Getting Started GPS-SW-02001-1
2.5 Configuring the Serial Connection
u-center stores the serial settings will use the last configuration when started. However, when u-center is started the first time, the COM port needs to be initialized. This will typically be done in the Receiver Tool Bar (Figure 2).

Figure 2: Receiver Tool Bar

text_image
Connect/Disconnect-Button with COM-Port selection arrow Baudrate-Button with baudrate selection arrow Autobauding-ButtonPlease note, u-center only supports the COM-Settings listed below. All u-blox GPS receivers are pre-configured this way.
- Parity: None
- Data Bits: 8
- Stop Bits: 1
- Flow Control: none
2.5.1 COM-Port
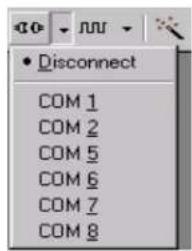
text_image
• Disconnect COM 1 COM 2 COM 5 COM 6 COM 7 COM 8Press the arrow in the Connect/Disconnect-Button and select the used COM-Port
2.5.2 Baudrate
2.5.2.1 Manual Selection
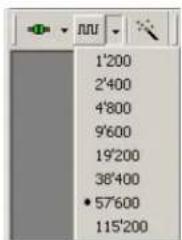
text_image
1'200 2'400 4'800 9'600 19'200 38'400 • 57'600 115'200The baudrate can be manually set or automatically detected by using the autobauding feature. Press the arrow in the Baudrate-Button to manually select the baudrate.
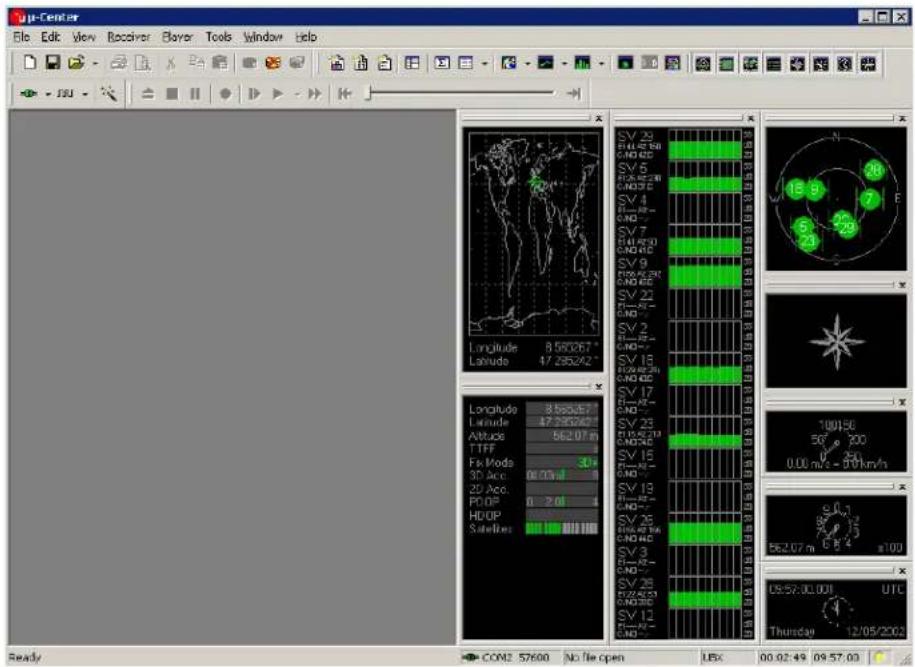
As soon as u-center is synchronized to the GPS receiver, the Connect/Disconnect-Button on the Receiver Tool Bar changes the color to green (Figure 3) and the display shows information about the satellite constellation, signal to noise ratio, time etc (Figure 5). If the baudrate of u-center and GPS receiver are not set to
the same value, the "Communication Information" icon changes to red. Please refer to section 4 for further information.

Figure 3: COM-Port and Baudrate successfully detected
2.5.2.2 Autobauding
u-center support autobauding. If frequent break errors are detected, u-center will lower the baudrate, in case of framing errors, the baudrate is increased until no further errors are detected.

Figure 4 Autobauding Button
! Warning Do not use the u-center autobauding if the GPS receiver has the autobauding enabled.
! Warning Some serial cards or adapters frequently generate errors. The u-center autobauding may not work reliably in this case. If you experience frequent errors, please set the baudrate manually.
If the GPS receiver is working correctly, the display will show information about the satellite constellation, signal to noise ratio, time etc (Figure 5)
text_image
μ-Center File Edit View Receiver Player Tools Window Help Longitude 8.56267° Latitude 47.235242° Longitude 8.6636° Latitude 47.230242° Altitude 562.07 m TIFF Fix Mods 30° 30 Acc 0.013 20 Acc. PDP 0.20 HDOP Sabetes SV 29 R1/25 E8 GND HC SV 5 R1/25 E28 GND HC SV 4 R1/25 HC- GND HC SV 7 R1/25 D0 GND HC SV 9 R1/25 E28 GND HC SV 22 R1/25 HC- GND HC SV 2 R1/25 HC- GND HC SV 18 R1/25 E28 GND HC SV 17 R1/25 HC- GND HC SV 23 R1/25 E19 GND HC SV 16 R1/25 HC- GND HC SV 13 R1/25 HC- GND HC SV 26 R1/25 E16 GND HC SV 3 R1/25 HC- GND HC SV 29 R1/25 E23 GND HC SV 12 R1/25 HC- GND HC N 18 9 7 E 6 23 100136 50' - 300 0.06 m/s - 0.0 km/h 562.07 m 0.5" s=100" 08:57:00:00 UTI Thursday 12/05/2003 Ready COM2 S7600 No file open UBC 00:02:49 09:57:00Figure 5: Start Display after a successful connection
3 Concept and Philosophy
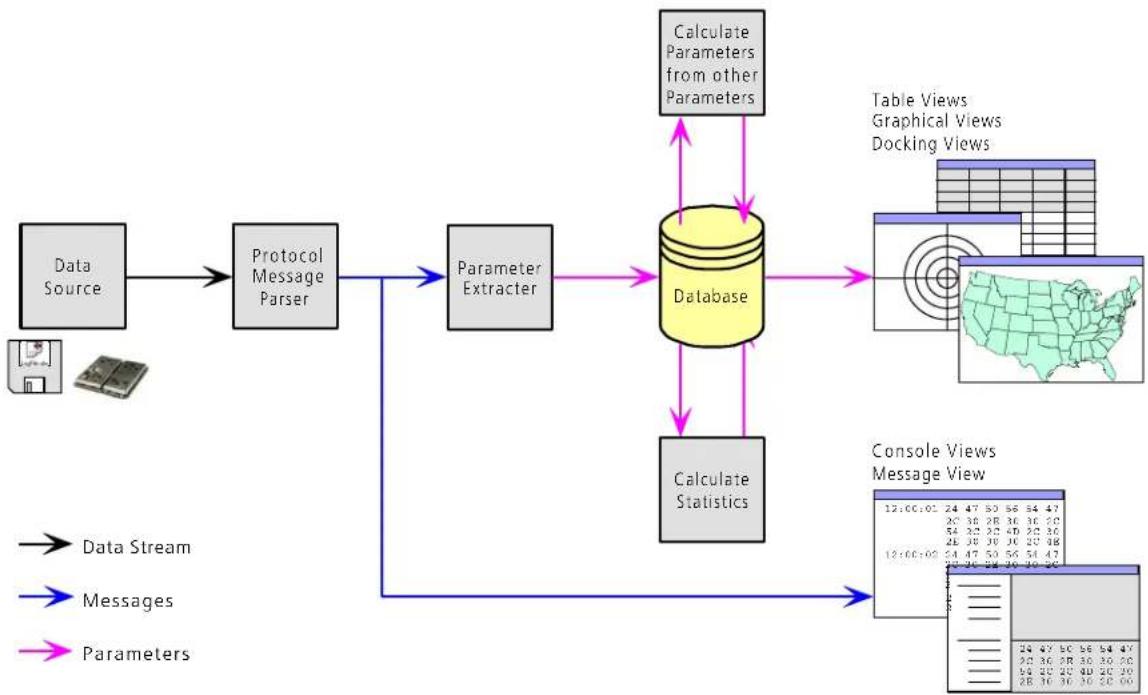
Understanding the basic concept behind u-center is important in order to get the highest benefit out of this powerful GPS evaluation software. Figure 6 depicts the architecture of the software. The program gets a data stream either from a COM port or a logfile and splits this stream into protocol messages. From the messages, relevant parameters are extracted and inserted into the current dataset of the database.
In the current dataset statistical values of the parameters are calculated. Average, Minimum, Maximum and Standard Deviation are calculated for most parameters. If a protocol does not provide a parameter, u-center tries to calculate the parameter from the ones that are available. For Example if velocity-north and velocity-east are available, u-center calculates the Speed over Ground and Course over Ground, unless this data is already available in the protocol.
flowchart
graph TD
    A["Data Source"] --> B["Protocol Message Parser"]
    B --> C["Parameter Extracter"]
    C --> D["Database"]
    D --> E["Calculate Statistics"]
    E --> F["Table Views"]
    E --> G["Graphical Views"]
    E --> H["Docking Views"]
    D --> I["Console Views"]
    I --> J["Message View 12:00:00"]
    I --> K["Message View 24:47:50:56:54:47"]
    I --> L["Message View 26:36:28:36:36:20"]
    I --> M["Message View 54:32:32:40:20:36"]
    I --> N["Message View 28:38:39:30:20:38"]
    I --> O["Message View 12:00:00:54:47:50:56:54:47"]
    I --> P["Message View 28:36:28:36:36:20"]
    I --> Q["Message View 28:36:36:30:20:36"]
Figure 6: Engine Architecture
When a new epoch (change in time) is detected, the current dataset is stored as history in the database. This history has a limited size. If the Size is exceeded u-center keeps only the latest datasets and the oldest ones are removed. The history size may be adjusted. Refer to section 3.2.5 for the details
u-center provides various view classes for observation. Most of the views take their data from the database. But there are some views, which get their data directly from the message without using the database at all. The views are updated when the database changes.
- Message View Displays a copy of every known message. This view allows observing a single message in detail. It may also be used to send and configure the GPS receiver.
-
Console Views Display the messages in a textual form. They are particularly useful for ANTARISTM Software Customization Kit (SCKit) users to develop GPS firmware code. There is also a wide range of information available, which is useful for evaluation and testing.
-
Graphical Views Display parameters from the database in graphical a form. Charts, Histograms and even a Map Overlay can be created. There are two more views that may be used for statistical performance and antenna pattern analysis.
- Tabular Views Show the parameters of the database in tabular form. They can be freely configured to allow customized tables.
- Docking Windows Can be docked to the frame of u-center. An analog watch, compass, world map, altitude and speed meter are available. There are also docking windows showing the current signal power and the constellation of the satellites received by the GPS receiver as well as a summary of the GPS status.
! Note
Displaying various Views and Docking Windows requires lots of computing power. Minimizing or closing them may significantly reduce the CPU usage.
3.1 Color coding scheme
In the graphical views and some of the docking windows, colors are used to indicate the quality of the data. Table 1 depicts the color-coding scheme parameters for graphical views depending on the quality of the navigation solution.
| Color Meaning | |
| + Yellow | Current value |
| + Green | 3D navigation solution |
| + Cyan | 2D navigation solution |
| + Blue | Degraded navigation solution (e.g. Dead reckoning) |
| + Red | No navigation solution |
Table 1: Color-coding scheme for graphical views
Table 2 depicts the color-coding scheme for the Docking Windows and Sky View. It indicates the state of each satellite.
| Color Meaning | |
| Green | Satellite used in navigation |
| Cyan | Satellite signal available, available for use in navigation |
| Blue | Satellite signal available, not available for use in navigation |
| Red | Satellite signal not available |
Table 2: Color-coding scheme for the Docking Windows and Sky View
3.2 Operating Modes
u-center has different operating modes. The mode changes when you open or close a log file or when you make an action in the player. To be able to use the record mode you have to create a new file, save to a new file or open an existing file. The record and player mode are only available if you have created a new file or when you have opened a write-able file.

flowchart
graph TD
    A["Online Mode"] -->|Open/Create File| B["Stop Mode"]
    B -->|Record| C["Recorder Mode"]
    B -->|Stop| D["Player Mode"]
    D -->|Play/Step/ Scan| B
    B -->|Stop| D
    A -->|Close/Eject File| B
    B -->|Save| A
Figure 7: Relations between operating modes
3.2.1 Online Mode
In this mode a GPS receiver is directly connected via a serial port with u-center. u-center can control and configure the receiver, it will display the data that the receiver is sending periodically.

flowchart
graph LR
    A["Microchip"] --> B["Database"]
    B --> C["Map Index"]
    C --> D["Indexed Data Map"]
Figure 8: Dataflow in Online Mode
3.2.2 Stop Mode
In this mode no data from receiver or log file is forwarded to the database and views. u-center is in this mode when a log file is open but player and recorder are not active.
3.2.3 Record Mode
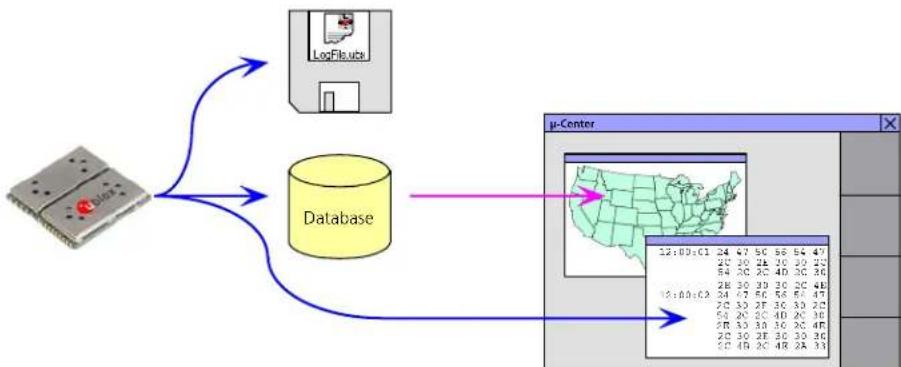
Record Mode is the same mode as the Online Mode. But u-center additionally creates a log file on your disk, contacting all the messages sent by the receiver. You enter this mode by creating a new log file or opening an existing log file without write protection and pressing the record button. An example of using this mode would be to make overnight measurements and evaluate the data at a later time. u-blox customer support may request a log file from you when you are experiencing a problem with one of our receivers.
flowchart
graph TD
    A["Device"] --> B["Database"]
    B --> C["μ-Center"]
    C --> D["Map with U.S. grid"]
    D --> E["Interface Display"]
Figure 9: Dataflow in Record Mode
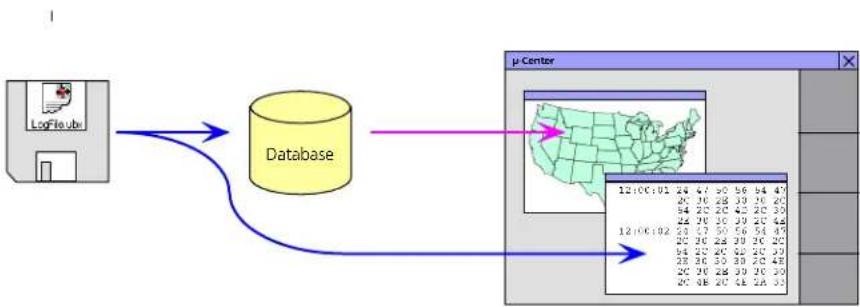
3.2.4 Player Mode
The Player Mode allows replaying a previously recorded log file step by step, in real-time or at an accelerated rate. You enter this mode by opening a file and pressing the play, step or scan button.
flowchart
graph LR
    A["LogFileuri"] --> B["Database"]
    B --> C["μ Center"]
    C --> D["US Map Visualization"]
    D --> E["20 21 22 23 24 25 26 27 28 29 30 31 32 33 34 35 36 37 38 39 40 41 42 43 44 45 46 47 48 49 50 51 52 53 54 55 56 57 58 59 60 61 62 63 64 65 66 67 68 69 70 71 72 73 74 75 76 77 78 79 80 81 82 83 84 85 86 87 88 89 90 91 92 93 94 95 96 97 98 99"]
Figure 10: Dataflow in Player Mode
3.2.5 Database Limitation
The number of epochs displayed in u-center is limited in order to allow an efficient analysis of large logfiles. The limitation is set to 1800 epochs by default. That means if an epoch is available every second you can analyze data for as much as 30 minutes. After this time the oldest values are discarded.
! Note Data stored to a logfile are not affected by the database limitation.
The number of epochs can be increased by a command line parameter if u-center is started from the Windows™ Start Menu. Just add the argument -history nnnn to the command line (nnnn is the number of epochs).
The example below shows the Run-Window for a database limitation of 1 hour at an update rate of 1Hz (3600 epochs):

text_image
Run Type the name of a program, folder, document, or Internet resources, and Windows will open it for you. Open: c:\program\u-center -history 3600 OK Cancel Browse...! Note
For long-term observations, it's recommended to start recording a log file before analysis begins.
! Warning
If a high value of epochs is selected, the display of data in real-time cannot be guaranteed, especially when graphical views are open.
3.2.6 Relations between Modes
The operating mode depends on the status of the log file player. To change a mode the user has to perform an action. Each mode has different states that are changed by a user action or by an event (Figure 7).
In the Online and the Record Mode, u-center displays the data from the receiver. In the Player mode data from a log file is displayed. The player mode has different states. In the play state messages are read and displayed periodically from the log file. The user interface is derived from the one of a CD player, and very intuitive. u-center updates the views after each message. The step state only gets one message from the log file and immediately falls back into the paused play state. In the scan state messages are also read periodically but the display is only updated when being paused or by changing the state.
You can set the position in a log file. This behaves differently in the player and the stop mode. In the stop mode the position is just set and no data is read and displayed. u-center will start recording or playing from that position when changing the mode. If you set the position in the Player mode, u-center will load the data up to this position from the log file and display the contents.

flowchart
graph TD
    subgraph Record Mode
        A["Record (Paused)"] --> B["Recording"]
        C["Start"] --> D["Stop"]
        E["Stop"] --> F["Stop (Paused)"]
    end

    subgraph Online Mode
        G["No File Open"] --> H["Player Mode"]
        I["Start"] --> J["Play (Paused)"]
        K["Stop"] --> L["Play"]
        M["Stop (Paused)"] --> N["Scan (Paused)"]
        O["Start"] --> P["Scan"]
        Q["End Of File"] --> R["Scan"]
    end

    G --> H
    H --> I
    I --> J
    J --> K
    K --> M
    M --> O
    O --> P
    P --> Q
    Q --> R
    R --> S["End Of File reached"]
    style Record Mode fill:#f9f,stroke:#333
    style Online Mode fill:#ccf,stroke:#333
    style Player Mode fill:#cfc,stroke:#333
Figure 11: Relations between different operating modes and their states
4 Menu Structure
4.1 The Main Frame
The Main Frame is the primary display screen of u-center. It displays all tool bars and some of the information provided by the GPS receiver. In the status bar, information about communication, UTC time, Operating Time, used protocol (NMEA or UBX), used file, etc. is shown.

text_image
Menu Bar Views Tool Bar μ-Center File Edit View Receiver Player Tools Window Help Receiver Tool Bar Player Tool Bar Mouse Cursor Button Function Standard Tool Bar Communication Information Protocol Information UTC Time Status Display File in use Operating Time- Button Function: A description about each button in the tool bars can be obtained by holding the mouse cursor over the button for a few seconds. A Tool Tip message will appear near the Icon with additional information while a detailed description is displayed in the Status Display.
• Status Display: display the current action or the function of a button if the mouse cursor is over the button - File in use: As soon as a file is used (this file must first be opened) the name of the file will be displayed (xxxxxx.ubx)
- Protocol Information: This box indicates the current message set that is being used to communicate with the GPS receiver. This can be the NMEA-0183 standard or the UBX protocol. The UBX protocol provides more extensive information with the receiver. u-center can handle both protocols.
• Operating Time: The time elapsed since you started u-center
• UTC Time: The current time sent by the GPS receiver
• Communication Information: Shows the active COM port and baudrate.
Color-Coding of this icon:
• Green: data is being received at the correct baudrate
• Dark Green: the last data received was valid, but there is no data to collect at this time.
• Red: data is being received but errors are detected
Dark Red: no data is being received but errors have been detected in the past
Gray: waiting for first data
Figure 12: u-center and GPS receiver are synchronized

Figure 13: u-center and GPS receiver mismatches
4.2 The Menu Bar
All u-center functions can be accessed through the Menu Bar, alternatively it may be easier to use the icons in the tool bars.
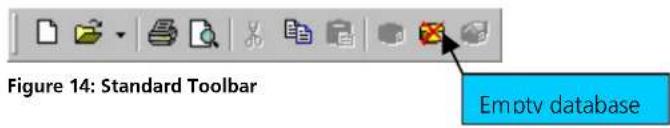
4.3 File Menu and Standard Tool Bar
text_image
Figure 14: Standard Toolbar Empty database
text_image
File Edit View Receiver New... Ctrl+N Save ... Ctrl+S Open... Ctrl+O Close Database Empty Print... Ctrl+P Print Preview Print Setup... Recent Files Exit 1 \\Whale\swdev...\NMEA.ubx 2 \\Whale\swdev...\SIRF.ubx 3 C:\TEMP\Logfile.ubxFigure 15: File Menu
New...
u-center can capture receiver output data into a logfile. However, logging will only start after Record in the Player Menu has been selected. The elapsed logging time is displayed in the field operating time. The log files have a 'ubx' extension.
Save...
Opens a new logfile, saves the data from a ring buffer to the logfile and immediately starts recording all newly received data. This is useful when error or an unexpected event occurred and no log file was recorded. The size of the ring buffer (4 MB) is large enough to retain the data for the last hour (approx.).
Open...
Opens a stored log file to be replayed.
Close Closes the log file.
Database Empty All stored values are deleted.
Recent Files A list of the most recent log files.
Exit Terminates u-center.
4.4 Edit Menu
The Edit Menu is fully Windows™ compliant.
4.5 View Menu and Views Tool Bar
4.5.1 Text Console
The Text Console displays the content messages in textual form such as UBX-INF or NMEA messages.

text_image
17:25:02 Resetting ... 17:25:02 u-blox ag - www.u-blox.com 17:25:02 TOS20 HW 00000040 17:25:02 ROM CORE 2.00 Oct 15 2002 19:05:47 17:28:29 $sdfsklasdfasdffasdfasd*17 17:28:29 WARNING: NMEA received unknown message 17:43:21 $PUBX,40,RMC,0,5,0,0*42 17:44:00 $PUBX,41,1,0007,0003,57600,0*28 17:44:01 $GPRMC,174401.00,A,4717.11279,N,00833.91732,E,0.006,216.12,061102,,A*6 17:44:06 $GPRMC,174406.00,A,4717.11275,N,00833.91721,E,0.003,216.12,061102,,A*6 17:44:09 $PUBX,40,RMC,0,0,0,0*47Figure 16: Text Console displaying UBX-INF and NMEA messages
text_image
17:45:38 $GPRMC, 174538.00, A:4717.11260, N,00833.91588, E,0.002, 216.12,061102.,A*6 17:45:39 $GPRMC, 174539.00, A:4717.11259, N,00833.91588, E,0.004, 216.12,061102.,A*6 17:45:40 $GPRMC, 174540.00, A:4717.11258, N,00833.91587, E,0.004, 216.12,061102.,A*6 17:45:41 $GPRMC, 174541.00, A:4717.11257, N,00833.91586, E,0.009, 216.12,061102.,A*6 17:45:42 $GPRMC, 174542.00, A:4717.11257, N,00833.91584, E,0.008, 216.12,061102.,A*6 17:45:43 $GPRMC, 174543.00, A:4717.11256, N,00833.91583, E,0.007, 216.12,061102.,A*6 17:45:44 $GPRMC, 174544.00, A:4717.11255, N,00833.91581, E,0.002, 216.12,061102.,A*6 17:45:45 $GPRMC, 174545.00, A:4717.11255, N,00833.91578, E,0.002, 216.12,061102.,A*6 17:45:46 $GPRMC, 174546.00, A:4717.11255, N,00833.91576, E,0.002, 216.12,061102.,A*6 17:45:47 $GPRMC, 174547.00, A:4717.11254, N,00833.91575, E,0.007, 216.12,061102.,A*6 17:45:48 $GPRMC, 174548.00, A:4717.11254, N,00833.91573, E,0.004, 216.12,061102.,A*6 17:45:49 $GPRMC, 174549.00, A:4717.11254, N,00833.91572, E,0.003, 216.12,061102.,A*6 17:45:50 $GPRMC, 174550.00, A:4717.11253, N,00833.91571, E,0.003, 216.12,061102.,A*6 17:45:51 $GPRMC, 174551.00, A:4717.11253, N,00833.91571, E,0.007, 216.12,061102.,A*6 17:45:52 $GPRMC, 174552.00, A:4717.11252, N,00833.9157D, E,0.005, 216.12,061102.,A*6Figure 17: Text Console displaying only RMC messages
u-center ANTARISTM Edition - User's Guide Menu Structure
GPS-SW-02001-1
| Element Name Description | |
| Lock Prevents the Text Console from being updated with new data when locked. | |
| Clear All Erases all data in the Text Console | |
| Filter On/Off Filter unwanted data from the data stream. This allows searching for certain expression, e.g. all RMC messages (Figure 17). |
Table 3: Description of the buttons of the different Consoles
4.5.1.1 Regular Expression Evaluation
Normally, when you search for a sub-string in a string, the match should be exact. So if we search for a sub-string "abc" then the string being searched should contain these exact letters in the same sequence for a match to be found. We can extend this kind of search to a case insensitive search where the sub-string "abc" will find strings like "Abc", "ABC" etc. That is, the case is ignored but the sequence of the letters should be exactly the same. Sometimes, a case insensitive search is also not enough. For example, if we want to search for numeric digit, then we basically end up searching for each digit independently. This is where regular expressions come in to our help. Regular expressions are text patterns that are used for string matching. Regular expressions are strings that contain a mix of plain text and special characters to indicate what kind of matching to do. Here's a very brief tutorial on using regular expressions.
Suppose, we are looking for a numeric digit then the regular expression we would search for is "[0-9]". The brackets indicate that the character being compared should match any one of the characters enclosed within the bracket. The dash (-) between 0 and 9 indicates that it is a range from 0 to 9. Therefore, this regular expression will match any character between 0 and 9, that is, any digit. If we want to search for a special character literally we must use a backslash before the special character. For example, the single character regular expression "*" matches a single asterisk. In the table below the special characters are briefly described. A regular expression search is case sensitive.
| Character Description | |
| ^ | Beginning of the string. The expression "^A" will match an 'A' only at the beginning of the string. |
| [^ | The caret (^) immediately following the left-bracket (I) has a different meaning. It is used to exclude the remaining characters within brackets from matching the target string. The expression "[^0-9]" indicates that the target character should not be a digit. |
| The dollar sign () will match the end of the string. The expression "abc$" will match the sub-string "abc" only if it is at the end of the string. | |
| | | The alternation or logic OR character (I) allows either expression on its side to match the target string. The expression "a|b" will match 'a' as well as 'b'. |
| . | The dot (.) will match any character. |
| * | The asterisk (*) indicates that the character to the left of the asterisk in the expression should match 0 or more times. |
| + | The plus (+) is similar to asterisk but there should be at least one match of the character to the left of the + sign in the expression. |
| ? | The question mark (?) matches the character to its left 0 or 1 times. |
| () | The parenthesis affects the order of pattern evaluation. |
| [] | Brackets ([ and ]) enclosing a set of characters indicates that any of the enclosed characters may match the target character. |
4.5.1.2 Example
Let's assume that the following lines would appear in the NMEA console without filtering.
14:00:03 GPGGA,140003.242,4717.1126,N,00833.7862,E,1,06,1.3,543.0,M,,,000009 14:00:03 GPGLL,4717.1126,N,00833.7862,E,140003.242,A34 14:00:03 GPGSA,A,3,06,17,25,22,30,10,,,,,,2.9,1.3,2.63A 14:00:03 GPGSV,2,1,07,06,58,062,44,17,52,161,44,25,45,239,44,22,35,301,447F 14:00:03 GPGSV,2,2,07,30,31,123,44,10,17,059,39,01,05,316,4E 14:00:03 GPRMC,140003.242,A,4717.1126,N,00833.7862,E,0.03,80.59,010201,36 14:00:03 GPVTG,80.59,T,,M,0.03,N,0.1,K56 14:00:04 GPGGA,140004.242,4717.1126,N,00833.7862,E,1,06,1.3,542.0,M,,,0000OF 14:00:04 GPGLL,4717.1126,N,00833.7862,E,140004.242,A33 14:00:04 GPGSA,A,3,06,17,25,22,30,10,,,,,,2.9,1.3,2.63A 14:00:04 GPGSV,2,1,07,06,58,062,45,17,52,161,44,25,45,239,44,22,35,301,447E 14:00:04 GPGSV,2,2,07,30,31,123,44,10,17,059,39,01,05,316,4E 14:00:04 GPRMC,140004.242,A,4717.1126,N,00833.7862,E,0.02,152.96,010201,OD 14:00:04 GPVTG,152.96,T,,M,0.02,N,0.0,K6B
In the following examples the characters marked red match the regular expression.
Example 1: Searching for the RMC with a valid position and all GGA Messages
"GP (GGA | RMC, .*, A,) "
14:00:03 $GPGGA,140003.242,4717.1126,N,00833.7862,E,1,06,1.3,543.0,M,,,,0000*09
14:00:03 $GPRMC,140003.242,A,4717.1126,N,00833.7862,E,0.03,80.59,010201,*36
14:00:04 $GPGGA,140004.242,4717.1126,N,00833.7862,E,1,06,1.3,542.0,M,,,,0000*OF
14:00:04 $GPRMC,140004.242,A,4717.1126,N,00833.7862,E,0.02,152.96,010201,*OD
Example 2: Searching for all GSV with the message index of '2' or '3' "GSV, .*, [2-3], "
14:00:03 $GPGSV,2,2,07,30,31,123,44,10,17,059,39,01,05,316,*4E
14:00:04 $GPGSV,2,2,07,30,31,123,44,10,17,059,39,01,05,316,*4E
Example 3: Searching for all messages starting with \$GP, which have a 'G' in the message identifier but not at the first position
"^(\$GP.+G.*,"
14:00:03 GPGGA,140003.242,4717.1126,N,00833.7862,E,1,06,1.3,543.0,M,,,000009 14:00:03 GPVTG,80.59,T,,M,0.03,N,0.1,K56 14:00:04 GPGGA,140004.242,4717.1126,N,00833.7862,E,1,06,1.3,542.0,M,,,0000OF 14:00:04 GPVTG,152.96,T,,M,0.02,N,0.0,K6B
Example 4: Searching for all message having a checksum of which the higher nibble is 3
"*3.\$"
14:00:03 GPGLL,4717.1126,N,00833.7862,E,140003.242,A34 14:00:03 GPGSA,A,3,06,17,25,22,30,10,,,,,,2.9,1.3,2.63A 14:00:03 GPRMC,140003.242,A,4717.1126,N,00833.7862,E,0.03,80.59,010201,,36 14:00:04 GPGLL,4717.1126,N,00833.7862,E,140004.242,A33 14:00:04 GPGSA,A,3,06,17,25,22,30,10,,,,,,2.9,1.3,2.6*3A
4.5.2 Packet Console
The Packet Console lists all incoming messages and provides information about message length and type.
text_image
12:21:45 UBX NAV-SVINFO, Size 208, 'Satellite Status and Information' 12:21:46 NMEA GPRMC, Size 73, 'Recommended Minimum Specific GNSS Data' 12:21:46 NMEA GPGLL, Size 52, 'Geographic Position - Latitude/Longitude' 12:21:46 UBX NAV-SDL, Size 60, 'Navigation Solution' 12:21:46 UBX NAV-SVINFO, Size 208, 'Satellite Status and Information' 12:21:47 NMEA GPRMC, Size 73, 'Recommended Minimum Specific GNSS Data' 12:21:47 NMEA GPGLL, Size 52, 'Geographic Position - Latitude/Longitude' 12:21:47 UBX NAV-SDL, Size 60, 'Navigation Solution' 12:21:47 UBX NAV-SVINFO, Size 208, 'Satellite Status and Information' 12:21:48 NMEA GPRMC, Size 74, 'Recommended Minimum Specific GNSS Data' 12:21:48 NMEA GPGLL, Size 52, 'Geographic Position - Latitude/Longitude' 12:21:48 UBX NAV-SDL, Size 60, 'Navigation Solution' 12:21:48 UBX NAV-SVINFO, Size 208, 'Satellite Status and Information' 12:21:49 NMEA GPRMC, Size 74, 'Recommended Minimum Specific GNSS Data' 12:21:49 NMEA GPGLL, Size 52, 'Geographic Position - Latitude/Longitude' 12:21:49 UBX NAV-SDL, Size 60, 'Navigation Solution' 12:21:49 UBX NAV-SVINFO, Size 208, 'Satellite Status and Information' 12:21:50 NMEA GPRMC, Size 74, 'Recommended Minimum Specific GNSS Data' 12:21:50 NMEA GPGLL, Size 52, 'Geographic Position - Latitude/Longitude'Figure 18: Packet Console
Refer to Section 4.5.1 for an explanation of the icons and text fields.
4.5.3 Binary Console
The Binary Console lists all incoming messages in binary and ASCII format.
| Binary Console | |||||||||||||||||
| 0030 | 16 | 32 | 00 | 04 | €200 | ||||||||||||
| 12:19:25 | 0000 | 24 | 47 | 50 | 52 | 4D | 43 | 2C | 31 | 12 | 31 | 39 | 32 | 35 | 2E | 30 30 | GPRMC, 121.925.00 |
| 0010 | 2C | 41 | 2C | 34 | 17 | 31 | 37 | 2E | 11 | 31 | 33 | 35 | 39 | 2C | 4E 2C | ,A,4717.11359,N, | |
| 0020 | 30 | 30 | 38 | 33 | 13 | 2E | 39 | 31 | 15 | 38 | 37 | 2C | 45 | 2C | 30 2E | O0833.91587,E,0. | |
| 0030 | 30 | 31 | 32 | 2C | 12 | 32 | 33 | 2E | 13 | 32 | 2C | 30 | 37 | 31 | 31 30 | 012, 223.32, 07110 | |
| 0040 | 32 | 2C | 2C | 34 | 41 | 2A | 36 | 36 | 0D | OA | 2, ,,,*6600 | ||||||
| 12:19:25 | 0000 | 24 | 47 | 50 | 47 | 4C | 4C | 2C | 34 | 17 | 31 | 37 | 2E | 31 | 31 33 35 | GPGLL, 4717.1115 | |
| 0010 | 19 | 2C | 45 | 2C | 30 | 30 | 38 | 33 | 13 | 2E | 39 | 31 | 35 | 38 37 2C | 9,N,00833.91587, | ||
| 0020 | 45 | 2C | 31 | 32 | 31 | 39 | 32 | 35 2E 30 | |||||||||
| 0030 | 36 35 00 04 | ||||||||||||||||
| 12:19:26 | 0000 | 24 47 50 52 4D 43 2C 31 12 31 39 32 36 2E 30 30 | |||||||||||||||
| 0010 2C 41 2C 34 17 31 37 2E 11 31 33 35 19 2C 45 2C | |||||||||||||||||
| 0020 30 30 38 33 13 2E 39 31 15 38 35 2C 45 2C 30 2E | |||||||||||||||||
| 0030 30 30 37 2C 12 32 33 2E 13 32 2C 30 37 31 31 30 | |||||||||||||||||
| 0040 32 2C 2C 41 2A 36 33 0D OA | |||||||||||||||||
| 12:19:26 | 0000 24 47 50 47 4C 4C 2C 34 17 31 37 2E 11 31 33 35 $GPGLL,4717.1115 | ||||||||||||||||
| 0010 19 C/ C/ C/ C/ C/ C/ C/ C/ C/ C/ C/ C/ C/ C/ C/ C/ C/ C/ C/ C/ C/ C/ C/ C/ C/ C/ C/ C/ C/ C/ C/ C/ C/ C/ C/ C/ C/ C/ C/ C/ C/ C/ C/ C/ C/ C/ C/ C/ C/ C/ C/C/A*6400 | |||||||||||||||||
Figure 19: Binary Console
Refer to section 4.5.1 for an explanation of the icons and text fields.
4.5.4 Message View
The Message View is utilized to communicate with the GPS receiver. Receiver output messages (e.g. navigation output, status and debug information) are displayed; input messages (e.g. configuration messages) can be sent. There are different sections for NMEA and UBX protocol.
Message Tree
A list of all NMEA and UBX message
Toolbar
text_image
Messages - [NMEA - GPSGA (Global Positioning System Fix Data)] NMEA - GPSGA (Global Positioning System Fix Data) Parameter Value Unit Description UTC 12131.00 hmmss.xx Universal time coordinated Lat 4712.11300 dimunlumans Latitude Hemisphere N Nat/North, 5x South Lion 00030.91586 Stocklmums Longitude Hemisphere E East, W/Av/est Status 1 Denyaid, 1x20/3D, 2xDGPS 5Vs Used 7 Number of SVs used for Navigation DOF 1.02 Dilution of precision HDPG or PDGP AI (MSL) 430.2 mm Altitude (above means zeelvel) Unit M McMeters Good Sep. M $m Good Operation = AM(MAE) - AM(MSL) Unit M McMeters Age of DGPS Cons s,Age of Differential Correctors DGPS Ref Station ID of DGPS Reference Station COS (Configuration) CAT (Optim) PAS (Fix Mode) INF (In'Postes) RSG (Messages) RAW (Navigation) RTI (Ports) RATE (Rates) 0000 24 47 50 47 47 41 2C 31 32 31 33 4GPGGA, 1215 0008 31 31 2E 30 30 2C 34 37 31 37 2K 11.00, 4717. 0016 31 31 33 30 30 2C 42 2C 30 10 30 1130B,N,000 0021 33 33 2E 39 31 39 34 36 2C 45 2C 13,9156,K, 002C 31 2C 37 2C 31 28 30 32 2C 34 39 1,7,1,01,49 0037 30 2E 12 2C 40 2C 34 38 2E 10 2C 0.2,N,48.0, 0042 4D 2C 2C 30 A 38 33 OVOA N,,D*5800Message Display
Displays the message content.
Hex Dump
Displays the message content in hexadecimal and ASCII form.
Figure 20: Message View
| Element Name Description | |
| Lock Prevents the Message View from being updated with new data when locked. | |
| Clear All Erases the entire Message View. | |
| Send Sends the current message to the GPS receiver. | |
| Poll Polls the selected message once. | |
| Auto poll Automatically polls a newly selected message once | |
| Message Hotkey Assigns a hotkey to the selected message |
Table 4: Description of the buttons in the Message View
4.5.4.1 Receiver Output Messages

text_image
Message Tree Black messages have recently been updated; grey messages have not been updated. Selected Message Blue shaded if mes-sage has been received from the GPS recently otherwise grey. Last Update Time in seconds since last update. Message Content Hex Dump 0000 B5 62 C1 01 14 pb 0005 00 28 3A 28 11 D( : )Figure 21: Message Display of an output message

Note Double-clicking on an output message enables or disables the periodic message update if the communication protocol is active. This feature is currently only supported for the UBX protocol.
4.5.4.2 Receiver Input Messages
Input messages can be edited and sent to the GPS receiver from the Message View. It is also possible to poll the current receiver settings.
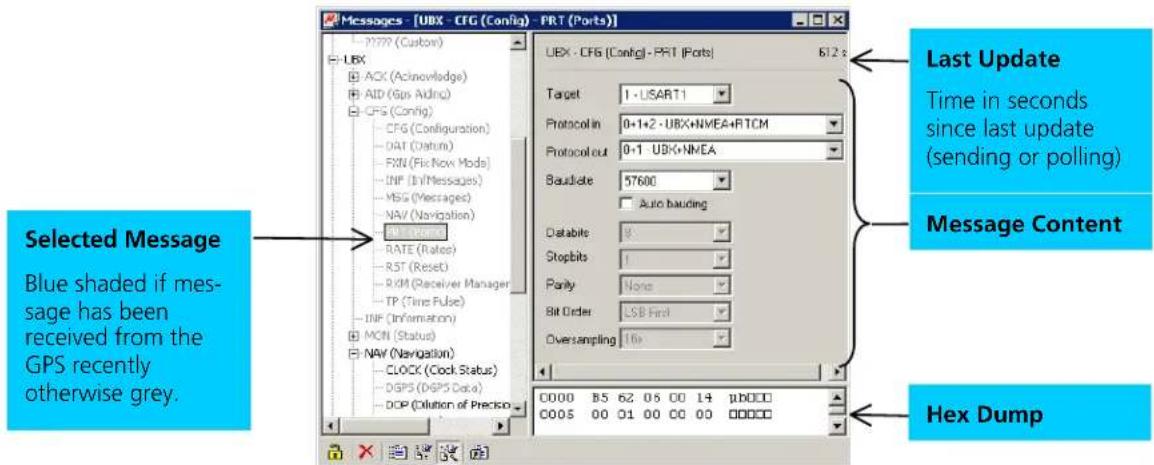
text_image
Messages - [UBX - CFG (Config) - PRT (Ports)] - 177P (Custom) - UBX - AOC (Acnovlodge) - AID (Gin Aidnc) - CFG (Config) - CFG (Configuration) - DAT (Datum) - FXN (Fix Now Mode) - INP (In Messages) - MSG (Messages) - NAV (Navigation) - NAV (Status) - RATE (Rate) - RST (Reset) - RPM (Receiver Manager) - TP (Time Pulse) - INP (Information) - MCN (Status) - NAV (Navigation) - CLOCK (Clock Status) - DGPS (DGPS Data) - DOP (Definition of Precision) UBX - CFG (Config) - PRT (Ports) 612 s Target 1 - USART1 Protocol in 0+1+2 -UBX+NMEA+RTCM Protocol out 0+1 UBX+NMEA Bauslate 57600 Auto bauding Databile 9 Stopbits 1 Parity None Bit Order LSB First Oversampling 16s C000 B5 62 06 00 14 pbDCD C005 00 01 00 00 00 00000 Last Update Time in seconds since last update (sending or polling) Message Content Hex Dump Selected Message Blue shaded if mes- sage has been received from the GPS recently otherwise grey.Figure 22: Message Display of an input message

Note
u-center performs some range checks on input messages. If an input value exceeds the permitted range, u-center will highlight the field in red but it is still possible to send the value to the receiver. However, the receiver is likely to reject such a message.
4.5.4.3 Custom Messages
u-center supports custom messages in ASCII, NMEA and UBX framing. This enables ANTARIST™ SCKit customers to test their proprietary input messages with u-center.
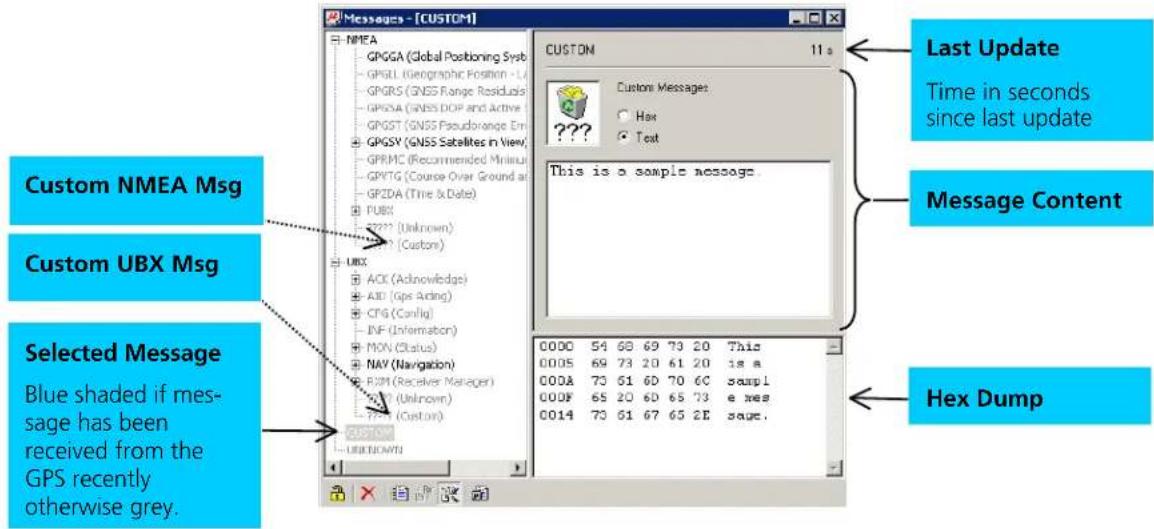
text_image
Messages - [CUSTOM] NMEA GP GGA (Global Positioning System) GP GLL (Geographic Position - L) GP GRS (GNSS Range Residuals) GP GSA (GNSS DOP and Active) GP GGT (GNSS Pseudorange Em GP GSY (GNSS Satellites in View) GPRMC (Recommended Minus GP VTG (Course Over Ground at GP ZDA (Time & Date) P UBX ? ? ? ? (Unknown) ? ? ? ? (Custom) U BX ACK (Acknowledge) AID (Ops Acting) CFG (Config) INF (Information) MON (Status) NAV (Navigation) R PM (Receiver Manager) S PC3 (Unknown) T PS3 (Custom) CUSTON USE CUSTON CUSTOM 11 a Custom Messages: Hex Text This is a sample message. Last Update Time in seconds since last update Message Content Selected Message Blue shaded if mes- sage has been received from the GPS recently otherwise grey. 0000 54 68 69 73 20 This 0005 69 73 20 61 20 is a 000A 73 61 60 70 6C sampl 000F 65 20 60 65 73 e nes 0014 73 61 67 65 2E saue. Hex DumpFigure 23: Message Display of custom message

Note
The Message View automatically calculates the necessary checksums for custom NMEA or UBX messages.
4.5.5 Statistic View
All available GPS values (transmitted from the GPS receiver or calculated by u-center) are displayed. The following statistics are displayed:
- Current Value
- Minimum Value
• Maximum Value - Average Value
• Standard Deviation
Grey color: the value was not set for the current epoch Empty field: data is not available
| Statistic View | ||||||||
| Title | Count | Current | Maximum | Maximum | Average | Deviation | Unit | Description |
| UTC | 23197 | 02/14/2001 13:53:59.309 | 02/14/2001 07:27:24.534 | 02/14/2001 13:53:59.309 | time due | Time UTC | ||
| GPS line | 23197 | 77.3052.305 | 77.3052.305 | 77.3052.305 | wno low | Time GPS | ||
| Lat | 23197 | 47.285206 | 47.285178 | 47.285283 | 47.285226 | 0.000023 | * | Position LTP Latitude |
| Lon | 23197 | 8555.85 | 8555.202 | 8555.323 | 8555.253 | 0.000021 | * | Position LTP Longitude |
| Alt (HAE) | 23197 | 550.70 | 530.00 | 581.40 | 547.01 | 13.09 | m | Position LTP Altitude (above ellipsoid) |
| Alt (MSL) | 23197 | 502.53 | 481.83 | 533.23 | 438.83 | 13.09 | m | Position LTP Altitude (above mean sea level) |
| X | 23197 | 4266102.52 | 426636.76 | 4266106.98 | 4266101.08 | 1.55 | m | Position ECEF X |
| Y | 23197 | 645566.00 | 645548.79 | 645568.58 | 645563.30 | 1.52 | m | Position ECEF Y |
| Z | 23197 | 6346918.90 | 6346918.99 | 6346918.93 | 6346918.91 | 1.30 | m | Position ECEF Z |
| VX | 0 | m/s | Velocity ECEF X | |||||
| VY | 0 | m/s | Velocity ECEF Y | |||||
| VZ | 0 | m/s | Velocity ECEF Z | |||||
| VN | 23197 | -0.05 | -0.06 | 0.06 | 0.01 | 0.01 | m/s | Velocity LTP North |
| VE | 23197 | 0.05 | -0.07 | 0.08 | 0.01 | 0.01 | m/s | Velocity LTP East |
| VD | 0 | m/s | Velocity LTP Down | |||||
| Speed | 0 | m/s | Speed | |||||
| SolG | 23197 | 0.97 | 0.00 | 0.08 | 0.02 | 0.01 | m/s | Speed over Ground |
| CoS | 23197 | 134.01 | 180.04 | 180.00 | 40.10 | 77.53 | Course over Ground | |
| HDOP | 23197 | 0.9 | 0.9 | 2.3 | 1.1 | 0.2 | DOP Horizontal | |
| VOOP | 23197 | 1.3 | 1.1 | 3.2 | 1.7 | 0.4 | DOP Vertical | |
| GDOP | 0 | DOP Geometric | ||||||
| TOOP | 0 | DOP Time | ||||||
| POOP | 23197 | 1.6 | 1.4 | 3.9 | 2.0 | 0.4 | DOP Position | |
Figure 24: Statistic View
! Note Choosing Database Empty in the File Menu or pressing the Button deletes the Statistic View.
! Note The content of the Statistic View can easily be exported to other programs using Copy/Paste.
4.5.6 Table View
All values from the database can be displayed in a tabular form (Figure 25). This is very useful when analysing logfile in detail.
| Index | UTC | Lat | Lon | Alt (HAE) | PDOP | Used SVs |
| 24613 | C2/14/2001 14:17:55.230 | 47 285215 | 8 965266 | 545.66 | 1.6 | 3,5,10,17,22,23,25,28 |
| 24614 | C2/14/2001 14:17:56.230 | 47 285209 | 8 965264 | 546.34 | 1.6 | 3,5,10,17,22,23,25,28 |
| 24615 | C2/14/2001 14:17:57.230 | 47 285209 | 8 965264 | 546.34 | 1.6 | 3,5,10,17,22,23,25,28 |
| 24616 | C2/14/2001 14:17:58.230 | 47 285209 | 8 965264 | 546.34 | 1.6 | 3,5,10,17,22,23,25,28 |
| 24617 | C2/14/2001 14:17:59.230 | 47 285209 | 8 965264 | 546.34 | 1.6 | 3,5,10,17,22,23,25,28 |
| 24618 | C2/14/2001 14:18:00.230 | 47 285209 | 8 965264 | 546.34 | 1.6 | 3,5,10,17,22,23,25,28 |
| 24619 | C2/14/2001 14:18:01.230 | 47 285209 | 8 965264 | 546.34 | 1.6 | 3,5,10,17,22,23,25,28 |
| 24620 | C2/14/2001 14:18:02.230 | 47 285215 | 8 965266 | 545.66 | 1.6 | 3,5,10,17,22,23,25,28 |
| 24621 | C2/14/2001 14:18:03.230 | 47 285215 | 8 965266 | 545.66 | 1.6 | 3,5,10,17,22,23,25,28 |
| 24622 | C2/14/2001 14:18:04.230 | 47 285209 | 8 965264 | 546.34 | 1.6 | 3,5,10,17,22,23,25,28 |
| 24623 | C2/14/2001 14:18:05.230 | 47 285209 | 8 965264 | 546.34 | 1.6 | 3,5,10,17,22,23,25,28 |
| 24624 | C2/14/2001 14:18:06.230 | 47 285209 | 8 965264 | 546.34 | 1.6 | 3,5,10,17,22,23,25,28 |
| 24625 | C2/14/2001 14:18:07.230 | 47 285209 | 8 965264 | 546.34 | 1.6 | 3,5,10,17,22,23,25,28 |
Figure 25: Table View
To add a new column, first select the desired value (Figure 26) and click the + Button. To remove a displayed value, click the - Button. To see the Table header click the 📄 Button.
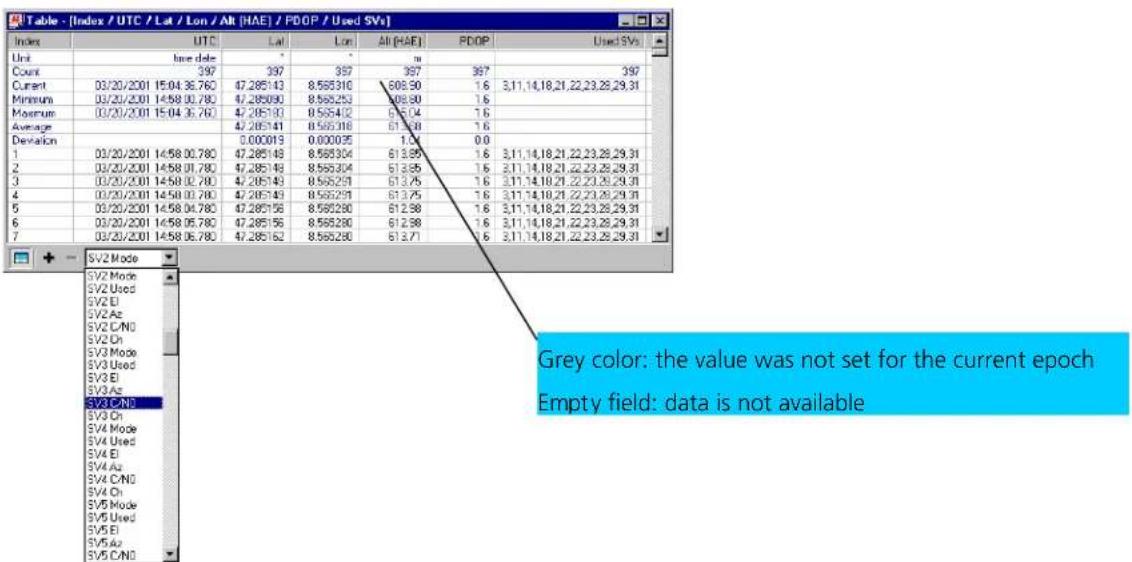
text_image
Table - [Index / UTC / Lat / Lon / Alt (HAE) / PDOP / Used SVs] Index Unit Unit date Count Current Minimum Maximum Average Deviation 1 2 3 4 5 6 7 SV2 Mode SV2 Mode SV2 Used SV2 El SV2 Az SV2 C/N0 SV2 Ch SV2 Mode SV3 Used SV3 El SV3 Az SV3 C/N0 SV3 Ch SV4 Mode SV4 Used SV4 El SV4 Az SV4 C/N0 SV4 Ch SV5 Mode SV5 Used SV5 El SV5 Az SV5 C/N0 PV2 Mode PV2 Used PV2 El PV2 Az PV2 C/N0 PV2 Ch PV2 Mode PV3 Used PV3 El PV3 Az PV3 C/N0 PV3 Ch PV4 Mode PV4 Used PV4 El PV4 Az PV4 C/N0 PV4 Ch PV5 Mode PV5 Used PV5 El PV5 Az PV5 C/N0 PV5 Ch PV5 Use PV5 El PV5 Az PV5 C/N0 PV5 Ch PV5 Use PV5 El PV5 Az PV5 C/N0 PV5 Ch PV5 Use PV5 El PV5 Az PV5 C/N0Figure 26: Selecting a new value

Note
The number of displayed epochs is limited to 1800 by default (3.2.5 Database Limitation).

Note
Choosing Database Empty in the File Menu or pressing the Button deletes the Table View.

Note
The content of the Statistic View can easily be exported to other programs using Copy/Paste.
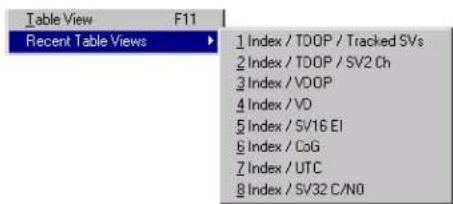
text_image
Table View F11 Recent Table Views 1 Index / T00P / Tracked SVs 2 Index / T00P / SV2 Ch 3 Index / V00P 4 Index / VD 5 Index / SV16 EI 6 Index / CoG 7 Index / UTC 8 Index / SV32 C/N0With the function Recent Table View one of the last 8 used tables can be selected (Figure 27) and displayed.
Figure 27: Recently used tables
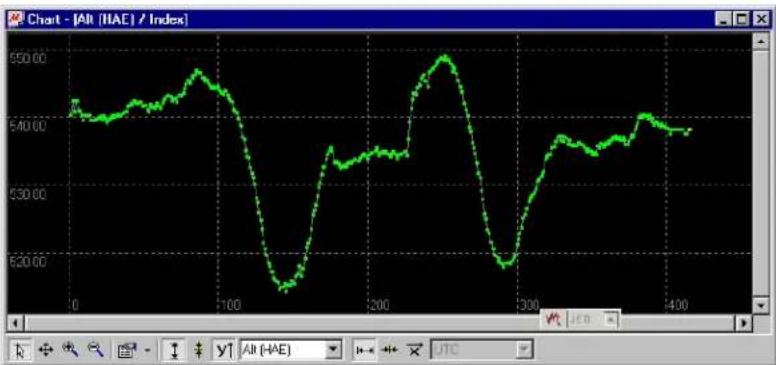
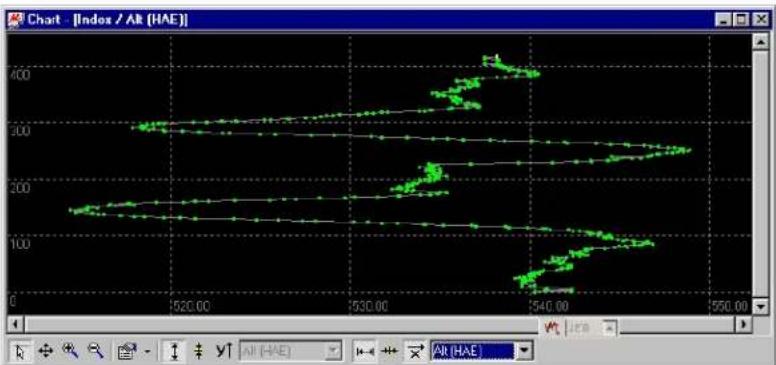
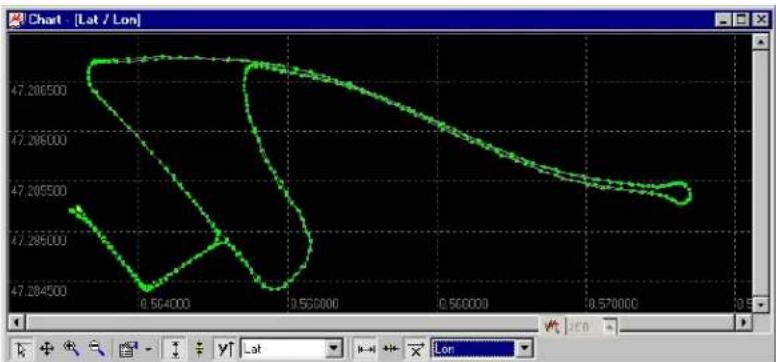
4.5.7 Chart View
Chart View allows the user to conveniently view GPS-Data records in graphical form. The data can be scaled in many different ways and formats. It's even possible to print the entire chart.
The examples below illustrate 3 different typical applications
line
| X | Y | | ---- | ------ | | 0 | 540.00 | | 50 | 545.00 | | 100 | 530.00 | | 150 | 520.00 | | 200 | 535.00 | | 250 | 550.00 | | 300 | 520.00 | | 350 | 540.00 | | 400 | 545.00 |Figure 28: Altitude as a function of Index (X = Index, Y = Alt)
line
| Index | HAE | |-------|-----| | 520.00 | 150 | | 525.00 | 160 | | 530.00 | 170 | | 535.00 | 180 | | 540.00 | 190 | | 545.00 | 200 | | 550.00 | 210 |Figure 29: Index as a function of Altitude (X = Altitude, Y = Index)
line
| x | y | | -------- | ------- | | 0.564000 | 47.284500 | | 0.566000 | 47.286000 | | 0.568000 | 47.286500 | | 0.570000 | 47.286500 | | 0.572000 | 47.286500 | | 0.574000 | 47.286500 | | 0.576000 | 47.286500 | | 0.578000 | 47.286500 | | 0.580000 | 47.286500 | | 0.582000 | 47.286500 | | 0.584000 | 47.286500 | | 0.586000 | 47.286500 | | 0.588000 | 47.286500 | | 0.590000 | 47.286500 | | 0.592000 | 47.286500 | | 0.594000 | 47.286500 | | 0.596000 | 47.286500 | | 0.598000 | 47.286500 | | 0.600000 | 47.286500 | | 0.602000 | 47.286500 | | 0.604000 | 47.286500 | | 0.606000 | 47.286500 | | 0.608000 | 47.286500 | | 0.610000 | 47.286500 | | 0.612000 | 47.286500 | | 0.614000 | 47.286500 | | 0.616000 | 47.286500 | | 0.618000 | 47.286500 | | 0.620000 | 47.286500 | | 0.622000 | 47.286500 | | 0.624000 | 47.286500 | | 0.626000 | 47.286500 | | 0.628000 | 47.286500 | | 0.630000 | 47.286500 | | 1.1 | 47.2865 | | 1.1 | 47.286 | | 1.1 | 47.286 | | 1.1 | 47.286 | | 1.1 | 47.286 | | 1.1 | 47.286 | | 1.1 | 47.286 | | 1.1 | 47.286 | | 3.1 | 47.286 | | 3.1 | 47.286 | | 3.1 | 47.286 | | 3.1 | 47.286 | | 3.1 | 47.286 | | 3.1 | 47.286 | | 3.1 | 47.286 | | 13 | 47.286 | | 13 | 47.286 | | 13 | 47.286 | | 13 | 47.286 | | 13 | 47.286 | | 13 | 47.286 | | 13 | 47.286 |Figure 30: Latitude as a function of Longitude (X = Longitude, Y = Latitude)
| Element Name Description | ||
 | Cursor The cursor position is shown in the lower left edge of the u-center windows. Click the right button mouse and hold the button down to measure differences. | |
 | Move The chart is moved inside the Chart View Window. Click and Drag/Drop the Chart. | |
 | Zoom In Drawing a rectangle enlarges the chart to the new view. To zoom in the Chart 2x click on the chart | |
 | Zoom Out Drawing a rectangle decreases the chart to the new view. To zoom out the Chart 2x click on the chart | |
 | Drawing Mode The size and form of the displayed values can be changed in the menu points; the connection line between the values can be selected in the menu Connect. For viewing the statically values (average, minimum, maximum, standard deviation) directly in the chart select the Statistics Menu | |
 | Fit Y Fit the Y Range | |
 | Follow Y Follow the most current Y-Value (the most current Y-value is always in the middle of the chart) | |
| [GZAB] | Index or Y Value Switch between the Index and the Y Value | |
 | Y Value Select the Y Value to be displayed | |
 | Fit X Fit the X Range | |
 | Follow X Follow the most current X-Value (the most current X-Value is always in the middle of the chart) | |
 | Index or X Value Switch between the Index and the X Value | |
 | X Value Select the X Value to be displayed | |
 | Moving Average | Adds a moving average. The average is calculated over the number of most recent values, specified with the parameter. |
Table 5: Description of the buttons and displays in Chart View

Note
The number of displayed epochs is limited to 1800 by default (see also section 3.2.5).
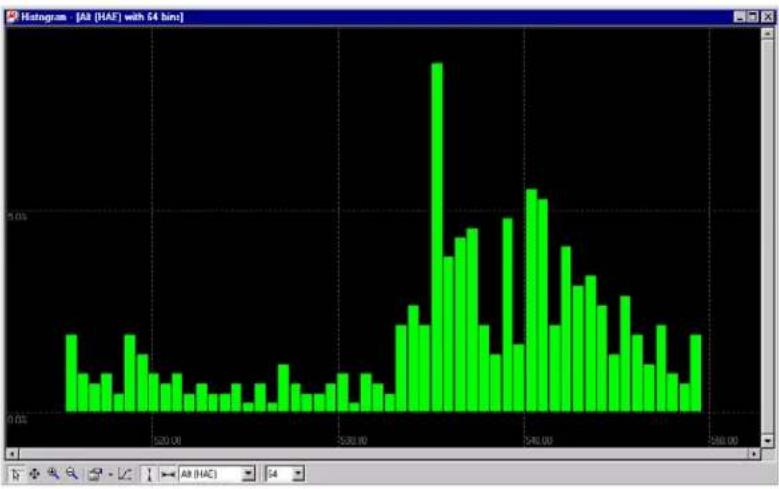
4.5.8 Histogram View
Histogram Views allow the user to view GPS-Data and probability distributions (Figure 31) and print the entire histogram if desired. The number of bins (storage container) is user-defined.
histogram
| Bin Range | Frequency | | --------------- | --------- | | 200.00 - 201.00 | 0.01 | | 201.00 - 202.00 | 0.01 | | 202.00 - 203.00 | 0.01 | | 203.00 - 204.00 | 0.01 | | 204.00 - 205.00 | 0.01 | | 205.00 - 206.00 | 0.01 | | 206.00 - 207.00 | 0.01 | | 207.00 - 208.00 | 0.01 | | 208.00 - 209.00 | 0.01 | | 209.00 - 210.00 | 0.01 | | 210.00 - 211.00 | 0.01 | | 211.00 - 212.00 | 0.01 | | 212.00 - 213.00 | 0.01 | | 213.00 - 214.00 | 0.01 | | 214.00 - 215.00 | 0.01 | | 215.00 - 216.00 | 0.01 | | 216.00 - 217.00 | 0.01 | | 217.00 - 218.00 | 0.01 | | 218.00 - 219.00 | 0.01 | | 219.00 - 220.00 | 0.01 | | 220.00 - 221.00 | 0.5 | | 221.00 - 222.00 | 1.5 | | 222.00 - 223.00 | 3.5 | | 223.00 - 224.00 | 5.5 | | 224.00 - 225.00 | 7.5 | | 225.00 - 226.00 | 9.5 | | 226.00 - 227.00 | 8.5 | | 227.00 - 228.00 | 7.5 | | 228.00 - 229.00 | 6.5 | | 229.00 - 230.00 | 5.5 | | 230.00 - 231.00 | 4.5 | | 231.00 - 232.00 | 3.5 | | 232.00 - 233.00 | 2.5 | | 233.00 - 234.00 | 1.5 | | 234.00 - 235.00 | 1.5 | | 235.00 - 236.00 | 1.5 | | 236.00 - 237.00 | 1.5 | | 237.00 - 238.00 | 1.5 | | 238.00 - 239.00 | 1.5 | | 239.00 - 240.00 | 1.5 | | 240.00 - 241.00 | 1.5 | | 241.00 - 242.00 | 1.5 | | 242.00 - 243.00 | 1.5 | | 243.00 - 244.00 | 1.5 | | 244.00 - 245.00 | 1.5 | | 245.00 - 246.00 | 1.5 | | 246.00 - 247.00 | 1.5 | | 247.00 - 248.00 | 1.5 | | 248.00 - 249.00 | 1.5 | | 249.00 - 250.00 | 1.5 | | 250.00 - 251.00 | 1.5 | | Note: The actual values may vary due to the random nature of the data generation.Figure 31: Altitude Histogram View
| Element Name Description | ||
 | Cursor The cursor position is shown in the lower left edge of the u-center windows. Click the right button mouse and hold the button down to measure differences. | |
 | Move The Histogram is moved inside the Histogram View Window.Click and Drag/Drop the Histogram. | |
| [287B] | Zoom In Drawing a rectangle enlarges the Histogram to the new view. To zoom in the Histogram 2x click on the Histogram | |
| [KKBW] | Zoom Out Drawing a rectangle decreases the Histogram to the new view.To zoom out the Histogram 2x click on the Histogram | |
 | Drawing Mode The size and form of the displayed values can be changed in the menu Points. The connection line between the values can be selected in the menu Connect. For viewing the statically values (average, minimum, maximum, standard deviation) directly in the Histogram select the Statistics Menu | |
 | Probability Display the probability Histogram (Figure 32) | |
 | Fit Probability Fit the Probability Range | |
 | Fit X Fit the X Range | |
 | Y Value Select the Y | Value to be displayed |
 | Bins | The number of Bins |
Table 6: Description of the buttons and displays in Histogram View

line
| X Value | Y Value | | ------- | ------- | | 530.00 | 0.0% | | 530.25 | 0.1% | | 530.50 | 0.2% | | 530.75 | 0.3% | | 531.00 | 0.4% | | 531.25 | 0.5% | | 531.50 | 0.6% | | 531.75 | 0.7% | | 532.00 | 0.8% | | 532.25 | 0.9% | | 532.50 | 1.0% | | 532.75 | 1.1% | | 533.00 | 1.2% | | 533.25 | 1.3% | | 533.50 | 1.4% | | 533.75 | 1.5% | | 534.00 | 1.6% | | 534.25 | 1.7% | | 534.50 | 1.8% | | 534.75 | 1.9% | | 535.00 | 2.0% | | 535.25 | 2.1% | | 535.50 | 2.2% | | 535.75 | 2.3% | | 536.00 | 2.4% | | 536.25 | 2.5% | | 536.50 | 2.6% | | 536.75 | 2.7% | | 537.00 | 2.8% | | 537.25 | 2.9% | | 537.50 | 3.0% | | 537.75 | 3.1% | | 538.00 | 3.2% | | 538.25 | 3.3% | | 538.50 | 3.4% | | 538.75 | 3.5% | | 539.00 | 3.6% | | 539.25 | 3.7% | | 539.50 | 3.8% | | 539.75 | 3.9% | | 540.00 | 4.0% | | 540.25 | 4.1% | | 540.50 | 4.2% | | 540.75 | 4.3% | | 541.00 | 4.4% | | 541.25 | 4.5% | | 541.50 | 4.6% | | 541.75 | 4.7% | | 542.00 | 4.8% | | 542.25 | 4.9% | | 542.50 | 5.0% | | 542.75 | 5.1% | | 543.00 | 5.2% | | 543.25 | 5.3% | | 543.50 | 5.4% | | 543.75 | 5.5% | | 544.00 | 5.6% | | 544.25 | 5.7% | | 544.50 | 5.8% | | 544.75 | 5.9% | | 545.00 | 6.0% | | 545.25 | 6.1% | | 545.50 | 6.2% | | 545.75 | 6.3% | | 546.00 | 6.4% | | 546.25 | 6.5% | | 546.50 | 6.6% | | 546.75 | 6.7% | | 547.00 | 6.8% | | 547.25 | 6.9% | | 547.50 | 7.0% | | 547.75 | 7.1% | | 548.00 | 7.2% | | 548.25 | 7.3% | | 548.50 | 7.4% | | 548.75 | 7.5% | | 549.00 | 7.6% | | 549.25 | 7.7% | | 549.50 | 7.8% | | 549.75 | 7.9% | | 550.00 | - |Figure 32: Probability Chart

Note
The number of displayed epochs is limited to 1800 by default (see also section 3.2.5).
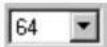
4.5.9 Deviation Map
The Deviation Map displays positions in longitude and latitude relative to a defined reference position.
text_image
Deviation Map min de avg+ dmax W 2.5m E 5.0m avg dev min 47.285239° 8.565272°Figure 33: Deviation Map
| Element Name Description | ||
| Properties The Reference Position can be defined as:The average of all previously measured positionsThe current positionA fixed, predefined valueThe radius of the outer circle can be adjusted with the Max.Deviation parameter. | ||
| Fit Automatically adjusts the Reference Position and the Max.Deviation to fit all positions into the Deviation Map. | ||
| Track | ||
| Statistics | ||
Table 7: Description of the buttons and displays in Deviation Map
! Note The number of displayed epochs is limited to 1800 by default (Section 3.2.5).
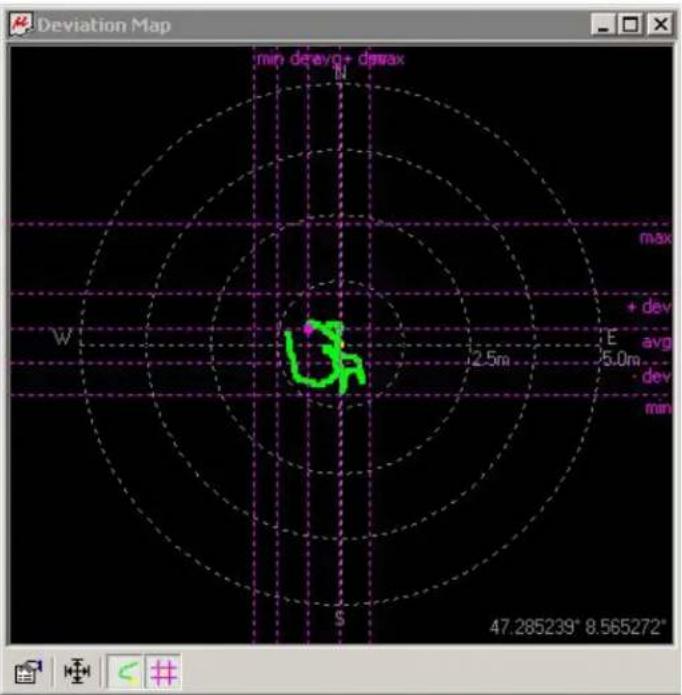
4.5.10 Map View
u-center can display positions on pre-calibrated maps (Figure 34). This allows a basic analysis of road tests.
text_image
Map - [office.png , 1024-509 . 8 bits/pixel , Image: 509 KB , File: 28 KB] Jelux AG, 2nd and one Gk, C4-8300 Travel, Switzerland - http://www.ebc.com.cnFigure 34: Displaying a position
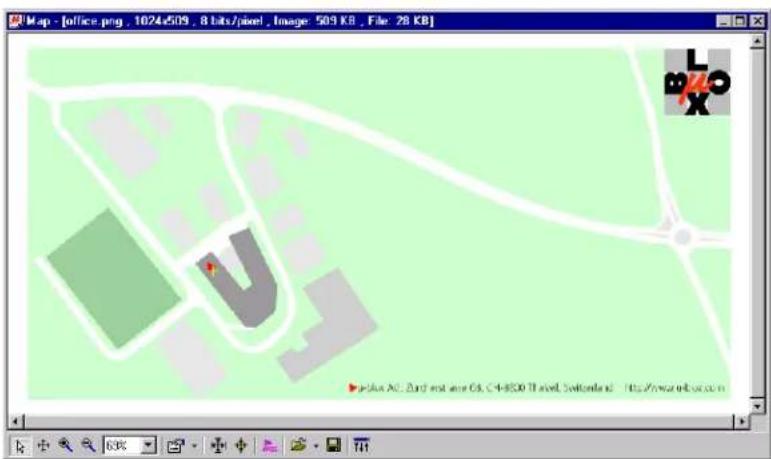
4.5.10.1 Using Map View
You can access the view specific commands in two different ways:
• Using the command in the Tool Bar below the Map View.
- Holding the cursor inside the Map View and pressing the right mouse button will. This will open a context menu:
text_image
Zoom Factor Adjust Colors None Points Connect Statistics Cursor Move Zoom In Zoom Quit Fit Map Markers Follow Drawing Mode Open Map... Recent Maps Save Map View... Copy| Element Name Description | ||
 | Cursor The position of the cursor is shown on the lower left edge of the u-center screen (Longitude, Latitude and Pixel-Position). By holding the left mouse button and moving the cursor over the map you can measure distance from one position to another | |
 | Move The map inside the Map View Window can be moved | |
 | Zoom In The map is enlarged by selecting a rectangle | |
 | Zoom Out The size of the Map is decreased | |
 | Zoom Factor Different specific zoom level can be selected | |
 | Drawing Mode The size and form of the displayed position can be changed; the connection line between the points can be selected in the menu Connect. To see statically values (average, minimum, maximum, standard deviation) directly in the map, select the Menu Statistic. | |
 | Fit Map The map size is adjusted to fit the Map Window | |
 | Follow Center the map on the current GPS position | |
 | Markers Add or remove the defined markers (see also 4.5.10.3 Map Calibration) | |
 | Open Map Load a new or one of 8 recently used maps. | |
 | Save Map View The current display can be stored in different formats | |
 | Adjust Colors | Brightness, contrast and color saturation of map can be adjusted by moving the glides |
Table 8: Description of the buttons and displays in Map View
! Note Map Views can be copied to the clipboard using the 'Print Screen' function.
! Note Choosing Database Empty in the File Menu or pressing the Button deletes all recently displayed positions and routes.
4.5.10.2 Application example: Reviewing a road test
Figure 35: Logfile from a road test
4.5.10.3 Map Calibration
To create your own map you will need a digitized map or pictures with orthogonal projection in one of the following pixel graphics formats.
- png Portable Network Graphics,
- bmp Windows Bitmap
• dib Device Independent Bitmap
• jpg/jpeg Jpeg File Interchange Format - pcx PC paintbrush
- tif Tag Image File Format
If your map is not in one of the above formats, you can simply convert it in one of the supported formats by a third party program. u-blox provides two sample maps. Office.png is a small map of our headquarters surrounding. World.png is a map of the whole world but with limited resolution.
To use a map in u-center, three calibration points are needed. For these points you have to know the pixel coordinates and the according WGS84 coordinates in the latitude/longitude format in degrees (longitude: -180.0 to 180.0, latitude: -90.0 to 90.0). These points are stored in the map calibration file. The calibration file must be stored at the same location as the bitmap itself. It has the same name but a different extension (*.mcf). The Format of the calibration file is very simple and can be edited in a simple editor like notepad.
Examples:
As an example we will have a closer look at the provided map 'world.png' and its calibration file 'world.mcf'.
natural_image
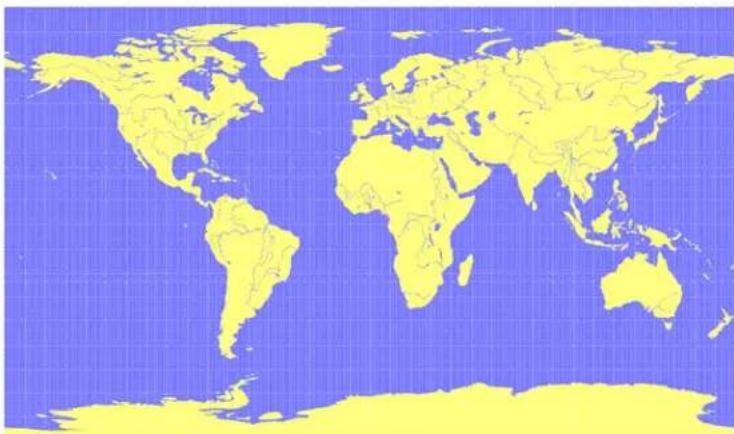
World map with yellow outline on blue grid background, no text or labels visibleDigital Map File: world.png
The Map has 1765 Pixels (0 to 1764) in the horizontal and 1046 Pixels (0 to 1045) in the vertical direction. The origin is the upper left corner. To calibrate this map we will use the following three calibration points (#1 to #3).
| Pixel WGS84 Coordinate | |||||
| Reference Point # X Y Latitude Longitude | |||||
| Upper Left Corner | 1 | 0 | 0 -180.0 | ||
| Lower Right Corner | 2 | 1764 | 1045 | 180.0 | -90.0 |
| Upper Right Corner | 3 | 1764 | 0 | 180.0 | 90.0 |
To determine the exact pixel position you can use Microsoft Paint (mspaint.exe) or any other pixel-editing program.
The calibration file is a plain ASCII text file. The file may contain comments. The file consists of two sections, which start with keywords encapsulated in braces.
The REFERENCE section, which is mandatory, contains the three points used to calibrate a map. Each reference point is on a single line and has the following syntax:
$$ # = < x >, \quad < y >, \quad < l o n >, \quad < l a t > ^ {\prime \prime} $$
where # is the index of the reference point
The MARKER section, which is optional, defines additional points on the map. Each point is on a single line with the syntax:
$$ \text {" # = i, < x > , < y > [, < t e x t > ]"} \text { or } \text {" # = c, < l a t > , < l o n > [, < t e x t > ]"} $$
where # is the index of the marker point
; INFO
;
; File: world.mcf
; Source: (sample data set)

; REFERENCE
;
; 3 Points must be defined to calibrate a Map
; Parameters:
; # = index of the point (1 to 3)
; x,y = image coordinates
; lat,lon = world coordinates
; Syntax:
; # = <x>, <y>, <lon>, <lat>

[REFERENCE]
1 = 0, 0, -180.0, 90.0
2 = 1764, 1045, 180.0, -90.0
3 = 1764, 0, 180.0, 90.0

; MARKER
;
; You can add points (image or world coord) to the map
; Parameters:
; num = number of markers that follow
; # = index of the point (1 to num)
; type = c for world or i image coordinates
; x,y = image coordinates
; lat,lon = world coordinates
; text = quoted text decription to the marker (optional)
; Syntax:
; Count = <num>
; # = <type>, <x|lon>, <y|lat>[,<text>]

[MARKER]
Count = 1
1 = c, 8.56525, 47.28519444, "u-blox ag"
Map Calibration File: world.mcf
4.5.11 Sky View
Sky View is an excellent tool for analyzing the performance of antennas as well as the conditions of the satellite observation environment. The polar plot graphically displays the averaged relative satellite signal strength (Figure 36), the position of satellites in the sky, identifies satellites by number and indicates which satellites are being used in the receiver calculation (see Section 3.1).

radar
Sky View | Direction | Value | | :--- | :--- | | N | 14 | | 0° | 28 | | 15° | 33 | | 30° | 33 | | 45° | 34 | | 60° | 39 | | 75° | 29 | | E | 32 | | 105° | 14 | | 120° | 40 | | 135° | 39 | | 150° | 33 | | 165° | 33 | | S | 30 | | 195° | 32 | | 210° | 20 | | 225° | 40 | | 240° | 40 | | 255° | 40 | | W | 40 | | 285° | 31 | | 300° | 28 | | 315° | 45 | | 330° | 41 | | 345° | 41 | | N | 14 | | 0° | 28 | | 15° | 33 | | 20° | 41 | | 21° | 21 | | 22° | 40 | | 23° | 41 | | 24° | 40 | | 25° | 40 | | 26° | 40 | | 27° | 40 | | 28° | 40 | | 29° | 40 | | 30° | 40 | | 31° | 40 | | 32° | 40 | | 33° | 40 | | 34° | 40 | | 35° | 40 | | 36° | 40 | | N | 14 | | 0° | 28 | | 15° | 33 | | 20° | 41 | | 21° | 21 | | 22° | 40 | | 23° | 41 | | 24° | 40 | | 25° | 40 | | 26° | 40 | | 75° | 29 | | E | 32 | | (Note: The image contains multiple data points) and labels in the center, but the chart structure is to be a polar coordinate system.Figure 36: Sky View
| Element Name Description | ||
 | Linear Selects a linear projection of the Sky View | |
 | Sine Selects a sinusoidal Projection of the Sky View | |
 | C/No Displays the averaged C/No values | |
| [020S] | Orbits Displays the orbits of the satellites | |
 | SVs Displays the current position of the satellites | |
| [8Z3S] | Coord. Adds a caption for the azimuth | |
 | Elevation Adds a caption for the elevation | |
Table 9: Description of the toolbar in Sky View
4.6 Receiver Menu and Receiver Toolbar
In order to communicate with a GPS receiver, u-center must have the correct COM port settings. Please refer to Section 2.5 for a description of the settings.

Note
Only the COM Ports, that are available on your computer, will show up in the COM Port drop down list. If a COM Port is grayed out, another application in the computer is using it.
4.7 Player Menu and Player Toolbar

text_image
Player Eject Ctrl+E ✓ Stop Ctrl+H Pause Ctrl+P Record Ctrl+R Step Ctrl+Space Play Ctrl+G Scan Ctrl+F Goto Begin Goto End Slow Normal Fast Goto PositionThe primary function of the Player is to display previously recorded GPS data from a file. Refer to Section4.3 for a description on how to create or open a log file. Using the player controls, you can step through or play all messages from the log file. The series of buttons in the player toolbar can be used to navigate through the log file. The records will be displayed on the navigation display window, in the same way that live GPS data is displayed when using u-center. The current file that is being displayed is shown in the box "File in use".
| Element Name Description | ||
| Eject Close the active log file | ||
| Stop Stops displaying or recording to the active log file | ||
| Pause Pauses displaying or recording to a log file | ||
| Record Starts recording to the previously created logfile. Please note this function is only available if a logfile has been opened before. | ||
| Step Single step function, the next message is read | ||
| Play Starts to display a log file. You can select the speed of the action.After each message the display is updated as required | ||
| Scan | Reads the entire log file into the database and updates the display at the end of the scan period | |
| Go to Begin | Set the read path to the begin of the log file | |
| Go to End | Go to the end of the log file | |
 | Go to Position | This slider bar is used to shuttle back and forth through the history log. Pulling the slider to the right will fast-forward the playback, and pulling it to the left will rewind the playback |
Table 10: Description of the buttons and the slider in the Player Toolbar
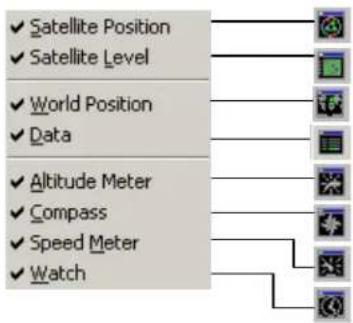
4.8 View Menu: Docking Windows
The Docking Windows are graphic displays, which provide real-time information about the GPS receiver. These are the most commonly used windows for u-center users. Eight different panes can be displayed: receiver status, satellite and signal strength information, position on a world map and 4 analog dials. The windows can be resized, closed or moved anywhere on the screen. Refer to Section 3.1 for an explanation about the color codes. To open these windows, select Docking Windows from the View menu, or simply click on the icons on the View tool bar.
text_image
✓ Satellite Position ✓ Satellite Level ✓ World Position ✓ Data ✓ Altitude Meter ✓ Compass ✓ Speed Meter ✓ Watch
text_image
Satellite Level Displays Elevation, Azimuth and C/NO (dBHz) for SVs World Position Displays the current Position on a world map Receiver Status Displays a summary of the receiver status. SV 6 EI 72 Az 227 C/N0 44.0 SV 5 EI 39 Az 100 C/N0 42.0 SV 9 EI 3 Az 152 C/N0 36.0 SV 30 EI 75 Az 75 C/N0 44.0 SV 24 EI 29 Az 52 C/N0 40.0 SV 4 EI 4 Az 29 C/N0 25.0 SV 14 EI 15 Az 235 C/N0 35.0 SV 25 EI 38 Az 303 C/N0 44.0 SV 17 EI 8 Az 174 C/N0 25.0 Satellite Position Displays the position of satellites in the sky Speed Meter Displays the current speed Compass Displays the current course over ground Altitude Meter Displays the current altitude Watch Displays the date and the current UTC-TimeFigure 37: Docking Windows
4.9 Tools Menu
4.9.1 Firmware Update
The receiver firmware can be updated with the firmware update function in the Tools Menu.
- Establish the serial communication between u-center and the GPS receiver (see also section 2.5).
- Start the Firmware Update Tool
- Select the path of the 'prodstub' (ATR0620l.exe) and the firmware image.
- Select the 'Production Mode'. ANTARISTM based GPS receivers can be put into boot mode by sending a UBX protocol command. If the GPS receiver connected to u-center is configured for UBX protocol input, choose the 'use serial port' option. Otherwise, select 'use bootmode pin' and put the receiver manually into boot mode.
- Check the COM port (u-center automatically initializes the COM port with the u-center COM port).
-
Select the download baudrate. This is the baudrate used during the firmware download. The default value is 115200 baud. The lower this baudrate, the longer a firmware update takes.
-
If 'Production Mode' is set to 'serial port with UBX protocol', check the UBX protocol baudrate(u-center automatically initializes it with the u-center baudrate.). The UBX protocol baudrate is only used to enter the download process.
- Initiate the download by pressing the 'Update' button. The GPS receiver will be reset automatically after the download.

text_image
ANTARIS Flash Firmware Update Firmware image T:\uc-timlp\debora flashrun.bin Prodstub location T:\uc_v2_ldr\ATR0620l.exe Serial interface port COM 1 at baudrate 115200 To enter Production Mode: use bootmode pin (on GPS evaluation box: press boot button while cycling power or pressing the reset button, then start the update) use RTS / DTR (make sure that the jumpers in the GPS evaluation box are in the correct position) use serial port with UBX protocol at baudrate 57600 Progress Update Abort CloseFigure 38: Firmware update window
4.9.2 GPS Configuration
u-center AE is capable to get the actual configuration of an ANTARIST™ based GPS receiver and store it to an ASCII text file containing hexadecimal records. Such a file can be edited and stored to an ANTARIST™ based GPS receiver again. By clicking the menu "Tools->GPS Configuration..." of u-center AE, the GPS Configuration dialog opens. The following functions are available:
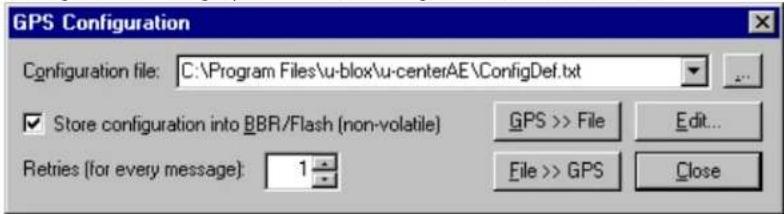
text_image
GPS Configuration Configuration file: C:\Program Files\u-blox\u-centerAE\ConfigDef.txt ✓ Store configuration into BBR/Flash (non-volatile) Retries (for every message): 1 GPS >> File Edit... File >> GPS CloseFigure 39: Screenshot, u-center GPS configuration
- Specify the name of a new configuration file to store current configuration from the ANTARISTM GPS receiver
- Specify the name of an existing configuration file and load this configuration into the ANTARIST™ GPS receiver
• A flag can be set to force storing the configuration into the Battery Backed RAM (BBR) or Flash EPROM.
If reading or writing configuration data fails too frequently, try to increase the number of retries u-center AE should do on a single message if one fails.

NOTE: Sending a configuration to an ANTARISTM GPS receiver may fail due to a baud rate change on the current serial port of the receiver where sending this configuration to. If this happens, simply change the u-center AE's baud rate and send the configuration again.

text_image
Getting GPS Configuration Polling: CFG-MSG - B5 62 06 01 02 00 01 01 08 3 ... successfully completed! Polling: CFG-MSG - B5 62 06 01 02 00 01 02 0C 3 ... successfully completed! Polling: CFG-MSG - B5 62 06 01 02 00 01 03 0D 3 ... successfully completed! Polling: CFG-MSG - B5 62 06 01 02 00 01 04 0E 3 ... successfully completed! Polling: CFG-MSG - B5 62 06 01 02 00 01 06 10 3 ... successfully completed! Polling: CFG-MSG - B5 62 06 01 02 00 01 08 12 3 AbortThere is a window for showing the progress of data transfer to/from ANTARISTM based GPS receivers. Clicking "GPS >> File" closes this dialog box and opens the progress window showing configurations being polled and stored into a local file. Clicking "File >> GPS" opens the same progress window showing the configurations that are sent to the ANTARISTM based GPS receiver. This progress window closes after having finished transfer without any error.
Figure 40: Screenshot, u-center getting configuration
The user can abort the transfer by clicking the "Abort" button. It's not possible to close the window unless transfer has completed or the user aborted it.

Note: It's not recommended to read/write configuration while the ANTARISTM based GPS receivers is in sleep mode.

text_image
ConfigTest.txt - Notepad File Edit Format Help MON-VER - 00 04 28 09 32 2E 31 52 43 34 20 20 40 61 79 20 31 36 28 32 30 30 33 20 CFG-ART - 06 13 04 09 00 00 OF 64 CFG-DAT - 06 06 02 09 00 00 CFG-INF - 06 02 08 00 00 00 00 00 00 00 07 00 ... ... CFG-INF - 06 02 08 00 OF A2 48 OF 98 98 98 98 CFG-HSG - 06 01 06 09 01 01 00 00 00 00 ... ... CFG-HSG - 06 01 06 09 E1 04 08 00 00 00 CFG-HAV - 06 03 1C 09 03 01 1D 1C 1C 95 95 C3 C3 C3 C3 C3 C3 C3 C3 C3 C3 C3 C3 C3 C3 C3 C3 C3 C3 C3 C3 C3 C3 C3 C3 C3 C3 C3 C3 C3 C3 C3 C3 C3 C3 C3 C3 C3 C3 C3 C3 C3 C3 C3 C3 C3 C3 C3 C3 C3 C3 C CFG-PRT - 06 08 14 09 08 09 08 09 08 09 08 09 08 09 08 09 08 09 08 09 08 CFG-PRT - 06 08 14 09 01 09 08 09 08 09 08 09 E8 B5 B5 B5 B5 B5 B5 B5 B5 B5 B5 B5 B5 B5 B5 B5 B5 B5 B5 B5 B5 B5 B5 B5 B5 B5 B5 B5 B5 B5 B5 B5 B5 B5 B5 B5 B5 B5 B5 B5 B5 B5 B5 B5 B5 B5 B5 B5 B5 B5 B5 B CFG-PRT - 06 08 14 09 D2 D2 D2 D2 D2 D2 D2 D2 D2 D2 D2 D2 D2 D2 D2 D2 D2 D2 D2 D2 D2 D2 D2 D2 D2 D2 D2 D2 D2 D2 D2 D2 D2 D2 D2 D2 D2 D2 D2 D2 D2 D2 D2 D2 D2 D2 D2 D2 D2 D2 D CFG-RATE - 06 08 06 E8 E8 E8 E8 E8 E8 E8 E8 E8 E8 E8 E8 E8 E8 E8 E8 E8 E8 E8 E8 E8 E8 E8 E8 E8 E8 E8 E8 E8 E8 E8 E8 E8 E8 E8 E8 E8 E8 E8 E8 E8 E8 E8 E8 E8 E8 E8 E8 E8 E8 E CFG-RXM - 06 11 D2 D2 D2 D2 D2 D2 D2 D2 D2 D2 D2 D2 D2 D2 D2 D2 D2 D2 D2 D2 D2 D2 D2 D2 D2 D2 D2 D2 D2 D2 D2 D2 D2 D2 D2 D2Figure 41: Content Configuration File
When clicking the "Edit" button in the GPS Configuration dialog, the Notepad editor opens (standard Windows software). Configurations are stored the following way:
- 1 ^st line: it contains the version of the ANTARIST ^TM based GPS receiver where the configuration is from. Never change this line!
- For the 2 ^nd line and following each line contains the same:
- - . The byte code consists of class and message IDs (2 bytes), payload length (2 bytes), payload (payload length bytes). The sync characters and the checksum are not included. They will be calculated automatically.
Please refer to ANTARISTM Protocol Specification [8] for detailed information and ranges.
4.9.3 Hotkeys
The Tools Menu allows administrating the Hotkeys defined in the Message View. Please refer to Section 4.5.4 for more information on the Hotkeys.
4.10 Window Menu
The Windows Menu is Windows® compliant.
4.11 Help Menu
The u-center help is provided in form of an extensive user's guide, which can be accessed through the Windows® Start Menu (Start -> Programs -> u-blox products -> Manuals -> u-center) or downloaded from the u-blox website (www.u-blox.com).
5 Troubleshooting
NMEA or UBX protocol is not available in the Message View
u-center uses dynamic link libraries (DLL). The installation program will automatically install the required DLL's into the u-center program directory. Should you try to copy a u-center installation from one location to another, make sure you also copy the DLL files. Verify, the version of u-center matches the DLL version.
u-center doesn't display all messages
Make sure the baudrate is sufficient. If the bandwidth is insufficient, GPS receivers based on the ANTARIST™ GPS Technology will skip excessive messages.
Some serial port cards/adapters (i.e. USB to RS232 converter) frequently generate errors. If a communication error occurs during while u-center receives a message, the message will be discarded.
u-center looses the connection to the GPS receiver
u-center and the ANTARISTM GPS Technology have an autobauding feature. If frequent communication errors occur (i.e. due to problems with the serial port), the connection may be lost as u-center and the GPS receiver will autonomously try to adjust the baudrate. Do not enable the u-center autobauding feature if the GPS receiver has the autobauding enabled.
Some COM port are not shown in the port list
Only the COM Ports, that are available on your computer, will show up in the COM Port drop down list. If a COM Port is grayed out, another application in the computer is using it.
PC is very slow when u-center runs
If a high value of epochs is selected, the display in real-time can not be guaranteed, especially when many graphical Views are open. u-center does not update minimized Views and Console in real-time. Close or minimize as many of the graphical Views and Consoles as possible and u-center will run faster.
Logfile / Data are only partly displayed
The number of epochs displayed in u-center is limited in order to allow an efficient analysis of larger logfiles. The limitation is set to 1800 epochs by default. That means if an epoch is available every second you can analyze data for as much as 30 minutes. After this time the oldest values are discarded. Data stored to a logfile are not affected by the database limitation. Please refer to section 3.2.5 Database Limitation for instructions on how to increase this limit.
When planning long-term observations, it's recommended to start recording a log file before analysis begins.
Output messages are not updated in the Message View
Make sure, the protocol you'd like to receive is enabled. If so, double-click on the desired output message. Double-clicking on an output message enables or disables the periodic message update if the respective protocol is active. Alternatively, select the desired input or output message and press the 'Poll' button.
If you would like to get UBX-INF () messages in the log file, configure the receiver accordingly with the UBX-CFG-INF input message.
No logfile is recorded
After a new logfile is created, logging will not automatically start but only after selecting the Record button in the Player Toolbar.
u-center does not support UBX messages
UBX messages are only supported with the ANTARISTM Edition of u-center. Make sure you use the u-center ANTARISTM Edition (V2.00 or higher) when evaluating the ANTARISTM GPS Technology.
A Index
A
Antenna Performance Analysis, 35
ASCII, 5, 20, 23, 34, 41
Autobauding, 7, 8
Average, 9, 24, 27
B
Battery Backed RAM, 41
Baudrate, 7, 8
Binary Console, 20, 21
C
CFG-INF, 43
Chart View, 25, 27
COM-Port, 7, 8
Configuration, 41
Configuration File, 41
Console Views, 9
Custom Messages, 23
D
Database Limitation, 12, 17, 24, 25, 32
Deviation Map, 30
DLL, 6, 43
Docking Windows, 10, 38
E
Edit Menu, 17
EvalKit, 5, 6
F
File Menu, 16
Firmware Update, 39
Flash EPROM, 41
G
GPS Configuration, 41
H
HAE, 6, 47
Histogram View, 28, 29
Hotkeys, 42
|
Input Message, 22, 23
Installation, 6
L
Latitude, 6, 26, 30, 32, 33, 34
Logfile, 33, 43
Longitude, 6, 26, 32, 34
M
Map Calibration, 33, 35
Map View, 30, 31, 32
Message View, 9, 21, 22, 23, 42, 43
MSL, 6, 47
N
New, 17
NMEA, 5, 15, 17, 19, 21, 23, 43, 47
0
Open, 17
Output Message, 22, 43
P
Packet Console, 20
Player Menu, 17, 32, 37
Player Toolbar, 37
PUBX, 47
R
Real-Time, 12, 13, 38, 43
Receiver Menu, 36
Receiver Toolbar, 36
Regular Expression Evaluation, 18
Road Tests, 5, 30, 32, 33
RS232, 43
S
Save, 17
Serial Connection, 7
Sky View, 10, 35, 36
Standard Deviation, 24
Standard Tool Bar, 16
Statistic View, 24, 25
T
Table View, 24, 25
Tabular Views, 10
Text Console, 17, 18
Troubleshooting, 43
U
UBX, 5, 15, 17, 21, 22, 23, 43, 47
UBX-INF, 17, 43
UTC, 6, 15, 16
V
View Menu, 17, 38
Views Tool Bar, 17
W
WGS-84, 6, 47
B Lists
B.1 List of Figures
Figure 1: Start Display....6
Figure 2: Receiver Tool Bar....7
Figure 3: COM-Port and Baudrate successfully detected ....8
Figure 4 Autobauding Button....8
Figure 5: Start Display after a successful connection ....8
Figure 6: Engine Architecture ....9
Figure 7: Relations between operating modes....11
Figure 8: Dataflow in Online Mode....11
Figure 9: Dataflow in Record Mode....12
Figure 10: Dataflow in Player Mode....12
Figure 11: Relations between different operating modes and their states....14
Figure 12: u-center and GPS receiver are synchronized....16
Figure 13: u-center and GPS receiver mismatches....16
Figure 14: Standard Toolbar ....16
Figure 15: File Menu....16
Figure 16: Text Console displaying UBX-INF and NMEA messages....17
Figure 17: Text Console displaying only RMC messages....17
Figure 18: Packet Console ....20
Figure 19: Binary Console....21
Figure 20: Message View....21
Figure 21: Message Display of an output message....22
Figure 22: Message Display of an input message ....23
Figure 23: Message Display of custom message....23
Figure 24: Statistic View ....24
Figure 25: Table View ......24
Figure 26: Selecting a new value ....25
Figure 27: Recently used tables....25
Figure 28: Altitude as a function of Index (X = Index, Y = Alt)....26
Figure 29: Index as a function of Altitude (X = Altitude, Y = Index) .....26
Figure 30: Latitude as a function of Longitude (X=Longitude, Y=Latitude)....26
Figure 31: Altitude Histogram View....28
Figure 32: Probability Chart....29
Figure 33: Deviation Map .... 30
Figure 34: Displaying a position....31
Figure 35: Logfile from a road test ....33
Figure 36: Sky View .... 36
Figure 37: Docking Windows....39
Figure 38: Firmware update window....40
Figure 39: Screenshot, u-center GPS configuration ....41
Figure 40: Screenshot, u-center getting configuration ....41
Figure 41: Content Configuration File ....42
B.2 List of Tables
Table 1: Color-coding scheme for graphical views....10
Table 2: Color-coding scheme for the Docking Windows and Sky View ....10
Table 3: Description of the buttons of the different Consoles....18
Table 4: Description of the buttons in the Message View....22
Table 5: Description of the buttons and displays in Chart View....27
Table 6: Description of the buttons and displays in Histogram View....29
Table 7: Description of the buttons and displays in Deviation Map....30
Table 8: Description of the buttons and displays in Map View....32
Table 9: Description of the toolbar in Sky View....36
Table 10: Description of the buttons and the slider in the Player Toolbar....37
C Glossary
MSL Height above Mean Sea Level or Orthometric Height
HAE Height Above WGS-84-Ellipsoid
NMEA 0183 ASCII based standard data communication protocol used by GPS receivers.
UBX File extension for u-center logfiles or short form for the UBX protocol
UBX Protocol A proprietary binary protocol used by the ANTARISTM GPS technology
PUBX u-blox proprietary extension to the NMEA protocol
Related Documents
[1] ANTARISTM EvalKit – Users Guide, Doc No GPS.G3-EK-02001
[2] u-blox' GPS Dictionary - Doc No GPS-X-00001
[3] GPS Basics, Introduction to the system – Application overview - Doc No GPS-X-02007
[4] ANTARISTM GPS Technology Protocol Specifications – Doc No GPS.G3-X-03002
All these documents are available on our webpage (http://www.u-blox.com).
Contact
For further info, please contact us:
Headquarters Subsidiaries
u-blox AG
Zuercherstrasse 68
CH-8800 Thalwil
Switzerland
Phone: +41 1 722 74 44
Fax: +41 1 722 74 47
E-mail: info@u-blox.com
www.u-blox.com
Barham Court, Teston
Maidstone, Kent ME18 5BZ
United Kingdom
Phone: +44 1622 618628
Fax: +44 1622 618629
E-mail: info_uk@u-blox.co.uk
www.u-blox.co.uk
Technical Support:
Phone: +44 1622 618628
E-mail: support_uk@u-blox.co.uk
u-blox Asia Pacific Ltd.
Suite A, 8/F, Block 7
398 Castle Peak Road
Tsuen Wan, Hong Kong
Phone: +852-2940-0085
Fax: +852-2615-2285
E-mail: info_ap@u-blox.com
www.u-blox.com
u-blox America, Inc.
13800 Coppermine Road
Herndon, VA 20171
USA
Phone: +1 (703) 234 5290
Fax: +1 (703) 234 5770
E-mail: info_us@u-blox.com
www.u-blox.us
u-blox Beijing Office
c/o Beijing Eastar Technology Co., Ltd.
Suite Z, No. 10
Haidian District, Beijing 100088
P.R. China
Phone: +86-10-6226-2091
Fax: +86-10-6223-4821
E-mail: info_ap@u-blox.com
www.u-blox.com
Technical Support:
Phone: +1 (703) 234 5290
E-mail: support_us@u-blox.us
Technical Support:
Phone: +86-10-6226-2091
E-mail: support_ap@u-blox.com