
FX-9860GII V2.0 - Photo and Video Software CASIO - Free user manual and instructions
Find the device manual for free FX-9860GII V2.0 CASIO in PDF.


| Product Type | Graphing Calculator |
| Model Number | FX-9860GII V2.0 |
| Brand | Casio |
| Display | 21 characters x 8 lines, dot matrix |
| Dimensions | Approx. 19.7 x 8.5 x 1.7 cm |
| Weight | Approx. 188 g (including batteries) |
| Power Source | 4 x AAA batteries |
| Battery Life | Approx. 140 hours continuous display |
| Memory | 64 KB RAM, 1.4 MB Flash ROM |
| Functions | Graphing, spreadsheet, statistics, equation solver, programming |
| Connectivity | USB port, 3-pin serial port |
| Operating System | Casio OS with icon-based menu |
| Languages | Multiple languages including English, French, German, Spanish |
| Accessories Included | User manual, CD-ROM with software, USB cable, protective case |
| Maintenance | Clean with dry cloth; avoid liquids |
| Safety Precautions | Do not disassemble; replace batteries correctly |
| Spare Parts Availability | Batteries and USB cable available from Casio or retailers |
| Reparability | Calculator is not user-serviceable; contact Casio support |
| Country of Origin | China |
| Warranty | 1 year limited warranty |
Frequently Asked Questions - FX-9860GII V2.0 CASIO
User questions about FX-9860GII V2.0 CASIO
0 question about this device. Answer the ones you know or ask your own.
Ask a new question about this device
Download the instructions for your Photo and Video Software in PDF format for free! Find your manual FX-9860GII V2.0 - CASIO and take your electronic device back in hand. On this page are published all the documents necessary for the use of your device. FX-9860GII V2.0 by CASIO.
USER MANUAL FX-9860GII V2.0 CASIO
E-CON2 Application (English)
1 E-CON2 Overview
2 Using the Setup Wizard
3 Using Advanced Setup
4 Using a Custom Probe
5 Using the MULTIMETER Mode
6 Using Setup Memory
7 Using Program Converter
8 Starting a Sampling Operation
9 Using Sample Data Memory
10 Using the Graph Analysis Tools to Graph Data
11 Graph Analysis Tool Graph Screen Operations
12 Calling E-CON2 Functions from an eActivity
natural_image
Pure waveform diagram with no text, numbers, or symbols14÷0×2.3
ab% 1 ▼ 2
![2×[1/2 0] 0 0]](/content/2026/06/1160825/images/17890ce7fcf8ed697e2f7f7a3f985b0e58f1ff8e769c5a26d071a91295098a03.jpg)
▶▶
![2×[1/2 0] □ 0]](/content/2026/06/1160825/images/5994293949cd26093682ba892b64ca8c39bbf573b58a807900b42ef8a1f40f0a.jpg)
SHIFT x2() 2
![2×[1/2 √2] □ □ ]](/content/2026/06/1160825/images/d151f2fc690a3a4e3e9c34b72d58f9f5da4cd56cb1ab2f1dae543928f8d46570.jpg)
SHIFT x2() 2 a % 1 ▼ 2

EXE

F6 (DRAW)

natural_image
Simple parabolic curve drawn on a Cartesian coordinate system (no labels or text)
line
| x | y | | ---- | ------ | | 0.0 | -1.0 | | 0.2 | 0.5 | | 0.4 | 1.0 | | 0.6 | 0.5 | | 0.8 | -0.5 | | 1.0 | -1.0 |- an / an+1 / an+2 / bn / bn+1 / bn+2 / cn / cn+1 / cn+2 ... an / an+1 / an+2 / bn / bn+1 / bn+2 / cn / cn+1 / cn+2 expresses
OPTN F6 (▷) F6 (▷) F3 (FMEM)*
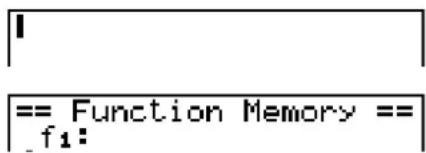
== Function Memory == f1:(A+B)(A-B)
F1(STO) 1 EXE
* fx-7400G
II: F2 (FMEM)
EXIT EXIT EXIT
OPTN F6 (▷) F6 (▷) F3 (FMEM)*
== Function Memory == f1: (A+B)(A-B) f2: f3: f4: f5: f6:
F4 (SEE)
* fx-7400G
II: F2 (FMEM)
OPTN F6 (▷) F6 (▷) F3 (FMEM)*
F1(STO) 1 EXE
* fx-7400G
II: F2 (FMEM)
[OPTN]-[CALC]-[Int÷]
AC 1 0 7 OPTN F4 (CALC)* F6 (▷)
F6 (▷) F1 (Int÷) 7
EXE
* fx-7400GII: F3 (CALC)

OPTN F4 (CALC)* F5 (SolvN)
X,θ,T x2 — 5 X,θ,T — 6 ) EXE
* fx-7400G
II: F3 (CALC)
EXIT
![WARNING! More solutions may exist. Press: [EXIT]](/content/2026/06/1160825/images/3b8d965531c747c9abb232a1611eecc8c03bceea13f6f8331e7202b43f603efa.jpg)
![AMS 1[ -1 ] 2[ 6 ] -1](/content/2026/06/1160825/images/9286a88079fcae39cd35fec0fed7232732453286deb2028a7f794e92efdea745.jpg)
[OPTN]-[CALC]-[d/dx]
AC OPTN F4 (CALC)* F3(
d2/dx2) X,θ,T ∧ 3 + 4 X,θ,T x² + X,θ,T - 6 ,
II: F3-(74A10G)
line
| x | f(x) | | ---- | ---- | | a | Peak | | x₁ | Low | | x₂ | High | | x₃ | Low | | x₄ | High | | b | Stable |OPTN F4(CALC)* F6(▷)F1(FMin)f(x) a b n *fx-7400GII: F3(CALC)
AC OPTN F3 (CPLX)* F2 (Abs)
(3+4F1(i)EXE
[OPTN]-[CPLX]-[Conj]
F 1 (R - OP) F 2 (× Rw)
F 1 (R - OP) F 3 (× Rw +)
OPTN F2 (MAT) F5 (Aug)
F1 (Mat) ALPHA X,θ,T (A)
F1 (Mat) ALPHA log (B) EXE
![AnS 1 2 1 [ ] 3 2 [ ] 2 4](/content/2026/06/1160825/images/d51e778febc1c59bf64086a192dc20b58e73685599285c06dde2033a52df9acf.jpg)
Mat → List (Mat Xn) → List n
OPTN F6 (▷) F4 (NUM) F1 (Abs)
OPTN F2 (MAT) F1 (Mat) ALPHA X,θ,T (A) EXE

AC OPTN F6 (▷) F4 (NUM) F1 (Abs)
OPTN F2 (MAT) F1 (Mat) ALPHA sin (D) EXE
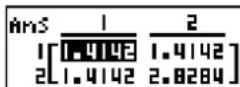
1.414213562
i, Abs, Arg, Conjg, ReP, ImP, ▶a+bi, ▶r∠θ
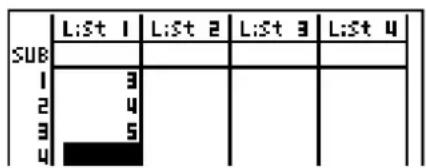

OPTN F1 (LIST) F2 (L→M) F1 (List)
F1 (List)
F6 (▷) F6 (▷) F1 (List) 1 ) EXE
Mean(List 1) 42.4
OPTN F1 (LIST) F6 (▷) F4 (Med) F6 (▷) F6 (▷) F1 (List)
F6 (▷) F6 (▷) F1 (List) 1
F1 (List) 2 ) EXE
Median(List 1, List 2) 46
OPTN F1 (LIST) F6 (▷) F5 (Aug) F6 (▷) F6 (▷) F1 (List)
AC OPTN F1 (LIST) F6 (▷) F5 (Aug)
F6 (▷) F6 (▷) F1 (List) 1
F1 (List) 2 ) EXE
![AnS 1 [3] 2 -2 3 1 4 9 5 10](/content/2026/06/1160825/images/e8ab104410a69f1ff5c0e0a978cf3f9faeb5800c878788d579f75b2fe710362f.jpg)
F6 (▷) F1 (List) 1 EXE
Sum List 1 212
F6 (▷) F1 (List) 1 EXE
Prod List 1
720
F6 (▷) F1 (List) 1 EXE

F6 (▷) F1 (List) 1 EXE
![× 100 =2/(2+3)6+5[4] 10 3/(2+3+6+5+4) × 100 = → 2 15 6/(2+3+6+5+4) × 100 = → 3 30 5/(2+3+6+5+4) × 100 = → 4 25 4/(2+3+6+5+4) × 100 = → 5 20](/content/2026/06/1160825/images/f8f27407cc863ce577dd02f082f311ab2314ac6bd85e22b94e4791cdb560626f.jpg)
OPTN F1 (LIST) F1 (List) 3 → F1 (List) 1 EXE
2 5 → OPTN F1 (LIST) F1 (List) 3 SHIFT + ( [ ) 2 SHIFT — ( ) EXE
![Store In List Memory List[1~26]: 1 OK OK ENG ENG](/content/2026/06/1160825/images/d443e8ed0d0b0bceaabddbfae02306f2ecb2bc67d66ccd786a7397564ae1db72.jpg)
EXE
Complex Mode: a + bi
![aX³+bX²+cX+d=0 X1[ -1] X2 [ -0.5+1.3228i ] X3 [ -0.5-1.3228i ] - 1](/content/2026/06/1160825/images/ed6ae9eb7daf6b80ebebe6fe2a1696afc213d5eb282c980676a2e29b4c33e65c.jpg)
Complex Mode: r θ
![aX³+bX²+cX+d=0 X1[1.43.1415] X2[1.4142x1.9321] X3[1.4142x-1.932] 1∠3.141592654](/content/2026/06/1160825/images/62b81d5d30b7f64510638102d80d5e1d00a966127e66f2cb6764db4817bd7fed.jpg)
natural_image
Simple geometric diagram showing a vertical line intersecting a horizontal axis, with two symmetric downward-pointing lines forming a V-shape (no text or labels)natural_image
Symmetrical four-lobed flower-like shape centered at origin on Cartesian coordinate system (no text or symbols)line
| X | Y | |---|---| | 0.0 | 0.0 | | 0.2 | 0.1 | | 0.4 | 0.3 | | 0.6 | 0.5 | | 0.8 | 0.7 | | 1.0 | 0.9 | | 1.2 | 1.1 | | 1.4 | 1.3 | | 1.6 | 1.5 | | 1.8 | 1.7 | | 2.0 | 1.9 | | 2.2 | 2.1 | | 2.4 | 2.3 | | 2.6 | 2.5 | | 2.8 | 2.7 | | 3.0 | 2.9 | | 3.2 | 3.1 | | 3.4 | 3.3 | | 3.6 | 3.5 | | 3.8 | 3.7 | | 4.0 | 3.9 | | 4.2 | 4.1 | | 4.4 | 4.3 | | 4.6 | 4.5 | | 4.8 | 4.7 | | 5.0 | 4.9 | | 5.2 | 5.1 | | 5.4 | 5.3 | | 5.6 | 5.5 | | 5.8 | 5.7 | | 6.0 | 5.9 | | 6.2 | 6.1 | | 6.4 | 6.3 | | 6.6 | 6.5 | | 6.8 | 6.7 | | 7.0 | 6.9 | | 7.2 | 7.1 | | 7.4 | 7.3 | | 7.6 | 7.5 | | 7.8 | 7.7 | | 8.0 | 7.9 | | 8.2 | 8.1 | | 8.4 | 8.3 | | 8.6 | 8.5 | | 8.8 | 8.7 | | 9.0 | 8.9 | | 9.2 | 9.1 | | 9.4 | 9.3 | | 9.6 | 9.5 | | 9.8 | 9.7 | | 10.0 | 9.9 |F3 (TYPE) F1 (Y=) (X,θ,T + 5 ) (X,θ,T + 4 )
( X,θ,T + 3 ) EXE
F6 (DRAW)
② SHIFT F2 (ZOOM) F1 (BOX)
③ ◀️ \~ ◀️ EXE
④ ◀️ \~ ◀️, ▲️ \~ ▲️ EXE

line
| X Value | Y Value | | ------- | ------- | | -5.968253968 | 1.032258064 |
natural_image
Simple black line drawing of a wave-like pattern with no text or symbolsF3 (TYPE) F1 (Y=) VARS F4 (GRPH)
F1(Y) 1 ( F1(Y) 2 ) EXE
VARS F4 (GRPH) F1 (Y) 2
( F1(Y) 1 ) EXE
![Graph Func :Y= Y1B:Y(X+1) [—] Y2B:X²+3 [—] Y3B:Y1(Y2) [—] Y4B:Y2(Y1) [—] Y5: Y6: SEL DEL TYPE STYL AMEM DRAW](/content/2026/06/1160825/images/168466b0c011d596dfa7eeacac3386576c962d06aca91b01fdd1410d41d0a10c.jpg)
VARS F4 (GRPH) F1 (Y) 1 ( ALPHA X,θ,T (A)
SHIFT ▪ (=) (-) 1 ) EXE
VARS F4 (GRPH) F1 (Y) 1 (ALPHA X,θ,T (A)
SHIFT • (=) 0 ) EXE
VARS F4 (GRPH) F1 (Y) 1 ( ALPHA X,θ,T (A)
SHIFT • (=) 1 ) EXE
▲ ▲ ▲ ▲ F1 (SEL)
F6 (DRAW)


natural_image
Symmetrical geometric line drawing with intersecting curves and a central axis (no text or labels)natural_image
Symmetrical geometric line drawing with intersecting curves and a central axis (no text or symbols)natural_image
Abstract geometric line drawing with intersecting curves and ovals (no text or symbols)natural_image
Pure waveform diagram with no text, numbers, or symbolsnatural_image
Simple parabolic curve drawn on a Cartesian coordinate system (no labels or text)② SHIFT F3 (V-WIN) F1 (INIT) EXIT
③ SHIFT MENU (SET UP) ▼ * F2 (Stop) EXIT
*fx-9750GII: SHIFT MENU (SET UP)
④ F5 (B-IN) ▼ F1 (SEL)
① MENU DYNA
② SHIFT F3 (V-WIN) F1 (INIT) EXIT
③ SHIFT MENU (SET UP) ▼ ▼ * F1 (On) EXIT
*fx-9750GII: ▼
④ F5 (B-IN) F1 (SEL)
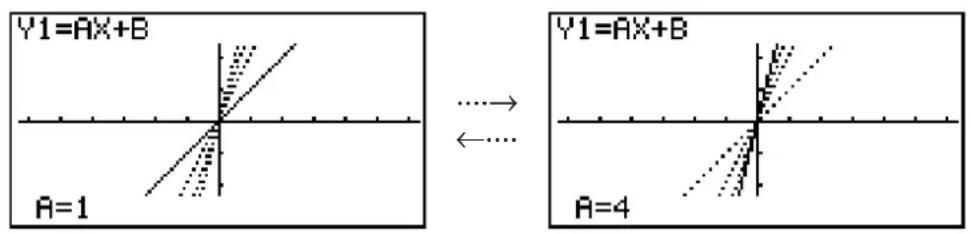
⑤ F4 (VAR) 1 EXE 0 EXE
⑥ F2 (SET) 1 EXE 4 EXE 1 EXE EXIT
⑦ F3 (SPEED) F3 (EXIT)
⑧ F6 (DYNA)
⑤ F6 (TABL)
⑥ F4 (WEB)
⑦ EXE \~ EXE (an is convergent)
☑ EXE \~ EXE ( bn is divergent)

natural_image
Pure geometric diagram showing a parabola and two curved lines intersecting at the origin (no text or symbols)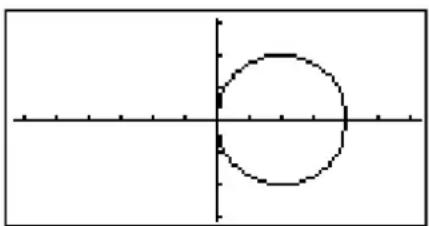
natural_image
Simple geometric diagram showing a circle intersected by perpendicular lines (no text or labels)line
| X | Y | |---|---| | 0 | -2 | | 4 | 7 |
X = (Y - 2) ^ 2 + 3
bar
| Category | Value 1 | Value 2 | Value 3 | Value 4 | Value 5 | Value 6 | Value 7 | |---|---|---|---|---|---|---|---| | [1] | 10 | 5 | 8 | 12 | 15 | 20 | 25 | | [2] | 15 | 10 | 12 | 18 | 22 | 28 | 35 | | [3] | 20 | 12 | 15 | 25 | 30 | 35 | 40 | | [4] | 18 | 5 | 3 | 8 | 10 | 12 | 15 | | [5] | 30 | 15 | 20 | 35 | 40 | 45 | 50 | | [6] | 35 | 20 | 25 | 40 | 45 | 50 | 55 | | [7] | 40 | 25 | 30 | 45 | 50 | 55 | 60 | The chart displays a single series of values for each category. The first three categories are labeled '10AK', and the remaining categories are labeled '10AK'.scatter
| Label | Value | |-------|-------| | CALC | 0.1 | | Defi | 0.2 | | | 0.3 | | | 0.4 | | | 0.5 | | | 0.6 | | | 0.7 | | | 0.8 | | | 0.9 |(Spreidingsdiagram)

line
| Point | Value | |---|---| | CALC | 0.1 | | DefG | 0.3 | | | 0.45 | | | 0.55 | | | 0.65 | | | 0.75 | | | 0.85 | | | 0.95 |(xy-lijngrafiek)
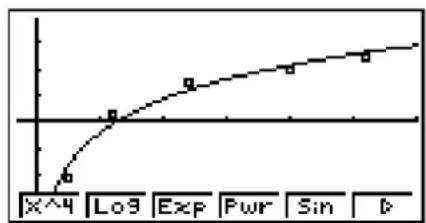
③ F1 (CALC) F6 (▷) F2 (Log)
④ F6 (DRAW)

line
| X | Y | |---|---| | 4 | 0 | | Lo3 | 1 | | Exp | 2 | | Pwr | 3 | | Sin | 4 | | b | 5 |F1 (CALC) F6 (▷) F2 (Log)
F6 (DRAW)
F1 (CALC) F6 (▷) F5 (Sin)
F6 (DRAW)

line
| X | Y | |---|---| | 0 | 0 | | 1 | 0.5 | | 2 | 0.8 | | 3 | 0.9 | | 4 | 0.7 | | 5 | 0.3 | | 6 | -0.2 | | 7 | -0.6 | | 8 | -0.9 | | 9 | -0.8 | | 10 | -0.5 | | 11 | -0.2 | | 12 | 0.1 | | 13 | 0.4 | | 14 | 0.7 | | 15 | 0.9 | | 16 | 0.8 | | 17 | 0.6 | | 18 | 0.3 | | 19 | -0.1 | | 20 | -0.4 | | 21 | -0.7 | | 22 | -0.9 | | 23 | -0.8 | | 24 | -0.5 | | 25 | -0.2 | | 26 | 0.1 | | 27 | 0.4 | | 28 | 0.7 | | 29 | 0.9 | | 30 | 0.8 | | 31 | 0.6 | | 32 | 0.3 | | 33 | -0.1 | | 34 | -0.4 | | 35 | -0.7 | | 36 | -0.9 | | 37 | -0.8 | | 38 | -0.5 | | 39 | -0.2 | | 40 | 0.1 | | 41 | 0.4 | | 42 | 0.7 | | 43 | 0.9 | | 44 | 0.8 | | 45 | 0.6 | | 46 | 0.3 | | 47 | -0.1 | | 48 | -0.4 | | 49 | -0.7 | | 50 | -0.9 | | 51 | -0.8 | | 52 | -0.5 | | 53 | -0.2 | | 54 | 0.1 | | 55 | 0.4 | | 56 | 0.7 | | 57 | 0.9 | | 58 | 0.8 | | 59 | 0.6 | | 60 | 0.3 | | 61 | -0.1 | | 62 | -0.4 | | 63 | -0.7 | | 64 | -0.9 | | 65 | -0.8 | | 66 | -0.5 | | 67 | -0.2 | | 68 | 0.1 | | 69 | 0.4 | | 70 | 0.7 | | 71 | 0.9 | | 72 | 0.8 | | 73 | 0.6 | | 74 | 0.3 | | 75 | -0.1 | | 76 | -0.4 | | 77 | -0.7 | | 78 | -0.9 | | 79 | -0.8 | | 80 | -0.5 | | 81 | -0.2 | | 82 | 0.1 | | 83 | 0.4 | | 84 | 0.7 | | 85 | 0.9 | | 86 | 0.8 | | 87 | 0.6 | | 88 | 0.3 | | 89 | -0.1 | | 90 | -0.4 | | 91 | -0.7 | | 92 | -0.9 | | 93 | -0.8 | | 94 | -0.5 | | 95 | -0.2 | | 96 | +0.1 | | 97 | +0.4 | | 98 | +0.7 | | 99 | +0.9 | | 100 | +0.8 |line
| t | R(t) | | ---- | ---- | | 0 | Peak | | t = 0 | Peak | | t = t | Shaded region (shaded area) |1 2 π _ t ^ + ∞ e ^ - u ^ 22 du
t (x) = x - xO _ x
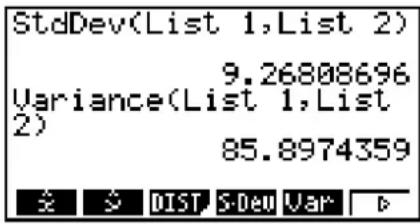
Variance n [,List m] (List
List n.....gegevens
List m ......Frequentiegegevens
EXIT F5 (STAT) F5 (Var)* EXIT
F1 (LIST) F1 (List) 1 , F1 (List) 2 ) EXE
* fx-7400G
II: F4 (STAT) F4 (Var)


histogram
| Category | Value | | -------- | ----- | | Z | Low | | P | High |µ≠11.4 ...... tendens van de test


histogram
| Category | Value | | -------- | ----- | | Z | Low | | P | High |µ1≠µ2 ...... tendens van de test
Prop≠0.5 ...... tendens van de test
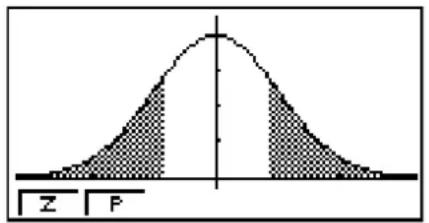
histogram
| Category | Value | | -------- | ----- | | Z | 0 | | P | 0 ||Execute
|
area
| Category | Value | | -------- | ----- | | Z | Low | | P | High |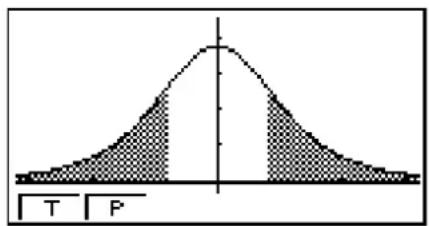
area
| Category | Value | | -------- | ----- | | T | Low | | P | High |µ≠11.3 ...... tendens van de test

µ1≠µ2 ...... tendens van de test
area
| Category | Value | | -------- | ----- | | CHI | Low | | P | High |
area
| Category | Value | | -------- | ----- | | F | Peak | | P | Low |σ1≠σ2 ...... tendens van de test
- Resultaten
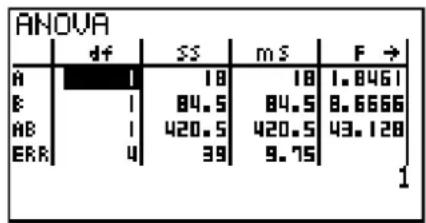


flowchart
graph TD
    A[" "] --> B[" "]
    C[" "] --> D[" "]
    E[" "] --> F[" "]
|Execute |
F4 (INTR)
F1(Z)
F4 (2-P)
■ t-interval
F5 (DIST) F1 (NORM) F3 (InvN)

Area
(0
kanswaarde
≤ Area ≤ 1)
F5 (DIST) F2 (t) F3 (InvN)

line
| X-axis Label | Y-axis Value | |---|---| | LOWER=1 | 1000 | | UPPER=2 | 1600 |F5 (DIST) F4 (F) F2 (FCd)

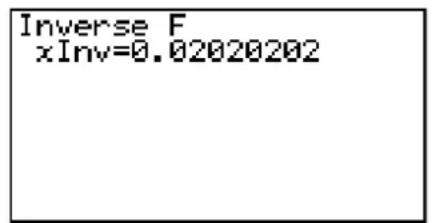

F5 (DIST) F5 (BINM) F2 (BCd)

F5 (DIST) F6 (▷) F2 (GEO) F2 (GCd)

F5 (DIST) F6 (▷) F2 (GEO) F3 (InvG)
natural_image
Simple geometric shape with two adjacent rectangles (no text or symbols)natural_image
Simple geometric shape composed of two rectangles, one outlined and one solid, with no text or symbols.PMT = - PV + β × FVα
FV = - PV + α × PMTβ
n = (1 + iS) × PMT - FV × i(1 + iS) × PMT + PV × i (1 + i)
I % = 0
PV = - (PMT × n + FV)
PMT = - PV + FVn
FV = - (PMT × n + PV)
n = - PV + FVPMT
α = (1 + i × S) × 1 - , β = (1 + i) ^ - n
S = 0 ... Payment:End (configuratiescherm) 1 ... Payment:Begin (configuratiescherm) .
i = I %1 0 0 amp; (P / Y = C / Y = 1) (1 + I %1 0 0 × [C / Y] ^ C / YP / Y amp; ... .. (Anders dan de bovenstaande) .
• I %
i (reële rentevoet)
PV + α × PMT + β × FV = 0
natural_image
Simple geometric shape with a horizontal line inside a rectangle (no text or symbols)NFV = NPV × (1 + i) ^ n
- IRR
0 = CF _ 0 + CF _ 1(1 + i) + CF _ 2(1 + i) ^ 2 + CF _ 3(1 + i) ^ 3 + ... + CF _ n(1 + i) ^ n
natural_image
Pure electrical circuit lines without any symbolsnatural_image
Simple downward-sloping dashed line on white background (no text or symbols)![D Input a Date ...Month M[1~12]: 8 PRD dI+D dI-D](/content/2026/06/1160825/images/a48150a09dd88e8408946655de8dadec67e360452794637f32f369606add4e95.jpg)
n......levensduur
{SYD}
{SYD} - {TABL}
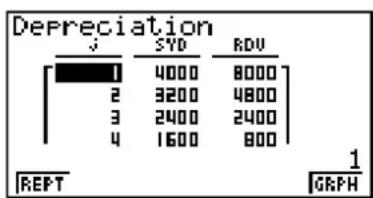
{SYD} - {GRPH}

bar
| Category | Value | |---|---| | Bar 1 | 0.8 | | Bar 2 | 0.6 | | Bar 3 | 0.4 | | Bar 4 | 0.2 | | Bar 5 | 0.1 |INT = - AD CSXM = PRCM + INT

natural_image
Simple horizontal line with six small vertical tick marks at the bottom (no text or symbols)
{PRC} {PRC} - {GRPH} {PRC} - {MEMO}
Bond Calculation CPD=01M01D2012Y(SUN)
natural_image
Geometric diagram of a polyhedron with labeled point A and dashed lines indicating hidden edges (no text or symbols beyond label)DrawFTG-Con, DrawFTG-Plt 8-15
DrawGraph 8-15
DrawR-Con, DrawR-Plt 8-15
DrawRΣ-Con, DrawRΣ-Plt 8-16
DrawStat 8-16
DrawWeb 8-16
Dsz 8-12
Exp(....8-19
Exp▶Str(....8-19
For\~To\~(Step\~)Next 8-10
Getkey 8-17
Goto\~Lbl 8-12
If\~Then\~(Else\~)IfEnd 8-9
lsz 8-13
Locate 8-17
Menu....8-14
OpenComport38k 8-18
Prog 8-11
PlotPhase....8-16
RclCapt....8-21
Receive(....8-18
Receive38k....8-18
Return 8-12
Send(....8-18
Send38k....8-18
Stop 8-12
StrCmp(....8-20
StrInv(....8-20
StrJoin(....8-20
StrLeft(....8-20
StrLen(....8-20
StrLwr(....8-20
StrMid(....8-20
StrRight(....8-20
StrRotate(....8-21
StrShift(....8-21
StrSrc(....8-21
StrUpr(....8-21
While\~WhileEnd 8-10
? (Invoercommando) 8-8
▲ (Uitvoercommando) 8-8
← (Nieuwe regel-commando) ......8-9
■ Controlecommando's (CTL)
Break
■ Wiscommando's (CLR)
ClrGraph
DispF-Tbl, DispR-Tbl*
DrawFTG-Con, DrawFTG-Plt
Geen parameters
Locate 7, 1, "CASIO FX"
Receive38k / Send38k
" X ="? → XX = ?
Plot type: DrawFTG-Plt
S-Gph1 DrawOn, Scatter, List 1, List 2, 1, Square
S-Gph1 DrawOn, NPPlot, List 1, Square
S-Gph1 DrawOn, Hist, List 1, List 2
S-Gph1 DrawOn, Linear, List 1, List 2, List 3
S-Gph1 DrawOn, Logistic, List 1, List 2
S-Gph1 DrawOn, Bar, List 1, None, None, StickLength
S-Gph1 DrawOn, Scatter, List 1, List 2, 1, Square
DrawStat
Syntax: NormCD(Lower, Upper[, σ, μ])
Syntax: InvNormCD(["L(of -1) of R(of 1) of C(of 0)", ]p[,σ,μ]) tail (Left, Right, Central)
Syntax: tCD(Lower, Upper, df [])
Syntax: ChiCD(Lower, Upper, df [])
Syntax: FCD(Lower, Upper, ndf, ddf [])
Syntax: HypergeoPD(x, n, M, N[])
Syntax: HypergeoCD(X, n, M, N[])
TwoSampleFTest: Voert 2-sample F-testberekening uit.
Syntax: TwoSampleFTest " σ1 conditie", s x1 , n 1 , s x2 , n 2
Syntax: TwoSampleFTest "σ1 conditie", List1, List2, [, Freq1 [, Freq2]]
Syntax: Cash_NPV(I%, Csh)
Syntax: Cash_PBP(I%, Csh)
Syntax: Cash_NFV(I%, Csh)
SHIFT 8 (CLIP) ▶ ▼ ▼ ▼ ▼
scatter
| Label | Value | |-------|-------| | CALC | 0.1 | | Defi | 0.2 | | | 0.3 | | | 0.4 | | | 0.5 | | | 0.6 | | | 0.7 | | | 0.8 | | | 0.9 |![eAct List [ ] [FOLDER1] [FOLDER2] CONICS.g2e : 740 GEO.g2e : 260 GRAPH.g2e : 600 INTEG.g2e : 640↓ OPEN NEW DEL SRC S.D](/content/2026/06/1160825/images/db281c3b4f9a85104e1f44631a1602c86fa65c46be10f2847da2379de02ba7a3.jpg)