
StreamSmart 400 - Calculator HP - Free user manual and instructions
Find the device manual for free StreamSmart 400 HP in PDF.


| Product type | Data streaming device for calculators |
| Model | StreamSmart 400 |
| Brand | HP |
| Dimensions | Approximately 10 x 5 x 2 cm |
| Weight | About 100 g |
| Power supply | USB powered or 2 AAA batteries |
| Main functions | Real-time data streaming from sensors to HP Prime calculator |
| Supported sensors | Temperature, light, sound, voltage, motion, and more |
| Connectivity | USB cable included |
| Compatibility | HP Prime graphing calculator |
| Sampling rate | Up to 1000 samples per second |
| Display | No built-in display, data shown on calculator |
| Software | HP StreamSmart application required |
| Maintenance | Clean with dry cloth; avoid moisture |
| Safety | Do not disassemble; keep away from water |
| Spare parts | Not available; contact HP support for repairs |
| Repairability | Not user-serviceable; warranty repair only |
| General information | Used for science experiments and data logging |
Frequently Asked Questions - StreamSmart 400 HP
User questions about StreamSmart 400 HP
0 question about this device. Answer the ones you know or ask your own.
Ask a new question about this device
Download the instructions for your Calculator in PDF format for free! Find your manual StreamSmart 400 - HP and take your electronic device back in hand. On this page are published all the documents necessary for the use of your device. StreamSmart 400 by HP.
USER MANUAL StreamSmart 400 HP
StreamSmart 400 Acknowledgments
Manual written by G.T. Springer
Revision History
Date Version Revision
August 2008 1.0 A
Legal Notices
This manual and any examples contained herein are provided “as is” and are subject to change without notice. Hewlett-Packard Company makes no warranty of any kind with regard to this manual, including, but not limited to, the implied warranties of merchantability, non-infringement and fitness for a particular purpose.
Hewlett-Packard Company shall not be liable for any errors or for incidental or consequential damages in connection with the furnishing, performance, or use of this manual or the examples contained herein.
Copyright © 2008 Hewlett-Packard Development Company, L.P.
Reproduction, adaptation, or translation of this manual is prohibited without prior written permission of Hewlett-Packard Company, except as allowed under the copyright laws.
Hewlett-Packard Company
16399 West Bernardo Drive
MS 8-600
San Diego, CA 92127-1899
USA
HP Part Number
F2235 - 90001
Table of Contents
1 HP Mobile Calculating Laboratory
Types of experiments....3
Streaming experiments ....4
The StreamSmart Aplet 4
The Statistics Aplet 7
Manual conventions 7
Helpful hints....8
2 Streaming Experiments
Viewing a stream of data 12
Low battery symbol 17
Select a set of data 17
Export a data set 19
Analyze experimental data 20
3 Capturing Data from Events
Numeric view: the meter mode....25
Set up experiment.... 26
Monitor and select events ......28
Analyze the data 29
Data logging....29
4 Advanced Topics
Sensor setup: manually identify a sensor.... 31
Unit setup: manually select units for a sensor 32
Calibration 33
The Plot Setup menu....35
Setting the stream window 35
Plot display options.... 36
Filtering data for display and export 36
Data history 39
Oscilloscope mode 40
StreamSmart 400 and the virtual HP 39/40gs 41
Keyboard shortcuts 42
Mathematical details: zoom, pan, and trace 42
5 Warranty, Regulatory, and Contact Information
Replacing the battery 45
HP Limited hardware warranty and customer care 45
Customer care....47
Product regulatory & environment information ....50
1 HP Mobile Calculating Laboratory
The HP Mobile Calculating Laboratory (HP MCL) consists of one or more Fourier® sensors, an HP StreamSmart 400, and either the HP 39gs or HP 40gs graphing calculator with the StreamSmart Aplet. Investigation and understanding of mathematics and science concepts are enhanced by the HP Mobile Calculating Laboratory, as it is designed to simplify the collection and analysis of real-world data.
Types of experiments
The Mobile Laboratory supports a number of different types of experiments, as shown in the table below.
Table 1-1 Types of experiments
| Type Description Example | ||
| Stream Displays a live time graph (data stream) for up to four sensors simultaneously, at rates up to 5,700 samples per second. See Chapter 2 for details. | Two students each sing a note one octave apart into separate microphones; the HP MCL displays their voice sound waves live so their wavelengths can be compared. | |
| Stream/select events | Same as above StreamSmart captures the dampened oscillations of a vibrating rod. Students select just the maxima of the oscillations for further analysis. | |
| Selected events Displays a live meter read-out for up to four sensors simultaneously; you can add a set of readings to your data set at any time. See Chapter 3 for details. | Collect pH and temperature readings from various locations around the edge of a pond. | |
| Events-with-entry Same as above Collect pH and nitrate readings from various locations along a stream; add as an entry to each reading the distance from the point in the stream to a runoff drain pipe that empties into the stream. | ||
| Log Set up a stream experiment to collect a certain number of readings at a set sampling rate. See Chapter 3 for details. | Take 20 temperature readings from a cooling cup of coffee for 10 minutes, taking one reading every 30 seconds. | |
Streaming experiments
The HP MCL defaults to a stream experiment when started. In a streaming experiment, data is displayed graphically on the HP 39/40gs calculator as it streams in from the StreamSmart 400 at frequencies of up to 5,700 samples per second (5.7 KHz). To ensure that the resulting stream is visible on the display and moving at a rate that the student can perceive, the window settings for the display are automatically selected, based on the capabilities of the sensors and the initial range of values collected. There is no setup required for a streaming experiment—just plug and go!
The StreamSmart Aplet
The student experiences the HP Mobile Calculating Laboratory via the StreamSmart Aplet on the HP 39/40gs graphing calculators. Please check online to ensure that your HP 39/40gs calculator has the latest version of the StreamSmart Aplet. Visit www.hp.com/calculators to download the latest version.
You can also use the StreamSmart 400 with the StreamSmart Aplet in the Virtual HP 39/40gs Graphing Calculator software for the PC. Visit www.hp.com/calculators to download this software application.
The StreamSmart Aplet has the same general structure as the other HP 39/40gs Aplets. For example, the StreamSmart Aplet has the standard Plot and Numeric views. Table 1-2 below lists the standard Aplet views and their use in the StreamSmart Aplet. Note that the standard Symbolic and Symbolic Setup views are not used by the StreamSmart Aplet.
Table 1-2 StreamSmart standard views
| View Name/Key(s) Description | ||
| PlotR | · View up to four data streams graphically as time graphs· Perform streaming experiments· See Chapter 2, Stree Experiments for details | |
| NumericS | · View up to four sensors numerically in a meter· Perform selected events and events-with-entry experiments· See Chapter 3, from Events for details | |
| Plot setup(page 1)@ R | · Optional: set up the window for the graphic view of the data stream· Optional: choose stacked display of multiple data streams or overlaid display (superimposed)· Optional: choose data filters for display and export of data· See Chapter 4, for details | |
| Plot setup(page 2) | · Optional: select a history of fixed length (in seconds), or an automatic history that keeps the most current data but saves less and less of earlier data from the stream(s)· See Chapter 4, Adv for details | |
| Numeric setup@ S | · Activate and deactivate individual channels from the four channels of the StreamSmart 400· Choose sensor units· See Chapter 4, Adv for details | |
All of the views listed in Table 1-2 can be accessed via the Views menu by pressing V. In addition to these standard Aplet views, the Views menu also contains views specific to the StreamSmart Aplet. These views are listed below in Table 1-3. Details on these views can be found in Chapter 4, Advanced Topics.
Table 1-3 Specific StreamSmart 400 views
| View Name/Key(s) Description | |
 | Sensor setup • Select/deselect each channel's sensor• Manually identify a sensor from a list of supported sensors |
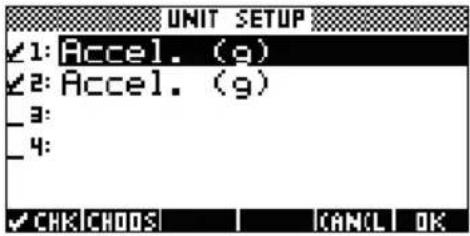 | Unit setup • Activate/deactivate channels• Select a unit of measurement for sensors with multiple units of measurement available |
 | Calibrate • Select a sensor's channel for software calibration of the sensor• Per form point software calibration of the selected sensor |
 | Experiment • Perform data logging experiments with a set duration (length in seconds) and set number of samples |
The Statistics Aplet
The StreamSmart Aplet works seamlessly with the Statistics Aplet to provide you all the tools you need to collect and analyze data. StreamSmart does the collection of the data and selection of a final data set for analysis, then exports the data directly to the Statistics Aplet, where additional graphing and analysis occurs. As stated previously, the HP MCL can collect data from up to four sensors simultaneously. In addition, each sample comes with a timestamp. The HP MCL combines these readings into an ordered data-tuple:
(timestamp, channel 1 sensor, channel 2 sensor, channel 3 sensor, channel 4 sensor)
Of course, one or more of the four channels may not have a sensor attached. In that case, the ordered data-tuple is shortened appropriately. Once you select the data you want to analyze, the data is sent to columns in the Statistics Aplet. The Statistics Aplet has ten columns available for data, C1 through C9, and C0. You may choose a destination column for each value in the ordered data-tuple of your experimental data, or use the default values provided. The result is that each data-tuple becomes a row in a set of columns in the Statistics Aplet.
When you export data to the Statistics Aplet, you can choose to follow your data into the Statistics Aplet for analysis or stay in the StreamSmart Aplet to continue experimentation. In-depth analysis of the data, including the calculation of summary statistics (for 1 or 2 variables) and modeling bi-variate data with various fits, is performed in the Statistics Aplet. This manual contains a brief introduction to the Statistics Aplet, but for more information about the Statistics Aplet, refer to the HP 39/40gs User's Guide.
Manual conventions
Throughout this manual, a few conventions have been employed to help you find the functions under discussion. There are four notational conventions, corresponding to primary key functions, shifted key functions, and functions in menus:
-
Functions on the keyboard appear in their own special font. For example, the ENTER key appears as ____. Shifted functions will be noted as such and referenced both by the function name and the key combination required, as in the function, @ R (Plot Setup).
-
The HP 39/40gs calculators employ context-sensitive menus that appear along the bottom of the display. The functions in these menus are accessed via the top row of keys on the keyboard directly below the screen display. There are six of these menu keys in all. For example, in the Plot screen capture in Table 1-2, the four items shown in the menu are: CHAN, PAN, SCOPE, and STOP. Throughout this guide, these keys appear in a special font when they represent a key press. For example, when the ZOOM function appears in a step as a key press, it is represented by @ZOOM.
-
The StreamSmart Aplet also employs dialogue boxes from time to time, as shown in the Streamer Plot Setup view in Table 1-2 above. The field names in menus and other data are shown in bold type. For example, in the top left corner of the Plot Setup dialog box in Table 1-2, there is a field named XRNG. In this manual, the field name is shown in bold as XRNG.
- Screen captures are provided to assist you in checking your data. The actual data will vary. These screen captures are simply provided to help orient you to the software and to help you navigate through the functionality.
- Finally, tasks are numbered to clarify steps in multi-step procedures.
Helpful hints
Remember these helpful hints and shortcuts as you use the StreamSmart Aplet:
- At any time, you can reset the StreamSmart Aplet by pressing the U key on the keyboard and the !RESET menu key. When prompted, press %YES\$. Press \START for a new data stream.
- The &!OK& menu key is interchangeable with the `key, as are the CANCL menu key and the \$key.
- When navigating a list of options in a menu, use the alphabetical keys to jump to your choice. For example, press 7 to jump to the first item in the list that starts with the letter "P." Press 7 again to cycle through the next option that starts with "P."
• Use + to navigate lists of options as well. + advances through the list of items in order.
2 Streaming Experiments
Most often, you will simply plug up to four Fourier® sensors into the front of the StreamSmart 400, connect the StreamSmart 400 to the HP 39/40gs serial port, and turn the switch on the right side to the ON position. When you start the StreamSmart Aplet on the HP 39/40gs, you will find that you are immediately collecting data from all of the sensors!
In streaming experiments, data is collected in real-time, with data literally “flowing” across the screen in up to four separate streams. A streaming experiment is illustrated conceptually in Figure 2-1 below. Each section of this chapter on streaming experiments corresponds to one of the bubbles in the flow chart in the figure.
![graph LR A["Start"] --> B["View Data Stream"] B --> C["Select Data Set"] C --> D["Export Data to Statistics Aplet"] D --> E["Stop"] E --> F["Analyze Data in Statistics Aplet"] G["StreamSmart Aplet"] --> B H["Statistics Aplet"] --> E](/content/2026/05/1069422/images/54d195a540307b694ae159d2e38cc501f5216ac8b0a0a467cc41ea781843b63b.jpg)
Figure 2-1 Streaming experiment
As data streams across the screen, you can modify how you view the stream(s). You can speed the streams up or slow them down simultaneously, as all four streams share the same horizontal time axis. In addition, you can move each stream up or down separately and zoom in or out on each stream vertically. Each stream has its own vertical axis. Zooming and panning each stream separately in the vertical dimension allows you to get just the right view on your experimental data. You can also stop and restart the stream(s), and choose a discreet section of the stream(s) to examine more closely. The speed at which you can collect data and the flexibility you have in viewing the data are features unique to streaming experiments performed with the HP MCL.
Table 2-1 describes what you see on screen and summarizes what you can do at each step in a streaming experiment. Use this table for quick reference. The following sections elaborate on the steps shown in the bubbles of the flow chart in Figure 2-1. Refer to these sections for more detailed information on viewing, selecting, and exporting data.
Table 2-1 Streaming experiment flow
| Display Description | |
| How I got there:Pr#s Datastreamer % | |
 Figure 2-2 Stream Figure 2-2 Stream | What I see on screen:Up to four data streams displayed graphically in real-timeChannel number, sensor type and units for the current selected stream, and screen width expressed in seconds |
| What I can do:CHAN: select a channel (stream) to trace, etc.PAN/ZOOM: toggle between panning (scrolling) and zooming with direction keysPAN: scroll up, down, left, and rightZOOM: zoom in or out vertically or horizontallySCOPE: switch to oscilloscope mode (see Chapter 4)START/STOP: stop stream flow or start a new stream | |
| Display Description | |
| How I got there:Pr@STOP@EXPRT | |
 Figure 2-3 Select, page 1 Figure 2-3 Select, page 1 | What I see on screen:Data streamsCurrent channel and sensor, with tracer activeSelected data set, based on the current channel, and the number of data points ready for exportCurrent tracer coordinates |
| What I can do:ZOOM, PAN, and TRACeto navigate the data streams and find data of interestCROP LEFT and CROP RIGHT(nextpage) to see more functions | |
What I can do:
- CHAN: select a channel (stream) to trace, etc.
• PAN/ZOOM: toggle between panning (scrolling) and zooming with direction keys
• PAN: scroll up, down, left, and right
• ZOOM: zoom in or out vertically or horizontally
• SCOPE: switch to oscilloscope mode (see Chapter 4) - START/STOP: stop stream flow or start a new stream
Display Description
Figure 2-3 Select, page 1
How I got there:
What I see on screen:
- Data streams
- Current channel and sensor, with tracer active
- Selected data set, based on the current channel, and the number of data points ready for export
- Current tracer coordinates
What I can do:
• ZOOM, PAN, and TRACE to navigate the data streams and find data of interest
• CROP LEFT and CROP RIGHT
- (nextpage) to see more functions
Table 2-1 Streaming experiment flow
| Display Description | |
| How I got there:Pr e s | |
| What I see on screen:Same as page 1, but with different menu keys | |
| Figure 2-4 Select,page 2 | |
| What I can do:EDIT: choose a set number of samples between two chosen time valuesSUBTRACT or ADD data-tuples to the current data setCANCL to return to the current data stream or OK to export the current data set to the Statistics Aplet(previous page) to return to page 1 | |
| Display Description | |
| How I got there:Pr e s &OK& | |
| What I see on screen:Fields for the four StreamSmart 400 channels, each with a checkbox to select or deselect that channel for data export, and a dropdown box to choose a destination column in the Statistics Aplet for that channel's dataA checkbox to choose between staying in the StreamSmart Aplet after data export or following your data into the Statistics Aplet | |
| Figure 2-5 Export | |
| What I can do:CHK: select or deselect each channel for data exportCHOOS: select destination columns for the data from each sensorCANCL to return to the original data set or OK to send the data to the Statistics Aplet | |
Table 2-1 Streaming experiment flow
| n | C1 | C2 | C3 | C4 |
| 1 | 0396 | 704677 | ||
| 2 | 0405 | .658847 | ||
| 3 | 0404 | .56696 | ||
| 4 | 0403 | .411355 | ||
| 5 | 0402 | .30694 | ||
| 6 | 0401 | .312805 | ||
| .0396 | ||||
| F01 | INS | ST81 | 805 | P/AF-K/S |
What I can do:
- TABLE: scroll through the table of data using W, X, Z, and Y
• GRAPH: graph data using V Auto Scale
• 1VAR/2VAR: toggle between analysis of 1-variable and 2-variable data
• STATS: view summary statistics - MORE: see the HP 39/40gs User Guide for more information on the Statistics Aplet, including regression fit types and statistical plot types
Viewing a stream of data
Once the StreamSmart Aplet is started with one or more sensors and the StreamSmart 400 attached, the StreamSmart Aplet displays a graphic representation of the incoming data streams as time graphs. The horizontal dimension represents time in seconds, and the vertical dimension represents the current sensor values in relevant units. Because only one stream may be traced at a time, the display also identifies the currently selected data stream, the units of measurement of the selected stream, and the length of time represented by the width of the display screen.
The StreamSmart Aplet first tries to identify the attached sensors and makes several decisions based on the characteristics of the sensors. The StreamSmart Aplet sets the vertical scales for each data stream based on the units of the sensor and the initial readings. The StreamSmart Aplet also sets the horizontal scale for the length of time represented by the width of the display. These default settings ensure that the streams are visible in the display and moving at a perceptible rate. You can vary the speed and vertical position of the streams to meet your needs, even while the data is streaming. Occasionally, the StreamSmart Aplet may not be able to identify a sensor. See Chapter 4, Advanced Topics for details on how to manually identify an unrecognized sensor.
Data streams in at up to 5,700 samples per second, and the data are shown graphically on a 131 x 64 pixel display. At this rate and display resolution, if each pixel column represented a single data point, the stream would move at an extremely high rate. In fact, under these circumstances, the cursor would fly along at over eight feet per second! To slow the stream down enough to make the motion easily perceptible, each pixel in each data stream represents a set of data points. The student can zoom in horizontally on the streams, essentially making each pixel represent a smaller and smaller set of data points, or zoom out, making each pixel represent a larger and larger data set. By default, the StreamSmart Aplet uses the average of these data points to represent the entire set. In other words,
StreamSmart filters the data by using averages. However, you can choose other filtering methods. For advanced filtering methods, refer to Chapter 4, Advanced Topics. Although the data are averaged for graphing purposes, you still have access to all the data. This is a unique feature of the StreamSmart 400.
The screens shown in Figure 2-7 and Figure 2-8 illustrate the location and basic functions of the menu keys during and just after streaming. Use @ZOOM! and @PAN# to modify the appearance of the streams. SCOPE starts streaming in oscilloscope mode, in which the data streams from left to right across the screen, then repeats upon reaching the right edge of the display, similar to the sweep of an oscilloscope. START/STOP is a toggle that stops and restarts data streaming. Once you stop the stream, there are three additional functions available: Trace, Export, and Next Page. Use !TRACE to view numerical characteristics of points in the data stream. !EXPRT replaces the SCOPE function once streaming is stopped; it opens a set of tools for selecting a final data set to analyze. (next page) displays the second page of the menu key functions.


Figure 2-7 During streaming Figure 2-8 After streaming
Table 2-2 lists the menu functions available during and just after streaming.
Table 2-2 Menu keys during data streaming, page 1
| Menu Key Description | |
| \CHAN | This menu key opens the channel selection menu, which allows you to select which stream to trace. By extension, you are also choosing which stream to zoom or pan vertically. Alternately, you can use the keys numbered 1-4 to select a channel. |
| @@PAN#/\ZOOM | This menu key is a toggle that determines how the direction keys function. Press once to activate Pan mode, once more to activate Zoom mode. The active mode is indicated by a small square after the menu mode name. |
| @@PAN# | Toggles the direction keys to scroll the data streams up, down, left, and right to find data of interest. Panning horizontally affects all streams uniformly; panning vertically affects only the current, selected stream. |
| \ZOOM | Used with the direction keys, zooms in or out, horizontally or vertically, to get the best view of the streams. Zooming horizontally affects all streams uniformly, while zooming vertically affects only the current, selected stream. |
| \SCOPE | Switches to oscilloscope mode. In this mode, the data stream sweeps from left to right, then returns to start from the left for another sweep. See Chapter 4, Advanced Topics for details. |
| \START/\STOP | This toggle starts and stops data streaming. Stopping the stream(s) permits exploration of the data and selection of a final data set for export. Start deletes any current data set and starts a new set of streams. |
| \TRACE | Activates Trace mode, allowing you to trace along any of the data streams. |
| \EXPRT | Opens the Export Data menu, with functions for isolating and selecting a final data set to export to the Statistics Aplet. |
| Accesses the second page of menu keys. | |
Zoom, Pan and Trace are radio button toggles that work in conjunction with the direction keys (W, X, Z, and Y). Only one function is active at a time, its active status indicated by a small square after the function name. For example, TRAC ppm means the tracer is active and the direction keys will be used to trace the selected stream or jump to another stream. Table 2-3 describes how the direction keys are used for each of these functions.
Table 2-3 Functions controlled by the direction keys
| Menu Key Description | ||
| @ZOOM! | ZY | Use these keys to zoom in or out horizontallyIf you are actively streaming data, these keys speed up the stream or slow it downIf streaming has stopped, trace to data of interest and then switch to Zoom to zoom in or out on the tracer coordinates. The tracer location stays fixed.P r Y to zoom in horizontally on the tracer position, effectively decreasing the amount of time represented by the width of the displayP r Z to zoom out horizontally on the tracer position, effectively increasing the amount of time represented by the width of the display |
| @ZOOM!! | WX | Zoom in/out vertically on the current selected data streamPr W to zoom in and press X to zoom outThe center of the display stays fixedDecreases/increases the vertical scale, in sensor units, of the current, selected stream |
| %PAN | ZY | Move all stream(s) left and right in the displayThe screen display is a fixed window that moves back and forth along the stream(s) |
| %PAN | WX | Move the current, selected stream up and down in the displayUseful to separate or superimpose the streams for viewing purposes |
| !TRACE | ZY | Moves left or right from pixel to pixel in the current, selected data streamDisplays timestamp and sensor data |
| !TRACE | WX | Moves the tracer from one stream to anotherPr X to move from channel to channel in increasing numerical orderPr W to move through the channels in decreasing numerical order |
Besides navigating and tracing the data set to find data of interest, StreamSmart also lets you compare any two points in a single stream and manually add a data-tuple as a row in your chosen columns in the Statistics Aplet. These functions are found on the second page of the Stream menu, which is only active once streaming has stopped.
Mark and Swap can be used together to examine the relationship between points in the data stream currently being traced. When you press @MRK\$, the StreamSmart Aplet sets a visible mark at the current tracer location. Once the mark is set, you can trace to any other point in the stream. The StreamSmart Aplet displays the change in both x and y between the mark and the current tracer location (see Figure 2-9). Press @SWAP! to switch the tracer and mark locations.

Figure 2-9
Add and Setup are also used together when you want to build your final data set, point by point. For example, suppose a data stream represents the dampened oscillations of a vibrating rod. In this case, you may want to collect just the maximum of each oscillation into a data set. Press \SETUP to choose columns in the Statistics Aplet for your data. Once the columns have been chosen, return to your data stream and trace to the first point you want to keep in your data set. Press %ADD\$ to add the data as a row to your chosen columns in the Statistics Aplet. StreamSmart briefly displays a message telling you the row to which the data point is being exported. Continue in this fashion until you have collected all the points you want, then start the Statistics Aplet to view and analyze your data. Table 2-4 lists the second page of menu keys and their functions.
Table 2-4 Menu keys, page 2
| Menu Key Description | |
| @MRK | Toggles Mark mode on and off, setting a mark at the current tracer position, or erasing the mark. |
| @SWAP! | Switches the tracing cursor and the mark on the current, selected stream. |
| @GOTO@ | Permits you to jump to a specific time along the current stream. |
| Sets the destination columns for data when %ADD is pressed. | |
| %ADD$ | Adds the current data-tuple to the default columns in the Statistics Aplet. |
| Returns to the previous page of menu keys. | |
Low battery symbol
The low battery symbol (☐) on the screen indicates that probes requiring higher power may not work. If the battery symbol appears in the upper left corner of the screen, as shown in Figure 2-10, and your experiment requires the use of higher power probes, be sure the StreamSmart has a fresh battery. For instructions on changing the battery, see the section titled, Replacing the battery in Chapter 5.

Figure 2-10 The low battery symbol
Select a set of data
Once you have stopped streaming data, you will want to examine the data to find just the data set you wish to analyze. The !EXPRT menu key opens the Export menu. Here you will find all the tools you'll need to identify and select your final data set. Note that Zoom, Pan, and Trace are still available. In addition, you can use %\1\%and \% 1% to crop data off the left and right sides of the data set, as shown in Figure 2-11. You can also thin the data by subtracting points; if you change your mind, you can add them back.
![Ch1: Mic. Export: 50 x:5.462s y:-0.0298 CHAN 200M TRAC [ ]](/content/2026/05/1069422/images/ce936b7469898a75c7890a0b274320dc448e1881b7f435caab8c17c6f4169140.jpg)
Figure 2-11
Table 2-5 and Table 2-6 describe the new functions available on the two pages of the Export Menu.
Table 2-5 Menu keys during export, page 1
| Menu Key Description | |
| %|n% | Toggles left-cropping on and off. Use Y and Z to move the left-crop bar. Data to the left of the bar is excluded from the final data set. |
| %|n% | Toggles right-cropping on and off. Use Y and Z to move the right-crop bar. Data to the right of the bar is excluded from the final data set. |
| Moves to a second page of menu keys. | |
Table 2-6 Menu keys during export, page 2
| Menu Key Description | |
| EDIT# | Lets you select a specific number of data-tuples between two time values for export to the Statistics Aplet. |
| %- | Subtracts 1 data-tuple from the current data set; when shifted, subtracts 10 data-tuples from the current data set. |
| %+ | Adds 1 data-tuple to the current data set; when shifted, adds 10 data-tuples to the current data set. |
| !CANCL | Cancels the current data set selection and returns to the full set of streams. |
| @OK@ | Begins exportation of the current selected data set to the Statistics Aplet and deletes all other data. |
| Returns to the first page of the Export menu. | |
Export a data set
Once you have selected a final data set for analysis, it is relatively simple to export your data to columns in the Statistics Aplet. Figure 2-12 illustrates the fields of the Export menu.

Figure 2-12 The Export menu
There are six fields in the Export menu: four for the StreamSmart 400 channels, one for the timestamp associated with each data-tuple, and one that determines what happens after the data is exported. The four channel fields, (CH 1, CH 2, CH 3, and CH 4), as well as the TIME field, all behave the same way. They are each preceded by a checkbox and followed by a dropdown box. The checkbox allows you to select or deselect the data from each channel for exportation. By default, all four channels and the time are selected for export. Press[sp]!CHK! to toggle between selecting and deselecting a channel. Each channel field is also followed by a dropdown box. This dropdown box permits you to choose the column in the Statistics Aplet you want as the destination for the data from that channel. Press the ICHOOS menu key to change the current column to any of the ten columns in the Statistics Aplet. At any time, you can press !CANCL! to ignore the changes you made and return to your data set, or press !%OK\$% to proceed with exportation of the data. Once your data set is exported, all the other data from your experiment is deleted to make room for a new experiment. Table 2-7 summarizes the options in the Export dialogue box.
Table 2-7 Export menu dialog box options
| Field Menu Key Description | ||
| CH1 | |sgy|!!CHK | Toggles between selecting and deselecting the current channel. The data from any active channel (its stream) will be exported; the data from any inactive channel will not be exported. |
| CH2 | ||
| CH3 | ||
| CH4 | CHOOS | Opens a dropdown box with the names of the columns in the Statistics Aplet (C1, C2, C3...C9, and C0). Choose any column as the destination for the data from this channel. |
| Time | ||
| Open Stat Aplet | |sgy|!!CHK | Toggles between selecting and deselecting this option. If selected, the Statistics Aplet will be opened after data exportation and the Numeric view of the data will be displayed. If deselected, you will return to the StreamSmart Aplet and data streaming after the data is exported. |
Analyze experimental data
The StreamSmart Aplet provides minimal facilities for examining and analyzing data, as most of this work is done in the Statistics Aplet after the data is exported there. The Statistics Aplet lets you view your data in a table, plot it as a graph, view summary statistics, and create 2-variable models for bi-variate data. All of this functionality is described in detail in the HP 39/40gs User Guide, so it is not repeated here. However, this section contains a brief summary of commonly used functions in the Statistics Aplet.
When you leave the StreamSmart Aplet and enter the Statistics Aplet, you enter the Numeric view of that Aplet, as shown in Figure 2-13.
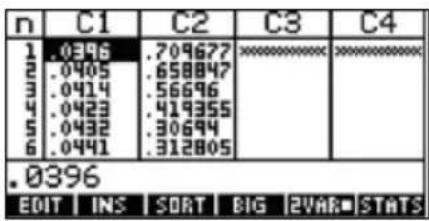
Figure 2-13 The Statistics Aplet Numeric view
The Numeric view shows your columns of data arranged in a table. Although only four columns are displayed, there are actually ten columns available. Use Y and Z to move from column to column; use X and W to navigate through the data in a column.
One key to understanding the Statistics Aplet is the |1VAR//|2VAR| menu key. Press this key to toggle between 1-variable and 2-variable statistics. If set to |1VAR|, you are studying the data column by column; if set to |2VAR|, you are studying the relationship between any two columns of data. Press Q to enter the Symbolic view of the Aplet and define which columns to study. In 1-VAR mode, the Symbolic view will let you define up to five histograms, or box-and-whisker plots: H1, H2, H3, H4, and H5. Each plot can take one column for its data and another for its frequency, or one column for the data and a common frequency you enter manually. In 2-VAR mode, the Symbolic view will let you define up to five scatter plots (S1, S2, etc.). Press @ Q (Plot Setup) to select a fit model for each scatter plot.
The easiest way to see a graph of your data is to press V and select the Autoscale option. If your graph is a scatter plot, press @MENU and then \$@FIT#@ to see the fit model plotted with your data. The views of the Statistics Aplet are summarized in Table 2-8 and Table 2-9. For more information, please refer to the HP 39/40gs User Guide.
Table 2-8 Views in the Statistics Aplet
Symbolic Plot Numeric
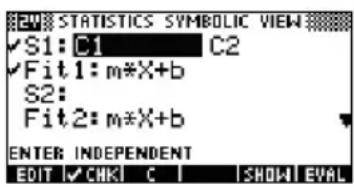
Figure 2-14 Define an analysis
![+ + + + + S1[1]:1.5 MENU](/content/2026/05/1069422/images/5267ec5c475ec5f9aa02e2370134efda1f863ae16eebb9ffa0abd39343bc2488.jpg)
Figure 2-15 Statistical plot
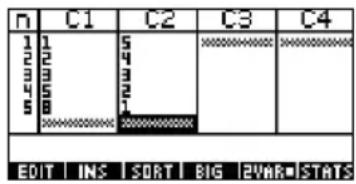
Figure 2-16 Table of values
Table 2-9 Views in the Statistics Aplet using the SHIFT key
| Symbolic Setup @ Q | Plot Setup @ R |
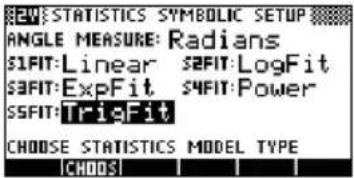 |  |
Figure 2-17 Choose fits Figure 2-18 Setup the graph
3 Capturing Data from Events
Although the StreamSmart 400 is capable of collecting data at high sampling rates, as shown in Chapter 2, it is also versatile enough to gather data from experiments of slower frequency—and even distinct events—with ease. You have seen the power of streaming data in real time at speeds over 5,000 samples per second with the streaming experiment. In this chapter, we go to the opposite extreme to show you how simple it is to take a few isolated sample readings from up to four sensors at a time and collect them into a data set for analysis. The StreamSmart Aplet lets you capture data at any point in time and have the data exported to corresponding rows of separate columns in the Statistics Aplet. Additionally, you can have the readings auto-numbered in the order in which they are collected, or you can add a numerical entry to each reading when it is taken. Figure 3-1 summarizes the steps involved in these types of experiments.
![graph TD A["Start"] --> B["Set Up"] B --> C["Monitor and Select Event"] C --> D{Decision} D --> E["End"] E --> F["Analyze Data"] G["Start"] --> H["Set Up"] H --> I["Monitor and Select Event"] I --> J["Add Numerical Entry"] J --> K{Decision} K --> L["End"] L --> M["Analyze Data"] N["Take another read…](/content/2026/05/1069422/images/336da2ed6b56cf82b17de08cb9877dac167719f2a94e5eb68e1c54ee996e760f.jpg)
Figure 3-1 Selected events and events-with-entry experiments
Table 3-1 illustrates what you see on screen and summarizes what you can do at each step in experiments in which you wish to capture data from distinct events.
Table 3-1 Capturing data from discrete events
| View Description | |
| How I got there:Pr sSETUPWhat I see on screen:The Capture Events Menu | |
Figure 3-2 Set up experiment
| What I can do: |
| Activate up to four channels with their attached sensorsChoose a column for storing the data from each active channelOptional: choose a column for manually adding a numeric entrySelect to just collect the data from each event, auto-number each event, or add a numeric entry to each event |
View Description
| CH1-CURRENT (A) | 2.15 |
| CH4VOLTAGE (V) | 1.465 |
| ADD SETUPPROBE UNIT STAT | |
Figure 3-3 Monitor and select events
| What I can do: |
| • ADD: add a reading to the current data set |
| • SETUP: select experiment type and destination for data |
| • PROBE: manually identify a channel's sensor |
| • UNIT: change units of measurement for a sensor |
| • STAT: go directly to the Statistics Aplet to view and analyze the current data set |
Table 3-1 Capturing data from discrete events
| n | C1 | C2 | C3 | C4 |
| 1 | .0396 | .704677 | XOKOKOK | XOKOKOK |
| 2 | .0405 | .658847 | ||
| 3 | .0414 | .59696 | ||
| 4 | .0423 | .414355 | ||
| 5 | .0432 | .30694 | ||
| 6 | .0441 | .312805 | ||
| .0396 | ||||
Figure 3-4 Analyze data
| What I can do: |
| • TABLE: scroll through the table of data using W, X, Z, and Y |
| • GRAPH: graph data using V Auto Scale |
| • 1VAR/2VAR: toggle between analysis of 1-variable and 2-variable data |
| • STATS: view summary statistics |
| • MORE: see the HP 39/40gs User's Guide for more information on the Statistics Aplet, including regression fit types and statistical plot types |
Numeric view: the meter mode
Whether you choose to auto-number your selected events or add a numerical entry to each event, experiments involving a series of distinct events always start in the Numeric view of the StreamSmart Aplet. Once the StreamSmart Aplet is started with at least one sensor and the StreamSmart 400 attached, press S to view the sensor readings in Meter mode. The Aplet displays a running meter which updates a few times per second. The meter identifies up to four attached sensors, the units for each sensor, and the current reading of each sensor. A sample display is shown below in Figure 3-5. In this figure, a 2.5A current sensor is plugged into Channel 1 (CH1:) and a 2.5V voltage sensor is plugged into Channel 2 (CH2:).
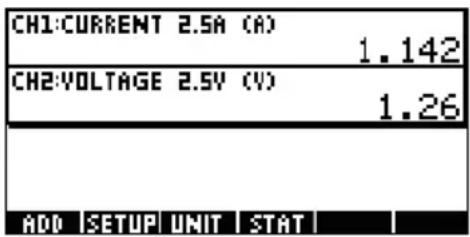
Figure 3-5
Table 3-2 lists the menu keys and their functions for Figure 3-5
Table 3-2 Menu keys in the Numeric view
| Menu Key Description | |
| %ADD | Adds the current reading(s) to the data set as a single eventSee the section below titled, Monitor and select events |
| @SETUP | Choose Selected Events, Events with Entry, or Auto NumberActivate/deactivate each of the four channelsChoose destination columns for data from each active channelSee the section below titled, Set up experiment |
| !PROBE | Manually identify a probe or sensorSee Chapter 4, Advanced Topics |
| UNIT@ | Choose units of measurement for each sensorSee Chapter 4, Advanced Topics |
| #STAT@ | Opens the Statistics Aplet to view and analyze the current data setSee the section below titled, Analyze the data |
Set up experiment
By default, pressing the %ADD\$ menu key will capture the current set of readings from sensors attached to Channels 1 through 4 of the StreamSmart 400. The readings will be auto-numbered, and this number will be stored in Row 1 of column
C1 in the Statistics Aplet. The rest of the readings will be stored in Row 1 of columns C2 through C5, with the reading from the sensor in Channel 1 stored in C2, the reading from the sensor in Channel 2 stored in C3, etc. The next time %ADD\$ is pressed, the data will be stored on Row 2 of these columns. This process can be continued indefinitely.
The Capture Events menu lets you set up where your data will go when you press %ADD\$. You can choose which channels are active and where the data from each channel is stored in the Statistics Aplet. Press ⓄSETUP to enter the Capture Events menu. In addition to choosing columns for your sensor data, you can also deactivate auto-numbering or choose to add an entry to the data from each selected event. Figure 3-6 illustrates the Capture Events menu.

Figure 3-6 The Capture Events menu
Like the Export menu discussed in Chapter 2, the Capture Events menu has a field for each of the four StreamSmart 400 channels. Each of these fields is preceded by a checkbox to activate/deactivate the channel, and followed by a choose box to select the Statistics Aplet column for storing the data from that channel. There is also an EVENT METHOD field that controls what happens each time you press %ADD\$. Here you can choose whether to simply collect the data from the sensors, auto-number each reading, or add a numeric entry to each reading. If you choose to add a numeric entry to each reading, this menu also has a fifth field, ENTRY, that determines the column where these numeric entries are stored.
Table 3-3 lists the menu keys in the Capture Events menu and their functions.
Table 3-3 Menu keys in the Capture Events menu
| Menu Key Description | |
| !sgsy]!!CHK | • Toggles the selected channel off and on. |
| CHOOS | • Choose destination column in the Statistic Aplet for data from the selected channel.• Choose Selected Events, Events with Entry, or Auto Number in the Event Method field. |
| $OK% | • Accept changes made in the Capture Events menu and return to the Numeric view. |
| CANCL | • Cancel changes made in the Capture Events menu, keep the previous configuration, and return to the Numeric view. |
For example, in Figure 3-7 below, Channels 1 and 2 are active, but Channels 3 and 4 are not. The data from Channel 1 will be stored in C1 and the data from Channel 2 will be stored in C2. Because the EVENT METHOD field setting is WITH ENTRY, each reading will prompt for a numeric entry, which will be stored in column C3.

Figure 3-7 An events-with-entry set up
In Figure 3-7, C2 is highlighted as the destination for data from the sensor in Channel 2 of the StreamSmart 400. Pressing |s|!|CHK! now will toggle Channel 2 to be inactive. Pressing the CHOOS menu key drops down a list of C1 through C9, and C0, from which you can choose any other column for the data from the sensor in Channel 2. Press \$OK% to accept all your changes at any time, or the CANCL menu key to cancel all changes; either way, you will return to the Numeric view.
In Figure 3-8, the EVENT METHOD field is highlighted, showing that With Entry has been selected. You may choose to have the events auto-numbered or skip adding any numerical entries to the events (Event Only). Press the CHOOS menu key to make a selection from these three options, as shown in Figure 3-9.


Figure 3-8 Event Method field Figure 3-9 Event Method options
Press the \$0K% menu key to accept your new selection, or the CANCL menu key to keep the current selection and return to the Numeric view.
Monitor and select events
Once you have activated the proper channels and set destinations for the data from these channels, you are ready to begin collecting data. Of course, you can always just start by collecting data using the default columns. To capture an event, just press the \$ADD# menu key. If you have selected to capture events only, or to have them auto-numbered, you will see a display similar to the one depicted in Figure 3-10, which shows that your event data are being added to the current data set. If you have selected to add events to your entry, the display will appear as shown in Figure 3-11, prompting you to add your numerical entry to the event just captured.
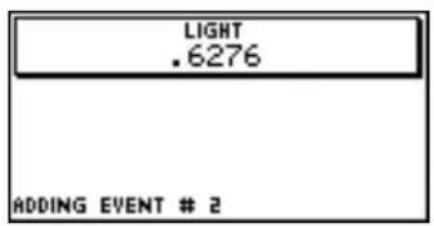

Figure 3-10 Event Only Figure 3-11 With Entry
Analyze the data
Once you have captured all your events, press the @STAT® menu key to proceed to the Statistics Aplet, where your data set has been saved. For a brief summary of the Statistics Aplet, refer to the section titled, Analyze experimental data in Chapter 2. For more complete information, please consult the HP 39/40gs User's Guide.
Data logging
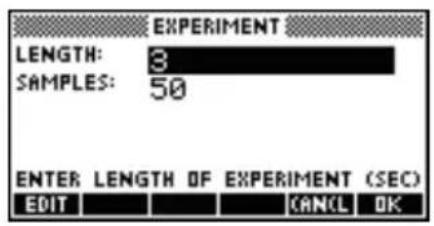
Under certain circumstances, it is desirable to run an experiment for a particular duration (e.g., 3 seconds exactly) and collect a particular number of samples (e.g., 50 samples). The StreamSmart 400 accommodates this need via the
Experiment option under the Views menu, as illustrated in Figure 3-12 and Figure 3-13.
- Press V Experiment to enter the Experiment menu.
- Set LENGTH to 3 seconds and SAMPLES to 50.
- Press \$#OK?@ to trigger data collection.
![Accel. (m/s^2) Export: 50 x:3.0s ZOOM PAN TRACE [ ]](/content/2026/05/1069422/images/6b4d9d97bad579bc881e4c218f0b827b754ecfad8582759f7c846e6ca2c570c4.jpg)
Figure 3-12 The Experiment menu Figure 3-13 50 readings in 3 sec.
Data collection is shown as a time graph, just like a streaming experiment. However, StreamSmart collects 50 discrete sets of sensor readings in a 3-second period at a uniform frequency of 1 reading every 0.06 seconds. The Figure 3-13 shows 50 data points have been collected (Export:50) and the trace cursor readout at the far left of the screen shows that the elapsed time is exactly 3.0
seconds (x:3.0s). At this point, the student is ready to select and export a final data set. Refer to the section titled, Select a set of data in Chapter 2 for more details on selecting and exporting a data set.
4 Advanced Topics
This chapter is devoted to a number of advanced topics, including:
- Sensor setup
- U n i t s e t u p
-
C a l i b r a t i o n
• T h e Plot Setup menu -
Oscilloscope mode
- StreamSmart on the virtual HP 39/40gs calculator
- Keyboard shortcuts
• Mathematical detail behind the zoom and pan features
These advanced topics will help you get the most out of the HP MCL.
Sensor setup: manually identify a sensor
The StreamSmart Aplet is designed to automatically identify a Fourier® sensor attached to the StreamSmart 400. In some cases, StreamSmart may fail to identify a sensor or identify it incorrectly. In this case, you must manually identify the sensor using the Sensor Setup dialog box. Press V and select the Sensor Setup option, as shown in Figure 4-1, or pressA .


Figure 4-1 Figure 4-2
Figure 4-2 shows the Sensor Setup dialog box with accelerometers plugged into Channels 1 and 2. Suppose that the sensor in Channel 1 is not an accelerometer, but a force sensor. With Channel 1, highlighted, press !CH00S and select the appropriate force sensor option. In Figure 4-3, the 0-80 N Force sensor option has been selected. Press ☐ to make this change effective and return to the Sensor Setup dialog box. Figure 4-4 shows the Sensor Setup dialog box with the new changes. Press ☐ to finalize any changes and return to the StreamSmart Aplet. Figure 4-5 shows the Numeric view with the new force sensor in Channel 1.


Figure 4-3 Figure 4-4 Figure 4-5
Unit setup: manually select units for a sensor
When the StreamSmart Aplet automatically identifies a sensor, it also chooses a unit of measurement for that sensor. All subsequent readings from that sensor are shown using the current unit of measurement. Many, but not all, of the probes have multiple units of measurement available. For sensors that do have multiple units available, you can change the unit of measurement at any time using the Unit Setup dialog box. Press V and select the Unit Setup option to open the Unit Setup dialog box, or press B . In the Numeric view, you can simply press \$UNIT#.
Figure 4-6 shows the Unit Setup dialog box with a force sensor measuring Newtons in Channel 1 and an accelerometer measuring G's (G=9.8 m/s²) in Channel 2. Note that Channel 2 in Figure 4-6 is highlighted. Suppose you wish the accelerometer to measure in meters per second squared (m/s²) instead. Press !CH00S and select Accel. (m/s²), as shown in Figure 4-7.


Figure 4-6 Figure 4-7
Press OK to return to the dialog box with the changes shown (Figure 4-8). Press OK to exit the dialog box and activate the changes. Figure 4-9 shows the Numeric view with the new units.

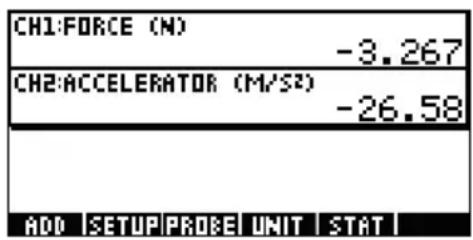
Figure 4-8 Figure 4-9
Calibration
Many Fourier® sensors are factory-calibrated and should not need user calibration. However, most of those that do require user calibration have an adjustment screw on the sensor itself for hardware calibration. Please refer to the documentation that comes with each sensor to determine its calibration status.
If a sensor requires calibration and no hardware calibration is available, the software calibration may be done in the StreamSmart Aplet. Software calibration has two limitations. First, it is the software being calibrated, not the sensor, which means that the new calibration settings will not be carried over if the sensor is plugged into a different calculator. Second, since the calibration is in the software, it will be applied to all sensors of that same type. The StreamSmart Aplet cannot distinguish between two sensors of the same type.
Once it has been determined that software calibration for a sensor is the only option, it should be noted that the StreamSmart 400 offers both 1-point and 2-point methods for such calibrations. A 1-point calibration simply changes the offset, while a 2-point calibration changes both offset and slope.
To perform a calibration:
-
Press S to view the sensor readings numerically. In Figure 4-10, suppose the current reading of the low-G accelerometer is incorrect, and the correct reading is -6.433.
-
Given that the current reading is not correct and the correct reading is known, press V and select the Calibrate option (see Figure 4-11).
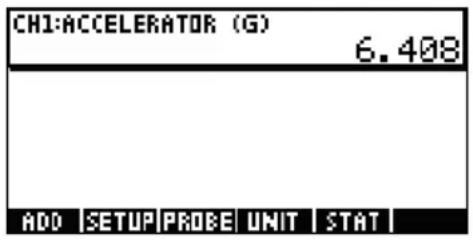
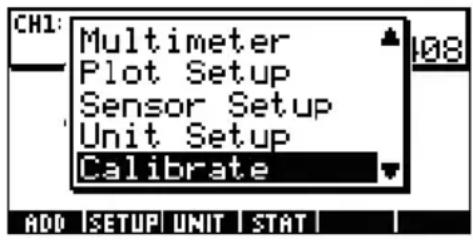
Figure 4-10 Figure 4-11
- Figure 4-12 shows the calibration screen, with its options for 1- or 2-point calibration. Note that the meter continues to show the live streaming of sensor values. Press ☐ to enter the correction for the current reading. The current reading is still 6.408, but it should read -6.433. Enter the correct value as shown in Figure 4-13 and press ☐ to return to the calibration screen.
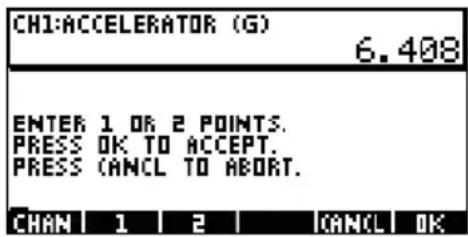

Figure 4-12 Figure 4-13
- Note that the calibration change is not yet effective, as you have the option of entering a second correction. The white square in the %\1$ key in Figure 4-14 indicates that the first point correction has been logged.
- Press ☐ to enter a second point correction, or press ☐ to make the 1-point calibration effective (Figure 4-15). Of course, you can press CANCL to abort the calibration process.

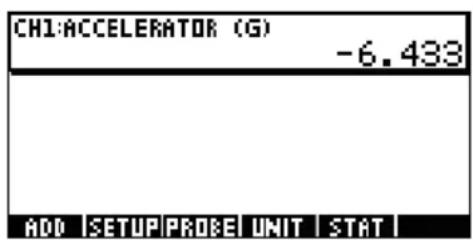
Figure 4-14 Figure 4-15
The Plot Setup menu
The Plot Setup menu gives you access to a number of advanced options for streaming experiments. Among these are overriding the default streaming window settings and the default data filtering methods.
Setting the stream window
In most cases, you will use the zoom and pan features to match the display dimensions to the set of data points you find interesting. In some cases, however, you may want to see all the data between two known time values. Suppose you have been collecting data from a microphone for a few seconds (see Figure 4-16) and you wish to look at the data from time t=0.85 seconds to time t=0.95 seconds.

Figure 4-16
To see this exact time interval without zooming and panning:
- Press @ R to enter the Plot Setup menu.
- Change the XRNG values to [0.85, 0.95] (Figure 4-17).
- Press the R key to return to the streaming window.(Figure 4-18).
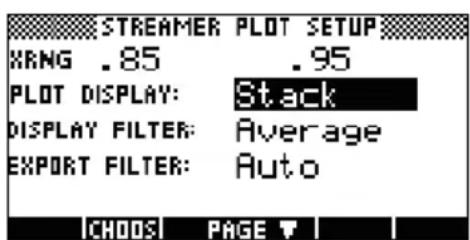
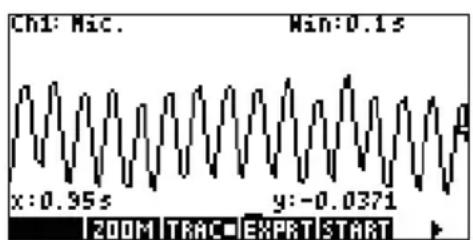
Figure 4-17 Figure 4-18
The StreamSmart Aplet will match the minimum and maximum time values in the XRNG fields to the closest corresponding time values in the data set. They may not always match exactly. In Figure 4-18, the maximum x-value is indeed 0.95 and the width of the display represents 0.1 second. The next streaming experiment will maintain the width of the display at 0.1 seconds, meaning that XRNG will initially be [0, 0.1]. These values will remain in effect until new values are chosen or the StreamSmart Aplet is reset.
Plot display options
When performing experiments with multiple probes, the StreamSmart Aplet places each data stream in its own swim-lane by default. The data streams appear in the numerical order of their channels, from top to bottom of the display. Under certain circumstances, you may want to see multiple data streams superimposed instead of separated in swim-lanes. In the Plot Setup menu, the Plot Display field allows you to choose either option. This field has two settings: Stack and Overlay. Figure 4-19 depicts the data streams from two microphones shown with the default Stack option, with the data streams separated in their familiar swim-lanes. Press !CHOOS and select the Overlay option to see the streams superimposed, as in Figure 4-21.


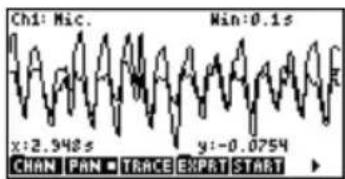
Figure 4-19 Stacked Figure 4-20 Figure 4-21 Overlaid
Filtering data for display and export
Under most circumstances, each pixel in the display of the data stream represents multiple sensor readings. Depending on the current window, each pixel could represent quite a large data set. For example, in Figure 4-22, each pixel has a width of approximately 0.1 seconds (13s/130pixels=0.1s/pixel). But StreamSmart 400 has collected approximately 570 readings in each 0.1 second interval. For display purposes, those 570 readings are represented by a single value. In Figure 4-22, the readings taken from 6.85 seconds until 6.95 seconds have been averaged to obtain a reading of 0.578. The pixel containing the point (6.9, 0.578) has been turned on to represent that set of readings.

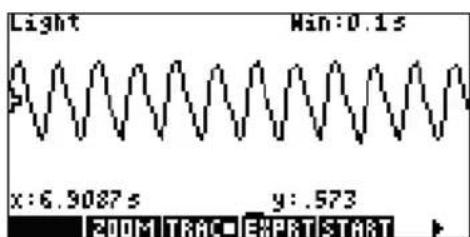
Figure 4-22 Figure 4-23
As you zoom out, each pixel represents a larger and larger set of readings. Zooming in makes each pixel represent a smaller and smaller set of readings until, when you have zoomed all the way in, each pixel finally does represent a single reading. This is fundamental to the StreamSmart solution to data collection: the full data set is available to the user and is only filtered for display and export purposes. Since the data goes through these two distinct filters before it gets to the Statistic Aplet, the advanced user benefits from understanding the default filtering process and the other filtering options available.
During data streaming, each pixel in the display represents an interval of time and all the sample readings collected during that time interval. For example, Figure 4-22 shows the tracer at the pixel whose center is at 6.9 seconds. As stated previously, all the data collected between x=6.85 seconds and x=6.95 seconds have been represented by the average of those readings, which is 0.578. Figure 4-23 shows all the data between x=6.9 seconds and x=7.0 seconds. All that data is equivalent to the data represented by a single pixel in Figure 4-22! Only when the StreamSmart Aplet has zoomed all the way in on a set of data is there a 1:1 correspondence between pixels and data points.
The default display filter uses the numerical average of the readings in an interval to represent that set of readings. When you export the data to the Statistics Aplet, the StreamSmart Aplet uses the same values that the display used. This method ensures that the export filter is the same as the display filter.
The StreamSmart Aplet has a number of different filtering options for both display and export purposes. Figure 4-24 shows the data stream in Figure 4-22 filtered by the average of each pixel set. Figure 4-25 shows the same data set filtered by the minimum of each pixel set, while Figure 4-26 is filtered by the maximum. The oscillations hidden in Figure 4-22 and exposed by zooming in Figure 4-23 can also be seen in Figure 4-25 and Figure 4-26, this time exposed by the filtering methods. Once a filtering method is chosen, it is used for the current, as well as future data streams until either the StreamSmart Aplet is reset or another filtering method is chosen.
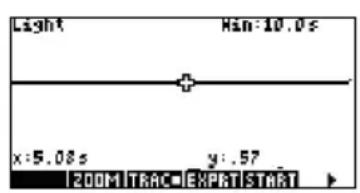

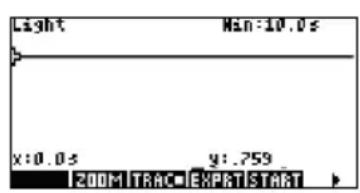
Figure 4-24 Figure 4-25 Figure 4-26
To choose a display filtering method:
-
Press @ R to enter the Plot Setup menu and use the X key to highlight the DISPLAY FILTER field (Figure 4-27).
-
Press CHOOE to see the list of options (Figure 4-28).
-
Use X and W to highlight your selection and press the ☐ key.
- Press R to return to the graphic view using the new filtering method.

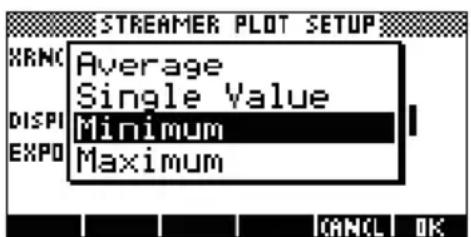
Figure 4-27 Figure 4-28
Table 4-1 summarizes the display filtering options available in the Display Filter field of the Plot Setup menu.
Table 4-1 Display filters
| Name Description | |
| Average | Uses the average of the data in each pixel interval to represent the data. |
| Single Value | Uses a single value to represent the data. |
| Minimum | Uses the minimum value to represent the data. |
| Maximum | Uses the maximum value to represent the data. |
In the same way that data is filtered for display in the StreamSmart Aplet, it is also filtered for export to the Statistics Aplet.
To choose an export filtering method:
- Press @ R to enter the Plot Setup menu and use the X key to highlight the EXPORT FILTER field.
- Press the CHOICE menu key to see the list of options.
- Use X and W to highlight your selection and press OK.
- Press R to return to the graphic view, and then press EXPORT to export data to the Statistics Aplet using the new filtering methods.
The export options are the same as the options for display filtering, with two additions. The additional options are summarized in Table 4-2.
Table 4-2 Additional export filters
| Name | Description |
| Auto This is the default option. It matches the export filter to the display filter. | |
| WYSIWYG This option filters the data so that the scatter plot in the Statistics Aplet matches the graph in the StreamSmart Aplet exactly. The results of this filtering depends on your zoom level. | |
Data history
By default, StreamSmart 400 collects data from a single sensor at approximately 5,700 samples per second while streaming. At this rate, the StreamSmart Aplet can collect approximately 16.5 seconds of data before memory is full. You can use the options in the Experiment menu to increase the time allotted to an experiment, or you can change the way the StreamSmart Aplet allocates memory to data streams via the History field in the second page of the Plot Setup menu. Press @ R %@PAGE#|n|% to access this menu. Figure 4-29 illustrates the second page of the Plot Setup menu with the History Type field highlighted. By default, this field is set to Fixed, meaning that the StreamSmart Aplet will store all data collected during streaming for a fixed amount of time. The amount of time will vary, depending on the number of sensors in use. The current duration (in seconds) is shown in the History field. In this case, streaming can continue for a total of 16.453 seconds. You can change the History Type from Fixed to Auto by pressing !CH00S and selecting the Auto option (see Figure 4-30). If the History Type is set to Auto, then streaming will continue indefinitely. However, as streaming continues, less and less of the older data is saved.
The Auto setting is useful for starting a stream and not worrying about when an experiment is going to start. Since the most recent data is saved in its entirety and only the oldest data is selectively purged, you can start a stream and just let it run until you are ready to start an experimental procedure.
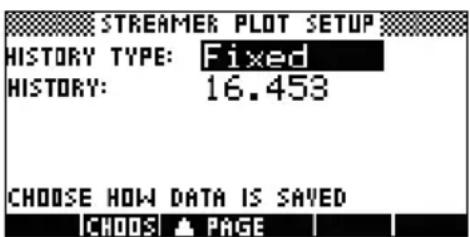

Figure 4-29 Figure 4-30
Oscilloscope mode
While streaming data in the Plot view, the StreamSmart Aplet provides you with the option of Oscilloscope mode. Press SCOPE to activate Oscilloscope mode. This menu key is a toggle, so press it again to return to normal data streaming.
Oscilloscope mode works with a trigger to enable an oscilloscopic view of your data stream. With no trigger set, Oscilloscope mode displays the incoming data in sweeps. Data streaming occurs from left to right across the screen. When the stream hits the right edge of the display, it continues by returning to the left edge of the display and again streams from left to right. Each sweep takes the same amount of time and you can zoom in or out horizontally to adjust the sweep time. These features allow you to visually capture data that varies periodically, such as sound waves.
A trigger can be set in order to position the data at a specific display location when the trigger is crossed. You can set an ascending or descending trigger. An ascending trigger starts the sweep at the trigger position when the data values first exceed the trigger value. A descending trigger starts the sweep when the data values first drop below the trigger value. The operation of the trigger mechanism assures that when the triggering value is reached, the first data point is plotted where the dotted trigger lines intersect. You can also set a two-way trigger.
While in Oscilloscope mode, the zoom and pan features both work as they do during data streaming. The result is that you can manipulate the visual display of an oscillating data stream to meet your specific needs rather easily. Table 4-3 and Table 4-4 describe the menu key functions available in Oscilloscope mode.
Table 4-3 Oscilloscope menu keys, page 1
| Menu Key Description | |
| @ZOOM/PAN! | This key toggles between zooming and panning (scrolling) with the direction keys. |
| @ZOOM | When on, use the direction keys to zoom in or out, vertically or horizontally, to adjust the size of the oscilloscope window in sensor units or seconds. |
| PAN$ | When on, use the direction keys to scroll vertically or horizontally in the display. |
| @TRGR@ | Toggles the trigger off and on. When on, use the direction keys to set the location of the trigger. |
| !SCOPE | This key toggles Oscilloscope mode off and on. |
| \START /kSTOP | This key toggles between start and stop. Press !STOP to stop the stream of data; press START to begin a new data stream. |
Table 4-3 Oscilloscope menu keys, page 1
| Menu Key Description | |
| This key displays the second page of the oscilloscope menu. | |
Table 4-4 Oscilloscope menu keys, page 2
| Menu Key Description | |
| !000000|,,,,,,% | Sets a two-way trigger that operates whether it is crossed from below or above. Use the direction keys to set the location of the trigger. |
| !000000|,|,,,^ | Sets an ascending trigger. Use the direction keys to set the x- and y-positions for the trigger. |
| !,,,,zv|n[000000^ | Sets a descending trigger. Use the direction keys to set the x- and y-positions for the trigger. |
| Returns to the first page of the oscilloscope menu. | |
StreamSmart 400 and the virtual HP 39/40gs
The StreamSmart 400 may be used in conjunction with the virtual HP 39/40gs Graphing Calculator software for the PC. This use is effective when demonstrating the StreamSmart 400 to an audience or in a classroom setting. Students can also demonstrate an experiment to the class in this way. The StreamSmart 400 connects to a PC using a mini-USB to USB cable. This cable is included in the HP 39/40gs package. Connect the StreamSmart 400 to your PC, launch the virtual HP 39/40gs Graphing Calculator application, and start the StreamSmart Aplet. For further information regarding the virtual HP 39/40gs Graphing Calculator software for the PC, please visit www.hp.com/calculators.
Keyboard shortcuts
Table 4-5 lists the keyboard shortcuts for the StreamSmart Aplet. These shortcuts are available either during or just after streaming.
Table 4-5 Keyboard shortcuts
| Key(s) Description | |||
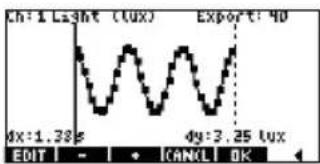
| . | Toggles through the three options available for viewing a final data set after streaming and prior to export. See Figure 4-31, Figure 4-32, and Figure 4-33. | ||
 |  |  | |
| Figure 4-31 Figure 4-32 Figure 4-33 | |||
| / | Zooms in vertically, during or after streaming. | ||
| * | Zooms out vertically, during or after streaming. | ||
| + | Zooms in horizontally, during or after streaming. | ||
| - | Zooms out horizontally, during or after streaming. | ||
| f | $%+ | Adds ten points to the currently selected data set, while in the Export menu. | |
| f | %- | Subtracts ten points from the currently selected data set, while in the Export menu. | |
| A | Opens the Sensor Setup menu. | ||
| B | Opens the Unit Setup menu. | ||
| E | After one or more vertical zooms, E returns to the original view of the current data stream. | ||
| E | @ | After vertical, zooms on multiple streams, E @ returns all streams to their original views. | |
Mathematical details: zoom, pan, and trace
Table 4-6 and Table 4-7 elaborate on how zooming and panning work. Table 4-8 concludes the section with an explanation of tracing.
Table 4-6 Zoom
| Aplet Feature | Key Description | |
| Zoom | W | The horizontal center line remains fixed, but the window contracts vertically. Ymax decreases and Ymin increases in such a way that their average remains the same. The graph appears to stretch out. If the graph is not centered vertically, the graph may drift as well as stretch. |
| Zoom | X | Like Zoom W, the horizontal center line remains fixed, but the view dilates vertically. Ymax increases and Ymin decreases in such a way that their average remains the same. The graph appears to shrink vertically. Again, if the graph is not centered vertically, it may drift as it shrinks as well. |
| Zoom | Y | Zoom in horizontally: decreases the time duration represented by the window's width. The current tracer position remains fixed. Xmin increases and Xmax decreases accordingly. If data is streaming, the appearance is that the data stream speeds up (increases the "current" of the stream). If streaming has stopped, the appearance is a dynamically increasing horizontal dilation about the vertical segment X=Xtracer, where Xtracer is the x-coordinate of the current tracer location. |
| Zoom | Z | Zoom out horizontally: increases the time duration represented by the window's width. The current tracer position remains fixed. Xmin decreases and Xmax increases accordingly. If data is streaming, the appearance is that the data stream slows down (decreases the "current" of the stream). If streaming has stopped, the appearance is a dynamic horizontal contraction of the data with respect to the vertical segment X=Xtracer. Once the data stream has contracted to the point where it all fits in the display, continuing to zoom in contracts with respect to the left edge of the display. Zooming out horizontally will eventually stop with data still visible in a handful of pixel columns. |
One way to remember what will happen when you use Zoom left and Zoom right is to remember that the left edge of the display is X=Xmin, and the right edge is X=Xmax. In a horizontal zoom, the left edge always remains fixed. The left and right keys simply move the current, right edge (X=Xmax) to the left and right, respectively.
Table 4-7 Pan
| Aplet Feature | Key Description | |
| Pan | W | Moves the stream itself upwards. The values of Ymax and Ymin are decreased by equal amounts. |
| Pan | X | Moves the stream itself downwards. The values of Ymax and Ymin are increased by equal amounts. |
| Pan | Y | Moves the stream itself to the right. The values of Xmin and Xmax are decreased by equal amounts. |
| Pan | Z | Moves the stream to the left. The values of Xmin and Xmax are increased by equal amounts. |
Table 4-8 Trace
| Aplet Feature | Key Description | |
| Trace | Y | Moves the trace cursor along the data stream, from pixel to pixel, to the right. The values of X-Min and X-Max only change if the cursor traces beyond the right edge of the display. |
| Trace | Z | Moves the trace cursor along the data stream, from pixel to pixel, to the left. The values of X-Min and X-Max only change if the cursor traces beyond the left edge of the display. |
5 Warranty, Regulatory, and Contact Information
Replacing the battery
The StreamSmart 400 uses one 9-volt battery. Use only fresh batteries. Do not use rechargeable batteries. To install a new battery:
- With the unit turned off, slide the back cover off.
- Holding the black tab with one hand, carefully detach the old battery by pulling it gently with the other hand. Warning! pulling too hard without supporting the black tab can damage the battery connectors.
- Connect a new battery by slipping the battery terminals into the proper connectors on the black tab. Be sure the terminals fit securely.
- Place the tab with the new battery attached inside the compartment and slide the back cover closed.
Warning! There is danger of explosion if the battery is incorrectly replaced. Replace only with the same or equivalent type recommended by the manufacturer. Dispose of used batteries according to the manufacturer's instructions. Do not mutilate, puncture, or dispose of batteries in fire. The batteries can burst or explode, releasing hazardous chemicals.
HP Limited hardware warranty and customer care
This HP Limited Warranty gives you, the end-user customer, express limited warranty rights from HP, the manufacturer. Please refer to HP's Web site for an extensive description of your limited warranty entitlements. In addition, you may also have other legal rights under applicable local law or special written agreement with HP.
Limited Hardware Warranty Period
Duration: 12 months total (may vary by region, please visit www.hp.com/support for latest information)
General Terms
HP warrants to you, the end-user customer, that HP hardware, accessories and supplies will be free from defects in materials and workmanship after the date of purchase, for the period specified above. If HP receives notice of such defects during the warranty period, HP will, at its option, either repair or replace products which prove to be defective. Replacement products may be either new or like-new.
HP warrants to you that HP software will not fail to execute its programming instructions after the date of purchase, for the period specified above, due to defects in material and workmanship when properly installed and used. If HP receives notice of such defects during the warranty period, HP will replace software media which does not execute its programming instructions due to such defects.
HP does not warrant that the operation of HP products will be uninterrupted or error free. If HP is unable, within a reasonable time, to repair or replace any product to a condition as warranted, you will be entitled to a refund of the purchase price upon prompt return of the product with proof of purchase.
HP products may contain remanufactured parts equivalent to new in performance or may have been subject to incidental use.
Warranty does not apply to defects resulting from (a) improper or inadequate maintenance or calibration, (b) software, interfacing, parts or supplies not supplied by HP, (c) unauthorized modification or misuse, (d) operation outside of the published environmental specifications for the product, or (e) improper site preparation or maintenance.
HP MAKES NO OTHER EXPRESS WARRANTY OR CONDITION WHETHER WRITTEN OR ORAL. TO THE EXTENT ALLOWED BY LOCAL LAW, ANY IMPLIED WARRANTY OR CONDITION OF MERCHANTABILITY, SATISFACTORY QUALITY, OR FITNESS FOR A PARTICULAR PURPOSE IS LIMITED TO THE DURATION OF THE EXPRESS WARRANTY SET FORTH ABOVE. Some countries, states or provinces do not allow limitations on the duration of an implied warranty, so the above limitation or exclusion might not apply to you. This warranty gives you specific legal rights and you might also have other rights that vary from country to country, state to state, or province to province.
TO THE EXTENT ALLOWED BY LOCAL LAW, THE REMEDIES IN THIS WARRANTY STATEMENT ARE YOUR SOLE AND EXCLUSIVE REMEDIES. EXCEPT AS INDICATED ABOVE, IN NO EVENT WILL HP OR ITS SUPPLIERS BE LIABLE FOR LOSS OF DATA OR FOR DIRECT, SPECIAL, INCIDENTAL, CONSEQUENTIAL (INCLUDING LOST PROFIT OR DATA), OR OTHER DAMAGE, WHETHER BASED IN CONTRACT, TORT, OR OTHERWISE. Some countries, States or provinces do not allow the exclusion or limitation of incidental or consequential damages, so the above limitation or exclusion may not apply to you.
The only warranties for HP products and services are set forth in the express warranty statements accompanying such products and services. HP shall not be liable for technical or editorial errors or omissions contained herein.
FOR CONSUMER TRANSACTIONS IN AUSTRALIA AND NEW ZEALAND: THE WARRANTY TERMS CONTAINED IN THIS STATEMENT, EXCEPT TO THE EXTENT LAWFULLY PERMITTED, DO NOT EXCLUDE, RESTRICT OR MODIFY AND ARE IN ADDITION TO THE MANDATORY STATUTORY RIGHTS APPLICABLE TO THE SALE OF THIS PRODUCT TO YOU.
Customer care
In addition to the one year hardware warranty your HP calculator also comes with one year of technical support. If you need assistance, HP customer care can be reached by either e-mail or telephone. Before calling please locate the call center nearest you from the list below. Have your proof of purchase and calculator serial number ready when you call.
Telephone numbers are subject to change, and local and national telephone rates may apply. For more support information, please visit the web at: www.hp.com/support.
Contact Information
| Country/Region Contact | |
| Africa (English) www.hp.com/support | |
| Afrique (français) www.hp.com/support | |
| Argentina 0-800-555-5000 | |
| Australia 1300-551-664 | |
| Belgique (français) 02 620 00 85 | |
| Belgium (English) 02 620 00 86 | |
| Bolivia 800-100-193 | |
| Brasil 0-800-709-7751 | |
| Canada 800-HP-INVENT | |
| Caribbean 1-800-711-2884 | |
| Česká republikaik 296 335 612 | |
| Chile 800-360-999 | |
| China 中国 | 010-68002397 |
| Colombia | 01-8000-51-4746-8368 |
| Costa Rica 0-800-011-0524 | |
| Denmark 82 33 28 44 | |
| Deutschland | 069 9530 7103 |
| Ecuador 800-711-2884 | |
| El Salvador 800-6160 | |
| España 913753382 | |
| France 01 4993 9006 | |
| Greece Ελλάδα 210 969 6421 | |
| Guatemala 1-800-999-5105 | |
| Honduras 800-711-2884 | |
| Hong Kong 香港特別行政區 852 2833-1111 | |
| India www.hp.com/support/india | |
| Indonesia +65 6100 6682 | |
| Ireland 01 605 0356 | |
| Italia 02 754 19 782 | |
| Japan 日本 81-3-6666-9925 | |
| Korea 한국 www.hp.com/support/korea | |
| Magyarország www.hp.com/support | |
| Malaysia +65 6100 6682 | |
| México | 01-800-474-68368 |
| Middle East International | www.hp.com/support |
| Netherland | 020 654 5301 |
| New Zealand | 0800-551-664 |
| Nicaragua | 1-800-711-2884 |
| Norwegen | 23500027 |
| Österreich | 01 360 277 1203 |
| Panamá 001-800-711-2884 | |
| Paraguay | (009) 800-541-0006 |
| Perú 0-800-10111 | |
| Philippines +65 6100 6682 | |
| Polska www.hp.com/support | |
| Portugal 021 318 0093 | |
| Puerto Rico 1-877 232 0589 | |
| Russia Россия 495 228 3050 | |
| Schweiz (Deutsch) 01 439 5358 | |
| Singapore 6100 6682 | |
| South Africa 0800980410 | |
| South Korea 한국 2-561-2700 | |
| Suisse (français) 022 827 8780 | |
| Suomi 09 8171 0281 | |
| Sverige 08 5199 2065 | |
| Svizzera (italiano) 022 567 5308 | |
| Türkiye | www.hp.com/support |
| Taiwan 臺灣 | +852 28052563 |
| Thailand ไทย | +65 6100 6682 |
| United Kingdom | 0207 458 0161 |
| United States | 800-HP INVENT |
| Uruguay 0004-054-177 | |
| Venezuela | 0-800-474-68368 |
| Viêt Nam +65 6100 6682 | |
Product regulatory & environment information
Federal Communications Commission Notice
This equipment has been tested and found to comply with the limits for a Class B digital device, pursuant to Part 15 of the FCC Rules. These limits are designed to provide reasonable protection against harmful interference in a residential installation. This equipment generates, uses, and can radiate radio frequency energy and, if not installed and used in accordance with the instructions, may cause harmful interference to radio communications. However, there is no guarantee that interference will not occur in a particular installation. If this equipment does cause harmful interference to radio or television reception, which can be determined by turning the equipment off and on, the user is encouraged to try to correct the interference by one or more of the following measures:
- Reorient or relocate the receiving antenna.
- Increase the separation between the equipment and the receiver.
- Connect the equipment into an outlet on a circuit different from that to which the receiver is connected.
- Consult the dealer or an experienced radio or television technician for help.
Modifications
The FCC requires the user to be notified that any changes or modifications made to this device that are not expressly approved by Hewlett-Packard Company may void the user's authority to operate the equipment.
Cables
Connections to this device must be made with shielded cables with metallic RFI/EMI connector hoods to maintain compliance with FCC rules and regulations.
Declaration of Conformity for products Marked with FCC Logo, United States Only
This device complies with Part 15 of the FCC Rules. Operation is subject to the following two conditions: (1) this device may not cause harmful interference, and (2) this device must accept any interference received, including interference that may cause undesired operation.
If you have questions about the product that are not related to this declaration, write to
Hewlett-Packard Company
P.O. Box 692000, Mail Stop 530113
Houston, TX 77269-2000
For questions regarding this FCC declaration, write to
Hewlett-Packard Company
P.O. Box 692000, Mail Stop 510101
Houston, TX 77269-2000
or call HP at 281-514-3333
To identify your product, refer to the part, series, or model number located on the product.
Canadian Notice
This Class B digital apparatus meets all requirements of the Canadian Interference-Causing Equipment Regulations.
Avis Canadien
European Union Regulatory Notice
This product complies with the following EU Directives:
- Low Voltage Directive 2006/95/EC
• EMC Directive 2004/108/EC
Compliance with these directives implies conformity to applicable harmonized European standards (European Norms) which are listed on the EU Declaration of Conformity issued by Hewlett-Packard for this product or product family.
This compliance is indicated by the following conformity marking placed on the product:

This marking is valid for non-Telecom products and EU harmonized Telecom products (e.g. Bluetooth).

This marking is valid for EU non-harmonized Telecom products.
*Notified body number (used only if applicable - refer to the product label)
Hewlett-Packard GmbH, HQ-TRE, Herrenberger Srasse 140, 71034 Boeblingen, Germany
Japanese Notice
Perchlorate Material - special handling may apply
This calculator's Memory Backup battery may contain perchlorate and may require special handling when recycled or disposed in California.
Disposal of Waste Equipment by Users in Private Household in the European Union

This symbol on the product or on its packaging indicates that this product just not be disposed of with your other household waste. Instead, it is your responsibility to dispose of your waste equipment by handing it over to a designated collection point for the recycling of waste electrical and electronic equipment. The separate collection and recycling of your waste equipment at the time of disposal will help to conserve natural resources and ensure that it is recycled in a manner that protects human health and the environment. For more information about where you can drop off your waste equipment for recycling, please contact your local city office, your household waste disposal service or the shop where you purchased the product.
Chemical Substances
HP is committed to providing our customers with information about the chemical substances in our products as needed to comply with legal requirements such as REACH (Regulation EC No 1907/2006 of the European Parliament and the Council). A chemical information report for this product can be found at:
http://www.hp.com/go/reach
low battery symbol 17
replacing 45
D
Data
analyzing 20
capturing from events 23
data-tuple 7
exporting 19
history types 39
logging 29
selecting a set 17
DataStreamer flow 10
Direction keys
chan 14
functions 15
pan 14
scope 14
trace 14
zoom 14
Display filters 38
choosing a 37
E
Experiments
streaming 4
types of 3
Export
add 18
crop 18
edit 18
keys during 18
subtract 18
Export filters
additional 39
choosing a 38
F
Filtering
data 36
display 36
export 36
H
Helpful hints 8
K
Keys
shortcuts 42
M
Manual conventions 7
Menu 14, 18
advanced Plot Setup menu 35
Menu keys
add 17
Capture Events menu 27
during export 18
goto 17
mark 17
Numeric view 26
setup 17
| swap 17 | Stream window |
| Meter mode 25 | seeing exact time interval 35 |
| N | Streaming experiments |
| Numeric view | description 9 |
| the meter mode 25 | StreamSmart |
| O | Aplet 4 |
| Oscilloscope | specific views 6 |
| menu keys 40 | with virtual calculators 41 |
| trigger 40 | StreamSmart 400 |
| Oscilloscope mode 40 | connecting 9 |
| S | StreamSmart Aplet 4 |
| Sensor | specific views 6 |
| calibration 33 | standard views 5 |
| calibration of offset, slope 33 V | |
| manually choose sensors 31 | Virtual Graphing Calculator 41 |
| manually select sensor units | |
| 32 | |
| setup 31 | |
| Statistics | |
| views in the Statistics Aplet | |
| 21 | |
| Statistics Aplet 7 | |
| Stream 3 | |
| events-with-entry 3 | |
| export data from 18 | |
| keys after 14 | |
| keys during 14 | |
| log 3 | |
| select data for 17 | |
| select events 3 | |
| setting the window 35 | |
| Stream of data | |
| viewing 12 | |


- STREAMSMART 400 ACKNOWLEDGMENTS
- REVISION HISTORY
- DATE VERSION REVISION
- LEGAL NOTICES
- TABLE OF CONTENTS
- 1 HP MOBILE CALCULATING LABORATORY
- 2 STREAMING EXPERIMENTS
- 3 CAPTURING DATA FROM EVENTS
- 4 ADVANCED TOPICS
- 5 WARRANTY, REGULATORY, AND CONTACT INFORMATION
- TYPES OF EXPERIMENTS
- STREAMING EXPERIMENTS
- THE STREAMSMART APLET
- THE STATISTICS APLET
- MANUAL CONVENTIONS
- HELPFUL HINTS
- WHAT I CAN DO
- DISPLAY DESCRIPTION
- HOW I GOT THERE
- WHAT I SEE ON SCREEN
- VIEWING A STREAM OF DATA
- LOW BATTERY SYMBOL
- SELECT A SET OF DATA
- EXPORT A DATA SET
- ANALYZE EXPERIMENTAL DATA
- SYMBOLIC PLOT NUMERIC
- NUMERIC VIEW: THE METER MODE
- SET UP EXPERIMENT
- MONITOR AND SELECT EVENTS
- ANALYZE THE DATA
- DATA LOGGING
- SENSOR SETUP: MANUALLY IDENTIFY A SENSOR
- UNIT SETUP: MANUALLY SELECT UNITS FOR A SENSOR
- CALIBRATION
- THE PLOT SETUP MENU
- SETTING THE STREAM WINDOW
- PLOT DISPLAY OPTIONS
- FILTERING DATA FOR DISPLAY AND EXPORT
- DATA HISTORY
- OSCILLOSCOPE MODE
- STREAMSMART 400 AND THE VIRTUAL HP 39/40GS
- KEYBOARD SHORTCUTS
- MATHEMATICAL DETAILS: ZOOM, PAN, AND TRACE
- REPLACING THE BATTERY
- HP LIMITED HARDWARE WARRANTY AND CUSTOMER CARE
- LIMITED HARDWARE WARRANTY PERIOD
- GENERAL TERMS
- CUSTOMER CARE
- PRODUCT REGULATORY & ENVIRONMENT INFORMATION
- FEDERAL COMMUNICATIONS COMMISSION NOTICE
- MODIFICATIONS
- CABLES
- DECLARATION OF CONFORMITY FOR PRODUCTS MARKED WITH FCC LOGO, UNITED STATES ONLY
- CANADIAN NOTICE
- AVIS CANADIEN
- EUROPEAN UNION REGULATORY NOTICE
- JAPANESE NOTICE
- PERCHLORATE MATERIAL - SPECIAL HANDLING MAY APPLY
- DISPOSAL OF WASTE EQUIPMENT BY USERS IN PRIVATE HOUSEHOLD IN THE EUROPEAN UNION
- CHEMICAL SUBSTANCES
- D
- E
- F
- H
- K
- M
Brand : HP
Model : StreamSmart 400
Category : Calculator