
ProSecure STM300 Bundle - Firewall NETGEAR - Free user manual and instructions
Find the device manual for free ProSecure STM300 Bundle NETGEAR in PDF.


| Product Type | Unified Threat Management (UTM) Appliance |
| Brand | Netgear |
| Model | ProSecure STM300 Bundle |
| Dimensions (W x D x H) | 17.5 x 13 x 1.75 inches (44.5 x 33.0 x 4.4 cm) |
| Weight | Approximately 14 lbs (6.4 kg) |
| Power Supply | AC 100-240V, 50-60Hz, 2.5A |
| Ethernet Ports | 8x Gigabit LAN, 2x Gigabit WAN (RJ-45) |
| Console Port | 1x RS232 (RJ-45) |
| Firewall Throughput | Up to 800 Mbps |
| VPN Throughput | Up to 200 Mbps (IPsec) |
| Concurrent Sessions | Up to 500,000 |
| Security Features | Stateful firewall, intrusion prevention, anti-virus, anti-spam, content filtering, DoS protection |
| VPN Support | IPsec, SSL VPN, PPTP, L2TP |
| Management | Web GUI (HTTPS), CLI (SSH/Console), SNMP |
| Logging & Reporting | Syslog, email alerts, local log storage |
| Operating Temperature | 0°C to 40°C (32°F to 104°F) |
| Storage Temperature | -20°C to 70°C (-4°F to 158°F) |
| Humidity | 10% to 90% non-condensing |
| Certifications | FCC, CE, UL, RoHS |
| Included Accessories | Power cord, Ethernet cable, console cable, rack mount kit, quick start guide |
| Spare Parts & Repairability | Spare power supply, fans; field-replaceable units; professional repair recommended |
| Maintenance & Cleaning | Clean exterior with dry cloth; ensure ventilation is not obstructed; avoid liquids |
Frequently Asked Questions - ProSecure STM300 Bundle NETGEAR
User questions about ProSecure STM300 Bundle NETGEAR
0 question about this device. Answer the ones you know or ask your own.
Ask a new question about this device
Download the instructions for your Firewall in PDF format for free! Find your manual ProSecure STM300 Bundle - NETGEAR and take your electronic device back in hand. On this page are published all the documents necessary for the use of your device. ProSecure STM300 Bundle by NETGEAR.
USER MANUAL ProSecure STM300 Bundle NETGEAR
ProSecure Web/Email Security Threat Management Appliance STM150, STM300, or STM600
Reference Manual


350 East Plumeria Drive San Jose, CA 95134 USA
January 2011 202-10519-06 1.0
© 2009–2011 NETGEAR, Inc. All rights reserved.
No part of this publication may be reproduced, transmitted, transcribed, stored in a retrieval system, or translated into any language in any form or by any means without the written permission of NETGEAR, Inc.
Technical Support
Thank you for choosing NETGEAR. To register your product, get the latest product updates, or get support online, visit us at http://support.netgear.com.
Phone (US & Canada only): 1-888-NETGEAR
Phone (Other Countries): See Support information card.
Product Updates
Product updates are available on the NETGEAR website at http://prosecure.netgear.com or http://kb.netgear.com/app/home.
ProSecure Forum
Go to http://prosecure.netgear.com/community/forum.php for information about the ProSecure forum and to become part of the ProSecure community.
Trademarks
NETGEAR, the NETGEAR logo, ReadyNAS, ProSafe, ProSecure, Smart Wizard, Auto Uplink, X-RAID2, and NeoTV are trademarks or registered trademarks of NETGEAR, Inc. Microsoft, Windows, Windows NT, and Vista are registered trademarks of Microsoft Corporation. Other brand and product names are registered trademarks or trademarks of their respective holders.
Statement of Conditions
To improve internal design, operational function, and/or reliability, NETGEAR reserves the right to make changes to the products described in this document without notice. NETGEAR does not assume any liability that may occur due to the use, or application of, the product(s) or circuit layout(s) described herein.
Revision History
| Manual Part Number | Manual Version Number | Publication Date | Description |
| 202-10519-06 1.0 February | February 2011 | Made the following changes:Upgraded the book to the new format.Entirely revised Chapter 6, Monitoring System Access and Performance, to document the new Logs, Reports, and Alerts configuration menus that replaced the old Logs & Report configuration menu.Added Appendix A, Report Templates.Separated the traffic logs into email traffic logs and Web traffic logs (see Configuring and Activating System, Email, and Syslog Logs and Querying Logs).Under the Monitoring main navigation menu, replaced all screen shots that showed the old Logs & Reports configuration menu with screen shots that show the new Alerts, Logs, and Reports configuration menus. | |
| 202-10519-06(continued) | 1.0 February 2011(continued) | (continued)• Revised the Setup Wizard update settings information (see Setup Wizard Step 7 of 11: Update Settings), software update information (see Updating the Software), and system status information (see Viewing System Status). | |
| 202-10519-05 | 1.0 July 2010 Added the following major new features:• Network refresh and permanent MAC address bindings (see Configuring the Network Refresh and Permanent MAC Address Bindings)• Setting exceptions for custom groups and custom categories, and setting exceptions for file extensions and protocols (see Setting Scanning Exclusions and Web Access Exceptions)• Creating custom groups (see Creating Custom Groups for Web Access Exceptions)• Creating custom categories—see Creating Custom Categories for Web Access Exceptions)• Using the DC Agent (see Understanding the ProSecure DC Agent, Requirements for the ProSecure DC Agent Software and DC Agent Server, and Downloading ProSecure DC Agent Software, and Creating and Deleting DC Agents)Also added the following minor features:• Requirement to accept terms of service agreement on the Real-Time Blacklist screen• Capability to set the public host, IP address, and port on the Distributed Spam Analysis screen• Capability to replace the content of a blocked page with custom text• Capability to enable and disable SSLv2• Refinements in the active users search methods.• Domain information in the output screens that are accessible from the Monitoring menu• Testing a URL as part of the diagnostics tools | ||
| 202-10519-01 | 1.1 October 2009 Index update. | ||
| 202-10519-01 | 1.0 September 2009 Initial publication of this reference manual. | ||
Contents
Chapter 1 Introduction
What Is the ProSecure Web/Email Security Threat Management Appliance
STM150, STM300, or STM600?......8
What Can You Do with an STM? 9
Key Features and Capabilities 9
Stream Scanning for Content Filtering ....10
Autosensing Ethernet Connections with Auto Uplink .....11
Easy Installation and Management ....11
Maintenance and Support 12
STM Model Comparison....12
Service Registration Card with License Keys. 12
Package Contents 13
Hardware Features....14
Front Panel Ports and LEDs....14
Rear Panel Features 20
Bottom Panel with Product Label 22
Choosing a Location for the STM. 23
Using the Rack-Mounting Kit .....24
Chapter 2 Using the Setup Wizard to Provision the STM in Your Network
Choosing a Deployment Scenario .....25
Gateway Deployment....25
Server Group . . . . . . . . . . . . . . . . . . . . . . . . . . . . . . . . . . . . . . . . . . . . . . . . . . . . . . . . . . . 26
Segmented LAN Deployment. 27
Understanding the Steps for Initial Connection .....27
Qualified Web Browsers....28
Logging In to the STM 28
Understanding the Web Management Interface Menu Layout.....30
Using the Setup Wizard to Perform the Initial Configuration .....32
Setup Wizard Step 1 of 10: Introduction.....33
Setup Wizard Step 2 of 11: Networking Settings .....33
Setup Wizard Step 3 of 11: Time Zone .....35
Setup Wizard Step 4 of 11: Email Security....37
Setup Wizard Step 5 of 11: Web Security . . . . . . . . . . . . . . . . . . . . . . . . . . . . . . . . . . . . . . . . . . . . . . . . . . . . . . . . . 39
Setup Wizard Step 6 of 11: Email Notification Server Settings .....42
Setup Wizard Step 7 of 11: Update Settings .....43
Setup Wizard Step 8 of 11: HTTP Proxy Settings .....45
Setup Wizard Step 9 of 11: Web Categories .....46
Setup Wizard Step 10 of 11: Configuration Summary .....48
Setup Wizard Step 11 of 11: Restarting the System .....49
Verifying Correct Installation....49
Testing Connectivity 49
Testing HTTP Scanning .....49
Registering the STM with NETGEAR....50
What to Do Next ....51
Chapter 3 Performing Network and System Management
Configuring Network Settings.....52
Configuring Session Limits and Timeouts ....56
Configuring the Network Refresh and
Permanent MAC Address Bindings .....57
Managing Permanent MAC Address Bindings .....59
Configuring the HTTP Proxy Settings.....60
About Users with Administrative and Guest Privileges. . . . . . . . . . . . . . . . . . . . . . . . . . . . . . . . . . . . . . . . . . . . . . . . . . . . . . . 61
Changing Administrative Passwords and Timeouts .....62
Configuring Remote Management Access....64
Using an SNMP Manager....65
Supported MIB Browsers 67
Managing the Configuration File. 67
Backing Up Settings 68
Restoring Settings 69
Reverting to Factory Default Settings....70
Updating the Software....71
Scheduling Updates....71
Performing a Manual Update 73
Critical Updates That Require a Restart....74
Configuring Date and Time Service 74
Managing Digital Certificates....76
Managing the Certificate for HTTPS Scans .....78
Managing Trusted Certificates....79
Managing Untrusted Certificates 80
Managing the Quarantine Settings....81
Managing the STM's Performance....82
Chapter 4 Content Filtering and Optimizing Scans
About Content Filtering and Scans....84
Default Email and Web Scan Settings .....85
Configuring Email Protection ....87
Customizing Email Protocol Scan Settings.....87
Customizing Email Anti-Virus Settings .88
Email Content Filtering 94
Protecting Against Email Spam 97
Configuring Web and Services Protection ....105
Customizing Web Protocol Scan Settings .....105
Configuring Web Malware Scans 107
Configuring Web Content Filtering .....109
Configuring Web URL Filtering....116
HTTPS Scan Settings....119
Specifying Trusted Hosts 124
Configuring FTP Scans 125
Configuring Application Control 127
Setting Scanning Exclusions and Web Access Exceptions .....130
Setting Scanning Exclusions 130
Setting Access Exception Rules for Web Access....132
Creating Custom Groups for Web Access Exceptions....139
Creating Custom Categories for Web Access Exceptions .....142
Chapter 5 Managing Users, Groups, and Authentication
About Users, Groups, and Domains....147
Configuring Groups 148
Creating and Deleting Groups by Name. 149
Editing Groups by Name 150
Creating and Deleting Groups by IP Address and Subnet .....151
Configuring User Accounts....152
Creating and Deleting User Accounts 153
Editing User Accounts 154
Configuring Authentication 154
Understanding the STM's Authentication Options .....155
Understanding Active Directories and LDAP Configurations .....157
Creating and Deleting LDAP and Active Directory Domains .....161
Editing LDAP and Active Directory Domains .....164
Understanding the ProSecure DC Agent .....164
Requirements for the ProSecure DC Agent Software and
DC Agent Server 165
Downloading ProSecure DC Agent Software, and Creating
and Deleting DC Agents....165
Creating and Deleting RADIUS Domains. 167
Editing RADIUS Domains and Configuring VLANs .....169
Global User Settings 170
Viewing and Logging Out Active Users 172
Chapter 6 Monitoring System Access and Performance
Configuring Logging, Alerts, and Event Notifications .....175
Configuring the Email Notification Server....176
Configuring and Activating System, Email, and Syslog Logs.....177
Configuring Alerts....182
Monitoring Real-Time Traffic, Security, Statistics, and Web Usage. . . . 184
Understanding the Information on the Dashboard Screen . . . . . . . . . 184
Monitoring Web Usage....190
Viewing System Status....192
Querying Logs 194
Example: Using Logs to Identify Infected Clients .....199
Log Management....199
Viewing, Scheduling, and Generating Reports....200
Report Templates ....200
Generating Reports for Downloading .....202
Scheduling Automatic Generation and Emailing of Reports. . . . . . . . 203
Advanced Report Filtering Options....204
Viewing and Managing the Quarantine Files .....208
Using Diagnostics Utilities .....215
Using the Network Diagnostic Tools. 216
Using the Realtime Traffic Diagnostics Tool....217
Gathering Important Log Information and
Generating a Network Statistics Report .....218
Restarting and Shutting Down the STM 219
Chapter 7 Troubleshooting and Using Online Support
Basic Functioning .....223
Power LED Not On....223
Test LED or Status LED Never Turns Off. 223
LAN or WAN Port LEDs Not On 224
Troubleshooting the Web Management Interface .....224
When You Enter a URL or IP Address a Time-Out Error Occurs. . . . . . .225
Troubleshooting a TCP/IP Network Using a Ping Utility.....225
Testing the LAN Path to Your STM 226
Testing the Path from Your PC to a Remote Device .....226
Restoring the Default Configuration and Password .....227
Problems with Date and Time .....228
Using Online Support 228
Enabling Remote Troubleshooting .....228
Installing Hot Fixes 229
Sending Suspicious Files to NETGEAR for Analysis .....230
Accessing the Knowledge Base and Documentation .....231
Appendix A Report Templates
Appendix B Default Settings and Technical Specifications
Appendix C Related Documents
Appendix D Notification of Compliance
Index
This chapter provides an overview of the features and capabilities of the ProSecure Web/Email Security Threat Management Appliance STM150, STM300, and STM600. It also identifies the physical features of the appliances and the contents of the product packages.
This chapter contains the following sections:
• What Is the ProSecure Web/Email Security Threat Management Appliance STM150, STM300, or STM600? on this page
• What Can You Do with an STM? on page 9
• Key Features and Capabilities on page 9
• Service Registration Card with License Keys on page 12
• Package Contents on page 13
• Hardware Features on page 14
• Choosing a Location for the STM on page 23
What Is the ProSecure Web/Email Security Threat Management Appliance STM150, STM300, or STM600?
The ProSecure Web/Email Security Threat Management Appliance STM150, STM300, or STM600, hereafter referred to as the STM, is an appliance-based, Web and email security solution that protects the network perimeter against Web-borne threats from spyware, viruses, email, and blended threats. Ideally deployed at the gateway, it serves as the network's first line of defense against all types of threats, and complements firewalls, intrusion detection systems (IDS)/intrusion prevention systems (IPS), dedicated Intranet security products, and endpoint antivirus and antispyware software.
Powered by patent-pending Stream Scanning technology and backed by one of the most comprehensive malware databases in the industry, the STM can detect and stop all known spyware and viruses at the gateway, preventing them from reaching your desktops and servers, where cleanup would be much more difficult.
In addition to scanning HTTP, HTTPS, FTP, SMTP, POP3, and IMAP traffic, the STM protects networks against spam phishing attacks and unwanted Web use. The STM is a plug-and-play device that can be installed and configured within minutes.
What Can You Do with an STM?
The STM combines robust protection against malware threats with ease of use and advanced reporting and notification features to help you deploy and manage the device with minimal effort.
Here are some of the things that you can do with the STM:
- Protect the network instantly. The STM is a plug-and-play security solution that can be instantly added to networks without the need for network reconfiguration.
- Scan network traffic for malware. Using the Stream Scanning technology, you can configure the STM to scan HTTP, HTTPS, FTP, SMTP, POP3, and IMAP protocols. Unlike traditional batch-based scan engines that need to cache the entire file before they can scan, this scan engine checks traffic as it enters the network, ensuring unimpeded network performance.
- Set access policies for individual users or groups. You can configure Web and email access policies for individual users and groups based on the STM's local database, on a group IP address, on a Lightweight Directory Access Protocol (LDAP) domain, group, or user, or on a RADIUS VLAN.
- Receive real-time alerts and generate comprehensive reports. You can configure the STM to send alerts when a malware attack or outbreak is detected on the network. Real-time alerts can be sent by email, allowing you to monitor malware events wherever you are.
By configuring the STM to send malware alerts, you can isolate and clean the infected computer before the malware incident can develop into a full-blown outbreak. The STM also provides comprehensive reports that you can use to analyze network and malware trends.
- Manage through SNMP support. You can enable and configure the STM's Simple Network Management Protocol (SNMP) settings to receive SNMP traps through a supported management information base (MIB) browser.
- Allow automated component updates. Downloading components regularly is the key to ensuring updated protection against new threats. The STM makes this administrative task easier by supporting automatic malware pattern, program, and engine updates.
Key Features and Capabilities
The STM provides the following key features and capabilities:
- Up to two pairs of 10/100/1000 Mbps Gigabit Ethernet WAN ports (see STM Model Comparison on page 12).
• Scalable support (see STM Model Comparison on page 12) for:
- Up to 600 concurrent users
- Up to 6000 concurrently scanned HTTP sessions
- Up to 239 MB/s HTTP throughput
- Up to 960,000 emails per hour SMTP throughput
• Stream Scanning technology that enables scanning of real-time protocols such as HTTP.
- Comprehensive Web and email inbound and outbound security, covering six major network protocols: HTTP, HTTPS, FTP, SMTP, POP3, and IMAP.
• URL content filtering with 64 categories.
- Malware database containing hundreds of thousands of signatures of spyware, viruses, and other malware threats.
- Very frequently updated malware signatures, hourly if required. The STM can automatically check for new malware signatures as frequently as every 15 minutes.
• Multiple antispam technologies to provide extensive protection against unwanted emails.
- Spam and malware quarantine for easy analysis.
- Web application control, including access control for instant messaging, media applications, peer-to-peer applications, and Web-based tools and toolbars.
- User management with LDAP, Active Directory, and RADIUS integration, allowing you to configure access policies per user and per group.
- Easy, Web-based wizard setup for installation and management.
• SNMP-manageable.
• Dedicated management interface. (This feature is model dependent; see STM Model Comparison on page 12.)
- Hardware bypass port to prevent network disruption in case of failure. (This feature is model dependent; see STM Model Comparison on page 12.)
- Front panel LEDs for easy monitoring of status and activity.
• Internal universal switching power supply.
Stream Scanning for Content Filtering
Stream Scanning is based on the simple observation that network traffic travels in streams. The STM scan engine starts receiving and analyzing traffic as the stream enters the network. As soon as a number of bytes are available, scanning starts. The scan engine continues to scan more bytes as they become available, while at the same time another thread starts to deliver the bytes that have been scanned.
This multithreaded approach, in which the receiving, scanning, and delivering processes occur concurrently, ensures that network performance remains unimpeded. The result is file scanning that is up to five times faster than with traditional antivirus solutions—a performance advantage that you will notice.
Stream Scanning also enables organizations to withstand massive spikes in traffic, as in the event of a malware outbreak. The scan engine has the following capabilities:
• Real-time protection. The Stream Scanning technology enables scanning of previously undefended real-time protocols, such as HTTP. Network activities susceptible to latency (for example, Web browsing) are no longer brought to a standstill.
- Comprehensive protection. Provides both Web and email security, covering six major network protocols: HTTP, HTTPS, FTP, SMTP, POP3, and IMAP. The STM uses enterprise-class scan engines employing both signature-based and distributed spam analysis to stop both known and unknown threats. The malware database contains hundreds of thousands of signatures of spyware, viruses, and other malware.
- Objectionable traffic protection. The STM prevents objectionable content from reaching your computers. You can control access to the Internet content by screening for Web categories, Web addresses, and Web services. You can log and report attempts to access objectionable Internet sites.
- Automatic signature updates. Malware signatures are updated as frequently as every hour, and the STM can check automatically for new signatures as frequently as every 15 minutes.
Autosensing Ethernet Connections with Auto Uplink
With its internal 10/100/1000 ports, the STM can connect to either a 10 Mbps standard Ethernet network, a 100 Mbps Fast Ethernet network, or a 1000 Mbps Gigabit Ethernet network. The interfaces are autosensing and capable of full-duplex or half-duplex operation.
The STM incorporates Auto Uplink™ technology. Each Ethernet port automatically senses whether the Ethernet cable plugged into the port should have a “normal” connection such as to a PC or an “uplink” connection such as to a switch or hub. That port then configures itself correctly. This feature eliminates the need to think about crossover cables, as Auto Uplink accommodates either type of cable to make the right connection.
Easy Installation and Management
You can install, configure, and operate the STM within minutes after connecting it to the network. The following features simplify installation and management tasks:
- Browser-based management. Browser-based configuration allows you to easily configure the STM from almost any type of operating system, such as Windows, Macintosh, or Linux. A user-friendly Setup Wizard is provided, and online help documentation is built into the browser-based Web Management Interface.
- SNMP. The STM supports SNMP to let you monitor and manage log resources from an SNMP-compliant system manager. The SNMP system configuration lets you change the system variables for MIB2.
- Diagnostic functions. The STM incorporates built-in diagnostic functions such as a ping utility, traceroute utility, DNS lookup utility, and remote restart.
- Remote management. The STM allows you to log in to the Web Management Interface from a remote location on the Internet. For security, you can limit remote management access to a specified remote IP address or range of addresses.
- Visual monitoring. The STM's front panel LEDs provide an easy way to monitor its status and activity.
Maintenance and Support
NETGEAR offers technical support seven days a week, 24 hours a day. Information about support is available on the NETGEAR ProSecure website at http://prosecure.netgear.com/support/index.php.
STM Model Comparison
The following table compares the three STM models to show the differences:
Table 1. Differences between the STM Models
| Feature STM150 STM300 STM600 | |||
| Performance and Sizing Guidelines | |||
| Concurrent users Up to 150 Up to 300 Up to 600 | |||
| Web scan throughput 42 Mbps 136 Mbps 307 Mbps | |||
| Concurrent scanned HTTP connections 1500 | 3000 6000 | ||
| SMTP throughput (emails per hour) 122,000 | 355,000 550,000 | ||
| Hardware | |||
| Gigabit RJ-45 ports | Total of 5 ports:• 1 uplink• 4 downlink | Total of 3 ports:• 1 pair of ports(1 uplink and 1 downlink)• 1 management | Total of 5 ports:• 2 pairs of portsa (2 uplink and 2 downlink)• 1 management |
| Gigabit RJ45 port pairs with failure bypass | 0 | 1 pair of ports | 2 pairs of ports |
| Dedicated management VLAN RJ45 ports | 0 | 1 | 1 |
a. The STM600 provides two pairs of ports, allowing for support of two separate networks or subnets with strict traffic separation.
Service Registration Card with License Keys
Be sure to store the license key card that came with your STM in a secure location. You do need these keys to activate your product during the initial setup.

Figure 1.
Note: If you reset the STM to the original factory default settings after you have entered the license keys to activate the STM (see Registering the STM with NETGEAR on page 50), the license keys are erased. The license keys and the different types of licenses that are available for the STM are no longer displayed on the Registration screen. However, after you have reconfigured the STM to connect to the Internet and to the NETGEAR registration server, the STM retrieves and restores all registration information based on its MAC address and hardware serial number. You do not need to reenter the license keys and reactivate the STM.
Package Contents
The STM product package contains the following items:
• ProSecure Web/Email Security Threat Management Appliance STM150, STM300, or STM600
• One AC power cable
• Rubber feet (4) with adhesive backing
• One rack-mount kit
• Straight-through Category 5 Ethernet cable
- ProSecure™ Web/Email Security Threat Management Appliance STM150, STM300, or STM600 Installation Guide
- Depending on the model purchased, service registration card with one or more license keys
If any of the parts are incorrect, missing, or damaged, contact your NETGEAR dealer. Keep the carton, including the original packing materials, in case you need to return the product for repair.
Hardware Features
The front panel ports and LEDs, rear panel ports, and bottom label of the STM models are described in this section.
Front Panel Ports and LEDs
The front panels of the three STM models provide different components.
STM150 Front Panel
The following figure shows the front panel ports and status light-emitting diodes (LEDs) of the STM150:

Figure 2.
From left to right, the STM150's front panel shows the following ports and LEDs:
- Power LED.
- Test LED.
- One nonfunctioning USB port. This port is included for future management enhancements. The port is currently not operable on any STM model.
- One uplink (WAN) Gigabit Ethernet port with an RJ-45 connector, left LED, and right LED.
- Four downlink (LAN) Gigabit Ethernet ports with RJ-45 connectors, left LEDs, and right LEDs.
Note: All Gigabit Ethernet ports provide switched N-way, automatic speed-negotiating, auto MDI/MDIX technology.
The function of each STM150 LED is described in the following table:
Table 2. LED Descriptions for the STM150
| Object Activity Description | ||
| Power On (green) Power is supplied to the STM. | ||
| Test On (amber) during startup | The STM is initializing. After approximately 2 minutes, when the STM has completed its initialization, the Test LED turns off. If the Test LED remains on, the initialization has failed. | |
| Completed its initialization successfully. The Test LED should be off during normal operation. | ||
| Blinking (amber) The STM is shutting down. | ||
| One of the three licenses has expired. To stop the Test LED from blinking, renew the license, or click the Stop LED Blinking button on the System Status screen (see Viewing System Status on page 192). | ||
| Uplink (WAN) Port | ||
| Left LED Off | The WAN port has no physical link, that is, no Ethernet cable is plugged into the STM. | |
| On (green) The WAN port has a valid connection with a device that provides an Internet connection. | ||
| Blink (green) Data is being transmitted or received by the WAN port. | ||
| Right LED Off | The WAN port is operating at 10 Mbps. | |
| On (amber) The WAN port is operating at 100 Mbps. | ||
| On (green) The WAN port is operating at 1000 Mbps. | ||
| Downlink (LAN) Ports | ||
| Left LED Off | The LAN port has no link. | |
| On (green) The LAN port has detected a link with a connected Ethernet device. | ||
| Blink (green) Data is being transmitted or received by the LAN port. | ||
| Right LED Off | The LAN port is operating at 10 Mbps. | |
| On (amber) The LAN port is operating at 100 Mbps. | ||
| On (green) The LAN port is operating at 1000 Mbps. | ||
Front Panel STM300
The following figure shows the front panel ports and LEDs of the STM300:

Figure 3.
From left to right, the STM300's front panel shows the following ports and LEDs:
- Console port. Port for connecting to an optional console terminal. The port has a DB9 male connector. The default baud rate is 9600 K. The pinouts are (2) Tx, (3) Rx, (5) and (7) Gnd.
- Power LED.
- Status LED.
- Hard drive (HDD) LED.
- One nonfunctioning USB port. This port is included for future management enhancements. The port is currently not operable on any STM model.
- Dedicated management (Mgmt) Gigabit Ethernet port with an RJ-45 connector.
- One uplink (WAN) Gigabit Ethernet port with an RJ-45 connector, left LED, and right LED.
- One downlink (LAN) Gigabit Ethernet port with RJ-45 connectors, left LED, and right LED.
The function of each STM300 LED is described in the following table:
Table 3. LED Descriptions for the STM300
| Object Activity Description | ||
| Power On (green) Power is supplied to the STM. | ||
| Off Power is not supplied to the STM. | ||
| Status On (amber) during startup | The STM is initializing. After approximately 2 minutes, when the STM has completed its initialization, the Status LED turns off. If the Status LED remains on, the initialization has failed. | |
| Off The system has completed its initialization successfully. The Status LED should be off during normal operation. | ||
| Blinking (amber) The STM is shutting down. | ||
| HDD On (Green) Information is being written to the hard drive. | ||
| Off No hard drive activity. | ||
| Uplink (WAN) Port | ||
| Left LED Off | The WAN port has no physical link, that is, no Ethernet cable is plugged into the STM. | |
| On (green) The WAN port has a valid connection with a device that provides an Internet connection. | ||
| Blink (green) Data is being transmitted or received by the WAN port. | ||
| Right LED Off | The WAN port is operating at 10 Mbps. | |
| On (green) The WAN port is operating at 100 Mbps. | ||
| On (amber) The WAN port is operating at 1000 Mbps. | ||
| Downlink (LAN) Ports | ||
| Left LED Off | The LAN port has no link. | |
| On (green) The LAN port has detected a link with a connected Ethernet device. | ||
| Blink (green) Data is being transmitted or received by the LAN port. | ||
| Right LED Off | The LAN port is operating at 10 Mbps. | |
| On (green) The LAN port is operating at 100 Mbps. | ||
| On (amber) The LAN port is operating at 1000 Mbps. | ||
Front Panel STM600
The following figure shows the front panel ports and LEDs of the STM600:

Figure 4.
From left to right, the STM600's front panel shows the following ports and LEDs:
- Console port. Port for connecting to an optional console terminal. The ports has a DB9 male connector. The default baud rate is 9600 K. The pinouts are (2) Tx, (3) Rx, (5) and (7) Gnd.
- Power LED.
- Status LED.
- Hard drive (HDD) LED.
- One nonfunctioning USB port. This port is included for future management enhancements. The port is currently not operable on any STM model.
- Dedicated management (Mgmt) Gigabit Ethernet port with an RJ-45 connector.
- Pair 1 uplink (WAN) and downlink (LAN) Gigabit Ethernet ports with RJ-45 connectors, left LEDs, and right LEDs.
- Pair 2 uplink (WAN) and downlink (LAN) Gigabit Ethernet ports with RJ-45 connectors, left LEDs, and right LEDs.
Note: All Gigabit Ethernet ports provide switched N-way, automatic speed-negotiating, auto MDI/MDIX technology.
The function of each STM600 LED is described in the following table:
Table 4. LED Descriptions for the STM600
| Object Activity Description | ||
| Power On (green) Power is supplied to the STM. | ||
| Off Power is not supplied to the STM. | ||
| Status On (amber) during startup | The STM is initializing. After approximately 2 minutes, when the STM has completed its initialization, the Status LED turns off. If the Status LED remains on, the initialization has failed. | |
| Off The system has completed its initialization successfully. The Status LED should be off during normal operation. | ||
| Blinking (amber) The STM is shutting down. | ||
| HDD On (green) Information is being written to the hard drive. | ||
| Off No hard drive activity. | ||
| Uplink (WAN) Port | ||
| Left LED Off | The WAN port has no physical link, that is, no Ethernet cable is plugged into the STM. | |
| On (green) The WAN port has a valid connection with a device that provides an Internet connection. | ||
| Blink (green) Data is being transmitted or received by the WAN port. | ||
| Right LED Off | The WAN port is operating at 10 Mbps. | |
| On (green) The WAN port is operating at 100 Mbps. | ||
| On (amber) The WAN port is operating at 1000 Mbps. | ||
| Downlink (LAN) Ports | ||
| Left LED Off | The LAN port has no link. | |
| On (green) The LAN port has detected a link with a connected Ethernet device. | ||
| Blink (green) Data is being transmitted or received by the LAN port. | ||
| Right LED Off | The LAN port is operating at 10 Mbps. | |
| On (green) The LAN port is operating at 100 Mbps. | ||
| On (amber) The LAN port is operating at 1000 Mbps. | ||
Rear Panel Features
The rear panel of the STM150 differs from the rear panels of the STM300 and STM600.
Rear Panel STM150
The following figure shows the rear panel components of the STM150:

Figure 5.
From left to right, the STM150's rear panel components are:
- Console port. Port for connecting to an optional console terminal. The port has a DB9 male connector. The default baud rate is 9600 K. The pinouts are (2) Tx, (3) Rx, (5) and (7) Gnd.
- Kensington lock. Attach an optional Kensington lock to prevent unauthorized removal of the STM150.
- Power button. Press to restart the STM150. Restarting does not reset the STM150 to its factory defaults.
- Reset button. Using a sharp object, press and hold this button for about 10 seconds until the front panel Test LED flashes and the STM150 returns to factory default settings.
Note: If you reset the STM150, all configuration settings are lost and the default passwords are restored.
- AC power socket. Attach the power cord to this socket.
Rear Panel STM300 and STM600
The rear panels of the STM300 and STM600 are identical.
The following figure shows the rear panel components of the STM300 and STM600:

Figure 6.
From left to right, the STM300's and STM600's rear panel components (excluding the four fan air outlets) are:
- Power switch. Switch to turn the STM300 or STM600 on or off. Restarting does not reset the STM300 or STM600 to its factory defaults.
Note: The STM300 and STM600 do not provide a Reset button. For information about how to reset the STM300 or STM600 to factory default settings using the Web Management Interface, see Reverting to Factory Default Settings on page 70.
- AC power socket. Attach the power cord to this socket.
Bottom Panel with Product Label
The product label on the bottom of the STM's enclosure displays the STM's default IP address, default user name, and default password, as well as regulatory compliance, input power, and other information.
STM150 Product Label

Figure 7.
STM300 Product Label

Figure 8.
STM600 Product Label

Figure 9.
Choosing a Location for the STM
The STM is suitable for use in an office environment where it can be freestanding (on its runner feet) or mounted into a standard 19-inch equipment rack. Alternatively, you can rack-mount the STM in a wiring closet or equipment room. A mounting kit, containing two mounting brackets and four screws, is provided in the STM package.
Consider the following when deciding where to position the STM:
• The unit is accessible and cables can be connected easily.
- Cabling is away from sources of electrical noise. These include lift shafts, microwave ovens, and air-conditioning units.
• Water or moisture cannot enter the case of the unit.
- Airflow around the unit and through the vents in the side of the case is not restricted. Provide a minimum of 25 mm or 1 inch clearance.
• The air is as free of dust as possible.
- Temperature operating limits are not likely to be exceeded. Install the unit in a clean, air-conditioned environment. For information about the recommended operating temperatures for the STM, see Appendix B, Default Settings and Technical Specifications.
Using the Rack-Mounting Kit
Use the mounting kit for the STM to install the appliance in a rack. (A mounting kit is provided in the product package for the STM.) The mounting brackets that are supplied with the STM are usually installed before the unit is shipped out. If the brackets are not yet installed, attach them using the supplied hardware.

Figure 10.
Before mounting the STM in a rack, verify that:
• You have the correct screws (supplied with the installation kit).
• The rack onto which you will mount the STM is suitably located.
Using the Setup Wizard to Provision the STM in Your Network
2
This chapter describes provisioning the STM in your network. This chapter contains the following sections:
• Choosing a Deployment Scenario on this page
• Understanding the Steps for Initial Connection on page 27
• Logging In to the STM on page 28
• Using the Setup Wizard to Perform the Initial Configuration on page 32
• Verifying Correct Installation on page 49
• Registering the STM with NETGEAR on page 50
• What to Do Next on page 51
Choosing a Deployment Scenario
The STM is an inline transparent bridge appliance that can easily be deployed to any point on the network without the need for network reconfiguration or additional hardware.
The following are the most common deployment scenarios for the STM. Depending on your network environment and the areas that you want to protect, you can choose one or a combination of the deployment scenarios that are described in the following sections:
• Gateway Deployment on this page
• Server Group on page 26
• Segmented LAN Deployment on page 27
Gateway Deployment
In a typical gateway deployment scenario, a single STM appliance is installed at the gateway—between the firewall and the LAN core switch—to protect the network against all malware threats entering and leaving the gateway. Installing the STM behind the firewall protects it from denial of service (DoS) attacks.
The following figure shows a typical gateway deployment scenario:
![graph TD A["Internet"] --> B["Firewall"] B --> C["Web/Email Threat Manager"] C --> D["Core Switch"] D --> E1["Switch"] D --> E2["Switch"] D --> E3["Switch"] E1 --> F1["Desktops"] E2 --> F2["Desktops"] E3 --> F3["Desktops"] E1 --> F4["Desktops"] E2 --> F5["Desktops"] E3 --> F6["Desktops"] E1 --> G1["…](/content/2026/05/1028692/images/b29b3609c851998a8e40568bb0130dfb740ece890aeffa59291ea3f5796e99cc.jpg)
Figure 11.
Server Group
In a server group deployment, one STM appliance is installed at the gateway and another in front of the server group to help protect the email server from threats from internal as well as external clients. This type of deployment splits the network load and provides the email server with dedicated protection against malware threats, including email-borne viruses and spam. The following figure shows a typical server group deployment scenario:
![graph TD A["Internet"] --> B["Firewall"] B --> C["Web/Email Threat Manager"] C --> D["Core Switch"] D --> E["Switch"] D --> F["Switch"] D --> G["Switch"] E --> H["Desktops"] F --> I["Desktops"] G --> J["Desktops"] H --> K["Mail Server"] I --> K J --> K](/content/2026/05/1028692/images/8ecf823677748f7b5451ac9732d485733c0aa577c331b55c30ac8b536f8ff850.jpg)
Figure 12.
Segmented LAN Deployment
In a segmented LAN deployment, one STM appliance is installed in front of each network segment. VLAN traffic can pass through the STM and can be scanned by the STM. This type of deployment splits the network load and protects network segments from malware threats coming in through the gateway or originating from other segments. The following figure shows a typical segmented LAN deployment scenario:
![graph TD A["Internet"] --> B["Firewall"] B --> C["Core Switch"] C --> D["Switch"] C --> E["Switch"] C --> F["Switch"] D --> G["Network Segment"] E --> H["Network Segment"] F --> I["Network Segment"] G --> J["Switch"] H --> K["Switch"] I --> L["Switch"]](/content/2026/05/1028692/images/29d0d78b2adfa7d444da20c9152958d056de937bc6b474bf84b100f984e55de2.jpg)
Figure 13.
Understanding the Steps for Initial Connection
Generally, five steps are required to complete the basic and security configuration of your STM:
- Connect the STM physically to your network. Connect the cables and restart your network according to the instructions in the installation guide. See the ProSecure™ Web/Email Security Threat Management Appliance STM150, STM300, or STM600 Installation Guide for complete steps. A PDF of the Installation Guide is on the NETGEAR ProSecure™ website at http://prosecure.netgear.com/resources/document-library.php.
- Log in to the STM. After logging in, you are ready to set up and configure your STM. See Logging In to the STM on page 28.
-
Use the Setup Wizard to configure basic connections and security. During this phase, you connect the STM to your network. See Using the Setup Wizard to Perform the Initial Configuration on page 32.
-
Verify the installation. See Verifying Correct Installation on page 49.
- Register the STM. See Registering the STM with NETGEAR on page 50.
Each of these tasks is described separately in this chapter.
Qualified Web Browsers
To configure the STM, you need to use a Web browser such as Microsoft Internet Explorer 5.1 or later, Mozilla Firefox I.x or later, or Apple Safari 1.2 or later with JavaScript, cookies, and SSL enabled.
Although these Web browsers are qualified for use with the STM's Web Management Interface, SSL VPN users should choose a browser that supports JavaScript, Java, cookies, SSL, and ActiveX to take advantage of the full suite of applications. Note that Java is required only for the SSL VPN portal, not for the Web Management Interface.
Logging In to the STM
To connect to the STM, your computer needs to be configured to obtain an IP address automatically from the STM via DHCP. For instructions on how to configure your computer for DHCP, see the document that you can access from Preparing Your Network in Appendix C.
To connect and log in to the STM:
- Start any of the qualified browsers, as explained in Qualified Web Browsers on this page.
- Enter https://192.168.1.201 in the address field.

Figure 14.
Note: The STM factory default IP address is 192.168.1.201. If you change the IP address, you need to use the IP address that you assigned to the STM to log in to the STM.
The NETGEAR Configuration Manager Login screen displays in the browser (see the following figure, which shows the STM300).

Figure 15.
- In the User Name field, type admin. Use lowercase letters.
- In the Password field, type password. Here, too, use lowercase letters.
Note: The STM user name and password are not the same as any user name or password you might use to log in to your Internet connection.
Note: The first time that you remotely connect to the STM with a browser via an SSL VPN connection, you might get a warning message regarding the SSL certificate. If you are using a Windows computer with Internet Explorer 5.5 or later, simply click Yes to accept the certificate. Other browsers provide you with similar options to accept and install the SSL certificate. If you connect to the STM through the User Portal Login screen (see Figure 88 on page 156), you can import the STM's root certificate by clicking the link at the bottom of the screen.
- Click Login. The Web Management Interface displays, showing the Dashboard screen (see the following figure, which shows only the top part of the screen). For information about this screen, see Understanding the Information on the Dashboard Screen on page 184.
Note: During the initial setup, the Setup Wizard displays when you first log in; afterward the login takes you to the Dashboard screen.

Figure 16.
Note: After 5 minutes of inactivity (the default login time-out), you are automatically logged out.
Understanding the Web Management Interface Menu Layout
The following figure shows the menu at the top of the STM300's Web Management Interface. The Web Management Interface layouts of the STM150 and STM600 are identical to the STM300.
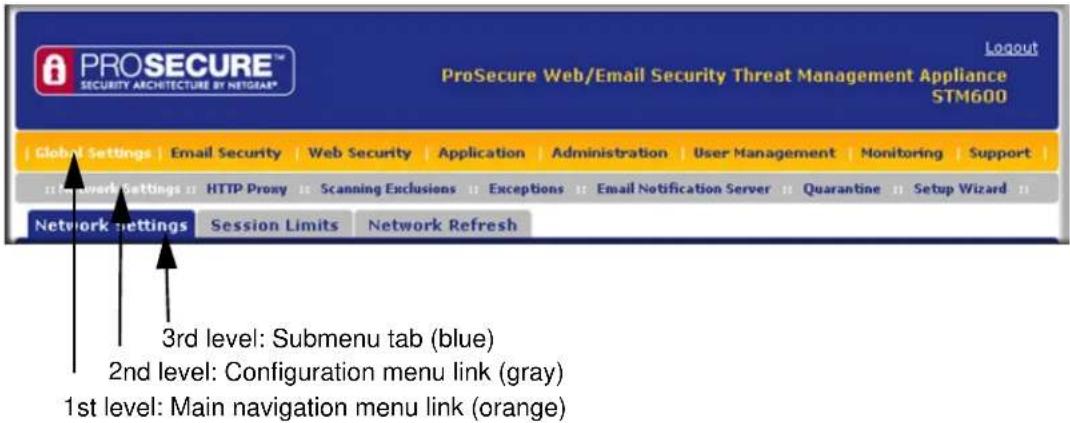
Figure 17.
The Web Management Interface menu consists of the following components:
- 1st Level: Main navigation menu links. The main navigation menu in the orange bar across the top of the Web Management Interface provides access to all the configuration functions of the STM, and remains constant. When you select a main navigation menu link, the letters are displayed in white against an orange background.
- 2nd Level: Configuration menu links. The configuration menu links in the gray bar (immediately below the main navigation menu bar) change according to the main navigation menu link that you select. When you select a configuration menu link, the letters are displayed in white against a gray background.
- 3rd Level: Submenu tabs. Each configuration menu item has one or more submenu tabs that are listed below the gray menu bar. When you select a submenu tab, the text is displayed in white against a blue background.
The bottom of each screen provides action buttons. The nature of the screen determines which action buttons are shown. The following figure shows an example:
Apply
Reset
Figure 18.
Any of the following action buttons might be displayed on screen (this list might not be complete):
• Apply. Save and apply the configuration.
- Reset. Reset the configuration to default values.
- Test. Test the configuration before you decide whether or not to save and apply the configuration.
- Auto Detect. Enable the STM to detect the configuration automatically and suggest values for the configuration.
• Next. Go to the next screen (for wizards).
• Back. Go to the previous screen (for wizards).
• Search. Perform a search operation.
- Cancel. Cancel the operation.
- Send Now. Send a file or report.
When a screen includes a table, table buttons are displayed to let you configure the table entries. The nature of the screen determines which table buttons are shown. The following figure shows an example:




Figure 19.
Any of the following table buttons might be displayed on screen:
• Select All. Select all entries in the table.
- Delete. Delete the selected entry or entries from the table.
- Enable. Enable the selected entry or entries in the table.
- Disable. Disable the selected entry or entries in the table.
- Add. Add an entry to the table.
• Edit. Edit the selected entry.
• Up. Move the selected entry up in the table.
• Down. Move the selected entry down in the table.
Almost all screens and sections of screens have an accompanying help screen. To open the help screen, click the question mark icon. ( )
Using the Setup Wizard to Perform the Initial Configuration
The Setup Wizard facilitates the initial configuration of the STM by taking you through 11 screens, the last of which allows you to save the configuration.
To start the Setup Wizard:
- Select Global Settings > Network Settings from the menu. The Network Settings submenu tabs display with the Network Settings screen in view.
- From the Network Settings configuration menu, select Setup Wizard.
The following sections explain the 11 configuration screens of the Setup Wizard. On the 10th screen, you can save your configuration. The 11th screen is just an informational screen.
The tables in the following sections explain the buttons and fields of the Setup Wizard screens. Additional information about the settings in the Setup Wizard screens is provided in other chapters that explain manual configuration; each following section provides a specific link to a section in another chapter.
Setup Wizard Step 1 of 10: Introduction

Figure 20.
The first Setup Wizard screen is just an introductory screen. Click Next to go to the following screen.
Setup Wizard Step 2 of 11: Networking Settings
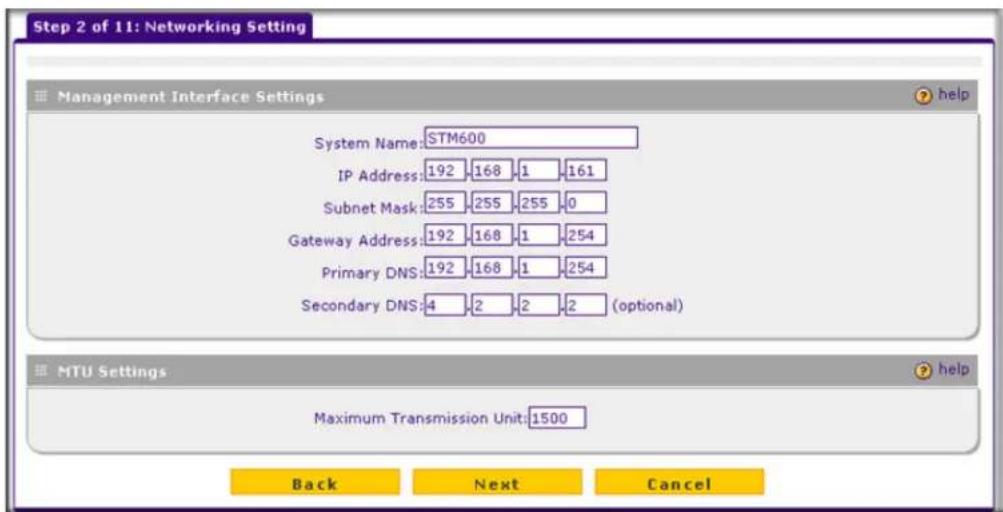
Figure 21.
Enter the settings as explained in the following table, and then click Next to go the following screen.
Note: After you have completed the steps in the Setup Wizard, you can make changes to the network settings by selecting Global Settings > Network Settings. For more information about these network settings, see Configuring Network Settings on page 52.
Table 5. Setup Wizard Step 2: Network Settings
| Setting Description (or Subfield and Description) | |
| Management Interface Settings | |
| System Name The name for the STM for purposes of identification and management. The default name is the name of your model (STM150, STM300, or STM600). | |
| IP Address Enter the IP address of the STM through which you will access the Web Management Interface. The factory default IP address is 192.168.1.201.Note: If you change the IP address of the STM while being connected through the browser, you will be disconnected. You then need to open a new connection to the new IP address and log in again. For example, if you change the default IP address from 192.168.1.201 to 10.0.0.1, you need to enterhttps://10.0.0.1in your browser to reconnect to the Web Management Interface. | |
| Subnet Mask Enter the IP subnet mask. The subnet mask specifies the network number portion of an IP address. Unless you are implementing subnetting, use 255.255.255.0 as the subnet mask. | |
| Gateway Address Enter the IP address of the gateway through which the STM is accessed. | |
| Primary DNS Specify the IP address for the primary DNS server. | |
| Secondary DNS As an option, specify the IP address for the secondary DNS server. | |
| MTU Settings | |
| Maximum Transmission Unit | The maximum transmission unit (MTU) is the largest physical packet size that a network can transmit. Packets that are larger than the MTU value are divided into smaller packets before they are sent, an action that prolongs the transmission process. For most Ethernet networks the MTU value is 1500 bytes, which is the default setting.Note: NETGEAR recommends synchronizing the STM's MTU setting with that of your network to prevent delays in transmission. |
Setup Wizard Step 3 of 11: Time Zone

Figure 22.
Enter the settings as explained in the following table, and then click Next to go the following screen.
Note: After you have completed the steps in the Setup Wizard, you can make changes to the date and time by selecting Administration > System Date & Time. For more information about these settings, see Configuring Date and Time Service on page 74.
Table 6. Setup Wizard Step 3: System Date and Time Settings
| Setting Description (or Subfield and Description) | ||
| System Date and TimeFrom the drop-down list, select an NTP server, or select to enter the time manually. | ||
| Use Default NTP Servers The STM regularly updates its real-time clock (RTC), which it uses for scheduling, by contacting a default NETGEAR NTP server on the Internet. This is the default setting. | ||
| Use Custom NTP Servers The STM regularly updates its RTC by contacting one of the two NTP servers (primary and backup), both of which you need to specify in the fields that become available when you select this option.Note: If you select this option but leave either the Server 1 or Server 2 field blank, both fields are automatically set to the default NETGEAR NTP servers.Note: A list of public NTP servers is available at http://support.ntp.org/bin/view/Servers/WebHome. | ||
| Manually Enter the Date and Time | Date Enter the date in the yyyy-mm-dd (year-month-date) format. | |
| Time Enter the time in the hh-mm-ss (hour-minutes-seconds) format. | ||
| Time Zone | ||
| From the drop-down list, select the local time zone in which the STM operates. The correct time zone is required in order for scheduling to work correctly. You do not need to configure daylight savings time, which is applied automatically when applicable. Greenwich Mean Time (GMT) is the default setting.Note: When you select a time zone that is not associated with a location, such as (GMT -08:00) GMT-8, daylight savings time is automatically disabled. When you select a time zone that is associated with a location, such as (GMT -08:00) Pacific Time (US & Canada), daylight savings time is automatically enabled. | ||
Setup Wizard Step 4 of 11: Email Security

Figure 23.
Enter the settings as explained in the following table, and then click Next to go the following screen.
Note: After you have completed the steps in the Setup Wizard, you can make changes to the email security settings by selecting Email Security > Policy or Email Security > Anti-Virus. The Email Anti-Virus screen also lets you specify notification settings and email alert settings. For more information about these settings, see Configuring Email Protection on page 87.
Tip: To enhance performance, you can disable scanning of any protocols that are seldom or never used. Be mindful of the difference between user-and server-generated traffic. For example, your mail server might not use IMAP, but some users might configure IMAP clients.
Table 7. Setup Wizard Step 4: Email Security Settings
| Setting Description (or Subfield and Description) | ||
| Services to Scan | ||
| SMTP SMTP | scanning is enabled by default on standard service port 25. | To disable any of these services, clear the corresponding check box. You can change the standard service port or add another port in the corresponding Ports to Scan field. |
| POP3 POP3 | scanning is enabled by default on standard service port 110. | |
| IMAP IMAP | scanning is enabled by default on standard service port 143. | |
| Scan Action | ||
| SMTP From | the SMTP drop-down list, specify one of the following actions to be taken when an infected email is detected:Quarantine attachment.The email is not blocked, but the attachment is removed and placed in the malware quarantine for further research. In addition, a malware quarantine log entry is created, and depending on the nature of the malware threat, also a virus log entry or a spyware log entry.Delete attachment.The email is not blocked, but the attachment is deleted, and a virus log entry or a spyware log entry is created.Block infected email.This is the default setting. The email is blocked, and a virus log entry or a spyware log entry is created.Quarantine infected email.The email is placed in the malware quarantine for further research. In addition, a malware quarantine log entry is created, and depending on the nature of the malware threat, also a virus log entry or a spyware log entry.Log only. Only a virus log entry or a spyware log entry is created. The email is not blocked and the attachment is not deleted. | |
| POP3 From | the POP3 drop-down list, specify one of the following actions to be taken when an infected email is detected:Quarantine attachment.The email is not blocked, but the attachment is removed and placed in the malware quarantine for further research. In addition, a malware quarantine log entry is created, and depending on the nature of the malware threat, also a virus log entry or a spyware log entry.Delete attachment.This is the default setting. The email is not blocked, but the attachment is deleted, and a virus log entry or a spyware log entry is created.Log only. Only a virus log entry or a spyware log entry is created. The email is not blocked and the attachment is not deleted. | |
| IMAP From | the IMAP drop-down list, specify one of the following actions to be taken when an infected email is detected:Quarantine attachment.The email is not blocked, but the attachment is removed and placed in the malware quarantine for further research. In addition, a malware quarantine log entry is created, and depending on the nature of the malware threat, also a virus log entry or a spyware log entry.Delete attachment.This is the default setting. The email is not blocked, but the attachment is deleted, and airus log entry or a spyware log entry is created.Log only. Only a virus log entry or a spyware log entry is created. The email is not blocked and the attachment is not deleted. | |
Table 7. Setup Wizard Step 4: Email Security Settings (Continued)
| Setting Description (or Subfield and Description) |
| Scan Exceptions |
| From the drop-down list, specify one of the following actions to be taken when an email attachment exceeds the size that you specify in the file size field:Skip. The file is not scanned but skipped, leaving the end user vulnerable. This is the default setting.Block. The file is blocked and does not reach the end user.The default and maximum file sizes are as follows:For the STM600, the default setting is to block any attachment larger than 10240 KB. The maximum file size that you can specify is 51200 KB.For the STM300, the default setting is to block any attachment larger than 10240 KB. The maximum file size that you can specify is 25600 KB.For the STM150, the default setting is to block any attachment larger than 8192 KB. The maximum file size that you can specify is 25600 KB.Note: Setting the maximum file size to a high value might affect the STM's performance. NETGEAR recommends the default value, which is sufficient to detect the vast majority of threats. |
Setup Wizard Step 5 of 11: Web Security
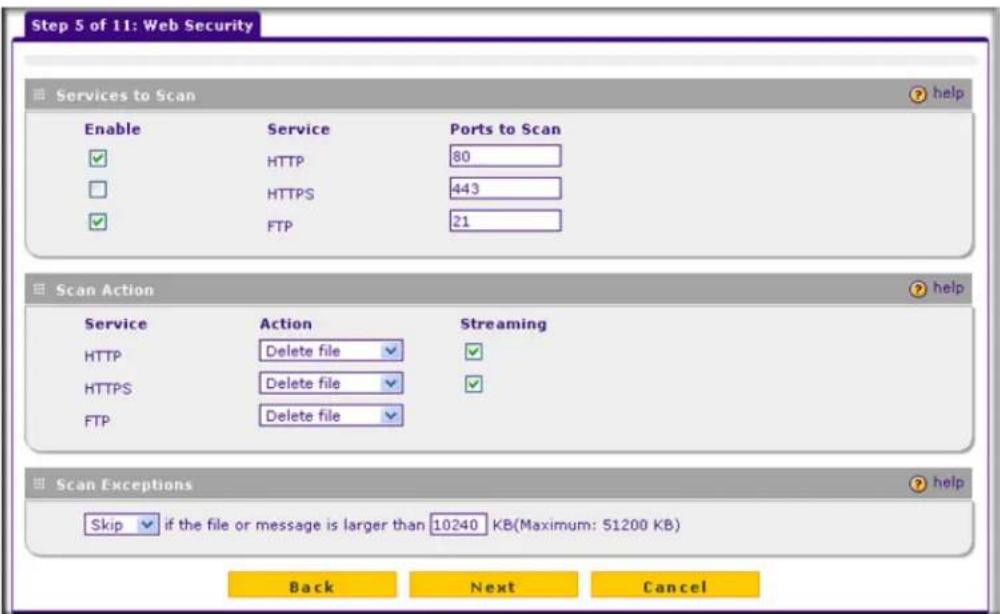
Figure 24.
Enter the settings as explained in the following table, and then click Next to go the following screen.
Note: After you have completed the steps in the Setup Wizard, you can make changes to the Web security settings by selecting Web Security > Policy or Web Security > HTTP/HTTPS > Malware Scan. The Malware Scan screen also lets you specify HTML scanning and notification settings. For more information about these settings, see Configuring Web and Services Protection on page 105.
Table 8. Setup Wizard Step 5: Web Security Settings
| Setting Description (or Subfield and Description) | ||
| Services to Scan | ||
| HTTP HTTP | scanning is enabled by default on standard service port 80. | To disable Hypertext Transfer Protocol (HTTP) scanning, clear the corresponding check box. You can change the standard service port or add another port in the corresponding Ports to Scan field. |
| HTTPS HTTPS | scanning is disabled by default. | To enable Hypertext Transfer Protocol over Secure Socket Layer (HTTPS) scanning, select the corresponding check box. You can change the standard service port (number 443) or add another port in the corresponding Ports to Scan field. |
| FTP FTP scanning | is enabled by default on standard service port 21. | To disable File Transfer Protocol (FTP) scanning, clear the corresponding check box. You can change the standard service port or add another port in the corresponding Ports to Scan field. |
| Scan Action | ||
| HTTP From | the HTTP drop-down list, specify one of the following actions to be taken when an infected Web file or object is detected:Quarantine file. The Web file or object is removed and placed in the malware quarantine for further research. In addition, a malware quarantine log entry is created, and depending on the nature of the malware threat, also a virus log entry or spyware log entry.Delete file. This is the default setting. The Web file or object is deleted, and a virus log entry or spyware log entry is created.Log only. Only a virus log entry or spyware log entry is created. The Web file or object is not deleted.Select the Streaming check box to enable streaming of partially downloaded and scanned HTTP file parts to the end user. This method allows the user to experience more transparent Web downloading. Streaming is enabled by default. | |
Table 8. Setup Wizard Step 5: Web Security Settings (Continued)
| Setting Description (or Subfield and Description) | |
| HTTPS From the HTTPS drop-down list, specify one of the following actions to be taken when an infected Web file or object is detected:Quarantine file. The Web file or object is removed and placed in the malware quarantine for further research. In addition, a malware quarantine log entry is created, and depending on the nature of the malware threat, also a virus log entry or spyware log entry.Delete file. This is the default setting. The Web file or object is deleted, and a virus log entry or spyware log entry is created.Log only. Only a virus log entry or spyware log entry is created. The Web file or object is not deleted.Select the Streaming check box to enable streaming of partially downloaded and scanned HTTPS file parts to the end user. This method allows the user to experience more transparent Web downloading. Streaming is enabled by default. | |
| FTP From the FTP drop-down list, specify one of the following actions to be taken when an infected Web file or object is detected:Quarantine file. The Web file or object is removed and placed in the malware quarantine for further research. In addition, a malware quarantine log entry is created, and depending on the nature of the malware threat, also a virus log entry or spyware log entry.Delete file. This is the default setting. The Web file or object is deleted, and a virus log entry or Spyware log entry is created.Log only. Only a virus log entry or spyware log entry is created. The Web file or object is not deleted. | |
| Scan Exceptions | |
| From the drop-down list, specify one of the following actions to be taken when a Web file or object exceeds the size that you specify in the file size field:Skip. The file is not scanned but skipped, leaving the end user vulnerable. This is the default setting.Block. The file is blocked and does not reach the end user.The default and maximum file sizes are as follows:For the STM600 and STM300, the default setting is to block any attachment larger than 10240 KB. The maximum file size that you can specify is 51200 KB.For the STM150, the default setting is to block any attachment larger than 8192 KB. The maximum file size that you can specify is 25600 KB.Note: Setting the maximum file size to a high value might affect the STM's performance. NETGEAR recommends the default value, which is sufficient to detect the vast majority of threats. |
Setup Wizard Step 6 of 11: Email Notification Server Settings

Figure 25.
Enter the settings as explained in the following table, and then click Next to go the following screen.
Note: After you have completed the steps in the Setup Wizard, you can make changes to the administrator email notification settings by selecting Global Settings > Email Notification Server. For more information about these settings, see Configuring the Email Notification Server on page 176.
Table 9. Setup Wizard Step 6: Email Notification Server Settings
| Setting Description (or Subfield and Description) | |
| Email Notification Server Settings | |
| Show as Mail Sender A descriptive name of the sender for email identification purposes. For example, enter stm600notification@netgear.com. | |
| Send Notifications to The email address to which the notifications should be sent. Typically, this is the email address of a user with administrative privileges. | |
| SMTP Server The IP address and port number or Internet name and port number of your ISP's outgoing email SMTP server. The default port number is 25.Note: If you leave this field blank, the STM cannot send email notifications. | |
| Mail Server Requires Authentication | If the SMTP server requires authentication, select the Mail Server Requires Authentication check box and enter the following settings: |
| User Name The user name for SMTP server authentication. | |
| Password The password for SMTP server authentication. | |
Setup Wizard Step 7 of 11: Update Settings

Figure 26.
Enter the settings as explained in the following table, and then click Next to go the following screen.
Note: After you have completed the steps in the Setup Wizard, you can make changes to the security subscription update settings by selecting Administration > Software Update. For more information about these settings, see Updating the Software on page 71.
Table 10. Setup Wizard Step 7: Update Settings
| Setting Description (or Subfield and Description) | |
| System Information | |
| You cannot configure this section; it is shown for information only. For the software, scan engine, (signature) pattern file, and operating system (OS), the current version and the date of the last update are displayed.Click + More to display the versions and most recent downloads for the antispam engine, applications engine, applications pattern file, stream engine, stream pattern file, mini engine, mini pattern file, policyd, scand, urld, update client, and rescue software. | |
| Update Settings | |
| Update From Select one of the following radio buttons:Default Update Server. The scan engine and signatures are updated from the NETGEAR default update server.Another Update Server. The scan engine and signatures are updated from a server that you specify by entering the server IP address or host name in the Server Address field. | |
| Server Address The update server IP address or host name. | |
| Update Component Make one of the following selections from the drop-down list:Update Signature Patterns only. Only the (signature) pattern file is updated. The software, scan engine, and OS are not updated.Update all Software and Signature Patterns. The software, scan engine, (signature) pattern file, and OS are updated. This is the default setting. | |
| Update Frequency | |
| Make one of the following selections:Weekly. From the drop-down lists, specify the day, hour, and minutes that the update should occur.Daily. From the drop-down lists, specify the hour and minutes that the update should occur.Every. From the drop-down list, specify the frequency with which the update should occur. |
Setup Wizard Step 8 of 11: HTTP Proxy Settings

Figure 27.
Enter the settings as explained in the following table, and then click Next to go the following screen.
Note: After you have completed the steps in the Setup Wizard, you can make changes to the security subscription update settings by selecting Global Settings> HTTP Proxy. For more information about these settings, see Configuring the HTTP Proxy Settings on page 60.
Table 11. Setup Wizard Step 8: HTTP Proxy Settings
| Setting Description (or Subfield and Description) | ||
| HTTPS Proxy Settings | ||
| Use a Proxy Server to Connect to the Internet | If computers on the network connect to the Internet via a proxy server, select the Use a Proxy Server to Connect to the Internet check box to specify and enable a proxy server. Enter the following settings: | |
| Proxy Server The IP address and port number of the proxy server. | ||
| User Name The user name for proxy server authentication. | ||
| Password The password for proxy server authentication. | ||
Setup Wizard Step 9 of 11: Web Categories

Figure 28.
Enter the settings as explained in the following table, and then click Next to go the following screen.
Note: After you have completed the steps in the Setup Wizard, you can make changes to the content filtering settings by selecting Web Security > HTTP/HTTPS > Content Filtering. The Content Filtering screen lets you specify additional filtering tasks and notification settings. For more information about these settings, see Configuring Web Content Filtering on page 109.
Table 12. Setup Wizard Step 9: Web Categories Settings
| Setting Description (or Subfield and Description) |
| Select the Web Categories You Wish to Block |
| Select the Enable Blocking check box to enable blocking of Web categories, which is the default setting.Select the check boxes of any Web categories that you want to block. Use the action buttons in the following way:Allow All. All Web categories are allowed.Block All. All Web categories are blocked.Set to Defaults. Blocking and allowing of Web categories are returned to their default settings. See Table 24 on page 85 for information about the Web categories that are blocked by default. Categories that are preceded by a green rectangle are allowed by default; categories that are preceded by a pink rectangle are blocked by default. |
Setup Wizard Step 10 of 11: Configuration Summary

Figure 29.
Click Apply to save your settings and automatically restart the system, or click Back to make changes to the configuration.
Setup Wizard Step 11 of 11: Restarting the System

Figure 30.
Wizard screen 11 is just an informational screen to let you know that the system restarts automatically with the new configuration.
Verifying Correct Installation
Test the STM before deploying it in a live production environment. The following instructions walk you through a couple of quick tests designed to ensure that your STM is functioning correctly.
Testing Connectivity
Verify that network traffic can pass through the STM:
• Test an Internet URL (see Testing a URL on page 217).
• Ping the IP address of a device on either side of the STM.
Testing HTTP Scanning
If client computers have direct access to the Internet through your LAN, try to download the eicar.com test file from http://www.eicar.org/download/eicar.com.
The eicar.com test file is a legitimate DoS program and is safe to use because it is not a malware threat and does not include any fragments of malware code. The test file is provided by EICAR, an organization that unites efforts against computer crime, fraud, and misuse of computers or networks.
Verify that the STM correctly scans HTTP traffic:
- Log in to the STM Web Management Interface, and then verify that HTTP scanning is enabled. For information about how to enable HTTP scanning, see Customizing Web Protocol Scan Settings on page 105.
- Check the downloaded eicar.com test file, and note the attached malware information file.
Registering the STM with NETGEAR
To receive threat management component updates and technical support, you need to register your STM with NETGEAR. The support registration keys are provided with the product package (see Service Registration Card with License Keys on page 12).
The STM supports a bundle key, which is a single support registration key that provides all three licenses: Web protection, Email protection, and Support & Maintenance.
Note: Activating the service licenses initiates their terms of use. Activate the licenses only when you are ready to start using this unit. If your unit has never been registered before, you can use the 30-day trial period for all three types of licenses to perform the initial testing and configuration. To use the trial period, do not click Register in step 5 of the following procedure but click Trial instead.
To activate the service licenses:
- Ensure that your STM is connected to the Internet.
- Select Support > Registration from the menu. The Registration screen displays:

Figure 31.
- In the Registration Key field, enter the license key.
- Fill out the customer and VAR fields.
- Click Register.
- Repeat step 3 and step 5 for additional license keys.
The STM activates the licenses and registers the unit with the NETGEAR registration server.
Note: If you reset the STM to the original factory default settings after you have entered the license keys to activate the STM (see Registering the STM with NETGEAR on page 50), the license keys are erased. The license keys and the different types of licenses that are available for the STM are no longer displayed on the Registration screen. However, after you have reconfigured the STM to connect to the Internet and to the NETGEAR registration server, the STM retrieves and restores all registration information based on its MAC address and hardware serial number. You do not need to reenter the license keys or reactivate the STM.
What to Do Next
You have completed setting up and deploying the STM to the network. The STM is now set up to scan the protocols and services that you specified for malware threats and to perform updates based on the configured update source and frequency.
If you need to change the settings, or to view reports or logs, log in to the STM Web Management Interface, using the default IP address or the IP address that you assigned to the STM in Setup Wizard Step 1 of 10: Introduction on page 33.
The STM is ready for use. However, the following sections describe some important tasks that you might want to address before you deploy the STM in your network:
• Changing Administrative Passwords and Timeouts on page 62
• Managing Digital Certificates on page 76
• Configuring Groups on page 148
- Configuring User Accounts on page 152
- Configuring Authentication on page 154
• Setting Scanning Exclusions and Web Access Exceptions on page 130
Performing Network and System Management
3
This chapter describes the network settings, the system management features, and ways to improve the performance of the STM. If you have used the Setup Wizard, you have already configured some of these settings, but there are situations in which you might want to modify them. This chapter contains the following sections:
- Configuring Network Settings on this page
- Configuring Session Limits and Timeouts on page 56
- Configuring the Network Refresh and Permanent MAC Address Bindings on page 57
- Configuring the HTTP Proxy Settings on page 60
• About Users with Administrative and Guest Privileges on page 61 - Configuring Remote Management Access on page 64
• Using an SNMP Manager on page 65
• Managing the Configuration File on page 67
• Updating the Software on page 71 - Configuring Date and Time Service on page 74
• Managing Digital Certificates on page 76
• Managing the Quarantine Settings on page 81
• Managing the STM's Performance on page 82
Configuring Network Settings
If you have used the Setup Wizard, you might already have configured the Web Management Interface and maximum transmission unit (MTU) settings; the Network Settings screen allows you to modify these settings and to specify the interface speed and duplex settings.
The STM requires a valid IP address to retrieve online updates and to enable access to its Web Management Interface. If you have used the Setup Wizard to configure the STM, you have already specified the management interface name and address settings and the size of the MTU. In addition to modifying these settings, the Network Settings screen also allows you to specify the interface speed and duplex settings for the management interface, for the
STM600 or STM300 uplink and downlink interfaces, or for the STM150's WAN and LAN interfaces.
To configure the STM's network settings:
- Select Global Settings > Network Settings from the menu. The Network Settings submenu tabs display with the Network Settings screen in view. (The following figure shows the STM600.)

Figure 32. STM600
The following figure shows the Interface Speed & Duplex Settings section of the Network Settings screen of the STM300:

Figure 33. STM300
The following figure shows the Interface Speed & Duplex Settings section of the Network Settings screen of the STM150:
| Interface | Speed/Duplex | MAC Address | Set Speed/Duplex |
| LAN1 | No Link | 00:1F:33:1E:F1:84 | auto |
| LAN2 | No Link | ||
| LAN3 | No Link | ||
| LAN4 | 1000baseT/Full | ||
| WAN | 1000baseT/Full | 00:1F:33:1E:F1:85 | auto |
Figure 34. STM150
- Complete the fields and make your selections from the drop-down lists as explained in the following table:
Table 13. Network Settings
| Setting Description | (or Subfield and Description) |
| Management Interface Settings | |
| System Name The | name for the STM for purposes of identification and management. The default name is the name of your model (STM150, STM300, or STM600). |
| IP Address Enter the | IP address of the STM through which you will access the Web Management Interface. The factory default IP address is 192.168.1.201.Note:If you change the IP address of the STM while being connected through the browser, you will be disconnected. You then need to open a new connection to the new IP address and log in again. For example, if you change the default IP address from 192.168.1.201 to 10.0.0.1, you need to enterhttps://10.0.0.1in your browser to reconnect to the Web Management Interface. |
| Subnet Mask Enter | the IP subnet mask. The subnet mask specifies the network number portion of an IP address. Unless you are implementing subnetting, use 255.255.255.0 as the subnet mask. |
| Gateway Address Enter the IP address of the gateway through which the STM is accessed. | |
| Primary DNS Specify the IP address for the primary DNS server IP address. | |
| Secondary DNS As | an option, specify the IP address for the secondary DNS server IP address. |
| Interface Speed & Duplex SettingsThese sections show the MAC address and assigned speed and duplex setting for each active interface. The Set Speed/Duplex drop-down list allows you to select the speed and duplex setting for each active interface. To set the speed to 1000baseT duplex ("full"), selectautoto let the STM sense the speed automatically.Note:MGMT stands for management interface. | |
Table 13. Network Settings (Continued)
| Setting Description | (or Subfield and Description) | |
| STM600(see Figure 32 on page 53) | MGMT From the Set | Speed/Duplex drop-down list, make one of the following selections:auto. Speed autosensing. This is the default setting.10baseT/Half. Ethernet speed at half duplex.10baseT/Full. Ethernet speed at full duplex.100baseT/Half. Fast Ethernet speed at half duplex.100baseT/Full. Fast Ethernet speed at full duplex. |
| PAIR1 UPLINK | ||
| PAIR1 DOWNLINK | ||
| PAIR2 UPLINK | ||
| PAIR2 DOWNLINK | ||
| STM300(see Figure 33 on page 53) | MGMT From the Set | Speed/Duplex drop-down list, make one of the following selections:auto. Speed autosensing. This is the default setting.10baseT/Half. Ethernet speed at half duplex.10baseT/Full. Ethernet speed at full duplex.100baseT/Half. Fast Ethernet speed at half duplex.100baseT/Full. Fast Ethernet speed at full duplex. |
| UPLINK | ||
| DOWNLINK | ||
| STM150(see Figure 34 on page 54) | LAN1LAN2LAN3LAN4 | From the Set Speed/Duplex drop-down list, make one of the following selections:auto. Speed autosensing. This is the default setting, which can sense 1000BaseT speed at full duplex.10baseT/Half. Ethernet speed at half duplex.10baseT/Full. Ethernet speed at full duplex.100baseT/Half. Fast Ethernet speed at half duplex.100baseT/Full. Fast Ethernet speed at full duplex.Note: All LAN interfaces share the same MAC address, speed, and duplex mode.Note: The STM150 does not provide a dedicated management interface. |
| WAN | ||
| MTU Settings | ||
| Maximum Transmission Unit | The maximum transmission unit (MTU) is the largest physical packet size that a network can transmit. Packets that are larger than the MTU value are divided into smaller packets before they are sent, an action that prolongs the transmission process. For most Ethernet networks the MTU value is 1500 bytes, which is the default setting.Note: NETGEAR recommends synchronizing the STM's MTU setting with that of your network to prevent delays in transmission. | |
-
Click Apply to save your settings. (If you click Reset, the STM restarts to restore the default network settings.) Changing the network settings has the following consequences:
-
Changing any of the settings in the Management Interface Settings section of the screen causes the STM to restart.
- Changing any of the settings in the Interface Speed & Duplex Settings section of the screen causes the network to restart.
- Changing the MTU setting causes services such as HTTP and SMTP to restart.
Configuring Session Limits and Timeouts
The Session Limits screen allows you to specify the total number of sessions per user (that is, per IP address or single source machine) that are allowed on the STM. Session limiting is disabled by default. When session limiting is enabled, you can specify the maximum number of sessions per user either as an absolute number or as a percentage of the STM's total connection capacity per user, which is 10000 sessions. (You cannot change the total connection capacity per user.) If a user exceeds the number of allocated sessions, packets might be dropped.
Note: Some protocols such as FTP and RSTP create two sessions per connection.
To configure session limits and timeouts:
- Select Global Settings > Network Settings from the menu. The Network Settings submenu tabs display with the Network Settings screen in view.
- Click the Session Limits submenu tab. The Session Limits screen displays:

Figure 35.
- Select the radio buttons, make your selections from the drop-down list, and complete the fields as explained in the following table:
Table 14. Session Limits Settings
| Setting Description | or Subfield and Description) | |
| Session Limits | ||
| Do You Want to Enable per-user Session Limits? | Select theYesradio button to enable session limits, and then fill in the Limit Type and Limit Value fields. The No radio button is selected by default. | |
| Limit Type From the Limit Type drop-down list, make one of the following selections:•Percentage of Maximum Sessions. Session limits are set as a percentage of the total connection capacity per user.•Sessions per User. Session limits are set as an absolute number. | ||
| Limit Value Depending on the selection in the Limit Type field, this value is a percentage or an absolute number. | ||
| The Total Number of Packets Dropped field, which you cannot configure, shows the total number of packets that are dropped because the session limit has been exceeded. | ||
| Session TimeoutsIf a session goes without data flow longer than the configured values, the session is terminated. | ||
| TCP Timeout The time in seconds after which a TCP session without data flow is terminated. The default time is 1200 seconds. | ||
| UDP Timeout The time in seconds after which an UDP session without data flow is terminated. The default time is 180 seconds. | ||
| ICMP Timeout The time in seconds after which an ICMP session without data flow is terminated. The default time is 8 seconds. | ||
- Click Apply to save your settings. Changing any settings in the Session Timeouts section of the screen requires the STM to restart. If you click Reset, the STM restarts to restore the default network settings.
Configuring the Network Refresh and Permanent MAC Address Bindings
The STM integrates smart virtual MAC address detection to automatically detect virtual MAC addresses and bind these to an interface. When the network topology changes, a virtual MAC address might no longer be bound to the original interface. If this situation occurs, the host to which the virtual MAC address is assigned is no longer able to communicate with others through the STM. Therefore, the network need to be refreshed to enable the STM to redetect the virtual MAC address on the correct interface.
To refresh the network and view the MAC Address Bindings table:
- Select Global Settings > Network Settings from the menu. The Network Settings submenu tabs display with the Network Settings screen in view.
- Click the Network Refresh submenu tab. The Network Refresh screen displays. (The following figure shows the STM150.)

Figure 36.
- Select the check boxes and radio buttons and make your selections from the drop-down list as explained in the following table:
Table 15. Network Refresh Settings
| Setting Description | or Subfield and Description) | |
| Automatically Refresh the Network | ||
| Periodically refresh the MAC address bindings | Select this check box to enable the periodic refresh of the dynamic MAC address bindings. Specify if the refresh occurs either weekly or daily. | |
| Weekly | Select the Weekly radio button to enable a weekly refresh of the network, and then specify when the refresh needs to occur by selecting the day, hour, and minutes from the drop-down lists. | |
| Daily | Select the Daily radio button to enable a daily refresh of the network, and then specify when the refresh needs to occur by selecting the hour and minutes from the drop-down lists. | |
| Click Apply to schedule the automatic refresh of the network, or click Reset to return to the default settings. | ||
| Manually Refresh the Network | ||
| Click Refresh to immediately refresh the network.Note: When you click Refresh, the network restarts.Note: The Advanced Settings button is described in the following section. | ||
Managing Permanent MAC Address Bindings
You can permanently bind a MAC address to an interface. Such a binding does not change when the network topology changes and does not need to be redetected by the STM.
To create a permanent MAC binding:
- Select Global Settings > Network Settings from the menu. The Network Settings submenu tabs display with the Network Settings screen in view.
- Click the Network Refresh submenu tab. The Network Refresh screen displays (see the previous figure, which shows the STM150). Locate the Manually Refresh the Network section.
-
Click the Advanced Settings button. The screen expands to display the MAC Address Bindings section.
-
Complete the fields and make your selections from the drop-down lists as explained in the following table:
Table 16. MAC Address Binding Settings
| Setting Description | |
| MAC Address Enter the MAC address that you want to bind permanently. | |
| Port (STM150) or Interface (STM300 and STM600) | From the drop-down list, select the interface to which the MAC address needs to be bound. |
| Type This field is automatically determined: it displays Permanent or Dynamic. | |
- To add the newly configured MAC address binding to the MAC Address Bindings table, click the Add table button in the Action column.
The MAC Address Bindings table displays both the dynamic bindings that are automatically detected by the STM and the permanent bindings that you have created.
Changing a Dynamic MAC Address Binding to a Permanent Binding
To change a dynamic binding to a permanent binding:
- Locate the dynamic MAC address binding that you want bind permanently, and select an interface from the Port drop-down list (STM150) or Interface drop-down list (STM300 and STM600).
- Click the corresponding Add table button in the Action column.
Activating, Editing, or Deleting a Permanent MAC Address Binding
For each permanent binding in the MAC Address Bindings table, the Action column provides two table buttons:
• Apply. Activates the permanent MAC address binding.
- Delete. Deletes the permanent MAC address binding from the table.
To assign another interface to a permanent MAC address binding:
- Locate the dynamic MAC address binding that you want to edit, and select another interface from the Port drop-down list (STM150) or Interface drop-down list (STM300 and STM600).
- Click Apply to save your changes.
Configuring the HTTP Proxy Settings
If you have used the Setup Wizard, you might have already configured an HTTP proxy; the HTTP Proxy screen allows you to modify these settings. If the STM is installed behind an HTTP proxy, you might need to specify the HTTP proxy settings for the STM to connect to the
Internet. The settings on the HTTP Proxy screen affect Web category filtering, distributed spam analysis, and software updates.
To configure the HTTP proxy:
- Select Global Settings > HTTP Proxy from the menu. The HTTP Proxy screen displays:

Figure 37.
- Select the check box and complete the fields as explained in the following table:
Table 17. HTTP Proxy Settings
| Setting Description (or) | Subfield and Description) | |
| HTTPS Proxy Settings | ||
| Use a Proxy Server to Connect to the Internet | If computers on the network connect to the Internet via a proxy server, select the Use a Proxy Server to Connect to the Internet check box to specify and enable a proxy server. Enter the following settings: | |
| Proxy Server The IP address and port number of the proxy server. | ||
| User Name The user name for proxy server authentication. | ||
| Password The p password for proxy server authentication. | ||
- Click Apply to save your settings.
About Users with Administrative and Guest Privileges
There are two predefined user types that can access the STM's Web Management Interface:
- Administrator. A user who has full access and the capacity to change the STM configuration (that is, read/write access). The default user name for an administrator is admin, and the default password for an administrator is password.
- Guest user. A user who can only view the STM configuration (that is, read-only access). The default user name for a guest is guest, and the default password for a guest is guest.
NETGEAR recommends that you change these passwords to more secure passwords.
The login window that is presented to the administrator and guest user is the NETGEAR Configuration Manager Login screen (see Figure 87 on page 155).
Changing Administrative Passwords and Timeouts
In addition to changing the default password for the administrator and guest user, you can use the Set Password screen to change the account names, and modify the Web Management Interface timeout setting.
Note: The ideal password should contain no dictionary words from any language, and should be a mixture of letters (both uppercase and lowercase), numbers, and symbols. The password can be up to 64 characters.
To modify the administrator and guest accounts, and to modify the Web Management Interface timeout setting:
- Select Administration > Set Password from the menu. The Set Password screen displays:
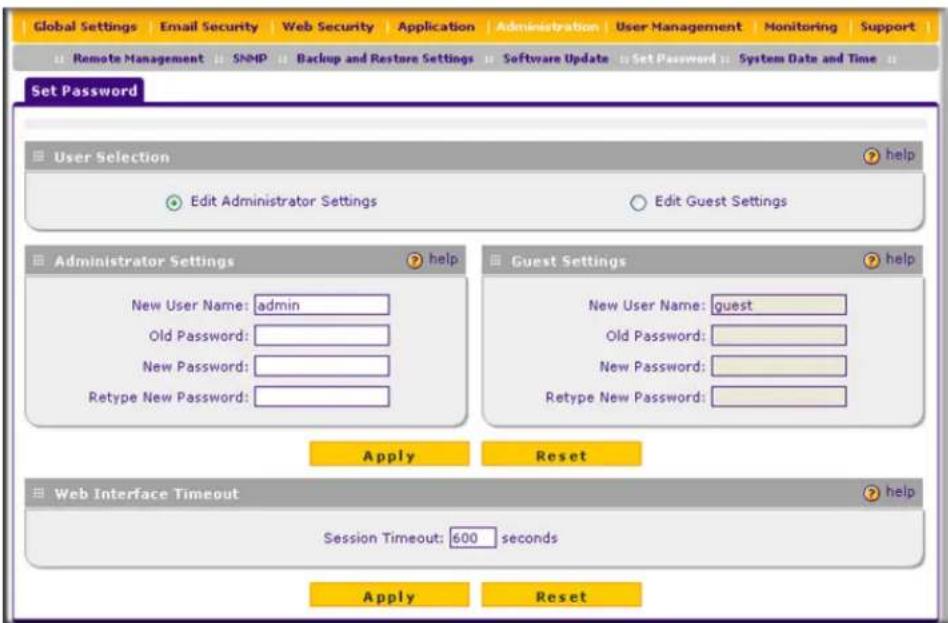
Figure 38.
- To modify the administrator or guest settings, select the check box and complete the fields as explained in the following table:
Table 18. Set Password Settings Screen: Administrator and Guest Settings
| Setting Description (or Subfield and Description) | |
| User Selection | |
| Select one of the following radio buttons:Edit Administrator Settings. Allows you to modify the administrator settings, while the guest settings are masked out.Edit Guest Settings. Allows you to modify the guest settings, while the administrator settings are masked out. | |
| Administrator Settings/Guest Setting | |
| New User Name The default user name. For the administrator account, the default name is admin; for the guest account, the default name is guest. | |
| Old Password The current (factory default) password. | |
| New Password Enter the new password. | |
| Retype New Password Confirm the new password. |
- Under the Administrator Settings and Guest Settings sections of the screen, click Apply to save your settings.
- If you modified the administrator settings and now want to modify the guest settings, or the other way around, repeat step 2 and step 3 for the other settings.
- To modify the Web Management Interface timeout settings, complete the field as explained in the following table:
Table 19. Set Password Settings Screen: Web Interface Timeout Settings
| Setting Description (or | Subfield and Description) |
| Web Interface Timeout | |
| Session Timeout Enter | the period in seconds after which the Web Management Interface is automatically logged off if no activity is detected. The default is 600 seconds. You can configure a session timeout from 30 seconds to 9999 seconds. |
- Under the Web Interface Timeout section of the screen, click Apply to save your settings.
Note: After a factory default reset, the password and timeout values are changed back to password and 600 seconds (5 minutes), respectively.
Configuring Remote Management Access
An administrator can configure, upgrade, and check the status of the STM over the Internet via a Secure Sockets Layer (SSL) VPN connection.
You need to use an SSL VPN connection to access the STM from the Internet: type https:// (not http://) followed by the STM's WAN IP address into your browser. For example, if the STM's WAN IP address is 172.16.0.123, type the following in your browser:
https://172.16.0.123.
The STM's remote login URL is:
https://
Note: The STM is accessible to anyone who knows its IP address and default password. Because a malicious WAN user can reconfigure the STM and misuse it in many ways, NETGEAR highly recommends that you change the admin and guest default passwords before continuing (see Changing Administrative Passwords and Timeouts on page 62).
To configure remote management:
- Select Administration > Remote Management from the menu. The Remote Management screen displays:

Figure 39.
- In the Secure HTTPS Management section of the screen, enter number of the port that you want to use to access Web Management Interface of the STM. The default setting is port 443, but you can enter a port ranging from 1024 to 65535. You cannot use some ports such as 2080 and 8088 that might be used by the STM.
This section of the screen also displays the HTTPS hyperlink through which you can access the Web Management Interface of the STM. The hyperlink consists of the IP address or fully qualified domain name (FQDN) for the STM and the port number that you have assigned.
-
In the Access Control List section of the screen, you can specify IP addresses or IP address ranges that you want to grant access to the Web Management Interface for increased security. To specify a range, separate the beginning IP address and the ending IP address by a hyphen (-).To allow access from all IP addresses and IP address ranges, leave this field blank.
-
Click Apply to save your changes.
Note: To maintain security, the STM rejects a login that uses http://address rather than the SSL https://address.
Note: The first time that you remotely connect to the STM with a browser via an SSL VPN connection, you might get a warning message regarding the SSL certificate. If you are using a Windows computer with Internet Explorer 5.5 or later, simply click Yes to accept the certificate.
Using an SNMP Manager
Simple Network Management Protocol (SNMP) forms part of the Internet Protocol Suite as defined by the Internet Engineering Task Force (IETF). SNMP is used in network management systems to monitor network-attached devices for conditions that warrant administrative attention.
SNMP exposes management data in the form of variables on the managed systems, which describe the system configuration. These variables can then be queried (and sometimes set) by managing applications.
SNMP lets you monitor and manage your STM from an SNMP manager. It provides a remote means to monitor and control network devices, and to manage configurations, statistics collection, performance, and security. The STM provides support for report aggregation through SNMP version 1 (SNMPv1) and version 2 (SNMPv2).
To enable SNMP and to configure the SNMP settings:
1. Select Administration > SNMP from the menu. The SNMP screen displays:

Figure 40.
2. Select the radio buttons and complete the fields as explained in the following table:
Table 20. SNMP Settings
| Setting Description (or Subfield and Description) | |
| SNMP Settings | |
| Do You Want to Enable SNMP? | Select one of the following radio buttons:Yes. Enable SNMP.No. Disable SNMP. This is the default setting. |
| Read Community The community string to allow an SNMP manager access to the MIB objects of the STM for the purpose of reading only. The default setting is public. | |
| Set Community The community string to allow an SNMP manager access to the MIB objects of the STM for the purpose of reading and writing. The default setting is private. | |
Table 20. SNMP Settings (Continued)
| Setting Description (or Subfield and Description) | ||
| Do You Want to Enable SNMP? (continued) | Contact The SNMP | system contact information that is available to the SNMP manager. This setting is optional. |
| Location The phys | cal location of the STM. This setting is optional. | |
| Trusted SNMP Hosts | ||
| Enter the IP addresses of the computers and devices to which you want to grant read-only (GET) or write (SET) privileges on the STM. Separate IP addresses by a comma. To allow any trusted SNMP host access, leave the field blank, which is the default setting. | ||
| SNMP Traps | ||
| Enter the IP addresses of the SNMP management stations that are allowed to receive the STM's SNMP traps. Separate IP addresses by a comma. If you leave the field blank, which is the default setting, no SNMP management station can receive the STM's SNMP traps. | ||
3. Click Apply to save your settings.
Supported MIB Browsers
After you have configured the SNMP settings, you need to enter the IP address of the STM in the Management Information Base (MIB) browsers through which you want to query or configure the STM. See the documentation of your MIB browser for instructions.
NETGEAR recommends the following MIB browsers for receiving the STM SNMP notifications:
MG-Soft
SNMP
• Net-SNMP (Linux Text)
• SNMP Browser for KDE
The STM MIB structure is automatically downloaded by management stations. You should start receiving notifications after you have enabled SNMP on the STM and added its IP address into your MIB browsers.
Managing the Configuration File
The configuration settings of the STM are stored in a configuration file on the STM. This file can be saved (backed up) to a PC, retrieved (restored) from the PC, or cleared to factory default settings.
Once the STM is installed and works correctly, make a backup of the configuration file to a computer. If necessary, you can later restore the STM settings from this file.
The Backup and Restore Settings screen lets you:
• Back up and save a copy of the current settings
- Restore saved settings from the backed-up file
• Revert to the factory default settings.
To display the Backup and Restore Settings screen, select Administration > Backup and Restore Settings from the menu:

Figure 41.
Backing Up Settings
The backup feature saves all STM settings to a file. These settings include:
• Network settings. IP address, subnet mask, gateway, and so on.
- Scan settings. Services to scan, primary and secondary actions, and so on.
- Update settings. Update source, update frequency, and so on.
• Antispam settings. Whitelist, blacklist, content filtering settings, and so on.
Back up your STM settings periodically, and store the backup file in a safe place.
Tip: You can use a backup file to export all settings to another STM that has the same language and management software versions. Remember to change the IP address of the second STM before deploying it to eliminate IP address conflicts on the network.
To back up settings:
- On the Backup and Restore Settings screen (see the previous figure), next to Save a copy of current settings, click the Backup button to save a copy of your current settings. A dialog box displays, showing the file name of the backup file.
Note: The backup file has the following format: backup_\hostname_\productversion_\$yyyymmdd.gpg.
\$hostname: The host name of the STM that is configured on the Network Settings screen, for example, STM600. \$productversion: The software version of the STM, for example, 2.0.0-39. \$yyyymmdd: The time when the backup is performed, for example, 20100617.
Using these examples, the backup file name would be backup_STM600_2.0.0-39_20100617.gpg.
- Select Save file, and then click OK.
- Open the folder where you have saved the backup file, and then verify that it has been saved successfully.
Note the following:
- If your browser is not configured to save downloaded files automatically, locate the folder in which you want to save the file, specify the file name, and save the file.
- If you have your browser configured to save downloaded files automatically, the file is saved to your browser's download location on the hard disk.
Restoring Settings

WARNING!
Restore only settings that were backed up from the same software version. Restoring settings from a different software version can corrupt your backup file or the STM system software.
To restore settings from a backup file:
- On the Backup and Restore Settings screen (see Figure 41 on page 68), next to Restore save settings from file, click Browse.
- Locate and select the previously saved backup file.
- When you have located the file, click the Restore button. A warning screen might appear, and you might have to confirm that you want to restore the configuration.
The STM restarts. During the reboot process, the Backup and Restore Settings screen remains visible. The reboot process is complete after several minutes when the Test LED on the front panel goes off.

WARNING!
Once you start restoring settings, do not interrupt the process. Do not try to go online, turn off the STM, shut down the computer, or do anything else to the STM until the settings have been fully restored.
Reverting to Factory Default Settings
To reset the STM to the original factory default settings, click the Default button next to Revert to factory default settings on the Backup and Restore Settings screen (see Figure 41 on page 68).
The STM restarts. The Backup and Restore Settings screen remains visible during the reboot process. The reboot process is complete after several minutes when the Test LED (STM150) or Status LED (STM300 and STM600) on the front panel goes off.

WARNING!
When you restore the factory default settings, the STM settings are erased. All content settings and scan settings are lost. Back up your settings if you intend on using them.
Note: After rebooting with factory default settings, the STM administrator account password is password, the guest account password is guest, and the LAN IP address is 192.168.1.201.
Note: For the STM150 only, there is an alternate way to return the settings to factory defaults: Using a sharp object, press and hold the Reset button on the rear panel of the STM150 (see Rear Panel STM150 on page 20) for about 10 seconds until the front panel Test LED flashes and the STM150 returns to factory default settings.
Updating the Software
If you have used the Setup Wizard, you might have already configured the software update settings; the Software Update screen allows you to modify these settings.
The STM has four main software components:
- The application software that includes the network protocols, security services, Web Management Interface, and other components.
- A scan engine that enables the STM to scan emails, attachments, Web files, and applications, and that functions in conjunction with the pattern file.
• A pattern file that contains the virus signature files and virus database.
• An operating system (OS) that includes the kernel modules and hardware drives.
The STM provides two methods for updating components:
• Scheduled, automatic update
- Manual update
Because new virus threats can appear any hour of the day, it is very important to keep both the pattern file and scan engine firmware as current as possible. The STM can automatically check for updates, as often as every 15 minutes, to ensure that your network protection is current.
Scheduling Updates
Enabling scheduled updates ensures that the STM automatically downloads the latest components from the NETGEAR update server.
To configure scheduled updates:
- Select Administration > Software Update from the menu. The Software Update screen displays:
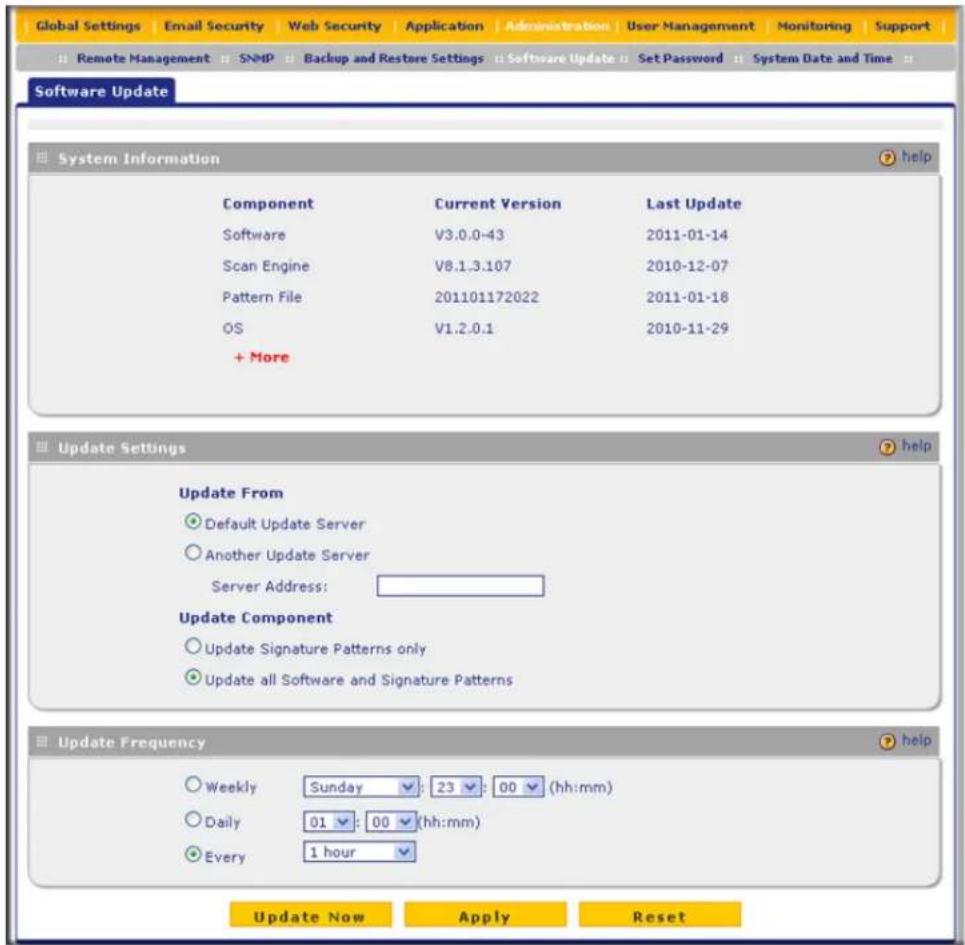
Figure 42.
- Select the radio buttons, complete the field, and make your selections from the drop-down lists as explained in the following table:
Table 21. Software Update Settings
| Setting Description | (or Subfield and Description) | |
| System Information | ||
| You cannot configure this section; it is shown for information only. For the software, scan engine, (signature) pattern file, and operating system (OS), the current version and the date of the last update are displayed.Click + More to display the versions and most recent downloads for the antispam engine, applications engine, applications pattern file, stream engine, stream pattern file, mini engine, mini pattern file, policyd, scand, urld, update client, and rescue software. | ||
| Update Settings | ||
| Update From Select | one of the following radio buttons:Default Update Server. The scan engine and signatures are updated from the NETGEAR default update server.Another Update Server. The scan engine and signatures are updated from a server that you specify by entering the server IP address or host name in the Server Address field. | |
| Server Address The update server IP address or host name. | ||
| Update Component | Make one of the following selections from the drop-down list:Update Signature Patterns only. Only the (signature) pattern file is updated. The software, scan engine, and OS are not updated.Update all Software and Signature Patterns. The software, scan engine, (signature) pattern file, and OS are updated. This is the default setting. | |
| Update Frequency | ||
| Make one of the following selections:Weekly. From the drop-down lists, specify the day, hour, and minutes that the update should occur.Daily. From the drop-down lists, specify the hour and minutes that the update should occur.Every. From the drop-down list, specify the frequency with which the update should occur. | ||
- Click Apply to save your settings.
Performing a Manual Update
If you want to immediately check for and download available updates, perform a manual update:
- Select Administration > Software Update from the menu. The Software Update screen displays (see the previous figure).
- At the bottom of the screen, click Update Now. The STM contacts the update server and checks for available updates. If updates are available, the Update Progress screen displays to show the progress of the update:

Figure 43.
- After the update has finished, click Apply to activate the newly updated software.
Critical Updates That Require a Restart
If a downloaded update requires a restart, you are prompted to perform the update when you log in to the STM. The following figure shows an example of a Critical Update screen, which provides information about the update and allows you to install it immediately or at sa later time. To install the update immediately, click Install Now. To install the update at a later time, click Later.

Figure 44.
Configuring Date and Time Service
If you have used the Setup Wizard, you might have already configured the system date and time settings; the System Date and Time screen allows you to modify these settings.
Configure date, time, and NTP server designations on the System Date and Time screen. Network Time Protocol (NTP) is a protocol that is used to synchronize computer clock times in a network of computers. Setting the correct system time and time zone ensures that the date and time recorded in the STM logs and reports are accurate. Changing the time zone requires the STM to restart to apply the updated settings.
To set time, date, and NTP servers:
- Select Administration > System Date and Time from the menu. The System Date and Time screen displays:

Figure 45.
The top of the screen displays the current weekday, date, time, time zone, and year (in the example in the previous figure: Current Time: 2009-08-02 00:19:30).
- Select the radio buttons, complete the fields, and make your selections from the drop-down list as explained in the following table:
Table 22. System Date and Time Settings
| Setting Description | (or Subfield and Description) | |
| System Date and TimeFrom the drop-down list, select an NTP server, or select to enter the time manually. | ||
| Use Default NTP Servers | The STM regularly updates its real-time clock (RTC), which it uses for scheduling, by contacting a default NETGEAR NTP server on the Internet. This is the default setting. | |
| Use Custom NTP Servers | The STM regularly updates its RTC by contacting one of the two NTP servers (primary and backup), both of which you need to specify in the fields that become available when you select this option.Note:If you select this option but leave either the Server 1 or Server 2 field blank, both fields are automatically set to the default NETGEAR NTP servers.Note:A list of public NTP servers is available at http://support.ntp.org/bin/view/Servers/WebHome. | |
| Server 1 Name / IP Address | Enter the IP address or host name the primary NTP server. | |
| Server 2 Name / IP Address | Enter the IP address or host name the secondary NTP server. | |
| Manually Enter the Date and Time | Date Enter the date in the yyyy-mm-dd (year-month-date) format. | |
| Time Enter the time in the hh-mm-ss (hour-minutes-seconds) format. | ||
| Time Zone | ||
| From the drop-down list, select the local time zone in which the STM operates. The correct time zone is required in order for scheduling to work correctly. You do not need to configure daylight savings time, which is applied automatically when applicable. GMT (Greenwich Mean Time) is the default setting.Note:When you select a time zone that is not associated with a location such as (GMT -08:00) GMT-8, daylight savings time is automatically disabled. When you select a time zone that is associated with a location such as (GMT -08:00) Pacific Time (US & Canada), daylight savings time is automatically enabled. | ||
- Click Apply to save your settings. Changing the time zone requires the STM to restart.
Note: If you select the default NTP servers or if you enter a custom server FQDN, the STM determines the IP address of the NTP server by performing a DNS lookup. You need to configure a DNS server address on the Network Settings screen (see Configuring Network Settings on page 52) before the STM can perform this lookup.
Managing Digital Certificates
The STM uses digital certificates (also known as X509 certificates) for secure Web access connections over HTTPS (that is, SSL VPN connections).
Digital certificates can be either self-signed or can be issued by Certification Authorities (CAs) such as an internal Windows server or an external organizations such as Verisign or Thawte. On the STM, the uploaded digital certificate is checked for validity and purpose. The digital certificate is accepted when it passes the validity test and the purpose matches its use.
The STM uses digital certificates to authenticate connecting HTTPS servers, and to allow HTTPS clients to be authenticated by remote entities. A digital certificate that authenticates a server, for example, is a file that contains the following elements:
• A public encryption key to be used by clients for encrypting messages to the server.
• Information identifying the operator of the server.
- A digital signature confirming the identity of the operator of the server. Ideally, the signature is from a trusted third party whose identity can be verified.
When a security alert is generated, the user can decide whether or not to trust the host.
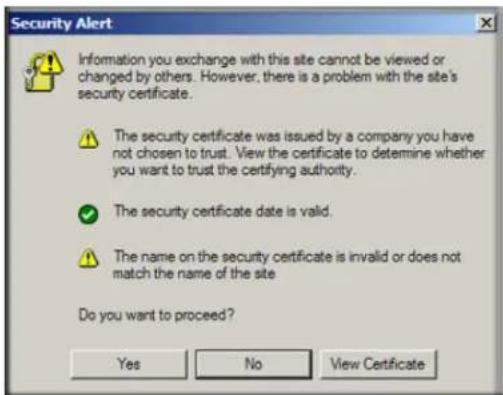
Figure 46.
You can obtain a digital certificate from a well-known commercial Certificate Authority (CA) such as Verisign or Thawte. Because a commercial CA takes steps to verify the identity of an applicant, a digital certificate from a commercial CA provides a strong assurance of the server's identity.
The STM contains a self-signed digital certificate from NETGEAR. This certificate can be downloaded from the STM login screen or from the Certificate Management screen for browser import. However, NETGEAR recommends that you replace this digital certificate with a digital certificate from a well-known commercial CA prior to deploying the STM in your network.
The STM's Certificate Management screen lets you to view the currently loaded digital certificate for HTTPS scans, upload a new digital certificate, manage the trusted CA authorities list, and manage the untrusted certificates list.
To display the Certificate Management screen, select Web Security > Certificate Management from the menu. Because of the size of this screen, and because of the way the information is presented, the Certificate Management screen is divided and presented in this manual in three figures (the following figure, Figure 48 on page 79, and Figure 49 on page 80).
Managing the Certificate for HTTPS Scans
To manage the STM's active certificate that is used for HTTPS scans, select Web Security > Certificate Management from the menu. The Certificate Management screen displays. The following figure shows only the Certificate Used for HTTPS Scans section of the screen:
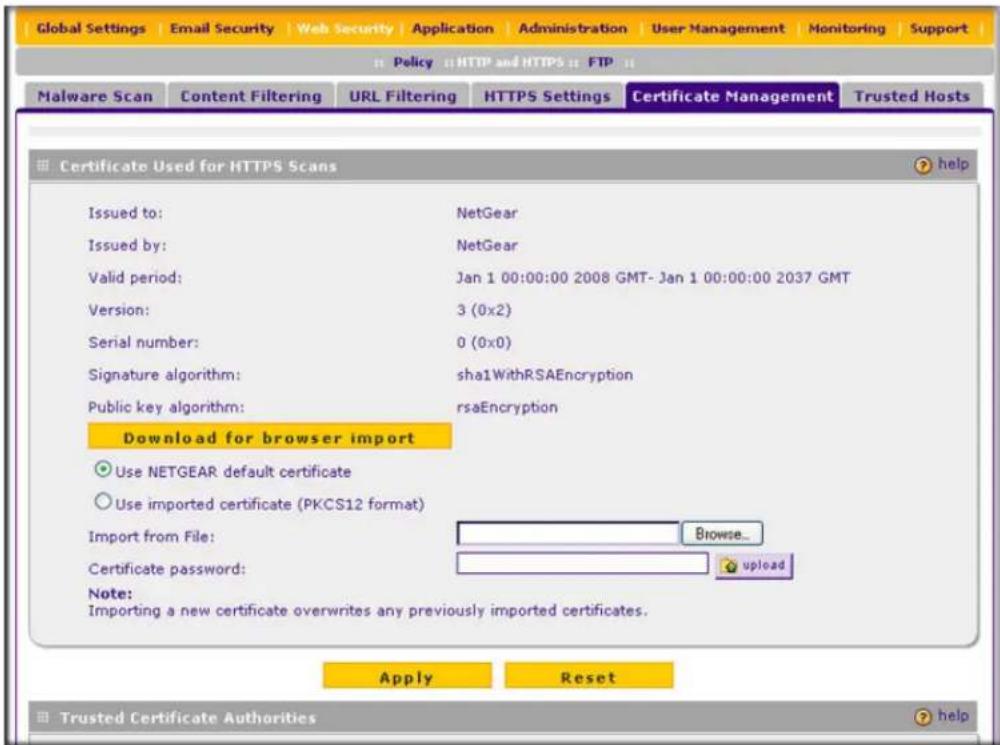
Figure 47. Certificate Management, screen 1 of 3
The top part of the Certificate Used for HTTPS Scans section displays information about the current certificate that is used for HTTPS scans.
Note: For information about the HTTPS scanning process, HTTPS Scan Settings on page 119.
To download the current certificate into your browser:
- Click Download for browser import.
- Follow the instructions of your browser to save the RootCA.crt file on your computer.
To reload the default NETGEAR certificate:
- Select the Use NETGEAR default certificate radio button.
- Click Apply to save your settings.
To import a new certificate:
- Select the Use imported certificate (PKCS12 format) radio button.
- Click Browse next to the Import from File field.
- Navigate to a trusted certificate file on your computer. Follow the instructions of your browser to place the certificate file in the Import from File field.
- If required, enter the appropriate password in the Certificate password field.
- Click the Upload button.
Note: If the certificate file is not in the pkcs12 format, the upload fails. Importing a new certificate overwrites any previously imported certificates.
- Click Apply to save your settings.
Managing Trusted Certificates
To manage trusted certificates:
Select Web Security > Certificate Management from the menu. The Certificate Management screen displays. The following figure shows only the Trusted Certificate Authorities section of the screen:
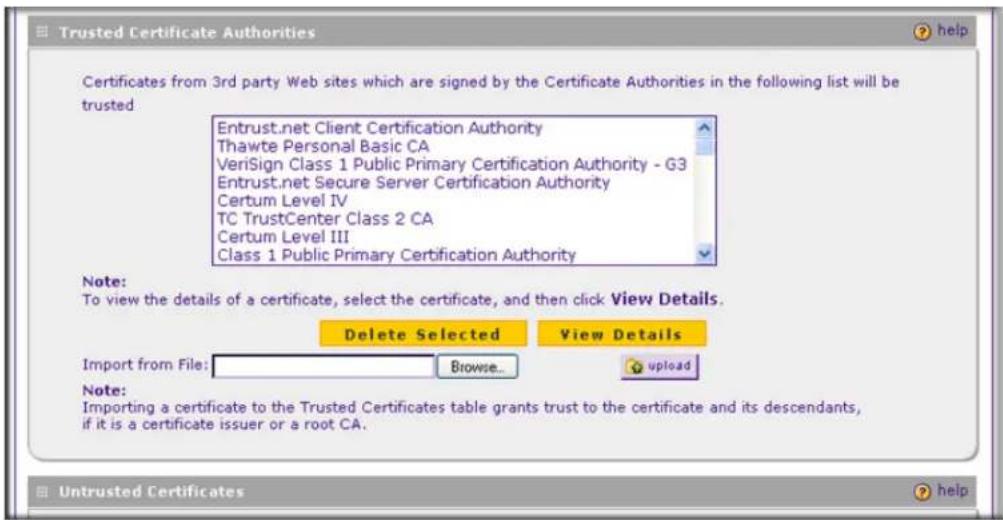
Figure 48. Certificate Management, screen 2 of 3
The Trusted Certificate Authorities table contains the trusted certificates from third-party websites that are signed by the Certificate Authorities.
To view details of a trusted certificate:
- From the Trusted Certificate Authorities table, select the certificate.
- Click View Details. A new screen opens that displays the details of the certificate.
To delete a trusted certificate:
- From the Trusted Certificate Authorities table, select the certificate.
- Click Delete Selected.
To import a trusted certificate:
- Click Browse next to the Import from File field.
- Navigate to a trusted certificate file on your computer. Follow the instructions of your browser to place the certificate file in the Import from File field.
- Click the Upload button. The newly imported trusted certificate is added to the Trusted Certificate Authorities table.
Managing Untrusted Certificates
To manage untrusted certificates:
Select Web Security > Certificate Management from the menu. The Certificate Management screen displays. The following figure shows only the Untrusted Certificates section of the screen:

Figure 49. Certificate Management, screen 3 of 3
When the STM detects an untrusted or invalid certificate, it automatically places the certificate in the Untrusted Certificates table.
To view details of an untrusted certificate:
- From the Untrusted Certificates table, select the certificate.
- Click View Details. A new screen opens that displays the details of the certificate.
To delete an untrusted certificate:
- From the Untrusted Certificates table, select the certificate.
- Click Delete Selected.
To move an untrusted certificate to the Trusted Certificate Authorities table:
- From the Untrusted Certificates table, select the certificate.
- Click Add to Trusted List. The previously untrusted certificate is added to the Trusted Certificate Authorities table.
Managing the Quarantine Settings
You can specify how much memory the STM reserves for quarantined items, and how long these items remain in memory. In general, the default settings work well for most situations.
To change the quarantine settings:
- Select Global Settings > Quarantine from the menu. The Quarantine screen displays:

Figure 50.
- Select the radio buttons, complete the field, and make your selections from the drop-down lists as explained in the following table:
Table 23. Quarantine Settings
| Setting Description (or Subfield and Description) | |
| Malware Quarantine Area Size | Specify the maximum amount of memory in MB that is allocated to malware quarantine. This limit is cumulative for all users.For the STM600, the default setting is 200 MB, and the maximum setting is 512 MB.For the STM150 and STM300, the default setting is 100 MB, and the maximum setting is 512 MB.Note: After the limit has been exceeded, old items are automatically purged from the malware quarantine to make space for new items. |
| Spam Quarantine Area Size | Specify the maximum amount of memory in MB that is allocated to spam quarantine. This limit is cumulative for all users.For the STM600, the default setting is 1024 MB, and the maximum setting is 2048 MB.For the STM150 and STM300, the default setting is 512 MB, and the maximum setting is 1024 MB.Note: After the limit has been exceeded, old items are automatically purged from the malware quarantine to make space for new items. |
| Quarantine Lifetime Specify how | long items remain in quarantine before being automatically purged. The default setting is 15 days. The maximum setting is 30 days. |
- Click Apply to save your settings.
Note: For information about how to view and manage the quarantine files, see Viewing and Managing the Quarantine Files on page 208.
Managing the STM's Performance
Performance management consists of controlling the traffic through the STM so that the necessary traffic gets through when there is a bottleneck and either reducing unnecessary traffic or rescheduling some traffic to low-peak times to prevent bottlenecks from occurring in the first place.
If you want to reduce traffic by preventing unwanted emails from reaching their destinations or by preventing access to certain sites on the Internet, you can use the STM's content filtering feature. By default, this feature is disabled; all requested traffic from any website is allowed with the exception of Web content categories that are mentioned in Default Email and Web Scan Settings on page 85.
You can adjust the following features of the STM in such a way that the traffic load on the WAN side decreases.
- Email content filtering. To reduce incoming email traffic, you can block emails with large attachments, reject emails based on keywords, file extensions, or file names, and set spam protection rules. There are several ways you can reduce unwanted email traffic:
- Setting the size of email files to be scanned. Scanning large email files requires network resources and might slow down traffic. You can specify the maximum file or message size that is scanned, and whether files that exceed the maximum size are skipped (which might compromise security) or blocked. For more information, see Exception Settings on page 90.
- Keyword, file extension, and file name blocking. You can reject emails based on keywords in the subject line, file type of the attachment, and file name of the attachment. For more information, see Email Content Filtering on page 94.
- Protecting against spam. Set up spam protection to prevent spam from using up valuable bandwidth. For more information, see Protecting Against Email Spam on page 97.
- Web content filtering. The STM provides extensive methods to filter Web content in order to reduce traffic:
- Web category blocking. You can block entire Web categories because their content is unwanted, offensive, or not relevant, or simply to reduce traffic. For more information, see Configuring Web Content Filtering on page 109.
- File extension blocking. You can block files based on their extension. Such files can include executable files, audio and video files, and compressed files. For more information, see Configuring Web Content Filtering on page 109.
- URL blocking. You can specify URLs that are blocked by the STM. For more information, see Configuring Web URL Filtering on page 116.
- Web services blocking. You can block Web applications such as instant messaging, media, peer-to-peer, and tools. For more information, see Configuring Application Control on page 127.
- Web object blocking. You can block the following Web component types: embedded objects (ActiveX, Java, Flash), proxies, and cookies; and you can disable Java scripts. For more information, see Configuring Web Content Filtering on page 109.
- Setting the size of Web files to be scanned. Scanning large Web files requires network resources and might slow down traffic. You can specify the maximum file size that is scanned, and whether files that exceed the maximum size are skipped (which might compromise security) or blocked. For more information, see Configuring Web Malware Scans on page 107.
For these features (with the exception of Web object blocking and setting the size of files to be scanned), you can set schedules to specify when Web content is filtered (see Configuring Web Content Filtering on page 109) and configure scanning exclusions and access exceptions (see Setting Scanning Exclusions and Web Access Exceptions on page 130). You can use the STM's monitoring functions to assist you with performance management (see Monitoring Real-Time Traffic, Security, Statistics, and Web Usage on page 184).
Content Filtering and Optimizing Scans
4
This chapter describes how to apply the content filtering features of the STM and how to optimize scans to protect your network. This chapter contains the following sections:
• About Content Filtering and Scans on this page
- Configuring Email Protection on page 87
- Configuring Web and Services Protection on page 105
- Configuring Application Control on page 127
• Setting Scanning Exclusions and Web Access Exceptions on page 130
About Content Filtering and Scans
The STM provides very extensive Web content and email content filtering options, Web browsing activity reporting, email antivirus and antispam options, and instant alerts via email. You can establish restricted Web access policies that are based on the time of day, Web addresses, and Web address keywords. You can also block Internet access by applications and services, such as instant messaging and peer-to-peer file sharing clients.
Note: For information about how to monitor blocked content and malware threats in realtime, see Monitoring Real-Time Traffic, Security, Statistics, and Web Usage on page 184. For information about how to view blocked content and malware threats in the logs, see Querying Logs on page 194. For information about how to view quarantined content, see Viewing and Managing the Quarantine Files on page 208.
Default Email and Web Scan Settings
For most network environments, the default scan settings and actions that are shown in the following table work well, but you can adjust these to meet the needs of your specific environment.
Table 24. Default Email and Web Scan Settings
| Scan Type Default Scan Setting Default Action (if applicable) | ||
| Email Server Protocols | ||
| SMTP Enabled Block infected email | ||
| POP3 Enabled Delete attachment if infected | ||
| IMAP Enabled Delete attachment if infected | ||
| Web Server Protocolsa | ||
| HTTP Enabled Delete file if malware threat detected | ||
| HTTPS Disabled No action (scan disabled) | ||
| FTP Enabled Delete file if malware threat detected | ||
| Instant Messaging Services | ||
| Google Talk Allowed | ||
| ICQ Allowed | ||
| mIRC Allowed | ||
| MSN Messenger | Allowed | |
| Allowed | ||
| Yahoo Messenger | Allowed | |
| Media Applications | ||
| iTunes (music store, update) | Allowed | |
| Quicktime (update) | Allowed | |
| Real Player (guide) | Allowed | |
| Rhapsody (guide, music store) | Allowed | |
| Winamp (Internet radio/TV) | Allowed | |
| Peer-to-Peer (P2P) Services | ||
| BitTorrent | Allowed | |
| eDonkey | Allowed | |
| Gnutella | Allowed | |
| Scan Type | Default Scan Setting | Default Action (if applicable) |
| Tools | ||
| Alexa Toolbar Allowed | ||
| GoToMyPC Allowed | ||
| Weatherbug Allowed | ||
| Yahoo Toolbar Allowed | ||
| Web Objects | ||
| Embedded Objects (ActiveX/Java/Flash) Allowed | ||
| Javascript Allowed | ||
| Proxy Allowed | ||
| Cookies Allowed | ||
| Web Content Categories | ||
| Commerce Allowed | ||
| Drugs and Violence Blocked | ||
| Education Allowed with the | exception of School Cheating | |
| Gaming | Blocked | |
| Inactive Sites Allowed | ||
| Internet Communication and Search | Allowed with the exception of Anonymizers | |
| Leisure and News | Allowed | |
| Malicious | Blocked | |
| Politics and Religion | Allowed | |
| Sexual Content | Blocked | |
| Technology | Allowed | |
| Uncategorized | Allowed | |
a. For the STM300 and STM600, files and messages that are larger than 10240 KB are skipped by default. For the STM150, files and messages that are larger than 8192 KB are skipped by default.
Configuring Email Protection
The STM lets you configure the following settings to protect the network's email communication:
• The email protocols that are scanned for malware threats
• Actions that are taken when infected emails are detected
• The maximum file sizes that are scanned
- Keywords, file types, and file names in emails that are filtered to block objectionable or high-risk content
- Customer notifications and email alerts that are sent when events are detected
• Rules and policies for spam detection
Customizing Email Protocol Scan Settings
If you have used the Setup Wizard, you might have already configured the email policies; the (email) Policy screen allows you to modify these settings.
To configure the email protocols and ports to scan:
- Select Email Security > Policy from the menu. The (email) Policy screen displays:

Figure 51.
- Select the check boxes and complete the fields and as explained in the following table:
Table 25. Email Policy Settings
| Setting Description | |
| Services to Scan | |
| SMTP | Select the SMTP check box to enable Simple Mail Transfer Protocol (SMTP) scanning. This service is enabled by default and uses default port 25. |
| POP3 | Select the POP3 check box to enable Post Office Protocol 3 (POP3). This service is enabled by default and uses default port 110. |
| IMAP | Select the IMAP check box to enable Internet Message Access Protocol (IMAP). This service is enabled by default and uses default port 143. |
Note: If a protocol uses a port other than the standard service port (for example, port 25 for SMTP), enter this nonstandard port in the Ports to Scan field. For example, if the SMTP service on your network uses both port 25 and port 2525, enter both port numbers in the Ports to Scan field and separate them by a comma.
Note: The following protocols are not supported by the STM: SMTP over SSL using port number 465, POP3 over SSL using port number 995, and IMAP over SSL using port number 993.
- Click Apply to save your settings.
Customizing Email Anti-Virus Settings
If you have used the Setup Wizard, you might have already configured the email antivirus action and exception settings; the Action and Exception screens allows you to modify these settings. The Notification screen allows you to specify the email antivirus notification settings.
Whether or not the STM detects an email virus, you can configure it to take a variety of actions (some of the default actions are listed in Table 24 on page 85), set exceptions for file sizes, and specify which notifications, emails, or both need to be sent to the end users.
Action Settings
To configure the email antivirus action settings:
- Select Email Security > Anti-Virus from the menu. The Anti-Virus submenu tabs display with the Action screen in view:
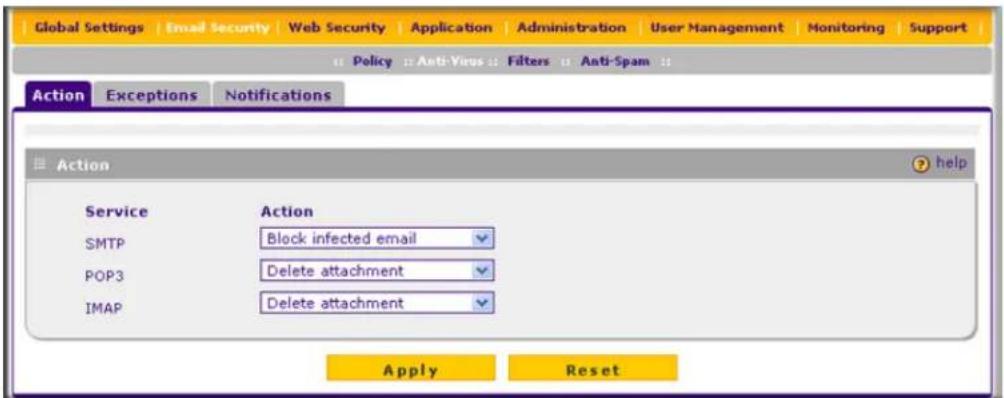
Figure 52.
- Make your selections from the drop-down lists as explained in the following table:
Table 26. Email Anti-Virus Action Settings
| Setting Description | |
| Action | |
| SMTP From the | SMTP drop-down list, specify one of the following actions to be taken when an infected email is detected:Quarantine attachment. The email is not blocked, but the attachment is removed and placed in the malware quarantine for further research. In addition, a malware quarantine log entry is created, and depending on the nature of the malware threat, also a virus log entry or a spyware log entry.Delete attachment. The email is not blocked, but the attachment is deleted, and a virus log entry or a spyware log entry is created.Block infected email. This is the default setting. The email is blocked, and a virus log entry or a spyware log entry is created.Quarantine infected email. The email is placed in the malware quarantine for further research. In addition, a malware quarantine log entry is created, and depending on the nature of the malware threat, also a virus log entry or a spyware log entry.Log only. Only a virus log entry or a spyware log entry is created. The email is not blocked and the attachment is not deleted. |
| Setting Description | |
| POP3 From the | POP3 drop-down list, specify one of the following actions to be taken when an infected email is detected:Quarantine attachment. The email is not blocked, but the attachment is removed and placed in the malware quarantine for further research. In addition, a malware quarantine log entry is created, and depending on the nature of the malware threat, also a virus log entry or a spyware log entry.Delete attachment. This is the default setting. The email is not blocked, but the attachment is deleted, and a virus log entry or a spyware log entry is created.Log only. Only a virus log entry or a spyware log entry is created. The email is not blocked and the attachment is not deleted. |
| IMAP From the | MAP drop-down list, specify one of the following actions to be taken when an infected email is detected:Quarantine attachment. The email is not blocked, but the attachment is removed and placed in the malware quarantine for further research. In addition, a malware quarantine log entry is created, and depending on the nature of the malware threat, also a virus log entry or a spyware log entry.Delete attachment. This is the default setting. The email is not blocked, but the attachment is deleted,and a virus log entry or a spyware log entry is created.Log only. Only a virus log entry or a spyware log entry is created. The email is not blocked and the attachment is not deleted. |
- Click Apply to save your settings.
Exception Settings
To configure the email antivirus exception settings:
- Select Email Security > Anti-Virus from the menu. The Anti-Virus submenu tabs display with the Action screen in view.
- Click the Exceptions submenu tab. The Exceptions screen displays:

Figure 53.
- Make your selection from the drop-down list and complete the field as explained in the following table:
Table 27. Email Anti-Virus Exception Settings
| Setting Description | |
| Scan Exceptions | |
| From the drop-down list, specify one of the following actions to be taken when an email attachment exceeds the size that you specify in the file size field:Skip. The file is not scanned but skipped, leaving the end user vulnerable. This is the default setting.Block. The file is blocked and does not reach the end user.The default and maximum file sizes are:For the STM600 and STM300, the default setting is to block any attachment larger than 10240 KB. The maximum file size that you can specify is 51200 KB.For the STM150, the default setting is to block any attachment larger than 8192 KB. The maximum file size that you can specify is 25600 KB. | |
Note: Setting the maximum file size to a high value might affect the STM's performance. NETGEAR recommends the default value, which is sufficient to detect the vast majority of threats.
- Click Apply to save your settings.
Notification Settings
To configure the email antivirus notification settings:
- Select Email Security > Anti-Virus from the menu. The Anti-Virus submenu tabs display with the Action screen in view.
- Click the Notifications submenu tab. The Notifications screen displays:
![Global Settings | Email Security | Web Security | Application | Administration | User Management | Monitoring | Support | Policy Anti-Time Filters Anti-Spam Action Exceptions Notifications Notification Settings Insert Warning into Email Subject (SMTP) Malware Found: [MALWARE INFECTED] No Malware Fou…](/content/2026/05/1028692/images/9a9e7b53e5d33aa15a0f199ab80108bb6449e6ec2af7dc851e1c29ba32eccb7d.jpg)
Figure 54.
- Complete the fields, select the check boxes, and make your selections from the drop-down lists as explained in the following table:
Table 28. Email Anti-Virus Notification Settings
| Setting Description | |
| Notification Settings | |
| Insert Warning into Email Subject (SMTP) | For SMTP email messages, select this check box to insert a warning into the email subject line:Malware Found. If a malware threat is found, a [MALWARE INFECTED] message is inserted. You can change this default message.No Malware Found. If no malware threat is found, a [MALWARE FREE] message is inserted. You can change this default message.By default, this check box is cleared and no warnings are inserted. |
| Append Safe Stamp (SMTP and POP3) | For SMTP and POP3 email messages, select this check box to insert a default safe stamp message at the end of an email. The safe stamp insertion serves as a security confirmation to the end user. You can change the default message. By default, this check box is cleared and no safe stamp is inserted. |
| Append Warning if Attachment Exceeds Scan Size Limit (SMTP and POP3) | For SMTP and POP3 email messages, select this check box to append a default warning message to an email if the message or an attachment to the message exceeds the scan size limit. The warning message informs the end user that the attachment was skipped and might not be safe to open. You can change the default message. By default, this check box is selected and a warning message is appended to the email. |
| Replace Infected Attachments with the Following Warning Message | Select this check box to replace an email that is infected with a default warning message. The warning message informs the end user about the name of the malware threat. You can change the default message to include the action that the STM has taken (see the following example). By default, this check box is selected, and a warning message replaces an infected email.The following is a sample message where the %VIRUSINFO% metaword is replaced with the EICAR test virus:This attachment contains malware: File 1.exe contains malware EICAR.Action: Delete.Note: Make sure that you keep the %VIRUSINFO% metaword in a message to enable the STM to insert the correct malware threat information. |
| Email Alert SettingsNote: Ensure that the email notification server (see Configuring the Email Notification Server on page 176) is configured before you specify the email alert settings. | |
| Send alert to In addition | to inserting a warning message to replace an infected email, you can configure the STM to send a notification email to the sender, the recipient, or both by selecting the corresponding check box or check boxes. By default, both check boxes are cleared and no notification email is sent. |
| Subject The default subject line for the notification email is “Malware detected!” You can change this subject line. | |
| Message The warning message informs the sender, the recipient, or both about the name of the malware threat. You can change the default message to include more information.Make sure that you keep the %VIRUSINFO% metaword in a message to enable the STM to insert the correct malware threat information. In addition to the %VIRUSINFO% metaword, you can insert the following metawords in your customized message: %TIME%, %PROTOCOL%, %FROM%, %TO%, %SUBJECT%, %FILENAME%, %ACTION%, %VIRUSNAME%. | |
4. Click Apply to save your settings.
Email Content Filtering
The STM provides several options to filter unwanted content from emails. You can filter content from emails based on keywords in the subject line, file type of the attachment, and file name of the attachment. You can also set an action to perform on emails with password-protected attachments.
Several types of email blocking are available:
- Keyword blocking. You can specify words that, should they appear in the email subject line, cause that email to be blocked by the STM.
- Password-protected attachments. You can block emails based on password-protected attachments such as .zip or .rar attachments.
- File extension blocking. You can block emails based on the extensions of attached files. Such files can include executable files, audio and video files, and compressed files.
- File name blocking. You can block emails based on the names of attached files. Such names can include, for example, names of known malware threats such as the Netsky worm (which normally arrives as netsky.exe).
To configure email content filtering:
1. Select Email Security > Filters from the menu. The Filters screen displays:

Figure 55.
- Complete the fields and make your selections from the drop-down lists as explained in the following table:
Table 29. Email Filter Settings
| Setting Description | or Subfield and Description) | ||
| Filter by Subject Keywords | |||
| Keywords Enter | keywords that are detected in the email subject line. Use commas to separate different keywords. The total maximum length of this field is 2048 characters, excluding duplicate words and delimiter commas. | ||
| Action SMTP From the S | MTP drop-down list, specify one of the following actions to be taken when a keyword that is defined in the Keywords field is detected:Block email & Log. The email is blocked, and a log entry is created.Log. This is the default setting. Only a log entry is created. The email is not blocked. | ||
| POP3 From the POP3 drop-down list, specify one of the following actions to be taken when a keyword that is defined in the Keywords field is detected:Block email & Log. The email is blocked, and a log entry is created.Log. This is the default setting. Only a log entry is created. The email is not blocked. | |||
| Filter by Password-Protected Attachments (ZIP, RAR, etc.) | |||
| Action SMTP From the S | MTP drop-down list, specify one of the following actions to be taken when a password-protected attachment to an email is detected:Block attachment & Log. The email is not blocked, the attachment is blocked, and a log entry is created.Block email & Log. The email is blocked, and a log entry is created.Log. This is the default setting. Only a log entry is created. The email and attachment are not blocked. | ||
| POP3 From the POP3 drop-down list, specify one of the following actions to be taken when a password-protected attachment to an email is detected:Block attachment & Log. The email is not blocked, the attachment is blocked, and a log entry is created.Log. This is the default setting. Only a log entry is created. The email and attachment are not blocked. | |||
| IMAP From the IMAP drop-down list, specify one of the following actions to be taken when a password-protected attachment to an email is detected:Block attachment & Log. The email is not blocked, the attachment is blocked, and a log entry is created.Log. This is the default setting. Only a log entry is created. The email and attachment are not blocked.Setting Descriptionoption (or Subfield and Description) | |||
| Filter by File Type | |||
| File Extension | By default, the File Extension field lists the most common file extensions that are detected. You can manually add or delete extensions. Use commas to separate different extensions. You can enter a maximum of 40 file extensions; the maximum total length of this field, excluding the delimiter commas, is 160 characters.You can also use the drop-down list to add predefined file extensions from a specific category to the File Extension field:None. No file extensions are added to the File Extension field. This is the default setting.Executables. Executable file extensions (exe, com, dll, so, lib, scr, bat, and cmd) are added to the File Extension field.Audio/Video. Audio and video file extensions (wav, mp3, avi, rm, rmvb, wma, wmv, mpg, mp4, and aac) are added to the File Extension field.Compressed Files. Compressed file extensions (zip, rar, gz, tar, and bz2) added to the File Extension field. | ||
| Action SMTP From the d | drop-down list, specify an action when an email attachment with a file extension that is defined in the File Extension field is detected. The drop-down list selections and defaults are the same as the ones for the Filter by Password-Protected Attachments (ZIP, RAR, etc.) section earlier in this table. | ||
| POP3 | |||
| IMAP | |||
| Filter by File Name | |||
| File Name Enter the file names that are detected. For example, to block the Netsky worm (which normally arrives as netsky.exe), enter netsky.exe. You can enter a maximum of 20 file names. Use commas to separate multiple file names. The maximum total length of this field is 400 characters, excluding the delimiter commas. | |||
| Action SMTP From the d | drop-down list, specify an action when an email attachment with a name that is defined in the File Name field is detected. The drop-down list selections and defaults are the same as the ones for the Filter by Password-Protected Attachments (ZIP, RAR, etc.) section earlier in this table. | ||
| POP3 | |||
| IMAP | |||
3. Click Apply to save your settings.
Protecting Against Email Spam
The STM integrates multiple antispam technologies to provide comprehensive protection against unwanted email. You can enable all or a combination of these antispam technologies. The STM implements these spam prevention technologies in the following order:
- Whitelist. Emails from the specified sources or to the specified recipients are not considered spam and are accepted.
- Blacklist. Emails from the specified sources are considered spam and are blocked.
- Real-time blacklist. Emails from known spam sources that are collected by blacklist providers are blocked.
- Distributed spam analysis. Emails that are detected as spam by the NETGEAR Spam Classification Center are either tagged, blocked, or quarantined.
This order of implementation ensures the optimum balance between spam prevention and system performance. For example, if an email originates from a whitelisted source, the STM delivers the email immediately to its destination inbox without implementing the other spam prevention technologies, thereby speeding up mail delivery and conserving the STM system resources. However, regardless of whether or not an email is whitelisted, it is still scanned by the STM's antimalware engines.
You can configure these antispam options in conjunction with content filtering to optimize blocking of unwanted mails.
Note: Emails that are sent through the STM over an authenticated connection between a client and an SMTP mail server are not checked for spam.
Note: An email that has been checked for spam by the STM contains an "X-STM-SMTP" (for SMTP emails) or "X-STM-POP3" (for POP-3 emails) tag in its header.
Setting Up the Whitelist and Blacklist
You can specify emails that are accepted or blocked based on the originating IP address, domain, and email address by setting up the whitelist and blacklist. You can also specify emails that are accepted based on the destination domain and email address.
The whitelist ensures that email from listed (that is, trusted) sources and recipients is not mistakenly tagged as spam. Emails going to and from these sources and recipients are delivered to their destinations immediately, without being scanned by the antispam engines. This can help to speed up the system and network performance. The blacklist, on the other hand, lists sources from which all email messages are blocked. You can enter up to 200 entries per list, separated by commas.
Note: The whitelist takes precedence over the blacklist, which means that if an email source is on both the blacklist and the whitelist, the email is not scanned by the antispam engines.
To configure the whitelist and blacklist:
- Select Email Security > Anti-Spam from the menu. The Anti-Spam submenu tabs display, with the Whitelist/Blacklist screen in view:
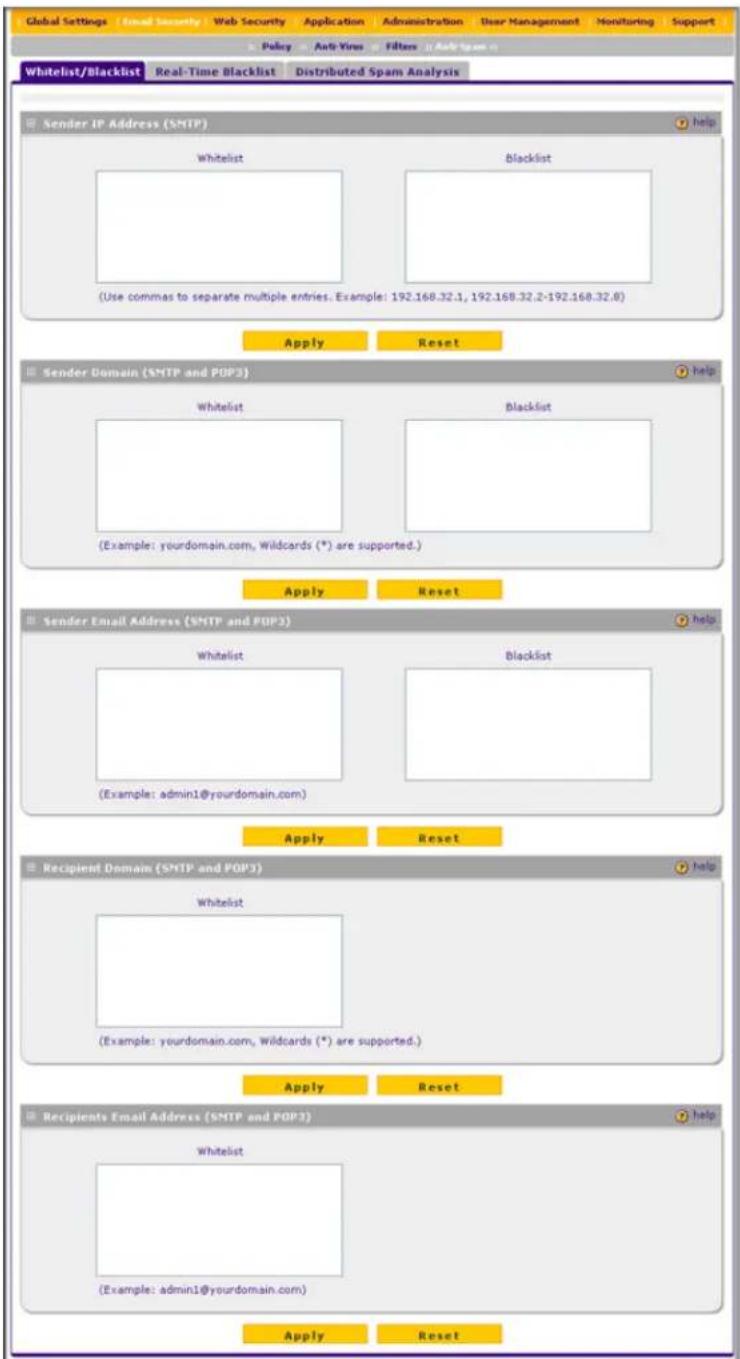
Figure 56.
- Complete the fields as explained in the following table:
Table 30. Whitelist/Blacklist Settings
| Setting Description | |
| Sender IP Address (SMTP) | |
| Whitelist Enter the source IP addresses from which emails can be trusted. | |
| Blacklist Enter the source IP addresses from which emails are blocked. | |
| Click Apply to save your settings, or click Reset to clear all entries from these fields. | |
| Sender Domain (SMTP and POP3) | |
| Whitelist Enter the sender email domains from which emails can be trusted. | |
| Blacklist Enter the sender email domains from which emails are blocked. | |
| Click Apply to save your settings, or click Reset to clear all entries from these fields. | |
| Sender Email Address (SMTP and POP3) | |
| Whitelist Enter the email addresses from which emails can be trusted. | |
| Blacklist Enter the email addresses from which emails are blocked. | |
| Click Apply to save your settings, or click Reset to clear all entries from these fields. | |
| Recipients Domain (SMTP and POP3) | |
| Whitelist Enter the email domains of the recipients to which emails can be safely delivered. | |
| Click Apply to save your settings, or click Reset to clear all entries from this field. | |
| Recipients Email Address (SMTP and POP3) | |
| Whitelist Enter the email addresses of the recipients to which emails can be safely delivered. | |
| Click Apply to save your settings, or click Reset to clear all entries from this field. | |
Note: In the fields of the Whitelist/Blacklist screen, use commas to separate multiple entries. For IP addresses, use a hyphen to indicate a range (for example, 192.168.32.2-192.168.32.8.)
Configuring the Real-Time Blacklist
Blacklist providers are organizations that collect IP addresses of verified open SMTP relays that might be used by spammers as media for sending spam. These known spam relays are compiled by blacklist providers and are made available to the public in the form of real-time blacklists (RBLs). By accessing these RBLs, the STM can block spam originating from known spam sources.
Note: By default, the STM comes with two pre-defined blacklist providers: Spamhaus, and Spamcop. You can add a maximum of 16 blacklist providers to the RBL sources.
To enable the real-time blacklist:
- Select Email Security > Anti-Spam from the menu. The Anti-Spam submenu tabs display, with the Whitelist/Blacklist screen in view.
- Click the Real-Time Blacklist submenu tab. The Real-Time Blacklist screen displays:

Figure 57.
- Select the Enable check box to enable the Real-Time Blacklist function.
- Select the Active check boxes to the left of the default blacklist providers (Spamhaus and Spamcop) that you want to activate. A Terms of Service popup window displays.
- Read the terms of service in the Terms of Service field. If you agree with these terms, click OK.
- Click Apply to save your settings.
To add a blacklist provider to the real-time blacklist:
- In the Add Real-time Blacklist section, add the following information:
• In the Provider field, add the name of the blacklist provider.
• In the RBL Domain Suffix field, enter the domain suffix of the blacklist provider.
- Click the Add table button in the Add column. The new blacklist provider is added to the Real-Time Blacklist (SMTP) table, and it is disabled by default.
To delete a blacklist provider from the real-time blacklist, click the Delete table button next to the blacklist provider that you want to delete.
Configuring Distributed Spam Analysis
Spam, phishing, and other email-borne threats consist of millions of messages intentionally composed differently to evade commonly used filters. Nonetheless, all messages within the same outbreak share at least one unique, identifiable value that can be used to distinguish the outbreak.
With distributed spam analysis, message patterns are extracted from the message envelope, headers, and body with no reference to the content itself. Pattern analysis can then be applied to identify outbreaks in any language, message format, or encoding type. Message patterns can be divided into distribution patterns and structure patterns. The STM uses distribution patterns to determine if the message is legitimate or a potential threat by analyzing the way it is distributed to the recipients. The STM uses structure patterns to determine the volume of the distribution.
The STM uses a distributed spam analysis architecture to determine whether or not an email is spam for SMTP and POP3 emails. Any email that is identified as spam is tagged as spam (an option for both SMTP and POP3), blocked, or quarantined (the latter two are options possible only for SMTP).
Note: Unlike other scans, you do not need to configure the spam score because the NETGEAR Spam Classification Center performs the scoring automatically as long as the STM is connected to the Internet. However, this does mean that the STM needs to be connected to the Internet for the spam analysis to be performed correctly.
To configure distributed spam analysis and the antispam engine settings:
- Select Email Security > Anti-Spam from the menu. The Anti-Spam submenu tabs display, with the Whitelist/Blacklist screen in view.
- Click the Distributed Spam Analysis submenu tab. The Distributed Spam Analysis screen displays:

Figure 58.
- Complete the fields, select the check boxes, and make your selections from the drop-down lists as explained in the following table:
Table 31. Distributed Spam Analysis Settings
| Setting Description | ion (or Subfield and Description) | |
| Distributed Spam Analysis | ||
| SMTP Select the | SMTP check box to enable distributed spam analysis for the SMTP protocol.(You can enable distributed spam analysis for both SMTP and POP3.) | |
| POP3 Select the | POP3 check box to enable distributed spam analysis for the POP3 protocol.(You can enable distributed spam analysis for both SMTP and POP3.) | |
| Setting Description | on (or Subfield and Description) | |
| Action SMTP From | the SMTP drop-down | list, select the action that is taken when spam is detected by the antispam engine:Tag spam email. This is the default setting. The email is tagged as spam, and a spam log entry is created.Block spam email. The email is blocked, and a spam log entry is created.Quarantine spam email. The email is quarantined, a spam log entry is created, and a spam quarantine log entry is created. |
| POP3 The only option is to tag spam email. A spam log entry is also created. | ||
| Tag Add tag to mail subject When you select the Tag spam email option from the Action drop-down list (see earlier in this table), select this check box to add a tag to the email subject line. The default tag is [SPAM], but you can customize this tag. The default setting is to add the default tag to the subject line. | ||
| Send Quarantine Spam ReportNote: Ensure that the email notification server (see Configuring the Email Notification Server on page 176) is configured before you specify the quarantine spam report settings. | ||
| Enable Select this | check box to enable the STM to send a quarantine spam report to the recipient that you have specified on the Email Notification Server screen (see Configuring the Email Notification Server on page 176). | |
| Select one of the following radio buttons to specify the frequency with which the report is sent:Weekly. Reports are sent weekly at the day and time that you specify from the drop-down lists (weekday, hours, and minutes).Daily. Reports are sent daily at the time that you specify from the drop-down lists (hours and minutes). | ||
| Setting Description | or Subfield and Description) | |
| Set Public Host/IP Address and Port | The management port of the STM usually has a LAN IP address assigned, preventing users from outside the LAN from accessing the STM to look at their quarantined spam email. Select this check box to enable users from outside the LAN to access their quarantined spam email. Complete the Host/IP fields.Note:If you use a firewall, you need to map the public IP address and public port to the LAN IP address of the STM's management port.Note:When you select the Set Public Host/IP Address and Port check box, the spam reports (seeUser-Generated Spam Reportson page 214) display an External Link column with hyperlinks that are consistent with the IP address and port that you specify in the Host/IP field. | |
| Host/IP Enter the public | IP address and public port of the STM. | |
- Click Apply to save your settings. The Distributed Spam Analysis section and the Send Quarantine Spam Report section each have their own Apply and Reset buttons to enable you to make changes to these sections separately.
Configuring Web and Services Protection
The STM lets you configure the following settings to protect the network's Internet communication:
• The Web protocols that are scanned for malware threats
• Actions that are taken when infected Web files or objects are detected
• The maximum file sizes that are scanned
• Web objects that are blocked
- Web categories, keywords, and file types that are filtered to block objectionable or high-risk content
- Domains and URLs that are blocked for objectionable or high-risk content
- Customer notifications and email alerts that are sent when events are detected
- Schedules that determine when content filtering is active
Customizing Web Protocol Scan Settings
If you have used the Setup Wizard, you might have already configured the Web protocol scan settings; the (Web) Policy screen allows you to modify these settings.
Scanning all protocols enhances network security, but might affect the performance of the STM. For an optimum balance between security and performance, enable scanning only of the most commonly used protocols on your network. For example, you can scan FTP and HTTP, but not HTTPS (if this last protocol is not often used). For more information about performance, see Managing the STM's Performance on page 82.
To specify the Web protocols and ports that are scanned for malware threats.
- Select Web Security > Polices from the menu. The (Web) Policy screen displays:

Figure 59.
- Select the check boxes and complete the fields and as explained in the following table:
Table 32. Web Policy Settings
| Setting Description | |
| Services to Scan | |
| HTTP | Select the HTTP check box to enable Hypertext Transfer Protocol (HTTP) scanning. This service is enabled by default and uses default port 80. You can change the standard service port or add another port in the corresponding Ports to Scan field. |
| HTTPS | Select the HTTPS check box to enable Hypertext Transfer Protocol over Secure Socket Layer (HTTPS). This service is disabled by default. The HTTPS default port is 443. You can change the standard service port or add another port in the corresponding Ports to Scan field. |
| FTP | Select the FTP check box to enable File Transfer Protocol (FTP). This service is enabled by default and uses default port 21. You can change the standard service port or add another port in the corresponding Ports to Scan field. |
Note: If a protocol uses a port other than the standard service port (for example, port 80 for HTTP), enter this nonstandard port in the Ports to Scan field. For example, if the HTTP service on your network uses both port 80 and port 8080, enter both port numbers in the Ports to Scan field, and separate them by a comma.
- Click Apply to save your settings.
Configuring Web Malware Scans
If you have used the Setup Wizard, you might have already configured the Web malware action and exception scan settings; the Malware Scan screen allows you to modify these settings.
Whether or not the STM detects Web-based malware threats, you can configure it to take a variety of actions (some of the default actions are listed in Table 24 on page 85), skip files that are too large, and send notifications, emails, or both to the end users.
To configure the Web-based malware settings:
- Select Application Security > HTTP/HTTPS from the menu. The HTTP/HTTPS submenu tabs display, with the Malware Scan screen in view:
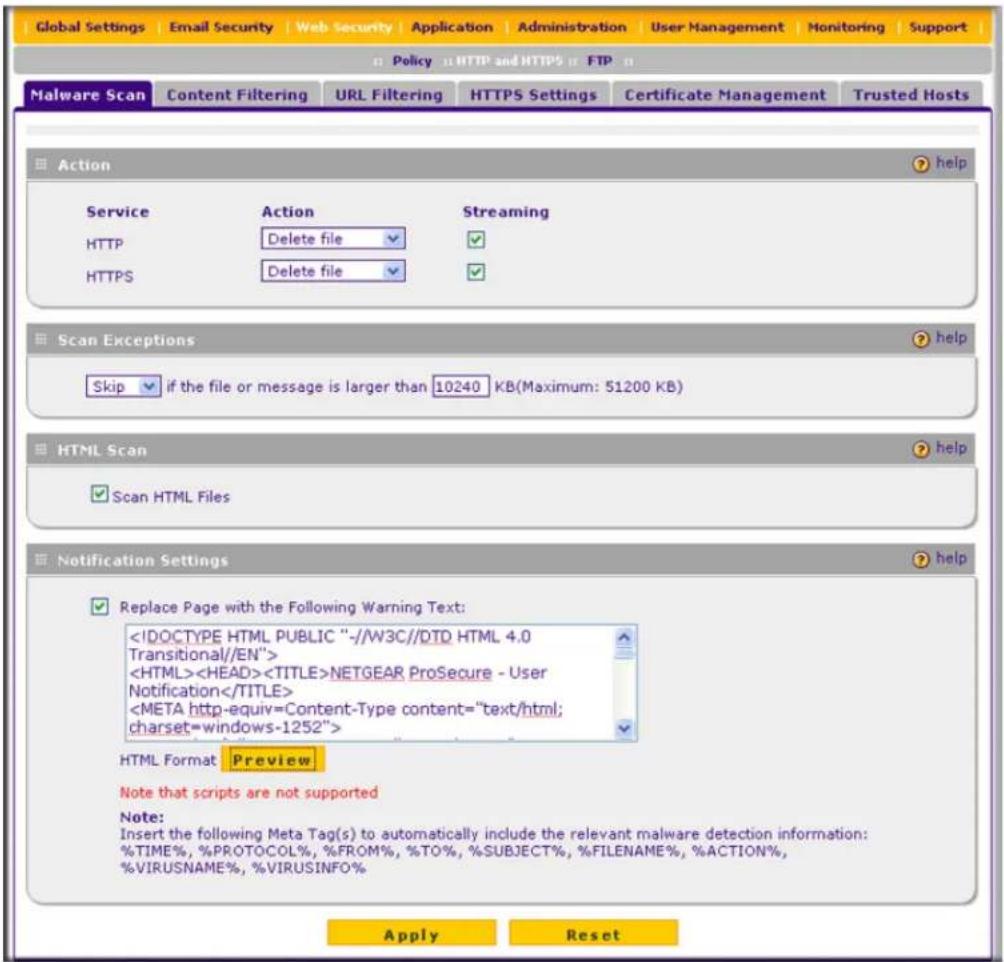
Figure 60.
- Complete the fields, select the check boxes, and make your selections from the drop-down lists as explained in the following table:
Table 33. Malware Scan Settings
| Setting Description | ||
| Action | ||
| HTTP and HTTPS | Action From | the HTTP or HTTPS drop-down list, specify one of the following actions to be taken when an infected Web file or object is detected:Quarantine file. The file is placed in quarantine, a malware quarantine log entry is created, and depending on the nature of the malware threat, also a virus log entry or a spyware log entry.Delete file. This is the default setting. The Web file or object is deleted, and depending on the nature of the malware threat, a virus log entry or a spyware log entry is created.Log only. Depending on the nature of the malware threat, only a virus log entry or a spyware log entry is created. The Web file or object is not placed in quarantine nor deleted. |
| Streaming | Select the Streaming check box to enable streaming of partially downloaded and scanned HTTP or HTTPS file parts to the end user. This method allows the user to experience more transparent Web downloading. Streaming is enabled by default. | |
| Scan Exceptions | ||
| From the drop-down list, specify one of the following actions to be taken when a file or message exceeds the size that you specify in the file size field:Skip. The file is not scanned but skipped, leaving the end user vulnerable. This is the default setting.Block. The file is blocked and does not reach the end user.The default and maximum file sizes are as follows:For the STM600 and STM300, the default setting is to block any attachment larger than 10240 KB. The maximum file size that you can specify is 51200 KB.For the STM150, the default setting is to block any attachment larger than 8192 KB. The maximum file size that you can specify is 25600 KB.Note: Setting the maximum file size to a high value might affect the STM's performance. NETGEAR recommends the default value, which is sufficient to detect the vast majority of threats. | ||
| HTML Scan | ||
| Scan HTML Files | Select this check box to enable scanning of HyperText Markup Language (HTML) files, which is enabled by default. | |
| Notification Settings | ||
| Select the Replace Page with the Following Warning Text check box to enable the STM to replace the content of a Web page that is blocked because of a detected malware threat with the following text:NETGEAR ProSecure Web/Email Security Threat Management Appliance has detected and stopped malicious code embedded in this web site for protecting your computer and network from infection.%VIRUSINFO% | ||
| Note: You can customize this text. Make sure that you keep the %VIRUSINFO% metaword in the text to enable the STM to insert the correct malware threat information. In addition to the %VIRUSINFO% metaword, you can insert the following metawords in your customized message: %TIME%, %PROTOCOL%, %FROM%, %TO%, %SUBJECT%, %FILENAME%, %ACTION%, %VIRUSNAME%. | ||
| The text is displayed on the Malware Scan screen with HTML tags. ClickPreviewto open a screen that displays the notification text in HTML format. | ||
3. Click Apply to save your settings.
Configuring Web Content Filtering
If you want to restrict internal LAN users from access to certain types of information and objects on the Internet, use the STM's content filtering and Web objects filtering. With the exception of the Web content categories that are mentioned in Default Email and Web Scan Settings on page 85, all requested traffic from any website is allowed. You can specify a message such as "Blocked by NETGEAR" that is displayed onscreen if a user attempts to access a blocked site (see the Notification Settings section that is described at the bottom of Table 34 on page 112). Several types of Web content blocking are available:
- File extension blocking. You can block files based on their extension. Such files can include executable files, audio and video files, and compressed files.
- Web object blocking. You can block the following Web objects: embedded objects (ActiveX, Java, Flash), proxies, and cookies; and you can disable Java scripts. However, websites that are on the whitelist (see Configuring Web URL Filtering on page 116) are never subject to Web object blocking.
- Web category blocking. You can block entire Web categories because their content is unwanted, offensive, or not relevant, or simply to reduce traffic.
Note: You can bypass any type of Web blocking for trusted domains by adding the exact matching domain names to the trusted host list (see Specifying Trusted Hosts on page 124). Access to the domains on the trusted host list is allowed for PCs in the groups for which file extension, object, or category blocking, or a combination of these types of Web blocking has been enabled.
Note: You can bypass any type of Web blocking for trusted URLs by adding the URLs to the whitelist (see Configuring Web URL Filtering on page 116). Access to the URLs on the whitelist is allowed for PCs in the groups for which file extension, object, or category blocking, or a combination of these types of Web blocking has been enabled.
Note: For information about creating custom categories that allow you to set access exceptions for combinations of Web categories, see Creating Custom Categories for Web Access Exceptions on page 142.
If you have used the Setup Wizard, you might have already configured the Web category blocking settings; the Content Filtering screen allows you to modify these settings.
To configure Web content filtering:
- Select Web Security > HTTP/HTTPS from the menu. The HTTP/HTTPS submenu tabs display, with the Malware Scan screen in view.
- Click the Content Filtering submenu tab. The Content Filtering screen displays. Because of the large size of this screen, it is presented in this manual in three figures (the following figure, Figure 62 on page 111, and Figure 63 on page 112).

Figure 61. Content Filtering, screen 1 of 3
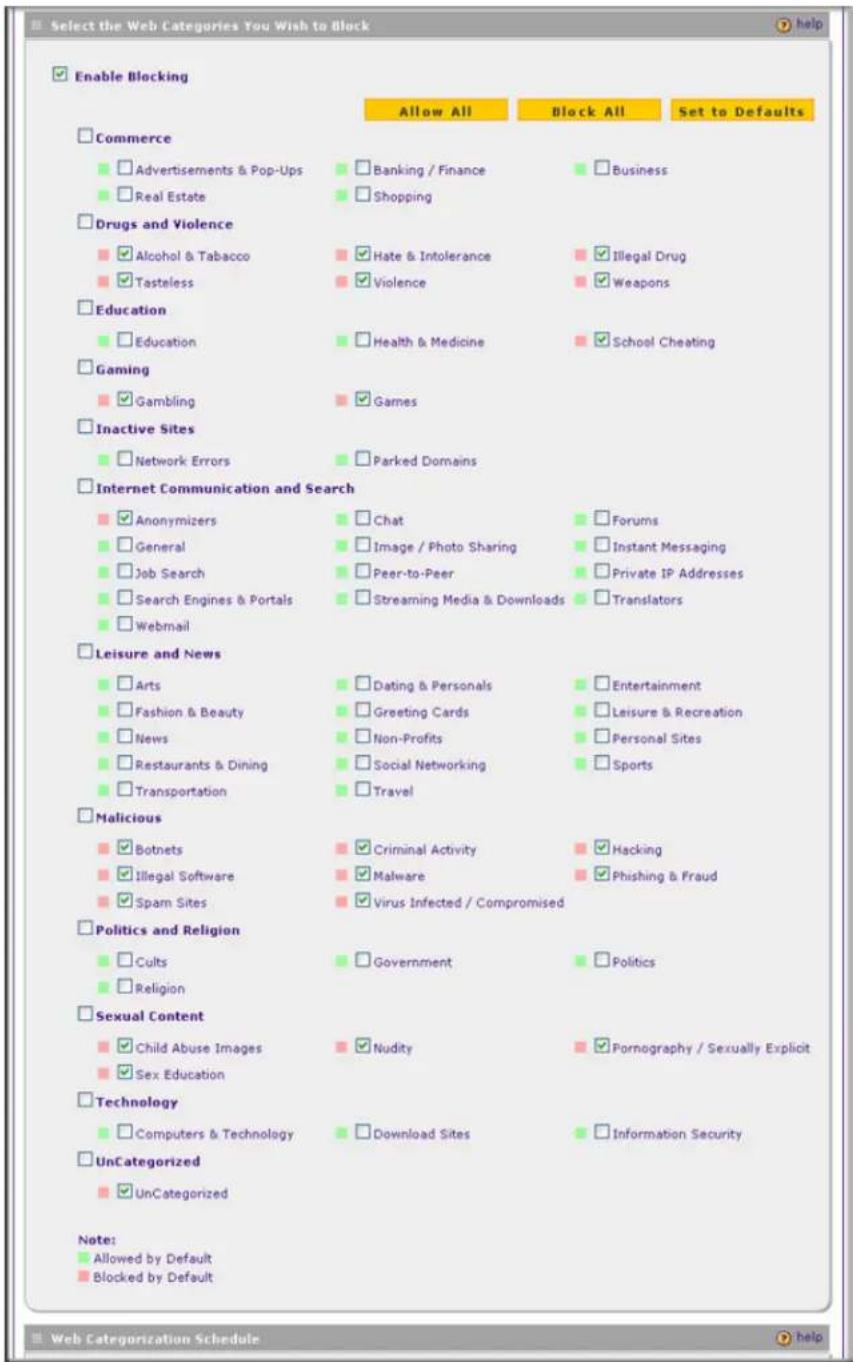
Figure 62. Content Filtering, screen 2 of 3

Figure 63. Content Filtering, screen 3 of 3
- Complete the fields, select the check boxes, and make your selections from the drop-down lists as explained in the following table:
Table 34. Content Filtering Settings
| Setting Description | |
| Content Filtering | |
| Log HTTP Traffic Select this check box to log HTTP traffic. For information about how to view the logged traffic, seeQuerying Logson page 194. By default, HTTP traffic is not logged.Note: Logging HTTP traffic might affect the STM's performance (see Managing the STM's Performance on page 82). | |
| Block Files with the Following Extensions | Select the check box to enable file extension blocking. By default, the File Extension field lists the most common file extensions that are detected. You can manually add or delete extensions. Use commas to separate different extensions. You can also use the drop-down list to add predefined file extensions from a specific category to the File Extension field:None. No file extensions are added to the File Extension field. This is the default setting.Executables. Executable file extensions (exe, com, dll, so, lib, scr, bat, and cmd) are added to the File Extension field.Audio/Video. Audio and video file extensions (wav, mp3, avi, rm, rmvb, wma, wmv, mpg, mp4, and aac) are added to the File Extension field.Compressed Files. Compressed file extensions (zip, rar, gz, tar, and bz2) added to the File Extension field. |
| Show This Message When a File was Blocked | |
| The STM replaces the content of a Web page that is blocked because of violating file extensions with the following text, which you can customize:Internet Policy has restricted access to this location with file extension:%URL%Note: Make sure that you keep the %URL% metaword in the text to enable the STM to show the URL of the blocked pager. | |
| As an option, you can select the Insert Link to User Login Portal Page check box. When you select this check box, the screen that displays when a user attempts to access blocked content includes a hyperlink that allows the user to log in as another user:You are logged in as %USER%(Click here to login as another user)Note: Make sure that you keep the %LOGIN-LINK% metaword in the text to enable the STM to insert the actual hyperlink. | |
| The text is displayed on the Content Filtering screen with HTML tags. Click Preview to open a screen that displays the notification text in HTML format. | |
| Block Web ObjectsSelect one or both of the following check boxes: | |
| Remove Embedded Objects | All embedded objects such as ActiveX, Java, and Flash objects are removed from downloaded Web pages.Note: Because embedded objects are commonly used on legitimate websites, blocking embedded objects globally might have a negative impact on a user's Web browsing experience. |
| Disable Javascript J | Javascript is disabled on downloaded Web pages. |
| Select the Web Categories You Wish to Block | |
| Select the Enable Blocking check box to enable blocking of Web categories, which is the default setting. Select the check boxes of any Web categories that you want to block. Use the action buttons at the top of the section in the following way:Allow All. All Web categories are allowed.Block All. All Web categories are blocked.Set to Defaults. Blocking and allowing of Web categories are returned to their default settings. See Table 24 on page 85 for information about the Web categories that are blocked by default. Categories that are preceded by a green rectangle are allowed by default; categories that are preceded by a pink rectangle are blocked by default. | |
| Web Categorization Schedule | |
| Do You Want this Schedule to be Active on All Days or Specific Days? | Select one of the following radio buttons:All Days. The schedule is in effect all days of the week.Specific Days. The schedule is active only on specific days.To the right of the radio buttons, select the check box for each day that you want the schedule to be in effect. |
| Do You Want this Schedule to be Active All Day or at Specific Times during the Day? | Select one of the following radio buttons:All Day. The schedule is in effect all hours of the selected day or days.Specific Times. The schedule is active only on specific hours of the selected day or days.To the right of the radio buttons, fill in the Start Time and End Time fields (Hour, Minute, AM/PM) during which the schedule is in effect. |
| Replace the Content of a Blocked Page with the Following Text | |
| The STM replaces the content of a Web page that is blocked because of violating content with the following text, which you can customize:Internet Policy has restricted access to this location belonging to the following categories:%FULL-CATEGORY-LIST%Note: Make sure that you keep the %FULL-CATEGORY-LIST% metaword in the text to enable the STM to insert the categories that the blocked Web page falls under. | |
| As an option, you can select one or both of the following check boxes:Allow Users to Submit a "Report a URL Misclassification" Form. When you select this check box, the screen that displays when a user attempts to access blocked content includes a hyperlink to report a URL misclassification. SeeClick here to Report a URL Misclassificationin the Web Category Lookup section later in this table.Note: Make sure that you keep the %SUBMIT-URL-CATEGORIZATION% metaword in the text to enable the STM to insert the actual hyperlink.Insert Link to User Login Portal Page. When you select this check box, the screen that displays when a user attempts to access blocked content includes a hyperlink that allows the user to log in as another user:You are logged in as %USER%(Click here to login as another user)Note: Make sure that you keep the %LOGIN-LINK% metaword in the text to enable the STM to insert the actual hyperlink. | |
| The text is displayed on the Content Filtering screen with HTML tags. ClickPreviewto open a screen that displays the notification text in HTML format. | |
| Web Category Lookup | |
| URL Enter a URL to | find out if it has been categorized, and if so, in which category. Then click theLookupbutton. If the URL has been categorized, the category appears next to Lookup Results. |
| Clear WebCategory Cache | ClickClear Web Category Cacheto enable the STM to synchronize with the NETGEAR server and download the most recent Web categorizations.Note: Synchronizing might temporarily slow down the STM's performance because the STM needs to acquire the Web categorizations remotely instead of from its local cache. |
| Click here toReport a URLMisclassification | To submit a misclassified or uncategorized URL to NETGEAR for analysis, click theClick here to Report a URL Misclassificationlink. A screen opens that allows you to select from drop-down lists up to two categories in which you think that the URL could be categorized. Then click theSubmitbutton. |
- Click Apply to save your settings.
Configuring Web URL Filtering
If you want to allow or block internal LAN users from access to certain sites on the Internet, use the STM's Web URL filtering. You can create or import a whitelist that contains domain names and URLs that are accepted, and a blacklist with domain names and URLs that are blocked. The whitelist takes precedence over the blacklist.
Note: A URL that you enter on the whitelist or blacklist might contain other embedded URLs such as URLs for advertisements or sponsors, causing unexpected behavior. If you want to allow a URL by placing it on the whitelist, make sure that all embedded URLs are also placed on the whitelist. Similarly, if you want to block a URL by placing it on the blacklist, make sure that all embedded URLs are also placed on the blacklist.
Note: For information about creating custom categories that allow you to set access exceptions for combinations of URLs, see Creating Custom Categories for Web Access Exceptions on page 142.
To configure Web URL filtering:
- Select Web Security > HTTP/HTTPS from the menu. The HTTP/HTTPS submenu tabs display, with the Malware Scan screen in view.
- Click the URL Filtering submenu tab. The URL Filtering screen displays:

Figure 64.
- Select the check boxes and complete the fields and as explained in the following table:
Table 35. URL Filtering Settings
| Setting Description | |||
| Whitelist (takes precedence over Blacklist) | |||
| Enable Select this | check box to bypass scanning of the URLs that are listed in the URL field. Users are allowed to access the URLs that are listed in the URL field. | ||
| URL This field contains the URLs for which scanning is bypassed. To add a URL to this field, use the Add URL field or the Import from File tool (see information later in this table). You can add a maximum of 2000 URLs.Note: If a URL is in both the whitelist and blacklist, then the whitelist takes precedence and URLs on the whitelist are not scanned.Note: Wildcards (*) are supported. For example, if you enter www.net*.com in the URL field, any URL that begins with www.net and ends with .com is allowed. | |||
| Delete | To delete one or more URLs, highlight the URLs, and click the Delete table button. | ||
| Export | To export the URLs, click the Export table button, and follow the instructions of your browser. | ||
| Add URL | Type or copy a URL in the Add URL field. Then click the Add table button to add the URL to the URL field. | ||
| Import from File | To import a list with URLs into the URL field, click the Browse button and navigate to a file in .txt format that contains line-delimited URLs (that is, one URL per line). Then click the Upload table button to add the URLs to the URL field.Note: Any existing URLs in the URL field are overwritten when you import a list of URLs from a file. | ||
| Blacklist | |||
| Enable Select this | check box to block the URLs that are listed in the URL field. Users attempting to access these URLs receive a notification (see information later in this table). | ||
| URL This field contains the URLs that are blocked. To add a URL to this field, use the Add URL field or the Import from File tool (see information later in this table). You can add a maximum of 2000 URLs.Note: If a URL is in both the whitelist and blacklist, then the whitelist takes precedence and URLs on the whitelist are not scanned.Note: Wildcards (*) are supported. For example, if you enter www.net*.com in the URL field, any URL that begins with www.net and ends with. com is blocked. | |||
| Delete | To delete one or more URLs, highlight the URLs, and click the Delete table button. | ||
| Export | To export the URLs, click the Export table button and follow the instructions of your browser. | ||
| Add URL | Type or copy a URL in the Add URL field. Then click the Add table button to add the URL to the URL field. | ||
| Import from File | To import a list with URLs into the URL field, click the Browse button and navigate to a file in .txt format that contains line-delimited URLs (that is, one URL per line). Then click the Upload table button to add the URLs to the URL field.Note: Any existing URLs in the URL field are overwritten when you import a list of URLs from a file. | ||
| Replace the Content of a Blocked Page with the Following Text | When a user attempts to access a blocked URL, the STM replaces the content of the blocked URL with the following text, which you can customize:Internet Policy has restricted access to this location:%URL%Note: Make sure that you keep the %URL% metaword in the text to enable the STM to insert the category that the blocked Web page falls under. | ||
| As an option, you can select the Insert Link to User Login Portal Page check box to include a hyperlink on screen that allows the user to log in as another user:You are logged in as %USER%(Click here to login as another user)Note: Make sure that you keep the %LOGIN-LINK% metaword in the text to enable the STM to insert the actual hyperlink. | |||
| The text is displayed on the URL Filtering screen with HTML tags. Click Preview to open a screen that displays the notification text in HTML format. | |||
4. Click Apply to save your settings.
HTTPS Scan Settings
HTTPS traffic is encrypted traffic that cannot be scanned or the data stream would not be secure. However, the STM can scan HTTPS traffic that is transmitted through an HTTP proxy. The STM can break up the SSL connection between the HTTPS server and the HTTP client, scan the HTTPS traffic, and then rebuild the SSL connection.
The following figure shows the HTTPS scanning traffic flow:
![graph TD A["HTTPS Server"] -->|STM communicates on Client's behalf| B["Internet"] B -->|HTTPS request| C["HTTPS Client"] C -->|STM sends its own Cert to Client| B B -->|Server returns Cert to STM for authentication| A](/content/2026/05/1028692/images/1ab45295e2ba0de8537df8e45205886f4b9faa6b465ebf09262fdaec8d73e975.jpg)
Figure 65.
The HTTPS scanning process functions with the following principles:
- The STM breaks up an SSL connection between an HTTPS server and an HTTP client into two parts:
- A connection between the HTTPS client and the STM
- A connection between the STM and the HTTPS server
- The STM simulates the HTTPS server communication to the HTTPS client, including the SSL negotiation, certificate exchange, and certificate authentication. In effect, the STM functions as the HTTPS server for the HTTPS client.
- The STM simulates the HTTPS client communication to the HTTPS server, including the SSL negotiation, certificate exchange, and certificate authentication. In effect, the STM functions as the HTTPS client for the HTTPS server.
During SSL authentication, the HTTPS client authenticates three items:
• Is the certificate trusted?
• Has the certificate expired?
• Does the name on the certificate match that of the website?
If one of these is not satisfied, a security alert message displays in the browser window:
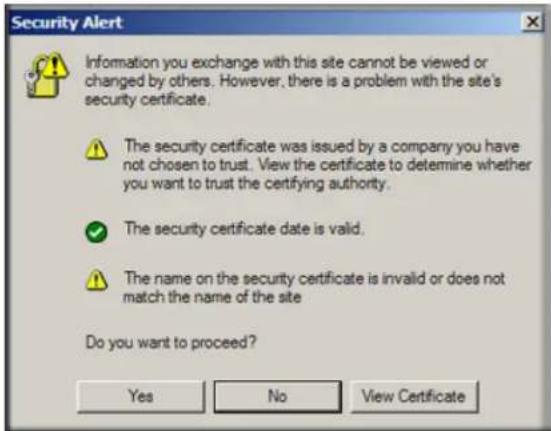
Figure 66.
However, even when a certificate is trusted or still valid, or when the name of a certificate does match the name of the website, a security alert message still displays when a user who is connected to the STM visits an HTTPS site. The appearance of this security alert message is expected behavior because the HTTPS client receives a certificate from the STM instead of directly from the HTTPS server. If you want to prevent this security alert message from displaying, install a root certificate on the client PC. The root certificate can be downloaded from the STM's User Portal Login screen (see Figure 88 on page 156).
If client authentication is required, the STM might not be able to scan the HTTPS traffic because of the nature of SSL. SSL has two parts—client and server authentication. HTTPS server authentication occurs with every HTTPS request, but HTTPS client authentication is not mandatory, and rarely occurs. Therefore it is of less importance whether the HTTPS request comes from the STM or from the real HTTPS client.
However, certain HTTPS servers do require HTTPS client certificate authentication for every HTTPS request. Because of the design of SSL, the HTTPS client needs to present its own certificate in this situation rather than using the one from the STM, preventing the STM from scanning the HTTPS traffic. For information about certificates, see Managing Digital Certificates on page 76.
You can specify trusted hosts for which the STM bypasses HTTPS traffic scanning. For more information, see Specifying Trusted Hosts on page 124.
To configure the HTTPS scan settings:
- Select Web Security > HTTP/HTTPS from the menu. The HTTP/HTTPS submenu tabs display, with the Malware Scan screen in view.
- Click the HTTPS Settings submenu tab. The HTTPS Settings screen displays:

Figure 67.
- Select the check boxes and complete the field and as explained in the following table:
Table 36. HTTPS Settings
| Setting Description | |
| HTTP Tunneling | |
| Select this check box to allow scanning of HTTPS connections through an HTTP proxy, which is disabled by default. Traffic from trusted hosts is not scanned (see Specifying Trusted Hosts on page 124).Note: For HTTPS scanning to occur correctly, you need to add the HTTP proxy server port in the Ports to Scan field for the HTTPS service on the Services screen (see Configuring the HTTP Proxy Settings on page 60). | |
| HTTPS SSL Settings | |
| Select the Allow the STM to handle HTTPS connections using SSLv2 check box to allow HTTPS connections using SSLv2, SSLv3, or TLSv1. If this check box is cleared, the STM allows HTTPS connections using SSLv3 or TLSv1, but SSLv2 connections are dropped by the STM. | |
| HTTPS 3rd Party Website Certificate Handling | |
| Select this check box to allow a Secure Sockets Layer (SSL) connection with a valid certificate that is not signed by a trusted Certificate Authority (CA). The default setting is to allow such as a connection. | |
| Show This Message When an SSL Connection Attempt Fails | |
| By default, a rejected SSL connection is replaced with the following text, which you can customize:The SSL connection cannot be established.URL: %URL%REASON: %REASON% | |
| Note: The text is displayed on the HTTPS Settings screen with HTML tags. Click Preview to open a screen that displays the notification text in HTML format. | |
| Note: Make sure that you keep the %URL% and %REASON% metawords in the text to enable the STM to insert the correct URL information and the reason of the rejection. | |
- Click Apply to save your settings.
Note: For information about certificates that are used for SSL connections and HTTPS traffic, see Managing Digital Certificates on page 76.
Specifying Trusted Hosts
You can specify trusted hosts for which the STM bypasses HTTPS traffic scanning and security certificate authentication. The security certificate is sent directly to the client for authentication, which means that the user does not receive a security alert for trusted hosts. For more information about security alerts, see Managing Digital Certificates on page 76.
Note that certain sites contain elements from different HTTPS hosts. As an example, assume that the https://example.com site contains HTTPS elements from the following three hosts:
• trustedhostserver1.example.com
• trustedhostserver2.example.com
- imageserver.example.com
To completely bypass the scanning of the https://example.com site, you need to add all three hosts to the trusted hosts list because different files from these three hosts are also downloaded when a user attempts to access the https://example.com site.
To specify trusted hosts:
- Select Web Security > HTTP/HTTPS from the menu. The HTTP/HTTPS submenu tabs display, with the Malware Scan screen in view.
- Click the Trusted Hosts submenu tab. The Trusted Hosts screen displays. (The following figure contains an example.)

Figure 68.
- Complete the fields and select the check box as explained in the following table:
Table 37. Trusted Hosts Settings
| Setting Description | ||
| Do Not Intercept HTTPS Connections for the following Hosts | ||
| Enable Select this | check box to bypass scanning of trusted hosts that are listed in the Hosts field.Users do not receive a security alert for trusted hosts that are listed in the Hosts field. | |
| Hosts This field contains the trusted hosts for which scanning is bypassed. To add a host to this field, use the Add Host field or the Import from File tool (see later in this table). You can add a maximum of 200 hosts. | ||
| Export | To export the hosts, click the Export table button and follow the instructions of your browser. | |
| Add Host | Type or copy a trusted host in the Add Host field. Then click the Add table button to add the host to the Hosts field. | |
| Import from File | To import a list with trusted hosts into the Hosts field, click the Browse button and navigate to a file in .txt format that contains line-delimited hosts (that is, one host per line). Then click the Upload table button to add the hosts to the Host field.Note: Any existing hosts in the Hosts field are overwritten when you import a list of hosts from a file. | |
- Click Apply to save your settings.
Configuring FTP Scans
Some malware threats are specifically developed to spread through the FTP protocol. By default, the STM scans FTP traffic, but you can specify how the STM scans FTP traffic and which action is taken when a malware threat is detected.
Note: The STM does not scan password-protected FTP files.
To configure the FTP scan settings:
1. Select Web Security > FTP from the menu. The FTP screen displays:

Figure 69.
2. Complete the fields, select the check boxes, and make your selections from the drop-down lists as explained in the following table:
Table 38. FTP Scan Settings
| Setting Description | ||
| Action | ||
| FTP Action | From the | FTP drop-down list, specify one of the following actions to be taken when an infected FTP file or object is detected:Quarantine file. The FTP file or object is placed in quarantine, a malware quarantine log entry is created, and depending on the nature of the malware threat, also a virus log entry or a spyware log entry.Delete file. This is the default setting. The FTP file or object is deleted, and depending on the nature of the malware threat, a virus log entry or a spyware log entry is created.Log only. Depending on the nature of the malware threat, only a virus log entry or a spyware log entry is created. The FTP file or object is not deleted. |
Table 38. FTP Scan Settings (Continued)
| Setting Description |
| Scan Exception |
| From the drop-down list, specify one of the following actions to be taken when a file or object exceeds the size that you specify in the file size field:Skip. The file or object is not scanned but skipped, leaving the end user vulnerable. This is the default setting.Block. The file or object is blocked and does not reach the end user.The default and maximum file sizes are as follows:For the STM600 and STM300, the default setting is to block any file or object larger than 10240 KB. The maximum file size that you can specify is 51200 KB.For the STM150, the default setting is to block any file or object larger than 8192 KB. The maximum file size that you can specify is 25600 KB.Note: Setting the maximum file size to a high value might affect the STM's performance. NETGEAR recommends the default value, which is sufficient to detect the vast majority of threats. |
| Block Files with the Following Extensions |
| Select the check box to enable file extension blocking. By default, the File Extension field lists the most common file extensions that are detected. You can manually add or delete extensions. Use commas to separate different extensions.You can also use the drop-down list to add predefined file extensions from a specific category to the File Extension field:None. No file extensions are added to the File Extension field. This is the default setting.Executables. Executable file extensions (exe, com, dll, so, lib, scr, bat, and cmd) are added to the File Extension field.Audio/Video. Audio and video file extensions (wav, mp3, avi, rm, rmvb, wma, wmv, mpg, mp4, and aac) are added to the File Extension field.Compressed Files. Compressed file extensions (zip, rar, gz, tar, and bz2) are added to the File Extension field. |
3. Click Apply to save your settings.
Configuring Application Control
The STM lets you control user access to Web applications such as instant messaging, media, peer-to-peer services, and online tools. Blocking an application prohibits all traffic to and from the application, which can be useful when you want to control the STM's throughput. By default, none of the applications are blocked.
Note: For information about creating custom categories that allow you to set access exceptions for combinations of applications, see Creating Custom Categories for Web Access Exceptions on page 142.
To enable and configure application control:
- Select Application from the menu. The Application Control screen displays.
Because of the size of this screen, and because of the way the information is presented, the Application Control screen is divided and presented in this manual in three figures: the following figure shows only the very top part of the screen, Figure 71 on page 129 shows the Instant Messaging and Media Application sections, and Figure 72 on page 129 shows the Peer to Peer and Tools sections.

Figure 70. Application Control, screen 1 of 3
- In the Application Settings section of the screen, select the Enable Application Control check box.
- Under the Application Settings section of the screen, click Apply. The configurations of the individual applications can now take effect.
- For each of the four application sections on the screen—Instant Messaging, Media Applications, Peer to Peer, and Tools—select the Block check box to specify to block all applications for that section, or select the individual check boxes to specify to block individual applications.

Figure 71. Application Control, screen 2 of 3

Figure 72. Application Control, screen 3 of 3
- After you have configured each section, first click Apply to save the settings before you continue with the next section. You need to save the configuration changes for each section individually.
For reference, you can specify access control for the following applications:
- Instant Messaging:
- Google Talk
- ICQ
- mIRC
- MSN Messenger
- Yahoo Messenger
• Media Applications:
- iTunes (Music Store, update)
- Quicktime (Update)
- Real Player (Guide)
- Rhapsody (Guide, Music Store)
- Winamp (Internet Radio/TV)
- Peer to Peer:
- BitTorrent
- eDonkey
- Gnutella
- Tools
- Alexa Toolbar
- GoToMyPC
- Weatherbug
- Yahoo Toolbar
Setting Scanning Exclusions and Web Access Exceptions
After you have specified which IP addresses and ports the STM scans for malware threats, you can set scanning exclusion rules for certain IP addresses and ports. Similarly, after you have specified which content the STM filters, you can set exception rules for users and members of a group.
Setting Scanning Exclusions
To save resources, you can configure scanning exclusions for IP addresses and ports that you know are secure. For example, if your network includes a Web server that hosts Web pages that are accessible by anyone on the Internet, the files that are hosted by your Web server do not need to be scanned. To prevent the STM from scanning these files, you can configure up to 127 scanning exclusion rules for your Web server.
To configure scanning exclusion rules:
- Select Global Settings > Scanning Exclusions from the menu. The Scanning Exclusions screen displays. This screen shows the Scanning Exclusions table, which is empty if you have not specified any exclusions. (The following figure shows one exclusion rule in the table as an example.)

Figure 73.
- In the Scanning Exclusions section of the screen, specify an exclusion rule as explained in the following table:
Table 39. Add Scanning Exclusion Settings
| Setting Description | |
| Client IP The client IP address and optional subnet mask that are excluded from all scanning. | |
| Destination IP The destination IP address and optional subnet mask that are excluded from all scanning. | |
| Port The number of the port that is excluded from all scanning. | |
| Brief Description A description of the exclusion rule for identification and management purposes. | |
- In the Add column, click the Add table button to add the exclusion rule to the Scanning Exclusions table. The new exclusion rule is enabled by default.
To disable a rule, select the check box in the Enable column for the rule.
To delete an exclusion rule from the Scanning Exclusions table, click the Delete table button in the Action column to the right of the rule that you want to delete.
Setting Access Exception Rules for Web Access
You can set up to 200 exception rules for users and members of a group to allow access to applications, file extensions and protocols, Web categories, and URLs that you have blocked for all other users, or the other way around, to block access to applications, file extensions and protocols, Web categories, and URLs that you have allowed access to for all other users.
If you have not created a custom group, an exception rule can apply to either one of the following groups or individual users:
- All users
• All authenticated users
• All unauthenticated users
• A local group or local user
• A group or users that is defined by its IP address
• A Lightweight Directory Access Protocol (LDAP) group or LDAP user
• A RADIUS VLAN group
To further refine exception rules, you can create custom groups that allow you to include a combination of local groups and local users, groups and users that are defined by their IP address, LDAP groups and users, and RADIUS groups and users. For more information, see Creating Custom Groups for Web Access Exceptions on page 139.
Note: Users and groups to which access exception rules apply are not the same as LAN groups. For information about how to specify members of a LAN group and to customize LAN group names, see Managing Users, Groups, and Authentication on page 147.
If you have not created a custom category, an exception rule can apply to either one of the following components:
• One built-in application group or built-in individual application
• A combination of files extensions and protocols
• One URL or URL expression
• One built-in Web category group or built-in individual Web category
To further refine exception rules, you can create custom categories that allow you to include either a selection of applications, or a selection of URLs, or a selection of Web categories. For more information, see Creating Custom Categories for Web Access Exceptions on page 142.
Tip: If you want to use a custom group and custom category, first create the custom group and custom category, then create the exception rule.
To set Web access exception rules:
- Select Global Settings > Exceptions from the menu. The Exceptions submenu tabs display, with the Exceptions screen in view. This screen shows the Exceptions table, which is empty if you have not specified any exception rules. (The following figure shows several exception rules in the table as an example.)
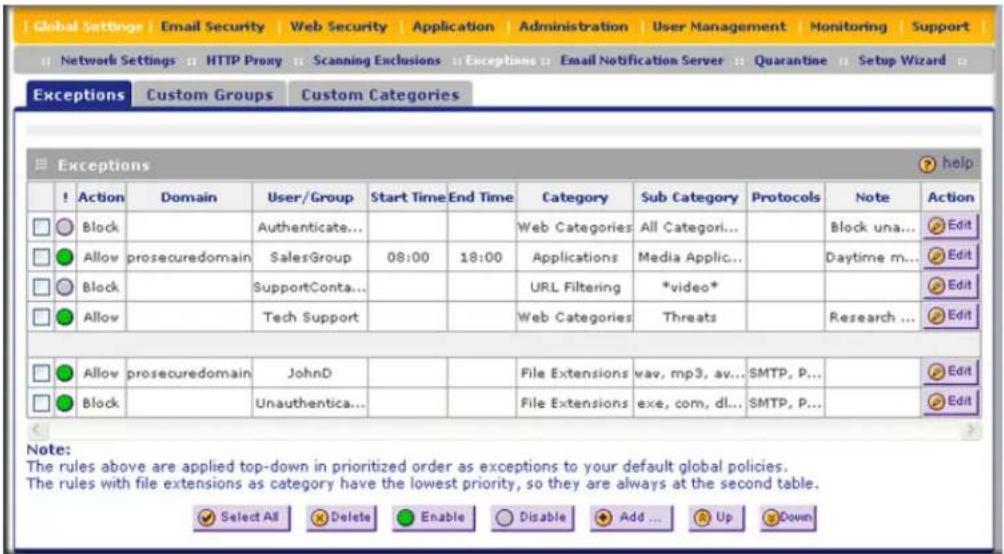
Figure 74.
Note: If text in a field of the table exceeds the width of the column, hold the cursor over the field to display the entire text.
- Under the Exceptions table, click the Add table button to specify an exception rule. The Add Exception screen displays:

Figure 75.
- Complete the fields and make your selections from the drop-down lists as explained in the following table:
Table 40. Add Exception Settings
| Setting Description | |
| Action From the drop-down list, select the action that the STM applies:Allow. The exception allows access to an application, Web category, or URL that is otherwise blocked.Block. The exception blocks access to an application, Web category, or URL that is otherwise allowed. | |
| Domain User/Group | Click theEditbutton to open the Applies To screen, which lets you configure a domain, group, or individual user to which the exception needs to apply (see the screen later in this table).If applicable, on the Applies To screen, click aLookupbutton to retrieve a group or user.When you have made your decision, click anApplybutton to add the domain to the Domain field on the Add Exception screen and the group and user to the User/Group field on the Add Exception screen.Note:The Domain field can remain blank for some special users or groups.Following are the options on the Applies To screen. |
 | |
Table 40. Add Exception Settings (Continued)
| Setting Description | ||
| Domain User/Group (continued) | All Users Click the Apply button to apply the exception to all users, both authenticated and unauthenticated. | |
| Authenticated Click the Apply button to apply the exception to all authenticated users. These are users who have actively logged in to the STM and who have been authenticated. | ||
| Unauthenticated Click the Apply button to apply the exception to all unauthenticated users. These are users who have not actively logged in to the STM. By default, these users are assigned the account name anonymous. | ||
| Local Groups Do the following:1. From the Name drop-down list, select a local group.2. Click the Apply button to apply the exception to the selected local group.You can specify local groups on the Groups screen (see Creating and Deleting Groups by Name on page 149). | ||
| Group Membership by IP | Do the following:1. From the Name drop-down list, select a group that is defined by its IP address.2. Click the Apply button to apply the exception to the selected group.You can specify groups that are defined by their IP address on the IP/Subnet Groups screen (see Creating and Deleting Groups by IP Address and Subnet on page 151). | |
| Local User Search Do the following:1. In the Name field, enter a user name.2. Click the Lookup button. If the user is found, he or she is listed to the left of the Apply button.3. Click the Apply button to apply the exception to the selected user. | ||
| DomainUser/Group(continued) | LDAPUser/Group Search | Do the following:1. From the Domain drop-down list, select an LDAP domain.2. From the Type drop-down list, select User, Group, or User&Group.3. In the Name field, enter the name of the user, group, or user and group, or leave this field blank.4. Click the Lookup button. If the user or group is found, it is listed to the left of the Apply button. If you left the Name field blank, all users, groups, or users and groups are listed; in this case, make a selection.5. Click the Apply button to apply the exception to the selected user or group.You can specify LDAP domains, groups, and users on the LDAP screen (see Creating and Deleting LDAP and Active Directory Domains on page 161). |
| RADIUS User Do the following:1. From the Domain drop-down list, select a RADIUS domain.2. From the VLAN ID/Name drop-down list, select a VLAN ID or VLAN name.3. Click the Apply button to apply the exception to the selected VLAN.You can specify RADIUS domains and VLANs on the RADIUS screen (see Creating and Deleting RADIUS Domains on page 167). | ||
| Custom Groups Do the following:1. From the Name drop-down list, select a custom group.2. Click the Apply button to apply the exception to the selected group.You can specify custom groups on the Custom Groups screen (see Creating Custom Groups for Web Access Exceptions on page 139). | ||
| Start Time The time in 24-hour format (hours and minutes) when the action starts. If you leave these fields empty, the action applies continuously. | ||
| End Time The time in 24-hour format (hours and minutes) when the action ends. If you leave these fields empty, the action applies continuously. | ||
| Category(and related information) | From the Category drop-down list, select the category to which the action applies. Your selection determines which drop-down lists, fields, radio buttons, and check boxes display onscreen. | |
| Applications The action | applies to an application. Select an application from the Sub Category drop-down list. For information about custom application categories, seeCreating Custom Categories for Web Access Exceptionson page 142. | |
| File Extensions The action | applies to one or more file extensions and one or more protocols. The following field and check boxes display on screen:File Extensions.Manually enter up to 40 file extensions. Use commas to separate multiple file extensions. Wildcards (*) are supported. A single asterisk (*) matches any file extension. You can also use the drop-down list to the right of the File Extension field to automatically add file extensions from the following categories:- None.No file extensions are added to the File Extension field. This is the default setting.Executables.Executable file extensions (exe, com, dll, so, lib, scr, bat, and cmd) are added to the File Extension field.Audio/Video.Audio and video file extensions (wav, mp3, avi, rm, rmvb, wma, wmv, mpg, mp4, and aac) are added to the File Extension field.Compressed Files.Compressed file extensions (zip, rar, gz, tar, and bz2) are added to the File Extension field.Protocols.Select one or multiple check boxes to specify which protocols the action applies to:- SMTP- POP3- IMAP- HTTP- HTTPS- FTP | |
| URL Filtering The action | applies to a URL. The following field and drop-down list display onscreen. Select a radio button to either enter a URL expression or select a custom URL list.URL Expression.Enter a URL or URL expression such as *video* or *chat*. Wildcards (*) are supported. The maximum supported size of the URL or URL expression is 1024 bytes.Custom URL List.Select a custom URL list from the Sub Category drop-down list.For information about custom URL lists, seeCreating Custom Categories for Web Access Exceptionson page 142. | |
| Category(and related information)(continued) | Web Categories The action applies to a Web category. Select a Web category from the Sub Category drop-down list. For information about custom Web categories, seeCreating Custom Categories for Web Access Exceptionson page 142. | |
| Note A description of the exception rule for identification and management purposes or any other relevant information that you wish to include. | ||
- Click Apply to save your settings. The new exception rule is added to the Exceptions table. To return to the Exception screen without adding the rule, click Return.
- Select the check box to the left of the rule that you want to enable, or click the Select All table button to select all rules.
- Click the Enable table button to enable the selected rule or rules.
Note: Enabled exception rules are preceded by a green circle in the ! column; disabled exception rules are preceded by a gray circle in the ! column.
To make changes to an existing exception rule:
- In the Action column to the right of to the exception rule, click the Edit table button. The Edit Exception screen displays. This screen is identical to the Add Exception screen (see Figure 74 on page 133).
- Modify the settings that you wish to change (see the previous table).
- Click Apply to save your changes. The modified exception rule is displayed in the Exceptions table.
To delete or disable one or more exception rules:
- Select the check box to the left of the rule that you want to delete or disable, or click the Select All table button to select all rules.
- Click one of the following table buttons:
- Disable. Disables the rule or rules. The ! status icon changes from a green circle to a gray circle, indicating that the rule is or rules are disabled. (By default, when a rule is added to the table, it is automatically enabled.)
- Delete. Deletes the rule or rules.
The table rank of the exception rule in the Exceptions table determines the order in which the rule ia applied (from the top down). To change the position of the rules in the table, select one or more a rules, and then click one of the following table buttons:
- Up. Moves the rule or rules up one position in the table rank.
- Down. Moves the rule or rules down one position in the table rank.
Creating Custom Groups for Web Access Exceptions
After you have specified groups and users (see Managing Users, Groups, and Authentication in Chapter 5), you can create up to 200 custom groups, each of which can include a combination of local groups and local users, groups and users that are defined by their IP address, LDAP groups and users, and RADIUS groups and users. You use these custom groups to set Web access exceptions on the Exceptions screen (see Setting Access Exception Rules for Web Access on page 132).
To create and manage custom groups:
-
Select Global Settings > Exceptions from the menu. The Exceptions submenu tabs display, with the Exceptions screen in view.
-
Click the Custom Groups submenu tab. The Custom Groups screen displays. This screen shows the Custom Groups table, which is empty if you have not specified any custom groups. (The following figure shows one custom group in the table as an example.)

Figure 76.
- Under the Custom Groups table, click the Add table button to specify a custom group. The Add Custom Group screen displays:
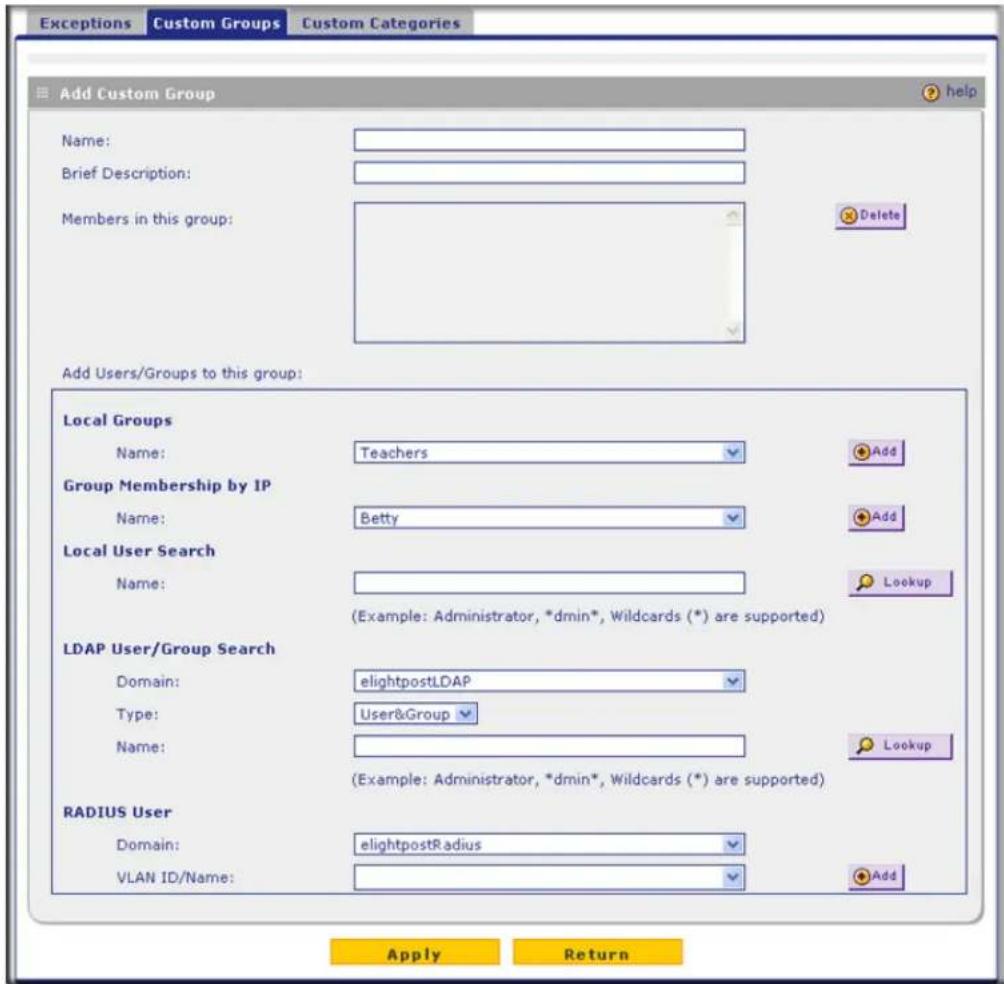
Figure 77.
- Complete the fields and make your selections from the drop-down lists as explained in the following table:
Table 41. Add Custom Group Settings
| Setting Description | |
| Name A name of the custom group for identification and management purposes. | |
| Brief Description | A description of the custom group for identification and management purposes. |
| Members in this group | When you click the Add button in the Add Users/Groups to this group section of the screen, the selected member is added to this field. You can add multiple members. To remove a member, highlight the member in this field, and then click the Delete button. |
Table 41. Add Custom Group Settings (Continued)
| Setting Description | ||
| AddUsers/Groupsto this group | Local Groups Do the following:From the Name drop-down list, select a local group.Click the Add button to add the selected local group to thecustom group. Repeat this step to add more local groups to thecustom group.You can specify local groups on the Groups screen (see Creating andDeleting Groups by Name on page 149). | |
| Group Membershipby IP | Do the following:From the Name drop-down list, select a group that is defined byits IP address.Click the Add button to add the selected group to the customgroup. Repeat this step to add more users or groups, or both, tothe custom group.You can specify groups that are defined by their IP address on theIP/Subnet Groups screen (see Creating and Deleting Groups by IPAddress and Subnet on page 151). | |
| Local User Search Do the following:In the Name field, enter a user name.Click the Lookup button. If the user is found, he or she is listed tothe left of the Apply button.Click the Add button to add the selected local user to the customgroup. Repeat this step to add more local users to the customgroup. | ||
| LDAPUser/Group Search | Do the following:From the Domain drop-down list, select an LDAP domain.From the Type drop-down list, select User, Group, orUser&Group.In the Name field, enter the name of the user, group, or user andgroup, or leave this field blank.Click the Lookup button. If the user or group is found, it is listedto the left of the Add button. If you left the Name field blank, allusers, groups, or users and groups are listed. In this case, make aselection.Click the Add button to add the selected user or group to thecustom group. Repeat this step to add more users or groups, orboth, to the custom group.You can specify LDAP domains, groups, and users on the LDAPscreen (see Creating and Deleting LDAP and Active DirectoryDomains on page 161). | |
| Add Users/Groups to this group (continued) | RADIUS User Do the following: | |
| 1. From the Domain drop-down list, select a RADIUS domain.2. From the VLAN ID/Name drop-down list, select a VLAN ID or VLAN name.3. Click the Add button to add the selected VLAN ID or VLAN name to the custom group. Repeat this step to add more VLAN IDs or VLAN names to the custom group.You can specify RADIUS domains and VLANs on the RADIUS screen (see Creating and Deleting RADIUS Domains on page 167). | ||
- After you have specified all members of the custom group, click Apply to save your settings. The new custom group is added to the Custom Groups table. To return to the Custom Groups screen without adding the group, click Return.
To make changes to an existing custom group:
- In the Action column to the right of to the custom group, click the Edit table button. The Edit Custom Group screen displays. This screen is identical to the Add Custom Group screen (see Figure 77 on page 140).
- Modify the settings that you wish to change (see the previous table).
- Click Apply to save your changes. The modified custom group is displayed in the Custom Groups table.
To delete one or more custom groups:
- Select the check box to the left of the custom group that you want to delete, or click the Select All table button to select all custom groups.
- Click the Delete table button.
Creating Custom Categories for Web Access Exceptions
Use custom categories to set Web access exceptions on the Exceptions screen (see Setting Access Exception Rules for Web Access on page 132). Custom categories can include a selection of applications, or a selection of URLs, or a selection of Web categories, but no combination of applications, URLs, and Web categories. You can create up to 200 custom categories.
To create and manage custom categories:
-
Select Global Settings > Exceptions from the menu. The Exceptions submenu tabs display, with the Exceptions screen in view.
-
Click the Custom Categories submenu tab. The Custom Categories screen displays. This screen shows the Custom Categories table, which is empty if you have not specified any custom categories. (The following figure shows three custom categories in the table as an example.)

Figure 78.
- Under the Custom Categories table, click the Add table button to specify a custom category. The Add Custom Category screen displays. The nature of the screen depends on your selection from the Category Type drop-down list, which is set by default to Applications (this selection is shown in the following figure). The URL Filtering and Web Categories settings are shown in Figure 80 on page 144 and Figure 81 on page 144 respectively.

Figure 79. Category Type: Applications
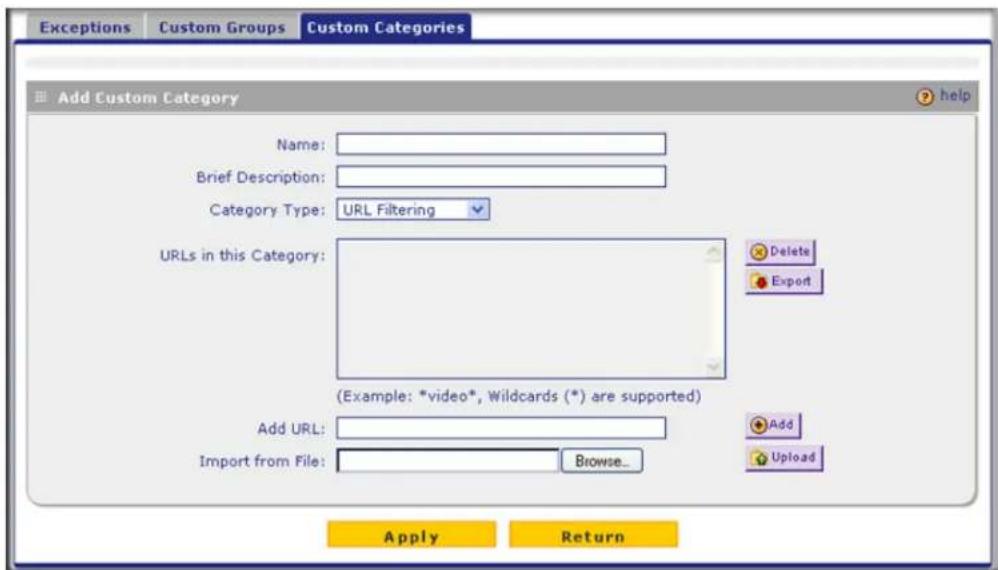
Figure 80. Category Type: URL Filtering

Figure 81. Category Type: Web Categories
- Complete the fields and make your selections from the drop-down lists as explained in the following table:
Table 42. Add Custom Category Settings
| Setting Description | ||
| Name A name of the custom category for identification and management purposes. | ||
| Brief Description | A description of the category group for identification and management purposes. | |
| Category Type | From the Category Type drop-down list, select the type of category that you want to create. Your selection determines the nature of the screen. | |
| Applications Use | the move buttons to move entire application categories (for example, Instant Messaging), individual applications (for example, Instant Messaging - Google Talk), or combinations of both from the Applications outside this Category field to the Applications in this Category field (or the other way around).These are the functions of the move buttons:< or > moves one or more highlighted selections from one field to the other.< or >> moves all entries from one field to the other. | |
| URL Filtering URL | Ls in this Category field:This field contains the URLs that are added to the custom category. To add a URL to this field, use the Add URL field or the Import from File tool (see explanations later in this table). You can add a maximum of 2000 URLs.Note: Wildcards (*) are supported. For example, if you enter www.net*.com in the Add URL field and then click the Add table button, any URL that begins with www.net and ends with .com is included in the custom category.These are the functions of the table buttons to the right of the field:Delete. To delete one or more URLs, highlight the URLs, and click the Delete table button.Export. To export the URLs, click the Export table button, and follow the instructions of your browser. | |
| Add URL field:Type or copy a URL in the Add URL field. Then click the Add table button to add the URL to the URLs in this Category field. | ||
| Import from File field:To import a list with URLs into the URLs in this Category field, click the Browse button and navigate to a file in .txt format that contains line-delimited URLs (that is, one URL per line). Then click the Upload table button to add the URLs to the URLs in this Category field.Note:Any existing URLs in the URLs in this Category field are overwritten when you import a list of URLs from a file. | ||
| Category Type (continued) | Web Categories | Use the move buttons to move entire Web categories (for example, Commerce), individual applications (for example, Commerce - Shopping), or combinations of both from the Web Categories outside this Category field to the Web Categories in this Category field (or the other way around). These are the functions of the move buttons:• < or > moves one or more highlighted selections from one field to the other.• << or >> moves all entries from one field to the other. |
- Click Apply to save your settings. The new category is added to the Custom Categories table. To return to the Custom Categories screen without adding the category, click Return.
To make changes to an existing custom category:
- In the Action column to the right of to the custom category, click the Edit table button. The Edit Custom Category screen displays. This screen is identical to the Add Custom Category screen (see Figure 77 on page 140).
- Modify the settings that you wish to change (see the previous table).
- Click Apply to save your changes. The modified custom group is displayed in the Custom Categories table.
To delete one or more custom categories:
- Select the check box to the left of the custom category that you want to delete, or click the Select All table button to select all custom categories.
- Click the Delete table button.
Managing Users, Groups, and Authentication
5
This chapter describes how to manage users, groups, and authentication on the STM. This chapter contains the following sections:
• About Users, Groups, and Domains on this page
• Configuring Groups on page 148
- Configuring User Accounts on page 152
- Configuring Authentication on page 154
• Global User Settings on page 170
• Viewing and Logging Out Active Users on page 172
About Users, Groups, and Domains
Users can be individual users or can be part of a group, and a group is generally part of a domain. Normally, you first create a domain, then you create a group that you assign to a domain, and then you create users that you assign to a group. The STM does not let you create domains; the local groups that you define are automatically assigned to the STM's prosecutedomain default domain. However, you can use existing LDAP and RADIUS domains on the STM.
The main purpose for using groups and domains is to apply exceptions (that is, adding or removing restrictions) for Web browsing, URL access, and application access (see Setting Access Exception Rules for Web Access on page 132).
Note: For information about a different type of users—those with administrative and guest privileges—see About Users with Administrative and Guest Privileges on page 61.
The STM supports both unauthenticated and authenticated users:
- Unauthenticated users. Anonymous users who do not log in to the STM and to which the STM's default email and Web access policies apply.
- Authenticated users. Users who have a computer behind the STM, who log in to the STM with a user name and password, and who are assigned an access policy that normally differs from the STM's default email and Web access policies. Different users or user groups can have different access policies, so there can be multiple access policies on the STM.
In addition to being authenticated as individual users, users can be authenticated on the STM according to group membership or IP address:
- Group membership. A group is defined in the STM's local database, an LDAP database, or a RADIUS database. If you use a RADIUS database for authentication, a group can also be defined in a VLAN.
- IP address. A group is defined by its IP address and subnet.
Note: For detailed information about authentication, see Configuring Authentication on page 154.
The login window that is presented to this type of users is the User Portal Login screen (see Figure 88 on page 156), which requires three items: a user name, a password, and a domain selection. The domain determines the authentication method that needs to be used—LDAP, Active Directory, RADIUS, or the STM's local database.
Configuring Groups
The use of groups simplifies the application of exception policies that allow different sets of users to have different Internet access restrictions. Rather than applying the same exception to each user, it is easier to apply a single exception to the entire group. For information about exception policies, see Setting Access Exception Rules for Web Access on page 132.
Note: For information about custom groups that allow you to set access exceptions for a combination of local groups and local users, groups and users that are defined by their IP address, LDAP groups and users, and RADIUS groups and users, see Creating Custom Groups for Web Access Exceptions on page 139.
You can define groups either by name or by IP address and subnet:
- Groups defined by name. These are local groups on the STM to which you can add users from the STM's local user database. Local groups are automatically assigned to the STM's prosecutedomain default domain.
Note: For information about groups that are defined by VLANs, see Creating and Deleting VLANs for Use with RADIUS Domains on page 170.
- Groups defined by IP address and subnet. These are groups that can be on your local network or on a remote device.
Note: If you use groups on a remote device, you need to configure your network's firewall to allow access to the IP address and subnet mask that have been assigned to the remote group.
Creating and Deleting Groups by Name
To create a local group by name:
- Select User Management > Groups from the menu. The Groups screen displays. (The following figure contains one example.)

Figure 82.
The List of Groups table displays the local groups with the following fields:
• Name. The name of the group, which is the defining characteristic of the group.
- Brief Description. An optional brief description of the group.
- Action. The Edit table button, which provides access to the Edit Group screen, and the Delete table button, which allows you to delete the group.
- In the Add New Group section of the screen, complete the fields as explained in the following table:
Table 43. Group Settings
| Setting Description | |
| Name A descriptive (alphanumeric) name of the group for identification and management purposes. | |
| Description A brief description of the group for identification and management purposes. This description is optional. | |
- Click the Add table button. The new group is added to the List of Groups table.
To delete a group from the List of Groups table, click the Delete table button in the Action column for the group that you want to delete.
Note: When you delete a group, an exception rule that is associated with this group no longer has any effect. You can delete such an exception rule.
Editing Groups by Name
To edit a local group that you created by name:
-
Select User Management > Groups from the menu. The Groups screen displays (see the previous figure).
-
In the Action column of the List of Groups table, click the Edit table button for the group that you want to edit. The Edit Group screen displays. (The following figure contains some examples.)

Figure 83.
- Change the field and move the users as explained in the following table:
Table 44. Edit Group Settings
| Setting Description | |
| Edit Description You can edit the brief description of the group for identification and management purposes. | |
| Use the move buttons to move all users or only selected users from the Local users field to the Users in this group field (or the other way around).These are the functions of the move buttons:< or > moves one or more highlighted selections from one field to the other.<<< or >> moves all entries from one field to the other. | |
- Click Apply to save your changes.
Creating and Deleting Groups by IP Address and Subnet
To create a group by IP address and subnet:
- Select User Management > IP Subnet/Groups from the menu. The IP Subnet/Groups screen displays. (The following figure contains one example.)
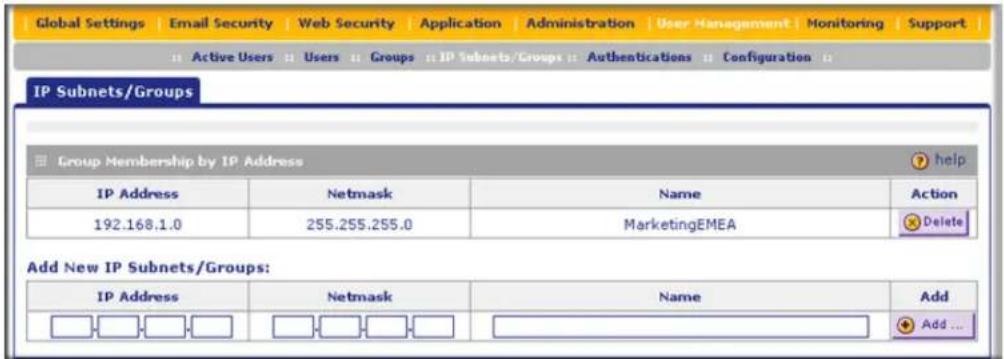
Figure 84.
The Groups Membership by IP Address table displays the groups with the following fields:
• IP Address. The IP address for the group.
• Netmask. The subnet mask for the group.
• Name. The name of the group.
• Action. The Delete table button, which allows you to delete the group.
- In the Add New IP Subnets/Groups section of the screen, complete the fields as explained in the following table:
Table 45. IP Subnet/Group Settings
| Setting Description |
| IP Address An IP address on your local network or on a remote device to which the users are assigned. |
| Netmask The subnet mask to which the users are assigned. For an individual IP address, specify 255.255.255.255. |
| Name A descriptive (alphanumeric) name of the group for identification and management purposes. |
- Click the Add table button. The new group is added to the Groups Membership by IP Address table.
To delete a group from the List of Groups table, click the Delete table button in the Action column for the group that you want to delete.
Note: When you delete a group, an exception rule that might be associated with this group no longer has any effect. You can delete such an exception rule.
Configuring User Accounts
When you create a user account, you can assign the user to a local group. Therefore, you should first create any local groups, then user accounts. User accounts are added to the STM's local user database.
Creating and Deleting User Accounts
To create an individual user account:
- Select Users > Users from the menu. The Users screen displays:

Figure 85.
The List of Users table displays the users with the following fields:
- Enable. The check box allows you to enable or disable the user.
• Name. The name of the user. - Group. The group to which the user is assigned. If no group is displayed, the user is not assigned to any group.
-
Action. The Edit table button, which provides access to the Edit User screen, and the Delete table button, which allows you to delete the user.
-
In the Add New Users section of the screen, complete the fields, make your selection from the drop-down list, and select the radio buttons as explained in the following table:
Table 46. User Settings
| Setting Description | |
| Name A descriptive (alphanumeric) name of the user for identification and management purposes. | |
| Groups The drop-down list shows the local groups that are listed on the Groups screen. From the drop-down list, select the group to which the user is assigned. For information about how to configure groups, see Configuring Groups on page 148. | |
| Password Select one of the following radio buttons:The radio button to the left of the Password field. Enter the password that the user needs to enter to gain access to the STM. The password can be up to 64 characters.Use username as the password. The password that is assigned to the user is identical to the user name. | |
- Click the Add table button. The new user is added to the List of Users table.
To delete a user from the List of Users table, click the Delete table button in the Action column for the user that you want to delete.
Editing User Accounts
The only field that you can change for a user account is the password.
To modify the password for a user:
-
Select Users > Users from the menu. The Users screen displays (see the previous figure).
-
Click the Edit table button in the Action column for the user whose password you want to modify. The Edit User screen displays. (The following figure contains an example.)

Figure 86.
- Modify the password:
a. In the Password field, enter the new password.
b. In the Confirm Password field, repeat the new password.
- Click Apply to save your settings.
Configuring Authentication
The authentication options of the STM are discussed in the following sections:
• Understanding the STM's Authentication Options on page 155
• Understanding Active Directories and LDAP Configurations on page 157
- Creating and Deleting LDAP and Active Directory Domains on page 161
• Editing LDAP and Active Directory Domains on page 164
• Understanding the ProSecure DC Agent on page 164
- Requirements for the ProSecure DC Agent Software and DC Agent Server on page 165
- Downloading ProSecure DC Agent Software, and Creating and Deleting DC Agents on page 165
- Creating and Deleting RADIUS Domains on page 167
• Editing RADIUS Domains and Configuring VLANs on page 169
Understanding the STM's Authentication Options
The login screen and authentication on the STM depend on the user type. There are two basic user types on the STM that are explained in the following sections:
• Administrative users and users with guest privileges
- Users with special access privileges
Administrative Users and Users with Guest Privileges
Users with administrative and guest privileges on the STM need to log in through the NETGEAR Configuration Manager Login screen (see the following figure), where they are authenticated through the STM's local user database. These users need to provide their user name and password.
For information about the predefined administrator and guest user accounts, see About Users with Administrative and Guest Privileges on page 61. For information about how to change the administrator default name and password or guest default name and password, see Changing Administrative Passwords and Timeouts on page 62.

Figure 87.
Users with Special Access Privileges
Users who have a computer behind the STM and who are assigned access policies that differ from the STM's default email and Web access policies (see Setting Access Exception Rules for Web Access on page 132) need to log in through the User Portal Login screen (see the following figure). These users need to provide their user name and password, and select the domain to which they have been assigned.
The lower part of the NETGEAR Configuration Manager Login screen (see the previous figure) provides a User Portal Login Link that lets you open the User Portal Login screen:

Figure 88.
After a user has logged in through the User Portal Login screen, the Authentication screen displays:
![Authentication [ Change Password ] Logout help You have successfully logged in from IP : 192.105.155.84 2009 © Copyright NETGEAR ©](/content/2026/05/1028692/images/aa755cd6318ea95bc3381974104d0bd0852625d5b96ef1a7ab09ad12e92f54fd.jpg)
Figure 89.
The Authentication screen shows the IP address with which the user has logged in and lets a user change his or her password.
If you do not use the DC agent in your configuration (see Understanding the ProSecure DC Agent on page 164), after completing a session, a user needs to log out by following these steps:
- Return to the User Portal Login screen (see Figure 88).
Note: The user needs to know how to return to the User Portal Login screen.
The administrator needs to provide the User Portal Login URL:
https://
https://
Alternately, the administrator can provide the NETGEAR Configuration
Manager Login screen, from which the user can access the User Portal Login
screen: https://
- Log in again.
- On the Authentication screen (see the previous figure), click the Logout link.

WARNING!
Ensure that users understand that they need to log out after completing a session in order to prevent subsequent users from inheriting access privileges that were not assigned to them.
In addition to authentication through the STM's local user database, the STM supports the following external authentication methods for users logging in through the User Portal Login screen:
- LDAP. A network-validated domain-based authentication method that functions with a Lightweight Directory Access Protocol (LDAP) authentication server. LDAP is a standard for querying and updating a directory. Because LDAP supports a multilevel hierarchy (for example, groups or organizational units), this information can be queried to provide specific group policies or bookmarks based on LDAP attributes.
- Active Directory. A network-validated domain-based authentication method that functions with a Microsoft Active Directory authentication server. Microsoft Active Directory authentication servers support a group and user structure. Because the Active Directory supports a multilevel hierarchy (for example, groups or organizational units), this information can be queried to provide specific group policies or bookmarks based on Active Directory attributes. A Microsoft Active Directory database uses an LDAP organization schema.
- RADIUS. A network-validated PAP or CHAP password-based authentication method that functions with Remote Authentication Dial In User Service (RADIUS).
RADIUS supports two types of protocols:
- PAP. Password Authentication Protocol (PAP) is a simple protocol in which the client sends a password in clear text.
- CHAP. Challenge Handshake Authentication Protocol (CHAP) executes a three-way handshake in which the client and server trade challenge messages, each responding with a hash of the other's challenge message that is calculated using a shared secret value.
When logging in through the User Portal Login screen, users need to provide their name and password, and select the domain that corresponds to the authentication method that has been assigned to them.
Understanding Active Directories and LDAP Configurations
This manual assumes that you already have a knowledge of Active Directories and LDAP servers. The following sections are meant to provide some additional information before you go to Creating and Deleting LDAP and Active Directory Domains on page 161.
How an Active Directory Works
Understanding how a typical Active Directory (AD) works might be of help when you are specifying the settings for the LDAP and Active Directory domains on the STM.
The following applies to a typical AD:
- Organizational unit (OU), common name (CN), and domain controller (DC) can all be used to build a search base in the AD. The following applies to the OU and CN containers:
- An AD administrator can create an OU but cannot create a CN that was built in the AD server.
- An AD administrator can apply a global policy object (GPO) to an OU but not to a CN.
- An OU is created in the root node (for example, dc=companyname, dc=com) of the hierarchy. In a company AD, an OU often represents a regional office or department.
• A group is created under cn=users. - A user is created under each OU so that the user can logically show in a tree of the AD server.
- A relationship between a group and users is built using their attributes (by default: member and memberOf). These show in a lookup result.
The following is an example of how to set the search base:
If in a company AD server “cn=users” and “ou=companyname” and both are specified under “dc=companyname,dc=com,” the search base needs to be set as “dc=companyname,dc=com” in order for the STM to search both users and groups.
If the size limit is exceeded so that "dc=companyname, dc=com" misses some entries during the lookup process, a user can still be correctly authenticated. However, to prevent the size limit from being exceeded, an AD administrator needs to set a larger value in the LDAP server configuration so that the entire list of users and groups is returned in the lookup result. Another workaround is to use a specific search name or a name with a wildcard in the lookup process, so that the subset of the entire list is returned in the lookup result.
How to Bind a Distinguished Name in an LDAP Configuration
Understanding how to bind a distinguished name (DN) in an LDAP configuration might be of help when you are specifying the settings for the LDAP and Active Directory domains on the STM.
To bind a user with the name Jamie Hanson with the LDAP server:
Note: In this example, the LDAP domain name is ABC.com, and the LDAP server has the IP address 192.168.35.115 on port 389.
- On a computer that has access to the Active Directory (AD), open the Active Directory for Users and Computers.
-
Select the user Jamie Hanson.
-
Click the General tab. The general properties for Jamie Hanson display:

Figure 90.
- To verify Jamie Hanson's user login name, click the Account tab. The account properties for Jamie Hanson display:

Figure 91.
- Log in to the STM.
-
Select User Management > Authentications from the menu. The LDAP screen displays.
-
In the List of LDAP table, click the Edit button in the Action column of domain ABC.com. The Edit LDAP screen displays.
-
To bind the user Jamie Hanson to the LDAP server for authentication on the STM, use one of the following two formats in the Bind DN field of the Edit LDAP screen:
- The display name in DN format: cn=Jamie Hanson, cn=users, dc=testAD, dc=com (see the example in the following figure).

Figure 92.
- The Windows account name in email format such as jhanson@testAD.com. (The following figure shows only the Bind DN field.)

Figure 93.
-
Click Test to verify that the LDAP server can actually function with the bind DN that you have modified. The automated test procedure checks the connection to the LDAP server, the bind DN, and the bind password. If any settings require changes, you are notified at the end of the automated test procedure.
-
Click Apply to save your settings.
Creating and Deleting LDAP and Active Directory Domains
To configure LDAP and Active Directory authentication:
- Select User Management > Authentication from the menu. The authentication submenu tabs display with the LDAP screen in view:

Figure 94.
The List of LDAP table displays the following fields:
- Domain Name. The name of the STM's domain to which the server has been assigned.
• Server. The IP address of the LDAP or Active Directory server. -
Action. The Edit table button, which provides access to the Edit LDAP screen, and the Delete table button, which allows you to delete the LDAP or Active Directory server.
-
Complete the fields and make your selections from the drop-down list as explained in the following table:
Table 47. LDAP Settings
| Setting Description | |
| Domain A descriptive (alphanumeric) name of the LDAP or Active Directory authentication server for identification and management purposes. | |
| Server The server | IP address or server host name of the LDAP or Active Directory authentication server. |
| Encryption From | the drop-down list, select the encryption type for the connection between the STM and the LDAP or Active Directory server:None. The connection is not encrypted. This is the default setting.TLS. The connection uses Transport Layer Security (TLS) encryption.SSL. The connection uses Secure Socket Layer (SSL) encryption. |
| Port The port number for the LDAP or Active Directory authentication server. The default port for the LDAP server is 389, which is generally the default port for TLS encryption or no encryption. When the encryption is SSL, the default port is generally 636. | |
| Bind DN The LDAP | or Active Directory bind distinguished name (DN) that is required to access the LDAP or Active Directory authentication server. This bind DN needs to be a user in the LDAP or Active Directory directory that has read access to all the users that you would like to import into the STM. The Bind DN field accepts two formats:A display name in the DN format. For example: cn=Jamie Hanson,cn=users,dc=test,dc=com.A Windows login account name in email format. For example: jhanson@testAD.com. This last type of bind DN can be used only for a Windows Active Directory server. |
| Bind Password The authentication secret or password that is required to access the LDAP or Active Directory authentication server. | |
| Search Base The | distinguished name (DN) at which to start the search, specified as a sequence of relative distinguished names (rdn), connected with commas and without any blank spaces. For most users, the search base is a variation of the domain name. For example, if your domain is yourcompany.com, your search base DN might be as follows: dc=yourcompany,dc=com. |
| UID Attribute The | attribute in the LDAP directory that contains the user's identifier (uid).For an Active Directory, enter sAMAccountName.For an OpenLDAP directory, enter uid. |
| Member Groups Attribute | This field is optional. The attribute that is used to identify the groups an entry belongs to. For an Active Directory, enter memberOf.For OpenLDAP, you can enter a customized attribute to identify the groups of an entry. |
| Group Members Attribute | This field is optional. The attribute that is used to identify the members of a group.For an Active Directory, enter member.For OpenLDAP, you can enter a customized attribute to identify the members of a group. |
| Additional Filter T | This field is optional. A filter that is used when searching the LDAP server for matching entries while excluding others. (Use the format described by RFC 2254.)The following search term examples match users only:Active Directory: objectClass=userOpen LDAP: objectClass=posixAccount |
- Click Test to verify that the LDAP server can actually function with the LDAP settings that you have specified. The automated test procedure checks the connection to the LDAP server; the bind DN, and the bind password. If any settings require changes, you are notified at the end of the automated test procedure.
Note: If the automated test procedure returns the message “LDAP server test passed but size limit exceeded,” only a limited number of entries (for example, 1000) was returned after the LDAP server was queried. To ensure that the lookup results include all users and groups, set larger values in the LDAP server. Another workaround is to use a specific search name or a name with a wildcard in the lookup process, so that the subset of the entire list is returned in the lookup result.
- Click Add to save your settings. The LDAP or Active Directory domain and server are added to the List of LDAP table.
To delete a domain and server from the List of LDAP table, click the Delete table button in the Action column for the domain and server that you want to delete.

WARNING!
After their sessions have expired, users can no longer log in to the STM if the domain that has been assigned to them is the domain that you deleted.
Editing LDAP and Active Directory Domains
To edit an LDAP or Active Directory domain:
- Select User Management > Authentication from the menu. The authentication submenu tabs display with the LDAP screen in view (see Figure 94 on page 161).
- In the Action column of the List of LDAP table, click the Edit table button for the domain and server that you want to edit. The Edit LDAP screen displays. This screen contains the same fields as the LDAP screen (see Figure 94 on page 161).
- Modify the fields and make your selections from the drop-down list as explained in Table 47 on page 162.
- Click Test to verify that the LDAP server can actually function with the LDAP settings that you have modified. The automated test procedure checks the connection to the LDAP server, the bind DN, and the bind password. If any settings require changes, you are notified at the end of the automated test procedure.
- Click Apply to save your settings.
Understanding the ProSecure DC Agent
If you set up an open network, you would want to allow unauthenticated users to surf anonymously. For a secure network, you would use a more restrictive access policy for unauthenticated users and a less restricted access policy for authenticated users.
Without the use of the DC agent, any LDAP domain user surfs anonymously until providing credentials to the STM in order to proceed past a blocked Web activity. With use of the DC agent, LDAP domain users are immediately known to the STM when they are authenticated on a DC server on which the DC agent is installed.
If the LDAP directory authenticates through a domain controller (DC) server that runs Windows Server 2003 with Service Pack 1 (SP1) or Windows Server 2008, you can use the ProSecure DC Agent software to authenticate LDAP domain users.
The DC agent monitors all Windows login events (that is, all LDAP domain user authentications) on the DC server, and provides a mapping of Windows user names and IP addresses to the STM, enabling the STM to transparently apply user policies. The DC agent transfers encrypted names, IP addresses, groups, and login times of the users logged in to the STM, where this information remains securely (that is, it is not transferred out of the STM).
Requirements for the ProSecure DC Agent Software and DC Agent Server
Note the following requirements for the ProSecure DC agent software and domain controller (DC) servers:
- If the DC server is located behind a firewall or there is a firewall on the DC server, ensure that the firewall does not block the server's listening port. The default port that is used by the DC agent is 5182.
-
The DC agent needs to be able to automatically log an account login event when a domain user account is authenticated against the LDAP directory on a DC server. Verify that the DC server has the following configuration:
-
The Audit Logon Events policy is defined and the Success check box is selected.
- The Audit Account Logon Events policy is defined and the Success check box is selected.
- The Audit Account Management policy is defined and the Success check box is selected.
In addition, if you change the log path of the security log, restart the DC server to bring the change into effect.
- If you use the ProSecure DC Agent software on a DC server that is running Windows Server 2003, ensure that Window's Security Log settings in the Event Viewer are set to the maximum size of 16 MB and to overwrite events as needed.
Downloading ProSecure DC Agent Software, and Creating and Deleting DC Agents
When new ProSecure DC Agent software is available, the STM automatically downloads the software from the update server and notifies administrative users in several ways:
• The STM sends an email to administrative users.
• The STM records a syslog entry.
- The STM generates a notification screen that is presented to administrative users upon login.
To download ProSecure DC Agent software and add a DC agent:
- Select User Management > Authentication from the menu. The authentication submenu tabs display with the LDAP screen in view. Locate the List of DC Agents table at the bottom of the screen. (See this section of the screen in the following figure.)
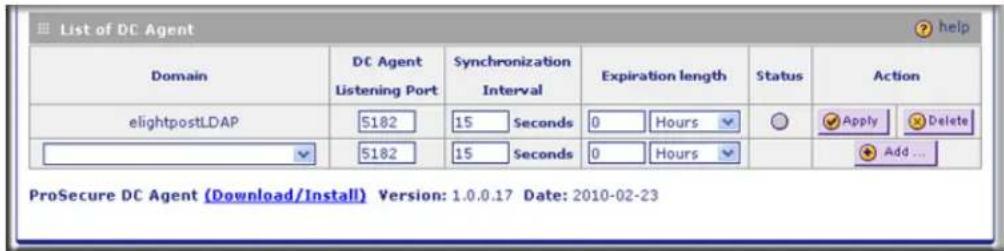
Figure 95.
- Under the List of DC Agents table, click the Download/Install link to download the ProSecure DC Agent software. Follow the instructions of your browser to save the software file to your computer.
- Install the ProSecure DC Agent software on each domain controller (DC) server through which the LDAP directory authenticates users.
- Complete the fields and make your selections from the drop-down lists as explained in the following table:
Table 48. DC Agent Settings
| Setting Description | |
| Domain From the Domain drop-down list, select an LDAP domain to bind with the DC agent. For information about configuring LDAP domains, see Creating and Deleting LDAP and Active Directory Domains on page 161. | |
| DC Agent Listening Port | Enter the listening port of the DC agent. The listening port is the port through which the DC agent transfers the list of authenticated users to the STM. The default port is 5182. |
| Synchronization Interval | Enter the time interval (in seconds) at which the DC agent updates the list of authenticated users. The default interval is 15 seconds. |
| Expiration length Enter time interval in hours or minutes (determined by your selection from the Expiration length drop-down list) that is allowed to elapse before a user login expires. The default setting is zero (0), that is, a user login does not expire. | |
| Status Displays the status of the DC agent: A green circle indicates that the DC agent is active; a gray circle indicates that the DC agent is inactive. | |
- To add the newly configured DC agent to the List of DC Agents table, click the Add table button in the Action column.
For each DC agent in the List of DC Agents table, the Action column provides two table buttons:
• Apply. Activates the DC agent. The circle in the Status column turns green.
- Delete. Deletes the DC agent from the table.
To edit a DC agent:
- In the Domain column, locate the DC agent that you want to edit, and make changes in the columns to the right of the Domain column.
- Click Apply to save your changes.
Creating and Deleting RADIUS Domains
To configure RADIUS authentication:
-
Select User Management > Authentication from the menu. The authentication submenu tabs display with the LDAP screen in view.
-
Click the RADIUS submenu tab. The RADIUS screen displays. (The following figure contains two examples.)

Figure 96.
The List of RADIUS table displays the following fields:
- Domain. The name of the STM's domain to which the server has been assigned.
• Server. The IP address of the RADIUS server. -
Action. The Edit table button, which provides access to the Edit RADIUS screen, and the Delete table button, which allows you to delete the RADIUS server.
-
Complete the fields and make your selections from the drop-down list as explained in the following table:
Table 49. RADIUS Settings
| Setting Description | ||
| Domain A descriptive (alphanumeric) name of the RADIUS authentication server for identification and management purposes. | ||
| Server The server | IP address or server host name of the RADIUS authentication server. | |
| Port The port number for the RADIUS authentication server. The default port for the RADIUS server is 1812. | ||
| Shared Secret The shared secret (password) that is required to access the RADIUS authentication server. | ||
| Repeat The maximum number of times that the STM attempts to connect to the RADIUS server. The default setting is 3 times. | ||
| Timeout The period after which an unsuccessful connection attempt times out. The default setting is 5 seconds. | ||
| Authentication Type | From the drop-down list, select the encryption type for the connection between the STM and the LDAP or Active Directory server:• PAP. The connection uses the Password Authentication Protocol (PAP). This is the default setting.• CHAP. The connection uses the Challenge Handshake Authentication Protocol (CHAP). | |
| Use the following user account to test RADIUS settings | Select this check box to test the RADIUS settings with the user name and password that you need to specify. | |
| User Name The | user name to test the RADIUS settings with. | |
| Password The p | password to test the RADIUS settings with. | |
- Click Test to verify that the RADIUS server can actually function with the RADIUS settings that you have specified. The automated test procedure checks the connection to the RADIUS server, the user name, and the password. If any settings require changes, you are notified at the end of the automated test procedure.
- Click Apply to save your settings. The RADIUS domain and server are added to the List of RADIUS table.
To delete a domain and server from the List of RADIUS table, click the Delete table button in the Action column for the domain and server that you want to delete.

WARNING!
After their sessions have expired, users can no longer log in to the STM if the domain that has been assigned to them is the domain that you deleted.
Editing RADIUS Domains and Configuring VLANs
To edit a RADIUS domain:
- Select User Management > Authentication from the menu. The authentication submenu tabs display with the LDAP screen in view.
- Click the RADIUS submenu tab. The RADIUS screen displays (see Figure 96 on page 167).
- In the Action column of the List of RADIUS table, click the Edit table button for the domain and server that you want to edit. The Edit Radius screen displays. (The following figure contains some examples.)

Figure 97.
- Modify the fields and make your selections from the drop-down list as explained in Table 49 on page 168.
- Click Test to verify that the RADIUS server can actually function with the RADIUS settings that you have modified. The automated test procedure checks the connection to the RADIUS server, the user name, and the password. If any settings require changes, you are notified at the end of the automated test procedure.
- Click Apply to save your settings.
Creating and Deleting VLANs for Use with RADIUS Domains
After you have created a RADIUS domain by specifying a RADIUS server, you can add a virtual LAN (VLAN), and then set access exceptions for the logged-in RADIUS users (see Setting Access Exception Rules for Web Access on page 132).
In order to use the VLAN to set access exceptions on the STM, the following is required:
• You need to have defined a VLAN policy on another platform.
• You need to have added users to the VLAN policy.
• The RADIUS server needs to contain VLAN attributes in its user information.
At the bottom of the Edit Radius screen (see the previous figure, which contains one VLAN example), the List of VLAN table displays the following fields:
• VLAN ID/Name. The identifier or name for the VLAN.
- Brief Description. An optional brief description of the VLAN.
• Action. The Delete table button, which allows you to delete the VLAN.
To add a VLAN:
-
On the Edit Radius screen, locate the Add New VLAN ID/Name section at the very bottom of the screen. Specify the VLAN:
a. In the VLAN ID/Name field, enter the identifier or the name of the VLAN.
b. In the Brief Description field, enter a description of the VLAN. This field is optional. -
Click the Add table button. The new VLAN is added to the List of VLAN table.
To delete a user from the List of VLAN table, click the Delete table button in the Action column for the VLAN that you want to delete.
Global User Settings
You can globally set the user session settings for authenticated users. These settings include the session expiration period, the allowed session idle time, and the default domain that is presented to the users.
To specify the global user configuration settings:
- Select User Management > Configuration from the menu. The Configuration screen displays:

Figure 98.
- Locate the Sessions Parameters section on screen. Specify the session settings:
- Session Expiration Length. The period after which a session expires and a user needs to log in again. This setting applies to all users. From the drop-down list, select either Minutes or Hours. Then, in the field to the left of the drop-down list, enter a number for the minutes or hours. The session expiration length cannot exceed the idle time period.
Note: For information about how to set the time-out period for the Web Management Interface, see Changing Administrative Passwords and Timeouts on page 62.
- Idle Time. The period after which an idle connection is terminated and a user needs to log in again. This setting applies to all users. From the drop-down list, select either Minutes or Hours. Then, in the field to the left of the drop-down list, enter a number for the minutes or hours. The idle time period cannot exceed the session expiration length.
-
Click Apply to save the session settings.
-
Locate the Users Portal Login Settings section on screen. Specify the default domain settings:
- From the Default Domain drop-down list, select a domain that is presented as the default domain on the User Portal Login screen. The default domain that is presented is prosecutedomain. Users can still select another domain (if there are other domains configured on the STM) from the drop-down list on the User Portal Login screen.
- Select the Authenticate User with User Selected Domain check box to limit the authentication on the User Portal Login screen to the domain that you select from the Default Domain drop-down list. If you do not select this check box, the STM attempts to authenticate users through all the domains that are listed in the drop-down list on the User Portal Login screen; when authentication through one domain fails, the STM attempts authentication through another domain.
- Click Apply to save the default domain settings.
Viewing and Logging Out Active Users
A user with administrative privileges can view the active users and log out selected or all active users.
To log out all active users:
- Select User Management > Active Users from the menu. The Active Users screen displays:

Figure 99.
- Click the Logout All Users button in the gray settings bar at the top of the Active Users screen.
To view all or selected users:
- On the Active Users screen (see the previous figure), select one of the following radio buttons:
• View All. This selection returns all active users after you click the Search button.
- Search Criteria. This selection lets you enter the following search criteria so that only selected users are returned after you click the Search button. Use either the IP Address field or the Domain and User fields. The setting of the Login Type check boxes affects both the IP address search method and the domain and user search method.
- IP Address. Enter an IP address or an IP address and subnet mask in Classless Inter-Domain Routing (CIDR) notation (for example, /024).
- Domain. Enter a domain (for example, proescuredomain).
- User. Enter a user name (for example, JackP). If you do not enter a user name, all users of the specified domain are displayed in the search results.
-
Login Type. Select the DC Agent check box to display only users who logged in through the DC agent in the search results. Select the User Portal check box to display only users who logged in through the user portal search results. By default, both check boxes are selected.
-
In the Display field, enter a number to specify how many entries per page the search result screen returns.
-
Click Search. The search results screen displays. (The following figure contains some examples.)

Figure 100.
The List of Users table displays the following fields:
• IP Address. The IP address that is associated with the user.
• Domain. The domain to which the user belongs.
• User. The user name.
• Groups. The groups to which the user belongs, if any.
- Last Seen. The most recent time that scanned traffic associated with the user (that is, IP address) passed through the STM.
- Login Type. The method through which the user logged in (DC agent or user portal).
To log out selected active users:
- On the search results screen select the check boxes to the left of the users that you want to log out.
- Click Logout.
Monitoring System Access and Performance
This chapter describes the system monitoring features of the STM. You can be alerted to important events such as attacks and login failures. You can also view the system status and real-time traffic and security information. In addition, the diagnostics utilities are described.
Note: All email notification functions that are part of the Logs, Reports, and Alerts menus, and some of the functions that are part of the Diagnostics configuration menu require that you configure the email notification server—see Configuring the Email Notification Server on page 176.
This chapter contains the following sections:
- Configuring Logging, Alerts, and Event Notifications on this page
• Monitoring Real-Time Traffic, Security, Statistics, and Web Usage on page 184
• Viewing System Status on page 192
• Querying Logs on page 194
• Viewing, Scheduling, and Generating Reports on page 200
• Viewing and Managing the Quarantine Files on page 208
• Using Diagnostics Utilities on page 215
Configuring Logging, Alerts, and Event Notifications
You can configure the STM to email logs and alerts to a specified email address. For example, the STM can email security-related events such as malware incidents, infected clients, and failed authentications. By default, the STM logs content filtering events such as attempts to access blocked sites and URLs, unwanted email content, spam attempts, and many other types of events.
For you to receive the logs in an email message, the STM's notification server needs to be configured and email notification needs to be enabled. If the notification server is not configured or email notification is disabled, you can still query the logs and generate log reports to view on the Web Management Interface or to save in CSV format.
For more information about logs, see Querying Logs on page 194.
Configuring the Email Notification Server
If you have used the Setup Wizard, you might have already configured the email notification server; the Email Notification Server screen allows you to modify these settings.
The STM can automatically send information such as notifications and reports to an administrator. You need to configure the necessary information for sending email, such as the administrator's email address, the email server, user name, and password.
To configure the email notification server:
- Select Global Settings > Email Notification Server from the menu. The Email Notification Server screen displays. (The following figure contains some examples.)

Figure 101.
- Complete the fields, select the radio button and check boxes, and make your selections from the drop-down lists as explained in the following table:
Table 50. Email Notification Settings
| Setting Description (or Subfield and Description) | |
| Show as Mail Sender A | descriptive name of the sender for email identification purposes. For example, enter stm600notification@netgear.com. |
| Send Notifications to The | email address to which the notifications should be sent. Typically, this is the email address of a user with administrative privileges. |
| SMTP server The IP address and port number or Internet name and port number of your ISP's outgoing email SMTP server. The default port number is 25.Note: If you leave this field blank, the STM cannot send email notifications. | |
| Mail Server Requires Authentication | If the SMTP server requires authentication, select the Mail Server Requires Authentication check box and enter the following settings: |
| User Name The user name for SMTP server authentication. | |
| Password The password for SMTP server authentication. | |
3. Click Apply to save your settings.
Configuring and Activating System, Email, and Syslog Logs
You can configure the STM to log system events such as a change of time by an NTP server, secure login attempts, restarts, and other events. You can also send logs to the administrator or schedule logs to be sent to the administrator or to a syslog server on the network. In addition, the Log Management screen provides the option to selectively clear logs. Because this large screen has three sections, each with its own Apply button, this screen is presented in this manual in three figures (the following figure, Figure 103 on page 180, and Figure 104 on page 182).
Emailing Logs
To enable and configure logs to be sent to an email address:
- Select Monitoring > Logs from the menu. The Logs submenu tabs display, with the Log Management screen in view (see the following figure, Figure 103 on page 180, and Figure 104 on page 182).
- Locate the Email Logs to Administrator section on the screen. Select the Enable check box to enable the STM to send logs to an email address.

Figure 102. Log Management, screen 1 of 3
- Complete the fields, select the radio button and check boxes, and make your selections from the drop-down lists as explained in the following table:
Table 51. Email Logs Settings
| Setting Description | (or Subfield and Description) |
| Send to The email | address of the recipient of the log file. This is normally a user with administrative privileges. You enter up to three email address, separated by commas.Click Send Now to immediately send the logs that you first need to have specified (see the information later in this table).Note:To limit the size of the email, the STM does not send the actual logs to the specified email address but an email that contains links to the actual logs. These links remain active for a period of 10 days, after which the logs are no longer available. |
| Frequency Select | a radio button to specify how often the log file is sent:When the space is full.Logs are sent when the storage space that is assigned to the logs is full.Daily.Logs are sent daily at the time that you specify from the drop-down lists (hours and minutes).Weekly.Logs are sent weekly at the day and time that you specify from the drop-down lists (weekday, hours, and minutes). |
| Setting Description (or Subfield and Description) | |
| Select Logs to Send | Select the check boxes to specify which logs are sent via email:System logs. The system event logs that include all system errors, informational messages, configuration changes, and system software updates.Email traffic logs. All scanned incoming and outgoing email traffic.Web traffic logs. All scanned incoming and outgoing Web traffic.Malware logs. All intercepted viruses and spyware.Spam logs. All intercepted spam, including spam that was detected through the blacklist, real-time blacklist, and distributed spam analysis.Email filter logs. All emails that are intercepted because of keyword, file type, file name, password, or size limit violations.Content filter logs. All websites, URLs, and FTP sites that are intercepted because of Web category, blacklist, file type, or size limit violations.Application logs. All intercepted application access violations. |
| Select the types of system logs that are sent via email:error. All system errors.info. All informational messages.conf. All configuration changes.update. All system software updates. | |
| Format Select a radio button to specify the format in which the log file is sent:Plain text. The log file is sent as a plain text file.CSV. The log file is sent as a comma-separated values (CSV) file. | |
| Size Select the Split logs size to check box to break up the log file into smaller files, and specify the maximum size of each file in MB. The default setting is 20 MB. | |
- Click Apply to save your settings.
Sending Logs to a Syslog Servers
To enable and configure logs to be sent to a syslog server:
- Select Monitoring > Logs from the menu. The Logs submenu tabs display, with the Log Management screen in view (see Figure 102 on page 178).
- Locate the Send Logs via Syslog section on the screen (see the following figure), and select the Enable check box to enable the STM to send logs to a syslog server.

Figure 103. Log Management, screen 2 of 3
- Complete the fields, select the check boxes, and make your selections from the drop-down lists as explained in the following table:
Table 52. Syslog Settings
| Setting Description | IP address the syslog server. |
| Port The port number that the syslog server uses to receive logs. The default port number is 514. | |
| Logs Select the check boxes to specify which logs are sent to the syslog server: ·System logs. The system event logs that include all system errors, informational messages, configuration changes, and system software updates. ·Email traffic logs. All scanned incoming and outgoing traffic. ·Web traffic logs. All scanned incoming and outgoing traffic. ·Malware logs. All intercepted viruses and spyware. ·Spam logs. All intercepted spam, including spam that was detected through the blacklist, real-time blacklist, and distributed spam analysis. ·Email filter logs. All emails that are intercepted because of keyword, file type, file name, password, or size limit violations. ·Content filter logs. All websites, URLs, and FTP sites that are intercepted because of Web category, blacklist, file type, or size limit violations. ·Application logs. All intercepted application access violations. | |
| Setting Description (or Subfield and Description) | |
| Facility The facility indicates from which internal part of the STM the log message originates. For each log that you have selected to be sent to the syslog server (see earlier in this table), select one of the following facilities from the drop-down list:auth. Security and authorization log messages.authpriv. Security and authorization log messages for sensitive information.cron. Clock daemon log messages.deamon. Other daemon log messages.ftp. FTP log messages.kern. Kernel log messages.local0 through local7. Locally defined log messages (1 through 7).lpr. Line printer subsystem log messages.mail. Mail subsystem log messages.news. Usenet news subsystem log messages.syslog. Log messages that are generated internally by the syslog server (syslogd).user. Generic user-level log messages.uucp. Unix-Unix copy (UUCP) subsystem log messages. | |
| Priority For each log that you have selected to be sent to the syslog server (see earlier in this table), select one of the following severities from the drop-down list:emerg. The STM is unusable.alert. An action needs to be taken immediately.crit. There are critical conditions.err. There are error conditions.warning. There are warning conditions.notice. There are normal but significant conditions.info. Informational messages.debug. Debug-level messages.Note: All the logs with a severity that is equal to and above the severity that you specify are logged on the specified syslog server. For example, if you select crit as the severity, then the logs with the severities crit, alert, and emerg are logged. | |
- Click Apply to save your settings.
Clearing Logs
To clear logs:
- Select Monitoring > Logs from the menu. The Logs submenu tabs display, with the Log Management screen in view (see Figure 102 on page 178). Locate the Clear the Following Log Information section at the bottom of the screen:

Figure 104. Log Management, screen 3 of 3
- Select one ore more check boxes to specify which logs are cleared:
• System. The system event logs are cleared.
- Email traffic. The logs with scanned incoming and outgoing email traffic are cleared.
• Web traffic. The logs with scanned incoming and outgoing Web traffic are cleared.
• Malware. The logs with intercepted viruses and spyware are cleared.
- Spam. The logs with intercepted spam are cleared.
- Email filter. The logs with intercepted emails are cleared.
• Content filter. The logs with intercepted websites, URLs, and FTP sites are cleared.
• Application. The logs with intercepted applications are cleared.
- Click Clear Log Information.
Configuring Alerts
You can configure the STM to send an email alert when a failure, license expiration, or malware attack or outbreak occurs. Four types of alerts are supported:
- Update Failure Alert. Sent when an attempt to update any component such as a pattern file or scan engine firmware fails.
- License Expiration Alerts. Sent when a license is about to expire and then again when a license has expired.
• Malware Alert. Sent when the STM detects malware threats. - Malware Outbreak Alert. Sent when the malware outbreak criteria that you have configured are reached or exceeded. Outbreak criteria are based on the number of malware threats detected within a specified period of time.
To configure and activate the email alerts:
- Select Monitoring > Alerts from the menu. The Alerts screen displays:
Figure 105.
- Select the check boxes and complete the fields as explained in the following table:
Table 53. Alerts Settings
| Setting Description (or Subfield and Description) | ||
| Enable UpdateFailure Alerts | Select this check box to enable update failure alerts. | |
| Enable LicenseExpiration Alerts | Select this check box to enable update license expiration alerts. | |
| Enable MalwareAlerts | Select this check box to enable malware alerts, and configure the Subject and Message fields. | |
| Subject Enter the subject line for the email alert. The default text is [Malware alert]. | ||
| Message Enter the content for the email alert. The default text is %VIRUSINFO%, which is the metaword that enables the STM to insert the correct malware threat information.Note: In addition to the %VIRUSINFO% metaword, you can insert the following metawords in your customized message:%TIME%, %PROTOCOL%, %FROM%, %TO%, %SUBJECT%, %FILENAME%, %ACTION%, %VIRUSNAME%. | ||
| Setting Description | (or Subfield and Description) | |
| Enable Malware Outbreak Alerts | Select this check box to enable malware outbreak alerts, and configure the Outbreak Criteria, Protocol, and Subject fields. | |
| Outbreak Criteria | To define a malware outbreak, specify the following fields:malware found within.The number of malware incidents that are detected.minutes (maximum 90 minutes). The period in which the specified number of malware incidents are detected.Note:When the specified number of detected malware incidents is reached within the time threshold, the STM sends a malware outbreak alert. | |
| Protocol | Select the check box or check boxes to specify the protocols (SMTP, POP3, IMAP, HTTP, HTTPS, and FTP) for which malware incidents are detected. | |
| Subject Enter the subject line for the email alert. | ||
3. Click Apply to save your settings.
Monitoring Real-Time Traffic, Security, Statistics, and Web Usage
You can monitor the real-time traffic, security events, and statistics from the Dashboard screen. The Web Usage screen displays which hosts on your network are consuming the most resources.
Understanding the Information on the Dashboard Screen
When you start up the STM, the default screen that displays is the Dashboard screen, which lets you monitor the following items:
• CPU, memory, and hard disk status
• The number of active connections per protocol
• The total malware threats and the malware threats over the last seven days
• Total scanned services traffic over the last seven days
• Statistics for the most recent five and top five malware threats detected, applications blocked, Web categories blocked, and spam emails blocked
- The real-time security scanning status with detected network traffic, detected network threats, and service statistics for the six supported protocols (HTTP, HTTPS, FTP, SMTP, POP3, and IMAP)
• Interface statistics
To display the Dashboard screen, select Monitoring > Dashboard from the menu. The Dashboard submenu tabs display with the Dashboard screen in view. Because of the size of this screen, it is divided and presented in this manual in three figures (the following figure, Figure 107 on page 187, and Figure 108 on page 189), each with its own table that explains the fields.

Figure 106. Dashboard, screen 1 of 3
Except for setting the poll interval and clearing the statistics, you cannot configure the fields on the Dashboard screen. Any changes need to be made on other screens.
To set the poll interval:
- Click the Stop button.
- From the Poll Interval drop-down list, select a new interval (the minimum is 5 seconds, the maximum is 5 minutes).
- Click the Set Interval button.
To clear the statistics, click Clear Statistics.
The following table explains the fields of the Status, Total Threats, and Threats (Last 7 Days) sections of the Dashboard screen:
Table 54. Dashboard: Status, Total Threats, and Threats (Last 7 Days) Information
| Item Description | tion |
| Status | |
| System The current CPU, memory, and hard disk usage. When usage is within safe limits, the status bars show green. | |
| Services The protocols that are being scanned for malware threats. ON, OFF, or HALT is stated next to the protocol, and the number of active connections for each protocol.ON indicates that protocol is scanned; OFF indicates that the protocol is not scanned; HALT indicates that you enabled protocol scanning but the protection license has expired. | |
| Active Connections | The number of active connection per protocol. |
| Application Control | ON indicates that application control is enabled; OFF indicates that application control is disabled; HALT indicates that you enabled application control but the protection license has expired.For information about how to configure application control, seeConfiguring Application Control on page 127. |
| Total Threats (Since Last Clear) | |
| Email Displays the total number of:Scanned (emails).Files blocked (seeEmail Content Filteringon page 94).Quarantined (seeEmail Content Filteringon page 94).Malware detected (seeCustomizing Email Anti-Virus Settingson page 88).Spam (seeProtecting Against Email Spamon page 97). | |
| Web Displays the total number of:Scanned (files).Files blocked (seeConfiguring Web Content Filteringon page 109).Quarantined (seeConfiguring Web Content Filteringon page 109).Malware detected (seeConfiguring Web Malware Scanson page 107).URLs blocked (seeConfiguring Web URL Filteringon page 116). | |
| Item Description | |
| Application Displays the total number of:IM blocked.Tools blocked.Media blocked.P2P blocked.Note: For information about how to configure these applications, seeConfiguring Application Control on page 127. | |
| Threats (Last 7 Days) | |
| This is a graphic that shows the relative number of threats and access violations over the last week, using different colors for the various applications:Note: IMBlock stands for instant messaging applications blocked; P2PBlock stands for peer-to-peer applications blocked. | |
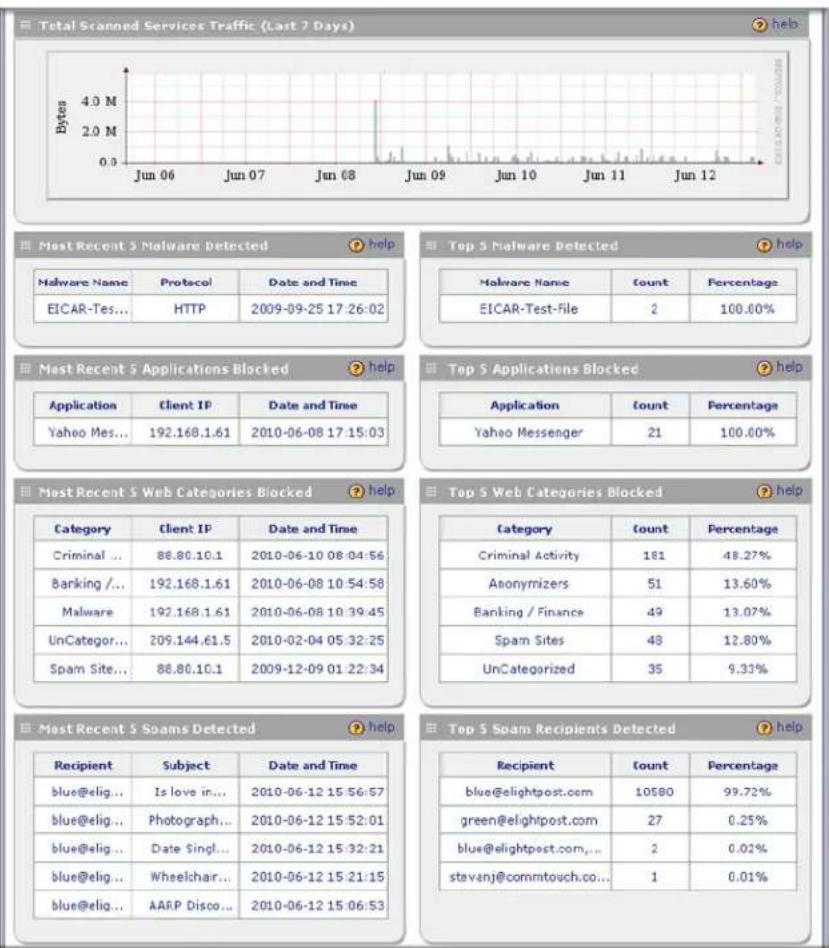
Figure 107. Dashboard, screen 2 of 3
The following table explains the fields of the Total Scanned Services Traffic, Most Recent 5, and Top 5 sections of the Dashboard screen:
Table 55. Dashboard: Total Scanned Services Traffic and Most Recent 5 and Top 5 Information
| Item Description | ||
| Total Scanned Services Traffic (Last 7 Days) | ||
| This is a graphic that shows the relative number of traffic in bytes over the last week. | ||
| Category Most Recent 5 Description Top 5 Description | ||
| Malware •Malware Name. The name of the malware threat.•Protocol. The protocol in which the malware threat was detected.•Date and Time. The date and time that the malware threat was detected. | •Malware Name. The name of the malware threat.•Count. The number of times that the malware threat was detected.•Percentage. The percentage that the malware threat represents in relation to the total number of detected malware threats. | |
| Application •Application. The name of the application that was blocked.•Client IP. The client IP address from which the application request came.•Date and Time. The date and time that the application request was blocked. | •Application. The name of the application that was blocked.•Count. The total number of user requests for the blocked application.•Percentage. The percentage that the application represents in relation to the total number of detected application requests. | |
| Web •Category. The Web category that was blocked.Note: For more information about Web categories, seeConfiguring Web Content Filtering on page 109.•Client IP. The client IP address from which the Web request came.•Date and Time. The date and time that the Web request was blocked. | •Category. The Web category that was blocked.Note: For more information about Web categories, seeConfiguring Web Content Filtering on page 109.•Count. The total number of Web requests for the blocked Web category.•Percentage. The percentage that the Web category represents in relation to the total number of blocked Web categories. | |
| Spam •Recipient. The intended recipient of the spam message.•Subject. The email subject line in the spam message.•Date and Time. The date and time that the spam message was detected. | •Recipient. The intended recipient of the spam message.•Count. The number of spam messages for the intended recipient.•Percentage. The percentage that the spam message represents in relation to the total number of detected spam messages. | |
| Protocol | HTTP | SMTP | POP3 | FTP | HTTPS | IMAP |
| Total Scanned Traffic (MB) | 400.36 | 936.08 | 0.00 | 6.09 | 0.00 | 0.00 |
| Total Emails/Files Scanned | 182012 | 16751 | 0 | 81 | 0 | 0 |
| Total Malwares Found | 2 | 0 | 0 | 0 | 0 | 0 |
| Virus | 2 | 0 | 0 | 0 | 0 | 0 |
| Spywares | 0 | 0 | 0 | 0 | 0 | 0 |
| Total Emails/Files Blocked | 4 | 0 | 0 | 0 | 0 | 0 |
| Total Malware Quarantined | 0 | 0 | 0 | 0 | 0 | 0 |
| Total Spam Quarantined | 1 | |||||
| Total URLs Blocked | 375 | 0 | ||||
| Total Spam Emails | 14487 | 0 | ||||
| Blacklist & RBL | 2 | 0 | ||||
| Distributed Spam Analysis | 14485 | 0 |
Figure 108. Dashboard, screen 3 of 3
Note: The previous figure shows the Interface Statistics section of the STM600. The STM300 and STM150 have different interfaces (see the following table).
The following table explains the fields of the Service Statistics and Interface Statistics sections of the Dashboard screen:
Table 56. Dashboard: Service Statistics and Interface Statistics Information
| Item Description | |
| Service Statistics | |
| For each of the six supported protocols (HTTP, HTTPS, FTP, SMTP, POP3, and IMAP), this section provides the following statistics: | |
| Total Scanned Traffic (MB) | The total quantity of scanned traffic in MB. |
| Total Emails/Files Scanned | The total number of scanned emails and files. |
Table 56. Dashboard: Service Statistics and Interface Statistics Information (Continued)
| Item Description | ||
| Total Malwares Found The total number of detected malware threats. | ||
| Total Emails/Files Blocked The total number of blocked emails and files. | ||
| Total Malware Quarantined The total number of detected malware threats that were placed in quarantine. | ||
| Total Spam Quarantined The total number of spam messages that were placed in quarantine.Note: These statistics apply only to SMTP. | ||
| Total URLs Blocked The total number of URL requests that were blocked.Note: These statistics apply only to HTTP and HTTPS. | ||
| Total Spam Emails The total number of spam emails that were detected.Note: These statistics apply only to SMTP and POP3. | ||
| Distributed Spam Analysis | The total number of spam messages that were detected through distributed spam analysis (seeConfiguring Distributed Spam Analysis on page 102). | |
| Interface StatisticsSTM600: MGMT (Management), PAIR1 UPLINK, PAIR1 DOWNLINK, PAIR2 UPLINK, PAIR2 DOWNLINK.STM300: MGMT, UPLINK, DOWNLINK.STM150: LAN1, LAN2, LAN3, LAN4, WAN. | ||
| For each interface the following statistics are displayed: | ||
| Status 10BaseT Half duplex, | 10BaseT Full duplex, 100BaseT Half duplex,100BaseT Full duplex, or No Link. | |
| TX The number of transmitted packets in KB, MB, or GB (as stated on the screen). | ||
| RX The number of received packets in KB, MB, or GB (as stated on the screen). | ||
Monitoring Web Usage
The Web Usage screen shows you how the STM's Web resources are being used. You can see, for example, which host on the STM uses most resources.
To view the STM's Web usage:
-
Select Monitoring > Dashboard from the menu. The Dashboard submenu tabs display with the Dashboard screen in view.
-
Click the Web Usage submenu tab. The Web Usage screen displays:

Figure 109.
-
Use the From drop-down list to select the start date of the Web usage report (year, month, date) and the To drop-down list to select the end date of the report (year, month, date).
-
Click View. The STM generates a Web usage report.
The Web usage reports shows the following columns:
• TOP. The Web usage ranking.
• Category. The Web content filtering category.
- Requests. The number of requests for the category.
- % of Requests. The percentage of requests for the category in relation to the total number of Web requests.
• IPs. The number of IP addresses that request the category.
- % of IPs. The percentage of IP addresses that request the category in relation to the total number of IP addresses.
- Blocked. Whether or not the category is blocked by the STM.
Viewing System Status
The System Status screen provides real-time information about the following components of the STM:
- Firmware versions and update information of the STM, software versions and update information of the components, license expiration dates for each type of license, and hardware serial number
• Management interface information
• MAC addresses for the STM's interfaces
To view the System Status screen select Monitoring > System Status. The following figure displays the System Status screen of the STM600. The Interfaces section of the System Status screen differs for the STM300 and STM150 (see the explanation in the following table).

Figure 110.
The following table explains the fields of the System Information, Management Interface Information, and Interfaces sections of the System Status screen:
Table 57. System Status Information
| Setting Description | |
| System Information | |
| Firmware Information The | current version and most recent update (that is, the most recently downloaded version) for the software, scan engine, pattern file, and operating system (OS).Click + More to display the versions and most recent downloads for the antispam engine, applications engine, applications pattern file, stream engine, stream pattern file, mini engine, mini pattern file, policyd, scand, urld, update client, and rescue software. |
| Hardware Serial Number | The hardware serial number of the STM. |
| License Expiration Date T | the license keys and the expiration dates for the email protection, Web protection, and maintenance and support licenses.Note:When a license has expired, the license expiration date is displayed in red font. |
| When a license expires, a LED on the front panel of the STM blinks continuously to remind you to renew the license. To stop the blinking, click Stop LED Blinking.On the STM150: The Test LED blinks when a license expires.On the STM300 and STM600: The Status LED blinks when a license expires. | |
| Management Interface Information | |
| System Name | These fields are self-explanatory. You can configure these fields on the Network Settings screen (see Configuring Network Settings on page 52). |
| IP Address | |
| Subnet Mask | |
| Gateway IP Address | |
| Primary DNS | |
| Secondary DNS | |
| Interfaces | |
| The MAC addresses of the STM's interfaces. (The previous figure displays the System Status screen for the STM600.)STM600: MGMT (Management), PAIR1 DOWNLINK, PAIR1 UPLINK, PAIR2 DOWNLINK, PAIR2 UPLINK.STM300: MGMT, DOWNLINK, UPLINK.STM150: LAN, WAN. (The four LAN interfaces share a single MAC address.) | |
Querying Logs
The extensive log querying functions of the STM can help you to monitor the protection of the network and fine-tune the performance of the STM.
For information about emailing logs and sending logs to a syslog server, see Configuring and Activating System, Email, and Syslog Logs on page 177.
The STM generates logs that provide detailed information about malware threats and traffic activities on the network. You can search and view these logs through the Web Management Interface or save the log records in CSV or HTML format and download them to a computer (the downloading option is not available for all logs). You can also specify how many entries are displayed per page (the default setting is 15 entries).
The STM provides nine types of logs:
- Email traffic. All scanned incoming and outgoing email traffic.
• Web traffic. All scanned incoming and outgoing Web traffic.
• Virus. All intercepted viruses.
• Spyware. All intercepted spyware. - Spam. All intercepted spam, including spam that was detected through the blacklist, real-time blacklist, and distributed spam analysis.
- Email filters. All emails that are intercepted because of keyword, file type, file name, password, or size limit violations.
- Content filters. All websites, URLs, and FTP sites that are intercepted because of Web category, blacklist, file type, or size limit violations.
- System. The system event logs that include all system errors, informational messages, configuration changes, and system software updates.
• Application. All intercepted application access violations.
You can query and generate each type of log separately and filter the information based on a number of criteria. For example, you can filter the virus logs using the following criteria (other log types have similar filtering criteria):
- Start date and time
• End date and time - Protocols (HTTP, HTTPS, FTP, SMTP, POP3, and IMAP)
- Virus name
• Action (delete, quarantine, quarantine email, block email, and log) - Domain name
- User name
- Client IP address
-
Server IP address
-
Recipient email address
- URL or subject
To query and download logs:
- Select Monitoring > Logs from the menu. The Logs submenu tabs display, with the Log Management screen in view.
- Click the Logs Query submenu tab. The Logs Query screen displays (see the following figure).
Depending on the selection that you make from the Log Type drop-down list, the screen adjusts to display the settings for the selected type of log. The following figure displays the Virus log information settings as an example.
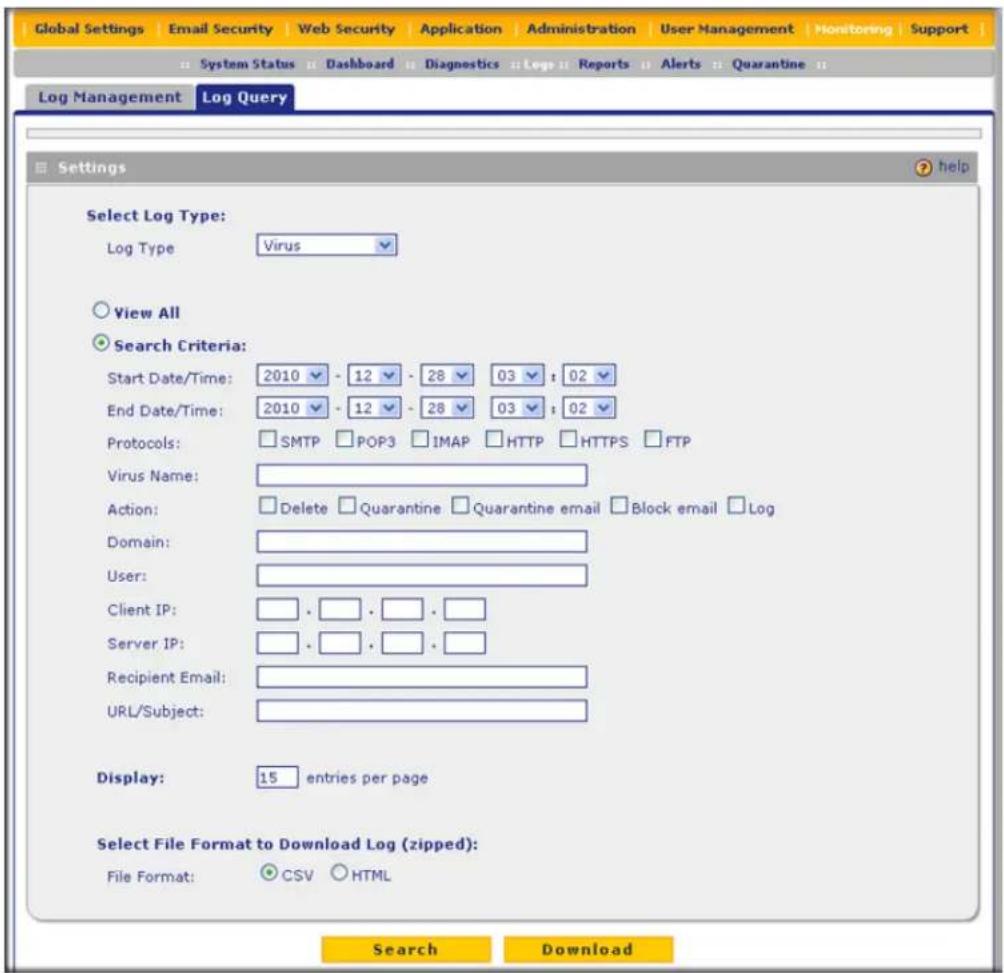
Figure 111.
- Select the check boxes and radio buttons, make your selections from the drop-down lists, and complete the fields as explained in the following table:
Table 58. Log Query Settings
| Setting Description | on (or Subfield and Description) | |
| Log Type Select | one of the following log types from the drop-down list:·Email traffic. All scanned incoming and outgoing email traffic.·Web traffic. All scanned incoming and outgoing email traffic.·Virus. All intercepted viruses.·Spyware. All intercepted spyware.·Spam. All intercepted spam, including spam that was detected through the blacklist, real-time blacklist, and distributed spam analysis.·Email filters. All emails that are intercepted because of keyword, file type, file name, password, or size limit violations.·Content filters. All websites, URLs, and FTP sites that are intercepted because of Web category, blacklist, file type, or size limit violations.·System. The system event logs that include all system errors, informational messages, configuration changes, and system software updates.·Application. All intercepted application access violations. | |
| View All Select one of the following radio buttons: | ||
| Search Criteria | ·View All. Display or download the entire selected log.·Search Criteria. Query the selected log by configuring the search criteria that are available for the selected log. | |
| Start Date/Time From the drop-down lists, select the year, month, day, hours, and minutes for the start date and time.This field is available for the following logs:Email traffic, Web traffic, Virus, Spyware, Spam, Email filters, Content filters, System, and Application. | ||
| End Date/Time From the drop-down lists, select the year, month, day, hours, and minutes for the end date and time.This field is available for the following logs:Email traffic, Web traffic, Virus, Spyware, Spam, Email filters, Content filters, System, and Application. | ||
| Protocols Select one or more check boxes to specify the protocols that are queried.The following protocols can be selected:·For the Email traffic log: SMTP, POP3, and IMAP.·For the Web traffic log: HTTP, HTTPS, and FTP.·For Virus, and Spyware logs: SMTP, POP3, IMAP, HTTP, HTTPS, and FTP.·For the Spam log: SMTP and POP3.·For the Email filters log: SMTP, POP3, and IMAP.·For the Content filters log: HTTP, HTTPS, and FTP. | ||
| Search Criteria(continued) | Domain The domain name that is queried.This field is available for the following logs:Email traffic, Web traffic, Virus, Spyware, Spam, Email filters, Content filters, and Application. | |
| User The user name that is queried.This field is available for the following logs:Email traffic, Web traffic, Virus, Spyware, Spam, Email filters, Content filters, and Application. | ||
| Client IP The client IP address that is queried.This field is available for the following logs:Email traffic, Web traffic, Virus, Spyware, Spam, Content filters, and Application. | ||
| Server IP The server IP address that is queried.This field is available for the following logs:Email traffic, Web traffic, Virus, Spyware, Content filters, and Application. | ||
| Reason Select one or more check boxes to specify the reasons that are queried:The following reasons can be selected:For the Email filters log: keyword, file type, file name, password, and size limit.For the Content filters log: Web category, file type, blacklist, and size limit. | ||
| Virus Name The name of the virus that is queried.This field is available only for the Virus log. | ||
| Spyware Name The name of the spyware that is queried.This field is available only for the Spyware log. | ||
| Action Select one or more check boxes to specify the malware treatment actions that are queried.The following actions can be selected:For the Virus and Spyware logs: Delete, Quarantine, Quarantine email, Block email, or Log.For the Spam log: Block, Tag, or Quarantine. | ||
| Detected By Select one or all check boxes to specify the method by which spam is detected: Blacklist, RBL, or Distributed Spam Analysis.This field is available only for the Spam log. | ||
| Subject The email subject that is queried:This field is available for the following logs:Email traffic, Spam, and Email filters. | ||
| Sender Email The email address of the sender that is queried.This field is available only for the Email traffic log. | ||
| Setting Description | or Subfield and Description) | |
| Search Criteria (continued) | Recipient Email The email address of the recipient that is queried.This field is available for the following logs:Email traffic, Virus, Spyware, Spam, and Email filters. | |
| URL/Subject The URL and subject that are queried.This field is available for the following logs:Traffic, Virus, and Spyware. | ||
| URL The URL that is queried.This field is available for the following logs:Web traffic and Content filters. | ||
| Category The Web or application category that is queried.This field is available for the following logs:Content filters and Application. | ||
| Size The file's minimum and maximum size (in bytes) that are queried.This field is available only for the Web traffic log. | ||
| Type Select one or more check boxes to specify the system event types that are queried: Error (all system errors), Info (all informational messages), Conf (all configuration changes), and Update (all system software updates).This field is available only for the System log. | ||
| Event The description of the event incident that is queried.This field is available only for the System log. | ||
| Section The application group (Instant Messaging, Media Applications, Peer to Peer, or Tools) that is queried.This field is available only for the Application log. | ||
| Display The maximum number of pages that are displayed. The default setting is 15 entries. | ||
| Download Log (zipped) File Format | Select a radio button to specify the format in which to download the zipped log file:• CSV. Download the log file as a comma-separated values (CSV) file.• HTML. Download the log file as an HTML file. | |
4. Click one of the following action buttons:
- Search. Query the log according to the search criteria that you specified and view the log through the Web Management Interface, that is, onscreen.
- Download. Query the log according to the search criteria that you specified, and download the log to a computer.
Example: Using Logs to Identify Infected Clients
You can use the STM logs to help identify potentially infected clients on the network. For example, clients that are generating abnormally high volumes of HTTP traffic might be infected with spyware or a virus.
To identify infected clients that are sending spyware or a virus in outbound traffic, query the STM spyware and virus logs and see if any of your internal IP addresses are the source of spyware or a virus:
- On the Log Query screen (see Figure 111 on page 195), select Web traffic as the log type.
- Select the start date and time from the drop-down lists.
- Select the end date and time from the drop-down lists.
- Next to Protocols, select the HTTP check box.
- Click Search. After a while, the log displays onscreen.
- Check if there are clients that are sending out suspicious volumes of data, especially to the same destination IP address, on a regular basis.
If you find a client exhibiting this behavior, you can run a query on that client's HTTP traffic activities to get more information. Do so by running the same HTTP traffic query and entering the client IP address in the Client IP field.
Log Management
Generated logs take up space and resources on the STM internal disk. To ensure that there is always sufficient space to save newer logs, the STM automatically deletes older logs whenever the total log size reaches 50 percent of the allocated file size for each log type.
Automated log purging means that you do not need to constantly manage the size of the STM logs and ensures that the latest malware incidents and traffic activities are always recorded.
Note: The STM saves its logs every 5 minutes. If a power failure affects the STM, logs that were created within the 5-minute period before the power failure occurred are lost. Therefore, NETGEAR recommends that you connect the STM to a syslog server to save the logs externally.
For information about how to manually purge selected logs, see Clearing Logs on page 182.
Viewing, Scheduling, and Generating Reports
The extensive reporting functions of the STM let you perform the following tasks that help you to monitor the protection of the network and the performance of the STM:
- Generating, viewing, and downloading Web, email, application, and system reports
- Scheduling automatic Web, email, application, and system reports, and emailing these reports to specified recipients
You can view the reports onscreen, download them to your computer, and configure the STM to send them to one or more email addresses.
The STM provides preconfigured report templates. As an option, you can apply advanced filtering options to specify the number of top entries to be included, the chart type, and the output format, and you can filter the report on the following components:
- Client IP addresses
- Users
- Destinations
Because of the size and nature of the Reports screen, it is divided and presented in this manual in several figures that are explained in the following sections:
• Report Templates on this page
• Generating Reports for Downloading on page 202
• Scheduling Automatic Generation and Emailing of Reports on page 203
• Advanced Report Filtering Options on page 204
Report Templates
The STM provides preconfigured report templates in four categories:
Web Activity
- Email Activity
• Application Activity
• System Information
To display the report templates and view reports onscreen:
- Select Monitoring > Reports from the menu. The Reports screen displays. The following figure shows only the Report Templates section of the screen with the preconfigured report templates.

Figure 112.
- Click the red + More button for a report category to display the advanced report templates for that category. The System Information category contains only a single report template.
- Click View for a report to display the selected report onscreen. To set a time range and advanced filtering options for a report, see the following sections.
For detailed information about report templates, including what type of information is presented in each report and what type of advanced filtering you can apply to each report, see Appendix A, Report Templates.
Generating Reports for Downloading
To generate a report:
- Select Monitoring > Reports from the menu. The Reports screen displays. By default, the Generate Report radio button is selected. The following figure shows the Reports screen without the Template Reports section, and shows some samples in the Generated Report List.

Figure 113.
- In the Filtering Options section of the screen, make your selections from the Time Range drop-down lists. Specify a start date and time and an end date and time. For advanced filtering options, see Advanced Report Filtering Options on page 204.
- In the Report Templates section of the screen, select the check boxes for the reports that you want to generate. For information, see Report Templates on page 200 and Appendix A, Report Templates.
- In the Generate Report section of the screen, click Generate. After a short while, the report is added to the Generated Report List. This list can contain a maximum of 12 saved reports. (To delete a previously saved report, click its Delete table button in the Action column.)
- Download the new report (or a previously saved report) by clicking its Download table button in the Action column.
The report is downloaded as a zipped file. By default, the zipped file contains MHTML files. However, you can change the output format from the Output Format drop-down list
in the advanced filtering options section of the screen (see Advanced Report Filtering Options on page 204).
Scheduling Automatic Generation and Emailing of Reports
To schedule a report and enable the STM to email the report:
- Select Monitoring > Reports from the menu. The Reports screen displays.
- In the Report Selection section of the screen, select the Schedule Report radio button. The screen adjusts to display the scheduling and emailing options. The following figure shows the Reports screen without the Template Reports section, and with some samples in the Scheduled Report List.

Figure 114.
- In the Filtering Options section of the screen, make your selections from the Frequency drop-down lists to specify the frequency with which the reports are generated.
- Daily. If you do not use the drop-down lists to change the time, the report is generated daily at 3:00 a.m.
• Weekly. By default, the report is generated weekly on Sunday at 3:00 a.m. You can use the drop-down lists to change the day of the week and the time.
• Monthly. If you do not use the drop-down lists to change the time, the report is generated on the first of the month at 3:00 a.m. You cannot change the day of the month.
For advanced filtering options, see Advanced Report Filtering Options on page 204.
- In the Report Templates section of the screen, select the check boxes for the reports that you want to generate. For information, see Report Templates on page 200 and Appendix A, Report Templates.
- Configure the Schedule Report section of the screen as explained in the following table:
Table 59. Schedule Report Settings
| Setting Description | ||
| Report Name Enter a unique name for the report. | ||
| Reports to keep Enter the maximum number of reports that you want to be saved in the Scheduled Report List. The maximum number of report that can be saved is 12. The default number is 5. | ||
| Send Report by Email | Select the Send Report by Email check box to enable the STM to send the report to the recipients that you specify in the Email Report to field. | |
| Email Report to The | email addresses of the report recipients.Note: Use commas to separate email addresses. | |
- Still in the Schedule Report section of the screen, click the Add table button to add the report to the Scheduled Report List. The report is automatically enabled, which is indicated by a green circle in the leftmost column, enabling the STM to automatically generate the report at the specified date and time.
The buttons in the Action column of the Scheduled Report List allow you perform the following actions:
• Edit. Opens the Edit Scheduled Report screen to let you make changes to the report.
- Disable. Disables the automatic generation of the report. The circle in the leftmost column turns gray.
- Enable. Enables the automatic generation of the report. The circle in the leftmost column turns green.
• Delete. Deletes the report.
Advanced Report Filtering Options
You can configure advanced filtering options for both generated and scheduled reports. Although the Time Range drop-down lists apply only to the generated reports and the Frequency drop-down lists apply only to the scheduled reports, the advanced filtering options
are identical for both types of reports but need to be specified separately for each generated report and each scheduled report.
To configure advanced filtering options:
- Select Monitoring > Reports from the menu. The Reports screen displays.
-
In the Report Selection section, select one of the following radio buttons:
-
Generate Report.
-
Schedule Report.
-
Depending on the whether you selected to generate or schedule a report, perform one of the following actions:
-
If you selected Generate Report, make your selections from the Time Range drop-down lists.
-
if you selected Schedule Report, make your selections from the Frequency drop-down lists.
-
In the Filtering Options section of the screen, click Show Advanced Options. The following figure shows only the advanced options of the Filtering Options section of the screen.

Figure 115.
- Configure the advanced filtering options as explained in the following table:
Table 60. Advanced Filtering Options Settings
| Setting Description | ||
| Top Count Enter a | number between 1 and 100 to specify how many entries are included in reports that provide a top count, such as the Top Users by Requests report or the Top Spam Senders by Requests report.The default number is 10, which means that 10 users are included in the Top Users by Requests report and 10 senders are included in the Top Spam Senders by Requests report. | |
| Chart Type Specify | the type of chart that is generated in the report by making one of the following selections from the drop-down list:Vertical Bars. This is the default selection.Line.Pie. | |
| Output Format Specify | the output format of the report by making one of the following selections from the drop-down list:HTML. The report is generated as a zipped file that contains MIME HTML (MHTML or MTH) files. This is the default setting.PDF. The report is generated as a zipped file that contains PDF files.CSV. The report is generated as a zipped file that contains comma-separated values (CSV) files. | |
| Client IP Address To | filter the report results on a client IP address, enter the IP address and optional subnet mask in the IP Address fields below the Client IP Address table, and then click the Add table button to add the IP address to the Client IP Address table. You can add multiple IP addresses to the table.To delete an entry from the Client IP Address table, select the entry, and then click the Delete table button. | |
| User To filter the report results on a user identity, make a selection from the User Type drop-down list below the User table. The screen adjusts depending on your selection; the different options are explained in the following rows in this table. After you have specified the user identity, click the Add table button to add the user to the User table. You can add multiple users to the table. Wildcarts (*) are supported.To delete an entry from the User table, select the entry, and then click the Delete table button. | ||
| Users(continued) | Local User Enter the | name of a local user, or use wildcards to specify a group of users. To specify all local users, enter *. Then click the Add table button.Alternately, click the Lookup table button to open a table that displays all local users, each user with an individual Add table button that lets you add the user to the User table. You can add multiple users to the User table.Note:Groups to which local users might belong are not displayed. |
| LDAP User Select | an LDAP domain from the drop-down list to the right of the User Type drop-down list. Enter the name of an LDAP user, or use wildcards to specify a group of users. To specify all LDAP users who belong to the selected LDAP domain, enter *. Then click the Add table button.Alternately, click the Lookup table button to open a table that displays all users who belong to the selected LDAP domain, each user with an individual Add table button that lets you add the user to the User table. You can add multiple users to the User table. | |
| RADIUS User Select | a RADIUS domain from the drop-down list to the right of the User Type drop-down list. Enter the name of a RADIUS user, or use wildcards to specify a group of users. To specify all RADIUS users who belong to the selected RADIUS domain, enter *. Then click the Add table button.Alternately, click the Lookup table button to open a table that displays all users who belong to the selected RADIUS domain, each user with an individual Add table button that lets you add the user to the User table. You can add multiple users to the User table. | |
| Destination To filter | the report results on a Web destination such as a domain, Web category, or application, make a selection from the Limit to drop-down list below the Destination table. The screen adjusts depending on your selection; the different options are explained in the following rows in this table. After you have specified the destination, click the Add table button to add the destination to the Destination table. You can add multiple destinations to the table.To delete an entry from the Destination table, select the entry, and then click the Delete table button. | |
| Domain Enter the name of a domain or use wildcards to specify a group of domains. Then click the Add table button. You can add multiple domains to the Destination table. | ||
| Destination (continued) | Category From the drop-down list to the right of the Limit to drop-down list, select one of the following options:Web Categories. The screen displays a table with all Web categories, each one with an individual Add table button that lets you add the category to the Destination table. You can add multiple categories to the Destination table.Applications. The screen displays a table with all applications, each one with an individual Add table button that lets you add the application to the Destination table. You can add multiple applications to the Destination table. | |
- In the Report Templates section of the screen, select the check boxes for the reports that you want to generate. For information, see Report Templates on page 200 and Appendix A, Report Templates.
- Depending on the whether you selected to generate or schedule a report, perform one of the following actions:
- If you selected Generate Report, click Generate in the Generate Report section of the screen. For more information, see Generating Reports for Downloading on page 202.
- If you selected Schedule Report, configure the settings in the Schedule Report section of the screen, and click the Add table button. For more information, see Scheduling Automatic Generation and Emailing of Reports on page 203.
Viewing and Managing the Quarantine Files
Depending on the selections that you made on the screens of the Email Security and Web Security main menus (see Chapter 4, Content Filtering and Optimizing Scans), the STM intercepts and saves emails that are infected by spam and both emails and files that are infected by malware threats (viruses and spyware) to its quarantine files. You can search these files, view the search results through the Web Management Interface, and then take a variety of actions that are described in Viewing and Managing the Quarantined Spam Table on page 212 and Viewing and Managing the Quarantined Infected Files Table on page 213. You can also specify how many entries are displayed per page (the default setting is 15 entries).
Note: For information about how to specify the quarantine settings, see Managing the Quarantine Settings on page 81.
You can query and view the spam quarantine file and the malware quarantine file separately and filter the information based on a number of criteria. You can filter the spam quarantine file using the following criteria:
- Start date and time
• End date and time - Domain name
- User name
- Source IP address
- Sender email address
• Recipient email address - Subject
• Size of the email
You can filter the malware quarantine file using the following criteria:
- Start date and time
• End date and time - Protocols (HTTP, HTTPS, FTP, SMTP, POP3, and IMAP)
- Domain name
- User name
- Malware name
- Client IP address
• Recipient email address
• Recipient email address - URL or subject
- Size of the file
To query the quarantine files:
- Select Monitoring > Quarantine from the menu. The Quarantine screen displays (see the following figure).
- Depending on the selection that you make from the Quarantine File Type drop-down list, the screen adjusts to display the settings for the selected type of quarantine file. The following figure displays the spam quarantine file settings as an example.
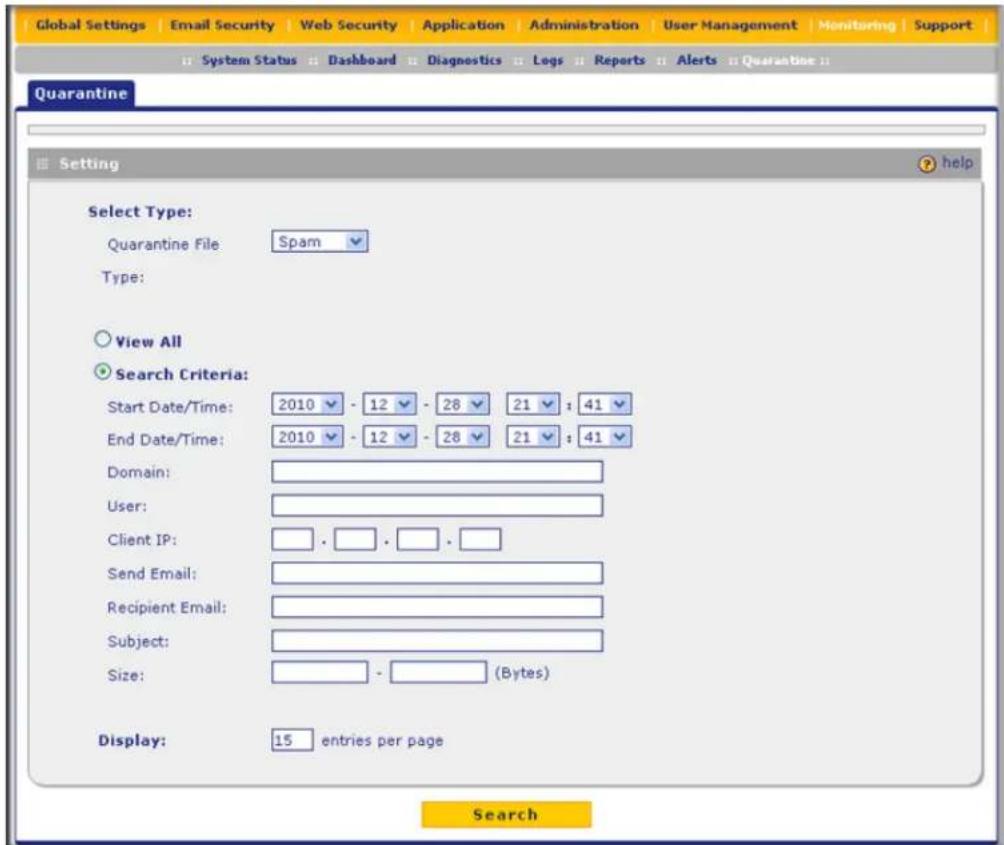
Figure 116.
- Select the check boxes and radio buttons, make your selections from the drop-down lists, and complete the fields as explained in the following table:
Table 61. Quarantine File Settings
| Setting Description | or Subfield and Description | |
| File Type Select | one of the following file types from the drop-down list:Spam. Quarantined spam that was detected through distributed spam analysis.Malware. All quarantined spyware and viruses. | |
| View All Select one | of the following radio buttons:View All. Display or download the entire selected quarantine file.Search Criteria. Query the selected quarantine file by configuring the search criteria that are available for the selected file. | |
| Search Criteria | ||
| Setting | Description (or Subfield and Description) | |
| Search Criteria (continued) | Start Date/Time From the drop-down lists, select the year, month, day, hours, and minutes for the start date and time. | |
| End Date/Time From the drop-down lists, select the year, month, day, hours, and minutes for the end date and time. | ||
| Protocols Select one or more check boxes to specify the protocols that are queried (malware quarantine file only). | ||
| Domain The domain name that is queried. | ||
| User The user name that is queried. | ||
| Malware Name The name of the spyware or virus that is queried (malware quarantine file only). | ||
| Client IP The client IP address that is queried (malware quarantine file only). | ||
| Source IP The source IP address that is queried (spam quarantine file only). | ||
| Sender Email The email address of the sender that is queried (spam quarantine file only). | ||
| Recipient Email The email address of the recipient that is queried. | ||
| URL/Subject The URL or subject that is queried (malware quarantine file only). | ||
| Subject The subject that is queried (spam quarantine file only). | ||
| Size | The file's minimum and maximum size (in bytes) that are queried. | |
| Display | The maximum number of entries that are displayed on a page. The default setting is 15 entries. | |
- Click Search. Depending on the selected quarantine file (spam or malware), the Quarantine screen displays the Quarantined Spam table or the Quarantined Infected Files table, which are explained in the following sections.
Viewing and Managing the Quarantined Spam Table
When you query the spam quarantine file, the Quarantine screen with the Quarantined Spam table displays:

Figure 117.
The Quarantined Spam table shows the following columns:
- Check box. Lets you select the table entry.
• Date. The date that the email was received. - Protocol. The protocol (SMTP) in which the spam was found.
• Domain. The domain in which the spam was found.
• User. The user name that was used to log in to the STM. - Client IP. The client IP address from which the spam originated.
• From. The email address of the sender.
• To. The email address of the recipient.
• Subject. The email subject line.
• Size (Bytes). The size of the email in bytes.
The following figure show the Quarantined Spam table with data. (Normally, this data does not fit on screen, and you need to scroll to see all data.)
| □ | Date | Protocol | Domain | User | Client IP | From | To | Subject | Size(Bytes) |
| □ | 2010-06-12 04:29:00 | SMTP | anonymous | 192.168.58.200 | ztzhang@test.com | ztzhang@test.com, user@test.com | #@#@#@ CTCH Evaluation Spam Test Match ##@#@ | 1017 | |
| □ | 2010-06-12 04:28:30 | SMTP | anonymous | 192.168.58.200 | ztzhang@test.com | ztzhang@test.com | #@#@#@ CTCH Evaluation Spam Test Match ##@#@ | 1145 |
Figure 118.
After you have selected one or more table entries, take one of the following actions (or click the Return link to return to the previous screen):
- Send as Spam. The selected spam email files are tagged as spam for distributed spam analysis, and are sent to the intended recipients.
- Send as Ham. The selected spam email files are not tagged as spam for distributed spam analysis, are removed from quarantine, and are sent to the intended recipients.
- Delete. The selected spam email files are removed from quarantine and deleted.
Viewing and Managing the Quarantined Infected Files Table
When you query the malware quarantine file, the Quarantine screen with the Quarantined Infected Files table displays:
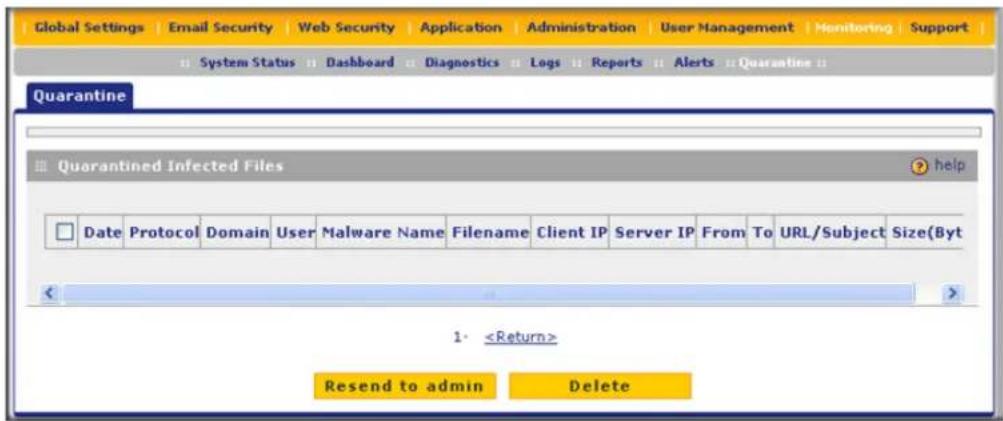
Figure 119.
The Quarantined Infected Files table shows the following columns:
- Check box. Lets you select the table entry.
• Date. The date that the file was received. - Protocol. The protocol (SMTP, POP3, IMAP, HTTP, FTP, HTTPS) in which the spyware or virus was found.
• Domain. The domain name that was used to log in to the STM.
• User. The user name that was used to log in to the STM.
• Malware name. The name of the spyware or virus. - File name. The name of the file in which the spyware or virus was found.
- Client IP. The client IP address from which the spyware or virus originated.
• Server IP. The server IP address from which the spyware or virus originated.
• From. The email address of the sender.
• To. The email address of the recipient.
• URL/Subject. The URL or subject that is associated with the spyware or virus.
• Size (Bytes). The size of the virus or spyware file in bytes.
The following figure shows the Quarantined Infected Files table with data. (Normally, this data does not fit onscreen, and you need to scroll to see all data.)
| ☐ | Date | Protocol | Domain | User | Malware Name | Filename | Client IP | Server IP | From | To | URL/Subject | Size(Bytes) |
| ☐ | 2010-06-12 04:30:00 | SMTP | prosecure | test_user | EICAR-Test-File | eicar.zip | 192.168.58.200 | 192.168.35.165 | test@test.com | user@test.com | Virus 3 | 70 |
| ☐ | 2010-06-12 04:26:34 | POP3 | anonymous | EICAR-Test-File | eicar_病毒 | 192.168.58.200 | 192.168.35.165 | ztzhang@test.com | ztzhang@test.com | virus 2 | 68 | |
| ☐ | 2010-06-12 04:26:00 | SMTP | anonymous | EICAR-Test-File | eicar_病毒 | 192.168.58.200 | 192.168.35.165 | ztzhang@test.com | ztzhang@test.com | virus 1 | 68 |
Figure 120.
After you have selected one or more table entries, take one of the following actions (or click the Return link to return to the previous screen):
- Resend to Admin. The selected malware files are removed from quarantine, zipped together as an email attachment, and then send to the recipient that you have specified on the Email Notification Server screen (see Configuring the Email Notification Server on page 176).
- Delete. The selected malware files are removed from quarantine and deleted.
User-Generated Spam Reports
Users logging in through the User Portal Login screen can select to receive a report with intercepted spam emails that were intended for their email address.
To send a spam report to an email address, a user should do the following:
- On the User Portal Login screen (see Figure 88 on page 156), click the here link in the Check your quarantined mail here section. The Send Spam Report screen displays. (The following figure shows the STM300).

Figure 121.
- Select the start date and time from the Begin Date/Time drop-down lists.
- Specify the recipient's email address in the Send to field.
Note: The report includes only quarantined spam emails that contain the email address that is specified in the Send to field.
4. Click Send Report.
The report provides summary information such as time, sender, recipient, subject, and size, and a retrieve link. The user can retrieve an individual email by clicking the internal or external retrieve link for the email. The presence of an external retrieve links (see the red box in the following figure) depends on the setting of the Set Public Host/IP Address and Port check box on the Distributed Spam Analysis screen (see Configuring Distributed Spam Analysis on page 102).
| Time | From | To | Subject | Size(Bytes) | Internal link | External link |
| 2010-01-19 00:00:00 | test@test.com | test2@test.com | Quarantine Spam Report 0 | 1 | Retrieve it | Retrieve it |
| 2010-01-19 00:00:15 | test1@test.com | test2@test.com | Quarantine Spam Report 1 | 2 | Retrieve it | Retrieve it |
| 2010-01-19 00:00:30 | test2@test.com | test2@test.com | Quarantine Spam Report 2 | 3 | Retrieve it | Retrieve it |
Figure 122.
Using Diagnostics Utilities
The STM provides diagnostic tools that help you analyze traffic conditions and the status of the network. Two sets of tools are available:
• Network diagnostic tools. These tools include a ping utility, traceroute utility, and DNS lookup utility.
- Traffic diagnostic tools. These tools allow you to perform real-time, per-protocol traffic analysis between specific source and destination addresses and let you generate reports on network usage in your network.
Note: For normal operation, diagnostic tools are not required.
To display the Diagnostics screen, select Monitoring > Diagnostics from the menu. To facilitate the explanation of the tools, the Diagnostics screen is divided and presented in this manual in three figures (the following figure, Figure 125 on page 217, and Figure 126 on page 218).
Using the Network Diagnostic Tools
This section discusses the Ping or Trace an IP Address section, the Perform a DNS Lookup section, and the Test URL section of the Diagnostics screen:
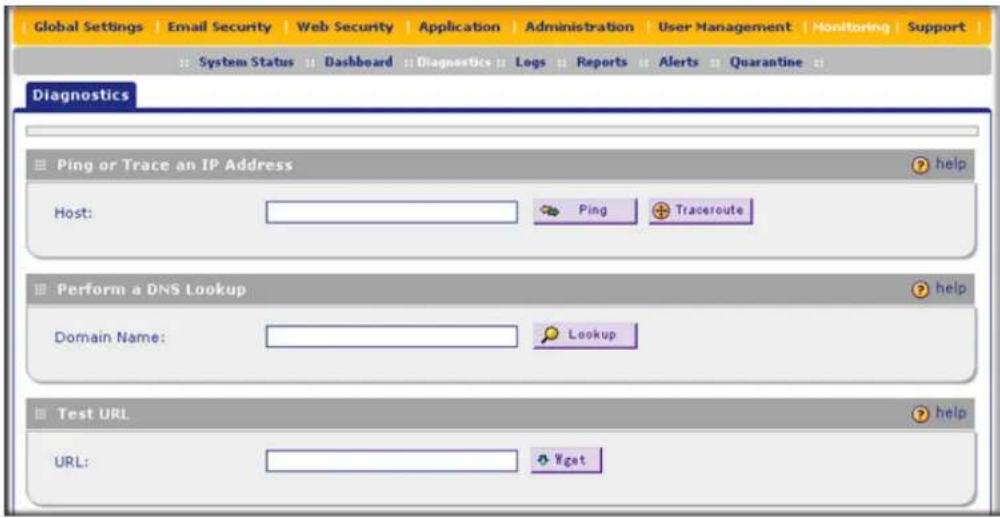
Figure 123. Diagnostics, screen 1 of 3
Sending a Ping Packet
Use the ping utility to send a ping packet request to check the connection between the STM and a specific IP address. If the request times out (no reply is received), it usually means that the destination is unreachable. However, some network devices can be configured not to respond to a ping. The ping results are displayed on a new screen; click Back on the Windows menu bar to return to the Diagnostics screen.
To send a ping:
- Locate the Ping or Trace an IP Address section on the Diagnostics screen. In the Host field, enter the IP address or host name that you want to ping.
- Click the Ping button. The results of the ping are displayed below the Host field.
Tracing a Route
A traceroute lists all routers between the source (the STM) and the destination IP address.
To send a traceroute:
- Locate the Ping or Trace an IP Address section on the Diagnostics screen. In the Host field, enter the IP address or host name for which you want trace the route.
- Click the Traceroute button. The results of the traceroute are displayed below the Host field.
Looking Up a DNS Address
A Domain Name Server (DNS) converts the Internet name (for example, www.netgear.com) to an IP address. If you need the IP address of a Web, FTP, mail, or other server on the Internet, request a DNS lookup to find the IP address.
To look up a DNS address:
- Locate the Perform a DNS Lookup section on the Diagnostics screen. In the Domain Name field, enter a domain name.
- Click the Lookup button. The results of the lookup action are displayed below the Domain Name field.
Testing a URL
Testing a URL allows you to verify that the STM can connect to the Internet. The test performs a DNS lookup and captures the HTTP page.
To test a URL:
- Locate the Test URL section on the Diagnostics screen. In the URL field, enter a URL.
- Click the Wget button. The results of the URL test are displayed below the URL field:
![--11:26:35-- http://www.yahoo.com/ => 'index.html' Resolving www.yahoo.com... 67.195.145.138, 72.30.2.43, 67.195.145.137 Connecting to www.yahoo.com[67.195.145.138]:80... connected. HTTP request sent, awaiting response... 200 OK Length: unspecified [text/html] 200 OK](/content/2026/05/1028692/images/fbf5eae767e0362ff976fddd8b82c72e03034cb57b91e67eb43e62ec252a94e6.jpg)
Figure 124.
Using the Realtime Traffic Diagnostics Tool
This section discusses the Realtime Traffic Diagnostics section of the Diagnostics screen:
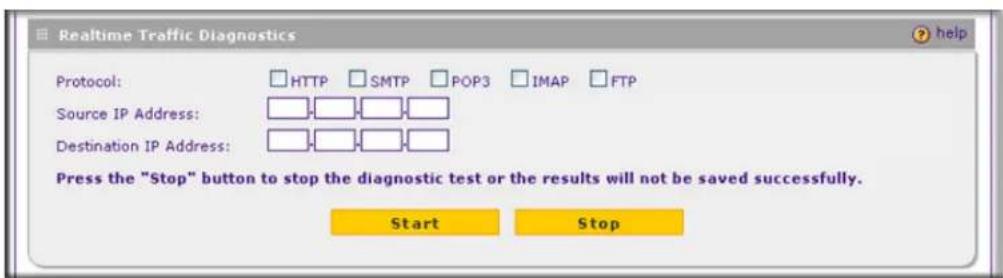
Figure 125. Diagnostics, screen 2 of 3
You can use the realtime traffic diagnostics tool to analyze traffic patterns with a network traffic analyzer tool. Depending on the network traffic analyzer tool that you use, you can find
out which applications are using most bandwidth, which users use most bandwidth, how long users are connected, and other information.
To use the realtime traffic diagnostics tool:
- Locate the Realtime Traffic Diagnostics section on the Diagnostics screen. Select one or more check boxes to specify the protocols for which you want to capture the traffic flow. The check boxes that you can select are HTTP, SMTP, POP3, IMAP, and FTP.
- In the Source IP Address field, enter the IP address of source of the traffic stream that you want to analyze.
- In the Destination IP Address field, enter the IP address of the destination of the traffic stream that you want to analyze.
- Click Start. You are prompted to save the downloaded traffic information file to your computer; however, do not save the file until you have stopped capturing the traffic flow.
- When you want to stop capturing the traffic flow, click Stop.
- Select a location to save the captured traffic flow. (The default file name is diagnostics.result.dat.) The file is downloaded to the location that you specify.
- When the download is complete, browse to the download location you specified and verify that the file has been downloaded successfully.
- Send the file to NETGEAR Technical Support for analysis.
Gathering Important Log Information and Generating a Network Statistics Report
When you request support, NETGEAR Technical Support might ask you to collect the debug logs and other information from your STM.
This section discusses the Gather Important Log Information section, Network Statistics Report section, and Reboot the System section of the Diagnostics screen:
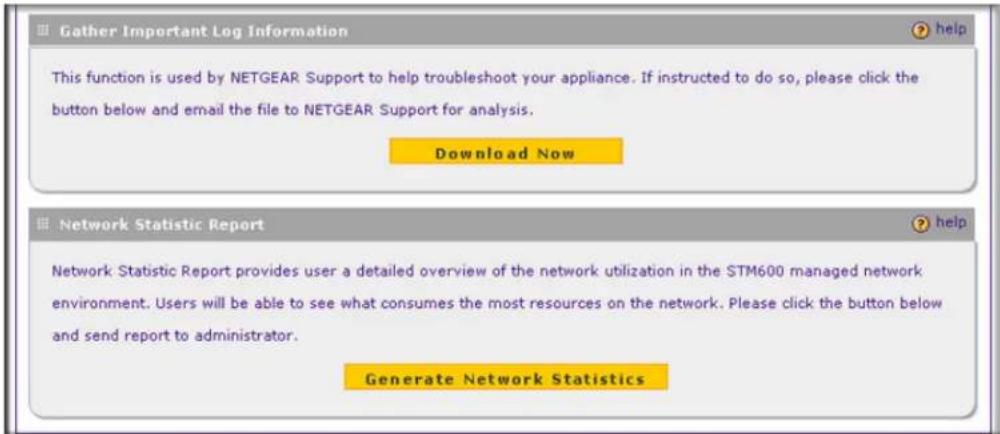
Figure 126. Diagnostics, screen 3 of 3
Gathering Important Log Information
To gather log information about your STM:
-
Locate the Gather Important Log Information section on the Diagnostics screen. Click Download Now. You are prompted to save the downloaded log information file to your computer. The default file name is importantlog.gpg.
-
When the download is complete, browse to the download location you specified and verify that the file has been downloaded successfully.
Generating Network Statistics
The network statistic report provides a detailed overview of the network utilization in the STM managed network environment. The report allows you to see what consumes the most resources on the network.
To generate the network statistic report:
Locate the Network Statistics Report section on the Diagnostics screen. Click Generate Network Statistics. The network statistic report is sent in an email to the recipient that you have configured on the email Notification Server screen (see Configuring the Email Notification Server on page 176).
Restarting and Shutting Down the STM
You can perform a remote restart, for example, when the STM seems to have become unstable or is not operating normally.
Note: Restarting breaks any existing connections either to the STM (such as your management session) or through the STM (for example, LAN users accessing the Internet). However, connections to the Internet are automatically reestablished when possible.
To restart the STM:
Locate the Restart & Shutdown section on the Diagnostics screen (this section is not shown on any of the Diagnostics screen figures in this manual). Click the Restart button. The STM restarts. (If you can see the unit: The reboot process is complete when the Test LED on the front panel goes off.)
Note: See also Updating the Software on page 71.
Note: For the STM150 only, there is an alternate way to restart: Press the Power button on the rear panel of the STM150 (see Rear Panel STM150 on page 20). The front panel Test LED flashes, and the STM150 reboots.
To shut down the STM:
Locate the Restart & Shutdown section on the Diagnostics screen (this section is not shown on any of the Diagnostics screen figures in this manual). Click the Shutdown button. The STM shuts down.

WARNING!
You can shut down the STM using the Web Management Interface, but you cannot start up the STM using the Web Management Interface.
Troubleshooting and Using Online Support
This chapter provides troubleshooting tips and information for the STM. After each problem description, instructions are provided to help you diagnose and solve the problem. For the common problems listed, go to the section indicated.
Is the STM on?
Go to Basic Functioning on page 223.
• Have I connected the STM correctly?
Go to Basic Functioning on page 223.
- I cannot access the STM's Web Management Interface.
Go to Troubleshooting the Web Management Interface on page 224.
• A time-out occurs.
Go to When You Enter a URL or IP Address a Time-Out Error Occurs on page 225.
• I have problems with the LAN connection.
Go to Troubleshooting a TCP/IP Network Using a Ping Utility on page 225.
• I want to clear the configuration and start over again.
Go to Restoring the Default Configuration and Password on page 227.
• The date or time is not correct.
Go to Problems with Date and Time on page 228.
• I need help from NETGEAR.
Go to Using Online Support on page 228.
Note: The STM's diagnostic tools are explained in Using Diagnostics Utilities on page 215.
Basic Functioning
After you turn on power to the STM, check that the following sequence of events occurs:
- When power is first applied, verify that the Power LED is on.
- After approximately 2 minutes, verify that:
a. The Test LED (STM150) or Status LED (STM300 and STM600) is no longer lit.
b. The left LAN port LEDs are lit for any local ports that are connected.
c. The left WAN port LEDs are lit for any WAN ports that are connected.
If a port's left LED is lit, a link has been established to the connected device. If a port is connected, verify the following right LED behavior in relation to the established port speed:
• Connected to a 1000-Mbps device:
- STM150: The right LED is green.
- STM300: The right LED is amber.
- STM600: The right LED is amber.
• Connected to a 100-Mbps device:
- STM150: The right LED is amber.
- STM300: The right LED is green.
- STM600: The right LED is green.
- Connected to a 10-Mbps device: For all STM models, the right LED is off.
If any of these conditions does not occur, see the appropriate following section.
Power LED Not On
If the Power and other LEDs are off when your STM is turned on, make sure that the power cord is correctly connected to your STM and that the power supply adapter is correctly connected to a functioning power outlet. If the error persists, you have a hardware problem and should contact NETGEAR Technical Support.
Test LED or Status LED Never Turns Off
When the STM is powered on, the Test LED (STM150) or Status LED (STM300 and STM600) turns on for approximately 2 minutes and then turns off when the STM has completed its initialization. If the Test LED (STM150) or Status LED (STM300 and STM600) remains on, there is a fault within the STM.
If all LEDs are still on more than several minutes minute after power-up, do the following:
• Turn the power off, and then turn it on again to see if the STM recovers.
- Clear the STM's configuration to factory defaults. Doing so sets the STM's IP address to 192.168.1.201. This procedure is explained in Restoring the Default Configuration and Password on page 227.
If the error persists, you might have a hardware problem and should contact NETGEAR Technical Support.
LAN or WAN Port LEDs Not On
If either the LAN LEDs or WAN LEDs do not light when the Ethernet connection is made, check the following:
- Make sure that the Ethernet cable connections are secure at the STM and at the hub, router, or workstation.
• Make sure that power is turned on to the connected hub, router, or workstation. - Be sure you that are using the correct cables:
When connecting the STM's uplink (WAN) ports to one or two devices that provide the Internet connections, use the cables that are supplied with the devices. These cables could be a standard straight-through Ethernet cables or an Ethernet crossover cables.
Troubleshooting the Web Management Interface
If you are unable to access the STM's Web Management Interface from a PC on your local network, check the following:
- Check the Ethernet connection between the PC and the STM as described in the previous section (LAN or WAN Port LEDs Not On).
- If your STM's IP address has been changed and you do not know the current IP address, clear the STM's configuration to factory defaults. This sets the STM's IP address to 192.168.1.201. This procedure is explained in Restoring the Default Configuration and Password on page 227.
Tip: If you do not want to revert to the factory default settings and lose your configuration settings, you can restart the STM and use a sniffer to capture packets sent during the reboot. Look at the ARP packets to locate the STM's LAN interface address.
- Make sure that you are using the SSL https://address login rather than the http://address login.
- Make sure that your browser has Java, JavaScript, or ActiveX enabled. If you are using Internet Explorer, click Refresh to be sure that the Java applet is loaded.
• Try quitting the browser and launching it again. - Make sure that you are using the correct login information. The factory default login name is admin and the password is password. Make sure that Caps Lock is off when entering this information.
If the STM does not save changes you have made in the Web Management Interface, check the following:
- When entering configuration settings, be sure to click the Apply button before moving to another screen, or your changes are lost.
- Click the Refresh or Reload button in the Web browser. The changes might have occurred, but the Web browser might be caching the old configuration.
When You Enter a URL or IP Address a Time-Out Error Occurs
A number of things could be causing this situation; try the following troubleshooting steps:
- Check whether other computers on the LAN work correctly. If they do, ensure that your computer's TCP/IP settings are correct.
- If the computer is configured correctly but still not working, ensure that the STM is connected and turned on. Connect to the Web Management Interface and check the STM's settings. If you cannot connect to the STM, see the information in the previous section (Troubleshooting the Web Management Interface on page 224).
- If the STM is configured correctly, check your Internet connection (for example, your modem or router) to make sure that it is working correctly.
Troubleshooting a TCP/IP Network Using a Ping Utility
Most TCP/IP terminal devices and firewalls contain a ping utility that sends an echo request packet to the designated device. The device then responds with an echo reply.
Troubleshooting a TCP/IP network is made very easy by using the ping utility in your PC or workstation.
Testing the LAN Path to Your STM
You can ping the STM from your PC to verify that the LAN path to the STM is set up correctly.
To ping the STM from a PC running Windows 95 or later:
- From the Windows toolbar, click Start and select Run.
- In the field provided, type ping followed by the IP address of the STM; for example:
ping 192.168.1.201 - Click OK. A message, similar to the following, should display:
Pinging
If the path is working, you will see this message:
Reply from
If the path is not working, you will see this message:
Request timed out
If the path is not functioning correctly, you could have one of the following problems:
- Wrong physical connections
- Make sure that the LAN port LED is on. If the LED is off, follow the instructions in LAN or WAN Port LEDs Not On on page 224.
- Check that the corresponding Link LEDs are on for your network interface card and for the hub ports (if any) that are connected to your workstation and STM.
• Wrong network configuration - Verify that the Ethernet card driver software and TCP/IP software are both installed and configured on your PC or workstation.
- Verify that the IP address for your STM and your workstation are correct and that the addresses are on the same subnet.
Testing the Path from Your PC to a Remote Device
After verifying that the LAN path works correctly, test the path from your PC to a remote device. From the Windows Run dialog box, type:
ping -n 10
in which
If the path is functioning correctly, replies as in the previous section are displayed. If you do not receive replies:
- Check that your PC has the IP address of your STM listed as the default gateway. If the IP configuration of your PC is assigned by DHCP, this information is not visible in your PC's Network Control Panel.
- Check to see that the network address of your PC (the portion of the IP address that is specified by the netmask) is different from the network address of the remote device.
- Check that the modem or router is connected and functioning.
Restoring the Default Configuration and Password
To reset the STM to its original factory default settings:
- Select Administration > Backup and Restore Settings from the menu. The Backup and Restore Settings screen displays.

Figure 127.
- Next to Revert to factory default settings, click the Default button.
The STM restarts. During the reboot process, the Backup & Restore Settings screen remains visible. The reboot process is complete after several minutes when the Test LED (STM150) or Status LED (STM300 and STM600) on the front panel goes off.

WARNING!
When you restore the factory default settings, the STM settings are erased. All scan and antispam settings are lost. Back up your settings if you intend to use them.
Note: After rebooting with factory default settings, the STM administrator account password is password, the guest account password is guest, and the LAN IP address is 192.168.1.201.
Note: For the STM150 only, there is an alternate way to return the settings to factory default: Using a sharp object, press and hold the Reset button on the rear panel of the STM150 (see Rear Panel STM150 on page 20) for about 10 seconds until the front panel Test LED flashes and the STM150 returns to factory default settings.
Problems with Date and Time
The System Date and Time screen displays the current date and time of day (see Configuring Date and Time Service on page 74). The STM uses the Network Time Protocol (NTP) to obtain the current time from one of several Network Time Servers on the Internet. Each entry in the log is stamped with the date and time of day. Problems with the date and time function can include:
- Date shown is January 1, 2000. Cause: The STM has not yet successfully reached a Network Time Server. Check that your Internet access settings are configured correctly. If you have just completed configuring the STM, wait at least 5 minutes and check the date and time again.
- Time is off by one hour. Cause: The STM does not automatically sense daylight savings time. Go to the System Date & Time screen (Administration > System Date & Time), and select or clear the check box marked Automatically Adjust for Daylight Savings Time.
Using Online Support
The STM includes online support tools that allow NETGEAR Technical Support to securely perform diagnostics of the STM, and that let you submit suspicious files for analysis by NETGEAR. You can also access the Knowledge Base and documentation online.
Enabling Remote Troubleshooting
One of the advanced features that the STM provides is online support through a support tunnel. With this feature, NETGEAR Technical Support staff is able to analyze from a remote location any difficulty you might be experiencing with the STM and to perform advanced diagnostics. Make sure that ports 443 and 2222 are open on your firewall, and that you have the support key that was given to you by NETGEAR.
To initiate the support tunnel:
- Select Support > Online Support from the menu. The Online Support screen displays:

Figure 128.
- In the Support Key field, enter the support key that was given to you by NETGEAR.
- Click Connect. When the tunnel is established, the tunnel status field displays ON.
To terminate the tunnel, click Disconnect. The Tunnel Status field displays OFF.
If NETGEAR Technical Support cannot access the STM remotely, they might ask you to save a log file to your computer and then email it to NETGEAR for analysis (see Gathering Important Log Information and Generating a Network Statistics Report on page 218).
Installing Hot Fixes
NETGEAR might release hot fixes or patches if certain problems are found in any software release. When a hot fix is available, install it immediately to ensure optimum performance of the STM. Hot fixes might be released through NETGEAR resellers or might be available on the NETGEAR ProSecure website at http://prosecure.netgear.com.
To display information about installed hot fixes, select Support > Hot Fixes from the menu. The Hot Fixes screen displays:

Figure 129.
The Hot Fixes table displays the installed hot fixes with the following fields:
• Installed At. The date and time when the hot fix was installed on the STM.
• Component. The component for which the hot fix provides a patch.
- Base Version. The base software version for the hot fix. The hot fix cannot be installed on an earlier or later software version, but only on the software version for which it is intended.
• Hot Fix Name. The name of the hot fix.
To install a hot fix:
- Obtain the hot fix from NETGEAR or its authorized reseller.
- Save the hot fix file on the computer that you will use to access the STM.
- Log in to the STM.
- Select Support > Hot Fixes from the menu. The Hot Fixes screen displays (see the previous figure).
- Next to the Import from File field, click Browse.
- Navigate to the location on your computer where you have saved the hot fix file, and then select it.
- Click Open. The hot fix file now appears in the Import from File field.
- Click Apply to install the hot fix.
The Test LED (STM150) or Status LED (STM300 and STM600) blinks during the hot fix installation.
Sending Suspicious Files to NETGEAR for Analysis
You can report any undetected malware file or malicious email to NETGEAR for online for analysis. The file is compressed and password protected before it is sent.
To submit a file to NETGEAR for analysis:
- Select Support > Malware Analysis from the menu. The Malware Analysis screen displays:
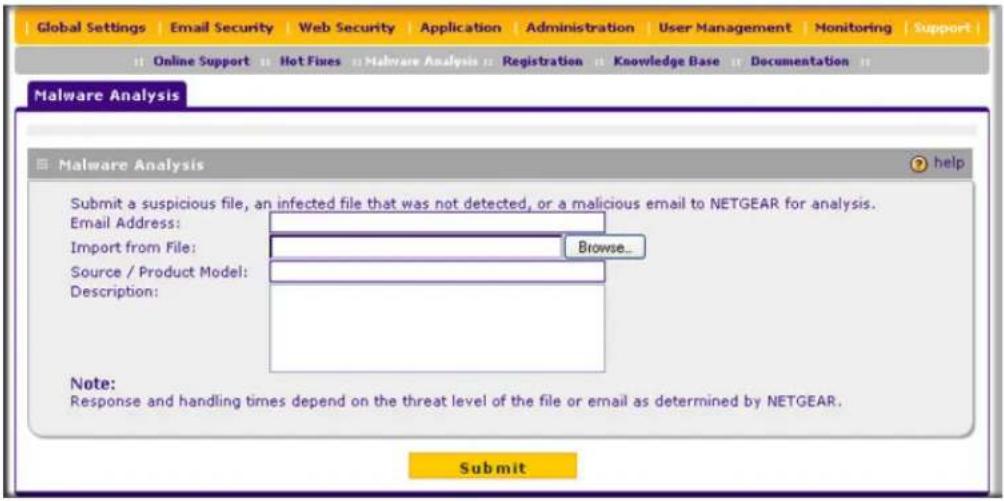
Figure 130.
- Complete the fields as explained in the following table:
Table 62. Malware Analysis Settings
| Setting Description | |
| Email Address The email | address of the submitter to enable NETGEAR to contact the submitter if needed. |
| Import from File Click Browse to navigate to the file that you want to submit to NETGEAR. | |
| Source / Product Model S | specify where the file originated (for example, an email address if received via email) and, if known, which product or scan feature (for example, the STM or a desktop antivirus application) detected the file. |
| Description As an option, | include a description or any information that is relevant. |
- Click Submit.
Accessing the Knowledge Base and Documentation
To access NETGEAR's Knowledge Base for the STM, select Support > Knowledge Base from the menu.
To access NETGEAR's documentation library for your STM model, select Support > Documentation from the menu.
The following table provides information about the preconfigured report templates. These report templates are accessible from the Reports screen (see Viewing, Scheduling, and Generating Reports on page 200).
In the Filtering Options columns of the following table, a indicates that the option is supported; an indicates that the option is not supported. Some reports require you to enable logging of HTTP traffic (for more information, see the Content Filtering screen and Configuring Web Content Filtering on page 109) so the report can provide HTTP traffic statistics. This requirement is indicated by a in the Enable logging of HTTP traffic column.
Note: “By hour” report templates show only the most recent 24 hours of statistics data if the selected time range is longer than one day; “By day” report templates show only the most recent 30 or 31 days of statistics data if the selected time range is longer than one month; “By month” report templates show only the most recent 12 months of statistics data if the selected time range is longer than one year.
Table 63. Report Templates Information
| Activity Information Reported Filtering Options | Enable logging of HTTP traffic | ||||||
| Client IP Address | User Do | Domain Web | Categories | Applications | |||
| Web Activity | |||||||
| Top Users by Requests | Top users by number of Web requests:Chart with the number of Web requests per userTable with the following items:- User identity- Number of Web requests- Bandwidth usage | √ | √ | √ | √ | × | |
| Top Users by Bandwidth | Top users by bandwidth usage:Chart with the bandwidth usage per userTable with the following items:- User identity- Bandwidth usage- Number associated of Web requests | √ | √ | √ | √ | × | |
| Top Destination Domains by Requests | Top destination domains by number of requests:Chart with the requests by destination domains listedTable with the following items:- Destination domain name- Number of requests- Associated bandwidth usage | √ | √ | √ | √ | × | |
| Top Destination Domains by Bandwidth | Top destination domains by bandwidth usage:Chart with the bandwidth usage by destination domains listedTable with the following items:- Destination domain name- Bandwidth usage- Number of associated requests | √ | √ | √ | √ | × | |
| Top Web Categories by Requests | Top Web categories by number of requests:Chart with the number of requests by Web category listedTable with the following items:- Web category- Number of requests- Associated bandwidth usage | √ | √ | √ | √ | × | |
| Top Web Categories by Bandwidth | Top Web categories by bandwidth usage:Chart with the bandwidth usage by Web category listedTable with the following items:- Web category- Bandwidth usage- Number of associated requests | √ | √ | √ | √ | × | |
| Top Blocked Users by Requests | Top blocked users by number of Web requests:Chart with the number of Web requests per userTable with the following items:- User identity- Number of Web requests | √ | √ | √ | √ | × | |
| Top Blocked Destination Domains by Requests | Top blocked destination domains by number of requests:Chart with the number of requests by destination domain listedTable with the following items:- Destination domain name- Number of requests | √ | √ | √ | √ | × | |
| Web Activity, Advanced (Click +More onscreen) | |||||||
| Top Blocked Web Categories by Requests | Top blocked Web categories by number of requests:Chart with the number of requests by Web categories listedTable with the following items:- Web category- Number of blocked requests | √ | √ | √ | √ | ✕ | |
| Top Blocked Users by Web Categories | Top blocked users by number of Web category requests:Chart with the number of Web category requests per blocked userTable with the following items:- User identity- Number of blocked Web category requests | √ | √ | √ | √ | ✕ | |
| Top Blocked Users by Blacklist | Top users by number of blacklisted website requests:Chart with the number of backlisted website requests per userTable with the following items:- User identity- Number of backlisted website requests | √ | √ | √ | ✕ | ✕ | |
| Top Blocked Users by File Type | Top users by number of blocked file extension requests:Chart with the number of blocked file extension requests per userTable with the following items:- User identity- Number of blocked file extension requests | √ | √ | √ | ✕ | ✕ | |
| Top Blocked Users by Malware | Top users by number of blocked malware downloads:Chart with the number of blocked malware downloads per userTable with the following items:- User identity- Number of blocked malware downloads | √ | √ | √ | ✕ | ✕ | |
| Requests by Hour | For each Web server protocol separately, the number of requests per hour for the time range that you specify in the Filtering Options section of the Reports screen:Chart with the number of Web requests per hourTable with the following items:- Hour- Number of Web requests per hour- Associated bandwidth usage per hour | √ | √ | √ | √ | ✕ | |
| Requests by Day | For each Web server protocol separately, the number of requests per day for the time range that you specify in the Filtering Options section of the Reports screen:Chart with the number of Web requests per dayTable with the following items:- Day- Number of Web requests per day- Associated bandwidth usage per day | ✓ | ✓ | ✓ | ✓ | ✘ | |
| Requests by Month | For each Web server protocol separately, the number of requests per month for the time range that you specify in the Filtering Options section of the Reports screen:Chart with the number of Web requests per monthTable with the following items:- Month- Number of Web requests per month- Associated bandwidth usage per month | ✓ | ✓ | ✓ | ✓ | ✘ | |
| Bandwidth by Hour | For each Web server protocol separately, the bandwidth usage per hour for the time range that you specify in the Filtering Options section of the Reports screen:Chart with the bandwidth usage per hourTable with the following items:- Hour- Bandwidth usage per hour- Associated number of requests per hour | ✓ | ✓ | ✓ | ✓ | ✘ | |
| Bandwidth by Day | For each Web server protocol separately, the bandwidth usage per day for the time range that you specify in the Filtering Options section of the Reports screen:Chart with the bandwidth usage per dayTable with the following items:- Day- Bandwidth usage per day- Associated number of requests per day | ✓ | ✓ | ✓ | ✓ | ✘ | |
| Bandwidth by Month | For each Web server protocol separately, the bandwidth usage per month for the time range that you specify in the Filtering Options section of the Reports screen:Chart with the bandwidth usage per monthTable with the following items:- Month- Bandwidth usage per month- Associated number of requests per month | ✓ | ✓ | ✓ | ✓ | ✘ | |
Table 63. Report Templates Information (Continued)
| Activity Information Reported Filtering Options | Enable logging of HTTP traffic | |||||
| Client IP Address | User Domain Web | Categories | Applications | |||
| Blocked Categories by Hour | For HTTP and HTTPS separately, the number of blocked Web category requests per hour for the time range that you specify in the Filtering Options section of the Reports screen:Chart with the number of blocked Web category requests per hourTable with the following items:- Hour- Number of blocked Web category requests per hour | ✓ | ✓ | ✓ | ✓ | ✘ |
| Blocked Categories by Day | For HTTP and HTTPS separately, the number of blocked Web category requests per day for the time range that you specify in the Filtering Options section of the Reports screen:Chart with the number of blocked Web category requests per dayTable with the following items:- Day- Number of blocked Web category requests per day | ✓ | ✓ | ✓ | ✓ | ✘ |
| Blocked Categories by Month | For HTTP and HTTPS separately, the number of blocked Web category requests per month for the time range that you specify in the Filtering Options section of the Reports screen:Chart with the number of blocked Web category requests per monthTable with the following items:- Month- Number of blocked Web category requests per month | ✓ | ✓ | ✓ | ✓ | ✘ |
| Blocked Files by Hour | For each Web server protocol separately, the number of blocked file extension requests per hour for the time range that you specify in the Filtering Options section of the Reports screen:Chart with the number of blocked file extension requests per hourTable with the following items:- Hour- Number of blocked file extension requests per hour | ✓ | ✓ | ✓ | ✘ | ✘ |
| Blocked Files by Day | For each Web server protocol separately, the number of blocked file extension requests per day for the time range that you specify in the Filtering Options section of the Reports screen:Chart with the number of blocked file extension requests per dayTable with the following items:- Day- Number of blocked file extension requests per day | ✓ | ✓ | ✓ | ✘ | ✘ |
Table 63. Report Templates Information (Continued)
| Activity Information Reported Filtering Options | Enable logging of HTTP traffic | ||||||
| Client IP Address | User Do | main Web | Categories | Applications | |||
| Blocked Files By Month | For each Web server protocol separately, the number of blocked file extension requests per month for the time range that you specify in the Filtering Options section of the Reports screen:Chart with the number of blocked file extension requests per monthTable with the following items:- Month- Number of blocked file extension requests per month | √ | √ | √ | ✕ | ✕ | |
| Top Infected Malwares | Top malware by number of detected infections or infection attempts received over Web requests:A chart with the number of detected infections or infection attempts per malwareTable with the following items:- Malware name- Number of detected infections or infection attempts | √ | √ | √ | ✕ | ✕ | |
| Top Infected Clients | Top client IP addresses by number of detected malware infections or infection attempts received over Web requests:Chart with the number of detected malware infections or infection attempts per client IP addressTable with the following items:- Client IP address- Number of detected malware infections or infection attempts | √ | √ | √ | ✕ | ✕ | |
| Infected Malwares by Hour | For each Web server protocol separately, the number of detected malware infections or infection attempts per hour for the time range that you specify in the Filtering Options section of the Reports screen:Chart with the number of detected malware infections or infection attempts per hourTable with the following items:- Hour- Number of detected malware infections or infection attempts per hour | √ | √ | √ | ✕ | ✕ | |
| Infected Malwares by Day | For each Web server protocol separately, the number of detected malware infections or infection attempts per day for the time range that you specify in the Filtering Options section of the Reports screen:Chart with the number of detected malware infections or infection attempts per dayTable with the following items:- Day- Number of detected malware infections or infection attempts per day | √ | √ | √ | ✕ | ✕ | |
| Infected Malwares by Month | For each Web server protocol separately, the number of detected malware infections or infection attempts per month for the time range that you specify in the Filtering Options section of the Reports screen:Chart with the number of detected malware infections or infection attempts per monthTable with the following items:- Month- Number of detected malware infections or infection attempts per month | ✓ | ✓ | ✓ | ✘ | ✘ | |
| User Activity | Top users by number of blocked and allowed Web requests:Chart with the number of blocked and allowed Web requests per userTable with the following items:- User identity- Last time that the user was detected ("Last seen")- Total number of Web requests- Number of allowed Web requests- Number of blocked Web requests- Associated bandwidth usage | ✓ | ✓ | ✓ | ✓ | ✘ | |
| Email Activity | |||||||
| Top Spam Senders by Requests | For the blacklist and real-time blacklist combined and for the distributed spam analysis separately, the top spam senders by number of detected spam messages:Chart with the number of detected spam messages per senderTable with the following items:- Sender's email address- Number of detected spam messages | ✓ | ✓ | ✘ | ✘ | ✘ | |
| Top Spam Recipients by Requests | For the blacklist and real-time blacklist combined and for the distributed spam analysis separately, the top spam recipients by number of detected spam messages:Chart with the number of detected spam messages per recipientTable with the following items:- Recipient's email address- Number of detected spam messages | ✓ | ✓ | ✘ | ✘ | ✘ | |
| Email Activity, Advanced (Click +More onscreen) | |||||||
| Spam by Hour | For SMTP and POP3 separately, the number of detected spam messages per hour for the time range that you specify in the Filtering Options section of the Reports screen:Chart with the number of detected spam messages per hourTable with the following items: - Hour- Number of detected spam messages per hourNote: For SMTP, the blacklist and real-time blacklist information is presented combined; for POP3, only blacklist information is presented; for both SMTP and POP3, the distributed spam analysis information is presented separately. | √ | √ | ✕ | ✕ | ✕ | |
| Spam by Day | For SMTP and POP3 separately, the number of detected spam messages per day for the time range that you specify in the Filtering Options section of the Reports screen:Chart with the number of detected spam messages per dayTable with the following items: - Day- Number of detected spam messages per dayNote: For SMTP, the blacklist and real-time blacklist information is presented combined; for POP3, only blacklist information is presented; for both SMTP and POP3, the distributed spam analysis information is presented separately. | √ | √ | ✕ | ✕ | ✕ | |
| Spam by Month | For SMTP and POP3 separately, the number of detected spam messages per month for the time range that you specify in the Filtering Options section of the Reports screen:Chart with the number of detected spam messages per monthTable with the following items: - Month- Number of detected spam messages per monthNote: For SMTP, the blacklist and real-time blacklist information is presented combined; for POP3, only blacklist information is presented; for both SMTP and POP3, the distributed spam analysis information is presented separately. | √ | √ | ✕ | ✕ | ✕ | |
| Email Messages by Hour | For each email server protocol separately, the number of email messages per hour for the time range that you specify in the Filtering Options section of the Reports screen:Chart with the number of email messages per hourTable with the following items: - Hour- Number of email messages per hour- Associated bandwidth usage per hour | ✓ | ✓ | ✘ | ✘ | ✘ | |
| Email Messages by Day | For each email server protocol separately, the number of email messages per day for the time range that you specify in the Filtering Options section of the Reports screen:Chart with the number of email messages per dayTable with the following items:- Day- Number of email messages per day- Associated bandwidth usage per day | ✓ | ✓ | ✘ | ✘ | ✘ | |
| Email Messages by Month | For each email server protocol separately, the number of email messages per month for the time range that you specify in the Filtering Options section of the Reports screen:Chart with the number of email messages per monthTable with the following items:- Month- Number of email messages per month- Associated bandwidth usage per month | ✓ | ✓ | ✘ | ✘ | ✘ | |
| Filtered Emails by Hour | For each email server protocol separately, the number of filtered email messages per hour for the time range that you specify in the Filtering Options section of the Reports screen:Chart with the number of filtered email messages per hourTable with the following items:- Hour- Number of filtered email messages per hour | ✓ | ✓ | ✘ | ✘ | ✘ | |
| Filtered Emails by Day | For each email server protocol separately, the number of filtered email messages per day for the time range that you specify in the Filtering Options section of the Reports screen:Chart with the number of filtered email messages per dayTable with the following items:- Day- Number of filtered email messages per day | ✓ | ✓ | ✘ | ✘ | ✘ | |
| Filtered Emails by Month | For each email server protocol separately, the number of filtered email messages per month for the time range that you specify in the Filtering Options section of the Reports screen:Chart with the number of filtered email messages per monthTable with the following items:- Month- Number of filtered email messages per month | √ | √ | ✕ | ✕ | ✕ | |
| Top Infected Malwares | Top virus or spyware by number of detected infections or infection attempts received over email messages:A chart with the number of detected infections or infection attempts per malwareTable with the following items:- Virus or spyware name- Number of detected infections or infection attempts | √ | √ | ✕ | ✕ | ✕ | |
| Top Infected Clients | Top client IP addresses by number of detected virus or spyware infections or infection attempts received over email messages:Chart with the number of detected virus or spyware infections or infection attempts per client IP addressTable with the following items:- Client IP address- Number of detected virus or spyware infections or infection attempts | √ | √ | ✕ | ✕ | ✕ | |
| Infected Malwares by Hour | For each email server protocol separately, the number of detected virus or spyware infections or infection attempts per hour for the time range that you specify in the Filtering Options section of the Reports screen:Chart with the number of detected virus or spyware infections or infection attempts per hourTable with the following items:- Hour- Number of detected virus or spyware infections or infection attempts per hour | √ | √ | ✕ | ✕ | ✕ | |
| Infected Malwares by Day | For each email server protocol separately, the number of detected virus or spyware infections or infection attempts per day for the time range that you specify in the Filtering Options section of the Reports screen:Chart with the number of detected virus or spyware infections or infection attempts per dayTable with the following items:- Day- Number of detected virus or spyware infections or infection attempts per day | ✓ | ✓ | ✘ | ✘ | ✘ | |
| Infected Malwares by Month | For each email server protocol separately, the number of detected virus or spyware infections or infection attempts per month for the time range that you specify in the Filtering Options section of the Reports screen:Chart with the number of detected virus or spyware infections or infection attempts per monthTable with the following items:- Month- Number of detected virus or spyware infections or infection attempts per month | ✓ | ✓ | ✘ | ✘ | ✘ | |
| Application Activity | |||||||
| Top Blocked Users by Requests | Top users by number of blocked application requests:Chart with the number of blocked application requests per userTable with the following items:- User identity- Number of blocked applications | ✓ | ✓ | ✘ | ✘ | ✓ | |
| Top Blocked Applications by Requests | Top blocked applications by number of requests:Chart with the number of requests per blocked applicationTable with the following items:- Application name- Number of blocked requests | ✓ | ✓ | ✘ | ✘ | ✓ | |
| Application Activity, Advanced (Click +More onscreen) | |||||||
| Top Blocked Clients by Requests | Top clients IP addresses by number of blocked applications:Chart with the number of blocked applications per client IP addressTable with the following items:- Client IP address- Number of blocked applications | ✓ | ✓ | ✘ | ✘ | ✓ | |
| Blocked Applications by Hour | The number of blocked applications per hour for the time range that you specify in the Filtering Options section of the Reports screen:Chart with the number of blocked applications per hourTable with the following items:- Hour- Number of blocked applications per hour | √ | √ | ✕ | ✕ | √ | |
| Blocked Applications by Day | The number of blocked applications per day for the time range that you specify in the Filtering Options section of the Reports screen:Chart with the number of blocked applications per dayTable with the following items:- Day- Number of blocked applications per day | √ | √ | ✕ | ✕ | √ | |
| Blocked Applications by Month | The number of blocked applications per month for the time range that you specify in the Filtering Options section of the Reports screen:Chart with the number of blocked applications per monthTable with the following items:- Month- Number of blocked applications per month | √ | √ | ✕ | ✕ | √ | |
| System Information | |||||||
| CPU & Memory Usage | CPU and memory usage, presented separately:Chart with the CPU usage and the memory usageNote: There is no table for this information. | ✕ | ✕ | ✕ | ✕ | ||
Default Settings and Technical Specifications
B
To return the STM to the default factory configuration settings that are shown in the following table, click the Default button on the Backup and Restore Settings screen (see Reverting to Factory Default Settings on page 70).
Table 64. STM Default Configuration Settings
| Feature Default | ||
| Login | ||
| User Login URL https://192.168.1.201 | ||
| Admin User Name (case-sensitive) admin | ||
| Admin Login Password (case-sensitive) password | ||
| Guest User Name (case-sensitive) guest | ||
| Guest Login Password (case-sensitive) guest | ||
| Management | ||
| System Configuration Web-based configuration and status monitoring | ||
| Required Minimum Browser versions • Microsoft Internet Explorer 5.1 or later• Mozilla Firefox I.x or later• Apple Safari 1.2 or laterNote: To enable a computer to scan secure HTTPS traffic, you need to import the root CA certificate into your browser from the STM login screen. | ||
| Time Zone GMT (Greenwich Mean Time) | ||
| Time Adjusted for Daylight Savings Time Enabled | ||
| SNMP Disabled | ||
| Administration Console Port RS232 | ||
| LAN Connections | ||
| MAC Address Default address | ||
| MTU Size 1500 | ||
| Ports STM150: 5 AutoSense 10/100/1000 | BASE-T, RJ-45STM300: 3 AutoSense 10/100/1000BASE-T, RJ-45STM600: 5 AutoSense 10/100/1000BASE-T, RJ-45 | |
| LAN IP Address In line transparent bridged | ||
| Subnet Mask 255.255.255.0 | ||
The following table shows the STM specifications.
Table 65. STM Specifications
| Feature Specification | ||
| Supported Protocols | ||
| Data Protocols HTTP, HTTPS, FTP, IMAP, POP3, SMTP | ||
| Power | ||
| Worldwide 100–240V AC/50–60 Hz, universal input, 1.5A max. | ||
| Physical Specifications | ||
| Dimensions (H x L x W) STM150: 43.5 x | 258 x 440 mm (1.7 x 10.2 x 17.3 in.)STM300: 44.4 x 500 x 426 mm (1.75 x 19.7 x 16.8 in.)STM600: 44.4 x 500 x 426 mm (1.75 x 19.7 x 16.8 in.) | |
| Weight STM150: 3.68 kg (8.1 lb.) | STM300: 8.2 kg (18.1 lb.)STM600: 8.2 kg (18.1 lb.) | |
| From Factor 1U | ||
| Environmental Specifications | ||
| Operating temperature 0° to 40° C (32° to | 104° F) | |
| Storage temperature –20° to 70° C (–4° to | 70° F) | |
| Operating humidity 5–95% maximum relative humidity, noncondensing | ||
| Meets requirements of | RoHS | |
| Electromagnetic Emissions | ||
| Meets requirements of FCC Part 15 Class | AVCCI Class ACE mark, commercial | |
| Safety | ||
| Meets requirements of UL listed | C-Tick | |
This appendix provides links to reference documents you can use to gain a more complete understanding of the technologies used in your NETGEAR product.
| Document | Link |
| TCP/IP Networking Basics http://documentation.netgear.com/reference/enu/tcpip/index.htm | |
| Wireless Networking Basics http://documentation.netgear.com/reference/enu/wireless/index.htm | |
| Preparing Your Network http://documentation.netgear.com/reference/enu/wsdhcp/index.htm | |
| Virtual Private Networking Basics http://documentation.netgear.com/reference/enu/vpn/index.htm | |
| Glossary http://documentation.netgear.com/reference/enu/glossary/index.htm | |
Notification of Compliance
NETGEAR Wired Products
D
Regulatory Compliance Information
This section includes user requirements for operating this product in accordance with National laws for usage of radio spectrum and operation of radio devices. Failure of the end-user to comply with the applicable requirements may result in unlawful operation and adverse action against the end-user by the applicable National regulatory authority.
This product's firmware limits operation to only the channels allowed in a particular Region or Country. Therefore, all options described in this user's guide may not be available in your version of the product.
FCC Requirements for Operation in the United States
FCC Information to User
This product does not contain any user serviceable components and is to be used with approved antennas only. Any product changes or modifications will invalidate all applicable regulatory certifications and approvals
This device complies with Part 15 of the FCC Rules. Operation is subject to the following two conditions: (1) This device may not cause harmful interference, and (2) this device must accept any interference received, including interference that may cause undesired operation.
FCC Guidelines for Human Exposure
This equipment complies with FCC radiation exposure limits set forth for an uncontrolled environment. This equipment should be installed and operated with minimum distance of 20 cm between the radiator and your body.
This transmitter must not be co-located or operating in conjunction with any other antenna or transmitter.
FCC Declaration Of Conformity
We, NETGEAR, Inc., 350 East Plumeria Drive, San Jose, CA 95134, declare under our sole responsibility that the ProSecure Web/Email Security Threat Management Appliance STM150, STM300, or STM600 complies with Part 15 of FCC Rules.
Operation is subject to the following two conditions:
• This device may not cause harmful interference, and
- This device must accept any interference received, including interference that may cause undesired operation.
FCC Radio Frequency Interference Warnings & Instructions
This equipment has been tested and found to comply with the limits for a Class B digital device, pursuant to Part 15 of the FCC Rules. These limits are designed to provide reasonable protection against harmful interference in a residential installation. This equipment uses and can radiate radio frequency energy and, if not installed and used in accordance with the instructions, may cause harmful interference to radio communications. However, there is no guarantee that interference will not occur in a particular installation.
If this equipment does cause harmful interference to radio or television reception, which can be determined by turning the equipment off and on, the user is encouraged to try to correct the interference by one or more of the following methods:
• Reorient or relocate the receiving antenna.
- Increase the separation between the equipment and the receiver.
- Connect the equipment into an electrical outlet on a circuit different from that which the radio receiver is connected.
- Consult the dealer or an experienced radio/TV technician for help.
Modifications made to the product, unless expressly approved by NETGEAR, Inc., could void the user's right to operate the equipment.
Canadian Department of Communications Radio Interference Regulations
This digital apparatus, ProSecure Web/Email Security Threat Management Appliance STM150, STM300, or STM600, does not exceed the Class B limits for radio-noise emissions from digital apparatus as set out in the Radio Interference Regulations of the Canadian Department of Communications.
European Union
The ProSecure Web/Email Security Threat Management Appliance STM150, STM300, or STM600 complies with essential requirements of EU EMC Directive 2004/108/EC and Low Voltage Directive 2006/95/EC as supported by applying the following test methods and standards:
• EN55022: 2006 / A1: 2007
• EN55024: 1998 / A1: 2001 / A2: 2003
• EN60950-1: 2005 2nd Edition
EN 61000-3-2:2006
• EN 61000-3-3:1995 w/A1:2001+A2:2005
For the EU Declaration of Conformity, please visit: http://kb.netgear.com/app/answers/detail/a_id/11621/sno/0.
Additional Copyrights
| AES Copyright (c) 2001, Dr. Brian Gladman, brg@gladman.uk.net, Worcester, UK.All rights reserved.TERMSRedistribution and use in source and binary forms, with or without modification, are permitted subject to the following conditions:1. Redistributions of source code must retain the above copyright notice, this list of conditions, and the following disclaimer.2. Redistributions in binary form must reproduce the above copyright notice, this list of conditions, and the following disclaimer in the documentation and/or other materials provided with the distribution.3. The copyright holder's name must not be used to endorse or promote any products derived from this software without his specific prior written permission.This software is provided "as is" with no express or implied warranties of correctness or fitness for purpose. |
| Open SSL Copyright (c) 1998–2000 The OpenSSL Project. All rights reserved.Redistribution and use in source and binary forms, with or without modification, are permitted provided that the following conditions are met:1. Redistributions of source code must retain the above copyright notice, this list of conditions, and the following disclaimer.2. Redistributions in binary form must reproduce the above copyright notice, this list of conditions, and the following disclaimer in the documentation and/or other materials provided with the distribution.3. All advertising materials mentioning features or use of this software must display the following acknowledgment: "This product includes software developed by the OpenSSL Project for use in the OpenSSL Toolkit (http://www.openssl.org/)."4. The names "OpenSSL Toolkit" and "OpenSSL Project" must not be used to endorse or promote products derived from this software without prior written permission. For written permission, contact openssl-core@openssl.org.5. Products derived from this software may not be called "OpenSSL" nor may "OpenSSL" appear in their names without prior written permission of the OpenSSL Project.6. Redistributions of any form whatsoever must retain the following acknowledgment: "This product includes software developed by the OpenSSL Project for use in the OpenSSL Toolkit (http://www.openssl.org/)."THIS SOFTWARE IS PROVIDED BY THE OpenSSL PROJECT "AS IS," AND ANY EXPRESSED OR IMPLIED WARRANTIES, INCLUDING, BUT NOT LIMITED TO, THE IMPLIED WARRANTIES OF MERCHANTABILITY AND FITNESS FOR A PARTICULAR PURPOSE ARE DISCLAIMED. IN NO EVENT SHALL THE OpenSSL PROJECT OR ITS CONTRIBUTORS BE LIABLE FOR ANY DIRECT, INDIRECT, INCIDENTAL, SPECIAL, EXEMPLARY, OR CONSEQUENTIAL DAMAGES (INCLUDING, BUT NOT LIMITED TO, PROCUREMENT OF SUBSTITUTE GOODS OR SERVICES; LOSS OF USE, DATA, OR PROFITS; OR BUSINESS INTERRUPTION) HOWEVER CAUSED AND ON ANY THEORY OF LIABILITY, WHETHER IN CONTRACT, STRICT LIABILITY, OR TORT (INCLUDING NEGLIGENCE OR OTHERWISE) ARISING IN ANY WAY OUT OF THE USE OF THIS SOFTWARE, EVEN IF ADVISED OF THE POSSIBILITY OF SUCH DAMAGE.This product includes cryptographic software written by Eric Young (eay@cryptsoft.com). This product includes software written by Tim Hudson (tjh@cryptsoft.com). |
| MD5 Copyright (C) 1990, RSA Data Security, Inc. All rights reserved.License to copy and use this software is granted provided that it is identified as the “RSA Data Security, Inc. MD5 Message-Digest Algorithm” in all material mentioning or referencing this software or this function. License is also granted to make and use derivative works provided that such works are identified as “derived from the RSA Data Security, Inc. MD5 Message-Digest Algorithm” in all material mentioning or referencing the derived work.RSA Data Security, Inc. makes no representations concerning either the merchantability of this software or the suitability of this software for any particular purpose. It is provided “as is” without express or implied warranty of any kind.These notices must be retained in any copies of any part of this documentation and/or software. |
| PPP Copyright (c) 1989 Carnegie Mellon University. All rights reserved.Redistribution and use in source and binary forms are permitted provided that the above copyright notice and this paragraph are duplicated in all such forms and that any documentation, advertising materials, and other materials related to such distribution and use acknowledge that the software was developed by Carnegie Mellon University. The name of the University may not be used to endorse or promote products derived from this software without specific prior written permission.THIS SOFTWARE IS PROVIDED “AS IS” AND WITHOUT ANY EXPRESS OR IMPLIED WARRANTIES, INCLUDING, WITHOUT LIMITATION, THE IMPLIED WARRANTIES OF MERCHANTABILITY AND FITNESS FOR A PARTICULAR PURPOSE. |
| Zlib zlib.h. Interface of the zlib general purpose compression library version 1.1.4, March 11th, 2002. Copyright (C) 1995–2002 Jean-loup Gailly and Mark Adler.This software is provided “as is,” without any express or implied warranty. In no event will the authors be held liable for any damages arising from the use of this software. Permission is granted to anyone to use this software for any purpose, including commercial applications, and to alter it and redistribute it freely, subject to the following restrictions:1. The origin of this software must not be misrepresented; you must not claim that you wrote the original software. If you use this software in a product, an acknowledgment in the product documentation would be appreciated but is not required.2. Altered source versions must be plainly marked as such, and must not be misrepresented as being the original software.3. This notice may not be removed or altered from any source distribution.Jean-loup Gailly: jloup@gzip.org; Mark Adler: madler@alumni.caltech.edu.The data format used by the zlib library is described by RFCs (Request for Comments) 1950 to 1952 in the files rfc1950.txt (zlib format), rfc1951.txt (deflate format), and rfc1952.txt (gzip format). For more information, see http://www.ietf.org/rfc/. |
Index
Numerics
10BaseT, 100BaseT, and 1000BaseT 55
A
AC input
STM150 20
STM300 21
STM600 21
access
preventing inherited privileges 156
read/write and read-only 61
remote management 64
rules for Web access 132
action buttons (Web Management Interface) 31
activating service licenses 12, 50
Active Directory (AD)
domains 161
how it works 158
overview 157
ActiveX objects 86
address binding, permanent 57, 59
administrator (admin)
overview 61
receiving
alerts by email 182
logs by email 178
reports by email 204
settings 63
airflow 23
alerts
email address for sending alerts 176
specifying alerts to send via email 182
Alexa Toolbar 86, 130
allowing
emails 100
URLs 118
Web access exceptions 134
Web categories 47, 114
antispam settings, backing up 68
antivirus
action if infected emails 38
user notification settings 93
application software, updating 71
applications
activity reports 243
control 127
custom categories 143, 145
logs 179, 180, 194, 196
recent 5 and top 5 violations 188
setting access exceptions 137
status 187
attached devices, monitoring with SNMP 65
audio and video files
email filtering 97
FTP filtering 127
Web filtering 113, 137
authenticated users 135
authentication
methods 157
using the DC agent 164
Auto Uplink 11
automatically updating software 72
autosensing, speed 54, 55
B
backing up settings 68
binding MAC addresses 59
BitTorrent 85, 130
blacklist
emails 98
URLs 118
blocking
emails 100
file extensions 94, 97, 109, 113, 127
file names 94, 97
keywords, emails 94, 96
sites, reducing traffic 82
URLs 118
Web access exceptions 134
Web categories 47, 109, 114
Web objects 109, 113
bottom panel and label
STM150 22
STM300 22
STM600 23
browsers, for Web Management Interface 28
bundle key, for registering 50
buttons (hardware)
Power
STM150 20
STM300 21
STM600 21
Reset (STM150 only) 20, 71
buttons (software) 31, 32
C
CA (Certification Authority) 76
cache, clearing Web categories 115
capabilities and features 9
card, service registration 12
categories, Web content 47, 114
certificates
authentication 120
commercial CAs 77
exchange 120
managing 76
NETGEAR default 78
self-signed 77
third party website 123
trusted 79
untrusted 80
warning messages 29, 65, 121
Certification Authority (CA) 76
Challenge Handshake Authentication Protocol (CHAP) 157
clearing statistics 186
clients, identifying infected 199
community strings, SNMP 66
community, ProSecure™ 2
comparison, STM models 12
compatibility, protocols 246
compliance
notification of 249
regulatory and safety 247
compressed files
email filtering 97
FTP filtering 127
Web filtering 113, 137
concurrent number of users and scanned HTTP connections 12
configuration
changes, system logs 179
settings, defaults 245
using the Setup Wizard 32
Configuration Manager login 155
configuration menu (Web Management Interface) 31
connections, concurrently scanned, HTTP 12
console port
STM150 20
STM300 16
STM600 18
content filtering
See also emails.
See also Web content filtering.
audio, compressed, executable, and video files 137
blocked Web page, user notification settings 113, 114
emails 94, 95
logs 179, 180, 194, 196
overview 84, 109
scheduling 114
settings, using the Setup Wizard 46
Web 47, 112, 114
control, applications 127
cookies 86
CPU usage 186
critical updates 74
crossover cable 11, 224
D
dates
setting 36, 75, 76
troubleshooting 228
daylight savings time 36, 76
DC (domain controller) agent 164
debug logs 218
dedicated management VLAN port 12
defaults
configuration
list of settings 245
restoring 70, 227
content filtering settings 85
domains, for authentication 172
IP address 34, 54
login time-out 30
NETGEAR certificate 78
subnet mask 34, 54
user name and password 29
deployment
rack mounting 24
scenarios 25
testing and verifying connectivity 49
diagnostic tools 216
distinguished name (DN) 158
distributed spam analysis 102, 103
DNS
looking up an address 217
server IP addresses 34, 54
ProSecure Web/Email Security Threat Management (STM) Appliance
documentation
online 231
reference 248
domain controller (DC) agent 164
domains
default 172
LDAP and Active Directory (AD) 161
overview 147
RADIUS 167
trusted 109
Web access exceptions, applying to 134
downlink (LAN) ports 14, 16
downloading
DC agent software 165
SSL certificate 29
STM software 73
dropped packets, session limit exceeded 57
duplex, settings 54
dust 23
dynamic MAC bindings 60
E
eDonkey 85, 130
EICAR 49
electrical noise 23
email notification server
configuring manually 176
settings, using the Setup Wizard 42
SMTP server 42, 176
emails
activity reports 239
antivirus settings 38
antivirus user notifications 93
attachments, sizes 39, 91
audio, compressed, executable, and video files, filtering 97
blocked, statistics 190
content filtering 94, 95
defaults, content filtering and scan settings 85
distributed spam analysis 102, 103
filter logs 179, 180, 194, 196
protection. See SMTP, POP3, or IMAP.
real-time blacklist 100
scanned, statistics 189
security settings, using the Setup Wizard 37
SMTP throughput (emails per hour) 12
spam protection, overview 97
traffic logs 179, 180, 194, 196
traffic statistics 186
whitelist and blacklist 98
environmental specifications 246
error, system logs 179
exceptions, Web access
custom categories 142
custom groups 139
setting rules 132
exclusions, scanning 130
executable files
email filtering 97
FTP filtering 127
Web filtering 113, 137
F
facilities, syslog server 181
factory defaults
login 22
service licenses, automatic retrieval 51
settings, reverting to 70, 227
failure bypass 12
features and capabilities 9
file extensions
blocking
for emails 94, 97
for Web access 109, 113, 127
settings access exceptions 137
file names, blocking 94, 97
File Transfer Protocol. See FTP.
files, suspicious 230
filtering reports 204, 233
firmware
updating 71
versions 193
fixes, "hot" 229
Flash objects 86
forum, ProSecure™ 2
FQDN (fully qualified domain name) 65
front panel
STM150 14
STM300 16
STM600 18
FTP (File Transfer Protocol)
action, infected Web file or object 41
default port 40, 106
enabling scanning 40, 106
filtering files (audio, video, executable, and
compressed) 127
sizes of files and objects 127
fully qualified domain name (FQDN) 65
G
gateway address 54
Gnutella 85, 130
Google Talk 85, 130
GoToMyPC 86, 130
groups
by IP address and subnet, managing 151 by IP membership, authentication 135, 141 by name, managing 149 local 135, 141 membership 148 overview 147 Web access exceptions applying to 134 creating custom groups 139
guest users 61, 63
guidelines, performance and sizing 12
H
hard disk usage 186
Hard drive (HDD) LED
STM150, not applicable
STM300 17
STM600 19
hardware
serial number 193
STM150
bottom panel and label 22
front panel 14
LEDs 15, 223, 224
rear panel 20
STM300
bottom panel and label 22
front panel 16
LEDs 17, 223, 224
rear panel 21
STM600
bottom panel and label 23
front panel 18
LEDs 19, 223, 224
rear panel 21
help button (Web Management Interface) 32
hosts
public 105
security alerts 77
trusted
importing 125
SNMP 67
specifying 124
hot fixes 229
HTML (Hypertext Markup Language), scanning 108
HTTP (Hypertext Transfer Protocol)
action, infected Web file or object 40, 108
default port 40, 106
logging, traffic 112
proxy settings
configuring manually 61
for HTTPS scanning 119, 123
using the Setup Wizard 45
scanning
concurrent connections 12
enabling 40, 106
testing 49
trusted hosts 124
HTTPS (Hypertext Transfer Protocol over Secure Socket Layer)
action, infected Web file or object 41, 108
default port 40, 106
managing certificates 78
scanning
enabling 40, 106
explanation of process 119
trusted hosts 124
Hypertext Markup Language (HTML) 108
Hypertext Transfer Protocol over Secure Socket Layer. See HTTPS.
Hypertext Transfer Protocol. See HTTP.
|
ICMP (Internet Control Message Protocol) time-out 57
ICQ (instant messaging) 85, 130
IDS (intrusion detection system) 8
IETF (Internet Engineering Task Force) 65
IMAP (Internet Message Access Protocol)
action, infected emails 38, 90
blocking (password-protected attachments, file
extensions, and file names) 96
default port 38, 88
enabling scanning 38, 88
importing
certificates 79
trusted hosts 125
informational messages, system logs 179
initial configuration, Setup Wizard 32
installation, steps 27
instant messaging services
configuring 130
defaults 85
statistics 187
interfaces
binding to a MAC address 60
speed and duplex settings 54
status 193
Internet Control Message Protocol (ICMP) time-out 57
Internet Engineering Task Force (IETF) 65
Internet Message Access Protocol. See IMAP.
ProSecure Web/Email Security Threat Management (STM) Appliance
intrusion detection systems (IDS) and intrusion prevention systems (IPS) 8
IP addresses
DNS servers 34, 54
public 105
STM 34, 54
subnet mask, STM 34, 54
IPS (intrusion prevention system) 8
iTunes 85, 130
J
Java objects 86
Javascript 86, 113
K
KDE (MIB browser) 67
Kensington lock (STM150 only) 20
keywords, blocking in emails 94, 96
kit, rack-mounting 24
Knowledge Base 231
L
LAN default settings 246
LAN LEDs
STM150 15
STM300 17
STM600 19
troubleshooting 223, 224
LAN ports
STM150 14
STM300 16
STM600 18
LDAP (Lightweight Directory Access Protocol) binding a DN 158
configuring a DN 162
domains 161
overview 157
settings 162
users and groups 136, 141
LEDs
Hard drive (HDD)
STM150, not applicable
STM300 17
STM600 19
LAN
STM15015
STM30017
STM60019
locations
STM150 14
STM300 16
STM600 18
Power
STM150 15
STM300 17
STM600 19
Status
STM150, not applicable
STM300 17
STM600 19
stop blinking (Test LED, Status LED) 193
Test (STM150 only) 15
troubleshooting 223, 224
WAN
port speed indicators 223
STM150 15
STM300 17
STM600 19
license expiration alert 182
licenses
activating 50
expiration dates 193
key 12
trial period 50
lifetime, quarantine 82
Lightweight Directory Access Protocol. See LDAP.
limits, sessions 57
listening port, DC agent 166
location, placement 23
lock, Kensington (STM150 only) 20
log information, diagnostics 219
logging
administrator emailing options 178
clearing 182
email address for sending logs 176
management 199
querying logs 194
search criteria 196
selecting logs 196
specifying logs to send via email 179
syslog server 180
logging out users
all active 172
preventing inherited access privileges 156
login
default settings 245
time-out
changing 62
defaults 30
looking up DNS address 217
M
MAC addresses, binding 59
main navigation menu (Web Management Interface) 31
malware
alerts and outbreak alerts 182, 183
blocked page, user notification settings 108
detected, statistics 190
infected files, viewing 213
logs 179, 180
quarantine area size 82
quarantined
querying and viewing 209
statistics 190
recent 5 and top 5 threats 188
management
default settings 245
digital certificates 76
performance 82
Management Information Base (MIB) 67
management ports
STM150, not applicable
STM300 16
STM600 18
manually updating software 73
maximum transmission unit (MTU) settings 34, 55
media applications
configuring 130
defaults 85
status 187
memory usage 186
menu descriptions 31
MG-Soft MIB browser 67
MIB (Management Information Base), and MIB browsers 67
mIRC (instant messaging) 85, 130
misclassification, of URLs 115
models, STM 12
moisture 23
MSN Messenger 85, 130
MTU (maximum transmission unit) settings 34, 55
N
name, system 34, 54
NETGEAR Configuration Manager login 155
NETGEAR registration server 13
Net-SNMP (Linux Text) (MIB browser) 67
network
diagnostic tools 215, 216
refreshing 57
statistics report, diagnostics 219
network settings
backing up 68
configuring manually 52
using the Setup Wizard 33
Network Time Protocol (NTP), troubleshooting 228
notification settings (users)
antivirus 93
malware, blocked page 108
URLs, blocked 119
Web content filtering, blocked page 113, 114
NTP servers, settings 35, 75
O
online analysis, by NETGEAR 230
online documentation 231
online support 228
operating system, updating 44, 71
outbreak, malware alerts 182, 184
P
package contents, STM 13
packets
dropped, exceeding session limit 57
transmitted and received, statistics 190
pair of ports 12
Password Authentication Protocol (PAP) 157
password-protected attachments 94, 96
passwords
changing 62
default 29
restoring 227
pattern file
signatures 44
updating 71
peer-to-peer (P2P) services
configuring 130
defaults 85
status 187
performance and sizing guidelines 12
performance, management 82
permanent MAC bindings 60
phishing 102
physical specifications 246
pinging
ping utility, diagnostics 216
troubleshooting TCP/IP 225
placement, location 23
polling interval 186
POP3 (Post Office Protocol 3)
action, infected emails 38, 90
ProSecure Web/Email Security Threat Management (STM) Appliance
blocking (keywords, password-protected
attachments, file extensions, and file names) 96
default port 38, 88
distributed spam analysis 103
enabling scanning 38, 88
ports
console
STM150 20
STM300 16
STM600 18
LAN
speed 223
STM150 14
STM300 16
STM600 18
locations
STM150 14
STM300 16
STM600 18
management
STM150, not applicable
STM300 16
STM600 18
public 105
WAN
STM150 14
STM300 16
STM600 18
Post Office Protocol 3. See POP3.
Power button
STM150 20
STM300 21
STM600 21
Power LED
STM150 15
STM300 17
STM600 19
troubleshooting 223
power receptacle
STM150 20
STM300 21
STM600 21
power specifications, adapter 246
priorities, syslog server 181
product updates 2
ProSecure™ forum and community 2
ProSecure™ Web/Email Security Threat Management
Appliance STM150, STM300, or STM600 Installation
Guide 27
protocols
compatibilities 246
settings access exceptions 137
Web 105
proxies
for HTTPS scanning 119
HTTP
configuring manually 61
using the Setup Wizard 45
scanning defaults 86
Q
QQ (instant messaging) 85, 130
quarantine
infected files (malware), viewing 213
search criteria 211
settings 81
spam emails, viewing 212
viewing 208
question mark icon (Web Management Interface) 32
Quicktime 85, 130
R
rack-mount kit 24
RADIUS
domains 167
overview 157
shared secrets 168
users 136, 142
VLANs 170
RADIUS-CHAP and RADIUS-PAP 157, 168
read/write access, read-only access 61
Real Player 85, 130
real-time blacklist (RBL)
emails 100
terms of service 101
real-time clock (RTC) 35, 75
real-time protection, capabilities 10
real-time traffic, diagnostics 217
rear panel
STM150 20
STM300 21
STM600 21
rebooting 219
reducing traffic 82
reference documents 248
refreshing the network 57
registering with NETGEAR 50
registration information, retrieving 13
regulatory compliance 247
Remote Authentication Dial In User Service. See RADIUS.
remote management, access and configuration 64
remote troubleshooting, enabling 228
removing, embedded objects 113
reports
email address for sending reports 176
filtering options 204, 233
generating 202
scheduling 203
templates 200, 233
user-generated spam report 214
Web resource usage 191
Reset button, STM150 (only) 20, 71
restoring
factory default settings 70, 227
settings from backup file 69
Rhapsody 85, 130
routes, tracing 216
RTC (real-time clock) 35, 75
rules, Web access exceptions 132
S
safety compliance 247
scan engine
capabilities 10
updating 44, 71
scan settings, backing up 68
scanning
email security settings 38
exclusions 130
HTML files 108
overview 84
size exceptions
email attachments 39, 91
FTP files and objects 127
Web files and objects 41, 108
Web security settings 40
scheduling
content filtering 114
reports 203
updates 44, 71
Web access exceptions 136
search criteria
logs 196
quarantine 211
Secure Socket Layer. See SSL.
security alerts, trusted or untrusted hosts 77
security subscription update settings
configuring manually 71
using the Setup Wizard 43
service licenses
activating 50
automatic retrieval 51
expiration dates 193
trial period 50
service registration card 12
sessions
expiration length 171
limits 57
time-out 63
Setup Wizard, initial configuration 32
severities, syslog 180
shared secrets, RADIUS 168
shutting down 219
signatures, pattern file 44
Simple Mail Transfer Protocol. See SMTP.
Simple Network Management Protocol. See SNMP.
size, exceptions
email attachments 39, 91
FTP files and objects 127
Web files and objects 41, 108
size, quarantine areas 82
sizing and performance, guidelines 12
SMTP (Simple Mail Transfer Protocol)
action, infected emails 38, 89
blocking (keywords, password-protected
attachments, file extensions, and file names) 96
default port 38, 88
distributed spam analysis 103
enabling scanning 38, 88
server for email notification 42, 176
throughput (emails per hours) 12
sniffer 224
SNMP (Simple Network Management Protocol)
overview 65
settings 66
SNMPv1 and SNMPv2, supported 65
traps 67
trusted hosts 67
software updates, system logs 179
software, STM 44
spam
blocked messages, recent 5 and top 5 188
detected, statistics 190
distributed spam analysis 102
logs 179, 180, 194, 196
protection, overview 97
quarantine area size 82
quarantined
emails, viewing 212
querying and viewing 209
statistics 190
real-time blacklist (RBL) 100
reports, sending 104
user-generated report 214
whitelist and blacklist 98
Spamhaus and Spamcop 101
specifications, physical and technical 246
ProSecure Web/Email Security Threat Management (STM) Appliance
speed settings and autosensing 54
spyware
logs 194, 196
See also anti virus, See also emails.
SSL (Secure Socket Layer)
connection and HTTPS scanning 120
disabling SSLv2 connections 123
encryption for LDAP 162
SSLv2, SSLv3, and TLSv1 123
SSL certificates
downloading 29
warning message 65, 121
statistics (interfaces, service, and traffic) 189
status
interfaces and Web Management Interface 193
system 186, 192
Status LED
STM150, not applicable
STM300 17
STM600 19
stop blinking 193
troubleshooting 223
STM150 hardware
bottom panel and label 22
front panel 14
LEDs 15, 223, 224
rear panel 20
STM300 hardware
bottom panel and label 22
front panel 16
LEDs 17, 223, 224
rear panel 21
STM600 hardware
bottom panel and label 23
front panel 18
LEDs 19, 223, 224
rear panel 21
Stream Scanning technology overview 10
streaming, scanned file parts 40, 108
submenu tabs (Web Management Interface) 31
subnet mask, STM 34, 54
support
online 228
technical 2
suspicious files 230
switch, power
STM150 20
STM300 21
STM600 21
synchronization interval, DC agent 166
syslog server 180
system
activity reports 244
logs 179, 180, 194, 196
name 34, 54
status 186, 192
system date and time settings, using the Setup Wizard 35
T
table buttons (Web Management Interface) 32
tabs, submenu (Web Management Interface) 31
TCP (Transmission Control Protocol) time-out 57
TCP/IP network troubleshooting 225
technical specifications 246
technical support 2
templates, reports 200, 233
terms of service, real-time blacklist (RBL) 101
Test LED (STM150 only)
description 15
stop blinking 193
troubleshooting 223
testing
connectivity and HTTP scanning 49
URLs 217
throughput
time, daylight savings
applied automatically 36, 76
troubleshooting 228
time-out
errors 225
sessions 63
TCP, UDP, and ICMP 57
TLS (Transport Layer Security) 162
tools (online)
configuring 130
defaults 86
status 187
tracing a route (traceroute) 216
trademarks 2
traffic
diagnostic tools 215
email and Web logs 179, 180, 194, 196
real-time diagnostics 217
reducing 82
total scanned, in MB 189
total, in bytes 188
Transmission Control Protocol (TCP) time-out 57
Transport Layer Security (TLS) 162
traps, SNMP 67
trial period, service licenses 50
troubleshooting
basic functioning 223
browsers 225
configuration settings, using sniffer 224
defaults 225
LEDs 223, 224
NTP 228
remotely 228
testing your setup 226
time-out error 225
Web Management Interface 224
trusted certificates 79
trusted domains 109
trusted hosts 124
trusted URLs 109
U
UDP (User Datagram Protocol) time-out 57
unauthenticated users 135
untrusted certificates 80
update failure alert 182, 183
update servers 44, 73
update settings
backing up 68
security subscriptions
configuring manually 71
using the Setup Wizard 43
updates
critical 74
product 2
scheduling 44, 71
updating software 71
uplink (WAN) ports 14, 16
URLs
blacklist 118
blocked
statistics 190
user notification settings 119
categorization 115
custom categories 144, 145
misclassification 115
settings access exceptions 137
testing 217
trusted 109
using wildcards 118
whitelist 118
USB port, nonfunctioning
STM150 14
STM300 16
STM600 18
User Datagram Protocol (UDP) time-out 57
user name, default 29
User Portal Login link 156
users
accounts, configuring 152
administrative (admin) 61, 63, 155
authenticated 135, 148
global settings 170
guests 61, 63
logging out 156
number of concurrent 12
overview 147
searching 135, 141, 173
special privileges 155
unauthenticated 135, 148
Web access exceptions, applying to 134
V
virus
logs 194, 196
See also malware.
VLAN port, dedicated management 12
VLANs (virtual LANs), using for authentication 170
W
WAN LEDs
port speed indicators 223
STM150 15
STM300 17
STM600 19
troubleshooting 224
WAN ports
STM150 14
STM300 16
STM600 18
warning message, SSL certificate 29, 65, 121
Weatherbug 86, 130
Web access exceptions
custom categories 142
custom groups 139
setting rules 132
Web activity
reports 233
statistics 186
traffic logs 179, 180, 194, 196
Web categories
blocked, recent 5 and top 5 188
blocking 109, 114
blocking, using the Setup Wizard 47
custom, for exceptions 142, 144
ProSecure Web/Email Security Threat Management (STM) Appliance
default settings 86
filtering, using the Setup Wizard 46
setting access exceptions 138
Web content filtering
audio, compressed, executable, and video files 113, 137
blocked malware, user notifications 108
blocked page, user notifications 113, 114
blocked URL, user notifications 119
defaults 85
files and objects, sizes 41, 108
logs 179, 180, 194, 196
overview 109
security settings, using the Setup Wizard 39
Web Management Interface 31
browsers, qualified 28
layout 30
settings 34
status 193
troubleshooting 224
Web objects
blocking 109, 113
default settings 86
sizes 41, 108
Web protection. See HTTP, See HTTPS, See FTP.
Web resource usage
monitoring 190
reports 191
Web scanning
defaults 85
throughput 12
whitelist
emails 98
URLs 118
wildcards, using for URLs 118
Winamp 85, 130
Y
Yahoo Messenger 85, 130
Yahoo Toolbar 86, 130
Z
zone, time 36, 76


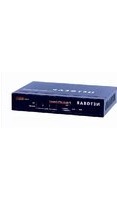

- PROSECURE WEB/EMAIL SECURITY THREAT MANAGEMENT APPLIANCE STM150, STM300, OR STM600
- TECHNICAL SUPPORT
- PRODUCT UPDATES
- PROSECURE FORUM
- TRADEMARKS
- STATEMENT OF CONDITIONS
- CONTENTS
- CHAPTER 1 INTRODUCTION
- CHAPTER 2 USING THE SETUP WIZARD TO PROVISION THE STM IN YOUR NETWORK
- CHAPTER 3 PERFORMING NETWORK AND SYSTEM MANAGEMENT
- CHAPTER 4 CONTENT FILTERING AND OPTIMIZING SCANS
- CHAPTER 5 MANAGING USERS, GROUPS, AND AUTHENTICATION
- CHAPTER 6 MONITORING SYSTEM ACCESS AND PERFORMANCE
- CHAPTER 7 TROUBLESHOOTING AND USING ONLINE SUPPORT
- APPENDIX A REPORT TEMPLATES
- APPENDIX B DEFAULT SETTINGS AND TECHNICAL SPECIFICATIONS
- APPENDIX C RELATED DOCUMENTS
- APPENDIX D NOTIFICATION OF COMPLIANCE
- WHAT IS THE PROSECURE WEB/EMAIL SECURITY THREAT MANAGEMENT APPLIANCE STM150, STM300, OR STM600
- WHAT CAN YOU DO WITH AN STM
- KEY FEATURES AND CAPABILITIES
- STREAM SCANNING FOR CONTENT FILTERING
- AUTOSENSING ETHERNET CONNECTIONS WITH AUTO UPLINK
- EASY INSTALLATION AND MANAGEMENT
- MAINTENANCE AND SUPPORT
- STM MODEL COMPARISON
- SERVICE REGISTRATION CARD WITH LICENSE KEYS
- PACKAGE CONTENTS
- HARDWARE FEATURES
- FRONT PANEL PORTS AND LEDS
- STM150 FRONT PANEL
- FRONT PANEL STM300
- FRONT PANEL STM600
- REAR PANEL FEATURES
- REAR PANEL STM150
- REAR PANEL STM300 AND STM600
- BOTTOM PANEL WITH PRODUCT LABEL
- STM150 PRODUCT LABEL
- STM300 PRODUCT LABEL
- STM600 PRODUCT LABEL
- CHOOSING A LOCATION FOR THE STM
- USING THE RACK-MOUNTING KIT
- USING THE SETUP WIZARD TO PROVISION THE STM IN YOUR NETWORK
- 2
- CHOOSING A DEPLOYMENT SCENARIO
- GATEWAY DEPLOYMENT
- SERVER GROUP
- SEGMENTED LAN DEPLOYMENT
- UNDERSTANDING THE STEPS FOR INITIAL CONNECTION
- QUALIFIED WEB BROWSERS
- LOGGING IN TO THE STM
- TO CONNECT AND LOG IN TO THE STM
- UNDERSTANDING THE WEB MANAGEMENT INTERFACE MENU LAYOUT
- FIGURE 19
- USING THE SETUP WIZARD TO PERFORM THE INITIAL CONFIGURATION
- TO START THE SETUP WIZARD
- SETUP WIZARD STEP 1 OF 10: INTRODUCTION
- SETUP WIZARD STEP 2 OF 11: NETWORKING SETTINGS
- SETUP WIZARD STEP 3 OF 11: TIME ZONE
- SETUP WIZARD STEP 4 OF 11: EMAIL SECURITY
- SETUP WIZARD STEP 5 OF 11: WEB SECURITY
- SKIP ✓ IF THE FILE OR MESSAGE IS LARGER THAN 10240 KB(MAXIMUM: 51200 KB)
- SETUP WIZARD STEP 6 OF 11: EMAIL NOTIFICATION SERVER SETTINGS
- SETUP WIZARD STEP 7 OF 11: UPDATE SETTINGS
- SETUP WIZARD STEP 8 OF 11: HTTP PROXY SETTINGS
- SETUP WIZARD STEP 9 OF 11: WEB CATEGORIES
- SETUP WIZARD STEP 10 OF 11: CONFIGURATION SUMMARY
- SETUP WIZARD STEP 11 OF 11: RESTARTING THE SYSTEM
- VERIFYING CORRECT INSTALLATION
- TESTING CONNECTIVITY
- TESTING HTTP SCANNING
- REGISTERING THE STM WITH NETGEAR
- TO ACTIVATE THE SERVICE LICENSES
- WHAT TO DO NEXT
- PERFORMING NETWORK AND SYSTEM MANAGEMENT
- 3
- CONFIGURING NETWORK SETTINGS
- TO CONFIGURE THE STM'S NETWORK SETTINGS
- CONFIGURING SESSION LIMITS AND TIMEOUTS
- TO CONFIGURE SESSION LIMITS AND TIMEOUTS
- CONFIGURING THE NETWORK REFRESH AND PERMANENT MAC ADDRESS BINDINGS
- TO REFRESH THE NETWORK AND VIEW THE MAC ADDRESS BINDINGS TABLE
- MANAGING PERMANENT MAC ADDRESS BINDINGS
- TO CREATE A PERMANENT MAC BINDING
- CHANGING A DYNAMIC MAC ADDRESS BINDING TO A PERMANENT BINDING
- TO CHANGE A DYNAMIC BINDING TO A PERMANENT BINDING
- ACTIVATING, EDITING, OR DELETING A PERMANENT MAC ADDRESS BINDING
- TO ASSIGN ANOTHER INTERFACE TO A PERMANENT MAC ADDRESS BINDING
- CONFIGURING THE HTTP PROXY SETTINGS
- TO CONFIGURE THE HTTP PROXY
- ABOUT USERS WITH ADMINISTRATIVE AND GUEST PRIVILEGES
- CHANGING ADMINISTRATIVE PASSWORDS AND TIMEOUTS
- TO MODIFY THE ADMINISTRATOR AND GUEST ACCOUNTS, AND TO MODIFY THE WEB MANAGEMENT INTERFACE TIMEOUT SETTING
- CONFIGURING REMOTE MANAGEMENT ACCESS
- TO CONFIGURE REMOTE MANAGEMENT
- USING AN SNMP MANAGER
- TO ENABLE SNMP AND TO CONFIGURE THE SNMP SETTINGS
- SELECT ADMINISTRATION > SNMP FROM THE MENU. THE SNMP SCREEN DISPLAYS
- SELECT THE RADIO BUTTONS AND COMPLETE THE FIELDS AS EXPLAINED IN THE FOLLOWING TABLE
- CLICK APPLY TO SAVE YOUR SETTINGS
- SUPPORTED MIB BROWSERS
- MANAGING THE CONFIGURATION FILE
- BACKING UP SETTINGS
- TO BACK UP SETTINGS
- RESTORING SETTINGS
- WARNING
- TO RESTORE SETTINGS FROM A BACKUP FILE
- REVERTING TO FACTORY DEFAULT SETTINGS
- UPDATING THE SOFTWARE
- SCHEDULING UPDATES
- TO CONFIGURE SCHEDULED UPDATES
- PERFORMING A MANUAL UPDATE
- CRITICAL UPDATES THAT REQUIRE A RESTART
- CONFIGURING DATE AND TIME SERVICE
- MANAGING DIGITAL CERTIFICATES
- MANAGING THE CERTIFICATE FOR HTTPS SCANS
- TO DOWNLOAD THE CURRENT CERTIFICATE INTO YOUR BROWSER
- TO RELOAD THE DEFAULT NETGEAR CERTIFICATE
- TO IMPORT A NEW CERTIFICATE
- MANAGING TRUSTED CERTIFICATES
- TO MANAGE TRUSTED CERTIFICATES
- TO VIEW DETAILS OF A TRUSTED CERTIFICATE
- TO DELETE A TRUSTED CERTIFICATE
- TO IMPORT A TRUSTED CERTIFICATE
- MANAGING UNTRUSTED CERTIFICATES
- TO MANAGE UNTRUSTED CERTIFICATES
- TO VIEW DETAILS OF AN UNTRUSTED CERTIFICATE
- TO DELETE AN UNTRUSTED CERTIFICATE
- TO MOVE AN UNTRUSTED CERTIFICATE TO THE TRUSTED CERTIFICATE AUTHORITIES TABLE
- MANAGING THE QUARANTINE SETTINGS
- TO CHANGE THE QUARANTINE SETTINGS
- MANAGING THE STM'S PERFORMANCE
- CONTENT FILTERING AND OPTIMIZING SCANS
- 4
- ABOUT CONTENT FILTERING AND SCANS
- DEFAULT EMAIL AND WEB SCAN SETTINGS
- CONFIGURING EMAIL PROTECTION
- CUSTOMIZING EMAIL PROTOCOL SCAN SETTINGS
- TO CONFIGURE THE EMAIL PROTOCOLS AND PORTS TO SCAN
- CUSTOMIZING EMAIL ANTI-VIRUS SETTINGS
- ACTION SETTINGS
- TO CONFIGURE THE EMAIL ANTIVIRUS ACTION SETTINGS
- EXCEPTION SETTINGS
- TO CONFIGURE THE EMAIL ANTIVIRUS EXCEPTION SETTINGS
- NOTIFICATION SETTINGS
- TO CONFIGURE THE EMAIL ANTIVIRUS NOTIFICATION SETTINGS
- EMAIL CONTENT FILTERING
- TO CONFIGURE EMAIL CONTENT FILTERING
- SELECT EMAIL SECURITY > FILTERS FROM THE MENU. THE FILTERS SCREEN DISPLAYS
- PROTECTING AGAINST EMAIL SPAM
- SETTING UP THE WHITELIST AND BLACKLIST
- TO CONFIGURE THE WHITELIST AND BLACKLIST
- CONFIGURING THE REAL-TIME BLACKLIST
- TO ENABLE THE REAL-TIME BLACKLIST
- TO ADD A BLACKLIST PROVIDER TO THE REAL-TIME BLACKLIST
- CONFIGURING DISTRIBUTED SPAM ANALYSIS
- CONFIGURING WEB AND SERVICES PROTECTION
- CUSTOMIZING WEB PROTOCOL SCAN SETTINGS
- CONFIGURING WEB MALWARE SCANS
- TO CONFIGURE THE WEB-BASED MALWARE SETTINGS
- CONFIGURING WEB CONTENT FILTERING
- TO CONFIGURE WEB CONTENT FILTERING
- CONFIGURING WEB URL FILTERING
- TO CONFIGURE WEB URL FILTERING
- HTTPS SCAN SETTINGS
- TO CONFIGURE THE HTTPS SCAN SETTINGS
- SPECIFYING TRUSTED HOSTS
- TO SPECIFY TRUSTED HOSTS
- CONFIGURING FTP SCANS
- TO CONFIGURE THE FTP SCAN SETTINGS
- SELECT WEB SECURITY > FTP FROM THE MENU. THE FTP SCREEN DISPLAYS
- COMPLETE THE FIELDS, SELECT THE CHECK BOXES, AND MAKE YOUR SELECTIONS FROM THE DROP-DOWN LISTS AS EXPLAINED IN THE FOLLOWING TABLE
- CONFIGURING APPLICATION CONTROL
- TO ENABLE AND CONFIGURE APPLICATION CONTROL
- SETTING SCANNING EXCLUSIONS AND WEB ACCESS EXCEPTIONS
- SETTING SCANNING EXCLUSIONS
- TO CONFIGURE SCANNING EXCLUSION RULES
- SETTING ACCESS EXCEPTION RULES FOR WEB ACCESS
- TO SET WEB ACCESS EXCEPTION RULES
- TO MAKE CHANGES TO AN EXISTING EXCEPTION RULE
- TO DELETE OR DISABLE ONE OR MORE EXCEPTION RULES
- CREATING CUSTOM GROUPS FOR WEB ACCESS EXCEPTIONS
- TO CREATE AND MANAGE CUSTOM GROUPS
- TO MAKE CHANGES TO AN EXISTING CUSTOM GROUP
- TO DELETE ONE OR MORE CUSTOM GROUPS
- CREATING CUSTOM CATEGORIES FOR WEB ACCESS EXCEPTIONS
- TO CREATE AND MANAGE CUSTOM CATEGORIES
- TO MAKE CHANGES TO AN EXISTING CUSTOM CATEGORY
- TO DELETE ONE OR MORE CUSTOM CATEGORIES
- MANAGING USERS, GROUPS, AND AUTHENTICATION
- 5
- ABOUT USERS, GROUPS, AND DOMAINS
- CONFIGURING GROUPS
- CREATING AND DELETING GROUPS BY NAME
- TO CREATE A LOCAL GROUP BY NAME
- EDITING GROUPS BY NAME
- CREATING AND DELETING GROUPS BY IP ADDRESS AND SUBNET
- CONFIGURING USER ACCOUNTS
- CREATING AND DELETING USER ACCOUNTS
- EDITING USER ACCOUNTS
- TO MODIFY THE PASSWORD FOR A USER
- CONFIGURING AUTHENTICATION
- UNDERSTANDING THE STM'S AUTHENTICATION OPTIONS
- ADMINISTRATIVE USERS AND USERS WITH GUEST PRIVILEGES
- USERS WITH SPECIAL ACCESS PRIVILEGES
- ENSURE THAT USERS UNDERSTAND THAT THEY NEED TO LOG OUT AFTER COMPLETING A SESSION IN ORDER TO PREVENT SUBSEQUENT USERS FROM INHERITING ACCESS PRIVILEGES THAT WERE NOT ASSIGNED TO THEM
- UNDERSTANDING ACTIVE DIRECTORIES AND LDAP CONFIGURATIONS
- HOW AN ACTIVE DIRECTORY WORKS
- HOW TO BIND A DISTINGUISHED NAME IN AN LDAP CONFIGURATION
- TO BIND A USER WITH THE NAME JAMIE HANSON WITH THE LDAP SERVER
- CREATING AND DELETING LDAP AND ACTIVE DIRECTORY DOMAINS
- EDITING LDAP AND ACTIVE DIRECTORY DOMAINS
- TO EDIT AN LDAP OR ACTIVE DIRECTORY DOMAIN
- UNDERSTANDING THE PROSECURE DC AGENT
- REQUIREMENTS FOR THE PROSECURE DC AGENT SOFTWARE AND DC AGENT SERVER
- DOWNLOADING PROSECURE DC AGENT SOFTWARE, AND CREATING AND DELETING DC AGENTS
- TO DOWNLOAD PROSECURE DC AGENT SOFTWARE AND ADD A DC AGENT
- TO EDIT A DC AGENT
- CREATING AND DELETING RADIUS DOMAINS
- TO CONFIGURE RADIUS AUTHENTICATION
- EDITING RADIUS DOMAINS AND CONFIGURING VLANS
- TO EDIT A RADIUS DOMAIN
- CREATING AND DELETING VLANS FOR USE WITH RADIUS DOMAINS
- TO ADD A VLAN
- GLOBAL USER SETTINGS
- TO SPECIFY THE GLOBAL USER CONFIGURATION SETTINGS
- VIEWING AND LOGGING OUT ACTIVE USERS
- TO LOG OUT ALL ACTIVE USERS
- TO VIEW ALL OR SELECTED USERS
- TO LOG OUT SELECTED ACTIVE USERS
- MONITORING SYSTEM ACCESS AND PERFORMANCE
- CONFIGURING LOGGING, ALERTS, AND EVENT NOTIFICATIONS
- CONFIGURING THE EMAIL NOTIFICATION SERVER
- TO CONFIGURE THE EMAIL NOTIFICATION SERVER
- CONFIGURING AND ACTIVATING SYSTEM, EMAIL, AND SYSLOG LOGS
- EMAILING LOGS
- SENDING LOGS TO A SYSLOG SERVERS
- TO ENABLE AND CONFIGURE LOGS TO BE SENT TO A SYSLOG SERVER
- CLEARING LOGS
- TO CLEAR LOGS
- CONFIGURING ALERTS
- MONITORING REAL-TIME TRAFFIC, SECURITY, STATISTICS, AND WEB USAGE
- UNDERSTANDING THE INFORMATION ON THE DASHBOARD SCREEN
- TO SET THE POLL INTERVAL
- MONITORING WEB USAGE
- TO VIEW THE STM'S WEB USAGE
- VIEWING SYSTEM STATUS
- QUERYING LOGS
- TO QUERY AND DOWNLOAD LOGS
- CLICK ONE OF THE FOLLOWING ACTION BUTTONS
- EXAMPLE: USING LOGS TO IDENTIFY INFECTED CLIENTS
- LOG MANAGEMENT
- VIEWING, SCHEDULING, AND GENERATING REPORTS
- REPORT TEMPLATES
- TO DISPLAY THE REPORT TEMPLATES AND VIEW REPORTS ONSCREEN
- GENERATING REPORTS FOR DOWNLOADING
- TO GENERATE A REPORT
- SCHEDULING AUTOMATIC GENERATION AND EMAILING OF REPORTS
- TO SCHEDULE A REPORT AND ENABLE THE STM TO EMAIL THE REPORT
- ADVANCED REPORT FILTERING OPTIONS
- TO CONFIGURE ADVANCED FILTERING OPTIONS
- VIEWING AND MANAGING THE QUARANTINE FILES
- TO QUERY THE QUARANTINE FILES
- VIEWING AND MANAGING THE QUARANTINED SPAM TABLE
- VIEWING AND MANAGING THE QUARANTINED INFECTED FILES TABLE
- USER-GENERATED SPAM REPORTS
- TO SEND A SPAM REPORT TO AN EMAIL ADDRESS, A USER SHOULD DO THE FOLLOWING
- CLICK SEND REPORT
- USING DIAGNOSTICS UTILITIES
- USING THE NETWORK DIAGNOSTIC TOOLS
- SENDING A PING PACKET
- TO SEND A PING
- TRACING A ROUTE
- TO SEND A TRACEROUTE
- LOOKING UP A DNS ADDRESS
- TO LOOK UP A DNS ADDRESS
- TESTING A URL
- TO TEST A URL
- USING THE REALTIME TRAFFIC DIAGNOSTICS TOOL
- TO USE THE REALTIME TRAFFIC DIAGNOSTICS TOOL
- GATHERING IMPORTANT LOG INFORMATION AND GENERATING A NETWORK STATISTICS REPORT
- GATHERING IMPORTANT LOG INFORMATION
- TO GATHER LOG INFORMATION ABOUT YOUR STM
- GENERATING NETWORK STATISTICS
- TO GENERATE THE NETWORK STATISTIC REPORT
- RESTARTING AND SHUTTING DOWN THE STM
- TO RESTART THE STM
- TO SHUT DOWN THE STM
- TROUBLESHOOTING AND USING ONLINE SUPPORT
- BASIC FUNCTIONING
- AFTER YOU TURN ON POWER TO THE STM, CHECK THAT THE FOLLOWING SEQUENCE OF EVENTS OCCURS
- POWER LED NOT ON
- TEST LED OR STATUS LED NEVER TURNS OFF
- IF ALL LEDS ARE STILL ON MORE THAN SEVERAL MINUTES MINUTE AFTER POWER-UP, DO THE FOLLOWING
- LAN OR WAN PORT LEDS NOT ON
- IF EITHER THE LAN LEDS OR WAN LEDS DO NOT LIGHT WHEN THE ETHERNET CONNECTION IS MADE, CHECK THE FOLLOWING
- TROUBLESHOOTING THE WEB MANAGEMENT INTERFACE
- IF YOU ARE UNABLE TO ACCESS THE STM'S WEB MANAGEMENT INTERFACE FROM A PC ON YOUR LOCAL NETWORK, CHECK THE FOLLOWING
- WHEN YOU ENTER A URL OR IP ADDRESS A TIME-OUT ERROR OCCURS
- TROUBLESHOOTING A TCP/IP NETWORK USING A PING UTILITY
- TESTING THE LAN PATH TO YOUR STM
- TO PING THE STM FROM A PC RUNNING WINDOWS 95 OR LATER
- TESTING THE PATH FROM YOUR PC TO A REMOTE DEVICE
- RESTORING THE DEFAULT CONFIGURATION AND PASSWORD
- TO RESET THE STM TO ITS ORIGINAL FACTORY DEFAULT SETTINGS
- PROBLEMS WITH DATE AND TIME
- USING ONLINE SUPPORT
- ENABLING REMOTE TROUBLESHOOTING
- TO INITIATE THE SUPPORT TUNNEL
- INSTALLING HOT FIXES
- TO INSTALL A HOT FIX
- SENDING SUSPICIOUS FILES TO NETGEAR FOR ANALYSIS
- TO SUBMIT A FILE TO NETGEAR FOR ANALYSIS
- ACCESSING THE KNOWLEDGE BASE AND DOCUMENTATION
- DEFAULT SETTINGS AND TECHNICAL SPECIFICATIONS
- B
- NOTIFICATION OF COMPLIANCE
- D
- REGULATORY COMPLIANCE INFORMATION
- FCC REQUIREMENTS FOR OPERATION IN THE UNITED STATES
- FCC INFORMATION TO USER
- FCC GUIDELINES FOR HUMAN EXPOSURE
- FCC DECLARATION OF CONFORMITY
- FCC RADIO FREQUENCY INTERFERENCE WARNINGS & INSTRUCTIONS
- CANADIAN DEPARTMENT OF COMMUNICATIONS RADIO INTERFERENCE REGULATIONS
- EUROPEAN UNION
- INDEX
- NUMERICS
- A
- C
- PROSECURE WEB/EMAIL SECURITY THREAT MANAGEMENT (STM) APPLIANCE
- E
- F
- G
- H
- J
- K
- L
- M
- N
- O
- P
- Q
- R
- S
- T
- U
- V
- W
- Y
- Z
Brand : NETGEAR
Model : ProSecure STM300 Bundle
Category : Firewall