S730D - Haut-parleur EDIFIER - Notice d'utilisation et mode d'emploi gratuit
Retrouvez gratuitement la notice de l'appareil S730D EDIFIER au format PDF.

Choisissez votre langue et indiquez votre email : nous vous enverrons une version traduite specifiquement.
Questions des utilisateurs sur S730D EDIFIER
0 question sur cet appareil. Repondez a celles que vous connaissez ou posez la votre.
Poser une nouvelle question sur cet appareil
Aucune question pour l'instant. Soyez le premier à en poser une.
Téléchargez la notice de votre Haut-parleur au format PDF gratuitement ! Retrouvez votre notice S730D - EDIFIER et reprennez votre appareil électronique en main. Sur cette page sont publiés tous les documents nécessaires à l'utilisation de votre appareil S730D de la marque EDIFIER.
MODE D'EMPLOI S730D EDIFIER

text_image
Notes For the contents of the report are not to be reproduced or copied. In this case, such that is not subject to change in the past 12 months of December 2013. Edifier's rights issue was filed by Edifier. www.edifier.com Edifier's rights issue was filed by Edifier. N/A. 1984-06-05
text_image
Edifier S730 Multimedia Speaker Linear & Manual How to be carefully tested in a technical manner, including the option
text_image
1997年5月20日 2008年5月20日 A B C D E F G H I J K L M N O P Q R S T U V W X Y Z A B C D E F G H I J K L M N O P Q R S T U V W X Y Z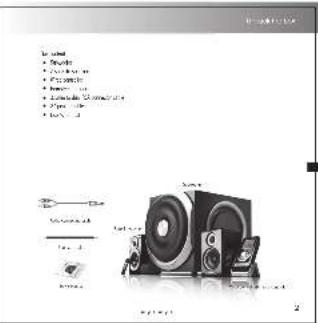
text_image
To use • Audio • Display • Flicker • Hourlight • Litterbox • Puzzles • Sound • Sounder • Sounder • Sounder • Sounder • Sounder • Sounder • Sounder • Sounder • Sounder • Sounder • Sounder • Sounder • Sounder • Sounder • Sounder • Sounder • Sounder • Sounder • Sounder • Sounder • Sounder • Sounder • Sounder • Sounder • Sounder • Sounders • Sounders • Sounders • Sounders • Sounders • Sounders • Sounders • Sounders • Sounders • Sounders • Sounders • Sounders • Sounders • Sounders • Sounders • Sounders • Sounders • Sounders • Sounders • Sounders • Sounders • Sounders • Sounders • Sounders • Sounders • Soundes • Soundes • Soundes • Soundes • Soundes • Soundes • Soundes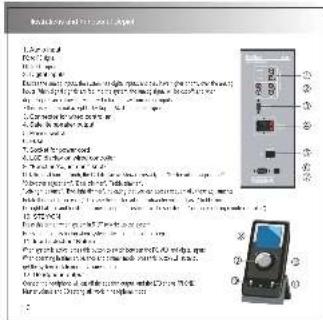
text_image
Scanned document page showing a device with labeled ports and a control panel, likely from an industrial or electronic device.
text_image
Diagram of a device interface with labeled ports, connectors, and measurement annotations in Chinese
text_image
Edit the image on the right side of the chart. The image is designed to create a table with a table for all four rows. All rows contain 10 rows of data, each containing a unique symbol (e.g., circles, squares, stars) and corresponding numeric values. The table contains two rows of data: one with 10 rows of data and one with 2 rows of data. The table contains three rows of data: 1 row, 2 rows, and 3 rows. Each row contains a central icon representing a data point or feature. The table contains three rows of data points (e.g., 1, 2, 3) and three rows of data points (e.g., 4, 5, 6). The table contains three rows of data points (e.g., 1, 2, 3), each associated with a specific value indicated by the number inside the grid. The table contains three rows of data points (e.g., 1, 2, 3), each associated with a specific value indicated by the number inside the grid. The table contains three rows of data points (e.g., 1, 2, 3), each associated with a specific value indicated by the number inside the grid. The table contains three rows of data points (e.g., 1, 2, 3), each associated with a specific value indicated by a number inside the grid. The table contains three rows of data points (e.g., 1, 2, 3), each associated with a specific value indicated by a number inside the grid. The table contains three rows of data points (e.g., 1, 2, 3), each associated with a specific value indicated by a number inside the grid. The table contains three rows of data points (e.g., 1, 2, 3), each associated with an exact numerical value indicated by the number inside the grid. The table contains three rows of data points (e.g., 1, 2, 3), each associated with an exact numerical value indicated by the number inside the grid. The table contains three rows of data points (e.g., 1, 2, 3), each associated with an exact numerical value indicated by the number inside the grid. The table contains three rows of data points (e.g., 1, 2, 3), each corresponding to a specific integer value indicated by the number inside the grid. The table contains three rows of data points (e.g., 1, 2, 3), each corresponding to a specific integer value indicated by the number inside the grid. The table contains three rows of data points (e.g., 1, 2, 3), each corresponding to a specific integer value indicated by the number inside the grid. The table contains three rows of data points (e.g., 1, 2, and 3), each corresponding to a specific integer value indicated by the number inside the grid. The table contains three rows of data points (e.g., 1, 2, and 3), each corresponding to a specific integer value indicated by the number inside the grid. The table contains three rows of data points (e.g., 1, 2, and 3), each corresponding to a specific integer value indicated by the number inside the grid. The table contains three rows of data point (e.g., 1, 2, and 3), each corresponding to a specific integer value indicated by the number inside the grid. The table contains three rows of data point (e.g., 1, 2, and 3), each corresponding to a specific integer value indicated by the number inside the grid. The table contains three rows of data point (e.g., 1, 2, and 3), each corresponding to a specific integer value indicated by the number within the grid. The table contains three rows of data point (e.g., 1, 2, and 3), each corresponding to a specific integer value indicated by the number inside the grid. The table contains three rows of data point (e.g., 1, 2, and 3), each corresponding to a specific integer value indicated by the number inside the grid. The table contains three rows of data point (e.g., 1, 2, and 3), which corresponds to specific integer values indicated by the number inside the grid. The table contains three rows of data point (e.g., 1, 2, and 3), which correspond to specific integer values indicated by the number inside the grid. The table contains three rows of data point (e.g., 1, 2, and 3), which correspond to specific integer values indicated by the number inside the grid. The table contains three rows of data point (e.g., 1, 2, and 3), which correspond to specific integer values indicated by the number inside the grid. The table contains three rows of data point (e.g., 1, and 2), which correspond to specific integer values indicated by the number inside the grid. The table contains three rows of data point (e.g., 1, and 2), which correspond to specific integer values indicated by the number inside the grid. The table contains three rows of data point (e.g., 1, and 2), which correspond to specific integer values indicated by the number inside the grid. The table contains three rows of data point (e.g., 1, and 2) and their corresponding integer values indicated by the number inside the grid.
text_image
3.2C. High-Condition Figure 1: The first condition is the 'high' level of the 'low' level of the 'high' level of the 'low' level of the 'high'. The 'low' level of the 'high' level of the 'low' level of the 'high' level of the 'low' level of the 'high'. The 'low' level of the 'high' level of the 'low' level of the 'high' level of the 'low' level of the 'high'. The 'low' level of the 'high' level of the 'low' level of the 'high' level of the 'low' level of the 'high'. The 'low" level of the 'high' level of the 'low' level of the 'high' level of the 'low' level of the 'high'. The 'low' level of the 'high' level of the 'low' level of the 'high' level of the 'low' level of the 'high'. The 'low' level of the 'high' level of the 'low' level of the 'high' level of the 'low' level of the 'high'. The "low" level of the "high" level of the "low" level of the "high" level of the "low" level of the "high". The "low" level of the "high" level of the "low" level of the "high" level of the "low" level of the "high". The "low" level of the "high" level of the "low" level of the "high" level of the "low" level of the "high". The "low" level of the "high" level of the "low" level of the "high" level of the "low" level of the 'high'. The "low" level of the "high" level of the "low" level of the "high" level of the "low" level of the "high". The "low" level of the "high" level of the "low" level of the "high" level of the "low" level of the "high". The "low" level of the "high" level of the "low" level of the "high" level of the "' low' level'. The "low" level of the "high" level of the "low" level of the "high" level of the "' high' level'. The "low" level of the "high" level of the "low" level of the "high" level of the "' high' level'. The "low" level of the "high" level of the "low" level of the "high" level of the "' high' level'. The "low" level of the "high" level of the "low" level of the "high" level of the "' high' level'. The "low" level of both are given to a constant value (0.5) for all three levels. The values increase progressively from left to right, indicating a positive correlation between these two variables.
text_image
Summary: 1972年 5月1日 C. 2006 B. 2007 C. 2008 D. 2009 E. 2010 F. 2011 G. 2012 H. 2013 I. 2014 J. 2015 K. 2016 L. 2017 M. 2018 N. 2019 O. 2020 P. 2021 Q. 2022 R. 2023 S. 2024 T. 2025 U. 2026 V. 2027 W. 2028 X. 2029 Y. 2030 Z. 2031 A. 2032 B. 2033 C. 2034 D. 2035 E. 2036 F. 2037 G. 2038 H. 2039 I. 2040 J. 2041 K. 2042 L. 2043 M. 2044 N. 2045 O. 2046 P. 2047 Q. 2048 R. 2049 S. 2050 T. 2051 U. 2052 V. 2053 W. 2054 X. 2055 Y. 2056 Z. 2057 A. 2058 B. 2059 C. 2060 D. 2061 E. 2062 F. 2063 G. 2064 H. 2065 I. 2066 J. 2067 K. 2068 L. 2069 M. 2070 N. 2071 O. 2072 P. 2073 Q. 2074 R. 2075 S. 2076 T. 2077 U. 2078 V. 2079 W. 2080 X. 2081 Y. 2082 Z. 2083 A. 2084 B. 2085 C. 2086 D. 2087 E. 2088 F. 2089 G. 2090 H. 2091 I. 2092 J. 2093 K. 2094 L. 2095 M. 2096 N. 2097 O. 2098 P. 2099 Q. 2100