
GSP-8180TG - Measurement GW Instek - Free user manual and instructions
Find the device manual for free GSP-8180TG GW Instek in PDF.


| Product Type | Spectrum Analyzer |
| Brand | GW Instek |
| Model | GSP-8180TG |
| Category | Measurement |
| Frequency Range | 9 kHz to 1.8 GHz |
| Resolution Bandwidth (RBW) | 1 Hz to 3 MHz (1-3 step) |
| Video Bandwidth (VBW) | 1 Hz to 3 MHz (1-3 step) |
| Amplitude Accuracy | ±1 dB typical |
| Display | 8.4 inch color TFT LCD (800x600) |
| Dimensions (W x H x D) | 330 x 170 x 400 mm |
| Weight | Approximately 7 kg |
| Power Supply | AC 100-240V, 50/60Hz, 80W max |
| Main Functions | Frequency measurement, amplitude measurement, harmonics measurement, occupied bandwidth, channel power, ACPR |
| Cleaning | Wipe with a dry, soft cloth. Do not use solvents. |
| Safety Precautions | Use only with grounded outlet; avoid input overload; observe ESD handling. |
| Spare Parts & Repairability | Service manual available; calibration recommended annually. |
Frequently Asked Questions - GSP-8180TG GW Instek
User questions about GSP-8180TG GW Instek
0 question about this device. Answer the ones you know or ask your own.
Ask a new question about this device
Download the instructions for your Measurement in PDF format for free! Find your manual GSP-8180TG - GW Instek and take your electronic device back in hand. On this page are published all the documents necessary for the use of your device. GSP-8180TG by GW Instek.
USER MANUAL GSP-8180TG GW Instek
This manual contains proprietary information, which is protected by copyright. All rights are reserved. No part of this manual may be photocopied, reproduced or translated to another language without prior written consent of the Good Will company.
The information in this manual was correct at the time of printing. However, Good Will continues to improve products and reserves the right to change specification, equipment, and maintenance procedures at any time without notice.
Good Will Instrument Co., Ltd. No. 7-1, Jhongsing Rd., Tucheng Dist., New Taipei City 236, Taiwan.
Table of Contents
SAFETY INSTRUCTIONS 5
USER NOTICE.... 10
General Inspection 10
Safety Precaution before Operation ....11
Electro-static Discharge (ESD) Protection ....13
First Time to Power on 14
GETTING STARTED.... 15
Package Contents and Accessories 16
Front Panel Overview....17
Rear Panel 19
Front Panel Function Key 21
Parameter Input 24
User Interface 26
Build-in Help 28
Basic Measurement 28
MENU INTEPRETATION 32
Frequency 37
Span 41
Amplitude....43
Autoset....47
Bandwidth 48
Trace....50
Detector 52
Display 54
Sweep 55
Trigger 56
Tracking Generator 57
Mode....59
Peak Search 61
Marker 65
Marker→ 69
Marker Function 71
Measurement....73
Measure Setup....77
System....78
File 81
Quick Save....82
Save 82
FAQ....84
APPENDIX....86
Specifications 86
GSP-8000 Factory Default Settings....91
Certificate Of Compliance 94
SAFETY INSTRUCTIONS
This chapter contains important safety instructions that you must follow when operating the GSP-8000, and when keeping it in storage. Read the following before operating the GSP-8000 to ensure your safety and to keep the GSP-8000 in the best possible condition.
Safety Symbols
These safety symbols may appear in this manual or on the GSP-8000.

WARNING
Warning: Identifies conditions or practices that could result in injury or loss of life.

CAUTION
Caution: Identifies conditions or practices that could result in damage to the GSP-8000 or to other properties.

DANGER High Voltage

Attention Refer to the Manual

Protective Conductor Terminal

Earth (ground) Terminal
Do not dispose electronic equipment as unsorted municipal waste. Please use a separate collection facility or contact the supplier from which this instrument was purchased.
Safety Guidelines
General Guideline

CAUTION
- Do not place any heavy object on the GSP-8000.
- Avoid severe impact or rough handling that leads to damaging the GSP-8000.
- Do not discharge static electricity to the GSP-8000.
- Do not block or obstruct the cooling fan vent openings.
- Do not perform measurement at circuits directly connected to Mains (Note below).
- Do not disassemble the GSP-8000 unless you are qualified as service personnel.
- The equipment is not for measurements performed for CAT II, III and IV.
(Measurement categories) EN 61010-1 specifies the measurement categories and their requirements as follows. The GSP-8000 falls under category I.
- Measurement category IV is for measurement performed at the source of low-voltage installation.
- Measurement category III is for measurement performed in the building installation.
- Measurement category II is for measurement performed on the circuits directly connected to the low voltage installation.
- 0 is for measurements performed on circuits not directly connected to Mains.

- AC Input voltage range: 100-240Vac; Frequency: 50/60Hz - Connect the protective grounding conductor of the AC power cord to an earth ground, to avoid electrical shock.
Cleaning the GSP-8000
- Disconnect the power cord before cleaning. - Use a soft cloth dampened in a solution of mild detergent and water. Do not spray any liquid. - Do not use chemicals or cleaners containing harsh material such as benzene, toluene, xylene, and acetone.
Operation Environment
- Location: Indoor, no direct sunlight, dust free, almost non-conductive pollution (Note below) - Temperature: 0°C to 40°C - Altitude: Up to 2000m - Transient Overvoltage on the main supply is 2500V.
(Pollution Degree) EN 61010-1 specifies the pollution degrees and their requirements as follows. THE GSP-8000 falls under degree 2. Pollution refers to “addition of foreign matter, solid, liquid, or gaseous (ionized gases), that may produce a reduction of dielectric strength or surface resistivity”. - Pollution degree 1: No pollution or only dry, non-conductive pollution occurs. The pollution has no influence. - Pollution degree 2: Normally only non-conductive pollution occurs. Occasionally, however, a temporary conductivity caused by condensation must be expected. - Pollution degree 3: Conductive pollution occurs, or dry, non-conductive pollution occurs which becomes conductive due to condensation which is expected. In such conditions, equipment is normally protected against exposure to direct sunlight, precipitation, and full wind pressure, but neither temperature nor humidity is controlled.
Storage environment
- Location: Indoor
• Relative Humidity: < 80%
• Temperature: -20^ to 70^
Disposal

Do not dispose this instrument as unsorted municipal waste. Please use a separate collection facility or contact the supplier from which this instrument was purchased. Please make sure discarded electrical waste is properly recycled to reduce environmental impact.
Power cord for the United Kingdom
When using the GSP-8000 in the United Kingdom, make sure the power cord meets the following safety instructions.
NOTE: This lead/appliance must only be wired by competent persons

WARNING: THIS APPLIANCE MUST BE EARTHED
IMPORTANT: The wires in this lead are coloured in accordance with the following code:
Green/ Yellow: Earth
Blue: Neutral
Brown: Live (Phase)
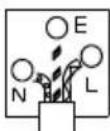
As the colours of the wires in main leads may not correspond with the coloured marking identified in your plug/appliance, proceed as follows:
The wire which is coloured Green & Yellow must be connected to the Earth terminal marked with either the letter E, the earth symbol ⏻ or coloured Green/Green & Yellow.
The wire which is coloured Blue must be connected to the terminal which is marked with the letter N or coloured Blue or Black.
The wire which is coloured Brown must be connected to the terminal marked with the letter L or P or coloured Brown or Red.
If in doubt, consult the instructions provided with the equipment or contact the supplier.
This cable/appliance should be protected by a suitably rated and approved HBC mains fuse: refer to the rating information on the equipment and/or user instructions for details. As a guide, a cable of 0.75mm2 should be protected by a 3A or 5A fuse. Larger conductors would normally require 13A types, depending on the connection method used.
Any exposed wiring from a cable, plug or connection that is engaged in a live socket is extremely hazardous. If a cable or plug is deemed hazardous, turn off the mains power and remove the cable, any fuses and fuse assemblies. All hazardous wiring must be immediately destroyed and replaced in accordance to the above standard.
USER NOTICE
This chapter helps you in preparing the spectrum analyzer for use and provides the information to start using the spectrum analyzer correctly.
General Inspection
When you receive your new instrument, it is recommended that you check the instrument following these steps:
Steps
- Check for transportation damage.
If it is found that the packaging carton or the foamed plastic protection cushion has suffered serious damage, do not throw it away until the complete device and its accessories have been electrically and mechanically checked.
- Check the Accessories
Please ensure that all the listed accessories are present and undamaged, if any problems are found please contact your distributor.
- Check the Complete Instrument
If there is any physical damage, operational fault, or performance issue please contact your distributor or GW Instek's local office. If there is any damage to the instrument please ensure you keep the original packaging. Ideally you should always keep the original packaging if the instrument must be returned for repair.
Safety Precaution before Operation
Check Power Supply
The analyzer is equipped with a three-wire power cord in accordance with international safety standards. The product must be grounded properly before being powered on, as floating or improper ground may cause damage to the instrument or personal injury.
Make sure the grounding conductor of the spectrum analyzer is grounded before turning on the instrument. After which the AC power cord can be connected. Do not use a non-ground power cord.
Allowed Variation Range of Supply Power Parameters
The spectrum analyzer is compatible with 100V\~240V, 50Hz-60Hz AC power. The table below lists the power requirement to run the spectrum analyzer.
| Power Supply Parameter | Compatible Range |
| Voltage | 100 - 240 VAC |
| Frequency | 50 - 60 Hz ±10% |
| Power | 28W |
To prevent or lower the risk of damage to the spectrum analyzer from power interference between instruments, especially from peak pulses produced by large power consumption instruments, a 220V/110V AC regulated power supply is recommended.
Power Cord Selection
The analyzer is equipped with a three-wire power cord in accordance with international safety standards. This cable grounds the analyzer cabinet when connected to an appropriate power line outlet. The cable must be rated greater than 250Vac and 2A.

WARNING
Improper grounding may cause damage to the instrument, or result in personal injury. Make sure the grounding conductor of the spectrum analyzer is grounded before turning on the instrument.
Always use a well-grounded power source. Do not use an external power cable, power cord or an auto transformer without grounded protection. If this product is to be powered via an external auto transformer for voltage reduction, ensure that its common terminal is connected to a neutral (earthed pole) of the power supply.
Make sure the supply power is stable before turning on the analyzer to protect it from damage. Refer to "First Time to Power on" on page 14
Electro-static Discharge (ESD) Protection
ESD is an issue often ignored by users. Damage from ESD on the instrument is unlikely to occur immediately but will significantly reduce the reliability of it. Therefore, ESD precautions should be implemented in the work environment, and applied daily.
Generally, there are two steps to manage ESD protection:
- Conductive table mats to connect hands via wrist bands
- Conductive ground mat to connect feet via ankle straps
Implement both protection methods will provide a good level of anti-static protection. If used alone, the protection will not be as reliable. To ensure user's safety, anti-static components should offer at least 1MΩ isolation resistance.

WARNING
The above ESD protections measures cannot be used when working with over 500V!
Make good use of anti-static technology to protect components from damage:
- Quickly ground the internal and external conductor of the coaxial cable before it is connected with the spectrum analyzer.
- Staff must wear anti-static gloves before touching the connector cord or doing any assemble work.
- Assure all the instruments are grounded properly to avoid static storage.
First Time to Power on
Connect the three-pin AC power cord into the instrument. Insert the plug into a power socket provided with a protective ground.

WARNING
Check the power source before turning on the spectrum analyzer, to protect the device from damage.
Steps
- Press the power switch on the bottom left of the front panel.
- Self-initialization takes about 30 seconds, after the boot screen the spectrum analyzer will default to the scanning curve.
- After power on, let the spectrum analyzer warm up for 60 minutes for stabilization to obtain the most accurate results.
GETTING STARTED
This chapter introduces the front / rear panel, the user interface and explains how to use the instrument with a measurement example demonstration.
Package Contents and Accessories 16
Front Panel Overview....17
Rear Panel 19
Front Panel Function Key 21
Parameter Input ....24 Numeric Keypad....24
User Interface 26
Build-in Help 28
Basic Measurement 28
Package Contents and Accessories
The GSP-8000 has a number of standard and optional accessories that can be ordered. For more information please visit the GW Instek website at www.gwinstek.com or consult your authorized distributor for details.
| Standard Accessories | Description |
| Power Cable | Mains power cable (region dependent) |
| Option | Description |
| GSP-8180E1 | EMI activation option for GSP-8180 |
| GSP-8380E1 | EMI activation option for GSP-8380 |
| GSP-8800E1 | EMI activation option for GSP-8800 |
| Optional Accessories | Description |
| GKT-001 | General Kit Set |
| GKT-002 | CATV Kit Set |
| GKT-003 | RLB Kit Set |
| GKT-008 | EMI Probe Kit Set |
Front Panel Overview
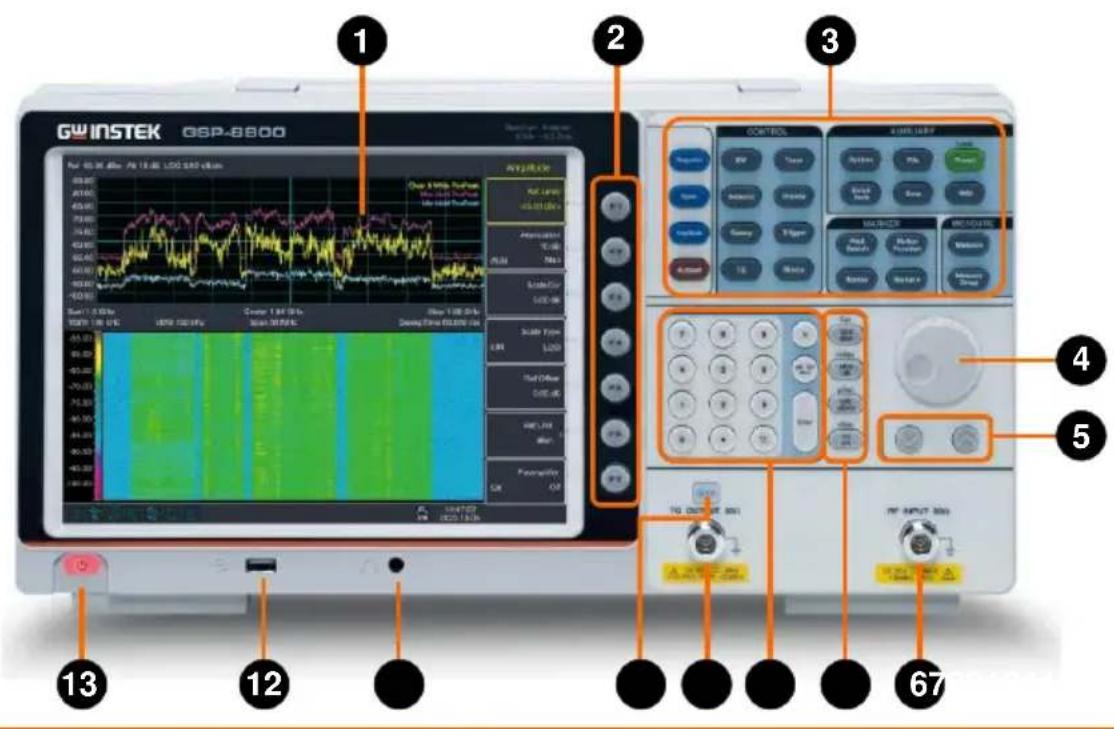
- LCD
1024x768 color LCD display. The display shows the soft keys for the current function, frequency, amplitude and marker information.
- Menu soft keys
The F1 to F7 function keys directly correspond to the soft keys on the right-hand side of display.
- Function keys
See page 21 for details.
- Knob
During parameter editing, turn the knob clockwise to increase, or counterclockwise to decrease the parameter values at specified steps.
- Arrow keys
(1) Increase or decrease the parameter value at specific steps while editing a parameter.
(2) Move the cursor though the directory
| tree in the File function | ||
| 6. RF Input connector | 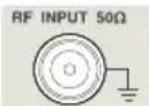 | The RF input may be connected to a device via a N type connector. |
 Note Note | When input attenuator is higher than 10 dB, the RF port input signal must be less than +30 dBm.Input voltage at RF input port must not be higher than 50 V DC to avoid damage to the attenuator and input mixer tracking generator. | |
| 7. Unit keys | 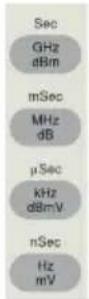 | Unit keys include GHz/dBm/s, MHz/dB/ms, kHz/dBmV/μs and Hz/mV/ns. After entering the desired numbers, choose an appropriate unit to complete the input. The specific meaning of unit is decided by the type of input parameter ("frequency", "amplitude" or "time"). |
| 8. Numeric keypad | See page 24 for details. | |
| 9. TG output connector | 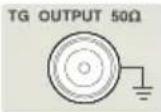 | The output of the tracking generator can be connected to a receiver through an N type male connector, users can purchase this option if required. |
| 10. TG output On/Off button |  | When the TG function is enabled, the backlight of button turns on and turns off when the function is disabled. |
| 11. Earphone interface |  | 3.5mm stereo headphone jack (wired for mono operation) |
| 12. USB Host port |  | The analyzer may serve as a "host" device to connect to external USB devices. This interface is available for USB storage devices. |
| 13. Power key |  | Push to turn on, long push to turn off |
Rear Panel
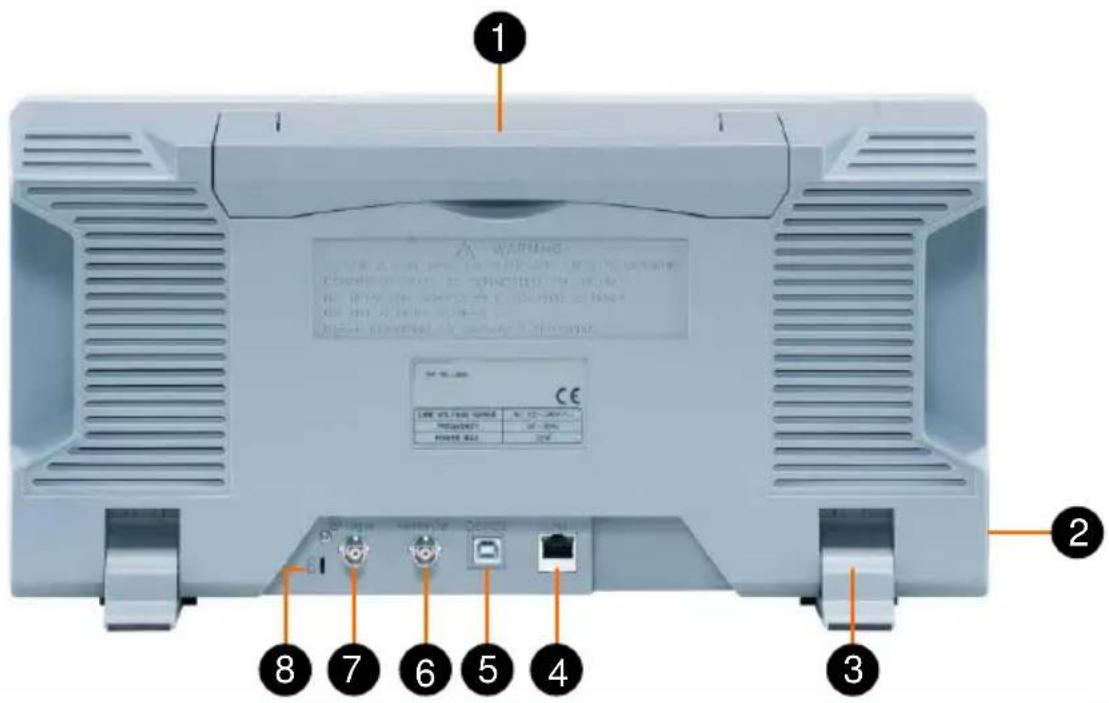
- Handle Stow the handle for mobile use.
2 AC power connector AC: frequency 50Hz/60Hz ±10%, single-phase alternative 220V±15% or 110V±15% - Stool To adjust the angle of the device
- LAN interface Through this interface, the analyzer can be connected to your local network for remote control. An integrated testing system can be built quickly, as the analyzer conforms to the LXI C Device class instrument standards.
- USB Device interface This configurable USB port permits external USB devices. It supports PictBridge printer and remote-control connection.
- Ref In/Out The BNC input or output of the 10 MHz reference clock
-
Trig-In Input an external signal (TTL signal) for external trigger function.
-
Lock hole
You can lock the spectrum analyzer to a fixed location using the security lock (please buy it yourself) to secure the spectrum analyzer.
Front Panel Function Key
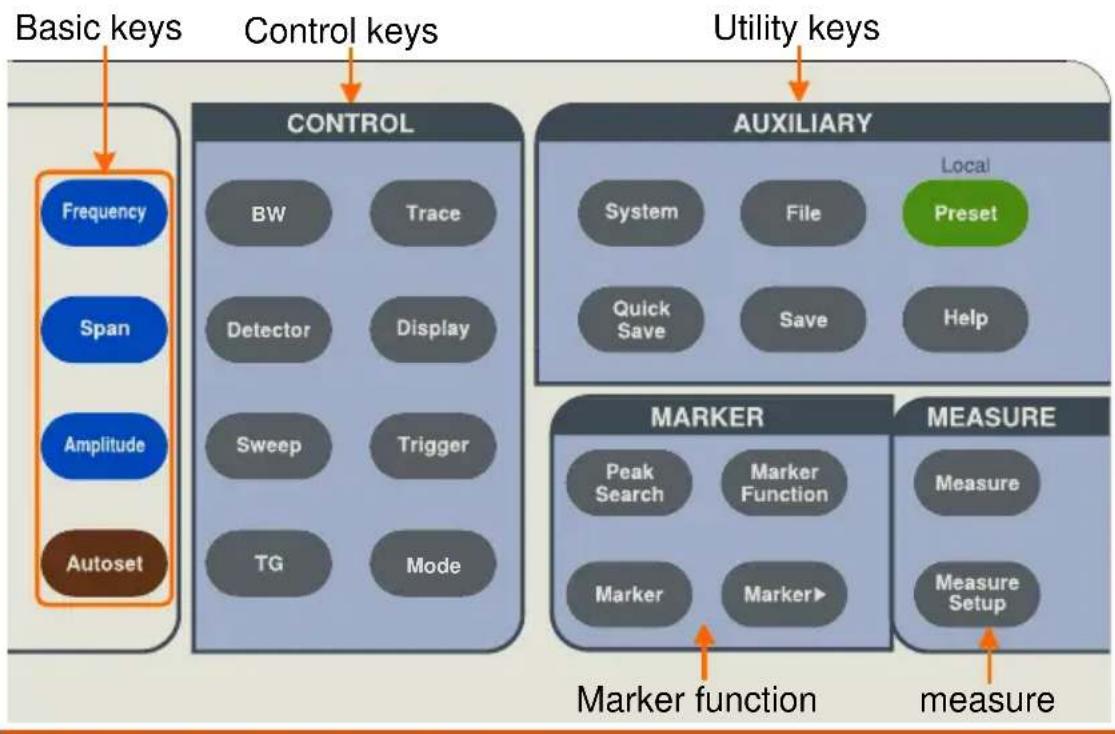
flowchart
graph TD
    A["Basic keys"] --> B["Frequency"]
    A --> C["Span"]
    A --> D["Amplitude"]
    A --> E["Autoset"]
    F["Control keys"] --> G["BW"]
    F --> H["Trace"]
    F --> I["Detector"]
    F --> J["Display"]
    F --> K["Sweep"]
    F --> L["Trigger"]
    F --> M["TG"]
    F --> N["Mode"]
    O["Utility keys"] --> P["AUXILIARY"]
    P --> Q["System"]
    P --> R["File"]
    P --> S["Quick Save"]
    P --> T["Save"]
    P --> U["Local Preset"]
    P --> V["Help"]
    W["Marker function"] --> X["MEASURE"]
    Y["Measure Setup"] --> Z["Measure"]
    style A fill:#f9f,stroke:#333
    style F fill:#ccf,stroke:#333
    style O fill:#cfc,stroke:#333
    style W fill:#fcc,stroke:#333
Basic keys
Frequency
Activates the center-frequency function, and accesses the frequency function menu.
Span
Activates the frequency sweep span function, and set Full Span\Zero Span\Last Span.
Amplitude
Activates the reference level function, and accesses the amplitude softkeys, with which you set functions that affect data on the vertical axis.
Autoset
Searches the signal automatically within the full frequency range.
Control keys
BW
Activates the RBW (resolution bandwidth), VBW (video bandwidth) function, and accesses the softkeys that control the bandwidth.
Trace
Accesses the softkeys that allow you to store and manipulate trace information.

Accesses the softkeys that allow you to configure detector functions.
Accesses the softkeys that allow you to control what is displayed on the analyzer, including the display line, graticule, Label, Menu Hide, Brightness and Screen Sleep.

Accesses the softkeys that allow you to set the sweep time, select the sweep mode of the analyzer.

Accesses the softkeys that allow you to select the trigger mode of the analyzer.

Accesses the softkeys that allow you to set the tracking generator.
Accesses the softkeys that allow you to set the Spectrum and demodulation mode.
Marker function keys

Places a marker on the highest/lowest peak, and accesses the Peak functions menu.

Accesses the marker control keys that select the type and number of markers and turns them on and off.

Accesses the marker function soft keys that allow you to set other system parameters based on the current marker's value.
Accesses the menu of other marker functions, such as N-dB bandwidth measure, marker noise, and frequency counting.
Advanced measure keys
Accesses the softkeys that let you make transmitter power measurements such as Time Spec, ACPR (adjacent channel power), channel power, and OBW (occupied bandwidth), etc.
Sets the parameters for the selected measurement function.
Utility keys
Accesses the softkeys that allow you to get the system information, or set the system parameters.

Accesses the softkeys that allow you to configure the file system of the analyzer.

Resets the analyzer to the factory settings or user state. This state can be specified in 【System】→[PowerOn/Preset▶]→[Preset▶].
Save the contents of the current screen quickly.

Accesses the soft keys that allow you to save current screen, trace data, user state or limit line data.

Press the Help key to activate the help system. Press the Help key again to exit.
Parameter Input
Specific parameter values are able to be entered using the numeric keypad, knob, and directional keys.
Numeric Keypad
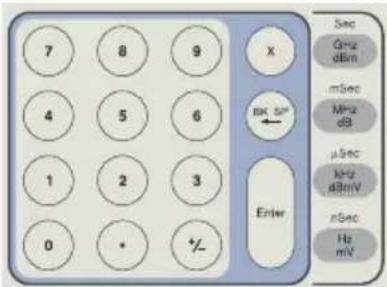
Numeric keys
Decimal point
Sign key

Numbers 0-9 are available to be used.
A decimal point “.” will be inserted at the cursor position when this key is pressed.

Sign key “+/-” is to toggle the sign of a parameter. When pressed the first time, a “-” will be inserted and changed into “+” following the second press.
Cancel key

(1) During the editing process this key will clear the inputs in the active area and exit editing mode at the same time.
(2) Turn off the display in the active area.
(3) Exit current test mode while in keyboard test.
Back key

(1) During the process of parameter editing, this key will delete the characters on the left side of the cursor.
(2) While in the process of file name editing, pressing this key will delete characters that have been entered.
Enter key
When pressed, the system will complete the input process and insert a default measurement unit for the parameter automatically.
Unit keys
Sec Unit keys include GHz/dBm/Sec, GHz/dBm, MHz/dB/mSec, kHz/dBmV/μSec and MHz/dR Hz/mV/nSec. After entering the desired numbers, choose an appropriate unit to complete the input. The specific meaning of unit is decided by the type of input parameter ("frequency", "amplitude" or "time").
User Interface
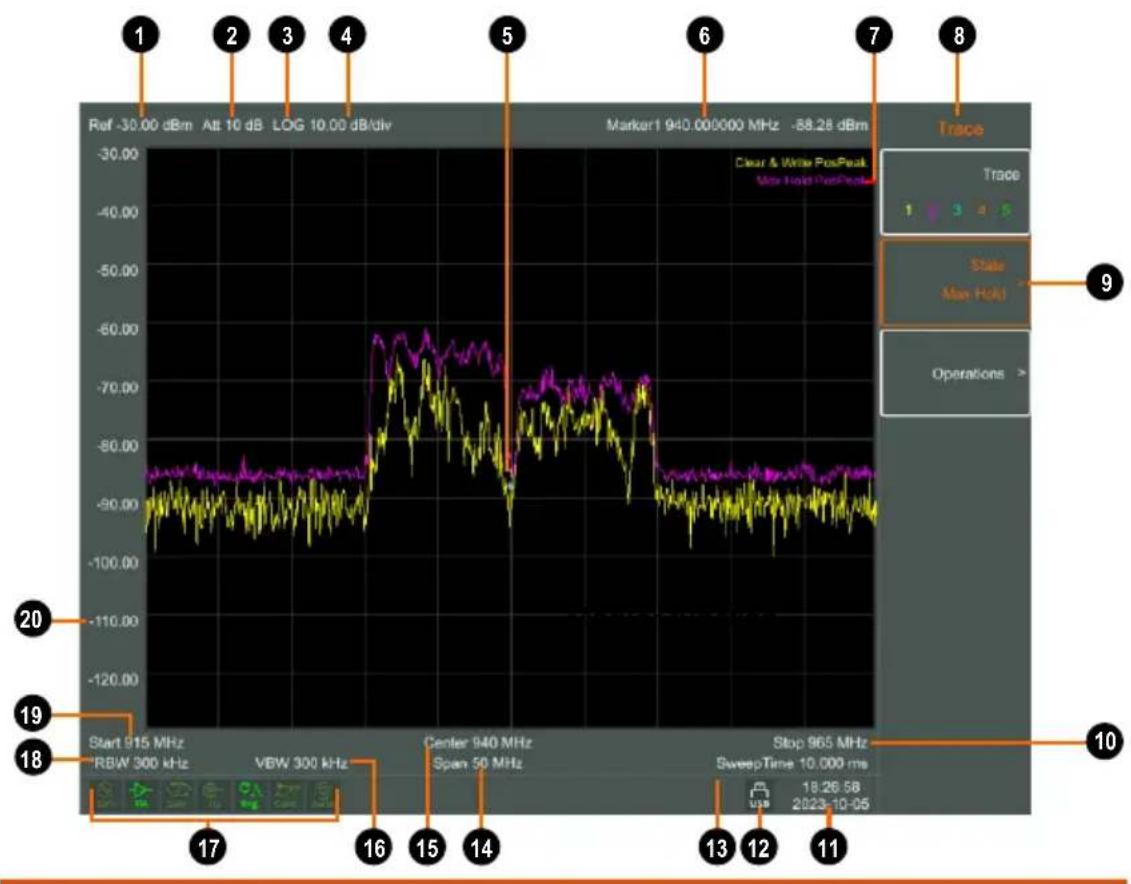
line
| Frequency (MHz) | Value (dB) | |-----------------|------------| | Start 915 | -85.28 | | RBW 300 | -85.28 | | VZW 300 | -85.28 | | Center 940 | -70.00 | | Span 50 | -70.00 | | Stop 965 | -70.00 | | SweepTime | -85.28 | | 18-26 | -85.28 | | 20 | -85.28 | | 23-10-05 | -85.28 |No. Name
Description
- Reference level
Reference level
2 Attenuation
Display input attenuation setting
- Amplitude Division Type
Can choose logarithmic or linear
- Amplitude Division
Display Division scale
- Marker
Display current activated marker
- Marker readout
Display frequency and amplitude of current marker
Related Key
Amplitude → [Ref Level]
Amplitude → [Attenuation]
Amplitude → [Scale Type]
Amplitude → [Scale/ Div]
Marker
Marker
- Trace Mode
Trace Type and Detector Type
- Menu title
Function of current menu belongs to.
- Menu item
Menu item of current function

- Stop Frequency
Display Stop Frequency

- Date/time
Display system date and time
- USB storage device
Show if USB storage device is inserted;

- Sweep Time
System sweep time
- Span
Display span width

- Center frequency
Display center frequency
- Video bandwidth
Display video bandwidth
- System status icon
Display spectrum analyzer status
- Resolution bandwidth
Display resolution bandwidth
- Start Frequency
Display Start Frequency

- Amplitude Graticule
Display Amplitude Graticule
Build-in Help
The built-in help provides information that refers to every function key and menu key on the front panel. Users can view this help information if required.
Basic Measurement
Basic measurements include, input signal frequency and amplitude display, marked by a frequency marker. Follow these four simple steps below to implement input signal measurement.
Steps
- Setting center frequency
- Setting span and resolution bandwidth
- Activate marker
- Setting amplitude
For example, to measure a 100MHz -20dBm signal, you must turn on the spectrum analyzer and ensure it is warmed up for 60 minutes to ensure measurement accuracy.
Equipment connection
- Connect the output terminal of signal generator to the RF Input 50Ω terminal of spectrum analyzer. Set the parameters as follows:
Frequency 100 MHz
Amplitude -20 dBm
Setting parameters
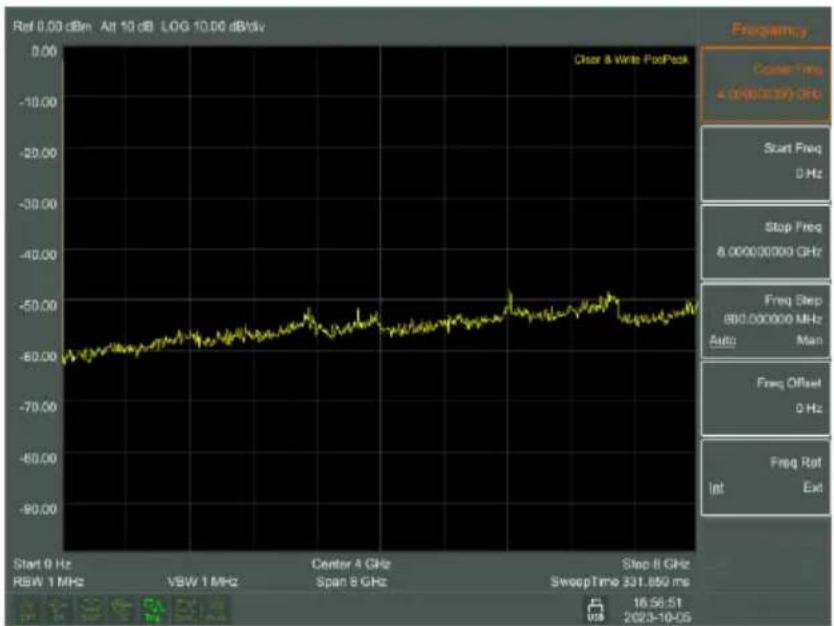
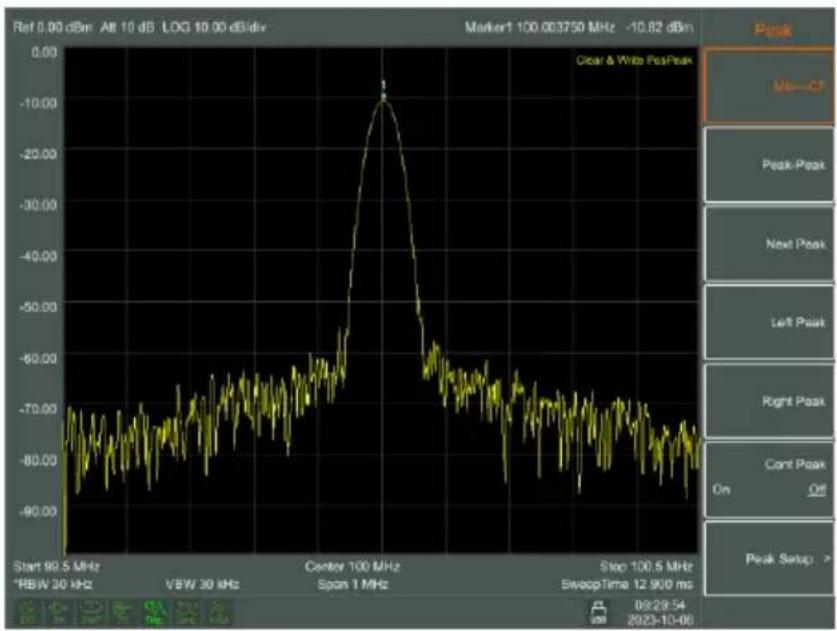
- Press the Preset button to restore the analyzer to its factory defined state. The spectrum analyzer will display the spectrum from 9kHz to the maximum span width. The signal generated will display as a vertical line at 100MHz.
Preset
line
| Frequency | Start Freq (dB) | | --------- | --------------- | | D Hz | 6.000000000 GHz | | Stop Freq | 6.000000000 GHz | | Freq Step | 880.000000 MHz | | Auto | Man | | Freq Offset | 0 Hz | | Freq Rot | Int | | Ext | 16.56-51 |To clearly observe the signal, reduce the frequency span to 1 MHz and set the center frequency to 100MHz.
- Setting Center Frequency Press the Frequency button and select Center frequency on corresponding pop up menu. Input "100" and select the unit as MHz on the numeric keypad. The keys can be used to set the exact value but the knob and directional keys can also be used to set the center frequency.
- Setting Frequency Span Press the Span button, input "1" and select MHz as its unit using the + numeric keypad or press ↓ button to decrease to 1MHz.

- Press the BW button and set resolution bandwidth to manual. Input 30 and select kHz as its unit using the numeric keypad or press ↓ button to decrease to 30kHz.

+

- Press the Detector button and set the detection type to positive peak.
The signal at a higher resolution
line
| Frequency | Value | | --------------- | --------- | | Center 100 MHz | -10.82 dBm| | Step 100.5 MHz | -70.00 dBm| | SWoepTime | -70.00 dBm| | 2023-10-06 | -70.00 dBm|Please note that resolution bandwidth, video bandwidth and frequency span are self-adapted. They adjust to certain values according to frequency span. Sweep time can be self-adapted too.
Activate Marker
- Press the Marker button in the function area. Press the soft key to select Marker 1 2 3 4 5 6 7 8. Select Marker 1 and the marker is located at horizontal center by default. That is the signal peak point or its neighbor.

- Press Peak Search button. Frequency and amplitude values are read by the marker and shown on the top right of the display area.

Setting amplitude
- The reference level will be shown at the top of the display grid. To get a better dynamic range, the real signal peak point should be located at or near the top of display grid (reference level). The reference level is also the maximum value
on Y axis. Here we reduce to 20dB reference level to increase the dynamic range.
- Press the Amplitude button. The amplitude setting menu will pop up and the reference level soft key will be activated. The reference level can be input at the top left of the display grid. Input -20 using the numeric keypad and set the unit to dBm. You can also use the ↓ key or the knob for adjustment.
The reference level is set at -20dBm, which is the signal peak value near the top of the grid. The balance between the signal peak value and noise is dynamic range.
MENU INTEPRETATION
This chapter provides you with the information on using the front panel of the spectrum analyzer.
Frequency 37
Center Freq....37
Start Freq....38
Stop Freq....38
Freq Step Auto Manual....39
Freq Offset 39
Freq Ref Internal External 40
Scale Type LIN LOG....40
Span 41
Span....41
Full Span 41
Zero Span....42
Last Span....42
Amplitude....43
Ref Level 43
Attenuation....44
Scale/Div 44
Scale Type....45
Ref Offset 45
Ref Unit▶ 46
Preamplifier....46
Autoset....47
Bandwidth 48
RBW....48
VBW....48
Trace....50
Trace....50
State 50
Operations▶ 51
Detector 52
Detector type comparison ....52
Pos Peak 52
Neg Peak 52
Sample 52
Normal 53
Voltage Avg....53
RMS Avg....53
Quasi-Peak 53
Display 54
Full Screen....54
Display Line....54
Ampt Graticule 54
Label 54
Menu Hide On Off....54
Brightness 54
Screen Sleep On Off....54
Sweep 55
Sweep Time....55
Sweep Single 55
Sweep Cont....55
Trigger 56
Free....56
Video....56
External....56
Tracking Generator 57
TG▶ 57
Track Gen 57
Output Level 57
Reference....57
Position 57
Do Normalize....57
Normalize On Off 58
Mode 59
MODE▶ 59
Spectrum 59
Demod▶ 59
Demod Mode 59
Sound 59
Carrier Freq....59
Modulation▶ 60
AM▶ 60
FM▶ 60
Peak Search 61
Peak Search
Peak Search 61
Mkr > CF....61
Peak-Peak 61
Next Peak 62
Left Peak....63
Right Peak 63
Cont Peak On Off....63
Peak Setup▶ 63
Peak Excursion....63
Peak Mode Max Min 63
Sort Freq Ampt....63
Peak List On Off....64
Marker 65
Marker 1 2 3 4 5 6 7 8 ....65
Trace 1 2 3 4 5....66
Normal 66
Delta 66
Off....67
All Off 68
Marker Table 68
Marker→ 69
Mkr->CF 69
Mkr->CF Step 69
Mkr->Start 69
Mkr->Stop 70
Mkr->Ref Level 70
MkrΔ->Span 70
MkrΔ->CF 70
Marker Function 71
Function Off....71
NdB On Off....71
Marker Noise On Off....71
Freq Count▶ 71
Measurement....73
Measure off....73
Time Spec On Off....73
ACPR On Off 73
Chanel Power On off....73
OBW On Off....74
Pass-Fail▶ 74
Window Meas▶ 74
Window Meas On Off....74
Limit Line On Off....74
Freq Line On Off 74
Limit Set Up Low....74
Freq Set Start Stop....75
Window Sweep On Off 75
Limit Meas▶ 75
Limit Meas On Off....75
Line Up On Off....75
Line Low On Off....75
Offset X/Y....75
Edit▶ 76
Measure Setup....77
Channel BW....77
Channel Interval 77
Channel Nums 77
Power Percent 77
System....78
System▶ 78
System Info....78
Firmware update 78
Option▶ 78
Setting▶ 78
LAN▶ 79
Shutdown On Off....79
Language▶ 79
Date/Time▶ 79
Power On/Preset▶ 80
File 81
Storage Int Ext....81
Type▶ 81
First Page....81
Prev Page....81
Next Page 81
Last Page 81
Operations▶ 81
Quick Save....82
Save 82
Screen Pixmap▶ 82
Trace Data ▶ 82
User State 82
Limit Line 82
QuickSaveSet▶ 83
Frequency
The frequency range of a channel can be expressed by either of two groups of parameters: Start Frequency and Stop Frequency; or Center Frequency and Span. If any such parameter is changed, the others would be adjusted automatically in order to ensure the coupling relationship among them
$$ f _ {c e n t e r} = \left(f _ {s t o p} + f _ {s t a r t}\right) / 2 $$
$$ f _ {s p a n} = f _ {s t o p} - f _ {s t a r t} $$
f_center, f_stop, f_start and f_span denotes the center frequency, the stop frequency, the start frequency and the span respectively.
Center Freq
Sets the center frequency of the sweep. When pressed, the frequency mode is switched to Center Freq and Span in order to enter the desired parameter data.
Key Points
- The start and stop frequencies vary with the center frequency when the span is constant.
- Changing the center frequency horizontally shifts the current sweep channel and the adjustment is limited by the specified frequency range.
- In Zero Span mode, the start frequency, stop frequency and center frequency are always equal. If one is changed the others are updated to match.
- You can modify this parameter using the numeric keys, knob, or direction keys.
Start Freq
Sets the start frequency of the sweep. When pressed, the frequency mode is switched to Start Freq and Stop Freq in order to enter the desired parameter data.
Key Points
- The span and center frequency are changed automatically according to the start frequency. The change of the span would have influence on other system parameters. For more details, please refer to Span.
- In Zero Span mode, the start frequency, stop frequency and center frequency are always equal. If one is changed the others are updated to match.
- You can modify this parameter using the numeric keys, knob, or direction keys.
- If start freq is larger than stop freq when setting, then stop freq will increase automatically to the same value of start freq.
Stop Freq
Sets the stop frequency of the sweep. When pressed, the frequency mode is switched to Start Freq and Stop Freq in order to enter the desired parameter data.
Key Points
- Modifying the stop frequency changes the span and center frequency, and the change of span influences other system parameters, see Span.
- You can modify this parameter using the numeric keys, knob, or direction keys.
- If stop freq is larger than start freq when setting, then start freq will decrease automatically to the same value of stop freq.
Freq Step Auto Manual
Sets the step of center/start/stop frequency. Changing the frequency range in a fixed step continuously switches the channel to be measured.
Key Points
- The frequency step type could be "Manual" or "Auto". In Auto mode, the CF step is 1/10 of span if it is in Non-zero span mode or equals 25% of RBW while in Zero span mode; in Manual mode, you can set the step using the numeric, step keys or knob. Then activate Center Frequency, press step, center frequency will change as setting step.
- After you set an appropriate frequency step and select center frequency, you can use using up and down direction keys to switch between measurement channels in a specified step in order to sweep the adjacent channels manually.
- You can modify this parameter using the numeric keys, knob, or direction keys.
Frequency step lends itself to detect the harmonic waves and bandwidths that are beyond the current span.
For example, for order of harmonic of a 300 MHz signal, you can use set both the center frequency and frequency step to 300 MHz, and press the up direction key continuously to increase the center frequency to 600MHz, that is secondary harmonic. Press frequency steps to increase center frequency by 300MHz, which reaches 900MHz. [Frequency Step Auto Manual] shows the auto or manual mode to setting the steps. When step is under manual mode, press [Frequency Step Auto Manual] to return to auto mode.
Freq Offset
You can set a frequency offset to displayed frequency value, including freq marker value. This movement won't influence sweep frequency range.
While this function activated (frequency offset isn't 0), you can modify this parameter using the numeric keys, knob or direction keys.
Freq Ref Internal External
Set the reference frequency as internal or external input, this is regarded as whole device reference.
Scale Type LIN LOG
This function can switch the display unit of the frequency axis to linear or logarithmic mode. (Enabled after installing EMI Option)
Span

Set the spectrum analyzer to span mode. When press the SPAN button, Span, Full Span, Zero Span and Last Span will be available to configure. You can modify span using the numeric keys, knob or direction keys. Use numeric key or Zero Span to clear span.
Span
Sets the frequency range of the sweep. When pressed, the frequency mode is switched to Center Freq/Span.
Key Points
- The start and stop frequencies are changed with the span automatically.
- In manual span mode, the span can be set down to 0 Hz, that is zero span mode. And up to the full span described in "Specification". When it is set to the maximum span, it enters full span mode.
- Modifying the span in non-zero span mode may cause an automatic change in both CF step and RBW if they were in Auto mode, and the change of RBW may influence VBW (in Auto VBW mode).
- In non-zero span mode, variation in the span, RBW or VBW would cause a change in sweep time.
- You can modify this parameter using the numeric keys, knob, or direction keys.
Full Span
Sets the spectrum analyzer to center frequency/sweep mode, and span of the analyzer to the maximum.
Zero Span
Sets the span of the analyzer to 0 Hz. Both the start and stop frequencies will equal the center frequency and the horizontal axis will denote time. The analyzer here is measuring the time domain characteristics of amplitude, located at the corresponding frequency point. This will help to observe the signal (especially for modulated signal) at time domain.
Last Span
Changes the span to the previous span setting.
Amplitude
Sets the amplitude parameters of the analyzer. Through these parameters, signals under measurement can be displayed at an optimal view with minimum error. The pop out amplitude menu includes Ref Level, Attenuation, Scale/Div, Scale Type, Ref Offset, Ref Unit and Preamplifier.
Ref Level
Activate reference level function and sets the maximum power or voltage for display window.
Key Points
- This value is affected by a combination of maximum mixing level, input attenuation, and preamplifier. When you adjust it, the input attenuation is adjusted under a constant max mixing level, meeting:
$$ L _ {R e f} - a _ {R F} + a _ {P A} \leq L _ {m i x} $$
L_Ref , a_RF , a_PA and L_mix denotes the reference level, the input attenuation, the preamplifier, and the max mixing level, respectively.
- You can modify this parameter using the numeric keys, knob, or direction keys.
Reference level located at the top of axis grid. Measurement near the reference level would gain better accuracy, but input signal amplitude should not exceed the reference level; if it exceeds, the signal will be compressed and distorted, result in wrong measurement. Analyzer's input attenuation is related with reference level, it can self-adjust to avoid signal compression. Minimum reference level is -80dBm at Log scale under 0dB attenuation.
Attenuation
Sets the front attenuator of the RF input in order to permit big signals (or small signals) to pass from the mixer with low distortion (or low noise). It only works under internal mixer mode to adjust input attenuator insider analyzer. In Auto mode, input attenuator is related with reference level.
Key Points
- When the preamplifier is On, the input attenuation could be set up to 40 dB. You can adjust the reference level to ensure that the specified parameters meet the requirement.
- Modifying the reference level may cause an automatic change in attenuation value; But the change of attenuation value won't influence reference level.
- You can modify this parameter using the numeric keys, knob, or direction keys.
Attenuator adjustment is to make the maximum signal amplitude pass from mixer less than or equal to -10dBm. E.g. if the reference level is +12dBm, the attenuator value is 22dB, then the input level in mixer is -18dBm (12-22-8=-18), its mainly purpose is to avoid signal compression. Switch Attenuation Auto Manual to manual mode, adjust the attenuator manually. The highlight under auto or manual stands for auto coupling and manual coupling. When attenuator is under manual mode, press Attenuation Auto Manual will match the attenuator and reference level again.

Maximum input signal amplitude of input attenuator (10dB input attenuation at least) is +27dBm, higher power signal will damage input attenuator or mixer.
Scale/Div
Sets the logarithmic units per vertical grid division on the display. Select 0.01 \~ 100dB log amplitude scale. It's 10dB/div by default. Every activated marker is with dB as unit, difference between two markers is treated as marker difference under dB unit.
Key Points
- By changing the scale, the displayed amplitude range is adjusted.
- The amplitude that can be displayed is from reference level minus 10 times the current scale value to the reference level.
- You can modify this parameter using the numeric keys, knob, or direction keys.
Scale Type
Sets the Scale Type of Y-axis to Lin or Log, the default is Log. It only works under internal mixer mode. In general, select mV as Lin amplitude scale unit. Of course there would be other units for select.
Key Points
- In Log scale type: the Y-axis denotes the logarithmic coordinates, the value shown at top of the grid is the reference level and the grid size is equal to the scale value. The unit of Y-axis will be automatically switched into the default “dBm” when the scale type is changed from Lin to Log.
In Lin scale type: the Y-axis denotes the linear coordinates, the value shown at the top of the grid is the reference level and the bottom of the grid shows 0 V. The grid size is 10% of the Reference level and the Scale/Div is invalid. The unit of Y-axis will be automatically switched into the default “V” when the scale type is changed from Log to Lin.
Other than as mentioned above, the unit of Y-axis is independent of the Scale Type.
Ref Offset
Assigns an offset to the reference level to attempt to compensate for gains or losses generated between the device under measurement and the analyzer.
Key Points
- The changing of this value changes both the readout of the reference level and the amplitude readout of the marker, but will not impact the position of the curve on the screen.
- You can modify this parameter using the numeric keys.
- This offset use dB as absolute unit, will not change with selected scale and unit.
Ref Unit▶
Sets the unit of the Y-axis to dBm, dBmV, dBuV, V or W.
| dBm | Choose decibel equals to 1mW as amplitude unit. |
| dBμW | Choose decibel equals to 1μW as amplitude unit. |
| dBpW | Choose decibel equals to 1pW as amplitude unit. |
| dBmV | Choose decibel equals to 1mV as amplitude unit. |
| dBμV | Choose decibel equals to 1μW as amplitude unit. |
| W | Choose Watts as amplitude unit. |
| V | Choose Voltage as amplitude unit. |
Preamplifier
Sets the status of preamplifier located at the front of the RF signal path. Turning on the preamplifier reduces the displayed average noise level in order to distinguish small signals from the noise when working with small signals.
Autoset
Searches for signals automatically throughout the full frequency range, adjusts the frequency and amplitude to their optimum and realizes one-key signal search and auto setting of parameters.
- Some parameters such as reference level, scale, and input attenuation may be changed during the auto tune. If there is no signal is found, a message “Auto tune fail, can’t search any signal.” will appear on the screen.
Bandwidth
BW
Sets the RBW (Resolution Bandwidth) and VBW (Video Bandwidth) parameters of the analyzer. Pop out the setting menu includes RBW, VBW, and EMI Filter▶.
RBW
Adjust the resolution bandwidth ranging from 1Hz-1MHz. Use numeric key, step key or knob to switch resolution bandwidth. The underline under Auto or Manual means Auto mode or Manual mode.
Key Points
- Reducing the value of RBW will increase the frequency resolution, but may also cause sweeps to take longer (Sweep Time is effected by a combination of RBW and VBW when it is in Auto mode).
- RBW decreases with the span (non-zero span) in Auto RBW mode.
VBW
Sets the desired video bandwidth in order to remove the band noise. Set the video resolution displays in function area, ranging from 10Hz to 1MHz by sequence step. You can modify this parameter by numeric key, step key or knob. The underline under Auto or Manual means Auto mode or Manual mode. Press [VBW Auto Manual] and hold it in manual until the underline highlighted under Auto to return auto mode.
Key Points
- Reducing the value of RBW will increase the frequency resolution, but may also cause sweeps to take longer (Sweep Time is effected by a combination of RBW and VBW when it is in Auto mode).
• VBW varies with RBW when it is set to Auto.
EMI Filter▶ (Only apply to - Opt. 02 EMI Settings)
Pop out the menu for EMI measurement bandwidth.
| EMI bandwidth On Off | Turn on or off EMI measurement resolution bandwidth. |
| 1MHz | Set EMI measurement resolution to 1MHz. |
| 120kHz | Set EMI measurement resolution to 120kHz. |
| 9kHz | Set EMI measurement resolution to 9kHz. |
| 200Hz | Set EMI measurement resolution to 200Hz. |
Trace
As the sweep signal is displayed as a trace on the screen, you can set parameters about the trace using this key. The analyzer allows for up to five traces to be displayed at one time, and press this key to check the menu for trace. It includes Trace, State and Operations.
Trace
Select trace, the analyzer offers 1, 2, 3, 4, 5 trace. The selected trace and corresponding status menu will be underlined.
State▶
The state of selected trace.
| Clear Write | Refresh current curve and display the analyzer trace. |
| Max Hold | Maintains the maximum for each point of the trace. It continuously receives scan data and select positive peak value detect mode. |
| Min Hold | Maintains the minimum for each point of the trace. It continuously receives scan data and select negative peak value detect mode. |
| Average | Trace average function. It doesn’t need narrow VBW to implement smooth trace. This function set the wave detector to acquisition mode, continuously get average of the trace to smooth it. |
| View | Stops updating trace data and display current trace for observation. |
| Blink | Clear the trace on screen. But the trace stock will keep still without refreshing. |
Operations▶
Enter trace math related sub menu.
| 1 ↔ 2 | Exchange the trace stock 1 data with trace stock 2 and place them in display mode. |
| 2-DL → 2 | Deduct display line value in trace stock 2. This function execute once when activated. Press 2 - DL → 2 again to execute it the second time. When this function activated, display line will also be activated. |
| 2 ↔ 3 | Exchange the trace stock 2 data with trace stock 3 and place them in display mode. |
| 1→3 | Exchange the trace stock 1 data with trace stock 3 and place them in display mode. |
| 2→3 | Exchange the trace stock 2 data with trace stock 3 and place them in display mode. |
Detector
While displaying a wider span, each pixel contains spectrum information associated with a larger subrange. That is, several samples may fall on one pixel. Which of the samples will be represented by the pixel depends on the selected detector type. Press this key to pop out the relevant menu includes Pos Peak, Neg Peak, Sample, Normal, Voltage Avg, RMS Avg (EMI Option) and Quasi-Peak (EMI Option).
Key Points
- Selects an appropriate type according to the application in order to ensure the accuracy of the measurement for your application.
- It can be divided into five Traces and set their own Detectors respectively.
- Every selected type is shown with a parameter icon on the left status bar of screen.
Detector type comparison
Pos Peak
Searches t he maximum from the sampling data segment and displays it at the corresponding pixel. Positive peak detector will be selected when [Max Hold] pressed.
Neg Peak
Searches the minimum from the sampling data segment and displays it at the corresponding pixel.
Sample
Set the detector to the sampling detector mode. This mode is usually used for video averaging and noise frequency Maker.
Normal
When noise is detected, the positive and negative peaks are alternately displayed, otherwise only positive peaks are displayed.
Voltage Avg
Average all the data of the sampling data segment and display the result as the value of the pixel.
RMS Avg
Calculates the average power of all the samples in the sample bucket.
Quasi-Peak
The quasi-peak detector is a peak detector that is weighted by the duration and repetition rate of the signal, as specified by the CISPR 16-1-1 standard. Quasi-peak detection is characterized by a fast charge time and slow decay time.
Display
Controls the screen display of the analyzer, such as setting the on or off for, display line, amplitude scale, grid, label, Menu Hide, Brightness and Screen Sleep.
Full Screen
Set to full-screen display graphical interface, press any key to exit.
Display Line
When this menu is on, an adjustable horizontal reference line is activated on the screen.
Ampt Graticule
Turn on or off amplitude scale function.
Label
Defines the content displayed or hidden in the comments that appear in the display grid area.
Menu Hide On Off
Turn on or off the menu auto hiding when not any touch or key press.
Brightness
Set the screen brightness control from 0 \~ 100%
Screen Sleep On Off
Set the screen automatic sleep time (minimus).
Sweep

Sets parameters about the Sweep time and mode including Sweep Time, Sweep Single and Sweep Cont.
Sweep Time
Sets the time interval for the analyzer to complete a sweep.
In non-zero span, the analyzer uses the shortest sweep time on the basis of the current RBW and VBW settings if Auto is selected.
You can modify this parameter using the numeric keys, knob, or direction keys.
Sweep Single
Press Single Sweep to set the sweep mode to Single. Press Single Scan to restart the scan when the next trigger signal arrives. Allows you to set continuous scan mode.
Sweep Cont
Press Continuous Scan to activate the sweep scan mode.
Trigger

Sets the trigger type and other associated parameters, menu includes Free and Video.
Free
Set the trigger mode to the free trigger mode so that the scan trigger is as fast as possible with the spectrum analyzer. It meets the trigger conditions at any time, that is, continue to generate a trigger signal.
Video
This indicates a trigger signal will be generated when the system detects a video signal in which the voltage exceeds the specified video trigger level.
External
The external trigger is used when an external trigger signal is input into the Trig-in port. The external trigger signal can be configured as positive or negative edge.
Tracking Generator
TG
When the Tracking Generator is On, a signal with the same frequency of the current sweep signal will be output from the TG OUTPUT 50Ω terminal on the front panel. Press the key will pop out related menu includes TG▶, Track Gen On Off, Output Power Level, Reference, Position, Do normalize and Normalize On Off. The tracking source is turned off in the power-on and reset states.
TG▶
To configure tracking source.
Track Gen
RF output and spectrum reception are fully synchronized on the frequency sweep, and the tracking source frequency can not be set individually.
Output Level
Tracking Source power output range from 0dBm to -40dBm.
Reference
Adjusts the vertical position of trace on the screen.
Position
Adjusts the verticak of trace on the screen with percent.
Do Normalize
After connecting the instrument's RF output to the RF input, press the normalized soft menu and the display shows a straight line on the 0dB scale.
Normalize On Off
Turn on or off the Normalize function.
Mode
There has three modes for display: Spectrum, Demod and Modulation. Default is Spectrum mode. In Demod mode, it set the volume of the speaker on audio demodulation. Enter the modulation settings, the spectrum analyzer supports AM, FM digital demodulation.
MODE▶
Enter the mode menu.
Spectrum
The default mode on spectrum analyzer.
Demod▶
When the audio demodulation is on, adjust the speaker output volume.
Demod Mode
Set the AM or FM demodulation soft menu.
Sound
When the audio demodulation is on, adjust the speaker output volume.
Carrier Freq
Set the carrier frequency of audio demodulation.
Modulation▶
Enter the demodulation mode soft menu. Including AM, FM.
AM▶
Enter AM demodulation soft menu.
| Carrier Freq | Set the carrier frequency of the AM modulation signal. |
| IF BW | Set the demodulation bandwidth to auto or manual mode. |
| Setup▶ | Time Axis, Depth Axis, AF Trigger setup. |
| Time Axis▶ | Ref. Value, Postion, Scale/Div Auto Man setup. |
| Depth Axis▶ | Ref. Depth, Postion, Scale/Div Auto Man setup. |
| AF Trigger▶ | AF Trigger On Off, Edge Neg Pos, Trigger Mode Single Cont, Trigger Level %, Trigger Delay setup. |
| Data Reset | Reset the max, min, and mean data of AM. |
FM▶
Enter FM demodulation soft menu.
| Carrier Freq | Set the carrier frequency of the FM modulation signal. |
| IF BW | Set the demodulation bandwidth to auto or manual mode. |
| Setup▶ | Time Axis, Depth Axis, AF Trigger setup. |
| Time Axis▶ | Ref. Value, Postion, Scale/Div Auto Man setup. |
| Depth Axis▶ | Ref. Depth, Postion, Scale/Div Auto Man setup. |
| AF Trigger▶ | AF Trigger On Off, Edge Neg Pos, Trigger Mode Single Cont, Trigger Level %, Trigger Delay setup. |
| Data Reset | Reset the max, min, and mean data of FM. |
Peak Search
Executes peak searching immediately and opens the Peak setting menu.
Key Points
- If Max is selected from the Peak Search option, it will search and mark the maximum on the trace.
- If Min is selected from the Peak Search option, it will search and mark the minimum on the trace.
- The peak search of Peak-Peak, Next Peak, Peak Right, Peak Left or peaks in the peak list must meet the specified parameter condition.
- The spurious signal at the zero frequency caused by LO feed through is ignored.
Peak Search

Place a frequency scale at the highest point of the trace and display the frequency and amplitude of the frequency scale in the upper right corner of the screen. Peak search does not change the activated function.
$$ M k r > C F $$
Used to move the peak point to the center frequency point.
Peak-Peak
Show the max-peak and min-peak delta.
Next Peak
Searches the peak whose amplitude is the closest to that of the current peak. The peak is then identified with a marker. When this key is pressed repeatedly, you can quickly find a lower peak.
Left Peak
Searches the nearest peak located to the left side of the current peak and meets the current peak and peak thresholds condition. The peak is then identified with a marker.
Right Peak
Searches the nearest peak located to the right side of the current peak and meets the current peak and peak thresholds condition. The peak is then identified with a marker.
Cont Peak On Off
Set the peak search form, off by default. On mode will automatically search for the peak.
Peak Setup▶
Relevant settings for the Peak function include Peak Excursion, Max/Min Peak switching, Peak Sort Freq Ampl, and Peak List On Off functions.
Peak Excursion
This function is used to set the peak height. For example, the peak excursion default is 10dB, the signal will be captured only if it is more than 10dB above the noise floor.
Peak Mode Max Min
Set the peak mode to maximum or minimum.
Sort Freq Ampt
Set the peak list sort by frequency or amplitude.
Peak List On Off
Turn the peak list on or off. Display 10 peaks that meet the set conditions.
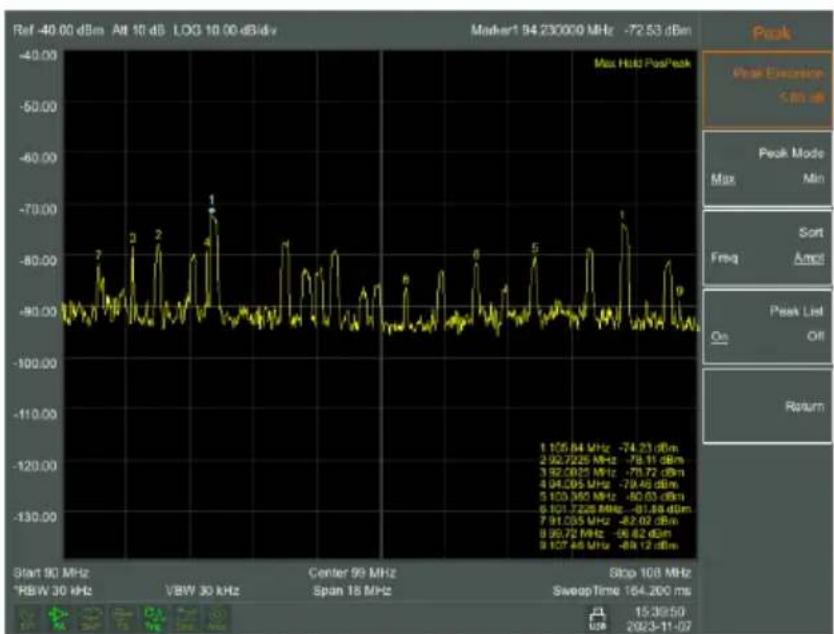
line
| Frequency (MHz) | Power (dBm) | | --------------- | ----------- | | 1.156 | -74.23 | | 2.027 | -78.11 | | 3.92 | -78.72 | | 4.94 | -78.45 | | 5.120 | -80.03 | | 6.101 | -81.84 | | 7.91 | -82.02 | | 8.90 | -86.82 | | 9.107 | -89.12 |Marker
The marker appears as a rhombic sign (shown below) for identifying the point on the trace. We can easily readout the parameters of the marked point on the trace, such as the amplitude, frequency and sweep time.
Key Points
- The analyzer allows for up to three groups of markers to be displayed at one time, but only one pair or one single marker is active every time.
- You can use the numeric keys, knob or direction keys to enter the desired frequency or time when any marker type menu is active, so as to view the readouts of different points on the trace.
Marker 1 2 3 4 5 6 7 8
Selects one marker, the default is Marker1. And place the frequency scale at the center of the trace. If the frequency difference is activated, this soft key changes to the menu under the Difference function.
If there is already a marker, this command will not produce any operation. If there are already two markers (e.g. in Difference mode), Marker changes the active frequency scale to a new single frequency scale. Amplitude and frequency information can be obtained from the frequency scale (time information when the sweep width is 0Hz), and these values are displayed in the upper right corner of the active function area and the screen. You can use the numeric keys, the step key, or the knob to move the active frequency scale.
The marker reads data from the current active track (this track may be track A or track B). If both tracks are active or both tracks are in static display mode, the frequency scale will read data from track A.
Trace 1 2 3 4 5
In the trace measurement, the frequency scale used to activate the traces.
Normal
One of the marker types, which is used to measure the values of X (Frequency or Time) or Y (Amplitude) at certain point of the trace. When selected, a marker will appear with its own digital ID such as "1" on the trace.
Key Points
- If no active marker exists currently, a one will be enabled automatically at the center frequency of current trace.
- You can use the knob, direction keys or numeric keys to move the marker. The readouts of the marker will be displayed on the upper right of the screen.
- The readout resolution of the X-axis corresponds to the span and sweep points. For higher resolution, add sweep points or reduce the span.
Delta
One of the marker types, which is used to measure the delta values of X (Frequency or Time) and Y (Amplitude) between the Reference point and certain point on the trace. When selected, a pair of markers appears on the trace, which are the Reference Marker and the Delta Marker. Will be in the active area and the display area of the upper right corner, showing the amplitude delta value between the two markers and frequency difference. If a single marker already exists, [Delta] will place a static marker and an active marker to the original position and a single marker position. Use the knob, step key, or number keys to move the marker. If there are two markers, press [Delta] directly. However, if [Delta] has been
activated, press Delta to place the still frequency scale to the active marker. The displayed amplitude difference is expressed in dB, or is the linear unit in terms of the corresponding scale.
Key Points
- The Reference Marker will be activated at the position of current marker, or else both the reference marker and Delta Marker will be simultaneously activated at the center frequency location if no marker is active at the present.
- The location of the Reference Marker is always fixed (both in the X-axis and the Y-axis), while the Delta Marker is active. You can use the numeric keys, knob or direction keys to change the location of Delta Marker.
- The delta of both the Frequency/Time and the amplitude between the two markers are displayed at the upper right of the screen.
Two ways to enable a certain point as the reference:
Key Points
- Open a Normal marker and locate it onto a point and then switch the marker type into "Delta", creating a new reference, then you can modify the location of the delta point to achieve the delta measurement.
- Open a Delta Marker and place it onto a point, then reselect the Delta menu to locate the marker you opened onto this points, then you can modify the location of the delta point to achieve the delta measurement.
Off
The marker information displayed on the screen and functions based on the marker will be turned off and won't show up again.
All Off
Turns off all the opened markers and the related functions. The marker won't show again.
Marker Table
Turns on or off the display of all marker table.
Marker→
A soft menu associated with the marker function is popped out for setting the other system parameters (such as Center frequency, Reference level) by current marker readings. These menus relate to the frequency of the spectrum analyzer, whether the sweep width and marker are in normal or delta marker mode.
Mkr->CF
Sets the center frequency of the analyzer based on the frequency of the current marker. This feature quickly moves the signal to the center of the screen.
If Normal is selected, the center frequency will be set to the frequency of the current marker.
If Delta Marker is selected, the center frequency will be set to the frequency at which the Delta Marker is located.
The function is invalid in Zero span mode.
Mkr->CF Step
Sets the center frequency step of the analyzer based on the frequency of the current marker.
If Normal is selected, the center frequency step will be set to the frequency of current marker.
If Delta Marker is selected, the center frequency step will be set to the frequency at which the Delta Marker is located.
The function is invalid in Zero span mode.
Mkr->Start
Sets the start frequency of the analyzer based on the frequency of the current marker.
If Normal is selected, the start frequency will be set to the frequency of the current marker.
If Delta Marker is selected, the start frequency will be set to the frequency at which the Delta Marker is located.
The function is invalid in Zero span mode.
Mkr->Stop
Sets the stop frequency of the analyzer based on the frequency of the current marker.
If Normal is selected, the stop frequency will be set to the frequency of the current marker.
If Delta Marker is selected, the stop frequency will be set to the frequency at which the Delta Marker is located.
The function is invalid in Zero span mode.
Mkr->Ref Level
Sets the reference level of the analyzer based on the amplitude of the current marker.
If Normal is selected, the reference level will be set to the amplitude of the current marker.
If Delta Marker is selected, the reference level will be set to the amplitude at which the Delta Marker is located.
MkrΔ->Span
Changes the span of the analyzer to the frequency difference between the two markers.
MkrΔ->CF
Changes the center frequency of the analyzer to the frequency difference between the two markers.
Marker Function
Executes specific marker soft menu.
Function Off
Turn off marker measurement function.
NdB On Off
Enables the N dB BW measurement or sets the value of N. The N dB BW denotes the frequency difference between points that are located on both sides of the current marker while the amplitude falls off (N<0) or rises (N>0) N dB separately,
Key Points
- When the measurement starts, the analyzer will search the two points which are located at both sides of the current point and are N dB amplitudes smaller or greater than the current point, and display the frequency difference between the two points.
- You can use the numeric keys, knob or direction keys to modify the value of N, 3 at default.
Marker Noise On Off
Turn on or off the frequency noise function. The function of marking noise is applied to the selected cursor, and then the noise Power Spectral Density at the cursor is read. When turned on, the average noise level read at the frequency scale is normalized to 1 Hz bandwidth for noise power.
Freq Count▶
Activate the frequency counter function and display the count results in the upper right corner of the screen. The counter counts only the signals that are displayed on the screen. The frequency
count also pops up an additional counter function for the soft menu, including Freq Count On Off
| Freq Count On Off | Turn on or off the frequency counter mode. This function is invalid when the trace signal generator is activated. The count value is displayed in the upper right corner of the screen. |
| Resolution | Counter resolution is divided into 1 kHz, 100 Hz, 10 Hz, 1Hz. Changing the counter resolution can change the counter accuracy. The higher the resolution, the higher the counting accuracy. |
Measurement
Provide a variety of advanced measurement functions, pop-up spectrum analyzer built-in and user-defined measurement function soft menu, turn on or off the time spectrum, adjacent channel power measurement, channel power measurement, occupied bandwidth, Pass-Fail measurement menu.
Measure off
You can directly close the currently running measurement function, you can also choose to close the measurement menu.
Time Spec On Off
Turn on or off the time spectrum measure mode.
ACPR On Off
Turn on or off the adjacent channel power measurement. the Measure Setup button to pop up the parameters of the adjacent channel power measurement soft menu. The adjacent channel power is used to measure the ratio of the adjacent channel power of the transmitter. The absolute value of the main channel power and the absolute value of the adjacent channel power are obtained by the linear power integration method, so that the adjacent channel power ratio is gained.
Chanel Power On off
Turn on or off channel power measurements. Press the Measure Setup button to pop up the channel power measurement parameter settings soft menu. The channel power is used to measure the transmitter channel power, according to the user set the channel bandwidth, through the linear power integration method to obtain the absolute value of the main channel power.
OBW On Off
Turn on or off the occupied bandwidth measurement. Press the Measure Setup button to pop up the parameter setting soft menu for occupying the bandwidth measurement. Occupied Bandwidth is a measure of the bandwidth occupied by the transmitter signal can be measured from the total power ratio within the in-band power span, with a default value of 99% (the user can set this value).
Pass-Fail▶
Enter the pass / fail measurement function soft menu. Pass/ fail measurement has two modes of window measurement and area measurement.
Window Meas▶
Enter Window measurement soft menu.
Window Meas On Off
Turn on or off window measurement mode.
Limit Line On Off
Turns the amplitude line on or off, and the amplitude line turns on when the window measurement is on.
Freq Line On Off
Turns the frequency line on or off, and the frequency line turns on when the window measurement is on.
Limit Set Up Low
Used to edit the upper and lower limit on the amplitude line.
Freq Set Start Stop
Start and stop frequencies for scanning line for editing.
Window Sweep On Off
Turn window sweep on or off. When the window sweep is on, only the window formed by the intersection of the amplitude line and the frequency line is scanned. The peripheral stops scanning; the full frequency is scanned when it is closed.
Limit Meas▶
Enter the soft menu of the area measurement mode.
Limit Meas On Off
Turn On or Off area measurement mode.
Line Up On Off
When the upper limit line is turned on or off, the upper limit line is opened by default when the area measurement is on.
Line Low On Off
When the lower limit line is turned on or off, the lower limit line is opened by default when the area measurement is on.
Offset X/Y
Frequency For the actual measurement, the edited area as a whole superimposed on a frequency, so that it can implement left or right shift, easy to measure. Does not affect the frequency and marker of the spectrum analyzer settings.
Amplitude
The region has been edited on the whole superimposed on a degree, so that it can move up or down, easy to measure. Does not affect the amplitude setting of the spectrum analyzer.
Edit▶
UpLine Edit ▶
Upper line editing is used to edit the control line above the trace, depending on the trace.
LowLine Edit
Lower line editing is used to edit the control line above the trace, depending on the trace.
Save Line
Save the current limit line.
LoadLine ▶
Load the limit line.
Measure Setup
Measurement setting menu for the corresponding measurement parameter settings when adjacent channel power, channel power, occupied bandwidth measurement mode is turned on.
Channel BW
Set the bandwidth of the channel power measurement, and set the total display power percentage of bandwidth.
Channel Interval
Set the center frequency difference of the primary channel to the adjacent channel.
Channel Nums
Set the number of upper and lower adjacent channels measured by adjacent channel power.
Power Percent
Set the power ratio of occupied bandwidth.
System
System
A soft menu for system parameter settings pops up. Including System Info ▶, Firmware Update, Option▶, LAN▶, Shutdown On Off, Language▶, Date/Time▶. For first time you use the spectrum analyzer, set the date and time, the system will store the settings, restart the machine after power off won't change the settings.
System▶
Pop up system information and system log soft menu.
System Info
Display the instrument model number, serial number, Firmware version, Temperature, LAN interface information, Optional activation state, Calibrate Date, etc.
Firmware update
Update firmware from usb disk. The files to be upgraded must be placed in the spectrum folder under the USB root folder.
Option▶
This function displays the optional content of the spectrum analyzer.
Setting▶
This function displays various settings of this unit.
LAN▶
Pop out the relative menu for network configuring.
| IP | Used to set the IP address of the LAN port. |
| Mask | Set the subnet mask parameter. |
| Gate | Set default gateway address. |
| DHCP On Off | To reset the LAN. Toggles the LAN configuration between DHCP and manual settings. |
Shutdown On Off
Automatic shutdown time(minimus). If there is no button and touch operation within the set time, shutdown.
Language▶
To set the system language, in English by default.
Date/Time▶
Used to set the device date, time, and their format.
| Date/ Time On Off | Turn on or off Date/Time display. |
| Date Set | Set the display date for spectrum analyzer. Format is YYYMMDD. E.g. June 22th, 2022 should display as 2022.06.22. |
| Time Set | Set the display time for spectrum analyzer. Format is HHMMSS. E.g. 16:55:30 should display as 16.55.30. |
Power On/Preset▶
Used to set the analyzer power on parameters or reset parameters.
| Power Set▶ | Power on parameter settings include Factory and User |
| Preset▶ | Power on parameter settings include Factory and User |
 Note Note | To save the current system configuration as a user-defined configuration, press the [Save] panel key and select the [User Status] menu item. |
File
Pop up file management soft menu.
Storage Int Ext
In the directory state, view the latest stored files.
Type▶
To check file type under directory, includes screen image, trace data, limit line and display all.
First Page
Display first page of current directory.
Prev Page
Display Previous page.
Next Page
Display next page.
Last Page
Display last page of current directory.
Operations▶
Pop out the soft menu for file operation, includes sorting order, delete, export, import, and set as power on, set as preset, etc.
Quick Save
Save the contents of the current screen quickly.
Save

It's available to save screenshot, trace data, or user status.
Screen Pixmap▶
Enter screenshot save soft menu, you can choose to save screenshots to local or flash memory, the image file format is bmp, the lower left corner of the screen status display bar will display the saved screenshots information.
Trace Data▶
Enter the trace data save soft menu, you can choose to save the trace data to the local or flash memory, trace data file format is csv, the bottom left corner of the screen status display trace data saving information.
User State
Save the current system configuration as a user self-defined configuration, the file format is “.user”. Save it in local. The information on saving the user status will display in the status bar of the bottom left corner of the screen.
Limit Line
Enter the limit line data save soft menu, you can choose to save the limit line data to the local or flash memory, limit line data file format is “.sp”.
QuickSaveSet▶
Set quick save the screen, trace file, system configuration or limit line data.
F_AQ
Typical issues that may occur when using your spectrum analyzer:
• Power on malfunction.
- No signal display
- Wrong measurement results or poor frequency or amplitude precision.
Power on malfunction can include a situation where the screen is still dark (no display) after switch on.
Q1. If the screen is still dark after power on.
please check
- Power on malfunction. If the power supply has been connected correctly and it the power supply voltage range is within the specification.
- If the power switch has been turned on.
- If the fan is running, please contact us for service.
Q2. There is no signal display at any wave band.
A2. Set a signal generator at 30 MHz frequency and -20 dBm power and connect it to the spectrum analyzer RF input connector. If there is still no signal display, there may be a problem with the spectrum analyzer hardware circuit. Please contact GW Instek for service.
Q3. The signal amplitude readout is not precise.
A3. Perform a calibration. If amplitude readout is still not precise, then it may be a problem with internal circuit, please contact GW Instek for service.
Q4 The frequency readout exceed the error range during measurements.
A4. Check if the signal source is stable. If so, check if spectrum analyzer reference is precise. Select internal or external frequency reference according to measurement conditions: press the FREQ button [frequency reference Internal External]. If the frequency is still not precise, then the spectrum analyzer LO has lost its phase lock, please contact GW Instek for service.
For more information, contact your local dealer or GW Instek at www.gwinstek.com / marketing@goodwill.com.tw.
APPENDIX
Specifications
This chapter lists the technical specifications and general technical specifications of the spectrum analyzer. Unless otherwise stated, the technical specifications apply to the following conditions:
- The instrument has been preheated for 60 minutes before use.
- The instrument is in the calibration cycle and has been self-calibrated.
"Typical" and "nominal" for this product are defined as follows:
- Typical: Refers to the performance of the product under certain conditions.
- Nominal: Refers to the approximate value under product application process.
| Model | GSP-8000 Series | |
| FREQUENCY | ||
| FREQUENCY | ||
| Range | GSP-8180 | 9 kHz ~ 1.8 GHz |
| GSP-8380 | 9 kHz ~ 3.8 GHz | |
| GSP-8800 | 9 kHz ~ 8.0 GHz | |
| Resolution | 1 Hz | |
| FREQUENCY SPAN | ||
| Span Range | 0 Hz, 100 Hz to max. frequency of instrument | |
| Span Uncertainty | ±span / (sweep points-1) | |
| INTERNAL FREQUENCY REFERENCE | ||
| Frequency Range | 10.000000 MHz | |
| Reference Frequency Accuracy | ±[(days from last calibrate × freq aging rate) + temperature stability + initial accuracy] | |
| Temperature stability | <1ppm (15°C ~ 35°C) | |
| Aging rate | <1ppm/year | |
| Initial Accuracy | <1ppm | |
| SSB PHASE NOISE | ||
| Offset from Carrier | fc=1 GHz, RBW=1 kHz, VBW=1kHz, 20°C ~ 30°C, average ≥ 40 | |
| 10 kHz | <-104 dBc/Hz | |
| 100 kHz | <-106 dBc/Hz (Typical) | |
| 1 MHz | <-115 dBc/Hz (Typical) | |
| BANDWIDTH | ||
| Resolution Bandwidth | 1Hz to 1MHz (1-3-5-10 steps by sequence) | |
| 200Hz, 9kHz, 120kHz, 1MHz, EMI Filter(6dB), Optional | ||
| RBW Uncertainty | <5%, Typical, RBW ≤ 1 MHz | |
| Resolution Filter Shape Factor(60dB: 3dB) | <5: 1, Typical, digital and close to Gaussian shape | |
| Video Bandwidth (VBW) | 10 Hz ~ 3 MHz | |
| AMPLITUDE | ||
| AMPLITUDE AND LEVEL | ||
| Amplitude measurement range | GSP-8180 | DANL ~ +10 dBm, 100 kHz ~ 1 MHz, Preamp Off |
| DANL ~ +20 dBm, 1 MHz ~ 1.8 GHz, Preamp Off | ||
| GSP-8380 | DANL ~ +10 dBm, 100 kHz ~ 1 MHz, Preamp Off | |
| DANL ~ +20 dBm, 1 MHz ~ 3.8 GHz, Preamp Off | ||
| GSP-8800 | DANL ~ +10 dBm, 100 kHz ~ 10 MHz, Preamp Off | |
| DANL ~ +20 dBm, 10 MHz ~ 8 GHz, Preamp Off | ||
| Reference Level | -80 dBm ~ +30 dBm, 0.01dB by step | |
| Preamp | 20 dB, 100 kHz ~ Max. Frequency Range | |
| Input Attenuation | 0 ~ 40 dB, in 1 dB step | |
| Max Input DC Voltage | 50 VDC | |
| Max continuous power | +30dBm, Average continuous power | |
| Displayed Average Noise Level (DANL) | ||
| Preamp Off | Input Attenuation = 0 dB, ref. level ≥ -60dBm, trace average ≥ 40 RBW normalizes to 1Hz, DETECTOR = SAMPLE, RBW =100Hz, VBW = 100Hz | |
| GSP-8180 | 9 kHz ~ 1MHz, <-95 dBm (typical), <-88dBm | |
| 1 MHz ~ 1 GHz, <-140dBm (typical), <-130 dBm | ||
| 1 GHz ~ 1.8 GHz, <-138dBm (typical), <-128 dBm | ||
| GSP-8380 | 9 kHz ~ 1MHz, <-95 dBm (typical), <-88dBm | |
| 1 MHz ~ 1 GHz, <-140dBm (typical), <-130 dBm | ||
| 1 GHz ~ 3.8 GHz, <-138dBm (typical), <-128 dBm | ||
| GSP-8800 | 9 kHz ~ 1MHz, <-95dBm (typical), <-88 dBm | |
| 1 MHz ~ 500MHz, <-140dBm (typical), <-130 dBm | ||
| 500MHz ~ 3GHz, <-138dBm (typical), <-128 dBm | ||
| 3GHz ~ 6GHz, <-134dBm (typical), <-124 dBm | ||
| 6GHz ~ 8GHz, <-129dBm (typical), <-119dBm | ||
| Preamp on | Input Attenuation = 0 dB, ref. level ≥ -60dBm, trace average ≥ 40 RBW normalizes to 1Hz, DETECTOR = SAMPLE, RBW =100Hz, VBW = 100Hz | |
| GSP-8180 | 100 kHz ~ 1MHz, <-135 dBm (typical), <-128dBm | |
| 1 MHz ~ 1 GHz, <-160dBm (typical), <-150 dBm | ||
| 1 GHz ~ 1.8 GHz, <-160dBm (typical), <-150 dBm | ||
| GSP-8380 | 100 kHz ~ 1MHz, <-135 dBm (typical), <-128dBm | |
| 1 MHz ~ 1 GHz, <-160dBm (typical), <-150 dBm | ||
| 1 GHz ~ 3.8 GHz, <-160dBm (typical), <-150 dBm | ||
| GSP-8800 | 100 kHz ~ 1MHz, <-135dBm (typical), <-128 dBm | |
| 1 MHz ~ 500MHz, <-160dBm (typical), <-150 dBm | ||
| 500MHz ~ 3GHz, <-160dBm (typical), <-150 dBm | ||
| 3GHz ~ 6GHz, <-154dBm (typical), <144 dBm | ||
| 6GHz ~ 8GHz, <-149dBm (typical), <-139dBm | ||
| FREQUENCY RESPONSE | ||
| Filter Bandwidth | 20°C to 30°C, 30% to 70% relative humidity, input attenuation=10 dB, reference frequency =50 MHz, SPAN = 200KHz, RBW = 10KHz, VBW = 10KHz | |
| Preamp Off, fc ≥100 kHz | ±0.8 dB, 100K ~ Max. Frequency Range | |
| Preamp On, fc ≥1MHz | ±0.9 dB, 100K ~ Max. Frequency Range | |
| UNCERTAINTY AND ACCURACY | ||
| RBW Switch Uncertainty | Reference: 10 kHz RBW at Frequency Center is 50 MHz | |
| ±0.2 dB, Log resolution | ||
| Input Attenuation Uncertainty | 20°C ~ 30°C, fc =50 MHz, Preamplifier Off, 10 dB RF attenuation,RBW = 10K, | |
| 1 ~ 40 dB ±0.5 dB | ||
| Absolute Amplitude Uncertainty | 20°C to 30°C, fc=50 MHz, Span=200 kHz, RBW=10 kHz, VBW=10 kHz, peak detector, 10 dB RF attenuation,average ≥ 20, 2db/div, 95% confidence level | |
| Preamp Off | ±0.4 dB, input signal level -20 dBm | |
| Preamp On | ±0.5 dB, input signal level -40 dBm | |
| Uncertainty | 20°C to 30°C, fc=>1MHz, signal iput range 0~-50dBm, Ref Level range 0~-50dBm, 10 dB RF attenuation, RBW =1kHz, VBW =1kHz,Preamp Off; | |
| ±1.5 dB(typical) | ||
| VSWR | GSP-8180 | <1.5, Nominal, Input 10 dB RF attenuation, 1MHz ~ 1.8GHz |
| GSP-8380 | <1.5, Nominal, Input 10 dB RF attenuation, 1MHz ~ 3.8GHz | |
| GSP-8800 | <1.8, Nominal, Input 20 dB RF attenuation, 1MHz ~ 8.0GHz | |
| DISTORTION AND SPURIOUS RESPONSE | ||
| Second harmonic distortion | fc ≥ 50 MHz, Preamp off, signal input -20 dBm, 0 dB RF attenuation, 20°C ~ 30°C | |
| -65 dBc | ||
| Third-order intermodulation | fc ≥ 50 MHz, Input double tone level -20 dBm, frequency interval 100 kHz, input attenuation 0 dB, preamplifier off, 20°C ~ 30°C | |
| +10 dBm | ||
| 1 dB Gain Compression | Nominal, fc ≥ 50 MHz, 0 dB RF attenuation, Preamp off, 20°C ~ 30°C | |
| >-2 dBm | ||
| Residual response | Connect 50 Ω load at input port, 0 dB input attenuation, 20°C to 30°C, average ≥40, RBW = 300Hz, VBW = 3kHz,SPAN = 2M | |
| <-85 dBm, 1 MHz ~ Max. Frequency Range | ||
| Input related spurious | <-60 dBc, -30 dBm signal at input mixer, 20°C ~ 30°C | |
| SWEEP | ||
| SWEEP TIME | ||
| Range | 10 ms ~ 3000 s, None-zero Span | |
| 1 ms ~ 3000 s, Zero Span | ||
| Sweep Mode | Continuous; Single | |
| TRACKING GENERATOR (OPTION 01) | ||
| TRACKING GENERATOR OUTPUT | ||
| Frequency Range | 100 kHz ~ Max. Frequency Range | |
| Output power level range | -40 dBm ~ 0 dBm | |
| Output power level resolution | 1 dB | |
| Output flatness | ± 3 dB | |
| Maximum safe reverse level | Average total power: +30 dBm, DC: ±50 VDC | |
| Impedance | 50 Ω, Nominal | |
| Connector | N Type Female | |
| FREQUENCY COUNTER | ||
| FREQUENCY COUNTER | ||
| Resolution | 1Hz, 10Hz, 100Hz, 1kHz | |
| Accuracy | ±(frequency indication × frequency reference accuracy) + counter resolution | |
| INPUTS AND OUTPUTS | ||
| RF INPUT | ||
| Impedance | 50 Ω, Nominal | |
| Connector | N Type Female | |
| REFERENCE INPUT | ||
| Connector | BNC Female | |
| 10MHz Reference Amplitude | 0 dBm to +10 dBm | |
| Trigger Input | ||
| Impedance | 1 kΩ | |
| 10MHz Reference Amplitude | BNC Female | |
| USB | ||
| USB Host | Connector | A Plug |
| Protocol | USB 2.0 (Host End) | |
| USB Device | Connector | B Plug |
| Protocol | 2.0 Version | |
| GENERAL | ||
| Display | Type | TFT LCD |
| Resolution | 1024*768 | |
| Size | 10.4 inches | |
| Color | 65,536 colors | |
| Remote Control | USB Device | B Plug, supports USB TMC |
| LAN TCP/IP Interface | RJ-45, supports 10Base-T/100Base-Tx | |
| Mass Memory | Internal Memory | 256M Bytes |
| Temperature | Operating Temperature | 0 °C to 40°C |
| Storage Temperature | -20°C to 70°C | |
| Relative humidity | 0°C to 30°C | ≤ 95% |
| 30°C to 40°C | ≤ 75% | |
| Dimensions & Weight | 421(W) × 221(H) × 115(D) mm; Approx. 5.0 kg (without package) | |
| AC Power Socket | 100V ~ 240V, 50/60Hz | |
| Power Consumption | 28W | |
GSP-8000 Factory Default Settings
The following default settings are the factory configuration settings for GSP-8000.
Factory Settings
| Parameter | Value |
| Frequency | |
| 4000.000000 MHz (GSP-8800) | |
| Center Frequency | 1900.000000 MHz (GSP-8380) |
| 900.000000 MHz (GSP-8180) | |
| Start Frequency | 0 Hz |
| 8000.000000 MHz (GSP-8800) | |
| Stop Frequency | 3800.000000 MHz (GSP-8380) |
| 1800.000000 MHz (GSP-8180) | |
| 800.000000 MHz (GSP-8800) | |
| Frequency Step | 380.000000 MHz (GSP-8380) |
| 180.000000 MHz (GSP-8180) | |
| Frequency Offset | 0 Hz |
| Frequency Reference | Internal |
| SPAN | |
| 8.000000000 GHz (GSP-8800) | |
| Span | 3.800000000 GHz (GSP-8380) |
| 1.800000000 GHz (GSP-8180) | |
| Amplitude | |
| Reference Level | 0.00dBm |
| Attenuator | Auto 10 dB |
| Scale/div | 10.00dB |
| Scale Type | Log |
| Reference Offset | 0.00dB |
| Unit | dBm |
| Preamp | Off |
| BW | |
| Resolution Bandwidth | Auto 1MHz |
| Video Bandwidth | Auto 1MHz |
| EMI Filter | Off |
| Detector | |
| Detect Type | Pos Peak |
| Sweep | |
| Sweep Time | Auto |
| Sweep Term | Continuous Sweep |
| TG | |
| Tracking Source | Off |
| Trace | |
| Trace | 1 |
| Trace State | Clear & Write |
| Trace 1 Math | 1<->2 |
| Display | |
| Full Display | Off |
| Display Line | Off |
| Amplitude Graticule | Off |
| Label | Off |
| Menu Hide | Off |
| Brightness | 100% |
| Screen Sleep | Off |
| Trig | |
| Trigger Type | Free |
| Mode | |
| Display Mode | Spectrum |
| Peak | |
| Peak Search | Off |
| Peak Excursion | 10dB |
| Peak Mode | Max Peak |
| Peak Sort | Amplitude |
| Marker Fctn | |
| NdB | Off |
| Marker Noise | Off |
| Frequency Count | Off |
| Marker | |
| Marker | 1 |
| Trace | 1 |
| Marker List | Off |
| Measurement | |
| Time Spectrum | Off |
| Adjacent Power | Off |
| Channel Power | Off |
| Occupied Bandwidth | Off |
| Pass-fail | Off |
| Measure Setup | |
| Channel Bandwidth | 1.000000MHz |
| Channel Gap | 2.000000MHz |
| Adjacent Number | 3 |
| Power Percent | 99.9% |
| System | |
| Interface | LAN |
| IP Address | 192.168.0.x |
| Subnet Mask | 255.255.255.0 |
| Gateway | 192.168.0.1 |
| Local Language | English |
| Date/Time | On |
Certificate Of Compliance
We
GOOD WILL INSTRUMENT CO., LTD.
declare that the CE marking mentioned product
satisfies all the technical relations application to the product within the scope of council:
Directive: EMC; LVD; WEEE; RoHS
The product is in conformity with the following standards or other normative documents:
| ◎ EMC | ||
| EN 61326-1 | Electrical equipment for measurement, control and laboratory use -- EMC requirements | |
| Conducted & Radiated Emission EN 55011 / EN 55032 | Electrical Fast Transients EN 61000-4-4 | |
| Current Harmonics EN 61000-3-2 / EN 61000-3-12 | Surge Immunity EN 61000-4-5 | |
| Voltage Fluctuations EN 61000-3-3 / EN 61000-3-11 | Conducted Susceptibility EN 61000-4-6 | |
| Electrostatic Discharge EN 61000-4-2 | Power Frequency Magnetic Field EN 61000-4-8 | |
| Radiated Immunity EN 61000-4-3 | Voltage Dip/ Interruption EN 61000-4-11 / EN 61000-4-34 | |
| ◎ Safety | ||
| EN 61010-1 : | Safety requirements for electrical equipment for measurement, control, and laboratory use - Part 1: General requirements | |
GOODWILL INSTRUMENT CO., LTD.
No. 7-1, Jhongsing Road, Tucheng District, New Taipei City 236, Taiwan
Tel: +886-2-2268-0389 Fax: +886-2-2268-0639
Web: http://www.gwinstek.com Email: marketing@goodwill.com.tw
GOODWILL INSTRUMENT (SUZHOU) CO., LTD.
No. 521, Zhujiang Road, Snd, Suzhou Jiangsu 215011, China
Tel: +86-512-6661-7177 Fax: +86-512-6661-7277
Web: http://www.instek.com.cn Email: marketing@instek.com.cn
GOODWILL INSTRUMENT EURO B.V.
De Run 5427A, 5504DG Veldhoven, The Netherlands
Tel: +31-(0)40-2557790 Fax: +31-(0)40-2541194
Email: sales@gw-instek.eu


- Table of Contents
- SAFETY INSTRUCTIONS 5
- USER NOTICE.... 10
- GETTING STARTED.... 15
- MENU INTEPRETATION 32
- SAFETY INSTRUCTIONS
- Safety Symbols
- Safety Guidelines
- General Guideline
- CAUTION
- Power cord for the United Kingdom
- WARNING: THIS APPLIANCE MUST BE EARTHED
- USER NOTICE
- General Inspection
- Steps
- Safety Precaution before Operation
- Check Power Supply
- Allowed Variation Range of Supply Power Parameters
- Power Cord Selection
- WARNING
- Electro-static Discharge (ESD) Protection
- First Time to Power on
- GETTING STARTED
- Package Contents and Accessories
- Front Panel Overview
- Front Panel Function Key
- Basic keys
- Control keys
- Marker function keys
- Advanced measure keys
- Utility keys
- Parameter Input
- Numeric Keypad
- Numeric keys
- Cancel key
- Back key
- Enter key
- Unit keys
- No. Name
- Description
- Related Key
- Build-in Help
- Basic Measurement
- Equipment connection
- Setting parameters
- MENU INTEPRETATION
- Detector 52
- Display 54
- Sweep 55
- Trigger 56
- Tracking Generator 57
- Mode 59
- Peak Search
- Frequency
- Center Freq
- Start Freq
- Key Points
- Stop Freq
- Freq Step Auto Manual
- Freq Offset
- Freq Ref Internal External
- Scale Type LIN LOG
- Span
- Full Span
- Zero Span
- Last Span
- Amplitude
- Ref Level
- Attenuation
- Scale/Div
- Scale Type
- Ref Offset
- Ref Unit▶
- Preamplifier
- Autoset
- Bandwidth
- RBW
- VBW
- EMI Filter▶ (Only apply to - Opt. 02 EMI Settings)
- Trace
- State▶
- Operations▶
- Detector
- Detector type comparison
- Pos Peak
- Neg Peak
- Sample
- Normal
- Voltage Avg
- RMS Avg
- Quasi-Peak
- Display
- Full Screen
- Display Line
- Ampt Graticule
- Label
- Menu Hide On Off
- Brightness
- Screen Sleep On Off
- Sweep
- Sweep Time
- Sweep Single
- Sweep Cont
- Trigger
- Free
- Video
- External
- Tracking Generator
- TG▶
- Track Gen
- Output Level
- Reference
- Position
- Do Normalize
- Mode
- MODE▶
- Spectrum
- Demod▶
- Demod Mode
- Sound
- Carrier Freq
- Modulation▶
- AM▶
- FM▶
- Peak-Peak
- Next Peak
- Left Peak
- Right Peak
- Cont Peak On Off
- Peak Setup▶
- Peak Excursion
- Peak Mode Max Min
- Sort Freq Ampt
- Peak List On Off
- Marker
- Marker 1 2 3 4 5 6 7 8
- Trace 1 2 3 4 5
- Delta
- Off
- All Off
- Marker Table
- Marker→
- Mkr->CF
- Mkr->CF Step
- Mkr->Start
- Mkr->Stop
- Mkr->Ref Level
- MkrΔ->Span
- MkrΔ->CF
- Marker Function
- NdB On Off
- Marker Noise On Off
- Freq Count▶
- Measurement
- Measure off
- Time Spec On Off
- ACPR On Off
- Chanel Power On off
- OBW On Off
- Pass-Fail▶
- Window Meas▶
- Window Meas On Off
- Limit Line On Off
- Freq Line On Off
- Limit Set Up Low
- Freq Set Start Stop
- Window Sweep On Off
- Limit Meas▶
- Limit Meas On Off
- Line Up On Off
- Line Low On Off
- Offset X/Y
- Edit▶
- UpLine Edit ▶
- LowLine Edit
- Save Line
- LoadLine ▶
- Measure Setup
- Channel BW
- Channel Interval
- Channel Nums
- Power Percent
- System
- System▶
- System Info
- Firmware update
- Option▶
- Setting▶
- LAN▶
- Shutdown On Off
- Language▶
- Date/Time▶
- Power On/Preset▶
- File
- Type▶
- Quick Save
- Save
- Screen Pixmap▶
- Trace Data▶
- User State
- Limit Line
- QuickSaveSet▶
- F_AQ
- APPENDIX
- Specifications
- GSP-8000 Factory Default Settings
- Certificate Of Compliance
- GOOD WILL INSTRUMENT CO., LTD.
- GOODWILL INSTRUMENT CO., LTD.
- GOODWILL INSTRUMENT (SUZHOU) CO., LTD.
- GOODWILL INSTRUMENT EURO B.V.
Brand : GW Instek
Model : GSP-8180TG
Category : Measurement