Leader LV5600 - Measurement

LV5600 - Measurement Leader - Free user manual and instructions

Find the device manual for free LV5600 Leader in PDF.

📄 607 pages English EN Download 💬 AI Question 10 questions ⚙️ Specs
Notice Leader LV5600 - page 14
Pick your language and provide your email: we'll send you a specifically translated version.
Product TypeWaveform Monitor / Rasterizer
ModelLV5600 (built-in LCD), LV7600 (external monitor)
Display (LV5600)7-inch color TFT, 1920×1080, touch panel
Video Inputs4x BNC SDI (SD/HD/3G/12G with options), 2x SFP+ 10GbE IP (SER05)
Video Outputs4x BNC SDI (reclocked/TSG), 1x BNC SDI monitor, 1x HDMI monitor
Audio Inputs (SER03)Digital AES-3id (8 pairs), Analog balanced (8 channels)
Audio Outputs (SER03)Digital out (8 pairs), Analog out (8 channels), Headphone jack
Reference Input1 pair BNC, black burst / tri-level sync, passive loop-through
Control Interfaces2x USB 2.0, 1x Ethernet (10/100/1000), 1x Remote (15-pin D-sub), RS-422/485 (SER27)
Supported SDI FormatsSD, HD, 3G-A, 3G-B-DL/DS, 12G, dual/quad link 4K (with SER28/SER29)
IP Video Formats (SER05)SMPTE ST 2022-6, ST 2110-20, 2K/HD/SD, up to 4 channels per 10GbE
Measurement FunctionsWaveform, Vector, Picture, Audio, Status, Eye (SER02), Jitter, HDR (SER23), CIE Chromaticity, Focus Assist (SER25)
TSG Pattern Generator (SER24)Color bars, multiformat, flat field, moving box, embedded audio, up to 12G
Presets60 presets, load/save to USB
CaptureScreen capture (bitmap), Frame capture (SDI/IP, TIFF/DPX, 16 frames)
Power SupplyAC 90-240V, 50/60 Hz, auto-ranging
Dimensions (LV5600)3U half-rack, 300 mm depth
Dimensions (LV7600)1U full-rack, 300 mm depth
WeightApprox. 5 kg (LV5600), 4 kg (LV7600)
Hardware OptionsSER01 (SDI), SER02 (SDI+Eye), SER03 (Audio), SER05 (IP), etc.
Software OptionsSER23 (HDR), SER24 (TSG), SER25 (Focus), SER26 (Layout), SER27 (Tally), SER28 (4K), SER29 (12G)
AccessoriesRemote controller LV7290, rack mount adapters, SFP+ modules
Safety StandardsCE, WEEE compliant, safety summary in manual

Frequently Asked Questions - LV5600 Leader

What video formats does the LV5600 support?
The LV5600 supports SD-SDI, HD-SDI, 3G-SDI (Level A and B), and with optional SER28 and SER29 also supports 12G-SDI and 4K formats (dual/quad link). IP video (SMPTE ST 2022-6, ST 2110-20) is available with the SER05 option.
How do I connect an external monitor?
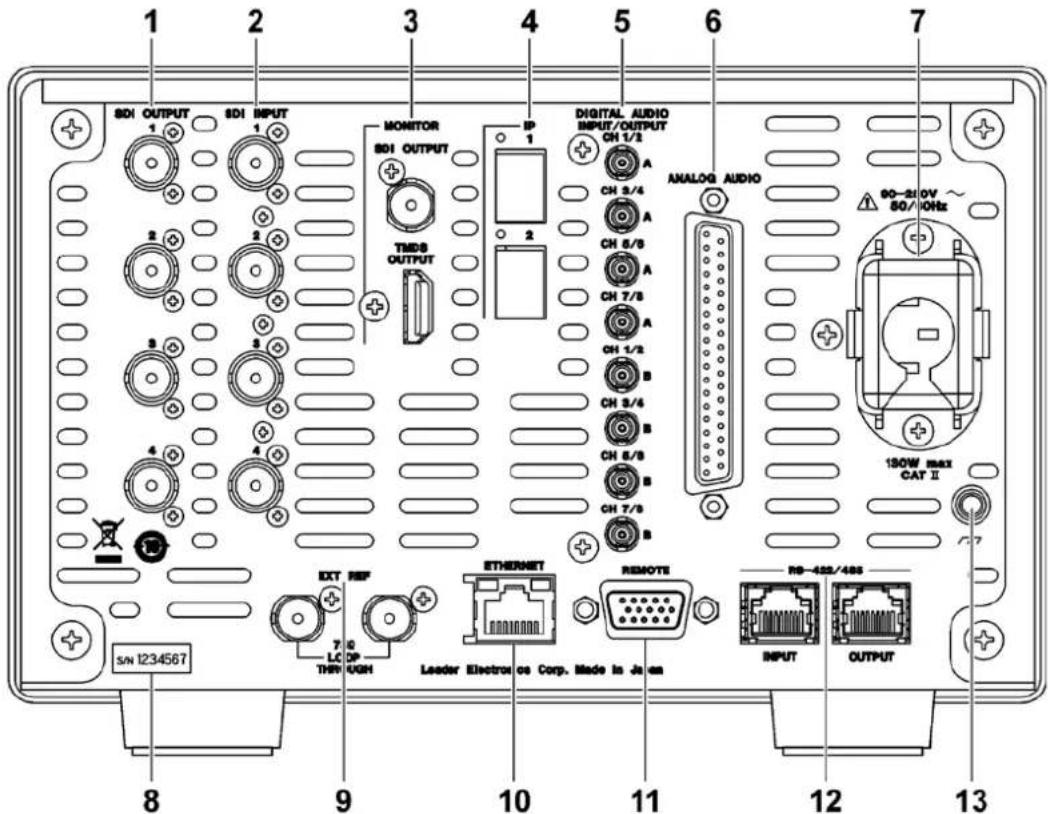
Use the MONITOR OUTPUT BNC connector (SDI) or the HDMI port (TMDS). The output resolution is 1920×1080. For touch control, connect a USB touch panel interface to the instrument's USB port.
Can I measure audio with the LV5600?
Yes, embedded audio from SDI/IP is supported. For external digital/analog audio I/O, you need the SER03 DIGI/ANA AUDIO option, which adds AES-3id and balanced analog connectors plus loudness measurement.
What is the difference between LV5600 and LV7600?
The LV5600 has a built-in 7-inch LCD touch screen. The LV7600 is a rasterizer (no screen) designed for use with an external monitor via SDI or HDMI output. Both share the same measurement capabilities and options.
How can I remotely control the instrument?
Remote control is possible via Ethernet using TELNET, FTP, SNMP, or a web browser (HTTP). You can also use the optional LV7290 remote controller or the REMOTE connector on the rear panel (contact closure).
What is the eye pattern option?
The SER02 SDI INPUT/EYE hardware option enables physical layer measurements: eye pattern and jitter display on SDI INPUT 1, supporting SD to 12G-SDI. It includes cursors and automatic measurements.
How do I install software options?
Contact your local LEADER agent with the instrument's MAC address and serial number to obtain a license key. Then go to SYS menu > LICENSE to enter the key. Each option requires a unique key per instrument.
Can I generate test patterns with the LV5600?
Yes, the SER24 TSG software option turns the reclocked SDI outputs into a signal generator. It supports HD to 12G patterns, including color bars, flat field, moving box, and embedded audio. For 4K patterns, SER28 is also needed.
How do I capture a waveform or frame?
Use the CAP menu. For screen capture, press CAP and select SCREEN CAPTURE. For frame capture (SDI or IP), select FRAME CAPTURE. Captured data can be saved to USB memory or displayed on screen.
What is the proper warm-up time?
For accurate measurements, allow approximately 30 minutes warm-up after power-on to stabilize internal temperature. This ensures reliable waveform and level accuracy.

User questions about LV5600 Leader

0 question about this device. Answer the ones you know or ask your own.

Ask a new question about this device

The email remains private: it is only used to notify you if someone responds to your question.

No questions yet. Be the first to ask one.

Download the instructions for your Measurement in PDF format for free! Find your manual LV5600 - Leader and take your electronic device back in hand. On this page are published all the documents necessary for the use of your device. LV5600 by Leader.

USER MANUAL LV5600 Leader

LV5600-SER03 / LV7600-SER03

LV5600-SER05 / LV7600-SER05

LV5600-SER23 / LV7600-SER23

LV5600-SER24 / LV7600-SER24

LV5600-SER25 / LV7600-SER25

LV5600-SER26 / LV7600-SER26

LV5600-SER27 / LV7600-SER27

LV5600-SER28 / LV7600-SER28

LV5600-SER29 / LV7600-SER29

SDI INPUT

SDI INPUT / EYE

DIGI / ANA AUDIO

10G IP INPUT

HDR

TSG

FOCUS ASSIST

LAYOUT

TALLY

4K

12G-SDI

Instruction Manual

Thank you for purchasing.

Please carefully read this instruction manual and the included "GENERAL SAFETY SUMMARY".

Please use the product safely.

TABLE OF CONTENTS

GENERAL SAFETY SUMMARY ...... I

1. INTRODUCTION.... 1

1.1 Scope of Warranty.... 1
1.2 Operating Precautions.... 1

1.2.1 Maximum Allowable Input Voltage 1
1.2.2 Mechanical Shock.... 2
1.2.3 Electrostatic Damage.... 2
1.2.4 Warming Up.... 2
1.2.5 About Standby Mode 2
1.2.6 Backup 2
1.2.7 About the LCD Panel (LV5600).... 2

1.3 About Trademarks and Licenses 3
1.4 Terminology Used in This Manual.... 3

2. PRODUCT CONFIGURATION.... 5

2.1 Lineup 5
2.2 Hardware Options 5
2.3 Software Options 6
2.4 Items Sold Separately....6

3. SPECIFICATIONS....7

3.1 General....7
3.2 Features 8
3.3 Specifications 12

3.3.1 SDI Video Formats and Standards (SER01/SER02/SER24/SER28/SER29)....12
3.3.2 IP Video Formats and Standards (SER05)....19
3.3.3 SDI Audio Formats and Standards (SER01/SER02/SER03) 19
3.3.4 IP Audio Formats and Standards (SER03/SER05)....19
3.3.5 External Digital I/O Audio Formats and Standards (SER03) 20
3.3.6 SDI Input Connector (SER01/SER02/SER24/SER28/SER29) 20
3.3.7 SDI Output Connector (SER01/SER02/SER24/SER28/SER29) 21
3.3.8 IP Input Connectors (SER05)....21
3.3.9 External Reference Input....22
3.3.10 External Audio Input/Output Connectors (SER03)....23
3.3.11 Monitor Output Connector 23
3.3.12 Headphone Output....24
3.3.13 Control Connectors....24
3.3.14 Front Panel 26
3.3.15 Capturing 27
3.3.16 TSG (SER24/SER28/SER29) 28
3.3.17 Presets....31

3.3.18 Display 32

3.3.19 Video Signal Waveform Display 34

3.3.20 Vector Display 36

3.3.21 Picture Screen 37

3.3.22 Superimpose Display 38

3.3.23 CINELITE Display....39

3.3.24 CINELITE Advanced Display....40

3.3.25 CINEZONE Display 40

3.3.26 Focus Assist (SER25)....41

3.3.27 CIE Chromaticity Diagram Display 41

3.3.28 HDR Display (SER23) 42

3.3.29 Audio Display 42

3.3.30 Status Display 46

3.3.31 Eye Pattern (SER02)....52

3.3.32 Jitter Display (SER02)....54

3.3.33 Tally Display....55

3.3.34 Camera ID Display 55

3.3.35 General Specifications....56

4. PANEL DESCRIPTION....57

4.1 Front Panel....57

4.2 Rear Panel....61

5. BEFORE YOU BEGIN MEASURING....64

5.1 Attaching the Cover Inlet Stopper....64

5.2 Turning the Instrument On and Off 65

5.3 Connecting USB Devices....65

5.4 Installing the SFP+ Transceiver Module (SER05)....66

5.5 Signal I/O 67

5.5.1 SDI Signal I/O 67

5.5.2 IP Signal Input (SER05)....69

5.5.3 External Sync Signal Input 70

5.5.4 Digital Audio I/O (SER03)....74

5.5.5 Analog Audio Signal I/O (SER03)....75

5.5.6 Monitor Signal Output....76

5.6 Operation Basics 77

5.6.1 Displaying the Function Menu 77

5.6.2 Function Menu Operations....77

5.6.3 Mouse and Touch Panel Control....78

5.6.4 Tab Menu Operations....80

5.6.5 Setting the Key Lock....81

5.7 Measurement Screen Description....82

6. BASIC OPERATION....84

6.1 Setting the Input Signals....84

6.1.1 Selecting the Input Mode 84

6.1.2 Selecting the Simul Mode 85
6.1.3 Selecting the Displayed Channel....86
6.1.4 Input Format Error Indication 87

6.2 Setting the Signals to Measure 88

6.2.1 SD, HD, 3G-A, and 3G-B-DL Measurement .....88
6.2.2 Measuring HD(DL) Signals....90
6.2.3 Measuring 3G(DL)-2K Signals 92
6.2.4 Measuring 3G-B-DS Signals....94
6.2.5 Measuring 12G Signals (SER29) 96
6.2.6 Measuring 3G(QL) Signals (SER28)....98
6.2.7 Measuring 3G(DL)-4K Signals (SER28)....100
6.2.8 Measuring HD(QL) Signals (SER28) 102
6.2.9 IP Measurement (SER05)....104

6.3 Selecting the Measurement Mode 107

6.3.1 Video Signal Waveform Display 107
6.3.2 Vector Display 107
6.3.3 Picture Screen 108
6.3.4 Audio Display 108
6.3.5 Status Display 109
6.3.6 Eye Pattern Display (SER02)....109
6.3.7 Multi Display 110

6.4 Operation Key Actions....114

6.5 Customized Layout (SER26) 116

6.5.1 Notes 116
6.5.2 Layout Procedure....117
6.5.3 Layout Screen Description....120

6.6 Enhanced Layout (SER26) 132

6.6.1 Enhanced Layout Procedure 133
6.6.2 Enhanced Layout Screen Description....137

7. SYSTEM SETTINGS....143

7.1 Configuring the I/O Connectors....143

7.1.1 Configuring the Input System 143
7.1.2 Input Signal Assignment 144
7.1.3 Setting the Input Format....146
7.1.4 Setting the Payload ID 147
7.1.5 Setting the Format Alarm....150
7.1.6 Configuring the SDI Output Connectors....152
7.1.7 Configuring the TSG Settings (SER24)....153
7.1.8 Configuring the Monitor Output Connectors 158
7.1.9 Configuring the HDR Settings (SER23) 159
7.1.10 Configuring the IP Signal Settings (SER05) 161
7.1.11 Configuring the PTP Settings (SER05)....162
7.1.12 Setting the Video Format (SER05)....163

7.2 Configuring the Instrument 164

7.2.1 General Settings 164
7.2.2 Configuring the Function Menu....165

7.2.3 Configuring the On-screen Menu 166
7.2.4 Configuring the Capture Feature 167
7.2.5 Configuring the Information Display....169
7.2.6 Setting the Network IP 171
7.2.7 Configuring SNTP....172
7.2.8 Configuring the Server.... 173
7.2.9 Configuring SNMP 174
7.2.10 Configuring the IP Settings (SER05) 176
7.2.11 Configuring the Remote Control Settings....177
7.2.12 Configuring the RS-422/485 Settings (SER27) 179
7.2.13 Setting the Camera ID (SER27) 180
7.2.14 Configuring the Tally Display (SER27) 182
7.2.15 Setting the Operation keys.... 184
7.2.16 Date and time settings.... 186
7.2.17 Configuring the LV7290 187

7.3 Displaying System Information....189
7.4 Installing Software Options....190
7.5 Adjusting the Backlight (LV5600) 191
7.6 Turning Off the LCD Panel (LV5600)....191
7.7 Initialization 192

7.7.1 Initializing Settings.... 192
7.7.2 Initializing the Layout 193
7.7.3 Initializing the Operation keys....193
7.7.4 Initializing the Settings and Layout 193

8. CAPTURE FEATURE....194

8.1 Screen Capture.... 195

8.1.1 Capturing the Displayed Screen.... 195
8.1.2 Displaying Screen Capture Data 195
8.1.3 Saving to a USB Memory Device 196
8.1.4 Displaying Screen Capture Data from a USB Memory Device 198
8.1.5 Deleting Screen Capture Data from a USB Memory Device.... 198

8.2 Frame Capture....200

8.2.1 Capturing Frame Data 200
8.2.2 Displaying Frame Capture Data 202
8.2.3 Saving to a USB Memory Device 203
8.2.4 Displaying Frame Data from a USB Memory Device....204
8.2.5 Deleting Frame Capture Data from a USB Memory Device.... 204

9. PRESET FEATURE....205

9.1 Registering Presets....205
9.2 Loading Presets 207
9.3 Deleting Presets....208
9.4 Copying All Presets from the instrument to a USB Memory Device....209
9.5 Copying All Presets from a USB Memory Device to the instrument....210

10. VIDEO SIGNAL WAVEFORM DISPLAY 211

10.1 Operation Key Description 211

10.2 Setting the Waveform Display Position....212

10.3 Configuring the Display Settings 213

10.3.1 Selecting the Display Mode....213

10.3.2 Turning the Channels On and Off....214

10.3.3 4Y Parade Display 215

10.3.4 Configuring the 3G-B-DS Display....215

10.3.5 Adjusting the Waveform Intensity 215

10.3.6 Selecting the Waveform Color 216

10.3.7 Adjusting the Scale Intensity 216

10.3.8 Selecting the Scale Color 216

10.3.9 Selecting the Scale Unit 217

10.3.10 Displaying a Scale for 75% Color Bars....219

10.3.11 Displaying the Scale 219

10.4 Configuring the Gain and Filter Settings....221

10.4.1 Setting the Variable Gain....221

10.4.2 Selecting the Fixed Gain....221

10.4.3 Selecting the Filter 222

10.4.4 Setting the Scale Jump 225

10.5 Configuring the Sweep Settings....227

10.5.1 Selecting the Sweep Method 227

10.5.2 Selecting the Line Display Format....228

10.5.3 Selecting the Field Display Format 229

10.5.4 Selecting the Horizontal Magnification 230

10.5.5 Displaying the Blanking Interval 233

10.6 Configuring the Cursor Settings....234

10.6.1 Turning Cursors On and Off 234

10.6.2 Selecting the Cursor 234

10.6.3 Selecting the Y-Axis Measurement Unit 235

10.6.4 Selecting the X-Axis Measurement Unit 236

10.6.5 Moving the Cursors 236

10.6.6 Turning the Cursor Value Display On and Off 236

10.7 Configuring the Line Selection Settings....238

10.7.1 Turning Line Selection On and Off 238

10.7.2 Setting the Line Selection Range 239

10.8 Configuring the Color System Settings....240

10.8.1 Selecting the Color Matrix 240

10.8.2 Turning the Luminance Signal On and Off 242

10.8.3 Selecting the Composite Display Format....242

10.8.4 Selecting the Setup Level 243

10.9 Displaying the External Sync Signal Waveform....244

10.9.1 Adjusting the Waveform Intensity 244

10.9.2 Selecting the Waveform Color 244

10.9.3 Adjusting the Scale Intensity 244

10.9.4 Selecting the Scale Color....245

10.9.5 Selecting the Scale Unit 245

10.9.6 Displaying the Scale 245

11. VECTOR DISPLAY....246

11.1 Operation Key Description 247
11.2 Setting the Display and Waveform Intensity 247

11.2.1 Switching the Display Mode 247
11.2.2 Adjusting the Waveform Intensity 248
11.2.3 Selecting the Waveform Color.... 248
11.2.4 Configuring the 3G-B-DS Display....249

11.3 Setting the Scale....250

11.3.1 Adjusting the Scale Intensity 250
11.3.2 Selecting the Scale Color....250
11.3.3 Turning the I and Q Axes On and Off 251
11.3.4 Selecting the Scale 252

11.4 Setting the Gain 253

11.4.1 Setting the Variable Gain....253
11.4.2 Selecting the Fixed Gain....253

11.5 Displaying the Marker 254

11.6 Configuring the Line Selection Settings....255

11.6.1 Turning Line Selection On and Off 255
11.6.2 Setting the Line Selection Range 256

11.7 Configuring the Color System Settings....257

11.7.1 Selecting the Color Matrix 257
11.7.2 Displaying a Scale for 75% Color Bars....258
11.7.3 Selecting the Composite Display Format....259
11.7.4 Selecting the Setup Level 260

11.8 5-Bar Display....260

11.8.1 Selecting the Scale Unit 261
11.8.2 Selecting the Display Order 263

11.9 Histogram Display 264

11.9.1 Selecting the Display Format 264
11.9.2 Selecting the Measurement Signal 266

12. CIE CHROMATICITY DIAGRAM DISPLAY 267

12.1 Setting the Scale....267

12.1.1 Selecting the Color Scale.... 268
12.1.2 Selecting the Triangle 269
12.1.3 Setting the User-defined Triangle 270
12.1.4 Turning the Sub Scale On and Off 271

12.2 Setting the Chromaticity Diagram Mode....272

12.2.1 Selecting the Display Mode....272
12.2.2 Selecting the Display Standard....272
12.2.3 Turning Clipping On and Off 273
12.2.4 Turning the Filter On and Off 273
12.2.5 Setting the Gamma Value....273

12.3 Displaying Cursors.... 274

12.4 Configuring the Line Selection Settings....274

13. PICTURE SCREEN....275

13.1 Selecting the Display Mode 276
13.2 Adjusting the Picture 277

13.2.1 Switching between the Color and Monochrome Displays 277
13.2.2 Setting the Chroma Gain....277
13.2.3 Adjusting the Brightness 277
13.2.4 Adjusting the Contrast.... 277
13.2.5 Adjusting the Gain 278
13.2.6 Adjusting the Bias....278

13.3 Configuring the Display Settings....279

13.3.1 Displaying Gamut Errors 279
13.3.2 Turning the Information On and Off 280
13.3.3 Configuring the 3G-B-DS Display....281

13.4 Configuring the Marker Settings 282

13.4.1 Turning the Frame Marker On and Off 282
13.4.2 Turning the Center Marker On and Off.... 282
13.4.3 Setting the Aspect Marker 283
13.4.4 Setting the Aspect Shadow....285
13.4.5 Setting the Safe Action Marker 286
13.4.6 Setting the Safe Title Marker 286
13.4.7 Setting User Markers 287

13.5 Setting the Superimpose Feature....288

13.5.1 Selecting the Closed Caption Display 288
13.5.2 Selecting the Format of English Closed Captions 288
13.5.3 Selecting the Display Details of English Closed Captions....288
13.5.4 Selecting the Format of Japanese Closed Captions 289
13.5.5 Selecting the Japanese Closed Caption Data 289
13.5.6 Displaying the Clear Screen Log 290
13.5.7 Clearing Japanese Closed Caption Data 295
13.5.8 Selecting the Multiplex System for European Closed Captions 296
13.5.9 Selecting the Magazine Number and Page Number for European Closed Captions.....296

13.6 Configuring CINELITE Settings 297

13.6.1 f Stop Display Description 298
13.6.2 Procedure for Displaying the f Stop Display....299
13.6.3 %DISPLAY Screen Description 300
13.6.4 Selecting the Points to Display 302
13.6.5 Setting Measurement Points 302
13.6.6 Setting the Measurement Size.... 302
13.6.7 Configuring User-Defined Correction Tables 303
13.6.8 Displaying Link Markers 308

13.7 Configuring CINEZONE Settings.... 309

13.7.1 Gradation Display....309
13.7.2 Step Display Mode 310
13.7.3 Search Display Mode 312

13.8 Focus Assist Display (SER25) 313

13.8.1 Selecting the Display Mode....313
13.8.2 Turning Focus Assist On and Off 313
13.8.3 Selecting the Detection Sensitivity 314
13.8.4 Selecting the Luminance Level 314
13.8.5 Selecting the Highlight Color 314

13.9 Configuring the Line Selection Settings....315

13.9.1 Turning Line Selection On and Off 315
13.9.2 Setting the Line Selection Range 316
13.9.3 Setting the Lip Sync Measurement Range (SER03)....316

  1. HDR DISPLAY (SER23)....317

14.1 Video Signal Waveform Display 318

14.1.1 Scale Display 318
14.1.2 Selecting the Scale Display 322
14.1.3 Setting the Reference Level 323
14.1.4 Cursor Display 324

14.2 Vector Display....325

14.2.1 Histogram Display 325

14.3 Picture Screen 326

14.3.1 CINELITE and CINEZONE Displays.... 326
14.3.2 %DISPLAY 327
14.3.3 CINEZONE Display 328
14.3.4 Link Marker Display 329

14.4 MAXFALL and MAXCLL Displays 330

14.4.1 Turning the Display On and Off 330
14.4.2 Starting and Stopping Measurements....330
14.4.3 Clearing Measurements....331

  1. AUDIO DISPLAY 332

15.1 Setting the Signals to Measure 333

15.1.1 Selecting the Measurement Signal 333
15.1.2 Channel Assignment for the Lissajous Display (SER03)....334
15.1.3 Channel Assignment for the Surround Display (SER03)....335
15.1.4 Configuring Audio Input/Output Connectors (SER03) 335
15.1.5 Channel Assignment for the Analog Audio Output Connector (SER03)....336

15.2 Selecting the Display Mode (SER03)....337
15.3 Configuring Error Detection Settings 340
15.4 Adjusting the Volume....341
15.5 Meter Display 342

15.5.1 Selecting the Scale....342
15.5.2 Selecting the Response Model 343
15.5.3 Setting the Peak Hold 343
15.5.4 Setting the Reference Level 344

15.6 Lissajous Display (SER03) 345

15.6.1 Adjusting the Lissajous Curve Intensity 345
15.6.2 Adjusting the Scale Intensity 345

15.6.3 Selecting the Lissajous Curve Display Format.... 346
15.6.4 Selecting the Scale Display Format 347
15.6.5 Setting the Lissajous Curve Gain 348

15.7 Surround Display (SER03) 348

15.7.1 Adjusting the Surround Waveform Intensity....349
15.7.2 Adjusting the Scale Intensity 349
15.7.3 Selecting the Surround Display Format.... 350
15.7.4 Setting the Surround Waveform Gain 350

15.8 Status Display (SER03) 351

15.8.1 Status Screen Description 351
15.8.2 Event Log Display 352
15.8.3 Channel Status Display 353
15.8.4 Displaying User Bits....354
15.8.5 Resetting Errors....354

15.9 Loudness Display (SER03) 355

15.9.1 Loudness Display Explanation 355
15.9.2 Selecting the Measurement Time....358
15.9.3 Clearing the Loudness Measurement....358
15.9.4 Starting and Stopping Measurements.... 358
15.9.5 Selecting the Scale 358
15.9.6 Configuring Loudness Settings 359
15.9.7 Saving to a USB Memory Device 364

16. STATUS DISPLAY....367

16.1 Status Screen Description....367
16.2 Configuring Error Detection Settings 372

16.2.1 Error Setup 1 372
16.2.2 Error Setup 2 374
16.2.3 Error Setup 3 376
16.2.4 Error Setup 4 378

16.3 Clearing Error Counts....381

16.4 Configuring Event Log Settings....381

16.4.1 Event Log Screen Description 381
16.4.2 Starting the Event Log....385
16.4.3 Clearing the Event Log....385
16.4.4 Selecting the Overwrite Mode 385
16.4.5 Saving to a USB Memory Device 386

16.5 Configuring the Data Dump Settings 388

16.5.1 Data Dump Display Description 389
16.5.2 Moving the Display Position 390
16.5.3 Selecting the Adjustment Step Resolution.... 391
16.5.4 Selecting What the Function Dial Controls....391
16.5.5 Selecting the Display Mode....391
16.5.6 Selecting the Display Format 392
16.5.7 Selecting the Content to Display....394
16.5.8 Saving to a USB Memory Device 394

16.6 Configuring Phase Difference Measurement Settings 395

16.6.1 Phase Difference Measurement Screen Description 396

16.7 Setting the Lip Sync Measurement (SER03) 399

16.7.1 Selecting the Measurement Range....400

16.7.2 Updating the Measurement Screen 400

16.7.3 Setting the Measurement Range 401

16.8 Configuring the IP Screen (SER05) 404

16.8.1 Displaying the IP Status Screen....404

16.8.2 Configuring the IP Status Screen 406

16.8.3 Displaying the Packet Jitter Screen 407

16.8.4 Configuring the Packet Jitter Screen....408

16.8.5 Displaying the PTP Status Screen 409

16.8.6 Configuring the PTP Status Screen 411

16.9 Displaying a List of Ancillary Data 412

16.9.1 Ancillary Data Display Description....412

16.9.2 Displaying a Dump of Ancillary Data 413

16.9.3 Updating the Dump Display 413

16.9.4 Selecting the Dump Mode 414

16.10 Detecting Ancillary Packets 415

16.10.1 Ancillary Packet Screen Description....415

16.10.2 Displaying EDH Packets....417

16.10.3 Displaying Payload IDs....417

16.10.4 Displaying Audio Control Packets 418

16.10.5 V-ANC ARIB Display 419

16.10.6 Displaying Closed Caption Packets 419

16.10.7 Displaying the Inter-Stationary Control Signal 420

16.10.8 Displaying the Data Broadcast Trigger Signal 423

16.10.9 Displaying User Data 424

16.10.10 V-ANC SMPTE Display....425

16.10.11 Displaying AFD Packets 425

16.10.12 Performing Custom Searches 426

  1. EYE PATTERN DISPLAY (SER02)....428

17.1 Eye Pattern Display Description 430

17.2 Jitter Display Description 431

17.3 Setting the Waveform Display Position....432

17.4 Switching between Eye Pattern and Jitter 432

17.5 Setting the Intensity 433

17.5.1 Adjusting the Waveform Intensity 433

17.5.2 Adjusting the Scale Intensity 433

17.6 Selecting the Display Colors 434

17.6.1 Selecting the Waveform Color 434

17.6.2 Selecting the Scale Color....434

17.7 Configuring Error Detection Settings 435

17.7.1 Configuring 12G Error Settings....435

17.7.2 Configuring 3G Error Settings 437

17.7.3 Configuring HD Error Settings 439

17.7.4 Configuring SD Error Settings 441

17.8 Configuring Eye Pattern Display Settings....443

17.8.1 Adjusting the Gain 443

17.8.2 Selecting the Filter 443

17.8.3 Selecting the Sweep Time 444

17.8.4 Turning the Peak Hold On and Off 445

17.8.5 Clearing the Peak Hold.... 445

17.8.6 Turning Cursors On and Off 446

17.8.7 Selecting the Cursor 447

17.8.8 Selecting the X-Axis Measurement Unit 449

17.8.9 Selecting the Y-Axis Measurement Unit 449

17.8.10 Moving the Cursors 449

17.8.11 Resetting Cursors....450

17.8.12 Selecting the Display Mode 450

17.8.13 Selecting the 2-Screen Display Mode 450

17.9 Configuring the Jitter Display Settings 450

17.9.1 Selecting the Magnification....451

17.9.2 Selecting the Filter 451

17.9.3 Selecting the Sweep Time 451

17.9.4 Turning the Peak Hold On and Off....452

17.9.5 Clearing the Peak Hold....452

17.9.6 Turning Cursors On and Off 453

17.9.7 Selecting the Cursor 453

17.9.8 Selecting the X-Axis Measurement Unit 454

17.9.9 Selecting the Y-Axis Measurement Unit 454

17.9.10 Moving the Cursors 454

17.9.11 Resetting Cursors....455

17.9.12 Selecting the Display Mode 455

17.9.13 Selecting the 2-Screen Display Mode 455

18. REMOTE CONTROL....456

18.1 Bit Mode 457

18.2 Binary Mode 460

18.3 Command Mode 462

18.4 Tally Mode (SER27) 464

19. RS-422/485 (SER27) 466

19.1 Transmission Commands....468

19.1.1 Setting the Address....468

19.1.2 Setting Keywords and Parameters 469

19.1.3 Setting the Checksum....474

19.2 Response Messages 475

20. NETWORK CONTROL 476

20.1 SNTP Client Function 476

20.1.1 How to Use 476

20.1.2 Time Adjustment Value....477

20.2 TELNET 478

20.2.1 How to Use 478
20.2.2 How to Enter Commands 479
20.2.3 TELNET Commands....480

20.3 FTP 497

20.3.1 How to Use 497
20.3.2 How to Enter Commands 498
20.3.3 FTP Commands 498

20.4 HTTP 499

20.4.1 Operating Environment.... 499
20.4.2 Notes 499
20.4.3 How to Use 500
20.4.4 MEASUREMENT WITH DISPLAY....502
20.4.5 REMOTE CONTROL....503
20.4.6 EVENT LOG VIEWER....504

20.5 SNMP 505

20.5.1 SMI Definitions 505
20.5.2 How to Use 505
20.5.3 Standard MIBs....507
20.5.4 Enterprise MIB....511
20.5.5 Extended TRAP (Variable Binding List) 538

21. MENU TREE....548

21.1 INPUT Menu 548
21.2 SYS Menu 549
21.3 CAP Menu 553
21.4 MEM Menu 555
21.5 RECALL Menu 556
21.6 WFM Menu....557
21.7 VECT Menu 560
21.8 PIC Menu 565
21.9 AUDIO Menu 571
21.10 STATUS Menu 575
21.11 EYE Menu (SER02) 580
21.12 MULTI menu....582

22. FIRMWARE UPDATE HISTORY....583

GENERAL SAFETY SUMMARY

■ Read This before Using the Instrument

This instrument should only be used by persons with sufficient knowledge of electronics who thoroughly understand the contents of this manual.

This instrument is not designed or manufactured for households or ordinary consumers.

If unqualified personnel are to use the instrument, be sure the instrument is handled under the supervision of qualified personnel (those who have electrical knowledge). This is to prevent the possibility of personal injury or damage to the instrument.

■ Note about Reading This Manual

The contents of this manual contain specialized terminology and may be difficult to understand. If you have any questions about the contents of this manual, please contact your local LEADER agent.

■ Symbols and Terms

The following symbols and terms are used in this instruction manual and on the instrument to indicate important warnings and notes.

Leader LV5600 - GENERAL SAFETY SUMMARY - 1 This symbol appears in this instruction manual and on the instrument to indicate an area where improper handling could result in personal injury, damage to the instrument, or malfunction of the instrument or devices connected to it.When you encounter this symbol on the instrument, be sure to refer to the information in this instruction manual that corresponds to the area that the symbol marks.
Leader LV5600 - GENERAL SAFETY SUMMARY - 2 WARNING Ignoring the precautions that this term indicates could lead to death or serious injury.
Leader LV5600 - GENERAL SAFETY SUMMARY - 3____CAUTION Ignoring the precautions that this term indicates could lead to personal injury or damage to the instrument.

GENERAL SAFETY SUMMARY

Read the warnings and information below thoroughly to avoid death, personal injury, and damage and deterioration of the instrument.

Leader LV5600 - GENERAL SAFETY SUMMARY - 1

WARNING

■ Warnings Concerning the Case and Panels

Do not remove the instrument's case or panels for any reason. Touching the internal components of the instrument could lead to fire or electric shock.

Also, do not allow foreign materials, such as liquids, combustible matter, and metal, to enter the instrument. Turning the instrument on when such materials are inside it could lead to fire, electric shock, damage to the instrument, or some other accident.

■ Installation Environment

  • Operating Temperature Range
    Use this instrument in a 0 to 40 °C environment. Using the instrument with its vents blocked or in a high temperature environment could lead to fire.
    Drastic changes in temperature, such as might be caused by moving the instrument between two rooms with different temperatures, can damage the instrument by causing condensation to form within it. If there is a possibility that the instrument has condensation within it, wait for approximately 30 minutes before turning on the power.

- Operating Humidity Range

Use this instrument in an environment whose relative humidity is 85 % or less where there is no threat of condensation forming.

Also, do not operate this instrument with wet hands. Doing so could lead to electric shock or fire.

- Do Not Operate in an Explosive Atmosphere

Using this instrument in an environment where flammable gases, explosive gazes, or steam is emitted or stored could lead to an explosion or fire. Do not use the instrument in such an environment.

- Do Not Insert Foreign Materials

Do not insert foreign materials, such as metal and flammable objects, through the vents or allow liquid to enter the instrument. Such acts can lead to fire, electric shock, damage to the instrument, or some other accident.

■ If You Notice Something Wrong during Operation

If you notice smoke, fire, a strange smell, or something else that is wrong with the instrument while you are operating it, stop operation immediately. Failing to do so could lead to fire. Turn OFF the power switch, and remove the power cord from the outlet. After making sure that fire has not spread anywhere, contact your local LEADER agent.

GENERAL SAFETY SUMMARY

Leader LV5600 - GENERAL SAFETY SUMMARY - 1

WARNING

■ Warnings Concerning the Power Source

Do not use a power source with a voltage other than the rated power source voltage for the instrument. Doing so could lead to fire.

Confirm the voltage of the power source before you connect the power cord to it.

Only use a power source whose frequency is 50/60 Hz.

Use a power cord that is appropriate for the voltage of the power source. Also, use a power cord that meets the safety standards of the country that you are using it in.

Using a power cord that does not meet the standards could lead to fire. If the power cord is damaged, stop using it, and contact your local LEADER agent. Using a damaged power cord could lead to electrical shock or fire.

When removing the power cord from the power outlet, do not pull on the cord. Pull from the plug.

■ Warnings Concerning Grounding

The instrument has a ground terminal to protect the user and the instrument from electric shock. Ensure that the product is properly grounded for safe operation.

■ Warnings Concerning the Panel

Sections of the panel are made out of glass. If the glass breaks, the broken glass may lead to injury. Do not apply a strong shock to the panel, cut it with sharp metal, or damage it in any similar manner.

Leader LV5600 - GENERAL SAFETY SUMMARY - 2

CAUTION

■ Cautions Concerning the Input and Output Connectors

To avoid damaging the instrument, only apply signals to the input connectors that conform to the specifications in this instruction manual. Do not short or apply external voltage to the output connectors. Doing so could damage the instrument.

■ Cautions Concerning the Ethernet Port

When you are connecting the instrument to the communication provider's equipment, connect to the Ethernet port through a hub that is authorized for use in the country that you are using the instrument in.

GENERAL SAFETY SUMMARY

■ Calibration and Repairs

This instrument has been carefully examined at the factory to ensure that its performance is in accordance with the standards. However, because of factors such as parts wearing out over time, the performance of the instrument may degrade. To ensure stable performance, we recommend that you have the instrument calibrated regularly. Also, if the instrument malfunctions, repairs are necessary. For repairs and calibration, contact your local LEADER agent.

■ Routine Maintenance

When you clean the instrument, remove the power plug from the outlet.

Do not use thinner or benzene when you clean the instrument's case, panels, or knobs. Doing so could lead to paint chipping and the corrosion of plastic components. To clean the case, panels, and knobs, use a soft cloth with mild detergent, and wipe gently. While cleaning, make sure that foreign materials, such as water and detergent, do not enter the product. If liquid or a metal object enters into the instrument, fire or electric shock may result.

■ About the European WEEE Directive

Leader LV5600 - ■ About the European WEEE Directive - 1

Leader LV5600 - ■ About the European WEEE Directive - 2

This instrument and its accessories are subject to the European WEEE Directive. Follow the applicable regulations of your country or region when discarding this instrument or its accessories. Follow the EU Battery Directive when discarding the batteries that you removed from this instrument. (WEEE stands for Waste Electrical and Electronic Equipment.)

Follow the warnings and precautions that have been listed in this section to use the instrument correctly and safely. Precautions are also contained in various other sections of this instruction manual. To use the instrument correctly, be sure to follow those precautions as well.

If you have any questions or comments about this instruction manual, please contact your local LEADER agent.

1. INTRODUCTION

1. INTRODUCTION

Thank you for purchasing this LEADER instrument. To use this instrument safely, read this instruction manual thoroughly, and make sure that you know how to use the instrument properly.

If some point about the operation of this instrument is still unclear after you have read this instruction manual, refer to the contact information on the back cover of the manual to contact LEADER, or contact your local LEADER agent.

After you have finished reading this manual, keep it in a convenient place so that you can refer to it when necessary.

1.1 Scope of Warranty

This LEADER instrument has been manufactured under the strictest quality control guidelines.

LEADER shall not be obligated to furnish the following free services during the warranty period.

  1. Repair of malfunction or damages resulting from fire, natural calamity, or improper voltage applied by the user.
  2. Repair of a product that has been improperly repaired, adjusted, or modified by personnel other than a factory-trained LEADER representative.
  3. Repair of malfunctions or damages resulting from improper use.
  4. Repair of malfunctions caused by devices other than this instrument.
  5. Repair of malfunctions or damages without the presentation of a proof of purchase or receipt bill for the instrument.

This Warranty is valid only in Japan.

1.2 Operating Precautions

1.2.1 Maximum Allowable Input Voltage

Leader LV5600 - Maximum Allowable Input Voltage - 1

The maximum signal voltage that can be applied to the input connectors is indicated below. Do not apply excessive voltage to the connectors. Doing so may damage the device or lead to injury.

Table 1-1 Maximum allowable input voltage

Input ConnectorMaximum Allowable Voltage
Main unitEXT REF±5 V (DC + peak AC)
Main unitREMOTE0 to 5 VDC
SER01SDI INPUT±2 V (DC + peak AC)
SER02SDI INPUT±2 V (DC + peak AC)
SER03DIGITAL AUDIO INPUT±5 V (DC + peak AC)

1. INTRODUCTION

1.2.2 Mechanical Shock

This instrument contains sensitive components, so it may be damaged if it is dropped or otherwise exposed to a strong shock.

1.2.3 Electrostatic Damage

Electronic components can be damaged by static discharge. Static electricity can build up in the core wire of a coaxial cable. Before connecting a coaxial cable to an I/O connector of the instrument, short the core wire of the cable with the external conductor.

1.2.4 Warming Up

To ensure more accurate measurements, turn ON the instrument approximately 30 minutes before you intend to use it to allow its internal temperature to stabilize.

1.2.5 About Standby Mode

Even if you press the power switch to turn off this instrument, the instrument remains in standby mode as long as the power cord is connected to the outlet. In standby mode, some of the internal circuits operate and may generate heat. Unless necessary, keep the power cord disconnected from the outlet.

1.2.6 Backup

This instrument has a last-memory feature. When you turn the power on, the instrument starts with the panel settings that were in use the last time that it was turned off. If the backup battery is out of power, the message "The last memory feature is disabled." will appear, and this last-memory feature will no longer work.

To continually use the last-memory feature, we recommend that you replace the backup battery with a new one every five years after you purchase the instrument. You cannot replace the backup battery yourself. For details, contact your nearest LEADER agent.

1.2.7 About the LCD Panel (LV5600)

There may be a small number of pixels in the LCD panel that do not light or are always on. Note that this is not a malfunction.

The LCD panel supports a large number of video signals. SDI input signals are displayed asynchronously on the LCD. Therefore, images may appear to flicker on the waveform and picture displays.

In addition, the input SDI signal is temporarily stored in frame memory and is loaded by using the LCD display synchronization signal—which is not synchronized with the input SDI signal. Therefore, because frame skip—which skips over frames in the memory—and frame repeat—which reads the same frames of the memory twice—occur, the image may appear to flicker.

(An external sync signal can be used to synchronize the LCD to the input signal.)

1. INTRODUCTION

1.3 About Trademarks and Licenses

The company and product names in this document are trademarks or registered trademarks of their respective holders.

DynaFont is a registered trademark of DynaComware Taiwan Inc.

This product uses open source software under the GNU General Public License (http://www.gnu.org/copyleft/gpl.html).

If you need the source code covered by the GNU General Public License, CONTACT YOUR LOCAL LEADER AGENT.

[Notes]

  1. Leader does not provide warranty or support for the software covered by the GNU General Public License.
  2. Alteration and distribution of this program shall be performed under your responsibility.
  3. The expense of Leader distributing the software to you shall be borne by you.

1.4 Terminology Used in This Manual

  • SER**
    LV5600-SER** and LV7600-SER** are referred to as SER**.
  • Single Input Mode
    This refers to the mode in which on the INPUT menu, F•7 DISPLAY is set to SINGLE. It is a mode for measuring a single input signal.

  • Simul Mode
    This refers to the mode in which on the INPUT menu, F•7 DISPLAY is set to SIMUL. It is a mode for measuring multiple input signals simultaneously.

  • Multi-screen Display
    This refers to the mode in which the MULTI key is on.

  • Underlining (_)
    Underlined options indicate the default values.

1. INTRODUCTION

The following names are used for the input formats and link systems.

Multi link may be used as a collective term to refer to dual link and quad link.

Table 1-2 Input formats and link systems

NameDescriptionLink System
SDSD-SDISingle link
HDHD-SDISingle link
3G-A3G-SDI level ASingle link
3G-B-DL3G-SDI level B dual link mappingSingle link
3G-B-DS3G-SDI level B dual stream mappingSingle link
12G12G-SDI TYPE 1Single link
HD(DL)HD-SDI dual linkDual link
3G(DL)-2K3G-A, 3G-B-DL dual linkResolution 1920 (2048)×1080Dual link
3G(DL)-4K3G-B-DS dual linkResolution 3840 (4096)×2160Dual link
HD(QL)HD-SDI quad linkQuad link
3G(QL)3G-A, 3G-B-DL quad linkQuad link
3GCollective name for 3G links-
3G-BCollective name for 3G-B-DL and 3G-B-DS-
3G(DL)Collective name for 3G(DL)-2K, 3G(DL)-4K-
4KCollective name for 12G, 3G(QL), 3G(DL)-4K, HD(QL)-

2. Product Configuration

2. PRODUCT CONFIGURATION

2.1 Lineup

LV5600 WAVEFORM MONITOR

Built-in LCD

LV7600 RASTERIZER External monitor type

2.2 Hardware Options

This instrument operates as a measuring instrument by installing hardware options.

To replace or add hardware options, contact your local LEADER agent. You cannot install or uninstall units.

Table 2-1 Hardware options

Model NameLineupFunction
LV5600LV7600
SDI INPUTLV5600-SER01SD, HD, 3G SDI input (*1)
SDI INPUT/EYELV5600-SER02SD, HD, 3G SDI input and eye pattern display (*1)
DIGI/ANA AUDIOLV5600-SER03LV7600-SER03Digital/analog audio I/O and display
10G IP INPUTLV5600-SER05LV7600-SER05IP input (*1)

*1 The LV5600 requires the LV5600-SER01, LV5600-SER02, or LV5600-SER05 to be installed. The LV7600 requires the LV5600-SER01, LV5600-SER02, or LV7600-SER05 to be installed. The LV5600-SER01 and LV5600-SER02 cannot be installed in the instrument at the same time.

2. Product Configuration

2.3 Software Options

The following software options (sold separately) can be installed in the instrument.

If you want to obtain a software option, provide your local LEADER agent with the instrument's MAC address (see the LICENSE tab) and serial number (see the rear panel). We will issue a license key.

When you receive the license key, install the option by referring to section 7.4, "Installing Software Options." Each instrument requires a unique license key. You cannot use the same key for multiple instruments.

Table 2-2 Software options

Model NameLineupFunction
LV5600LV7600
HDRLV5600-SER23LV7600-SER23HDR measurement function
TSGLV5600-SER24LV7600-SER24SDI signal generation function (*1)
FOCUS ASSISTLV5600-SER25LV7600-SER25Focus assist display function
LAYOUTLV5600-SER26LV7600-SER26Customized layout, display assignment function
TALLYLV5600-SER27LV7600-SER27ID, iris, tally display function
4KLV5600-SER28LV7600-SER284K video signal support function
12G-SDILV5600-SER29LV7600-SER2912G-SDI support (*2)

*1 You need the LV5600-SER28 to output 4K patterns (other than 12G) on the LV5600-SER24. You need the LV7600-SER28 to output 4K patterns (other than 12G) on the LV7600-SER24.
*2 You need the LV5600-SER28 to install the LV5600-SER29 in the LV5600. You need the LV7600-SER28 to install the LV7600-SER29 in the LV7600.

2.4 Items Sold Separately

LV5600, LV7600

LV7290

Ethernet connection remote controller

LV5600

LR2560 Rack Mount Adapters

LC2565 Blank Panels

LV5600-SER05, LV7600-SER05

LC2144

SFP+ module for 10GbE multi-mode fibers 300 m

LC2145

SFP+ module for 10GbE single-mode fibers 10 km

3. SPECIFICATIONS

3. SPECIFICATIONS

3.1 General

The LV5600 WAVEFORM MONITOR and LV7600 RASTERIZER are integrated media measuring and monitoring devices that support various video signals and audio signals. A built-in LCD type and a rasterizer type for use with an external monitor are available, so you can choose the model appropriate for your installation location.

The LV5600 and LV7600 integrate waveform display technologies, measurement technologies, and monitoring technologies that Leader has accumulated over the years to provide both high functionality and superb operability.

In terms of video signals, these instruments support a variety of SDI signals up to 12G-SDI as well as video over IP. The video signal waveform display, vector display, picture display, and eye pattern display enable measurements and quality control of various video signals. The status display allows you to view various error statuses and system stability in the form of event logs and long-term charts.

In terms of audio signals, these instruments support digitally embedded audio signals in SDI or IP signals and digital/analog audio signals received from external sources. Level display, Lissajous display, status display, and so on are available.

In addition to the keys and knobs available on conventional models, these instruments can be controlled through a USB mouse, the touch panel (*1), and on the LV7600, a set of dedicated keys for frequently used camera adjustment menus.

Moreover, a rich lineup of options is available in addition to these powerful functions and operability. Through the combination of these options, these instruments can be used in the measurement, monitoring, and evaluation of video and audio signals in a wide variety of applications including (1) broadcast station master monitoring applications for the integrated monitoring of video and audio signals, (2) monitoring applications for monitoring the quality of transmission signals, (3) studio sub and post production applications for controlling the video signal levels, and (4) broadcast equipment compliance applications for determining whether video and audio signals comply with appropriate standards.

*1 The LV7600 requires a touch-panel type external monitor to be connected to the main unit. The touch panel interface on the external monitor is connected to the LV7600's USB port. The video interface on the external monitor is connected to the LV7600's monitor output connector. LEADER does not guarantee that all touch panel type monitors will work with the LV7600.

3. SPECIFICATIONS

3.2 Features

- Support for a Variety of Signal Inputs

The abundant video signal input options enable measurement and monitoring of SDI signals and IP (video over IP) signals as well. In terms of audio signals, SDI embedded audio, IP embedded audio, and external AES/EBU and analog audio are supported. The supported audio format is L-PCM.

- Superb Operability

Operability was prioritized in the design of these instruments. You can use the best control interface according to your liking or situation. In addition to the conventional keys and knobs on the front panel, you can control the instrument remotely using a USB mouse. Further, the LV5600 has a 7-inch full-HD touch panel. The LV7600 can be connected to a USB touch panel interface of a touch-panel monitor. These interfaces allow intuitive control and configuration through touch operation.

The LV7600 also has function menu operation keys that can be operated while viewing a remote display and an independent set of dedicated keys for frequently used camera adjustment operations.

These instruments can also be controlled remotely by connecting a dedicated remote controller (sold separately), controlled remotely from a Web browser on a PC over an Ethernet connection, and used to perform automatic measurements using TELNET or FTP.

- Compact

While providing high flexibility through various options and high functionality for various situations, the LV5600 is 3U half-rack size and the LV7600 1U full-rack size, each with 300 mm depth. A 90 V to 240 V AC power supply is employed, so you do not need to worry about where and how to install an AC adapter.

• 4K Video Format (SER28/SER29)

In addition to SD-SDI, HD-SDI, 3G-SDI single link, 12G-SDI single link, 3G-SDI dual link and quad link, and HD-SDI quad link are supported. These cover SDI signals from SD video format to HD video format and even 4K video format.

For the 4K video format, in the case of 12G-SDI single link input, up to four inputs can be displayed through switching. In the case of 3G-SDI dual link input, up to two inputs can be displayed through switching. In the case of 3G-SDI, HD-SDI, or SD-SDI single link input, up to four inputs can be displayed and monitored simultaneously.

• IP Video Format (SER05)

2K video format signals on IP signal SMPTE ST 2022-6 (uncompressed) and SMPTE ST 2110-20 (uncompressed) are supported. In the case of the 2K video format, up to four channels can be received through a single 10 Gbit Ethernet cable.

3. SPECIFICATIONS

• Transmission Quality Analysis Function

Signal analysis functions have been enhanced based on the SDI signal measurement technology that Leader has cultivated over the years. Other enhancements have been made to various transmission error monitoring, external sync phase difference display, lip sync measurement (SER03), SDI signal frequency deviation measurement function, equivalent cable length meter function, and the ancillary data analysis function, which has become more important with the introduction of 4K video signals.

For the IP signal measurement, enhanced transmission quality (QoS) monitoring features are available for detecting packet loss, checksum errors, discontinuous packets, and other transmission errors as well as packet jitters and other parameters that have become harder to detect as a result of IP encryption.

• Video Analysis Functions

Numerous types of displays are available for the various video signals such as the video signal waveform display, vector display, picture display, 5-bar display, and CIE chromaticity diagram display. In addition, quality control (QoE) functions for video signals are available including freeze error, black error, and gamut error detection functions. Detected errors can be recorded in event logs.

• Audio Analysis Functions (SER03)

For audio signals, level meter display is possible on audio signals embedded in SDI or IP signals and AES/EBU audio signals received from external sources.

The SER03 DIGI/ANA AUDIO option allows Lissajous display, surround display, loudness display and detection of mute and clip errors. Detected errors can be recorded in event logs.

- Eye Pattern Display (SER02/SER28/SER29) (*1)

Eye pattern display and jitter display, which are physical layer measurements of SDI signals from SD-SDI to 12G-SDI, are possible. These physical layer measurements can be performed using cursors or performed automatically. Measurements can be exported via a network.

- Closed Caption Decode Display Function

Japanese closed captions embedded in SDI signals, CEA-608 and CEA-708 closed captions, teletext, and OP47 subtitles can be decoded and displayed.

- External Sync Signal Input with Waveform Display Function

The phase difference and synchronization states of SDI or IP video signals can be shown graphically based on an external reference sync signal (black burst, tri-level sync). Further, the waveform of the applied external reference sync signal can be displayed, allowing early discovery of problems related to the sync signal.

Video signal waveforms, vector waveforms, picture, and other items of input video signals can be laid out freely in the sizes of your choice. It is possible to display up to four input signals simultaneously or display a single input signal in several displays. You can create other display layouts such as displaying a normal picture display of a single input signal next to an HDR CINEZONE display or display the waveforms of all lines simultaneously with a line selection waveform.

3. SPECIFICATIONS

• SDI Signal Generation Function (SER24)

The SDI signal reclock output connector also functions as a simple SDI signal generator. It supports HD-SDI to 12G-SDI as well as the 4K video format of 3G-SDI quad link. For the pattern, you can select the HD multiformat color bar, the 4K multiformat color bar, or the flat field pattern, which allows you to select any level. You can also overlay a moving box or insert embedded audio.

• External Monitor Output

The measurement screen can be output in SDI or TMDS from the monitor output connector. The output signal can be displayed on an external SDI or HDMI monitor (*2) in full high definition resolution.

- Capture Feature

A screen capture feature, which captures the entire display as still-image data, is available. Not only can be captured data be displayed on the instrument, but it can also be compared with an input signal or saved to a USB memory device as bitmap data for viewing on a PC.

A frame capture feature is also available. If an SDI Signal is being received, a frame including the blanking interval can be captured. If an IP signal is being received, a frame covering the active video period can be captured. You can set the frame capture function mode to manual or auto, which captures frames when errors occur. The frame capture data can be viewed and searched through on a PC using a frame capture viewer.

- Time Code Display

The timecodes embedded in SDI or IP signals can be displayed. The timecode can also be used as the timestamp in the event log.

• External Remote Connector

A contact terminal can be used to load presets, switch the input signal, and transmit alarms.

- Ethernet Port

The following features become available when you connect the instrument to a PC: remote control through TELNET, file transfer through FTP, remote control and alarm generation through SNMP, remote control from a Web browser through HTTP, and internal clock synchronization through SNTP. Using the LV7290 REMOTE CONTROLLER (sold separately) allows up to eight LV5600s, or LV7600s to be remote controlled.

- HDR (SER23)

Level monitoring is possible on HLG and PQ defined in ITU-R BT.2100 as well as S-Log3-compatible HDR signals. Level control is possible based on the estimated brightness (nits, cd/m 2 ) of a display taking the OOTF into consideration. Video signal waveform display supports IRE scale as well as HDR scale. On CINEZONE display, the SDR area is displayed in monochrome, while the HDR area is displayed using colors corresponding to the brightness. This makes it easy to view the brightness distribution in the HDR area.

- Focus Assist (SER25)

A new focusing algorithm based on nonlinear super-resolution technology has been developed, allowing highly sensitive focusing even on low-contrast images that were difficult to be focused in on in the past. You can select the sensitivity according to the image scene.

3. SPECIFICATIONS

• RS-422/485 Connector (SER27)

You can recall presets, switch the display channel, and display the camera ID, iris, and tally by using serial communication.

*1 Only SDI INPUT 1 supports the eye pattern display.
*2 LEADER does not guarantee the operation on all HDMI monitors.

3.3 Specifications

3.3.1 SDI Video Formats and Standards (SER01/SER02/SER24/SER28/SER29)

Table 3-1 SD video signal formats and standards

Color SystemQuantizationImageField Frequency/ScanningCompliant Standard
YCBCR 4:2:210 bit720×48759.94 /ISMPTE ST 259
720×57650 /I

Table 3-2 HD video signal formats and standards

Color SystemQuantizationImageFrame (Field) Frequency/ScanningCompliant Standard
YCBCR 4:2:210 bit1280×72060/59.94/50/30/29.97/25/24/23.98 /PSMPTE ST 292-1SMPTE ST 296
1920×108060/59.94/50 /ISMPTE ST 274SMPTE ST 292-1
30/29.97/25/24/23.98 /P
30/29.97/25/24/23.98 /PsF

Table 3-3 3G-A video signal formats and standards

Color SystemQuantizationImageFrame (Field) Frequency/ScanningCompliant Standard
YCB CR 4:2:210 bit1920×108060/59.94/50 /PSMPTE ST 274SMPTE ST 425-1
48/47.95 /P-
2048×108060/59.94/50/48/47.95 /PSMPTE ST 425-1SMPTE ST 2048-2
12 bit 1920×108060/59.94/50 /ISMPTE ST 274SMPTE ST 425-1
30/29.97/25/24/23.98 /P
30/29.97/25/24/23.98 /PsF
2048×108030/29.97/25/24/23.98 /PSMPTE ST 425-1SMPTE ST 2048-2
30/29.97/25/24/23.98 /PsF
YCB CR 4:4:410 bit1280×72060/59.94/50/30/29.97/25/24/23.98 /PSMPTE ST 296SMPTE ST 425-1
1920×108060/59.94/50 /ISMPTE ST 274SMPTE ST 425-1
30/29.97/25/24/23.98 /P
30/29.97/25/24/23.98 /PsF
12 bit 1920×108060/59.94/50 /ISMPTE ST 274SMPTE ST 425-1
30/29.97/25/24/23.98 /P
2048×108030/29.97/25/24/23.98 /PSMPTE ST 425-1SMPTE ST 2048-2
30/29.97/25/24/23.98 /PsF
RGB 4:4:410 bit1280×72060/59.94/50/30/29.97/25/24/23.98 /PSMPTE ST 296SMPTE ST 425-1
1920×108060/59.94/50/ ISMPTE ST 274SMPTE ST 425-1
30/29.97/25/24/23.98 /P
30/29.97/25/24/23.98 /PsF
2048×108030/29. 97/25/24/23.98 /PSMPTE ST 425-1SMPTE ST 2048-2
30/29.97/25/24/23.98 /PsF
  1. SPECIFICATIONS
Color SystemQuantizationImageFrame (Field) Frequency/ScanningCompliant Standard
12 bit 1920×108060/59.94/50 /ISMPTE ST 274SMPTE ST 425-1
30/29.97/25/24/23.98 /P
2048×108030/29.97/25/24/23.98 /PSMPTE ST 425-1SMPTE ST 2048-2
30/29.97/25/24/23.98 /PsF
30/25/24 /PsF
XYZ 4:4:412bit2048×108030/25/24 /PSMPTE ST 425-1SMPTE ST 428
30/25/24 /PsF

Table 3-4 3G-B-DL, HD(DL) Video Signal Formats and Standards

Color SystemQuantizationImageFrame (Field) Frequency/ScanningCompliant Standard
YCB CR 4:2:210 bit1920×108060/59.94/50 /PSMPTE ST 274SMPTE ST 372SMPTE ST 425-1
48/47.95 /P-
2048×108060/59.94/50/48/47.95 /PSMPTE ST 372SMPTE ST 425-1SMPTE ST 2048-2
12 bit 1920×108060/59.94/50 /ISMPTE ST 274SMPTE ST 372SMPTE ST 425-1
30/29.97/25/24/23.98 /P
30/29.97/25/24/23.98 /PsF
2048×108030/29.97/25/24/23.98 /PSMPTE ST 372SMPTE ST 425-1SMPTE ST 2048-2
30/29.97/25/24/23.98 /PsF
YCB CR 4:4:410 bit1920×108060/59.94/50 /ISMPTE ST 274SMPTE ST 372SMPTE ST 425-1
30/29.97/25/24/23.98 /P
30/29.97/25/24/23.9B /PsF
2048×108030/29.97/25/24/23.98 /PSMPTE ST 372SMPTE ST 425-1SMPTE ST 2048-2
30/29.97/25/24/23.98 /Ps
12 bit 1920×108060/59.94/50 /ISMPTE ST 274SMPTE ST 372SMPTE ST 425-1
30/29.97/25/24/23.98 /P
30/29,97/25/24/23.98 /PsF
2048×108030/29.97/25/24/23.98 /PSMPTE ST 372SMPTE ST 425-1SMPTE ST 2048-2
30/29.97(25/24/23.98 /PsF
  1. SPECIFICATIONS
Color SystemQuantizationImageFrame (Field) Frequency/ScanningCompliant Standard
RGB 4:4:410 bit1920×108060/59.94/50 /ISMPTE ST 274
30/29.97/25/24/23.98 /PSMPTE ST 372
30/29.97/25/24/23.98 /PsFSMPTE ST 425-1
2048×108030/29.97/25/24/23.98 /PSMPTE ST 372
30/29.97/25/24/23.98 /PsFSMPTE ST 425-1
SMPTE ST 2048-2
12 bit 1920×108060/59.94/50 /ISMPTE ST 274
30/29.97/25/24/23.98 /PSMPTE ST 372
30/29.97/25/24/23.98 /PsFSMPTE ST 2048-2
2048×108030/29.97/25/24/23.98 /PSMPTE ST 372
30/29.97/25/24/23.98 /PsFSMPTE ST 425-1
SMPTE ST 248-2
XYZ 4:4:412bit2048×108030/25/24 /PSMPTE ST 372
30/25/24 /PsFSMPTE ST 425-1
SMPTE ST 428

* When these signals are displayed, phase differences of up to 100 clocks (approx. 1.34 μs) between HD(DL) links are automatically corrected.

Table 3-5 3G-B-DS video signal formats and standards

Color SystemQuantizationImageFrame (Field) Frequency/ScanningCompliant Standard
YCBCR 4:2:210 bit1920×108060/59.94/50 /ISMPTE ST 274SMPTE ST 425-1
30/29.97/25/24/23.98 /P
30/29.97/25/24/23.98 /PsF
1280×72060/59.94/50/30/29.97/25/24/23.98 /PSMPTE ST 296SMPTE ST 425-1

Table 3-6 3G(DL)-2K Video Signal Formats and Standards

Color SystemQuantizationImageFrame (Field) Frequency/ScanningCompliant Standard
YCBCR 4:2:212 bit1920×108060/59.94/50 /PSMPTE ST 274SMPTE ST 425-3
48/47.95 /P-
2048×108060/59.94/50/48/47.95 /PSMPTE ST 2048-2SMPTE ST 425-3
YCBCR 4:4:410 bit1920×108060/59.94/50 /PSMPTE ST 274SMPTE ST 425-3
2048×108060/59.94/50/48/47.95 /PSMPTE ST 2048-2SMPTE ST 425-3
12 bit1920×108060/59.94/50 /PSMPTE ST 274SMPTE ST 425-3
2048×108060/59.94/50/48/47.95 /PSMPTE ST 2048-2SMPTE ST 4 25-3
  1. SPECIFICATIONS
Color SystemQuantizationImageFrame (Field) Frequency/ScanningCompliant Standard
RGB 4:4:410 bit1920×108060/59.94/50 /PSMPTE ST 274SMPTE ST 425-3
2048×108060/59.94/50/48/47.95 /PSMPTE ST 2048-2SMPTE ST 425-3
12 bit1920×108060/59.94/50 /PSMPTE ST 274SMPTE ST 425-3
2048×108060/59.94/50/48/47.95 /PSMPTE ST 2048-2SMPTE ST 4 25-3

* When these signals are displayed, phase differences of up to 100 clocks (approx. 0.67 μs) between links are automatically corrected.

* 3G-A and 3G-B-DL links are supported.

Table 3-7 3G(DL)-4K Video Signal Formats and Standards

Division Transmission SystemColor SystemQuantizationImageFrame Frequency/ScanningCompliant Standard
Square YC BCR 4:2:210 bit3840×216030/29.97/25/24/23.98 /PSMPTE ST 425-3SMPTE ST 2036-1
30/29.97/25/24/23.98 /PsF-
4096×216030/29.97/25/24/23.98 /PSMPTE ST 425-3SMPTE ST 2048-1
30/29.97/25/24/23.98 /PsF-
2 sample interleave YCBCR 4:2:210 bit3840×216030/29.97/25/24/23.98 /PSMPTE ST 425-3SMPTE ST 2036-1
4096×216030/29.97/25/24/23.98 /PSMPTE ST 425-3SMPTE ST 2048-1

* You also need the SER28.

* When these signals are displayed, phase differences of up to 100 clocks (approx. 0.67 μs) between links are automatically corrected.

* 3G-B-DS links are supported.

Table 3-8 HD(QL) video signal formats and standards

Division Transmission SystemColor SystemQuantizationImageFrame Frequency/ScanningCompliant Standard
Square YC B CR 4:2:210 bit3840×216030/29.97/25/24/23.98 /P-
30/29.97/25/24/23.98 /PsF-
4096×216030/29.97/25/24/23.98 /P-
30/29.97/25/24/23.98 /PsF-

* You also need the SER28.

* When these signals are displayed, phase differences of up to 100 clocks (approx. 0.67 μs) between links are automatically corrected.

3. SPECIFICATIONS

Table 3-9 3G(QL) video signal formats and standards

Division Transmission SystemColor SystemQuantizationImageFrame Frequency/ScanningCompliant Standard
Square YC BCR 4:2:210 bit3840×216060/59.94/50 /PSMPTE ST 425-5 SMPTE ST 2036-1
48/47.95 /P-
4096×216060/59.94/50/48/47.95 /PSMPTE ST 425-5 SMPTE ST 2048-1
12 bit3840×216030/29.97/25/24/23.98 /PSMPTE ST 425-5 SMPTE ST 2036-1
30/29.97/25/24/23.98 /PsF-
4096×216030/29.97/25/24/23.98 /PSMPTE ST 425-5 SMPTE ST 2048-1
30/29.97/25/24/23.98 /PsF-
YCBR 4:4:410 bit3840×216030/29.97/25/24/23.98 /PSMPTE ST 425-5 SMPTE ST 2036-1
30/29.97/25/24/23.98 /PsF-
4096×206030/29.97/25/24/23.98 /PSMPTE ST 425-5 SMPTE ST 2048-1
30/29.97/25/24/23.98 /PsF-
12 bit3840×216030/29.97/25/24/23.98 /PSMPTE ST 425-5 SMPTE ST 2036-1
30/29.97/25/24/23.98 /PsF-
30/29.97/25/24/23.98 /PSMPTE ST 425-5 SMPTE ST 2048-1
30/29.97/25/24/23.98 /PsF-
RGB 4:4:410 bit3840×216030/29.97/25/24/23.98 /PSMPTE ST 425-5 SMPTE ST 2036-1
30/29.97/25/24/23.98 /PsF-
12 bit3840×216030/29.97/25/24/23.98 /PSMPTE ST 425-5 SMPTE ST 2036-1
30/29.97/25/24/23.98 /PsF-
4096×216030/29.97/25/24/23.98 /PSMPTE ST 425-5 SMPTE ST 2048-1
3O/29.97/25/24/23.98 /PsF-
30/29.97/25/24/23.98 /PsF-
XYZ 4:4:412bit4096×216030/25/24 /PSMPTE ST 425-5 SMPTE ST 428
30/25/24 /PsF-
  1. SPECIFICATIONS
Division Transmission SystemColor SystemQuantizationImageFrame Frequency/ScanningCompliant Standard
2 sample interleave YCB CR 4:2:210 bit3840×216060/59.94/50 /PSMPTE ST 425-5SMPTE ST 2036-1
48/47.95 /P-
4096×216060/59.94/50/48/47.95 /PSMPTE ST 425-5SMPTE ST 2048-1
12 bit3840×216030/29.97/25/24/23.98 /PSMPTE ST 425-5SMPTE ST 2036-1
4096×216030/29.97/25/24/23.98 /PSMPTE ST 425-5SMPTE ST 2048-1
YCB CR 4:4:410 bit3840×216030/29.97/25/24/23.98 /PSMPTE ST 425-5SMPTE ST 2036-1
4096×216030/29.97/25/24/23.98 /PSMPTE ST425-5SMPTE ST 2048-1
12 bit3840×216030/29.97/25/24/23.98 /PSMPTE ST 425-5SMPTE ST 2036-1
4096×216030/28.97/25/24/23.98 /PSMPTE ST 425-5SMPTE ST 2048-1
RGB 4:4:410 bit3840×216030/29.97/25/24/23.98 /PSMPTE ST 425-5SMPTE ST 2036-1
4096×216030/29.97/25/24/23. 98 /PSMPTE ST 425-5SMPTE ST 2048-1
12 bit3840×216030/29.97/25/24/23.98 /PSMPTE ST 425-5SMPTE ST 2036-1
4096×206030/29.97/25/24/23.98 /PSMPTE ST 425-5SMPTE ST 2048-1
XYZ 4:4:412bit4096×216030/25/24 /PSMPTE ST 425-5SMPTE ST 428

* You also need the SER28.
* When these signals are displayed, phase differences of up to 100 clocks (approx. 0.67 μs) between links are automatically corrected.
* 3G-A and 3G-B-DL links are supported.

3. SPECIFICATIONS

Table 3-10 12G video signal formats and standards

Division Transmission SystemColor SystemQuantizationImageFrame Frequency/ScanningCompliant Standard
2 sample interleave YCB CR 4:2:210 bit3840×216060/59.94/50 /PSMPTE ST 2036-1 SMPTE ST 2082-10
48/47.95/P-
4096×216060/59.94/50/48/47.95 /PSMPTE ST 2048-1 SMPTE ST 2082-10
12 bit3840×216030/29.97/25/24/23.98 /PSMPTE ST 2036-1 SMPTE ST 2082-10
4096×216030/29.97/25/24/23.98 /PSMPTE ST 2048-1 SMPTE ST 2082-10
YCB CR 4:4:410 bit3840×216030/29.97/25/24/23.98 /PSMPTE ST 2036-1 SMPTE ST 2082-10
4096×216030/29.97/25/24/23.98 /PSMPTEST 2048-1 SMPTE ST 2082-10
12 bit3840×216030/29.97/25/24/23.98 /PSMPTE ST 2036-1 SMPTE ST 2082-10
4096×21603O/29.97/25/24/23.98 /PSMPTE ST 2048-1 SMPTE ST 2082-10
RGB 4:4:410 bit3840×216030/29.97/25/24/23.98 /PSMPTE ST 2036-1 SMPTE ST 2082-10
4096×216030/29.97/25/24/23,98 /PSMPTE ST 2048-1 SMPTE ST 2082-10
12 bit3840×216030/29.97/25/24/23.98 /PSMPTE ST 2036-1 SMPTE ST 2082-10
4096x216030/29.97/25/24/23.98 /PSMPTE ST 2048-1 SMPTE ST 2082-10

* You also need the SER28 and SER29.

3. SPECIFICATIONS

3.3.2 IP Video Formats and Standards (SER05)

Supported IP Formats SMPTE ST 2022-6, SMPTE ST 2110-20

Redundant System Compliant Standard

SMPTE ST 2022-7

Synchronization Mode PTP (SMPTE ST 2059-1/2)

Supported Protocol IPv4 (Internet Protocol version 4)

IGMPv2/v3 (Internet Group Management Protocol)

Table 3-11 IP input signal formats

LinkCompressionColor SystemQuantizationImageFrame (Field) Frequency/Scanning
SD (*1)Uncompressed YCB CR 4:2:210bit720x48759.94 /I
720x57650 /I
HD Uncompressed YC B CR 4:2:210bit1920x108060/59.94/50 /I
1280x720 (*1)60/59.94/50 /P
3G-AUncompressed YCB CR 4:2:210bit1920x108060/59.94/50 /P

*1 Only SMPTE ST 2022 is supported.

3.3.3 SDI Audio Formats and Standards (SER01/SER02/SER03)

Compliant Standard

12G, 3G, HD, HD(DL) SMPTE ST 299

SD SMPTE ST 272

Sampling Frequency 48 kHz

Quantization 24 bit

Format L-PCM

Clock Generation Generated from the video clock

Synchronization Synchronized to the video signal

SDI Audio Channel Separation

Separates up to four groups (16 channels) from an SDI input.

3.3.4 IP Audio Formats and Standards (SER03/SER05)

Compliant Standard SMPTE ST 2022-6, SMPTE ST 2110-30, AMWA NMOS IS-04

Sampling frequency 48 kHz

Quantization 24 bit

Format L-PCM

Clock Generation System Generated from the video clock

Synchronization Relationship Synchronized to the video signal

IP Audio Channel Separation Up to four groups 16 channels

3. SPECIFICATIONS

3.3.5 External Digital I/O Audio Formats and Standards (SER03)

Compliant Standard AES-3id

Sampling Frequency 48 kHz

Quantization 24 bit

Format L-PCM

Output Signal Separates and outputs audio signals embedded in SDI or IP signals

(audio channel displayed on the screen)

3.3.6 SDI Input Connector (SER01/SER02/SER24/SER28/SER29)

SDI Input Connector

Connector Type BNC

Number of Input Connectors

4 (SDI INPUT 1 / 2 / 3 / 4)

Input Impedance 75Ω

Input Return Loss

5 MHz to 1.485 GHz -15 dB or more

1.485 to 2.970 GHz -10 dB or more

2.970 to 5.940 GHz -7 dB or more

5.940 to 11.880 GHz -4 dB or more

Maximum Input Voltage ±2 V (DC + peak AC)

Eye Pattern Display Eye pattern display is possible only on SDI INPUT 1.

3. SPECIFICATIONS

3.3.7 SDI Output Connector (SER01/SER02/SER24/SER28/SER29)

SDI Output Connector

Connector Type BNC

Number of Output Connectors

4 (SDI OUTPUT 1 / 2 / 3 / 4)

Output Impedance 75Ω

Output Return Loss

5 MHz to 1.485 GHz -15 dB or more

1.485 to 2.970 GHz -10 dB or more

2.970 to 5.940 GHz -7 dB or more

5.940 to 11.880 GHz -4 dB or more

Output Voltage 800 mVp-p ± 10 % (into 75 Ω)

Output Signal Reclocked signal of SDI input (*1), TSG output

Reclocked Signal Reclocks the SDI signals of SDI INPUT 1 to 4 and outputs them through SDI OUTPUT 1 to 4

Select Reclocked Signal SDI OUTPUT 1 can reclock and output a signal from SDI INPUT 1 to 4 by switching. (*1)

Signal Generation Function

SDI OUTPUT 1 to 4 output SDI signals as a TSG. (*2)

*1 Valid when the input signal is SD/HD/3G-B-DL/3G-A and the display assignment mode is set to off.
*2 For dual link and quad link, audio is embedded only in channel 1.

3.3.8 IP Input Connectors (SER05)

Connector Type SFP+

Number of Ports 2

Compliant Standard 10GBASE-SR / 10GBASE-LR

Fiber Types Multi-mode, single-mode

3. SPECIFICATIONS

3.3.9 External Reference Input

Connector Type BNC

Number of Input Connectors 1 pair

Input Impedance 15 kΩ passive loop-through

Input Return Loss ≥ 30 dB for 50 kHz to 30 MHz into 75 Ω

Maximum Input Voltage ±5 V (DC + peak AC)

Input Signal Tri-level sync or NTSC/PAL black burst signal

10 field IDs are supported.

Function Video signal waveform display and phase difference display

based on the phase of an external sync signal

Waveform display of external sync signal

* The display position of the video signal waveform display and the measured phase of the phase difference display based on the phase of the external sync signal may vary by ±1 clock depending on the timing when the external sync signal or SDI signal is connected or disconnected or when the device is restarted.
* Video signal waveform display based on the phase of an external sync signal is not possible for the following formats.

• IP input video signal using SER05
• 3G's 720/30P, 720/29.97P, 720/25P, 720/24P, 720/23.98P
• HD(DL)'s 1080/60P, 1080/59.94P, 1080/50P
• 3G(DL), 3G(QL), HD(QL), 12G
• Frame frequency 48P, 47.95P

* Phase difference display based on the phase of an external sync signal is not possible for the following formats.

• 3G's 720/30P, 720/29.97P, 720/25P, 720/24P, 720/23.98P
• Frame frequency 48P, 47.95P

3. SPECIFICATIONS

3.3.10 External Audio Input/Output Connectors (SER03)

Digital Audio I/O Connectors

Connector Type DIN 1.0/2.3 connector

Number of I/O Connectors

Group A 4 pairs (8 channels)

Group B 4 pairs (8 channels)

I/O Impedance 75Ω

Maximum Input Voltage ±5 V (DC + peak AC)

Output Voltage 1.0 Vp-p ± 10 % (into 75 Ω)

Input/Output Switching By group (4 pairs (8 channels))

Output Signal Audio signal displayed on the screen

Analog Audio I/O Connectors

Connector Type 37-pin D-sub (female)

I/O Signal Format Balanced DC coupling

I/O Channels 8ch

Input/Output Switching Switch all channels

Input Impedance ≤ 20 kΩ

Maximum Input Voltage 24 dBu

Output Impedance Nominal 50 Ω

Output Signal 8 audio signal channels displayed on the screen

Maximum Output Level 24 dBu ± 0.5 dB 1 kHz (into a balanced load of 100 kΩ or more)

3.3.11 Monitor Output Connector

SDI Output Connector

Function Output the displayed screen to an SDI monitor

Output Connector BNC

Number of Output Connectors

1

Output Impedance 75Ω

Output Return Loss

5 MHz to 1.485 GHz 15 dB or more

1.485 to 2.97 GHz 10 dB or more

Output Voltage 800 mVp-p ± 10 % (into 75 Ω)

Output Signal Outputs the LCD screen in HD, 3G-A, or 3G-B-DL.

Output Format

Color SystemQuantizationImageFrame (Field) Frequency/ScanningCompliant Standard
YCBCR 4:2:210 bit1920×108060/59.94/50 /ISMPTE ST 274
60/59.94/50 /P

Synchronization

Synchronized with the LCD refresh rate

(free run or frequency synchronization with the external reference signal(*1))

3. SPECIFICATIONS

TMDS Output Connector

Function Output the displayed screen to an HDMI monitor (*2)

Output Connector HDMI

Number of Output Connectors

1

Signal Format Single Link T.M.D.S

DDC Not supported

HOT PLUG Detection Not supported

Output Signal Outputs the LCD screen

Image 1920×1080

Frame Frequency 60P, 59.94P, 50P

Synchronization Synchronized with the LCD refresh rate (free run or frequency synchronization with the external reference signal(*1))

Touch Control Touch control possible by connecting the USB touch panel interface of a touch panel monitor to the LV5600 or LV7600 (*3)

*1 Frame (field) frequencies 24 Hz and 23.98 Hz are not supported.
*2 LEADER does not guarantee the operation on all HDMI monitors.
*3 LEADER does not guarantee that all touch panel type monitors will work with the LV7600.

3.3.12 Headphone Output

Output Connector

LV5600 One 3.5 mm mini jack (stereo)

LV7600 One stereo jack

Output Signal 2 channels from the audio signals that are being displayed on the screen (downmixed Lt and Rt are also possible)

Sampling Frequency 48 kHz

Volume Adjustment Using the menu

Power Output 100 mW maximum (into 8 Ω load)

3.3.13 Control Connectors

USB Port

Port Type Standard A

Number of Ports 2

Specifications USB 2.0

Compatible Devices USB memory, USB mouse, touch panel monitor

USB Memory Feature Saves capture data, preset data, event log data, data dumps, and loudness log data (SER03)

USB Mouse Feature Used to control on the screen

Touch panel monitor Touch control of the displayed screen (*1, *2)

3. SPECIFICATIONS

Ethernet Port

Compliant Standard IEEE802.3

Supported Protocol

TELNET (*3) Command control, status query

FTP File transfer

SNMP Command control, alarm query

HTTP Remote monitoring and control from a Web browser

SNTP Internal clock synchronization

Connector Type RJ-45

Type 10Base-T / 100Base-TX / 1000Base-T

Function Remote control from an external PC or remote controller (*3), file transfer, status information query

Remote Connector

Port Type 15-pin D-sub (female)

Locking Screws Inch screws (No.4-40UNC)

Number of Ports 1

Control Signal LV-TTL level (low active)

Input Voltage Range 0 to 5 V DC

All inputs are pulled up to +3.3 V (control is also possible using +5 V)

Function Load preset settings, switch input signals, transmit alarm signals activate tally, and start, stop, and clear the loudness measurement

Alarm Output Outputs alarms signals when a format alarm occurs, when various errors occur, when the fan malfunctions, or when the internal temperature is abnormal

RS-422/485 Connector (SER27)

Function Receives tally, camera ID, and camera iris signals and displays them

Port Type RJ-45

Number of Ports 2

*1 Pinch out and swipe operations are not supported.
*2 LEADER does not guarantee that all touch panel type monitors will work with the LV7600.
*3 You cannot use TELNET and the LV7290 at the same time.

3. SPECIFICATIONS

3.3.14 Front Panel

Display (LV5600)

LCD Type 7-inch color TFT

Resolution 1920×1080

Refresh Rate 60 Hz, 59.94 Hz, 50 Hz

(free run or frequency synchronization with the external reference signal(*1))

Touch Panel Electrostatic touch panel

Tapping the display shows touch keys

Key LEDs

All the keys are dimly back-lit.

The selected key is lit more brightly.

Power Switch

Electronic switch (which remembers whether the instrument is on or off)

Last Memory Backs up the panel settings to memory

Key Lock Lock by holding down the SYS key. Prevents unintentional

operations on the instrument.

*1 The LCD refresh rate changes automatically depending on the frame rate of the external reference signal.

Frame Rate of the External Reference SignalLCD Refresh Rate
23.98HzFree run
24HzFree run
25Hz50Hz
29.97Hz59.94Hz
30Hz60Hz

3. SPECIFICATIONS

3.3.15 Capturing

Screen Capture

Function Captures the screen
DisplayDisplays only the captured image or overlays the captured image over the input signal
MediaInternal memory (RAM) and USB memoryYou can only save one screen capture to the internal memory.
Data OutputSaved to bitmap format to a USB memory device or to a file format that the instrument can load (BSG).
Data Input Data saved to a USB memory device can be loaded and displayed on the instrument.

Frame Capture

FunctionCaptures frame data (blanking included for SDI)
Input Signal SDI signal (SER01/02), IP signal (SER05)
DisplayDisplays only the captured frame data or superimposes the captured frame data over the input signal
MediaInternal memory (RAM) and USB memoryStores 1 frame or 16 consecutive frames (32 frames for some formats) in the internal memory
Data OutputSaved to DPX or TIFF format to a USB memory device or to a file format that the instrument can load (FRM).
Data Input Data saved to a USB memory device can be loaded and displayed on the instrument. (*1)
Capture TimingManual and automatic (error capture)
Error CapturingAutomatically captures frame data when an error occurs
Error Location SearchCan be searched on Frame Capture Viewer

* An input signal in the same format as the frame data is required.

3. SPECIFICATIONS

3.3.16 TSG (SER24/SER28/SER29)

Table 3-12 HD video signal formats and standards

Color SystemQuantizationImageFrame (Field) Frequency/ScanningCompliant Standard
YCBCR 4:2:210 bit1280x72060/59.94/50 /PSMPTE ST 292-1SMPTE ST 296
30/29.97/25/24/23.98 /P
1920x108060/59.94/50 /ISMPTE ST 274SMPTE ST 292-1
30/29.97/25/24/23.98 /P
30/29.97/25/24/23.98 /PsF

Table 3-13 3G-A, 3G-B-DL video signal formats and standards

Color SystemQuantizationImageFrame (Field) Frequency/ScanningCompliant Standard
YCBCR 4:2:210 bit1920×108060/59.94/50/48/47.95 /PSMPTE ST 274SMPTE ST 425-1
48/47.95 /P-
2048×108060/59.94/50/48/47.95 /PSMPTE ST 425-1SMPTE ST 2048-2
YCBCR 4:4:410 bit 1920×108060/59.94/50 /ISMPTE ST 274SMPTE ST 425-1
30/29.97/25/24/23.98 /P
30/29.97/25/24/23.98 /PsF
2048×108030/29.97/25/24/23.98 /PSMPTE ST 425-1SMPTE ST 2048-2
30/29.97/25/24/23.98 /PsF
RGB 4:4:410 bit1920×108060/59.94/50 /ISMPTE ST 274SMPTE ST 425-1
30/29.97/25/24/23.98 /P
30/29.97/25/24/23.98 /PsF
2048×108030/29.97/25/24/23.98 /PSMPTE ST 425-1SMPTE ST 2048-2
30/29.97/25/24/23.98 /PsF

Table 3-14 3G(DL)-4K Video Signal Formats and Standards

Division Transmission SystemColor SystemQuantizationImageFrame Frequency/ScanningCompliant Standard
Square YC B CR 4:2:210 bit3840×216030/29.97/25/24/23.98 /PSMPTE ST 425-3SMPTE ST 2036-1
30/29.97/25/24/23.98 /PsF-
4096×216030/29.97/25/24/23.98 /PSMPTE ST 425-3SMPTE ST 2048-1
30/29.97/25/24/23.98 /PsF-
2 sample interleave YCB CR 4:2:210 bit3840×216030/29.97/25/24/23.98 /PSMPTE ST 425-3SMPTE ST 2036-1
4096×216030/29.97/25/24/23.98 /PSMPTE ST 425-3SMPTE ST 2048-1

* You also need the SER28.

3. SPECIFICATIONS

Table 3-15 3G(QL) video signal formats and standards

Division Transmission SystemColor SystemQuantizationImageFrame Frequency/ScanningCompliant Standard
Square YC BCR 4:2:210 bit3840×216060/59.94/50 /PSMPTE ST 425-5SMPTE ST 2036-1
48/47.95 /P-
4096×216060/59.94/50/48/47.95 /PSMPTE ST 425-5SMPTE ST 2048-1
YCBCR 4:4:410 bit3840×216030/29.97/25/24/23.98 /PSMPTE ST 425-5SMPTE ST 2036-1
30/29.97/25/24/23.98 /PsF-
4096×216030/29.97/25/24/23.98 /PSMPTE ST 425-5SMPTE ST 2048-1
30/29.97/25/24/23.98 /PsF-
RGB 4:4:410 bit3840×216030/29.97/25/24/23.98 /PSMPTE ST 425-5SMPTE ST 2036-1
30/29.97/25/24/23.98 /PsF-
2 sampleinterleave YCBCR 4:2:210 bit3840×216060/59.94/50 /PSMPTE ST 425-5SMPTE ST 2036-1
48/47.95 /P-
4096×216030/29.97/25/24/23.98 /PSMPTE ST 425-5SMPTE ST 2048-1
YCBCR 4:4:410 bit3840×216030/29.97/25/24/23.98 /PSMPTE ST 425-5SMPTE ST 1036-1
4096×216030/29.97/25/24/23.98 /PSMPTE ST 425-5SMPTE ST 2048-1
RGB 4:4:410 bit3840×216030/29.97/25/24/23.98 /PSMPTE ST 425-5SMPTE ST 2036-1
4096×216030/29.97/25/24/23.98 /PSMPTE ST 425-5SMPTE ST 2048-1

* You also need the SER28.
* 3G-A and 3G-B-DL links are supported.

3. SPECIFICATIONS

Table 3-16 12G video signal formats and standards

Division Transmission SystemColor SystemQuantizationImageFrame Frequency/ScanningCompliant Standard
2 sample interleave YCB CR 4:2:210 bit3840×216060/59.94/50 /PSMPTE ST 2036-1 SMPTE ST 2082-10
48/47.95/P-
4096×216060/59.94/50/48/47.95 /PSMPTE ST 2048-1 SMPTE ST 2082-10
YCB CR 4:4:410 bit3840×216030/29.97/25/24/23.98 /PSMPTE ST 2036-1 SMPTE ST 2082-10
4096×216030/29.97/25/24/23.98 /PSMPTE ST 2048-1 SMPTE ST 2082-10
RGB 4:4:410 bit3840×216030/29.97/25/24/23.98 /PSMPTE ST 2036-1 SMPTE ST 2082-10
4096×216030/29.97/25/24/23,98 /PSMPTE ST 2048-1 SMPTE ST 2082-10

* 12G-SDI TYPE 1 is supported.
* You also need the SER28 and SER29.

3. SPECIFICATIONS

Output Pattern100% color bar, 75% color bar, HD multiformat color bar, 4K multiformat color bar, color raster, gamma, cross hatch, 10 step, limit lamp, check field, lip sync pattern (SER03)
Scrolling (*1)
DirectionEight directions (up, down, left, right, and their combinations)
Speed Range and UnitPer frame (field)4 to 124 dots, in 4 dot steps
Moving Box ON / OFF (*1)
ColorsWHITE / YELLOW / CYAN / GREEN / MAGENTA / RED / BLUE / BLACK
Speed 1 to 3
Frequency Phase Adjustment (*1, *2)
Quad linkVary the phases of SDI OUTPUT 2 to 4 independently relative to SDI OUTPUT 1
Dual linkVary the phase of SDI OUTPUT 2 relative to SDI OUTPUT 1 and the phase of SDI OUTPUT 4 relative to SDI OUTPUT 3
Adjustment Range ±0.5 lines (in unit of video clocks)±1/2 frames (in unit of lines)
Embedded Audio
Number of Embedded Channels
16 channels max. (*3)
Embedding On/OffOn/off at the audio group level
Audio Level-20d BFS, -18 dBFS, 0 dBFS, Mute

*1 Either scrolling, moving box, or frequency phase adjustment can be turned on.
*2 The output phase may be off by ±2 clock from the specified value as a result of switching the format or turning on and off the power.
*3 For horizontal 4096/2048 pixel format at frame rates 60, 59.94, 30, 29.97 Hz, only 8 channels are embedded.

3.3.17 Presets

PresetSaves panel settings (with a few exceptions)
Number of Presets60
Preset Loading MethodFront panel or remote connector(*1)
CopyingAll preset data can be copied from the instrument to a USB memory device or from a USB memory device to the instrument.

*1 The number of presets loaded from the remote connector can be 8 or 60.

3. SPECIFICATIONS

3.3.18 Display

Number of simultaneously displayed SDI input signals

SD, HD, 3G-A, 3G-B-DL 4

HD(DL) 2

3G-B-DS 1

3G(DL)-2K 2

3G(DL)-4K (SER28) 1

HD(QL) (SER28) 1

3G(QL) (SER28) 1

12G (SER29) 1

Number of Display Systems in the IP Input Signal (SER05)

1

Display Mode

Single display Displays a single input signal

Simul Display Displays two or more input signals simultaneously SDI and IP can be displayed simultaneously. (*1)

Display Assignment Mode (SER26)

Maps the input video signal of a channel to multiple areas (*2)

Alarm Indications

System Alarm Indication Displays an alarm when the fan malfunctions or when the internal temperature is abnormal

Error Indication Displays an error when an receive signal error occurs

Display Layout

Multi Display Control the WFM/PIC and other display functions in multiple areas from a single screen

Customized Layout (SER26)

Function Freely arrange the windows shown with the WFM, VECT, PIC, AUDIO, STATUS, and EYE (SER02) keys (one of each), and a window consisting of six displays shown with MULTI

Display Format Displays up to four single link input signals in tiled, mixed, V aligned, or H aligned mode.

Normal Mode Each display area is divided evenly.

Tiled Display The windows are divided into four quadrants.

Mixed Display The windows are cascaded.

V Aligned Display The windows are arranged top to bottom.

H Aligned Display The windows are arranged side by side.

Tile Mode The display contents arranged in the display are shown in four quadrants per screen.

V Aligned Mode The display contents arranged in the display are shown in four vertical divided windows per screen.

H Aligned Mode The display contents arranged in the display are shown in four horizontally divided windows per screen.

3. SPECIFICATIONS

Enhanced Layout (SER26)

FunctionWhen multiple channels of single link are displayed, the selected channel is automatically shown in a specific area. You can make the specific area larger than the other areas to show the selected channel enlarged.

3G-B-DS Display Format

Aligned Display The screen is divided into windows.
Time Display

Displayed ContentsCurrent time, time code
Current Time DisplayThe time based on the internal clock
Time Code DisplayLTC, VITC, D-VITC (SD only)

Compliant Standard
LTC, VITC SMPTE ST 12-2

D-VITC SMPTE ST 266
Tally Display

Remote ConnectorTurn on and off the tally display by controlling through the remote connector
RS-485 Control (SER27)Shows tallies through RS-485 control

Camera ID Display

Instrument SettingShows the camera ID set with the instrument’s menu
RS-485 Control (SER27)Shows the camera ID through RS-485 control

Iris Display

RS-485 Control (SER27)Shows the iris through RS-485 control

*1 IP signals can be displayed when the SDI system is set to SD/HD/3G-A/3G-B-DL.
*2 Simultaneous display of HDR (SER23) and normal picture or CINEZONE and normal picture is possible. However, there is a limit to the number of channels that can be displayed. This can be set only for SD/HD/3G-A/3G-B-DL single link. It cannot be set for 4K signals or SDI system that transmits multiple lines.

3. SPECIFICATIONS

3.3.19 Video Signal Waveform Display

Waveform Control

Display Mode

Overlay Overlays component signals

Parade Displays component signals side by side

Blanking Interval H and V blanking periods can be masked.

RGB Conversion Converts a YC BCR signal into an RGB signal and displays the result

Channel Assignment GBR or RGB order

Pseudo-Composite Display Artificially converts component signals into composite signals and displays the result

Line Select Displays the selected line

Sweep Modes H / V

Color 7 colors to choose from

Vertical Axis

Gain ×1 / ×5 / ×10

Variable Gain

Gain x1 ×0.2 to ×2.0

Gain x5 ×1.0 to ×10.0

Gain x10 ×2.0 to ×10.0

Amplitude Accuracy ±0.5% (single default display)

3G, HD(DL) (1080/60P, 1080/59.94P, 1080/50P)

Y Signal ±0.5 % (1 to 60 MHz)

CBCR Signal ±0.5 % (0.5 to 30 MHz)

Low-Pass Attenuation ≥ 20 dB (at 40 MHz)

3G, HD, HD(DL) (1080/60P, 1080/59.94P, 1080/50P)

Y Signal ±0.5 % (1 to 30 MHz)

CBCR Signal ±0.5 % (0.5 to 15 MHz)

Low-Pass Attenuation ≥ 20 dB (at 20 MHz)

SD

Y Signal ±0.5 % (1 to 5.75 MHz)

CBCR Signal ±0.5 % (0.5 to 2.75 MHz)

Low-Pass Attenuation ≥ 20 dB (at 3.8 MHz)

Horizontal Axis

Line Display

Display Format Overlay (1H, 2H) (*1)

Parade (1H, 2H, 3H)

4Y parade (4H)

Magnification ×1 / ×10 / ×20 / ACTIVE / BLANK

Field Display

Display Format Overlay (1V, 2V) (*2)

Parade (1V, 2V, 3V)

Magnification ×1 / ×20 / ×40

Time Accuracy ±0.5% (single default display)

3. SPECIFICATIONS

Cursor Measurement

Composition

Horizontal Cursors 2 (REF and DELTA)

Vertical Cursors 2 (REF and DELTA)

Simultaneous Display Displays the horizontal cursors and vertical cursors simultaneously

Amplitude Measurement mV / % / R% / DEC / HEX

Time Measurement Second display

Frequency Display Computes and displays the frequency with the length of one period set to the time between two cursors

Cursor Value Display Displays measured values at the cursors

Scale

Type %, V, decimal, hexadecimal

Display Colors 7 colors to choose from

HDR Scale (SER23) Adds an HDR scale to each scale for HDR

External Sync Signal Waveform Display

Compatible SDI Systems Can be displayed for SD, HD, 3G-A, and 3G-B-DL

Features Waveform display of external sync signal

Vertical Axis

Gain ×1

Variable Gain CAL

Horizontal Axis

Line Display

Display Format 1H, 2H

Magnification ×1

Field Display

Display Format 1V, 2V

Magnification ×1

Scale

Type %

Display Colors 7 colors to choose from

*1 2H display is not possible when the input signal is 4K.
*2 2V display is not possible when the input signal is progressive.

3. SPECIFICATIONS

3.3.20 Vector Display

Display Colors 7 colors to choose from

Blanking Interval H and V blanking periods can be masked (according to the video signal waveform display settings).

Pseudo-Composite Display Artificially converts component signals into composite signals and displays the result

Line Select Displays the selected line

Gain ×1 / ×5 / IQ-MAG

Variable Gain

Gain x1 ×0.2 to ×2.0

Gain x5 ×1.0 to ×10.0

Gain IQ-MAG

Not SD, component display

0.620 to 6.240

SD, component display

0.580 to 5.840

Not SD, pseudo-composite display

0.570 to 5.700

SD, pseudo-composite display

0.520 to 5.260

Amplitude Accuracy ±0.5 %

Scale

Type AUTO / ITU-R BT.601 / ITU-R BT.709 / DCI / ITU-R BT.2020

Color Bar Saturation 75% / 100%

IQ Axis Show or hide

Display Colors 7 colors to choose from

Vector Marker Display Displays a marker and numeric value at the specified location on the vector display

Number of Markers 1

Numeric Display Displays the marker position numerically

Cb Displays the C B position as a percentage

Cr Displays the CR position as a percentage

deg Displays the hue in degrees.

d Displays the distance from the center as a percentage

Histogram Display Displays the Y, R, G, and B histograms

SDI Signal 5-Bar Display Function Converts an SDI signal into Y, R, G, B, and composite values, and then displays the five peak levels.

Channel Assignment RGB / GBR

Scale % / mV / HEX / DEC

Error Level Based on the gamut error, composite gamut error, and luminance error thresholds

Line Select Displays the selected line

Low-Pass Filter The same as for gamut errors

3. SPECIFICATIONS

3.3.21 Picture Screen

Quantization8 bit (internal signal processing is performed with signed 12 bit or higher)
Level MappingMaps the black level to 0 (8bit), SDI code value (when receiving 10 bit RGB) 1024 to 255 (8 bit)
Display Sizes Reduced, actual size, ×2, full frame
Quality Adjustment and Color Selection
Brightness, contrast, RGB gain, RGB bias, chroma gain, monochrome display (RGB gain, RGB bias, chroma gain not valid)
Frame RateConverts the frame rate based on the LCD frame rate (60P, 59.94P, 50P)
Aspect Marker Display
3G (17:9 aspect ratio) 16:9 / 14:9 / 13:9 / 4:3 / 2.39:1
3G (16:9 aspect ratio), HD, HD(DL)
17:9 / 14:9 / 13:9 / 4:3 / 2.39:1 / AFD (*1)
SD 16:9 / 14:9 / 13:9 / AFD(*1)
Aspect Marker Format Line, shadow (99 levels), or black
Safety Marker SizeARIB TR-B4, SMPTE RP-218, or user-defined
AFD Display(*1)Displays abbreviations for SMPTE ST 2016-1-2007 standard AFD codes
Line SelectMarks the selected line
Error IndicationDisplays markers in the gamut error and level error areas

*1 AFD Supports only SD or HD.

3. SPECIFICATIONS

3.3.22 Superimpose Display

Displays English closed captions, European closed captions, and Japanese closed captions over the picture

English Closed Caption

Compliant Standards (Mapping Standards)

EIA-708 SMPTE ST 334

EIA/CEA-608-B (EIA-708-B)

SMPTE ST 334

EIA/CEA-608-B (EIA/CEA-608-B)

SMPTE ST 334

VBI (EIA/CEA-608-B Line21)

CIA/EIA-608-B

European Closed Caption

Compliant Standards

Teletext

TU-R BT. 653-3 System B / OP47

Simple Japanese Closed Caption Display

Displays a simple Japanese closed caption on the picture display. (Select HD, SD, analog, or portable closed caption to display. Select language 1 or 2.)

Compliant Standard

ARIB STD-B37 short form data

Supported Video Formats

1080i/59.94 (SMPTE 274M, 292)

525i/59.94 (SMPTE 259M)

Display

Display position control is supported only for HD and SD closed captions.

Characters

Only Kanji, roman numerals, katakana, hiragana, additional characters (ARIB STD-B24), additional kanji (ARIB STD-B24), and 1-byte DRCS are displayed.

Character Sizes

Supports only standard, medium, small, and specified size codes

Logging

Logged Events

Clear screen command, text closed caption display event, time code, TV commercial material check result

Data Format Text

TV Commercial Material Checking

Function

Checks whether closed caption displays are present during the closed caption prohibited time

Check Period

The material start time and end time can be specified using timecodes.

Log Display Color

Closed Caption during Prohibited Time

Red

Closed Caption Not during Prohibited Time

Green

Check Result Display

Displays OK or NG when measurements are complete

Loudness Synchronization

(SER03)

Simultaneous measurement with loudness measurement

3. SPECIFICATIONS

3.3.23 CINELITE Display

FunctionVideo levels are displayed numerically.
f Stop DisplayDisplays f Stop values relative to a reference pointSet in reference to an object with an 18% reflectancef Stop gamma correction (not supported on the SER23)
Fundamental GammaITU-R BT.709 / hybrid log gamma (HLG)(SER23) / PQ (SER23)/ S-Log3 (SER23)
User Correction Table3 types (data acquired with a real device)
% Display (SDR)Displays the luminance level or RGB level as a percentage withthe SDI code value 64 assumed to be 0% and the SDI codevalue 940 assumed to be 100%
Gradation DisplayDisplays the luminance or RGB value with the SDI code value64 assumed to be 0 and the SDI code value 940 assumed to be255
CV DisplayDecimal, hexadecimalDisplays the SDI signal code value as YCBCR or RGB accordingto the input signal(only for measurement size 1×1)
HDR Display (SER23)
HLG
System Gamma OFF
Narrow RangeDisplays the relative HLG luminance with the SDI code value 64assumed to 0% and 940 assumed to be 1200% or 100%
Full RangeDisplays the relative HLG luminance with the SDI code value 0assumed to 0% and 1023 assumed to be 1200% or 100%
System Gamma ON
Narrow RangeDisplays the relative HLG luminance with the SDI code value 64assumed to 0cd/m2 and 940 assumed to be 1000cd/m2
Full RangeDisplays the relative HLG luminance with the SDI code value 0assumed to 0cd/m2 and 1023 assumed to be 1000cd/m2
PQConverts the luminance level to the display’s cd/m2 anddisplays the result
Narrow RangeSDI code value 64 to 940 are assumed to be 0cd/m2 to 10000cd/m2
Full RangeSDI code value 0 to 1023 are assumed to be 0cd/m2 to 10000cd/m2
S-Log3Converts the reflectance to IRE with SDI code value 95assumed to be 0% and 589 assumed to be 100% and displaysit as a percentage
Measured Points3
Measurement Sizes1 × 1 pixel, 3 × 3 pixels, and 9 × 9 pixels

3. SPECIFICATIONS

3.3.24 CINELITE Advanced Display

FunctionSynchronizes the markers on the waveform display, vector display, and chromaticity diagram display to the points selected with CINELITE
Waveform Display Link Markers
Synchronizes the markers on the waveform display to the points selected with CINELITE
Number of Link MarkersUp to 16 (for YRGB, YGBR display) (including the 4 reference points)
Vector Link MarkersSynchronizes the markers on the vector display to the points selected with CINELITE
Number of Link MarkersUp to 4 (including the 1 reference point)
Vector Numeric DisplayDisplays numerically the active marker position
CbDisplays the CB position as a percentage
CrDisplays the CR position as a percentage
deg Displays the hue as an angle (°).
d Displays the distance from the center as a percentage
CIE Chromaticity Diagram Display Link Markers
Synchronizes the markers on the CIE chromaticity diagram display to the points selected with CINELITE
Number of Link MarkersUp to 4 (including the 1 reference point)

3.3.25 CINEZONE Display

CINEZONE Display (SDR)

FunctionAdds colors to the display in accordance with luminance levels
Display Colors Linear (1024 colors), step (12 colors)
Upper Limit-6.3 to 109.4 % (values equal to or greater than the upper limit are displayed in white)
Lower Limit-7.3 to 108.4 % (values less than the lower limit are displayed in black)

CINEZONE display (HDR) (SER23)

FunctionAdds colors to the display in accordance with luminance levels
HDR Area SettingDisplays color according to the brightness
SDR Area SettingMonochrome display
Upper Limit Displays magenta for values exceeding the limit
Ref.LEVEL to 100% (code values 64 to 940 or 0 to 1023 assumed to be 100%)
Lower Limit Displays black for values less than the limit
0% to Ref.LEVEL% (code values 64 to 940 or 0 to 1023 assumed to be 100%)

3. SPECIFICATIONS

3.3.26 Focus Assist (SER25)

Detection Sensitivity LOW / MIDDLE / HIGH

Highlight Display Color WHITE / GREEN / BLUE / RED

Picture Luminance Level OFF / EMBOSS / 25% / 50% / 75% / 100%

3.3.27 CIE Chromaticity Diagram Display

Display Standard CIE1931 (xy display), CIE1976 (u'v' display)

Display Type Chromaticity diagram display, color temperature display

Display Mode

Chromaticity Diagram Display

Luminance display, color display

Color Temperature Display Luminance display

Colorimetry ITU-R BT.601(525) / ITU-R BT.601(625) / BT.709 / DCI / ITU-R

BT.2020

Clipping

ON Clips negative values of the input signal to zero

OFF Displays negative values of the input signal according to ITU-R

BT.1361

Smoothing Displays by averaging data every two pixels

Accuracy ±0.005 (relative to the measurement coordinate value)

Chromaticity Diagram Display Scale

Triangle Select two from ITU-R BT.601 (525), ITU-R BT.601 (625),

ITU-R BT.709, DCI, and ITU-R BT.2020

User-defined Triangle Set a single user-defined triangle

Background Color sample, white background, black background

Sub scale Color temperature curve, grid (0.1 steps), white point (D65),

triangle name (each can be turned on or off)

Cursor Displays the cursor position in coordinates

Gamma ITU-R BT.709, user (1.5 to 3.0), HLG (SER23), PQ (SER23),

S-Log3 (SER23)

3. SPECIFICATIONS

3.3.28 HDR Display (SER23)

Compliant StandardITU-R BT.2100 (HLG: Hybrid Log Gamma, FullRange / NarrowRange),ITU-R BT.2100 (PQ: Perceptual Quantization, FullRange / NarrowRange)S-Log3
Supported FormatsAll formats except SD-SDI
Function
Video Waveform DisplayScale, cursor
Vector Display Histogram
Picture Screen
HDR CINEZONE
HDR CINELITE
MAXCLL, MAXFALL (CEA861 compliant)
START MAXCLL, MAXFALL computation start
STOPMAXCLL, MAXFALL computation stop

3.3.29 Audio Display

Input Signal SDI embedded audio

Digital audio I/O connector (SER03)

Analog audio input (SER03)

SFP IP Audio (SER05)

Format L-PCM

Sampling Frequency 48 kHz

Quantization 24 bit

SDI Embedded Audio

Compliant Standard

3G, HD, HD(DL) SMPTE ST 299

SD SMPTE ST 272

Clock Generation Generated from the video clock

Synchronization Must be synchronized to the video clock.

All SDI signals must be synchronized.

Channel Separation Separates up to four groups (16 channels) from an SDI input.

(For 3G, channels 1 to 16 and channels 17 to 32 are divided.)

IP Input (SER05)

Clock Generation System Generated from the video clock

Synchronization Relationship

Must be synchronized to the video clock.

All the content video signals must be synchronized.

Channel Separation

IP Input Audio Separates up to four groups 16 channels

3. SPECIFICATIONS

Maximum Number of Display Channels

SDI embedded audio signal

16 (from any SDI input, displayed in groups)

External Audio Signals (SER03)

16 (A, B)

Analog Audio Signals (SER03)

8

IP Input Audio Signal (SER05)

16

Display Types Level meter, Lissajous (SER03), correlation meter (SER03),

surround (SER03), status (SER03), loudness (SER03)

Level meter

Displayed Channels 8ch / 16ch

Dynamic Range

SDI Embedded Audio

SDI-60 dBFS, -90 dBFS, reference level±3 dB

External Digital Audio (SER03)

-60 dBFS, -90 dBFS, reference level±3 dB

External Analog Audio (SER03)

-60dBFS, reference level±3 dB

Scales the scale reference level 4dBu to -20dBFS

Level Accuracy ±0.3 dB

(-50 to 0 dBFS, 1 kHz, signal source impedance 40 Ω or less)

Frequency Response 30 Hz to 20 kHz ± 0.4 dB (4 dBu, 1 kHz reference, TRUE PEAK response)

20 Hz to 20 kHz + 0.4 dB, -0.6 dB (4 dBu, 1 kHz reference,

TRUE PEAK response)

Meter Response Model TRUE PEAK / PPM type I / PPM type II / VU

Peak Hold Time 0.0 to 5.0 s (in 0.5 s steps), HOLD

Level Setting -40.0 to 0.0 dBFS (standard level, warning level, over level)

Level Numeric Display Displays the levels numerically

Numeric display in red when level-over is detected

Displays a blue "M" when mute is detected (ON/OFF selectable.

The displays changes to a blue ■ when the layout size is small.)

Displays "U.L" when audio is not detected

3. SPECIFICATIONS

Lissajous Display (SER03)

Displayed Channels 2ch×1

2ch×4

2ch×8

Display Mode X-Y / MATRIX

Correlation Meter Displays the correlation between two channels as a value from -1 to 1

Channel Assignment

SINGLE LISSAJOU L/R

MULTI LISSAJOU L1, R1 to L4, R4 to L8, R8

Surround Display (SER03) (*1)

Function Displays a graphical representation of a sound field

Surround Format 5.1ch

Channel Mapping L / R / C / LFE / Ls / Rs / Lt / Rt

Center Channel Format NORMAL / PHANTOM CENTER

Gain ×1 / AUTO

Status Display (SER03)

Level Audio levels are displayed using numbers (dBFS).

Error Detection Counts the number of errors that occur for each channel

Level Over Counts the number of times that the level of the input signal exceeds the set value

Detection Setting -40.0 to 0.0 dBFS

Clipping Counts the number of times that a received signal exceeds the maximum signal value for the specified number of consecutive samples

Detection Setting 1 to 100 sample

Mute Counts the number of times that the length of a received mute signal exceeds the specified period

Detection Setting 1 to 5000 ms

Parity Error Counts the number of times that the input signal's parity bit and the parity bit recalculated by the instrument differ

Validity Error Counts the number of times that the input signal's validity bit is 1

CRC Error Counts the number of times that the CRC of the channel status bits and the calculated CRC are different

Code Violation Counts the number of times that the state of the input signal's biphase modulation is abnormal

Elapsed Time Displays the amount of time that has elapsed since the instrument was reset

Channel Status Bits Dump display, text display

User Data Bits Dump Display

3. SPECIFICATIONS

Loudness Display (SER03)

FunctionLoudness chart display, numeric display, log, level meter display, peak value display
Compliant StandardITU-R BS.1770, ARIB TR-B32, EBU R128, ATSC A/85
Measurement ChannelSimultaneous measurement of two audio sources
Mode (Main)Monaural, stereo, 5.1, user specified channel
Mode (Sub)Off, monaural, stereo
Channel SelectionUser-defined assignment of eight channels
LFE Gain 0 to 10 times
Measurement TriggerManual (panel), remote, timecode, mute
Measurement ModeBS1770, ARIB, EBU, ATSC, CUSTOM
Target Level
BS1770 -24.0 LKFS
ARIB -24.0 LKFS ( ± 1 LK)
EBU-23.0 LUFS ( ± 1 LU)
ATSC-24.0 LKFS ( ± 2 LK)
CUSTOM-25.0 to -23.0 LKFS
Average Time
Momentary Loudness200 to 10000 ms
Short-term Loudness200 to 10000 ms
Chart Display

1 During Audio Measurement

Graph display of integrated loudness and momentary or short-term loudness

2 During Audio Measurement

Graph display of integrated, momentary, or short-term loudness
Measurement Time2min, 10min, 30min, 1hour, 2hour, 6hour, 12hour, 24hour
MAGZoomed display of the target level from -18 to +9 (LK/LU)
Numeric DisplayAbsolute value and relative value displays of integrated loudness and momentary or short-term loudness
Integrated LoudnessDisplayed in red when the target level range is exceeded
Momentary, Short-term Loudness
Displayed in red when the target level is exceeded

Log

Log TimeUp to 24 hours
File

Log Saves gating block loudness in CSV format

SummarySaves settings and measurement results in text format

Level Meter Display Displays level meters for eight channels

Peak Value DisplayDisplays peak values of a measurement channel numerically

*1 Only CH MODE 8CH is supported.

3. SPECIFICATIONS

3.3.30 Status Display

Signal Detection Detects the presence of an SDI signal

Format Display Displays the video signal format

Frequency Deviation Display

Function Displays the sampling frequency deviation Displays an error if ±10 ppm is exceeded

Measurement Range ±100 ppm

Precision ±2 ppm

Equivalent Cable Length Display

Function Displays SDI signal attenuation in terms of cable length Displays an error if the specified cable length is exceeded

Supported Cables

12G L-5.5CUHD

3G, HD LS-5CFB / 1694A

SD L-5C2V / 8281

Display Range

12G < 10 m, 10 to 80 m, > 80 m

3G < 10 m, 10 to 100 m, > 100 m

HD < 10 m, 10 to 130 m, > 130 m

SD < 50 m, 50 to 200 m, > 200 m

Precision

12G, 3G, HD ±20 m

SD ±30 m

Resolution 10 m

Error Count Display Up to 999999 errors for each error type

Count Period 1 second, 1 field (frame)

Embedded Audio Channel Display

Displays the embedded audio channel numbers

* If the input signal is 3G-B-DL, only stream 1 is supported.

SDI Signal Error Detection

CRC Error Detects 3G and HD signal transmission errors

EDH Error Detects SD signal transmission errors

TRS Position Error Detects TRS embedding position errors

TRS Code Error Detects TRS protection bit errors

Line Number Error Detects errors with the line numbers embedded in 3G and HD signals

Illegal Code Error Detects data within the range of 000 to 003h and 3FC to 3FFh in locations other than TRS and ADF

3. SPECIFICATIONS

Ancillary Data Packet Error Detection

Checksum error Detects ancillary data transmission errors

Parity Error Detects ancillary data header parity errors

Embedded Audio Packet Error Detection (*1)

BCH Error Detects audio packet transmission errors

DBN Error Detects audio packet continuity errors

Parity Error Detects audio packet parity errors

Embedded Position Error Detects the presence of audio in lines where it should not be embedded

Sample Counter Error Detects asynchronous audio by measuring the number of audio samples

*1 If the input signal is 3G-B-DL, only stream 1 is supported.

Video Error Detection

Freeze Error Detects freezing of video within the specified time range

Detection Method Video interval checksum

Time Specification 2 to 300 frames

Black Error Detects video blackouts

Black Level Specification 0 to 100%

Area Specification 1 to 100%

Time Specification 1 to 300 frames

Gamut Error Detects gamut errors

Detection Range

Upper limit 90.8 to 109.4%

Lower Limit -7.2 to 6.1%

Low-Pass Filter

FormatLow-Pass Filter
HD/SD: 1 MHzHD: 2.8 MHz SD: 1 MHz
SD 720×487Approx. 1 MHz (EBU R103-2000)Approx. 1 MHz
SD 720×576Approx. 1 MHz (EBU R103-2000)Approx. 1 MHz
HD 1280×720Approx. 1 MHzApprox. 2.8 MHz
HD 1920×1080 (frame rate ≤ 30 Hz)Approx. 1 MHz (IEEE STD 205)Approx. 2.8 MHz
HD 1920×1080 (frame rate > 30 Hz)Approx. 2 MHzApprox. 5.5 MHz
HD 2048×1080 (frame rate ≤ 30 Hz)Approx. 1 MHz (IEEE STD 205)Approx. 2.8 MHz
HD 2048×1080 (frame rate > 30 Hz)Approx. 2 MHzApprox. 5.5 MHz
4K 3840×2160 (frame rate ≤ 30 Hz)Approx. 4 MHzApprox. 11 MHz
4K 3840×2160 (frame rate > 30 Hz)Approx. 8 MHzApprox. 22 MHz
4K 4096×2160 (frame rate ≤ 30 Hz)Approx. 4 MHzApprox. 11 MHz
4K 4096×2160 (frame rate > 30 Hz)Approx. 8 MHzApprox. 22 MHz

Area Specification 0.0 to 5.0%

Time Specification 1 to 60 frames

3. SPECIFICATIONS

Composite Gamut Error Detects level errors that occur when component signals are converted to composite signals

Detection Range

Upper limit 90.0 to 135.0%

Lower Limit -40.0 to 20.0%

Low-Pass Filter The same as the gamut error

Area Specification 0.0 to 5.0%

Time Specification 1 to 60 frames

SDI Analysis Features

Event Log Display

Function Records detected errors, events—such as the instrument switching between input signals, and timestamps.

Log Capacity Up to 1000 events

Operation Logs all events from start to finish

Data Output Overwrite mode, Stop after 1,000 events

Data Dump Display

Display Format Displays serial data sequence or displays each color component separately

SD, HD, 3G-A, 3G-B-DS

PICTURE, stream 1, stream 2

3G-B-DL PICTURE, link A, link B

HD(DL) PICTURE, link A, link B

3G(DL)-2K PICTURE, link 1, link 2

3G(DL)-4K (SER28) PICTURE, link 1, link 2

3G(QL), HD(QL) (SER28)

PICTURE, link 1, link 2, link 3, link 4

12G (SER29) PICTURE, sub1, sub2, sub3, sub4

Display Format Details

PICTURE Links or streams 1 and 2 are combined and displayed in a picture structure.

Stream 1/2 Displays each stream in a transmission structure

Link A, B, 1, 2, 3, 4 Displays the selected link

Line Select Displays the selected line

Sample Select Displays from the selected sample

Jump Feature Jumps to an EAV or SAV

Data Output Text output to USB memory

3. SPECIFICATIONS

Phase Difference Display

Function

Displays the phase difference between a reference signal and an SDI signal numerically and graphically

Reference Signal

SD, HD, 3G-A, 3G-B-DL

external sync signal, Ach

3G-B-DS External sync signal

HD(DL) External sync signal, Ach, Cch

3G(DL)-2K (SER28) External sync signal, Ach, Cch

HD(QL), 3G(DL)-4K, 3G(QL) (SER28)

External sync signal

12G (SER29) External sync signal

Display Range

Vertical 1 frame

For 3G-B-DL 47.95P to 60P, ±1 frame measurement possible

Horizontal ±1 line

* If the reference signal is set to an external sync signal, the measured phase may vary by ±1 clock depending on the timing when the external sync signal or SDI signal is connected or disconnected or when the power is turned on and off.

SDI Ancillary Data List Display

List Display Details

Presence or absence of each ancillary data type, embedded line number, and number of packets per frame

Dump Display

The selected ancillary data is displayed in hexadecimal or binary.

EDH Display (Only for SD)

Compliant Standard

SMPTE RP 165

Displayed Contents

Analyzes and displays EDH packets and displays received CRC errors

Display Format

Text, hexadecimal, binary

Payload ID Display

Compliant Standard

SMPTE ST 352

Displayed Contents

Analyzes and displays payload information

Display Format

Text and binary

Displaying Audio Control Packets

Compliant Standard

SMPTE ST 299-1, SMPTE ST 272

Displayed Contents

Displays audio control packet analysis

Display Format

Text, hexadecimal, binary

Display Format

1 / 2 / 3 / 4

Japanese Closed Caption Display

Compliant Standard

ARIB STD-B37

Displayed Contents

Analysis display of closed caption signals

Display Format

Text, hexadecimal, binary

3. SPECIFICATIONS

English Closed Caption Display (*1)

CDP Packet Display Details

CDP packet header information

Presence or absence of timecode packet,

Presence or absence of closed caption packet and validity of this packet,

Presence or absence of closed caption service packet and validity of this packet,

Presence or absence of the FUTURE data packet

Time Code

When time code packets are present

Closed Caption Data

When valid closed caption packets are present

Presence or absence of CC1 to 4, TEXT1 to 4, XDS packets

XDS Packet Display Details

Contents adviser information

Copy management information

Display content of ProgramDescription packet

Stuffing Descriptor

AC3 Audio Descriptor

Caption Service Descriptor

Content Advisory Descriptor

Extended Channel Name Descriptor

Service Location Descriptor

Time-Shifted Service Descriptor

Component Name Descriptor

DCC Arriving Request Descriptor

DCC Arriving Request Descriptor

Redistribution Control Descriptor

Inter-Stationary Control Signal (NET-Q) Display

ARIB STD-B39

Analysis display of inter-stationary control signals

Text, hexadecimal, binary

Q signal logging

Analysis display of the format ID

Outputs Q signal logs in CSV format through a USB memory device

Data Broadcast Trigger Signal Display(*1)

ARIB STD-B35

Text, hexadecimal, binary

V-ANC User Data Display (*1)

ARIB TR-B23

Hexadecimal, binary

AFD Packet Display SMPTE ST 2016-3

Text, hexadecimal, binary

3. SPECIFICATIONS

User-Defined ANC Packet Display

DID / SDID

Y / C

Hexadecimal, binary

*1 This is not supported when the input signal is 3G or 12G (SER29).

Lip Sync Display (SER03)Displays the phase difference between the video and audio
Lip Sync Measurement
FunctionMeasures the time difference between the SDI signal and digital audio signal and displays the results numerically and graphically
Reference SignalA Leader TSG that supports lip syncing (*1)
Measurement MethodMeasures the time difference when the luminance level of the video signal exceeds the specified value and when the audio level signal exceeds the specified value
Luminance Level Setting25 to 100%
Audio Signal Level Setting-30 to 0 dBFS
Supported Audio SignalsEmbedded audio signal, digital audio signal
Measurement Range (Bar Display)±50 ms / ±100 ms / ±500 ms / ±1.0 s / ±2.5 s
Measurement Range (Numeric Display)±3999 ms
Measurement Resolution1 ms

*1 TSG patterns not made by Leader may be supportable by specifying the video signal setting and audio signal setting.

3. SPECIFICATIONS

IP Analysis Function (SER05)

IP Status Display
FunctionDisplay the 10G Ethernet (IP 1/2) traffic an streams
Status Display
Linkup Detects Ethernet linkup
ProtocolST2022-6 / ST2110-20 / PTP / UDP
Bit Rate DisplayDisplays the bit rate (Mbps) of the user data section of each stream excluding the header section
Number of Measured Streams
Up to 100
Integration Rate DisplayDisplays the total number of bits per second (Gbps) excluding the Ethernet frame header and FCS
Measurement Range Resolution 1 s2 min, 10 min, 30 min, 1 h, 2 h, 6 h, 12 h, 24 h, 72 h
IP Packet Jitter Display
FunctionDisplays graphically the packet arrival interval of the selected video stream
Measurement Range Resolution 1 s2 min, 10 min, 30 min, 1 h, 2 h, 6 h, 12 h, 24 h, 72 h
PTP Status Display
FunctionDisplays graphically the PTP time and delay information
Measurement Range Resolution 1 s2 min, 10 min, 30 min, 1 h, 2 h, 6 h, 12 h, 24 h, 72 h
Display ModeDelay Time / Time Offset

3.3.31 Eye Pattern (SER02)

SDI Input Connector SDI INPUT 1

DisplayDisplays the input SDI waveform before equalizing
Number of Displays
1-Screen DisplayDisplays the eye pattern of the selected filter in a single screen
2-Screen DisplayDisplays the timing filter and eye pattern of the selected filter in two screens
Waveform Display Color 7 colors to choose from
Scale Display Color 7 colors to choose from
Method Equivalent time sampling
Amplitude Accuracy800 mV ± 5 % (for 800 mV input)
Time Axis
2 UI Display
12G (SER29)12.5 ps/div
3G50 ps/div
HD 100 ps/div
SD550 ps/div

3. SPECIFICATIONS

4 UI Display

12G (SER29) 25 ps/div

3G 100 ps/div

HD 200 ps/div

SD 1100 ps/div

16 UI Display

12G (SER29) 100 ps/div

3G 400 ps/div

HD 800 ps/div

SD 4400 ps/div

Time Axis Accuracy ±3 %

Jitter Filter

10Hz HPF 10Hz

100Hz HPF 100Hz

1 kHz

HPF 1 kHz

100 kHz

HPF 100 kHz

TIMING HPF 10Hz

ALIGNMENT

12G (SER29)

HPF 100 kHz

3G, HD

HPF 100 kHz

SD HPF 1 kHz

Cursor Measurement

Amplitude measurement using Y cursors

Time measurement using X cursors

Rise time and fall time measurement using the TrTf cursor

Automatic Measurement Items

Eye pattern's amplitude

Rise time (the time for the signal to rise from 20 to 80 % of its amplitude)

Fall time (the time for the signal to fall from 80 to 20 % of its amplitude)

Timing jitter

Jitter

Rising edge overshoot

Falling edge overshoot

3. SPECIFICATIONS

3.3.32 Jitter Display (SER02)

SDI Input Connector SDI INPUT 1

DisplayDisplays the jitter component of an SDI signal
Number of Displays
1-Screen DisplayDisplays the jitter waveform of the selected filter in a single screen
2-Screen DisplayDisplays the timing jitter and the jitter waveform of the selected filter in two screens
Waveform Display Color7 colors to choose from
Scale Display Color 7 colors to choose from
Method Phase detection method
Gain ×16 / ×8 / ×4 / ×2 / ×1
Measurement Range
12G (SER29)
×16 0.00 to 1.20 UI
×4 1.20 to 4.80 UI
×2 4.80 to 9.60 UI
×1 9.60 to 19.20 UI
3G, HD, SD
×8 0.00 to 1.20 UI
×2 1.20 to 4.80 UI
×1 4.80 to 9.60 UI
Time Axis 1H / 2H / 1V / 2V (*1)
Time Axis Accuracy ±3 %
Jitter Filter
10Hz HPF 10Hz
100Hz HPF 100Hz
1 kHzHPF 1 kHz
100 kHzHPF 100 kHz
TIMING HPF 10Hz
ALIGNMENT
12G (SER29)HPF 100 kHz
3G, HDHPF 100 kHz
SDHPF 1 kHz

3. SPECIFICATIONS

Cursor Measurement Jitter value measurement through the use of cursors

Automatic Measurement Display Feature

Displays the jitter value in seconds (sec) and unit intervals (UI)

Automatic Measurement Items

Timing jitter, alignment jitter, jitter

Accuracy Input jitter frequency: 1 kHz. Filter setting: 10 Hz, within measurement range

0 UI < automatic measured value ≤ 1 UI
±10 % + 0.07 UI
1 UI < automatic measured value ≤ 7 UI
±10 % 

*1 2V display is not possible when the input signal is progressive except for 60/59.94/50P of HD(DL).

3.3.33 Tally Display

Number of Displays 3 (TALLY-1, TALLY-2, TALLY-EXT) (*1)

Display Colors 7 colors to choose from

Control Method Remote connector, RS-422/485 connector (SER27)

*1 The number of displays per channel. Arranged using the customized layout feature or the enhanced layout feature.

3.3.34 Camera ID Display

Number of Displays 2 (LABEL-1, LABEL-2) (*1)

Iris Display 1 (IRIS) (*1)

Control Method Instrument, RS-422/485 connector (SER27)

*1 The number of displays per channel. Arranged using the customized layout feature or the enhanced layout feature.

3. SPECIFICATIONS

3.3.35 General Specifications

Environmental Conditions

Operating Temperature 0 to 40 °C

Operating Humidity Range 85 %RH or less (no condensation)

Optimal Temperature 10 to 30 °C

Operating Environment Indoors

Elevation Up to 2,000 m

Overvoltage Category II

Pollution Degree 2

Power Requirements

Voltage 90 to 250 VAC

Frequency 50/60Hz

Power Consumption 160 W max.

Dimensions

LV5600 215 (W) × 132 (H) × 298 (D) mm (excluding protrusions)

LV7600 426 (W) × 44 (H) × 300 (D) mm (excluding protrusions)

Weight

LV5600 4.6 kg max. (including options, excluding accessories)

LV7600 4.2 kg max. (including options, excluding accessories)

Accessories

LV5600, LV7600 Power cord 1

Cover/Inlet stopper....1

15-pin D-sub connector....1

15-pin D-sub connector cover....1

Instruction manual (CD-ROM) 1

LV5600-SER03, LV7600-SER03

37-pin D-sub connector....1

37-pin D-sub connector cover....1

4. PANEL DESCRIPTION

4. PANEL DESCRIPTION

4.1 Front Panel

Leader WAVEFORM MONITOR LV5600 1 2 3 4 5 6 7 8 9 10 11 12 13 14 15 16 17 18 19 20 21 22 F-1 F-2 F-3 F-4 F-5 F-6 F-7 INPUT EXT SYS CAP MEM RECALL S-CUT VFM VECT PIC AUDIO STATUS EYE MULTI USB

Figure 4-1 LV5600 front panel

Table 4-1 LV5600 front panel description

No.NameDescription
1LCDDisplays measurement and setup screens. Control the instrument with the touch panel.
2F•1 to F•7Carries out the corresponding function menu operation.[See also] 5.6.2, "Function Menu Operations"
3Power SwitchPress to turn the instrument on. Hold down to turn the instrument off.[See also] 5.2, "Turning the Instrument On and Off"
4INPUTSets the display channel.[See also] 6.1, "Setting the Input Signals"
5EXTSwitches the sync signal. When the internal sync signal is being used, this key's LED turns off. When the external sync signal is being used, this key's LED lights.[See also] 5.5.2, "External Sync Signal Input"
6SYS Configures thesettings[See also] 7, "SYSTEM SETTINGS."
7CAP Captures the screen[See also] 8, "CAPTURE FEATURE"
8MEM Press this keyto register or delete a single preset setting, or copy all preset settings.[See also] 9, "PRESET FEATURE"
9RECALLPress this key to recall a preset setting configuration.[See also] 9, "PRESET FEATURE"
  1. PANEL DESCRIPTION
No.NameDescription
10S-CUTLoads panel settings, saves a screen capture to the USB memory device, adjusts the intensity, performs cursor measurement, or adjusts the headphone volume.[See also] 6.4, "Operation Key Actions"
11WFMShows the video signal waveform display. You can change the layout as you like.[See also] 10, "Video Signal Waveform Display."
12VECTShows vectors. You can change the layout as you like.[See also] 11, "VECTOR DISPLAY"
13PICShows the picture display. You can change the layout as you like.[See also] 13, "PICTURE DISPLAY"
14AUDIOShows the audio display. You can change the layout as you like.[See also] 15, "AUDIO DISPLAY"
15STATUSShows the status. You can change the layout as you like.[See also] 16, "Status Display"
16EYE(SER02)The eye pattern is displayed. You can change the layout as you like.[See also] 17, "EYE PATTERN DISPLAY (SER02)"
17MULTIShows a combination of measurement screens. You can change the layout as you like.[See also] 6.3.7, "MULTI-SCREEN DISPLAY"
18V POSTurn to adjust the vertical position of the video signal waveform or other item. Press to return to the reference position.
19H POSTurn to adjust the horizontal position of the video signal waveform or other item. Press to return to the reference position.
20F•DTurn to specify a numeric value or to move cursors. In most cases, press to reset the value to its default value.
21USBConnect a USB memory device, USB mouse, or touch panel monitor.[See also] 5.3, "Connecting USB Devices."
22HeadphonejackThis is a mini-plug headphone jack. When a pair of headphones are connected to this jack, the instrument transmits the audio signal embedded in the SDI signal or the audio signal (SER03) received through its rear panel.
  1. PANEL DESCRIPTION
    Leader LV5600 - Front Panel - 2

Figure 4-2 LV7600 front panel

Table 4-2 LV7600 front panel description

No.NameDescription
1Power SwitchPress to turn the instrument on. Hold down to turn the instrument off.[See also] 5.2, "Turning the Instrument On and Off"
2INPUT Sets the display channel.[See also] 6.1, "Setting the Input Signals"
3CAP Captures the screen[See also] 8, "CAPTURE FEATURE"
4MEM Press this key to register or delete a single preset setting, or copy all preset settings.[See also] 9, "PRESET FEATURE"
5F•1 to F•7Carries out the corresponding function menu operation.[See also] 5.6.2, "Function Menu Operations"
6FORMSwitches the video signal waveform and vector display format. The display format types and order can be changed as you like.[See also] 6.4, "Operation Key Actions"
7OVLAYSwitches the video signal waveform display format. When the overlay display (video signal waveforms are displayed on top of each other) is in use, this key's LED lights. When the parade display (video signal waveforms are displayed side by side) is in use, this key's LED turns off.[See also] 6.4, "Operation Key Actions"
8GAINSwitches the video signal waveform and vector gain. When fixed gain is being used, this key's LED turns off. When variable gain is being used, this key's LED lights.[See also] 6.4, "Operation Key Actions"
9SWEEPSwitches the video signal waveform sweep method. When line display is being used, this key's LED turns off. When field/frame display is being used, this key's LED lights. The sweep method types and order can be changed as you like.[See also] 6.4, "Operation Key Actions"
10SELECT ▶Carries out the corresponding function menu operation.[See also] 5.6.2, "Function Menu Operations"
11V POSTurn to adjust the vertical position of the video signal waveform or other item. Press to return to the reference position.
12H POSTurn to adjust the horizontal position of the video signal waveform or other item. Press to return to the reference position.
13F•DTurn to specify a numeric value or to move cursors. In most cases, press to reset the value to its default value.
14PHONESThis is a mini-plug headphone jack. When a pair of headphones are connected
  1. PANEL DESCRIPTION
No.NameDescription
to this jack, the instrument transmits the audio signal embedded in the SDI signal or the audio signal (SER03) received through its rear panel.
15USBConnect a USB memory device, USB mouse, or touch panel monitor.[See also] 5.3, “Connecting USB Devices.”
16EXTSwitches the sync signal. When the internal sync signal is being used, this key’s LED turns off. When the external sync signal is being used, this key’s LED lights.[See also] 5.5.2, “External Sync Signal Input”
17SYS Configures the settings[See also] 7, “SYSTEM SETTINGS.”
18RECALLPress this key to recall a preset setting configuration.[See also] 9, "PRESET FEATURE"
19WFMShows the video signal waveform display. You can change the layout as you like.[See also] 10, “Video Signal Waveform Display.”
20VECTShows vectors. You can change the layout as you like.[See also] 11, “VECTOR DISPLAY”
21PICShows the picture display. You can change the layout as you like.[See also] 13, “PICTURE DISPLAY”
22AUDIOShows the audio display. You can change the layout as you like.[See also] 15, “AUDIO DISPLAY”
23STATUSShows the status. You can change the layout as you like.[See also] 16, “Status Display”
24EYE(SER02)The eye pattern is displayed. You can change the layout as you like.[See also] 17, “EYE PATTERN DISPLAY (SER02)”
25MULTIShows a combination of measurement screens. You can change the layout as you like.[See also] 6.3.7, “MULTI-SCREEN DISPLAY”
26S-CUTLoads panel settings, saves a screen capture to the USB memory device, adjusts the intensity, performs cursor measurement, or adjusts the headphone volume.[See also] 6.4, “Operation Key Actions”
27FILTERSwitches the video signal waveform filter. When FLAT is being used, this key’s LED turns off. Otherwise, this key’s LED lights. During pseudo-composite display, the filter types and order can be changed as you like.[See also] 6.4, “Operation Key Actions”
28MAG(GAIN)Switches the video signal waveform and vector gain. When X1 is being used, this key’s LED turns off. Otherwise, this key’s LED lights. The vector gain types and order can be changed as you like.[See also] 6.4, “Operation Key Actions”
29MAG(SWEEP)Switches the video signal waveform horizontal magnification. When X1 is being used, this key’s LED turns off. Otherwise, this key’s LED lights. The magnification types and order can be changed as you like.[See also] 6.4, “Operation Key Actions”

4.2 Rear Panel

1 2 3 4 5 6 7 8 9 10 11 12 13 SDI OUTPUT SDI INPUT MONITOR SDI OUTPUT TMSB OUTPUT IP 1 DIGITAL AUDIO INPUT/OUTPUT CH 1/2 A CH 3/4 A CH 5/8 A CH 7/8 A ANALOG AUDIO 90-210V~ 80/10Hz 130W max CAT II s/n 1234567 EXT REF 7 C LC OP THRY HIGH ETHERNET Leader Electronic Corp. Made In Ju en REMOTE RS-432/436 INPUT OUTPUT

Figure 4-3 LV5600 rear panel (SER01/SER02/SER03/SER05)

Table 4-3 LV5600 rear panel description

No.NameDescription
1SDI OUTPUT(SER01/SER02)SDI signal output connectors[See also] 5.5.1, "SDI Signal I/O."
2SDI INPUT(SER01/SER02)SDI signal input connectors.[See also] 5.5.1, "SDI Signal I/O."
3MONITORTransmits the screen image.[See also] 5.5.6, "Transmitting Monitor Signals"
4IP(SER05)IP signal input connectors. These are used by installing an SFP+ module sold separately.[See also] 5.4, "Installing the SFP+ Module (SER05)"
5DIGITAL AUDIOINPUT/OUTPUT(SER03)Digital audio signal I/O connectors. Switch between input and output using audio menu.[See also] 5.5.4, "Digital Audio I/O (SER03)."
6ANALOG AUDIO(SER03)Analog audio signal I/O connectors. Switch between input and output using audio menu.[See also] 5.5.5, "Analog Audio Signal I/O (SER03)"
7AC inletAn inlet for receiving AC power. Attach the included cover/inlet stopper to the AC inlet.[See also] 5.1, "Attaching the Cover Inlet Stopper"
8Serial numberlabelThe serial number is printed on this label.
  1. PANEL DESCRIPTION
No.NameDescription
9EXT REFExternal reference input connector. This is a loop-through connector.[See also] 5.5.2, “External Sync Signal Input”
10ETHERNETEthernet port. Supports TELNET, FTP, SNMP, HTTP, and SNTP.
11REMOTE15-pin D-sub remote connector. This can be used to execute actions such as recalling preset settings.
12RS-422/485(SER27)Receives tally, camera ID, and camera iris signals through serial communication and displays them.
13Ground terminalConnect the instrument to an external ground.
  1. PANEL DESCRIPTION
    Leader LV5600 - Rear Panel - 2

Figure 4-4 LV7600 rear panel (SER01/SER02/SER03/SER05)

Table 4-4 LV7600 rear panel description

No.NameDescription
1SDI INPUT(SER01/SER02)SDI signal input connectors.[See also] 5.5.1, "SDI Signal I/O."
2MONITOR Transmitsthe screen image.[See also] 5.5.6, "Transmitting Monitor Signals"
3EXT REFExternal reference input connector. This is a loop-through connector.[See also] 5.5.2, "External Sync Signal Input"
4IP(SER05)IP signal input connectors. These are used by installing SFP+ modules sold separately.[See also] 5.4, "Installing the SFP+ Module (SER05)"
5REMOTE15-pin D-sub remote connector. This can be used to execute actions such as recalling preset settings.
6ANALOG AUDIO(SER03)Analog audio signal I/O connectors. Switch between input and output using audio menu.[See also] 5.5.5, "Analog Audio Signal I/O (SER03)"
7Ground terminalConnect the instrument to an external ground.
8AC inletAn inlet for receiving AC power. Attach the included cover/inlet stopper to the AC inlet.[See also] 5.1, "Attaching the Cover Inlet Stopper"
9Serial number labelThe serial number is printed on this label.
10SDI OUTPUT(SER01/SER02)SDI signal output connectors[See also] 5.5.1, "SDI Signal I/O."
11RS-422/485(SER27)Receives tally, camera ID, and camera iris signals through serial communication and displays them.
12ETHERNETEthernet port. Supports TELNET, FTP, SNMP, HTTP, and SNTP.
13DIGITAL AUDIOINPUT/OUTPUT(SER03)Digital audio signal I/O connectors. Switch between input and output using audio menu.[See also] 5.5.4, "Digital Audio I/O (SER03)."

5. BEFORE YOU BEGIN MEASURING

5. BEFORE YOU BEGIN MEASURING

5.1 Attaching the Cover Inlet Stopper

A cover/inlet stopper is included with the instrument. Use this device to prevent the power cord from being pulled free of the AC inlet. To attach the cover/inlet stopper, follow the procedure below.

- Installation

  1. Cover the power cord with the cover/inlet stopper.

Leader LV5600 - Attaching the Cover Inlet Stopper - 1

natural_image Technical line drawing of a mechanical component with an arrow indicating assembly (no text or symbols present)
  1. Push the cover/inlet stopper, until you hear a click, to attach it to the AC inlet.

Leader LV5600 - Attaching the Cover Inlet Stopper - 2

  1. Check that the cover/inlet stopper is securely attached to the AC inlet.

- Removing the Cover/Inlet Stopper

  1. Release the lock by using two fingers to press the cover/inlet stopper levers.

Leader LV5600 - Attaching the Cover Inlet Stopper - 3

  1. Pull the cover/inlet stopper away from the AC inlet.

Leader LV5600 - Attaching the Cover Inlet Stopper - 4

natural_image Technical line drawing of a mechanical component being inserted into a housing (no text or symbols)

5. BEFORE YOU BEGIN MEASURING

5.2 Turning the Instrument On and Off

To turn on the power, press the power switch. The power switch LED lights, and the instrument turns ON. When you turn ON the power, the instrument starts up with the same panel settings that were set when it was last turned OFF.

To turn off the power, hold down the power switch for at least 2 seconds. The power switch LED and the instrument turn OFF.

5.3 Connecting USB Devices

The front panel has two USB ports. You can connect a USB memory device, USB mouse, or touch panel monitor to these ports. You can connect the devices to either USB port, but you cannot connect the same type of devices to the instrument simultaneously.

USB devices can be connected or removed with the power turned on.

- USB Memory Device

When a USB memory devices is connected, a USB memory icon 📋 appears in the upper right of the screen.

You can save various types of data in a USB memory device.

This icon is normally green, but it changes to red when the USB memory device is being accessed. Do not turn the power OFF or remove the USB memory device when the icon is red.

- USB Mouse

When a USB mouse is connected, a mouse icon 📂 appears in the upper right of the screen. Basic operations can be performed without a mouse, but arranging the measurement screen layout requires a mouse or touch panel control.

[See also] 6.5, "Customized Layout (SER26)," 6.6, "Enhanced Layout (SER26)"

- Touch Panel Monitor

When the USB touch panel interface of a touch panel monitor is connected, a mouse icon appears in the upper right of the screen. The video interface of the touch panel monitor is connected to the monitor output connector.

Basic operations can be performed without a touch panel, but arranging the measurement screen layout requires a mouse or touch panel control.

[See also] 6.5, "Customized Layout (SER26)," 6.6, "Enhanced Layout (SER26)"

5. BEFORE YOU BEGIN MEASURING

5.4 Installing the SFP+ Transceiver Module (SER05)

If the SER05 is installed, the rear panel has two IP input connectors. Install SFP+ modules sold separately.

You can connect and disconnect an SFP+ transceiver module with the power turned on.

To install it, follow the procedure below.

- Installation

  1. Pay attention to the orientation of the SFP+ module, and insert the module into IP input connector 1.

Leader LV5600 - Installing the SFP+ Transceiver Module (SER05) - 1

natural_image Technical line drawing of a mechanical component with an arrow indicating direction (no text or symbols)
  1. Push it in until a click is heard.
  2. Install another module into 2 in a similar manner.

- Uninstallation

Pinch the SFP+ transceiver module with your fingers, and pull it out. Do not pull the cable.

5. BEFORE YOU BEGIN MEASURING

5.5 Signal I/O

5.5.1 SDI Signal I/O

LV5600 SDI OUTPUT SDI INPUT 1 1 2 2 3 3 4 4 LV7600 1 2 3 4 SDI INPUT 1 2 3 4 SDI OUTPUT

* When an SER01 or SER02 is installed

Figure 5-1 SDI I/O connectors

• SDI Signal Input SDI INPUT 1 to 4

These are the input connectors for the link system.

Apply signals that are specified in section 3.3.1, "SDI Video Formats and Standards," and section 3.3.2, "SDI Audio Formats and Standards."

Select the SDI System on the SDI IN SETUP1 tab of the SYS menu, and then apply signals to SDI INPUT 1 to 4.

[See also] SDI IN SETUP1 tab → 7.1.1, "Configuring the SDI Input Connectors."

Table 5-1 SDI signal input

Link SystemConnector Type
Single linkApply to SDI INPUT 1, 2, 3, and 4 (up to four inputs)
Dual linkApply to SDI INPUT 1/2 and 3/4 (up to two inputs)
Quad linkApply to SDI INPUT 1/2/3/4 (up to one input)

5. BEFORE YOU BEGIN MEASURING

• SDI Signal Output SDI OUTPUT 1 to 4

There are two SDI signal output settings: Input Through and Test Signal. You can set it on the SDI OUT tab of the SYS menu.

- Input Through

SDI OUTPUT 1 to 4 transmit reclocked signals of the signals received through SDI INPUT 1 to 4. Use the signals for monitoring.

For single link, you can select whether to assign SDI OUTPUT 1 to SDI INPUT 1 or a channel that you select on the SDI OUT tab. If you select to use a channel that you select, set the output channel using the INPUT menu or F•6 INPUT SELECT in the appropriate measurement screen. If SER26 is installed, you can also output the signal assigned with Display Assignment on the SDI IN SETUP1 tab.

For IP, signals are converted into HD-SDI and output.

- Test Signal

SDI OUTPUT 1 to 4 output various patterns. You can superimpose a moving box, vary the phase, and so on. You can use the instrument as a signal generator.

- Terminators

The SDI input connectors are terminated internally at 75 Ω , so there is no need to connect terminators to them. Connect cables with a characteristic impedance of 75 Ω .

- Setting the Display Channels

Configure the display channels using the SDI IN SETUP1 tab of the SYS menu and the INPUT menu.

[See also] 6.2, "Setting the Signals to Measure"

- Cables

It has been confirmed that errors do not occur when the instrument receives an 800 mVp-p stress pattern through the following cables.

Input SignalCable TypeInput Connector (SDI INPUT 1 to 4)Video Pattern
12GL5.5CUHD cable70 mCheck field
3GLS-5CFB cable70 mCheck field
HDLS-5CFB cable110 mCheck field
SDL-5C2V cable200 mCheck field

5. BEFORE YOU BEGIN MEASURING

5.5.2 IP Signal Input (SER05)

LV5600 IP 1 2 LV7600 IP 1 2

* When SFP+ modules (sold separately) are installed

Figure 5-2 IP input connectors

Install the SFP+ modules sold separately, and then apply signals to IP 1 and 2. Because IP 1 and 2 take on a redundant structure, when applying signals to both connectors, apply the same signal to them. If you are applying the signal to one of the connectors, apply it to IP 1. To configure IP settings, use the SDI IN SETUP1, IP SETUP1, and IP SETUP2 tabs of the SYS menu.

[See also] SDI IN SETUP1 tab → 7.1.1, "Configuring the Input System," 7.1.2 "Input Signal Assignment" IP SETUP1 tab → 7.1.10, "Configuring the IP Signal Settings (SER05)" IP SETUP2 tab → 7.1.11, Configuring PTP Settings (SER05)," 7.1.12, "Setting the Video Format (SER05)"

- SDI IN SETUP1 Tab

Set the SDI System to 2K SD/HD/3G-A/3G-B-DL. Then, set Display Assignment Type to IP (when the SER26 is not installed), or assign IP Stream1 to 4 to Input-A to D (when the SER26 is installed). If Type is set to IP, IP Stream1 to 4 are assigned to Input-A to D, respectively.

- IP SETUP1 Tab

Set the signal standard, IP address, and port number. You can set the IP address and port number for each stream.

- IP SETUP2 Tab

Configure the PTP and video format settings.

5. BEFORE YOU BEGIN MEASURING

5.5.3 External Sync Signal Input

LV5600 EXT REF 75Ω LOOP THROUGH

LV7600 EXT REF 75Ω LOOP THROUGH

Figure 5-3 External sync signal input connectors

On the video-signal-waveform and vector displays, you can apply an external sync signal to display waveforms. (*1) Apply an external sync signal to an external sync signal input connector, and then press EXT. The instrument determines the sync signal format automatically.

As shown in the figure below, the external sync signal input connectors are loop-through. Apply the input signal to one of the two connectors, and terminate the other connector at 75 Ω, or connect it to another 75 Ω device. If you connect to another device, be sure to terminate the device at the end of the chain at 75 Ω. Connect cables with a characteristic impedance of 75 Ω.

LV5600 or LV7600 EXT REF LOOP THROUGH

Figure 5-4 Loop-through

*1 Waveform display using an external sync signal is not possible for the following formats.

• IP input video signal using SER05
• 3G's 720/30P, 720/29.97P, 720/25P, 720/24P, 720/23.98P
• HD(DL)'s 1080/60P, 1080/59.94P, 1080/50P
• 3G(DL), 3G(QL), HD(QL), 12G
• Frame frequency 48P, 47.95P

5. BEFORE YOU BEGIN MEASURING

External sync signals that are compatible with each input signal are indicated with a check mark in the following table.

Proper measurement is possible only for combinations that are indicated with check marks.

Table 5-2 External sync signal formats (SD, HD)

SDI (SD, HD) Input Signal Format
525/59.94I625/50I1080/60I1080/59.94I1080/50I1080/30PsF1080/29.97PsF1080/25PsF1080/24PsF1080/23.98PsF1080/30P1080/29.97P1080/25P1080/24P1080/23.98P720/60P720/59.94P720/50P720/30P720/29.97P720/25P720/24P720/23.98P
External Sync Signal FormatNTSC with 10 field ID (59.94Hz)(*1)
NTSC (59.94Hz)
PAL (50Hz)
1080/60I
1080/59.94I
1080/50I
1080/24PsF
1080/23.98PsF
1080/30P
1080/29.97P
1080/25P
1080/24P
1080/23.98P
720/60P
720/59.94P
720/50P
720/30P
720/29.97P
720/25P
720/24P
720/23.98P

*1 If the input signal is 1080/23.98PsF or 1080/23.98P, the 10 field ID is automatically detected.

5. BEFORE YOU BEGIN MEASURING

Table 5-3 External sync signal formats (3G)

1080/60P1080/59.94P1080/50P1080/60I1080/59.94I1080/50I1080/30PsF1080/29.97PsF1080/25PsF1080/24PsF1080/23.98PsF1080/30P1080/29.97P1080/25P1080/24P1080/23.98P720/60P720/59.94P720/50P
External Sync Signal FormatNTSC with 10 field ID (59.94Hz)(*1)
NTSC (59.94Hz)
PAL (50Hz)
1080/60I
1080/59.94I
1080/50I
1080/24PsF
1080/23.98PsF
1080/30P
1080/29.97P
1080/25P
1080/24P
1080/23.98P
720/60P
720/59.94P
720/50P

*1 If the input signal is 1080/23.98PsF or 1080/23.98P, the 10 field ID is automatically detected.

5. BEFORE YOU BEGIN MEASURING

Table 5-4 External sync signal formats (12G)

SDI (12G) Sub ImageInput Signal Format (*1)
1080/60P1080/59.94P1080/50P1080/30P1080/29.97P1080/25P1080/24P1080/23.98P
External Sync Signal FormatNTSC with 10 field ID (59.94Hz)(*2)
NTSC (59.94Hz)
PAL (50Hz)
1080/60I
1080/59.94I
1080/50I
1080/30P
1080/29.97P
1080/25P
1080/24P
1080/23.98P

*1 If the input signal is 12G, the phase difference is measured for the 4k sub image format.
*2 If the input signal is 1080/23.98PsF or 1080/23.98P, the 10 field ID is automatically detected.

5. BEFORE YOU BEGIN MEASURING

5.5.4 Digital Audio I/O (SER03)

LV5600 DIGITAL AUDIO INPUT/OUTPUT CH 1/2 A CH 3/4 A CH 5/6 A CH 7/8 A CH 1/2 B CH 3/4 B CH 5/6 B CH 7/8 + LV7600 DIGITAL AUDIO INPUT/OUTPUT A CH 1/2 CH 3/4 CH 5/6 CH 7/8 CH 1/2 CH 3/4 CH 5/6 CH 7/8 + - - - - - - - - - - - - - - - - - - - - - - - - - - - - - - - - - - - - - - - - - - - - - - - - - - - - -

* When an SER03 is installed

Figure 5-5 Digital audio I/O connectors

- Input/Output Switching

The connectors can be switched between input and output in groups (A and B). Under EXTERNAL AUDIO on the AUDIO IN/OUT tab of the AUDIO menu, select Input or Output.

[See also] AUDIO IN/OUT tab → 15.1.4, "Configuring the Audio I/O Connectors (SER03)"

• Audio Signal Output

If group A or B is set to output, the following signals are output. Use the signals for monitoring.

Table 5-5 Audio signal output

INPUTCH MODEGroup A OutputGroup B Output
SDI8ch8 channels in the1st GROUP and 2nd GROUP8 channels in the1st GROUP and 2nd GROUP
16ch 8 channels in the1st GROUP and 2nd GROUP8 channels in the3rd GROUP and 4th GROUP
EXT AUDIO 8ch- (Input)8 channels applied to group A
8 channels applied to group B- (Input)
16ch- (Input)- (Input)

5. BEFORE YOU BEGIN MEASURING

5.5.5 Analog Audio Signal I/O (SER03)
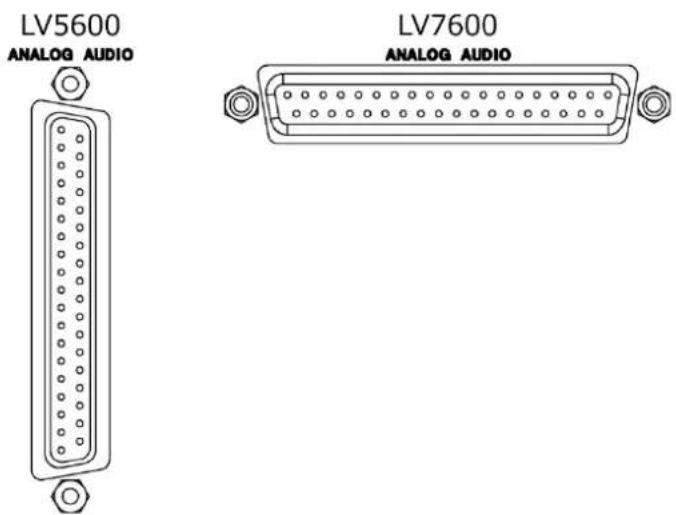
LV5600 ANALOG AUDIO LV7600 ANALOG AUDIO

* When an SER03 is installed

Figure 5-6 Analog Audio Signal I/O Connector

- Input/Output Switching

This connector is used by switching between input and output.

Under ANALOG AUDIO on the AUDIO IN/OUT tab of the AUDIO menu, select Input or Output.

[See also] AUDIO IN/OUT tab → 15.1.4, "Configuring the Audio I/O Connectors (SER03)"

• Audio Signal Output

8 audio signal channels displayed on the screen are output. Use the signals for monitoring.

5. BEFORE YOU BEGIN MEASURING

5.5.6 Monitor Signal Output

LV5600 MONITOR SDI OUTPUT TMDS OUTPUT LV7600 MONITOR SDI OUTPUT TMDS OUTPUT

Figure 5-7 Monitor output connectors

The SDI OUTPUT connector and TMDS OUTPUT connector transmit the instrument's screen for monitoring purposes. Connect to an full high definition (1920×1080) display.

- Selecting the Sync Mode

On the MONITOR OUT tab of the SYS menu, select internal synchronization or external synchronization. If you select internal synchronization, you can also select the output format.

[See also] MONITOR OUT tab → 7.1.8, "Configuring the Monitor Output Connectors"

5.6 Operation Basics

5.6.1 Displaying the Function Menu

Use the function menu to change the various settings.

Normally the function menu is displayed, but it can be cleared by pressing the mode key that is currently selected. You can also set it to disappear automatically on the GENERAL tab of the SYS menu.

[See also] GENERAL tab → 7.2.1, "General Settings"

If the measurement menu disappears, carry out one of the following operations to display it again. When you perform this operation, the menu is displayed at the level that was displayed before it disappeared.

- Displaying the Menu by Pressing the Mode Key

Press the currently selected mode key (WFM, VECT, PIC, AUDIO, STATUS, or EYE) to display the menu again.

In multi-screen display, you can select whether to switch the measurement screen with the mode keys (WFM, VECT, PIC, AUDIO, STATUS, and EYE) on the GENERAL tab of the SYS menu.

[See also] GENERAL tab → 7.2.1, "General Settings"

- Pressing a Function Key to Display a Menu

Press one of the function keys to display the menu again.

5.6.2 Function Menu Operations

This section explains how to operate the function menu, using the WFM → F•1 WFM INTEN/CONFIG menu as an example.

WHITE YELLOW CYAN GREEN MAGENTA RED BLUE MULTI F1 F2 WFM MODE F3 WFM INTENSITY -F4 WFM COLOR F5 WFM SCALE F6 INPUT SELECT A F7(up menu) -F·1 F·2 F·3 F·4 F·5 F·6 F·7

Figure 5-8 Function menu operations

- Specifying Values

To set the value of a setting like F•3 WFM INTENSITY, which is shown in the figure above, press F•3, and then turn the function dial (F•D). You can reset most settings to their default values by pressing the function dial (F•D).

5. BEFORE YOU BEGIN MEASURING

- Selecting Settings

To select a setting from a list like the one shown in the figure above for F•4 WFM COLOR, press F•4 several times to select the setting you want. The setting changes each time you press F•4. After you stop pressing F•4, the setting is confirmed and the pop-up menu disappears.

When the options are on and off or start and stop, the setting toggles each time you press the key.

- Selecting Settings Using the ◀ SELECT ▶ Key (LV7600)

On the LV7600, you can use the ◀ SELECT ▶ key to operate the function menu. Press the ◀ ▶ key to move horizontally, and press SELECT to select.

The menu level changes. If there is no applicable menu item, the selection moves to the left menu item.

5.6.3 Mouse and Touch Panel Control

You can use the mouse or touch panel to control the keys on the screen to specify settings in the same manner as using the front panel keys. To display the keys, connect a mouse, and click in the screen or tap the screen.

Mouse and touch panel can be used at the same time.

To use touch panel control on the LV7600, connect the USB touch panel interface of a touch panel monitor using a USB cable. Connect the video interface of the touch panel monitor to the monitor output connector.
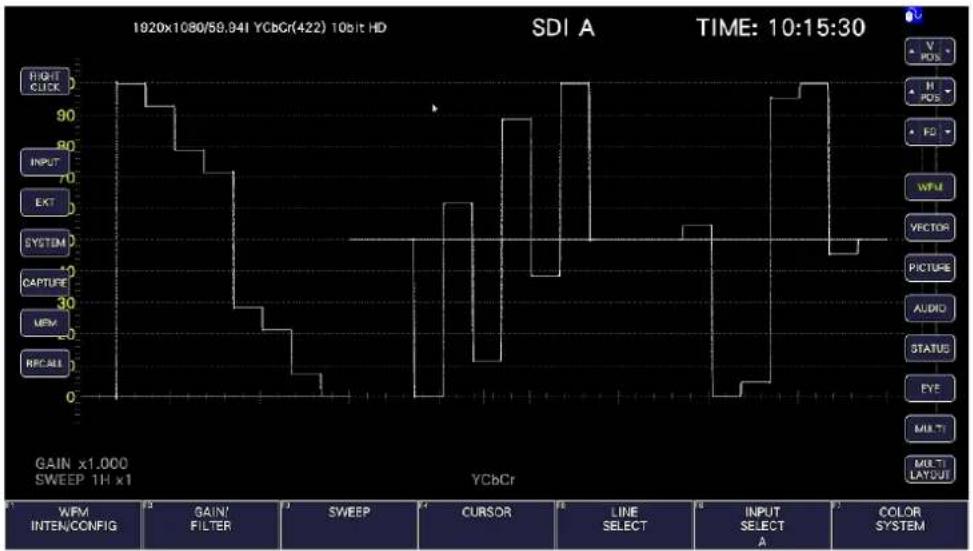
Leader LV5600 - Mouse and Touch Panel Control - 1

line | Signal | Value | |-----------------|-------| | RIGHT CLICK | 0 | | INPUT | 90 | | EXT | 70 | | SYSTEM | 30 | | CAPTURE | 90 | | MEV | 30 | | RECALL | 0 |

Figure 5-9 Mouse and touch panel control

• Measurement Screen Settings

Click or tap the keys on the screen and the function menu.

You can change a value in the function menu by using the ▲▼ key to the left and right of FD, the ▲▼ key to the left and right of the value, or the mouse wheel.

5. BEFORE YOU BEGIN MEASURING

- Tab Screen Settings

Click or tap the setting on the screen and the function menu.

You can change a value on a tab screen by using the ▲▼ key to the left and right of FD or the mouse wheel.

- Moving Cursors

Cursors on video signal waveforms can be moved easily with a mouse or touch panel.

When using a mouse, click a cursor to select it, and then click a position to move the cursor. To unselect, right-click. A portion of the cursors can be moved with a mouse wheel. If you use a mouse wheel, right-click to set the position.

When using the touch panel, tap a cursor to select it, and then tap a position to move the cursor.

- Right-Click Menu

Right-click the mouse or click or tap RIGHT CLICK at the upper left of the screen to display the following menu.

LAYOUT is an item that can only be set using the mouse or touch panel.

Table 5-6 Right-click menu

MenuDescription
ALL CLEARHides the keys and function menu from the screen.Click in the screen to redisplay them.
KEY CLEARHides the keys from the screen.Click in the screen to redisplay them.
MENU CLEAR Hides the function menu.Click in the screen to redisplay it.
LAYOUTCreates a measurement screen layout.[See also] 6.5, “Customized Layout (SER26)”
ENHANCED LAYOUTCreates a measurement screen layout.This option can be selected in simul mode.[See also] 6.6, “Enhanced Layout (SER26)”

5. BEFORE YOU BEGIN MEASURING

5.6.4 Tab Menu Operations

Normally, the function menus are used to configure the various settings. However, tab menus—such as that shown below—are displayed in some situations.

This section explains how to operate the tab menu, using the GENERAL tab menu as an example.

GENERAL CAPTURE&DISPLAY NETWORK REMOTE RS486 CAMERA ID TALLY OPERATION KEY DATE&TIME General Preset Overwrite Disable Enable Fan Speed 4 Screenover Off [min] LCD Auto Off Off [min] Touch Panel Disable Enable Function Menu Mode Key Direct Single Multi/Single Common Auto Off Off [sec] Recall Recall Menu Function Menu On-screen Menu Auto Off Off [sec] Operation Key Off On COMPLETE PREV NEXT up TAB TAB TALY up menu

Figure 5-10 Tab menu operations

- Moving Cursors

To move the cursor, turn the function dial (F•D). Depending on what you are setting, there are some items in which you cannot move the cursor.

- Switching Tabs

When there are multiple tabs, such as in the figure above, F•2 PREV TAB and F•3 NEXT TAB to change between tabs. If you switch to another tab, the settings are retained, but they are not confirmed until you press F•1 COMPLETE.

- Selecting a Check Box

Move the cursor to the check box that you want to select, and press the function dial (F•D).

- Entering Values

Move the cursor to the item that you want to enter the value for, and press the function dial (F•D). Turn the function dial (F•D) to set the value. To confirm the value that you have set, press the function dial (F•D) again.

- Confirming Settings

Press F•1 COMPLETE to apply the settings from all the tabs and return to the screen that is one level up.

- Canceling Settings

Press F•7 up menu to cancel the settings from all the tabs and return to the screen that is one level up.

5. BEFORE YOU BEGIN MEASURING

5.6.5 Setting the Key Lock

You can prevent unintentional operations on the instrument by enabling the key lock. The key lock disables all the keys except for the power switch.

Mouse and touch panel control are also disabled.

- Enabling the Key Lock

Hold down SYS until the following message is displayed on the screen. While the key lock is enabled, the key lock icon 🔗 appears in the upper right of the screen.

KEYLOCK !!

Press 'SYS' for 2 sec.

Figure 5-11 Enabling the key lock

- Releasing the Key Lock

Hold down SYS until the following message is displayed on the screen.

KEYLOCK !!

Canceled.

Figure 5-12 Releasing the key lock

5. BEFORE YOU BEGIN MEASURING

5.7 Measurement Screen Description

The measurement screen layout can be arranged as you like. This section explains items that are common to all displays.

Leader LV5600 - Measurement Screen Description - 1

line | Event | Value | |-----------------|-------| | RIGHT CLICK | 1 | | INPUT | 90 | | EXT | 80 | | SYSTEM | 70 | | CAPTURE | 60 | | MEM | 50 | | RECALL | 40 | | GAIN x1.000 | 30 | | SWEEP 1H x1 | 20 | | YCbCr | 1 | | V POS | 2 | | H POS | 3 | | FD | 4 | | WFM | 5 | | VECTOR | 6 | | PICTURE | 7 | | AUDIO | 8 | | STATUS | 9 | | EYE | 10 | | MULTI | 11 | | MULTI LAYOUT | 12 | | WFM INTEN/CONFIG | 13 | | GAIN FILTER | 14 | | SWEEP | 15 | | CURSOR | 16 | | LINE SELECT | 17 | | INPUT SELECT A | 18 | | COLOR SYSTEM | 19 |

Figure 5-13 Measurement screen description

Table 5-7 Measurement screen description

No.NameDescription
1 OVER HEATFAN ALARM"OVER HEAT" appears when the internal temperature increases."FAN ALARM" appears when a fan error occurs.If either of these alarm appears, immediately turn the power off,and then check for problems with the operating environment. If thisalarm appears even though there are no problems with theoperating environment, contact your local LEADER agent.[See also] 7.2.17, "Displaying System Information."
2TEMPERATUREAppears when the internal temperature increases. You can alsochoose to hide this information.[See also] 7.2.17, "Displaying System Information" and 7.2.1,"General Settings."
3ERRORAppears when an input signal error occurs.(*1) You can also chooseto hide this information.To configure error detection settings, use F•5 STATUS SETUP on theSTATUS menu or F•4 ERROR SETUP on the EYE menu.[See also] 7.2.17, "Displaying System Information" and 7.2.1,"General Settings."
4Mouse iconAppears when a USB mouse is connected or the USB interface of atouch panel monitor is connected. You can also choose to hide thisinformation.[See also] 5.3, "Connecting USB Devices," and 7.2.1, "GeneralSettings"
5Key lock iconAppears when key lock is enabled. You can also choose to hide thisinformation.[See also] 5.6.5, "Setting the Key Lock," and 7.2.1, "GeneralSettings"
6USB memory iconThis appears when a USB memory device is connected. You can alsochoose to hide this information.[See also] 5.3, "Connecting USB Devices," and 7.2.1, "GeneralSettings"
7Screen keysKeys on the screen that you operate with a mouse or the touchpanel.[See also] 5.6.3, "Mouse and Touch Panel Control"
8Function menuA menu for configuring settings.[See also] 5.6.1, "Displaying the Function Menu."

*1 All channels are applicable. However, when measuring 12G, 3G-B-DS or 3G(DL)-4K, only on the currently displayed channels are applicable.

6. BASIC OPERATION

6. BASIC OPERATION

6.1 Setting the Input Signals

This section explains the INPUT menu settings and input format display.

6.1.1 Selecting the Input Mode

When SDI System on the SDI IN SETUP1 tab is set to SD/HD/3G-A/3G-B-DL, or HD Dual Link, to select the input mode, follow the procedure below.

Procedure

INPUTF•7DISPLAY : SINGLE / SIMUL

Settings

SINGLE:The instrument operates in single input mode.
It is a mode for measuring a single signal that has been turned on using F•1 to F•4.
SIMUL:The instrument operates in simul mode.
It is a mode for measuring multiple signals that have been turned on using F•1 to F•4.

DISPLAY = SINGLE
Leader LV5600 - Selecting the Input Mode - 1

line | Signal | Value | |--------|-------| | A | ON | | B | OFF | | C | OFF | | D | OFF | | E | OFF | | F | COM | | G | SINGLE| | H | SINGLE| | I | SINGLE| | J | SINGLE| | K | SINGLE| | L | SINGLE| | M | SINGLE| | N | SINGLE| | O | SINGLE| | P | SINGLE| | Q | SINGLE| | R | SINGLE| | S | SINGLE| | T | SINGLE| | U | SINGLE| | V | SINGLE| | W | SINGLE| | X | SINGLE| | Y | SINGLE| | Z | SINGLE| | AA | SINGLE| | AB | SINGLE| | AC | SINGLE| | AD | SINGLE| | AE | SINGLE| | AF | SINGLE| | AG | SINGLE| | AH | SINGLE| | AI | SINGLE| | AJ | SINGLE| | AK | SINGLE| | AL | SINGLE| | AM | SINGLE| | AN | SINGLE| | AO | SINGLE| | AP | SINGLE| | AQ | SINGLE| | AR | SINGLE| | AS | SINGLE| | AT | SINGLE| | AU | SINGLE| | AV | SINGLE| | AW | SINGLE| | AX | SINGLE| | AY | SINGLE| | AZ | SINGLE| | BA | SINGLE| | BB | SINGLE| | BC | SINGLE| | BD | SINGLE| | BE | SINGLE| | BF | SINGLE| | BG | SINGLE| | BH | SINGLE| | BI | SINGLE| | BJ | SINGLE| | BK | SINGLE| | BL | SINGLE| | BM | SINGLE| | BN | SINGLE| | BO | SINGLE| | BP | SINGLE| | BPW | SINGLE| | BPX | SINGLE| | BPY | SINGLE| | BPZ | SINGLE| | BPYX | SINGLE| | BPYZ | SINGLE| | BPZYX | SINGLE| | BPZYX 3D | SINGLE | | BPZYX 3D | SINGLE | | BPZYX 3D 3D | SINGLE | | BPZYX 3D 3D 3D | SINGLE | | BPZYX 3D 3D 3D | SINGLE | | BPZYX 3D 3D 3D | SINGLE | | BPZYX 3D 3D 3D 3D | SINGLE | | BPZYX 3D 3D 3D 3D | SINGLE | | BPZYX 3D 3D 3D 3D 3D | SINGLE | | BPZYX 3D 3D 3D 3D 3D 3D | SINGLE | | BPZYX 3D 3D 3D 3D 3D 3D | SINGLE | | BPZYX 3D 3D 3D 3D 3D 3D 3D | SINGLE | | BPZYX 3D 3D 3D 3D 3D 3D 3D | SINGLE | | BPZYX 3D 3D 3D 3D 3D 3D 3D | SINGLE | | BPZYX 3D 3D 3D 3D 3D.5 BPZYX 3D.5 BPZYX 3D.5 BPZYX.5 BPZYX.5 BPZYX.5 BPZYX.5 BPZYX.5 BPZYX.5 BPZYX.5 BPZYX.5 BPZYX.5 BPZYX.5 BPZYX.5 BPZYX.5 BPZYX.5 BPZYX.5 BPZYX.1 BPZYX.1 BPZYX.1 BPZYX.1 BPZYX.1 BPZYX.1 BPZYX.1 BPZYX.1 BPZYX.1 BPZYX.1 BPZYX.1 BPZYX.1 BPZYX.1 BPZYX.1 BPZYX.1 BOEATE CH MODE COM OPLATE CH MODE COM OPLATE CH MODE COM OPLATE CH MODE COM OPLATE CH MODE COM OPLATE CH MODE COM OPLATE CH MODE COM OPLATE CH MODE COM OPLATE CH MODE COM OPLATE CH MODE COM OPLATE CH MODE COM OPLATE CH MODE COM OPLATE CH MODE COM OPLATE CH MODE COM OPLATE CH MODE COM OPLATECH MODE COM OPLATECH MODE COM OPLATECH MODE COM OPLATECH MODE COM OPLATECH MODE COM OPLATECH MODE COM OPLATECH MODE COM OPLATECH MODE COM OPLATECH MODE COM OPLATECH MODE COM OPLATECH MODE COM OPLATECH MODE COM OPLATECH MODE COM OPLATECH MODE COM OPLATECH MODE CO OPLATECH MODE COM OPLATECH MODE COM OPLATECH MODE COM OPLATECH MODE COM OPLATECH MODE COM OPLATECH MODE COM OPLATECH MODE COM OPLATECH MODE COM OPLATECH MODE COM OPLATECH MODE COM OPLATECH MODE COM OPLATECH MODE COM OPLATECH MODE COM OPLATECH MODE COM NOLI | NOLI | NOLI | NOLI | NOLI | NOLI | NOLI | NOLI | NOLI | NOLI | NOLI | NOLI | NOLI | NOLI | NOLI | NOLI | NOLI | NOLI | NOLI | NOLI | NOLI : NOLI : NOLI : NOLI : NOLI : NOLI : NOLI : NOLI : NOLI : NOLI : NOLI : NOLI : NOLI : NOLI : NOLI : NOLI : NOLI : NOLI : NOLD : NOLD : NOLD : NOLD : NOLD : NOLD : NOLD : NOLD : NOLD : NOLD : NOLD : NOLD : NOLD : NOLD : NOLD : NOLD : NOLD : NOLD : NOLD : NOLD : NINL : NINL : NINL : NINL : NINL : NINL : NINL : NINL : NINL : NINL : NINL : NINL : NINL : NINL : NINL : NINL : NINL : NOV | NOV | NOV | NOV | NOV | NOV | NOV | NOV | NOV | NOV | NOV | NOV | NOV | NOV | NOV | NOV | NOV | NOV | NOV | NOV | NOV | NOV | NOV | NOV | NOV | NOV : NOV : NOV : NOV : NOV : NOV : NOV : NOV : NOV : NOV : NOV : NOV : NOV : NOV : NOV : NOV : NOV : NOV : NOV : NOV : NOV : NOV : NOV : NOV : NOV : NOV \ NOV : NOV : NOV : NOV : NOV : NOV : NOV : NOV : NOV : NOV : NOV : NOV : NOV : NOV : NOV : NOV : NOV : NOV : NOV : NOV : NOV : NOV : NOV : NOV : SOLO | SOLO | SOLO | SOLO | SOLO | SOLO | SOLO | SOLO | SOLO | SOLO | SOLO | SOLO | SOLO | SOLO | SOLO | SOLO | SOLO | SOLO | SOLO | SOLO | SOLO | SOLO | SOLO | SOLO | SOLO | SOLO : SOLO : SOLO : SOLO : SOLO : SOLO : SOLO : SOLO : SOLO : SOLO : SOLO : SOLO : SOLO : SOLO : SOLO : SOLO : SOLO : SOLO : SOLO : SOLO : SOLO : DOLEATE CH MODE COM OPLATE CH MODE COM

6. BASIC OPERATION

Leader LV5600 - BASIC OPERATION - 1

line | Mode | Time (s) | |------|----------| | A | 12 | | B | 12 | | C | 12 | | D | 12 | | OPERATE CH MODE COM | 12 | | DISPLAY SIMUL | 12 |

Figure 6-1 Selecting the input mode

6.1.2 Selecting the Simul Mode

When in simul mode, to select how to set each channel, follow the procedure below. If you change INDIVIDUAL to COM, all the settings are changed to those of the channel selected with F•6 INPUT SELECT on each measurement screen.

Procedure

INPUT → F•6OPERATE CH MODE: COMMON / INDIVIDUAL
Settings
COMMON:Measurement settings are made for all channels.A portion of the settings, such as the line selection when signals of different formats are applied, are not shared by all channels.
INDIVIDUAL:Measurement settings are made for each channel. To select the channel you want to set, use F•6 INPUT SELECT on each measurement screen.A portion of the settings, such as ERROR CLEAR on the STATUS menu are shared by all channels.

6.1.3 Selecting the Displayed Channel

To select the channels to display, follow the procedure below.

On the SDI IN SETUP1 tab of the SYS menu, assign input signal to the display channels.

[See also] 7.1.2, "Input Signal Assignment"

Procedure (When the link format is set to single)

|INPUT|

→ F•1 A: ON / OFF
→ F•2 B: ON / OFF
→ F•3 C: ON / OFF
→ F•4 D: ON / OFF

Procedure (for dual link)

INPUT

→ F•1 A: ON / OFF

→ F•2 B: ON / OFF

Procedure (for quad link)

|INPUT|

→ F•1 A: ON

You can also use F•6 INPUT SELECT on each measurement screen to select the display channels.

F•6 INPUT SELECT works as follows:

  • In single input mode, select the display channel.
  • When Through Out(SDI1) on the SDI OUT tab is Selection(A/B/C/D), select the signal to output from SDI OUTPUT 1.
  • Selects that channel to be configured when F•6 OPERATE CH MODE of the INPUT menu is set to INDIVIDUAL.
  • Selects where to recall captured frame data from.

6.1.4 Input Format Error Indication

If the format of the received signal is not appropriate for the setting specified on the SDI IN SETUP1 tab of the SYS menu, the instrument displays the format in red or an INPUT FORMAT window in the center of the screen. If this occurs, check the settings on the SDI IN SETUP1 tab, the input signal, and payload ID.

The format is displayed in red in the following situations.

  • If the format is 2 sample interleave of 3G(DL)-4K or 3G(QL), and the order of the link is not correct
  • When the payload ID is not appropriate

An INPUT FORMAT window is displayed in the following situations.

- If the input signal is multi link, and the format specified on the SDI IN SETUP1 tab is not received

[See also] SDI IN SETUP1 tab → 7.1.1, "Configuring the SDI Input Connectors."

Leader LV5600 - Input Format Error Indication - 1

line | Channel | Value | | ------- | ----- | | Ach | 1920x1080/59.94P YCbCr(422) 10bit 3G-A | | Bch | 1920x1080/59.94P YCbCr(422) 10bit 3G-A |

Figure 6-2 Input format error indication

6. BASIC OPERATION

6.2 Setting the Signals to Measure

This section explains the procedure from applying an input to displaying the measurement screen for each of the different input signal formats.

6.2.1 SD, HD, 3G-A, and 3G-B-DL Measurement

  1. On the SDI IN SETUP1 tab of the SYS menu, set SDI System to 2K SD/HD/3G-A/3G-B-DL, and under Display Assignment, select the SDI signal channels to measure.

[See also] 7.1.1, "Configuring the SDI Input Connectors"

SYS → F•1 SIGNAL IN OUT → F•2 PREV TAB or F•3 NEXT TAB → SDI IN SETUP1 SDI IN SETUP2 SDI OUT MONITOR OUT HDR IP SETUP1 IP SETUP2 SDI System 2K SD/HD/3G-A/3G-B-DL Colorimetry Payload ID Display Assignment Type SDI Input A 0.1 Input B 0.2 Input C 0.3 Input D 0.4 SDI Input Rate SDI-1 AUTO SDI-2 AUTO SDI-3 AUTO SDI-4 AUTO COMPLETE PREV TAB NEXT TAB up menu

Figure 6-3 SDI IN SETUP1 tab

6. BASIC OPERATION

  1. If the input signal is HD or 3G, press F•2 PREV TAB or F•3 NEXT TAB, and under SETTING on the SDI IN SETUP2 tab, set the payload ID.

Select Use or Not Use. If you select Not Use, specify the following settings.

• HD: Set i/PsF Select.
• 3G: Set i/PsF Select, Color System, and Pixel Depth.

[See also] 7.1.4, "Setting the Input Format and Format Alarm"

SYS → F•1 SIGNAL IN OUT → F•2 PREV TAB or F•3 NEXT TAB → SDI IN SETUP SDI IN SETUP SDI OUT MON TOR OUT HDR Format Payload ID Use Not Use Payload ID Not use (or Missing) Division Square 2 Sample Interface IPsF Select Interface Segmented Frame(PsF) Color System YCr422 Pixel Depth 10 Bit 12 Bit Alarm Format OFF ON System 120x1000 x1 Structure 120x1000 x1 FrameField Rate 50.041 Division Square 2 Sample Interface Solve/Invert OFF DN Type 57.705 COMPLETE PREV NEXT up TAB TAB TAB up menu

Figure 6-4 SDI IN SETUP2 tab

  1. Press COMPLETE.
  2. Apply SDI signals to the SDI INPUT connectors on the rear panel.

LV5600 SDI INPUT 1 2 3 4 LV7600 SDI INPUT

Figure 6-5 SDI input connectors

6. BASIC OPERATION

  1. Press INPUT to select the channels you want to measure.

Press F•7 DISPLAY to select whether to measure a single channel (SINGLE) or multiple channels (SIMUL).

Press F•1 to F•4 to turn on the channels you want to measure.

Leader LV5600 - BASIC OPERATION - 1

line | Time | Value | | -------- | ----- | | 1920x1080/59.94P YCbCr(422) 10bit 3G-A | 100 | | 15:23:01 | 50 |

Figure 6-6 Measurement screen

6.2.2 Measuring HD(DL) Signals

  1. On the SDI IN SETUP1 tab of the SYS menu, set SDI System to 2K HD Dual Link.

[See also] 7.1.1, "Configuring the SDI Input Connectors"

SYS → F•1 SIGNAL IN OUT → F•2 PREV TAB or F•3 NEXT TAB → SDI IN SETUP1 SDI IN SETUP2 SDI OUT MON TOR OUT HDR SDI System 2K HD Dual Link Colorimetry Payload ID Display Assignment Type: DAI Input-A: DAI Input-B: DAI Input-C: DAI Input-D: DAI SDI Input Rate SDI-1 AUTO SDI-2 AUTO SDI-3 AUTO SDI-4 AUTO COMPLETE PREV TAB NEXT TAB up menu

Figure 6-7 SDI IN SETUP1 tab

6. BASIC OPERATION

  1. Press F•2 PREV TAB or F•3 NEXT TAB, and under SETTING on the SDI IN SETUP2 tab, set the payload ID.

Select Use or Not Use. If you select Not Use, set i/PsF Select, Color System, and Pixel Depth.

Even if Use is selected, if a HD signal is applied, it will be detected as an HD(DL) signal.

[See also] 7.1.4, "Setting the Input Format and Format Alarm"

SYS → F•1 SIGNAL IN OUT → F•2 PREV TAB or F•3 NEXT TAB → SDI IN SETUP SDI IN SETUP SDI OUT MON TOR OUT HDR Format Payload ID Use Not Use Payload ID Not use (or Missing) Division Square 2 Sample Interleave IPsF Select Interface Segmented Frame(PsF) Color System YCuCr422 Pixel Depth 10 Bit 12 Bit Alarm Format OFF ON System 120x1000 x1000 x1000 Structure 120x1000 x1000 x1000 Frame/Field Resin 50.94% Division Square 2 Sample Interleave Source/Inflow OFF DN Type 57.70G COMPLETE PREV TAB NEXT TAB up menu

Figure 6-8 SDI IN SETUP2 tab

  1. Press COMPLETE.
  2. Apply HD signals to the SDI INPUT connectors on the rear panel.

Connectors 1 and 2 and connectors 3 and 4 are pairs.

LV5600 SDI INPUT 1 2 3 4 LV7600 SDI INPUT

Figure 6-9 SDI input connectors

6. BASIC OPERATION

  1. Press INPUT to select the channels you want to measure.

Press F•7 DISPLAY to select whether to measure a single channel (SINGLE) or multiple channels (SIMUL).

Press F•1 and F•2 to turn on the channels you want to measure.

Leader LV5600 - BASIC OPERATION - 1

line | Time (x1000) | Value | | ------------ | ----- | | Start | 100 | | Mid | 70 | | End | 50 |

Figure 6-10 Measurement screen

6.2.3 Measuring 3G(DL)-2K Signals

  1. On the SDI IN SETUP1 tab of the SYS menu, set SDI System to 2K 3G Dual Link.

[See also] 7.1.1, "Configuring the SDI Input Connectors"

SYS → F•1 SIGNAL IN OUT → F•2 PREV TAB or F•3 NEXT TAB → SDI IN SETUP1 SDI IN SETUP2 SDI OUT MON TOR OUT HDR SDI System 2K 3G Dual Link Colorimetry Payload ID Display Assignment Type: SAI Input-A: SDA Input-B: SDA Input-C: SDA Input-D: SDA SDI Input Rate SDI-1 AUTO SDI-2 AUTO SDI-3 AUTO SDI-4 AUTO COMPLETE PREV TAB NEXT TAB up menu

Figure 6-11 SDI IN SETUP1 tab

6. BASIC OPERATION

  1. Press F•2 PREV TAB or F•3 NEXT TAB, and under SETTING on the SDI IN SETUP2 tab, set the payload ID.

Select Use or Not Use. If you select Not Use, set Color System and Pixel Depth. Even if Use is selected, if a 3G-A or 3G-B-DL signal is applied, it will be detected as a 3G(DL)-2K signal.

[See also] 7.1.4, "Setting the Input Format and Format Alarm"

SYS → F•1 SIGNAL IN OUT → F•2 PREV TAB or F•3 NEXT TAB → SDI IN SETUP SDI IN SETUP SDI OUT MON TOR OUT HDR Format Payload ID Use Not Use Payload ID Not use (or Missing) Division Square 2 Sample Interleave UPoF Select Interface Segmented Frame(PaF) Color System YCbCr422 Pixel Depth 10 Bit 12 Bit Alarm Format OFF ON System 120x1000 32.8-95.0 Dia Structure 120x1000 12x1 FramePaid Res: 60.94% Division Squares 2 Sample Interleave Solve/Invert OFF DN Type 67.729 COMPLETE PREV 1 NEXT 4 up TAB TAB TAB up menu

Figure 6-12 SDI IN SETUP2 tab

  1. Press COMPLETE.
  2. Apply a 3G-A or 3G-B-DL signal to the SDI INPUT connectors on the rear panel. Connectors 1 and 2 and connectors 3 and 4 are pairs.

LV5600 SDI INPUT 1 2 3 4 LV7600 SDI INPUT

Figure 6-13 SDI input connectors

6. BASIC OPERATION

  1. Press INPUT to select the channels you want to measure.

Press F•7 DISPLAY to select whether to measure a single channel (SINGLE) or multiple channels (SIMUL).

Press F•1 and F•2 to turn on the channels you want to measure.

2048x1080/59.84P RGB(444) 10bit 3G-B-DL DUAL SDI A-B TIME: 16:21:18 GAIN x1.000 SWEEP 1H x1 GBR A - B C - D OPERATE DISPLAY ON OFF COM SINGLE

Figure 6-14 Measurement screen

6.2.4 Measuring 3G-B-DS Signals

  1. On the SDI IN SETUP1 tab of the SYS menu, set SDI System to 2K 3G-B-DS.

[See also] 7.1.1, "Configuring the SDI Input Connectors"

SYS → F•1 SIGNAL IN OUT → F•2 PREV TAB or F•3 NEXT TAB → SDI IN SETUP1 SDI IN SETUP2 SDI OUT MON TOR OUT HDR SDI System 2K 3G-B DS Colorimetry Payload ID Display Assignment Price SDI Input-A SDI-1 Input-B SDI-2 Input-C SDI-3 Input-D SDI-4 SDI Input Rate SDI-1 AUTO SDI-2 AUTO SDI-3 AUTO SDI-4 AUTO COMPLETE PREV TAB NEXT TAB up menu

Figure 6-15 SDI IN SETUP1 tab

6. BASIC OPERATION

  1. Press F•2 PREV TAB or F•3 NEXT TAB, and under SETTING on the SDI IN SETUP2 tab, set the payload ID.

Select Use or Not Use. If you select Not Use, set i/PsF Select.

Even if Use is selected, if a 3G-B-DL signal is applied, the instrument will detect is as a 3G-B-DS signal.

[See also] 7.1.4, "Setting the Input Format and Format Alarm"
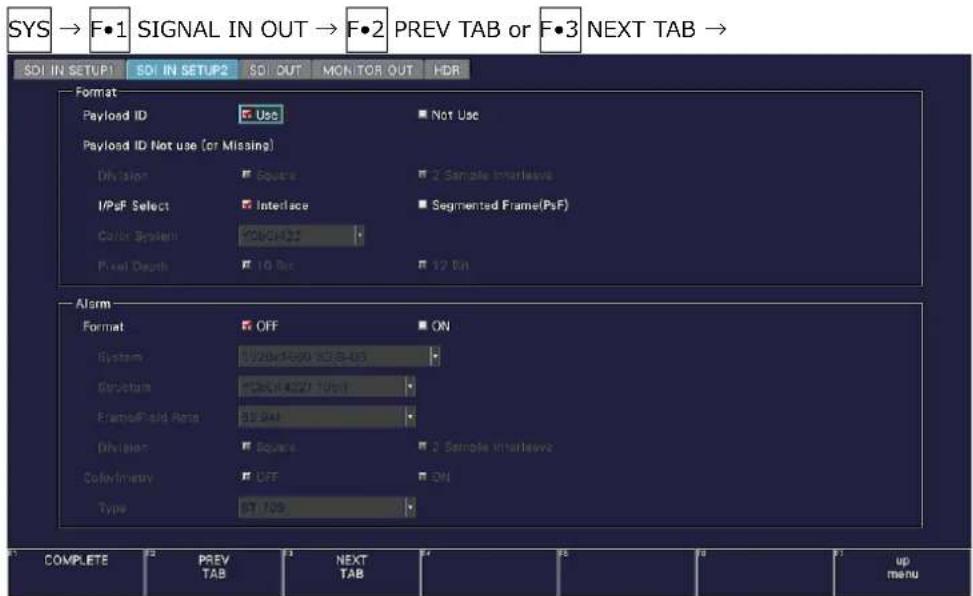
SYS → F•1 SIGNAL IN OUT → F•2 PREV TAB or F•3 NEXT TAB → SDI IN SETUP SDI IN SETUP SDI OUT MON TOR OUT HDR Format Payload ID Use Not Use Payload ID Not use (or Missing) Division Square 2 Sample Interleave IPoF Select Interface Segmented Frame(PsF) Color System 406/422 Pixel Depth 10 Bus 12 Bit Alarm Format OFF ON System 120x1500 x3.8-03 Structure 120x1422 Unit FrameField Range 50.041 Division Squares 2 Sample Interleave Solvifmserv OFF ON Type 57.709 COMPLETE PREV TAB NEXT TAB up menu

Figure 6-16 SDI IN SETUP2 tab

  1. Press COMPLETE.
  2. Apply 3G-B-DS signals to the SDI INPUT connectors on the rear panel.

LV5600 SDI INPUT 1 2 3 4 LV7600 SDI INPUT 1 2 3 4

Figure 6-17 SDI input connectors

6. BASIC OPERATION

  1. Press INPUT to select the channels you want to measure.

Press F•1 to F•4 to turn on the channels you want to measure. Simul mode cannot be used.

Leader LV5600 - BASIC OPERATION - 1

line | Panel | Event | Value | |-------|-------|-------| | A | ON | 100 | | A | OFF | 95 | | B | ON | 80 | | B | OFF | 75 | | C | ON | 60 | | C | OFF | 55 | | D | ON | 40 | | D | OFF | 35 | | D | OFF | 30 | | D | OFF | 25 | | D | OFF | 20 | | D | OFF | 15 | | D | OFF | 10 | | D | OFF | 5 | | D | OFF | 0 | | D | OFF | -5 | | D | OFF | -10 | | D | OFF | -15 | | D | OFF | -20 | | D | OFF | -25 | | D | OFF | -30 | | D | OFF | -35 | | D | OFF | -40 | | D | OFF | -45 | | D | OFF | -50 | | D | OFF | -55 | | D | OFF | -60 | | D | OFF | -65 | | D | OFF | -70 | | D | OFF | -75 | | D | OFF | -80 | | D | OFF | -85 | | D | OFF | -90 | | D | OFF | -95 | | D | OFF | -100 | | D | OFF | -105 | | D | OFF | -110 | | D | OFF | -115 | | D | OFF | -120 | | D | OFF | -125 | | D | OFF | -130 | | D | OFF | -135 | | D | OFF | -140 | | D | OFF | -145 | | D | OFF | -150 | | D | OFF | -155 | | D | OFF | -160 | | D | OFF | -165 | | D | OFF | -170 | | D | OFF | -175 | | D | OFF | -180 | | D | OFF | -185 | | D | OFF | -190 | | D | OFF | -195 | | D | OFF | -200 | | D | OFF | -205 | | D | OFF | -210 | | D | OFF | -215 | | D | OFF | -220 | | D | OFF | -225 | | D | OFF | -230 | | D | OFF | -235 | | D | OFF | -240 | | D | OFF | -245 | | D | OFF | -250 | | D | OFF | -255 | | D | OFF | -260 | | D | OFF | -265 | | D | OFF | -270 | | D | OFF | -275 | | D | OFF | -280 | | D | OFF | -285 | | D | OFF | -290 | | D | OFF | -295 | | D | OFF | -300 | | D | OFF | -305 | | D | OFF | -310 | | D | OFF | -315 | | D | OFF | -320 | | D | OFF | -325 | | D | OFF | -330 | | D | OFF | -335 | | D | OFF | -340 | | D | OFF | -345 | | D | OFF | -350 | | D | OFF | -355 | | D | OFF | -360 | | D | OFF | -365 | | D | OFF | -370 | | D | OFF | -375 | | D | OFF | -380 | | D | OFF | -385 | | D | OFF | -390 | | D | OFF | -395 | | D | OFF | -400 | | D | OFF | -405 | | D | OFF | -410 | | D | OFF | -415 | | D | OFF | -420 | | D | OFF | -425 | | D | OFF | -430 | | D | OFF | -435 | | D | OFF | -440 | | D | OFF | -445 | | D | OFF | -450 | | D | OFF | -455 | | D | OFF | -460 | | D | OFF | -465 | | D | OFF | -470 | | D | OFF | -475 | | D | OFF | -480 | | D | OFF | -485 | | D | OFF | -490 | | D | OFF | -495 | | D | OFF | -500 | | D | OFF | -505 | | D | OFF | -510 | | D | OFF | -515 | | D | OFF | -520 | | D | OFF | -525 | | D | OFF | -530 | | D | OFF | -535 | | D | OFF | -540 | | D | OFF | -545 | | D | OFF | -550 | | D | OFF | -555 | | D | OFF | -560 | | D | OFF | -565 | | D | OFF | -570 | | D | OFF | -575 | | D | OFF | -580 | | D | OFF | -585 | | D | OFF | -590 | | D | OFF | -595 | | D | OFF | -600 | | D | Off | -605 | | D | Off | -610 | | D | Off | -615 | | D | Off | -620 | | D | Off | -625 | | D | Off | -630 | | D | Off | -635 | | D | Off | -640 | | D | Off | -645 | | D | Off | -650 | | D | Off | -655 | | D | Off | -660 | | D | Off | -665 | | D | Off | -670 | | D | Off | -675 | | D | Off | -680 | | D | Off | -685 | | D | Off | -690 | | D | Off | -695 | | D | Off | -700 | | D | Off | -705 | | D | Off | -710 | | D | Off | -715 | | D | Off | -720 | | D | Off | -725 | | D | Off | -730 | | D | Off | -735 | | D | Off | -740 | | D | Off | -745 | | D | Off | -750 | | D | Off | -755 | | D | Off | -760 | | D | Off | -765 | | D | Off | -770 | | D | Off | -775 | | D | Off | -780 | | D | Off | -785 | | D | Off | -790 | | D | Off | -795 | | D | Off | -800 | | E | Note: The chart displays two data series (SODA and SODA) plotted against time (X-axis) and voltage (Y-axis). The values for each series are labeled on the chart. The labels above the charts are 'ON'.

Figure 6-18 Measurement screen

6.2.5 Measuring 12G Signals (SER29)

  1. On the SDI IN SETUP1 tab of the SYS menu, set SDI System to 4K 12G.

[See also] 7.1.1, "Configuring the SDI Input Connectors"

SYS → F•1 SIGNAL IN OUT → F•2 PREV TAB or F•3 NEXT TAB → SDI IN SETUP1 SDI IN SETUP2 SDI OUT MONTOR OUT HDR SDI System 4K 12G Colorimetry Payload ID Display Assignment Type SDI Input-1 0.000 Input-2 0.000 Input-3 0.000 Input-4 0.000 SDI Input Rate SDI-1 AUTO SDI-2 AUTO SDI-3 AUTO SDI-4 AUTO COMPLETE PREV TAB NEXT TAB up menu

Figure 6-19 SDI IN SETUP1 tab

6. BASIC OPERATION

  1. Press F•2 PREV TAB or F•3 NEXT TAB, and under SETTING on the SDI IN SETUP2 tab, set the payload ID.

Select Use or Not Use. If you select Not Use, set Division, Color System, and Pixel Depth. [See also] 7.1.4, "Setting the Input Format and Format Alarm"
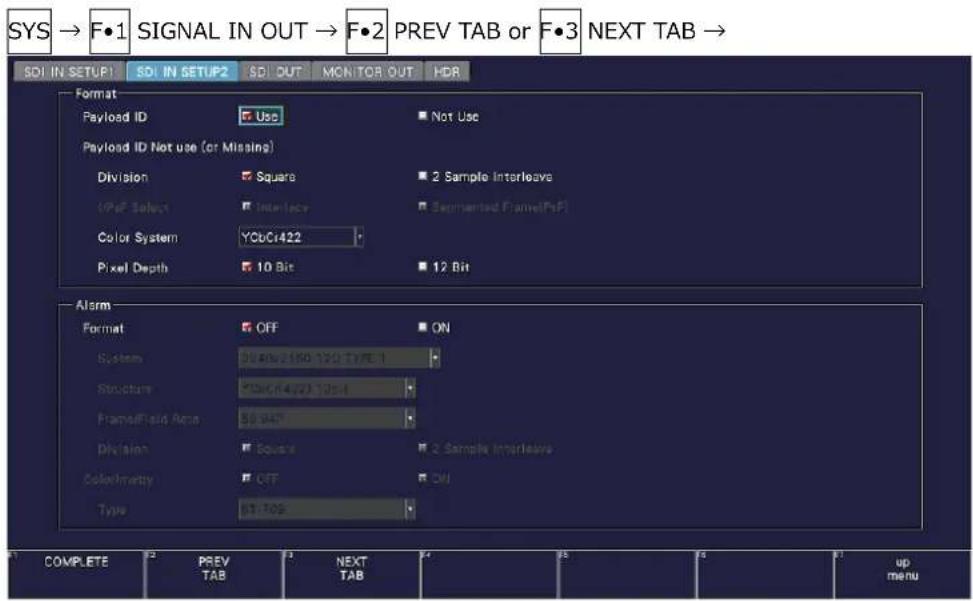
SYS → F•1 SIGNAL IN OUT → F•2 PREV TAB or F•3 NEXT TAB → SDI IN SETUP SDI IN SETUP SDI OUT MONITOR OUT HDR Format Payload ID Use Not Use Payload ID Not use (or Missing) Division Square 2 Sample Interleave (Pre) Select Interface Segmented Frame(PsF) Color System YCbCr422 Pixel Depth 10 Bit 12 Bit Alarm Format OFF ON System 0.00-2.00 120 TYPE 1 Structure 0.00-4.00 120 FrameField Area 50 MHz Division Square 2 Sample Interleave ColorOpacity OFF ON Type 50 Hz COMPLETE PREV 3 NEXT 4 up TAB TAB TAB up menu

Figure 6-20 SDI IN SETUP2 tab

  1. Press COMPLETE.
  2. Apply 12G signals to the SDI INPUT connectors on the rear panel.

LV5600 SDI INPUT 1 2 3 4 LV7600 SDI INPUT 1 2 3 4

Figure 6-21 SDI input connectors

6. BASIC OPERATION

  1. Press INPUT to select the channels you want to measure.

Press F•1 to F•4 to turn on the channels you want to measure. Simul mode cannot be used.

Leader LV5600 - BASIC OPERATION - 1

line | State | Value | |-------|-------| | A | ON | | B | OFF | | C | OFF | | D | OFF | | E | OFF | | F | OFF | | G | OFF | | H | OFF | | I | OFF | | J | OFF |

Figure 6-22 Measurement screen

* To measure 12G-SDI signals, use cables and connectors that are appropriate for transmitting 12G-SDI signals. Using incompatible or degraded cables or connectors may cause the transmission characteristics to degrade drastically.

6.2.6 Measuring 3G(QL) Signals (SER28)

  1. On the SDI IN SETUP1 tab of the SYS menu, set SDI System to 4K 3G Quad Link.

[See also] 7.1.1, "Configuring the SDI Input Connectors"

SYS → F•1 SIGNAL IN OUT → F•2 PREV TAB or F•3 NEXT TAB → SDI IN SETUP SDI IN SETUP SDI OUT MON TOR OUT HDR SDI System 4K 3G Quad Link Colorimetry Payload ID Display Assignment Type BDI Input A BDI X Input B BDI Y Input C BDI Z Input D BDI AA SDI Input Rate SDI-1 AUTO SDI-2 AUTO SDI-3 AUTO SDI-4 AUTO COMPLETE PREV TAB NEXT TAB up menu

Figure 6-23 SDI IN SETUP1 tab

6. BASIC OPERATION

  1. Press F•2 PREV TAB or F•3 NEXT TAB, and under SETTING on the SDI IN SETUP2 tab, set the payload ID.

Select Use or Not Use. If you select Not Use, set Division, Color System, and Pixel Depth. Even if Use is selected, if a 3G-B-DS signal is applied, it will be detected as a 3G-B-DL signal.

[See also] 7.1.4, "Setting the Input Format and Format Alarm"

SYS → F•1 SIGNAL IN OUT → F•2 PREV TAB or F•3 NEXT TAB → SDI IN SETUP SDI IN SETUP SDI OUT MON TOR OUT HDR Format Payload ID Use Not Use Payload ID Not use (or Missing) Division Squares 2 Sample Interleave Input Select Interface Segmented Plane(PaF) Color System YCbCr422 Pixel Depth 10 Bit 12 Bit Alarm Format OFF ON System 104.0Hz 160 35.0-35.0 Hz Structure 12GHz 221.0Hz FrameField Area 55.045° Division Square's 2 Sample Interleave Solution/Menu OFF ON Type 57.725 COMPLETE PREV 1 NEXT 4 up TAB TAB TAB up menu

Figure 6-24 SDI IN SETUP2 tab

  1. Press COMPLETE.
  2. Apply a 3G-A or 3G-B-DL signal to the SDI INPUT connectors on the rear panel.
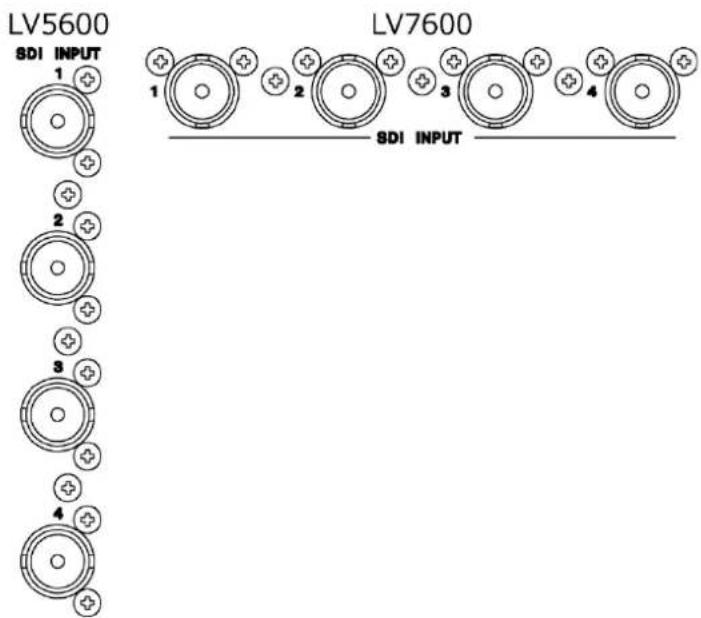
LV5600 SDI INPUT 1 2 3 4 LV7600 SDI INPUT 1 2 3 4

Figure 6-25 SDI input connectors

6. BASIC OPERATION

  1. Channels to be measured are fixed to F•1 ON.

Leader LV5600 - BASIC OPERATION - 1

line | Time | Value | | -------- | ----- | | 0 | 100 | | 1 | 90 | | 2 | 80 | | 3 | 70 | | 4 | 60 | | 5 | 50 | | 6 | 40 | | 7 | 30 | | 8 | 20 | | 9 | 10 | | 10 | 0 | | 11 | 10 | | 12 | 20 | | 13 | 30 | | 14 | 40 | | 15 | 50 | | 16 | 60 | | 17 | 70 | | 18 | 80 | | 19 | 90 | | 20 | 100 | | 21 | 90 | | 22 | 80 | | 23 | 70 | | 24 | 60 | | 25 | 50 | | 26 | 40 | | 27 | 30 | | 28 | 20 | | 29 | 10 | | 30 | 0 | | 31 | 10 | | 32 | 20 | | 33 | 30 | | 34 | 40 | | 35 | 50 | | 36 | 60 | | 37 | 70 | | 38 | 80 | | 39 | 90 | | 40 | 100 | | 41 | 90 | | 42 | 80 | | 43 | 70 | | 44 | 60 | | 45 | 50 | | 46 | 40 | | 47 | 30 | | 48 | 20 | | 49 | 10 | | 50 | 0 | | 51 | 10 | | 52 | 20 | | 53 | 30 | | 54 | 40 | | 55 | 50 | | 56 | 60 | | 57 | 70 | | 58 | 80 | | 59 | 90 | | 60 | 100 | | 61 | 90 | | 62 | 80 | | 63 | 70 | | 64 | 60 | | 65 | 50 | | 66 | 40 | | 67 | 30 | | 68 | 20 | | 69 | 10 | | 70 | 0 | | 71 | 10 | | 72 | 20 | | 73 | 30 | | 74 | 40 | | 75 | 50 | | 76 | 60 | | 77 | 70 | | 78 | 80 | | 79 | 90 | | 80 | 100 | | 81 | 90 | | 82 | 80 | | 83 | 70 | | 84 | 60 | | 85 | 50 | | 86 | 40 | | 87 | 30 | | 88 | 20 | | 89 | 10 | | 90 | 0 | | ... | ... |

Figure 6-26 Measurement screen

6.2.7 Measuring 3G(DL)-4K Signals (SER28)

  1. On the SDI IN SETUP1 tab of the SYS menu, set SDI System to 4K 3G Dual Link. [See also] 7.1.1, "Configuring the SDI Input Connectors"
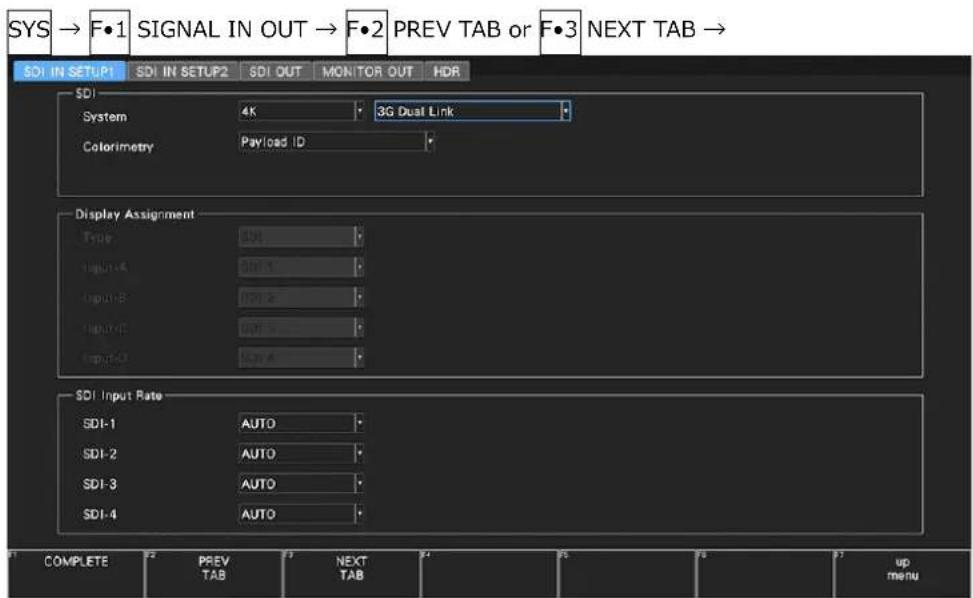
SYS → F•1 SIGNAL IN OUT → F•2 PREV TAB or F•3 NEXT TAB → SDI IN SETUP1 SDI IN SETUP2 SDI OUT MON TOR OUT HDR SDI System 4K 3G Dual Link Colorimetry Payload ID Display Assignment Type SM Input A 0.1 Input B 0.2 Input C 0.3 Input D 0.4 SDI Input Rate SDI-1 AUTO SDI-2 AUTO SDI-3 AUTO SDI-4 AUTO COMPLETE PREV 3 NEXT 4 5 6 up TAB TAB TAB menu

Figure 6-27 SDI IN SETUP1 tab

6. BASIC OPERATION

  1. Press F•2 PREV TAB or F•3 NEXT TAB, and under SETTING on the SDI IN SETUP2 tab, set the payload ID.

Select Use or Not Use. If you select Not Use, set Division.

Even if Use is selected, if a 3G-B-DL signal is applied, it will be detected as a 3G-B-DS signal.

[See also] 7.1.4, "Setting the Input Format and Format Alarm"

SYS → F•1 SIGNAL IN OUT → F•2 PREV TAB or F•3 NEXT TAB → SDI IN SETUP SDI IN SETUP SDI OUT MON TOR OUT HDR Format Payload ID Use Not Use Payload ID Not use (or Missing) Division Squares 2 Sample Interleave MF of Select Interface Segmented Frame(PaF) Color System YC#01A22 Pixel Depths 10 Bus 12 Pin Alarm Format OFF ON System 104.0m/160 35.8-03 Wall Structure 104.0m/20 Unit Frame/Paid Ring 20.0mm Division Square 2 Sample Interleave Solivimetry OFF ON Type 57.709 COMPLETE PREV TAB NEXT TAB up menu

Figure 6-28 SDI IN SETUP2 tab

  1. Press COMPLETE.
  2. Apply 3G-B-DS signals to the SDI INPUT connectors on the rear panel.

Connectors 1 and 2 and connectors 3 and 4 are pairs.

LV5600

LV5600 SDI INPUT 1 2 3 4 LV7600 SDI INPUT 1 2 3 4

Figure 6-29 SDI input connectors

6. BASIC OPERATION

  1. Press INPUT to select the channels you want to measure.

Press F•1 and F•2 to turn on the channels you want to measure. Simul mode cannot be used.
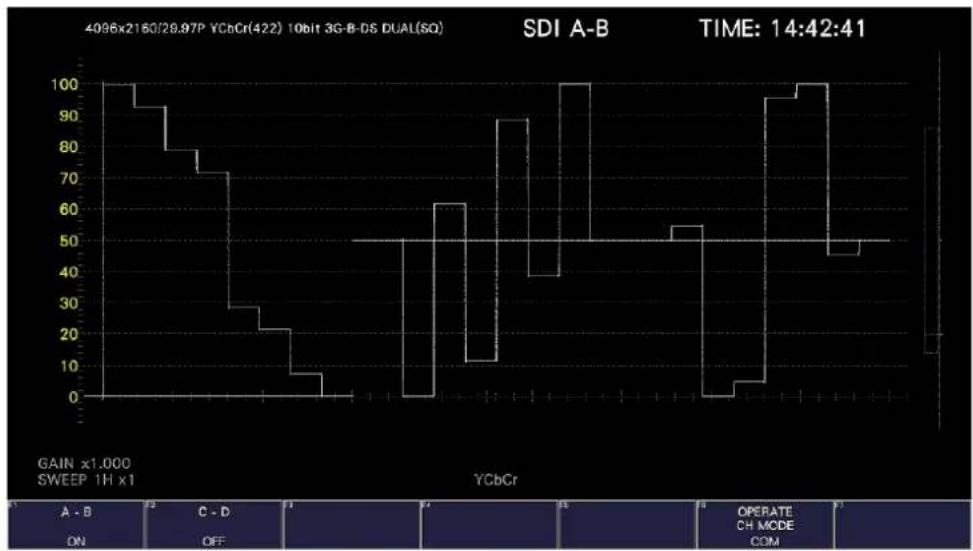
Leader LV5600 - BASIC OPERATION - 1

line | Time | Value | | -------- | ----- | | 0 | 100 | | 10 | 90 | | 20 | 80 | | 30 | 70 | | 40 | 60 | | 50 | 50 | | 60 | 40 | | 70 | 30 | | 80 | 20 | | 90 | 10 | | 100 | 0 | | 110 | 10 | | 120 | 20 | | 130 | 30 | | 140 | 40 | | 150 | 50 | | 160 | 60 | | 170 | 70 | | 180 | 80 | | 190 | 90 | | 200 | 100 | | 210 | 90 | | 220 | 80 | | 230 | 70 | | 240 | 60 | | 250 | 50 | | 260 | 40 | | 270 | 30 | | 280 | 20 | | 290 | 10 | | 300 | 0 | | 310 | 10 | | 320 | 20 | | 330 | 30 | | 340 | 40 | | 350 | 50 | | 360 | 60 | | 370 | 70 | | 380 | 80 | | 390 | 90 | | 400 | 100 | | 410 | 90 | | 420 | 80 | | 430 | 70 | | 440 | 60 | | 450 | 50 | | 460 | 40 | | 470 | 30 | | 480 | 20 | | 490 | 10 | | 500 | 0 |

Figure 6-30 Measurement screen

6.2.8 Measuring HD(QL) Signals (SER28)

  1. On the SDI IN SETUP1 tab of the SYS menu, set SDI System to 4K HD Quad Link.

[See also] 7.1.1, "Configuring the SDI Input Connectors"

SYS → F•1 SIGNAL IN OUT → F•2 PREV TAB or F•3 NEXT TAB → SDI IN SETUP1 SDI IN SETUP2 SDI OUT MONTOR OUT HDR SDI System 4K HD Quad Link Colorimetry Payload ID Display Assignment Type SDI Input-1-4 AUTO Input-2-0 AUTO Input-12 AUTO Input-20 AUTO SDI Input Rate SDI-1 AUTO SDI-2 AUTO SDI-3 AUTO SDI-4 AUTO COMPLETE PREV TAB NEXT TAB up menu

Figure 6-31 SDI IN SETUP1 tab

  1. Press COMPLETE.

6. BASIC OPERATION

  1. Apply HD signals to the SDI INPUT connectors on the rear panel.
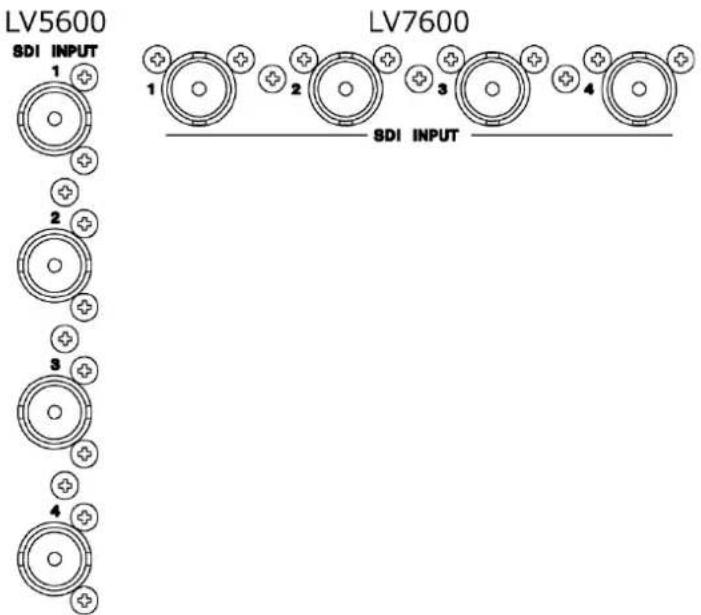
LV5600 SDI INPUT 1 2 3 4 LV7600 SDI INPUT

Figure 6-32 SDI input connectors

  1. Channels to be measured are fixed to F•1 ON.

Leader LV5600 - BASIC OPERATION - 2

line | Time (x1000) | Value | | ------------ | ----- | | Start | 100 | | Mid | 70 | | End | 50 |

Figure 6-33 Measurement screen

6. BASIC OPERATION

6.2.9 IP Measurement (SER05)

  1. On the SDI IN SETUP1 tab of the SYS menu, set SDI System to 2K SD/HD/3G-A/3G-B-DL. Then, for Display Assignment, select IP signal.

Set Display Assignment Type to IP (when the SER26 is not installed), or assign IP Stream1 to 4 to Input-A to D (when the SER26 is installed).

[See also] 7.1.1, "Configuring the SDI Input Connectors"

SYS → F•1 SIGNAL IN OUT → F•2 PREV TAB or F•3 NEXT TAB → SDI IN SETUP1 SDI IN SETUP2 SDI OUT MONTOR OUT HDR IP SETUP1 IP SETUP2 SDI System 2K SD/HD/3G-A/3G-B-DL Colorimetry Payload ID Display Assignment Type IP Input-1 IP Current-1 Input-2 IP Current-2 Input-3 IP Current-3 Input-4 IP Current-4 SDI Input Rate SDI-1 AUTO SDI-2 AUTO SDI-3 AUTO SDI-4 AUTO COMPLETE PREV TAB NEXT TAB up menu

Figure 6-34 SDI IN SETUP1 tab

6. BASIC OPERATION

  1. Press F•2 PREV TAB or F•3 NEXT TAB, and set the parameters on the IP SETUP1 tab. Set the signal standard, IP address, and port number.

You can set the IP address and port number for each stream. If you do not select the check boxes, the addresses and port numbers can be assigned automatically on a first-come-first-served basis or assigned by pressing a single key on the status screen.

[See also] 7.1.10, "Configuring the IP Signal Settings (SER05)," 16.8.2, "Configuring the IP Status Screen"

SYS → F•1 SIGNAL IN OUT → F•2 PREV TAB or F•3 NEXT TAB → SDI IN SETUP1 SDI IN SETUP2 SDI OUT MONITOR OUT HDR IP SETUP1 IP SETUP2 IP Setup Type ST2022-6 Redundancy Mode Off On IP Input 1 IP Stream 1 Video Source Address 0 0 0 0 Destination Address 0 0 0 0 Destination Port 0 0 0 0 Number of channels COMPLETE PREV TAB NEXT TAB up menu

Figure 6-35 IP SETUP1 tab

  1. Press F•3 NEXT TAB, and set the parameters on the IP SETUP2 tab.

Set the PTP domain number and the video format for when the signal standard is ST2110. [See also] 7.1.11, "Configuring the PTP Settings (SER05)," 7.1.12, "Setting the Video Format (SER05)"

SYS → F•1 SIGNAL IN OUT → F•2 PREV TAB or F•3 NEXT TAB → SDI IN SETUP1 SDI IN SETUP2 SDI OUT MONITOR OUT HDR IP SETUP1 IP SETUP2 PTP Setup Domain Number Primary 127 ST2110 Video Format IP Stream 1 RTP Payload Type Video 96 System 1920x1080 HD Structure YCbCr(422)10bit Frame/Field Rate 59.941 COMPLETE PREV TAB NEXT TAB up menu

Figure 6-36 IP SETUP2 tab

6. BASIC OPERATION

  1. Press F•1 COMPLETE.
  2. Install SFP+ transceiver modules into the IP area of the rear panel, and apply IP signals.

When the signal standard is ST2110 or when Redundancy Mode is set to Off, apply the signal to IP 1.

When Redundancy Mode is set to On, apply the signal to IP 1 and 2.

[See also] 5.4, "Installing the SFP+ Module (SER05)," 5.5.2, "Applying IP Signals (SER05)"

LV5600 IP 1 2 LV7600 1 IP 2

Figure 6-37 IP input connectors

  1. Press INPUT to select the channels (streams) you want to measure.

Press F•7 DISPLAY to select whether to measure a single channel (SINGLE) or multiple channels (SIMUL).

Press F•1 to F•4 to turn on the channels you want to measure. If the SER26 is not installed, channels A to D are assigned streams 1 to 4.
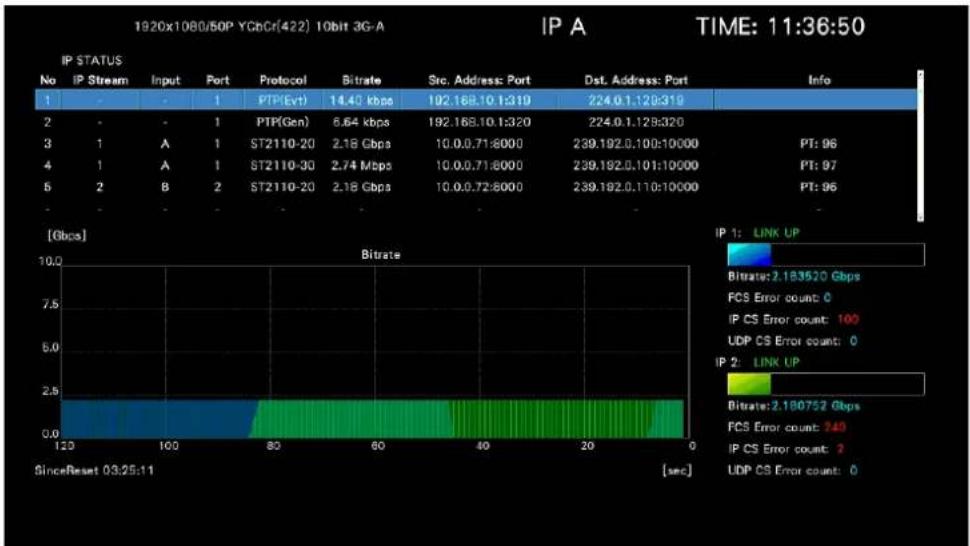
Leader LV5600 - BASIC OPERATION - 2
Figure 6-38 Measurement screen

6.3 Selecting the Measurement Mode

The types of measurement screens available are WFM, VECT, PIC, AUDIO, STATUS, and EYE. There is also another type, MULTI, that combines these six types. Press a mode key on the front panel to select the type.

6.3.1 Video Signal Waveform Display

To display video signal waveforms, press WFM.

The available features include line select display, which displays the waveform of the selected line, RGB display, pseudo-composite display, and external sync signal waveform display.

Leader LV5600 - Video Signal Waveform Display - 1

line | Event | Value | |-----------------|-------| | Gain x1,000 | 100 | | SWEEP 1H x1 | 50 | | GAIN FILTER | 60 | | SWEEP | 10 | | CURSOR | 90 | | LINE SELECT | 40 | | INPUT SELECT A | 55 | | COLOR SYSTEM | 45 |

Figure 6-39 Video signal waveform display

6.3.2 Vector Display

To display vectors, press VECT.

The available features include line select display, marker display, pseudo-composite display, 5-bar display, and CIE chromaticity diagram display.

1920x1080/58.941 YCbCr(422) 10bit HD SDI A TIME: 15:28:20 COLORIMETRY BT.709 Y1 R Mg B G Cy COMPONENT GAIN x1.000 VECT INTEN/CCNFIG VECTOR SCALE VECTOR GAIN MARKER OFF LINE SELECT INPUT SELECT A COLOR SYSTEM

Figure 6-40 Vector display

6.3.3 Picture Screen

To show the picture display, press PIC.

The available features include monochrome display, marker display, line select display, and focus assist display (SER25).

1920x198059.841 YCbCr(422) 10bit HD SDI A TIME: 15:30:12 PIC CONFIG CINEL/TE FOCUS LINE SELECT INPUT SELECT A

Figure 6-41 Picture display

6.3.4 Audio Display

To show the audio display, press AUDIO.

The available features include meter display, Lissajous display (SER03), surround display (SER03), and status display (SER03) of the signal selected with F•7 MAPPING.

Leader LV5600 - Audio Display - 1

bar | Display Mode | L1 | L2 | L3 | L4 | |---|---|---|---|---| | LISSAJOU | -1 | -1 | -1 | -1 | | METER SETUP | -1 | -1 | -1 | -1 | | LISSAJOU SETUP | -1 | -1 | -1 | -1 | | ERROR SETUP | -1 | -1 | -1 | -1 | | PHONES VOLUME 0 | -1 | -1 | -1 | -1 | | INPUT SELECT A | -1 | -1 | -1 | -1 | | MAPPING | -1 | -1 | -1 | -1 | | AES | -20 | -20 | -20 | -20 | | TRUE PEAK | -20 | -20 | -20 | -20 | | EMB | -20 | -20 | -20 | -20 | Source: AES TRUE PEAK EMB Scale: True PEAK -70.0, -76.0, -73.9, -76.0, -73.9, -76.0, -76.0, -76.0

Figure 6-42 Audio display

6.3.5 Status Display

To show the status display, press STATUS.

Event log display and data dump display are available.

1920x1080/59.94I YCbCr(422) 10bit HD SDI A TIME: 15:33:25 STATUS SIGNAL FORMAT Freq Cable Embedded Audio A CH DETECT 1920x1080/59.94I HD -0.0ppm 1,2,3,4,5,6,7,8,9,10,11,12,13,14,15,16 ERROR SDI A CH ANC A CH CRC 0 Check Sum 0 TRS Poo 0 Parity 0 TRS Code 0 ILLEGAL Code 0 Line Number 0 Embedded Audio A CH Video Quality A CH BCH 0 Freeze Parity 0 Black DBN 0 Gamut Inhibit 0 Comp Gamut Audio Sample 0 Level Y Level C SinceReset 00:00:10 EVENT SDI ANC DATA ANC STATUS INPUT ERROR LOG ANALYSIS VIEWER PACKET SETUP A CLEAR

Figure 6-43 Status display

6.3.6 Eye Pattern Display (SER02)

To show eye patterns, press EYE. (If SER02 is not installed, the EYE key is disabled.) You can also show jitter by switching F•1 EYE/JITTER MODE. Simul mode is not supported.
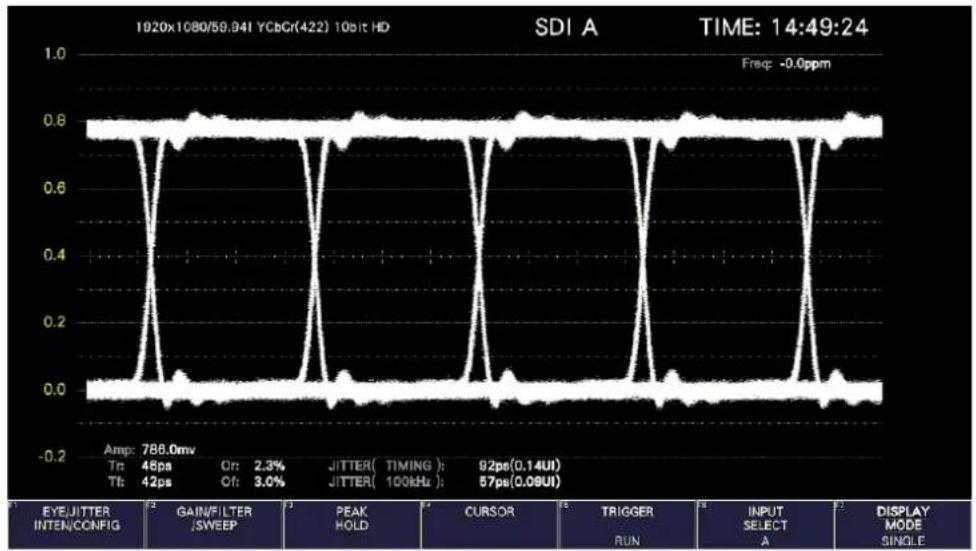
Leader LV5600 - Eye Pattern Display (SER02) - 1

line | Event | Time (s) | Amplitude (mv) | |-------|----------|----------------| | EYEJITTER INTEN/CONFIG | 786.0 | 0.0 | | GAIN/FILTER /Sweep | 46 | 0.8 | | PEAK HOLD | 2.3 | 0.8 | | CURSOR | 3.0 | 0.8 | | TRIGGER RUN | 92 | 0.8 | | INPUT SELECT A | 100 | 0.8 | | DISPLAY MODE SINGLE | 0.14 | 0.8 | | JITTER (TIMING): 100kHz | 0.08 | 0.8 | | JITTER (TIMING): 100kHz: -0.0ppm | - | 0.8 | | Frequency: -0.0ppm | - | 0.0 |

Figure 6-44 Eye pattern display

6.3.7 Multi Display

To show a multi screen, which is a combination of measurement screens, press MULTI.

If Mode Key Direct on the GENERAL tab is set to Single, you can select between six types of layouts by using F•1 LAYOUT SELECT.

To set each measurement screen, use F•2 MULTI WFM MENU to F•7 MULTI EYE MENU.

If Mode Key Direct on the GENERAL tab is set to Multi/Single Common, you can switch between measurement screens by pressing MULTI. To select the layout, hold MULTI down for 2 seconds to display the function menu. Then select using F•1 LAYOUT USER 1 to F•6 LAYOUT USER 6. [See also] GENERAL tab → 7.2.1, "General Settings"

- USER 1

The vector, video signal waveform, status, and picture are displayed in four divided screens.

Leader LV5600 - - USER 1 - 1

line SDI A | Signal | Value | | :--- | :--- | | SDI A | 0 | | Blue | 0 | | Red | 0 | | Pink | 0 | | Green | 0 | | Grey | 0 | | Yellow | 0 | | Cyan | 0 | | Magenta | 0 | | Black | 0 | | White | 0 | | Dark Grey | 0 | | Grey Grey | 0 | | Grey Grey | 0 | | Grey Grey Grey | 0 | | Grey Grey Grey | 0 | | Grey Grey Grey | 0 | | Grey Grey Grey | 0 | | Grey Grey Grey | 0 | | Grey Grey Grey | 0 | | Grey Grey Grey | 0 | | Grey Grey Grey | 0 | | Grey Grey Grey | 0 | | Grey Grey Grey | 0 | | Grey Grey Grey | 0 | | Grey Grey Grey | 0 | | Grey Grey Grey | -1 | | Grey Grey Grey | -1 | | Grey Grey Grey | -1 | | Grey Grey Grey | -1 | | Grey Grey Grey | -1 | | Grey Grey Grey | -1 | | Grey Grey Grey | -1 | | Grey Grey Grey | -1 | | Grey Grey Grey | -1 | | Grey Grey Grey | -1 | | Grey Grey Grey | -1 | | Grey Grey Grey | -1 | | Grey Grey Grey | -1 | | Grey Blue | 0 | | Blue | 0 | | Red | 0 | | Pink | 0 | | Green | 0 | | Grey | 0 | | Grey Grey | 0 | | Blue | 0 | | Blue | 0 | | Red | 0 | | Pink | 0 | | Green | 0 | | Grey | 0 | | Grey Grey | 0 | | Blue | 0 | | Blue | 0 | | Red | 0 | | Blue | 0 | | Red | 0 | | Pink | 0 | | Green | 0 | | Grey | 0 | | Blue | 0 | | Blue | 0 | | Red | 0 | | Blue | 0 | | Red | 0 | | Pink | 0 | | Green | 0 | | Grey | 0 | | Blue | 0 | | Blue | 0 | | Red | 0 | | Blue | 0 | | Red | 0 | | Pink | 0 | | Green | 0 | | Grey | 1 | | Blue | 1 | | Blue | 1 | | Red | 1 | | Blue | 1 | | Red | 1 | | Pink | 1 | | Green | 1 | | Grey | 1 | | Blue | 1 | | Blue | 1 | | Red | 1 | | Blue | 1 | | Red | 1 | | Pink | 1 | | Green | 1 | | Grey | 1 | | Blue | 1 | | Blue | 1 | | Red | 1 | | Blue | 1 | | Red | 1 | | Pink | 1 | | Green | 1 | | Grey - Blue Barter Barter Barter Barter Barter Barter Barter Barter Barter Barter Barter Barter Barter Barter Barter Barter Barter Barter Barter Barter Barter Barter Barter Barter Barter Barter Barter Barter Barter Barter Barter Barter Barter Barter Barter Barter Barter Barter Barter Barter Barter Barter Barter Barter Barter Barter Barter Barter Barter Barter Barater Barter Barter Barter Barter Barter Barter Barter Barter Barter Barter Barter Barter Barter Barter Barter Barter Barter Barter Barter Barter Barter Barter Barter Barter Barter Barter Barter Barter Barter Barter Barter Barter Barter Barter Barater Bar/Bar/Bar/Bar/Bar/Bar/Bar/Bar/Bar/Bar/Bar/Bar/Bar/Bar/Bar/Bar/Bar/Bar/Bar/Bar/Bar/Bar/Bar/Bar/Bar/Bar/Bar/Bar/Bar/Bar/Bar/Bar/Bar/Bar/Bar/Bar/Bar/Bar/Bar/Bar/Bar/Bar/Bar/Bar/Bar/Bar/Bar/Bar/Bar/Bar/Bar/ Bars / Bars / Bars / Bars / Bars / Bars / Bars / Bars / Bars / Bars / Bars / Bars / Bars / Bars / Bars / Bars / Bars / Bars / Bars / Bars / Bars / Bars / Bars / Bars / Bars / Bars / Bars / Bars / Bars / Bars / Bars / Bars / Bars / Bars / Bars / Bars / Bars / Bars / Bars / Bars / Bars / Bars / Bars / Bars / Bars / Bars / Bars / Bars / Bars / Bars / Bars, Bars / Bars / Bars / Bars / Bars / Bars / Bars / Bars / Bars / Bars / Bars / Bars / Bars / Bars / Bars / Bars / Bars / Bars / Bars / Bars / Bars / Bars / Bars / Bars / Bars / Bars / Bars / Bars / Bars / Bars / Bars / Bars / Bars / Bars / Bars / Bars / Bars / Bars / Bars / Bars / Bars / Bars / Bars / Bars / Bars / Bars / Bars / Bars / Bars / Bars (Note: The chart displays a single bar in the table) with values ranging from -1 to +2. The bars are colored by category (e.g., 'Blue', 'Red', 'Green') and are labeled with 'Colorimetry' (BT.709). The color bar is labeled 'GAIN x1.009' and 'SWEEP TH x1'. The bar colors are colored: black, white, blue, red, green, purple, cyan, magenta, yellow, orange, pink, gray, white, dark gray, blue.

Figure 6-45 Multi display (USER 1)

6. BASIC OPERATION

- USER 2

The picture is displayed in the main screen, and the video signal waveform and vector are displayed as thumbnails.

1920x1080/59.94 YCbCr(422) 106:L HD SDI A TIME: 15:37:21

Figure 6-46 Multi display (USER 2)

- USER 3

The vector is displayed in the main screen, and the video signal waveform and picture are displayed as thumbnails.
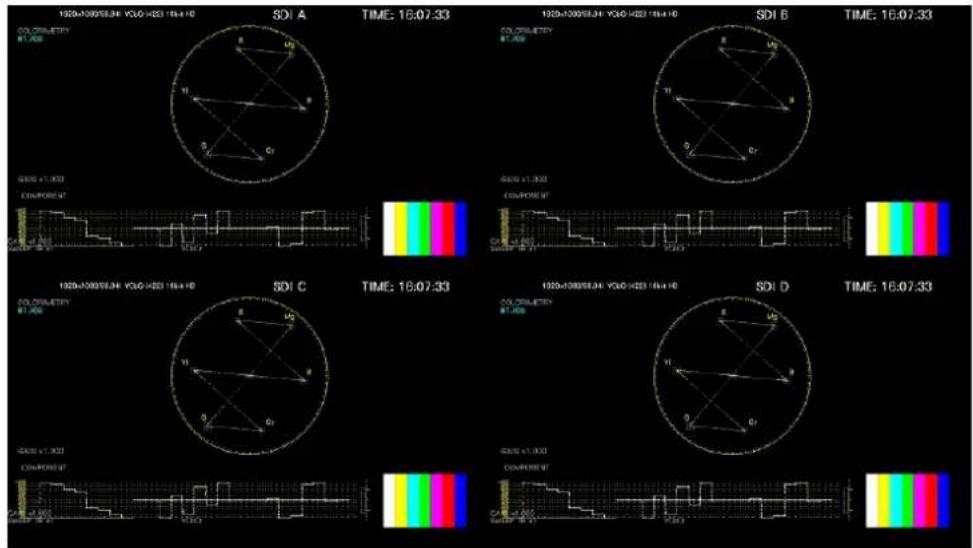
1920+1000/5J4E YOLO-HESI 16:4:10 SDI A TIME: 16.07.33 1920+1000/5J4E YOLO-HESI 16:4:10 SDI B TIME: 16.07.33 1920+1000/5J4E YOLO-HESI 16:4:10 SDI C TIME: 16.07.33 1920+1000/5J4E YOLO-HESI 16:4:10 SDI D TIME: 16.07.33

Figure 6-47 Multi display (USER 3)

- USER 4

The picture, video-signal-waveform, and vector are displayed top to bottom. This is suitable for simul mode.

Leader LV5600 - - USER 4 - 1

line | Group | Time (min) | Value | |-------|------------|-------| | SDI A | 0.5 | 100 | | SDI A | 1.0 | 80 | | SDI A | 1.5 | 60 | | SDI A | 2.0 | 40 | | SDI A | 2.5 | 20 | | SDI A | 3.0 | 10 | | SDI A | 3.5 | 5 | | SDI A | 4.0 | 2 | | SDI A | 4.5 | 1 | | SDI A | 5.0 | 0.5 | | SDI A | 5.5 | 0.2 | | SDI A | 6.0 | 0.1 | | SDI A | 6.5 | 0.05 | | SDI A | 7.0 | 0.02 | | SDI A | 7.5 | 0.01 | | SDI A | 8.0 | 0.005 | | SDI A | 8.5 | 0.002 | | SDI A | 9.0 | 0.001 | | SDI A | 9.5 | 0.0005| | SDI B | 0.5 | 100 | | SDI B | 1.0 | 80 | | SDI B | 1.5 | 60 | | SDI B | 2.0 | 40 | | SDI B | 2.5 | 20 | | SDI B | 3.0 | 10 | | SDI B | 3.5 | 5 | | SDI B | 4.0 | 2 | | SDI B | 4.5 | 1 | | SDI B | 5.0 | 0.5 | | SDI B | 5.5 | 0.2 | | SDI B | 6.0 | 0.1 | | SDI B | 6.5 | 0.05 | | SDI B | 7.0 | 0.02 | | SDI B | 7.5 | 0.01 | | SDI C | 0.5 | 100 | | SDI C | 1.0 | 80 | | SDI C | 1.5 | 60 | | SDI C | 2.0 | 40 | | SDI C | 2.5 | 20 | | SDI C | 3.0 | 10 | | SDI C | 3.5 | 5 | | SDI C | 4.0 | 2 | | SDI C | 4.5 | 1 | | SDI C | 5.0 | 0.5 | | SDI C | 5.5 | 0.2 | | SDI C | 6.0 | 0.1 | | SDI C | 6.5 | 0.05 | | SDI C | 7.0 | 0.02 | | SDI C | 7.5 | 0.01 | | SDI D | 0.5 | 100 | | SDI D | 1.0 | 80 | | SDI D | 1.5 | 60 | | SDI D | 2.0 | 40 | | SDI D | 2.5 | 20 | | SDI D | 3.0 | 10 | | SDI D | 3.5 | 5 | | SDI D | 4.0 | 2 | | SDI D | 4.5 | 1 | | SDI D | 5.0 | 0.5 | | SDI D | 5.5 | 0.2 | | SDI D | 6.0 | 0.1 | | SDI D | 6.5 | 0.05 | | SDI D | 7.0 | 0.02 | | SDI D | 7.5 | 0.01 | | SDI D | 8.0 | 0.005 | | STJX | - | - | | STJX | - | - | | STJX | - | - | | STJX | - | - | | STJX | - | - | | STJX | - | - | | STJX | - | - | | STJX | - | - | | STJX | - | - | | STT | - | - | | STT | - | - | | STT | - | - | | STT | - | - | | STT | - | - | | STT | - | - | | STT | - | - | | STT | - | - | | STT | - | - | | STT / Component1: ±1, ±2, ±3, ±4, ±5, ±6, ±7, ±8, ±9, ±10, ±11, ±12, ±13, ±14, ±15, ±16, ±17, ±18, ±19, ±20, ±21, ±22, ±23, ±24, ±25, ±26, ±27, ±28, ±29, ±30, ±31, ±32, ±33, ±34, ±35, ±36, ±37, ±38, ±39, ±40, ±41, ±42, ±43, ±44, ±45, ±46, ±47, ±48, ±49, ±50, ±51, ±52, ±53, ±54, ±55, ±56, ±57, ±58, ±59, ±60, ±61, ±62, ±63, ±64, ±65, ±66, ±67, ±68, ±69, ±70, ±71, ±72, ±73, ±74, ±75, ±76, ±77, ±78, ±79, ±80, ±81, ±82, ±83, ±84, ±85, ±86, ±87, ±88, ±89, ±90, ±91, ±92, ±93, ±94, ±95, ±96, ±97, ±98, ±99, + | | STJX | - | - | | STJX | - | - | | STJX | - | - | | STJX | - | - | | STJX | - | - | | STJX | - | - | | STJX | - | - | | STJX | - | - | | STJT / Component1: +1, +2, +3, +4, +5, +6, +7, +8, +9, +10, +11, +12, +13, +14, +15, +16, +17, +18, +19, +20, +21, +22, +23, +24, +25, +26, +27, +28, +29, +30, +31, +32, +33, +34, +35, +36, +37, +38, +39, +40, +41, +42, +43, +44, +45, +46, +47, +48, +49, +50 ,+ ,+ ,+ ,+ ,+ ,+ ,+ ,+ ,+ ,+ ,+ ,+ ,+ ,+ ,+ ,+ ,+ ,+ ,+ ,+ ,+ ,+ ,+ ,+ ,+ ,+ ,+ ,+ ,+ ,+ ,+ ,+ ,+ ,+ STT / Component1: +1, +2 , +3 , +4 , +5 , +6 , +7 , +8 , +9 , +10 , +11 , +12 , +13 , +14 , +15 , +16 , +17 , +18 , +19 , +20 , +21 , +22 , +23 , +24 , +25 , +26 , +27 , +28 , +29 , +30 , +31 , +32 , +33 , +34 , +35 , +36 , +37 , +38 , +39 , +40 ,+ ,+ ,+ ,+ ,+ ,+ ,+ ,+ ,+ ,+ ,+ ,+ ,+ ,+ ,+ ,+ ,+ ,+ ,+ ,+ ,+ ,+ ,+ STT / Component1: +1 , +2 , +3 , +4 , +5 , +6 , +7 , +8 , +9 , +10 , +11 , +12 , +13 , +14 , +15 , +16 , +17 , +18 , +19 , +20 , +21 , +22 , +2/ ]- [chart] STT / Component1: - [chart]- [chart] STT / Component1: - [chart]- [chart] STT / Component1: - [chart]- [chart] STT / Component1: - [chart]- [chart] STT / Component1: - [chart]- [chart] STT / Component1: - [chart]- [chart][chart][chart][chart][chart][chart][chart][chart][chart][chart][chart][chart][chart][chart][chart][chart][chart][chart][chart][chart][chart][chart][chart][chart][chart][chart][chart][chart][chart][chart][chart][chart][chart][chart][chart][chart][chart][chart][chart][chart][chart][chart][chart][chart][chart][chart][chart][chart][chart][chart][chart][chart][chart][chart][chart][chart][chart][chart][chart][chart](Chart) [Chart] [Chart] [Chart] [Chart] [Chart] [Chart] [Chart] [Chart] [Chart] [Chart] [Chart] [Chart] [Chart] [Chart] [Chart] [Chart] [Chart] [Chart] [Chart] [Chart] [Chart] [Chart] [Chart] [Chart] [Chart] [Chart] [Chart] [Chart] [Chart] [Chart] [Chart] [Chart] [Chart] [Chart] (Chart) [Chart) [Chart] [Chart] [Chart] [Chart] [Chart] [Chart] [Chart] [Chart] [Chart] [Chart] (Chart) [Chart) [Chart] (Chart) [Chart] (Chart) (Chart) (Chart) (Chart) (Chart) (Chart) (Chart) (Chart) (Chart) (Chart) (Chart) (Chart) (Chart) (Chart) (Chart) (Chart) (Chart) (Chart) (Chart) (Chart) (Chart) (Chart) (Chart) (Chart) (Chart) (Chart) (Chart) (Chart) (Chart) (Chart) (Chart) (Chart) (Chart) (Chart) = (Chart) * (-), (-), (-), (-), (-), (-), (-), (-), (-), (-), (-), (-), (-), (-), (-), (-), (-), (-), (-), (-), (-), (-), (-), (-), (-), (-), (-), (-), (-), (-), (-), (-), (-), (-), (-), (-)|

Figure 6-48 Multi display (USER 4)

- USER 5

The picture and video signal waveform are displayed in the top and bottom screens. This is suitable for simul mode.

SDD A SDD B SDD C SDD D

Figure 6-49 Multi display (USER 5)

6. BASIC OPERATION

- USER 6

The tally, picture, and video signal waveform are displayed in tiles.

This is suitable for simul mode.

EXT CAM A CAM A CAM A SDI A EXT CAM B CAM B CAM B SDI B 1920x108/53.541 YCQ4420 10x1 HD TIME: 16:47:20 TIME: 16:47:20 EXT CAM C CAM C CAM C SDI C EXT CAM D CAM D CAM D SDI D 1920x108/53.541 YCQ4420 10x1 HD TIME: 16:47:20 TIME: 16:47:20

Figure 6-50 Multi display (USER 6)

6. BASIC OPERATION

6.4 Operation Key Actions

Operation keys are shortcut keys for functions that are frequently used in video content production. Key assignments can be changed freely on the OPERATION KEY tab.

[See also] OPERATION KEY tab → 7.2.15, "Setting the Operation keys"

- LV5600

The S-CUT key can be controlled from the panel, mouse, and touch panel. Others can be controlled from the mouse and touch panel.

• LV7600

Keys can be controlled from the panel, mouse, and touch panel.

Leader LV5600 - Operation Key Actions - 1

flowchart
graph TD
    A["LV5600"] --> B["S-CUT"]
    C["LV7600"] --> D["FORM"]
    C --> E["OVLAY"]
    C --> F["GAIN"]
    C --> G["SWEEP"]
    C --> H["MAG"]
    C --> I["MAG"]
    B --> J["S-CUT"]
    B --> K["FILTER"]
    E --> L["MAG"]

Figure 6-51 Operation keys (panel)
FORM OVERLAY GAIN SWEEP SHORT CUT FILTER MAG MAG

Figure 6-52 Operation keys (mouse and touch panel control screen)

- S-CUT Key

Performs the action selected with SHORT CUT on the OPERATION KEY tab.

Table 6-1 SHORTCUT key action

DIRECTThe previously registered panel settings will be loaded.To register the panel settings, configure the instrument to the settings that you want to register, press MEM, and then press SHORTCUT.
CAP&WAITA screen capture will be taken and saved to a USB memory device.Connect a USB memory device in advance.
INTENUse the function menu shown in the lower right of the screen to adjust the waveform intensity.This is valid on the video signal waveform display, vector display, and audio display (SER03).When a mouse is connected, clicking the function menu resets the value to the default.When using the touch panel, tapping the function menu resets the value to the default.
CURSOR Performs cursor measurement.This is valid on the video signal waveform display and vector display.
VOLUMEUse the function menu shown in the lower right of the screen to adjust the headphone volume.When a mouse is connected, clicking the function menu resets the value to the default.When using the touch panel, tapping the function menu resets the value to the default.

• Operation Keys Other Than S-CUT

This is valid on the video signal waveform display and vector display. Each time you press the key, the settings assigned to the key switch.

[See also] Video signal waveform display → 10.1, "Operation Key Description"

Vector display → 11.1, "Operation Key Description"

6.5 Customized Layout (SER26)

The layout of the measurement screen that appears when the WFM, VECT, PIC, AUDIO, STATUS, or EYE key is pressed (one type each) and the screen that appears when the MULTI key is pressed (six types) can be arranged freely. To do so, connect a mouse to the front panel USB port or use the touch panel.

The layout that you specify will not be initialized even if you initialize the instrument. To initialize, perform any of the procedures below.

[See also] 7.7, "Initialization"

LAYOUT INITIALIZE YES on the SYS menu: The entire layout is initialized.

ALL INITIALIZE YES on the SYS menu: The entire layout is initialized.

Factory default settings: The entire layout is initialized.

DEFAULT LAYOUT in the layout window The layout of the selected measurement display is initialized.

6.5.1 Notes

The maximum number of items that can be arranged is determined by 128 ÷ the number of display channels (1 to 4).

Item, here, includes the items on the Main and Sub tabs as well as Format, Input, and Time on the Option tab.

6.5.2 Layout Procedure

As an example, this section explains how to change the layout of a multi display (User 1) in the following manner.

a) Display the layout screen
b) Change TIME in the upper right of the screen to DATE
c) Superimpose the vector on the picture
d) Add audio
e) Add TIME to the status
f) Apply the changes

Before change
Leader LV5600 - Layout Procedure - 1

line | Parameter | Value | | --------- | ----- | | CO2 | A.00 | | WD | 0 | | WD Plus | 8 | | WD Color | 0 | | WD/Color Value | 0 | | Line Number | 0 | | Coated Ratio | A.00 | | BCH | 0 | | Ratio | 0 | | Gain | 0 | | Gain Rate | 0 | | Delay | 0 | | Delay Rate | 0 | | Delay Rate | 0 | | Delay Rate | 0 | | Delay Rate | 0 | | Delay Rate | 0 | | Delay Rate | 0 | | Delay Rate | 0 | | Delay Rate | 0 | | Delay Rate | 0 | | Delay Rate | 0 | | Delay Rate | 0 | | Delay Rate | 0 | | Delay Rate | 0 | | Delay Rate | 0 | | Delay Rate | -1 | | Delay Rate | -1 | | Delay Rate | -1 | | Delay Rate | -1 | | Delay Rate | -1 | | Delay Rate | -1 | | Delay Rate | -1 | | Delay Rate | -1 | | Delay Rate | -1 | | Delay Rate | -1 | | Delay Rate | -1 | | Delay Rate | -1 | | Delay Rate | -1 | | Delay Rate | -1 | | Delay Rate | -1 | | | Delay Rate | -1 | | | Delay Rate | -1 | | | Delay Rate | -1 | | | Delay Rate | -1 | | | Delay Rate | -1 | | | Delay Rate | -1 | | | Delay Rate | -1 | | | Delay Rate | -1 | | | Delay Rate | -1 | | | Delay Rate | -1 | | | Delay Rate | -1 | | | Delay Rate | -1 | | | Delay Rate >10bit HD COLORIMETRY BT.709 SDI A TIME: 15:34:46 GAIN x 1,000 SWEET BY AT YOMC Superfect M-08-28

Leader LV5600 - Layout Procedure - 2

After change
Leader LV5600 - Layout Procedure - 3

line | Time | Value | | -------- | ----- | | 0 | 0 | | 10 | 0 | | 20 | 0 | | 30 | 0 | | 40 | 0 | | 50 | 0 | | 60 | 0 | | 70 | 0 | | 80 | 0 | | 90 | 0 | | 100 | 0 | | 110 | 0 | | 120 | 0 | | 130 | 0 | | 140 | 0 | | 150 | 0 | | 160 | 0 | | 170 | 0 | | 180 | 0 | | 190 | 0 | | 200 | 0 | | 210 | 0 | | 220 | 0 | | 230 | 0 | | TIME: 13:41:23 | - |

Figure 6-53 Arranging the multi display layout

a) Display the layout screen

  1. Press MULTI, and set F•1 LAYOUT SELECT to USER 1.

If Mode Key Direct on the GENERAL tab is set to Multi/Single Common, hold MULTI down for about 2 seconds to display the function menu.

There are six layouts for the multi screen. You can use USER 1 to USER 6 to switch between the layouts.

  1. Right-click on the measurement screen or click or tap RIGHT CLICK at the upper left of the screen to select LAYOUT.

The layout screen appears.

Layout Select Item: DISCT/68ARM STICE Display Mode: NORMAL + FILE ALIGN+ ALIGN- Add rows Main Bob Tally WPM PICTURE VEGETA AUDIO STATUS EYE DELETES Default LAYOUT Grid Size: 10x19 * 20x30 INPUT TIME XO = 960 YO = 60 x1 = 1920 y1 = 600 [width = 960, height = 540 ] [FORMAT:OFF, INPUT:OFF, TIME:OFF, BG:OFF] [STYLE:ALIGNH] WFM XO = 960 YO = 600 x1 = 1920 y1 = 1050 [width = 960, height = 480 ] [FORMAT:OFF, INPUT:OFF, TIME:OFF, FRAME:OFF] [STYLE:ALIGNH] PICTURE

Figure 6-54 Layout screen

b) Change TIME in the upper right of the screen to DATE

  1. Click or tap the TIME item in the upper right of the screen.

The color of the frame and text changes to light blue, and Select Item in the layout window displays TIME. This indicates that the TIME item is selected.

  1. Click or tap DELETE.

The TIME item is deleted.

  1. On the Sub tab, click or tap DATE.

The DATE item appears.

6. BASIC OPERATION

  1. Place the DATE item in the area where the TIME item was displayed.

To move an item, drag it.

To resize an item, drag the green handles at the four corners of the item.

The position and size of an item snap to the grid selected by Grid Size in the layout window.

You can also use the Area tab to move and resize an item.

The coordinates at the upper left corner of the screen are (0, 0) . Those at the lower right corner are (1920, 1080) . Using these references, set the coordinates of the upper left corner of the item (x0, y0) and the lower right corner (x1, y1) .

The minimum size is 90 × 60 .

If the layout window gets in the way, move it or close it. When using a mouse, to display a window that you closed, double-click in the layout screen.

If multiple items are on top of each other, items in the back may not be selectable. If you need to select such item, click or tap the item on the Main or Sub tab. The selected item will move to the front.

c) Superimpose the vector on the picture

  1. Select the VECTOR item, and click Background Transparent on the Option tab.

Background Transparent is for making the background transparent when an item is superimposed on a picture.

  1. Place the VECTOR item on top of the picture.

Resize as necessary.

d) Add audio

  1. On the Main tab, click or tap AUDIO.

The AUDIO item appears.

You can place an AUDIO item even if SER03 is not installed, but the message "Not installed" will appear.

  1. Place the AUDIO item in the area where the VECTOR item was originally displayed.

e) Add TIME to the status

  1. Click or tap the STATUS item.

  2. On the Option tab, click or tap Time.

The TIME item on the Sub tab can be placed anywhere. Time on the Option tab is displayed at the top of the selected item. You cannot change the display position or size.

f) Apply the changes

  1. Right-click or tap in the layout screen, and click or tap SAVE.

The measurement screen returns.

If you click or tap EXIT, all the changes that you made up to that point will be canceled.

6.5.3 Layout Screen Description

Layout Select Item: VICT/RAWESTOCK Display Mode: NORMAL = TILE ALIGN-H ALIGN-V Add Item Main Sub Tally WMO PICTURE VECTOR AUDIO STATUS EYE DELETE Default LAYOUT Grid Size: 10x10 = 20x20 Add Settings Add Options Styles View Area x0 = 0 y0 = 80 x1 = 960 y1 = 800 Add Condition: PICTURE, VECT, AUDIO ST * Tally Setup Audio Level + OFF PATTLE TALLY PATTLE DEFAULT LAYOUT CIE INPUT TIME X0 = 960 Y0 = 600 x1 = 1920 y1 = 600 [ width = 960, height = 540 ] [ FORMAT:OFF, INPUT:OFF, TIME:OFF, BG:OFF ] [ STYLE:ALIGNH ] WFM x0 = 880 y0 = 600 x1 = 1320 y1 = 1080 [ width = 960, height = 480 ] [ FORMAT:OFF, INPUT:OFF, TIME:OFF, FRAME:OFF ] [ STYLE:ALIGNH ] PICTURE 3

Figure 6-55 Layout screen

1 Layout Window

The Layout window is used to create layouts.

Mode in the title bar displays the current measurement mode (WFM, USER 1 to USER 5, etc.).

You can move the window by dragging and close it by clicking or tapping ✗ in the upper right of the window. When using a mouse, to display a window that you closed, double-click in the layout screen.

2 Item

Displays the item selected on the Main or Sub tab.

The settings specified with Item Setting are displayed in the frame.

If you select it, the frame color changes from white to light blue.

3 Menu Guide

A function menu appears in this area.

Use these as guides when placing items.

  1. BASIC OPERATION
    4 5
    Leader LV5600 - Menu Guide - 1

Layout Select Item : VECT/SBAR/HIST/CIE Display Mode : NORMAL + TILE ALIGN-H ALIGN-V Add Item 10 Main Sub Tally FORMAT INPUT TIME DATE REMOTE LABEL DELETE Item Setting 13 Area Option Style Format Input Time Background Transparent Frame Add Condition 15 PICTURE VECT AUDIO ST + Tally Setup Audio Level on 15 DEFAULT LAYOUT Grid Size : 10x10 30x30

6 7 8
Layout Select Item : VECT/SBAR/HIST/CIE Display Mode : NORMAL • TILE • ALIGN-H • ALIGN-V Add Item 11 Main Sub Tally LABEL-1 LABEL-2 IRIS TALLY-1 TALLY-2 TALLY-EXT DELETE Item Setting 5 Area Option Style • TILE • MIX • ALIGN-V • ALIGN-H Add Condition PICTURE VECT AUDIO ST • • VECT/SBAR/HIST/CIE • VECTOR • SBAR • HIST • CIE 16 DEFAULT LAYOUT Grid Size : 10x10 • 30x30

Layout Select Item : VECT/SBAR/HIST/CIE Display Mode : NORMAL • TILE ALIGN-H ALIGN-V Add Item Item Setting Main Sub Tally Area Option Style LABEL-1 TILE MIX ALIGN-V + ALIGN-H LABEL-2 ADD CONDITION PICTURE VECT AUDIO ST • > • LEVEL BAR + etc. LEVEL BAR LISSAJOU STATUS SURROUND LOUDNESS 17 TALLY-1 TALLY-2 TALLY-EXT DELETE DEFAULT LAYOUT Grid Size : 10x10 + 30x30

Layout Select Item: VECT/SBAR/HIST/CIE Display Mode: NORMAL • TILE • ALIGN-H • ALIGN-V Add Item Main Sub Tally LABEL-1 LABEL-2 IRIS TALLY-1 TALLY-2 TALLY-EXT DELETE Item Setting Area Option Style • TILE • MIX • ALIGN-V • ALIGN-H Add Condition IRE VECT AUDIO STATUS • • STATUS ALL • STATUS ERROR • DATA DUMP • EVENT LOG • EXT REF • ANC PACKET SUMMARY • ANC STATUS EDH 18 DEFAULT LAYOUT Grid Size: 10x10 • 30x30

Layout Select Item : VECT/SBAR/HIST/CIE Display Mode : NORMAL + TILE ALIGN-H ALIGN-V Add Item Item Setting Main Sub Tally Area Option Style LABEL-1 TILE MIX ALIGN-V • ALIGN-H LABEL-2 TALLY-1 Add Condition VECT AUDIO STATUS EYE + • EYE / JITTER • EYE TALLY-2 JITTER TALLY-EXT 19 DELETE DEFAULT LAYOUT Grid Size : 10x10 30x30

Figure 6-56 Layout window

4 Select Item

Displays the selected item.

5 Display Mode / Style

Select the display format for simul mode.

Display Mode applies to the entire screen, Style applies to the selected item.

If Display Mode is not set to NORMAL or if the selected item is AUDIO or EYE, Style cannot be selected.

If the selected item is VECTOR (5BAR), VECTOR (HIST), VECTOR (CIE), STATUS, or an item on the Sub tab, you cannot set Style to MIX.

If Display Mode is not set to NORMAL and multiple channels are displayed in simul mode, even if you place AUDIO or EYE items in the layout, "Not supported" will appear and will not work.

For example, if the following screens are displayed in single input mode and you change to simul mode, the display changes depending on Display Mode as follows.

Leader LV5600 - Display Mode / Style - 1

line SDI A | Signal | Value | | :--- | :--- | | A Oil | 0 | | B Gas | 0 | | C Gas | 0 | | D Gas | 0 | | E Gas | 0 | | F Gas | 0 | | G Gas | 0 | | H Gas | 0 | | I Gas | 0 | | J Gas | 0 | | K Gas | 0 | | L Gas | 0 | | M Gas | 0 | | N Gas | 0 | | O Gas | 0 | | P Gas | 0 | | Q Gas | 0 | | R Gas | 0 | | S Gas | 0 | | T Gas | 0 | | U Gas | 0 | | V Gas | 0 | | W Gas | 0 | | X Gas | 0 | | Y Gas | 0 | | Z Gas | 0 | | AA Gas | 0 | | AB Gas | 0 | | AC Gas | 0 | | AD Gas | 0 | | AE Gas | 0 | | AF Gas | 0 | | AG Gas | 0 | | AH Gas | 0 | | AI Gas | 0 | | AJ Gas | 0 | | AK Gas | 0 | | AL Gas | 0 | | AM Gas | 0 | | AN Gas | 0 | | AO Gas | 0 | | AP Gas | 0 | | AQ Gas | 0 | | AR Gas | 0 | | ASG (Peak) | 0 | | ASG (Peak) | 1.28-4.68/1.38/1.61/1.72/1.93/1.95/1.98 GAIN = 1,000 SWEER = 1.1 YCB/Cr TIME: 11:33:45 COLORIMETRY BT.709 GAIN x1,000 SWEER @ X1

Figure 6-57 Single input mode

6. BASIC OPERATION

- When Display Mode Is NORMAL

The screen is divided by channel within each item. Select the division format with Style.

TILE (tile the screens) MIX (cascade the screens)

1000/1000/24 YOCH(HD) 100 H 1000/1000/24 YOCH(HD) 100 H STJ708 =1.000 COMPONENT STJ708 =1.000 COMPONENT STJ708 =1.000 COMPONENT SDI A SDI C SDI B SDI D TIME: 11:36:42 TIME: 11:35:42 TIME: 11:36:42 GAIN =1.000 SWEEP TH X1 YOCH ALIGN-V (arrange vertically) ALIGN-H (arrange horizontally)

Figure 6-58 Normal display

- When Display Mode Is TILE

The screen is divided by channel.

Ach Bch

Leader LV5600 - BASIC OPERATION - 2

line | Condition | Time (Hz) | Vcc (Hz) | |-----------|-----------|----------| | SDI A | 100 | ~5 | | SDI A | 110 | ~10 | | SDI A | 120 | ~5 | | SDI A | 130 | ~10 | | SDI A | 140 | ~5 | | SDI A | 150 | ~10 | | SDI A | 160 | ~5 | | SDI A | 170 | ~10 | | SDI A | 180 | ~5 | | SDI A | 190 | ~10 | | SDI A | 200 | ~5 | | SDI A | 210 | ~10 | | SDI A | 220 | ~5 | | SDI A | 230 | ~10 | | SDI A | 240 | ~5 | | SDI A | 250 | ~10 | | SDI A | 260 | ~5 | | SDI A | 270 | ~10 | | SDI A | 280 | ~5 | | SDI A | 290 | ~10 | | SDI A | 300 | ~5 | | SDI A | 310 | ~10 | | SDI A | 320 | ~5 | | SDI A | 330 | ~10 | | SDI A | 340 | ~5 | | SDI A | 350 | ~10 | | SDI A | 360 | ~5 | | SDI A | 370 | ~10 | | SDI A | 380 | ~5 | | SDI A | 390 | ~10 | | SDI A | 400 | ~5 | | SDI A | 410 | ~10 | | SDI A | 420 | ~5 | | SDI A | 430 | ~10 | | SDI A | 440 | ~5 | | SDI A | 450 | ~10 | | SDI A | 460 | ~5 | | SDI A | 470 | ~10 | | SDI A | 480 | ~5 | | SDI A | 490 | ~10 | | SDI A | 500 | ~5 | | SDI A | 510 | ~10 | | SDI A | 520 | ~5 | | SDI A | 530 | ~10 | | SDI A | 540 | ~5 | | SDI A | 550 | ~10 | | SDI A | 560 | ~5 | | SDI A | 570 | ~10 | | SDI A | 580 | ~5 | | SDI A | 590 | ~10 | | SDI A | 600 | ~5 | | SDI A | 610 | ~10 | | SDI A | 620 | ~5 | | SDI A | 630 | ~10 | | SDI A | 640 | ~5 | | SDI A | 650 | ~10 | | SDI A | 660 | ~5 | | SDI A | 670 | ~10 | | SDI A | 680 | ~5 | | SDI A | 690 | ~10 | | SDI A | 700 | ~5 | | SDI B | 10 | ~2.5 | | SDI B | 2 | ~2.5 | | SDI B | 3 | ~2.5 | | SDI B | 4 | ~2.5 | | SDI B | 5 | ~2.5 | | SDI B | 6 | ~2.5 | | SDI B | 7 | ~2.5 | | SDI B | 8 | ~2.5 | | SDI B | 9 | ~2.5 | | SDI B | 10 | ~2.5 | | SDI B | 11 | ~2.5 | | SDI B | 12 | ~2.5 | | SDI B | 13 | ~2.5 | | SDI B | 14 | ~2.5 | | SDI B | 15 | ~2.5 | | SDI B | 16 | ~2.5 | | SDI B | 17 | ~2.5 | | SDI B | 18 | ~2.5 | | SDI B | 19 | ~2.5 | | SDI B | 20 | ~2.5 | | SDI B | 21 | ~2.5 | | SDI B | 22 | ~2.5 | | SDI B | 23 | ~2.5 | | SDI B | 24 | ~2.5 | | SDI B | 25 | ~2.5 | | SDI B | 26 | ~2.5 | | SDI B | 27 | ~2.5 | | SDI B | 28 | ~2.5 | | SDI B | 29 | ~2.5 | | SDI B | 30 | ~2.5 | | SDI B | 31 | ~2.5 | | SDI B | 32 | ~2.5 | | SDI B | 33 | ~2.5 | | SDI B | 34 | ~2.5 | | SDI B | 35 | ~2.5 | | SDI B | 36 | ~2.5 | | SDI B | 37 | ~2.5 | | SDI B | 38 | ~2.5 | | SDI B | 39 | ~2.5 | | SDI B | 40 | ~2.5 | | SDI B | 41 | ~2.5 | | SDI B | 42 | ~2.5 | | SDI B | 43 | ~2.5 | | SDI B | 44 | ~2.5 | | SDI B | 45 | ~2.5 | | SDI B | 46 | ~2.5 | | SDI B | 47 | ~2.5 | | SDI B | 48 | ~2.5 | | SDI B | 49 | ~2.5 | | SDI B | 50 | ~2.5 | | SDI B | 51 | ~2.5 | | SDI B | 52 | ~2.5 | | SDI B | 53 | ~2.5 | | SDI B | 54 | ~2.5 | | SDI B | 55 | ~2.5 | | SDI B | 56 | ~2.5 | | SDI B | 57 | ~2.5 | | SDI B | 58 | ~2.5 | | SDI B | 59 | ~2.5 | | SDI B | 60 | ~2.5 | | SDI C | - | - | | SDI C | - | - | | SDI C | - | - | | SDI C | - | - | | SDI C | - | - | | SDI C | - | - | | SDI C | - | - | | SDI C | - | - | | SDI C | - | - | | SD I + Vcc = Vcc / Vcc / Vcc / Vcc / Vcc / Vcc / Vcc / Vcc / Vcc / Vcc / Vcc / Vcc / Vcc / Vcc / Vcc / Vcc / Vcc / Vcc / Vcc / Vcc / Vcc / Vcc / Vcc / Vcc / Vcc / Vcc // | The image contains multiple horizontal lines representing the voltage levels of the signals in the output channel (Vcc) for two channels (Vcc) under different conditions (e.g., “Vcc” or “Vcc” with varying amplitude). The labels on the diagrams are “Vcc” and “Vcc”. The values are labeled as “Vcc”. The numbers inside the diagrams are “Vcc”. The colors represent the signal type.

Cch Dch

Figure 6-59 Tiled display

6. BASIC OPERATION

- When Display Mode Is ALIGN-H

The screen is divided by channel and arranged side by side.

Ach Bch Cch Dch
Leader LV5600 - BASIC OPERATION - 1

line | Channel | Time (s) | Signal Value | |---------|----------|--------------| | SCD A | 0.000 | 87.265 | | SCD A | 0.000 | 87.265 | | SCD A | 0.000 | 87.265 | | SCD A | 0.000 | 87.265 | | SCD A | 0.000 | 87.265 | | SCD A | 1.000 | 87.265 | | SCD A | 1.000 | 87.265 | | SCD A | 1.000 | 87.265 | | SCD A | 1.000 | 87.265 | | SCD A | 1.000 | 100 | | SCD A | 1.000 | 100 | | SCD B | 0.000 | 87.265 | | SCD B | 0.000 | 87.265 | | SCD B | 0.000 | 87.265 | | SCD B | 0.000 | 87.265 | | SCD B | 0.000 | 87.265 | | SCD B | -1.000 | 87.265 | | SCD B | -1.000 | 87.265 | | SCD B | -1.000 | 87.265 | | SCD B | -1.000 | 87.265 | | SCD B | -1.000 | 100 | | SCD C | 0.000 | 87.265 | | SCD C | 0.000 | 87.265 | | SCD C | 0.000 | 87.265 | | SCD C | -1.000 | 87.265 | | SCD C | -1.000 | 87.265 | | SCD C | -1.000 | 87.265 | | SCD D | 1.000 | 87.265 | | SCD D | -1.000 | 87.265 | | SCD D | -1.000 | 87.265 | | SCD D | -1.000 | 100 | | SCD D | -1.000 | 100 | | SCD D | -1.000 | 100 | | SCD D | -1.000 | 15 | | SCD D | -1.000 | 15 | | SCD D | -1.000 | 15 | | SCD D | -1.000 | 15 | | SCD D | -1.000 | 3 | | SCD D | -1.000 | 3 | | SCD D | -1.000 | 3 | | SCD D | -1.000 | 3 | | SCD D | -1.000 | 3 | | SCD D | -1.000 | 3 | | SCD D | -1,5 | 87.265 | | SCD D | -1,5 | 87.265 | | SCD D | -1,5 | 87.265 | | SCD D | -1,5 | 87.265 | | SCD D | -1,5 | 87.265 | | SCD D | -1,5 | 8 | | SCD D | -1,5 | 8 | | SCD D | -1,5 | 8 | | SCD D | -1,5 | 8 | | SCD D | -1,5 | 8 | | SCD D | -1,5 | 3 | | SCD D | -1,5 | 3 | | SCD D | -1,5 | 3 | | SCD D | -1,5 | 3 | | SCD D | -1,5 | 3 | | SCD D | -1,5 | 3 | | SCD D | -1,5 | 3 | | T-4 | 1 | 87.265 | | T-4 | -1 | 87.265 | | T-4 | +1 | 87.265 | | T-4 | +2 | 87.265 | | T-4 | +3 | 87.265 | | T-4 | +4 | 87.265 | | T-4 | +5 | 87.265 | | T-4 | +6 | 87.265 | | T-4 | +7 | 87.265 | | T-4 | +8 | 87.265 | | T-4 | +9 | 87.265 | | T-4 | +10 | 87.265 | | T-4 | +11 | 87.265 | | T-4 | +12 | 87.265 | | T-4 | +13 | 87.265 | | T-4 | +14 | 87.265 | | T-4 | +15 | 87.265 | | T-4 | +16 | 87.265 | | T-4 | +17 | 87.265 | | T-4 | +18 | 87.265 | | T-4 | +19 | 87.265 | | T-4 | +20 | 87.265 | | T-4 | +21 | 87.265 | | T-4 | +22 | 87.265 | | T-4 | +23 | 87.265 | | T-4 | +24 | 87.265 | | T-4 | +25 | 87.265 | | T-4 | +26 | 87.265 | | T-4 | +27 | 87.265 | | T-4 | +28 | 87.265 | | T-4 | +29 | 87.265 | | T-4 | +3 | 87.265 | | T-4 | +3 | 87.265 | | T-4 | +3 | 87.265 | | T-4 | +3 | 87.265 | | T-4 | +3 | 87.265 | | T-4 | +3 | 87 | | T-4 | +3 | 8 | | T-4 | +3 | 3 | | T-4 | +3 | 3 | | T-4 | +3 | 3 | | T-4 | +3 | 3 | | T-4 | +3 | 3 | | T-4 | +3 | 3 | | T-4 | +3 | 3 | | T-4 | +3 | 3 | S SDF SDF SDF SDF SDF SDF SDF SDF SDF SDF SDF SDF SDF SDF SDF SDF SDF SDF SDF SDF SDF SDF SDF SDF SDF SDF SDF SDF SDF SDF SDF SDF SDF SDF

Figure 6-60 ALIGN-H display

- When Display Mode Is ALIGN-V

The screen is divided by channel and arranged top to bottom.

1920:00053.34 YVDC422 YEN 10 GAN 16:000 SPEED TH x1 YOCH 1920:00053.34 YVDC422 YEN 10 GAN 16:000 SPEED TH x1 YOCH 1920:00053.34 YVDC422 YEN 10 GAN 16:000 SPEED TH x1 YOCH 1920:00052.34 YVDC422 YEN 10 GAN 16:000 SPEED TH x1 YOCH 1920:00053.34 YVDC422 YEN 10 GAN 16:000 SPEED TH x1 YOCH 1920:00053.34 YVDC422 TEN 10 GAN 16:000 SPEED TH x1 YOCH 1920:00053.34 YVDC422 TEN 10

Figure 6-61 ALIGN-V display

6. BASIC OPERATION

6 DELETE

Deletes the selected item.

7 DEFAULT LAYOUT

Resets the layout to the initial settings defined for each measurement mode. Grid Size is not reset.

8 Grid Size: 10x10 / 30x30

Select the grid size.

The position and size of items snap to the grid specified here.

9 Main

Measurement items.

• WFM

Shows the video signal waveform display.

- PIC

Shows the picture display.

- VECTOR

Click or tap this after selecting the display mode on the VECTOR tab to show the vector waveform. A CIE chromaticity diagram will not be displayed properly if the VECT item is overlapping other items.

- AUDIO

Click or tap this after selecting the display mode on the AUDIO tab to show audio. If SER03 is not installed, the message "Not installed" is displayed.

- STATUS

Click or tap this after selecting the display mode on the STATUS tab to show the status.

• EYE

Click or tap this after selecting the display mode on the EYE tab to show the eye pattern or jitter.

If SER02 is not installed, the message "Not installed" is displayed.

10 Sub

Items for displaying information.

- FORMAT

Shows the format (e.g., 1920x1080/59.94I YCbCr(422) 10bit HD).

If you place this item, you can show and hide it using the GENERAL SETUP tab of the SYS menu.

It is normally displayed in white, but if the input format is not appropriate, it turns red.

- INPUT

Shows the input signal (e.g., SDI A).

If you place this item, you can show and hide it using the GENERAL SETUP tab of the SYS menu.

• TIME

Shows the time (e.g., TIME: 00:00:00).

If you place this item, you can select the display format using the GENERAL SETUP tab of the SYS menu.

- DATE

Shows the date (e.g., DATE: 2000/01/01).

If you place this item, you can select the display format using the GENERAL SETUP tab of the SYS menu.

Only one item is displayed even if you switch to simul mode.

11 Tally

Items for tally display and camera ID display.

Unarranged items are displayed with black characters. Clicking an item places the item.

Arranged items are displayed with green characters. Clicking an item selects the item.

- LABEL-1, LABEL-2

Shows the camera ID set on the RS485 tab, CAMERA ID tab or through RS-422/485.

The default values are CAM A to CAM D and vary depending on the channel.

[See also] RS485 tab → 7.2.12, "Configuring the RS-422/485 Settings (SER27)"

CAMERA ID tab → 7.2.13, "Setting the Camera ID (SER27)"

• IRIS

Shows the iris set on the RS485 tab, CAMERA ID tab or through RS-422/485.

The default values are CAM A to CAM D and vary depending on the channel.

[See also] RS485 tab →7.2.12, "Configuring the RS-422/485 Settings (SER27)"

CAMERA ID tab →7.2.13, "Setting the Camera ID (SER27)"

• TALLY-1, TALLY-2, TALLY-EXT

Shows the tally set through the remote connector, TALLY tab or RS-422/485.

TALLY-EXT (EXTENDED) is a tally display with a comment of up to eight characters. You can edit the comment on the REMOTE tab.

[See also] TALLY tab → 7.2.14, "Configuring the Tally Display (SER27)"

REMOTE tab → 7.2.8, "Setting the Remote Connector"

6. BASIC OPERATION

12 Area

Set the position and size of the selected item.

The coordinates at the upper left corner of the screen are (0, 0) . Those at the lower right corner are (1920, 1080) . Based on these references, the coordinates of the upper left corner of the item is (x0, y0) , and those of the lower right corner is (x1, y1) .

You can change the values using the ▲▼ key or the wheel on the mouse.

13 Option

Set the options for the selected item.

- Format

Turns on and off the format display (e.g., 1920x1080/59.94I YCbCr(422) 10bit HD).

This option cannot be displayed for an AUDIO item, EYE item, or an item on the Sub tab. If this is set to on, you can show and hide it using the GENERAL SETUP tab of the SYS menu.

It is normally displayed in white, but if the input format is not appropriate, it turns red.

- Input

Turns on and off the input signal display (e.g., SDI A).

This option cannot be displayed for an AUDIO item, EYE item, or an item on the Sub tab. If this is set to on, you can show and hide it using the GENERAL SETUP tab of the SYS menu.

- Time

Turns on and off the time display (e.g., TIME: 00:00:00).

This option cannot be displayed for an AUDIO item, EYE item, or an item on the Sub tab. If this is set to on, you can select the display format using the GENERAL SETUP tab of the SYS menu.

• Background Transparent

Selects the transmittance of the background when the sub item is superimposed on a picture.

When enabled, the transmittance is set to 100 %; when disabled, the transmittance is set to 50 %.

You cannot set this option for a PIC item.

•Frame

Turns on and off the frame display of PICTURE items.

14 Tally Setup

Select whether to display tallies on the outer frame of the PICTURE item.

This setting applies to all PICTURE items and enhanced layout.

If this is set to on, TALLY-1 set through the remote connector, TALLY tab or RS-422/485 is shown on the outside and TALLY-2 on the inside. Tally is not displayed when the input signal is 3G-B-DS.

EXT CAM A CAM A CAM A SDI A 1920x1080/59.94I YCbCr(422) 10bit HD TIME: 10:20:30

Figure 6-62 Tally display

15 Audio Level

Select whether to display audio meters on both sides of the PICTURE item.

This setting applies to all PICTURE items.

If the AUDIO item is also displayed simultaneously or if the input signal is 3G-B-DS, audio meters are not displayed.

1920x1080/58.94/- YCbCr(422)-10bit HD EXT SDI A TIME: 17:16:42

Figure 6-63 Audio meter display

16 VECT

Select the display mode of the VECTOR item. Select the mode before clicking or tapping the VECTOR item.

VECT / 5BAR / HIST / CIEShows the normal vector display. You can switch the display between vector waveform, 5bar, histogram and CIE chromaticity diagram. It cannot be arranged with the items below at the same time. If you want to arrange the items below, delete this item first.
VECTORShows vectors.
5BARSwitches to the 5-bar display.
HISTA histogram is displayed.
CIEThe CIE chromaticity diagram display is shown.

17 AUDIO

Select the display mode of the AUDIO item. Select the mode before clicking or tapping the AUDIO item.

LEVEL BAR + etc.This is the normal audio display. The display switches between Lissajous, surround, meter, status, and loudness.It cannot be arranged with the items below at the same time. If you want to arrange the items below, delete this item first.
LEVEL BAR Meters are displayed.It cannot be arranged with LOUDNESS at the same time.When 16 channels are being measured, meters will not be displayed correctly if arranged at the same time with SURROUND.
LISSAJOULissajous curves are displayed.
STATUSShows the status.
SURROUND Surround waveforms are displayed.This item will not be displayed correctly when 16 channels are being measured or when embedded audio is being measured.
LOUDNESSLoudness are displayedIt cannot be arranged with LEVEL BAR at the same time.This item will not be displayed correctly when 16 channels are being measured or when embedded audio is being measured.

18 STATUS

Selects the display mode of the STATUS item. Select the mode before clicking or tapping the STATUS item.

STATUS ALLThis is the normal status display. The display switches between error count, data dump, etc.It cannot be arranged with the items below at the same time. If you want to arrange the items below, delete this item first.
STATUS ERRORError counts are displayed.
DATA DUMPData dump is displayed.
EVENT LOGThe event log is displayed.
EXT REFPhase differences are displayed.
ANC PACKET SUMMARYA summary of ancillary pockets is displayed.
ANC One of the following is displayed.
•STATUS EDH: EDH Display•STATUS PAYLOAD: Payload ID Display•STATUS CONTROL: Audio control packet display•STATUS ARIB CC: Closed Caption Display•STATUS ARIB NETQ: NET-Q display•STATUS ARIB TRIG: Data trigger display•STATUS ARIB USER1: User data 1 display•STATUS ARIB USER2: User data 2 display•STATUS SMPTE AFD: AFD Display•STATUS SEARCH: Ancillary packet search display

6. BASIC OPERATION

19 EYE

Select the display mode of the EYE item. Select the mode before clicking or tapping the EYE item.

EYE / JITTERThis is the normal eye pattern display. The display switches between eye pattern and jitter.It cannot be arranged with the items below at the same time. If you want to arrange the items below, delete this item first.
EYEThe eye pattern is displayed.
JITTERThe jitter waveform is displayed.

For example, you can arrange EYE and JITTER to be displayed at the same time.

Leader LV5600 - EYE - 1

line | Time (ms) | Amplitude | |-----------|---------| | 0 | 0.0 | | 1 | 0.0 | | 2 | 0.0 | | 3 | 0.0 | | 4 | 0.0 | | 5 | 0.0 | | 6 | 0.0 | | 7 | 0.0 | | 8 | 0.0 | | 9 | 0.0 | | 10 | 0.0 | | 11 | 0.0 | | 12 | 0.0 | | 13 | 0.0 | | 14 | 0.0 | | 15 | 0.0 | | 16 | 0.0 | | 17 | 0.0 | | 18 | 0.0 | | 19 | 0.0 | | 20 | 0.0 | | 21 | 0.0 | | 22 | 0.0 | | 23 | 0.0 | | 24 | 0.0 | | 25 | 0.0 | | 26 | 0.0 | | 27 | 0.0 | | 28 | 0.0 | | 29 | 0.0 | | 30 | 0.0 | | 31 | 0.0 | | 32 | 0.0 | | 33 | 0.0 | | 34 | 0.0 | | 35 | 0.0 | | 36 | 0.0 | | 37 | 0.0 | | 38 | 0.0 | | 39 | 0.0 | | 40 | 0.0 | | 41 | 0.0 | | 42 | 0.0 | | 43 | 0.0 | | 44 | 0.0 | | 45 | 0.0 | | 46 | 0.0 | | 47 | 0.0 | | 48 | 0.0 | | 49 | 0.0 | | 50 | 0.0 | | 51 | 0.0 | | 52 | 0.0 | | 53 | 0.0 | | 54 | 0.0 | | 55 | 0.0 | | 56 | 0.0 | | 57 | 0.0 | | 58 | 0.0 | | 59 | 0.0 | | 60 | 0.0 | | 61 | 0.0 | | 62 | 0.0 | | 63 | 0.0 | | 64 | 0.0 | | 65 | 0.0 | | 66 | 0.0 | | 67 | 0.0 | | 68 | 0.0 | | 69 | 0.0 | | 70 | 0.0 | | 71 | 0.0 | | 72 | 0.0 | | 73 | 0.0 | | 74 | 0.0 | | 75 | 0.0 | | 76 | 0.0 | | 77 | 0.0 | | 78 | 0.0 | | 79 | 0.0 | | 80 | 0.0 | | 81 | 0.0 | | 82 | 0.0 | | 83 | 0.0 | | 84 | 0.0 | | 85 | 0.0 | | 86 | 0.0 | | 87 | 0.0 | | 88 | 0.0 | | 89 | 0.0 | | 90 | 0.0 | | 91 | 0.0 | | 92 | 0.0 | | 93 | 0.0 | | 94 | 0.0 | | 95 | 0.0 | | 96 | 0.0 | | 97 | 0.0 | | 98 | 0.0 | | 99 | 0.0 | | Note: The data is in milli-seconds format for the last two time points (e.g., 'Aug: -765.%') and the rest of the time points (e.g., 'A' or 'B'). The values are estimated based on the current value 'A' and the corresponding time point 'B'. The y-axis is labeled 'Average' and the x-axis is labeled 'Time'. The chart is divided into four sections: 'On', 'On', 'On', and 'On'.

Figure 6-64 Eye pattern and jitter display

6.6 Enhanced Layout (SER26)

Enhanced layout is an extended function that enables the measurement screens of up to four channels to be laid out on a single screen simultaneously in simul mode. To use this function, connect a mouse to the front panel USB port.

CAM A EXT CAM A CAM A SDI A DATE: 2018/07/05 TIME: 08:52:05 1920x1080/59.941 YCbCr(422) 10bit HD CAM B EXT CAM B CAM B CAM B SDI B EXT CAM C EXT CAM C CAM C CAM C SDI C EXT CAM D EXT CAM D CAM D CAM D SDI D

Figure 6-65 Enhanced layout

Enhanced layout will not be initialized even if PARAM INIT YES is executed from the SYS menu. To initialize it, execute LAYOUT INIT YES or ALL INIT YES from the SYS menu, factory default initialization, or DEFAULT LAYOUT from the enhanced layout window.

[See also] 7.7, "Initialization"

As shown below, the number of layout channels differs between the enhanced layout and customized layout.

[See also] 6.5, "Customized Layout (SER26)"

Table 6-2 Layout comparison

Enhanced layoutCustomized layout
Number of layout channels1 to 41

6. BASIC OPERATION

6.6.1 Enhanced Layout Procedure

As an example, this section will explain the procedure to display the enhanced layout of channels A to D.

Enhanced layout can be shown in simul mode when multi-screen display is in use.

  1. On the SDI IN SETUP1 tab of the SYS menu, set SDI System to SD/HD/3G-A/3G-B-DL.

SYS → F•1 SIGNAL IN OUT → F•2 PREV TAB or F•3 NEXT TAB → SDI IN SETUP1 SDI IN SETUP2 SDI OUT MONITOR OUT HDR IP SETUP1 IP SETUP2 SDI System 2K SD/HD/3G-A/3G-B-DL Colorimetry Payload ID Display Assignment Type SDI Input-A AUTO Input-B AUTO Input-C AUTO Input-D AUTO SDI Input Rate SDI-1 AUTO SDI-2 AUTO SDI-3 AUTO SDI-4 AUTO COMPLETE PREV TAB NEXT TAB up menu

Figure 6-66 SDI IN SETUP1 tab

  1. Set F•7 DISPLAY of the INPUT menu to SIMUL, and set F•1 A to F•4 D to ON.

INPUT → F1 A F2 B F3 C F4 D F5 F6 OPERATE F7 DISPLAY ON ON ON ON COM SIMUL F·1 F·2 F·3 F·4 F·5 F·6 F·7

Figure 6-67 INPUT menu

  1. Press MULTI.

  2. Right-click in the measurement screen, and click ENHANCED LAYOUT.

The enhanced layout screen appears.

Layout MODE WFM PICTURE VECTOR Layout-1 Mode: PICTURE Layout-2 Mode: WFM Layout-3 Mode: VECTOR Layout-4 Mode: STATUS Main Sub1 Sub2 Sub3 Othe Layout Info Tally LAYOUT-1 LAYOUT-2 LAYOUT-3 LAYOUT-4 MAIN: LAYOUT-1 PICTURE MAIN: LAYOUT-2 WFM MAIN: LAYOUT-3 VECTOR DELETE ALL CLEAR DEFAULT LAYOUT [PICTURE] MAIN LAYOUT-1 x0 : 0 x1 : 1120 y0 : 80 y1 : 690 Grid Size : +10x10 30x30 SUB2 LAYOUT-1 PICTURE SUB3 LAYOUT-1 PICTURE SUB2 LAYOUT-2 WFM SUB3 LAYOUT-2 VECTOR SUB2 LAYOUT-3 VECTOR SUB2 LAYOUT-4 VECTOR SUB2 LAYOUT-5 VECTOR SUB2 LAYOUT-6 VECTOR SUB2 LAYOUT-7 VECTOR SUB2 LAYOUT-8 VECTOR SUB2 LAYOUT-9 VECTOR SUB2 LAYOUT-10 VECTOR

Figure 6-68 Enhanced layout screen

  1. Change the layout as necessary.

A default layout is initially stored in the main unit. Even after you change the layout, you can return to the default layout by clicking DEFAULT LAYOUT.

To create a new layout after clearing the default layout, click ALL CLEAR.

The basic operation is the same as with the customized layout. See section 6.5.2, "Layout Procedure."

For details on the enhanced layout screen, see section 6.6.2, "Enhanced Layout Screen Description."

- Selecting the Measurement Mode

You can select up to four measurement modes. Assign measurement modes to Layout-1 to Layout-4.

MODE WFM PICTURE VECTOF Layout-1 Mode : PICTURE Layout-2 Mode : WFM Layout-3 Mode : VECTOR Layout-4 Mode : STATUS

6. BASIC OPERATION

- Arranging Items

Arrange items on the Main, Sub1, Sub2, Sub3, and Other tabs.

Main, Sub1, Sub2, and Sub3 represent four channels. The channel selected with F•6 INPUT SELECT on each measurement screen is displayed in Main.

Main Sub1 Sub2 Sub3 Othe Layout Info Tally LAYOUT-1 LAYOUT-2 LAYOUT-3 LAYOUT-4

- Notes

  • Arrange PICTURE items so they do not overlap.
  • Arrange waveform display items (WFM, VECTOR) so they do not overlap.
  • Arrange Main, Sub1, Sub2, and Sub3 according to the number of channels to be used with the following combinations. Arrangements other than these combinations are possible, but they will not be displayed correctly.
Number of channelsMainSub1Sub2Sub3
1---
2--
3-
4

6. BASIC OPERATION

  1. Right-click or tap in the enhanced layout screen, and click or tap SAVE.

The measurement screen returns.

If you click or tap EXIT, all the changes that you made up to that point will be canceled.

CAM A CAM A CAM A EXT SDI A DATE: 2018/07/05 TIME: 08:52:05 1920x1080/59.941 YC2O(422) 10bit HD COLORIMETER SET 3.09 CAM A-ONE COMPONENT CAM B CAM B CAM B SDI B CAM C CAM C CAM C SDI C CAM D CAM D CAM D SDI D EXT EXT EXT EXT EXT

Figure 6-69 Enhanced layout (INPUT SELECT = A)

Items arranged on Main show the channels selected with F•6 INPUT SELECT on each measurement screen. However, if you click a picture of Sub1, Sub2, or Sub3, the channel that you click appears on Main.

For example, in the above figure, if you click the picture of Sub2 (Cch), Cch appears on Main. (Sub1 to Sub3 show channels other than the channel shown on Main in the A, B, C, D order.)

CAM C EXT CAM C CAM C SDI C DATE: 2018/07/04 TIME: 17:02:29 1920x1030/59.941 YC#(422) 10bit HD CAM A CAM A CAM A SDI A CAM B CAM B CAM B SDI B CAM D EXT CAM D CAM D CAM D SDI D

Figure 6-70 Enhanced layout (INPUT SELECT = C)

6.6.2 Enhanced Layout Screen Description

1
Layout MODE WFM PICTURE VECTOR** Layout-1 Mode: PICTURE - Layout-2 Mode: WFM - Layout-3 Mode: VECTOR - Layout-4 Mode: STATUS - Main Sub1 Sub2 Sub3 Othe * Layout Info Tally LAYOUT-1 LAYOUT-2 LAYOUT-3 LAYOUT-4 DELETE ALL CLEAR DEFAULT LAYOUT [PICTURE]MAINLAYOUT-1 x0 : 0 x1 : 1120 y0 : 60 y1 : 650 Grid Size : 10x10 30x30 MAIN.LAYOUT-1 PICTURE SUB1:READ INPUT SUB1:READ-2 VFM SUB1:READ-3 VECTOR SUB2:LAYOUT-1 PICTURE SUB2:READ INPUT SUB2:READ-2 VFM SUB2:READ-3 VECTOR SUB3:LAYOUT-1 PICTURE SUB3:READ INPUT SUB3:READ-2 VFM SUB3:READ-3 VECTOR MAIN.LAYOUT-2 WFM MAIN.LAYOUT-3 VECTOR (1120x830) (1120x830) (1120x830) (1120x830) (1120x830) (1120x830) (1120x830) (1120x830) (1120x830) (1120x830) (1120x830)

Figure 6-71 Enhanced layout screen description

1 Enhanced layout window

The Layout window is used to create layouts.

You can move the window by dragging and close it by clicking ☒ in the upper right of the window. If you close it, you can redisplay it by double-clicking in the enhanced layout screen.

2 Item

Items arranged on the Main, Sub1 to Sub3, and Other tabs are displayed. The upper-left coordinate, item name, and size are displayed in the frame. If you select it, the item name color changes from white to light blue.

Layout MODE WFM PICTURE VECTO# Layout-1 Mode : PICTURE Layout-2 Mode : WFM Layout-3 Mode : VECTOR Layout-4 Mode : STATUS 3 4 Main Sub1 Sub2 Sub3 Othe Layout Info Tally LAYOUT-1 LAYOUT-2 LAYOUT-3 LAYOUT-4 5 6 9 DELETE ALL CLEAR DEFAULT LAYOUT [PICTURE]:MAIN: LAYOUT-1 x0 : 0 : x1 : 1120 y0 : 60 : y1 : 690 Grid Size : * 10x10 30x30 MODE WFM PICTURE VECTO# Format Time Input Frame Background Transparent DATE AUDIO EYE REMOTE LABEL TEMP-SAVE TEMP-LOAD SELECT OPTION MAIN SELECT COPY MAIN PASTE ALL --- << TOP >> 7

Figure 6-72 Enhanced layout window

3 MODE

Assign measurement modes to Layout-1 to Layout-4. You can select from the following measurement modes.

WFM / VECTOR / PICTURE / STATUS

4 WFM / PICTURE / VECTOR / AUDIO / STATUS / EYE

Set the options for each measurement mode.

You can set these items when you arrange an item.

- Format

Turns on and off the format display (e.g., 1920x1080/59.94I YCbCr(422) 10bit HD). If you set this to ON, you can show and hide it using the GENERAL SETUP tab of the SYS menu.

It is normally displayed in white, but if the input format is not appropriate, it turns red. If the specified format is not received, it turns yellow.

- Time

Turns on and off the time display (e.g., TIME: 00:00:00).

If you set this option to ON, you can select the display format using the GENERAL SETUP tab of the SYS menu.

6. BASIC OPERATION

- Input

Turns on and off the input signal display (e.g., SDI A).

If you set this to ON, you can show and hide it using the GENERAL SETUP tab of the SYS menu.

- Frame

Turns on and off the frame display of PICTURE items.

• Background Transparent

Selects the transmittance of the background when the sub item is superimposed on a picture.

When enabled, the transmittance is set to 100 %; when disabled, the transmittance is set to 50 %.

You cannot set this option for a PICTURE item.

- Tally Setup

Select whether to display tallies on the outer frame of the PICTURE item.

See "14 Tally Setup" in section 6.5.3, "Layout Screen."

- Audio Level

Select whether to display audio meters on both sides of the PICTURE item.

See "15 Audio Level" in section 6.5.3, "Layout Screen."

5 Main / Sub1 / Sub2 / Sub3

Main, Sub1, Sub2, and Sub3 represent four channels. For each channel, you arrange items. (To arrange items for three channels, use the Main, Sub1, Sub2 combination. For two channels, use the Main, Sub1 combination. For one channel, use Main.)

Main displays the channel selected with F•6 INPUT SELECT on each measurement screen. Sub1 to Sub3 show channels other than the channel shown on Main in the A, B, C, D order.

Items are categorized into Layout, Info, and Tally.

Unarranged items are displayed with black characters. Clicking an item places the item. Arranged items are displayed with green characters. Clicking an item selects the item.

Layout Info Tally LAYOUT-1 LAYOUT-2 LAYOUT-3 LAYOUT-4

Layout Info Tally FORMAT INPUT TIME

Layout Info Tally TALLY-1 LABEL-1 TALLY-2 LABEL-2 TALLY-EXT IRIS

- LAYOUT-1 to LAYOUT-4

Shows the measurement mode assigned on the MODE tab.

6. BASIC OPERATION

- FORMAT

Shows the format (e.g., 1920x1080/59.94I YCbCr(422) 10bit HD).

If you place this item, you can show and hide it using the GENERAL SETUP tab of the SYS menu.

It is normally displayed in white, but if the input format is not appropriate, it turns red. If the specified format is not received, it turns yellow.

- INPUT

Shows the input signal (e.g., SDI A).

If you place this item, you can show and hide it using the GENERAL tab of the SYS menu.

• TIME

Shows the time (e.g., TIME: 00:00:00).

If you place this item, you can select the display format using the GENERAL tab of the SYS menu.

• TALLY-1, TALLY-2, TALLY-EXT

Shows the tally set through the remote connector, TALLY tab or RS-422/485.

TALLY-EXT (EXTENDED) is a tally display with a comment of up to eight characters. You can edit the comment on the REMOTE tab.

[See also] TALLY tab → 7.2.14, "Configuring the Tally Display (SER27)"

REMOTE tab → 7.2.8, "Setting the Remote Connector"

- LABEL-1, LABEL-2

Shows the camera ID set on the RS485 tab, CAMERA ID tab or through RS-422/485.

The default values are CAM A to CAM D and vary depending on the channel.

[See also] RS485 tab → 7.2.12, "Configuring the RS-422/485 Settings"

CAMERA ID tab → 7.2.13, "Setting the Camera ID (SER27)"

• IRIS

Shows the iris set on the RS485 tab, CAMERA ID tab or through RS-422/485.

The default values are CAM A to CAM D and vary depending on the channel.

[See also] RS485 tab →7.2.12, "Configuring the RS-422/485 Settings"

CAMERA ID tab →7.2.13, "Setting the Camera ID (SER27)"

6 Other

- DATE

Place the DATE item.

The DATE item shows the date (e.g., DATE: 2000/01/01).

If you place this item, you can select the display format using the GENERAL SETUP tab of the SYS menu.

• AUDIO

Place the AUDIO item.

• EYE

Place the EYE item.

7 Ctrl

Manipulates items such as select, copy, and paste.

- TEMP-SAVE

Temporarily saves the current layout.

Note that the layout that is present when you enter the enhanced layout screen is automatically saved even if you don't click TEMP-SAVE.

The saved layout is deleted when you exit from the enhanced layout screen.

- TEMP-LOAD

Loads the layout saved with TEMP-SAVE or the layout that was present when you entered the enhanced layout screen.

- SELECT OPTION

Selects the target items when you group items with the SELECT function.

SELECT ITEM OPTION Layout : ✓ 1 ✓ 2 ✓ 3 ✓ 4 Information : ✓ FORMAT ✓ INPUT ✓ TIME Tally : ✓ 1 ✓ 2 ✓ EXT Tally Label : ✓ 1 ✓ 2 ✓ IRIS CANCEL OK

- MAIN/SUB1/SUB2/SUB3 - SELECT

Selects the items of the selected channels as a group.

If items are not grouped, SELECT is displayed with black characters.

If items are grouped, SELECT is displayed with green characters, and the selected item range is displayed in white. Moving by dragging, COPY, and DELETE can be used on grouped items.

• COPY

Temporarily saves the layout of items grouped with SELECT.

The saved layout is deleted when you exit from the enhanced layout screen or change the SELECT OPTION.

• MAIN/SUB1/SUB2/SUB3 - PASTE

Pastes the layout saved with COPY to the selected channel.

This is useful such as when you want to make Sub1 to Sub3 the same layout.

If there is a same item as the copied item at the paste destination channel, the position and size are overwritten.

6. BASIC OPERATION

- ALL - ---

CH - MAIN/SUB1/SUB2/SUB3

ITEM - LAYOUT-1/LAYOUT-2 and the like

Selects the target items when you select items with << and >>.

If you select ALL, all items of all channels are selected in order.

If you select CH, all items of the selected channel are selected in order.

If you select ITEM, the selected items of all channels are selected in order.

• <<, >>

Selects the items specified by ALL/CH/ITEM in order. You can select an item by clicking it directly, but this is useful when items are overlapped and you want to select items in the back.

Moving by dragging, COPY, DELETE, and TOP can be used on selected items.

• TOP

Moves the selected items to the front.

8 DELETE

Deletes individually selected or grouped items.

If the Ctrl tab is displayed, individually selected items can only be deleted if they are part of the ALL/CH/ITEM target.

9 ALL CLEAR

Deletes all items.

10 DEFAULT LAYOUT

Resets the layout to factory default.

11 Item name

Displays the selected item name.

12 x0, y0, x1, y1

Set the position and size of the selected item.

The coordinates at the upper left corner of the screen are (0, 0) . Those at the lower right corner are (1920, 1080) . Based on these references, the coordinates of the upper left corner of the item is (x0, y0) , and those of the lower right corner is (x1, y1) .

You can change the values using the ▲▼ key or the wheel on the mouse.

13 Grid Size: 10x10 / 30x30

Select the grid size.

The position and size of items snap to the grid specified here.

7. SYSTEM SETTINGS

7. SYSTEM SETTINGS

The SYS menu can be used to configure the instrument and options. Press SYS, and use the SYS menu.

SYS → F1 SIGNAL IN OUT F2 SYSTEM SETUP F3 SYSTEM INFO F4 LICENSE F5 LCD BACK LIGHT 28 F6 LCD OFF F7 INITIALIZE F·1 F·2 F·3 F·4 F·5 F·6 F·7

Figure 7-1 SYS menu

7.1 Configuring the I/O Connectors

To configure the I/O connector settings, use F•1 SIGNAL IN OUT on the SYS menu.

7.1.1 Configuring the Input System

Use SDI on the SDI IN SETUP1 tab to configure the input system of SDI INPUT and IP on the rear panel.

SYS → F•1 SIGNAL IN OUT → F•2 PREV TAB or F•3 NEXT TAB → SDI IN SETUP1 SDI IN SETUP2 SDI OUT MONITOR OUT HDR IP SETUP1 IP SETUP2 SDI System 2K SDI/HD/3G-A/3G-B-DL Colorimetry Payload ID Display Assignment Type SDI Input A SDI Input B SDI Input C SDI Input D SDI SDI Input Rate SDI-1 AUTO SDI-2 AUTO SDI-3 AUTO SDI-4 AUTO COMPLETE PREV TAB NEXT TAB up menu

Figure 7-2 SDI IN SETUP1 tab

- System

Select the input format.

4K 12G / 4K 3G Quad Link / 4K 3G Dual Link / 4K HD Quad Link / 2K SD/HD/3G-A/3G-B-DL / 2K HD Dual Link / 2K 3G Dual Link / 2K 3G-B-DS 

7. SYSTEM SETTINGS

- Colorimetry

Select the colorimetry to use on the video-signal-waveform, vector, picture, and CIE-chromaticity-diagram displays.

The currently applied colorimetry is displayed in cyan in the vector display and CIE chromaticity diagram display. For 3G(QL) and 3G(DL)-4K, if you select a payload ID, the current applied colorimetry is displayed in yellow if the colorimetries of all links are not matched.

For SD input, the colorimetry is fixed to BT.601, regardless of the colorimetry selection.

The picture display on the instrument LCD is not capable of expressing the color space of the applied colorimetry.

Payload ID:If SDI System is 4K 12G, 4K 3G Quad Link, or 4K 3G Dual Link and the division transmission system is 2 sample interleave, the instrument automatically detects BT.2020 from the payload ID and operates. For the square format or for modes other than BT.2020, the instrument runs in BT.709 mode.
BT-709:Runs in BT.709 mode.
BT-2020:Runs in BT.2020 mode.
DCI:Runs in DCI mode.

- XYZ Gamma Select

Select the gamma for XYZ input.

Bottom Zero Gamma / DCI Gamma

7.1.2 Input Signal Assignment

Use Display Assignment on the SDI IN SETUP1 tab to assign the SDI INPUT and IP connectors on the rear panel to the display channels.

SYS → F•1 SIGNAL IN OUT → F•2 PREV TAB or F•3 NEXT TAB → SDI IN SETUP1 SDI IN SETUP2 SDI OUT MON TOR OUT HDR SDI System 2K SDHD/3G-A/3G-B-DL Colonimetry Payload ID Signal Input Type SDI Input A SDI-1 Input B SDI-2 Input C SDI-3 Input D SDI-4 SDI Input Rate SDI-1 AUTO SDI-2 AUTO SDI-3 AUTO SDI-4 AUTO COMPLETE PREV TAB NEXT TAB up menu

Figure 7-3 SDI IN SETUP1 tab

7. SYSTEM SETTINGS

- Type

Select which signals to apply to the display channels, the SDI signals received through the SDI INPUT connectors or the IP signals received through the IP connectors on the rear panel. This selection is possible when SDI System is set to SD/HD/3G-A/3G-B-DL, the SER05 10G IP INPUT is installed, and SER26 LAYOUT is not installed. In all other cases, the type is fixed to SDI.

SDI / IP

- Input-A to D (SER26)

When SER26 LAYOUT is installed, the display assignment display is enabled allowing you to assign a single input signal to multiple display channels, regardless of whether the signal is SDI or IP.

You can set these parameters only when SDI System is set to SD/HD/3G-A/3G-B-DL.

You can select IP Stream when the SER05 10G IP INPUT is installed.

- Input A

Selects the input to display channel A.

SDI 1 / SDI 2 / SDI 3 / SDI 4 /

IP Stream1 / IP Stream2 / IP Stream3 / IP Stream4

- Input B

Selects the input to display channel B.

SDI 1 / SDI 2 / SDI 3 / SDI 4 /

IP Stream1 / IP Stream2 / IP Stream3 / IP Stream4

- Input C

Selects the input to display channel C.

SDI 1 / SDI 2 / SDI 3 / SDI 4 /

IP Stream1 / IP Stream2 / IP Stream3 / IP Stream4

- Input D

Selects the input to display channel D.

SDI 1 / SDI 2 / SDI 3 / SDI 4 /

IP Stream1 / IP Stream2 / IP Stream3 / IP Stream4

7. SYSTEM SETTINGS

When SER26 is installed
SDI IN SETUP1 SDI IN SETUP2 SDI OUT MONITOR OUT HDR IP SETUP1 IP SETUP2 SDI System 2K SDI/HD/3G-A/3G-B-DL Colorimetry Payload ID Display Assignment Type SDI Input-A SDI 1 Input-B SDI 2 Input-C IP Stream1 Input-D IP Stream2 SDI Input Rate SDI-1 AUTO SDI-2 AUTO SDI-3 AUTO SDI-4 AUTO COMPLETE PREV TAB NEXT TAB up menu

Figure 7-4 SDI IN SETUP1 tab

7.1.3 Setting the Input Format

Use SDI Input Rate on the SDI IN SETUP1 tab to set the SDI input signal format.

SYS → F•1 SIGNAL IN OUT → F•2 PREV TAB or F•3 NEXT TAB → SDI IN SETUP1 SDI IN SETUP2 SDI OUT MONITOR OUT HDR IP SETUP1 IP SETUP2 SDI System 2K SDHD/3G-A/3G-B-DL Colorimetry Payload ID Display Assignment Type SDI Input A Input B Input C Input D SDI Input Rate SDI-1 AUTO SDI-2 AUTO SDI-3 AUTO SDI-4 AUTO COMPLETE PREV TAB NEXT TAB up menu

Figure 7-5 SDI IN SETUP1 tab

- SDI Input Rate

Select the format of the signal to receive from SDI INPUT 1 to 4. In normal cases, use AUTO. If you select a setting other than AUTO and apply a signal different from the selected format, the signal will not be received correctly.

AUTO / 12G / 3G / HD / SD

7. SYSTEM SETTINGS

7.1.4 Setting the Payload ID

User Format on the SDI IN SETUP2 tab to set the payload ID parameters.

SYS → F•1 SIGNAL IN OUT → F•2 PREV TAB or F•3 NEXT TAB → SDI IN SETUP SDI IN SETUP SDI OUT MONITOR OUT HDR Format Payload ID Use Not Use Payload ID Not use (or Missing) Division Source Sample Interleave IPaF Select Interface Segmented Frame(PsF) Color System YCbCr422 Pixel Depth 10 Bit 12 Bit Alarm Format OFF ON System 1920x1080 HD Structure YCLCr(422) 10bit Frame/Field Rate 29.97P Dilution Square Sample Interleaves Colorimetry OFF ON Type BT-709 COMPLETE PREV TAB NEXT TAB up menu

Figure 7-6 SDI IN SETUP2 tab

- Payload ID

Select whether to use the payload ID for input format identification.

This cannot be selected when SDI System is 4K HD Quad Link.

Use / Not Use

If you select Not Use, set the items marked with a Y in

7. SYSTEM SETTINGS

Table 7-1. The instrument will operate using the specified settings.

If you select Use, the items marked with a Y will be detected from the payload ID. There is no need to set these items, but if you set them and a payload ID is not embedded in the input signal, the instrument will operate using the specified settings.

Regardless of whether you select Use or Not Use, items such as scanning and frame frequency will be detected from the TRS.

Table 7-1 Payload ID settings.

Input SignalDivisioni/PsF SelectColor SystemPixel Depth
HD Cannot be set Y No need to set(fixed to YCbCr 422)No need to set (fixed to 10 bits)
SDCannot be setNo need to set (fixed to interlace)No need to set (fixed to YCbCr 422)No need to set (fixed to 10 bits)
3G-A, 3G-B-DLCannot be setYYY
3G-B-DSCannot be setYCannot be setCannot be set
12GYCannot be setYY
HD(DL)Cannot be setYYY
3G(DL)-2KCannot be setCannot be setYY
3G(DL)-4KYCannot be setCannot be setCannot be set
3G(QL)YCannot be setYY

- Division

Selects the division transmission system when SDI System is 4K.

Square / 2 Sample Interleave

- i/PsF Select

The instrument cannot detect the following formats. Therefore, select whether to use interlace or segmented frame for displaying.

This cannot be selected when SDI System is 4K or 3G Dual Link.

• 1080/60I and 1080/30PsF

• 1080/59.94I and 1080/29.97PsF

• 1080/50I and 1080/25PsF

Interlace / Segmented Frame(PsF)

- Color System

Select the color system of the input signal.

SDI System is 3G-B-DS or 4K 3G Dual Link, this is fixed to YCbCr 422, and you cannot change it.

YCbCr 422 / YCbCr 444 / RGB 444 / XYZ 444

- Pixel Depth

Select the quantization of the input signal.

SDI System is 3G-B-DS or 4K 3G Dual Link, this is fixed to 10 bit, and you cannot change it.

10bit / 12bit

7.1.5 Setting the Format Alarm

User Alarm on the SDI IN SETUP2 tab to set the format alarm parameters.

SYS → F•1 SIGNAL IN OUT → F•2 PREV TAB or F•3 NEXT TAB → SDI IN SETUP SDI IN SETUP SDI OUT MONITOR OUT HDR Format Payload ID Use Not Use Payload ID Not use (or Missing) Division Source Sample Interleave IPaF Select Interface Segmented Frame(PsF) Color System YCbCr422 Pixel Depth 10 Bit 12 Bit Alarm Format OFF ON System 1920x1080 HD Structure YCLCr(422) 10bit Frame/Field Rate 29.97P Dilution Square Sample Interleaves Colorimetry OFF ON Type BT-709 COMPLETE PREV TAB NEXT TAB up menu

Figure 7-7 SDI IN SETUP2 tab

- Format

Turn on and off the format alarm detection.

If alarm detection is set to ON and a format other than the format specified with Format is received, the instrument operates in the following manner.

• Displays the format in yellow
- Displays errors in the event log of the status display
- Displays "ERROR" in the upper right of the display.
- Transmits a signal from the alarm output remote terminal

OFF / ON

7. SYSTEM SETTINGS

  • System
  • Structure
  • Frame/Field Rate
  • Division

When format alarm detection is on, specify the expected format. For information on the format combinations that are available, see section 3.3.1, "SDI Video Formats and Standards," and 3.3.2, "IP Video Formats and Standards (SER05)."

Table 7-2 Format selection

SDI SystemSystemStructureFrame/Field RateDivision
4K 12G 3840x2160 12G TYPE 14096x2160 12G TYPE 1YCbCr(422) 10 bit YCbCr(422) 12 bit YCbCr(444) 10 bit YCbCr(444) 12 bit RGB(444) 10 bit RGB(444) 12 bit60/59.94/50/48/47.95/30/29.97/25/24/23.98/P-
4K 3G Quad Link3840x2160 3G-B-DL Quad4096x2160 3G-B-DL Quad3840x2160 3G-A Quad4096x2160 3G-A QuadYCbCr(422) 10 bit YCbCr(422) 12 bit YCbCr(444) 10 bit YCbCr(444) 12 bit RGB(444) 10 bit RGB(444) 12 bit60/59.94/50/48/47.95/30/29.97 / 25/24/23.98/P30/29.97/25/24/23.98/PsFSquare/2 Sample Interleave
4K 3G Dual Link3840x2160 3G-B-DS Dual4096x2160 3G-B-DS DualYCbCr(422) 10 bit30/29.97/25/24/23.98/P30/29.97/25/24/23.98/PsFSquare/2 Sample Interleave
4K HD Quad Link3840x2160 HD Quad4096x2160 HD QuadYCbCr(422) 10 bit30/29.97/25/24/23.98/P30/29.97/25/24/23.98/PsF-
SD/HD/3G-A/3G-B-DL1920x1080 3G-B-DL2048x1080 3G-B-DL1280x720 3G-A1920x1080 3G-A2048x1080 3G-A1280x720 HD1920x1080 HD720x487 SD720x576 SDYCbCr(422) 10 bit YCbCr(422) 12 bit YCbCr(444) 10 bit YCbCr(444) 12 bit RGB(444) 10 bit RGB(444) 12 bit60/59.94/50/I60/59.94/50/48/47.95/30/29.97/25/24/23.98/P30/29.97/25/24/23.98/PsF-
HD Dual Link 1920x1080 HD Dual2048x1080 HD DualYCbCr(422) 10 bit YCbCr(422) 12 bit YCbCr(444) 10 bit YCbCr(444) 12 bit RGB(444) 10 bit RGB(444) 12 bit60/59.94/50/I60/59.94/50/48/47 .95/30/29.97/25/24/23.98/P30/29.97/25/24/23.98/PsF-
3G Dual Link1920x1080 3G-B-DL Dual2048x1080 3G-B-DL Dual1920x1080 3G-A Dual2048x1080 3G-A DualYCbCr(422) 12 bit YCbCr(444) 10 bit YCbCr(444) 12 bit RGB(444) 10 bit RGB(444) 12 bit60/59.94/50/48/47.95/P -
3G-B-DS1280x720 3G-B-DS1920x1080 3G-B-DSYCbCr(422) 10 bit60/59.94/50/I60/59.94/50/30/29.97/25/24/23.98/P30/29.97/25/24/23.98/PsF-

7. SYSTEM SETTINGS

- Colorimetry

Turn on and off the colorimetry alarm detection.

Normally, colorimetry is displayed in cyan on the vector waveform display and CIE chromaticity diagram display. But for 3G(QL) and 3G(DL)-4K, if any of the colorimetries does not match, it is displayed in yellow.

If alarm detection is set to on and a colorimetry other than that specified with Type is received, the colorimetry is displayed in red. It is also displayed in red on the video signal waveform display.

Note that this is invalid when the input signal is SD.

OFF / ON

- Type

When colorimetry alarm detection is on, specify the expected colorimetry.

BT-709 / BT-2020 / DCI

7.1.6 Configuring the SDI Output Connectors

Use Output on the SDI OUT tab to configure the SDI OUTPUT connectors on the rear panel.

SYS → F•1 SIGNAL IN OUT → F•2 PREV TAB or F•3 NEXT TAB → SDI IN SETUP SDI IN SETUP SDI OUT MONITOR OUT HDR Output Mode Input Through Follow the Signal Input (SDI IN SETUP) Through Out (SDI1) Fixed (1) Selection (1/2/3/4) Test Signal System F:20x1000 HD Devise Square 2 Sample Interface Structure C:60K (22) 100% Frame/Field Rate E:54% Pattern COLOR BAR 100% D:100% Interface F Y 10x02ACI Co 10x0200s Co 10x0200 Reset OFF Speed Dot Moving Box OFF Speed Phase Difference Off Bch Co Dch CLK TA.18MHz Embedded Audio F:G1 F:G2 F:G3 F:G4 Level -20dBFS CNC Enter F:OUT F:IN COMPLETE PREV TAB NEXT TAB up menu

Figure 7-8 SDI OUT tab

7. SYSTEM SETTINGS

- Mode

Select the signal that is generated from SDI OUTPUT. If SER24 TSG is not installed, Test Signal cannot be selected.

Input Through: Transmits the reclocked version of the signal that has been received by the SDI INPUT 1 to 4 connectors. If SER26 LAYOUT is installed, you can output the signal assigned with Display Assignment on the SDI IN SETUP1 tab.

Test Signal: Transmits the pattern specified by Test Signal.

• Follow the Display Assignment

If Mode is set to Input Through and SER26 LAYOUT is installed, selecting this check box outputs the signal assigned with Display Assignment on the SDI IN SETUP1 tab. If an IP signal is assigned, the signal is converted into an SDI signal and output.

- Through Out (SDI1)

When Mode is set to Input Through, select the signal to output from SDI OUTPUT 1. If the format is not SD, HD, 3G-A, or 3G-B-D, SDI INPUT 1 is fixed, and you cannot select it.

Fixed (1):Transmits the reclocked version of the signal that has been received by the SDI INPUT 1 connector.
Selection (1/2/3/4):Transmits the reclocked version of the signal that has been received by the SDI INPUT 1 to 4 connectors.To select the output channel, use the INPUT menu or F•6 INPUT SELECT on each measurement screen.

7.1.7 Configuring the TSG Settings (SER24)

When Mode on the SDI OUT tab is set to Test Signal, use the parameters under Test Signal to set the TSG to output from SDI OUTPUT on the rear panel.

SYS → F•1 SIGNAL IN OUT → F•2 PREV TAB or F•3 NEXT TAB → SDI IN SETUP1 SDI IN SETUP2 SDI OUT MONITOR OUT HDR Output Mode Test Signal Follow the Signal Input (SDI IN SETUP1) Through Out (SDI1) Fixed (1) Selection (12/3M) Test Signal System 1920x1080 HD Division Source Sample Interface Structure YCLC(422) 10bit Frame/Field Rate 59.941 Pattern COLOR BAR 100% GT-700 Y Hrd03ACI Cb (0x0200) Cr (0x0200) Scroll OFF Speed Dot Moving Box OFF Speed Phase Differences Off Box Cat Cat CLE TA18MIS Embedded Audio G1 G2 G3 G4 Level -20dBFS CRC Error OFF ON COMPLETE PREV TAB NEXT TAB up menu

Figure 7-9 SDI OUT tab

7. SYSTEM SETTINGS

  • System
  • Structure
  • Frame/Field Rate

Set the output format. The possible format combinations are shown below. The default values are 1920x1080 HD, YCbCr(422) 10 bit, 59.94I.

Table 7-3 Output format selection

SystemStructureFrame/Field Rate
3840x2160 12G4096x2160 12GYCbCr(422) 10 bit60/59.94/50/48/47.95/P
YCbCr(444) 10 bitRGB(444) 10 bit30/29.97/25/24/23.98/P
3840x2160 3G-B-DL Quad4096x2160 3G-B-DL Quad3840x2160 3G-A Quad4096x2160 3G-A Quad2048x1080 3G-B-DL2048x1080 3G-AYCbCr(422) 10 bit60/59.94/50/48/47.95/P
YCbCr(444) 10 bitRGB(444) 10 bit30/29.97/25/24/23.98/P30/29.97/25/24/23.98/PsF
3840x2160 3G-B-DS Dual4096x2160 3G-B-DS DualYCbCr(422) 10 bit30/29.97/25/24/23.98/P30/29.97/25/24/23.98/PsF
1920x1080 3G-B-DL1920x1080 3G-AYCbCr(422) 10 bit60/59.94/50/48/47.95/P
YCbCr(444) 10 bitRGB(444) 10 bit60/59.94/50/I30/29.97/25/24/23.98/P30/29.97/25/24/23.98/PsF
1920x1080 HDYCbCr(422) 10 bit60/59.94/50/I30/29.97/25/24/23.98/P30/29.97/25/24/23.98/PsF
1280x720 HDYCbCr(422) 10 bit60/59.94/50/P30/29.97/25/24/23.98/P

- Division

Selects the division transmission system when System is Quad or Dual.

Square / 2 Sample Interleave

7. SYSTEM SETTINGS

  • Pattern
  • Interlock

Select the output pattern. The selectable patterns are shown below. The selectable patterns vary depending on the System setting.

Depending on the pattern, you can turn on and off YCbCr or RGB separately.

For COLOR RASTER, you can set the YCbCr or RGB levels separately. Moreover, if Structure is set to RGB, you can select the Interlock check box to synchronize the RGB levels.

Table 7-4 Output pattern selection

PatternYCbCr/RGB on/offLevel adjustment
COLOR BAR 100%YesNo
COLOR BAR 75%YesNo
ARIB2020 COLOR BARYesNo
MULTI COLOR BAR 100%YesNo
MULTI COLOR BAR 75%YesNo
MULTI COLOR BAR (+I)YesNo
COLOR RASTERYesYes
OETFYesNo
CROSS HATCHNoNo
10_STEPNoNo
LIMIT RAMPYesNo
CHECK FIELDNoNo
LIP SYNC (SER03)NoNo

* The signal will be interrupted when the pattern is changed.

When OETF is selected, select the gamma characteristics.

BT-709 / HLG / PQ

Note that bandwidth limit is not applied to patterns other than COLOR BAR 100% and COLOR BAR 75%.

- Scroll

Select the scroll direction for when a pattern is scrolled.

If a setting other than OFF is selected, Moving Box and Phase Difference are turned off. You cannot select this when Pattern is set to CROSS HATCH.

OFF

RIGHT: Scrolls from left to right.

LEFT: Scrolls from right to left.

UP: Scrolls from bottom to top.

DOWN: Scrolls from top to bottom.

RIGHT & UP: Scrolls from lower left to upper right.

RIGHT & DOWN: Scrolls from upper left to lower right.

LEFT & UP: Scrolls from lower right to upper left.

LEFT & DOWN: Scrolls from upper right to lower left.

7. SYSTEM SETTINGS

- Speed

When Scroll is not set to off, set the scroll speed.

4 - 124 dots (4 dot steps)

- Moving Box

If you select the color of the moving box, a square that moves randomly is superimposed. If a setting other than OFF is selected, Scroll and Phase Difference are turned off.

When Moving Box is not set to off, set the moving box speed.

Greater the value, higher the speed.

1 - 3

- Phase Difference

If H or V is selected, the phase of other channels can be varied relative to Ach.

When System is set to Quad, you can adjust the Bch, Cch, and Dch phases relative to Ach. When System is set to Dual, you can adjust the Bch phase relative to Ach and the Dch phase relative to Cch.

If a setting other than OFF is selected, Scroll and Moving Box are turned off.

OFF / H / V

• Bch, Cch, Dch, or B/Dch

When Phase Difference is not set to off, you can adjust the Bch, Cch, and Dch phases. When System is set to Dual, the Bch and Dch phases are shared.

Phase Difference = H

-1374 - 0 - 1374 dots (depending on Frame/Field Rate)

Phase Difference = V

-562 - 0 - 562 Dot

7. SYSTEM SETTINGS

- Embedded Audio

When the pattern is not LIP SYNC, select the audio channels to embed in the SDI signal. 1 to 4ch is referred to as G1, 5 to 8ch as G2, 9 to 12ch as G3, and 13 to 16ch as G4.

The channels that can be embedded are 8 channels or 16 channels depending on the system and frame/field rate as shown below.

Table 7-5 Embedded audio settings

SystemFrame/Field RateG1G2G3G4
3840x2160 12G4096x2160 12G3840x2160 3G-B-DL Quad3840x2160 3G-A Quad4096x2160 3G-A Quad3840x2160 3G-B-DS Dual1920x1080 3G-B-DL1920x1080 3G-A2048x1080 3G-A1920x1080 HD1280x720 HD- Y Y Y Y
4096x2160 3G-B-DL Quad2048x1080 3G-B-DL60/59.94/30/29.97/P30/29.97/PsFY YNN
50/48/47.95/25/24/23.98/P25/24/23.98/PsFY YY Y
4096x2160 3G-B-DS Dual30/29.97/P30/29.97/PsFY YNN
25/24/23.98/P25/24/23.98/PsFY YY Y

- Level

Select the embedded audio level.

-20dBFS / -18dBFS / 0dBFS / Mute

- CRC Error

When set to on, an incorrect CRC is inserted into the Y series of the first line.

OFF / ON

7.1.8 Configuring the Monitor Output Connectors

Use LCD, TMDS, and SDI on the MONITOR OUT tab to configure the MONITOR OUTPUT connectors on the rear panel and the instrument's LCD.

SYS → F•1 SIGNAL IN OUT → F•2 PREV TAB or F•3 NEXT TAB → SDI IN SETUP SDI IN SETUP SDI OUT MONTOR OUT HDR LCD/TMDS/SDI Freq. Sync Mode INT EXT(Frequency lock, except 24Hz) Format 1080/59.94P SDI Out HD-SDI (convert Interface) COMPLETE PREV TAB NEXT TAB up menu

Figure 7-10 MONITOR OUT tab

- Freq. Sync Mode

Select the sync mode.

INT: Transmits in the selected format by using the internal clock.

EXT (Frequency lock, expect 24 Hz):

Transmits by using the external sync signal received through EXT REF.

The output signal format varies depending on the frame frequency of the external sync signal as follows.

30 Hz: 1080/60p

29.97 Hz: 1080/59.94p

25 Hz: 1080/50p

24 Hz or 23.98 Hz: INT

When there is no external sync signal: INT

- Format

If Freq Sync Mode is set to INT, select the frame frequency of the output signal.

1080/60p / 1080/59.94p / 1080/50p

- SDI Out

Select the output format of the SDI signal.

HD-SDI (convert Interlace) / 3G-SDI Level-A / 3G-SDI Level-B

7.1.9 Configuring the HDR Settings (SER23)

On the HDR tab, configure the settings of HDR measurement for each display channel (Input A to D).

SYS → F•1 SIGNAL IN OUT → F•2 PREV TAB or F•3 NEXT TAB → SDI IN SETUP SDI IN SETUP2 SDI OUT MON TOR OUT HDR Input-A HDR Mode HLG Ref.Level 50% VARIABLE System Gamma OFF ON Range Narrow HLG Scale 1200% 100% Input-B HDR Mode PQ Ref.Level 51% VARIABLE System Gamma OFF ON Range Narrow HLG Scale 1200% 100% Input-C HDR Mode S-Log3 Ref.Level VARIABLE System Gamma OFF ON Range Narrow HLG Scale 1200% 100% Input-D HDR Mode OFF Ref.Level VARIABLE System Gamma OFF ON Range Narrow HLG Scale 1200% 100% HDR signal measurement supports all formats except for SD and XYZ. COMPLETE PREV TAB NEXT TAB up menu

Figure 7-11 HDR tab
- HDR Mode

Turn of the HDR measurement, or select the HDR signal standard. If you select an HDR signal standard, HDR signals can be measured on the video-signal-waveform, vector, and picture displays.
HLG and PQ refer to ITU-R BT.2100, and S-Log3 refers to the log curve output from cameras of other manufacturers.

OFF: An HDR scale is not displayed.
HLG:When HLG Scale is 1200% (default value), 0 to 100% is displayed as 0 to 1200%.
When HLG Scale is 100% (default value), 0 to 100% is displayed as 0 to 100%.
PQ:0 to 100 % is displayed as 0 to 10000 cd/m2.
S-Log3:If 0 to 100% is set to 64 to 940, 95 to 940 is displayed as 0 to 2055%.

7. SYSTEM SETTINGS

- Ref. Level

When HDR Mode is set to HLG or PQ, select the reference level for the program production. On the video signal waveform display, the selected reference level is shown using broken lines on the scale.

On the picture display, the selected reference level is set to the REF default value on the HDR signal CINEZONE display. The REF default value is applied when you press the function dial (F•D).

HDR Mode = HLG

50% / 75%

HDR Mode = PQ

51% / 58%

- Variable

Select whether to enable the reference level setting.

When HDR Mode is set to HLG or PQ, the default reference level is set to the Ref.Level value. When HDR Mode is set to S-Log3, the default reference level is set to 61.0%.

OFF / ON

- System Gamma

When HDR Mode is set to HLG or S-Log3, turn system gamma on or off.

If system gamma is set to on, the scale corresponding to the HDR signal of the video signal waveform display and picture display is shown in cd/m 2 , which is a unit of display intensity for HLG displays.

When HDR Mode is set to HLG, gamma 1.2 is used to calculate the intensity with the full scale ranging up to 1000 cd/m2 .

When HDR Mode is set to S-Log3, the intensity is displayed with the full scale ranging up to 3000 cd/m2 .

OFF / ON

- Range

When HDR Mode is set to HLG or PQ, select the range.

Narrow / Full

- HLG Scale

When HDR Mode is set to HLG, select the HDR scale display.

1200%: 0 to 100 % is displayed as 0 to 1200%.

100% 0 to 100 % is displayed as 0 to 100%.

7.1.10 Configuring the IP Signal Settings (SER05)

Use IP Setup on the IP SETUP1 tab to configure the IP input signal settings.

SYS → F•1 SIGNAL IN OUT → F•2 PREV TAB or F•3 NEXT TAB → SDI IN SETUP1 SDI IN SETUP2 SDI OUT MONITOR OUT HDR IP SETUP1 IP SETUP2 IP Setup Type ST2022-6 Redundancy Mode Off On IP Input 1 IP Stream 1 Video Source Address 0 0 0 0 Destination Address 0 0 0 0 Destination Port 0 0 0 0 Number of channels COMPLETE PREV TAB NEXT TAB up menu

Figure 7-12 IP SETUP1 tab

- Type

Select the IP signal standard.

ST2022-6 / ST2110

- Redundancy Mode

When Type is set to ST2022-6, set the redundancy mode to on or off.

Off / On

- IP Input

Select which IP input you want to configure. You can set the following parameters for each IP input and IP stream.

You can select 2 when Type is set to ST2022-6 and Redundancy Mode is set to On.

1 / 2

- IP Stream

Select which IP stream you want to configure. You can set the following parameters for each IP input and IP stream.

1 / 2 / 3 / 4

7. SYSTEM SETTINGS

- Source Address

For the signals selected with IP Input and IP Stream, select the check boxes and assign their source IP addresses.

If you do not select the check boxes, they will be assigned automatically on a first-come-first-served basis. They can also be assigned by pressing a single key on the status screen.

[See also] 16.8.2, "Configuring the IP Status Screen."

192.168.0.1

- Destination Address, Destination Port

For the signals selected with IP Input and IP Stream, select the check boxes and assign their destination IP addresses and port numbers.

If you do not select the check boxes, they will be assigned automatically on a first-come-first-served basis. They can also be assigned by pressing a single key on the status screen.

0.0.0.0 / 05000

7.1.11 Configuring the PTP Settings (SER05)

Use PTP Setup on the IP SETUP2 tab to configure the PTP settings.

SYS → F•1 SIGNAL IN OUT → F•2 PREV TAB or F•3 NEXT TAB → SDI IN SETUP1 SDI IN SETUP2 SDI OUT MONITOR OUT HDR IP SETUP1 IP SETUP2 PTP Setup Domain Number Primary 127 ST2110 Video Format IP Stream 1 RTP Payload Type Video 96 System 1920x1080 HD Structure YCbC(422)10bit Frame/Field Rate 59.941 COMPLETE PREV TAB NEXT TAB up menu

Figure 7-13 IP SETUP2 tab

- Domain Number

Set the domain number.

0 - 127

7.1.12 Setting the Video Format (SER05)

Use ST2110 Video Format on the IP SETUP2 tab to set the video format for when the signal standard is set to ST2110.

SYS → F•1 SIGNAL IN OUT → F•2 PREV TAB or F•3 NEXT TAB → SDI IN SETUP SDI IN SETUP SDI OUT MONITOR OUT HDR IP SETUP IP SETUP2 PTP Setup Domain Number Primary 127 ST2110 Video Format IP Stream 1 * RTP Payload Type Video 96 System 1920x1080 HD * Structure YCbCr(422)10bit * Frame/Field Rate 59.941 * COMPLETE PREV TAB NEXT TAB up menu

Figure 7-14 IP SETUP2 tab

- IP Stream

Select which IP stream you want to configure. You can set the following parameters for each IP stream.

1/2/3/4

- RTP Payload Type

Set the payload type of the signal selected with IP Stream.

96 - 127

  • System
  • Structure
  • Frame/Field Rate

Set format of the signal selected with IP Stream. For information on the format combinations that are available, see section 3.3.2, "IP Video Formats and Standards (SER05)."

Table 7-6 Format selection

SystemStructureFrame/Field Rate
1920x1080 3GAYCbCr(422)10bit 6059.94/50 P
1920x1080 HD60/59.94/50 I

7. SYSTEM SETTINGS

7.2 Configuring the Instrument

To configure the instrument, press F•2 SYSTEM SETUP on the SYS menu.

7.2.1 General Settings

Use General on the GENERAL tab to configure general settings of the instrument.

They are not reset even if you initialize the settings. In addition, they are not recorded to presets.

SYS → F•2 SYSTEM SETUP → F•2 PREV TAB or F•3 NEXT TAB → GENERAL CAPTURE&DISPLAY NETWORK REMOTE RS486 CAMERA ID TALLY OPERATION KEY DATE&TIME General Preset Overwrite ☑ Disable ☑ Enable Fan Speed 4 Screensaver Off [min] LCD Auto Off Off [min] Touch Panel ☑ Disable ☑ Enable Function Menu Mode Key Direct ☑ Single ☑ Multi/Single Common Auto Off Off [sec] Recall ☑ Recall Menu ☑ Function Menu On-screen Menu Auto Off Off [sec] Operation Key Off ☑ On COMPLETE PREV TAB NEXT TAB up menu

Figure 7-15 GENERAL tab

- Preset Overwrite

Select whether to enable overwriting when registering presets.

Disable this to prevent overwriting presets.

Disable / Enable

- Fan Speed

Select the fan speed.

The larger the value, the higher the speed and the higher the cooling capability. In contrast, the smaller the value, the quieter the fan noise.

When an SER02 or an SER05 is installed

4/5/6/7/8

When an SER02 and an SER05 is not installed

1/2/3/4/5/6/7/8

7. SYSTEM SETTINGS

- Screensaver

Select the length of time that must elapse without any key operations for the screen saver to start.

To clear the screen saver, press any key excluding the power switch, double-click, or operate the touch panel.

Select the length of time that must elapse after the last key operation before the backlight is automatically turned off.

To turn it on again, press any key excluding the power switch, double-click, or operate the touch panel.

In multi-screen display, you can select whether to switch the measurement screen with the mode keys (WFM, VECT, PIC, AUDIO, STATUS, and EYE).

Single:Using the mode key switches the function menu and measurement screen.
Multi/Single Common:Using the mode key switches only the function menu. The measurement screen does not change from the multi-screen display.To display the function menu on the multi-screen display, hold down MULTI for about 2 seconds.

- Auto Off

Set the length of time that must elapse without any key operations for the function menu to disappear automatically.

If set to off, the menu will not disappear automatically, but for example, the measurement menu can be temporarily hidden by pressing the MODE key again.

Even if set to a value other than off, some menus, such as the SYS menu, never automatically disappear.

Off / 1 / 2 / 3 / 4 / 5 / 10 / 20 / 30 / 60 [sec]

- Recall

Select the menu to be displayed when recalling presets.

Recall Menu: The Recall menu is displayed.

Function Menu: The measurement menu is displayed.

7.2.3 Configuring the On-screen Menu

Use On-screen Menu on the GENERAL tab to configure the on-screen menu.

SYS → F•2 SYSTEM SETUP → F•2 PREV TAB or F•3 NEXT TAB → GENERAL CAPTURE&DISPLAY NETWORK REMOTE RS485 CAMERA ID TALLY OPERATION KEY DATE&TIME General Freset Overwrite ▼ Disable ▼ Enable Fan Speed 4 ▼ Screensaver Off ▼ [min] LCD Auto Off Off ▼ [min] Touch Panel ▼ Disable ▼ Enable Function Menu Mode Key Direct ▼ Single ▼ Multi/Single Common Auto Off Off ▼ [sec] Recall ▼ Recall Menu ▼ Function Menu On-screen Menu Auto Off Off ▼ [sec] Operation Key ▼ Off ▼ On COMPLETE PREV TAB NEXT TAB up menu

Figure 7-17 GENERAL tab

7. SYSTEM SETTINGS

- Auto Off

For keys on the screen controlled with the mouse or touch panel, select the length of time that must elapse without any key operations for the keys to disappear automatically.

Off / 1 / 2 / 3 / 4 / 5 / 10 / 20 / 30 / 60 [sec]

- Operation Key

Set whether to include the operation key in the keys on the screen controlled with the mouse or touch panel.

OFF / ON

7.2.4 Configuring the Capture Feature

Use Capture on the CAPTURE & DISPLAY tab to configure the capture feature.

SYS → F•2 SYSTEM SETUP → F•2 PREV TAB or F•3 NEXT TAB → GENERAL CAPTURE&DISPLAY NETWORK SNMP REMOTE RS486 CAMERA ID TALLY OPERATION KEY DATE&TIME LV7290 Capture Mode Screen File Type BMP BSG GPS TFT TRM Transport Frame Number F1 Frame 10 Frames Information Display Format Off On Input Off On Icon Off On Error Off On Temperature Warning Off On Date y/m/s Time Real Time COMPLETE PREV TAB NEXT TAB up menu

Figure 7-18 CAPTURE & DISPLAY tab

- Mode

Select the capture mode for when you press CAP.

[See also] 8, "CAPTURE FEATURE"

Screen: The screen will be captured as still images.

Video Frame (SDI Code Value): Frame data will be captured.

Video Frame (Converted): Frame data will be captured.

When data is saved to DPX or TIFF format, frame data is captured with the black level offset to zero.

7. SYSTEM SETTINGS

- File Type

Turns on the file format for saving the captured screen or frame data to a USB memory device.

[See also] 8, "CAPTURE FEATURE"

Mode = Screen

BMP:Files are saved to a USB memory device in BMP format. You can view the saved files on a PC.
BSG:Files are saved to a USB memory device in BSG format. You can view the saved files on the instrument.

* By default, BMP and BSG are both on. You cannot set both of these settings to OFF.

Mode = Video Frame (SDI Code Value) or Video Frame (Converted)

DPX:Only the picture area is saved as 10-bit DPX files.Even when the input signal is 12 bits, it is rounded to 10 bits and saved.When Mode is set to video Frame (Converted), the black level is offset to zero.This cannot be selected when Frame Number is set to 16 Frames.

TIF: Only picture data is saved as TIFF files.

This data is DPX data converted into TIFF format.
When Mode is set to video Frame (Converted), the black level is offset to zero.
This cannot be selected when Frame Number is set to 16 Frames.

FRM: frame data is saved.
* By default, all the check boxes are selected. You cannot turn all the settings off.

- Transport Frame Number

When Mode is set to Video Frame (SDI Code Value) or Video Frame (Converted), select the number of frames to capture.

[See also] 8.2, "Frame Capture"

1 Frame: A single frame of data is saved.

16 Frames:16 consecutive frames of data are saved.For the following formats, 32 picture frames are captured because two picture frames are mapped to each frame.3G-B-DL transmission; 3G(QL), 3G(DL)-2K frame rate60P/59.94P/50P/48P/47.95PHD(DL)transmission; frame rate 60P/59.94P/50P/48P/47.95P

7. SYSTEM SETTINGS

7.2.5 Configuring the Information Display

Use Information Display on the CAPTURE & DISPLAY tab to configure the information display.

SYS → F•2 SYSTEM SETUP → F•2 PREV TAB or F•3 NEXT TAB → GENERAL CAPTURE&D DISPLAY NETWORK SNMP REMOTE FS48b CAMERA ID TALLY OPERATION KEY DATE&TIME LV7290 Capture Mode Screen File Type BMP BSG OPX IFF ITRN Transport Frame Number 10 Frames Information Display Format Off On Input Off On Icon Off On Error Off On Temperature Warning Off On Date ymf/d Time Real Time COMPLETE PREV TAB NEXT TAB up menu

Figure 7-19 CAPTURE & DISPLAY tab

7. SYSTEM SETTINGS

- Format

Turns on and off the format display (e.g., 1920x1080/59.94I YCbCr(422) 10bit HD). This setting is valid when a FORMAT item or Format option is placed in the layout.

Off / On

- Input

Turns on and off the input signal display (e.g., SDI A). This setting is valid when a INPUT item or Input option is placed in the layout.

Off / On

- Icon

Turns on and off the mouse icon 1, key lock icon ⚠, and USB memory icon ⚣. If you turn this off, you will not be able to tell from the screen whether a mouse, the US interface of a touch panel monitor, or a USB memory device is connected.

[See also] 5.7, "Measurement Screen Description"

Off / On

- Temperature Warning

Turns on and off the alarm display (TEMPERATURE) that appears when the internal temperature increases.

"OVER HEAT" will still be displayed even if this is set to off.

[See also] 7.2.17, "Displaying System Information"

Off / On

- Error

Turn on or off the error display in the upper right of the measurement screen. [See also] 5.7, "Measurement Screen Description"

Off / On

- Date

Select the display format of the date. y is the Gregorian year, m is the month, and d is the day. This setting is valid when a DATE item is placed in the layout.

Off / y/m/d / m/d/y / d/m/y

- Time

Select the display format of the time. This setting is valid when a TIME item or Time option is placed in the layout, in the clear screen log of the picture display, and in the event log of the status display.

Off / Real Time / LTC / VITC / D-VITC

7. SYSTEM SETTINGS

7.2.6 Setting the Network IP

Use IP on the NETWORK tab to configure network IP settings and view the MAC address. The settings that you specify here will not be initialized even if you initialize the instrument. In addition, they are not recorded to presets.

SYS → F•2 SYSTEM SETUP → F•2 PREV TAB or F•3 NEXT TAB → GENERAL CAPTURE&DISPLAY NETWORK SNMP REMOTE RS485 CAMERA ID TALLY OPERATION KEY DATE&TIME LV7290 IP DHCP Off On IP Address 192 168 0 1 Subnet Mask 255 255 255 0 Default Gateway 0 0 0 0 Mac Address 00:00:00:00:00:00 SNTP SNTP Off On Server IP Address Time Zone Adjust 2:00 Server Telnet Off FTP Off On HTTP Off On COMPLETE PREV TAB NEXT TAB up menu

Figure 7-20 NETWORK tab

  • DHCP
    Select how to set the IP address.
Off:Enter the IP address, subnet mask, and default gateway manually.
On:The IP address, subnet mask, and default gateway are set automatically.
  • IP Address
  • Subnet Mask
  • Default Gateway

Set the IP address, subnet mask, and default gateway.

- MAC Address

Displays the MAC address.

7. SYSTEM SETTINGS

7.2.7 Configuring SNTP

Use SNTP on the NETWORK tab to configure the SNTP parameters.

The settings that you specify here will not be initialized even if you initialize the instrument. In addition, they are not recorded to presets.

SYS → F•2 SYSTEM SETUP → F•2 PREV TAB or F•3 NEXT TAB → GENERAL CAPTURE&DISPLAY NETWORK SNMP REMOTE RS485 CAMERA ID TALLY OPERATION KEY DATE&TIME LV7290 IP DHCP Off On IP Address 192 168 0 1 Subnet Mask 255 255 255 0 Default Gateway 0 0 0 0 Mac Address 00:00:00:00:00:00 SNTP SNTP Off On Server IP Address 0 0 0 0 Time Zone Adjust +9:00 * Server Telnet Off * FTP Off On HTTP Off On COMPLETE PREV TAB NEXT TAB up menu

Figure 7-21 NETWORK tab

• SNTP

Select whether to enable the SNTP client function.

When set to ON, enter the NTP server IP address in Server IP Address and the time adjustment value in Time Zone Adjust.

Off / On

  • Server IP Address
  • Time Zone Adjust

When the SNTP client function is set to ON, enter the NTP server IP address in Server IP Address and the time adjustment value in Time Zone Adjust.

7. SYSTEM SETTINGS

7.2.8 Configuring the Server

Use Server on the NETWORK tab to configure the TELNE, FTP, and HTTP.

The settings that you specify here will not be initialized even if you initialize the instrument. In addition, they are not recorded to presets.

SYS → F•2 SYSTEM SETUP → F•2 PREV TAB or F•3 NEXT TAB → GENERAL CAPTURE&DISPLAY NETWORK SNMP REMOTE RS485 CAMERA ID TALLY OPERATION KEY DATE&TIME LV7290 IP DHCP Off On IP Address 192 168 0 1 Subnet Mask 255 255 255 0 Default Gateway 0 0 0 0 Mac Address 00:00:00:00:00:00 SNTP SNTP Off On Server IP Address Time Zone Adj set 2:00 Server Telnet Off FTP Off On HTTP Off On COMPLETE PREV TAB NEXT TAB up menu

Figure 7-22 NETWORK tab

- Telnet

Select whether to enable the TELNET server feature and the LV7290 REMOTE CONTROLLER. You cannot use TELNET and the LV7290 at the same time.

Off / On / LV7290

- FTP Server

Select whether to enable the FTP server function.

Off / On

- HTTP Server

Select whether to enable the HTTP server feature.

Off / On

7.2.9 Configuring SNMP

Use SNTP tab to configure the SNTP parameters.

The settings that you specify here will not be initialized even if you initialize the instrument. Nor are they recorded to presets.

SYS → F•2 SYSTEM SETUP → F•2 PREV TAB or F•3 NEXT TAB → GENERAL CAPTURE&DISPLAY NETWORK SNMP REMOTE RS486 CAMERA ID TALLY OPERATION KEY DATE&TIME LV7290 SNMP SNMP Client Off ReadOnly ReadWrite SNMP Community ReadOnly: LDRUser ReadWrite: LDRAdm Trap Off On Manager IP Address 1: 0 0 0 0 2: 0 0 0 0 3: 0 0 0 0 4: 0 0 0 0 COMPLETE PREV TAB NEXT TAB READ ONLY COMMUNITY READ WRITE COMMUNITY up menu

Figure 7-23 SNMP tab
- SNMP Client
Select the SNMP access mode.
OFF: SNMP cannot be used.
ReadOnly: Settings can be read.
ReadWrite: Settings can be read and written.
• SNMP Community
Shows the SNMP community name.

The default values are shown below. You can change them using F•4 READ ONLY COMMUNITY and F•5 READ WRITE COMMUNITY. You cannot change the community name of TRAP.
Enter a comment using up to 15 characters.
Default
ReadOnly: LDRUser
ReadWrite: LDRAdm
TRAP: LDRUser
You can use the following keys on the SNMP community name input screen.

F•1CLEAR ALLDeletes all characters
F•2DELETEDeletes the character at the cursor
F•3INSERTInserts the selected character at the cursor position
F•4<=Moves the cursor to the left
F•5=>Moves the cursor to the right
F•6CHAR SETEnters the character

7. SYSTEM SETTINGS

Function dial (F•D)

Turn to select a character, and press to enter the character.

[F.D_NOB] = CHAR SELECT , [F.D_PUSH] = CHAR SET & Function Key Edit CHAR Community Name clear ALL DELETE INSERT => CHAR SET up menu

Figure 7-24 Community name input screen

- Trap

Select whether to enable SNMP trap output.

OFF / ON

- Manager IP Address

Shows up to four SNMP manager IP addresses.

- Saving the enterprise MIB file to USB memory device

To save the enterprise MIB file to USB memory device, follow the procedure shown below.

  1. Connect a USB memory device to the instrument.
  2. Press F·6 USB MEMORY.
  3. Press F•1 MIB FILE COPY.

The enterprise MIB file is saved to USB memory device.

Enterprise MIB file is saved to the following locations.

USB memory device

LV5600_USER or LV7600_USER

MIB

Lv5600.my or lv7600.my

When the enterprise MIB file exists in the USB memory device, F•1 OVER WRITE YES and F•3 OVER WRITE NO appear.

To overwrite, press F•1 OVER WRITE YES. To not overwrite, press F•3 OVER WRITE NO.

7. SYSTEM SETTINGS

7.2.10 Configuring the IP Settings (SER05)

Use SER05 on the SER05 (IP) tab to configure network settings and view the MAC address for IP 1 and 2.

The settings that you specify here will not be initialized even if you initialize the instrument. Nor are they recorded to presets.

SYS → F•2 SYSTEM SETUP → F•2 PREV TAB or F•3 NEXT TAB → GENERAL CAPTURE&D/SPLAY NETWORK SER05(IP) REMOTE RS485 CAMERA ID TALLY OPERATION KEY DATE&TIME SER05 IP1 Setting IP Address 192 168 1. 1 Subset Mask 255 255 255. 0 Default Gateway 0 0 0. 0 MAC Address 00:00:00:00:00:00 IP2 Setting IP Address 192. 168 2. 1 Subset Mask 255 255 255. 0 Default Gateway 0 0 0. 0 MAC Address 00:00:00:00:00:00

Figure 7-25 SER05 (IP) tab

  • IP Address
  • Subnet Mask
  • Default Gateway
    Set the IP address, subnet mask, and default gateway.
  • MAC Address

Displays the MAC address.

7.2.11 Configuring the Remote Control Settings

Use the REMOTE tab to configure remote control settings.

The settings that you specify here will not be initialized even if you initialize the instrument. In addition, they are not recorded to presets.

[See also] 10, "REMOTE CONTROL"

SYS → F•2 SYSTEM SETUP → F•2 PREV TAB or F•3 NEXT TAB → GENERAL CAPTURE&D DISPLAY NETWORK SNMP REMOTE RS485 CAMERA ID TALLY OPERATION KEY DATE&TIME LV7290 Remote Mode Bit Select Recall Recall&Loudness Recall&Tally Alarm Polarity Positive Negative Alarm Select Input-A Input-B Input-C Input-D Tally Control Select Tally-1 Remote RS485 Tally-2 Remote RS485 Tally-EXT Remote RS485 a COMPLETE PREV 1 PREV 2 NEXT 3 up TAB TAB TAB 4 TAB 5 6 7 up menu

Figure 7-26 REMOTE tab

  • Mode
    Select the method for loading presets.
Bit: Use pin 2 (/P1) to pin 9 (/P8) to load presets 1 to 8.
Binary:Set pin 2 (/P1) as the least significant bit and pin 7 (/P6) as the most significant bit, and use binary code to load presets 1 to 60.
Command:Recalls presets (1 to 60), selects channels, outputs alarms, and displays tallies (1/2).
Tally:Outputs alarms and displays tallies (1/2/EXT). (SER27)

- Select (SER03/SER27)

When Mode is Bit or Binary, select the function to assign to pin 8 (/P7), pin 9 (/P8), pin 10 (/ACH), pin 11 (/BCH), pin 12 (/CCH), and pin 13 (/DCH) of the remote connector. When Mode is Command or Tally, select Recall.

This is displayed when SER03 or SER27 or both are installed.

Recall: Assign preset recalling.

Recall&Loudness:

Assigned loudness control. Recall&Tally: Assigned tally control.

7. SYSTEM SETTINGS

- Alarm Polarity

Select the alarm output polarity.

Positive: A high signal is transmitted when an error is detected.

Negative: A low signal is transmitted when an error is detected.

- Alarm Select

Select the display channel that errors are detected on for transmitting alarms.

By default, all the check boxes are selected.

When measuring 3G-B-DS, alarms are output only for the currently shown display channels.

Input-A / Input-B / Input-C / Input-D

  • Tally-1
  • Tally-2
  • Tally-EXT

Select whether to control the tally using the remote connector or RS-422/485 connector (SER27).

Remote / RS485

7.2.12 Configuring the RS-422/485 Settings (SER27)

Use the RS485 tab to configure the RS-422/485 settings.

The settings that you specify here (except Local ID Setting) will not be initialized even if you initialize the instrument. In addition, they are not recorded to presets.

SYS → F•2 SYSTEM SETUP → F•2 PREV TAB or F•3 NEXT TAB → GENERAL CAPTURE&DISPLAY NETWORK REMOTE RS485 CAMERA ID TALLY OPERATION KEY DATE&TIME RS485 Baud Rate 115200 Data: Ebit Parity: None Stop Bit: 1bit Device Address 0 Termination Setting Off On COMPLETE PREV TAB NEXT TAB up menu

Figure 7-27 RS485 tab

- Baud Rate

Select the baud rate.

The following parameters are fixed: data length: 8 bit, parity: none, stop bit: 1 bit.

9600 / 19200 / 38400 / 57600 / 115200

- Device Address

Set the instrument's address. If you are connecting several instruments, assign different numbers.

0 - 99

- Termination Setting

Terminates the RS-422/485 connector. If you are connecting several instruments, set the instrument at the end to ON and all others to OFF.

Off / On

7.2.13 Setting the Camera ID (SER27)

When ID Control Select is set to Local, use the CAMERA ID tab to select the placement of the camera ID and set the label.

The procedures for Camera ID Label-1, Camera ID Label-2, and Camera ID Label-IRIS are the same.

The settings that you specify here (except the placement selection and label setting) will not be initialized even if you initialize the instrument. In addition, they are not recorded to presets.

SYS → F•2 SYSTEM SETUP → F•2 PREV TAB or F•3 NEXT TAB → GENERAL CAPTURE&DISPLAY NETWORK REMOTE RS486 CAMERA ID TALLY OPERATION KEY DATE&TIME Camera ID Control Select Local RS486 Camera ID Label-1 A: CENTER CAM A B: CENTER CAM B C: CENTER CAM C D: CENTER CAM D Camera ID Label-2 A: CENTER CAM A B: CENTER CAM B C: CENTER CAM C D: CENTER CAM D Camera ID Label IRIS A: CENTER CAM A B: CENTER CAM B C: CENTER CAM C D: CENTER CAM D COMPLETE PREV TAB NEXT TAB CAMERA ID LOCAL LABEL INPUT up menu

Figure 7-28 CAMERA ID tab

- Control Select

Select whether to set the camera ID on the instrument or through the RS-422/485 connector.

To camera ID is displayed for the LABEL-1, LABEL-2, and IRIS items on the layout.

Local / RS485

7. SYSTEM SETTINGS

- Selecting the placement

Select the placement of the camera ID.

LEFT / CENTER / RIGHT

- Setting the label

The default camera ID labels are CAM A to CAM D, but you can change them by selecting their check boxes and pressing F•5 LOCAL LABEL INPUT. Enter up to 16 characters.

You can use the following keys on the camera ID input screen.

F•1CLEAR ALLDeletes all characters
F•2DELETEDeletes the character at the cursor
F•3INSERTInserts the selected character at the cursor position
F•4<=Moves the cursor to the left
F•5=>Moves the cursor to the right
F•6CHAR SETEnters the character
Function dial (F•D)Turn to select a character, and press to enter the character.

The camera IDs can also be changed through RS-422/485. (When using this method, you can use Japanese Shift-JIS codes in addition to ASCII codes.)

[F.D_NOB] = CHAR SELECT , [F.D_PUSH] = CHAR SET & Function Key Edit CH-A Tally-1 Label C A M | A | | | | | | | | | 1 CLEAR ALL 2 DELETE 3 INSERT 4 <= 5 => 6 CHAR SET 7 up menu

Figure 7-29 Camera ID label input screen

7.2.14 Configuring the Tally Display (SER27)

Use the TALLY tab to configure the settings of the TALLY item placed in the layout.

SYS → F•2 SYSTEM SETUP → F•2 PREV TAB or F•3 NEXT TAB → GENERAL CAPTURE&D DISPLAY NETWORK REMOTE FS486 CAMERA ID TALLY OPERATION KEY DATE&TIME Tally Display Color Tally-1 Red Tally-2 Green Tally-EXT Orange Tally Off Black DIM Color Frame Off On Gray Background Off On Tally-EXT Comment EXT Comment Layout On The Left On This Right COMPLETE PREV TAB NEXT TAB TALLY EXT COMMENT INPUT up menu

Figure 7-30 TALLY tab

• Tally-1, Tally-2, Tally-EXT

Select the color of the TALLY item placed in the layout. The default values are red for Tally-1, green for Tally-2, and orange for Tally-EXT.

Red / Green / Blue / Cyan / Magenta / Yellow / Orange

• Tally Off

Select the color of the TALLY item placed in the layout and that of the tally frame for when the tally is off.

Black: No color is displayed.

DIM COLOR: The selected color is displayed dimly.

- Frame

Turns on and off the frame of the LABEL-1, LABEL-2, IRIS, TALLY-1, and TALLY-2 items placed in the layout.

(The frame of the TALLY-EXT item is always shown.)

OFF / ON

- Gray Background

Select whether to display the background of the LABEL-1, LABEL-2, IRIS, and TALLY-EXT items placed in the layout in gray.

OFF / ON

7. SYSTEM SETTINGS

- Tally-EXT Comment

Displays the comment of the TALLY-EXT item placed in the layout.

The default value is EXT, but you can change it using F•5 TALLY EXT COMMENT INPUT. Enter a comment using up to eight characters.

You can use the following keys on the comment input screen.

F•1CLEAR ALLDeletes all characters
F•2DELETEDeletes the character at the cursor
F•3INSERTInserts the selected character at the cursor position
F•4<=Moves the cursor to the left
F•5=>Moves the cursor to the right
F•6CHAR SETEnters the character
Function dial (F•D)Turn to select a character, and press to enter the character.

SPC # 4 5 6 7 8 9 0 1 2 3 >, ? H I J K L M N D P Q R S T U V W X Y Z [- ¥ ] ^ - a b c d e f g h i j k l m n o p q r s t u v w x y 2 { ! } - [F.D_NOB] = CHAR SELECT . [F.D_PUSH] = CHAR SET & Function Key Edit Setup TRY-EAT Comment X: X: X: X: X: X: X: X: X: X: X: X: X: X: X: X: X: X: X: X: X: X: X: X: X: X: X: X: X: X: X: X: X: X: X: X: X: X: X: X: X: X: X: X: X: X: X: X: X: X: X: CLEAR ALL DELETE INSERT <= => CHAR SET up menu

Figure 7-31 Comment input screen

- Comment Layout

Select the comment position of the TALLY-EXT item placed in the layout.

on the left: Places the comment on the left.

on the right: Places the comment on the right.

7. SYSTEM SETTINGS

7.2.15 Setting the Operation keys

Use the OPERATION KEY tab to set the operation keys.

SYS → F•2 SYSTEM SETUP → F•2 PREV TAB or F•3 NEXT TAB → GENERAL CAPTURE&D DISPLAY NETWORK REMOTE RS486 CAMERA ID TALLY OPERATION KEY DATE&TIME FORM WFM 1: Y 2: YCbCr 3: YGBR 4: GBR 5: YRGB 6: RGB 7: COMPOSITE VECTOR 1: COMPONENT 2: COMPOSITE SHORT CUT INTEN FILTER WFM[COMPOSITE] 1: FLAT 2: LUM 3: FLAT+LUM 4: LUM+CRMA MAG(GAIN) WFM 1: X1 2: X5 0% 3: X5 90% 4: X10 0% 5: X10 90% 6: SKIP VECTOR 1: X1 2: X5 3: IQ-MAG SWEEP WFM 1: TH 2: 2H 3: IV 4: 2V MAG(SWEEP) WFM 1: X1 2: X10 3: X20 4: X40 5: SKIP 6: SKIP COMPLETE PREV TAB NEXT TAB up menu

Figure 7-32 OPERATION KEY tab

- FORM

Set the display format and display order to apply when the FORM key is pressed on the video signal waveform display or vector display. Select SKIP to skip an item.

WFM: Y / YCbCr / YGBR / GBR / YRGB / RGB / COMPOSITE / SKIP VECTOR: COMPONENT / COMPOSITE / SKIP

- SHORT CUT

Select the action to perform when the S-CUT key is pressed.

DIRECT:The previously registered panel settings will be loaded. To register the panel settings, configure the instrument to the settings that you want to register, press MEM, and then press SHORTCUT.
CAP&WAIT:A screen capture will be taken and saved to a USB memory device. Connect a USB memory device in advance.
INTENSITY:Use the function menu shown in the lower right of the screen to adjust the waveform intensity. This is valid on the video signal waveform display, vector display, and audio display (SER03). When a mouse is connected, clicking the function menu resets the value to the default. When using the touch panel, tapping the function menu resets the value to the default.
CURSOR:Performs cursor measurement. This is valid on the video signal waveform display and vector display.
VOLUME:Use the function menu shown in the lower right of the screen to adjust the headphone volume. When a mouse is connected, clicking the function menu resets the value to the default. When using the touch panel, tapping the function menu resets the value to the default.

7. SYSTEM SETTINGS

- FILTER

Set the filter and display order to apply when the FILTER key is pressed in the pseudo-composite display of the video signal waveform display. Select SKIP to skip an item. Note that for component display, the FILTER key is used to switch between FLAT and LOWPASS.

FLAT / LUM / FLAT+LUM / LUM+CRMA / SKIP

- MAG(GAIN)

Set the magnification and display order to apply when the MAG (GAIN) key is pressed on the video signal waveform display or vector display. Select SKIP to skip an item.

WFM:X1 / X5 0% / X5 10% / X5 20% / X5 30% / X5 40% / X5 50% / X5 60% / X5 70% / X5 80% / X5 90% / X5 100% / X10 0% / X10 10% / X10 20% / X10 30% / X10 40% / X10 50% / X10 60% / X10 70% / X10 80% / X10 90% / X10 100% / SKIP
VECTOR:X1 / X5 / IQ-MAG / SKIP

- SWEEP

Set the sweep method and display order to apply when the SWEEP key is pressed on the video signal waveform display. Select SKIP to skip an item.

1H / 2H / 1V / 2V / SKIP

- MAG(SWEEP)

Set the horizontal magnification and display order to apply when the MAG (SWEEP) key is pressed on the video signal waveform display. Select SKIP to skip an item.

X1 / X10 / X20 / X40 / ACTIVE / BLANK / SKIP

7. SYSTEM SETTINGS

7.2.16 Date and time settings

Use the DATE&TIME tab to set the date and time.

You cannot set these settings when the SNTP client function is set to on.

The settings that you specify here will not be initialized even if you initialize the instrument. In addition, they are not recorded to presets.

SYS → F•2 SYSTEM SETUP → F•2 PREV TAB or F•3 NEXT TAB → GENERAL CAPTURE&D DISPLAY NETWORK REMOTE RS486 CAMERA ID TALLY OPERATION KEY DATE&TIME Date Day 2 Month 7 Year 2018 Time Hour 15 Minute 37 Second 41 COMPLETE PREV TAB NEXT TAB up menu

Figure 7-33 DATE & TIME tab

7. SYSTEM SETTINGS

7.2.17 Configuring the LV7290

You can configure the LV 7290 REMOTE CONTROLLER (sold separately) on the LV7290 SETUP tab.

If LV7290 is not selected under Telnet on the NETWORK tab, the LV7290 will not be displayed.

[See also] Telnet → 7.2.8, "Configuring the Server"

The connection to the LV7290 will be disconnected as soon as you change the LV7290 settings. The settings that you specify here will not be initialized even if you initialize the instrument. Nor are they recorded to presets.

SYS → F•2 SYSTEM SETUP → F•2 PREV TAB or F•3 NEXT TAB → GENERAL CAPTURE& DISPLAY NETWORK SNMP REMOTE RS485 CAMERA ID TALLY OPERATION KEY DATE&TIME LV7200 LV7200 Remote Controller Off On IP Address 192 168 0. 2 Subnet Mask 255 255 255 0 Default Gateway 0. 0. 0. 0 Remote Label (No Data) Frame Off On Gray Background Off On Unit Connect Destination Off On Unit IP Address Unit-1 192 168 0. 1 Unit-8 0. 0. 0 0 Unit-2 0. 0. 0. 0 Unit-8 0. 0. 0 0 Unit-3 0. 0. 0. 0 Unit-7 0. 0. 0 0 Unit-4 0. 0. 0. 0 Unit-8 0. 0. 0 0 COMPLETE PREV TAB NEXT TAB REMOTE LABEL INPUT up menu

Figure 7-34 LV7290 tab

- Remote Controller

Select whether to send the IP address, subnet mask, and default gateway settings to the LV7290.

Off / On

• IP Address / Subnet Mask / Default Gateway

Set the LV7290's IP address, subnet mask, and default gateway.

7. SYSTEM SETTINGS

- Remote Label

Displays the label of the REMOTE LABEL item placed in the layout.

There is no label in the default settings, but, you can press F•5 REMOTE LABEL INPUT to enter a label.

Enter up to 16 characters.

You can use the following keys on the label input screen.

F•1CLEAR ALLDeletes all characters
F•2DELETEDeletes the character at the cursor
F•3INSERTInserts the selected character at the cursor position
F•4<=Moves the cursor to the left
F•5=>Moves the cursor to the right
F•6CHAR SETEnters the character
Function dial (F•D)Turn to select a character, and press to enter the character.

[F.D_NOB] = CHAR SELECT - [F.D_PUSH] = CHAR SET & Function Key Edit Remarks Label SPC ! * # $ % & ' ( ) * + , - . / 0 1 2 3 4 5 6 ? 8 9 : ; < = > ? @ A B C D E F G H I J K L M N O P Q R S T U V W X Y Z [ ¥ ] ^ _ ' a b c d e f g h i j k l m n o p q r s t u v w x y z ( ! ) ~ CLEAR ALL DELETE INSERT <= > CHAR SET up TIME

Figure 7-35 Label input screen

- Frame

Turns on and off the frame of the REMOTE LABEL item placed in the layout.

Off / On

- Gray Background

Select whether to display the background of the REMOTE LABEL item placed in the layout in gray.

Off / On

- Connect Distination

Select whether to send the LV5600's and LV7600's IP address to the LV7290.

Off / On

• UNIT-1 to 8 IP Address

Set the connection destination LV5600 and LV7600 IP addresses.

7. SYSTEM SETTINGS

7.3 Displaying System Information

To display the system information, press F•3 SYSTEM INFO on the SYS menu. You can view the instrument version and the internal temperature on this tab.

SYS → F•3 SYSTEM INFO → INFORMATION LYS600 : WAVEFORM MONITOR FIRMWARE : 1.0 MOTHER : REV : 00 SOC : 001B WFM : REV : 00 FPGA : 003C PICTURE : REV : 00 FPGA : 004D SER01 SDI INPUT : REV : 00 SER02 SDI INPUT/EYE : NONE SER03 DIGITAL AUDIO : REV : 00 SER05 10G IP INPUT : NONE Temperature : up menu

Figure 7-36 INFORMATION tab

- Firmware

Displays the firmware version.

• MOTHER / WFM / PICTURE

Displays the hardware versions.

• SER01 / SER02 / SER03 / SER05

Displays the versions of the installed hardware options. Units displayed as "NONE" are not installed.

- Temperature

The internal temperature is displayed in a bar graph.

The internal temperature is displayed using 6 levels. Green levels indicate normal temperature. If the temperature increases and reaches the yellow area, a "TEMPERATURE" alarm appears at the top of the measurement screen.

If the internal temperature increases still further and reaches the red area, the alarm "OVER HEAT" appears in the upper left area of the measurement screen. When a specific temperature is reached, the power will be shut down.

Leader LV5600 - Displaying System Information - 2

If either of these alarm appears, immediately turn the power off, and then check for problems with the operating environment. If this alarm appears even though there are no problems with the operating environment, contact your local LEADER agent.

7. SYSTEM SETTINGS

7.4 Installing Software Options

To install options, use F•4 LICENSE on the SYS menu.

You can use this screen to view the MAC address and install options.

[See also] 2.3, "Software Options"

SYS → F•4 LICENSE → LICENSE MAC ADDRESS: 00:00:00:00:00:00 License List: 1. SER23 - HDR 13. 2. SER24 - TSG 14. 3. SER25 - FOCUS ASSIST 15. 4. SER26 - LAYOUT 16. 5. SER27 - TALLY 17. 6. SER28 - 4X 18. 7. SER29 - 12G 19. 8. 9. 10. 11. 12. Option License Key: 0 0 0 0 0 0 0 0 0 CLEAR SIGNISTER SREMOVE (up) UP menu

Figure 7-37 LICENSE tab

- Installing an Option

Have your license key ready, and follow the procedure below.

  1. Use the function dial (F•D) to enter the license key number.

Press F•2 CLEAR to clear the license key to 0000000000.

  1. Press F•3 REGISTER.

"Accepted" appears if the license key has been entered correctly, and the corresponding option becomes usable. The name of the option that has been installed appears in the License List.

"Failed" appears if the license key is not correct. Reenter the license key correctly.

- Disabling an Option

Have your license key ready, and follow the procedure below.

  1. Use the function dial (F•D) to enter the license key number.

Press F•2 CLEAR to clear the license key to 0000000000.

  1. Press F•4 REMOVE.

"Accepted" appears if the license key has been entered correctly, and the corresponding option is disabled. The name of the option is deleted from the License list.

"Failed" appears if the license key is not correct. Reenter the license key correctly.

  1. Restart the instrument.

7.5 Adjusting the Backlight (LV5600)

To adjust the backlight, use F•5 LCD BACK LIGHT on the SYS menu.

The larger the value, the brighter the backlight. Press the function dial (F•D) to return the setting to its default value (28).

1 - 28 - 32

7.6 Turning Off the LCD Panel (LV5600)

To turn off the LCD, press F•6 LCD OFF on the SYS menu.

To turn it on again, press any key excluding the power switch, double-click, or operate the touch panel.

7. SYSTEM SETTINGS

7.7 Initialization

To initialize the settings and layout, use F•7 INITIALIZE on the SYS menu.

Leader LV5600 - Initialization - 1

flowchart
graph LR
    A["F1 PALAM INIT YES"] --> B["F2 LAYOUT INIT YES"]
    B --> C["F3 OPERATE INIT YES"]
    C --> D["F4 ALL INIT YES"]
    D --> E["F5 INIT CANCEL"]
    E --> F["F6"]
    F --> G["F7"]

Figure 7-38 INITIALIZE menu

7.7.1 Initializing Settings

To initialize the settings, press F•1 PARAM INIT YES.

To cancel, press F•5 INIT CANCEL.

When you initialize the settings, all the settings—excluding those listed below—are initialized. For information about the default values, see chapter 21, "MENU TREES."

• Network settings (NETWORK tab)
• IP settings (SER05 (IP) tab)
- Remote control settings (REMOTE tab)
• RS-422/485 settings (RS485 tab)
- Camera ID settings (excluding Local ID Setting) (CAMERA ID tab)
- Date and time settings (DATE&TIME tab)
- Preset contents
• Measurement screen layout
• Factory Default Settings

If you also want to initialize the above settings (excluding the date and time settings), turn on the power while holding down the V POS and H POS knobs. Release them when about 3 seconds elapse after the power is turned on, and then press F•3 SRAM/FLASH INIT YES.

SRAM/FLASH INIT YES SRAM/FLASH INIT NO

Figure 7-39 Factory default settings

7. SYSTEM SETTINGS

7.7.2 Initializing the Layout

To initialize the layout, press F•2 LAYOUT INIT YES. To cancel, press F•5 INIT CANCEL.

When you initialize the layout, the layouts configured in all measurement displays (11 total) will be initialized. To initialize the layout in each measurement display, click or tap DEFAULT LAYOUT in the appropriate layout window.

[See also] DEFAULT LAYOUT → 6.5.3, "Layout Screen Description"

7.7.3 Initializing the Operation keys

To initialize the operation keys, press F•3 OPERATE INIT YES. To cancel, press F•5 INIT CANCEL.

7.7.4 Initializing the Settings and Layout

To initialize the settings and layout, press F•4 ALL INIT YES. To cancel, press F•5 INIT CANCEL.

8. CAPTURE FEATURE

The capture feature consists of screen capture and frame capture.

- Screen Capture

You can use the screen capture feature to capture still-image data of the screen. You can save the captured data to a USB memory device or overlay it on the input signal on the instrument's display.

• Frame Capture (SDI Code Value, Converted)

You can use the frame capture feature to capture a single frame or 16 consecutive frames of data from the SDI or IP signal. You can save the captured data to USB memory or overlay it on the input signal on the instrument display.

When data is saved to DPX or TIFF format in Converted mode, the black level is offset to zero.

Because data is captured as frame data, the data can be displayed on the instrument in different display modes. The supported display modes are the video signal waveform, vector, picture, and status (data dump) displays.

- Switching between Screen Capture and Frame Capture (SDI Code Value, Converted)

Use Mode on the CAPTURE & DISPLAY tab to switch between the two.

[See also] CAPTURE & DISPLAY tab → 7.2.4, "Configuring the Capture Feature"

SYS → F•2 SYSTEM SETUP → F•2 PREV TAB or F•3 NEXT TAB → GENERAL CAPTURE&DISPLAY NETWORK SNMP REMOTE RS485 CAMERA ID TALLY OPERATION KEY DATE&TIME LV7290 Capture Mode Screen File Type BMP BSG F1FX F1TT F1TM Transport Frame Number F1 Frame F10 Frames Information Display Format Off On Input Off On Icon Off On Error Off On Temperature Warning Off On Date y/m/d Time Real Time COMPLETE PREV TAB NEXT TAB up menu

Figure 8-1 CAPTURE & DISPLAY tab

8.1 Screen Capture

8.1.1 Capturing the Displayed Screen

To take a screen capture, follow the procedure below.

  1. Display the screen you want to capture.
  2. Press CAP.

The screen is captured to the internal memory. You can also take screen captures by pressing F•2 REFRESH while the CAP menu is displayed.

Note that if you perform one of the following operations after taking a screen capture, the captured data will be deleted.

  • Change the measurement screen
  • Press INPUT, MULTI, SYS, MEM, or RECALL
  • Turn off the power
  • Change the measurement screen
  • Press INPUT, MULTI, SYS, MEM, or RECALL
  • Turn off the power

Leader LV5600 - Capturing the Displayed Screen - 1

flowchart
graph LR
    A["F1"] --> B["F2 REFRESH"]
    B --> C["F3 DISPLAY REAL"]
    C --> D["F4"]
    D --> E["F5"]
    E --> F["F6"]
    F --> G["F7 SELECT CHA"]
    subgraph CAP
        H["F·1"]
        I["F·2"]
        J["F·3"]
        K["F·4"]
        L["F·5"]
        M["F·6"]
        N["F·7"]
    end

Figure 8-2 CAP menu

8.1.2 Displaying Screen Capture Data

Press CAP to display the acquired screen capture data on the instrument or overlay it on the current input signal.
You can display captured video signal waveform, vector, picture, audio waveform, and eye pattern waveform display data on the instrument. Other kinds of data (such as status and scale data) cannot be displayed. However, these other kinds of data can be saved to a USB memory device as BMP files.
To display screen capture data, press F•3 DISPLAY on the CAP menu.

REAL: The current input signal is displayed.
HOLD:The screen capture data is displayed.
BOTH:The current input signal and the screen capture data are overlaid with their intensities halved.

8.1.3 Saving to a USB Memory Device

Captured data acquired by pressing CAP is deleted when you perform an operation such as changing the measurement screen. However, by saving the screen capture data to a USB memory device in BSG format, you will be able to display the screen capture data on the instrument even after it is restarted.

Also, if you save the screen capture data in BMP format, you can view the captured data on a PC.

Use the CAPTURE & DISPLAY tab on the SYS menu to set the file format.

[See also] CAPTURE & DISPLAY tab → 7.2.4, "Configuring the Capture Feature"

  1. Connect a USB memory device to the instrument.
  2. Press F•6 USB MEMORY.

A file list screen and a USB MEMORY menu appear.

  1. Select how to name the file.

If F•1 AUTO FILENAME is set to on, the file is automatically assigned a name that consists of the year, month, day, hour, minute, and second (in that order) that are set on the SYS menu. (Example: 20090501100859.bmp)

Screen capture data is saved to the following locations.

USB memory device

LV5600_USER or LV7600_USER

L BMP

  • yyyymmddhhmmss.bmp
  • yyyymmddhhmmss.bsg

8. CAPTURE FEATURE

If F•1 AUTO FILENAME is set to off, press F•2 NAME INPUT to enter the file name. Enter up to 17 characters.

The key operations that you can perform in the file name input display are as follows:

F•1CLEAR ALLDeletes all characters
F•2DELETEDeletes the character at the cursor
F•4<=Moves the cursor to the left
F•5=>Moves the cursor to the right
F•6CHAR SETEnters the character
Function dial (F•D)Turn to select a character, and press to enter the character.

After entering the file name, F•7 up menu. The CAP menu appears.

[F.D_NOB] = CHAR SELECT - [F.D_PUSH] = CHAR SET & Function Key Edit Capture store file name CLEAR ALL DELETE < > => CHAR SET up menu

Figure 8-3 File name input screen

  1. Press F•3 STORE.

When AUTO FILENAME is set to on or if the specified file name does not exist in the USB memory device when AUTO FILENAME is set to off, the message "Please wait. Saving file" is displayed on the screen, and the screen capture data is saved to USB memory.

When AUTO FILENAME is set to off and the specified file name exists in the USB memory device, the STORE menu appears.

To overwrite, press F•1 OVER WRITE YES. The message "Please wait. Saving file" is displayed on the screen, and the screen capture data is saved to USB memory.

To not overwrite, press F•3 OVER WRITE NO.

CAP → F•6 USB MEMORY → F•3 STORE

F1 OVER WR YES F2 F3 OVER WR NO F4 F5 F6 F7 F·1 F·2 F·3 F·4 F·5 F·6 F·7

Figure 8-4 STORE menu

8.1.4 Displaying Screen Capture Data from a USB Memory Device

To display or overlay on the current input signal the BSG screen capture data that has been saved to a USB memory device, follow the procedure below.

(Screen capture data that has been saved in BMP format and screen capture data that has been saved in BSG format on a different model cannot be displayed on the instrument.)

  1. Connect a USB memory device to the instrument.
  2. Press CAP.
    The CAP menu appears.
  3. Press F•6 USB MEMORY. A file list screen and a USB MEMORY menu appear.
  4. Press F•5 RECALL.
    The BSG format file list screen appears.

  5. Turn the function dial (F•D) to select the file that you want to display.

  6. Press F•1 RECALL.

The capture data and CAP menu appear.

  1. Press F•3 DISPLAY to select the display format.

After you press F•1 RECALL, the display format is BOTH.

8.1.5 Deleting Screen Capture Data from a USB Memory Device

To delete screen capture data from a USB memory device, follow the procedure below. (You can also delete the data on the PC.)

  1. Connect a USB memory device to the instrument.
  2. Press CAP.
    The CAP menu appears.
  3. Press F•6 USB MEMORY.
    A file list screen and a USB MEMORY menu appear.
    You can also press F•5 RECALL here to display a BSG format file list screen.

  4. Turn the function dial (F•D) to select the file that you want to delete.

8. CAPTURE FEATURE

  1. Press F•5 DELETE FILE.

The DELETE FILE menu appears.

CAP → F•6 USB MEMORY → F•4 DELETE FILE → CAP → F•6 USB MEMORY → F•5 RECALL → F•4 DELETE FILE →

F1 DELETE YES F2 F3 DELETE NO F4 F5 F6 F7 F·1 F·2 F·3 F·4 F·5 F·6 F·7

Figure 8-5 DELETE FILE menu

  1. Press F•1 DELETE YES.

To cancel the operation, press F•3 DELETE NO.

8.2 Frame Capture

8.2.1 Capturing Frame Data

There are two ways to capture frame data. One way is to capture frame data manually, and the other is to capture frame data automatically when errors occur (error capture).

When using error capture, use single input mode. It will not work properly in simul mode.

  1. Display the screen you want to capture.

The display must be showing video signal waveforms, vectors, or a picture. However, capturing is not possible if an eye pattern (SER02) or audio is shown in the same display. For vector waveforms, press VECT and then set F•1 VECT INTEN/CONFIG → F•1 VECTOR DISPLAY to VECTOR. This feature does not support the 5-bar display.

  1. Press CAP.

The CAP menu appears.

Unlike screen captures, frame data is not captured when you press CAP.

Leader LV5600 - Capturing Frame Data - 1

flowchart
graph LR
    A["CAP"] --> B["F1 TRIGGER MANUAL"]
    B --> C["F2 REFRESH"]
    C --> D["F3 DISPLAY REAL"]
    D --> E["F4"]
    E --> F["F5"]
    F --> G["F6"]
    G --> H["F7 SELECT CHA"]
    H --> I["F·1"]
    I --> J["F·2"]
    J --> K["F·3"]
    K --> L["F·4"]
    L --> M["F·5"]
    M --> N["F·6"]
    N --> O["F·7"]

Figure 8-6 CAP menu

• Capturing frame data manually
3. Press F•1 TRIGGER to select MANUAL.
4. Press F•2 REFRESH.

Frame data is captured in the instrument.

- Capturing frame data automatically (error capture)

  1. Press F•1 TRIGGER to select ERROR.
  2. Press F•7 SELECT CH to select a channel.
  3. Press F•2 REFRESH.

Error capture for the selected channel begins.

To begin error capture on other channels, repeat steps 4 and 5.

The instrument switches to error standby mode and Channels for which capture is in progress appear in the upper right of the screen. Standby mode is cleared by setting F•1 TRIGGER to MANUAL.

In Simul mode, "Capture is invalid" will appear, and the capture function will not work.

TIME: 09:19:4 ERR CAP A B _ _

Figure 8-7 Error standby

8. CAPTURE FEATURE

6. When the message below appears, press any key except for the power key

If an error occurs during error standby, the instrument captures the frame data at that point and stops the frame capture.

The applicable errors are those listed under "Applicable Errors" below whose detection setting has been set to ON through F•5 STATUS SETUP on the STATUS menu.

Table 8-1 Applicable errors for error capturing

Applicable ErrorsInapplicable Errors
SDI ErrorTRS, Line Number, CRC, EDH, Illegal CodeFrequency, Cable
Ancillary Data ErrorParity, Checksum-
Embedded Audio ErrorBCH, DBN, Parity, Inhibit LineSample Count
Video ErrorGamut, Composite Gamut, LevelFreeze, Black

Leader LV5600 - When the message below appears, press any key except for the power key - 1

line | Time | Value | |------|-------| | 0 | 100 | | 10 | 90 | | 20 | 70 | | 30 | 50 | | 40 | 30 | | 50 | 10 | | 60 | 5 | | 70 | 0 | | 80 | 5 | | 90 | 10 | | 100 | 20 | | 110 | 30 | | 120 | 40 | | 130 | 50 | | 140 | 60 | | 150 | 70 | | 160 | 80 | | 170 | 90 | | 180 | 100 | | 190 | 90 | | 200 | 80 | | 210 | 70 | | 220 | 60 | | 230 | 50 | | 240 | 40 | | 250 | 30 | | 260 | 20 | | 270 | 10 | | 280 | 5 | | 290 | 0 | | 300 | 5 | | 310 | 10 | | 320 | 20 | | 330 | 30 | | 340 | 40 | | 350 | 50 | | 360 | 60 | | 370 | 70 | | 380 | 80 | | 390 | 90 | | 400 | 100 | | 410 | 90 | | 420 | 80 | | 430 | 70 | | 440 | 60 | | 450 | 50 | | 460 | 40 | | 470 | 30 | | 480 | 20 | | 490 | 10 | | 500 | 5 | | 510 | 0 | | 520 | 5 | | 530 | 10 | | 540 | 20 | | 550 | 30 | | 560 | 40 | | 570 | 50 | | 580 | 60 | | 590 | 70 | | 600 | 80 | | 610 | 90 | | 620 | 100 | | 630 | 90 | | 640 | 80 | | 650 | 70 | | 660 | 60 | | 670 | 50 | | 680 | 40 | | 690 | 30 | | 700 | 20 | | 710 | 10 | | 720 | 5 | | Note: The actual values for 'Ach Error Frame capture ends, Push Any Key' are not explicitly provided in the code. The 'SELECT CH A' indicates a selection of 'CH' on the right side. The 'GAIN x1.000 SWEEP1H x1' indicates a fixed input value. There is no additional data series in this image. The 'ERR CAP B' is shown as a red box above the chart.

Figure 8-8 Error capture end

8.2.2 Displaying Frame Capture Data

You can display the captured frame data on the instrument or overlay it on the current input signal. You can also display the frame data in different display modes.

- Selecting display format

To select the display format, follow the procedure below.

  • If the frame data captured to the internal memory does not exist, you cannot select the display format.
  • First, show the video signal waveform display, vector display (excluding the 5-bar display), or picture display.
  • To display frame data, the instrument must be receiving a signal whose format is the same as that of the captured data.
  • The display may blink when you operate the V POS knob, H POS knob, or function dial (F•D).
  • The scale and measured values are those of the current signal, not those of the captured data.

Procedure

CAPF•3DISPLAY: REAL / REPLAY / BOTH / HOLD

Settings

REAL: The current input signal is displayed.
REPLAY:The frame data is displayed. With 3G-B-DL, two video frames are embedded in a single frame data structure, so the screen may flicker. If this happens, set the display format to HOLD. Every time you select HOLD, the image of either frame will be displayed.When Transport Frame Number is set to 16 Frames, 16 consecutive frames (*1) of data are displayed repeatedly.
BOTH:The current input signal and the frame data are overlaid with their intensities halved.When Transport Frame Number is set to 16 Frames, the data of the first frame of the16 consecutive frames (*1) is displayed.
HOLD:The frame data is displayed. For measurements other than 3G-B-DL, we recommend the use of REPLAY.When Transport Frame Number is set to 16 Frames, the data of the first frame of the16 consecutive frames (*1) is displayed.

*1 The number of frames is 32 for the following formats.
• 3G-B-DL transmission; 3G(QL), 3G(DL)-2K frame rate 60P/59.94P/50P/48P/47.95P
• HD(DL)transmission; frame rate 60P/59.94P/50P/48P/47.95P

8.2.3 Saving to a USB Memory Device

The frame data captured in the instrument is cleared when the power is turned off, but you can save the data to a USB memory device. If the file format is set to FRM, you can display the data even after you turn the power off.

Use the CAPTURE & DISPLAY tab on the SYS menu to set the file format.

[See also] CAPTURE & DISPLAY tab → 7.2.4, "Configuring the Capture Feature"

The procedure to save is the same as with screen captures. After capturing frame data, see the procedure in section 8.1.3, "Saving to a USB Memory Device."

- When Transport Frame Number is set to 1 Frame, frame capture data is saved to the following locations.

USBmemory device LV5600_USER or LV7600_USER BMP yyyymmddhhmmss_A to D.dpx yyyymmddhhmmss_A to D.tif yyyymmddhhmmss_A to D.frm

- When Transport Frame Number is set to 16 Frames, frame capture data is saved to the following locations.

USBmemory device LV5600_USER or LV7600_USER BMP yyyymmddhhmmss yyyymmddhhmmss_A to D_00 to 15 or 31.frm

8.2.4 Displaying Frame Data from a USB Memory Device

To display on this instrument the frame data that has been saved in FRM format to a USB memory device or superimpose the data on the current input signal, follow the procedure below.

Frame data in FRM format that has been saved on a different model cannot be displayed on this instrument.

  1. Connect a USB memory device to the instrument.
  2. Press CAP.

The CAP menu appears.

  1. Press F•6 USB MEMORY.

The USB MEMORY menu appears.

  1. Press F•5 RECALL.

The FRM format file list screen appears.

  1. Turn the function dial (F•D) to select the file that you want to display.
  2. Press F•1 RECALL.

The frame data and CAP menu appear.

To display frame data, the instrument must be receiving a signal whose format is the same as that of the saved data. The FORMAT item at the bottom of the display shows the format of the saved data. It is displayed in green if the format is the same as the current format or in red if the format is not the same. If the FORMAT item is in red, F•1 RECALL does not appear.

When Transport Frame Number is set to 16 Frames, select the folder in which the 16 frames are stored.

  1. Press F•3 DISPLAY to select the display format.

8.2.5 Deleting Frame Capture Data from a USB Memory Device

The procedure to delete is the same as with screen captures. See 8.1.5, "Deleting Screen Capture Data from a USB Memory Device."

Note that when you press F•5 RECALL, however, the FRM format file list will appear.

9. PRESET FEATURE

9. PRESET FEATURE

The preset feature stores up to 60 sets of panel settings. It can be used to easily recall fixed settings.

Also, you can use the same settings on multiple instruments by copying presets to USB memory. However, the preset data is not compatible between the LV5600 and LV7600.

All items except the items below are stored in a preset. Stored items are not deleted even if you initialize the settings.

• Network settings (NETWORK tab)
• IP settings (SER05 (IP) tab)
- Remote control settings (REMOTE tab)
• RS-422/485 settings (RS485 tab)
- Camera ID settings (excluding Local ID Setting) (CAMERA ID tab)
- Date and time settings (DATE&TIME tab)

9.1 Registering Presets

To register a selected preset, follow the procedure below.

  1. Display the screen you want to register.

You can prevent overwriting presets by setting Preset Overwrite to Disable on the GENERAL tab of the SYS menu. To overwrite presets, set Preset Overwrite to Enable. Note that even when set to Disable, registering to an empty preset is possible.

You can set the menu that appears when a preset is recalled by setting Recall on the GENERAL SETUP tab of the SYS menu in advance.

[See also] GENERAL SETUP tab → 7.2.1, "General Settings"

  1. Press MEM.

The preset registration screen appears.

Internal Memory Preset List No. Comment Date&Time Size(byte) 1 --------------------- ---------------------- 2 ----------------------- 3 ----------------------- 4 ----------------------- 5 ----------------------- 6 ----------------------- 7 ----------------------- 8 ----------------------- 9 ----------------------- 10 ----------------------- 11 ----------------------- 12 ----------------------- 13 ----------------------- 14 ----------------------- 15 ----------------------- 16 ----------------------- 17 ----------------------- 18 ----------------------- 19 ----------------------- 20 ----------------------- 21 ----------------------- 22 ----------------------- 23 ----------------------- Setup Memory Comment COMMENT INPUT STORE ALL COPY USB→INT ALL COPY INT→USB

Figure 9-1 Preset registration screen

9. PRESET FEATURE

3. Press F•1 COMMENT INPUT.

The comment input screen appears.

You can also copy a comment from a preset that already has a comment saved to it. To copy a comment, on the preset registration display, move the cursor to the preset that has the comment that you want to copy, and press the function dial (F•D).

[F.D_NOB] = CHAR SELECT , [F.D_PUSH] = CHAR SET & Function Key Edit Setup Memory Comment Clear ALL DELETE INSERT <= => CHAR SET up menu

Figure 9-2 Comment input screen

4. Enter a comment of up to 16 characters.

You can use the following keys on the comment input screen.

F•1CLEAR ALLDeletes all characters
F•2DELETEDeletes the character at the cursor
F•3INSERTInserts the selected character at the cursor position
F•4<=Moves the cursor to the left
F•5=>Moves the cursor to the right
F•6CHAR SETEnters the character
Function dial (F•D)Turn to select a character, and press to enter the character.

5. Press F•7 up menu.

  1. Turn the function dial (F•D) to select the number of the preset you want to register.

7. Press F•2 STORE.

If a preset has already been stored with the number that you selected, the STORE menu appears. To overwrite the existing preset, press F•1 OVER WRITE YES. Otherwise, press F•4 OVER WRITE NO.

F-2 STORE does not appear if Preset Overwrite is set to Disable on the GENERAL tab of the SYS menu.

F1 OVER WR YES F2 F3 OVER WR NO F4 F5 F6 F7 F·1 F·2 F·3 F·4 F·5 F·6 F·7

Figure 9-3 STORE menu

9. PRESET FEATURE

9.2 Loading Presets

To recall a preset, follow the procedure below.

  1. Press RECALL.

The RECALL menu appears.

F1 No.1 DATA DUM P F2 No.2 LINE SEL F3 No.3 MY LAYOUT F4 No.4 F5 No.5 F6 No.6 F7 more F·1 F·2 F·3 F·4 F·5 F·6 F·7

Figure 9-4 RECALL menu

  1. Press a key from F•1 No.1 to F•6 No.6.

If the preset that you want to load is number 7 or greater, press F•7 more or turn the function dial (F•D).

The menu that appears immediately after loading the preset is either the RECALL menu or measurement menu depending on the setting that was specified on the GENERAL SETUP tab when the preset was registered.

[See also] GENERAL SETUP tab → 7.2.1, "General Settings"

9.3 Deleting Presets

To delete a preset, follow the procedure below.

  1. Press MEM.

The preset registration screen appears.

Internal Memory Preset List No. Comment Date&Time Size(byte) 1 PRESET1 2018/07/06 11:55:03 140.869 2 --------------------- --/---+/-- 3 ---------------------- --/---+/-- 4 ---------------------- --/---+/-- 5 ---------------------- --/---+/-- 6 ---------------------- --/---+/-- 7 ---------------------- --/---+/-- 8 ---------------------- --/---+/-- 9 ---------------------- --/---+/-- 10 ---------------------- --/---+/-- 11 ---------------------- --/---+/-- 12 ---------------------- --/---+/-- 13 ---------------------- --/---+/-- 14 ---------------------- --/---+/-- 15 ---------------------- --/---+/-- 16 ---------------------- --/---+/-- 17 ---------------------- --/---+/-- 18 ---------------------- --/---+/-- 19 ---------------------- --/---+/-- 20 ---------------------- --/---+/-- 21 ---------------------- --/---+/-- 22 ---------------------- --/---+/-- 23 ---------------------- --/---+/- - Setup Memory Comment PRESET1 COMMENT INPUT STORE DELETE ALL COPY USB->INT ALL COPY INT->USB

Figure 9-5 Preset registration screen

  1. Turn the function dial (F•D) to select the file that you want to delete.
  2. Press F•3 DELETE.

The DELETE menu appears.

Leader LV5600 - Deleting Presets - 2

flowchart
graph LR
    A["F1 DELETE YES"] --> B["F2"]
    B --> C["F3 DELETE NO"]
    C --> D["F4"]
    D --> E["F5"]
    E --> F["F6"]
    F --> G["F7"]
    H["F·1"] --> I["F·2"]
    I --> J["F·3"]
    J --> K["F·4"]
    K --> L["F·5"]
    L --> M["F·6"]
    M --> N["F·7"]

Figure 9-6 DELETE menu

  1. Press F•1 DELETE YES.

To cancel the operation, press F•3 DELETE NO.

9. PRESET FEATURE

9.4 Copying All Presets from the instrument to a USB Memory Device

To copy all the presets from the instrument to a USB memory device, follow the procedure below.

  1. Connect a USB memory device to the instrument.
  2. Press MEM.

The preset registration screen appears.

Internal Memory Preset List No. Comment Date&Time Size(bytes) 1 PRESET1 2018/07/06 11:55:00 140,86 2 --------------------- --/--- -/+ - 3 ---------------------- --/--- -/+ - 4 ---------------------- --/--- -/+ - 5 ---------------------- --/--- -/+ - 6 ---------------------- --/--- -/+ - 7 ---------------------- --/--- -/+ - 8 ---------------------- --/--- -/+ - 9 ---------------------- --/--- -/+ - 10 ---------------------- --/--- -/+ - 11 ---------------------- --/--- -/+ - 12 ---------------------- --/--- -/+ - 13 ---------------------- --/--- -/+ - 14 ---------------------- --/--- -/+ - 15 ---------------------- --/--- -/+ - 16 ---------------------- --/--- -/+ - 17 ---------------------- --/--- -/+ - 18 ---------------------- --/--- -/+ - 19 ---------------------- --/--- -/+ - 20 ---------------------- --/--- -/+ - 21 ---------------------- --/--- -/+ - 22 ---------------------- --/--- -/+ - 23 ---------------------- --/--- -/+ - Setup Memory Comment PRESET1 COMMENT INPUT STORE DELETE ALL COPY USB->INT ALL COPY INT->USB

Figure 9-7 Preset registration screen

  1. Press F•6 ALL COPY INT->USB.

The ALL COPY INT->USB menu appears.

FCOPY INT->USB YES F2 FCOPY INT->USB NO F4 F5 F6 F7 F·1 F·2 F·3 F·4 F·5 F·6 F·7

Figure 9-8 ALL COPY INT->USB menu

  1. Press F•1 COPY INT->USB YES.

To cancel the copy operation, press F•3 COPY INT->USB NO. If the USB memory device already contains presets, they will be overwritten.

Presets are saved to the following location.

Note that if you use a PC to change the names of the files stored in the USB memory device, you will no longer be able to copy the altered presets from the USB memory device to an instrument.

USB memory device LV5600_USER or LV7600_USER MEM PRESET_01.PRE (to PRESET_60.PRE)

9. PRESET FEATURE

9.5 Copying All Presets from a USB Memory Device to the instrument

To copy all the presets from a USB memory device to the instrument, follow the procedure below.

  1. Connect a USB memory device to the instrument.
  2. Press MEM.

The preset registration screen appears.

Internal Memory Preset List No. Comment Date&Time Size(bytes) 1 PRESET1 2018/07/06 11:55:00 140,86 2 --------------------- --/--- -/+ - 3 ---------------------- --/--- -/+ - 4 ---------------------- --/--- -/+ - 5 ---------------------- --/--- -/+ - 6 ---------------------- --/--- -/+ - 7 ---------------------- --/--- -/+ - 8 ---------------------- --/--- -/+ - 9 ---------------------- --/--- -/+ - 10 ---------------------- --/--- -/+ - 11 ---------------------- --/--- -/+ - 12 ---------------------- --/--- -/+ - 13 ---------------------- --/--- -/+ - 14 ---------------------- --/--- -/+ - 15 ---------------------- --/--- -/+ - 16 ---------------------- --/--- -/+ - 17 ---------------------- --/--- -/+ - 18 ---------------------- --/--- -/+ - 19 ---------------------- --/--- -/+ - 20 ---------------------- --/--- -/+ - 21 ---------------------- --/--- -/+ - 22 ---------------------- --/--- -/+ - 23 ---------------------- --/--- -/+ - Setup Memory Comment PRESET1 COMMENT INPUT STORE DELETE ALL COPY USB->INT ALL COPY INT->USB

Figure 9-9 Preset registration screen

  1. Press F•5 ALL COPY USB->INT.

The ALL COPY USB->INT menu appears.

F COPY USB->INT YES F2 F COPY USB->INT NO F4 F5 F6 F7 F·1 F·2 F·3 F·4 F·5 F·6 F·7

Figure 9-10 ALL COPY USB->INT menu

  1. Press F•1 COPY USB->INT YES.

To cancel the copy operation, press F•3 COPY USB->INT NO. If the instrument already has presets, the operation will be according to the Preset Overwrite setting on the GENERAL tab.

10. Video Signal Waveform Display

Normally, colorimetry is not displayed, but when the colorimetry alarm on the SYS menu is set to on and a colorimetry different from the one specified is received, the alarm is indicated in red in the upper left of the screen.

10.1 Operation Key Description

On the LV5600, operation keys other than S-CUT can be controlled from the mouse and touch panel. On the LV7600, keys can be controlled from the panel, mouse, and touch panel.

On the video signal waveform display, you can press the operation keys to change the following settings. (Some settings may not be changed.) The key LEDs light when the underlined setting is selected.

Key assignments can be changed freely on the OPERATION KEY tab.

[See also] OPERATION KEY tab → 7.2.15, "Setting the Operation keys"

Table 10-1 Operation Key Actions

SettingNotes
FORMY / YCbCr / YGBR / GBR / YRGB / RGB / COMPOSITE
OVLAYOVERLAY / PARADE
FILTERFLAT / LOWPASSDuring component display
FLAT / LUM / FLAT+LUM / LUM+CRMADuring pseudo-composite display
GAINCAL / VARIABLE
MAG (GAIN)X1 / X5 0% / X5 +90%X5 + 10% to X5 + 80%
SWEEP1H / 2H / 1V / 2V
MAG (SWEEP)X1 / X10 / X20 / X40ACTIVE and BLANK are also selectable.

10. Video Signal Waveform Display

10.2 Setting the Waveform Display Position

Use the V POS and H POS knobs to adjust the display position of video signal waveforms. On the multi display, these are valid when you press F•2 MULTI WFM on the MULTI menu.

LV5600 V F/M VECT PIC AUDIO STATUS F. D EYE MULTI USB LV7600 V POS H POS F. D PHONES USB

Figure 10-2 V POS and H POS knobs

• V POS Knob

This knob adjusts the vertical position of the video signal waveform. Pressing the knob returns the waveform to its default position.

• H POS Knob

This knob adjusts the horizontal position of the video signal waveform. Pressing the knob returns the waveform to its default position.

10. Video Signal Waveform Display

10.3 Configuring the Display Settings

To configure the display settings, press F•1 WFM INTEN/CONFIG on the WFM menu.

WFM → F•1 WFM INTEN/CONFIG → F1 EXTERNAL SYNC OFF F2 WFM MODE F3 WFM INTENSITY θ F4 WFM COLOR WHITE F5 WFM SCALE F6 INPUT SELECT A F7 up menu F·1 F·2 F·3 F·4 F·5 F·6 F·7

Figure 10-3 WFM INTEN/CONFIG menu

10.3.1 Selecting the Display Mode

To configure the display settings, press F•2 WFM MODE on the WFM INTEN/CONFIG menu.

Leader LV5600 - Selecting the Display Mode - 1

flowchart
graph LR
    A["WFM → F•1"] --> B["WFM INTEN/CONFIG → F•2"]
    B --> C["WFM MODE →"]
    D["F1 WFM MODE PARADE"] --> E["F2 Y ON"]
    E --> F["F3 Cb ON"]
    F --> G["F4 Cr ON"]
    G --> H["F5 4Y PARADE OFF"]
    H --> I["F6 INPUT SELECT A"]
    I --> J["F7 up menu"]
    K["F•1"] --> L["F•2"] --> M["F•3"] --> N["F•4"] --> O["F•5"] --> P["F•6"] --> Q["F•7"]

Figure 10-4 WFM MODE menu

To select the video signal waveform display mode, follow the procedure below.

This setting is invalid when COLOR MATRIX is set to COMPOSITE.

[See also] COLOR MATRIX → section 10.8.1, "Selecting the Color Matrix."

Procedure

WFM → F•1 WFM INTEN/CONFIG → F•2 WFM MODE → F•1 MODE: OVERLAY / PARADE

Settings

OVERLAY: The input signals are displayed overlaid.

PARADE: The input signals are displayed side by side.

WFM MODE = OVERLAY

Leader LV5600 - Selecting the Display Mode - 2

line | Signal | Value | |--------|-------| | WFM MODE OVERLAY | ON | | Y | ON | | Cb | ON | | Cr | ON | | F5 | ON | | INPUT SELECT A | | | | | | | | | | | | | | | | | | | | | | | | | | | | | | | | | | | | | | | | | | | | | | | | | | | | | INPUT SELECT A | | | | | | | | | | | | | | | | | | | | | | | | | | | | | | | | | | | | | | | | | | | | | | | | | | INPUT SELECT A | | | | | | | | | | | | | | | | | | | | | | | | | | | | | | | | | | | | | | | | | | | | | | | | | | | | | | | | | | | | | | | | | | | | | | | | | | | | | | | | | | | | | | | | | | | | | | | | | | | | | | | | | | | | | | | | | | | | | | | | | | | | | | | | | | | | | | | | | | | | | | |

10. Video Signal Waveform Display

WFM MODE = PARADE
Leader LV5600 - Video Signal Waveform Display - 1

line | Time | Value | | -------- | ----- | | Start | 100 | | Mid | 90 | | End | 50 |

Figure 10-5 Selecting the display mode

10.3.2 Turning the Channels On and Off

To turn the waveforms on and off, follow the procedure below.

You cannot turn all the waveforms off.

This menu item is not displayed when COLOR MATRIX is set to COMPOSITE or when YGBR or YRGB is set to ON.

[See also] COLOR MATRIX → section 10.8.1, "Selecting the Color Matrix."

YGBR, YRGB → section 10.8.20, "Turning Luminance Signals On and Off."

Procedure

WFM → F•1 WFM INTEN/CONFIG → F•2 WFM MODE
→ F•2 Y / G / R / X: ON / OFF
→ F•3 Cb / B / G / Y: ON / OFF
→ F•4 Cr / R / B / Z: ON / OFF 

10.3.3 4Y Parade Display

To extract the Y signals from channels 1 to 4 and display them side by side, follow the procedure below.

The conditions for displaying the 4Y parade display are listed below.

  • SDI System is set to SD, HD, 3G-A, or 3G-B-DL.
  • Simul mode
  • F•6 OPERATE CH MODE on the INPUT menu is set to COMMON.
  • F•7 COLOR SYSTEM → F•1 COLOR MATRIX on the WFM menu is set to YCbCr or COMPOSITE.
  • The layout display mode is set to NORMAL.

Also, note the following points.

  • Only the channels that have been set to ON on the INPUT menu are displayed.
  • Option in layout will be hidden.
  • Style in layout will be invalid.
  • The scale jump function cannot be used.

Procedure

WFM → F•1 WFM INTEN/CONFIG → F•2 WFM MODE → F•5 4Y PARADE: ON / OFF

10.3.4 Configuring the 3G-B-DS Display

When measuring 3G-B-DS, to select the display mode, follow the procedure below.

Procedure

WFM → F•1 WFM INTEN/CONFIG → F•2 WFM MODE → F•5 3G-B-DS DISPLAY: STREAM1 / STREAM2 / MIX / ALIGN

Settings

STREAM1: Stream 1 is displayed.

STREAM2: Stream 2 is displayed.

MIX: Streams 1 and 2 are displayed on top of each other.

ALIGN: Streams 1 and 2 are displayed side by side.

10.3.5 Adjusting the Waveform Intensity

To adjust the video signal waveform intensity, follow the procedure below.

Press the function dial (F•D) to return the setting to its default value (0).

Procedure

WFMF•1WFM INTEN/CONFIG →F•3WFM INTENSITY: -128 - 0 - 127

10. Video Signal Waveform Display

10.3.6 Selecting the Waveform Color

To select the video signal waveform color, follow the procedure below.

On the multi display, the following colors are assigned to the video signal waveforms.

Y: White Cb: Cyan Cr: Magenta

G: Green

B: Blue

R: Red

X: White

Y: Cyan

Z: Magenta

COMPOSITE: White

Procedure (a signal other than 3G-B-DS)

WFM → F•1 WFM INTEN/CONFIG → F•4 WFM COLOR: WHITE / YELLOW / CYAN / GREEN / MAGENTA / RED / BLUE / MULTI

Procedure (3G-B-DS)

WFM → F•1 WFM INTEN/CONFIG→ F•4 WFM COLOR

→|F•1|STREAM1 COLOR: WHITE / YELLOW / CYAN / GREEN / MAGENTA / RED / BLUE / MULTI

→|F•2|STREAM2 COLOR: WHITE / YELLOW / CYAN / GREEN / MAGENTA / RED / BLUE / MULTI

10.3.7 Adjusting the Scale Intensity

To configure the scale, press F•5 WFM SCALE on the WFM INTEN/CONFIG menu.

→ 1 WFM INTEN/CONFIG → 5 WFM SCALE →

F1 SCALE INTEN F2 SCALE COLOR F3 SCALE YELLOW SETTING F4 F5 F6 INPUT SELECT A F7 up menu F·1 F·2 F·3 F·4 F·5 F·6 F·7

Figure 10-6 WFM SCALE menu

To adjust the scale intensity, follow the procedure below.

Press the function dial (F•D) to return the setting to its default value (4).

Procedure

WFM → F•1 WFM INTEN/CONFIG → F•5 WFM SCALE → F•1 SCALE INTEN: -8 - 4 - 7

10.3.8 Selecting the Scale Color

To select the scale color, follow the procedure below.

Procedure

WFM → F•1 WFM INTEN/CONFIG → F•5 WFM SCALE → F•2 SCALE COLOR: WHITE / YELLOW / CYAN / GREEN / MAGENTA / RED / BLUE

10. Video Signal Waveform Display

10.3.9 Selecting the Scale Unit

To select the scale unit, follow the procedure below.

When COLOR MATRIX is set to COMPOSITE and the composite display format is NTSC, the scale unit setting is fixed at %. When the composite display format is PAL, this is fixed to V.

Video signal white (100 %) becomes 0.7 V or 100 % on the scale.

Video signal black (0 %) becomes 0 V or 0 % on the scale.

[See also] COLOR MATRIX → section 10.8.1, "Selecting the Color Matrix."

Procedure

WFM → F•1WFM INTEN/CONFIG → F•5WFM SCALE → F•3SCALE SETTING → F•1SCALE
UNIT: HDV,SD% / HDV,SDV / HD%,SD% / CV DEC / CV HEX / V / %

Settings

HDV,SD%:The scale shows voltages when the input signal is not SD and percentages when the input signal is SD.

HDV,SDV: The scale shows voltages.

HD%, SD%: The scale shows percentages.

CV DEC: 0 to 100 % is displayed as 64 to 940 (YGBR) or 64 to 960 (CbCr). For XYZ, 0 to 100% is displayed as 0 to 4095.

CV HEX: 0 to 100 % is displayed as 040 to 3AC (YGBR) or 040 to 3C0 (CbCr). For XYZ, 0 to 100% is displayed as 000 to FFF.

V The scale shows voltages.

% The scale shows percentages.

SCALE UNIT = HDV, SDV
Leader LV5600 - Selecting the Scale Unit - 1

line | Time (h) | Value | |----------|-------| | 0 | 0.7 | | 1 | 0.6 | | 2 | 0.5 | | 3 | 0.4 | | 4 | 0.3 | | 5 | 0.2 | | 6 | 0.1 | | 7 | 0.0 | | 8 | 0.1 | | 9 | 0.2 | | 10 | 0.3 | | 11 | 0.4 | | 12 | 0.5 | | 13 | 0.6 | | 14 | 0.7 | | 15 | 0.6 | | 16 | 0.5 | | 17 | 0.4 | | 18 | 0.3 | | 19 | 0.2 | | 20 | 0.1 | | 21 | 0.0 | | 22 | 0.1 | | 23 | 0.2 | | 24 | 0.3 | | 25 | 0.4 | | 26 | 0.5 |

10. Video Signal Waveform Display

SCALE UNIT = HD%, SD%
Leader LV5600 - Video Signal Waveform Display - 1

line | Time | Value | | ---------- | ----- | | 1920x1080/58.941 YCbCr(422) 10bit HD | 100 | | 13:59:15 | 50 |

SCALE UNIT = CV DEC
Leader LV5600 - Video Signal Waveform Display - 2

line 1920x1080/58.941 YCbCr(422) 10bit HD | Time | Value | | :--- | :--- | | Start | 64 | | End | 960 | | High | 512 | | Low | 64 | GAIN x1.000 SWEEP 1H x1 SDI A TIME: 14:00:33 SCALE UNIT CV DEC 75% COLOR SCALE OFF SCALE DISPLAY ON INPUT SELECT A up menu

SCALE UNIT = CV HEX
Leader LV5600 - Video Signal Waveform Display - 3

line 1920x1080/58.94I YCbCr(422) 10bit HD SDI A TIME: 14:01:18 | Time | Value | | :--- | :--- | | 040 | 3C0 | | 200 | 200 | | 300 | 040 | GAIN x1,000 SWEEP 1H x1 YCbCr SCALE UNIT CV HEX 75% COLOR SCALE OFF SCALE DISPLAY ON INPUT SELECT A up menu

Figure 10-7 Selecting the scale unit

10. Video Signal Waveform Display

10.3.10 Displaying a Scale for 75% Color Bars

When COLOR MATRIX is set to YCbCr, to display a scale on which a 75% color bar signal input is mapped to the peak level of the chrominance, follow the procedure below.

[See also] COLOR MATRIX → section 10.8.1, "Selecting the Color Matrix."

Procedure

WFM → F•1 WFM INTEN/CONFIG → F•5 WFM SCALE → F•3 SCALE SETTING → F•2 75% COLOR SCALE: ON / OFF

75%COLOR SCALE = ON

Leader LV5600 - Displaying a Scale for 75% Color Bars - 1

line 1920x1080/58.94I YCbCr(422) 10bit HD SDI A TIME: 14:02:54 GAIN x1.000 SWEEP 1H x1 YCbCr SCALE UNIT HD% SD% 75%COLOR SCALE ON SCALE DISPLAY ON INPUT SELECT A up menu

Figure 10-8 Displaying a scale for 75 % color bars

10.3.11 Displaying the Scale

To turn the scale display on and off, follow the procedure shown below.

Procedure

WFM → F•1 WFM INTEN/CONFIG → F•5 WFM SCALE → F•3 SCALE SETTING → F•3 SCALE DISPLAY: ON / OFF

10. Video Signal Waveform Display

SCALE DISPLAY = OFF
Leader LV5600 - Video Signal Waveform Display - 1

line | Time | Value | | -------- | ----- | | 1920x1080/59.941 YCbCr(422) 10bit HD | 100 | | 14:04:18 | 50 |

Figure 10-9 Displaying the scale

10.4 Configuring the Gain and Filter Settings

To configure the gain and filter settings, press F•2 GAIN/FILTER on the WFM menu.

Leader LV5600 - Configuring the Gain and Filter Settings - 1

flowchart
graph LR
    A["WFM"] --> B["F•2"]
    B --> C["GAIN/FILTER"]
    C --> D["F1"]
    D --> E["GAIN VARIABLE CAL"]
    E --> F["F2"]
    F --> G["GAIN MAG X5"]
    G --> H["F3"]
    H --> I["FILTER FLAT"]
    I --> J["F4"]
    J --> K["F5"]
    K --> L["SCALE JUMP 0%"]
    L --> M["F6"]
    M --> N["INPUT SELECT A"]
    N --> O["F7"]
    O --> P["up menu"]
    P --> Q["F•7"]
    Q --> R["F•6"]
    R --> S["F•5"]
    S --> T["F•4"]
    T --> U["F•3"]
    U --> V["F•2"]
    V --> W["F•1"]

Figure 10-10 GAIN/FILTER menu

You cannot set these when external sync signal waveform display is in use. They are set to the following values.

• GAIN VARIABLE: CAL
- GAIN MAG: X1
- FILTER: FLAT

10.4.1 Setting the Variable Gain

To set the variable video signal waveform gain, follow the procedure below.

Procedure

WFM → F•2 GAIN/FILTER → F•1 GAIN VARIABLE: CAL / VARIABLE

Settings

CAL: The waveform gain is fixed.

VARIABLE: You can adjust the waveform gain by turning the function dial (F•D). Press the function dial (F•D) to return the setting to its default value (1.000 or 5.000). The adjusted gain value (the combination of F•1 GAIN VARIABLE and F•2 GAIN MAG) appears at the bottom of the screen. 0.200 - 1.000 - 2.000 (for X1) 1.000 - 5.000 - 10.000 (for X5) 2.000 - 10.000 (for X10)

10.4.2 Selecting the Fixed Gain

To select the fixed video signal waveform gain, follow the procedure below.

Procedure

WFM → F•2 GAIN/FILTER → F•2 GAIN MAG: X1 / X5 / X10

10. Video Signal Waveform Display

10.4.3 Selecting the Filter

To select the filter to apply to video signal waveforms, follow the procedure below. The filters that you can select vary depending on the COLOR MATRIX setting.

[See also] COLOR MATRIX → section 10.8.1, "Selecting the Color Matrix."

Procedure (When COLOR MATRIX is set to YCbCr, GBR, or RGB)

WFM → F•2 GAIN/FILTER → F•3 FILTER: FLAT / LOWPASS

Settings

FLAT:A filter with a flat frequency response over the entire bandwidth of the input signal is applied.
LOWPASS:A low-pass filter with the following characteristics is applied.At 40 MHz, 20 dB attenuation or more (when the input signal is 1080/60P, 59.94P, or 50P)At 20 MHz, 20 dB attenuation or more (when the input signal is 3G, HD, or HD (DL) excluding 1080/60P, 59.94P, or 50P)At 3.8 MHz, 20 dB attenuation or more (when the input signal is SD)

FILTER = FLAT
Leader LV5600 - Selecting the Filter - 1

line | Time | Value | |------|-------| | 0 | 0 | | 5 | 50 | | 10 | 100 | | 15 | 50 | | 20 | 30 | | 25 | 20 | | 30 | 10 | | 35 | 5 | | 40 | 0 | | 45 | 5 | | 50 | 10 | | 55 | 20 | | 60 | 30 | | 65 | 40 | | 70 | 50 | | 75 | 60 | | 80 | 70 | | 85 | 80 | | 90 | 90 | | 95 | 100 | | 100 | 100 |

FILTER = LOWPASS
Leader LV5600 - Selecting the Filter - 2

area | Time Point | Value | | ---------- | ----- | | 1 | 95 | | 2 | 60 | | 3 | 40 | | 4 | 50 | | 5 | 70 | | 6 | 80 | | 7 | 90 | | 8 | 50 | | 9 | 40 | | 10 | 30 | | 11 | 20 | | 12 | 10 | | 13 | 5 | | 14 | 0 |

Figure 10-11 Selecting the filter (component)

10. Video Signal Waveform Display

Procedure (When COLOR MATRIX is set to COMPOSITE)

WFM → F•2 GAIN/FILTER → F•3 FILTER: FLAT / LUM / FLAT+LUM / LUM+CRMA

Settings

FLAT: Only the pseudo-composite signal is displayed.

LUM: Only the luminance signal is displayed.

FLAT+LUM: The pseudo-composite and luminance signals are displayed side by side. A filter with an attenuation of 20 dB or more at 40 MHz is applied to the luminance signal.

LUM+CRMA: The luminance and chrominance signals are displayed side by side. A filter with an attenuation of 20 dB or more at 40 MHz is applied to the luminance signal.

FILTER = FLAT

Leader LV5600 - Settings - 1

bar 1920x1080/58.94I YCbCr(422) 10bit HD SDI A TIME: 14:09:56 GAIN x1.000 SWEEP 1H x1 COMPOSITE | GAIN VARIABLE CAL | GAIN MAG x1 | FILTER FLAT | INPUT SELECT A | up menu | |---|---|---|---|---| | -40 | -40 | -40 | -40 | -40 | | -30 | -30 | -30 | -30 | -30 | | -20 | -20 | -20 | -20 | -20 | | -10 | -10 | -10 | -10 | -10 | | 0 | 0 | 0 | 0 | 0 | | 10 | 10 | 10 | 10 | 10 | | 20 | 20 | 20 | 20 | 20 | | 30 | 30 | 30 | 30 | 30 | | 40 | 40 | 40 | 40 | 40 | | 50 | 50 | 50 | 50 | 50 | | 60 | 60 | 60 | 60 | 60 | | 70 | 70 | 70 | 70 | 70 | | 80 | 80 | 80 | 80 | 80 | | 90 | 90 | 90 | 90 | 90 | | 100 | 100 | 100 | 100 | 100 | | 110 | 110 | 110 | 110 | 110 | | 120 | 120 | 120 | 120 | 120 | | 130 | 130 | 130 | 130 | 130 | | 140 | 140 | 140 | 140 | 140 | | 150 | 150 | 150 | 150 | 150 | | 160 | 160 | 160 | 160 | 160 | | 170 | 170 | 170 | 170 | 170 | | 180 | 180 | 180 | 180 | 180 | | 190 | 190 | 190 | 190 | 190 | | 200 | 200 | 200 | 200 | 200 | | 210 | 210 | 210 | 210 | 210 | | 220 | 220 | 220 | 220 | 220 | | 230 | 230 | 230 | 230 | 230 | | 240 | 240 | 240 | 240 | 240 | | 250 | 250 | 250 | 250 | 250 | | 260 | 260 | 260 | 260 | 260 | | 270 | 270 | 270 | 270 | 270 | | 280 | 280 | 280 | 280 | 280 | | 290 | 290 | 290 | 290 | 290 | | 300 | 300 | 300 | 300 | 300 | | 310 | 310 | 310 | 310 | 310 | | 320 | 320 | 320 | 320 | 320 | | 330 | 330 | 330 | 330 | 330 | | 340 | 340 | 340 | 340 | 340 | | 350 | 350 | 350 | 350 | 350 | | 360 | 360 | 360 | 360 | 360 | | 370 | 370 | 370 | 370 | 370 | | 380 | 380 | 380 | 380 | 380 | | 390 | 390 | 390 | 390 | 390 | | 400 | 400 | 400 | 400 | 400 | | ... (repeated for visual comparison) GAIN x1.ooo Sweep x1 x1

10. Video Signal Waveform Display

FILTER = LUM
Leader LV5600 - Video Signal Waveform Display - 1

line 1920x1080/59.941 YCbCr(422) 10bit HD SDI A TIME: 14:10:50 GAIN x1,000 LUM COMPOSITE GAIN VARIABLE CAL GAIN MAG X1 FILTER LUM INPUT SELECT A up menu

FILTER = FLAT+LUM
Leader LV5600 - Video Signal Waveform Display - 2

bar 1920x1080/59.941 YCbCr(422) 10bit HD SDI A TIME: 14:11:33 | Category | Value | |---|---| | GAIN x1.000 SWEEP 1H x1 | -40 | | FLAT+LUM | 120 | | COMPOSITE | 60 | | GAIN VARIABLE CAL | 0 | | GAIN MAG X1 | 0 | | FILTER FLAT+LUM | 0 | | INPUT SELECT A | 0 | | up menu | 0 |

FILTER = LUM+CRMA
Leader LV5600 - Video Signal Waveform Display - 3

line | Parameter | Value | |---------------------|-----------| | GAIN VARIABLE CAL | 1,000 | | GAIN MAG X1 | 1 | | FILTER LUM+CRMA | 1 | | INPUT SELECT A | 1 | | up menu | 1 |

Figure 10-12 Selecting the filter (composite)

10.4.4 Setting the Scale Jump

If F•2 GAIN MAG is set to X5, the waveform is expanded five times in the Y-axis direction. To select the area you want to see expanded, follow the procedure below. You can view the area that is currently displayed with respect to the entire waveform on the scale shown on the right side of the screen.

This menu item appears when GAIN MAG is set to X5 or X10.

Procedure

WFM → F 2 GAIN / FILTER → F 5 SCALE JUMP: 0 % / 1 0 % / 2 0 % / 3 0 % / 4 0 % / 5 0 % / 6 0 %\/ 7 0 % / 8 0 % / 9 0 % / 1 0 0 % / CURSOR

- 0 to 100%

The instrument has 11 types of screens in the Y-axis direction, these screens are switched in the range of 0 to 100%.

For example, if the scale unit is % and YCbCr is displayed, selecting 0% displays the 0 to 20% range, selecting 10% displays the 10 to 30% range, selecting 90% displays the 90 to 110% range, and selecting 100% displays the 100 to 120% range.

10. Video Signal Waveform Display

- Cursors

The scale jump function operates based on the Y-axis cursor, and the area near the currently selected cursor (▼ mark) is expanded. An operation example is shown below.

[Preparation]

  1. On the CURSOR menu, set F•1 CURSOR to ON and F•2 XY SEL to Y.
  2. On the GAIN/FILTER menu, set F•2 GAIN MAG to X5 or X10.
  3. Set F•4 SCALE JUMP to CURSOR.

[Operation]

  1. Set F•2 GAIN MAG to X1.
  2. Move the Y-axis cursor to the area you want magnified. (You can move the cursor on the GAIN/FILTER menu. You can switch between REF, DELTA, and TRACK by pressing the function dial (F•D).)
  3. Set F·2 GAIN MAG to X5 or X10 to expand the area near the Y-axis cursor.

SCALE JUMP = CURSOR
Leader LV5600 - [Operation] - 1

line | Signal | Value | |--------|-------| | GAIN | 47.3% | | VCI | 47.3% | | FILTER | 47.3% | | SCALE | 47.3% | | INPUT | 47.3% | | INPUT SELECT A | 47.3% | | up | 47.3% |

Figure 10-13 Setting the scale jump

10. Video Signal Waveform Display

10.5 Configuring the Sweep Settings

To configure the sweep settings, press F•3 SWEEP on the WFM menu.

Leader LV5600 - Configuring the Sweep Settings - 1

flowchart
graph LR
    A["WFM"] --> B["F•3"]
    B --> C["SWEEP"]
    C --> D["F1 SWEEP V"]
    D --> E["F2 V SWEEP 1V"]
    E --> F["F3 SWEEP MAG X1"]
    F --> G["F4 FIELD FIELD1"]
    G --> H["F5 BLANKING REMOVE"]
    H --> I["F6 INPUT SELECT A"]
    I --> J["F7 up menu"]
    subgraph F1
        K["F·1"]
        L["F·2"]
        M["F·3"]
        N["F·4"]
        O["F·5"]
        P["F·6"]
        Q["F·7"]
    end

Figure 10-14 SWEEP menu

10.5.1 Selecting the Sweep Method

To select the video signal waveform sweep method, follow the procedure below.

Procedure

Leader LV5600 - Selecting the Sweep Method - 1

Settings

H: Lines are displayed.

V: Fields or frames are displayed. Because the sampled data is downsampled, aliasing distortion occurs.

SWEEP = H

Leader LV5600 - Selecting the Sweep Method - 2

line SDI A TIME: 17:14:25 | Signal | Value | | :--- | :--- | | SWEEP H | 100 | | H SWEEP 1H | 93 | | SWEEP MAG X1 | 72 | | BLANKING REMOVE | 30 | | INPUT SELECT A | 90 | | up menu | 100 | GAIN x1,000 SWEEP 1H x1 YCbCr 10bit HD 1920x1080/58,941 YCbCr(422) 10bit HD

10. Video Signal Waveform Display

SWEEP = V

1920x1080/58.94I YCbCr(422) 10bit HD SDI A TIME: 17:15:17 GAIN x1.000 SWEEP 1V x1 YCbCr SWEEP V V SWEEP 1V SWEEP MAG X1 FIELD FIELD1 BLANKING REMOVE INPUT SELECT A up menu

Figure 10-15 Selecting the sweep method

10.5.2 Selecting the Line Display Format

When F•1 SWEEP is set to H, to select the sweep time, follow the procedure below.

Procedure

Leader LV5600 - Selecting the Line Display Format - 1

Settings

1H: One line is displayed.

2H: Two lines are displayed. This cannot be selected in the following situations.

  • For 4K
  • When WFM → F•1 WFM INTEN/CONFIG → F•2 WFM MODE → F•1 MODE is set to PARADE
  • When F•7 COLOR SYSTEM → F•1 COLOR MATRIX is set to COMPOSITE

H SWEEP = 1H

Leader LV5600 - Selecting the Line Display Format - 2

line | Signal | Value | |-----------------|-------| | SWEEP | 100 | | H | 55 | | H Sweep | 62 | | SWEEP MAG X1 | 30 | | BLANKING | 40 | | INPUT SELECT A | 45 | | up menu | 50 |

10. Video Signal Waveform Display

Leader LV5600 - Video Signal Waveform Display - 1

line | Signal | Value | | ------------- | ----- | | SWEEP | 100 | | H | 55 | | H-Sweep | 62 | | SWEEP MAG | 30 | | BLANKING | 55 | | INPUT SELECT | 62 | | up | 30 |

Figure 10-16 Selecting the line display format

10.5.3 Selecting the Field Display Format

When F•1 SWEEP is set to V, to select the sweep time, follow the procedure below.

Procedure

Leader LV5600 - Selecting the Field Display Format - 1

Settings

1V: One field is displayed.

2V: One frame is displayed. This option cannot be selected when the input signal is progressive.

V SWEEP = 1V

1920x1080/58.94I YCbCr(422) 10bit HD SDI A TIME: 17:19:48 GAIN x1,000 SWEEP 1V x1 YCbCr A SWEEP V V SWEEP 1V SWEEP MAG X1 FIELD FIELD1 E BLANKING REMOVE E INPUT SELECT A up menu

10. Video Signal Waveform Display

V SWEEP = 2V 1920x1080/59.94I YCbCr(422) 10bit HD SDI A TIME: 17:20:40 GAIN x1.000 SWEEP 2V x1 YCbCr SWEEP V V SWEEP 2V SWEEP MAG X1 BLANKING REMOVE INPUT SELECT A up menu

Figure 10-17 Selecting the field display format

Furthermore, when the input signal is interlace or segmented frame and F•2 V SWEEP is set to 1V, to select which field is displayed, follow the procedure below.

Procedure

Leader LV5600 - Video Signal Waveform Display - 2

10.5.4 Selecting the Horizontal Magnification

To select the horizontal magnification, follow the procedure below. The magnifications that you can select vary as shown below depending on settings such as COLOR MATRIX.

[See also] COLOR MATRIX → section 10.8.1, "Selecting the Color Matrix."

You cannot set this when external sync signal waveform display is in use. This is fixed to X1.

Table 10-2 Horizontal magnifications

F•1 SWEEPCOLOR MATRIXF•2 H SWEEPX1X10X20X40ACTIVEBLANK
H YCbCr, GBR, RGB1HYYYNYY
2HYYYNNY
COMPOSITE-YYYNY
V--YNYYNN

(Yes: Settable. No: Not settable.)

Procedure

WFM → F•3 SWEEP → F•3 SWEEP MAG: X1 / X10 / X20 / X40 / ACTIVE / BLANK

10. Video Signal Waveform Display

Settings

X1:The video signal waveforms are displayed so that they fit on the screen.
X10:The video signal waveforms are magnified from the center of the display to 10 times the size of X1.
X20:The video signal waveforms are magnified from the center of the display to 20 times the size of X1.
X40:The video signal waveforms are magnified from the center of the display to 40 times the size of X1.
ACTIVE:Everything but the video signal waveform blanking interval is magnified.
BLANK:The video signal waveform blanking interval is magnified.The vertical blanking interval is also displayed on the vector display.

SWEEP MAG = X1
Leader LV5600 - Video Signal Waveform Display - 1

line | Event | Value | |-------|-------| | Sweep H | 100 | | H SWEEP 1H | 90 | | SWEEP MAG X1 | 70 | | BlankING REMOVE | 60 | | INPUT SELECT A | 50 | | up menu | 45 |

SWEEP MAG = X10
Leader LV5600 - Video Signal Waveform Display - 2

line | Time | Value | | -------- | ----- | | Start | 60 | | Mid | 60 | | End | 90 |

10. Video Signal Waveform Display

SWEEP MAG = ACTIVE
Leader LV5600 - Video Signal Waveform Display - 1

line | Event | Value | |-------|-------| | Sweep | 100 | | H SWEEP | 95 | | Sweep MAG ACTIVE | 75 | | BlankING REMOVE | 60 | | INPUT SELECT A | 50 | | up menu | 50 |

SWEEP MAG = BLANK
1920x1080/59.341 YCbCr(422) 10s t HD SDI A TIME: 09:02:35 GAIN x1.000 SWEEP 1H BLANK YCbCr Sweep H H Sweep 1H Sweep MAG BLANK BlankING REMOVE INPUT SELECT A up menu

Figure 10-18 Horizontal magnifications

10. Video Signal Waveform Display

10.5.5 Displaying the Blanking Interval

To set how the waveforms in the blanking interval are displayed, follow the procedure below. If a setting other than REMOVE is selected, the vertical blanking interval is also displayed on the vector display.

[See also] COLOR MATRIX → section 10.8.1, "Selecting the Color Matrix."

You cannot set this when external sync signal waveform display is in use.

Procedure

WFM → F•3 SWEEP → F•5 BLANKING: REMOVE / V VIEW / H VIEW / ALL VIEW

Settings

REMOVE: Only the active interval is displayed.

V VIEW: The active interval and the vertical blanking interval are displayed.

H VIEW: The active interval and the horizontal blanking interval are displayed.

This option cannot be selected when COLOR MATRIX is set to COMPOSITE.

ALL VIEW: The entire input signal is displayed.

This option cannot be selected when COLOR MATRIX is set to COMPOSITE.

BLANKING = ALL VIEW

Leader LV5600 - Displaying the Blanking Interval - 2

line | Time | Value | | ---------- | ----- | | 09:03:29 | 100 |

Figure 10-19 Displaying blanking intervals

10. Video Signal Waveform Display

10.6 Configuring the Cursor Settings

To configure the cursor settings, press F•4 CURSOR on the WFM menu.

Leader LV5600 - Configuring the Cursor Settings - 1

flowchart
graph LR
    A["WFM → F•4"] --> B["CURSOR →"]
    B --> C["F1 CURSOR BOTH"]
    C --> D["F2 XY SELECT Y"]
    D --> E["F3 Y UNIT %"]
    E --> F["F4 FD VALUE REF"]
    F --> G["F5 CURSOR VALUE OFF"]
    G --> H["F6 INPUT SELECT A"]
    H --> I["F7 up menu"]
    subgraph F-1
        J["F·1"]
        K["F·2"]
        L["F·3"]
        M["F·4"]
        N["F·5"]
        O["F·6"]
        P["F·7"]
    end

Figure 10-20 CURSOR menu

10.6.1 Turning Cursors On and Off

To turn cursors on and off, follow the procedure shown below.

The REF cursor is displayed in blue, and the DELTA cursor is displayed in green. The value of DELTA - REF appears as a measured value in the lower right of the screen. (When F•3 Y UNIT is set to DEC or HEX, absolute values are displayed.)

0If BOTH is selected, the X-axis cursors and Y-axis cursors are displayed simultaneously.

Procedure

WFM → F•4 CURSOR → F•1 CURSOR: SINGLE / BOTH / OFF

10.6.2 Selecting the Cursor

To select the X (time measurement) or Y (amplitude measurement) cursor, follow the procedure below.

If F•1 CURSOR is set to BOTH, select the cursor to move here.

Procedure

WFM → F•4 CURSOR → F•2 XY SELECT: X / Y

XY SELECT = X

Leader LV5600 - Selecting the Cursor - 1

line | GAIN x1,000 | SWEEP 1H x1 | YCbCr(422) 10bit HD | | ----------- | ----------- | ------------------- | | 19.475 | | |

10. Video Signal Waveform Display

Leader LV5600 - Video Signal Waveform Display - 1

line | Metric | Value | |--------|-------| | CURSOR | 1920x1080/59.941 YCbCr(422) 10bit HD | | SINGLE | 1920x1080/59.941 YCbCr(422) 10bit HD | | Y SELECT | 1920x1080/59.941 YCbCr(422) 10bit HD | | Y UNIT | 1920x1080/59.941 YCbCr(422) 10bit HD | | FD VALUE TRACK | 1920x1080/59.941 YCbCr(422) 10bit HD | | CURSOR VALUE OFF | 1920x1080/59.941 YCbCr(422) 10bit HD | | INPUT SELECT A | 1920x1080/59.941 YCbCr(422) 10bit HD | | up menu | 1920x1080/59.941 YCbCr(422) 10bit HD |

Figure 10-21 Selecting the cursor

10.6.3 Selecting the Y-Axis Measurement Unit

When F•2 XY SELECT is set to Y, to select the Y-axis cursor measurement unit, follow the procedure below.

When COLOR MATRIX is set to YCbCr, GBR, or RGB, the default value is %.

[See also] COLOR MATRIX → section 10.8.1, "Selecting the Color Matrix."

Procedure

WFM → F•4CURSOR → F•3Y UNIT: mV / % / R% / DEC / HEX / HDR

Settings

mV:The measurement unit is volts.
%:The measurement unit is percentage.When the composite display format is NTSC, 714.3 mV is 100 %. When the composite display format is PAL, 700 mV is 100 %.
R%:The amplitude will be measured as a percentage of the amplitude at the time when you pressed F•5 REF SET.
DEC:Values are displayed in decimal with 0 to 100 % expressed as 64 to 940.This option cannot be selected when COLOR MATRIX is set to COMPOSITE. CBCR signal measurement is not supported.
HEX:Values are displayed in hexadecimal with 0 to 100 % expressed as 040 to 3AC.This option cannot be selected when COLOR MATRIX is set to COMPOSITE. CBCR signal measurement is not supported.
HDR: Values are displayed as a percentage or cd/m 2 .You can select this option when SER23 is installed and when HDR signals are being measured.For details, see section 14.1.4, “Cursor Display.”

10.6.4 Selecting the X-Axis Measurement Unit

When F•2 XY SELECT is set to X, to select the X-axis cursor measurement unit, follow the procedure below.

Procedure

WFMF•4CURSOR →F•3X UNIT: sec / Hz

Settings

sec:The measurement unit is seconds.
Hz:The measurement unit is frequency, with the length of one period set to the distance between the two cursors.

10.6.5 Moving the Cursors

To move a cursor, follow the procedure shown below to select a cursor. Then, move the cursor by turning the function dial (F•D). Triangles appear on both ends of the selected cursor.

You can also select a cursor by pressing the function dial (F•D). Each time you press the function dial (F•D), the selected cursor switches from REF, to DELTA, to TRACK, and then back to REF.

Procedure

WFMF•4CURSOR →F•4FD VALUE: REF / DELTA / TRACK

10.6.6 Turning the Cursor Value Display On and Off

To display cursor values, follow the procedure shown below (except when F•3 Y UNIT is set to R%).

The display unit is the unit specified with F•3 Y UNIT or F•3 X UNIT.

If F•1 CURSOR is set to BOTH, the value is displayed on the cursor selected with F•2 XY SELECT.

Procedure

WFMF•4CURSOR →F•5CURSOR VALUE: ON / OFF

10. Video Signal Waveform Display

CURSOR VALUE = ON
Leader LV5600 - Video Signal Waveform Display - 1

line | Time | Value | | ---------- | ----- | | 09:11:00 | 88.5% | | | 14.2% |

Figure 10-22 Turning the cursor value display on and off

10. Video Signal Waveform Display

10.7 Configuring the Line Selection Settings

To configure the line selection settings, press F•5 LINE SELECT on the WFM menu.

Leader LV5600 - Configuring the Line Selection Settings - 1

flowchart
graph LR
    A["WFM"] --> B["F•5"]
    B --> C["LINE SELECT"]
    C --> D["F1 LINE SELECT ON"]
    D --> E["F2 FIELD FRAME"]
    E --> F["F3"]
    F --> G["F4"]
    G --> H["F5"]
    H --> I["F6 INPUT SELECT A"]
    I --> J["F7 up menu"]
    K["F·1"] --> L["F·2"]
    L --> M["F·3"]
    M --> N["F·4"]
    N --> O["F·5"]
    O --> P["F·6"]
    P --> Q["F·7"]

Figure 10-23 LINE SELECT menu

10.7.1 Turning Line Selection On and Off

To display the vector of the selected line, follow the procedure below. You can use the function dial (F•D) to select a line. The number of the selected line appears in the lower left of the screen.

Changing this setting will also change the vector-display and picture-display line selection settings.

When SWEEP is set to V, this is fixed at OFF.

When CINELITE ADVANCE is set to on, CINELITE appears.

[See also] SWEEP → 10.5.1, "Selecting the Sweep Method," CINELITE ADVANCE → 13.6.8, "Displaying Link Markers"

You cannot set this when external sync signal waveform display is in use. This is fixed to OFF.

Procedure

WFM → F•5 LINE SELECT → F•1 LINE SELECT: ON / OFF / CINELITE

10. Video Signal Waveform Display

LINE SELECT = ON
Leader LV5600 - Video Signal Waveform Display - 1

line | Time (s) | Value | |----------|-------| | Start | 0 | | 0 | 15 | | 10 | 40 | | 20 | 75 | | 30 | 70 | | 40 | 60 | | 50 | 55 | | 60 | 20 | | 70 | 15 | | 80 | 40 | | 90 | 50 | | 100 | 50 | | 110 | 15 | | 120 | 60 | | 130 | 20 | | 140 | 80 | | 150 | 40 | | 160 | 90 | | 170 | 50 | | 180 | 50 | | 190 | 55 | | 200 | 15 | | 210 | 85 | | 220 | 90 | | 230 | 45 | | End | 50 |

LINE SELECT = OFF
Leader LV5600 - Video Signal Waveform Display - 2

line | Time | Value | | -------- | ----- | | Start | 0 | | Low | 15 | | Mid | 75 | | High | 100 | | End | 50 |

Figure 10-24 Turning line selection on and off

10.7.2 Setting the Line Selection Range

When F•1 LINE SELECT is set to ON and the input signal format is interlaced or segmented frame, to set the line selection range, follow the procedure below.

Changing this setting will also change the selected line on the video-signal-waveform, picture, and status (data dump) displays.

Procedure

VECTF•3LINE SEL →F•2FIELD: FIELD1 / FIELD2 / FRAME

Settings

FIELD1:A line from field 1 can be selected. (Example: 1 to 563)
FIELD2:A line from field 2 can be selected. (Example: 564 to 1125)

FRAME: All lines can be selected. (Example: 1 to 1125)

10. Video Signal Waveform Display

10.8 Configuring the Color System Settings

To configure the color system settings, press F•7 COLOR SYSTEM on the WFM menu.

Leader LV5600 - Configuring the Color System Settings - 1

flowchart
graph LR
    A["WFM → F•7"] --> B["COLOR SYSTEM →"]
    B --> C["F1 COLOR MATRIX GBR"]
    C --> D["F2 YGBR OFF"]
    D --> E["F3 COMPOSITE FORMAT AUTO"]
    E --> F["F4"]
    F --> G["F5"]
    G --> H["F6 INPUT SELECT A"]
    H --> I["F7 up menu"]
    I --> J["F•1"]
    J --> K["F•2"]
    K --> L["F•3"]
    L --> M["F•4"]
    M --> N["F•5"]
    N --> O["F•6"]
    O --> P["F•7"]

Figure 10-25 COLOR SYSTEM menu

You cannot set these when external sync signal waveform display is in use.

10.8.1 Selecting the Color Matrix

The instrument performs a matrix conversion on an input signal to convert it into a GBR, RGB or pseudo-composite signal. To select the waveform display format, follow the procedure below. The selected display format is indicated in the lower right of the display.

Procedure

WFM → F•7 COLOR SYSTEM → F•1 COLOR MATRIX: YCbCr / GBR / RGB / COMPOSITE

Settings

YCbCr: The YC BCR signal is displayed.

This setting cannot be selected when the input signal is RGB.

GBR: The input signal is converted into a GBR signal and displayed.

RGB: The input signal is converted into a RGB signal and displayed.

COMPOSITE:

The input signal is converted into a pseudo NTSC or PAL composite signal and displayed.

• Color burst frequencies do not match those of PAL and NTSC.

- Color burst and sync signal widths and locations are different from those of PAL and NTSC.

- The signal bandwidth is that of the original signal.

COLOR MATRIX = YCbCr

Leader LV5600 - Selecting the Color Matrix - 2

line | Time | Value | |---|---| | 09:18:23 | 100 | | 10:00 | 95 | | 11:00 | 80 | | 12:00 | 70 | | 13:00 | 30 | | 14:00 | 25 | | 15:00 | 20 | | 16:00 | 15 | | 17:00 | 50 | | 18:00 | 65 | | 19:00 | 15 | | 20:00 | 90 | | 21:00 | 40 | | 22:00 | 100 | | 23:00 | 50 | | 24:00 | 55 | | 25:00 | 5 | | 26:00 | 95 | | 27:00 | 95 | | 28:00 | 45 | | 29:00 | 50 |

10. Video Signal Waveform Display

COLOR MATRIX = GBR
Leader LV5600 - Video Signal Waveform Display - 1

line SDI A | Channel | Value | | :--- | :--- | | COLOR MATRIX CBR | 100 | | YGBR OFF | 100 | | COMPOSITE FORMAT AUTO | 100 | | INPUT SELECT A | 100 | | up menu | 100 |

COLOR MATRIX = RGB
1920x1080/58.94I YCbCr(422) 10bit HD SDI A TIME: 09:20:49 GAIN x1.000 SWEEP 1H x1 RGB COLOR MATRIX RGB YRGB OFF COMPOSITE FORMAT AUTO INPUT SELECT A up menu

COLOR MATRIX = COMPOSITE
Leader LV5600 - Video Signal Waveform Display - 3

bar 1920x1080/59.941 YCbCr(422) 10bit HD SDI A TIME: 09:21:39 GAIN x1.000 SWEEP TH x1 COMPOSITE COLOR MATRIX COMPOSITE 2 3 4 SETUP 5 6 INPUT SELECT A 7 up menu

Figure 10-26 Selecting the color matrix

10. Video Signal Waveform Display

10.8.2 Turning the Luminance Signal On and Off

When F•1 COLOR MATRIX is set to GBR or RGB, to turn the luminance signal (Y) on and off, follow the procedure below.

Procedure

WFM → F•7 COLOR SYSTEM → F•2 YGBR: ON / OFF → F•2 YRGB: ON / OFF

YGBR = ON

Leader LV5600 - Turning the Luminance Signal On and Off - 2

line | Time | Value | |---|---| | 0 | 100 | | 1 | 95 | | 2 | 80 | | 3 | 70 | | 4 | 30 | | 5 | 20 | | 6 | 10 | | 7 | 5 | | 8 | 0 | | 9 | 10 | | 10 | 20 | | 11 | 30 | | 12 | 40 | | 13 | 50 | | 14 | 60 | | 15 | 70 | | 16 | 80 | | 17 | 90 | | 18 | 100 | | 19 | 100 | | 20 | 100 | | 21 | 100 | | 22 | 100 | | 23 | 100 | | 24 | 100 | | 25 | 100 | | 26 | 100 | | 27 | 100 | | 28 | 100 | | 29 | 100 | | 30 | 100 | | 31 | 100 | | 32 | 100 | | 33 | 100 | | 34 | 100 |

Figure 10-27 Turning the luminance signal on and off

10.8.3 Selecting the Composite Display Format

To select the composite display format, follow the procedure below.

Procedure

WFM → F•7 COLOR SYSTEM → F•4 COMPOSITE FORMAT: AUTO / NTSC / PAL

Settings

AUTO: When the input signal frame rate is 25 Hz or 50 Hz, the format is PAL. Otherwise, the format is NTSC.

NTSC: The format is NTSC. The scale is fixed to percentage.

PAL: The format is PAL. The scale is fixed to V.

10. Video Signal Waveform Display

10.8.4 Selecting the Setup Level

When F•1 COLOR MATRIX is set to COMPOSITE, to select the setup level, follow the procedure below.

This menu does not appear if the composite display format is PAL.

Procedure

WFM → F•7 COLOR SYSTEM → F•5 SETUP: 0% / 7.5%

SETUP = 7.5%

Leader LV5600 - Selecting the Setup Level - 1

bar | Time | Value | |---|---| | 1920x1080/59.94I YCbCr(422) 10bit HD | 1920x1080/59.94I YCbCr(422) 10bit HD | | GAIN x1,000 SWEEP 1H x1 | COMPOSITE | | COMPOSITE FORMAT AUTO | 7.5% | | INPUT SELECT A | up menu | | TIME: 09:23:33 |

Figure 10-28 Selecting the setup level

10.9 Displaying the External Sync Signal Waveform

When F•1 EXTERNAL SYNC is set to ON on the WFM INTEN/CONFIG menu, the external sync signal waveform and the EXTERNAL SYNC menu appear.

When SDI System is set to 2K SD/HD/3G-A/3G-B-DL on the SYS menu, the external sync signal waveform can be displayed.

[See also] SDI System → 7.1.1, "Configuring the Input System."

Leader LV5600 - Displaying the External Sync Signal Waveform - 1

flowchart
graph LR
    A["WFM"] --> B["F•1"]
    B --> C["WFM INTEN/CONFIG"] --> D["F•1"]
    D --> E["EXTERNAL SYNC"] --> F["F1 EXTERNAL SYNC ON"]
    F --> G["F2"]
    G --> H["F3 EXT.SYNC INTENSITY θ"]
    H --> I["F4 EXT.SYNC COLOR WHITE"]
    I --> J["F5 WFM SCALE"]
    J --> K["F6 INPUT SELECT A"]
    K --> L["F7 up menu"]
    style A fill:#f9f,stroke:#333
    style L fill:#f9f,stroke:#333

Figure 10-29 EXTERNAL SYNC menu

10.9.1 Adjusting the Waveform Intensity

To adjust the video signal waveform intensity, follow the procedure below. Press the function dial (F•D) to return the setting to its default value (0).

Procedure

WFM → F•1 WFM INTEN/CONFIG → F•3 EXT.SYNC INTENSITY: -128 - 0 - 127

10.9.2 Selecting the Waveform Color

To select the external sync signal waveform color, follow the procedure below.

Procedure

WFM → F•1 WFM INTEN/CONFIG → F•4 EXT.SYNC COLOR: WHITE / YELLOW / CYAN / GREEN / MAGENTA / RED / BLUE / MULTI

10.9.3 Adjusting the Scale Intensity

To configure the scale, press F•5 WFM SCALE on the WFM INTEN/CONFIG menu.

Leader LV5600 - Adjusting the Scale Intensity - 1

flowchart
graph LR
    A["WFM"] --> B["F•1"]
    B --> C["WFM INTEN/CONFIG"]
    C --> D["F•5"]
    D --> E["WFM SCALE"]
    F["F1 SCALE INTEN 4"] --> G["F2 SCALE COLOR YELLOW"]
    G --> H["F3 SCALE SETTING"]
    H --> I["F4"]
    I --> J["F5"]
    J --> K["F6 INPUT SELECT A"]
    K --> L["F7 up menu"]

Figure 10-30 WFM SCALE menu

To adjust the scale intensity, follow the procedure below.

Press the function dial (F•D) to return the setting to its default value (4).

Procedure

WFM → F•1 WFM INTEN/CONFIG → F•5 WFM SCALE → F•1 SCALE INTEN: -8 - 4 - 7

10. Video Signal Waveform Display

10.9.4 Selecting the Scale Color

To select the scale color, follow the procedure below.

Procedure

WFM → F•1 WFM INTEN/CONFIG → F•5 WFM SCALE → F•2 SCALE COLOR: WHITE / YELLOW / CYAN / GREEN / MAGENTA / RED / BLUE 

10.9.5 Selecting the Scale Unit

When the external sync signal is NTSC, this is fixed to %. When the external sync signal is HD or PAL, this is fixed to V.

Procedure

WFM → F•1 WFM INTEN/CONFIG → F•5 WFM SCALE → F•3 SCALE SETTING
→ F•1 SCALE UNIT: % (when the external sync signal is NTSC)
→ F•1 SCALE UNIT: V (when the external sync signal is HD or PAL) 

10.9.6 Displaying the Scale

To turn the scale display on and off, follow the procedure shown below.

Procedure

WFM → F•1 WFM INTEN/CONFIG → F•5 WFM SCALE → F•3 SCALE SETTING → F•3
SCALE DISPLAY: ON / OFF 

11. VECTOR DISPLAY

11. VECTOR DISPLAY

To display vectors, press VECT, F•1 VECT INTEN/CONFIG, and then F•1 VECTOR DISPLAY to select VECTOR.

When VECTOR DISPLAY is set to 5BAR, see 11.8, "5-Bar Display," for the explanation. When set to HISTGRAM, see 11.9, "Histogram Display," for the explanation. When VECTOR DISPLAY is set to CIE, see 12, "CIE Chromaticity Diagram Display," for the explanation.

1920x1080/59.94I YCbCr(422) 10bit HD SDI A TIME: 11:21:21 COLORIMETRY BT.709 Y1 R Mg B G Cy GAIN x1.000 COMPONENT VECT INTEN/CONFIG VECTOR SCALE VECTOR GAIN MARKER OFF LINE SELECT INPUT SELECT A COLOR SYSTEM

Figure 11-1 Vector display

- Vectors

Component signal vector displays are X-Y displays based on CB (horizontal) and CR (vertical). The vector display scale has the following qualities.

Frame: ±5% of the full scale value 0.7 V (during component display) ±3% of the full scale value 0.7 V (during pseudo-composite display)

Circle: +20 % with respect to green

- Blanking interval

Normally, blanking interval is not displayed with vectors, but if SWEEP MAG is set to BLANK on the WFM menu or BLANKING is set to REMOVE, it is displayed.

- Colorimetry

The colorimetry selected on the SYS menu is displayed in cyan in the upper right of the screen. However, for 3G(DL)-4K and 3G(QL), the current applied colorimetry is displayed in yellow if the colorimetry information of all links specified by the payload ID are not matched.

When the colorimetry alarm on the SYS menu is set to on and a colorimetry different from the one specified is received, the alarm is indicated in red.

[See also] Colorimetry alarm → 7.1.4, "Setting the Input Format and Format Alarm"

11.1 Operation Key Description

On the LV5600, operation keys other than S-CUT can be controlled from the mouse and touch panel. On the LV7600, keys can be controlled from the panel, mouse, and touch panel. On the vector display, you can press the operation keys to change the following settings. (Some settings may not be changed.) The key LEDs light when the underlined setting is selected. Key assignments can be changed freely on the OPERATION KEY tab.

[See also] OPERATION KEY tab → 7.2.15, "Setting the Operation keys"

Table 11-1 Operation Key Actions

Setting
FORMCOMPONENT / COMPOSITE
OVLAYDisabled
FILTERDisabled
GAINCAL / VARIABLE
MAG (GAIN)X1 / X5 / IQ-MAG
SWEEPDisabled
MAG (SWEEP)Disabled

11.2 Setting the Display and Waveform Intensity

To configure the display and waveform intensity settings, press F•1 VECT INTEN/CONFIG on the VECT menu.

Leader LV5600 - Setting the Display and Waveform Intensity - 1

flowchart
graph LR
    A["VECT"] --> B["F•1"]
    B --> C["VECT INTEN/CONFIG"]
    C --> D["F1 VECTOR DISPLAY VECT"]
    D --> E["F2"]
    E --> F["F3 VECTOR INTENSITY θ"]
    F --> G["F4 VECTOR COLOR WHITE"]
    G --> H["F5"]
    H --> I["F6 INPUT SELECT A"]
    I --> J["F7 up menu"]
    K["F•1"] --> L["F•2"]
    L --> M["F•3"]
    M --> N["F•4"]
    N --> O["F•5"]
    O --> P["F•6"]
    P --> Q["F•7"]

Figure 11-2 VECT INTEN/CONFIG menu

11.2.1 Switching the Display Mode

To select the display mode, follow the procedure below.

Procedure

→ 1 VECT INTEN/CONFIG → 1 VECTOR DISPLAY: VECTOR / 5BAR / HISTGRAM / CIE DIAGRAM

Settings

VECTOR: Shows vectors.

5BAR: Switches to the 5-bar display. For details, see section 11.8, "5-Bar Display."

HISTGRAM: A histogram is displayed. For details, see section 11.9, "Histogram Display."

CIE DIAGRAM: The CIE chromaticity diagram display is shown. For details, see section 12, "CIE Chromaticity Diagram Display."

11. VECTOR DISPLAY

11.2.2 Adjusting the Waveform Intensity

To adjust the vector intensity, follow the procedure below.

Press the function dial (F•D) to return the setting to its default value (0).

Procedure

VECT → F•1 VECT INTEN/CONFIG → F•3 VECTOR INTENSITY: -128 - 0 - 127

11.2.3 Selecting the Waveform Color

To select the vector color, follow the procedure below.

Procedure (a signal other than 3G-B-DS)

VECT → F•1 VECT INTEN/CONFIG → F•2 VECTOR COLOR: WHITE / YELLOW / CYAN / GREEN / MAGENTA / RED / BLUE

Procedure (3G-B-DS)

→ 1 VECT INTEN/CONFIG → 2 VECTOR COLOR

→|F•1|STREAM1 COLOR: WHITE / YELLOW / CYAN / GREEN / MAGENTA / RED / BLUE / MULTI

→ F•2 STREAM2 COLOR: WHITE / YELLOW / CYAN / GREEN / MAGENTA / RED / BLUE / MULTI

11. VECTOR DISPLAY

11.2.4 Configuring the 3G-B-DS Display

When measuring 3G-B-DS, to select the display mode, follow the procedure below.

Procedure

→ 1 VECT INTEN/CONFIG → 5 3G-B-DS DISPLAY: STREAM1 / STREAM2 / MIX / ALIGN

Settings

STREAM1: Stream 1 is displayed.

STREAM2: Stream 2 is displayed.

MIX: Streams 1 and 2 are displayed on top of each other.

ALIGN: Streams 1 and 2 are displayed side by side.

3G-B-DS DISPLAY = MIX

1920x1080/59.941 YCbCr(422) 10bit 3G-B-DS SDI A TIME: 11:31:22 COLORIMETRY BT.709 YI R Mg B G CY GAIN x1.000 COMPONENT VECTOR DISPLAY VECTOR VECTOR INTENSITY 0 VECTOR COLOR 3G-B-DS DISPLAY MIX INPUT SELECT A up menu

3G-B-DS DISPLAY = ALIGN

NOSHI TEMPERATURE YEOH022-TOH: 15.9.05 SDI A TIME: 11:32:12 NOSHI TEMPERATURE YEOH022-TOH: 15.9.05 SDI A TIME: 11:32:12 COLORIMETRY BT.709 YI G Mg B Cy COLORIMETRY BT.709 YI G Mg B Cy GAIN x1,000 COMPONENT GAIN x1,000 COMPONENT VECTOR DISPLAY VECTOR VECTOR INTENSITY 0 VECTOR COLOR 3G-8-DS DISPLAY ALIGN INPUT SELECT A up menu

Figure 11-3 Configuring the 3G-B-DS Display

11.3 Setting the Scale

To configure the scale, use F•2 VECTOR SCALE on the VECT menu.

VECT → F•2 VECTOR SCALE → F1 SCALE INTEN 4 F2 SCALE COLOR YELLOW F3 IQ AXIS OFF F4 VECTOR SCALE AUTO F5 F6 INPUT SELECT A F7 up menu F·1 F·2 F·3 F·4 F·5 F·6 F·7

Figure 11-4 VECTOR SCALE menu

11.3.1 Adjusting the Scale Intensity

To adjust the scale intensity, follow the procedure below.

Press the function dial (F•D) to return the setting to its default value (4).

Procedure

VECT → F•2 VECTOR SCALE → F•1 SCALE INTENSITY: -8 - 4 - 7

11.3.2 Selecting the Scale Color

To select the scale color, follow the procedure below.

Procedure

VECT → F•2 VECTOR SCALE → F•2 SCALE COLOR: WHITE / YELLOW / CYAN / GREEN / MAGENTA / RED / BLUE

11.3.3 Turning the I and Q Axes On and Off

To turn the I and Q axes on and off, follow the procedure below.

This menu item does not appear when VECTOR SCALE is set to DCI or BT.2020.

When the full scale value of 0.7 V is 100 %, the I and Q axes are displayed at the following values.

Table 11-2 Displaying the I and Q axes

I AxisQ Axis
G44.559 %37.056 %
B27.865 %84.085 %
R69.120 %62.417 %

Procedure

VECT → F•2 VECTOR SCALE → F•3 IQ AXIS: ON / OFF

IQ AXIS = ON

1920x1080/58.94I YCbCr(422) 10bit HD SDI A TIME: 11:34:38 COLORIMETRY BT.709 YI R Mg Q B -I G CY GAIN x1.000 COMPONENT SCALE INTEN 4 SCALE COLOR YELLOW IQ AXIS ON VECTOR SCALE AUTO INPUT SELECT A up menu

Figure 11-5 Turning the I and Q axes on and off

11.3.4 Selecting the Scale

When COLOR MATRIX is set to COMPONENT, follow the procedure below to select the scale type.

[See also] COLOR MATRIX → section 11.7.1, "Selecting the Color Matrix."

Procedure

VECTF•2VECTOR SCALEF•4VECTOR SCALE: AUTO / BT.601 / BT.709 / DCI / BT.2020

Settings

AUTO:A scale for the colorimetry selected on the SYS menu is displayed.
BT.601:A scale defined in ITU-R BT.601 is displayed. When the input signal is SD and a 100 % color bar signal is being applied, the peak levels match the ends of the scale.
BT.709:A scale defined in ITU-R BT.709 is displayed. When the input signal is HD and a 100 % color bar signal is being applied, the peak levels match the ends of the scale.

DCI: A scale defined in DCI is displayed.

BT.2020:A scale defined in ITU-R BT.2020 is displayed. When the input signal is 4K, the division transmission system is 2 sample interleave, and a 100% color bar signal is being applied, the peak levels match the ends of the scale.

11.4 Setting the Gain

To set the gain, press F•3 VECTOR GAIN on the VECT menu.

Leader LV5600 - Setting the Gain - 1

flowchart
graph LR
    A["VECT → F·3"] --> B["VECTOR GAIN →"]
    B --> C["F1 GAIN VARIABLE CAL"]
    C --> D["F2 GAIN MAG X1"]
    D --> E["F3"]
    E --> F["F4"]
    F --> G["F5"]
    G --> H["F6 INPUT SELECT A"]
    H --> I["F7 up menu"]
    subgraph Function call
        J["F·1"] --> K["F·2"] --> L["F·3"] --> M["F·4"] --> N["F·5"] --> O["F·6"] --> P["F·7"]
    end

Figure 11-6 VECTOR GAIN menu

11.4.1 Setting the Variable Gain

To set the variable vector gain, follow the procedure below.

Procedure

VECT → F•3VECTOR GAIN → F•1GAIN VARIABLE: CAL / VARIABLE

Settings

CAL: The waveform gain is fixed.

VARIABLE:You can adjust the waveform gain by turning the function dial (F•D). Press the function dial (F•D) to return the setting to its default value.The adjusted gain value (the combination of F•1 GAIN VARIABLE and F•2 GAIN MAG) appears in the lower right of the screen.0.200 - 1.000 - 2.000 (for X1)1.000 - 5.000 - 10.000 (for X5)0.620 - 3.120 - 6.240 (not IQ-MAG or SD, component display)0.580 - 2.920 - 5.840 (IQ-MAG or SD, composite display)0.570 - 2.850 - 5.700 (not IQ-MAG or SD, for pseudo-composite display)0.520 - 2.630 - 5.260 (IQ-MAG or SD, for pseudo-composite display)

11.4.2 Selecting the Fixed Gain

To select the fixed vector gain, follow the procedure below.

Procedure

VECTF•3VECTOR GAIN →F•2GAIN MAG: X1 / X5 / IQ-MAG

Settings

X1:Vectors are displayed at ×1 magnification.
X5:Vectors are displayed at ×5 magnification.
IQ-MAG:Vectors are displayed using the following magnifications.×3.12 (for signals other than SD during component display; magnification that causes the I signal of the multiformat colorbar to lie on the circumference of the scale)×2.85 (for signals other than SD during pseudo-composite display; magnification that causes the I signal of the multiformat colorbar, which has gone through pseudo-composite conversion, to lie on the circumference of the scale)×2.92 (for SD signals during component display; magnification that causes

11. VECTOR DISPLAY

the amplitude to lie on the circumference of the scale when the burst signal of the composite vector display is converted into component signals) ×2.63 (for SD signals during pseudo-composite display; magnification that causes the -I and Q signals of the SMPTE colorbar, which has gone through pseudo-composite conversion, to lie on the circumference of the scale)

11.5 Displaying the Marker

To display a marker on the vector display, follow the procedure below.

You can move the marker horizontally using the H POS knob and vertically using the V POS knob. The measured values are displayed in the lower right of the display. Press the H POS knob to move the marker to the Cb = 0.0% position. Press the V POS knob to move the marker to the Cr = 0.0% position.

Measured values are displayed using the following references: Cb at position B = 100.0% and Cr at position R = 100.0%. The distance from the center is expressed as "d," and hue is expressed as "deg."

Normally, the marker is displayed in green. When if falls outside the display area, it blinks in red. If this occurs, "OVER" appears above the measured values.

Procedure
Leader LV5600 - Displaying the Marker - 1

1920x1080/59.941 YCbCr(422) 10bit HD SDI A TIME: 11:37:18 COLORIMETRY BT.709 Y1 R Mg B G Cy COMPONENT d = 64.1% deg = 131° Cb = -41.9% Cr = 48.6% GAIN x1.000 VECT INTER/CONFIG VECTOR SCALE VECTOR GAIN MARKER ON LINE SELECT INPUT SELECT A COLOR SYSTEM

Figure 11-7 Displaying the vector marker

11.6 Configuring the Line Selection Settings

To configure the line selection settings, press F•5 LINE SELECT on the VECT menu.

Leader LV5600 - Configuring the Line Selection Settings - 1

flowchart
graph LR
    A["VECT"] --> B["F•5"]
    B --> C["LINE SELECT"]
    C --> D["F1 LINE SELECT ON"]
    D --> E["F2 FIELD FRAME"]
    E --> F["F3"]
    F --> G["F4"]
    G --> H["F5"]
    H --> I["F6 INPUT SELECT A"]
    I --> J["F7 up menu"]
    K["F·1"] --> L["F·2"]
    L --> M["F·3"]
    M --> N["F·4"]
    N --> O["F·5"]
    O --> P["F·6"]
    P --> Q["F·7"]

Figure 11-8 LINE SELECT menu

11.6.1 Turning Line Selection On and Off

To display the vector of the selected line, follow the procedure below. You can use the function dial (F•D) to select a line. The number of the selected line appears in the lower left of the screen.

Changing this setting will also change the video-signal-waveform-display and picture-display line selection settings.

This menu item does not appear when SWEEP on the WFM menu is set to V.

[See also] SWEEP → Section 10.5.1, "Selecting the Sweep Method"

Procedure

→ 5 LINE SELECT → 1 LINE SELECT: ON / OFF

LINE SELECT = ON

1920x1080/58.94I YCbCr(422) 10bit HD SDI A TIME: 11:39:43 COLORIMETRY BT.709 YI R Mg B G Cy GAIN x1.000 LINE No: 342 COMPONENT LINE SELECT ON FIELD FRAME INPUT SELECT A up menu

11. VECTOR DISPLAY

LINE SELECT = OFF

Leader LV5600 - VECTOR DISPLAY - 1

radar | Element | Value | |---------|-------| | R | 100 | | Mg | 100 | | YI | 100 | | B | 100 | | G | 100 | | Cy | 100 |

Figure 11-9 Turning line selection on and off

11.6.2 Setting the Line Selection Range

When F•1 LINE SELECT is set to ON and the input signal format is interlaced or segmented frame, to set the line selection range, follow the procedure below.

Changing this setting will also change the selected line on the video-signal-waveform, picture, and status (data dump) displays.

Procedure

VECT → F•5 LINE SELECT → F•2 FIELD: FIELD1 / FIELD2 / FRAME

Settings

FIELD1: A line from field 1 can be selected. (Example: 1 to 563)

FIELD2: A line from field 2 can be selected. (Example: 564 to 1125)

FRAME: All lines can be selected. (Example: 1 to 1125)

11. VECTOR DISPLAY

11.7 Configuring the Color System Settings

To configure the color system settings, press F•7 COLOR SYSTEM on the VECT menu.

Leader LV5600 - Configuring the Color System Settings - 1

flowchart
graph LR
    A["VECT → F•7"] --> B["COLOR SYSTEM →"]
    B --> C["F1 COLOR MATRIX GBR"]
    C --> D["F2 YGBR OFF"]
    D --> E["F3 COMPOSITE FORMAT AUTO"]
    E --> F["F4"]
    F --> G["F5"]
    G --> H["F6 INPUT SELECT A"]
    H --> I["F7 up menu"]
    subgraph Function Blocks
        J["F•1"] --> K["F•2"] --> L["F•3"] --> M["F•4"] --> N["F•5"] --> O["F•6"] --> P["F•7"]
    end

Figure 11-10 COLOR SYSTEM menu

11.7.1 Selecting the Color Matrix

To select the vector display format, follow the procedure below. The selected display format is indicated in the lower right of the display.

Procedure

VECT → F•7 COLOR SYSTEM → F•1 COLOR MATRIX: COMPONENT / COMPOSITE

Settings

COMPONENT: The component chrominance signal is displayed on the X and Y axes. COMPOSITE: The component signal is converted into a pseudo-composite signal, and the pseudo-composite signal's chrominance signal is displayed on the X and Y axes.

COLOR MATRIX = COMPONENT

1920x1080/58.941 YCbCr(422) 10bit HD SDI A TIME: 11:44:01 COLORIMETRY BT.709 YI R Mg B G Cy GAIN x1.000 COMPONENT COLOR MATRIX COMPONENT F2 COLOR BAR 100% COMPOSITE FORMAT AUTO F3 E S INPUT SELECT A up menu

11. VECTOR DISPLAY

COLOR MATRIX = COMPOSITE
1920x1080/58.941 YCbCr(422) 10bit HD SDI A TIME: 11:44:45 COLORIMETRY BT.709 GAIN x1.000 COMPOSITE COLOR MATRIX COMPOSITE F2 COLOR BAR 100% COMPOSITE FORMAT AUTO SETUP 7.5% INPUT SELECT A up menu

Figure 11-11 Selecting the color matrix

11.7.2 Displaying a Scale for 75% Color Bars

To display a scale for 75 % color bars, follow the procedure below.

Procedure

VECT → F•7 COLOR SYSTEM → F•2 COLOR BAR: 100% / 75%

Settings

100%:A scale on which a 100% color bar signal input is mapped to the peak level is displayed.
75%:A scale on which a 75% color bar signal input is mapped to the peak level is displayed.

COLOR BAR = 75%
1920x1080/59.941 YCbCr(422) 10bit HD SDI A TIME: 11:46:13 COLORIMETRY BT.709 YI R Mg B G Cy GAIN x1.000 COMPONENT COLOR MATRIX COMPONENT #1 COLOR BAR 75% COMPOSITE FORMAT AUTO #2 #3 INPUT SELECT A up menu

Figure 11-12 Displaying a scale for 75 % color bars (when receiving a 75 % intensity color bar signal)

11. VECTOR DISPLAY

11.7.3 Selecting the Composite Display Format

To select the composite display format, follow the procedure below.

Procedure

VECT → F•7 COLOR SYSTEM → F•3 COMPOSITE FORMAT: AUTO / NTSC / PAL

Settings

AUTO: When the input signal frame rate is 25 Hz or 50 Hz, the format is PAL. Otherwise, the format is NTSC.

NTSC: The format is NTSC.

PAL: The format is PAL.

COMPOSITE FORMAT = NTSC

1920x1080/59.94I YCbCr(422) 10bit HD SDI A TIME: 11:47:52 COLORIMETRY BT.709 GAIN x1.000 COMPOSITE COLOR MATRIX COMPOSITE S COLOR BAR 100% F COMPOSITE FORMAT NTSC SETUP 7.5% S INPUT SELECT A up menu

COMPOSITE FORMAT = PAL

Leader LV5600 - Selecting the Composite Display Format - 3

radar | Component | Value | |---|---| | g | 25 | | R | 30 | | Mg | 20 | | U | 25 | | b | 20 | | Vl | 25 | | G | 20 | | Cy | 25 | | mg | 20 | | r | 25 | | V | 30 | | Gy | 20 | | CV | 25 | | CMOSITE | 100% | | COMPOSITE | 100% | | FORMAT | 100% | | PAL | 100% | | INPUT SELECT A | 100% | | up menu | 100% | | GAIN x1.000 COMPOSITE | 100% |

Figure 11-13 Selecting the composite display format

11. VECTOR DISPLAY

11.7.4 Selecting the Setup Level

When F•1 COLOR MATRIX is set to COMPOSITE, to select the setup level, follow the procedure below.

This menu does not appear if the composite display format is PAL.

Procedure

→ 7 COLOR SYSTEM → 4 SETUP: 0 % / 7.5 %

11.8 5-Bar Display

To display the 5 bar screen, press VECT, F•1 VECT INTEN/CONFIG, and then F•1 VECTOR DISPLAY to select 5BAR.

In the 5-bar display, the YCBCR signal is converted into a GBR or pseudo-composite signal, and the peak levels of the converted signal's Y, G, B, R, and CMP (composite) components are displayed simultaneously using five bars.

Leader LV5600 - 5-Bar Display - 1

bar 1920x1080/58.94I YCbCr(422) 10bit HD | Category | Value (%) | |---|---| | Y | 100 | | B | -33 | | D | 100 | | R | 100 | | CMP | 135 | | IRE | -33 | TIME: 11:49:54 VECTOR DISPLAY SBAR F2 F3 F4 F5 F6 INPUT SELECT A F7 up menu

Figure 11-14 5-bar display

• Y

Levels that fall outside of the range that you set using Luminance Upper and Luminance Lower on the status menu are displayed in red.

[See also] Luminance Upper and Luminance Lower → 4, "Error Setup 4"

• GBR

Levels that fall outside of the range that you set using Gamut Upper and Gamut Lower on the status menu are displayed in red.

[See also] Gamut Upper/Lower → 16.2.3, "Error Setup 3"

- CMP

Levels that fall outside of the range that you set using Composite Upper and Composite Lower on the status menu are displayed in red.

[See also] Composite Upper/Lower → 16.2.3, "Error Setup 3"

11. VECTOR DISPLAY

Use the VECT menu to configure the 5-bar display settings.

Leader LV5600 - - Menu - 1

flowchart
graph LR
    A["VECT"] --> B["F1 VECT INTEN/CONFIG"]
    B --> C["F2 5BAR SCALE %"]
    C --> D["F3 5BAR SEQUENCE GBR"]
    D --> E["F4"]
    E --> F["F5 LINE SELECT"]
    F --> G["F6 INPUT SELECT A"]
    G --> H["F7"]
    subgraph F-1
        B
        C
        D
        E
        F
        G
        H
    end

Figure 11-15 Vector menu

11.8.1 Selecting the Scale Unit

When VECTOR DISPLAY is set to 5BAR, to select the scale unit, follow the procedure below.

[See also] VECTOR DISPLAY → 11.2.1, "Switching the Display Mode" and 10.8.3, "Selecting the Composite Display Format"

Procedure

VECTF•25BAR SCALE: % / mV / HEX / DEC

Settings

%:The display unit for YGBR is percentage, and the display unit for CMP is IRE.
mV:The display unit is mV. Depending on the composite display format, the scale differs as follows:NTSC: 100 % = 700 mV (YGBR), 100IRE = 714.3 mV (CMP)PAL: 100%(IRE) = 700mV
HEX:YGBR is displayed as a percentage with 0 to 100% expressed as 040 to 3AC.CMP is displayed using IRE.
DEC:YGBR is displayed as a percentage with 0 to 100% expressed as 64 to 940.CMP is displayed using IRE.

5BAR SCALE = %
Leader LV5600 - Selecting the Scale Unit - 1

bar 1920x1080/58.941 YCbCr(422) 10bit HD | Category | Value | |---|---| | Y | 100 | | G | 100 | | B | 100 | | R | 100 | | IRE | -33 | | CMP | 135 | TIME: 11:51:48

5BAR SCALE = mV
Leader LV5600 - Selecting the Scale Unit - 2

bar 1920x1080/58.94I YCbCr(422) 10bit HD | Category | Value | |---|---| | Y | 700 | | G | 700 | | B | 700 | | R | 700 | | X: VECT INTEN/CONFIG | -236 mV | | X: 5BAR SCALE mV | -286 mV | | X: 5BAR SEQUENCE 08R | -236 mV | | X: LINE SELECT | -236 mV | | X: INPUT SELECT A | -236 mV | | SDI A TIME: 11:55:12 CMP YCbCr(422) 10bit HD X: VECT INTEN/CONFIG X: 5BAR SCALE mV X: 5BAR SEQUENCE 08R X: LINE SELECT X: INPUT SELECT A

5BAR SCALE = HEX
Leader LV5600 - Selecting the Scale Unit - 3

bar 1920x1080/58.94I YCbCr(422) 10bit HD | Category | Value | |---|---| | Y | 3AC | | G | 40 HEX | | B | 3AC | | B | 40 HEX | | CMP | 135 | | -33 IRE | -40 | | TIME: 11:56:29

5BAR SCALE = DEC
Leader LV5600 - Selecting the Scale Unit - 4

bar 1820x1080/58.94I YCbCr(422) 10bit HD | Category | Value | |---|---| | Y | 940 | | G | 64 | | B | 940 | | R | 940 | | VECT INTEN/CONFIG | 64 | | 5BAR SCALE DEC | 64 | | 5BAR SEQUENCE GBR | 64 | | LINE SELECT | 64 | | INPUT SELECT A | -33 | | CMP | 135 | TIME: 11:57:29

Figure 11-16 Selecting the scale unit

11.8.2 Selecting the Display Order

To select the 5-bar display order, follow the procedure shown below.

Procedure

VECTF•35BAR SEQUENCE: GBR / RGB

Settings

GBR:From the left, the signals are displayed in this order: Y, G, B, R, CMP.
RGB:From the left, the signals are displayed in this order: Y, R, G, B, CMP.

5BAR SEQUENCE = GBR
Leader LV5600 - Selecting the Display Order - 1

bar 1920x1080/58.94I YCbCr(422) 10bit HD | Category | Value (%) | |---|---| | Y | 100 | | B | 30 | | B | 100 | | R | 100 | | Line Select | -33 | | INPUT Select A | -40 | | CMP | 135 | | IRE | -33 | | VECT INTEN/CONFIG | 0 | | 5BAR SCALE % | 0 | | 5BAR SEQUENCE GBR | 0 | | TIME: 11:59:12

5BAR SEQUENCE = RGB
Leader LV5600 - Selecting the Display Order - 2

bar 1920x1080/59.941 YCbCr(422) 10bit HD | Category | Value (%) | |---|---| | Y | ~30 | | R | ~70 | | G | ~30 | | B | ~80 | | X-axis Label | Category | | VECT INTEN/CONFIG | 0 | | 5BAR SCALE % | 0 | | 5BAR SEQUENCE RGB | 0 | | LINE SELECT | 0 | | INPUT SELECT A | 0 | | TIME: 11:59:59 | 0 |

Figure 11-17 Selecting the display order

11.9 Histogram Display

To display histograms, press VECT, F•1 VECT INTEN/CONFIG, and then F•1 VECTOR DISPLAY to select HISTGRAM.

The histogram display shows the image data distribution by plotting the luminance level and R, G, B levels on the horizontal axis and the number of pixels at each luminance level and R, G, B level on the vertical axis.

If SER23 is installed, you can change the horizontal scale. See section 14.2.1, "Histogram Display."

Leader LV5600 - Histogram Display - 1

line | Time | Value | |------|-------| | 0 | 100 |

Figure 11-18 Histogram Display

- Menu

Use the VECT menu to configure the histogram display settings.

Leader LV5600 - Histogram Display - 2

flowchart
graph LR
    A["VECT"] --> B["F1 VECT INTEN/CONFIG"]
    B --> C["F2"]
    C --> D["F3 HISTOGRAM FORM SINGLE"]
    D --> E["F4 HISTOGRAM SETUP"]
    E --> F["F5"]
    F --> G["F6 INPUT SELECT A"]
    G --> H["F7"]

Figure 11-19 Vector menu

11.9.1 Selecting the Display Format

To select the display format, follow the procedure below.

Procedure

→ 3 HISTGRAM FORM: SINGLE / TILE / ALIGN_H / ALIGN_V

Settings

SINGLE: Luminance, R, G, or B is displayed.

TILE: Luminance, R, G, and B are displayed in tiles.

ALIGN_H: Luminance, R, G, and B are displayed side by side.

ALIGN_V: Luminance, R, G, and B are displayed top to bottom.

11. VECTOR DISPLAY

- When HISTGRAM FORM is TILE

Luminance, R, G, and B are displayed in tiles.

Leader LV5600 - VECTOR DISPLAY - 1

area | Time (s) | SDI A | VECT INTEN/CONFIG | HISTGRAM FORM TILE | INPUT SELECT A | |----------|-------|-------------------|--------------------|----------------| | 0 | 0 | 0 | 0 | 0 | | 50 | 0 | 0 | 0 | 0 | | 100 | 0 | 0 | 0 | 0 | | 150 | 0 | 0 | 0 | 0 | | 200 | 0 | 0 | 0 | 0 | | 250 | 0 | 0 | 0 | 0 | | 300 | 0 | 0 | 0 | 0 | | 350 | 0 | 0 | 0 | 0 | | 400 | 0 | 0 | 0 | 0 | | 450 | 0 | 0 | 0 | 0 | | 500 | 0 | 0 | 0 | 0 | | 550 | 0 | 0 | 0 | 0 | | 600 | 0 | 0 | 0 | 0 | | 650 | 0 | 0 | 0 | 0 | | 700 | 0 | 0 | 0 | 0 | | 750 | 0 | 0 | 0 | 0 | | 800 | 0 | 0 | 0 | 0 | | 850 | 0 | 0 | 0 | 0 | | 900 | 0 | 0 | 0 | 0 | | 950 | 0 | 0 | 0 | 0 | | 1000 | 0 | 0 | 0 | 0 | | 15:40:11 | | | | |

Figure 11-20 Tiled display

- When HISTGRAM FORM is ALIGN-H

Luminance, R, G, and B are displayed side by side.

Leader LV5600 - VECTOR DISPLAY - 2

line | Time | Intensity | | -------- | --------- | | 15:40:52 | Peak |

Figure 11-21 ALIGN_H display

11. VECTOR DISPLAY

- When HISTGRAM FORM is ALIGN-V

Luminance, R, G, and B are displayed top to bottom.

Leader LV5600 - VECTOR DISPLAY - 1

area | Time | VECT INTEN/CONFIG | HISTGRAM FORM ALIGN_V | INPUT SELECT A | |------|-------------------|------------------------|----------------| | 1 | 0 | 0 | 0 | | 2 | 0 | 0 | 0 | | 3 | 0 | 0 | 0 | | 4 | 0 | 0 | 0 | | 5 | 0 | 0 | 0 | | 6 | 0 | 0 | 0 | | 7 | 0 | 0 | 0 |

Figure 11-22 ALIGN_V display

11.9.2 Selecting the Measurement Signal

When HISTGRAM FORM is SINGLE, to select the measurement signal, follow the procedure below. A single signal from luminance, R, G, and B can be turned on.

Procedure

→ 4 HISTGRAM SETUP → 1 Y: ON / OFF → 2 R: ON / OFF → 3 G: ON / OFF → 4 B: ON / OFF

12. CIE Chromaticity Diagram Display

12. CIE CHROMATICITY DIAGRAM DISPLAY

To display the CIE chromaticity diagram, press VECT, F•1 VECT INTEN/CONFIG, and then F•1 VECTOR DISPLAY to select CIE DIAGRAM.

When VECTOR DISPLAY is set to VECT, 5BAR or HISTGRAM, see 11, "CIE Chromaticity Diagram Display," for the explanation.

Leader LV5600 - CIE CHROMATICITY DIAGRAM DISPLAY - 1

heatmap | X | Y | Value | |------|------|-------| | 0.0 | 0.0 | 0.0 | | 0.1 | 0.1 | 0.1 | | 0.2 | 0.2 | 0.2 | | 0.3 | 0.3 | 0.3 | | 0.4 | 0.4 | 0.4 | | 0.5 | 0.5 | 0.5 | | 0.6 | 0.6 | 0.6 | | 0.7 | 0.7 | 0.7 | | 0.8 | 0.8 | 0.8 |

Figure 12-1 CIE chromaticity diagram display

- Colorimetry

The colorimetry selected on the SYS menu is displayed in cyan in the lower right of the screen. However, for 3G(DL)-4K and 3G(QL), the current applied colorimetry is displayed in yellow if the colorimetry information of all links specified by the payload ID are not matched.

12.1 Setting the Scale

To configure the scale, use F•2 CIE DIAGRAM SCALE on the VECT menu.

This menu item does not appear when DISPLAY MODE is set to TEMP.

[See also] DISPLAY MODE → 12.2.1, "Selecting the Display Mode"

VECT → F•2 CIE DIAGRAM SCALE → F1 COLOR B.G. COLOR F2 TRIANGLE1 BT.709 F3 TRIANGLE2 BT.2020 F4 USER TRIANGLE F5 SUB SCALE F6 INPUT SELECT A F7 up menu F·1 F·2 F·3 F·4 F·5 F·6 F·7

Figure 12-2 CIE DIAGRAM SCALE menu

12. CIE Chromaticity Diagram Display

12.1.1 Selecting the Color Scale

To select the horseshoe-shaped color scale, follow the procedure below.

Procedure

VECT → F•2CIE DIAGRAM SCALE → F•1COLOR: B.G. COLOR / B.G. WHITE / B.G. BLACK
Settings
B.G. COLOR:The color scale is displayed. The background is black, and the waveform is displayed according to the luminance level.
B.G. WHITE:The color scale is not displayed. The background is white, and the waveform is displayed according to the picture color.
B.G. BLACK:The color scale is not displayed. The background is black, and the waveform is displayed according to the picture color.

COLOR = B.G. WHITE
Leader LV5600 - Selecting the Color Scale - 1

scatter | Category | Value | | -------------- | ----- | | COLOR | 0.0 | | TRIANGLE1 | 0.1 | | TRIANGLE2 | 0.2 | | USER TRIANGLE | 0.3 | | SUB SCALE | 0.4 | | INPUT SELECT A | 0.5 | | up menu | 0.6 |

COLOR = B.G. BLACK
Leader LV5600 - Selecting the Color Scale - 2

scatter | Category | Value | | -------------- | ----- | | COLOR | 0.0 | | B.O. BLACK | 0.0 | | TRIANGLE1 | 0.0 | | OFF | 0.0 | | TRIANGLE2 | 0.0 | | OFF | 0.0 | | USER TRIANGLE | 0.0 | | SUB SCALE | 0.0 | | INPUT SELECT A | 0.0 | | up menu | 0.0 |

Figure 12-3 Selecting the color scale

12.1.2 Selecting the Triangle

To display up to three color triangles, follow the procedure below.

Procedure
→ 2 CIE DIAGRAM SCALE → 2 TRIANGLE1: BT.601(525) / BT.601(625) / BT.709 / DCI / BT.2020 / OFF → 3 TRIANGLE2: BT.601(525) / BT.601(625) / BT.709 / DCI / BT.2020 / OFF → 4 USER TRIANGLE → 1 TRIANGLE: 1 / 2 / OFF

The color triangle vertex coordinates are shown below. u'v' coordinates are calculated from the xy coordinates.

Table 12-1 Color triangle vertex coordinates

12.1.3 Setting the User-defined Triangle

To set the user-defined triangle, press F•4 USER TRIANGLE on the CIE DIAGRAM SCALE menu.

Up to two user-defined triangles can be specified. Press F•1 TRIANGLE to select 1 or 2.

VECT → F•2 CIE DIAGRAM SCALE → F•4 USER TRIANGLE → F1 TRIANGLE 1 F2 PRIMARY COLOR G F3 x VALUE 0.170 F4 y VALUE 0.797 F5 COMMENT INPUT F6 INPUT SELECT A F7 up menu F·1 F·2 F·3 F·4 F·5 F·6 F·7

Figure 12-4 USER TRIANGLE menu

To change the vertex coordinates of the color triangle, follow the procedure below. Press PRIMARY COLOR to select the vertex you want to change, and then press F•3 x VALUE and F•4 y VALUE to set the coordinates. The default setting is equivalent to the BT.2020 coordinates.

Procedure

VECT → F•2 CIE DIAGRAM SCALE → F•5 USER TRIANGLE → F•2 PRIMARY COLOR: G / B / R → F•3 x VALUE: 0.000 - 0.170 - 1.000 → F•4 y VALUE: 0.000 - 0.797 - 1.000

Press F•5 COMMENT INPUT to assign names of your choice to user-defined triangles. Enter up to 8 characters.

[F.D.NCB] = CHAR SELECT , [F.D.PUSH] = CHAR SET & Function Key Edit setup User Triangle Comment

Figure 12-5 Triangle name input screen

12. CIE Chromaticity Diagram Display

The key operations that you can perform in the triangle name input display are as follows:

F•1CLEAR ALLDeletes all characters
F•2DELETEDeletes the character at the cursor
F•3INSERTInserts a character at the cursor
F•4<=Moves the cursor to the left
F•5=>Moves the cursor to the right
F•6CHAR SETEnters the character
Function dial (F•D)Turn to select a character, and press to enter the character.

12.1.4 Turning the Sub Scale On and Off

To set the sub scale, press F•5 SUB SCALE on the CIE DIAGRAM SCALE menu.

Leader LV5600 - Turning the Sub Scale On and Off - 1

flowchart
graph LR
    A["VECT → F•2"] --> B["CIE DIAGRAM SCALE → F•5"]
    B --> C["SUB SCALE →"]
    D["F1 TEMP SCALE OFF"] --> E["F2 GRID ON"]
    E --> F["F3 D65 ON"]
    F --> G["F4 TRIANGLE CAPTION ON"]
    G --> H["F5"]
    H --> I["F6 INPUT SELECT A"]
    I --> J["F7 up menu"]
    K["F·1"] --> L["F·2"] --> M["F·3"] --> N["F·4"] --> O["F·5"] --> P["F·6"] --> Q["F·7"]

Figure 12-6 SUB SCALE menu

To turn on and off the color temperature curve, grid, white point (D65), or triangle name, follow the procedure below.
Procedure

VECT→F•2CIE DIAGRAM SCALE→F•5SUB SCALE
→F•1TEMP SCALE:ON / OFF
→F•2GRID:ON / OFF
→F•3D65:ON / OFF
→F•4TRIANGLE CAPTION:ON / OFF

TEMP SCALE = ON / GRID = ON / D65 = ON / TRIANGLE CAPTION = ON

Leader LV5600 - Turning the Sub Scale On and Off - 2

surface_3d | Parameter | Value | | ----------------- | ----- | | Temp Scale ON | 0.0 | | Grid ON | 0.1 | | D05 ON | 0.2 | | Triangle Caption ON | 0.3 | | INPUT SELECT A | 0.4 | | up menu | 0.5 | | DT.709 | 0.6 | | BT.709 | 0.7 | | Colorimetry BT.709 | 0.8 |

Figure 12-7 Turning the sub scale on and off

12. CIE Chromaticity Diagram Display

12.2 Setting the Chromaticity Diagram Mode

To set the chromaticity diagram mode, press F•3 CIE DIAGRAM SETTING on the VECT menu.

Leader LV5600 - Setting the Chromaticity Diagram Mode - 1

F1 DISPLAY MODE DIAGRAM F2 CIE STANDARD CIE1931 F3 CLIP ON F4 FILTER OFF F5 MANUAL SETUP F6 INPUT SELECT A F7 up menu F·1 F·2 F·3 F·4 F·5 F·6 F·7

Figure 12-8 CIE DIAGRAM SETTING menu

12.2.1 Selecting the Display Mode

To select the display mode, follow the procedure below.

Procedure

VECT → F•3 CIE DIAGRAM SETTING → F•1 DISPLAY MODE: DIAGRAM / TEMP

Settings

DIAGRAM: The chromaticity diagram is displayed.

TEMP: The color temperature is displayed.

DISPLAY MODE = TEMP

1920x1080/58.94I YCbCr(422) 10bit HD SDI A TIME: 14:30:03 COLORIMETRY 81.709 x 100[K] DISPLAY MODE TEMP CIE STANDARD CIE1931 CLIP ON FILTER OFF MANUAL SETUP INPUT SELECT A up menu

Figure 12-9 Selecting the display mode

12.2.2 Selecting the Display Standard

To select the display standard, follow the procedure below.

Procedure

VECT → F•3 CIE DIAGRAM SETTING → F•2 CIE STANDARD: CIE1931 / CIE1976

Settings

CIE1931: Chromaticity diagram based on CIE 1931 is displayed.

CIE1976: Chromaticity diagram based on CIE 1976 is displayed.

12. CIE Chromaticity Diagram Display

12.2.3 Turning Clipping On and Off

To turn clipping on and off, follow the procedure below.

Procedure

VECT → F•3CIE DIAGRAM SETTING → F•3CLIP: ON / OFF
Settings
ON:Negative values of the input signal are clipped to zero.
OFF:Negative values of the input signal are displayed according to BT.1361.

12.2.4 Turning the Filter On and Off

To turn the filter on and off, follow the procedure below.

When set to ON, data is averaged every two pixels and displayed.

Procedure

VECTF●3CIE DIAGRAM SETTING →F●4FILTER: ON / OFF

12.2.5 Setting the Gamma Value

To set the gamma value, follow the procedure below.

Procedure

VECT→ F•3CIE DIAGRAM SETTING → F•5MANUAL SETUP
→ F•1MANUAL SETUP: ON / OFF
→ F•2COLORIMETRY: BT.601(525) / BT.601(625) / BT.709 / DCI / BT.2020
→ F•5GAMMA SETUP: 1.50 - 2.20 - 3.00

Settings

ON:The colorimetry set using F•2 COLORIMETRY and the gamma value set with F•5 GAMMA SETUP are used. However, this is not applied to the video-signal-waveform, vector, or picture display.The gamma calculation expression is (input signal level)^(gamma value).Negative input signal values are clipped to zero, regardless of whether F•3 CLIP is set to on or off.
OFF:The colorimetry standard selected on the SYS menu is used.

12. CIE Chromaticity Diagram Display

12.3 Displaying Cursors

To display a cursor on the chromaticity diagram, follow the procedure shown below. You can move the cursor horizontally using the H POS knob and vertically using the V POS knob. The measured values are shown in the upper right of the display. Press the H POS and V POS knobs to move the cursor to the following position.

Chromaticity diagram display: (x, y) = (u', v') = (0, 0)

Color temperature display: Lower left of the display

Procedure

VECT → F•4 CURSOR: ON / OFF

Leader LV5600 - Displaying Cursors - 1

heatmap | X | Y | |------|------| | 0.0 | 0.0 | | 0.1 | 0.1 | | 0.2 | 0.2 | | 0.3 | 0.3 | | 0.4 | 0.4 | | 0.5 | 0.5 | | 0.6 | 0.6 | | 0.7 | 0.7 | | 0.8 | 0.8 |

Figure 12-10 Displaying the chromaticity diagram cursor

12.4 Configuring the Line Selection Settings

To configure the line selection settings, press F•5 LINE SELECT on the VECT menu. See section 11.6, "Configuring Line Selection Settings."

13. Picture Screen

13. PICTURE SCREEN

To display the picture, press PIC.

1920x1080/59.941 YCbCr(422) 10bit HD SDI A TIME: 14:50:00 PIC CONFIG CINEL TE FOCUS LINE SELECT INPUT SELECT A

Figure 13-1 Picture display

13. Picture Screen

13.1 Selecting the Display Mode

To select the picture display mode, follow the procedure below.

Procedure

PIC → F•1PIC CONFIG → F•1PICTURE MODE: FIT / REAL / X2 / FULL FRM
Settings
FIT:The picture is displayed at the optimal size for the display area.Because the picture is enlarged or reduced, the display may become coarse or pixels may drop out. The instrument uses simple filtering to enlarge and reduce the picture.
REAL: A single sample of the video signal is displayed with a single pixel on the screen.If the picture is larger than the display area, use the V•POS and H•POS knobs to adjust the picture display position. Press a knob to return the picture to the corresponding default location.
X2:A single sample of the video signal is displayed with 4 pixels (2 horizontal and 2 vertical pixels) on the screen.If the picture is larger than the display area, use the V•POS and H•POS knobs to adjust the picture display position. Press a knob to return the picture to the corresponding default location.
FULL FRM:A single frame, including the blanking interval, is displayed.This is not displayed for 4K.

SIZE = FIT SIZE = REAL
Leader LV5600 - Selecting the Display Mode - 1
Figure 13-2 Selecting the display mode

13. Picture Screen

13.2 Adjusting the Picture

To adjust the picture, press F•2 ADJUST in the PIC CONFIG menu.

Leader LV5600 - Adjusting the Picture - 1

flowchart
graph LR
    A["PIC → F•1"] --> B["PIC CONFIG → F•2"]
    B --> C["ADJUST →"]
    D["F1"] --> E["MONO/COLOR"]
    D --> F["COLOR"]
    E --> G["F2"]
    E --> H["CHROMA UP"]
    E --> I["MORMAL"]
    F --> J["BRIGHTNESS [%"]]
    F --> K["0.0"]
    G --> L["F3"]
    H --> M["CONTRAST [%"]]
    H --> N["100.0"]
    I --> O["F4"]
    J --> P["GAIN/BIAS"]
    K --> Q["F5"]
    L --> R["F6"]
    M --> S["INPUT SELECT A"]
    N --> T["F7"]
    U["F•1"] --> V["F•2"]
    V --> W["F•3"]
    W --> X["F•4"]
    X --> Y["F•5"]
    Y --> Z["F•6"]
    Z --> AA["F•7"]

Figure 13-3 ADJUST menu

13.2.1 Switching between the Color and Monochrome Displays

To switch between the color and monochrome displays, follow the procedure below.

Procedure

PIC → F•1 PIC CONFIG → F•2 ADJUST → F•1 MONO/COLOR: MONO / COLOR

13.2.2 Setting the Chroma Gain

To switch the chroma gain, follow the procedure below.

Procedure

PIC → F•1 PIC CONFIG → F•2 ADJUST → F•2 CHROMA UP: UP / NORMAL

Settings

UP: The chroma gain is set to 2 (200.0 %).

NORMAL: The chroma gain is set to the value that you have set using F•5 GAIN/BIAS → F•1 GAIN.

13.2.3 Adjusting the Brightness

To adjust the brightness, follow the procedure below.

Press the function dial (F•D) to return the setting to its default value (0.0).

Procedure

PIC → F•1 PIC CONFIG → F•2 ADJUST → F•3 BRIGHTNESS[%]: -50.0 - 0.0 - 50.0

13.2.4 Adjusting the Contrast

To adjust the contrast, follow the procedure below.

Press the function dial (F•D) to return the setting to its default value (100.0).

Procedure

PIC → F•1 PIC CONFIG → F•2 ADJUST → F•4 CONTRAST[%]: 0.0 - 100.0 - 200.0

13. Picture Screen

13.2.5 Adjusting the Gain

To adjust the gain, press F•1 GAIN on the GAIN/BIAS menu.

Leader LV5600 - Adjusting the Gain - 1

flowchart
graph LR
    A["F-1"] --> B["F-2"]
    B --> C["F-3"]
    C --> D["F-4"]
    D --> E["F-5"]
    E --> F["F-6"]
    F --> G["F-7"]

    H["R GAIN [%"] 100.0] --> I["G GAIN [%"] 100.0] --> J["B GAIN [%"] 100.0] --> K["CHROMA GAIN[%"] 100.0] --> L["F6 INPUT SELECT A"] --> M["up menu"]

Figure 13-4 GAIN menu

To adjust the gain separately for the R, G, B, and chroma signals, follow the procedure below. Press the function dial (F•D) to return the setting to its default value (100.0).

When F•2 CHROMA UP is set to UP, F•4 CHROMA GAIN does not appear. If is fixed at 200.0.

Procedure

PIC → F•1 PIC CONFIG → F•2 ADJUST → F•5 GAIN/BIAS → F•1 GAIN → F•1 R GAIN[%]: 0.0 - 100.0 - 200.0 → F•2 G GAIN[%]: 0.0 - 100.0 - 200.0 → F•3 B GAIN[%]: 0.0 - 100.0 - 200.0 → F•4 CHROMA GAIN[%]: 0.0 - 100.0 - 200.0

13.2.6 Adjusting the Bias

To adjust the bias, press F•2 BIAS on the GAIN/BIAS menu.

Leader LV5600 - Adjusting the Bias - 1

flowchart
graph LR
    A["PIC"] --> B["F•1"]
    B --> C["PIC CONFIG"]
    C --> D["F•2"]
    D --> E["F•5"]
    E --> F["GAIN/BIAS"]
    F --> G["F•2"]
    G --> H["BIAS"]
    H --> I["F1"]
    I --> J["R BIAS [%"]]
    I --> K["0.0"]
    J --> L["F2"]
    L --> M["G BIAS [%"]]
    L --> N["0.0"]
    M --> O["F3"]
    O --> P["B BIAS [%"]]
    O --> Q["0.0"]
    P --> R["F4"]
    R --> S["F5"]
    S --> T["F6 INPUT SELECT A"]
    T --> U["F7 up menu"]
    U --> V["F•7"]

Figure 13-5 BIAS menu

To set the RGB signal bias separately for each color, follow the procedure below. Press the function dial (F•D) to return the setting to its default value (0.0).

Procedure

PIC → F•1 PIC CONFIG → F•2 → F•5 GAIN/BIAS → F•2 BIAS → F•1 R BIAS[%]: -50.0 - 0.0 - 50.0 → F•2 G BIAS[%]: -50.0 - 0.0 - 50.0 → F•3 B BIAS[%]: -50.0 - 0.0 - 50.0

13.3 Configuring the Display Settings

To configure the display settings, press F•3 INDICATION SETTING on the PIC CONFIG menu.

Leader LV5600 - Configuring the Display Settings - 1

flowchart
graph LR
    A["F1 GAMUT ERR. DISPLAY OFF"] --> B["F2"]
    B --> C["F3 STATUS INFOMATION ON"]
    C --> D["F4"]
    D --> E["F5 3G-B-DS DISPLAY ALIGN"]
    E --> F["F6 INPUT SELECT A"]
    F --> G["F7 up menu"]

Figure 13-6 INDICATION SETTING menu

13.3.1 Displaying Gamut Errors

To display the locations of gamut errors and luminance errors on the picture, follow the procedure below.

These errors are defined by the ranges that you specify by setting Gamut Upper and Gamut Lower, Composite Upper and Composite Lower, and Luminance Upper and Luminance Lower in the status menu. If Gamut Error, Composite Gamut Error, or Level Error is set to OFF, the corresponding errors are not displayed.

[See also] Gamut Upper/Lower, Composite Upper/Lower → 16.2.3, "Error Setup 3"

Luminance Upper/Lower → 16.2.4, "Error Setup 4"

Procedure

PIC → F•1PIC CONFIG → F•3INDICATION SETTING → F•2GAMUT ERR. DISPLAY: OFF /WHITE / RED / MESH

Settings

OFF:Gamut errors are not displayed.
WHITE:The picture intensity is halved, and gamut error are marked in white.
RED:The picture intensity is halved, and gamut error are marked in red.
MESH:Gamut errors are marked with a mesh pattern.

13. Picture Screen

13.3.2 Turning the Information On and Off

To turn on and off the display of the following information that you arranged in the layout, follow the procedure below.

This setting is valid on the display that appears when PIC is pressed. For multi display and other displays, it is fixed to ON.

  • Sub tab items (FORMAT, INPUT, TIME, DATE)
  • Option tab options (Format, Input, Time)

Procedure

PIC → F•1 PIC CONFIG → F•3 INDICATION SETTING → F•3 STATUS IMFORMATION: ON / OFF

STATUS INFO = ON

1920x108069.941 YCbCr(422) 10bit HD SDI A TIME: 14:53:04 GAMUT ERR DISPLAY OFF STATUS INFORMATION ON INPUT SELECT A up menu

Figure 13-7 Turning the information on and off

13. Picture Screen

13.3.3 Configuring the 3G-B-DS Display

When measuring 3G-B-DS, to select the display mode, follow the procedure below.

Procedure

PIC → F•1 PIC CONFIG → F•3 INDICATION SETTING → F•5 3G-B-DS DISPLAY: STREAM1 / STREAM2 / ALIGN

Settings

STREAM1: Stream 1 is displayed.

STREAM2: Stream 2 is displayed.

ALIGN: Streams 1 and 2 are displayed side by side.

3G-B-DS DISPLAY = ALIGN

GAMUT ERR DISPLAY OFF STATUS INFORMATION OFF 3G-B-DS DISPLAY ALIGN INPUT SELECT A up menu

Figure 13-8 Configuring the 3G-B-DS Display

13. Picture Screen

13.4 Configuring the Marker Settings

To configure the marker settings, press F•4 MARKER on the PIC CONFIG menu. This menu item does not appear when PICTURE MODE is set to a value other than FIT. [See also] PICTURE MODE → 13.1, "Selecting the Display Mode"

Leader LV5600 - Configuring the Marker Settings - 1

flowchart
graph LR
    A["FRAME MARKER OFF"] --> B["CENTER MARKER OFF"]
    B --> C["ASPECT MARKER 14:9"]
    C --> D["ASPECT SHADOW 50"]
    D --> E["SAFETY ZONE"]
    E --> F["INPUT SELECT A"]
    F --> G["up menu"]

Figure 13-9 MARKER menu

CENTER MARKER SAFE TITLE SAFE ACTION ASPECT MARKER FRAME MARKER

Figure 13-10 Horizontal marker display

13.4.1 Turning the Frame Marker On and Off

To turn the frame marker on and off, follow the procedure below.

Procedure

PIC → F•1 PIC CONFIG → F•4 MARKER → F•1 FRAME MARKER: ON / OFF

13.4.2 Turning the Center Marker On and Off

To turn the center marker on and off, follow the procedure below.

Procedure

PIC → F•1 PIC CONFIG → F•4 MARKER → F•2 CENTER MARKER: ON / OFF

13. Picture Screen

13.4.3 Setting the Aspect Marker

To display the aspect marker, follow the procedure below.

Procedure

PIC → F•1PIC CONFIG → F•4MARKER → F•3ASPECT MARKER: OFF / 17:9 / 16:9 / 14:9 / 13:9 / 4:3 / 2.39:1 / AFD

Settings

OFF: The aspect marker is not displayed.
17:9A 17:9 aspect marker is displayed.This option cannot be selected when the input signal is a 17:9 frame signal or an SD signal.
16:9:A 16:9 aspect marker is displayed.This option cannot be selected when the input signal is a 16:9 frame signal.
14:9:A 14:9 aspect marker is displayed.
13:9:A 13:9 aspect marker is displayed.
4:3:A 4:3 aspect marker is displayed.This option cannot be selected when the input signal is SD.
2.39:1:A 2.39:1 aspect marker is displayed.This option cannot be selected when the input signal is SD.
AFD:The aspect marker included in the AFD (Active Format Description) packets is displayed. Also, abbreviations for SMPTE ST 2016-1-2007 standard AFD codes are displayed in the upper left of the screen.This option can be selected when the input signal is SD or HD.

13. Picture Screen

The AFD codes that are displayed in the upper left of the screen are displayed as shown below according to the coded frame and the AFD code. If there are no AFD packets embedded in the input signal, “----” is displayed.

Table 13-1 AFD display

Displayed AbbreviationCoded FrameAFD CodeDescription
0000- UNDEFINED0 (4:3)0000Undefined
0001- RESERVED0 (4:3)0001Reserved
0010- 16:9LBTop0 (4:3)0010Letterbox 16:9 image, at top of the coded frame
0011- 14:9LBTop0 (4:3)0011Letterbox 14:9 image, at top of the coded frame
0100- >16:9LBox0 (4:3)0100Letterbox image with an aspect ratio greater than 16:9, vertically centered in the coded frame
0101- RESERVED0 (4:3)0101Reserved
0110- RESERVED0 (4:3)0110Reserved
0111- RESERVED0 (4:3)0111Reserved
1000- FullFrame0 (4:3)1000Full frame 4:3 image, the same as the coded frame
1001- Full Frame0 (4:3)1001Full frame 4:3 image, the same as the coded frame
1010- 16:9LBox0 (4:3)1010Letterbox 16:9 image, vertically centered in the coded frame with all image areas protected
1011- 14:9LBox0 (4:3)1011Letterbox 14:9 image, vertically centered in the coded frame
1100- RESERVED0 (4:3)1100Reserved
1101-4:3Full14:90 (4:3)1101Full frame 4:3 image, with alternative 14:9 center
1110-16:9LB14:90 (4:3)1110Letterbox 16:9 image, with alternative 14:9 center
1111-16:9LB4:30 (4:3)1111Letterbox 16:9 image, with alternative 4:3 center
0000w UNDEFINED1 (16:9)0000Undefined
0001w RESERVED1 (16:9)0001Reserved
0010w Full Frame1 (16:9)0010Full frame 16:9 image, the same as the coded frame
0011w 14:9Pillbox1 (16:9)0011Pillarbox 14:9 image, horizontally centered in the coded frame
0100w >16:9LBox1 (16:9)0100Letterbox image with an aspect ratio greater than 16:9, vertically centered in the coded frame
0101w RESERVED1 (16:9)0101Reserved
0110w RESERVED1 (16:9)0110Reserved
0111w RESERVED1 (16:9)0111Reserved
1000w FullFrame1 (16:9)1000Full frame 16:9 image, the same as the coded frame
1001w 4:3Pillbox1 (16:9)1001Pillarbox 4:3 image, horizontally centered in the coded frame
1010w FullNoCrop1 (16:9)1010Full frame 16:9 image, with all image areas protected
1011w14:9Pillbox1 (16:9)1011Pillarbox 14:9 image, horizontally centered in the coded frame
1100w RESERVED1 (16:9)1100Reserved
1101w4:3PB14:91 (16:9)1101Pillarbox 4:3 image, with alternative 14:9 center
1110wFull14:9Safe1 (16:9)1110Full frame 16:9 image, with alternative 14:9 center
1111wFull4:3Safe1 (16:9)1111Full frame 16:9 image, with alternative 4:3 center

13. Picture Screen

13.4.4 Setting the Aspect Shadow

When F•3 ASPECT MARKER is set to a value other than OFF, to adjust the darkness of the aspect marker shadow, follow the procedure below. The larger the number, the darker the shadow. If you specify 0, the aspect marker will be indicated with a line.

Press the function dial (F•D) to return the setting to its default value (50).

Procedure

PIC → F•1 PIC CONFIG → F•4 MARKER → F•4 ASPECT SHADOW[%]: 0 - 50 - 100

ASPECT SHADOW = 50

40 7 8 11 20 30 5 10 15 25 0 1 2 3 4 5 6 7 8 9 200 7 9 8 11 11 9 7 40 350 350 25 175 40 30 20 10 5 40 40 40 40 40 40 40 40 40 40 40 40

Figure 13-11 Setting the aspect shadow

13. Picture Screen

13.4.5 Setting the Safe Action Marker

To configure safety marker settings, press F•5 SAFETY ZONE on the MARKER menu. When F•3 ASPECT MARKER is set to AFD, this menu item is not available.

Leader LV5600 - Setting the Safe Action Marker - 1

flowchart
graph LR
    A["PIC"] --> B["F•1"]
    B --> C["PIC CONFIG"]
    C --> D["F•4"]
    D --> E["MARKER"]
    E --> F["F•5"]
    F --> G["SAFETY ZONE"]
    H["F1"] --> I["SAFE ACTION USER1"]
    I --> J["F2"]
    J --> K["SAFE TITLE USER2"]
    K --> L["F3"]
    L --> M["USER1/2 SET"]
    M --> N["F4"]
    N --> O["F5"]
    O --> P["F6"]
    P --> Q["INPUT SELECT A"]
    Q --> R["F7"]
    R --> S["up menu"]
    T["F-1"] --> U["F-2"]
    U --> V["F-3"]
    V --> W["F-4"]
    W --> X["F-5"]
    X --> Y["F-6"]
    Y --> Z["F-7"]

Figure 13-12 SAFETY ZONE menu

To display the safe action marker, follow the procedure below.

When an aspect marker is displayed, the safe action marker is displayed relative to the aspect marker.

Procedure

PIC → F•1PIC CONFIG → F•4MARKER → F•5SAFETY ZONE → F•1SAFE ACTION: ARIB / SMPTE / USER1 / OFF

Settings

ARIB:An ARIB TR-B4 safe action marker is displayed.
This setting cannot be selected when the input signal is 4K.
SMPTE:An SMPTE RP-218 safe action marker is displayed.
This setting cannot be selected when the input signal is 4K.
USER1:A marker that has been set with F•1 USER1 WIDTH[%] and F•2 USER1 HEIGHT[%] for F•3 USER1/2 SET is displayed.
OFF:A safe action marker is not displayed.

13.4.6 Setting the Safe Title Marker

To display the safe title marker, follow the procedure below.

When an aspect marker is displayed, the safe action marker is displayed relative to the aspect marker.

Procedure

PIC → F•1PIC CONFIG → F•4MARKER → F•5SAFETY ZONE → F•2SAFE TITLE: ARIB / SMPTE / USER2 / OFF

Settings

ARIB:An ARIB TR-B4 safe title marker is displayed.
This setting cannot be selected when the input signal is 4K.
SMPTE:An SMPTE RP-218 safe title marker is displayed.
This setting cannot be selected when the input signal is 4K.
USER2:A marker that has been set with F•3 USER2 WIDTH[%] and F•4 USER2 HEIGHT[%] for F•3 USER1/2 SET is displayed.

OFF: A safe title marker is not displayed.

13.4.7 Setting User Markers

By setting F•1 SAFE ACTION to USER1 and F•2 SAFE TITLE to USER2, you can display up to two user-defined markers.

To configure user-defined marker settings, press F•3 USER1/2 SET on the SAFETY ZONE menu.

Leader LV5600 - Setting User Markers - 1

flowchart
graph LR
    A["PIC"] --> B["F•1"]
    B --> C["PIC CONFIG"]
    C --> D["F•4"]
    D --> E["MARKER"]
    E --> F["F•5"]
    F --> G["SAFETY ZONE"]
    G --> H["F•3"]
    H --> I["USER1/2 SET"]

    subgraph User1
        J["F1 USER1 WIDTH[%"] 90]
        K["F2 USER1 HEIGHT[%"] 90]
        L["F3 USER2 WIDTH[%"] 80]
        M["F4 USER2 HEIGHT[%"] 80]
        N["F5 USER1/2 ASPECT OFF"]
        O["F6 INPUT SELECT A"]
        P["F7 up menu"]
    end

    subgraph Control
        Q["F•1"]
        R["F•2"]
        S["F•3"]
        T["F•4"]
        U["F•5"]
        V["F•6"]
        W["F•7"]
    end

Figure 13-13 USER1/2 SET menu

To set the width and height of a user marker and turn the aspect ratio display on and off, follow one of the procedures below.

Press the function dial (F•D) to return the width and height settings to their default value.

The aspect ratio display on/off setting applies both to USER1 and USER2.

Procedure

PIC → F•1 PIC CONFIG → F•4 MARKER → F•5 SAFETY ZONE → F•3 USER1/2 SET

→|F•1| USER1 WIDTH[%]: 0 - 90 - 100

→ F•2 USER1 HEIGHT[%]: 0 - 90 - 100

→ F•3 USER2 WIDTH[%]: 0 - 80 - 100

→ F•4 USER2 HEIGHT[%]: 0 - 80 - 100

→ F•5 USER1/2 ASPECT: ON / OFF

13.5 Setting the Superimpose Feature

The superimpose feature displays closed caption information on top of pictures.

To display the closed caption information, press F•5 SUPER IMPOSE on the PIC CONFIG menu.

Leader LV5600 - Setting the Superimpose Feature - 1

flowchart
graph LR
    A["F1 STANDARD ARIB"] --> B["F2 FORMAT HD"]
    B --> C["F3 LANGUAGE 1"]
    C --> D["F4"]
    D --> E["F5 CS LOG"]
    E --> F["F6 INPUT SELECT A"]
    F --> G["F7 up menu"]

Figure 13-14 SUPER IMPOSE menu

13.5.1 Selecting the Closed Caption Display

To select the closed caption to display over the picture, follow the procedure below. If you select OFF, no closed captions will be displayed.

Procedure
PIC → F•1PIC CONFIG → F•5 SUPER IMPOSE → F•1 STANDARD : OFF / SMPTE / ARIB / TELETEXT

Settings

OFF: Closed captions are not displayed.

SMPTE: English closed captions are displayed.

ARIB: Simple Japanese closed captions are displayed.

TELETEXT: European closed captions are displayed.

On the Japanese closed caption display, if a clear screen command is received, "CS" is displayed in cyan for approximately 0.5 seconds in the upper right of the screen.

13.5.2 Selecting the Format of English Closed Captions

To select the English closed caption format from the four types below, follow the procedure below.

Procedure

PIC → F•1 PIC CONFIG → F•5 SUPER IMPOSE → F•2 FORMAT: 608(708) / 608(608) / VBI / 708

Settings

608(708): CEA/EIA-608-B English closed caption information that is embedded in EIA-708-B CDP packets is displayed.

608(608): CEA/EIA-608-B English closed caption information is displayed.

VBI: CEA/EIA-608-B English closed caption information that is embedded in vertical blanking intervals is displayed.

708: EIA-708 English closed caption information that is embedded in EIA-708-B CDP packets is displayed.

13.5.3 Selecting the Display Details of English Closed Captions

When F•2 FORMAT is set to a value other than 708, to select the English closed caption content

13. Picture Screen

to display, follow the procedure below.

Procedure

PIC → F●1PIC CONFIG → F●5SUPER IMPOSE → F●3LANGUAGE: CC1 / CC2 / CC3 / CC4 / TEXT1 / TEXT2 / TEXT3 / TEXT4

When F•2 FORMAT is set to 708, to select the English closed caption content to display, follow the procedure below.

Press the function dial (F•D) to return the setting to its default value (1).

Procedure

PICF●1PIC CONFIG →F●5SUPER IMPOSE →F●4SERVICE DATA: 1 - 63

13.5.4 Selecting the Format of Japanese Closed Captions

To select the ARIB Japanese closed caption information format from the four types below, follow the procedure below. A border is displayed around the name of the selected format of Japanese closed captions in the upper right of the screen.

The closed caption format names are displayed in green when packets of the corresponding closed caption format are being received and in white otherwise.

Procedure

PICF•1PIC CONFIG →F•5SUPER IMPOSE →F•2FORMAT: HD / SD / ANALOG / CELLULAR

Settings

HD: Displays HD closed caption data
SD: Displays SD closed caption data
ANALOG: Displays analog closed caption data
CELLULAR: Displays porta closed caption data

13.5.5 Selecting the Japanese Closed Caption Data

To select the closed caption data type, follow the procedure below.

Procedure

PICF•1PIC CONFIG →F•5SUPER IMPOSE →F•3LANGUAGE: 1 / 2

Settings

1:Language 1
2:Language 2

13.5.6 Displaying the Clear Screen Log

You can detect the clear screen commands that are embedded in the broadcasts of programs with closed captions and display a log of these commands. In addition, using specified timecodes, you can check whether closed captions in TV commercial materials are displayed during the closed caption prohibited time.

Carry out the procedure below to display the clear screen command log.

Use the CS LOG menu to set the clear screen log.

Leader LV5600 - Displaying the Clear Screen Log - 1

flowchart
graph LR
    A["PIC"] --> B["F•1"]
    B --> C["PIC CONFIG"]
    C --> D["F•4"]
    D --> E["SUPER IMPOSE"]
    E --> F["F•5"]
    F --> G["CS LOG"]
    G --> H["F1"]
    H --> I["F2"]
    I --> J["LOG STOP"]
    J --> K["F3"]
    K --> L["CLEAR"]
    L --> M["F4"]
    M --> N["LOG MODE OVER WT"]
    N --> O["F5"]
    O --> P["TIMECODE SET"]
    P --> Q["F6"]
    Q --> R["USB MEMORY"]
    R --> S["F7"]
    S --> T["up menu"]
    T --> U["F-1"]
    U --> V["F-2"]
    V --> W["F-3"]
    W --> X["F-4"]
    X --> Y["F-5"]
    Y --> Z["F-6"]
    Z --> AA["F-7"]

Figure 13-15 CS LOG menu

Log screen

CS LOG LISTSAMPLE No.10<< NOW LOGGING >>
4:LTC TC20:32:56:01AHD1080i/59.94T_DSP
3:LTC TC20:32:56:01AHD1080i/59.94CS
2:LTC TC20:32:54:01AHD1080i/59.94T_DSP
1:LTC TC20:32:54:01AHD1080i/59.94CS
123456
  1. Generation Number
  2. Time Code
  3. Input channel
  4. Closed caption format
  5. Input format
  6. Log Entry Contents

* Even if there are several of these units installed in the instrument, there is only one log file.
* The clear screen log can be recorded when the Japanese closed caption screen or the clear screen log screen is displayed. Use the multi screen display or other means to keep these screens from closing during measurement.
* If you rewind a VCR, reset the log buffer before starting the clear screen log. Use START/STOP of F•2 LOG or F•6 CLEAR (Japanese closed caption screen) on the F•3 CLEAR, SUPER IMPOSE menu to reset.
* The clear screen log recording period is approximately 83 minutes when the closed caption changes every 2 seconds.
* Closed caption codes and decoded closed captions cannot be logged.

13. Picture Screen

- General Display Description

- Generation Number

The clear screen log entries are listed in order with the most recent events listed first. By turning the function dial (F•D) to the right, you can scroll the screen to view older entries in the log. Press the function dial (F•D) to display the latest entries in the log.

- Time Code

In the clear screen log, entries are recorded using the time code specified on the CAPTURE & DISPLAY tab of the SYS menu. Set the time code to LTC or VITC. D-VITC is not supported.

[See also] 7.2.5, "Configuring the Information Display"

- Log Entry Contents

The meanings of the displayed log contents are shown below.

CS: Detection of a clear screen command

T_DSP: Detection of closed caption display

- Starting or Stopping the Log

To start or stop the clear screen log, follow the procedure below.

Procedure

PIC → F•1PIC CONFIG → F•5SUPER IMPOSE → F•5CS LOG → F•2LOG: START / STOP

- Clearing the Log

To clear the clear screen log, follow the procedure below.

Procedure

PICF•1PIC CONFIG →F•5SUPER IMPOSE →F•5CS LOG →F•3CLEAR

- Log Operation Mode

The clear screen log can record up to 5,000 entries.

To select the action to perform when more than 5,000 events occur, follow the procedure below.

Procedure

PIC → F•1PIC CONFIG → F•5SUPER IMPOSE → F•5CS LOG → F•4LOG MODE: OVER WT
/ STOP

Settings

OVER WT: Old logs are discarded and overwritten.

STOP: Logs after the 5,000 events are not recorded.

13. Picture Screen

- Configuring the Closed Caption Checking Function

Carry out the procedure below to check whether a closed caption is displayed during the closed caption prohibited time.

Procedure

PIC → F•1PIC CONFIG → F•5SUPER IMPOSE → F•5CS LOG → F•5TIMECODE SET

Settings

OFF:Closed caption checking is disabled (log will be recorded).
Timecode:Closed caption checking is enabled.

- Start Time and End Time

If you select Timecode, set the check period to 4 s or longer using Start Time and End Time. If Time Code on the SYS menu is set to Real Time, you cannot set the trigger.

• Non Caption Time

Under Non Caption Time, set the closed caption prohibited time. If closed captions are displayed between Start Time and Front seconds after Start Time or between Rear seconds before End Time to End Time, the check result will be NG.

TIMECODE SETTING SETUP Trigger OFF Timecode Start Time 0: 0: 0: 0 End Time 0: 0: 5: 0 Non Caption Time Front 1.0 s Rear 1.0 s COMPLETE up menu

13. Picture Screen

- Saving Data to a USB Memory Device

You can save the clear screen log to a USB memory device as a text file. To save a file with a name that you specify, follow the procedure below.

  1. Used to connect USB memory.

  2. Press F•6 USB MEMORY.

The file list screen appears.

This setting appears when a USB memory device is connected.

External USB Flash Drive CS LOG File List No. Filename Date&Time Size(byte) 1 2018/07/11 52516.txt 2018/07/11 15:25:16 21 2 2018/07/11 52546.txt 2018/07/11 15:25:46 21 Disk Size: 4,003,266,560 Byte CS LOG Store File Name Free Size: 3,910,598,650 Byte txt AUTO FILENAME ON STORE FILE DELETE up menu

Figure 13-16 File list screen

  1. Set F•1 AUTO FILENAME to OFF.

  2. Press F•2 NAME INPUT.

The file name input display appears.

[F.D_NCB] = CHAR SELECT , [F.D_PUSH] = CHAR_SET & Function Key Edit GO LOG Store File Name .1 x 1 1 1 1 1 1 CLEAR ALL DELETE <= => CHAR SET up menu

Figure 13-17 File name input screen

13. Picture Screen

5. Enter a file name using up to 14 characters.

The key operations that you can perform in the file name input display are as follows:

F•1CLEAR ALLDeletes all characters
F•2DELETEDeletes the character at the cursor
F•4<=Moves the cursor to the left
F•5=>Moves the cursor to the right
F•6CHAR SETEnters the character
Function dial (F•D)Turn to select a character, and press to enter the character.

You can also copy the file name of an already saved file. To copy a file name, move the cursor to the file in the file list whose name you want to copy, and then press the function dial (F•D).

  1. Press F•7 up menu.
  2. Press F•3 STORE.

If a file with the same name that you have specified already exists on the USB memory device, an overwrite confirmation menu appears. To overwrite the existing preset, F•1 OVER WR YES. Otherwise, press F•3 OVER WR NO.

- Deleting the Clear Screen Log

To delete a clear screen log that has been saved to the USB memory device, select the log file on the file list display, and then press F•4 FILE DELETE. To delete the file, press F•1 DELETE YES. To cancel the delete operation, press F•3 DELETE NO.

• Automatic File Name Generation

If you set F•1 AUTO FILENAME to ON, the file name will be generated automatically in the format "YYYYMMDDhhmmss" when you save the file. In this situation, F•2 NAME INPUT is not displayed.

• USB Memory Device Folder Structure

Clear screen logs are saved in the LOG folder.

USB memory device LV5600_USER or LV7600_USER LOG YYYYMMDDhhmmss.txt Clear screen log file (with check result)

13. Picture Screen

• Measurement Example

As an example, this section describes how to perform closed caption checking on TV commercial material.

  1. On the CAPTURE & DISPLAY tab of the SYS menu, set Time Code to LTC or VITC. After setting them, press F•1 COMPLETE.
  2. Set → 1 PIC CONFIG → 5 SUPER IMPOSE → 1 STANDARD to ARIB.
  3. Set F•2 FORMAT and F•3 LANGUAGE.
  4. Press F•5 CS LOG.
  5. Press F•5 TIMECODE SET to set the time code.

Set Trigger to Timecode first, and then set the timecode and closed caption prohibited time. After setting them, press F•1 COMPLETE.

  1. Press F•2 LOG to start the log.

From this point until the end of measurement, do not exit the clear screen log screen or Japanese closed caption screen.

  1. Start the TV commercial material.

Closed caption checking will start at the specified time.

On the clear screen log screen, log entries are displayed in red when closed captions are displayed during the closed caption prohibited time and in green otherwise.

  1. When the check result is displayed, press any key.

The caption check result is displayed as OK or NG.

  1. If necessary, press F•6 USB MEMORY to save the measurement results to USB memory.

13.5.7 Clearing Japanese Closed Caption Data

To clear the displayed Japanese closed caption, follow the procedure below to press CLEAR.

Procedure

PIC → F•1 PIC CONFIG → F•5 SUPER IMPOSE → F•6 CLEAR

13. Picture Screen

13.5.8 Selecting the Multiplex System for European Closed Captions

To select the multiplex system for European closed captions from the two types below, follow the procedure below.

Procedure

PIC → F•1PIC CONFIG → F•5SUPER IMPOSE → F•2WST TRANSPORT: VBI / OP47
Settings
VBI:European closed caption information that is embedded in vertical blanking intervals is displayed.
OP47:Closed captions in SMPTE RDD-08 SDP format are displayed.

13.5.9 Selecting the Magazine Number and Page Number for European Closed Captions

To select a magazine number for European closed captions, follow the procedure below.

Procedure

PICF●1PIC CONFIG →F●5SUPER IMPOSE →F●3MAGAZINE:1 - 7 - 8

To select a page number for European closed captions, follow the procedure below.

Procedure

PICF●1PIC CONFIG →F●5SUPER IMPOSE →F●3PAGE:00 - 77 - FF

13. Picture Screen

13.6 Configuring CINELITE Settings

CINELITE is a feature that displays luminance levels of video signals on the picture. To show the CINELITE display, press F•2 CINELITE on the PIC menu.

Leader LV5600 - Configuring CINELITE Settings - 1

flowchart
graph LR
    A["F1 CINELITE DISPLAY OFF"] --> B["F2"]
    B --> C["F3"]
    C --> D["F4"]
    D --> E["F5"]
    E --> F["F6 INPUT SELECT A"]
    F --> G["F7 up menu"]

Figure 13-18 CINELITE menu

To switch to the CINELITE display, follow the procedure below.

Procedure

PIC → F•2 CINELITE → F•1 CINELITE DISPLAY: OFF / f Stop / %DISPLAY / CINEZONE

Settings

OFF: CINELITE is not displayed.

f Stop: The f Stop screen is displayed.

This option cannot be selected in 3G-B-DS.

%DISPLAY: The %DISPLAY screen is displayed.

This option cannot be selected in 3G-B-DS.

CINEZONE: The CINEZONE screen is displayed.

This option cannot be selected in 3G-B-DS.

13. Picture Screen

13.6.1 f Stop Display Description

To set f Stop, press F•1 CINELITE DISPLAY to select f Stop and then press F•2 f STOP SETUP.

On the f Stop display, luminance levels are displayed using f-stop (exposure) values.

The measured f Stop value for a group of measured points is typically displayed using white, but it will be displayed using yellow when it corresponds to a luminance level of 80 % or more. Additionally, f Stop values that correspond to luminance levels equal to or less than 0 % cannot be measured. They are displayed in yellow as "****."

Leader LV5600 - f Stop Display Description - 1

heatmap | Measurement | Value | | :--- | :--- | | [GAMMA:0.45] | 3 | | REF:0.0 | 1 | | P1(S: 549,L: 143) | 1.5 | | P2(S:1368,L: 776) | -2.1 | | P3(S:1163,L: 470) | **** | | 2 | Color-coded (Red, Blue, Green, Yellow, Cyan, Magenta, Black) |

Figure 13-19 f Stop display

1 Reference Position

The position where the cursors intersected when F•4 18% REF SET was pressed is displayed in red. This is the reference position for f-stop measurement.

2 Cursor

Up to three cursors can be set. The cursor coordinates are indicated using sample numbers and line numbers. The f Stop value relative to the reference point is displayed at each point.

3 Gamma Correction Value

The gamma correction value that you selected using F•5 GAMMA → F•1 GAMMA SELECT is displayed.

4 Reference display

The f Stop value at the reference position is displayed. The value immediately after you have pressed F•4 18% REF-SET is zero, but it will change when the picture changes.

13. Picture Screen

13.6.2 Procedure for Displaying the f Stop Display

The following example shows how to display luminance levels as f Stop numbers relative to the luminance level of 18 % gray chart. Include an 18 % gray chart with the objects that you are filming.

  1. Press PIC.
  2. Press F•2 CINELITE.
  3. Press F•1 CINELITE DISPLAY to select f Stop.
  4. Press F•2 f STOP SETUP.
  5. Press F•5 GAMMA and then F•1 GAMMA SELECT to select the gamma correction table type.

The default gamma correction value is 0.45, but you can also use a user-defined gamma correction table that matches the gamma characteristics of the camera that you are using. For details, see section 13.6.7, "Configuring User-Defined Correction Tables."

The selected gamma correction value is indicated in the upper left of the display.

  1. Press F•7 up menu.

  2. Make sure that the cursors are over the 18 % gray chart, and press F•4 18% REF SET.

The f Stop value for 18 % gray chart becomes 0.0 and is displayed in the upper part of the screen next to "REF:" The reference position is displayed with a red cursor.

  1. Use the cursors to set the measurement points.

The f Stop value relative to 18 % gray chart appears next to each cursor. You can set up to three measurement points.

13. Picture Screen

13.6.3 %DISPLAY Screen Description

To set % DISPLAY, press F•1 CINELITE DISPLAY to select % DISPLAY and then press F•2 % DISPLAY SETUP.

On the %DISPLAY screen, you can display luminance levels using Y%, RGB%, RGB255, CODE VALUE, or CODE VALUE DEC. Use F•4 UNIT SELECT to select the display format.

The measured values are typically displayed in white, but they are displayed in yellow when the luminance level at a measurement point is 80 % or more or 0 % or less.

- Y% Display

Luminance levels are indicated as percentages.

Leader LV5600 - %DISPLAY Screen Description - 1

heatmap | Category | Measure Numbers | P1+P2+P3 | P2(S:1368,L:776) (%) | P3(S:1163,L:470) -2.1% | | :--- | :--- | :--- | :--- | :--- | | Measure Position | 1 | 2 | 3 | 4 | | Measure Size | 1×1 | 2 | 4 | 5 | | Unit Select Y% | 1×1 | 2 | 4 | 5 | | INPUT SELECT A | 1 | 2 | 5 | 6 | | up menu | 1 | 2 | 6 | 7 | P1(S: 549,L: 143) 69.6% P2(S:1368,L:776) 16.0%

Figure 13-20 Y% display

- RGB% Display

Each of the R, G, and B levels is indicated using a percentage. The levels are also indicated using bars on the left side of the display (the order is R, G, and then B).

Leader LV5600 - %DISPLAY Screen Description - 2

heatmap | Category | P1(S: 540,L: 143)R: 75.1% G: 75.0% B: 0.0% | P2(S:1368,L: 776)R: 75.0% G: 0.0% B: 0.0% | P3(S:1163,L: 470)R: -2.1% G: -2.1% B: -2.1% | |---|---|---|---| | MEASURE NUMBERS P1+P2+P3 | | | | | MEASURE POSITION P1 | | | | | MEASURE SIZE 1X1 | | | | | UNIT SELECT RGB% | | | | | INPUT SELECT A | | | | | up menu | | | |

Figure 13-21 RGB% display

13. Picture Screen

- RGB255 Display

Each of the R, G, and B levels is indicated using 256 steps from 0 to 255. The levels are also indicated using bars on the left side of the display (the order is R, G, and then B).

The value of an RGB level that is 100 % or greater is 255. The value of an RGB level that is 0 % or less is 0.

Leader LV5600 - - RGB255 Display - 1

heatmap | Measurement Type | Value | | :--- | :--- | | P1(S: 548,L: 143)R: 191 G: 191 B: 0 | | | P2(S:1368,L: 776)R: 191 G: 0 B: 0 | | | P3(S:1163,L: 470)R: -5 G: -5 B: -5 | |

Figure 13-22 RGB255 display

• CV (CODE VALUE) Display, CV (CODE VALUE) (DEC) Display

When CV is selected, the SDI signal video data is displayed in hexadecimal.

When CA(DEC) is selected, the SDI signal video data is displayed in decimal.

When the input signal is YCbCr, the video is displayed in YCbCr, and when the input signal is RGB, the video is displayed in RGB.

You can select CV or CV(DEC) when F•3 MEAS SIZE is 1×1.

Leader LV5600 - • CV (CODE VALUE) Display, CV (CODE VALUE) (DEC) Display - 1

heatmap | Measurement | Value | |---|---| | P1(S: 548,L: 143)Y: 674 Cb: 176 Cr: 543 | 874 | | P2(S:1368,L: 776)Y: 204 Cb: 435 Cr: 848 | 204 | | P3(S:1163,L: 470)Y: 46 Cb: 512 Cr: 512 | 512 | | MEASURE NUMBERS P1+P2+P3 | 1 | | MEASURE POSITION P1 | 2 | | MEASURE SIZE 1X1 | 3 | | UNIT SELECT CV(DEC) | 4 | | INPUT SELECT A | 5 | | up menu | 6 |

Figure 13-23 CODE VALUE DEC display

13.6.4 Selecting the Points to Display

You can set three points to measure: P1 to P3. To select the measured points that you want to display, follow the procedure below.

Procedure
PIC → F•2 CINELITE → F•2 f STOP SETUP → F•1 MEASURE NUMBERS: P1 / P1+P2 / P1+P2+P3 → F•2 %DISPLAY SETUP → F•1 MEASURE NUMBERS: P1 / P1+P2 / P1+P2+P3

Settings
P1: P1 is displayed. P1+P2: P1 and P2 are displayed. P1+P2+P3: P1 to P3 are displayed.

13.6.5 Setting Measurement Points

Follow the procedure below to select which measurement point to set with the cursors, and then move the X cursor by using the H POS knob and the Y cursor by using the V POS knob. Press the H POS and V POS knobs at the same time to move the cursors to the center of the picture.

The cursors are not displayed if they are within the blanking interval. To display cursors that do not appear, move them within the screen.

The measurement point specified for f Stop and that specified for %DISPLAY are linked.

Procedure
PIC → F•2 CINELITE → F•2 f STOP SETUP → F•2 MEASURE POSITION: P1 / P2 / P3 → F•2 %DISPLAY SETUP → F•2 MEASURE POSITION: P1 / P2 / P3

13.6.6 Setting the Measurement Size

To select the measurement size, follow the procedure below. This setting is applied to P1 to P3 and REF.

The measurement size specified for f Stop and that specified for %DISPLAY are linked.

Procedure
PIC → F•2 CINELITE → F•2 f STOP SETUP → F•3 MEASURE SIZE: 1X1 / 3X3 / 9X9 → F•2 %DISPLAY SETUP → F•3 MEASURE SIZE: 1X1 / 3X3 / 9X9

Settings
1X1: The single pixel at the intersection of the cursors is measured. 3X3: The 3 × 3 area of pixels with its center at the intersection of the cursors is averaged and measured. 9X9: The luminance of the 9 × 9 area of pixels centered on the pixel at the intersection of the cursors is averaged and measured.

13.6.7 Configuring User-Defined Correction Tables

The default gamma correction value when measuring f Stop levels is 0.45, but you can also use a user-defined gamma correction table that matches the gamma characteristics of the camera that you are using.

There are two types of user-defined correction tables. The first type consists of tables that are created using the instrument and is made up of the USER1 to USER3 tables. The second type consists of tables that have been created externally using a device such as a PC and is made up of the USER_A to USER_E tables. These tables are not deleted even if you initialize the instrument.

- Creating User-Defined Correction Tables Using the instrument

You can create and store up to three user-defined correction tables.

As an example, the following procedure shows how to create a user-defined correction table that matches a camera's gamma characteristics.

Set the camera's f Stop value to F5.6 beforehand, and put an 18 % gray chart in the area that you will film.

  1. Adjust the lighting so that the displayed luminance level of the 18 % gray chart is 45.0 % (for example) on a camera whose f Stop value is set to F5.6.

For details, see section 13.6.3, "%DISPLAY Screen Description."

  1. Press F•7 up menu.
  2. Press F•1 CINELITE DISPLAY to select f Stop.
  3. Press F•2 f STOP SETUP.
  4. Press F•5 GAMMA and then F•1 GAMMA SELECT to select USER1.

In this example, explanation will be given for USER1, but USER2 and USER3 can also be created in the same way.

  1. Press F•2 GAMMA CAL.

A user-defined correction table appears in the lower left of the screen, and the luminance level appears as a 10-bit value (0% is displayed as 64, and 100% is displayed as 940) close to the cursor.

This setting is available when F•1 GAMMA SELECT is set to an option from USER1 to USER3.

13. Picture Screen

[GAMMA: USER1] [USER1] REF = 0.0 CAL E F Dev [22.0] 0.0 0 [16.0] 1.0 0 [11.0] 2.0 0 [8.0] 3.0 0 [5.6] 4.0 414 [4.0] 5.0 0 [2.8] 6.0 0 [2.0] 7.0 0 Lv: 414

Figure 13-24 User-defined correction table creation screen

  1. Press F•1 TABLE CLEAR.

All the values in the user-defined correction table that is currently being edited are initialized. Be sure to initialize the values first when you create a new user-defined correction table.

  1. Press F•1 CLEAR YES.

To cancel the initialization of the user-defined correction table, F•3 CLEAR NO.

  1. Place the cursors over the 18 % gray chart.

  2. Press F•5 CAL F, and select 5.6.

  3. Press F•4 CAL SET.

The luminance level when the camera f Stop value is F5.6 is input into Lev in the user-defined correction table. To delete a line of data, press F•3 1 DATA CLEAR.

  1. Change F•5 CAL F and the camera f Stop value together in the following order: 4.0, 2.8, 2.0, 8.0, 11.0, 16.0, 22.0. F•4 CAL SET each time you change the value to input the luminance level for each value.

Do not change the lighting or the position of the 18 % gray chart.

Also, make sure that the Lev value for f Stop values 22.0 to 2.0 increases linearly.

13. Picture Screen

The REF value in the user-defined correction table is entered when you press F•4 18% REF-SET on the f Stop display.

For example, if you use the left-hand table shown below and press F•4 18% REF-SET when the luminance value at the intersection of the cursors is 416 (10-bit value), the f Stop value at that point (3.0) is displayed as the REF value.

[USER1] REF=0,0 CAL_F F Lev [22,0] 0,0, 152 [16,0] 1,0, 240 [11,0] 2,0, 328 [8,0] 3,0, 416 [5,6] 4,0, 504 [4,0] 5,0, 592 [2,8] 6,0, 680 [2,0] 7,0, 768 → [USER1] REF=3,0 CAL_F F Lev [22,0] 0,0, 152 [16,0] 1,0, 240 [11,0] 2,0, 328 [8,0] 3,0, 416 [5,6] 4,0, 504 [4,0] 5,0, 593 [2,8] 6,0, 680 [2,0] 7,0, 768

Figure 13-25 User-defined correction tables

When the above user-defined correction tables are used, f Stop values are indicated as shown below. The values between specified values are interpolated linearly.

When Lv = 152 f Stop = -3.0

When Lv = 240 f Stop = -2.0

When Lv = 328 f Stop = -1.0

When Lv = 416 f Stop = 0.0

When Lv = 504 f Stop = 1.0

When Lv = 592 f Stop = 2.0

When Lv = 680 f Stop = 3.0

When Lv = 768 f Stop = 4.0

13. Picture Screen

- Loading a User-Defined Correction Table into the instrument

You can load up to five user-defined correction tables into the instrument.

To load a user-defined correction table into the instrument, follow the procedure below.

1. Create a user-defined correction table.

Example (TEST.CLT):

#######Comment
NAME:SAMPLE_1Keyword
TYPE:0Keyword
#Input -7% 0Comment
# 109% 4095Comment
#Output 0% 0Comment
# 1000% 65535Comment
#Input OutputComment
#######Comment
0 0Data
1 16Data
2 32Data
(Omitted)
4093 65488Data
4094 65504Data
4095 65520Data
# EOFComment

When you create a correction table, make sure that it conforms to the specifications listed below.

Overall File Specifications

Description:ASCII text file
Extension:.CLT
End-of-line character:CR+LF
Number of lines:5000 or less
Number of characters per line:255 or less (including CR+LF)
File name length:20 characters or less (excluding the extension)
Permitted file name characters:Letters of the alphabet (A to Z; uppercase and lowercase), numerals (0 to 9), and underscores (_).

Comment

If you start a line with the number sign (#), the line is treated as a comment and does not affect operations.

You can put comments anywhere.

13. Picture Screen

Keyword

Be sure to put the keyword lines before the data lines and to enter a keyword without anything preceding it at the beginning of each keyword line.

NAME: The instrument displays the eight characters that follow the separator (colon) as the name of the correction table. After the separator, enter the correction table name using letters of the alphabet (A to Z; uppercase and lowercase), numbers (0 to 9), and underscores (_). You can enter up to 10 characters.

TYPE: This is a code for identifying the file type. Enter a zero after the separator (colon).

Data

From the start of a line, enter the input value, a separator, and then the output value, in that order.

Input value: Enter values from 0 to 4095 (12 bits), increasing the value by one for each line.

A luminance level of 100 % is defined as 940 (10 bits) × 4 = 3760 (12 bits).

A luminance level of 0 % is defined as 64 (10 bits) × 4 = 256 (12 bits).

Separator: Enter a single tab code.

Output value: Enter a value from 0 to 65535 (16 bits).

  1. Save the user-defined correction table to USB memory, and connect the USB memory to the instrument.

Save the correction table in the following directory.

USB memory device

LV5600_USER or LV7600_USER

L CLT

TEST.CLT (example)

  1. Press PIC.

  2. Press F•2 CINELITE.

  3. Press |F•1| CINELITE DISPLAY to select f Stop.

  4. Press F•2 f STOP SETUP.

  5. Press F•5 GAMMA and then F•1 GAMMA SELECT to select USER_A.

In this example, a user-defined correction table is copied to USER_A, but user-defined correction tables can be copied to USER_B through USER_E in the same way.

  1. Press F•2 GAMMA FILE.

This setting is available when F•1 GAMMA SELECT is set to an option from USER_A to USER_E.

  1. Press F•1 FILE LIST.

The file list screen appears. This setting appears when a USB memory device is connected. To clear the table that has been copied to USER_A, press F•2 TABLE CLEAR.

13. Picture Screen

  1. Turn the function dial (F•D) to select the copy source file from the USB memory device.

  2. Press F•3 FILE LOAD.

The user-defined correction table that you selected is copied from the USB memory to USER_A. The copy operation is complete when the file list screen disappears and the display returns to the measurement screen.

If a file has already been stored to USER_A, an overwrite confirmation prompt appears. If you want to overwrite the current file, press F•1 OVER WRITE YES. Otherwise, press F•3 OVER WRITE NO.

After you have copied a user-defined correction table, you can select it by pressing F•1 GAMMA SELECT in the CINELITE menu. A loaded correction table is displayed using the name determined by its NAME keyword.

To synchronize the markers on the vector screen and video signal waveform screen to measurement points P1 to P3 and REF that you specify on the CINELITE screen, follow the procedure below.

Synchronized markers can be displayed only when an f Stop screen or % DISPLAY screen is shown in the same multi-screen display.

Markers cannot be displayed on the video signal waveform in the following situations.

  • When SWEEP is set to V or H SWEEP is set to 2H in the video signal waveform menu
  • When COLOR MATRIX in the video signal waveform menu is COMPOSIT

Marker display will not work properly when waveforms are being displayed using an external sync signal.

Procedure

PIC → F•2 CINELITE → F•4 CINELITE ADVANCE: ON / OFF

CINELITE ADVANCE = ON

Leader LV5600 - Displaying Link Markers - 1

line | Sample | Value | |--------|-------| | P1 | 548 | | P2 | 1368 | | P3 | 1163 | | P4 | 470 | | P5 | 435 | | P6 | 848 | | P7 | 543 | | P8 | 1430 | | P9 | 176 | | P10 | 543 | | P11 | 776 | | P12 | 435 | | P13 | 512 | | P14 | 512 | | P15 | 512 | | P16 | 512 | | P17 | 512 | | P18 | 512 | | P19 | 512 | | P20 | 512 | | P21 | 512 | | P22 | 512 | | P23 | 512 | | P24 | 512 | | P25 | 512 | | P26 | 512 | | P27 | 512 | | P28 | 512 | | P29 | 512 | | P30 | 512 | | P31 | 512 | | P32 | 512 | | P33 | 512 | | P34 | 512 | | P35 | 512 | | P36 | 512 | | P37 | 512 | | P38 | 512 | | P39 | 512 | | P40 | 512 | | P41 | 512 | | P42 | 512 | | P43 | 512 | | P44 | 512 | | P45 | 512 | | P46 | 512 | | P47 | 512 | | P48 | 512 | | P49 | 512 | | P50 | 512 | | P51 | 512 | | P52 | 512 | | P53 | 512 | | P54 | 512 | | P55 | 512 | | P56 | 512 | | P57 | 512 | | P58 | 512 | | P59 | 512 | | P60 | 512 | | P61 | 512 | | P62 | 512 | | P63 | 512 | | P64 | 512 | | P65 | 512 | | P66 | 512 | | P67 | 512 | | P68 | 512 | | P69 | 512 | | P70 | 512 | | P71 | 512 | | P72 | 512 | | P73 | 512 | | P74 | 512 | | P75 | 512 | | P76 | 512 | | P77 | 512 | | P78 | 512 | | P79 | 512 | | P80 | 512 | | P81 | 512 | | P82 | 512 | | P83 | 512 | | P84 | 512 | | P85 | 512 | | P86 | 512 | | P87 | 512 | | P88 | 512 | | P89 | 512 | | P90 | 512 | | P91 | 512 | | P92 | 512 | | P93 | 512 | | P94 | 512 | | P95 | 512 | | P96 | 512 | | P97 | 512 | | P98 | 512 | | P99 | 512 | | QOUT | - | | QOUT | - | | QOUT | - | | QOUT | - | | QOUT | - | | QOUT | - | | QOUT | - | | QOUT | - | | QOUT | - | | QOUT | - | | QOUT | - | | QOUT | - | | QOUT | - | | QUT | - | | QUT | - | | QUT | - | | QUT | - | | QUT | - | | QUT | - | | QUT | - | | QUT | - | | QUT | - | | QUT | - | | QUT | - | | QUT | - | | QUT | -

Figure 13-26 Displaying link markers

13.7 Configuring CINEZONE Settings

The CINEZONE display has a gradation (step) display mode, in which the picture luminance levels are converted into RGB colors and displayed and a search display mode, in which the specified luminance level is displayed using green.

To set either of these modes, on the picture menu, press F•2 CINELITE → F•1 CINELITE DISPLAY to select CINEZONE and then F•2 CINEZONE SETUP.

[See also] CINEZONE SETUP → 13.5, "Configuring CINELITE Settings"

13.7.1 Gradation Display

To display picture luminance levels through color gradation, follow the procedure below. In the gradation display mode, luminance levels are displayed using 1024 colors.

The picture is displayed such that luminance levels above F•2 UPPER are displayed using white, and levels below F•3 LOWER are displayed using black.

You can see what colors correspond to what luminance levels by looking at the scale on the right of the display.

If the difference between F•2 UPPER and F•3 LOWER is 1%, reducing F•2 UPPER will also reduce F•3 LOWER automatically to maintain the 1% difference. Likewise, increasing F•3 LOWER will also increase F•2 UPPER automatically to maintain the 1% difference.

F•2 UPPER and F•3 LOWER appear when you set F•1 CINEZONE FORM to GRADATE or STEP.

Procedure

PIC → F•2 CINELITE → F•1 CINELITE DISPLAY → F•2 CINEZONE SETUP → F•1 CINEZONE FORM and select GRADATE

→ F•2 UPPER: -6.3 - 100.0 - 109.4 → F•3 LOWER: -7.3 - 0.0 - 108.4

Picture Screen

Leader LV5600 - Gradation Display - 1

natural_image Gradient background transitioning from green to pink (no text or symbols)

13. Picture Screen

Leader LV5600 - Picture Screen - 1
Figure 13-27 Gradation display

13.7.2 Step Display Mode

To display picture luminance levels in steps, follow the procedure below.

In the step display mode, luminance levels are divided into 10 % steps and assigned to 12 different colors. For information about F•2 UPPER and F•3 LOWER, see section 13.7.1, "Gradation Display Mode."

Procedure

PIC → F•2 CINELITE → F•1 CINELITE DISPLAY → F•2 CINEZONE SETUP → F•1 CINEZONE FORM and select STEP → F•2 UPPER → F•3 LOWER

CINEZONE FORM = GRADATE

Leader LV5600 - Step Display Mode - 2

heatmap | Value Range | Color Intensity | |-------------|-----------------| | 966.2 | Red | | 83.4 | Green | | 50.8 | Yellow | | 72.6 | Cyan | | 90.4 | Blue | | 62.8 | Orange | | 43.6 | Light Green | | 52.4 | Green | | 0.2 | Dark Blue | | 0.0 | Blue |

13. Picture Screen

Leader LV5600 - Picture Screen - 1

bar CINEZONE FORM = STEP | Color | Value | |---|---| | Black | 0.2 | | Blue | 12.4 | | Cyan | 5.2 | | Green | 7.2 | | Yellow | 12.6 | | Orange | 16.8 | | Red | 168.3 |

Figure 13-28 Step display

13.7.3 Search Display Mode

In the search display mode, the specified luminance level ±0.5% is displayed using green on an otherwise monochrome picture display.

The picture is displayed such that luminance levels above F•2 UPPER are displayed using red, and levels below F•3 LOWER are displayed using blue.

To set the level that is displayed using green, follow the procedure below.

F•2 LEVEL appears when F•1 CINEZONE FORM is set to SEARCH.

Set F•2 UPPER and F•3 LOWER by setting F•1 CINEZONE FORM to GRADATE or STEP. See section 13.7.1, "Gradation Display."

Procedure

PIC → F•2 CINELITE → F•1 CINELITE DISPLAY → F•2 CINEZONE SETUP → F•1 CINEZONE

FORM and select SEARCH

→F•2 LEVEL: -7.3 - 40.0 - 109.4

CINEZONE FORM = SEARCH

0.1 10.0 80.0 60.0 45.0 30.0 15.0 8.0 -1

Figure 13-29 Search display

13. Picture Screen

13.8 Focus Assist Display (SER25)

The focus assist display makes it easy to verify the focus by highlighting the image according to the amount of detected edges.

To configure the focus assist settings, press F•4 FOCUS on the PIC menu. This menu item does not appear when PICTURE MODE is set to FULL FRM.

[See also] SIZE → 13.1, "Selecting the Display Mode"

PIC → F•4 FOCUS → F1 SIZE F2 FOCUS SENSITIVE F3 ATTUPE PICTURE EDGE INPUT F7 up FIT ASSIST ON MIDDLE LEVEL 100 COLOR SELECT F-1 F-2 F-3 F-4 F-5 F-6 F-7 F-3 F-4 F-5 F-6 F-7

Figure 13-30 FOCUS menu

Leader LV5600 - Focus Assist Display (SER25) - 2

natural_image Close-up of two orange lily flowers with dew drops, surrounded by green foliage (no text or symbols)

Figure 13-31 Focus assist display

13.8.1 Selecting the Display Mode

To select the picture display mode, follow the procedure below. For details, see section 13.1, "Selecting the Display Mode."

Procedure

PIC → F•4 FOCUS → F•1 PICTURE MODE: FIT / REAL / X2

13.8.2 Turning Focus Assist On and Off

To turn the focus assist display on and off, follow the procedure below.

Procedure

PIC → F•4 FOCUS → F•2 FOCUS ASSIST: ON / OFF

13. Picture Screen

13.8.3 Selecting the Detection Sensitivity

When F•2 FOCUS ASSIST is set to ON, to select the edge detection sensitivity, follow the procedure below.

Procedure

PIC → F•4 FOCUS → F•3 SENSITIVE: LOW / MIDDLE / HIGH / V-HIGH / U-HIGH

13.8.4 Selecting the Luminance Level

When F•2 FOCUS ASSIST is set to ON, to select the picture luminance level as a percentage, follow the procedure below.

Select OFF to hide the picture. Select EMBOSS to emboss the edges.

Procedure

PIC → F•4 FOCUS → F•4 PICTURE LEVEL: OFF / EMBOSS / 25 / 50 / 75 / 100

PIC LEVEL = OFF

Leader LV5600 - Selecting the Luminance Level - 1

natural_image Black and white line drawing of a lotus flower with visible petals and stem (no text or symbols)

PIC LEVEL = EMBOSS

Leader LV5600 - Selecting the Luminance Level - 2

natural_image Line drawing of a lotus flower with visible petals and stem (no text or symbols)

Figure 13-32 Selecting the luminance level

13.8.5 Selecting the Highlight Color

When F•4 PIC LEVEL is 25, 50, 75, or 100, to select the edge display color, follow the procedure below.

Procedure

PIC → F•4 FOCUS → F•5 EDGE COLOR: WHITE / RED / GREEN / BLUE

13.9 Configuring the Line Selection Settings

To configure the line selection settings, press F•5 LINE SELECT on the PIC menu. This menu item does not appear when PICTURE MODE is set to a value other than FIT. [See also] PICTURE MODE → 13.1, "Selecting the Display Mode"

Leader LV5600 - Configuring the Line Selection Settings - 1

flowchart
graph LR
    A["F1 LINE SELECT ON"] --> B["F2 FIELD FRAME"]
    B --> C["F3"]
    C --> D["F4 AV PHASE"]
    D --> E["F5"]
    E --> F["F6 INPUT SELECT A"]
    F --> G["F7 up menu"]

Figure 13-33 LINE SELECT menu

13.9.1 Turning Line Selection On and Off

To display a marker at the selected line, follow the procedure below. You can use the function dial (F•D) to select a line. The number of the selected line appears in the upper left of the screen.

Changing this setting will also change the video-signal-waveform-display and vector-display line selection settings.

Procedure

PIC → F•5 LINE SELECT → F•1 LINE SELECT: ON / OFF

LINE SELECT = ON

LINE No: 300

Figure 13-34 Turning line selection on and off

13.9.2 Setting the Line Selection Range

When F•1 LINE SELECT is set to ON and the input signal format is interlaced or segmented frame, to set the line selection range, follow the procedure below.

Changing this setting will also change the selected line on the video-signal-waveform, vector, and status (data dump) displays.

Procedure

PICF•5LINE SELECT →F•2FIELD: FIELD1 / FIELD2 / FRAME

Settings

FIELD1:A line from field 1 can be selected. (Example: 1 to 563)
FIELD2:A line from field 2 can be selected. (Example: 564 to 1125)

FRAME: All lines can be selected. (Example: 1 to 1125)

13.9.3 Setting the Lip Sync Measurement Range (SER03)

To set the lip sync measurement range, press F•4 AV PHASE on the LINE SELCT menu.

PIC → F•5 LINE SELECT → F•4 AV PHASE →

F1 AV MEASURE TOP 50F2 AV MEASURE LEFT 0F3 AV MEASURE RIGHT 0F4 AV MEASURE LINK 1[A]F5F6 INPUT SELECT A - DF7 up menu
F·1F·2F·3F·4F·5F·6F·7

Figure 13-35 AV PHASE menu

To set the lip sync measurement range, follow the procedure below. Markers are displayed at the specified lines.

You can also set these using AV PHASE SETUP of the STATUS menu, but here you can set them while viewing the picture. For details on the settings, section 16.7.3, "Setting the Measurement Range."

Procedure

PIC →F•5LINE SEL →F•4AV PHASE
F•1AV MEASURE TOP: 0 - 50 - 100
F•2AV MEASURE LEFT: 0 - 99
F•3AV MEASURE RIGHT: 0 - 99
F•4AV MEASURE LINK: 1[A] / 2[B] / 3[C] / 4[D]

14. HDR Display (SER23)

14. HDR DISPLAY (SER23)

HDR signals can be measured by installing SER23. HDR signal measurement supports all formats except for SD or XYZ.

To measure HDR signals, use SYS → F•1 SIGNAL IN OUT → HDR tab to select the HDR signal standard for each display channel. Also set SYSTEM GAMMA on or off.

[See also] HDR tab → 7.1.9, "Configuring the HDR Settings (SER23)"

SDI IN SETUP1 SDI IN SETUP2 SDI OUT MON TOB OUT HDR Input-A HDR Mode HLG Ref.Level 50% VARIABLE System Gamma OFF ON Range Narrow HLG Scale 1200% 100% Input-B HDR Mode PQ Ref.Level 51% VARIABLE System Gamma OFF ON Range Narrow HLG Scale 1200% 100% Input-C HDR Mode S-Log3 Ref.Level VARIABLE System Gamma OFF ON Range Narrow HLG Scale 1200% 100% Input-D HDR Mode OFF Ref.Level VARIABLE System Gamma OFF ON Range Narrow HLG Scale 1200% 100% HOR signal measurement supports all formats except for SD and XYZ. COMPLETE PREV TAB NEXT TAB up menu

Figure 14-1 HDR tab
- Scale Unit and Range

The scale unit and range used on HDR signal measurements are as follows depending on the settings on the HDR tab.

HDR ModeSystem GammaRangeHLG ScaleScale
OFF---None
HLGOFFNarrow1200%SDI code value: 64 to 940 is displayed as 0 to 1200%.
100%SDI code value: 64 to 940 is displayed as 0 to 100%.
Full1200%SDI code value: 0 to 1023 is displayed as 0 to 1200%. (*1)
100%SDI code value: 0 to 1023 is displayed as 0 to 100%. (*1)
ON Narrow1200%SDI code value: 64 to 940 is displayed as 0 to 1000cd/m 2 .
100%SDI code value: 64 to 940 is displayed as 0 to 1000cd/m 2 .
Full1200%SDI code value: 0 to 1023 is displayed as 0 to 1000cd/m 2 . (*1)
100%SDI code value: 0 to 1023 is displayed as 0 to 1000cd/m 2 . (※1)
PQ -Narrow-SDI code value: 64 to 940 is displayed as 0 to 10000cd/m 2 .
Full-SDI code value: 0 to 1023 is displayed as 0 to 10000cd/m 2 . (※1)
S-Log3OFF--SDI code value: 95 to 940 is displayed as 0 to 2055%.
ON--SDI code value: 95 to 940 is displayed as 0 to 3000cd/m 2 .

*1 SDI code values: 0 to 1023 take on values from 4 to 1019.

14. HDR Display (SER23)

14.1 Video Signal Waveform Display

On the video signal waveform display, scales and cursors for HDR signals can be displayed.

14.1.1 Scale Display

During HDR measurement, a scale corresponding to the HDR signal is displayed on the right side of the video signal waveform.

Note that the scale on the right side is not displayed when COLOR MATRIX is set to COMPOSITE.

The scale on the right side varies as follows depending on the settings on the HDR tab.

HDR ModeSystem GammaHLG ScaleScale
HLG OFF1200%0 to 1200 [%]
100%0 to 100 [%]
ON1200%0 to 1000 [cd/m2]
100%0 to 1000 [cd/m2]
PQ--0 to 10000 [cd/m2]
S-Log3OFF-0 to 2055 [%]
ON-0 to 3000 [cd/m2]

HDR Mode = HLG, SYSTEM GAMMA = OFF, Range = Narrow, HLG Scale = 1200%

Leader LV5600 - Scale Display - 1

line 1920x1080/58.941 YCbCr(422) 105it HD | Category | Value | | :--- | :--- | | GAIN x1.000 SWEEP 1H x1 | 100 | | GAIN' FILTER | 90 | | SWEEP | 70 | | CURSOR | 30 | | LINE SELECT | 60 | | INPUT SELECT A | 90 | | COLOR SYSTEM | 100 | | TIME: 13:48:16 | 1200 | | HLG-NARROW[50%] | 50 | | [%] | 0.0 |

14. HDR Display (SER23)

HDR Mode = HLG, SYSTEM GAMMA = OFF, Range = Narrow, HLG Scale = 100%

Leader LV5600 - HDR Display (SER23) - 1

line 1920x1080/58.941 YCbCr(422) 10bit HD | Signal | Value (%) | | :--- | :--- | | WFM INTEN/CONFIG | 100 | | GAIN' FILTER | 93 | | SWEEP | 78 | | CURSOR | 63 | | LINE SELECT | 90 | | INPUT SELECT A | 100 | | COLOR SYSTEM | 100 |

HDR Mode = HLG, SYSTEM GAMMA = OFF, Range = Full, HLG Scale = 1200%

Leader LV5600 - HDR Display (SER23) - 2

line 1920x1080/58.94I YCbCr(422) 10bit HD | Component | Value (%) | |---|---| | WFM INTEN/CONFIG | 100 | | GAIN' FILTER | 80 | | SWEEP | 70 | | CURSOR | 60 | | LINE SELECT | 50 | | INPUT SELECT A | 40 | | COLOR SYSTEM | 30 | | GAIN x1,000 SWEEP 1H x1 | 100 | | SDI A TIME: 16:14:13 HLG-FULL[50%] | 1200 |

HDR Mode = HLG, SYSTEM GAMMA = OFF, Range = Full, HLG Scale = 100%

Leader LV5600 - HDR Display (SER23) - 3

line | Phase | Value | |-------|-------| | WFM INTEN/CONFIG | 90 | | GAIN FILTER | 85 | | SWEEP | 70 | | CURSOR | 60 | | LINE SELECT | 85 | | INPUT SELECT A | 95 | | COLOR SYSTEM | 90 |

HDR Mode = HLG, SYSTEM GAMMA = ON, Range = Narrow, HLG Scale = 1200% or 100%

Leader LV5600 - HDR Display (SER23) - 4

line | Component | Value | | :--- | :--- | | WFM INTEN/CONFIG | 100 | | GAIN' FILTER | 93 | | SWEEP | 72 | | CURSOR | 62 | | LINE SELECT | 90 | | INPUT SELECT A | 100 | | COLOR SYSTEM | 51 | | TIME: 13:51:52 | 1000 |

HDR Mode = HLG, SYSTEM GAMMA = ON, Range = Full, HLG Scale = 1200% or 100%

Leader LV5600 - HDR Display (SER23) - 5

line | Time | Value | |---|---| | 1920x1080/58.94I YCbCr(422) 10bit HD | 93 | | 1920x1080/58.94I YCbCr(422) 10bit HD | 85 | | 1920x1080/58.94I YCbCr(422) 10bit HD | 75 | | 1920x1080/58.94I YCbCr(422) 10bit HD | 68 | | 1920x1080/58.94I YCbCr(422) 10bit HD | 32 | | 1920x1080/58.94I YCbCr(422) 10bit HD | 25 | | 1920x1080/58.94I YCbCr(422) 10bit HD | 15 | | 1920x1080/58.94I YCbCr(422) 10bit HD | 8 | | 1920x1080/58.94I YCbCr(422) 10bit HD | 5 | | 1920x1080/58.94I YCbCr(422) 10bit HD | 60 | | 1920x1080/58.94I YCbCr(422) 10bit HD | 40 | | 1920x1080/58.94I YCbCr(422) 10bit HD | 95 | | 1920x1080/58.94I YCbCr(422) 10bit HD | 50 | | 1920x1080/58.94I YCbCr(422) 10bit HD | 55 | | 1920x1080/58.94I YCbCr(422) 10bit HD | 10 | | 1920x1080/58.94I YCbCr(422) 10bit HD | 5 | | 1920x1080/58.94I YCbCr(422) 10bit HD | 60 | | 1920x1080/58.94I YCbCr(422) 6 | [cd/m²] | | WFM INTEN/CONFIG | | GAIN FILTER | | SWEEP | | CURSOR | | LINE SELECT | | INPUT SELECT A | | COLOR SYSTEM | | | | | | | | | | | | | | | | | | | | | | | | | | | | | | | | | | | | | | | | | | | | | | | | | | | | | | | | | | | | | | | | | | | | | | | | | | | | | | | | | | | | | | | | | | | | | | | | | | | | | | | | | | | | | | | | | | | | | | | | | | | | | | | | | | | | | | | | | | | | | | | | | | | | | | | | |

HDR Mode = PQ, Range = Narrow

Leader LV5600 - HDR Display (SER23) - 6

line | Event | Value | |-------|-------| | WFM INTEN/CONFIG | 100 | | GAIN FILTER | 90 | | SWEEP | 70 | | CURSOR | 60 | | LINE SELECT | 50 | | INPUT SELECT A | 40 | | COLOR SYSTEM | 30 | | TIME: 13:54:29 | 10000 |

14. HDR Display (SER23)

HDR Mode = PQ, Range = Full

Leader LV5600 - HDR Display (SER23) - 1

line | Signal | Value | | :--- | :--- | | WFM INTEN/CONFIG | 0 | | GAIN' FILTER | 95 | | SWEEP | 75 | | CURSOR | 30 | | LINE SELECT | 85 | | INPUT SELECT A | 40 | | COLOR SYSTEM | 100 |

HDR Mode = S-Log3, SYSTEM GAMMA = OFF

Leader LV5600 - HDR Display (SER23) - 2

line | Signal | Value | |-----------------|-------| | W/FM INTEN/CONFIG | 100 | | GAIN' FILTER | 95 | | SWEEP | 70 | | CURSOR | 60 | | LINE SELECT | 93 | | INPUT SELECT A | 100 | | COLOR SYSTEM | 42 |

HDR Mode = S-Log3, SYSTEM GAMMA = ON

Leader LV5600 - HDR Display (SER23) - 3

line | Event | Value | |-------|-------| | WFM INTEN/CONFIG | 100 | | GAIN' FILTER | 90 | | SWEEP | 70 | | CURSOR | 60 | | LINE SELECT | 40 | | INPUT SELECT A | 30 | | COLOR SYSTEM | 20 | | [cd/m²] | 14 | | [cd/m²] | 36 | | [cd/m²] | 580 | | [cd/m²] | 1350 | | [cd/m²] | 3000 | | [cd/m²] | 6000 |

Figure 14-2 Scale display

14. HDR Display (SER23)

14.1.2 Selecting the Scale Display

During HDR measurement, to select the scale display, follow the procedure below.

Procedure

WFM → F•1 WFM INTEN/CONFIG → F•5 WFM SCALE → F•3 SCALE SETTING → F•3 SCALE DISPLAY: OFF / MAIN / HDR / BOTH

Settings

OFF: The scale display is turned off.

MAIN: The normal scale is displayed.

HDR: An HDR scale for HDR signals is displayed.

BOTH: The normal scale and an HDR scale for HDR signals are displayed.

SCALE DISPLAY = OFF

Leader LV5600 - Selecting the Scale Display - 2

line 1920x1080/58.94I YCbCr(422) 10bit HD | Time | Value | | :--- | :--- | | 14:04:14 | 1000 | | 14:04:14 | 900 | | 14:04:14 | 800 | | 14:04:14 | 700 | | 14:04:14 | 600 | | 14:04:14 | 500 | | 14:04:14 | 400 | | 14:04:14 | 300 | | 14:04:14 | 200 | | 14:04:14 | 100 | | 14:04:14 | 0 | | 14:04:14 | -10 | | 14:04:14 | -20 | | 14:04:14 | -30 | | 14:04:14 | -40 | | 14:04:14 | -50 | | 14:04:14 | -60 | | 14:04:14 | -70 | | 14:04:14 | -80 | | 14:04:14 | -90 | | 14:04:14 | -100 | | 14:04:14 | -110 | | 14:04:14 | -120 | | 14:04:14 | -130 | | 14:04:14 | -140 | | 14:04:14 | -150 | | 14:04:14 | -160 | | 14:04:14 | -170 | | 14:04:14 | -180 | | 14:04:14 | -190 | | 14:04:14 | -200 | | 14:04:14 | -210 | | 14:04:14 | -220 | | 14:04:14 | -230 | | 14:04:14 | -240 | | 14:04:14 | -250 | | 14:04:14 | -260 | | 14:04:14 | -270 | | 14:04:14 | -280 | | 14:04:14 | -290 | | 14:04:14 | -300 | | 14:04:14 | -310 | | 14:04:14 | -320 | | 14:04:14 | -330 | | 14:04:14 | -340 | | 14:04:14 | -350 | | 14:04:14 | -360 | | 14:04:14 | -370 | | 14:04:14 | -380 | | 14:04:14 | -390 | | 14:04:14 | -400 | | 14:04:14 | -410 | | 14:04:14 | -420 | | 14:04:14 | -430 | | 14:04:14 | -440 | | 14:04:14 | -450 | | 14:04:14 | -460 | | 14:04:14 | -470 | | 14:04:14 | -480 | | 14:04:14 | -490 | | 14:04:14 | -500 | | 15:36N/A | -55 | | 75% COLOR SCALE OFF | -65 | | SCALE DISPLAY OFF | -75 | | INPUT SELECT A | -85 | | up menu (up menu) | -95 | | up menu (up menu) | -85 | | up menu (up menu) | -75 | | up menu (up menu) | -65 | | up menu (up menu) | -55 | | up menu (up menu) | -65 | | up menu (up menu) | -75 | | up menu (up menu) | -85 | | up menu (up menu) | -95 | | up menu (up menu) | -85 | | up menu (up menu) | -75 | | up menu (up menu) | -65 | | up menu (up menu) | -55 | | up menu (up menu) | -65 | | up menu (up menu) | -75 | | up menu (up menu) | -86 | | up menu (up menu) | -75 | | up menu (up menu) | -65 | | up menu (up menu) | -55 | | up menu (up menu) | -65 | | up menu (up menu) | -75 | | up menu (up menu) | -86 | | up menu (up menu) | -75 | | up menu (up menu) | -65 | | up Menu (up menu) | -55 | | up Menu (up menu) | -65 | | up Menu (up menu) | -75 | | up Menu (up menu) | -86 | | up Menu (up menu) | -75 | | up Menu (up menu) | -65 | | up Menu (up menu) | -55 | | up Menu (up menu) | -65 | | up Menu (up menu) | -75 | | up Menu (up menu) | -86 | | up Menu (up menu) | -75 | | up Menu (up menu) | -65 | | up Menu (up menu) | -55 | | up Menu (up menu)|

SCALE DISPLAY = MAIN

Leader LV5600 - Selecting the Scale Display - 3

line | Time | Value (%) | |---|---| | Start | 100 | | Midpoint | 30 | | End | 100 | | High Peak | 1200 | | Low Peak | 50 | | Close | 100 | | High End | 100 | | Low End | 50 | | Close End | 100 | | High End | 1200 | | Low End | 50 | | Close End | 100 | | High End | 1200 | | Low End | 50 | | Close End | 100 | | High End | 1200 | | Low End | 50 | | Close End | 100 | | High End | 1200 | | Low End | 50 | | Close End | 10

14. HDR Display (SER23)

SCALE DISPLAY = HDR
Leader LV5600 - HDR Display (SER23) - 1

line | Time | Gain (x1,000) | HLG-NARROW (%) | | -------- | ------------- | -------------- | | 14:04:59 | 1080 | 58 |

SCALE DISPLAY = BOTH
Leader LV5600 - HDR Display (SER23) - 2

line | Time | Value | |---|---| | 1920x1080/58.94I YCbCr(422) 10bit HD | 100 | | 1920x1080/58.94I YCbCr(422) 10bit HD | 90 | | 1920x1080/58.94I YCbCr(422) 10bit HD | 70 | | 1920x1080/58.94I YCbCr(422) 10bit HD | 30 | | 1920x1080/58.94I YCbCr(422) 10bit HD | 20 | | 1920x1080/58.94I YCbCr(422) 10bit HD | 10 | | 1920x1080/58.94I YCbCr(422) 10bit HD | 0 | | 1920x1080/58.94I YCbCr(422) 10bit HD | 50 | | 1920x1080/58.94I YCbCr(422) 10bit HD | 60 | | 1920x1080/58.94I YCbCr(422) 10bit HD | 40 | | 1920x1080/58.94I YCbCr(422) 10bit HD | 10 | | 1920x1080/58.94I YCbCr(422) 10bit HD | 55 | | 1920x1080/58.94I YCbCr(422) 10bit HD | 5 | | 1920x1080/58.94I YCbCr(422) 10bit HD | 55 | | 1920x1080/58.94I YCbCr(422) 10bit HD | 5 | | 1920x1080/58.94I YCbCr(422) 6Hg-NARROW[50%] | 12 | | 1920x1080/58.94I YCbCr(422) 6Hg-NARROW[50%] | 12 | | 1920x1080/58.94I YCbCr(422) 6Hg-NARROW[50%] | 1 | | 1920x1080/58.94I YCbCr(422) 6Hg-NARROW[50%] | 5 | | 1920x1080/58.94I YCbCr(422) 6Hg-NARROW[50%] | 5 | | 1920x1080/58.94I YCbCr(422) 6Hg-NARROW[50%] | 5 | | 1920x1080/58-6Hg-NARROW[50%] | 5 | | SCALE UNIT HD%, SD% | 75% COLOR SCALE OFF | | SCALE DISPLAY BOTH | (not labeled) | | INPUT SELECT A | (not labeled) | | up menu | (not labeled) |

Figure 14-3 Selecting the scale display

14.1.3 Setting the Reference Level

When VARIABLE is selected on the HDR tab for HDR measurement, to set the reference level, follow the procedure below.

This setting is shared with REF [%] of the CINEZONE display.

When HDR Mode is set to HLG or PQ on the HDR tab, the default value is set to the Ref.Level value. When HDR Mode is set to S-Log3, the default value is set to 50%.

[See also] VARIABLE → 7.1.9, "Configuring the HDR Settings (SER23)"

Procedure

WFM → F•1 WFM INTEN/CONFIG → F•5 WFM SCALE → F•3 SCALE SETTING

→|F•4| REF. LEVEL [%]: 0.0 - Ref.Level - 100

→ F•4 REF. LEVEL [%]: 0.0 - 61 - 100

14. HDR Display (SER23)

14.1.4 Cursor Display

During cursor measurement, to display measured values for HDR signals, follow the procedure below.

The unit of measurement is \% when on the HDR tab, HDR Mode is HLG or S-Log3 and SYSTEM GAMMA is OFF and cd/m2 when HDR Mode is HLG or S-Log3 and SYSTEM GAMMA is ON or when HDR Mode is PQ.

Procedure

WFM → F•4 CURSOR → F•3 Y UNIT: HDR

Y UNIT = HDR

Leader LV5600 - Cursor Display - 1

line 1920x1080/59.94I YCbCr(422) 10bit HD | Time | Value | | :--- | :--- | | 14:08:30 | 10000 | | 14:08:30 | 1000 | | 14:08:30 | 500 | | 14:08:30 | 26 | | 14:08:30 | 10 | | 14:08:30 | 0.5 | | 14:08:30 | 0.0 | | 14:08:30 | 10 | | 14:08:30 | 26 | | 14:08:30 | 50 | | 14:08:30 | 10 | | 14:08:30 | 26 | | 14:08:30 | 50 | | 14:08:30 | 10 | | 14:08:30 | 26 | | 14:08:30 | 50 | | 14:08-31 | 1000 | | 14:08-31 | 500 | | 14:08-31 | 26 | | 14:08-31 | 10 | | 14:08-31 | 26 | | 14:08-31 | 50 | | 14:08-31 | 10 | | 14:08-31 | 26 | | 14:08-31 | 50 | | 14:08-31 | 10 | | 14:08-31 | 26 | | 14:08-31 | 50 | | 14:08-29 | 500 | | 14:08-29 | 26 | | 14:08-29 | 10 | | 14:08-29 | 26 | | 14:08-29 | 50 | | 14:08-29 | 10 | | 14:08-29 | 26 | | 14:08-29 | 50 | | 14:08-29 | 10 | | 14:08-29 | 26 | | 14:08-29 | 50 | | 14:08-37 | 50 | | 14:08-37 | 26 | | 14:08-37 | 10 | | 14:08-37 | 26 | | 14:08-37 | 50 | | 14:08-37 | 10 | | 14:08-37 | 26 | | 14:08-37 | 50 | | 14:08-37 | 10 | | 14:08-37 | 26 | | 14:08-37 | 50 | | 14:08-45 | 50 | | 14:08-45 | 26 | | 14:08-45 | 10 | | 14:08-45 | 26 | | 14:08-45 | 50 | | 14:08-45 | 10 | | 14:08-45 | 26 | | 14:08-45 | 50 | | 14:08-45 | 10 | | 14:08-45 | 26 | | 14:08-53 | 50 | | 14:08-53 | 26 | | 14:08-53 | 10 | | 14:08-53 | 26 | | 14:08-53 | 50 | | 14:08-53 | 10 | | 14:08-53 | 26 | | 14:08-53 | 50 | | 14:08-53 | 10 | | 14:08-53 | 26 | | Note: The data is in a format format with 'GAIN x1.0, XSWEEP TH' and 'YCbCr', but it is not directly plotted on the chart.

Figure 14-4 Cursor display (HDR Mode = PQ)

14. HDR Display (SER23)

14.2 Vector Display

On the vector display, a histogram for HDR signals can be displayed.

14.2.1 Histogram Display

During histogram display, to select the horizontal scale, follow the procedure below.

Procedure

VECTF•2HISTGRAM SCALE: % / HDR

The scale for HDR varies as follows depending on the settings on the HDR tab.

HDR ModeSystem GammaHLG ScaleScale
HLG OFF1200%0 to 1200 [%]
100%0 to 100 [%]
ON1200%0 to 1000 [cd/m2]
100%0 to 1000 [cd/m2]
PQ--0 to 10000 [cd/m2]
S-Log3OFF-0 to 2055 [%]
ON-0 to 3000 [cd/m2]

HISTGRAM SCALE = HDR
Leader LV5600 - Histogram Display - 1

line | Time [cd/m2] | Value | | ------------ | ----- | | 0 | 0 | | 92 | 92 | | 10000 | 10000 |

Figure 14-5 Histogram display (HDR Mode = PQ)

14.3 Picture Screen

The picture display can show CINELITE, CINEZONE, MAXFALL, and MAXCLL for HDR signals. During HDR measurement F•2 CINELITE of the PIC menu changes to F•2 CINELITE/HDR. You can use this to show CINELITE, CINEZONE, MAXFALL, and MAXCLL.

Leader LV5600 - Picture Screen - 1

flowchart
graph LR
    A["F1 CINELITE DISPLAY OFF"] --> B["F2"]
    B --> C["F3 MAX FALL/CLL"]
    C --> D["F4"]
    D --> E["F5"]
    E --> F["F6 INPUT SELECT A"]
    F --> G["F7 up menu"]

Figure 14-6 CINELITE/HDR menu

14.3.1 CINELITE and CINEZONE Displays

To switch to the CINELITE or CINEZONE display, follow the procedure below.

Procedure

PIC → F•2 CINELITE/HDR → F•1 CINELITE DISPLAY: OFF / %DISPLAY / CINEZONE

Settings

OFF: CINELITE and CINEZONE is not displayed.

%DISPLAY: The %DISPLAY screen is displayed.

This option cannot be selected in 3G-B-DS.

CINEZONE: The CINEZONE screen is displayed.

This option cannot be selected in 3G-B-DS.

14. HDR Display (SER23)

14.3.2 %DISPLAY

The %DISPLAY of HDR signals shows measured values for HDR signals. In addition, even if the brightness level is 80% or higher or 0% or lower, measured values are displayed in white, not yellow.

Use the %DISPLAY SETUP menu to configure the %DISPLAY settings.

[See also] %DISPLAY SETUP → 13.5.8, "Configuring CINELITE Settings"

PIC → F•2 CINELITE/HDR → F•2 %DISPLAY SETUP →

Leader LV5600 - %DISPLAY - 1

heatmap | Category | Value (%) | |---|---| | P1(S: 100,L: 100) | 63.9 | | P2(S: 966,L: 169) | 227.5 | | P3(S:1161,L: 452) | 0.0 | MEASURE NUMBERS P1+P2+P3 MEASURE POSITION P1 MEASURE SIZE 1X1 UNIT SELECT HDR INPUT SELECT A up menu

Figure 14-7 %DISPLAY

14. HDR Display (SER23)

14.3.3 CINEZONE Display

On the CINEZONE display of HDR signals, to display the SDR area in monochrome and HDR area in color, follow the procedure below to select ON.

Note that if F•5 HDR ZONE is set to ON, STEP and SEARCH cannot be selected for F•1 CINEZONE FORM.

Procedure

PIC → F•2 CINELITE/HDR → F•5 HDR ZONE: OFF / ON

HDR ZONE = OFF

Leader LV5600 - CINEZONE Display - 1

natural_image Thermal or heat map visualization of a mountainous region with color-coded temperature zones (no text or labels)

HDR ZONE = ON

Leader LV5600 - CINEZONE Display - 2

natural_image Mountainous landscape with colorful temperature gradient overlay (no text or symbols)

Figure 14-8 CINEZONE display

14. HDR Display (SER23)

To set the display colors, follow the procedure below. If you set REF at boundary of the SDR area and HDR area, the SDR area can be displayed in monochrome and HDR area in color. When Variable is set to on on the HDR tab, you can set the REF value. If set to off, the default value is used.

This setting is shared with REF.LEVEL [%] of the video signal waveform display.

UPPER or higher: Magenta

REF or higher, UPPER or lower: Gradation from blue to red

LOWER or higher, REF or lower: Monochrome

LOWER or lower: Black

Procedure

PIC → F•2 CINELITE/HDR → F•2 CINEZONE SETUP

→ F•2 UPPER [%]

→ F•3 LOWER [%]

→ F•4 REF [%]

The values vary depending on the HDR tab settings as follows.

Set the values as percentages (0.0 to 100.0%) of the input video level.

If MAXFALL and MAXCLL displays are set to ON, HDR equivalent values are displayed in the upper left corner of the screen.

[See also] MAXFALL and MAXCLL displays → 14.4, "MAXFALL and MAXCLL Displays"

Figure 14-1 Display color values

HDR ModeSetting rangeDefault UPPER valueDefault LOWER valueDefault REF value
HLG0.0 to 100.0100.00.0Ref. Level
PQ0.0 to 100.0100.00.0Ref. Level
S-Log33.5 to 109.4100.03.561.0

Use F•4 CINELITE ADVANCE to configure the link marker display settings.

[See also] CINELITE ADVANCE → 13.6.8, "Displaying Link Markers"

PIC → F•2 CINELITE/HDR → F•4 CINELITE ADVANCE: ON / OFF

14.4 MAXFALL and MAXCLL Displays

MAXFALL (Maximum Frame Average Light Level) is a function that calculates the maximum value among the R, G, and B values in each pixel and sums the maximums of all pixels. The sum is divided by the number of pixels per frame to derive the average in the frame. The average of each frame is compared among all frames from the start of measurement, and the maximum value is displayed.

The R, G, and B values are converted linearly from the start of the calculation through OETF or InverseOETF.

MAXCLL (Maximum Content Light Level) is a function that displays the maximum value among the R, G, and B values from the start of measurement. The R, G, and B values are converted linearly.

The R, G, and B values are converted linearly from the start of the calculation through OETF or InverseOETF.

14.4.1 Turning the Display On and Off

To display MAXFALL and MAXCLL at the top of the screen, follow the procedure below to turn the function on. In addition, on the CINEZONE display, the HDR equivalents of the display color settings are displayed in the upper left corner of the screen.

Procedure
Leader LV5600 - Turning the Display On and Off - 1

heatmap | Category | Value (%) | |---|---| | UPPER | 1200.00 | | REF | 100.00 | | LOWER | 0.00 | | MAXCLL | 1207.50 | | MAXFALL | 305.12 | | INPUT SELECT A | - | | up menu | - |

Figure 14-9 MAXFALL and MAXCLL displays

14.4.2 Starting and Stopping Measurements

To start or stop MAXFALL and MAXCLL measurements, follow the procedure below.

Procedure
PIC → F•2 CINELITE/HDR → F•3 MAX FALL/CLL → F•2 MEASURE: STOP / START

14. HDR Display (SER23)

14.4.3 Clearing Measurements

To clear MAXFALL and MAXCLL measurements, follow the procedure below.

Procedure

PICF•2CINELITE/HDRF•3MAX FALL/CLLF•3CLEAR

15. Audio Display

15. AUDIO DISPLAY

To display the audio screen, press AUDIO.

On the audio display, the embedded audio signal applied to SDI INPUT can be displayed on a meter. If SER03 is installed, Lissajous display, surround display, or status display can be shown with the meter display. External audio signals applied to DIGITAL AUDIO INPUT/OUTPUT and ANALOG AUDIO can also be measured. DIGITAL AUDIO INPUT/OUTPUT and ANALOG AUDIO can also be used as output terminals by switching them on the AUDIO IN/OUT tab.

When measuring embedded audio, switching to simul mode enables SDI inputs A to D to be displayed in combination with the audio. (They can be displayed even if F•1 A to F•4 D on the INPUT menu are set to OFF.)

Leader LV5600 - AUDIO DISPLAY - 1

bar | Series | A1 | A2 | A3 | A4 | A5 | A6 | A7 | A8 | |---|---|---|---|---|---|---|---|---| | Black Bar | -20.0 | -20.6 | -23.8 | -26.0 | -29.0 | -23.9 | -26.0 | -26.0 | | Green Bar | -20.0 | -20.0 | -20.0 | -20.0 | -20.0 | -20.0 | -20.0 | -20.0 | | Total | 0.0 | 0.0 | 0.0 | 0.0 | 0.0 | 0.0 | 0.0 | 0.0 |

Figure 15-1 Audio display
- Src

The Src line in the lower right of the display shows the following information in order from the left.

DisplayDescriptionReference
1. Input signal displayAES-15.1
2. Meter response model display TRUE PEAK / PPM(I) /PPM(II) / VU+TRUE /VU+PPM(I) / VU+PPM(II)- 15.5.2
3. Measurement signal displayEMBEmbedded audio15.1
AESExternal digital audio
ANAExternal analog audio

15. Audio Display

15.1 Setting the Signals to Measure

To configure the measurement signal settings, press F•7 MAPPING on the AUDIO menu.

Procedure

AUDIO → F•7 MAPPING

15.1.1 Selecting the Measurement Signal

On the TARGET tab, select the measurement signal, select the audio group, and assign the headphone output.

AUDIO → F•7 MAPPING → F•2 PREV TAB or F•3 NEXT TAB → TARGET LISSAJOU SURROUND AUDIO INPUT ANALOG OUT INPUT SELECT Input EMB AUDIO 3G-B Stream Select 1 2 EXT AUDIO Input Group A 3 CH Mode 8ch 16ch GROUP SELECT 1st Group INPUT-1 G1 INPUT-A1.G1.CH1/2 INPUT-A1.G1.CH3/4 2nd Group INPUT-2 G2 INPUT-A1.G2.CH5/6 INPUT-A1.G2.CH7/6 3rd Group INPUT-3 G4 4th Group INPUT-4 G5 PHONES L INPUT-A:CH1 R INPUT-A:CH2 COMPLETE PREV TAB NEXT TAB up menu

Figure 15-2 TARGET tab
- Input

Set the input signal to EMB AUDIO, EXT AUDIO, or ANALOG. If SER03 is not installed, the input signal is fixed to EMB AUDIO.

EMB AUDIO:The embedded audio signal applied to SDI INPUT is measured.
EXT AUDIO:The external audio signal applied to DIGITAL AUDIO INPUT/OUTPUT is measured.If both EXTERNAL AUDIO settings are set to OUTPUT on AUDIO IN/OUT tab, you cannot select EXT AUDIO.
ANALOG:The external audio signal applied to ANALOG AUDIO is measured.If ANALOG AUDIO is set to OUTPUT on AUDIO IN/OUT tab, you cannot select ANALOG AUDIO.

- 3G-B Stream Select

If INPUT is set to EMB AUDIO, select the 3G-B stream. This is invalid when the input signal is not 3G-B.

1/2

15. Audio Display

- EXT Audio Input Group

If INPUT is set to EXT AUDIO and both EXTERNAL AUDIO settings are set to Input on the AUDIO IN/OUT tab, select the input group.

A / B

- CH Mode

Select the number of measurement channels.

If INPUT is set to EMB AUDIO and CH Mode is set to 8ch, CH9/10 to CH15/16 cannot be selected.

If INPUT is set to EXT AUDIO and either of the EXTERNAL AUDIO settings is set to Output on the AUDIO IN/OUT tab, you cannot select 16ch.

This cannot be selected when INPUT is set to ANALOG.

8ch / 16ch

15.1.2 Channel Assignment for the Lissajous Display (SER03)

On the LISSAJOU tab, assign channels from the audio group selected with GROUP SELECT and Lt and Rt (excluding some channels).

Leader LV5600 - Channel Assignment for the Lissajous Display (SER03) - 1

flowchart
graph TD
    A["AUDIO → F•7"] --> B["MAPPING → F•2"]
    B --> C["PREV TAB or F•3"]
    C --> D["NEXT TAB →"]
    D --> E["TARGET"]
    E --> F["LISSAJOU"]
    F --> G["SURROUND"]
    G --> H["AUDIO INPUT"]
    H --> I["ANALOG OUT"]
    I --> J["ASSIGN(SINGLE)"]
    J --> K["L INPUT-A:CH1"]
    K --> L["R INPUT-A:CH2"]
    L --> M["L INPUT-A:CH1"]
    M --> N["L INPUT-A:CH1"]
    N --> O["L INPUT-A:CH1"]
    O --> P["L INPUT-A:CH1"]
    P --> Q["L INPUT-A:CH1"]
    Q --> R["L INPUT-A:CH1"]
    R --> S["L INPUT-A:CH1"]
    S --> T["L INPUT-A:CH1"]
    T --> U["L INPUT-A:CH1"]
    U --> V["L INPUT-A:CH1"]
    V --> W["L INPUT-A:CH1"]
    W --> X["L INPUT-A:CH1"]
    X --> Y["L INPUT-A:CH1"]
    Y --> Z["L INPUT-A:CH1"]
    Z --> AA["L INPUT-A:CH1"]
    AA --> AB["L INPUT-A:CH1"]
    AB --> AC["L INPUT-A:CH1"]
    AC --> AD["L INPUT-A:CH1"]
    AD --> AE["L INPUT-A:CH1"]
    AE --> AF["L INPUT-A:CH1"]
    AF --> AG["L INPUT-A:CH1"]
    AG --> AH["L INPUT-A:CH1"]
    AH --> AI["L INPUT-A:CH1"]
    AI --> AJ["L INPUT-A:CH1"]
    AJ --> AK["L INPUT-A:CH1"]
    AK --> AL["L INPUT-A:CH1"]
    AL --> AM["L INPUT-A:CH1"]
    AM --> AN["L INPUT-A:CH1"]
    AN --> AO["L INPUT-A:CH1"]
    AO --> AP["L INPUT-A:CH1"]
    AP --> AQ["L INPUT-A:CH1"]
    AQ --> AR["L INPUT-A:CH1"]
    AR --> AS["L INPUT-A:CH1"]
    AS --> AT["L INPUT-A:CH1"]
    AT --> AU["L INPUT-A:CH1"]
    AU --> AV["L INPUT-A:CH1"]
    AV --> AW["L INPUT-A:CH1"]
    AW --> AX["L INPUT-A:CH1"]
    AX --> AY["L INPUT-A:CH1"]
    AY --> AZ["L INPUT-A:CH1"]
    AZ --> BA["L INPUT-A:CH1"]
    BA --> BB["L INPUT-A:CH1"]
    BB --> BC["L INPUT-A:CH1"]
    BC --> BD["L INPUT-A:CH1"]
    BD --> BE["L INPUT-A:CH1"]
    BE --> BF["L INPUT-A:CH1"]
    BF --> BG["L INPUT-A:CH1"]
    BG --> BH["L INPUT-A:CH1"]
    BH --> BI["L INPUT-A:CH1"]
    BI --> BJ["L INPUT-A:CH1"]
    BJ --> BK["L INPUT-A:CH1"]
    BK --> BL["L INPUT-A:CH1"]
    BL --> BM["L INPUT-A:CH1"]
    BM --> BN["L INPUT-A:CH1"]
    BN --> BO["L INPUT-A:CH1"]
    BO --> BP["L INPUT-A:CH1"]
    BP --> BQ["L INPUT-A:CH1"]
    BQ --> BR["L INPUT-A:CH1"]
    BR --> BS["L INPUT-A:CH1"]
    BS --> BT["L INPUT-A:CH1"]
    BT --> BU["L INPUT-A:CH1"]
    BU --> BV["L INPUT-A:CH1"]
    BV --> BW["L INPUT-A:CH1"]
    BW --> BX["L INPUT-A:CH1"]
    BX --> BY["L INPUT-A:CH1"]
    BY --> BZ["L INPUT-A:CH1"]
    BZ --> CA["L INPUT-A:CH1"]
    CA --> CB["L INPUT-A:CH1"]
    CB --> CC["L INPUT-A:CH1"]
    CC --> CD["L INPUT-A:CH1"]
    CD --> CE["L INPUT-A:CH1"]
    CE --> CF["L INPUT-A:CH1"]
    CF --> CG["L INPUT-A:CH1"]
    CG --> CH["L INPUT-A:CH1"]
    CH --> CI["L INPUT-A:CH1"]
    CI --> CJ["L INPUT-A:CH1"]
    CJ --> CK["L INPUT-A:CH1"]
    CK --> CR["L INPUT-A:CH1"]
    CR --> CS["L INPUT-A:CH1"]
    CS --> CT["L INPUT-A:CH1"]
    CT --> CU["L INPUT-A:CH1"]
    CU --> CV["L INPUT-A:CH1"]
    CV --> CW["L INPUT-A:CH1"]
    CW --> CX["L INPUT-A:CH1"]
    CX --> CY["L INPUT-A:CH1"]
    CY --> CZ["L INPUT-A:CH1"]

Figure 15-3 LISSAJOU tab

15. Audio Display

15.1.3 Channel Assignment for the Surround Display (SER03)

On the SURROUND tab, assign channels from the audio group selected with GROUP SELECT.

Leader LV5600 - Channel Assignment for the Surround Display (SER03) - 1

flowchart
graph TD
    A["INPUT-A:CH1"] --> B["C"]
    C["INPUT-A:CH2"] --> B
    D["INPUT-A:CH3"] --> B
    E["INPUT-A:CH4"] --> B
    F["INPUT-A:CH5"] --> B
    G["INPUT-A:CH6"] --> B
    H["INPUT-A:CH7"] --> B
    I["INPUT-A:CH8"] --> B
    J["Ls INPUT-A:CH5"] --> B
    K["Rs INPUT-A:CH6"] --> B
    L["LfLo(LL) INPUT-A:CH7"] --> B
    M["LFE INPUT-A:CH4"] --> B
    N["Rt/Ro(RR) INPUT-A:CH8"] --> B

Figure 15-4 SURROUND tab

15.1.4 Configuring Audio Input/Output Connectors (SER03)

Use the AUDIO IN/OUT tab to configure the DIGITAL AUDIO INPUT/OUTPUT and ANALOG AUDIO connectors on the rear panel.

Leader LV5600 - Configuring Audio Input/Output Connectors (SER03) - 1

flowchart
graph TD
    A["AUDIO"] --> B["F•7 MAPPING"]
    B --> C["F•2 PREV TAB or F•3 NEXT TAB"]
    D["TARGET"] --> E["LISSAJOU SURROUND AUDIO INPUT ANALOG OUT"]
    F["EXTERNAL AUDIO"] --> G["Group A <CH1-CHB> INPUT OUTPUT"]
    F --> H["Group B <CH1-CHB> INPUT OUTPUT"]
    I["ANALOG AUDIO"] --> J["Select INPUT OUTPUT"]

Figure 15-5 AUDIO IN/OUT tab

15. Audio Display

- EXTERNAL AUDIO

Select whether to use the DIGITAL AUDIO INPUT/OUTPUT connectors of each group as input connectors or output connectors.

INPUT / OUTPUT

• ANALOG AUDIO

Select whether to use ANALOG AUDIO as input connectors or output connectors.

INPUT / OUTPUT

15.1.5 Channel Assignment for the Analog Audio Output Connector (SER03)

On the ANALOG OUT tab, if ANALOG AUDIO is set to OUTPUT on the AUDIO IN/OUT tab, assign channels to the ANALOG AUDIO connectors on the rear panel.

AUDIO → F•7 MAPPING → F•2 PREV TAB or F•3 NEXT TAB → TARGET LISSAJOU SURROUND AUDIO INPUT ANALOG OUT CH ASSIGN ANALOG-OUT:CH1 INPUT-A:CH1 ANALOG-OUT:CH2 INPUT-A:CH2 ANALOG-OUT:CH3 INPUT-A:CH3 ANALOG-OUT:CH4 INPUT-A:CH4 ANALOG-OUT:CH5 INPUT-A:CH5 ANALOG-OUT:CH6 INPUT-A:CH6 ANALOG-OUT:CH7 INPUT-A:CH7 ANALOG-OUT:CH8 INPUT-A:CH8 COMPLETE PREV TAB NEXT TAB up menu

Figure 15-6 ANALOG OUT tab

15.2 Selecting the Display Mode (SER03)

To select the display mode, follow the procedure below.

Procedure

AUDIO → F•1DISPLAY MODE: LISSAJOU / SURROUND / METER / STATUS
Settings
LISSAJOU:Lissajous curves are displayed. During 8-channel measurement, audio meters are also displayed.
SURROUND:The surround display is shown on the left side of the screen, and the audio meter is displayed on the right side of the screen.This option cannot be selected when during 16-channel measurement or in simul mode during embedded audio measurement.
METER:The audio meters are displayed. This option cannot be selected during 8-channel measurement.
STATUS:Shows the status. During 8-channel measurement, audio meters are also displayed.
LOUDNESS:The loudness values are displayed on a chart, on a meter, and as values.This option cannot be selected when during 16-channel measurement or in simul mode during embedded audio measurement.

15. Audio Display

DISPLAY MODE = LISSAJOU
Leader LV5600 - Audio Display - 1

bar | Series | A1 | A2 | A3 | A4 | A5 | A6 | A7 | A8 | |---|---|---|---|---|---|---|---|---| | L1 | -20.0 | -20.6 | -23.0 | -20.0 | -26.6 | -29.0 | -26.0 | -28.6 | | R1 | 0 | 0 | 0 | 0 | 0 | 0 | 0 | 0 | | L2 | 0 | 0 | 0 | 0 | 0 | 0 | 0 | 0 | | R2 | 0 | 0 | 0 | 0 | 0 | 0 | 0 | 0 | | A3 | 0 | 0 | 0 | 0 | 0 | 0 | 0 | 0 | | L3 | 0 | 0 | 0 | 0 | 0 | 0 | 0 | 0 | | A4 | 0 | 0 | 0 | 0 | 0 | 0 | 0 | 0 | | L4 | 0 | 0 | 0 | 0 | 0 | 0 | 0 | 0 | | R4 | 0 | 0 | 0 | 0 | 0 | 0 | 0 | 0 | | A5 | 0 | 0 | 0 | 0 | 0 | 0 | 0 | 0 | | R5 | 0 | 0 | 0 | 0 | 0 | 0 | 0 | 0 | | A6 | 0 | 0 | 0 | 0 | 0 | 0 | 0 | 0 | | R6 | 0 | 0 | 0 | 0 | 0 | 0 | 0 | 0 | | A7 | 0 | 0 | 0 | 0 | 0 | 0 | 0 | 0 | | R7 | 0 | 0 | 0 | 0 | 0 | 0 | 0 | 0 | | A8 | 0 | 0 | 0 | 0 | 0 | 0 | 0 | 0 | The chart displays a bar chart with two sets of lines (black and green) representing different series. The x-axis is labeled 'Display Mode LISSAJOU' to 'EMB', and the y-axis is labeled with 'METER SETUP' to 'MAPPING'. The legend indicates 'DISPLAY MODE LISSAJOU' through 'METER SETUP' and 'MAPPING'. The data is presented in a structured format with labels for each row.

DISPLAY MODE = SURROUND
Leader LV5600 - Audio Display - 2

bar | Category | Value | |---|---| | Display MODE SURROUND | -20 | | Meter Setup | -20 | | Surround Setup | -20 | | Error Setup | -20 | | Phones Volume B | -20 | | INPUT SELECT A | -20 | | Mapping | -20 |

DISPLAY MODE = METER
Leader LV5600 - Audio Display - 3

bar | Test | Display Mode Meter | Meter Setup | Error Setup | Phones Volume | INPUT SELECT A | Mapping | |---|---|---|---|---|---|---| | A:1 | -28.0 | -28.6 | -20.0 | -20.0 | -28.0 | -28.6 | | A:2 | -28.0 | -28.6 | -20.0 | -20.0 | -28.0 | -28.6 | | A:3 | -28.0 | -28.6 | -20.0 | -20.0 | -28.0 | -28.6 | | A:4 | -28.0 | -28.6 | -20.0 | -20.0 | -28.0 | -28.6 | | A:5 | -28.0 | -28.6 | -20.0 | -20.0 | -28.0 | -28.6 | | A:6 | -28.0 | -28.6 | -20.0 | -20.0 | -28.0 | -28.6 | | A:7 | -28.0 | -28.6 | -20.0 | -20.0 | -28.0 | -28.6 | | A:8 | -28.0 | -28.6 | -20.0 | -20.0 | -28.0 | -28.6 | | A:9 | -28.0 | -28.6 | -20.0 | -20.0 | -28.0 | -28.6 | | A:10 | -28.0 | -28.6 | -20.0 | -20.0 | -28.0 | -28.6 | | A:11 | -28.0 | -28.6 | -20.0 | -20.0 | -28.0 | -28.6 | | A:12 | -28.0 | -28.6 | -20.0 | -20.0 | -28.0 | -28.6 | | A:13 | -28.0 | -28.6 | -20.0 | -20.0 | -28.0 | -28.6 | | A:14 | -28.0 | -28.6 | -20.0 | -20.0 | -28.0 | -28.6 | | A:15 | -28.0 | -28.6 | -20.0 | -20.0 | -28.0 | -28.6 | | A:16 | -28.0 | -28.6 | -20.0 | -20.0 | -28.0 | -28.6 | The chart displays a single bar chart with two vertical bars at the bottom of each bar labeled '±'. The top row contains all four bars labeled 'A', while the bottom row contains five bars labeled '±'. The bottom row contains six bars labeled 'A', 'B', 'C', 'D', and 'E' in the top row.

15. Audio Display

DISPLAY MODE = STATUS
Leader LV5600 - Audio Display - 1

bar | Channel | A:1/A:5 | A:2/A:6 | A:3/A:7 | A:4/A:8 | | :--- | :--- | :--- | :--- | :--- | | Level (dBFS) | -20.0 | -20.0 | -20.0 | -20.0 | | Level Over | 0 | 0 | 0 | 0 | | Clip | 0 | 0 | 0 | 0 | | Mute (Silence) | 41 | 41 | 41 | 41 | | Parity Error | 0 | 0 | 0 | 0 | | Validity Error | 0 | 0 | 0 | 0 | | CRC Error | 2535 | 2535 | 2535 | 2535 | | Code Violation | 0 | 0 | 0 | 0 | | Reset 00:12:18 | | | | | Legend: | A-1 | METER SETUP | STATUS SETUP | ERROR SETUP | PHONES VOLUME | INPUT SELECT | MAPPING Source: AES TRUE PEAK EMB End

DISPLAY MODE = LOUDNESS
Leader LV5600 - Audio Display - 2

bar | Measurement | Value | | :--- | :--- | | CH-MODE | -22.3 | | MEASURE | -20.0 | | TARGET LV | -24.0 | LEVEL OVER 0.0dBTP

Figure 15-7 Selecting the display mode

15. Audio Display

15.3 Configuring Error Detection Settings

To configure the error detection and meter display settings, follow the procedure below.

Procedure

Leader LV5600 - Procedure - 1

ERROR SETUP AUDIO ERROR SETUP Level Over OFF ON Clip OFF ON Duration 1 sample(1~100) Mute OFF ON Duration 1000 ms(1~5000) Parity Error OFF ON Validity Error OFF ON CRC Error OFF ON Code Violation OFF ON METER INDICATION Clip OFF ON Mute OFF ON COMPLETE up menu

Figure 15-8 ERROR SETUP tab

- Level Over

Turn the level error detection on or off.

An error is detected when the level set with OVER dBFS is exceeded.

[See also] OVER dBFS → 15.5.4, "Setting the Reference Level"

OFF / ON

- Clip

Turn the clip error detection on or off.

OFF / ON

If set to ON, you can set the duration. An error is detected when the maximum signal extends beyond the number of samples set here.

1 - 100

- Mute

Turn the mute error detection on or off.

OFF / ON

If set to ON, you can set the duration. An error is detected when a mute signal lasts longer than the duration set here.

1 - 1000 - 5000

15. Audio Display

- Parity Error

Turn the parity error detection on or off.

OFF / ON

- Validity Error

Turn the validity error detection on or off.

OFF / ON

- CRC Error

Turn the CRC error detection on or off.

OFF / ON

- Code Violation

Turn the code violation error detection on or off.

OFF / ON

- Clip (METER INDICATION)

If Clip is set to ON, turn on or off the "CLIP" indication that appears when errors occur.

OFF / ON

- Mute (METER INDICATION)

If Mute is set to ON, turn on or off the "M" indication that appears when errors occur.

OFF / ON

15.4 Adjusting the Volume

To adjust the headphone volume, follow the procedure below.

Press the function dial (F•D) to return the setting to its default value (0).

Procedure

AUDIO → F•5 PHONES VOLUME: 0 - 63

15. Audio Display

15.5 Meter Display

Meters are always displayed excluding the Lissajous display and status display during 16-channel management.

To configure meter display settings, press F•3 METER SETUP on the AUDIO menu.

Leader LV5600 - Meter Display - 1
Figure 15-9 Meter display

15.5.1 Selecting the Scale

To select the meter's scale, follow the procedure below.

However, if Input is set to ANALOG on the TARGET tab and ANALOG AUDIO is set to INPUT on the AUDIO IN/OUT tab, you cannot select 90DBFS.

Procedure

AUDIOF•3METER SETUP →F•1DYNAMIC RANGE: 60DBFS / 90DBFS / MAG

Settings

60DBFS:The meter's scale is set to -60 to 0 (dBFS).
90DBFS:The meter's scale is set to -90 to 0 (dBFS).
MAG:The meter's scale is set to the level specified by F•5 LEVEL SETTING → F•3 REF dBFS ±3 dB.

15.5.2 Selecting the Response Model

To select the meter's response model, follow the procedure below. The selected response model is indicated in the lower right of the screen.

Procedure
AUDIO → F•3 METER SETUP → F•2 RESPONSE: TRUEPEAK / PPM / VU → F•3 PPM MODE: PPM(I) / PPM(II) (for PPM) → F•3 PEAK METER: TRUE / PPM(I) / PPM(II) (for VU)

The response model settings (typical) are detailed below.

F•2 RESPONSEF•3 F•3 PPM MODE / PEAK METERDisplay Delay time (*1)Return time (*2)Average time
TRUEPEAK-TRUE PEAK0 msec1.7 sec
PPMPPM(I)PPM(I)10 msec1.7 sec
PPM(II)PPM(II)10 msec2.8 sec
VUTRUEVU+TRUE--
PPM(I)VU+PPM(I)--
PPM(II)VU+PPM(II)--

*1 The amount of time it takes for the meter to show -20 dBFS when a -20 dBFS/1 kHz sine-wave signal is applied with no input preceding it.
*2 The amount of time it takes for the meter to show -40 dBFS when a -20 dBFS/1 kHz sine-wave signal is removed from the input.

15.5.3 Setting the Peak Hold

When F•2 RESPONSE is set to VU, to set the peak hold time, follow the procedure below. The unit is seconds. You can set the value in 0.5-second steps.

Press the function dial (F•D) to return the setting to its default value (0.5).

Procedure
AUDIO → F•3 METER SETUP → F•4 PEAK HOLD: 0.0 - 0.5 - 5.0 / HOLD

15. Audio Display

15.5.4 Setting the Reference Level

To set the reference level, press F•5 LEVEL SETTING on the METER SETUP menu.

Leader LV5600 - Setting the Reference Level - 1

flowchart
graph LR
    A["AUDIO"] --> B["F•3"]
    B --> C["METER SETUP"]
    C --> D["F•5"]
    D --> E["LEVEL SETTING"]
    F["F1 OVER dBFS 0.0"] --> G["F2 WARNING dBFS -18.0"]
    G --> H["F3 REF dBFS -20.0"]
    H --> I["F4"]
    I --> J["F5"]
    J --> K["F6"]
    K --> L["F7 up menu"]
    M["F•1"] --> N["F•2"]
    N --> O["F•3"]
    O --> P["F•4"]
    P --> Q["F•5"]
    Q --> R["F•6"]
    R --> S["F•7"]

Figure 15-10 LEVEL SETTING menu

To set the meter reference level, follow the procedure below.

Procedure

AUDIO → F•3 METER SETUP → F•5 LEVEL SETTING → F•1 OVER dBFS: -40.0 - 0.0 → F•2 WARNING dBFS: -40.0 - -18.0 - 0.0 → F•3 REF dBFS: -40.0 - -20.0 - 0.0

Settings

OVER dBFS: Set the threshold level for audio level errors. WARNING dBFS: The portion of the meter that exceeds the level specified here is displayed in red. The portion of the meter below this level is displayed in yellow. REF dBFS: The portion of the meter that exceeds the level specified here is displayed in yellow. The portion of the meter below this level is displayed in green.

15. Audio Display

15.6 Lissajous Display (SER03)

To display Lissajous curves, set F•1 DISPLAY MODE on the AUDIO menu to LISSAJOU. To configure the Lissajous display settings, press F•2 LISSAJOU SETUP. This setting is available when F•1 DISPLAY MODE is set to LISSAJOU.

Leader LV5600 - Lissajous Display (SER03) - 1

bar AUDIO → F•1 DISPLAY MODE and select LISSAJOU → F•2 LISSAJOU SETUP → | Channel | Audio | Pulse | Amplitude (A) | Phase (R) | | :--- | :--- | :--- | :--- | :--- | | L1 | -30.0 | -29.0 | 0 | 0 | | R1 | -30.0 | -29.0 | -20 | -20 | | L2 | -30.0 | -29.0 | 0 | 0 | | R2 | -30.0 | -29.0 | -15 | -15 | | L3 | -30.0 | -29.0 | 0 | 0 | | R3 | -30.0 | -29.0 | -30 | -30 | | L4 | -30.0 | -29.0 | 0 | 0 | | R4 | -30.0 | -29.0 | -30 | -30 | | LISSAJOU INTEN 0 | 0 | 4 | 0 | 0 | | SCALE INTEN 4 | 0 | 4 | 0 | 0 | | DISPLAY MULTI | 0 | 4 | 0 | 0 | | FORM X-V | 0 | 4 | 0 | 0 | | AUTO GAIN ON | 0 | 4 | 0 | 0 | | INPUT SELECT A | 0 | 4 | 0 | 0 | | up menu | 0 | 4 | 0 | 0 | Source: AES TRUE PEAK EMB

Figure 15-11 Lissajous display

• Correlation Meter

The correlation meter indicates the phase difference between the two signals. A reading of +1 indicates that the signals are in-phase, a reading of -1 indicates that the signals are 180irc out of phase, and a reading of 0 indicates that the signals are not correlated.

15.6.1 Adjusting the Lissajous Curve Intensity

To set the Lissajous curve intensity, follow the procedure below.

Press the function dial (F•D) to return the setting to its default value (0).

Procedure

AUDIO → F•2 LISSAJOU SETUP → F•1 LISSAJOU INTEN: -8 - 0 - 7

15.6.2 Adjusting the Scale Intensity

To adjust the intensity of the Lissajous and meter scales, follow the procedure below. Press the function dial (F•D) to return the setting to its default value (4).

Procedure

AUDIO → F•2 LISSAJOU SETUP → F•2 SCALE INTEN: -8 - 4 - 7

15. Audio Display

15.6.3 Selecting the Lissajous Curve Display Format

To select the Lissajous curve display format, follow the procedure below.

Procedure

AUDIO → F•2LISSAJOU SETUP → F•3DISPLAY: MULTI / SINGLE
Settings
MULTI:Eight channels of Lissajous waveforms and eight channels of audio meters are displayed or 16 channels of Lissajous waveforms are displayed.
SINGLE:Two channels of Lissajous waveforms and eight channels of audio meters are displayed.This option cannot be selected in simul mode or 16-channel measurement.

DISPLAY = MULTI
Leader LV5600 - Selecting the Lissajous Curve Display Format - 1

bar | Category | Value | |---|---| | L1 | -20 | | R1 | -20 | | L2 | -20 | | R2 | -20 | | L3 | -20 | | R3 | -20 | | L4 | -20 | | R4 | -20 | | A1 | 0 | | A2 | 0 | | A3 | 0 | | A4 | 0 | | A5 | 0 | | A6 | 0 | | A7 | 0 | | A8 | 0 | | Subplot Table: | Label | Color | |---|---| | LISSAJOU INTEN 0 | Green | | SCALE INTEN 4 | Green | | DISPLAY MULTI | Green | | FORM X-V | Green | | AUTO GAIN ON | Green | | INPUT SELECT A | Green | | up menu | Green |

DISPLAY = SINGLE
Leader LV5600 - Selecting the Lissajous Curve Display Format - 2

bar | Category | Value | |---|---| | A:1 | -20.0 | | A:2 | -20.0 | | A:3 | -20.0 | | A:4 | -20.0 | | A:5 | -20.0 | | A:6 | -20.0 | | A:7 | -20.0 | | A:8 | -20.0 | | Subplot | Label | | :--- | :--- | | LISSAJOU INTEN 0 | | | SCALE INTEN 4 | | | DISPLAY SINGLE | | | FORM X-Y | | | AUTO GAIN ON | | | INPUT SELECT A | | | up menu | |

Figure 15-12 Selecting the Lissajous curve display format

15.6.4 Selecting the Scale Display Format

To select the scale display format, follow the procedure below.

Procedure

AUDIO → F•2LISSAJOU SETUP → F•4FORM: X-Y / MATRIX
Settings
X-Y:R is assigned to the X-axis (horizontal), and L is assigned to the Y-axis (vertical).
MATRIX:The R and L axes are positioned at 45° angles to the X and Y axes.

Leader LV5600 - Selecting the Scale Display Format - 1

natural_image Symmetrical abstract line drawing with labeled axes (L, R, -1, 0, +1) and no readable text or symbols

Leader LV5600 - Selecting the Scale Display Format - 2

natural_image Abstract 3D wireframe diagram with labeled axes L and R, no readable text or symbols

Figure 15-13 Selecting the scale display format

15. Audio Display

15.6.5 Setting the Lissajous Curve Gain

To select the Lissajous curve gain, follow the procedure below.

Procedure

AUDIO → F•4 LISSAJOU SETUP → F•5 AUTO GAIN: ON / OFF

Settings

ON: The gain is automatically adjusted so that the waveform fits the scale.

OFF: The waveform is displayed with a fixed gain.

AUTO GAIN = ON AUTO GAIN = OFF

L1 R1 -1 0 +1 L2 R2 -1 0 +1 L3 R3 -1 0 +1 L4 R4 -1 0 +1

L1 R1 -1 θ +1 L2 R2 -1 θ +1 L3 R3 -1 θ +1 L4 R4 -1 θ +1

Figure 15-14 Setting the Lissajous curve gain

15.7 Surround Display (SER03)

To show the surround display, set F•1 DISPLAY MODE on the AUDIO menu to SURROUND. To configure the surround display settings, press F•2 SURROUND SETUP. This setting is available when F•1 DISPLAY MODE is set to SURROUND.

AUDIO → F•1 DISPLAY MODE and select SURROUND → F•2 SURROUND SETUP →

Leader LV5600 - Surround Display (SER03) - 1

bar | Category | Value | |---|---| | A:1 | -26.0 | | A:2 | -29.6 | | A:3 | -29.0 | | A:4 | -26.2 | | A:5 | -29.6 | | A:6 | -29.9 | | A:7 | -30.0 | | A:8 | -29.6 | | L | -20 | | R | -20 | | C | -20 | | LFE | -20 | | Lb | -20 | | Rs | -20 | | Lt | -20 | | Rt | -20 | Source: AES TRUE PEAK EMB SALURENTEN INTEN 4 SURROUND 5.1 NORMAL AUTO GAIN ON INPUT SELECT A up menu

Figure 15-15 Surround display

15. Audio Display

15.7.1 Adjusting the Surround Waveform Intensity

To adjust the surround waveform intensity, follow the procedure below. Press the function dial (F•D) to return the setting to its default value (4).

Procedure

15.7.2 Adjusting the Scale Intensity

To adjust the intensity of the surround and meter scales, follow the procedure below. Press the function dial (F•D) to return the setting to its default value (4).

Procedure

AUDIOF•2SURROUND SETUP →F•2SCALE INTEN: -8 - 4 - 7

15. Audio Display

15.7.3 Selecting the Surround Display Format

To select the surround display format, follow the procedure below.

If adjacent channels (including Lch and Rch for PHANTOM) are of opposite phases, the scale between the channels is displayed in red.

Procedure

AUDIOF•2SURROUND SETUP →F•3SURROUND 5.1: NORMAL / PHANTOM

Settings

NORMAL:A waveform that combines Lch, Rch, Lsch, Rsch, and Cch (hard center) is displayed.
PHANTOM:A waveform that combines Lch, Rch, Lsch, Rsch, and phantom center and a Cch (hard center) waveform are displayed separately.

SURROUND 5.1 = NORMAL SURROUND 5.1 = PHANTOM
C L R Ls Rs

C L R Ls Rs

Figure 15-16 Selecting the surround display format

15.7.4 Setting the Surround Waveform Gain

To select the surround waveform gain, follow the procedure below.

Procedure

AUDIOF•2SURROUND SETUP →F•5AUTO GAIN: ON / OFF

Settings

ON:The gain is automatically adjusted so that the waveform fits the scale.
OFF:The waveform is displayed with a fixed gain.

15. Audio Display

15.8 Status Display (SER03)

To display the status, set F•1 DISPLAY MODE on the AUDIO menu to STATUS.

To configure the status display settings, press F•3 STAUS SETUP. This setting is available when F•1 DISPLAY MODE is set to STATUS.

AUDIO → F•1 DISPLAY MODE and select STATUS → F•3 STAUS SETUP →

Leader LV5600 - Status Display (SER03) - 1

bar | Channel | A:1/A:5 | A:2/A:6 | A:3/A:7 | A:4/A:8 | | :--- | :--- | :--- | :--- | :--- | | Level (dBFS) | -20.0 | -20.0 | -20.0 | -20.0 | | Level Over | 0 | 0 | 0 | 0 | | Clip | 0 | 0 | 0 | 0 | | Mute (Silence) | 41 | 41 | 41 | 41 | | Parity Error | 0 | 0 | 0 | 0 | | Validity Error | 0 | 0 | 0 | 0 | | CRC Error | 2535 | 2535 | 2535 | 2535 | | Code Violation | 0 | 0 | 0 | 0 | | Reset | 00:20:45 | | | | Event LOG CHANNEL STATUS USER BIT ERROR RESET INPUT SELECT A up menu

Figure 15-17 Status display

15.8.1 Status Screen Description

On the status display, the levels and the number of detected errors are displayed for the selected channels (up to 9999). Errors are only detected for the items that have been set to ON in section 15.3, "Configuring Error Detection Settings."

- Channel

Displays the channel. Each item below this item is displayed in two lines. The top line corresponds to the channel to the left of the slash, and the bottom line corresponds to the channel to the right of the slash.

- Level (dBFS)

Displays the level numerically.

- Level Over

Displays the number of times the level is greater than equal to the OVER dBFS value set in section 15.5.4, "Setting the Reference Level."

- Clip

Displays the number of times that a received signal exceeds the maximum signal value for the number of consecutive samples specified in section 15.3, "Configuring Error Detection Settings."

15. Audio Display

- Mute (Silence)

Displays the number of times that a mute signal exceeding the duration specified in section 15.3, "Configuring Error Detection Settings" is received.

- Parity Error

Counts the number of times that the input signal's parity bit and the recalculated parity bit differ.

- Validity Error

Counts the number of times that the input signal's validity bit is 1.

- CRC Error

Counts the number of times that the CRC of the channel status bits and the calculated CRC are different.

- Code Violation

Counts the number of times that the state of the input signal's biphase modulation is abnormal.

- Reset

Displays the time that has elapsed since → F3 STATUS SETUP → F5 ERROR RESET were pressed.

15.8.2 Event Log Display

To view the event log, follow the procedure below.

This screen is the same as the event log screen of the status display. For details, see section 16.4, "Configuring Event Log Settings."

Procedure

Leader LV5600 - Procedure - 1

EVENT LOG LIST SAMPLE No.5 << NOW LOGGING >> 5: 2018/07/12 15:29:27 D 1920x1080/29.97P 4: 2018/07/12 15:29:27 C 1920x1080/29.97P 3: 2018/07/12 15:29:27 B 1920x1080/59.94I 2: 2018/07/12 15:29:27 - EMB-AUDIO 1: 2018/07/12 15:29:27 A 1920x1080/59.94I CRC EDH TRS_P TRS_C ILLEGAL LINE CABLE_ERR CHK PRTY GMUT CGMUT FRZ BLK LVL_Y LVL_C A_BCH A_PRTY A_DBN A_INH A_SMP SDI_DELAY FREQ FORMAT_ALARM

Figure 15-18 Event log display

15. Audio Display

15.8.3 Channel Status Display

To display the status of the selected channel, follow the procedure below.

Use F•1 DISPLAY CHANNEL to select the channel. You can also use F•2 ALIGN to select the bit order.

Procedure

Leader LV5600 - Channel Status Display - 1

AES/EBU CHANNEL STATUS DISPLAY AES-3 DISPLAY CHANNEL : 1 FORMAT : Professional AUDIO DATA : PCM EMPHASIS : No emphasis SIGNAL LOCK : Locked SAMPLING FREQ: 48kHz REFERENCE : Not reference CH MODE : Two-channel RESOLUTION : 24bits ALIGNMENT : Not indicated ORIGIN : DESTINATION : TIME-OF-DAY : 00:00:00 CRC : NORMAL Byte : 01234567 00 : 10100001 01 : 00010001 02 : 00110100 03 : 00000000 04 : 00000000 05 : 00000000 06 : 00000000 07 : 00000000 08 : 00000000 09 : 00000000 10 : 00000000 11 : 00000000 Src: AES EMB 01234567 12 : 00000000 13 : 00000000 14 : 00000000 15 : 00000000 16 : 00000000 17 : 00000000 18 : 00000000 19 : 00000000 20 : 00000000 21 : 00000000 22 : 00000000 23 : 1010001 DISPLAY CHANNEL 1 ALIGN LSB 1st INPUT SELECT A up menu

Figure 15-19 Channel status display

15. Audio Display

15.8.4 Displaying User Bits

To display the user bits of the selected channel, follow the procedure below.

Use F•1 DISPLAY CHANNEL to select the channel. You can also use F•2 ALIGN to select the bit order.

Procedure

Leader LV5600 - Displaying User Bits - 1

Leader LV5600 - Displaying User Bits - 2

Figure 15-20 Displaying user bits

15.8.5 Resetting Errors

To reset the error counts that appear on the status display to 0, follow the procedure below. Also, the Reset indication at the lower left of the screen will be reset to 00:00:00.

Procedure

Leader LV5600 - Resetting Errors - 1

15. Audio Display

15.9 Loudness Display (SER03)

On the loudness display, the loudness values are displayed on a chart, on a meter, and as values. This setting is available when F•1 DISPLAY MODE is set to LOUDNESS. Loudness display is not possible in 16-channel measurement or in simul mode during embedded audio measurement. To configure loudness display settings, press F•3 LOUDNESS SETUP on the audio menu. This setting is available when F•1 DISPLAY MODE is set to LOUDNESS.

15.9.1 Loudness Display Explanation

You can measure the loudness of one input or two inputs on the loudness display. To switch between one input and two inputs, press F•5 LOUDNESS SETTING, and use the CHANNEL SUB tab.

MOMENTARY INTEGRATED PEAK(dBTP) L : -19.0 R : -19.0 LEVEL OVER -40 dBTP OVER 6 7 MEAS 5 MAIN CH-MODE : STEREO INTEGRATED: -22.4 LKFS 1.6 LU MOMENTARY : -21.6 LKFS 2.4 LU MAX : -20.0 LKFS TARGET LV : -24.0 LKFS RELATIVE 13 DISPLAY MODE LOUDNESS METER SETUP LOUDNESS SETUP 15 ERROR SETUP PHONES VOLUME 0 INPUT SELECT A MAPPING

Figure 15-21 One input (MAIN) loudness display
AES EMB INTEGRATED MAIN L PEAK(dBTP) L : -19.0 S-L: -19.0 R : -19.0 S-R: -19.0 C : -19.0 LFE: -19.0 La : -19.0 Rs : -19.0 LEVEL OVER 40.0dBTP OVER MEAS MAIN CH-MODE : 5.1 STEREO INTEGRATED: -17.9 -22.5 LKFS 6.2 1.5 LU MOMENTARY : -15.9 -20.6 LKFS 8.1 3.4 LU MAX : -15.5 -20.2 LKFS TARGET LV : -24.0 -24.0 LKFS RELATIVE RELATIVE 13 DISPLAY MODE METER LOUDNESS VOLUME SETUP LOUDNESS SETUP ERROR SETUP PHONES VOLUME INPUT SELECT MAPPING 0 A.1 A.2 A.3 A.4 A.5 A.6 A.7 A.8

Figure 15-22 Two input (MAIN and SUB) loudness display

15. Audio Display

1 Loudness Chart Display

One of the following values that you specified with F•5 LOUDNESS SETTING is displayed on a time-based chart.

  • Integrated loudness and momentary loudness of one input (MAIN)
  • Integrated loudness and short-term loudness of one input (MAIN)
  • Integrated loudness of two inputs (MAIN and SUB)
  • Momentary loudness of two inputs (MAIN and SUB)
  • Short-term loudness of two inputs (MAIN and SUB)

You can press F•1 PERIOD to change the measurement time. You can press F•4 MAG to expand the level scale. The green line indicates the target level.

To start measuring, set F•3 MEASURE to START. You can also use pin 9 (/P8) of the remote connector or a time code.

To clear the loudness chart, press F•2 CHART CLEAR. You can also use pin 8 (/P7) of the remote connector.

[See also] 15.9.6, "Configuring Loudness Settings," and 18, "Remote Control"

2 OVER

If dBTP Over Mark is set to ON on the LOUDNESS2 tab that appears when the peak level of a channel is greater than or equal to the level specified by OVER dBFS, a red ▼ is displayed at the top of the chart. An OVER mark is also displayed.

Neither mark is displayed when Level Over under ERROR SETUP is set to OFF.

[See also] OVER dBFS →15.5.4, "Setting the Reference Level."

ERROR SETUP →15.3, "Configuring Error Detection Settings."

3 PEAK(dBTP)

This displays the peak levels of the channels that have been assigned on the CHANNEL MAIN, CHANNEL SUB tab. You can press F•2 CHART CLEAR to clear the peak levels.

The values are normally displayed in white, but when a value is greater than or equal to the value specified by OVER dBFS, it is displayed in red.

[See also] OVER dBFS →15.5.4, "Setting the Reference Level."

4 LEVEL OVER

The level specified by OVER dBFS is displayed when Level Over under ERROR SETUP is set to ON and dBTP Over Mark is set to ON on the LOUDNESS SETTING tab.

[See also] OVER dBFS →15.5.4, "Setting the Reference Level."

ERROR SETUP →15.3, "Configuring Error Detection Settings."

5 MEAS / STOP / READY

"MEAS" is displayed during loudness measurement, and "STOP" is displayed when measurement is stopped, "READY" is displayed when the instrument is standing by.

6 Meter Display

The levels of the channels that you selected in section 15.1, "Setting the Signals to Measure" are displayed on a meter. In addition, correlation meters of adjacent channels are displayed at the top area of the meter. The correlation meter indicates the phase difference between the two signals. The right edge indicates in-phase, the left edge indicates 180irc out of phase, and the center indicates no correlation.

15. Audio Display

7 Loudness Meter Display (only for one input measurement)

The short-term loudness or the momentary loudness selected using Loudness Response on the LOUDNESS2 tab is displayed using meters. The level is normally displayed in green, but it is displayed in red if it exceeds the target level.

8 CH-MODE

This displays the channel mode that was selected on the CHANNEL MAIN, CHANNEL SUB tab.

9 INTEGRATED

The integrated loudness is displayed as values. The top value is an absolute value. The bottom value is a relative value with the target level as the reference. These values are normally displayed in white, but they are displayed in red when:

  • The measurement mode is ARIB or EBU and the loudness level is outside the range defined by the target level ± 1 (LU).
  • The measurement mode is ATSC and the loudness level is outside the range defined by the target level ± 2 (LK).

10 SHORTTERM / MOMENTARY

The short-term loudness or the momentary loudness selected using Loudness Response on the LOUDNESS2 tab is displayed as values.

The top value is an absolute value. The bottom value is a relative value with the target level as the reference.

11 MAX

The maximum value of the short-term loudness or momentary loudness selected using Loudness Response on the LOUDNESS2 tab is displayed as a value.

12 TARGET LV

This displays the target level. The target level varies according to the measurement mode as shown below.

  • When the measurement mode is not EBU: -24.0 (LKFS)
  • When the measurement mode is EBU: -23.0 (LUFS)

13 RELATIVE

This indication appears when the input signal is applicable for relative gating. This is displayed when Relative Gating Lamp is set to ON on the LOUDNESS2 tab.

14 INTEGRATED / SHORTTERM / MOMENTARY (only for two input measurement)

This displays the loudness type that was selected on the LOUDNESS SETTING tab Chart Setting.

15. Audio Display

15 LOUDNESS SETUP

To configure loudness display settings, press F•3 LOUDNESS SETUP on the audio menu. This setting is available when F•1 DISPLAY MODE is set to LOUDNESS.

Leader LV5600 - LOUDNESS SETUP - 1

flowchart
graph LR
    A["AUDIO"] --> B["F•3"]
    B --> C["LOUDNESS SETUP"]
    C --> D["F1 PERIOD 2MIN"]
    C --> E["F2 CHART CLEAR"]
    C --> F["F3 MEASURE STOP"]
    C --> G["F4 MAG OFF"]
    C --> H["F5 LOUDNESS SETTING"]
    C --> I["F6"]
    C --> J["F7 up menu"]

Figure 15-23 LOUDNESS SETUP menu

15.9.2 Selecting the Measurement Time

To select the measurement time, follow the procedure below.

Procedure

AUDIO → F•3 LOUDNESS SETUP → F•1 PERIOD: 2MIN / 10MIN / 30MIN / 1HOUR / 2HOUR / 6HOUR / 12HOUR / 24HOUR

15.9.3 Clearing the Loudness Measurement

To clear the loudness chart, peak level, and numeric displays, follow the procedure below.

Procedure

AUDIO → F•3 LOUDNESS SETUP → F•2 CHART CLEAR

15.9.4 Starting and Stopping Measurements

To start and stop measurements, follow the procedure below. When measurements are being performed, "MEAS" is displayed in the center of the screen. When measurements are stopped, "STOP" is displayed. "READY" is displayed when measurement is in standby.

This menu item does not appear when Trigger on the LOUDNESS2 tab is set to REMOTE.

Procedure

AUDIO → F•3 LOUDNESS SETUP → F•3 MEASURE: STOP / START

15.9.5 Selecting the Scale

To select the loudness chart display scale, follow the procedure below.

Procedure

AUDIO → F•3 LOUDNESS SETUP → F•4 MAG: OFF / ON

Settings

OFF:The target level is displayed on the scale that you selected with DYNAMIC RANGE on the METER SETUP menu.
ON:The target level is displayed on a scale that has a full scale ranging from -18 to +9 (LK/LU).

15. Audio Display

15.9.6 Configuring Loudness Settings

To configure loudness settings, follow the procedure below.

Procedure

AUDIO → F•3 LOUDNESS SETUP → F•5 LOUDNESS SETTING

AUDIO → F•3 LOUDNESS SETUP → F•5 LOUDNESS SETTING → F•2 PREV TAB or F•3 NEXT TAB →

LOUDNESS1 LOUDNESS2 CHANNEL MAIN CHANNEL SUB INTEGRATED LOUDNESS Measure Mode BS1770 ARIB EBU ATSC CUSTOM Target Level -24.0 LKFS (-25.0 - -23.0) Block Size 400 ms Absolute Gating -70 LKFS Overlap Size 75 % Relative Gating -10 LKFS LFE Gain OFF ON ShortTerm Loudness Average Time 3000 ms Momentary Loudness Average Time 400 ms COMPLETE PREV NEXT up TAB TAB up menu

Figure 15-24 LOUDNESS1 tab

- Measure Mode

Select the measurement mode.

BS1770 / ARIB / EBU / ATSC / CUSTOM

Depending on the measurement mode, the parameters vary as shown below.

Table 15-1 Selecting the measurement mode

Measure Mode
BS1770ARIBEBUATSCCUSTOM
Corresponding StandardITU-RBS.1770ARIBTR-B32EBU R128ATSC A/85 -
Target Level-24.0 [LKFS]-24.0[LKFS]-23.0[LUFS]-24.0[LKFS]-25.0 to -23.0[LKFS]
Block Size (ms)400400400400400
Overlap Size (%)757575075
Absolute Gating-70 [LKFS]-70 [LKFS]-70 [LUFS]--70 [LKFS]
Relative Gating-10 [LKFS]-10 [LKFS]-10 [LUFS]--10 [LKFS]

15. Audio Display

- LFE Gain

When Measure Mode is set to CUSTOM on the CHANNEL MAIN tab, select whether to measure LFEch. When this is set to ON, you can set the LFEch gain to a value from 0 to 10.

OFF / ON

- ShortTerm Loudness

Set the time that is used to calculate the short-term loudness.

200 - 3000 - 10000

• Momentary Loudness

Set the time that is used to calculate the momentary loudness.

200 - 400 - 10000

AUDIO → F•3 LOUDNESS SETUP → F•5 LOUDNESS SETTING → F•2 PREV TAB or F•3 NEXT TAB →

LOUDNESS1 LOUDNESS2 CHANNEL MAIN CHANNEL SUB CHART AND TERM SETTING Loudness Response ShortTerm Momentary Chart Setting Integrated ShortTerm Momentary LOUDNESS AUTO MEASURE Trigger OFF REMOTE Timecode Mute CM LOUDNESS AUTO MEASURE dBTP Over Mark OFF ON Relative Gating Lamp OFF ON COMPLETE PREV TAB NEXT TAB up menu

Figure 15-25 LOUDNESS2 tab

- Loudness Response

Select the response model.

When MODE on the CHANNEL SUB tab is set to MONO (ARIB) or STEREO, setting Loudness Response to ShortTerm also sets Chart Setting to ShortTerm, and setting Loudness Response to Momentary also sets Chart Setting to Momentary.

ShortTerm / Momentary

15. Audio Display

- Chart Setting

When MODE on the CHANNEL SUB tab is set to MONO (ARIB) or STEREO, select the type of loudness to display on the loudness chart.

Setting Chart Setting to ShortTerm also sets Loudness Response to ShortTerm, and setting Chart Setting to Momentary also sets Loudness Response to Momentary.

Integrated / ShortTerm / Momentary

- Trigger

Select the automatic loudness measurement mode from the available settings below.

OFF:Automatic measurement is disabled. You must set the loudness measurement on the LOUDNESS SETUP menu.
REMOTE:Measurement start, stop, and clear are executed through the remote control connector. See chapter 18, “REMOTE CONTROL.”You have to press → •2 SYSTEM SETUP, and then set Remote Select to Recall and Loudness on the REMOTE SETUP tab.
Timecode:Measurement start and stop are executed on the basis of the time codes embedded in the SDI signals. Set Start Time and End Time first, and then set •3 MEASURE on the LOUDNESS SETUP menu to START. “STOP” in the center of the screen changes to “READY.” When the time specified by Start Time arrives, measurement starts automatically.You need to select the time code using → •2 SYSTEM SETUP →CAPTURE&DISPLAY tab → Time.
Mute:Measurement start, stop, and clear and storage to USB memory are executed through input signals.

If you select Mute, on the LOUDNESS SETUP menu, press F•3 MEASURE to select START, and then apply the material to measure. "READY" appears in the center of the display.

Leader LV5600 - - Trigger - 1

flowchart
graph LR
    A["No sound"] --> B["Audio (leader)"]
    B --> C["No sound"]
    C --> D["Audio (body)"]
    D --> E["No sound"]
    E --> F["Audio (leader)"]
    F --> G["No sound"]
    style A fill:#f9f,stroke:#333
    style B fill:#ccf,stroke:#333
    style C fill:#cfc,stroke:#333
    style D fill:#fcc,stroke:#333
    style E fill:#cff,stroke:#333
    style F fill:#ffc,stroke:#333
    style G fill:#fcc,stroke:#333

Figure 15-26 Mute explanation

a) When and audio (leader) is received, loudness measurement is cleared.
b) Loudness measurement starts 1 second after the detection of no sound. "MEAS" appears in the center of the display.
c) Loudness measurement stops 3 seconds after the detection of no sound. If a USB memory device is connected, the loudness data is automatically saved to the device. "READY" appears in the center of the display.

You can measure multiple materials in succession by applying subsequent materials.

15. Audio Display

- dBTP Over Mark

Select whether to display a ▼ mark and the "OVER" mark when the peak level of a channel is greater than or equal to the level specified by OVER dBFS.

Neither mark is displayed when Level Over under ERROR SETUP is set to OFF.

[See also] OVER dBFS →15.5.4, "Setting the Reference Level."

ERROR SETUP →15.3, "Configuring Error Detection Settings."

OFF / ON

- Relative Gating Lamp

Select whether to display "R" when the input signal is applicable for relative gating.

OFF / ON

AUDIO → F•3 LOUDNESS SETUP → F•5 LOUDNESS SETTING → F•2 PREV TAB or F•3 NEXT TAB →

LOUDNESS1 LOUDNESS2 CHANNEL MAIN CHANNEL SUB CHANNEL MAIN MODE ■ MONO(ARIB) ■ STEREO ■ 5.1 ■ CUSTOM L ■ CH1 ■ CH2 ■ CH3 ■ CH4 ■ CH5 ■ CH6 ■ CH7 ■ CH8 ■ CH9 ■ CH10 ■ CH11 ■ CH12 ■ CH13 ■ CH14 ■ CH15 ■ CH16 ■ N.C. R ■ CH1 ■ CH2 ■ CH3 ■ CH4 ■ CH5 ■ CH6 ■ CH7 ■ CH8 ■ CH9 ■ CH10 ■ CH11 ■ CH12 ■ CH13 ■ CH14 ■ CH15 ■ CH16 ■ N.C. C ■ CH1 ■ CH2 ■ CH3 ■ CH4 ■ CH5 ■ CH6 ■ CH7 ■ CH8 ■ CH9 ■ CH10 ■ CH11 ■ CH12 ■ CH13 ■ CH14 ■ CH15 ■ N.C. LFE ■ CH1 ■ CH2 ■ CH3 ■ CH4 ■ CH5 ■ CH6 ■ CH7 ■ CH8 ■ CH9 ■ CH10 ■ CH11 ■ CH12 ■ CH13 ■ CH14 ■ CH15 ■ N.C. La ■ CH1 ■ CH2 ■ CH3 ■ CH4 ■ CH5 ■ CH6 ■ CH7 ■ CH8 ■ CH9 ■ CH10 ■ CH11 ■ CH12 ■ CH13 ■ CH14 ■ CH15 ■ N.C. Rs ■ CH1 ■ CH2 ■ CH3 ■ CH4 ■ CH5 ■ CH6 ■ CH7 ■ CH8 ■ CH9 ■ CH10 ■ CH11 ■ CH12 ■ CH13 ■ CH14 ■ CH15 ■ N.C. COMPLETE PREV NEXT up menu

Figure 15-27 CHANNEL MAIN tab

- MODE

Select the main loudness measurement channel.

MONO(ARIB): The channel that you select for L-Rch is measured.

STEREO: The channels that you select for Lch and Rch are measured.

5.1: The channels that you select for Lch, Rch, Cch, LFEch, Lsch, and Rsch are measured.

CUSTOM: The channels that you select for Lch, Rch, Cch, LFEch, Lsch, and Rsch are measured. N.C. can be selected during embedded audio measurement.

Channels set to N.C. are not measured.

15. Audio Display

AUDIO → F•3 LOUDNESS SETUP → F•5 LOUDNESS SETTING → F•2 PREV TAB or F•3 NEXT TAB →

LOUDNESS1 LOUDNESS2 CHANNEL MAIN CHANNEL SUB CHANNEL SUB MODE OFF MONO(ARIB) STEREO L CH1 CH2 CH3 CH4 CH5 CH6 CH7 CH8 CH9 CH10 CH11 CH12 CH13 CH14 CH15 CH16 R CH1 CH2 CH3 CH4 CH5 CH6 CH7 CH8 CH9 CH10 CH11 CH12 CH13 CH14 CH15 CH16 COMPLETE PREV TAB NEXT TAB up menu

Figure 15-28 CHANNEL SUB tab

- MODE

Select the sub loudness measurement channel.

OFF: Sub loudness is not measured.

MONO(ARIB): The channel that you select for L-Rch is measured.

STEREO: The channels that you select for Lch and Rch are measured.

15. Audio Display

15.9.7 Saving to a USB Memory Device

You can save the loudness data to a USB memory device as a .csv file and as a text file. To save a file with a name that you specify, follow the procedure below.

  1. Connect a USB memory device to the instrument.
  2. Press F•6 USB MEMORY.

The file list display appears.

This setting appears when a USB memory device is connected to the instrument.

External USB Flash Drive Loudness File List No. Filename Date&Time Size(byte) 1 20160607153833.csv 2016/06/07 15:38:33 16,155 2 20160607153833.txt 2016/06/07 15:38:33 873 Disk Size: 4,001,902,592 Byte Loudness Store File Name Free Size: 3,654,942,720 Byte .csv AUTO FILENAME ON STORE FILE DELETE up menu

Figure 15-29 File list display

  1. Set F•1 AUTO FILENAME to OFF.
  2. Press F•2 NAME INPUT.

The file name input display appears.

[F.D_NOB] = CHAR SELECT , [F.D_PUSH] = CHAR SET & Function Key Edit LOUDNESS Store File Name csv

Figure 15-30 File name input display

15. Audio Display

5. Enter a file name using up to 14 characters.

The key operations that you can perform on the file name input display are as follows:

F•1CLEAR ALL: Deletes all characters
F•2DELETE: Deletes the character at the cursor
F•4<=: Moves the cursor to the left
F•5=>: Moves the cursor to the right
F•6CHAR SET: Enters the character

Function Dial (F•D) : Turn to select a character, and press to enter the character.

You can copy the file name of an already saved file. To copy a file name, move the cursor to the file in the file list whose name you want to copy, and then press the function dial (F•D).

6. Press F•7 up menu.

7. Press F•3 STORE.

When the message "Saving file - Please wait." disappears, the file has been successfully saved.

If a file with the same name already exists on the USB memory device, an overwrite confirmation menu appears. To overwrite the current file, press F•1 OVER WR YES. To cancel the save operation, press F•3 OVER WR NO.

- Deleting a Loudness Data

To delete a loudness data that has been saved to the USB memory device, select the log file on the file list display, and then press F•4 FILE DELETE. To delete the file, press F•1 DELETE YES. To cancel the delete operation, press F•3 DELETE NO.

• Automatic File Name Generation

If you set F•1 AUTO FILENAME to ON, the file name will be generated automatically in the format "YYYYMMDDhhmmss" when you save the file. In this situation, F•2 NAME INPUT is not displayed.

- USB Memory Device Folder Structure

Loudness data is saved in the LOUDNESS folder.

USB memory device
LV5600_USER or LV7600_USER
LOUDNESS
YYYYMMDDhhmmss.csv
YYYYMMDDhhmmss.txt

- Loudness Data Explanation

In txt data, the contents set using F•5 LOUDNESS SETTING and integrated loudness values are stored. Judgment ([OK] or [NG]) on the basis of THRESHOLD is also stored.

In csv data, the current time, timecodes, main loudness values, and sub loudness values are stored. Data values of about 10 points are stored per second.

txt data example csv data example

2012/07/12 10:32:31 << SETTING DATA and RESULT >>

LOUDNESS SETTING

MEASURE MODE : ARIB

TARGET LEVEL : -24.0 LKFS

THRESHOLD : -25.0 \~ -23.0 LKFS

BLOCK SIZE : 400 msec

OVERLAP SIZE : 75 %

ABS GATING LV : -70.0 LKFS

REL GATING LV : -10.0 LKFS

LFE GAIN : OFF

LOUDNESS RESPONSE

RESPONSE : MOMENTARY

10:30:330:09:38-20.6-25.2
10:30:330:09:38-100-100
10:30:340:09:39-22.6-27.3
10:30:340:09:39-19-23.6
10:30:340:09:39-17-21.6
10:30:340:09:39-15.6-20.3
10:30:340:09:39-14.9-19.5
10:30:340:09:39-14.4-19
10:30:340:09:39-13.9-18.5
10:30:340:09:39-13.7-18.4
10:30:340:09:39-15-19.6
10:30:340:09:39-16.9-21.6
10:30:340:09:39-20.6-25.2
10:30:350:09:40-22.6-27.3
10:30:350:09:40-19-23.6
10:30:350:09:40-17-21.6
10:30:350:09:40-15.2-19.8
10:30:350:09:40-14.4-19
10:30:350:09:40-14.2-18.8
10:30:350:09:40-15.1-19.8
10:30:350:09:40-16.9-21.6
10:30:350:09:40-19.8-24.4
10:30:350:09:40-20.4-25
10:30:360:09:41-17.9-22.5
10:30:360:09:41-16.1-20.7

16. STATUS DISPLAY

To display the status, press STATUS.

1920x1080/59.94I YCbCr(422) 10bit HD SDI A TIME: 16:42:30 STATUS SIGNAL FORMAT Freq Cable Embedded Audio A CH DETECT 1920x1080/59.94I HD -0.0ppm 1,2,3,4,5,6,7,8,9,10,11,12,13,14,15,16 ERROR SDI A CH ANC A CH CRC 0 Check Sum 0 TRS Pos 0 Parity 0 TRS Code 0 ILLEGAL Code 0 Line Number 0 Embedded Audio A CH Video Quality A CH BCH 0 Freeze Parity 0 Black DBN 0 Gamut Inhibit 0 Comp Gamut Audio Sample 0 Level Y Level C SinceReset 00:00:31 EVENT SDI ANC DATA STATUS INPUT ERROR LOG ANALYSIS VIEWER PACKET SETUP A CLEAR

Figure 16-1 Status display

16.1 Status Screen Description

- SIGNAL

If the instrument is receiving an SDI signal, "DETECT" is displayed. Otherwise, "NO SIGNAL" is displayed.

If "NO SIGNAL" is displayed, the following items are not displayed.

• FORMAT/SUB IMAGE FORMAT

The input signal format is indicated. It is normally displayed in light blue, but if the input is not appropriate, it turns red.

- Freq

The sampling frequency deviation is displayed.

Normally, this is displayed in light blue. If Frequency Error on the ERROR SETUP1 tab is set to ON, the color changes to red when ±10 ppm is exceeded.

The display range is "<-100 ppm, -100 to +100 ppm, >+100 ppm," and the accuracy is ±2 ppm.

[See also] ERROR SETUP1 tab → section 16.2.1, "Error Setup 1"

16. Status Display

- Cable

The input signal attenuation is converted into a cable length that you selected and displayed. Normally the value is displayed in light blue, but by setting Cable Error on the ERROR SETUP1 tab to ON, if the value exceeds the specified Warning value, it will change to yellow. If the value exceeds the Error value, it will change to red.

The display range, accuracy, and resolution are shown below.

[See also] ERROR SETUP1 tab → section 16.2.1, "Error Setup 1"

- Display Range

12G< 10 m, 10 to 80 m, > 80 m(5 m steps)
3G< 10 m, 10 to 100 m, > 100 m(5 m steps)
HD< 10 m, 10 to 130 m, > 130 m(5 m steps)
SD< 50 m, 50 to 200 m, > 200 m(5 m steps)

- Accuracy

1 2 G, 3 G, HD ± 2 0 m

SD ± 3 0 m

- Resolution 10 m

- Embedded Audio

The channels of the audio packets embedded in the input signal are displayed.

If the input signal is 3G-B-DL, only stream 1 is displayed. (When measuring 3G-B-DS, stream 2 is also displayed.)

- ERROR

The counts of the errors for the items whose detection setting was set to ON with F•5 STATUS SETUP are displayed. Errors are counted once per second or once per field. The maximum number of errors that can be counted is 999999.

Switching video formats or input channels may cause disturbances in the signal that will cause errors to be detected.

- CRC (other than SD)

An error is counted when the CRC embedded in the input signal is different from the CRC that the instrument calculates.

- EDH (SD only)

An error is counted when the EDH packet contains an ancillary data error flag, an active picture error flag, or a full-field error flag and when the CRC in the EDH packet is different from the CRC that the instrument calculates from the video data.

- TRS Pos

Input signal TRS (Timing Reference Signal) errors are displayed.

An error is counted when the position of the header word (3FFh, 000h, 000h) of EAV (End of Active Video) and SAV (Start of Active Video) is not correct or when the F, V, or H TRS protection bit is outside the video specifications (such as when the blanking period is different).

- TRS Code

Input signal TRS (Timing Reference Signal) protection bit errors are displayed.

16. Status Display

An error is counted when the correspondence between F, V, and H in the protection bits (XYZ) of EAV (End of Active Video) and SAV (Start of Active Video) and error correction flags P3, P2, P1, and P0 is outside the video specifications.

- ILLEGAL Code

An error is counted when the input signal data is outside the timing reference signal (TRS) range or the range specified for the ancillary data flag (ADF) and "000h to 003h" or "3FCh to 3FFh" is detected.

In SDI signals, 000h to 003h and 3FCh to 3FFh (expressed as 10 bit data) are designed to be used as timing reference signals and ancillary data flags, they cannot be used as video signal data or ancillary data. An error is counted when data other than timing reference signal or ancillary data flag is present in this area.

• Line Number (other than SD)

An error is counted when the line number that is embedded in the input signal does not match the line number that has been counted by the instrument.

- Check Sum

The instrument uses the checksum in the input signal's ancillary data header to count errors.

- Parity

The instrument uses the parity bit in the input signal's ancillary data header to count errors.

- BCH (other than SD)

The instrument counts the errors in the BCH code in the input signal's embedded audio.

- Parity (other than SD)

The instrument counts the parity errors in the input signal's embedded audio.

• DBN

The instrument counts the continuity errors in the input signal's embedded audio. Embedded audio packets contain data block number words (DBN), which indicate packet continuity. A serial number between 1 and 255 is assigned to each packet. An error is counted when this DBN is not continuous between packets.

16. Status Display

- Inhibit

An error is counted when embedded audio packets are found in lines where they should not be embedded. The embedding inhibit lines are as follows.

However, for 3G-B-DL 60p, 59.94p, 50p, 48p, and 47.95p, the transmission scanning mode is interlace. For 12G, the line numbers are those of the sub images divided into the 3G data structure.

Table 16-1 Embedding inhibit lines

FormatTransmission Scanning Mode
ProgressiveInterlace
12G3840(4096)×2160Line 8-
HD/3G1280×720Line 8-
1920×1080Line 8Lines 8, 570
SD720×487-Lines 11, 274
720×576-Lines 7, 320

- Audio Sample

An error is counted when audio that is asynchronous to the video is embedded. For the video and audio to be synchronized, there is a specific number of audio data samples that need to be embedded in a given number of video frames. If this rule is not met, it is considered an error.

- Freeze

An error is counted when the video data is the same between video frames. Specify an area of the video to use for detection and the number of continuous frames that is required for the condition to be detected as an error.

Video data is compared using checksums.

- Black

An error is counted when the video luminance level is less than the specified value.

Set the luminance level for detecting error pixels, the ratio of error pixels in a frame, and the number of continuous frames that is required for the condition to be detected as an error.

• Gamut

Gamut errors are counted.

Set the upper and lower limits for detecting errors, the ratio of error pixels in a frame, and the number of continuous frames that is required for the condition to be detected as an error.

- Comp Gamut

Composite gamut errors are counted.

Set the upper and lower limits for detecting errors, the ratio of error pixels in a frame, and the number of continuous frames that is required for the condition to be detected as an error.

- Level Y

An error is counted when the luminance level is outside the specified range.

Set the upper and lower limits for detecting errors.

- Level C

An error is counted when the chrominance level is outside the specified range.

Set the upper and lower limits for detecting errors.

16. Status Display

- SinceReset

The time that has elapsed since F•7 ERROR CLEAR was pressed, the instrument was initialized, or the instrument was restarted is displayed.

16. Status Display

16.2 Configuring Error Detection Settings

To configure the error detection settings, use F•5 STATUS SETUP.

When error detection is set to ON, the following actions are performed when an error occurs.

  • Counts errors on the status display.
  • Displays errors in the event log of the status display
  • Displays "ERROR" in the upper right of the display.
    • Transmits a signal from the alarm output remote terminal

16.2.1 Error Setup 1

Use the ERROR SETUP1 tab to configure error detection settings for SDI signals.

STATUS → F●5 STATUS SETUP → F●2 PREV TAB or F●3 NEXT TAB → ERROR SETUP1 ERROR SETUP2 ERROR SETUP3 ERROR SETUP4 SDI Error Setup Error Counter Sec Field 12G Cable L-5.5CUHD TRS Error OFF ON 12G Cable Error / Warning 80 m / 80 m Line Number Error(Except SD) OFF ON 3G Cable LS-5CFB 1694A CRC Error(Except SD) OFF ON 3G Cable Error / Warning 100 m / 100 m EDH Error(SD) OFF ON HD Cable LS-5CFB 1694A Illegal Code Error OFF ON HD Cable Error / Warning 130 m / 130 m Frequency Error OFF ON SD Cable L-5C2V 8261 Cable Error OFF ON SD Cable Error / Warning 200 m / 200 m COMPLETE PREV TAB NEXT TAB up menu

Figure 16-2 ERROR SETUP1 tab

  • Error Counter
Sec:Errors are counted in units of seconds. Even if multiple errors occur within the same second, only a single error is counted.
Field:Errors are counted in units of fields (frames). Even if multiple errors occur within the same field (frame), only a single error is counted.

- TRS Error

Select whether to detect TRS Pos and TRS Code errors.

OFF / ON

• Line Number Error(Except SD)

Select whether to detect line number errors. This setting is valid when the input signal is not SD.

OFF / ON

16. Status Display

- CRC Error(Except SD)

Select whether to detect CRC errors. This setting is valid when the input signal is not SD.

OFF / ON

- EDH Error(SD)

Select whether to detect EDH errors. This setting is valid when the input signal is SD.

OFF / ON

- Illegal Code Error

Select whether to detect illegal code errors.

OFF / ON

- Frequency Error

Select whether to detect frequency deviation errors.

Even when this is set to OFF, the frequency deviation is still shown in the status display.

OFF / ON

- Cable Error

Select whether to detect cable errors.

Even when this is set to OFF, the cable length is still shown in the status display.

OFF / ON

• 12G Cable Error / Warning

Set the upper cable error limit and the upper cable warning limit for 12G input signals. If the value on the left side is exceeded, an error will occur, and the measured value on the status display will be displayed in red.

If the value on the right side is exceeded, a warning will occur, and the measured value on the status display will be displayed in yellow.

The cable used in cable length measurement is L-5.5CUHD.

10 - 80 m

- 3G Cable

Select the cable to use for cable length measurements when the input signal is 3G.

LS-5CFB / 1694A

• 3G Cable Error / Warning

Set the upper cable error limit and the upper cable warning limit for 3G input signals. If the value on the left side is exceeded, an error will occur, and the measured value on the status display will be displayed in red.

If the value on the right side is exceeded, a warning will occur, and the measured value on the status display will be displayed in yellow.

10 - 100 m

16. Status Display

- HD Cable

Select the cable to use for cable length measurements when the input signal is HD.

LS-5CFB / 1694A

• HD Cable Error / Warning

Set the upper cable error limit and the upper cable warning limit for HD input signals. If the value on the left side is exceeded, an error will occur, and the measured value on the status display will be displayed in red.

If the value on the right side is exceeded, a warning will occur, and the measured value on the status display will be displayed in yellow.

10 - 130 m

- SD Cable

Select the cable to use for cable length measurements when the input signal is SD.

L-5C2V / 8281

• SD Cable Error / Warning

Set the upper cable error limit and the upper cable warning limit for SD input signals. If the value on the left side is exceeded, an error will occur, and the measured value on the status display will be displayed in red.

If the value on the right side is exceeded, a warning will occur, and the measured value on the status display will be displayed in yellow.

50 - 200 m

16.2.2 Error Setup 2

Use the ERROR SETUP2 tab to configure ancillary data and embedded audio error detection settings.

STATUS → F●5 STATUS SETUP → F●2 PREV TAB or F●3 NEXT TAB → ERROR SETUP1 ERROR SETUP2 ERROR SETUP3 ERROR SETUP4 Ancillary Data Error Setup Parity Error OFF ON Checksum Error OFF ON Embedded Audio Error Setup BCH Error(Except SD) OFF ON DBN Error OFF ON Parity Error(Except SD) OFF ON Inhibit Line Error OFF ON Sample Count Error OFF ON COMPLETE PREV TAB NEXT TAB up menu

Figure 16-3 ERROR SETUP2 tab

16. Status Display

- Parity Error

Select whether to detect parity errors in the ancillary data.

OFF / ON

- Checksum Error

Select whether to detect checksum errors in the ancillary data.

OFF / ON

- BCH Error(Except SD)

Select whether to detect BCH errors in the embedded audio. This setting is valid when the input signal is not SD.

OFF / ON

- DBN Error

Select whether to detect DBN errors in the embedded audio.

OFF / ON

- Parity Error(Except SD)

Select whether to detect parity errors in the embedded audio. This setting is valid when the input signal is not SD.

OFF / ON

- Inhibit Line Error

Select whether to detect embedding errors in the embedded audio.

OFF / ON

- Sample Count Error

Select whether to detect sample number errors in the embedded audio.

An error is counted when audio that is asynchronous to the video is embedded. If a certain number of audio data samples are not embedded in a certain number of video frames, it will be considered and error (as defined in SMPTE ST 299 and SMPTE ST 272).

OFF / ON

16.2.3 Error Setup 3

In the ERROR SETUP3 tab, configure gamut error settings.

STATUS → F•5 STATUS SETUP → F•2 PREV TAB or F•3 NEXT TAB → ERROR SETUP1 ERROR SETUP2 ERROR SETUP3 ERROR SETUP4 Video Error Setup LowPass Filter OFF HD/SD:1MHz HD:2.8MHz SD:1MHz Gamut Error OFF ON Gamut Upper 109.4 %(90.8~109.4) 768 mv 3PE HEX(1022 DEC) Gamut Lower -7.2 %(-7.2~6.1) -50 mv 001 HEX( 1 DEC) Area N(0.3~0.0) Duration For= (1~60) Composite Gamut Error OFF ON Setup 5 0% 7.5% NTSC PAL Composite Upper 135.0 %(90.0~135.0) 964 mv 945 mv Composite Lower -40.0 %(-40.0~20.0) -286 mv -280 mv Area 4(0.3~5.0) Duration For= (1~60) a COMPLETE PREV TAB NEXT TAB up menu

Figure 16-4 ERROR SETUP3 tab

- LowPass Filter

Select the frequency response of the low-pass filter used for gamut error and composite gamut error detection. Set this to remove transient errors caused by overshoot and other anomalies.

HD/SD:1MHz / HD:2.8MHz SD:1MHz / OFF

- Gamut Error

Select whether to detect gamut errors.

ON / OFF

- Gamut Upper

Set the gamut error upper limit. An error occurs when the input signal level exceeds the specified value.

In the 5-bar GBR display, levels that are greater than or equal to the specified value are displayed in red.

90.8 - 109.4%

- Gamut Lower

Set the gamut error lower limit. An error occurs when the input signal level goes below the specified value.

In the 5-bar GBR display, levels that are less than or equal to the specified value are displayed in red.

-7.2 - 6.1%

16. Status Display

- Area

Specify the percentage of the active picture area over which errors must occur to be recognized as an error. You cannot configure this setting when Gamut Error is set to OFF.

0.0 - 1.0 - 5.0%

- Duration

Set the number of consecutive video frames over which errors must occur to be recognized as an error. You cannot configure this setting when Gamut Error is set to OFF.

1 - 60 Frames

- Composite Gamut Error

Select whether to detect composite gamut errors.

ON / OFF

- Setup

Select the setup level to add when converting component signals to composite signals.

0%: No setup level is added.

7.5%: A setup level of 7.5 % is added.

- Composite Upper

Set the composite gamut error upper limit. An error occurs when the input signal level exceeds the specified value.

In the 5-bar CMP display, levels that are greater than or equal to the specified value are displayed in red.

90.0 - 135.0%

- Composite Lower

Set the composite gamut error lower limit. An error occurs when the input signal level goes below the specified value.

In the 5-bar CMP display, levels that are less than or equal to the specified value are displayed in red.

-40.0 - 20.0%

- Area

Specify the percentage of the active picture area over which errors must occur to be recognized as an error. You cannot configure this setting when Composite Gamut Error is set to OFF.

0.0 - 1.0 - 5.0%

16. Status Display

- Duration

Set the number of consecutive video frames over which errors must occur to be recognized as an error. You cannot configure this setting when Composite Gamut Error is set to OFF.

1 - 60 Frames

16.2.4 Error Setup 4

On the ERROR SETUP4 tab, configure freeze error, black error, and level error settings.

ERROR SETUP1 ERROR SETUP2 ERROR SETUP3 ERROR SETUP4 Video Error Setup Freeze Error OFF ON Level Error OFF ON Area Upper 0 %(0~100) Luminance Upper 786 mV(-51~766) Area Lower 0 %(0~100) Luminance Lower -51 mV(-51~766) Area Left 0 %(0~100) Chroma Upper 399 mV(-400~399) Area Right 0 %(0~100) Chroma Lower -400 mV(-400~399) Duration 2 Frame(2~300) Black Error OFF ON Level 0 %(0~100) Area 100 %(1~100) Duration 1 Frame(1~300) COMPLETE PREV TAB NEXT TAB up menu

Figure 16-5 ERROR SETUP4 tab

- Freeze Error

Select whether to detect freeze errors. If you set this to OFF, you cannot configure the following settings.

ON / OFF

16. Status Display

• Area Upper / Area Lower / Area Left / Area Right

Set what percent of each active picture area (the upper, lower, left, and right areas) will not be subject to error detection.

0 - 100%

Active picture area Area Upper Area Left Error detection target area Area Right Area Lower 100% 100%

- Duration

Set the number of consecutive video frames over which errors must occur to be recognized as an error.

2 - 300 Frames

- Black Error

Select whether to detect black errors. If you set this to OFF, you cannot configure the following settings.

ON / OFF

- Level

Set the black error level. Any signals that are less than or equal to the specified value will be detected as errors.

0 - 100%

- Area

Specify the percentage of the active picture area over which errors must occur to be recognized as an error.

1 - 100%

- Duration

Set the number of consecutive video frames over which errors must occur to be recognized as an error.

1 - 300 Frames

16. Status Display

- Level Error

Select whether to detect level errors. If you set this to OFF, you cannot configure the following settings.

ON / OFF

- Luminance Upper

Set the luminance level error upper limit. An error occurs when the input signal level exceeds the specified value.

In the 5-bar Y display, levels that are greater than or equal to the specified value are displayed in red.

-51 - 766mV

- Luminance Lower

Set the luminance level error lower limit. An error occurs when the input signal level goes below the specified value.

In the 5-bar Y display, levels that are less than or equal to the specified value are displayed in red.

-51 - 766mV

- Chroma Upper

Set the chroma level error upper limit. An error occurs when the input signal level exceeds the specified value.

-400 - 399mV

- Chroma Lower

Set the chroma level error lower limit. An error occurs when the input signal level goes below the specified value.

-400 - 399mV

16. Status Display

16.3 Clearing Error Counts

To clear the error counts and SinceReset, follow the procedure below.

Procedure

Leader LV5600 - Clearing Error Counts - 1

16.4 Configuring Event Log Settings

To display the event log, follow the procedure below.

The event log displays a list of the events that have occurred.

The applicable event-detection channels are all channels in A to D. However, when measuring 3G-B-DS, 3G(DL)-4K, or 12G, events are detected only on the currently displayed channel.

Procedure

Leader LV5600 - Configuring Event Log Settings - 1

EVENT LOG LIST SAMPLE No.5 << NOW LOGGING >> 5: 2018/07/12 15:29:27 D 1920x1080/29.97P 4: 2018/07/12 15:29:27 C 1920x1080/29.97P 3: 2018/07/12 15:29:27 B 1920x1080/59.94I 2: 2018/07/12 15:29:27 - EMB-AUDIO 1: 2018/07/12 15:29:27 A 1920x1080/59.94I CRC EDH TRS_P TRS_C ILLEGAL LINE CABLE_ERR CHK PRTY GMUT CGMUT FRZ BLK LVL_Y LVL_C A_BCH A_PRTY A_DBN A_INH A_SMP SDI_DELAY FREQ FORMAT_ALARM

Figure 16-6 Event log display

16.4.1 Event Log Screen Description

Events are listed on the event log screen by the time of their occurrence.

Turn the function dial (F•D) to the right to scroll the screen and view older events in the log. Press the function dial (F•D) to display the latest events.

- Notes

- When the same event occurs successively and when multiple events occur at the same time, they are treated as a single event.

- When multiple events occur at the same time, you may not be able to check all the events on the screen. When this happens, you can view all the events by saving them to a USB memory device.

- The event display is cleared when you turn the power off.

- Switching video formats or input channels may cause disturbances in the signal that will cause errors to be displayed.

16. Status Display

- Time Display

The time is displayed in the format specified by Time that you select by pressing SYS → F•2 SYSTEM SETUP.

- Channel display

The input channel is displayed.

A "-" is displayed for audio events detected by SER03.

- Format Display

The input format is displayed.

If there is no input signal, "NO SIGNAL" is displayed.

- Event Display

Events are displayed one line at a time in rectangular frames. In the frame, the event occurrence state is shown for the number that you selected with the function dial (F•D). Further, for audio events detected by SER03, the corresponding channels are shown. The colors are used in frames to indicate different states. Gray indicates not applicable for counting. White indicates no event. Red indicates that an event is occurring. Green indicates that an event occurred in the past (not occurring currently).

The events that are displayed in the event log are listed below.

Of the items listed below, only those whose detection settings have been set to ON on the SDI IN SETUP2 tab of the SYS menu, STATUS SETUP of the STATUS menu, ERROR SETUP of the EYE menu, and ERROR SETUP of the AUDIO menu are displayed.

Table 16-2 Events

Applicable Options Event Name (in frame)Event Name (one line display)Description
SER01/SER02/SER29CRCCRCCRC Error(Except SD)
EDHEDHEDH Error(SD)
TRS PositionTRS PositionTRS Position Error
TRS_CodeTRS_CodeTRS Code Error
Illegal CodeIllegal CodeIllegal Code Error
Line NumberLine NumberLine Number Error(Except SD)
Cable ErrorCable ErrorCable Error
Cable WarningCable WarningCable Warning
Check SumCheck SumAncillary Data Checksum Error
ParityParityAncillary Data Parity Error
GamutGamutGamut Error
Gamut ST1Gamut ST1Gamut Error Stream 1
Gamut ST2Gamut ST2Gamut Error Stream 2
Cmp. GamutCmp. GamutComposite Gamut Error
Cmp. Gamut ST1Cmp. Gamut ST1Composite Gamut Error Stream 1
Cmp. Gamut ST2Cmp. Gamut ST2Composite Gamut Error Stream 2
FreezeFreezeFreeze Error
Freeze ST1Freeze ST1Freeze Error Stream 1
Freeze ST2Freeze ST2Freeze Error Stream 2
BlackBlackBlack Error
  1. Status Display
Applicable Options Event Name(in frame)Event Name(one line display)Description
Black ST1Black ST1Black Error Stream 1
Black ST2Black ST2Black Error Stream 2
Level YLevel YLuminance Error
Level Y ST1Level Y ST1Luminance Error Stream 1
Level Y ST2Level Y ST2Luminance Error Stream 2
Level CLevel CChroma Error
Level C ST1Level C ST1Chroma Error Stream 1
Level C ST2Level C ST2Chroma Error Stream 2
Audio BCHAudio BCHEmbedded Audio BCH Error(Except SD)
Audio ParityAudio ParityEmbedded Audio Parity Error(Except SD)
Audio DBNAudio DBNEmbedded Audio DBN Error
Audio InhibitAudio InhibitEmbedded Audio Inhibit Line Error
Audio SampleAudio SampleEmbedded Audio Sample Count Error
FrequencyFrequencyFrequency Error
Format AlarmFormat AlarmFormat Alarm
SER02 (other than 12G)SER02+SER29 (12G)EYE JitterEYE 12G Jitter12G Jitter Error
EYE 3G Jitter3G Jitter Error
EYE HD JitterHD Jitter Error
EYE SD JitterSD Jitter Error
EYE T JitterEYE 12G T Jitter12G Timing Jitter Error
EYE 3G T Jitter3G Timing Jitter Error
EYE HD T JitterHD Timing Jitter Error
EYE SD T JitterSD Timing Jitter Error
EYE Tr_TfEYE 12G Tr_Tf12G Deltatime Error(Tr-Tf)
EYE 3G Tr_Tf3G Deltatime Error(Tr-Tf)
EYE HD Tr_TfHD Deltatime Error(Tr-Tf)
EYE SD Tr_TfSD Deltatime Error(Tr-Tf)
EYE TfEYE 12G Tf12G Falltime Error
EYE 3G Tf3G Falltime Error
EYE HD TfHD Falltime Error
EYE SD TfSD Falltime Error
EYE TrEYE 12G Tr12G Risetime Error
EYE 3G Tr3G Risetime Error
EYE HD TrHD Risetime Error
EYE SD TrSD Risetime Error
EYE Amp.EYE 12G Amp.12G Amplitude Error
EYE 3G Amp.3G Amplitude Error
EYE HD Amp.HD Amplitude Error
EYE SD Amp.SD Amplitude Error
EYE OrEYE 12G Or12G OverShoot Rising Error
EYE 3G Or3G OverShoot Rising Error
EYE HD OrHD OverShoot Rising Error
EYE SD OrSD OverShoot Rising Error
EYE OfEYE 12G Of12G OverShoot Falling Error
  1. Status Display
Applicable Options Event Name (in frame)Event Name (one line display)Description
EYE 3G Of3G OverShoot Falling Error
EYE HD OfHD OverShoot Falling Error
EYE SD OfSD OverShoot Falling Error
SER03ValidityValidityValidity Error
CRCCRCCRC Error
ClipClipClip
MuteMuteMute
Level Ov.Level Ov.Level Over
ParityParityParity Error
Code Vil.Code Vil.Code Violation

16. Status Display

16.4.2 Starting the Event Log

To start the event log, follow the procedure below.

Procedure

STATUSF•1EVENT LOG →F•1LOG: START / STOP
Settings
START:The event log is started. "NOW LOGGING" appears in the upper right of the event log.
STOP:The event log is stopped. "LOGGING STOPPED" appears in the upper right of the event log.

16.4.3 Clearing the Event Log

To delete the event log, follow the procedure below.

Procedure

STATUSF•1EVENT LOG →F•2CLEAR

16.4.4 Selecting the Overwrite Mode

Up to 1000 events can be displayed. To select the action to perform when more than 1000 events occur, follow the procedure below.

Procedure

STATUSF•1EVENT LOG →F•3LOG MODE: OVER WRT / STOP

Settings

OVER WRT:Oldest events are overwritten.
STOP:Additional events are not recorded.

16. Status Display

16.4.5 Saving to a USB Memory Device

You can save the event log to a USB memory device as a text file.

To save a file with a name that you specify, follow the procedure below.

  1. Used to connect USB memory.
  2. Press F•6 USB MEMORY.

The file list screen appears.

This setting appears when a USB memory device is connected.

External USB Flash Drive LOG File List No. Filename Date&Time Size(byte) 1 20180712164804.txt 2018/07/12 16:48:04 256 2 20180712164808.txt 2018/07/12 16:48:08 259 Disk Sizes: 4,003,266,560 Byte LOG Store File Name Free Sizes: 3,910,402,048 Byte .txt AUTO FILENAME ON STORE FILE DELETE up menu

Figure 16-7 File list screen

  1. Set F•1 AUTO FILENAME to OFF.
  2. Press F•2 NAME INPUT.

The file name input display appears.

[F.D_NOB] = CHAR SELECT , [F.D_PUSH] = CHAR SET & Function Key Edit LOG Block File Name CLEAR ALL DELETE <= => CHAR SET up menu

Figure 16-8 File name input screen

16. Status Display

  1. Enter a file name using up to 14 characters.

The key operations that you can perform in the file name input display are as follows:

F•1CLEAR ALLDeletes all characters
F•2DELETEDeletes the character at the cursor
F•4<=Moves the cursor to the left
F•5=>Moves the cursor to the right
F•6CHAR SETEnters the character
Function dial (F•D)Turn to select a character, and press to enter the character.

You can also copy the file name of an already saved file. To copy a file name, move the cursor to the file in the file list whose name you want to copy, and then press the function dial (F•D).

  1. Press F•7 up menu.
  2. Press F•3 STORE.

If a file with the same name that you have specified already exists on the USB memory device, an overwrite confirmation menu appears. To overwrite the existing preset, F•1 OVER WR YES. Otherwise, press F•3 OVER WR NO.

- Deleting an Event Log

To delete an event log that has been saved to the USB memory device, select the log file on the file list display, and then press F•4 FILE DELETE. To delete the file, press F•1 DELETE YES. To cancel the delete operation, press F•3 DELETE NO.

• Automatic File Name Generation

If you set F•1 AUTO FILENAME to ON, the file name will be generated automatically in the format "YYYYMMDDhhmmss" when you save the file. In this situation, F•2 NAME INPUT is not displayed.

• USB Memory Device Folder Structure

Event logs are saved in the LOG folder.

USB memory device LV5600_USER or LV7600_USER LOG YYYYMMDDhhmmss.txt

16.5 Configuring the Data Dump Settings

To view the data dump, follow the procedure below.

In the data dump, the data of the selected line is listed. You can change the line number using the V POS knob and the sample number using the H POS knob. (You can also use the function dial (F•D).

Changing this setting will also change the selected line on the video-signal-waveform, vector, and picture displays (excluding some of the 4K settings).

When an SER05 is installed, the SDI ANALYSIS becomes the SDI/IP ANALYSIS menu. Further, during an IP measurement when the signal standard is ST 2110, data dump cannot be displayed.

Procedure

STATUS → F•2 SDI ANALYSIS or SDI / IP ANALYSIS → F•1 DATA DUMP

1920x1080/59.941 YCbCr(422) 10bit HD DATA DUMP LINE No.1 SAMPLE Y Cb/Cr [EAV] <1920> 3FF 3FF [EAV] <1921> 000 000 [EAV] <1922> 000 000 [EAV] <1923> 2D8 2DB LN LN <1924> 204 204 LN LN <1925> 200 200 CRC CRC <1926> 2BB 2F7 CRC CRC <1927> 23C 1E8 ADF <1928> 040 000 ADF <1929> 040 3FF ADF <1930> 040 3FF DID <1931> 040 2E7 DBN <1932> 040 1A2 DC <1933> 040 218 UDW <1934> 040 18F UDW <1935> 040 102 UDW <1936> 040 250 UDW <1937> 040 2D2 UDW <1938> 040 2C5 UDW <1939> 040 200 DUMP OPERATION MODE RUN DISPLAY SERIAL INPUT SELECT A up menu

Figure 16-9 Data dump display

16.5.1 Data Dump Display Description

• Detection Code Display

The input signal's embedded ancillary data is detected, and the following detection codes are displayed.

Table 16-3 Detection code display

Detection CodeDisplay ColorsDescription
ADFCyanAncillary data flags (000h, 3FFh, and 3FFh)
DIDCyanData identification (the data after ADF)
SDIDCyanSECONDARY DATA IDENTIFICATION(the secondary format data when the DID is smaller than 80h)
DBNCyanDATA BLOCK NUMBERS(the primary data format when the DID is larger than 80h)
DCCyanData count (the data after the SDID/DBN)
UDWCyanUser data words (the user data words of the data count length after ADF)
CSMagentaChecksum (the data immediately after UDW)
APYellowACTIVE PICTURE (From after the SAV to just before the EAVwhen the selected line is within the active video area)

- Line Number Display

Pictures sent in SDI signals are assigned line numbers as part of the transmission format. The line number is displayed in one of the following formats at the top of the screen.

Figure 16-4 Line number display

Line number displayDescription
LINE No.The picture scan line numbers and the line numbers during transmission are matched.
I/F LINE No.The picture scan line numbers and the line numbers during transmission are not matched.Line numbers during transmission are displayed.
PIC LINE No.The picture scan line numbers and the line numbers during transmission are not matched.Picture scan line numbers are displayed.

Normally, the picture scan line numbers and the line numbers for storing those line numbers during transmission are matched. However, they do not match when the following format is received.

If this is the case, you can switch between the picture scan line number (PICTURE) and line numbers during transmission.

Table 16-5 Format

FormatFrame RateSwitching operation
3G-B-DL60/59.94/50/48/47.95/PF•4DISPLAY (PICTURE/STREAM1/STREAM2)
HD(DL)60/59.94/50/48/47.95/PF•5LINK (PICTURE/A/B)
3G(DL)-2K60/59.94/50/48/47.95/PF•5LINK (PICTURE/1/2)

16. Status Display

As an example, the switching procedure for setting the picture scan line number to 42 when 3G-B-DL (1920×1080/59.94P) is applied is shown below.

  1. Data dump is displayed.
  2. Set F•4 DISPLAY to PICTURE.
  3. Use the V POS knob to set PIC LINE No. to 42.
  4. Set F•4 DISPLAY to STREAM1.

The line number display changes to I/F LINE No.21.

This indicates that the line number in which the picture scan line number 42 is stored for transmission is 21.

The relationship of other 3G-B-DL line numbers is shown below.

Table 16-6 3G-B-DL line number relationship

Picture scan line number (PIC LINE No.)Line number during transmission (I/F LINE No.)
PICTURESTREAM1STREAM2
15631125
21563
n (odd number)(n+1)/2+562(n-1)/2
m (even number)m/2m/2+562

16.5.2 Moving the Display Position

To configure data dump operation settings, press F•1 DUMP OPERATION on the DATA DUMP menu.

Leader LV5600 - Moving the Display Position - 1

flowchart
graph LR
    A["STATUS"] --> B["F•2"]
    B --> C["SDI ANALYSIS or SDI / IP ANALYSIS"]
    C --> D["F•1"]
    D --> E["DATA DUMP"]
    E --> F["F•2"]
    F --> G["DUMP OPERATION"]
    H["F1"] --> I["JUMP"]
    I --> J["EAV"]
    J --> K["F2"]
    K --> L["FD 1CLICK 1"]
    L --> M["F3"]
    M --> N["FD FUNCTION LINE"]
    N --> O["F4"]
    O --> P["DISPLAY SERIAL"]
    P --> Q["F5"]
    Q --> R["F6"]
    R --> S["USB MEMORY"]
    S --> T["F7"]
    T --> U["up menu"]
    V["F•1"] --> W["F•2"]
    W --> X["F•3"]
    X --> Y["F•4"]
    Y --> Z["F•5"]
    Z --> AA["F•6"]
    AA --> AB["F•7"]

Figure 16-10 DUMP OPERATION menu

To move the data dump sample number to a specific location, follow the procedure below.

Procedure

STATUS → F•2 SDI ANALYSIS or SDI / IP ANALYSIS → F•1 DATA DUMP → F•2 DUMP OPERATION → F•1 JUMP

: EAV / SAV

: END / START (when the input signal is 4K and F•5 LINK or F•5 SUB is set to PICTURE)

Settings

EAV: The display starts with the EAV sample number.

SAV: The display starts with the SAV sample number.

END: The last sample number is displayed.

START: The display starts with sample number 0.

16.5.3 Selecting the Adjustment Step Resolution

To select the line or sample number adjustment step resolution for when the function dial (F•D) is turned, follow the procedure below.

Procedure

STATUSF•2SDI ANALYSIS or SDI / IP ANALYSIS →F•1DATA DUMP →F•2DUMP
OPERATION →F•2FD 1CLICK: 1 / 10 / 50

16.5.4 Selecting What the Function Dial Controls

To select whether the line number or sample number is controlled with the function dial (F•D), follow the procedure below. You can also change the line number using the V POS knob and the sample number using the H POS knob.

Procedure

STATUSF•2SDI ANALYSIS or SDI / IP ANALYSIS →F•1DATA DUMP →F•2DUMP
OPERATION →F•3FD FUNCTION: LINE / SAMPLE

Settings

LINE: Turning the function dial (F•D) changes the line number. If you press the function dial (F•D), the data of line number 0 or 1 is displayed.
SAMPLE:Turning the function dial (F•D) changes the sample number. If you press the function dial (F•D), EAV or sample number 0 is displayed.

16.5.5 Selecting the Display Mode

To select the data dump display mode, follow the procedure below.

Procedure

STATUSF•2SDI ANALYSIS or SDI / IP ANALYSISF•1DATA DUMPF•1MODE: RUN / HOLD / FRM CAP

Settings

RUN:The input signal data is automatically updated and displayed.
HOLD:The input signal data is displayed statically.
FRM CAP:The frame data is displayed. If frame data has not been captured in the instrument, nothing is displayed. This setting can be selected in frame capture mode.

16. Status Display

16.5.6 Selecting the Display Format

To select the data dump display format, follow the procedure below.

This menu appears both in the DATA DUMP menu and DUMP OPERATION menu. However, when F•5 LINK or F•5 SUB is set to PICTURE, it does not appear.

Procedure

STATUS → F•2 SDI ANALYSIS or SDI / IP ANALYSIS → F•1 DATA DUMP → (F•2 DUMP OPERATION →) F•4 DISPLAY
: SERIAL / COMPO / BINARY (for HD, SD, 3G-A, HD (QL), 3G (QL) and 3G-A, 12G)
: PICTURE / STREAM1 / STREAM2 (for 3G-B-DL, 3G(QL) and 3G-B-DL)
: STREAM12 / STREAM1 / STREAM2 (for 3G(DL)-2K and 3G-B-DL)
: S1 SERIAL / S1 COMPO / S1 BINARY / S2 SERIAL / S2 COMPO / S2 BINARY (for 3G(DL)-4K, 3G-B-DS) 

Settings

SERIAL: The parallel converted data sequences are displayed.
COMPO: The parallel converted data sequences are divided into each component and displayed.
BINARY: The parallel converted data sequences are displayed in binary.
PICTURE: Links or streams 1 and 2 are combined and displayed in a picture structure.
STREAM1: Stream 1 is displayed.
STREAM2: Stream 2 is displayed.
STREAM12: Streams 1 and 2 are combined and displayed.
S1 SERIAL: Stream 1 is displayed serially.
S1 COMPO: Stream 1 is separated and displayed.
S1 BINARY: Stream 1 is displayed in binary.
S2 SERIAL: Stream 2 is displayed serially.
S2 COMPO: Stream 2 is separated and displayed.
S2 BINARY: Stream 2 is displayed in binary. 

DISPLAY = SERIAL

1920x1080/59.941 YCbCr(422) 10bit HDSDI ATIME: 16:50:11
DATA DUMPLINE No.1
SAMPLEYCb/Cr
[EAV]<1920>3FF3FF
[EAV]<1921>000000
[EAV]<1922>000000
[EAV]<1923>2D82D8
LNLN<1924>204204
LNLN<1925>200200
CRCCRC<1926>2BB2F7
CRCCRC<1927>23C1E8
ADF<1928>040000
ADF<1929>0403FF
ADF<1930>0403FF
DID<1931>0402E7
DBN<1932>0401A2
DC<1933>040218
UDW<1934>04018F
UDW<1935>040102
UDW<1936>040250
UDW<1937>0402D2
UDW<1938>0402C5
UDW<1939>040200

16. Status Display

DISPLAY = COMPO

1920x1080/58.94I YCbCr(422) 10bit HDSDI ATIME: 16:52:13
DATA DUMPLINE No.1
SAMPLEYCbCr
[EAV]<1920>3FF3FF
[EAV]<1921>000000
[EAV]<1922>000000
[EAV]<1923>2D82D8
LNLN<1924>204204
LNLN<1925>200200
CRCCRC<1926>2BB2F7
CRCCRC<1927>23C1E8
ADF<1928>040000
ADF<1929>0403FF
ADF<1930>0403FF
DID<1931>0402E7
DBN<1932>0402BE
DC<1933>040218
UDW<1934>0401C4
UDW<1935>040203
UDW<1936>040260
UDW<1937>0402A0
UDW<1938>0402B1
UDW<1939>04020F

DISPLAY = BINARY

1920x1080/59.941 YCbCr(422) 10bit HDSDI ATIME: 16:52:56
DATA DUMPLINE No.1
SAMPLEYCb/Cr
[EAV]<1920>11111111111111111111
[EAV]<1921>00000000000000000000
[EAV]<1922>00000000000000000000
[EAV]<1923>10110110001011011000
LNLN<1924>10000001001000000100
LNLN<1925>10000000001000000000
CRCCRC<1926>10101110111011110111
CRCCRC<1927>10001111000111101000
ADF<1928>00010000000000000000
ADF<1929>00010000001111111111
ADF<1930>00010000001111111111
DID<1931>00010000001011100111
DBN<1932>00010000001000111100
DC<1933>00010000001000011000
UDW<1934>00010000001000100100
UDW<1935>00010000001000000000
UDW<1936>00010000001010100000
UDW<1937>00010000001010011001
UDW<1938>00010000001010011001
UDW<1939>00010000001000001111

Figure 16-11 Selecting the display format

16.5.7 Selecting the Content to Display

When the link format is set to multi or 12G, to select which content to display the data dump of, follow the procedure below. Links or streams 1 and 2 are combined and displayed in a picture structure.

This menu appears both in the DATA DUMP menu and DUMP OPERATION menu.

Procedure (for multi link)

STATUS → F•2 SDI ANALYSIS or SDI / IP ANALYSIS → F•1 DATA DUMP → (F•2 DUMP OPERATION →) F•5 LINK
: PICTURE / A[A] / B[B] or PICTURE / A[C] / B[D] (for HD(DL))
: PICTURE / 1[A] / 2[B] or PICTURE / 1[C] / 2[D] (for 3G(DL))
: PICTURE / 1[A] / 2[B] / 3[C] / 4[D] (for 3G(QL), HD(QL)) 

Procedure (for 12G)

STATUS → F•2 SDI ANALYSIS or SDI / IP ANALYSIS → F•1 DATA DUMP → (F•2 DUMP OPERATION →) F•5 SUB: PICTURE / A / B / C / D 

16.5.8 Saving to a USB Memory Device

You can save the data dump to a USB memory device as a text file. The procedure to follow to save data is the same as the procedure that was given for the event log. See section 16.4.5, "Saving to a USB Memory Device."

Data dumps are saved in the DUMP folder.

USB memory device

LV5600_USER or LV7600_USER

L DUMP

YYYYMMDDhhmmss.txt

16. Status Display

16.6 Configuring Phase Difference Measurement Settings

To show the phase difference measurement display, follow the procedure below.

You can use the phase difference measurement display to measure the phase difference between an SDI signal and an external sync signal or the phase difference between a pair of SDI signals.

During an IP measurement, phase difference measurement screen cannot be displayed.

Procedure

Leader LV5600 - Procedure - 1

1920x1080/59.94I YCbCr(422) 10bit HD SDI A TIME: 16:54:10 CURRENT PHASE V PHASE H PHASE ---- Lines ---- us ---- pixel TOTAL PHASE ---- us -Advance -Advance +Delay +Delay REF NO SIGNAL REF SELECT EXT REF SET USER REF SET DEFAULT OH TIMING LEGACY INPUT SELECT A up menu

Figure 16-12 Phase difference measurement screen

• Measuring the Phase Difference between an SDI Signal and an External Sync Signal

You can measure the phase difference between an SDI signal and an external sync signal by setting F•1 REF SELECT to EXT. Apply the external sync signal.

Note that the following input formats are not supported.

• 3G 720/30P, 720/29.97P, 720/25P, 720/24P, 720/23.98P
• Frame frequency 48P, 47.95P

• Measuring the Phase Difference between SDI Signals

You can measure the phase difference between SDI signals by setting F•3 REF SELECT to SDI. This measurement is not possible when SDI System is set to 3G-B-DS on the SYS > F•1 SIGNAL IN OUT > SDI IN SETUP1 tab.

The reference signal varies depending on the input signal as shown below.

Figure 16-7 Reference signal

Input SignalReference Signal
SD, HD, 3GAch
HD(DL)Link A
3G(DL)-2K, 3G(DL)-4K, 3G(QL), HD(QL)Link 1

16.6.1 Phase Difference Measurement Screen Description

- CURRENT PHASE

V PHASE: The phase difference is displayed in units of lines.

H PHASE: The phase difference is displayed in units of time and in units of pixels or clocks. *1

TOTAL PHASE: The total of the V PHASE and H PHASE differences is displayed in units of time.

*1 When the input signal is HD(DL) 1080/60P, 1080/59.94P, 1080/50P or SD, the unit is clocks. Pixels are in units of the video's sampling frequency. Clocks are in units of the parallel video's transmission clock frequency.

• REF

This displays the reference signal as shown below.

Table 16-8 REF indications

F•1 REF SELECTDisplayDescription
EXTEXT BB : DEFAULTWhen the reference signal is BB and the phase difference is at the default value
EXT BB : USER REFWhen the reference signal is BB and the phase difference is at the user reference value
EXT HD : DEFAULT When the reference signal is HD3 and the phase difference is at the default value
EXT HD : USER REFWhen the reference signal is HD3 and the phase difference is at the user reference value
NO SIGNALWhen no external sync signal is being applied
SDISDI AWhen the input signal is SD, HD, or 3G and the reference signal is A
LINK AWhen the input signal is HD(DL) and the reference signal is link A
LINK 1When the input signal is 3G(DL)-2K, 3G(DL)-4K, 3G(QL), or HD(QL) and the reference signal is link 1
NO SIGNALIndicates that the reference SDI signal is not being received.

- Setting the User-Defined Phase Difference Reference

When F•1 REF SELECT is set to EXT, you can set the current phase difference to zero by pressing F•2 REF SET USER. You can change the reference to match the system that you are using. (During multi link, the phase difference of link A or link 1 is set to zero.)

To reset the phase difference to its default value (see below), press F•3 REF SET DEFAULT.

16. Status Display

- Default Phase Difference Setting

If the input signal is HD or SD and F•1 REF SELECT is set to EXT, you can use F•4 0H TIMING to select the reference where the phase difference is assumed to be zero.

When using a LEADER signal generator that allows you to select LEGACY or SERIAL, this setting must be matched to the setting selected on the instrument. In addition, depending on the output accuracy of the signal generator and measurement accuracy of the instrument, there may be an offset of around 0 ± 4 clocks in the display.

LEGACY: The phase difference is assumed to be zero when an external sync signal without a timing offset transmitted from a LEADER signal generator and an SDI signal are received.

SERIAL: The phase difference is zero when the external sync signal and the SDI signal are received at the times defined in the signal standard.

- Graphical Display

The vertical axis represents the V phase difference in lines. The horizontal axis represents the H phase time difference. When the circles that represent V and H overlap with each other in the center, there is no phase difference.

The circles are normally displayed in white, but they will be displayed in green under the following circumstances.

Horizontal: When the circle is within ±3 clocks of the center.

Vertical: When the circle is within ±0 clocks of the center.

When the signal is behind the reference signal, the circle is displayed on the Delay (+) side. When the signal is ahead of the reference signal, the circle is displayed on the Advance (-) side. For both the V and H axes, differences of up to approximately +1/2 frames from the center are displayed on the Delay axis and differences of up to approximately -1/2 frames from the center are displayed on the Advance axis. See the following table for details.

When the phase difference between an SDI signal and an external sync signal is being measured, the H axis phase difference may vary within a range of ±1 clock in cases such as when the signal is switched. When the phase difference between SDI signals is being measured, the H difference may vary within a range of ±2 clock in cases such as when the signal is switched.

16. Status Display

Table 16-9 Delay and Advance axis display ranges (3G-A, 3G-B, HD, SD)

3G-A, 3G-B, HD, SD FormatDisplayed on the Advance Axis
Displayed on the Delay Axis
V PHASE [Lines]H PHASE [us]V PHASE [Lines]H PHASE [us]V PHASE [Lines]H PHASE [us]
3G-A1080/59.94P-562-14.822to00to5620
1080/60P-562-14.808to00to5620
1080/50P-532-17.771to00to5620
3G-B1080/59.94P-1124-14.822to00to11250
1080/60P-1124-14.808to00to11250
1080/50P-1124-17.771to00to11250
3G-A3G-BHD1080/59.94I, 1080/29.97P, 1080/29.97PsF-562-29.645to00to5620
1080/60I, 1080/30P, 1080/30PsF-562-29.616to00to5620
1080/50I, 1080/25P, 1080/25PsF-562-35.542to00to5620
1080/23.98P, 1080/23.98PsF-562-37.060to00to5620
1080/24P, 1080/24PsF-562-37.023to00to5620
720/59.94P-3750to00to37422.230
720/60P-3750to00to37422.208
720/50P-3750to00to37426.653
720/29.97P-3750to00to37444.475
720/30P-3750to00to37444.430
720/25P-3750to00to37453.319
720/23.98P-3750to00to37455.597
720/24P-3750to00to37455.542
SD525/59.94I-262-63.518to00to2620
625/50I-312-63.962to00to3120

Table 16-10 Delay and Advance axis display ranges (12G)

12G Sub Image FormatDisplayed on the Advance Axis
Displayed on the Delay Axis
V PHASE [Lines]H PHASE [us]V PHASE [Lines]H PHASE [us]V PHASE [Lines]H PHASE [us]
12G1080/59.94P-562-14.822to00to5620
1080/60P-562-14.808to00to5620
1080/50P-532-17.771to00to5620
1080/29.97P-562-29.645to00to5620
1080/30P-562-29.616to00to5620
1080/25P-562-35.542to00to5620
1080/23.98P-562-37.060to00to5620
1080/24P-562-37.023to00to5620

16.7 Setting the Lip Sync Measurement (SER03)

To show the lip sync measurement screen, follow the procedure below.

By combining a Leader signal generator that supports lip syncing with this instrument, you can use the lip sync measurement screen to measure the offset between the video signal and the audio signal that occurs in the transfer route.

When an SER05 is installed, the SDI ANALYSIS becomes the SDI/IP ANALYSIS menu. Further, during an IP measurement when the signal standard is ST 2110, lip sync measurement screen cannot be displayed.

Procedure

STATUS → F•2 SDI ANALYSIS or SDI / IP ANALYSIS → F•3 AV PHASE

1920x1080/59.94I YCbCr(422) 10bit HD SDI A TIME: 16:57:17 REF: SDI A AUD: SDI A CH [ms] [FRM] + 1 0 ( 0) + 2 0 ( 0) + 3 0 ( 0) + 4 0 ( 0) + 5 0 ( 0) + 6 0 ( 0) + 7 0 ( 0) + 8 0 ( 0) -50 0 [ms] 50 AUD.ADVANCE [VIDEO REF] AUD.DELAY SCALE MAX 50ms REFRESH AV PHASE SETUP up menu

Figure 16-13 Lip sync measurement screen

As an example, we will show a procedure that uses the LT 4400 (the LT 4400SER01 must be installed) as the signal generator that supports lip syncing.

  1. Turn the LT 4400 lip sync feature on.

SDI SETTING→LIPSYNC to turn this feature on. For details, see the LT 4400 instruction manual.

  1. Send the signal generated from the LT 4400 SDI output connector to the transfer route. Apply the signal received from the transfer route to the SDI connector of this instrument. If the output audio is external audio, apply the video signal to the SDI input connector and the audio signal to the digital audio I/O connector.

  2. Select the audio signal.

On the instrument's → •7 MAPPING → TARGET tab, set the audio signal to EMB AUDIO (for embedded audio) or EXT AUDIO (for digital audio I/O connector). For EXT AUDIO, EXTERNAL AUDIO on the AUDIO IN/OUT tab must be set to INPUT.

16. Status Display

  1. The lip sync measurement screen is displayed.

Press STATUS → F•2 SDI ANALYSIS or SDI / IP ANALYSIS → F•3 AV PHASE.

The time difference when the luminance level of the video signal (the G signal level when the input signal is RGB) exceeds the specified value or when the audio level signal exceeds the specified value is measured, and the results are displayed numerically and graphically for each channel.

The measured value is displayed in units of time and frames. If the audio signal cannot be detected, "UNLOCK" is displayed. If the audio signal cannot be measured correctly, "MISSING" is displayed. Further, when the measured value is updated, an asterisk is displayed next to the channel.

You can set the video signal measurement range, video signal luminance level, and audio signal level using F•6 AV PHASE SETUP.

16.7.1 Selecting the Measurement Range

To select the graph measurement range, follow the procedure below.

Procedure

STATUS → F•2 SDI ANALYSIS or SDI / IP ANALYSIS → F•3 AV PHASE → F•1 SCALE MAX: 50ms / 100ms / 500ms / 1.0s / 2.5s

16.7.2 Updating the Measurement Screen

To update the measurement screen, follow the procedure below.

Procedure

STATUSF•2SDI ANALYSIS or SDI / IP ANALYSIS →F•3AV PHASE →F•2REFRESH

16.7.3 Setting the Measurement Range

To set the measurement range, follow the procedure below. Use the AV PHASE SETUP tab to configure these settings.

Procedure

STATUS → F•2 SDI ANALYSIS or SDI / IP ANALYSIS → F•3 AV PHASE → F•6 AV PHASE SETUP

AV PHASE SETUP AV PHASE Setup AV MES TOP 50 %(0 - 100) AV MES LEFT 0 %(0 - 98) AV MES RIGHT 0 %(0 - 99) Video Level 75 %(25 - 100) Audio Level -30 dBFS(-30 - 0) MES Gate OFF ON Gata Time 300 ms(100 - 1500) Link 1[A] 4K Square Division Only COMPLETE up menu

Figure 16-14 AV PHASE SETUP tab

- AV MES TOP

Set the video signal measurement line with the top edge of the picture taken to be 0 % and the bottom edge to be 100 %.

You can also set this using LINE SELECT on the PIC menu while viewing the picture.

[See also] 13.9.3, "Setting the Lip Sync Measurement Range (SER03)"

0 - 50 - 100%

- AV MES LEFT

Set the video signal measurement range (left side) with the left edge of the picture taken to be 0 % and the right edge to be 100 %. You cannot set this to the right of the line set with AV MES RIGHT.

You can also set this using LINE SELECT on the PIC menu while viewing the picture.

[See also] 13.9.3, "Setting the Lip Sync Measurement Range (SER03)"

0 - 99%

- AV MES RIGHT

Set the video signal measurement range (right side) with the right edge of the picture taken to be 0 % and the left edge to be 100 %. You cannot set this to the left of the line set with AV MES LEFT.

You can also set this using LINE SELECT on the PIC menu while viewing the picture.

[See also] 13.9.3, "Setting the Lip Sync Measurement Range (SER03)"

0 - 99%

  1. Status Display
    Leader LV5600 - Setting the Measurement Range - 3

Figure 16-15 Setting the measurement range (video signal)

- Video Level

Set the video signal luminance level. The time difference from the audio signal is measured when the luminance level of the measurement range specified with AV MES exceeds the level specified here.

25 - 75 - 100%

- Audio Level

Set the audio signal level. The time difference from the video signal is measured when the audio signal level exceeds the level specified here.

-30 - 0dBFS

- MES Gate

Select whether to specify the measurement range of the audio signal. Set this to ON such as when using a pattern containing multiple audio signals for a single video signal.

OFF / ON

- Gate Time

When MES Gate is set to ON, set the measurement range of the audio signal. The measurement range is "the rise time of the video signal ± the time set with Gate Time."

100 - 300 - 1500

Measurement range Gate Time Gate Time Video signal Audio signal Measured Not measured

Figure 16-16 Setting the measurement range (audio signal)

16. Status Display

- Link

When the input signal is 3G(QL) and square format, select the link for setting the measurement range.

1[A] / 2[B] / 3[C] / 4[D]

16. Status Display

16.8 Configuring the IP Screen (SER05)

16.8.1 Displaying the IP Status Screen

To view the IP status screen, follow the procedure below.

Procedure

STATUS → F•2 SDI / IP ANALYSIS → F•4 IP

Leader LV5600 - Displaying the IP Status Screen - 1
Figure 16-17 IP status screen

- IP Stream List

Up to 100 streams contained in the IP input signal are displayed.

By turning the function dial (F•D) to the right, you can scroll the screen to view all the streams. Also, if you press the function dial (F•D), the first stream is displayed.

Streams that are currently being received are displayed in white. Streams that were being received in the past are displayed in gray. You can clear past streams by pressing F•2 LIST CLEAR.

• No

The data number (1 to 100) is displayed.

- IP Stream

The IP stream number (1 to 4) is displayed.

- Input

The channel that the selected stream is assigned to (A to D) is displayed.

- Port

The port number (1 or 2) is displayed.

- Protocol

The protocol is displayed.

- Src. Address: Port

The source IP address and port number are displayed.

16. Status Display

- Dst. Address: Port

The destination IP address and port number are displayed.

- Info

VLAN availability and RTP payload type are displayed.

- Bitrate

The IP 1/2 bit rate is plotted in a chart. IP 1 and IP 2 are displayed in blue and green, respectively.

- SinceReset

The time that has elapsed since F•2 CHART CLEAR was pressed, the instrument was initialized, or the instrument was restarted is displayed.

• IP 1/2

"LINK UP" is displayed in green when communication is up. Otherwise, "LINK DOWN" is displayed in red.

- Bitrate

The bit rate is displayed numerically.

- FCS Error count

The number of FCS errors is displayed.

- IP CS Error count

The number of IP checksum errors is displayed.

- UDP CS Error count

The number of UDP checksum errors is displayed.

16.8.2 Configuring the IP Status Screen

- Selecting the Measurement Time

To select the chart measurement time (horizontal axis), follow the procedure below.

Procedure

STATUS → F•2 SDI / IP ANALYSIS → F•4 IP → F•4 CHART SETUP → F•1 PERIOD: 2MIN / 10MIN / 30MIN / 1HOUR / 2HOUR / 6HOUR / 12HOUR / 24HOUR / 72HOUR 

- Clearing the Chart

To clear the chart, error counts, and SinceReset, follow the procedure below.

Procedure

STATUS → F•2 SDI / IP ANALYSIS → F•4 IP → F•4 CHART SETUP → F•2 CHART CLEAR 

- Assigning IP Signals

To assign Src. Address: Port and Dst. Address: Port of the stream selected with the function dial (F•D) to the stream selected with F•5 IP STREAM SELECT, follow the procedure below. When you press F•1 SET IP STREAM, Source Address, Destination Address, and Destination Port check boxes on the SYS menu are selected, and the values are set automatically.

[See also] 7.1.10, "Configuring the IP Signal Settings (SER05)"

Procedure

STATUS → F•2 SDI / IP ANALYSIS → F•4 IP → F•5 IP STREAM SETUP → F•1 SET IP STREAM 

- Clearing the List

To clear the IP stream list, follow the procedure below.

Procedure

STATUS → F•2 SDI / IP ANALYSIS → F•4 IP → F•5 IP STREAM SETUP → F•2 LIST CLEAR 

16. Status Display

16.8.3 Displaying the Packet Jitter Screen

To display the packet jitter screen, follow the procedure below.

Procedure
STATUS → F•2 SDI / IP ANALYSIS → F•4 IP → F•2 PACKET JITTER

Leader LV5600 - Displaying the Packet Jitter Screen - 2

line | Time (sec) | Current (/ sec) | |---|---| | 120 | 8.09 us | | 100 | 8.09 us | | 80 | 3.22 us | | 60 | 3.88 us | | 40 | 3.22 us | | 20 | 3.22 us | | 0 | 3.22 us |

Figure 16-18 Packet jitter screen

  • IP Stream List
    The IP stream (1 to 4) data is displayed. Use F•5 IP STREAM SELECT to select the IP stream.

- Packet Arrival Interval Time

The packet arrival intervals are plotted on a chart. The maximum and minimum values within the last second are indicated in green and the average in blue.

- Current (/ sec)

The packet arrival intervals within the last second are displayed. Max, Min, and Avg indicate maximum, minimum, and average values, respectively.

- Total

The packet arrival intervals from when the measurement was started to the present are displayed. Max and Min indicate maximum and minimum values, respectively.

16.8.4 Configuring the Packet Jitter Screen

- Selecting the Measurement Time

To select the chart measurement time (horizontal axis), follow the procedure below.

Procedure

STATUS → F•2 SDI / IP ANALYSIS → F•4 IP → F•2 PACKET JITTER → F•1 PERIOD: 2MIN / 10MIN / 30MIN / 1HOUR / 2HOUR / 6HOUR / 12HOUR / 24HOUR / 72HOUR 

- Clearing the Chart

To clear the chart and measurement values, follow the procedure below.

Procedure

STATUS → F•2 SDI / IP ANALYSIS → F•4 IP → F•2 PACKET JITTER → F•2 CHART CLEAR 

- Selecting the IP Stream

To select the IP stream to be measured, follow the procedure below.

Procedure

STATUS → F•2 SDI / IP ANALYSIS → F•4 IP → F•2 PACKET JITTER → F•5 IP STREAM
SELECT: STREAM1 / STREAM2 / STREAM3 / STREAM4 

16. Status Display

16.8.5 Displaying the PTP Status Screen

To view the PTP status screen, follow the procedure below.

The PTP status screen has two modes: delay mode and offset mode. Press F•4 MODE to switch between the two.

Procedure

STATUSF•2SDI / IP ANALYSIS →F•4IP →F•3PTP

MODE = DELAY TIME
Leader LV5600 - Displaying the PTP Status Screen - 1

line | Port | Protocol | Bitrate | Sec. Address: Port | Dst. Address: Port | |------|----------|---------|---------------------|--------------------| | 1 | PTP(Gen) | 8.90 kbps | 102.168/10.1320 | 224.0.1.129320 | | 1 | PTP(Evt) | 12.14 kbps | 102.168/10.1319 | 224.0.1.129319 |

MODE = TIME OFFSET
Leader LV5600 - Displaying the PTP Status Screen - 2

line | Metric | Value | | ---------------- | --------- | | Time(UTC) | 2018/08/10 | | ΔT2-T1 | 10.980 us | | ΔT4-T3 | 10.856 us | | Current | 0.056 us | | Max | 0.190 us | | Min | -0.072 us | | Packet count | 16 | | Sync | 16 | | Follow up | 0 | | Delay request | 16 | | Delay response | 18 | | Amplitude | 4 | | Management | 1 |

Figure 16-19 PTP status screen

16. Status Display

- PTP Packet List

PTP packet data is displayed.

- Delay Time / Time Offset

The delay time or time difference is plotted on a chart. The maximum and minimum values within the last second are indicated in green. The measurement values for each second are displayed in blue.

  • Timing
  • State

The PTP lock state is indicated as "LOCK" or "UNLOCK."

- Time(UTC)

The UTC time is displayed.

- ΔT2 - T1 / ΔT4 - T3

The time for a message to be sent from the master to the slave ( ΔT2-T1 ) and the time for a message to be sent from the slave to the master ( ΔT4-T3 ) are displayed.

Leader LV5600 - Status Display - 1

flowchart
graph TD
    A["PTP Master"] -->|ΔT2-T1| B["T1"]
    A -->|ΔT4-T3| C["T4"]
    D["PTP Slave"] -->|T2| E["T2"]
    D -->|T3| F["T3"]
    A -->|T1| G["T1"]
    A -->|T4| H["T4"]

- Current / Max / Min

Based on the following equations, the delay time or time difference is displayed. Current indicates the measured values for each second. Max and Min indicate the maximum and minimum values within the past second, respectively.

Delay time = (ΔT2-T1) + (ΔT4-T3) / 2

Time difference = (ΔT2-T1) - (ΔT4-T3) / 2

- Packet count (/ sec)

Measured values for Sync, Follow up, Delay request, Delay response, Announce, and Management packets are displayed for each second.

16.8.6 Configuring the PTP Status Screen

- Selecting the Measurement Time

To select the chart measurement time (horizontal axis), follow the procedure below.

Procedure

STATUS → F•2 SDI / IP ANALYSIS → F•4 IP → F•3 PTP → F•1 PERIOD: 2MIN / 10MIN / 30MIN / 1HOUR / 2HOUR / 6HOUR / 12HOUR / 24HOUR / 72HOUR 

- Clearing the Chart

To clear the chart and measurement values, follow the procedure below.

Procedure

STATUS → F•2 SDI / IP ANALYSIS → F•4 IP → F•3 PTP → F•2 CHART CLEAR 

- Selecting the Measurement Mode

To select the measurement mode, follow the procedure below.

Procedure

STATUS → F•2 SDI / IP ANALYSIS → F•4 IP → F•3 PTP → F•4 MODE: DELAY TIME / TIME OFFSET 

Settings

DELAY TIME: The delay time is displayed.

TIME OFFSET: The time difference is displayed.

16.9 Displaying a List of Ancillary Data

To display a list of ancillary data, follow the procedure below.

During an IP measurement when the signal standard is ST 2110, ancillary data cannot be displayed.

Procedure

STATUS → F•3 ANC DATA VIEWER

1920x1080/59.941 YCbCr(422) 10bit HD SDI A TIME: 17:01:07 ANC DATA VIEWER STANDARD DID/SDID STATUS LINE No. PACKET S291M MARK DEL 80/- MISSING S291M END PKT 84/- MISSING S291M START PKT 88/- MISSING ARIB B.27 CC CF/- MISSING S299M ctrl G4 E0/- DETECT 571/F2 2/FRAME S299M ctrl G3 E1/- DETECT 571/F2 2/FRAME S299M ctrl G2 E2/- DETECT 571/F2 2/FRAME S299M ctrl G1 E3/- DETECT 571/F2 2/FRAME S299M aud G4 E4/- DETECT 1125/F2 1801/FRAME S299M aud G3 E5/- DETECT 1125/F2 1801/FRAME S299M aud G2 E6/- DETECT 1125/F2 1801/FRAME S299M aud G1 E7/- DETECT 1125/F2 1801/FRAME S272M ctrl G4 EC/- MISSING S272M ctrl G3 ED/- MISSING S272M ctrl G2 EE/- MISSING S272M ctrl G1 EF/- MISSING RP166 EDH F4/- MISSING S272M ext G4 F8/- MISSING S272M aud G4 F9/- MISSING S272M ext G3 FA/- MISSING S272M aud G3 FB/- MISSING S272M ext G2 FC/- MISSING ANC DUMP PAGE UP PAGE DOWN INPUT INPUT SELECT A up menu

Figure 16-20 Ancillary data screen

16.9.1 Ancillary Data Display Description

On the ancillary data screen, data is displayed as a list for each standard. If data is detected, "DETECT" is displayed in the STATUS column. If data is not detected, "MISSING" is displayed in the STATUS column.

- Data Viewing

By turning the function dial (F•D) to the right, you can scroll the screen to view all the data. You can also press F•2 PAGE UP and F•3 PAGE DOWN to move between pages. In the upper right of the screen, the "page number/total number of pages" is displayed.

If you press the function dial (F•D), the cursor returns to the first data entry.

- Selecting the Displayed Stream

When the input signal is 3G or 12G, to set the display stream to STREAM1 or STREAM2, press F•4 STREAM SELECT.

- Selecting the Content to Display

You can select the displayed content using F•5 LINK when the input signal is multi link and F•5 SUB when the input signal is 12G.

16. Status Display

16.9.2 Displaying a Dump of Ancillary Data

To display a dump of the data that you have selected on the ancillary data display, follow the procedure below.

By turning the function dial (F•D) to the right, you can scroll the screen to view all the data. If you press the function dial (F•D), the cursor returns to the first data entry.

Procedure

STATUS → F•3 ANC DATA VIEWER → F•1 ANC DUMP

1920x1080/59.94I YCbCr(422) 10bit HD SDI A TIME: 17:02:11 ANC DUMP STANDARD S299M ctrl G4 TYPE 1 STREAM Y LINE No. 9 DID 1E0 DBN 200 DC 108 1 202 2 200 3 20F 4 200 5 200 6 200 7 200 8 200 9 200 10 200 11 200 CHECKSUM 2FC HOLD TIME 3s DUMP MODE HEX up menu

Figure 16-21 Ancillary dump screen

16.9.3 Updating the Dump Display

When the selected data is embedded in multiple lines, the line number that is displayed on the ANC dump screen is switched at a regular interval. (However, the order in which the line numbers are switched is irregular.)

To select the dump display update time, follow the procedure below.

Procedure

STATUS → F•3 ANC DATA VIEWER → F•1 ANC DUMP → F•2 HOLD TIME: HOLD / 1s / 3s

Settings

HOLD: The screen is not updated.

1s: The screen is updated once per second.

3s: The screen is updated once every 3 seconds.

16. Status Display

16.9.4 Selecting the Dump Mode

To select the dump mode, follow the procedure below.

Procedure

STATUSF•3ANC DATA VIEWER →F•1ANC DUMP →F•3DUMP MODE: HEX / BINARY

Settings

HEX: Data is displayed in hexadecimal format.

BINARY: Data is displayed in binary format.

DUMP MODE = HEX

1920x1080/59.94I YCbCr(422) 10bit HDSDI ATIME: 17:02:11
ANC DUMP
STANDARD$299M ctrl G4
TYPE1
STREAMY
LINE No.9
DID1E0
DBN200
DC10B
1202
2200
320F
4200
5200
6200
7200
8200
9200
10200
11200
CHECKSUM2FC

DUMP MODE = BINARY

1920x1080/59.94I YCbCr(422) 10bit HDSDI ATIME: 17:02:59
ANC DUMP
STANDARD$299M ctrl G4
TYPE1
STREAMY
LINE No.571
DID0111100000
DBN1000000000
DC0100001011
11000000010
21000000000
31000001111
41000000000
51000000000
61000000000
71000000000
81000000000
91000000000
101000000000
111000000000
CHECKSUM1011111100

Figure 16-22 Selecting the dump mode

16. Status Display

16.10 Detecting Ancillary Packets

To display the ancillary packet display, follow the procedure below.

If an ancillary packet is detected, "DETECT" appears. If not, "MISSING" appears. If a dummy packet is detected, "DUMMY" appears.

During an IP measurement when the signal standard is ST 2110, ancillary data cannot be displayed.

Procedure

Leader LV5600 - Procedure - 1

1920x1080/59.341 YCbCr(422) 10bit HD SDI A TIME: 17:03:58 ANC PACKET SUMMARY AUDIO CONTROL PACKET DETECT LTC MISSING VITC MISSING PAYLOAD ID DETECT V-ANC SMPTE AFD MISSING V-ANC ARIB CLOSED CAPTION 1 MISSING CLOSED CAPTION 2 MISSING CLOSED CAPTION 3 MISSING NET-Q MISSING TRIGGER PACKET MISSING USER DATA 1 MISSING USER DATA 2 MISSING PACKET ANALYSIS INPUT SELECT A up menu

Figure 16-23 Ancillary packet screen

- Selecting the Content to Display

You can select the displayed content using F•5 LINK when the input signal is multi link and F•5 SUB when the input signal is 12G.

16.10.1 Ancillary Packet Screen Description

• AUDIO CONTROL PACKET

The embedded audio consists of 4 groups that each contain 4 channels. This makes for a total of 16 channels. A single audio control packet is embedded in each group.

[See also] 16.10.4, "Displaying Audio Control Packets"

- EDH (Error detection and handling; when the input signal is SD)

This packet is used for detecting transmission errors. When multiple devices are connected, this packet can be used to determine which device caused an error. Both full-field and active picture errors are detected.

[See also] 16.10.2, "Displaying EDH Packets"

• LTC (Linear/Longitudinal Time Code)

This is a type of timecode. One packet is embedded per frame.

• VITC (Vertical Interval Time Code)

This is a type of timecode. One packet is embedded per field.

16. Status Display

- PAYLOAD ID

This is a packet that is used to identify the video format. It conforms to SMPTE ST 352. [See also] 16.10.3, "Displaying Payload IDs"

• AFD

It is embedded in the V-ANC area.

[See also] 16.10.11, "Displaying AFD Packets"

- CLOSED CAPTION 1 to 3 (When the input signal is HD or SD)

This is a closed caption information packet that is embedded in the V-ANC area. Up to three closed caption data entries can be embedded. [See also] 16.10.6, "Displaying Closed Caption Packets"

• NET-Q (When the input signal is HD or SD)

This is an inter-stationary control signal.

[See also] 16.10.7, "Displaying the Inter-Stationary Control Signal"

- TRIGGER PACKET (When the input signal is HD or SD)

This is the data transmission trigger signal.

[See also] 16.10.8, "Displaying the Data Broadcast Trigger Signal"

- USER DATA 1 and 2 (When the input signal is HD or SD)

Up to two packets of user-defined data.

[See also] 16.10.9, "Displaying User Data"

16. Status Display

16.10.2 Displaying EDH Packets

When the input signal is SD, to display the EDH packet screen, follow the procedure below.

Procedure

STATUS → F•4 ANC PACKET → F•1 PACKET ANALYSIS → F•1 EDH 

- Selecting the Display Format

You can use F•1 DISPLAY to set the display format to TEXT (text display) or DUMP (dump display).

If you select DUMP, the dump display appears, and you can use the function dial (F•D) to view the entire data. If you press the function dial (F•D), the first data entry is displayed.

- Selecting the Dump Mode

When F•1 DISPLAY is set to DUMP, you can use F•2 DUMP MODE to set the dump mode to HEX (hexadecimal display) or BINARY (binary display).

16.10.3 Displaying Payload IDs

To show the payload ID display, follow the procedure below.

Procedure

STATUS → F•4 ANC PACKET → F•1 PACKET ANALYSIS → F•2 PAYLOAD ID 

1920x1080/59.94I YCbCr(422) 10bit HD SDI A TIME: 17:06:08 PAYLOAD ID DISPLAY SMPTE ST352 INTERFACE LINE No. 10, 572 BYTE1 10000101 VERSION ID SMPTE ST352-2011 PAYLOAD ID 1125(1080) LINE DIGITAL INTERFACE 1.485Gb/s BYTE2 00000110 TRANSPORT STRUCTURE INTERLACED PICTURE STRUCTURE INTERLACED PICTURE RATE 30/1.001 BYTE3 00100000 ASPECT RATIO 16:9 H SAMPLING 1920 COLORIMETRY NOT USED SAMPLING STRUCTURE 4:2:2 YCbCr BYTE4 00000001 CHANNEL ASSIGNMENT NOT USED DYNAMIC RANGE NOT USED ASPECT RATIO NOT USED MAPPING MODE NOT USED AUDIO EMB MODE NOT USED BIT DEPTH 10BIT INPUT SELECT A up menu

Figure 16-24 Payload ID display

- Selecting the Displayed Stream

When the input signal is 3G or 12G, to set the display stream to STREAM1 or STREAM2, press F•4 STREAM SELECT.

- Selecting the Content to Display

You can select the displayed content using F•5 LINK when the input signal is multi link and F•5 SUB when the input signal is 12G.

16. Status Display

16.10.4 Displaying Audio Control Packets

To display audio control packets, follow the procedure below.

Procedure
STATUS → F•4 ANC PACKET → F•1 PACKET ANALYSIS → F•3 CONTROL PACKET

1920x1080/59.941 YCpGr(422) 10bit HD SDI A TIME: 17:06:50 AUDIO CONTROL PACKET MONITOR SMPTE ST299-1 INTERFACE LINE No. 9, 571 CONTROL PACKET GROUP 1 FRAME No. 5 SAMPLE RATE 48kHz SYNC MODE SYNCHRONOUS ACTIVE CH 1, 2, 3, 4, DELAY1-2 INVALID +0000000 DELAY3-4 INVALID +0000000 DISPLAY GROUP INPUT SELECT TEXT 1 A up menu

Figure 16-25 Audio control packet screen

- Selecting the Display Format

You can use F•1 DISPLAY to set the display format to TEXT (text display) or DUMP (dump display).

If you select DUMP, the dump display appears, and you can use the function dial (F•D) to view the entire data. If you press the function dial (F•D), the first data entry is displayed.

- Selecting the Dump Mode

When F•1 DISPLAY is set to DUMP, you can use F•2 DUMP MODE to set the dump mode to HEX (hexadecimal display) or BINARY (binary display).

- Selecting the Group to Display

You can use F•3 GROUP to set the group to display to a group from groups 1 to 4. A single group in the audio signal consists of four channels.

- Selecting the Displayed Stream

When the input signal is 12G or 3G-B, to set the display stream to STREAM1 or STREAM2, press F•4 STREAM SELECT.

- Selecting the Content to Display

You can select the displayed content using F•5 LINK when the input signal is multi link and F•5 SUB when the input signal is 12G.

16. Status Display

16.10.5 V-ANC ARIB Display

To display the V blanking ancillary packets defined in the ARIB standard, use the ARIB menu. When the input signal is 3G or 12G, this menu item is not displayed.

Leader LV5600 - V-ANC ARIB Display - 1

flowchart
graph LR
    A["STATUS"] --> B["F•4 ANC PACKET"]
    B --> C["F•1 PACKET ANALYSIS"]
    C --> D["F•4 V-ANC"]
    D --> E["F•1 ARIB"]

    F1["CLOSED CAPTION"] --> G["F2 NET-Q"]
    G --> H["F3 DATA TRIGGER"]
    H --> I["F4 USER DATA 1"]
    I --> J["F5 USER DATA 2"]
    J --> K["F6 INPUT SELECT A"]
    K --> L["F7 up menu"]

    F1 --> M["F•1"]
    G --> N["F•2"]
    H --> O["F•3"]
    I --> P["F•4"]
    J --> Q["F•5"]
    K --> R["F•6"]
    L --> S["F•7"]

Figure 16-26 V-ANC ARIB menu

16.10.6 Displaying Closed Caption Packets

To display closed caption packets, follow the procedure below.

Leader LV5600 - Displaying Closed Caption Packets - 1

flowchart
graph LR
    A["STATUS"] --> B["F•4"]
    B --> C["ANC PACKET"]
    C --> D["F•1"]
    D --> E["PACKET ANALYSIS"]
    E --> F["F•4"]
    F --> G["V-ANC"]
    G --> H["F•1"]
    H --> I["ARIB"]
    J["CLOSED CAPTION"] --> K["F•1"]

1920x1080/58.941 YCbCr(422) 10bit HD SDI A TIME: 17:08:25 CLOSED CAPTION DISPLAY ARIB STD-B37 INTERFACE LINE No. CLOSED CAPTION TYPE HEADER WORD1: ERROR CORRECTION CONTINUITY INDEX HEADER WORD2: HEADER WORD3: START PACKET FLAG END PACKET FLAG TRANSMISSION MODE FORMAT ID HEADER WORD4: C.C. DATA ID LANGUAGE ID DISPLAY TYPE TEXT HD INPUT SELECT A up menu

Figure 16-27 Closed caption packet screen

  • Selecting the Closed Caption Type
    You can use F•2 TYPE to set the closed caption type to HD, SD, ANALOG, or CELLULAR.

- Selecting the Display Format

You can use F•1 DISPLAY to set the display format to TEXT (text display) or DUMP (dump display).

If you select DUMP, the dump display appears, and you can use the function dial (F•D) to view the entire data. If you press the function dial (F•D), the first data entry is displayed.

- Selecting the Dump Mode

When F•1 DISPLAY is set to DUMP, you can use F•3 DUMP MODE to set the dump mode to HEX (hexadecimal display) or BINARY (binary display).

16. Status Display

- Selecting the Content to Display

When the input signal is HD(DL) or HD(QL), you can use F•5 LINK to select the displayed content.

16.10.7 Displaying the Inter-Stationary Control Signal

To display the inter-stationary control signal, follow the procedure below.

Procedure

STATUS → F•4 ANC PACKET → F•1 PACKET ANALYSIS → F•4 V-ANC → F•1 ARIB → F•2 NET-Q

1920x1080/59.941 YCbCr(422) 10bit HD SDI A TIME: 14:13:15 INTER-STATIONARY CONTROL DATA ARIB STD-839 INTERFACE LINE No. ERROR CORRECTION CONTINUITY INDEX STATION CODE DATE & TIME VIDEO CURRENT: NEXT: AUDIO CURRENT: NEXT: DOWN MIX CURRENT: NEXT: DURATION 1: DURATION 2: TRIGGER SIGNAL Q1 Q2 Q3 Q4 Q5 Q6 Q7 Q8 Q9 Q10 Q11 Q12 Q13 Q14 Q15 Q16 Q17 Q18 Q19 Q20 Q21 Q22 Q23 Q24 Q25 Q26 Q27 Q28 Q29 Q30 Q31 Q32 COUNTER Q1 Q2 Q3 Q4 COUNTDOWN Q1 Q2 Q3 Q4 STATUS SIGNAL S1 S2 S3 S4 S5 S6 S7 S8 S9 S10 S11 S12 S13 S14 S15 S16 DISPLAY TEXT BIT MASK INPUT SELECT A UP METH

Figure 16-28 Inter-stationary control signal screen (TEXT)

- Selecting the Display Format

You can use F•1 DISPLAY to set the display format to TEXT (text display), DUMP (dump display), Q LOG (Q-signal log display), or FORMAT (format ID display).

If you select DUMP, the dump display appears. If you select Q LOG, the log display appears. In either case, you can use the function dial (F•D) to view the entire data. If you press the function dial (F•D), the first data entry is displayed.

16. Status Display

DISPLAY = DUMP

1920x1080/59.94I YCbCr(422) 10bit HD SDI A TIME: 14:14:24 INTER-STATIONARY CONTROL DATA ARIB STD-839 INTERFACE LINE No. DID SDID DC 1 HEADER 2 STATION CODE1 3 STATION CODE2 4 STATION CODE3 5 STATION CODE4 6 STATION CODE5 7 STATION CODE6 8 STATION CODE7 9 STATION CODE8 10 YEAR 11 MONTH 12 DAY 13 WEEK 14 HOUR 15 MINUTE 16 SECOND 17 MULTI SECOND 18 MULTI SECOND DISPLAY DUMP MODE HEX INPUT SELECT A up menu

DISPLAY = QLOG

1920x1080/58.94I YCbCr(422) 10bit HD SDI A TIME: 14:15:23 INTER-STATIONARY CONTROL DATA ARIB STD-B39 NETQ LOG LIST SAMPLE NO.= 0 << NOW LOGGING >> Q32----Q1 DISPLAY Q LOG Q LOG CLEAR BIT MASK INPUT SELECT A up menu

DISPLAY = FORMAT

1920x1080/59.34I YCbCr(422) 10bit HD FORMAT ID DISPLAY ARIB STD-839 INTERFACE LINE No. BYTE1 VERSION ID PAYLOAD ID DIGITAL INTERFACE BYTE2 TRANSPORT STRUCTURE PICTURE STRUCTURE HDR / SDR PICTURE RATE BYTE3 ASPECT RATIO H SAMPLING DISP ASPECT RATIO COLORIMETRY SAMPLING STRUCTURE BYTE4 CHANNEL ASSIGNMENT DIVISION BIT DEPTH SDI A TIME: 14:16:22 DISPLAY FORMAT INPUT SELECT A up menu

Figure 16-29 Selecting the display format

16. Status Display

- Selecting the Dump Mode

When F•1 DISPLAY is set to DUMP, you can use F•2 DUMP MODE to set the dump mode to HEX (hexadecimal display) or BINARY (binary display).

- Clearing the Q-Signal Log

When F•1 DISPLAY is set to Q LOG, press F•2 Q LOG CLEAR to clear the Q-signal log.

- Setting the Bit Mask

When F•1 DISPLAY is set to TEXT, you can use F•3 BIT MASK to mask the Q and status signals independently.

Press F•4 ALL ON to select all the check boxes. Press F•5 ALL OFF to clear all the check boxes.

Leader LV5600 - Status Display - 1

- Selecting the Content to Display

When the input signal is HD(DL) or HD(QL), you can use F•5 LINK to select the displayed content.

- Saving data to a USB memory device

If F•1 DISPLAY is set to Q LOG, you can press F•6 USB MEMORY to save the Q signal log to a USB memory device in CSV format. The procedure to follow to save data is the same as the procedure that was given for the event log. See section 16.4.5, "Saving to a USB Memory Device."

Q signal logs are saved in the NETQ folder.

USB memory device LV5600_USER or LV7600_USER NETQ YYYYMMDDhhmmss.csv

16. Status Display

16.10.8 Displaying the Data Broadcast Trigger Signal

To display the data broadcast trigger signal, follow the procedure below.

Procedure

STATUS → F•4 ANC PACKET → F•1 PACKET ANALYSIS → F•4 V-ANC → F•1 ARIB → F•3 DATA TRIGGER

1920x1080/58.341 YCbCr(422) 10bit HD SDI A TIME: 17:12:44 DATA BROADCAST TRIGGER ARIB STD-B35 INTERFACE LINE No. HEADER WORD1: ERROR CORRECTION CONTINUITY INDEX HEADER WORD2: PACKET NUMBER HEADER WORD3: LAST PACKET NUMBER HEADER WORD4: TRIGGER ID DISPLAY TEXT INPUT SELECT A up menu

Figure 16-31 Data broadcast trigger signal screen

- Selecting the Display Format

You can use F•1 DISPLAY to set the display format to TEXT (text display) or DUMP (dump display).

If you select DUMP, the dump display appears, and you can use the function dial (F•D) to view the entire data. If you press the function dial (F•D), the first data entry is displayed.

- Selecting the Dump Mode

When F•1 DISPLAY is set to DUMP, you can use F•2 DUMP MODE to set the dump mode to HEX (hexadecimal display) or BINARY (binary display).

- Selecting the Content to Display

When the input signal is HD(DL) or HD(QL), you can use F•5 LINK to select the displayed content.

16. Status Display

16.10.9 Displaying User Data

To display user data 1 or 2, follow the procedure below.

You can use the function dial (F•D) to view all the data. If you press the function dial (F•D), the first data entry is displayed.

Procedure

STATUS → F•4 ANC PACKET → F•1 PACKET ANALYSIS → F•4 V-ANC → F•1 ARIB
→ F•4 USER DATA 1
→ F•5 USER DATA 2 

1920x1080/59.94I YCbCr(422) 10bit HD SDI A TIME: 17:13:24 V-ANC USER DATA ARIB TR-B23 INTERFACE LINE No. DID SDID DC 1 2 3 4 5 6 7 8 9 10 11 12 13 14 15 16 17 18 DUMP MODE HEX INPUT SELECT A up menu

Figure 16-32 User data display

  • Selecting the Dump Mode
    You can use F•2 DUMP MODE to set the dump mode to HEX (hexadecimal display) or BINARY (binary display).
  • Selecting the Content to Display
    When the input signal is HD(DL) or HD(QL), you can use F•5 LINK to select the displayed content.

16. Status Display

16.10.10 V-ANC SMPTE Display

To display the V blanking ancillary packets defined in the SMPTE standard, use the SMPTE menu.

Leader LV5600 - V-ANC SMPTE Display - 1

flowchart
graph LR
    A["STATUS"] --> B["F•4"]
    B --> C["ANC PACKET"]
    C --> D["F•1"]
    D --> E["PACKET ANALYSIS"]
    E --> F["F•4"]
    F --> G["V-ANC"]
    G --> H["F•2"]
    H --> I["SMPTE"]
    J["F1"] --> K["F2"] --> L["F3"] --> M["F4"] --> N["F5"] --> O["AFD"] --> P["F6"] --> Q["F7"] --> R["up menu"]
    S["F•1"] --> T["F•2"] --> U["F•3"] --> V["F•4"] --> W["F•5"] --> X["F•6"] --> Y["F•7"]

Figure 16-33 SMPTE menu

16.10.11 Displaying AFD Packets

To display AFD packets, follow the procedure below.

Leader LV5600 - Displaying AFD Packets - 1

flowchart
graph LR
    A["STATUS"] --> B["F•4"]
    B --> C["ANC PACKET"]
    C --> D["F•1"]
    D --> E["PACKET ANALYSIS"]
    E --> F["F•4"]
    F --> G["V-ANC"]
    G --> H["F•2"]
    H --> I["SMPTE"]
    A --> J["F•5"]
    J --> K["AFD"]

1920x1080/58.94I YCbCr(422) 10bit HD SDI A TIME: 17:17:47 AFD DISPLAY SMPTE 2016-1-2007 INTERFACE LINE No. AFD CODE CODED FRAME BAR DATA FLAGS BAR DATA VALUE1 BAR DATA VALUE2 DISPLAY TEXT INPUT SELECT A up menu

Figure 16-34 AFD packet display

  • Selecting the Display Format
    You can use F•1 DISPLAY to set the display format to TEXT (text display) or DUMP (dump display).
    If you select DUMP, the dump display appears, and you can use the function dial (F•D) to view the entire data. If you press the function dial (F•D), the first data entry is displayed.

- Selecting the Dump Mode

When F•1 DISPLAY is set to DUMP, you can use F•2 DUMP MODE to set the dump mode to HEX (hexadecimal display) or BINARY (binary display).

16. Status Display

- Selecting the Displayed Stream

When the input signal is 3G-B, to set the display stream to STREAM1 or STREAM2, press F•4 STREAM SELECT.

- Selecting the Content to Display

You can select the displayed content using F•5 LINK when the input signal is multi link and F•5 SUB when the input signal is 12G.

16.10.12 Performing Custom Searches

To show the custom search screen, follow the procedure below.

You can use the function dial (F•D) to view all the data. If you press the function dial (F•D), the first data entry is displayed.

Procedure

STATUS → F•4 ANC PACKET → F•1 PACKET ANALYSIS → F•5 CUSTOM SEARCH

1920x1080/28.97P YCbCr(422) 10bit HD SDI A TIME: 17:23:17 CUSTOM SELECTED ANC PACKET INTERFACE LINE No. DID DBN DC 1 2 3 4 5 6 7 8 9 10 11 12 13 14 15 16 17 18 ID SET DUMP MODE Y/C SELECT INPUT SELECT A up menu HEX HEX Y

Figure 16-35 Custom search screen

• Detecting Ancillary Packets

You can search ancillary packets by using F•1 ID SET in the CUSTOM SEARCH menu.

STATUS → F•4 ANC PACKET → F•1 PACKET ANALYSIS → F•5 CUSTOM SEARCH → F•1 ID SET →

F1 DID 00 F2 SDID/DBN -- F3 SET F4 F5 F6 F7 up menu F·1 F·2 F·3 F·4 F·5 F·6 F·7

Figure 16-36 ID SET menu

16. Status Display

Set F•1 DID and F•2 SDID/DBN to display ancillary packets on the basis of the combination of the DID and SDID/DBN.

You can set F•1 DID in the range of 00 to FF. Press the function dial (F•D) to return the setting to its default value (00).

You can set F•2 SDID/DBN in the range of 00 to FF or select “--” to not specify a value. Press the function dial (F•D) to return the setting to its default value (--).

Press F•3 SET to clear the blue cursor assigned to F•1 DID or F•2 SDID/DBN. Use this key when you want to view all the data using the function dial (F•D).

- Selecting the Dump Mode

You can use F•2 DUMP MODE to set the dump mode to HEX (hexadecimal display) or BINARY (binary display).

- Selecting Which Signal to Display

When the input signal is not SD, you can use F•3 Y/C SELECT to set the signal to display to Y signal or C signal.

- Selecting the Displayed Stream

When the input signal is 3G or 12G, to set the display stream to STREAM1 or STREAM2, press F•4 STREAM SELECT.

- Selecting the Content to Display

You can select the displayed content using F•5 LINK when the input signal is multi link and F•5 SUB when the input signal is 12G.

17. Eye Pattern Display (SER02)

17. EYE PATTERN DISPLAY (SER02)

To display the eye pattern, press EYE.

On the eye pattern display you can use F•1 EYE/JITTER INTEN/CONFIG → F•1 EYE/JITTER MODE to display the eye pattern or jitter.

The SDI signal applied to SDI INPUT 1 is displayed.

If F•6 INPUT SELECT is set to a signal other than what is applied to SDI INPUT 1, the message "Not Supported" appears, and the eye pattern nor jitter is displayed. Simul mode is not supported.

Leader LV5600 - EYE PATTERN DISPLAY (SER02) - 1

line | Parameter | Value | | --------- | ----- | | Tr: 46ps | 0.0 | | Tb: 42ps | 0.0 | | Or: 2.3% | 0.8 | | Of: 3.0% | 0.8 | | JITTER (TIMING): 92ps(0.14UI) | 0.8 | | JITTER (TIMING): 57ps(0.09UI) | 0.8 | | Frequency offset | -0.2 | | Amp: 786.0mv EYE/JITTER INTEN/CONFIG FA GAIN/FILTER /SYEEP FA PEAK HOLD FA CURSOR FA TRIGGER RUN FA INPUT SELECT A FA DISPLAY MODE SINGLE

Figure 17-1 Eye pattern display
1920x1080/59.94I YCbCr(422) 10bit HD SDI A TIME: 14:51:39 X: 30.339usec Y: 809ps JITTER( TIMING ): 107ps(0.16UI) JITTER( 100kHz ): 57ps(0.09UI) EYE/JITTER INTEN/CONFIG GAIN/FILTER /SWEEP PEAK HOLD CURSOR TRIGGER RUN INPUT SELECT A DISPLAY MODE SINGLE

Figure 17-2 Jitter display

17. Eye Pattern Display (SER02)

- Displaying the Eye Pattern and Jitter Simultaneously

By using the customized layout feature (SER26) or enhanced layout feature (SER26), you can display the eye pattern and jitter simultaneously.

[See also] 6.5, "Customized Layout (SER26)," 6.6, "Enhanced Layout (SER26)"

Leader LV5600 - Eye Pattern Display (SER02) - 1

line | Time (ms) | Amo 200.1ms | |-----------|-------------| | 0 | 0.8 | | 1 | 0.0 | | 2 | 0.8 | | 3 | 0.0 | | 4 | 0.8 | | 5 | 0.0 | | 6 | 0.8 | | 7 | 0.0 | | 8 | 0.8 | | 9 | 0.0 | | 10 | 0.8 | | 11 | 0.0 | | 12 | 0.8 | | 13 | 0.0 | | 14 | 0.8 | | 15 | 0.0 | | 16 | 0.8 | | 17 | 0.0 | | 18 | 0.8 | | 19 | 0.0 | | 20 | 0.8 | | 21 | 0.0 | | 22 | 0.8 | | 23 | 0.0 | | 24 | 0.8 | | 25 | 0.0 | | 26 | 0.8 | | 27 | 0.0 | | 28 | 0.8 | | 29 | 0.0 | | 30 | 0.8 | | 31 | 0.0 | | 32 | 0.8 | | 33 | 0.0 | | 34 | 0.8 | | 35 | 0.0 | | 36 | 0.8 | | 37 | 0.0 | | 38 | 0.8 | | 39 | 0.0 | | 40 | 0.8 | | 41 | 0.0 | | 42 | 0.8 | | 43 | 0.0 | | 44 | 0.8 | | 45 | 0.0 | | 46 | 0.8 | | 47 | 0.0 | | 48 | 0.8 | | 49 | 0.0 | | 50 | 0.8 | | 51 | 0.0 | | 52 | 0.8 | | 53 | 0.0 | | 54 | 0.8 | | 55 | 0.0 | | 56 | 0.8 | | 57 | 0.0 | | 58 | 0.8 | | 59 | 0.0 | | 60 | 0.8 | | 61 | 0.0 | | 62 | 0.8 | | 63 | 0.0 | | 64 | 0.8 | | 65 | 0.0 | | 66 | 0.8 | | 67 | 0.0 | | 68 | 0.8 | | 69 | 0.0 | | 70 | 0.8 | | 71 | 0.0 | | 72 | 0.8 | | 73 | 0.0 | | 74 | 0.8 | | 75 | 0.0 | | 76 | 0.8 | | 77 | 0.0 | | 78 | 0.8 | | 79 | 0.0 | | 80 | 0.8 | | 81 | 0.0 | | 82 | 0.8 | | 83 | 0.0 | | 84 | 0.8 | | 85 | 0.0 | | 86 | 0.8 | | 87 | 0.0 | | 88 | 0.8 | | 89 | 0.0 | | 90 | 0.8 | | 91 | 0.0 | | 92 | 0.8 | | 93 | 0.0 | | 94 | 0.8 | | 95 | 0.0 | | 96 | 0.8 | | 97 | 0.0 | | 98 | 0.8 | | 99 | 0.0 | | Note: The 'Amo' values are estimated based on the provided code format.

Figure 17-3 Eye pattern and jitter display

17.1 Eye Pattern Display Description

• Automatic Measurement

On the eye pattern display, values such as the amplitude of the eye pattern and the jitter are measured automatically and displayed. Measured values are normally displayed in white, but they are displayed in yellow until they stabilize and in red if they exceed the values that you have specified in the error setup. If automatic measurements cannot be performed due to noise in the waveform or other reason, measured values are displayed as "----." If this occurs, use cursors to measure manually.

[See also] Reference 17.7, "Configuring Error Detection Settings"

The timing jitter and jitter measurement items show the values that were measured in jitter display mode. The instrument uses the phase demodulator method.

Other measurement items show the measured values calculated from the eye pattern waveform. Therefore, if the waveform degrades significantly, the difference between the automatically measured values and the cursor-measured values may become large.

• Measurement items

The items that can be automatically measured are shown below.

Table 17-1 Measurement items

SymbolDisplayDescription
aAmpEye-pattern amplitude
bTrRise time (time from 20% to 80% of amplitude)
cTfFall time (time from 80% to 20% of amplitude, figure omitted)
dT. JTiming Jitter
eJITJitter (jitter value when the currently selected filter is applied)
fOrOvershoot of the rising edge
gOfOvershoot of the falling edge

f b 80% d, e a 20% g

Figure 17-4 Explanation of measurement items

17. Eye Pattern Display (SER02)

- Unit interval

This unit uses unit intervals (UI) as jitter measurement units.

One cycle of the eye pattern is 1 UI. The time that corresponds to 1 UI varies depending on the input signal, as shown below.

Table 17-2 Time that corresponds to 1 UI

Input SignalBit RateTime That Corresponds to 1 UI
3G2.970/1.001 Gbps337.0 ps
2.970 Gbps336.7 ps
HD1.485/1.001 Gbps674.1 ps
1.485 Gbps673.4 ps
SD270 Mbps3.7 ns

1UI

Figure 17-5 Unit interval

17.2 Jitter Display Description

- Measurement

In the jitter display mode, the jitter component is extracted from the input signal and plotted on a time graph. The time (horizontal) axis can be displayed in different ways depending on the data interval of the lines, fields, or frames, which are being transmitted in the SDI signal.

• Automatic Measurement

Timing jitter (T.J) and jitter (JIT) are automatically measured and displayed on the jitter display screen. The measurement range is 0.00 to 9.60 UI.

SMPTE defines two methods of measuring jitter. One method uses an eye pattern, and the other method uses a phase demodulator.

The eye pattern method has disadvantages not only that measurements are difficult when the eye is not open but that measurements are prone to errors because the distinction between waveform distortion (such as noise and sags) and jitter is difficult.

In contrast, the phase demodulator method makes jitter measurements with small errors possible even when the eye pattern is closed and even when the amount of jitter is 1 UI or more.

The unit use the phase demodulator method.

17. Eye Pattern Display (SER02)

Measured values are normally displayed in white, but they are displayed in red if they exceed the values that you have specified in the error setup. If 10.00 UI is exceeded, "OVER" is displayed.

[See also] Reference 17.7, "Configuring Error Detection Settings"

17.3 Setting the Waveform Display Position

Use the V POS and H POS knobs to adjust the display position of the waveform.

On the multi display, these are valid when you press F•7 MULTI EYE on the MULTI menu.

LV5600 VFM VECT PIC AUDIO STATUS F-D EYE MULTI USB LV7600 V POS H POS F-D PHONES USB

Figure 17-6 V POS and H POS knobs

• V POS Knob

Adjusts the vertical position of the waveform.

Pressing the knob returns the waveform to its default position.

• H POS Knob

Adjusts the horizontal position of the waveform.

Pressing the knob returns the waveform to its default position.

17.4 Switching between Eye Pattern and Jitter

To switch between eye pattern and jitter, follow the procedure below.

Procedure

EYE → F•1 EYE/JITTER INTEN/CONFIG → F•1 EYE/JITTER: EYE / JITTER

17. Eye Pattern Display (SER02)

17.5 Setting the Intensity

Use F•1 EYE/JITTER INTEN/CONFIG → F•3 INTENSITY on the EYE menu to set the intensity. You can configure these settings separately for the eye pattern and jitter.

Leader LV5600 - Setting the Intensity - 1

flowchart
graph LR
    A["EYE"] --> B["F•1"]
    B --> C["EYE/JITTER INTEN/CONFIG"] --> D["F•3"]
    D --> E["INTENSITY"]
    F["F1"] --> G["EYE INTENSITY θ"]
    G --> H["F2"]
    H --> I["F3"]
    I --> J["EYE SCALE INTENSITY 4"]
    J --> K["F4"]
    K --> L["F5"]
    L --> M["F6"]
    M --> N["INPUT SELECT A"]
    N --> O["F7"]
    O --> P["up menu"]
    Q["F·1"] --> R["F·2"]
    R --> S["F·3"]
    S --> T["F·4"]
    T --> U["F·5"]
    U --> V["F·6"]
    V --> W["F·7"]

Figure 17-7 INTENSITY menu

17.5.1 Adjusting the Waveform Intensity

To adjust the intensity of the eye pattern and jitter, follow the procedure below. Press the function dial (F•D) to return the setting to its default value (0).

Procedure EYE → F•1 EYE/JITTER INTEN/CONFIG → F•3 INTENSITY → F•1 EYE INTENSITY: -128 - 0 - 127 → F•1 JITTER INTENSITY: -128 - 0 - 127

17.5.2 Adjusting the Scale Intensity

To adjust the scale intensity, follow the procedure below.

Press the function dial (F•D) to return the setting to its default value (4).

Procedure

|EYE |→ |F•1 | INTEN/SCALE → |F•3 | SCALE INTEN: -8 - 4 - 7

17. Eye Pattern Display (SER02)

17.6 Selecting the Display Colors

Use F•1 EYE/JITTER INTEN/CONFIG → F•4 COLOR on the EYE menu to set the display colors. You can configure these settings separately for the eye pattern and jitter.

Leader LV5600 - Selecting the Display Colors - 1

flowchart
graph LR
    A["EYE"] --> B["F•1"]
    B --> C["EYE/JITTER INTEN/CONFIG"] --> D["F•4"]
    D --> E["COLOR"]
    subgraph F1
        F1_1["EYE COLOR WHITE"] --> F2
        F2 --> F3["EYE SCALE COLOR YELLOW"]
    end
    subgraph F2
        F2_1 --> F3
        F3 --> F4
        F4 --> F5
        F5 --> F6
        F6 --> F7
        F7 --> F7A["INPUT SELECT A"]
        F7A --> F7B["up menu"]
    end
    subgraph F3_1
        F3_1 --> F4_1
        F4_1 --> F5_1
        F5_1 --> F6_1
        F6_1 --> F7_1
        F7_1 --> F7B
    end

Figure 17-8 COLOR menu

17.6.1 Selecting the Waveform Color

To select the color of the eye-pattern and jitter, follow the procedure below.

Procedure

EYE → F•1 EYE/JITTER INTEN/CONFIG → F•4 COLOR → F•1 EYE COLOR: WHITE / YELLOW / CYAN / GREEN / MAGENTA / RED / BLUE → F•1 JITTER COLOR: WHITE / YELLOW / CYAN / GREEN / MAGENTA / RED / BLUE

17.6.2 Selecting the Scale Color

To select the scale color, follow the procedure below.

Procedure

EYE → F•1 EYE/JITTER INTEN/CONFIG → F•4 COLOR → F•3 EYE SCALE COLOR: WHITE / YELLOW / CYAN / GREEN / MAGENTA / RED / BLUE → F•3 JITTER SCALE COLOR: WHITE / YELLOW / CYAN / GREEN / MAGENTA / RED / BLUE

17. Eye Pattern Display (SER02)

17.7 Configuring Error Detection Settings

Use F•1 EYE/JITTER INTEN/CONFIG → F•4 ERROR SETUP on the EYE menu to set error detection.

When error detection is set to ON, the following actions are performed when an error occurs.

  • Displays errors in the event log of the status display
  • Displays "ERROR" in the upper right of the display.
    • Transmits a signal from the alarm output remote terminal

- Displays measured values on the eye pattern display and jitter display in red

[See also] Section 16.4.1, "Event Log Screen Description"

17.7.1 Configuring 12G Error Settings

Use the 12G-SDI ERROR SETUP tab to configure error detection settings for 12G signals.

You can set the threshold values when you set the error detection to ON. Measured values given in SMPTE ST 2082-1 are used as 100 %.

EYE → F•4 ERROR SETUP → F•2 PREV TAB or F•3 NEXT TAB → 12G-SDI ERROR SETUP 3G-SDI/ERROR SETUP HD-SDI ERROR SETUP SD-SDI ERROR SETUP 12G-SDI EYE Pattern Error Setup SMPTE ST 2082-1 Amplitude Error OFF ON Upper 80 %(80 ~ 140) 640mv Max 10 %(10~200) 0.80UI 67.2ps Lower 40 %(40 ~ 100) 320mv Jitter Error OFF ON Risetime Error OFF ON Max 10 %(10~200) 0.03UI 2.5ps Max 40 %(40 ~ 110) 18.0ps OverShoot Rising Error OFF ON Falltime Error OFF ON Max 100 %(0~200) 10.0% Max 40 %(40 ~ 110) 18.0ps OverShoot Falling Error OFF ON Deltatima Error(Tr-Tf) OFF ON Max 100 %(0~200) 10.0% Max 40 %(40 ~ 110) 7ps COMPLETE PREV TAB NEXT TAB up menu

Figure 17-9 12G-SDI ERROR SETUP tab

A configuration example showing threshold values that correspond to SMPTE ST 2082-1 is given below.

Table 17-3 12G-SDI ERROR SETUP configuration example

ParameterSetting ExampleCorresponding Value
Amplitude ErrorUpper110%880 mV
Lower90%720 mV
Risetime ErrorMax100%45.0 ps
Falltime ErrorMax100%45.0 ps
Deltatime Error(Tr-Tf)Max100%18 ps
Timing Jitter ErrorMax100%8.00 UI (672.0 ps)
Jitter ErrorMax100%0.30 UI (25.2 ps)
Overshoot Rising ErrorMax100%10.0%
Overshoot Falling ErrorMax100%10.0%

17. Eye Pattern Display (SER02)

- Amplitude Error

Turns the eye pattern's amplitude error detection on and off.

You cannot set Lower to a value that is greater than Upper, even if the value is within the selectable range.

Upper:80 - 140% (640 - 1120 mV)
Lower:40 - 100% (320 - 800 mV)

- Risetime Error

Turns the eye pattern's rise time (the time for the signal to rise from 20 to 80 % of its amplitude) error detection on and off.

Max:40 - 140% (18.0 - 63.0 ps)

- Falltime Error

Turns the eye pattern's fall time (the time for the signal to fall from 80 to 20 % of its amplitude) error detection on and off.

Max:40 - 140% (18.0 - 63.0 ps)

- Deltatime Error(Tr-Tf)

Turns the eye pattern's time difference (between the rise and fall times) error detection on and off. When the measured values exceed the specified value, Tr and Tf are displayed in red.

Max:40 - 140% (7 - 25 ps)

- Timing Jitter Error

Turns the eye pattern and jitter's timing jitter error detection on and off.

Max:10 - 200% (0.80 - 16.00 UI, 67.2 - 1344.0 ps)

- Jitter Error

Turns jitter error detection for eye pattern and jitter.

Max:10 - 200% (0.03 - 0.60 UI, 2.5 - 50.4 ps)

- Overshoot Rising Error

Turns the rising edge overshoot error detection on and off.

Max:0 - 100 - 200% (0.0 - 20.0%)

- Overshoot Falling Error

Turns the falling edge overshoot error detection on and off.

Max:0 - 100 - 200% (0.0 - 20.0%)

17. Eye Pattern Display (SER02)

17.7.2 Configuring 3G Error Settings

Use the 3G-SDI ERROR SETUP tab to configure error detection settings for 3G signals.

You can set the threshold values when you set the error detection to ON. Measured values given in SMPTE ST 424 are used as 100 %.

EYE → F•4 ERROR SETUP → F•2 PREV TAB or F•3 NEXT TAB → 12G SDI ERROR SETUP 3G SDI ERROR SETUP HD SDI ERROR SETUP SD SDI ERROR SETUP 3G SDI EYE Pattern Error Setup SMPTE ST 424 Amplitude Error OFF ON Upper 80 %(80~140) 640mv Max 10 %(10~200) 0.20UI 67.4ps Lower 40 %(40~100) 320mv Jitter Error OFF ON Risetime Error OFF ON Max 10 %(10~200) 0.03UI 10.1ps Max 40 %(40~140) 54.0ps OverShoot Rising Error OFF ON Falltime Error OFF ON Max 100 %(0~200) 10.0% Max 40 %(40~140) 54.0ps OverShoot Falling Error OFF ON Deltatime Error(Tr-Tf) OFF ON Max 100 %(0~200) 10.0% Max 40 %(40~140) 20ps COMPLETE PREV TAB NEXT TAB up menu

Figure 17-10 3G-SDI ERROR SETUP tab

A configuration example showing threshold values that correspond to SMPTE ST 424 is given below.

Table 17-4 3G-SDI ERROR SETUP configuration example

ParameterSetting ExampleCorresponding Value
Amplitude ErrorUpper110%880 mV
Lower90%720 mV
Risetime ErrorMax100%135.0 ps
Falltime ErrorMax100%135.0 ps
Deltatime Error(Tr-Tf)Max100%50 ps
Timing Jitter ErrorMax100%2.00 UI (674.0 ps)
Jitter ErrorMax100%0.30 UI (101.2 ps)
Overshoot Rising ErrorMax100%10.0%
Overshoot Falling ErrorMax100%10.0%

17. Eye Pattern Display (SER02)

- Amplitude Error

Turns the eye pattern's amplitude error detection on and off.

You cannot set Lower to a value that is greater than Upper, even if the value is within the selectable range.

Upper:80 - 140% (640 - 1120 mV)
Lower:40 - 100% (320 - 800 mV)

- Risetime Error

Turns the eye pattern's rise time (the time for the signal to rise from 20 to 80 % of its amplitude) error detection on and off.

Max:40 - 140% (54.0 - 189.0 ps)

- Falltime Error

Turns the eye pattern's fall time (the time for the signal to fall from 80 to 20 % of its amplitude) error detection on and off.

Max:40 - 140% (54.0 - 189.0 ps)

- Deltatime Error(Tr-Tf)

Turns the eye pattern's time difference (between the rise and fall times) error detection on and off. When the measured values exceed the specified value, Tr and Tf are displayed in red.

Max:40 - 140% (20 - 70 ps)

- Timing Jitter Error

Turns the eye pattern and jitter's timing jitter error detection on and off.

Max:10 - 200% (0.20 - 4.00 UI, 67.4 - 1348.0 ps)

- Jitter Error

Turns jitter error detection for eye pattern and jitter.

Max:10 - 200% (0.03 - 0.60 UI, 10.1 - 202.5 ps)

- Overshoot Rising Error

Turns the rising edge overshoot error detection on and off.

Max:0 - 100 - 200% (0.0 - 20.0%)

- Overshoot Falling Error

Turns the falling edge overshoot error detection on and off.

Max:0 - 100 - 200% (0.0 - 20.0%)

17. Eye Pattern Display (SER02)

17.7.3 Configuring HD Error Settings

Use the HD-SDI ERROR SETUP tab to configure error detection settings for HD signals.

You can set the threshold values when you set the error detection to ON. Measured values given in SMPTE ST 292 are used as 100 %.

EYE → F•4 ERROR SETUP → F•2 PREV TAB or F•3 NEXT TAB → 12G SDI ERROR SETUP 3G SDI ERROR SETUP HD SDI ERROR SETUP SD SDI ERROR SETUP HD-SDI EYE Pattern Error Setup SMPTE ST 202 Amplitude Error OFF ON Upper 80 %(80~140) 640mv Max 10 %(10~200) 0.10UI 67.4ps Lower 40 %(40~100) 320mv Jitter Error OFF ON Risetime Error OFF ON Max 10 %(10~200) 0.02UI 13.5ps Max 40 %(40~140) 108.0ps OverShoot Rising Error OFF ON Falltime Error OFF ON Max 100 %(0~200) 10.0% Max 40 %(40~140) 108.0ps OverShoot Falling Error OFF ON Deltatime Error(Tr-Tf) OFF ON Max 100 %(0~200) 10.0% Max 40 %(40~140) 40ps COMPLETE PREV TAB NEXT TAB up menu

Figure 17-11 HD-SDI ERROR SETUP tab

A configuration example showing threshold values that correspond to SMPTE ST 292 is given below.

Table 17-5 HD-SDI ERROR SETUP configuration example

ParameterSetting ExampleCorresponding Value
Amplitude ErrorUpper110%880 mV
Lower90%720 mV
Risetime ErrorMax100%270.0 ps
Falltime ErrorMax100%270.0 ps
Deltatime Error(Tr-Tf)Max100%100 ps
Timing Jitter ErrorMax100%1.00 UI (674.0 ps)
Jitter ErrorMax100%0.20 UI (135.0 ps)
Overshoot Rising ErrorMax100%10.0%
Overshoot Falling ErrorMax100%10.0%

17. Eye Pattern Display (SER02)

- Amplitude Error

Turns the eye pattern's amplitude error detection on and off.

You cannot set Lower to a value that is greater than Upper, even if the value is within the selectable range.

Upper:80 - 140% (640 - 1120 mV)
Lower:40 - 100% (320 - 800 mV)

- Risetime Error

Turns the eye pattern's rise time (the time for the signal to rise from 20 to 80 % of its amplitude) error detection on and off.

Max:40 - 140% (108.0 - 378.0 ps)

- Falltime Error

Turns the eye pattern's fall time (the time for the signal to fall from 80 to 20 % of its amplitude) error detection on and off.

Max:40 - 140% (108.0 - 378.0 ps)

- Deltatime Error(Tr-Tf)

Turns the eye pattern's time difference (between the rise and fall times) error detection on and off. When the measured values exceed the specified value, Tr and Tf are displayed in red.

Max:40 - 140% (40 - 140 ps)

- Timing Jitter Error

Turns the eye pattern and jitter's timing jitter error detection on and off.

Max:10 - 200% (0.10 - 2.00 UI, 67.4 - 1348.0 ps)

- Jitter Error

Turns jitter error detection for eye pattern and jitter.

Max:10 - 200% (0.02 - 0.40 UI, 13.5 - 270.0 ps)

- Overshoot Rising Error

Turns the rising edge overshoot error detection on and off.

Max:0 - 100 - 200% (0.0 - 20.0%)

- Overshoot Falling Error

Turns the falling edge overshoot error detection on and off.

Max:0 - 100 - 200% (0.0 - 20.0%)

17. Eye Pattern Display (SER02)

17.7.4 Configuring SD Error Settings

Use the SD-SDI ERROR SETUP tab to configure error detection settings for SD signals.

You can set the threshold values when you set the error detection to ON. Measured values given in SMPTE ST 259 are used as 100 %.

EYE → F•4 ERROR SETUP → F•2 PREV TAB or F•3 NEXT TAB → 12G SDI ERROR SETUP 3G SDI ERROR SETUP HD SDI ERROR SETUP SD-SDI ERROR SETUP SD-SDI EYE Pattern Error Setup SMPTE ST 259 Amplitude Error OFF ON Upper 80 %(80~140) 640mv Max 10 %(10~200) 0.02UI 0.07ns Lower 40 %(40~100) 320mv Jitter Error OFF ON Risetime Error OFF ON Max 10 %(10~200) 0.02UI 0.07ns Max 40 %(40~140) 0.60ms OverShoot Rising Error OFF ON Falltime Error OFF ON Max 100 %(0~200) 10.0% Max 40 %(40~140) 0.60ms OverShoot Falling Error OFF ON Deltatime Error(Tr-Tf) OFF ON Max 100 %(0~200) 10.0% Max 40 %(40~140) 0.20ns COMPLETE PREV TAB NEXT TAB up menu

Figure 17-12 SD-SDI ERROR SETUP tab

A configuration example showing threshold values that correspond to SMPTE ST 259 is given below.

Table 17-6 SD-SDI ERROR SETUP configuration example

ParameterSetting ExampleCorresponding Value
Amplitude ErrorUpper110%880 mV
Lower90%720 mV
Risetime ErrorMax100%1.50 ns
Falltime ErrorMax100%1.50 ns
Deltatime Error(Tr-Tf)Max100%0.50 ns
Timing Jitter ErrorMax100%0.20 UI (0.74 ns)
Jitter ErrorMax100%0.20 UI (0.74 ns)
Overshoot Rising ErrorMax100%10.0%
Overshoot Falling ErrorMax100%10.0%

17. Eye Pattern Display (SER02)

- Amplitude Error

Turns the eye pattern's amplitude error detection on and off.

You cannot set Lower to a value that is greater than Upper, even if the value is within the selectable range.

Upper:80 - 140% (640 - 1120 mV)
Lower:40 - 100% (320 - 800 mV)

- Risetime Error

Turns the eye pattern's rise time (the time for the signal to rise from 20 to 80 % of its amplitude) error detection on and off.

Max:40 - 140% (0.60 - 2.10 ns)

- Falltime Error

Turns the eye pattern's fall time (the time for the signal to fall from 80 to 20 % of its amplitude) error detection on and off.

Max:40 - 140% (0.60 - 2.10 ns)

- Deltatime Error(Tr-Tf)

Turns the eye pattern's time difference (between the rise and fall times) error detection on and off. When the measured values exceed the specified value, Tr and Tf are displayed in red.

Max:40 - 140% (0.20 - 0.70 ns)

- Timing Jitter Error

Turns the eye pattern and jitter's timing jitter error detection on and off.

Max:10 - 200% (0.02 - 0.40 UI, 0.07 - 1.48 ns)

- Jitter Error

Turns jitter error detection for eye pattern and jitter.

Max:10 - 200% (0.02 - 0.40 UI, 0.07 - 1.48 ns)

- Overshoot Rising Error

Turns the rising edge overshoot error detection on and off.

Max:0 - 100 - 200% (0.0 - 20.0%)

- Overshoot Falling Error

Turns the falling edge overshoot error detection on and off.

Max:0 - 100 - 200% (0.0 - 20.0%)

17. Eye Pattern Display (SER02)

17.8 Configuring Eye Pattern Display Settings

To configure eye pattern display settings, press F•2 GAIN/FILTER/SWEEP on the EYE menu. This menu appears when F•1 EYE/JITTER INTEN/CONFIG → F•1 EYE/JITTER MODE is set to EYE.

Leader LV5600 - Configuring Eye Pattern Display Settings - 1

flowchart
graph LR
    A["EYE"] --> B["F•2"]
    B --> C["GAIN/FILTER/SWEEP"]
    C --> D["F1"]
    C --> E["F2"]
    C --> F["F3"]
    C --> G["F4"]
    C --> H["F5"]
    C --> I["F6"]
    C --> J["F7"]
    K["UPMenu"] --> L["F•1"]
    K --> M["F•2"]
    K --> N["F•3"]
    K --> O["F•4"]
    K --> P["F•5"]
    K --> Q["F•6"]
    K --> R["F•7"]

Figure 17-13 GAIN/FILTER/SWEEP menu

17.8.1 Adjusting the Gain

To adjust the eye-pattern gain, follow the procedure below.

Procedure
EYE → F•2GAIN/FILTER/SWEEP → F•1 GAIN VARIABLE: CAL / VARIABLE
Settings
CAL:The eye pattern is shown without gain.
VARIABLE:The eye pattern is shown with the specified gain (×0.50 to ×2.00). The gain value appears in the upper right of the screen.Turn the function dial (F•D) to adjust the gain. Press the function dial (F•D) to return the setting to its default value (1.00).

17.8.2 Selecting the Filter

To select the filter that is used during jitter measurement, follow the procedure below. The selected filter is indicated at the bottom of the display.

If you change this setting, the filter that you selected for jitter display also changes.

[See also] 17.9.2, "Selecting the Filter"

Procedure
EYE → F•2 GAIN/FILTER/SWEEP → F•3 FILTER: 100kHz / 1kHz / 100Hz / 10Hz / TIMING / ALIGNMENT
Settings
100kHz:Jitter at 100 kHz or higher is measured.
1kHz:Jitter at 1 kHz or higher is measured.
100Hz:Jitter at 100 Hz or higher is measured.
10Hz:Jitter at 10 Hz or higher is measured.
TIMING:Timing jitter is measured. Jitter at 10 Hz or higher is measured.
ALIGNMENT:Alignment jitter is measured. When the input signal is not SD, jitter at 100 kHz and higher is measured. When the input signal is SD, jitter at 1 kHz and higher is measured.

17. Eye Pattern Display (SER02)

17.8.3 Selecting the Sweep Time

To select the eye pattern sweep time, follow the procedure below.

Procedure

EYE → F•2GAIN/FILTER/SWEEP → F•2SWEEP: 2UI / 4UI / 16UI
Settings
2UI:Two cycles of the eye pattern are shown.
4UI:Four cycles of the eye pattern are shown.
16UI:Sixteen cycles of the eye pattern are shown.

SWEEP = 2UI
Leader LV5600 - Selecting the Sweep Time - 1

line | Parameter | Value | | --------------- | --------- | | Tr | 46ps | | Tf | 42ps | | Or | 2.8% | | Of | 3.0% | | JITTER( TIMING) | 100kHz | | JITTER( 50μm(DJ46UI)) | 57ps(0.09UI) | | GAIN VARIABLE CAL | 786.7mv | | FILTER | 100kHz | | SWEEP | 2UI | | INPUT SELECT A | 57ps(0.09UI) | | up menu | 57ps(0.09UI) |

SWEEP = 16UI
Leader LV5600 - Selecting the Sweep Time - 2

line | Parameter | Value | | --------------- | ------- | | Tr | 44ps | | Tf | 42ps | | Qtr | 2.4% | | Cf | 3.1% | | JITTER( TIMING): | 106ps(0.16UI) | | JITTER( 100kHz): | 55ps(0.08UI) | | GAIN VARIABLE CAL | 100kHz | | FILTER | 16UI | | SWEEP | 16UI | | INPUT SELECT A | 16UI | | up menu | 16UI |

Figure 17-14 Selecting the sweep time

17. Eye Pattern Display (SER02)

17.8.4 Turning the Peak Hold On and Off

To configure the peak hold settings, press F•3 PEAK HOLD on the EYE menu. Measurement is possible regardless of whether F•1 EYE/JITTER INTEN/CONFIG → F•2 EYE/JITTER is set to EYE or JITTER.

Leader LV5600 - Turning the Peak Hold On and Off - 1

flowchart
graph LR
    A["EYE"] --> B["F•3"]
    B --> C["PEAK HOLD"]
    C --> D["F1"]
    D --> E["PEAK HOLD ON"]
    E --> F["F2"]
    F --> G["CLEAR"]
    G --> H["F3"]
    H --> I["F4"]
    I --> J["F5"]
    J --> K["F6"]
    K --> L["INPUT SELECT A"]
    L --> M["F7"]
    M --> N["up menu"]
    N --> O["F•7"]
    O --> P["F•6"]
    P --> Q["F•5"]
    Q --> R["F•4"]
    R --> S["F•3"]
    S --> T["F•2"]
    T --> U["F•1"]

Figure 17-15 PEAK HOLD menu

To measure the peak values of the timing jitter (T.J) and the jitter (JIT), follow the procedure below.

When you set F•1 PEAK HOLD to ON, the peak values T.J.PEAK and J.PEAK are displayed in the lower part of the screen next to "PEAK." The peak values are retained until you press F•2 CLEAR. If a peak value exceeds 10.00UI, "OVER" is displayed.

Procedure

EYE → F•3 PEAK HOLD → F•1 PEAK HOLD: ON / OFF

PEAK HOLD = ON

Leader LV5600 - Turning the Peak Hold On and Off - 2

line | Parameter | Value | | --------------- | --------- | | Amp | 837.0mv | | Tr | 44ps | | Tf | 42ps | | Qt | 3.0% | | Of | 4.4% | | JITTER( 100kHz): | 58ps(0.09UI) | | JITTER( TIMING): | 87ps(0.13UI) | | PEAK | 60ps(0.09UI) | | J.PEAK | 111ps(0.17UI) | | T.J.PEAK | - | | INPUT SELECT A | - | | up menu | - |

Figure 17-16 Peak hold display

17.8.5 Clearing the Peak Hold

When F•1 PEAK HOLD is set to ON, to clear the peak hold, follow the procedure below.

Procedure

EYE → F•3 PEAK HOLD → F•2 CLEAR

17. Eye Pattern Display (SER02)

17.8.6 Turning Cursors On and Off

To configure the cursor settings, press F•4 CURSOR on the EYE menu.

EYE → F•4 CURSOR → F1 CURSOR F2 XY SEL F3 X UNIT F4 FD VALUE F5 F6 CURSOR F7 up ON X sec REF F·1 F·2 F·3 F·4 F·5 F·6 F·7

Figure 17-17 CURSOR menu

To turn cursors on and off, follow the procedure shown below.

When the cursors are turned on, the REF cursors are displayed in yellow (X) and light blue (Y), and the DELTA cursors are displayed in purple (X) and green (Y). The values of DELTA-REF appear as measured values in the upper part of the screen.

Procedure

EYE → F•4 CURSOR → F•1 CURSOR: ON / OFF

CURSOR = ON

Leader LV5600 - Turning Cursors On and Off - 2

line | Time (ms) | Amplitude (Amp) | |-----------|-----------------| | 42 | 0.0 | | 3.0 | 0.0 | | 100 | 0.0 | | 0.09 | 0.0 | | 15:46:03 | 0.0 |

Figure 17-18 Cursor display

17. Eye Pattern Display (SER02)

17.8.7 Selecting the Cursor

The X-axis and Y-axis cursors are displayed at the same time, but you can only use the function dial (F•D) to move one set of cursors at a time. To select which cursors you want to move, follow the procedure below.

Procedure

EYEF•4CURSOR →F•2XY SEL: X / Y / Tr,Tf

If you select Tr,Tf, you can measure the rise time (Tr) and fall time (Tf). Follow the procedure below.

  1. Set F•2 XY SEL to Tr,Tf.

This selects the Y-axis cursors.

  1. Use the function dial (F•D) to align the cursors with the amplitude of the eye pattern. This is the 100% amplitude position.

Leader LV5600 - Selecting the Cursor - 1

line | Parameter | Value | | --------------- | --------- | | X | 3312ps | | Y | 778.7mV | | Frequency | -0.0ppm | | Time | 15:49:33 | | Amplitude (Amp) | 786.0mv | | Tr | 44ps | | Tf | 44ps | | On | 2.5% | | Off | 2.9% | | Jitter (TIMING) | 100kHz | | Jitter (Jitter) | 89ps(0.13UI)| | Timing (100kHz) | 57ps(0.09UI)| | CurSOR ON | - | | XY SEL Tr,Tf | - | | Y UNIT V | - | | FD VALUE DELTA | - | | REF SET | - | | CURSOR RESET | - | | up menu | - |

Figure 17-19 Tr,Tf measurement (1)

17. Eye Pattern Display (SER02)

3. Press F•5 REF SET.

The Y-axis cursors move to the 20 % and 80 % positions of the amplitude, and then F•2 XY SEL is automatically set to X.

Leader LV5600 - Press F•5 REF SET. - 1

line | Metric | Value | | ---------------- | --------- | | Amplitude (Amp) | 786.3mv | | Time (s) | 16:37:58 | | X (Time) | 3312ps | | Y (Time) | 466.7mV | | Frequency (Freq)| -0.0ppm | | CurSOR ON | 46ps | | XY SEL X | 42ps | | FD VALUE SEC | 3.0% | | CURSOR RESET | 97ps(0.18UI) | | up menu | 53ps(0.09UI) |

Figure 17-20 Tr,Tf measurement (2)

  1. Align the X-axis cursors with the intersections of the Y-axis cursors and the eye pattern. Align with the rising edge of the pattern to measure Tr and the falling edge to measure Tf. The measured value is displayed next to X in the upper part of the screen.

Leader LV5600 - Press F•5 REF SET. - 2

line | Parameter | Value | | --------------- | --------- | | X | 56ps | | Y | 466.7mV | | Amplitude (Amp) | 766.3mv | | Time | 15:56:35 | | CurSOR ON | 2 | | XY SEL X | 3 | | FD VALUE REF | 4 | | CURSCR RESET | 5 | | up menu | 6 |

Figure 17-21 Tr, Tf measurement 3 (example of Tr)

17. Eye Pattern Display (SER02)

17.8.8 Selecting the X-Axis Measurement Unit

When F•2 XY SEL is set to X, to select the X-axis cursor measurement unit, follow the procedure below.

Procedure

EYEF•4CURSOR →F•3X UNIT: sec / Hz / UIp-p

Settings

sec:The measurement unit is seconds.
Hz:The measurement unit is frequency, with the length of one period set to the distance between the two cursors.
UIp-p:The measurement unit is UIp-p, with one UIp-p set to one cycle of the eye pattern.

17.8.9 Selecting the Y-Axis Measurement Unit

When F•2 XY SEL is set to Y, to select the Y-axis cursor measurement unit, follow the procedure below.

Procedure

EYEF•4CURSOR →F•3Y UNIT: / %

Settings

V: The measurement unit is volts.
%:The amplitude will be measured as a percentage of the amplitude at the time when you pressed F•5 REF SET.

17.8.10 Moving the Cursors

To move a cursor, follow the procedure shown below to select a cursor. Then, move the cursor by turning the function dial (F•D). Triangles appear on both ends of the selected cursor.

You can also select a cursor by pressing the function dial (F•D). Each time you press the function dial (F•D), the selected cursor switches from REF, to DELTA, to TRACK, and then back to REF.

Procedure

EYEF•4CURSOR →F•4FD VALUE: REF / DELTA / TRACK

Settings

REF: The REF cursor (yellow or light blue) is selected.
DELTA:The DELTA cursor (purple or green) is selected.
TRACK:The REF cursor and DELTA cursor are both selected.

17. Eye Pattern Display (SER02)

17.8.11 Resetting Cursors

To reset the cursor positions, follow the procedure below.

Procedure

Leader LV5600 - Resetting Cursors - 1

17.8.12 Selecting the Display Mode

To select the eye pattern display mode, follow the procedure below.

If the eye pattern and jitter are displayed simultaneously, the setting specified here also applies to the jitter.

Procedure

Leader LV5600 - Selecting the Display Mode - 1

Settings

RUN: The input signal is automatically updated and displayed.

STOP: The input signal is displayed statically. This is convenient for cursor measurement.

Even if STOP is selected, if you change the measurement conditions, such as switching to jitter, the mode switches to RUN.

17.8.13 Selecting the 2-Screen Display Mode

To select the eye pattern's 2-screen display mode, follow the procedure below.

Procedure

Leader LV5600 - Selecting the 2-Screen Display Mode - 1

Settings

SINGLE: Displays the eye pattern of the selected filter in a single screen

DUAL: Displays the timing filter and eye pattern of the selected filter in two screens

17.9 Configuring the Jitter Display Settings

To configure the jitter display settings, press F•1 EYE/JITTER INTEN/CONFIG on the EYE menu. This menu appears when F•1 EYE/JITTER INTEN/CONFIG → F•1 EYE/JITTER MODE is set to JITTER.

Leader LV5600 - Configuring the Jitter Display Settings - 1

F1F2GAIN MAG X8F3FILTER 100kHzF4SWEEP 1HF5F6INPUT SELECT AF7up menu
F·1F·2F·3F·4F·5F·6

Figure 17-22 GAIN/FILTER/SWEEP menu

17. Eye Pattern Display (SER02)

17.9.1 Selecting the Magnification

To select the jitter display magnification, follow the procedure below.

Procedure
→ 2 GAIN/FILTER/SWEEP → 2 GAIN MAG : X1 / X2 / X8 (for formats other than 12G) : X1 / X2 / X4 / X16 (for 12G)

17.9.2 Selecting the Filter

To select the filter that is used during jitter measurement, follow the procedure below. The selected filter is indicated at the bottom of the display.

If you change this setting, the filter that you selected for the eye pattern display also changes.

[See also] 17.8.2, "Selecting the Filter"

Procedure

EYE → F•2 GAIN/FILTER/SWEEP → F•3 FILTER: 100kHz / 1kHz / 100Hz / 10Hz / TIMING / ALIGNMENT

17.9.3 Selecting the Sweep Time

To select the sweep time, follow the procedure below.

Procedure

EYE → F•2 GAIN/FILTER/SWEEP → F•4 SWEEP: 1H / 2H / 1V / 2V

Settings

1H: The jitter from a period of one line is shown.
2H: The jitter from a period of two lines is shown.
1V: When the input signal is interlace or segmented frame, the jitter from a period of one field is shown. When the input signal is progressive, the jitter from a period of one frame is shown.
2V: When the input signal is interlace or segmented frame, the jitter from a period of one frame is shown. When the input signal is progressive, the jitter from a period of two frames is shown.
This option cannot be selected when the input signal is progressive except for 60/59.94/50P of HD(DL). 

17. Eye Pattern Display (SER02)

17.9.4 Turning the Peak Hold On and Off

To configure the peak hold settings, press F•3 PEAK HOLD on the EYE menu.

Leader LV5600 - Turning the Peak Hold On and Off - 1

flowchart
graph LR
    A["EYE"] --> B["F•3"]
    B --> C["PEAK HOLD"]
    C --> D["F1"]
    D --> E["PEAK HOLD ON"]
    E --> F["F2"]
    F --> G["CLEAR"]
    G --> H["F3"]
    H --> I["F4"]
    I --> J["F5"]
    J --> K["F6"]
    K --> L["INPUT SELECT A"]
    L --> M["F7"]
    M --> N["up menu"]
    N --> O["F•7"]
    O --> P["F•6"]
    P --> Q["F•5"]
    Q --> R["F•4"]
    R --> S["F•3"]
    S --> T["F•2"]
    T --> U["F•1"]

Figure 17-23 PEAK HOLD menu

To measure the peak values of the timing jitter (T.J) and the jitter (JIT), follow the procedure below.

When you set F•1 PEAK HOLD to ON, the peak values T.J.PEAK and J.PEAK are displayed in the lower part of the screen next to "PEAK." The peak values are retained until you press F•2 CLEAR. If a peak value exceeds 10.00UI, "OVER" is displayed.

Procedure

Leader LV5600 - Turning the Peak Hold On and Off - 2

PEAK HOLD = ON

1920x1080/58.94I YCbCr(422) 10bit HD SDI A TIME: 10:23:05 JITTER( 100kHz ): 60ps(0.09UI) JITTER( TIMING ): 87ps(0.13UI) PEAK J.PEAK: 62ps(0.09UI) T.J.PEAK: 112ps(0.17UI) PEAK HOLD ON CLEAR INPUT SELECT A up menu

Figure 17-24 Peak hold display

17.9.5 Clearing the Peak Hold

When F•1 PEAK HOLD is set to ON, to clear the peak hold, follow the procedure below.

Procedure

Leader LV5600 - Clearing the Peak Hold - 1

17. Eye Pattern Display (SER02)

17.9.6 Turning Cursors On and Off

To configure the cursor settings, press F•4 CURSOR on the EYE menu.

EYE → F•4 CURSOR → F1 CURSOR ON F2 XY SEL X F3 X UNIT sec F4 FD VALUE REF F5 F6 CURSOR RESET F7 up menu F·1 F·2 F·3 F·4 F·5 F·6 F·7

Figure 17-25 CURSOR menu

To turn cursors on and off, follow the procedure shown below.

When the cursors are turned on, the REF cursors are displayed in yellow (X) and light blue (Y), and the DELTA cursors are displayed in purple (X) and green (Y). The values of DELTA-REF appear as measured values in the upper part of the screen.

Procedure

Leader LV5600 - Turning Cursors On and Off - 2

CURSOR = ON

1920x1080/59.94I YCbCr(422) 10bit HD SDI A TIME: 16:00:17 X: 30.339usec Y: 809ps JITTER( TIMING ): 104ps(0.16UI) JITTER( 100kHz ): 57ps(0.09UI) CURSOR ON XY SEL X X UNIT sec FD VAR REF CURSOR RESET up menu

Figure 17-26 Cursor display

17.9.7 Selecting the Cursor

The X-axis and Y-axis cursors are displayed at the same time, but you can only use the function dial (F•D) to move one set of cursors at a time. To select which cursors you want to move, follow the procedure below.

Procedure

Leader LV5600 - Selecting the Cursor - 1

17. Eye Pattern Display (SER02)

17.9.8 Selecting the X-Axis Measurement Unit

When F•2 XY SEL is set to X, to select the X-axis cursor measurement unit, follow the procedure below.

Procedure

EYEF•4CURSORF•3X UNIT: sec / Hz

Settings

sec:The measurement unit is seconds.
Hz:The measurement unit is frequency, with the length of one period set to the distance between the two cursors.

17.9.9 Selecting the Y-Axis Measurement Unit

When F•2 XY SEL is set to Y, to select the Y-axis cursor measurement unit, follow the procedure below.

Procedure

EYEF•4CURSOR →F•3Y UNIT: sec / UIp-p

Settings

sec: The measurement unit is seconds.
UIp-p:The measurement unit is UIp-p, with one UIp-p set to one cycle of the eye pattern.

17.9.10 Moving the Cursors

To move a cursor, follow the procedure shown below to select a cursor. Then, move the cursor by turning the function dial (F•D). Triangles appear on both ends of the selected cursor.

You can also select a cursor by pressing the function dial (F•D). Each time you press the function dial (F•D), the selected cursor switches from REF, to DELTA, to TRACK, and then back to REF.

Procedure

EYEF•4CURSOR →F•4FD VAR: REF / DELTA / TRACK

Settings

REF:The REF cursor (yellow or light blue) is selected.
DELTA:The DELTA cursor (purple or green) is selected.
TRACK:The REF cursor and DELTA cursor are both selected.

17. Eye Pattern Display (SER02)

17.9.11 Resetting Cursors

To reset the cursor positions, follow the procedure below.

Procedure

EYEF•4CURSOR →F•6CURSOR RESET

17.9.12 Selecting the Display Mode

To select the jitter display mode, follow the procedure below.

If the eye pattern and jitter are displayed simultaneously, the setting specified here also applies to the eye pattern.

Procedure

EYEF•5TRIGGER: RUN / STOP

Settings

RUN:The input signal is automatically updated and displayed.
STOP:The input signal is displayed statically. This is convenient for cursor measurement.Even if STOP is selected, if you change the measurement conditions, such as switching to eye pattern, the mode switches to RUN.

17.9.13 Selecting the 2-Screen Display Mode

To select the jitter's 2-screen display mode, follow the procedure below.

Procedure

EYEF•7DISPLAY MODE: SINGLE / DUAL

Settings

SINGLE:Displays the jitter waveform of the selected filter in a single screen
DUAL:Displays the timing jitter and the jitter waveform of the selected filter in two screens

18. Remote Control

18. REMOTE CONTROL

You can use the remote connector on the rear panel to load presets, transmit alarm signals, and perform other operations. Use the supplied 15-pin D-sub connector to control the instrument.

- Remote Connector Diagram

The remote connector diagram as viewed from the rear panel is shown below.

REMOTE 5 15 1 11

Figure 18-1 Remote connector (female, inch screws)

- Configuring the instrument

To configure the remote control connector, use the SYS menu. See section 7.2.8, "Setting the Remote Connector."

To display tallies through the remote connector, an SER27 must be installed and Tally Control Select must be set to Remote.

SYS → F•2 SYSTEM SETUP → F•2 PREV TAB or F•3 NEXT TAB → GENERAL CAPTURE&DISPLAY NETWORK REMOTE RS485 CAMERA ID TALLY OPERATION KEY DATETIME Remote Mode Bit Select Recall Alarm Polarity Positive Negative Alarm Select Input-A Input-B Input-C Input-D Tally Control Select Tally-1 Remote RS485 Tally-2 Remote RS485 Tally-EXT Remote RS485 COMPLETE PREV TAB NEXT TAB up menu

Figure 18-2 REMOTE tab

Each mode on the REMOTE tab is described below. Depending on the selected mode, the items that can be controlled vary as follows.

Table 18-1 Mode

BitBinaryCommandTally
Load presetsPYYN
Switch the display channelYYYN
Alarm outputYYYY
Tally display (SER27)NNPY
Loudness control (SER03)YYNN

(Y: supported; P: partially supported N: not supported)

18.1 Bit Mode

This section describes the control method when Mode on the SYS menu is set to Bit.

- Pinout

Table 18-2 Pinout

Pin No.NameI/O (*1)Description
1OPEN-Open (*2)
2/P1ILoads preset 1
3/P2ILoads preset 2
4/P3ILoads preset 3
5/P4ILoads preset 4
6/P5ILoads preset 5
7/P6ILoads preset 6
8/P7ILoads preset 7 / clears loudness measurement (SER03) (*3)
9/P8ILoads preset 8 / starts/stops the loudness measurement (SER03) (*3)
10/ACHISelects Ach / Tally1 (*4)
11/BCHISelects Bch / Tally2 (*4)
12/CCHISelects Cch / Tally3 (*4)
13/DCHISelects Dch / Tally4 (*4)
14ALARMOAlarm output
15GND-Ground

*1 Is (inputs) are all pulled up to +3.3 V but can also receive +5 V.
*2 Do not connect anything.
*3 On the REMOTE tab of the SYS menu, when Select is set to Recall, preset recalling 7/8 is enabled. When it is set to Recall&Loudness, loudness measurement control is enabled.
*4 On the REMOTE tab of the SYS menu, when Select is set to Recall, the pins are for Input Select A to Dch. When Select is set to Recall&Tally, the pins are for Tally 1 to 4.

- Control

The input connectors respond to active-low signals. Do not apply negative voltages or voltages that exceed +5 V. The active-low signal must be stable for at least 350 ms. After that, wait at least 1 second before applying the next signal.

At least 350 ms Control At least 1 s

Figure 18-3 Control timing 1

After a setting is made, it may take about 3 seconds for the operation to finish. If you configure subsequent settings before the initial operation finishes, only the last setting will take effect. All settings in between will be discarded. (In the following example, control 2 will be discarded.)

Control 1 Control 2 Control 3 Control 1 operation Control 3 operation About 3 s

Figure 18-4 Control timing 2

- Recalling a Preset

You can use pins 2 to 9 of the remote connector to load presets.

In Bit mode, presets 1 to 8 can be recalled out of presets 1 to 60. Set the number to recall to low level.

- Switching Display Channels

You can use pins 10 to 13 of the remote connector to switch the display channel.

Channels that you set to low will be turned on, and channels that you set to high will be turned off. However, in single input mode, you cannot turn multiple channels on.

- Alarm output

An alarm is transmitted from pin 14 of the remote connector in the following situations. The alarm output applies to all channels (A to D). However, when measuring 3G-B-DS or 3G(DL)-4K, alarms are output only for the currently displayed channels.

18. Remote Control

  • When a format other than that specified on the SDI IN SETUP2 tab of the SYS menu is received
  • When an error occurs in the item that you have set to ON using F•5 STATUS SETUP on the STATUS menu
  • When a fan error occurs
  • When the internal temperature rises to an abnormal level (When Temperature of F•3 SYSTEM INFO on the SYS menu turns yellow)

- Loudness control measurement (SER03)

To control loudness measurement, set Select to Recall&Loudness, and use pins 8 and 9 of the remote connector. See section 15.9.6, "Configuring Loudness Settings"

Table 18-3 Loudness control

9p (/P8)8p (/P7)
Clears loudness measurement-L
Starts loudness measurementL-
Stops loudness measurementH-

18.2 Binary Mode

This section describes the control method when Mode on the SYS menu is set to Binary.

  • Pinout
  • Control
  • Switching Display Channels
  • Alarm output
  • Loudness control measurement (SER03)

These are the same as Bit mode. See section 18.1, "Bit Mode."

- Recalling a Preset

You can use pins 2 to 7 of the remote connector to load presets.

Table 18-4 Loading presets

PresetNo.7p6p5p4p3p2p
/P6/P5/P4/P3/P2/P1
1HHHHHL
2HHHHLH
3HHHHLL
4HHHLHH
5HHHLHL
6HHHLLH
7HHHLLL
8HHLHHH
9HHLHHL
10HHLHLH
11HHLHLL
12HHLLHH
13HHLLHL
14HHLLLH
15HHLLLL
16HLHHHH
17HLHHHL
18HLHHLH
19HLHHLL
20HLHLHH
21HLHLHL
22HLHLLH
23HLHLLL
24HLLHHH
25HLLHHL
26HLLHLH
27HLLHLL
28HLLLHH
29HLLLHL
  1. Remote Control
PresetNo.7p6p5p4p3p2p
/P6/P5/P4/P3/P2/P1
30HLLLLH
31HLLLLL
32LHHHHH
33LHHHHL
34LHHHLH
35LHHHLL
36LHHLHH
37LHHLHL
38LHHLLH
39LHHLLL
40LHLHHH
41LHLHHL
42LHLHLH
43LHLHLL
44LHLLHH
45LHLLHL
46LHLLLH
47LHLLLL
48LLHHHH
49LLHHHL
50LLHHLH
51LLHHLL
52LLHLHH
53LLHLHL
54LLHLLH
55LLHLLL
56LLLHHH
57LLLHHL
58LLLHLH
59LLLHLL
60LLLLHH

18.3 Command Mode

This section describes the control method when Mode on the SYS menu is set to Command.

- Pinout

Table 18-5 Pinout

Pin No.NameI/O (*1)Description
1OPEN-Open (*2)
2/F1IFunction 1
3/F2IFunction 2
4/F3IFunction 3
5/F4IFunction 4
6/F5IFunction 5
7/F6IFunction 6
8/F7IFunction 7
9/F8IFunction 8
10CMD1ICommand 1
11CMD2ICommand 2
12CMD3ICommand 3
13/STRIStrobe
14ALARMOAlarm output
15GND-Ground

*1 Is (inputs) are all pulled up to +3.3 V but can also receive +5 V.
*2 Do not connect anything.

The functions that can be assigned to pins 2 to 9 of the remote connector vary depending on the setting specified by pins 10 to 12 as follows.

Table 18-6 Command mode functions

Pin No.Function
Preset recall (Bit)Preset recall (Binary)Switch the display channelTally display (SER27)
10HLLH
11HHLH
12HHHL
2Recall 1Recall 1 (LSB)Selects channel AChannel A tally 1 display
3Recall 2Recall 2Selects channel BChannel A tally 2 display
4Recall 3Recall 3Selects channel CChannel B tally 1 display
5Recall 4Recall 4Selects channel DChannel B tally 2 display
6Recall 5Recall 5-Channel C tally 1 display
7Recall 6Recall 6 (MSB)-Channel C tally 2 display
8Recall 7--Channel D tally 1 display
9Recall 8--Channel D tally 2 display

- Control

Strobe signals are used for Command mode control. Data is retrieved when the strobe signal is at low level. Strobe signals should maintain a stable state for at least 350 ms.

Be careful because changing a command or function setting while the strobe signal is at low level can result in unexpected settings. (The correct setting will return after some time.)

Command (pins 10 to 12) Function (pins 2 to 9) Strobe (pin 13) At least 60 ms At least 350 ms At least 60 ms At least 1 s

Figure 18-5 Control timing

  • Loading presets (Bit)
  • Switching Display Channels
  • Alarm output

These are the same as Bit mode. See section 18.1, "Bit Mode."

- Loading presets (Binary)

This is the same as Binary mode. See section 18.2, "Binary Mode."

- Tally display (SER27)

You can use pins 2 to 9 of the remote connector to display tallies.

Tallies that you set to low will be turned on, and those that you set to high will be turned off. To display tallies, you must place TALLY items in the layout or turn Tally Frame on.

EXT CAM A CAM A CAM A SDI A 1920x1080/59.94I YCbCr(422) 10bit HD TIME: 11:59:22

Figure 18-6 Tally display

18. Remote Control

18.4 Tally Mode (SER27)

This section describes the control method when Mode on the SYS menu is set to Tally.

- Pinout

Table 18-7 Pinout

Pin No.NameI/O (*1)Description
1OPEN-Open (*2)
2/AT1IChannel A tally 1 display
3/AT2IChannel A tally 2 display
4/ATEIChannel A tally EX display
5/BT1IChannel B tally 1 display
6/BT2IChannel B tally 2 display
7/BTEIChannel B tally EX display
8/CT1IChannel C tally 1 display
9/CT2IChannel C tally 2 display
10/CTEIChannel C tally EX display
11/DT1IChannel D tally 1 display
12/DT2IChannel D tally 2 display
13/DTEIChannel D tally EX display
14ALARMOAlarm output
15GND-Ground

*1 Is (inputs) are all pulled up to +3.3 V but can also receive +5 V.
*2 Do not connect anything.

18. Remote Control

- Control

The input connectors respond to active-low signals. Tallies light at low level and turns off at high level.

Set the low level period to at least 32 ms.

Control At least 32 ms

Figure 18-7 Control timing

- Alarm output

These are the same as Bit mode. See section 18.1, "Bit Mode."

- Tally Display

You can use pins 2 to 13 of the remote connector to display tallies.

Tallies that you set to low will be turned on, and those that you set to high will be turned off. To display tallies, you must place TALLY items in the layout or turn Tally Frame on.

EXT CAM A CAM A CAM A SDI A 1920x1080/59.94I YCbCr(422) 10bit HD TIME: 15:52:01 x 3.40 YCbCr

Figure 18-8 Tally display

19. RS-422/485 (SER27)

You can recall presets, switch display channels, display tallies, and display camera IDs through the RS-422/485 connector on the rear panel.

• RS-422/485 Connector

The RS-422/485 connector as viewed from the rear panel is shown below.

RS-422/485 INPUT OUTPUT

Figure 19-1 RS-422/485 connector

- Interface System

Table 19-1 Interface system

Synchronization modeAsynchronous start-stop
Data transfer time9600 to 115200 bps
Data length8 bit
ParityNone
Stop bits1 bit
Transmission orderLSB First
Error DetectionDetection through checksum only
Output methodRS485 4-wire
Output connectorRJ-45

- Pinout

Table 19-2 Pinout

Pin No.NamePin No.Name
1TX+5OPEN
2TX-6RX-
3RX+7GND
4OPEN8GND

- Connection Example

An example is shown below of a connection for controlling two instruments from a PC.

PC1st LV5600 or LV7600 (*1)2nd LV5600 or LV7600 (*2)
INPUT(→)(←)(←)OUTPUTINPUT(→)(←)(←)OUTPUT
Pin No.NamePin No.NamePin No.NamePin No.NamePin No.Name
1TX+3RX+3RX+3RX+3RX+
2TX-6RX-6RX-6RX-6RX-
3RX+1TX+1TX+1TX+1TX+
4OPEN4OPEN4OPEN4OPEN4OPEN
5OPEN5OPEN5OPEN5OPEN5OPEN
6RX-2TX-2TX-2TX-2TX-
7GND7GND7GND7GND7GND
8GND8GND8GND8GND8GND

*1 Set Termination Setting on the SYS menu to off.
*2 Set Termination Setting on the SYS menu to on.

- Configuring the instrument

To configure the RS-422/485, use the RS485 tab of the SYS menu.

[See also] 7.2.12, "Configuring the RS-422/485 Settings (SER27)"

To set the camera ID through the RS-422/485 connector, ID Control Select must be set to RS485 on the CAMERA ID tab of the SYS menu.

[See also] 7.2.13, "Setting the Camera ID (SER27)"

To display the tally through the RS-422/485 connector, Tally Control Select must be set to RS485 on the REMOTE tab of the SYS menu.

[See also] 7.2.8, "Configuring the Remote Control Settings"

19.1 Transmission Commands

The transmission command format is shown below.

Table 19-3 Transmission commands

byte LV5600TransmissionCommandsLV7600TransmissionCommandsDescription Reference
002h02hSTX
135h37hHeader 1
236h36hHeader 2
330h30hHeader 3
430h30hHeader 4
530h to 39h30h to 39hSender IP address 1
630h to 39h30h to 39hSender IP address 2
730h to 39h30h to 39hLV5600 or LV7600 address 1
830h to 39h30h to 39hLV5600 or LV7600 address 2
930h30hRESERVED
1030h30hRESERVED
1130h/31h30h/31hKeyword 1
1230h to 32h30h to 32hKeyword 2
13 and above- - Parameter
- 30h to 39h/41h to 46h30h to 39h/41h to 46hChecksum 119.1.3, "Setting the Checksum"
- 30h to 39h/41h to 46h30h to 39h/41h to 46hChecksum 2
-03h03hETX

- Notes

  • If there is a gap of 100 ms or longer in the middle of a command, the command up to that point will be discarded.
  • If an incorrect address or format is sent, the command will be ignored.
  • After sending a command, verify that it has been acknowledged before sending the next command.

19.1.1 Setting the Address

Set the address in the range of 00 to 99 using a 4 byte ASCII code.

To set the LV5600 or LV7600 address, use Device Address on the RS485 tab of the SYS menu.

byteTransmission CommandsDescription
530h to 39hSender IP address 1
630h to 39hSender IP address 2
730h to 39hLV5600 or LV7600 address 1
830h to 39hLV5600 or LV7600 address 2

Example: To specify "sender address: 28, LV5600 or LV7600 address: 35," set "32h 38h 33h 35h."

19.1.2 Setting Keywords and Parameters

Keyword and parameter settings vary depending on the function to be controlled. The command for each function is described below.

- Recalling a Preset

Set the preset in the range of 1 to 60 using a 2 byte ASCII code.

byteTransmission CommandsDescription
1130hKeyword 1
1230hKeyword 2
1330h to 36hPreset 1
1430h to 39hPreset 2

Example: To recall preset number 28, set "30h 30h 32h 38h."

- Switching Display Channels

Collectively set the on and off states of channels A to D.

You can omit the command for channels that do not need to be changed.

byteTransmission CommandsDescription
1130hKeyword 1
1231hKeyword 2
1341hAch
1430hOFF
31hON
152ChSeparator
1642hBch
1730hOFF
31hON
182ChSeparator
1943hCch
2030hOFF
31hON
212ChSeparator
2244hDch
2330hOFF
31hON
242ChSeparator

Example: To specify "Ach: ON, Bch: OFF, Cch: no change, Dch: ON," set "30h 31h 41h 31h 2Ch 42h 30h 2Ch 44h 31h 2Ch." Ach Bch Dch

- Tally Display

Collectively set the tally display of channels A to D.

You can omit the command for channels that do not need to be changed.

To display tallies, you must place TALLY items in the customized layout or enhanced layout or set Tally Frame to Tally.

byteTransmission CommandsDescription
1130hKeyword 1
1232hKeyword 2
1341hAch
1430hTALLY-1: OFFTALLY-2: OFFTALLY-EXT: OFF
31hTALLY-1: ONTALLY-2: OFFTALLY-EXT: OFF
32hTALLY-1: OFFTALLY-2: ONTALLY-EXT: OFF
33hTALLY-1: ONTALLY-2: ONTALLY-EXT: OFF
34hTALLY-1: OFFTALLY-2: OFFTALLY-EXT: ON
35hTALLY-1: ONTALLY-2: OFFTALLY-EXT: ON
36hTALLY-1: OFFTALLY-2: ONTALLY-EXT: ON
37hTALLY-1: ONTALLY-2: ONTALLY-EXT: ON
152ChSeparator
1642hBch
1730h to 37hTally on/off (see byte 14)
182ChSeparator
1943hCch
2030h to 37hTally on/off (see byte 14)
212ChSeparator
2244hDch
2330h to 37hTally on/off (see byte 14)
242ChSeparator

Example: To specify "Ach: all ON, Bch: all OFF, Cch: no change, Dch: all ON,"
set "30h 32h 41h 31h 2Ch 42h 30h 2Ch 44h 31h 2Ch."
Ach Bch Dch

- Camera ID Display (collectively setting)

Collectively set the camera ID display of channels A to D.

You can omit the command for channels or labels that do not need to be changed.

To display camera IDs, you must place LABEL-1, LABEL-2, and IRIS items in the customized layout or enhanced layout.

byteTransmission CommandsDescription
1131hKeyword 1
1230hKeyword 2
1341hAch
1431hLABEL-1
1530hNo change
31hLeft justified
32hCenter justified
33hRight justified
16 to 31 ASCII code: 1 byte (20h to 7Eh)Shift JIS code: 2byte• 16 bytes max.• Two channels not allowed• Default value (CAM A) if not set
322ChSeparator
3332hLABEL-2
3430h to 33hPlacement (see byte 15)
35 to 50ASCII/Shift JISCharacter string (see bytes 16 to 31)
512ChSeparator
5233hIRIS
5330h to 33hPlacement (see byte 15)
54 to 69ASCII/Shift JISCharacter string (see bytes 16 to 31)
702ChSeparator
712ChSeparator
7242hBch
73 to 130-Channel B data (see bytes 14 to 71)
13143hCch
132 to 189-Channel C data (see bytes 14 to 71)
19044hDch
191 to 248-Channel D data (see bytes 14 to 71)

Example: To specify "Ach: LABEL-1=Tokyo1, LABEL-2=Tokyo2, IRIS=(delete), all left justified

Bch: LABEL-1=Osaka1, LABEL-2=Osaka2, IRIS=(no change), all center justified

Cch: all no change

Dch: all delete, set

"31h 30h

41h 31h 31h 93h 8Ch 8Bh 9Eh 31h 2Ch 32h 31h 93h 8Ch 8Bh 9Eh 32h 2Ch 33h 2Ch 2Ch

Ach LABEL-1 LABEL-2 IRIS

42h 31h 32h 91h E5h 8Dh E3h 31h 2Ch 32h 32h 91h E5h 8Dh E3h 32h 2Ch 2Ch

Bch LABEL-1 LABEL-2

44h 31h 2Ch 32h 2Ch 33h 2Ch 2Ch."

Dch LABEL-1 LABEL-2 IRIS

- Camera ID Display (collective channel setting)

Set the camera ID display collectively for each channel.

You can omit the command for settings that do not need to be changed.

To display camera IDs, you must place LABEL-1, LABEL-2, and IRIS items in the customized layout or enhanced layout.

byteTransmission CommandsDescription
1131hKeyword 1
1231hKeyword 2
1341hAch
42hBch
43hCch
44hDch
1431hLABEL-1
1530hNo change
31hLeft justified
32hCenter justified
33hRight justified
16 to 31 ASCII code: 1 byte (20h to 7Eh)Shift JIS code: 2 bytes• 16 bytes max.• Two channels not allowed• Default value (CAM A/B/C/D) if not set
322ChSeparator
3332hLABEL-2
3430h to 33hPlacement (see byte 15)
35 to 50ASCII/Shift JISCharacter string (see bytes 16 to 31)
512ChSeparator
5233hIRIS
5330h to 33hPlacement (see byte 15)
54 to 69ASCII/Shift JISCharacter string (see bytes 16 to 31)
702ChSeparator

Example: To specify "Cch: LABEL-1=Tokyo1, LABEL-2=(no change), IRIS=4.0, do not change any of the placements," set "31h 31h 43h 31h 30h 93h 8Ch 8Bh 9Eh 31h 2Ch 33h 30h 34h 2Eh 30h 2Ch." Cch LABEL-1 IRIS

- Camera ID Display (partial setting)

Set the camera ID display for each item.

To display camera IDs, you must place LABEL-1, LABEL-2, and IRIS items in the customized layout or enhanced layout.

byteTransmission CommandsDescription
1131hKeyword 1
1232hKeyword 2
1341hAch
42hBch
43hCch
44hDch
1431hLABEL-1
32hLABEL-2
33hIRIS
1530hNo change
31hLeft justified
32hCenter justified
33hRight justified
16 to 31ASCII code: 1 byte (20h to 7Eh)Shift JIS code: 2 bytes• 16 bytes max.• Two channels not allowed• Default value (CAM A/B/C/D) if not set
322ChSeparator

Example: To specify "Dch: LABEL-2=Tokyo1, left justified," set "31h 32h 44h 32h 31h 93h 8Ch 8Bh 9Eh 31h 2Ch."

19.1.3 Setting the Checksum

Add the data from the header to the parameters, and set the lower two digits using a 2 byte ASCII code.

As an example, the checksum for the following command will be calculated on the LV5600.

Sender IP address: 01

LV5600: 00

Function: Recall preset number 1

When we add the data from the header to the parameters, we obtain

3 5 h + 3 6 h + 3 0 h + 3 0 h + 3 0 h + 3 1 h + 3 0 h + 3 0 h + 3 0 h + 3 0 h + 3 0 h + 3 0 h + 3 0 h + 3 1 h = 2 ADh

Therefore, we set A→41h for checksum1 and D→44h for checksum2.

byteTransmission CommandsDescription
002hSTX
135hHeader 1
236hHeader 2
330hHeader 3
430hHeader 4
530hSender IP address 1
631hSender IP address 2
730hLV5600 address 1
830hLV5600 address 2
930hRESERVED
1030hRESERVED
1130hKeyword 1
1230hKeyword 2
1330hParameter 1
1431hParameter 2
15(41h)Checksum 1
16(44h)Checksum 2
1703hETX

19.2 Response Messages

The following three response messages are available. The format of each is shown below.

Table 19-4 Response messages

byteLV5600 Response CommandLV7600 Response CommandDescription
NormalFormat errorChecksum errorNormalFormat errorChecksum error
002h02h02h02h02h02hSTX
135h35h35h37h37h37hHeader 1
236h36h36h36h36h36hHeader 2
330h30h30h30h30h30hHeader 3
430h30h30h30h30h30hHeader 4
530h to 39h30h to 39h30h to 39h30h to 39h30h to 39h30h to 39hSender IP address 1
630h to 39h30h to 39h30h to 39h30h to 39h30h to 39h30h to 39hSender IP address 2
730h to 39h30h to 39h30h to 39h30h to 39h30h to 39h30h to 39hLV5600 or LV7600 address 1
830h to 39h30h to 39h30h to 39h30h to 39h30h to 39h30h to 39hLV5600 or LV7600 address 2
930h30h30h30h30h30hRESERVED
1030h30h30h30h30h30hRESERVED
1138h38h38h38h38h38hKeyword 1
1230h31h31h30h31h31hKeyword 2
1330h30h31h30h30h31hParameter 1
1430h31h30h30h31h30hParameter 2
1503h03h03h03h03h03hETX

- Notes

  • Response messages are returned for recalling presets, switching display channels, and displaying tallies when the LV5600 or LV7600 completes the configuration and for displaying camera IDs when the LV5600 or LV7600 receives the command.
  • The BUS is set to drive only when a response is returned for a setting command.

20. NETWORK CONTROL

The instrument can be remotely controlled through its Ethernet port on the rear panel.

Controlling the instrument remotely through its Ethernet interface has only been confirmed to work in a local network environment. LEADER does not guarantee that this feature will work in any network environment.

20.1 SNTP Client Function

The instrument can display time that is synchronized to an NTP server on the network.

20.1.1 How to Use

  1. Configure the Ethernet settings on the NETWORK tab of the SYS menu.

Set SNTP Client Select to On, and set the IP address, server IP address, and time zone adjustment. For details on time zone adjustment, see the next section.

[See also] 7.2.6, "Setting the Network IP"

SYS → F•2 SYSTEM SETUP → F•2 PREV TAB or F•3 NEXT TAB → GENERAL CAPTURE&DISPLAY NETWORK SNMP REMOTE RS485 CAMERA ID TALLY OPERAT ON KEY DATE&TIME LV7290 IP DHCP Off On IP Address 192 168 0 1 Subnet Mask 255 255 255 0 Default Gateway 0 0 0 0 Mac Address 00:00:00:00:00:00 SNTP SNTP Off On Server IP Address 0 0 0 0 Time Zone Adjust +9:00 Server Telnet Off FTP Off On HTTP Off On COMPLETE PREV TAB NEXT TAB up menu

Figure 20-1 NETWORK tab

  1. Press F•1 COMPLETE.
  2. Connect the instrument's Ethernet port to the external network device.

The instrument connects to the NTP server at the following times.

  • When you press F•1 COMPLETE in SYSTEM SETUP
    • Once every approximately 10 minutes

When the instrument connects normally to an NTP server, the time is displayed at the upper right of the screen.

If a connection cannot be established, "NTP ERROR" is displayed in red in the TIME box.

20.1.2 Time Adjustment Value

The date and time exchanged with an NTP (SNTP) are basically Coordinated Universal Time (UTC). Therefore, the time must be adjusted in accordance with the country or region where the device is used in. On the NETWORK tab, set Time Zone Adjust to one of the following values.

Table 20-1 Time adjustment values

Country or regionTime Zone Adjust
Eniwetok, Kwajalein-12:0
Midway Island, Samoa-11:0
Hawaii-10:0
Alaska-9:0
Pacific Time (US & Canada), Tijuana-8:0
Mountain Time (US & Canada), Arizona-7:0
Central Time (US & Canada), Central America, Saskatchewan, Mexico City-6:0
Eastern Time (US & Canada), Indiana (East), Bogota, Lima, Quito-5:0
Atlantic Time (Canada), La Paz, Santiago-4:0
Greenland, Buenos Aires, Georgetown, Brasilia-3:0
Mid-Atlantic-2:0
Azores, Cape Verde Is.-1:0
Greenwich Mean Time (Dublin, Edinburgh, Lisbon, London), Casablanca, Monrovia-/+0:0
Amsterdam, Berlin, Bern, Rome, Stockholm, Sarajevo, Skopje, Sofija, Vilnius, Warsaw, Zagreb, Brussels, Madrid, Copenhagen, Paris, Belgrade Bratislava, Budapest, Ljubljana, Prague, West Central Africa+1:0
Athens, Istanbul, Minsk, Jerusalem, Cairo Harare, Pretoria, Bucharest, Isinki, Riga, Tallinn+2:0
Kuwait, Riyadh, Nairobi, Baghdad, Moscow, Volgograd, St. Petersburg+3:0
Abu Dhabi, Muscat, Baku, Tbilisi, Yerevan+4:0
Islamabad, Karachi, Tashkent, Ekaterinburg+5:0
Astana, Dhaka, Almaty, Novosibirsk+6:0
Krasnoyarsk, Bangkok, Hanoi, Jakarta+7:0
Irkutsk, Ulaan Bataar, Kuala Lumpur, Singapore, Perth, Taipei, Beijing, Chongqing, Hong Kong SAR, Urumqi+8:0
Seoul, Yakutsk, Osaka, Sapporo, Tokyo+9:0
Vladivostok, Canberra, Melbourne, Sydney, Guam, Port Moresby, Brisbane, Hobart+10:0
Magadan, Solomon Is., New Caledonia+11:0
Auckland, Wellington, Fiji Islands, Kamchatka, Marshall Is.+12:0

20.2 TELNET

From a PC connected to the same network as the instrument, you can remotely control most of the operations that can be controlled from the panel.

If you are using the LV7600, read LV5600 and lv5600 as LV7600 and lv7600.

20.2.1 How to Use

  1. Configure the Ethernet settings on the NETWORK tab of the SYS menu.

Set the IP address, and set Telnet to On.

You cannot use the LV7290 REMOTE CONTROLLER while using TELNET. Conversely, if you set LV7290 to On, you cannot use TELNET.

[See also] 7.2.8, "Configuring the Server"

SYS → F•2 SYSTEM SETUP → F•2 PREV TAB or F•3 NEXT TAB → GENERAL CAPTURE&DISPLAY NETWORK SNMP REMOTE RS485 CAMERA ID TALLY OPERATION KEY DATE&TIME LV7290 IP DHCP Off On IP Address 192. 168 0. 1 Subnet Mask 255. 255. 255. 0 Default Gateway 0. 0 0. 0 Mac Address 00:00:00:00:00:00 SNTP SNTP Off On Target IP Address Time Zone Adjust =3.00 Server Telnet On FTP Off On HTTP Off On COMPLETE PREV TAB NEXT TAB up menu

Figure 20-2 NETWORK tab

  1. Press F•1 COMPLETE.
  2. Connect the instrument's Ethernet port to the external network device.
  3. On the PC, start a TELNET client.

On Windows 7, on the taskbar, click Start, and then click Run. Type "TELNET" and the IP address that you set in step 1. Then, click OK.

(To use TELNET, open Control Panel, click Turn Windows features on or off under Program and Features, and select the Telnet Client check box.)

20. Network Control

5. Type the login name and password.

The login name and password are "LV5600". Use uppercase for all characters.

When the login name and password are entered correctly, "LV5600@LV5600:\~\$" appears.

LV5600 login: LV5600

Password: *****

LV5600@LV5600:\~\$

6. Enter TELNET commands.

Enter commands by referring to sections 20.2.2, "How to Enter Commands," and 20.2.3, "TELNET Commands."

To end a TELNET session, type "exit" in lowercase letters.

LV5600@LV5600:\~\$ exit

20.2.2 How to Enter Commands

The command syntax is explained below. (Some commands do not have parameters.) To query a current setting, use a question mark as the parameter.

LV5600@LV5600:\~\$ [Command] + [Space] + [Parameter]

Examples of how to enter commands are shown below.

• Showing the Status Display

LV5600@LV5600:\~\$ STATUS

- Displaying the Center Marker in the Picture Display

LV5600@LV5600:\~\$ PIC:MARKER:CENTER ON

- Querying the Vector Intensity

LV5600@LV5600:\~\$ VECTOR:INTEN ?

* You can enter commands using uppercase or lowercase letters.
* Because the display channel selection command is different depending on the display mode (single or simul) and SDI signal input settings, check the INPUT KEY command.
* To query the measured value or detected value, you must use the INPUT KEY command to show the measurement screen of the appropriate channel.
Further, for 4K 3G QUAD LINK, 4K 3G DUAL LINK, 4K HD QUAD LINK, 3G DUAL LINK, and HD DUAL LINK settings, you must also select the link according to the link selection command of each measurement item.

20.2.3 TELNET Commands

TELNET commands follow the instrument or the option menu structure. Some of the descriptions do not apply depending on the installed options or the current settings.

  • INPUT KEY
r/w LimitationCommand Parameter
-INP:SIMULSINGLE / SIMUL / ?
-INP_SINGLE:AON / ? (Return value:ON (Channel A selected) / OFF (not selected))SD/HD/3G-A/3G-B-DL, 3G-B-DS setting, Select the display channel in single input mode.
-INP_SINGLE:BON / ? (Return value:ON (Channel B selected) / OFF (not selected))
-INP_SINGLE:CON / ? (Return value:ON (Channel C selected) / OFF (not selected))
-INP_SINGLE:DON / ? (Return value:ON (Channel D selected) / OFF (not selected))
-INP:SIMUL:AOFF / ON / ? (Return value:Channel A display on/off)SD/HD/3G-A/3G-B-DL, 3G-B-DS setting, Select the display channel in simul mode.
-INP:SIMUL:BOFF / ON / ? (Return value:Channel B display on/off)
-INP:SIMUL:COFF / ON / ? (Return value:Channel C display on/off)
-INP:SIMUL:DOFF / ON / ? (Return value:Channel D display on/off)
-INP_12G:AON / ? (Return value:ON (Channel A selected) / OFF (not selected))4K 12G setting, Select the display channel.
-INP_12G:BON / ? (Return value:ON (Channel B selected) / OFF (not selected))
-INP_12G:CON / ? (Return value:ON (Channel C selected) / OFF (not selected))
-INP_12G:DON / ? (Return value:ON (Channel D selected) / OFF (not selected))
-INP:D_SINGLE:ABON / ? (Return value: Channel A-B pair display on/off)4K 3G Dual Link, HD Dual Link, 3G Dual Link setting, Select the display channel in single input mode.
-INP:D_SINGLE:CDON / ? (Return value: Channel C-D pair display on/off)
-INP:D_SIMUL:ABOFF / ON / ? (Return value: Channel A-B pair display on/off)HD Dual Link, 3G Dual Link setting, Select the display channel in simul mode.
-INP:D_SIMUL:CDOFF / ON / ? (Return value:Channel C-D pair display on/off)
-INP_OPERATECOM / INDIVIDUAL / ?
  • EXT KEY
r/wLimitationCommand Parameter
-EXTINT / EXT / ?

•CAP KEY

r/w LimitationCommandParameter
-CAP:TRIGGERMANUAL / ERROR / ?
WOCAP:REFRESHNone
-CAP:DISPLAYREAL / HOLD / BOTH / ?
-CAP:FILE:BMPOFF / ON / ?
-CAP:FILE:BSGOFF / ON / ?
-CAP:FILE : DPXOFF / ON / ?
-CAP:FILE : TIFOFF / ON / ?
-CAP:FILE : FRMOFF / ON / ?
  1. Network Control
r/w LimitationCommand Parameter
WOSTORENone
WOMAKECAP_BMP / CAP_BSG / CAP_DPX_A / CAP_DPX_B / CAP_DPX_C / CAP_DPX_D / CAP_TIF_A / CAP_TIF_B / CAP_TIF_C / CAP_TIF_D / CAP_FRM_A / CAP_FRM_B / CAP_FRM_C / CAP_FRM_D / LOG / DUMP / LOUDNESS* File make command. Use FTP to retrieve created files.
-CAP:FRM:CAPNUM1 / 16 / ?
  • PRESET KEY
r/wLimitationCommand Parameter
WORCLL1 to 60
  • MULTI KEY
r/w LimitationCommand Parameter
-MULTIOFF / ON / ?
WOUSER:LYTUSER1/ USER2 / USER3 / USER4 / USER5 / USER6
  • SYS KEY
r/w LimitationCommand Parameter
-SYS:LCD:BACKLIGHT1 to 32 / ?
WOSYS:LCD:ONNone
WOSYS:LCD:OFFNone
WOSYS:INITIALIZE:PARAMNone
WOSYS:INITIALIZE:LAYOUTNone
WOSYS:INITIALIZE:OPERATENone
WOSYS:INITIALIZE:ALLNone
- SYSSDI:SYSTEM 4K_12G / 4K_3G_QLINK / 4K_3GDLINK /4K_HD_QLINK / SINGLE_LINK / HD_DLINK /3G_DLINK / 3GB_DSTREAM / ?* Correspondence between parameters and settings4K_12G : 4K 12G4K_3G_QLINK : 4K 3G QUAD LINK4K_3G_DLINK : 4K 3G DUAL LINK4K_HD_QLINK : 4K HD QUAD LINKSINGLE_LINK : SD/HD/3G-A/3G-B-DLHD_DLINK : HD DUAL LINK3G_DLINK : 3G DUAL LINK3GB_DSTREAM : 3G-B-DS
-SYS:SDI:COLORIMETRYPAYLOAD_ID / BT709 / BT2020 / DCI / ?
-SYS:XYZ_GAMMABOTTOM_ZERO / DCI / ?
  • WFM KEY
r/w LimitationCommand Parameter
WOWFMNone
-WFM:MODEOVERLAY / PARADE / ?
-WFM:MODE:YCBCR:YON / OFF / ?
-WFM:MODE:YCBCR:CBON / OFF / ?
-WFM:MODE:YCBCR:CRON / OFF / ?
  1. Network Control
-WFM:MODE:GBR:GON / OFF / ?
-WFM:MODE:GBR:BON / OFF / ?
-WFM:MODE:GBR:RON / OFF / ?
-WFM:MODE:RGB:RON / OFF / ?
-WFM:MODE:RGB:GON / OFF / ?
-WFM:MODE:RGB:BON / OFF / ?
-WFM:MODE:XYZ:XON / OFF / ?
-WFM:MODE:XYZ:YON / OFF / ?
-WFM:MODE:XYZ:ZON / OFF / ?
-WFM:MODE:4Y_PARADEON / OFF / ?
-WFM:MODE:3G-B-DSSTREAM1 / STREAM2 / MIX / ALIGN / ?
-WFM:EXT_SYNCON / OFF / ?
-WFM:EXT_SYNC:INTEN-128 to 127 / ?
-WFM:EXT_SYNC:COLORWHITE / YELLOW / CYAN / GREEN / MAGENTA / RED / BLUE / ?
-WFM:INTEN-128 to 127 / ?
-WFM:COLORWHITE / YELLOW / CYAN / GREEN / MAGENTA / RED / BLUE / MULTI / ?
-WFM:COLOR:S1WHITE / YELLOW / CYAN / GREEN / MAGENTA / RED / BLUE / MULTI / ?
-WFM:COLOR:S2WHITE / YELLOW / CYAN / GREEN / MAGENTA / RED / BLUE / MULTI / ?
-WFM:SCALE:INTEN-8 to 7 / ?
-WFM:SCALE:COLORWHITE / YELLOW / CYAN / GREEN / MAGENTA / RED / BLUE / ?
-WFM:SCALE:UNITHDV_SDP / HDV_SDV / HDP_SDP / CV_DEC / CV_HEX / ?
-WFM:SCALE:UNIT:NTSCP / ?
-WFM:SCALE:UNIT:PALV / ?
-WFM:SCALE:UNIT:FULLHDP_SDP / CV_DEC / CV_HEX / ?
-WFM:SCALE:75_COLORON / OFF / ?
-WFM:SCALE:DISPLAYON / OFF / BOTH / MAIN / HDR / ?
-WFM:GAIN:VARIABLECAL / VAR / ?
-WFM:GAIN:MAGX1 / X5 / X10 / ?
-WFM:GAIN:VALUE20 to 200 / ?* MAG value × 0.200 (20) - 2.000 (200)
-WFM:GAIN:SCALE_JUMPOP / 10P / 20P / 30P / 40P / 50P / 60P / 70P / 80P / 90P / 100P / CURSOR / ?
-WFM:FILTER:NORMALFLAT / LOWPASS / ?
-WFM:FILTER:COMPOSITEFLAT / LUM / FLAT_LUM / LUM_CRMA / ?
-WFM:SWEEPH / V / ?
-WFM:SWEEP:H_SWEEP1H / 2H / ?
-WFM:SWEEP:V_SWEEP1V / 2V / ?
-WFM:SWEEP:H_MAGX1 / X10 / X20 / ACTIVE / BLANK / ?
-WFM:SWEEP:V_MAGX1 / X20 / X40 / ?
-WFM:SWEEP:FIELDFIELD1 / FIELD2 / ?
-WFM:BLANKING:NORMALREMOVE / H_VIEW / V_VIEW / ALL_VIEW / ?
-WFM:BLANKING:COMPOSITEREMOVE / V_VIEW / ?
-WFM:CURSORWFM:CURSOR
-WFM:CURSOR:SELECTWFM:CURSOR:SELECT
-WFM:CURSOR:UNIT:XWFM:CURSOR:UNIT:X
-WFM:CURSOR:UNIT:YWFM:CURSOR:UNIT:Y
-WFM:CURSOR:UNIT:Y:COMPOSITEWFM:CURSOR:UNIT:Y:COMPOSITE
-WFM:CURSOR:REF0 to 927 (when X is selected)-5000 to 15000 (when Y is selected)
-WFM:CURSOR:DELTA0 to 927 (when X is selected)-5000 to 15000 (when Y is selected)
  1. Network Control
-WFM:CURSOR:TRACK0 to 927 (when X is selected)-15000 to 15000 (when Y is selected)
WOWFM:CURSOR:REFSETNone
-WFM:CURSOR:VALON / OFF / ?
-WFM:LINE_SELECTON / OFF / ?
-WFM:LINE_NUMBER0 to 32767 / ?
-WFM:LINE_FIELDFIELD1 / FIELD2 / FRAME / ?
-WFM:MATRIX:YCBCRYCBCR / GBR / RGB / COMPOSITE / ?
-WFM:MATRIX:RGBGBR / RGB / COMPOSITE / ?
-WFM:MATRIX:YGBRON / OFF / ?
-WFM:MATRIX:YRGBON / OFF / ?
-WFM:MATRIX:COMPOSITE:FORMATAUTO / NTSC / PAL / ?
-WFM:MATRIX:COMPOSITE:SETUPOP / 7.5P / ?
-WFM:MATRIX:XYZXYZ / GBR / RGB / COMPOSITE / ?
  • VECTOR KEY
r/w LimitationCommandParameter
WOVECTORNone
-VECTOR:LINE_SELECTON / OFF / CINELITE / ?
-VECTOR:LINE_NUMBER0 to 32767 / ?
-VECTOR:LINE_FIELDFIELD1 / FIELD2 / FRAME / ?
-VECTOR:MATRIX:CB100P / 75P / ?
-VECTOR:MATRIX:COLOR_MATRIXCOMPONENT / COMPOSITE / ?
-VECTOR:MATRIX:COMPOSITE:FORMATAUTO / NTSC / PAL / ?
-VECTOR:MATRIX:COMPOSITE:SETUP0P / 7_5P / ?
- VECTOR:VECTOR:MODEVECTOR / RGBVECTOR / YCBCRVECTOR / ?
-VECTOR:VECTOR:INTEN-128 to 127 / ?
-VECTOR:VECTOR:COLORWHITE / YELLOW / CYAN / GREEN / MAGENTA / RED / BLUE / ?
-VECTOR:VECTOR:COLOR:S1WHITE / YELLOW / CYAN / GREEN / MAGENTA / RED / BLUE / ?
-VECTOR:VECTOR:COLOR:S2WHITE / YELLOW / CYAN / GREEN / MAGENTA / RED / BLUE / ?
-VECTOR:VECTOR:3G-B-DSSTREAM1 / STREAM2 / MIX / ALIGN / ?
-VECTOR:VECTOR:SCALE:INTEN-8 to 7 / ?
-VECTOR:VECTOR:SCALE:COLORWHITE / YELLOW / CYAN / GREEN / MAGENTA / RED / BLUE / ?
-VECTOR:VECTOR:SCALE:IQ_AXISON / OFF / ?
-VECTOR:VECTOR:SCALE:VEC_SCALEAUTO / BT601 / BT709 / BT2020 / DCI / ?
-VECTOR:VECTOR:GAIN:VARIABLECAL / VAR / ?
-VECTOR:VECTOR:GAIN:MAGX1 / X5 / IQ / ?
-VECTOR:VECTOR:GAIN:VALUE200 to 2000 / ?* X11000 to 10000 / ?* X5580 to 5840 / ?* IQ-MAG or SD, composite display620 to 6240 / ?* not IQ-MAG or SD, component display520 to 5260 / ?* IQ-MAG or SD, for pseudo-composite display570 to 5700 / ?* not IQ-MAG or SD, for pseudo-composite display
-VECTOR:VECTOR:MARKERON / OFF / ?
-VECTOR:VECTOR:VAR_MKR:FOLLOW_MKRON / OFF / ?
-VECTOR:VECTOR:VAR_MKR:RADIUS_CTRLON / OFF / ?
  1. Network Control
-VECTOR:VECTOR:VAR_MKR:D_DEG_SELD / DEG / ?
-VECTOR:VECTOR:VAR_MKR:MKR_SIZE5 to 10 / ?
-VECTOR:RGBVECTOR:SCALE:ADJ_TARGETGB / GR / ?
-VECTOR:RGBVECTOR:SCALE:H-500 to 500 / ?
-VECTOR:RGBVECTOR:SCALE:V-500 to 500 / ?
-VECTOR:RGBVECTOR:GAIN:H 200 to 2000 / ?* 0.200 (200) - 2.000 (2000)
-VECTOR:RGBVECTOR:GAIN:V 200 to 2000 / ?* 0.200 (200) - 2.000 (2000)
-VECTOR:YCBCRVECTOR:SCALE:TIM_MKRAUTO / HD / SD / ?
-VECTOR:YCBCRVECTOR:SCALE:VEC_SCALEAUTO / BT601 / BT709 / BT2020 / DCI / ?
-VECTOR:YCBCRVECTOR:GAIN:VARIABLECAL / VAR / ?
-VECTOR:YCBCRVECTOR:GAIN:MAGX1 / X5 / ?
-VECTOR:YCBCRVECTOR:GAIN:VALUE 200 to 2000 / ?* MAG value × 0.200 (200) - 2.000 (2000)
-VECTOR:YCBCRVECTOR:GAIN:OBS_POINT BY_WH/ BY_YL / BY_CY / BY_G / BY_TM / BY_MG / BY_R / BY_B / BL / RY_B / RY_R / RY_MG / RY_TM / RY_G / RY_CY / RY_YL / RY_WH / ?
-VECTOR:5BAR:SCALEP / MV / HEX / DEC / ?
-VECTOR:5BAR:SEQUENCEGBR / RGB / ?
-VECTOR:HIST:SCALEP / HDR / ?
-VECTOR:HIST:FORMSINGLE / TILE / ALIGN_H / ALIGN_V / ?
-VECTOR:HIST:YON / OFF / ?
-VECTOR:HIST:RON / OFF / ?
-VECTOR:HIST:GON / OFF / ?
-VECTOR:HIST:BON / OFF / ?
-VECTOR:CIE:SCALE:COLORBG_COLOR / BG_WHITE / BG_BLACK / ?
-VECTOR:CIE:SCALE:TRIANGLE1OFF / BT601_525 / BT601_625 / BT709 / DCI / BT2020 / ?
-VECTOR:CIE:SCALE:TRIANGLE2OFF / BT601_525 / BT601_625 / BT709 / DCI / BT2020 / ?
-VECTOR:CIE:SCALE:USER_TRIANGLE1 / 2 / OFF / ?
- VECTOR:CIE:SCALE:USER_TRIANGLE:COLO RG / B / R / ?
-VECTOR:CIE:SCALE:USER_TRIANGLE1:X0 to 1000 / ?* 0(0.000) - 1000(1.000)
-VECTOR:CIE:SCALE:USER_TRIANGLE1:Y0 to 1000 / ?* 0(0.000) - 1000(1.000)
-VECTOR:CIE:SCALE:USER_TRIANGLE2:X0 to 1000 / ?* 0(0.000) - 1000(1.000)
-VECTOR:CIE:SCALE:USER_TRIANGLE2:Y0 to 1000 / ?* 0(0.000) - 1000(1.000)
-VECTOR:CIE:SCALE:SUB:TEMP_SCALEON / OFF / ?
-VECTOR:CIE:SCALE:SUB:GRIDON / OFF / ?
-VECTOR:CIE:SCALE:SUB:D65ON / OFF / ?
-VECTOR:CIE:SCALE:SUB:CAPON / OFF / ?
-VECTOR:CIE:MODEDIAGRAM / TEMP / ?
-VECTOR:CIE:STANDARDCIE1931 / CIE1976 / ?
-VECTOR:CIE:CLIPON / OFF / ?
-VECTOR:CIE:FILTERON / OFF / ?
-VECTOR:CIE:MANUALON / OFF / ?
-VECTOR:CIE:MANUAL:COLORIMETRYBT601_525 / BT610_625 / BT709 / DCI / BT2020 / ?
-VECTOR:CIE:MANUAL:GAMMA150 to 300 / ?* 150(1.50) - 300(3.00)
-VECTOR:CIE:CURSORON / OFF / ?
  • PICTURE KEY
r/w LimitationCommand Parameter
WOPICTURENone
-PIC:MODEFIT / REAL / X2 / FULL_FRAME / ?
-PIC:COLORMONO / COLOR / ?
-PIC:CHROMAUP / NORMAL / ?
-PIC:BRIGHTNESS-500 to 500 / ?* -500(-50.0%) - 500(50.0%)
- PIC:CONTRAST 0 to 2000 / ?* 0(0%) - 2000(200.0%)
-PIC:GAIN:R0 to 2000 / ?* 0(0%) - 2000(200.0%)
-PIC:GAIN:G0 to 2000 / ?* 0(0%) - 2000(200.0%)
-PIC:GAIN:B0 to 2000 / ?* 0(0%) - 2000(200.0%)
-PIC:GAIN:CHROMA0 to 2000 / ?* 0(0%) - 2000(200.0%)
-PIC:BIAS:R-500 to 500 / ?* -500(-50.0%) - 500(50.0%)
-PIC:BIAS:G-500 to 500 / ?* -500(-50.0%) - 500(50.0%)
-PIC:BIAS:B-500 to 500 / ?* -500(-50.0%) - 500(50.0%)
-PIC:DISP:GAMUTOFF / WHITE / RED / MESH / ?
-PIC:DISP:STATUS_INFOON / OFF / ?
-PIC:DISP:3G-B-DSSTREAM1 / STREAM2 / ALIGN / ?
-PIC:MARKER:FRAMEON / OFF / ?
-PIC:MARKER:CENTERON / OFF / ?
-PIC:MARKER:ASPECTOFF / 17_9 / 16_9 / 14_9 / 13_9 / 4_3 / 2.93_1 / AFD / ?
-PIC:MARKER:ASPECT:SHADOW0 to 100 / ?
-PIC:MARKER:SAFE:ACTIONARIB / SMPTE / USER1 / OFF / ?
-PIC:MARKER:SAFE:TITLEARIB / SMPTE / USER2 / OFF / ?
-PIC:MARKER:SAFE:USER1:WIDTH0 to 100 / ?
-PIC:MARKER:SAFE:USER1:HEIGHT0 to 100 / ?
-PIC:MARKER:SAFE:USER2:WIDTH0 to 100 / ?
-PIC:MARKER:SAFE:USER2:HEIGHT0 to 100 / ?
-PIC:MARKER:SAFE:USER1_2:ASPECTON / OFF / ?
-PIC:SUPER_IMPOSEOFF / CC_SMPTE / CC_ARIB / TELETEXT_B / ?
-PIC:SUPER_IMPOSE:FORMAT608_708 / 608_608 / VBI / 708 / ?* CC_SMPTE
-PIC:CINELITE:ADVANCESD / HD / ANALOG / CELLUAR / ?* CC_ARIB
-PIC:SUPER_IMPOSE:LANGUAGECC1 / CC2 / CC3 / CC4 / TEXT1 / TEXT2 / TEXT3 /TEXT4 / ?* CC_SMPTE1 / 2 / ?* CC_ARIB
-PIC:SUPER_IMPOSE:PAGE100 to 8FF / ?
-PIC:SUPER_IMPOSE:SERVICE_DATA1 to 63 / ?
-PIC:SUPER_IMPOSE:CS_LOGSTART / STOP / ?
-PIC:SUPER_IMPOSE:CS_LOG:LOUDNESSON / OFF / ?
WOPIC:SUPER_IMPOSE:CS_LOG:CLEARNone
-PIC:SUPER_IMPOSE:CS_LOG:MODEOVER_WRITE / STOP / ?
WOPIC:SUPER_IMPOSE:CLEARNone
  1. Network Control
-PIC:CINELITE:DISPLAYOFF / FSTOP / P_DISPLAY / CINEZONE / ?
-PIC:CINELITE:ADVANCEON / OFF / ?
-PIC:CINELITE:MEASURE_NUMBERSP1 / P1+P2 / P1+P2+P3 / ?
-PIC:CINELITE:MEASURE_POSITIONP1 / P2 / P3 / ?
-PIC:CINELITE:MEASURE_SIZE1X1 / 3X3 / 9X9 / ?
ROPIC:CINELITE:P1_DATA?
ROPIC:CINELITE:P2_DATA?
ROPIC:CINELITE:P3_DATA?
-PIC:CINELITE:MAX_FALL_CLLON / OFF / ?
-PIC:CINELITE:MAX_FALL_CLL:MEASURESTOP / START / ?
WOPIC:CINELITE:MAX_FALL_CLL:CLEARNone
WOPIC:CINELITE:FSTOP:18P_REF_SETNone
-PIC:CINELITE:FSTOP:GAMMA_SELECT0.45 / USER1 / USER2 / USER3 / USER_A / USER_B / USER_C / USER_D / USER_E / ?
WO PICCINELITE:FSTOP:GAMMA:CAL:TABLE_CLEARNone
WO PICCINELITE:FSTOP:GAMMA:CAL:1_DATA_CLEARNone
WOPIC:CINELITE:FSTOP:GAMMA:CAL:SETNone
-PIC:CINELITE:FSTOP:GAMMA:CAL:F22.0 / 16.0 / 11.0 / 8.0 / 5.6 / 4.0 / 2.8 / 2.0 / ?
WO PICCINELITE:FSTOP:GAMMA:FILE:TABLE_CLEARNone
-PIC:CINELITE:P_DISPLAY:UNIT_SELECTY_P / RGB_P / RGB255 / ?* MEASURE SIZE : not 1x1Y_P / RGB_P / RGB255 / CV_HEX / CV_DEC / ?* MEASURE SIZE : 1x1, input signal: not XYZY_P / RGB_P / RGB255 / CV_XYZ_HEX /CV_XYZ_DEC / CV_RGB_HEX / CV_RGB_DEC / ?* MEASURE SIZE : 1x1, input signal : XYZ
-PIC:CINELITE:CINEZONE:FORMGRADATE / STEP / SEARCH / ?
-PIC:CINELITE:CINEZONE:UPPER-63 to 1094 / ?※ -63(-6.3%) - 1094(109.4%)
-PIC:CINELITE:CINEZONE:LOWER-73 to 1084 / ?※ -73(-7.3%) - 1084(108.4%)
-PIC:CINELITE:CINEZONE:LEVEL-73 to 1094 / ?※ -73(-7.3%) - 1094(109.4%)
-PIC:FOCUS:PICTURE_MODEFIT / REAL / X2 / ?
-PIC:FOCUS:ASSISTON / OFF / ?
-PIC:FOCUS:SENSITIVELOW / MIDDLE / HIGH / V_HIGH / U_HIGH / ?
-PIC:FOCUS:PICTURE_LEVELOFF / EMBOSS / 25 / 50 / 75 / 100 / ?
-PIC:FOCUS:EDGE_COLORWHITE / RED / GREEN / BLUE / ?
-PIC:LINE_SELECTON / OFF / ?
-PIC:LINE_NUMBER-32768 to 32767 / ?
-PIC:LINE_FIELDFIELD1 / FIELD2 / FRAME / ?
  • AUDIO KEY
r/w LimitationCommandParameter
WOAUDIONone
-AUDIO:MODELISSAJOU / SURROUND / STATUS / LOUDNESS / ?※ CH MODE : 8CH LISSAJOU / METER / STATUS / ?※ CH MODE : 16CH
-AUDIO:METER:RANGE60DBFS / 90DBFS / MAG / ?
-AUDIO:METER:RESPONSETRUEPEAK / PPM / VU / ?
-AUDIO:METER:RESPONSE:PPMPPM_I / PPM_II / ?
-AUDIO:METER:RESPONSE:VUTRUE / PPM_I / PPM_II / ?
  1. Network Control
-AUDIO:METER:PEAK_HOLD0.0 / 0.5 / 1.0 / 1.5 / 2.0 / 2.5 / 3.0 / 3.5 / 4.0 / 4.5 / 5.0 / HOLD / ?
-AUDIO:METER:LEVEL_SET:OVER_LEVEL-400 to 0 / ?※ -40.0 (-400) - 0.0 (0)
-AUDIO:METER:LEVEL_SET:WARNING_LEVEL-400 to 0 / ?※ -40.0 (-400) - 0.0 (0)
-AUDIO:METER:LEVEL_SET:REF_LEVEL-400 to 0 / ?※ -40.0 (-400) - 0.0 (0)
-AUDIO:LISSAJOU:LISSAJOU:INTEN-8 to 7 / ?
-AUDIO:LISSAJOU:SCALE:INTEN-8 to 7 / ?
-AUDIO:LISSAJOU:DISPLAYMULTI / SINGLE / ?
-AUDIO:LISSAJOU:FORMX_Y / MATRIX / ?
-AUDIO:SURROUND:SURROUND:INTEN-8 to 7 / ?
-AUDIO:SURROUND:SCALE:INTEN-8 to 7 / ?
-AUDIO:SURROUND:5.1NORMAL / PHANTOM / ?
-AUDIO:SURROUND:AUTO_GAINON / OFF / ?
WOAUDIO:DISP:LOGNone
-AUDIO:STATUS:EVENT_LOGSTART / STOP / ?
WOAUDIO:STATUS:EVENT_LOG:CLEARNone
-AUDIO:STATUS:EVENT_LOG:MODEOVER_WRT / STOP / ?
WOAUDIO:DISP:CH_STATUSNone
-AUDIO:STATUS:CH_STATUS:CHCH1 / CH2 / CH3 / CH4 / CH5 / CH6 / CH7 / CH8 / CH9 / CH10 / CH11 / CH12 / CH13 / CH14 / CH15 / CH16 /A1 / A2 / A3 / A4 / A5 / A6 / A7 / A8 / A9 / A10 / A11 / A12 / A13 / A14 / A15 / A16 /B1 / B2 / B3 / B4 / B5 / B6 / B7 / B8 / B9 / B10 / B11 / B12 / B13 / B14 / B15 / B16 /C1 / C2 / C3 / C4 / C5 / C6 / C7 / C8 / C9 / C10 / C11 / C12 / C13 / C14 / C15 / C16 /D1 / D2 / D3 / D4 / D5 / D6 / D7 / D8 / D9 / D10 / D11 / D12 / D13 / D14 / D15 / D16 / ?
-AUDIO:STATUS:CH_STATUS:ALIGNLSB / MSB / ?
WOAUDIO:DISP:USER_BITNone
-AUDIO:STATUS:USER_BIT:CHCH1 / CH2 / CH3 / CH4 / CH5 / CH6 / CH7 / CH8 / CH9 / CH10 / CH11 / CH12 / CH13 / CH14 / CH15 / CH16 /A1 / A2 / A3 / A4 / A5 / A6 / A7 / A8 / A9 / A10 / A11 / A12 / A14 / A15 / A16 /B1 / B2 / B3 / B4 / B5 / B6 / B7 / B8 / B9 / B10 / B11 / B12 / B13 / B14 / B15 / B16 /C1 / C2 / C3 / C4 / C5 / C6 / C7 / C8 / C9 / C10 /C11 / C12 / C13 / C14 / C15 / C16 /D1 / D2 / D3 / D4 / D5 / D6 / D7 / D8 / D9 / D10 / D11 / D12 / D13 / D14 / D15 / D16 / ?
-AUDIO:STATUS:USER_BIT:ALIGNLSB / MSB / ?
WOAUDIO:STATUS:ERROR_RESETNone
-AUDIO:LOUD:PERIOD2MIN / 10MIN / 30MIN / 1HOUR / 2HOUR / 6HOUR / 12HOUR / 24HOUR / ?
WOAUDIO:LOUD:CHART_CLEARNone
-AUDIO:LOUD:MEASURESTART / STOP / ?
-AUDIO:LOUD:MAGOFF / ON / ?
  • STATUS KEY
r/wLimitationCommandParameter
WOSTATUSNone
  1. Network Control
WOSTS:DUMPNone
WOSTS:EXT_REFNone
WOSTS:AVPHASENone
WOSTS:ANCVIEWNone
WOSTS:ANCVIEW:DUMPNone
WOSTS:LOGNone
WOSTS:ANCPKTNone
WOSTS:ANCPKT:PKT_ANLYS:EDHNone
WOSTS:ANCPKT:PKT_ANLYS:PAYLOADNone
WOSTS:ANCPKT:PKT_ANLYS:CTRL_PKTNone
WOSTS:ANCPKT:PKT_ANLYS:V_ANC:ARIB:CCNone
WOSTS:ANCPKT:PKT_ANLYS:V_ANC:ARIB:NETQNone
WOSTS:ANCPKT:PKT_ANLYS:V_ANC:ARIB:TRIGNone
WO STS:ANCPKT:PKT_ANLYS:V_ANC:ARIB:USER 1None
WO STS:ANCPKT:PKT_ANLYS:V_ANC:ARIB:USER 2None
WOSTS:ANCPKT:PKT_ANLYS:V_ANC:SMPTE:60 8None
WO STS:ANCPKT:PKT_ANLYS:V_ANC:SMPTE:70 8None
WO STS:ANCPKT:PKT_ANLYS:V_ANC:SMPTE:AF DNone
WO STS:ANCPKT:PKT_ANLYS:V_ANC:SMPTE:PRO OGNone
WOSTS:ANCPKT:PKT_ANLYS:V_ANC:SMPTE:VBINone
WOSTS:ANCPKT:PKT_ANLYS:SEARCHNone
WOSTS:ERROR:CLEARNone
-STS:LOG:LOGSTART / STOP / ?
-STS:LOG:MODEOVER_WRT / STOP / ?
WOSTS:LOG:CLEARNone
-STS:SDI_ANLYS:DUMP:MODERUN / HOLD / ?
-STS:SDI_ANLYS:DUMP:MODE_CAPRUN / HOLD / FRMCAP / ?
-STS:SDI_ANLYS:DUMP:OPE:JUMPEAV / SAV / ?
WOSTS:SDI_ANLYS:EXT_REF:USER_REFNone
WOSTS:SDI_ANLYS:EXT_REF:DEFAULTNone
WOSTS:SDI_ANLYS:EXT_REF:SELECTEXT / SDI / ?
-STS:SDI_ANLYS:EXT_REF:TIMINGLEGACY / SERIAL / ?
-STS:AV_PHASE:SCALE50MS / 100MS / 500MS / 1000MS / 2500MS / ?
WOSTS:AVPHASE:REFRESHNone
-STS:ANCVIEW:DUMP:HOLDHOLD / 1S / 3S / ?
-STS:ANCVIEW:DUMP:MODEHEX / BINARY / ?
-STS:ANCVIEW:DUMP:SAMPLE0 to 258 / ?
-STS:ANCPKT:PKT_ANLYS:EDH:DISPTEXT / DUMP / ?
-STS:ANCPKT:PKT_ANLYS:EDH:MODEHEX / BINARY / ?
-STS:ANCVIEW:STREAMSTREAM1 / STREAM2 / ?
- STS: ANCPKT:PKT_ANLYS:PAYLOAD_ID:STREAMSTREAM1 / STREAM2 / ?
- STS: ANCPKT:PKT_ANLYS:CTRL_PKT:DISPLAYTEXT / DUMP / ?
-STS:ANCPKT:PKT_ANLYS:CTRL_PKT:MODEHEX / BINARY / ?
-STS:ANCPKT:PKT_ANLYS:CTRL_PKT:GROUPGROUP1 / GROUP2 / GROUP3 / GROUP4 / ?
- STS: ANCPKT:PKT_ANLYS:CTRL_PKT:STREAMSTREAM1 / STREAM2 / ?
-STS:ANCPKT:PKT_ANLYS:V_ANC:ARIB:CC:DISPTEXT / DUMP / ?
  1. Network Control
-STS:ANCPKT:PKT_ANLYS:V_ANC:ARIB:CC:TYPEHD / SD / ANALOG / CELLULAR / ?
-STS:ANCPKT:PKT_ANLYS:V_ANC:ARIB:CC:MODEHEX / BINARY / ?
-STS:ANCPKT:PKT_ANLYS:V_ANC:ARIB:CC:SMPL0 to 258 / ?
-STS:ANCPKT:PKT_ANLYS:V_ANC:ARIB:CC:STREAMSTREAM1 / STREAM2 / ?
-STS:ANCPKT:PKT_ANLYS:V_ANC:ARIB:NETQ:DISPTEXT / DUMP / Q_LOG / FORMAT / ?
-STS:ANCPKT:PKT_ANLYS:V_ANC:ARIB:NETQ:MODEHEX / BINARY / ?
-STS:ANCPKT:PKT_ANLYS:V_ANC:ARIB:NETQ:SMPL0 to 258 / ?
-STS:ANCPKT:PKT_ANLYS:V_ANC:ARIB:NETQ:LOG-50 to 50 / ?
-STS:ANCPKT:PKT_ANLYS:V_ANC:ARIB:NETQ:STREAMSTREAM1 / STREAM2 / ?
WOSTS:ANCPKT:PKT_ANLYS:V_ANC:ARIB:NETQ:CLEARNone
-STS:ANCPKT:PKT_ANLYS:V_ANC:ARIB:TRIG:DISPTEXT / DUMP / ?
-STS:ANCPKT:PKT_ANLYS:V_ANC:ARIB:TRIG:MODEHEX / BINARY / ?
-STS:ANCPKT:PKT_ANLYS:V_ANC:ARIB:TRIG:SMPL0 to 258 / ?
-STS:ANCPKT:PKT_ANLYS:V_ANC:ARIB:TRIG:STREAMSTREAM1 / STREAM2 / ?
-STS:ANCPKT:PKT_ANLYS:V_ANC:ARIB:USER1:MODEHEX / BINARY / ?
-STS:ANCPKT:PKT_ANLYS:V_ANC:ARIB:USER1:SMPL0 to 258 / ?
-STS:ANCPKT:PKT_ANLYS:V_ANC:ARIB:USER1:STREAMSTREAM1 / STREAM2 / ?
-STS:ANCPKT:PKT_ANLYS:V_ANC:ARIB:USER2:MODEHEX / BINARY / ?
-STS:ANCPKT:PKT_ANLYS:V_ANC:ARIB:USER2:SMPL0 to 258 / ?
-STS:ANCPKT:PKT_ANLYS:V_ANC:ARIB:USER2:STREAMSTREAM1 / STREAM2 / ?
-STS:ANCPKT:PKT_ANLYS:V_ANC:SMPTE:708:DISPTEXT / DUMP / ?
-STS:ANCPKT:PKT_ANLYS:V_ANC:SMPTE:708:MODEHEX / BINARY / ?
-STS:ANCPKT:PKT_ANLYS:V_ANC:SMPTE:708:SMPL0 to 258 / ?
-STS:ANCPKT:PKT_ANLYS:V_ANC:SMPTE:708:STREAMSTREAM1 / STREAM2 / ?
-STS:ANCPKT:PKT_ANLYS:V_ANC:SMPTE:608:DISPTEXT / DUMP / ?
-STS:ANCPKT:PKT_ANLYS:V_ANC:SMPTE:608:MODEHEX / BINARY / ?
-STS:ANCPKT:PKT_ANLYS:V_ANC:SMPTE:608:SMPL0 to 258 / ?
-STS:ANCPKT:PKT_ANLYS:V_ANC:SMPTE:608:STREAMSTREAM1 / STREAM2 / ?
-STS:ANCPKT:PKT_ANLYS:V_ANC:SMPTE:PROG:STREAMSTREAM1 / STREAM2 / ?
  1. Network Control
-STS:ANCPKT:PKT_ANLYS:V_ANC:SMPTE:VBI:STREAMSTREAM1 / STREAM2 / ?
-STS:ANCPKT:PKT_ANLYS:V_ANC:SMPTE:AFD:DISPTEXT / DUMP / ?
-STS:ANCPKT:PKT_ANLYS:V_ANC:SMPTE:AFD:MODEHEX / BINARY / ?
-STS:ANCPKT:PKT_ANLYS:V_ANC:SMPTE:AFD:STREAMSTREAM1 / STREAM2 / ?
-STS:ANCPKT:PKT_ANLYS:CSTM:ID_SET:DID0 to FF / ?
-STS:ANCPKT:PKT_ANLYS:CSTM:ID_SET:SDID-1 to FF / ?
-STS:ANCPKT:PKT_ANLYS:CSTM:MODEHEX / BINARY / ?
-STS:ANCPKT:PKT_ANLYS:CSTM:YCY / C / ?
-STS:ANCPKT:PKT_ANLYS:CSTM:STREAMSTREAM1 / STREAM2 / ?
WOSTS:ANCPKT:PKT_ANLYS:CSTM:ID_SET:SETNone
-STS:ANCPKT:PKT_ANLYS:CSTM:SMPL0 to 258 / ?
-STS:ERROR:SDI:COUNTERSEC / FIELD / ?
-STS:ERROR:SDI:TRSON / OFF / ?
-STS:ERROR:SDI:HD_LINEON / OFF / ?
-STS:ERROR:SDI:HD_CRCON / OFF / ?
-STS:ERROR:SDI:SD_EDHON / OFF / ?
-STS:ERROR:SDI:ILLEGAL_CODEON / OFF / ?
-STS:ERROR:SDI:FREQON / OFF / ?
-STS:ERROR:SDI:CABLEON / OFF / ?
-STS:ERROR:SDI:CABLE_12GL_55UCHD / ?
-STS:ERROR:SDI:CABLE_3GLS_5CFB / 1694A / ?
-STS:ERROR:SDI:CABLE_HDLS_5CFB / 1694A / L_7CDH / ?
-STS:ERROR:SDI:CABLE_SDL_5C2V / 8281SD / 1505A / ?
-STS:ERROR:SDI:CABLE_ERR_12G10 to 80 / ?
-STS:ERROR:SDI:CABLE_WAR_12G10 to 80 / ?
-STS:ERROR:SDI:CABLE_ERR_3G10 to 100 / ?
-STS:ERROR:SDI:CABLE_WAR_3G10 to 100 / ?
-STS:ERROR:SDI:CABLE_ERR_HD10 to 130 / ?
-STS:ERROR:SDI:CABLE_WAR_HD10 to 130 / ?
-STS:ERROR:SDI:CABLE_ERR_SD50 to 200 / ?
-STS:ERROR:SDI:CABLE_WAR_SD50 to 200 / ?
-STS:ERROR:ANC:PARITYON / OFF / ?
-STS:ERROR:ANC:CHECKSUMON / OFF / ?
-STS:ERROR:AUDIO:BCHON / OFF / ?
-STS:ERROR:AUDIO:DBNON / OFF / ?
-STS:ERROR:AUDIO:PARITYON / OFF / ?
-STS:ERROR:AUDIO:INHIBITON / OFF / ?
-STS:ERROR:AUDIO:SAMPLEON / OFF / ?
-STS:ERROR:GAMUT:LPFOFF / HD1M_SD1M / HD28M_SD1M / ?
-STS:ERROR:GAMUTON / OFF / ?
-STS:ERROR:GAMUT:UPPER908 to 1094 / ?
-STS:ERROR:GAMUT:LOWER-72 to 61 / ?
-STS:ERROR:GAMUT:UPPER_MV6356 to 7658 / ?
-STS:ERROR:GAMUT:LOWER_MV-504 to 427 / ?
-STS:ERROR:GAMUT:AREA0 to 50 / ?
-STS:ERROR:GAMUT:DURATION1 to 60 / ?
-STS:ERROR:C_GAMUTON / OFF / ?
-STS:ERROR:C_GAMUT:SETUP0% / 7.5% / ?
-STS:ERROR:C_GAMUT:UPPER900 to 1350 / ?
-STS:ERROR:C_GAMUT:LOWER-400 to 200 / ?
-STS:ERROR:C_GAMUT:UPPER_MV6300 to 9640 / ?
-STS:ERROR:C_GAMUT:LOWER_MV-2860 to 1430 / ?
  1. Network Control
-STS:ERROR:C_GAMUT:AREA0 to 50 / ?
-STS:ERROR:C_GAMUT:DURATION1 to 60 / ?
-STS:ERROR:FREEZEON / OFF / ?
-STS:ERROR:FREEZE:UPPER0 to 100 / ?
-STS:ERROR:FREEZE:LOWER0 to 100 / ?
-STS:ERROR:FREEZE:LEFT0 to 100 / ?
-STS:ERROR:FREEZE:RIGHT0 to 100 / ?
-STS:ERROR:FREEZE:DURATION2 to 300 / ?
-STS:ERROR:BLACKON / OFF / ?
-STS:ERROR:BLACK:LEVEL0 to 100 / ?
-STS:ERROR:BLACK:AREA1 to 100 / ?
-STS:ERROR:BLACK:DURATION1 to 300 / ?
-STS:ERROR:LEVELON / OFF / ?
-STS:ERROR:LEVEL:LUMA:UPPER-51 to 766 / ?
-STS:ERROR:LEVEL:LUMA:LOWER-51 to 766 / ?
-STS:ERROR:LEVEL:CHROMA:UPPER-400 to 399 / ?
-STS:ERROR:LEVEL:CHROMA:LOWER-400 to 399 / ?
-STS:ERROR:GAMUT:UPPER908 to 1094 / ?
-STS:AVPHASE:4K_SQD1A / 2B / 3C / 4D / ?
-STS:AVPHASE:TOP0 to 100 / ?
-STS:AVPHASE:LEFT0 to 99 / ?
-STS:AVPHASE:RIGHT0 to 99 / ?
-STS:AVPHASE:VIDEO25 to 100 / ?
-STS:AVPHASE:AUDIO-30 to 0 / ?
-STS:AVPHASE:MESGATEON / OFF / ?
-STS:AVPHASE:GATETIME100 to 1500 / ?
- STS:ANCPKT:PKT_ANLYS:V_ANC:ARIB:NETQ :BIT:Q1ON / OFF / ?
-STS:ANCPKT:PKT_ANLYS:V_ANC:ARIB:NETQ :BIT:Q2ON / OFF / ?
- STS:ANCPKT:PKT_ANLYS:V_ANC:ARIB:NETQ :BIT:Q3ON / OFF / ?
- STS:ANCPKT:PKT_ANLYS:V_ANC:ARIB:NETQ :BIT:Q4ON / OFF / ?
- STS:ANCPKT:PKT_ANLYS:V_ANC:ARIB:NETQ :BIT:Q5ON / OFF / ?
- STS:ANCPKT:PKT_ANLYS:V_ANC:ARIB:NETQ :BIT:Q6ON / OFF / ?
- STS:ANCPKT:PKT_ANLYS:V_ANC:ARIB:NETQ :BIT:Q7ON / OFF / ?
-STS:ANCPKT:PKT_ANLYS:V_ANC:ARIB:NETQ :BIT:Q8ON / OFF / ?
- STS:ANCPKT:PKT_ANLYS:V_ANC:ARIB:NETQ :BIT:Q9ON / OFF / ?
- STS:ANCPKT:PKT_ANLYS:V_ANC:ARIB:NETQ :BIT:Q10ON / OFF / ?
- STS:ANCPKT:PKT_ANLYS:V_ANC:ARIB:NETQ :BIT:Q11ON / OFF / ?
- STS:ANCPKT:PKT_ANLYS:V_ANC:ARIB:NETQ :BIT:Q12ON / OFF / ?
- STS:ANCPKT:PKT_ANLYS:V_ANC:ARIB:NETQ :BIT:Q13ON / OFF / ?
-STS:ANCPKT:PKT_ANLYS:V_ANC:ARIB:NETQ :BIT:Q14ON / OFF / ?
- STS:ANCPKT:PKT_ANLYS:V_ANC:ARIB:NETQ :BIT:Q15ON / OFF / ?
  1. Network Control
-STS:ANCPKT:PKT_ANLYS:V_ANC:ARIB:NETQ:BIT:Q16ON/OFF/?
-STS:ANCPKT:PKT_ANLYS:V_ANC:ARIB:NETQ:BIT:Q17ON/OFF/?
-STS:ANCPKT:PKT_ANLYS:V_ANC:ARIB:NETQ:BIT:Q18ON/OFF/?
-STS:ANCPKT:PKT_ANLYS:V_ANC:ARIB:NETQ:BIT:Q19ON/OFF/?
-STS:ANCPKT:PKT_ANLYS:V_ANC:ARIB:NETQ:BIT:Q20ON/OFF/?
-STS:ANCPKT:PKT_ANLYS:V_ANC:ARIB:NETQ:BIT:Q21ON/OFF/?
-STS:ANCPKT:PKT_ANLYS:V_ANC:ARIB:NETQ:BIT:Q22ON/OFF/?
-STS:ANCPKT:PKT_ANLYS:V_ANC:ARIB:NETQ:BIT:Q23ON/OFF/?
-STS:ANCPKT:PKT_ANLYS:V_ANC:ARIB:NETQ:BIT:Q24ON/OFF/?
-STS:ANCPKT:PKT_ANLYS:V_ANC:ARIB:NETQ:BIT:Q25ON/OFF/?
-STS:ANCPKT:PKT_ANLYS:V_ANC:ARIB:NETQ:BIT:Q26ON/OFF/?
-STS:ANCPKT:PKT_ANLYS:V_ANC:ARIB:NETQ:BIT:Q27ON/OFF/?
-STS:ANCPKT:PKT_ANLYS:V_ANC:ARIB:NETQ:BIT:Q28ON/OFF/?
-STS:ANCPKT:PKT_ANLYS:V_ANC:ARIB:NETQ:BIT:Q29ON/OFF/?
-STS:ANCPKT:PKT_ANLYS:V_ANC:ARIB:NETQ:BIT:Q30ON/OFF/?
-STS:ANCPKT:PKT_ANLYS:V_ANC:ARIB:NETQ:BIT:Q31ON/OFF/?
-STS:ANCPKT:PKT_ANLYS:V_ANC:ARIB:NETQ:BIT:Q32ON/OFF/?
-STS:ANCPKT:PKT_ANLYS:V_ANC:ARIB:NETQ:BIT:S1ON/OFF/?
-STS:ANCPKT:PKT_ANLYS:V_ANC:ARIB:NETQ:BIT:S2ON/OFF/?
-STS:ANCPKT:PKT_ANLYS:V_ANC:ARIB:NETQ:BIT:S3ON/OFF/?
-STS:ANCPKT:PKT_ANLYS:V_ANC:ARIB:NETQ:BIT:S4ON/OFF/?
-STS:ANCPKT:PKT_ANLYS:V_ANC:ARIB:NETQ:BIT:S5ON/OFF/?
-STS:ANCPKT:PKT_ANLYS:V_ANC:ARIB:NETQ:BIT:S6ON/OFF/?
-STS:ANCPKT:PKT_ANLYS:V_ANC:ARIB:NETQ:BIT:S7ON/OFF/?
-STS:ANCPKT:PKT_ANLYS:V_ANC:ARIB:NETQ:BIT:S8ON/OFF/?
-STS:ANCPKT:PKT_ANLYS:V_ANC:ARIB:NETQ:BIT:S9ON/OFF/?
-STS:ANCPKT:PKT_ANLYS:V_ANC:ARIB:NETQ:BIT:S10ON/OFF/?
-STS:ANCPKT:PKT_ANLYS:V_ANC:ARIB:NETQ:BIT:S11ON/OFF/?
-STS:ANCPKT:PKT_ANLYS:V_ANC:ARIB:NETQ:BIT:S12ON/OFF/?
  1. Network Control
-STS:ANCPKT:PKT_ANLYS:V_ANC:ARIB:NETQ :BIT:S13ON / OFF / ?
-STS:ANCPKT:PKT_ANLYS:V_ANC:ARIB:NETQ :BIT:S14ON / OFF / ?
-STS:ANCPKT:PKT_ANLYS:V_ANC:ARIB:NETQ :BIT:S15ON / OFF / ?
-STS:ANCPKT:PKT_ANLYS:V_ANC:ARIB:NETQ :BIT:S16ON / OFF / ?
ROSTS:DATA: SIGNAL_A?
ROSTS:DATA: SIGNAL_B?
ROSTS:DATA: SIGNAL_C?
ROSTS:DATA: SIGNAL_D?
ROSTS:DATA:LINK_A?
ROSTS:DATA:LINK_B?
ROSTS:DATA:LINK_C?
ROSTS:DATA:LINK_D?
ROSTS:DATA:FORMAT_A?
ROSTS:DATA:FORMAT_B?
ROSTS:DATA:FORMAT_C?
ROSTS:DATA:FORMAT_D?
ROSTS:DATA:AUDIO_A?
ROSTS:DATA:AUDIO_B?
ROSTS:DATA:AUDIO_C?
ROSTS:DATA:AUDIO_D?
ROSTS:DATA:EXTREF_A?
ROSTS:DATA:EXTREF_STAT_A?
ROSTS:DATA:EXTREF_HTIME_A?
ROSTS:DATA:EXTREF_HPIX_A?
ROSTS:DATA:EXTREF_VLINE_A?
ROSTS:DATA:EXTREF_TOTAL_A?
ROSTS:DATA:EXTREF_B?
ROSTS:DATA:EXTREF_STAT_B?
ROSTS:DATA:EXTREF_HTIME_B?
ROSTS:DATA:EXTREF_HPIX_B?
ROSTS:DATA:EXTREF_VLINE_B?
ROSTS:DATA:EXTREF_TOTAL_B?
ROSTS:DATA:EXTREF_C?
ROSTS:DATA:EXTREF_STAT_C?
ROSTS:DATA:EXTREF_HTIME_C?
ROSTS:DATA:EXTREF_HPIX_C?
ROSTS:DATA:EXTREF_VLINE_C?
ROSTS:DATA:EXTREF_TOTAL_C?
ROSTS:DATA:EXTREF_D?
ROSTS:DATA:EXTREF_STAT_D?
ROSTS:DATA:EXTREF_HTIME_D?
ROSTS:DATA:EXTREF_HPIX_D?
ROSTS:DATA:EXTREF_VLINE_D?
ROSTS:DATA:EXTREF_TOTAL_D?
ROSTS:DATA:ANC:AUDIO_CTRL1?
ROSTS:DATA:ANC:AUDIO_CTRL2?
ROSTS:DATA:ANC:EDH?
ROSTS:DATA:ANC:LTC1?
ROSTS:DATA:ANC:LTC2?
ROSTS:DATA:ANC:VLTC1?
ROSTS:DATA:ANC:VLTC2?
ROSTS:DATA:ANC:PAYLOAD1?
ROSTS:DATA:ANC:PAYLOAD2?
  1. Network Control
ROSTS:DATA:ANC:EIA:708_708?
ROSTS:DATA:ANC:EIA:708_608?
ROSTS:DATA:ANC:EIA:608?
ROSTS:DATA:ANC:PROGRAM?
ROSTS:DATA:ANC:BROADCAST?
ROSTS:DATA:ANC:VBI?
ROSTS:DATA:ANC:AFD1?
ROSTS:DATA:ANC:AFD2?
ROSTS:DATA:ANC:JPN_CC1?
ROSTS:DATA:ANC:JPN_CC2?
ROSTS:DATA:ANC:JPN_CC3?
ROSTS:DATA:ANC:NETQ1?
ROSTS:DATA:ANC:NETQ2?
ROSTS:DATA:ANC:TRIGGER?
ROSTS:DATA:ANC:USER1?
ROSTS:DATA:ANC:USER2?
ROSTS:DATA:ANC:PKT:PAYLOAD?
ROSTS:DATA:ANC:PKT:ARIB:NETQ:STATION?
ROSTS:DATA:ANC:PKT:ARIB:NETQ:VCURR?
ROSTS:DATA:ANC:PKT:ARIB:NETQ:VNEXT?
ROSTS:DATA:ANC:PKT:ARIB:NETQ:ACURR?
ROSTS:DATA:ANC:PKT:ARIB:NETQ:ANEXT?
ROSTS:DATA:ANC:PKT:ARIB:NETQ:DCURR?
ROSTS:DATA:ANC:PKT:ARIB:NETQ:DNEXT?
ROSTS:DATA:ANC:PKT:SMPTE:AFD:CODE?
ROSTS:DATA:ANC:PKT:SMPTE:AFD:FRAME?
ROSTS:DATA:ANC:PKT:SMPTE:AFD:BAR:FLG?
ROSTS:DATA:ANC:PKT:SMPTE:AFD:BAR:VAL1?
ROSTS:DATA:ANC:PKT:SMPTE:AFD:BAR:VAL2?
ROSTS:DATA:ANC:FREQ?
  • EYE KEY
r/w LimitationCommand Parameter
WOEYENone
-EYE:MODEEYE / JITTER / ?
-EYE:EYE:INTEN-128 to 127 / ?
-EYE:EYE:COLORWHITE / YELLOW / CYAN / GREEN / MAGENTA / RED / BLUE / ?
-EYE:EYE:SCALE:INTEN-8 to 7 / ?
-EYE:EYE:SCALE:COLORWHITE / YELLOW / CYAN / GREEN / MAGENTA / RED / BLUE / ?
-EYE:EYE:SETUP:GAIN:VARCAL / VAR / ?
-EYE:EYE:SETUP:GAIN:VAL50 to 200 / ?
-EYE:EYE:SETUP:SWEEP2UI / 4UI / 16UI / ?
-EYE:EYE:SETUP:FILTER100kHz / 10KHZ / 1KHZ / 100Hz / 10HZ / TIMING / ALIGNMENT / ?
-EYE:EYE:SETUP:TILESINGLE / DUAL / ?
-EYE:EYE:SETUP:CURSORON / OFF / ?
WOEYE:EYE:SETUP:CURSOR:RESETNone
-EYE:EYE:SETUP:CURSOR:XY_SELX / Y / TR_TF / ?
-EYE:JIT:INTEN-128 to 127 / ?
-EYE:JIT:COLORWHITE / YELLOW / CYAN / GREEN / MAGENTA / RED / BLUE / ?
-EYE:JIT:SCALE:INTEN-8 to 7 / ?
-EYE:JIT:SCALE:COLORWHITE / YELLOW / CYAN / GREEN / MAGENTA / RED / BLUE / ?
  1. Network Control
-EYE:JIT:SETUP:GAIN_SWEEP:MAGX1 / X2 / X8 / ?
-EYE:JIT:SETUP:GAIN_SWEEP:12G:MAGX1 / X2 / X4 / X16 / ?
-EYE:JIT:SETUP:GAIN_SWEEP:SWEEP1H / 2H / 1V / 2V / ?
-EYE:JIT:SETUP:FILTER100kHz / 10KHZ / 1KHZ / 100HZ / 10HZ / TIMING / ALIGNMENT / ?
-EYE:JIT:SETUP:PEAK_HOLDON / OFF / ?
WOEYE:JIT:SETUP:PEAK_CLEARNone
-EYE:JIT:SETUP:TILESINGLE / DUAL / ?
-EYE:JIT:SETUP:CURSORON / OFF / ?
WOEYE:JIT:SETUP:CURSOR:RESETNone
-EYE:JIT:SETUP:CURSOR:XY_SELX / Y / ?
WOEYE:ERROR:SETUP:COMPLETENone
-EYE:ERROR:12G:AMPON / OFF / ?
-EYE:ERROR:12G:AMP:UPPER80 to 140 / ?
-EYE:ERROR:12G:AMP:LOWER40 to 100 / ?
-EYE:ERROR:12G:RISEON / OFF / ?
-EYE:ERROR:12G:RISE:MAX40 to 110 / ?
-EYE:ERROR:12G:FALLON / OFF / ?
-EYE:ERROR:12G:FALL:MAX40 to 110 / ?
-EYE:ERROR:12G:DELTAON / OFF / ?
-EYE:ERROR:12G:DELTA:MAX40 to 110 / ?
-EYE:ERROR:12G:TIMING_JITON / OFF / ?
-EYE:ERROR:12G:TIMING_JIT:MAX10 to 200 / ?
-EYE:ERROR:12G:CURRENT_JITON / OFF / ?
-EYE:ERROR:12G:CURRENT_JIT:MAX10 to 200 / ?
-EYE:ERROR:12G:OVERSHOOT_RISEON / OFF / ?
-EYE:ERROR:12G:OVERSHOOT_RISE:MAX0 to 200 / ?
-EYE:ERROR:12G:OVERSHOOT_FALLON / OFF / ?
-EYE:ERROR:12G:OVERSHOOT_FALL:MAX0 to 200 / ?
-EYE:ERROR:3G:AMPON / OFF / ?
-EYE:ERROR:3G:AMP:UPPER80 to 140 / ?
-EYE:ERROR:3G:AMP:LOWER40 to 100 / ?
-EYE:ERROR:3G:RISEON / OFF / ?
-EYE:ERROR:3G:RISE:MAX40 to 140 / ?
-EYE:ERROR:3G:FALLON / OFF / ?
-EYE:ERROR:3G:FALL:MAX40 to 140 / ?
-EYE:ERROR:3G:DELTAON / OFF / ?
-EYE:ERROR:3G:DELTA:MAX40 to 140 / ?
-EYE:ERROR:3G:TIMING_JITON / OFF / ?
-EYE:ERROR:3G:TIMING_JIT:MAX10 to 200 / ?
-EYE:ERROR:3G:CURRENT_JITON / OFF / ?
-EYE:ERROR:3G:CURRENT_JIT:MAX10 to 200 / ?
-EYE:ERROR:3G:OVERSHOOT_RISEON / OFF / ?
-EYE:ERROR:3G:OVERSHOOT_RISE:MAX0 to 200 / ?
-EYE:ERROR:3G:OVERSHOOT_FALLON / OFF / ?
-EYE:ERROR:3G:OVERSHOOT_FALL:MAX0 to 200 / ?
-EYE:ERROR:HD:AMPON / OFF / ?
-EYE:ERROR:HD:AMP:UPPER80 to 140 / ?
-EYE:ERROR:HD:AMP:LOWER40 to 100 / ?
-EYE:ERROR:HD:RISEON / OFF / ?
-EYE:ERROR:HD:RISE:MAX40 to 140 / ?
-EYE:ERROR:HD:FALLON / OFF / ?
-EYE:ERROR:HD:FALL:MAX40 to 140 / ?
-EYE:ERROR:HD:DELTAON / OFF / ?
-EYE:ERROR:HD:DELTA:MAX40 to 140 / ?
-EYE:ERROR:HD:TIMING_JITON / OFF / ?
-EYE:ERROR:HD:TIMING_JIT:MAX10 to 200 / ?
  1. Network Control
-EYE:ERROR:HD:CURRENT_JITON / OFF / ?
-EYE:ERROR:HD:CURRENT_JIT:MAX10 to 200 / ?
-EYE:ERROR:HD:OVERSHOOT_RISEON / OFF / ?
-EYE:ERROR:HD:OVERSHOOT_RISE:MAX0 to 200 / ?
-EYE:ERROR:HD:OVERSHOOT_FALLON / OFF / ?
-EYE:ERROR:HD:OVERSHOOT_FALL:MAX0 to 200 / ?
-EYE:ERROR:SD:AMPON / OFF / ?
-EYE:ERROR:SD:AMP:UPPER80 to 140 / ?
-EYE:ERROR:SD:AMP:LOWER40 to 100 / ?
-EYE:ERROR:SD:RISEON / OFF / ?
-EYE:ERROR:SD:RISE:MAX40 to 140 / ?
-EYE:ERROR:SD:FALLON / OFF / ?
-EYE:ERROR:SD:FALL:MAX40 to 140 / ?
-EYE:ERROR:SD:DELTAON / OFF / ?
-EYE:ERROR:SD:DELTA:MAX40 to 140 / ?
-EYE:ERROR:SD:TIMING_JITON / OFF / ?
-EYE:ERROR:SD:TIMING_JIT:MAX10 to 200 / ?
-EYE:ERROR:SD:CURRENT_JITON / OFF / ?
-EYE:ERROR:SD:CURRENT_JIT:MAX10 to 200 / ?
-EYE:ERROR:SD:OVERSHOOT_RISEON / OFF / ?
-EYE:ERROR:SD:OVERSHOOT_RISE:MAX0 to 200 / ?
-EYE:ERROR:SD:OVERSHOOT_FALLON / OFF / ?
-EYE:ERROR:SD:OVERSHOOT_FALL:MAX0 to 200 / ?
-EYE:ERROR:12G:AMPON / OFF / ?
ROEYE:TRIGGERRUN / STOP / ?
ROEYE:DATA:AMP?
ROEYE:DATA:TR?
ROEYE:DATA:TF?
ROEYE:DATA:TJ?
ROEYE:DATA:CJ?
ROEYE:DATA:OR?
ROEYE:DATA:OF?
ROEYE:DATA:PEAK:TJ?
ROEYE:DATA:PEAK:JIT?

20.3 FTP

The files that are generated by the instrument can be transferred to a PC connected to the same network.

If you are using the LV7600, read LV5600 and lv5600 as LV7600 and lv7600.

20.3.1 How to Use

  1. Configure the Ethernet settings on the NETWORK tab of the SYS menu.

Set the IP address, and set FTP to ON.

[See also] 7.2.8, "Configuring the Server"

SYS → F•2 SYSTEM SETUP → F•2 PREV TAB or F•3 NEXT TAB → GENERAL CAPTLE&DISPLAY NETWORK SNMP REMOTE RS485 CAMERA ID TALLY OPERATION KEY DATE&TIME LV7290 DHCP Off On IP Address 192 168 0 1 Subnet Mask 255 255 255 0 Default Gateway 0 0 0 0 Mac Address 00:00:00:00:00:00 SNTP Off On SNTP Selected IP Address Time Zone Adj lat -3.00 Server Telnet Off FTP Off On HTTP Off On COMPLETE PREV TAB NEXT TAB up menu

Figure 20-3 NETWORK tab

  1. Press F•1 COMPLETE.
  2. Connect the instrument's Ethernet port to the external network device.
  3. On the PC, start an FTP client.

On Windows 7, on the taskbar, click Start, and then click Run. Type "FTP" and the IP address that you set in step 1. Then, click OK.

  1. Type the login name and password.

The login name and password are "LV5600". Use uppercase for all characters. When the login name and password are entered correctly, "ftp>" appears.

Connected to ***.***.***.***.
220 Welcome to LV5600 FTP service.
User (***,***,***,***:(none)): LV5600..... User name
331 Please specify the password.
Password: LV5600 .... Password (The password is not actually displayed.)
230 Login successful
ftp> 

6. Enter FTP commands.

Enter commands while referring to sections 20.3.2, "How to Enter Commands," and 20.3.3, "FTP Commands." You must generate files using the TELNET "MAKE" command before you use FTP commands.

To end an FTP session, type "bye" in lowercase letters.

ftp> bye 

20.3.2 How to Enter Commands

The command syntax is explained below.

ftp> [Command] + [Space] + [Parameter 1] + [Space] + [Parameter 2] 

Examples of how to enter commands are shown below.

ftp> get log.txt D:¥log.txt......Transfer the event log file to the PC.
200 PORT Command successful ......Return value
:
ftp> 

20.3.3 FTP Commands

Table 20-2 FTP commands

CommandParameter 1Parameter 2
getlog.txtStorage location on the PC and file name (example: D:¥log.txt)
dump.txtStorage location on the PC and file name (example: D:¥dump.txt)
cap_bmp.bmpStorage location on the PC and file name (example: D:¥capture.bmp)
cap_bsg.bsgStorage location on the PC and file name (example: D:¥capture.bsg)
cap_frm_a.frmStorage location on the PC and file name (example: D:¥capture_a.frm)
cap_dpx_a.dpxStorage location on the PC and file name (example: D:¥capture_a.dpx)
cap_tif_a.tifStorage location on the PC and file name (example: D:¥capture_a.tif)
cap_frm_b.frmStorage location on the PC and file name (example: D:¥capture_b.frm)
cap_dpx_b.dpxStorage location on the PC and file name (example: D:¥capture_b.dpx)
cap_tif_b.tifStorage location on the PC and file name (example: D:¥capture_b.tif)
cap_frm_c.frmStorage location on the PC and file name (example: D:¥capture_c.frm)
cap_dpx_c.dpxStorage location on the PC and file name (example: D:¥capture_c.dpx)
cap_tif_c.tifStorage location on the PC and file name (example: D:¥capture_c.tif)
cap_frm_d.frmStorage location on the PC and file name (example: D:¥capture_d.frm)
cap_dpx_d.dpxStorage location on the PC and file name (example: D:¥capture_d.dpx)
cap_tif_d.tifStorage location on the PC and file name (example: D:¥capture_d.tif)
lv5600.myStorage location on the PC and file name (example: D:¥lv5600.my)

20.4 HTTP

You can use this feature to control the instrument from a web browser on a PC in the same manner as you would control the instrument from the panel.

20.4.1 Operating Environment

The following web browsers have been confirmed to work.

  • Internet Explorer Ver.11
    • Google Chrome Ver. 4 6

20.4.2 Notes

  • Enable JavaScript and pop-up on the WEB browser in advance.
  • After you press a key in the web browser interface, wait for the screen to update before you perform the next operation. The screen cannot redraw fast enough to keep up with consecutive key presses. In this situation, a completely gray screen may be displayed temporarily. (After a few seconds the screen will return to normal.)
  • When you are using the HTTP server feature, perform as few panel operations on the instrument as possible. The instrument's internal processing load increases when it is redrawing the web browser screen, so there is a lag of 1 to 2 seconds from the time that you perform panel operations on the instrument to the time that the operations are actually carried out.
  • The number of simultaneous PC connections to the HTTP server feature is 1. Multiple connections are not supported.
  • User layout and enhanced layout features (SER26) cannot be used.

20.4.3 How to Use

  1. Configure the Ethernet settings on the NETWORK tab of the SYS menu.

Set the IP address, and set HTTP to ON.

[See also] 7.2.8, "Configuring the Server"

SYS → F•2 SYSTEM SETUP → F•2 PREV TAB or F•3 NEXT TAB → GENERAL CAPTLE&DISPLAY NETWORK SNMP REMOTE RS486 CAMERA ID TALLY OPERATION KEY DATE&TIME LV7290 DHCP Off On IP Address 192 168 0 1 Subnet Mask 255 255 255 0 Default Gateway 0 0 0 0 Mac Address 00:00:00:00:00:00 SNTP SNTP Off On Server IP Address Time Zone Adjust Yes Server Telnet Off FTP Off On HTTP Off On COMPLETE PREV TAB NEXT TAB up menu

Figure 20-4 NETWORK tab

  1. Press F•1 COMPLETE.
  2. Connect the instrument's Ethernet port to the external network device.
  3. Start the web browser on your PC.
  4. In the address box, enter "http://(the IP address that you set in step 1):8080."

http://192.168.2.10:8080/

Figure 20-5 Entering the IP address

  1. From the HTTP server menu, select the display mode.

HTTP SERVER MENU

MEASUREMENT WITH DISPLAY

REMOTE CONTROL

EVENT LOG VIEWER

Figure 20-6 HTTP server menu
Table 20-3 HTTP server menu description

NameDescription
MEASUREMENT WITH DISPLAYA measurement screen and control buttons are displayed.
REMOTE CONTROLOnly control buttons are displayed.Select this mode when you want to control the instrument while looking at its screen.
EVENT LOG VIEWERThe event log is displayed.The log can also be saved in text format.

If you select MEASUREMENT WITH DISPLAY, the measurement screen appears, but responses to operations can take 4 to 10 seconds, and auto display updating is every 10 seconds.

If you select REMOTE CONTROL, a screen is not displayed, but the response time is reduced to 2 to 3 seconds.

Select the mode that meets your needs.

20.4.4 MEASUREMENT WITH DISPLAY

On the MEASUREMENT WITH DISPLAY tab, the instrument is controlled by clicking the control buttons.

The measurement screen is updated automatically at a given interval. It may take some time for the screen to be updated after you click a control button depending on the operating environment.

MEASUREMENT WITH DISPLAY REMOTE CONTROL EVENT LOG VIEWER 1 1920x1080/59.941 YCbCr(422) 10bit HD SDI A TIME: 13:53:54 GAIN x1.000 SWEEP 1H x1 YCbCr WFM MODE PARADE Y ON Cb ON Cr ON INPUT SELECT A UP MENU 3 -SETUP- INPUT CAT NULTI LAYOUT SYSTEM PRESET NWM -POCKS- WFM VCTOR PICTURE AUDIO STATUS EYE -OPERATION- FORM OVERLAY GAIN Sweep SHORTOUT FILTER MAG MAG 7 8 -CAPTURE NOM/CLEAR ● BMP ○ JPG SCREEN REFRESH: ○ FAST ● NORMAL ○ SLOW 6 -BOTARY- VPOS << << < > >> >># HPOS << << < > >> >># F0 << << < > >> >># 9

Figure 20-7 MEASUREMENT WITH DISPLAY

Table 20-4 MEASUREMENT WITH DISPLAY description

No.NameDescription
1TabsSwitches the display mode.
2 Measurement screenThis is the measurement screen.You cannot click this area. Set the tab menu using the F•D button.
3Function key menuClick to control the menu.Double-click slowly to change to the next item.Use the F•D button to change values.
4SELECTThis button corresponds to holding down the MULTI key (layout selection).
5MEMThis button corresponds to holding down the PRESET key (preset registration).
6 V POS H POS F•D“>” and “<” correspond to turning the knob to the right and left respectively. The number of “<” or “>” corresponds to the amount of change.The V•POS, H•POS, and F•D buttons correspond to the behavior performed when the corresponding button is pressed.
7CAPTUREClick this button after selecting the file format (BMP or JPG) to display a measurement screen in a separate window.Right-click the screen and click “Save picture as” to save the image in the specified file format. If this method does not work, use “DOWNLOAD” in the upper left of the screen to save it.
8 MENU CLEAR Hides the menu.To show it again, click the function menu area.
9SCREEN REFRESHSet the screen’s auto update interval to FAST, NORMAL, or SLOW.

20.4.5 REMOTE CONTROL

On the REMOTE CONTROL tab, the instrument is controlled by clicking the control buttons. As this mode does not display a measurement screen, select this mode when you want to control the instrument while looking at its screen.

The descriptions of the control buttons are the same as in section 20.4.4, "MEASUREMENT WITH DISPLAY."

Leader LV5600 - REMOTE CONTROL - 1

flowchart
graph TD
    A["MEASUREMENT WITH DISPLAY"] --> B["REMOTE CONTROL"]
    B --> C["EVENT LOG VIEWER"]
    C --> D["FUNCTION-"]
    D --> E["P1"]
    D --> F["P2"]
    D --> G["P3"]
    D --> H["P4"]
    D --> I["P5"]
    D --> J["P6"]
    D --> K["P7"]
    D --> L["SETUP-"]
    L --> M["INPUT"]
    L --> N["EXT"]
    L --> O["MULTI"]
    L --> P["LAYOUT"]
    L --> Q["SYSTEM"]
    L --> R["PRESET"]
    L --> S["MEM"]
    L --> T["AVIO"]
    L --> U["STATUS"]
    L --> V["EVE"]
    L --> W["SHORTOUT"]
    L --> X["FILTER"]
    L --> Y["NAG"]
    L --> Z["NAG"]
    L --> AA["V PO 1"]
    L --> AB["<<"]
    L --> AC["<<"]
    L --> AD["<<"]
    L --> AE[">="]
    L --> AF[">="]
    L --> AG[">="]
    L --> AH[">="]
    L --> AI[">="]
    L --> AJ[">="]
    L --> AK[">="]
    L --> AL[">="]
    L --> AM[">="]

Figure 20-8 REMOTE CONTROL

20.4.6 EVENT LOG VIEWER

The EVENT LOG VIEWER tab displays the event log of the status display.

Nothing is displayed at first. You can display the log entries by setting LOG VIEWER to UPDATE.

The screen is updated automatically at a given interval.

Set LOG to START on the EVENT LOG menu in advance.

[See also] 16.4, "Configuring Event Log Settings"

MEASUREMENT WITH DISPLAY REMOTE CONTROL EVENT LOG VIEWER 1 LOG VIEWER CONTROL - LOG VIEWER UPDATE PAUSE LIST LING 20 ASTRESH FAST NORMAL SLOW GET LOG FILE 7 8 - LOG LIST - 1/2 10 * - - - - - - - - - - - - - - - - - - - - - - - - - - - - - - - - - - - - - - - - - - - - - - - - - - - - - - - - - - - - - - - - - - - - - - - - - - - - - - - - - - - - - - - - - - - - - - - - - - - - -

Figure 20-9 EVENT LOG VIEWER

Table 20-5 EVENT LOG VIEWER description

No.NameDescription
1TabsSwitches the display mode.
2UPDATEThe screen is updated automatically. LOG LIST shows the latest log.
3PAUSEThe screen is not automatically updated. Past log entries can be displayed in LOG LIST.
4LIST LINESelect the number of entries to display on a screen from 10 to 50 (in 5 steps).
5REFRESHSet the screen's auto update interval to FAST, NORMAL, or SLOW.
6GET LOG FILEThe event log is displayed in a separate window.From the File menu, choose Save As to save the log in text format.
7|<The latest log entries are displayed when LOG VIEWER is set to PAUSE.
8<<The next newer log page appears when LOG VIEWER is set to PAUSE.
9>>The next older log page appears when LOG VIEWER is set to PAUSE.
10>|The oldest log entries are displayed when LOG VIEWER is set to PAUSE.

20.5 SNMP

By using SNMP (Simple Network Management Protocol), you can control the instrument from SNMP managers. Additionally, you can notify the SNMP managers of errors that the instrument generates.

This product supports SNMPv2.

If you are using the LV7600, read LV5600 and lv5600 as LV7600 and lv7600.

The descriptions in this section follow the instrument or the option menu structure. Some of the descriptions do not apply depending on the installed options or the current settings.

20.5.1 SMI Definitions

INPORTS

MODULE-IDENTITY, OBJECT-TYPE, NOTIFICATION-TYPE, enterprises

FROM SNMPv2-SMI

DisplayString

FROM SNMPv2-TC

OBJECT-GROUP, MODULE-COMPLIANCE

FROM SNMPv2-CONF;

20.5.2 How to Use

  1. Configure the SNMP settings on the SNMP tab of the SYS menu.

Set the IP Address, and set SNMP Client to ReadWrite and SNMP Trap to ON. [See also] 7.2.9, "Configuring SNMP"

SYS → F•2 SYSTEM SETUP → F•2 PREV TAB or F•3 NEXT TAB → GENERAL CAPT/READ/SPLAY NETWORK SNMP REMOTE RS485 CAMERA ID TALLY OPERATION KEY DATE&TIME LV7290 SNMP SNMP Client Off ReadOnly ReadWrite SNMP Community ReadOnly: LDRUser ReadWriter: LDRAdm Trap Off On Manager IP Address 1: 0 0 0 0 2: 0 0 0 0 3: 0 0 0 0 4: 0 0 0 0 COMPLETE PREV TAB NEXT TAB READ ONLY COMMUNITY READ WRITE COMMUNITY up menu

Figure 20-10 SNMP tab

  1. Press F•1 COMPLETE.
  2. Connect the instrument's Ethernet port to the external network device.
  3. On the PC, start an SNMP manager.

You must provide the SNMP manager yourself.

The default community names are shown below.

20. Network Control

ReadOnly and ReadWrite can be changed with the SNMP Community parameter.

[See also] SNMP Community → 7.2.9, "Configuring SNMP"

ReadOnly : LDRUser

ReadWrite : LDRAdm

TRAP : LDRUser

  1. Check that the SNMP managers can perform GET and SET operations.

  2. From the SNMP manager, set the following MIB items to the SNMP managers' IP addresses.

Up to four locations can be set.

[IP address of TRAP transmission destination 1]

1.3.6.1.4.1.leader(20111).lv5600(40).lv5600ST1(1).l40trapTBL(9).l40trapIpTBL(1).l40trapIp1TBL(1).l40trapManagerIp1(1).0

[IP address of TRAP transmission destination 2]

1.3.6.1.4.1.leader(20111).Iv5600(40).Iv5600ST1(1).I40trapTBL(9).I40trapIpTBL(1).I40trapIp2TBL(2).I40trapManagerIp1(1).0

[IP address of TRAP transmission destination 3]

1.3.6.1.4.1.leader(20111).lv5600(40).lv5600ST1(1).l40trapTBL(9).l40trapIpTBL(1).l40trapIp3TBL(3).l40trapManagerIp1(1).0

[IP address of TRAP transmission destination 4]

1.3.6.1.4.1.leader(20111).lv5600(40).lv5600ST1(1).l40trapTBL(9).l40trapIpTBL(1).l40trapIp4TBL(4).l40trapManagerIp1(1).0

  1. Enable the TRAP transmission destinations.

To alleviate communication load, disable the transmission destinations that you are not using. This setting is disabled by factory default.

[Enable (1) or disable (2) TRAP transmission destination 1]

1.3.6.1.4.1.leader(20111).Iv5600(40).Iv5600ST1(1).I40trapTBL(9).I40trapIpTBL(1).I40trapIp1TBL(1).I40trapManagerIp1Act(2).0

[Enable (1) or disable (2) TRAP transmission destination 2]

1.3.6.1.4.1.leader(20111).lv5600(40).lv5600ST1(1).l40trapTBL(9).l40trapIpTBL(1).l40trapIp2TBL(2).l40trapManagerIp1Act(2).0

[Enable (1) or disable (2) TRAP transmission destination 3]

1.3.6.1.4.1.leader(20111).lv5600(40).lv5600ST1(1).l40trapTBL(9).l40trapIpTBL(1).l40trapIp3TBL(3).l40trapManagerIp1Act(2).0

[Enable (1) or disable (2) TRAP transmission destination 4]

1.3.6.1.4.1.leader(20111).lv5600(40).lv5600ST1(1).l40trapTBL(9).l40trapIpTBL(1).l40trapIp4TBL(4).l40trapManagerIp1Act(2).0

  1. Restart the LV5600.

  2. When the LV5600 starts, it transmits the standard TRAP "coldStart(0)." Check that this is received by the SNMP managers.

20.5.3 Standard MIBs

The instrument uses the following standard MIBs:

  • RFC1213 (MIB-II)
    • RFC1354 (IP Forwarding Table MIB)

In the tables, "ACCESS" and "SUPPORT" indicate the following:

IndicationDescription
ACCESSR/OInformation that can be read from the SNMP managers.
R/WInformation that can be read and written from the SNMP managers
SUPPORTYSupports the MIB object as defined by the standard.
R/OReading and writing are possible according to the standard, but the instrument only supports reading.
NNot supported.

- system group

MIBOIDSYNTAXACCESSSUPPORT
sysDescrsystem.1DisplayStringR/OY
sysObjectIDsystem.2ObjectIDR/OY
sysUpTimesystem.3TimeTicksR/OY
sysContactsystem.4DisplayStringR/WY
sysNamesystem.5DisplayStringR/OR/O
sysLocationsystem.6DisplayStringR/WY
sysServicessystem.7INTEGERR/OY

- interface group

MIBOIDSYNTAXACCESSSUPPORT
ifNumberinterfaces.1INTEGERR/OY
ifTableinterfaces.2Aggregate--
ifEntryifTable.1Aggregate--
ifIndexifEntry.1INTEGERR/OY
ifDescrifEntry.2DisplayStringR/OY
i fTypeifEntry.3INTEGERR/OY
ifMtuifEntry.4INTEGERR/OY
ifSpeedifEntry.5GaugeR/OY
ifPhysAddressifEntry.6OctetStringR/OY
ifAdminStatusifEntry.7INTEGERR/OR/O
ifOperStatusifEntry.8INTEGERR/OY
ifLastChangeifEntry.9TimeTicksR/OY
ifInOctetsifEntry.10CounterR/OY
ifInUcastPktsifEntry.11CounterR/OY
ifInNUcastPktsifEntry.12CounterR/OY
ifInDiscardsifEntry.13CounterR/OY
ifInErrorsifEntry.14CounterR/OY
ifInUnknownProtosifEntry.15CounterR/OY
ifOutOctetsifEntry.16CounterR/OY
ifOutUcastPktsifEntry.17CounterR/OY
ifOutNUcastPktsifEntry.18CounterR/OY
ifOutDiscardsifEntry.19CounterR/OY
ifOutErrorsifEntry.20CounterR/OY
ifOutQLenifEntry.21GaugeR/OY
ifSpecificifEntry.22ObjectIDR/OY
  • ip group
MIBOIDSYNTAXACCESSSUPPORT
ipForwardingip.1INTEGERR/OY
ipDefaultTTLip.2INTEGERR/OR/O
ipInReceivesip.3CounterR/OY
ipInHdrErrorsip.4CounterR/OY
ipInAddrErrorsip.5CounterR/OY
ipForwDatagramsip.6CounterR/OY
ipInUnknownProtosip.7CounterR/OY
ipInDiscardsip.8CounterR/OY
ipInDeliversip.9CounterR/OY
ipOutRequestsip.10CounterR/OY
ipOutDiscardsip.11CounterR/OY
ipOutNoRoutesip.12CounterR/OY
ipReasmTimeoutip.13INTEGERR/OY
ipReasmReqdsip.14CounterR/OY
ipReasmOKsip.15CounterR/OY
ipReasmFailsip.16CounterR/OY
ipFragOKsip.17CounterR/OY
ipFragFailsip.18CounterR/OY
ipFragCreatesip.19CounterR/OY
ipAddrTableip.20Aggregate--
ipAddrEntryipAddrTable.1R/OY
ipAdEntAddripAddrEntry.1IpAddressR/OY
ipAdEntIfIndexipAddrEntry.2INTEGERR/OY
ipAdEntNetMaskipAddrEntry.3IpAddressR/OY
ipAdEntBcastAddripAddrEntry.4INTEGERR/OY
ipAdEntReasmMaxSizeipAddrEntry.5INTEGERR/OY
ipRouteTableip.21Aggregate--
ipRouteEntryipRouteTable.1Aggregate--
ipRouteDestipRouteEntry.1IpAddressR/OR/O
ipRouteIfIndexipRouteEntry.2INTEGERR/OR/O
ipRouteMetric1ipRouteEntry.3INTEGERR/OR/O
ipRouteMetric2ipRouteEntry.4INTEGERR/OR/O
ipRouteMetric3ipRouteEntry.5INTEGERR/OR/O
ipRouteMetric4ipRouteEntry.6INTEGERR/OR/O
ipRouteNextHopipRouteEntry.7IpAddressR/OR/O
ipRouteTypeipRouteEntry.8INTEGERR/OR/O
ipRouteProtoipRouteEntry.9INTEGERR/OY
ipRouteAgeipRouteEntry.10INTEGER-N
ipRouteMaskipRouteEntry.11IpAddressR/OR/O
ipRouteMetric5ipRouteEntry.12INTEGER-N
ipRouteInfoipRouteEntry.13ObjectIDR/OY
ipNetToMediaTableip.22Aggregate--
ipNetToMediaEntryipNetToMediaTable.1Aggregate--
ipNetToMediaIfIndexipNetToMediaEntry.1INTEGERR/OR/O
ipNetToMediaPhysAddressipNetToMediaEntry.2OctetStringR/OR/O
ipNetToMediaNetAddressipNetToMediaEntry.3IpAddressR/OR/O
ipNetToMediaTypeipNetToMediaEntry.4INTEGERR/OR/O
ipRoutingDiscardsip.23CounterR/OY
  • icmp group
MIBOIDSYNTAXACCESSSUPPORT
icmpInMsgsicmp.1CounterR/OY
icmpInErrorsicmp.2CounterR/OY
icmpInDestUnreachsicmp.3CounterR/OY
icmpInTimeExcdsicmp.4CounterR/OY
icmpInParmProbsicmp.5CounterR/OY
icmpInSrcQuenchsicmp.6CounterR/OY
icmpInRedirectsicmp.7CounterR/OY
icmpInEchosicmp.8CounterR/OY
icmpInEchoRepsicmp.9CounterR/OY
icmpInTimestampsicmp.10CounterR/OY
icmpInTimestampRepsicmp.11CounterR/OY
icmpInAddrMasksicmp.12CounterR/OY
icmpInAddrMaskRepsicmp.13CounterR/OY
icmpOutMsgsicmp.14CounterR/OY
icmpOutErrorsicmp.15CounterR/OY
icmpOutDestUnreachsicmp.16CounterR/OY
icmpOutTimeExcdsicmp.17CounterR/OY
icmpOutParmProbsicmp.18CounterR/OY
icmpOutSrcQuenchsicmp.19CounterR/OY
icmpOutRedirectsicmp.20CounterR/OY
icmpOutEchosicmp.21CounterR/OY
icmpOutEchoRepsicmp.22CounterR/OY
icmpOutTimestampsicmp.23CounterR/OY
icmpOutTimestampRepsicmp.24CounterR/OY
icmpOutAddrMasksicmp.25CounterR/OY
icmpOutAddrMaskRepsicmp.26CounterR/OY
  • tcp group
MIBOIDSYNTAXACCESSSUPPORT
tcpRtoAlgorithmtcp.1INTEGERR/OY
tcpRtoMintcp.2INTEGERR/OY
tcpRtoMaxtcp.3INTEGERR/OY
tcpMaxConntcp.4INTEGERR/OY
tcpActiveOpenstcp.5CounterR/OY
tcpPassiveOpenstcp.6CounterR/OY
tcpAttemptFailstcp.7CounterR/OY
tcpEstabResetstcp.8CounterR/OY
tcpCurrEstabtcp.9GaugeR/OY
tcpInSegstcp.10CounterR/OY
tcpOutSegstcp.11CounterR/OY
tcpRetransSegstcp.12CounterR/OY
tcpConnTabletcp.13Aggregate--
tcpConnEntrytcpConnTable.1Aggregate--
tcpConnStatetcpConnEntry.1INTEGERR/OR/O
tcpConnLocalAddresstcpConnEntry.2IpAddressR/OY
tcpConnLocalPorttcpConnEntry.3INTEGERR/OY
tcpConnRemAddresstcpConnEntry.4IpAddressR/OY
tcpConnRemPorttcpConnEntry.5INTEGERR/OY
tcpInErrstcp.14CounterR/OY
tcpOutRststcp.15CounterR/OY

20. Network Control

  • udp group
MIBOIDSYNTAXACCESSSUPPORT
udpInDatagramsudp.1CounterR/OY
udpNoPortsudp.2CounterR/OY
udpInErrorsudp.3CounterR/OY
udpOutDatagramsudp.4CounterR/OY
udpTableudp.5Aggregate--
udpEntryudpTable.1Aggregate--
udpLocalAddressudpEntry.1IpAddressR/OY
udpLocalPortudpEntry.2INTEGERR/OY
  • snmp group
MIBOIDSYNTAXACCESSSUPPORT
snmpInPktssnmp.1CounterR/OY
snmpOutPktssnmp.2CounterR/OY
snmpInBadVersionssnmp.3CounterR/OY
snmpInBadCommunityNamessnmp.4CounterR/OY
snmpInBadCommunityUsessnmp.5CounterR/OY
snmpInASNParseErrssnmp.6CounterR/OY
snmpInTooBigssnmp.7CounterR/OY
snmpInNoSuchNamessnmp.8CounterR/OY
snmpInBadValuessnmp.9CounterR/OY
snmpInReadOnlysnmp.10CounterR/OY
snmpInGenErrssnmp.11CounterR/OY
snmpInTotalReqVarssnmp.12CounterR/OY
snmpInTotalSetVarssnmp.13CounterR/OY
snmpInGetRequestssnmp.14CounterR/OY
snmpInGetNextssnmp.15CounterR/OY
snmpInSetRequestssnmp.16CounterR/OY
snmpInGetResponsessnmp.17CounterR/OY
snmpInTrapssnmp.18CounterR/OY
snmpOutTooBigssnmp.19CounterR/OY
snmpOutNoSuchNamessnmp.20CounterR/OY
snmpOutBadValuessnmp.21CounterR/OY
snmpOutGenErrssnmp.22CounterR/OY
snmpOutGetRequestssnmp.23CounterR/OY
snmpOutGetNextssnmp.24CounterR/OY
snmpOutSetRequestssnmp.25CounterR/OY
snmpOutGetResponsessnmp.26CounterR/OY
snmpOutTrapssnmp.27CounterR/OY
snmpEnableAuthenTrapssnmp.28IpAddressR/WY

20.5.4 Enterprise MIB

- Enterprise Number

The Enterprise Number of LEADER ELECTRONICS CORP. is 20111. iso(1).org(3).dod(6).internet(1).private(4).enterprises(1).leader(20111)

- Enterprise MIB File

Save the file from instrument to a USB memory device or use FTP to obtain it from the instrument.

The file name is "lv5600.my."

[See also] 7.2.9, "Configuring SNMP", 7.2.8, "Configuring the Server"

- Enterprise MIB Structure

The enterprise MIB structure is shown below. On products that do not have units installed, the MIBs for the units cannot be controlled.

leaderOBJECT IDENTIFIER ::= { enterprises 20111 }
lv5600OBJECT IDENTIFIER ::= { leader 40 }
lv5600ST1OBJECT IDENTIFIER ::= { lv5600 1 }
l40notificationTBLOBJECT IDENTIFIER ::= { lv5600ST1 0 }
l40basicTBLOBJECT IDENTIFIER ::= { lv5600ST1 1 }
l40systemTBL OBJECT IDENTIFIER ::= { lv5600ST1 2 }
l40wfmTBLOBJECT IDENTIFIER ::= { lv5600ST1 3 }
l40vectorTBLOBJECT IDENTIFIER ::= { lv5600ST1 4 }
l40pictureTBLOBJECT IDENTIFIER ::= { lv5600ST1 5 }
l40statusTBLOBJECT IDENTIFIER ::= { lv5600ST1 6 }
l40eyeTBLOBJECT IDENTIFIER ::= { lv5600ST1 7 }
l40audioTBLOBJECT IDENTIFIER ::= { lv5600ST1 8 }
l40trapTBLOBJECT IDENTIFIER ::= { lv5600ST1 9 }

- ACCESS

In the tables, "ACCESS" indicates the following:

IndicationDescription
ACCESSR/OInformation that can be read from the SNMP managers.
R/WInformation that can be read and written from the SNMP managers
R/WOInformation that can be read and written from the SNMP managers (However, the retrieved data consists of meaningless fixed values.)
  • l40basicTBL(1) group
MIBOIDSYNTAXACCESSVALUE/RANGE
I40basInputTBLI40basicTBL.1Aggregate--
I40basInputChI40basInputTBL.1INTEGERR/W1 = a2 = b3 = c4 = d
I40basInputSimulI40basInputTBL.2INTEGERR/W1 = off2 = on
I40basInputOperateI40basInputTBL.3INTEGERR/W1 = com2 = individual
I40basInputExtrefI40basInputTBL.4INTEGERR/W1 = int2 = ext
I40basDispTBLI40basicTBL.3Aggregate--
I40basDispMultiI40basDispTBL.1INTEGERR/WO1 (fixed)
I40basDispAssignWfmI40basDispTBL.2INTEGERR/WO1 (fixed)
I40basDispAssignVecI40basDispTBL.3INTEGERR/WO1 (fixed)
I40basDispAssignPicI40basDispTBL.4INTEGERR/WO1 (fixed)
I40basDispAssignStsI40basDispTBL.5INTEGERR/WO1 (fixed)
I40basDispAssignEyeI40basDispTBL.6INTEGERR/WO1 (fixed)
I40basDispAssignAudI40basDispTBL.7INTEGERR/WO1 (fixed)
I40basPresetTBLI40basicTBL.4Aggregate--
I40basPresetStoreI40basPresetTBL.1INTEGERR/W1 to 60
I40basPresetDeleteI40basPresetTBL.2INTEGERR/W1 to 60
I40basPresetCopyUsbIntI40basPresetTBL.3INTEGERR/WO1 (fixed)
I40basPresetCopyIntUsbI40basPresetTBL.4INTEGERR/WO1 (fixed)
I40basPresetRecallI40basPresetTBL.5INTEGERR/W1 to 60
I40basCaptureTBLI40basicTBL.5Aggregate--
I40basCaptureModeI40basCaptureTBL.1INTEGERR/W1 = screen2 = frame-sdi (Sdi Code Value)3 = frame-converted (Converted)
I40basCaptureTriggerI40basCaptureTBL.2INTEGERR/W1 = manual2 = error
I40basCaptureRefreshI40basCaptureTBL.3INTEGERR/WO1 (fixed)
I40basCaptureDisplayI40basCaptureTBL.4INTEGERR/W1 = real2 = replay (video frame only)3 = both4 = hold
I40basCaptureFileBmpI40basCaptureTBL.5INTEGERR/W1 = off2 = on
I40basCaptureFileBsgI40basCaptureTBL.6INTEGERR/W1 = off2 = on
I40basCaptureFileDpxI40basCaptureTBL.7INTEGERR/W1 = off2 = on
I40basCaptureFileTifI40basCaptureTBL.8INTEGERR/W1 = off2 = on
I40basCaptureFileFrmI40basCaptureTBL.9INTEGERR/W1 = off2 = on
I40basCaptureFileStoreI40basCaptureTBL.10INTEGERR/WO1 (fixed)
I40basMakeTBLI40basicTBL.6Aggregate--
I40basMakeFileI40basMakeTBL.1INTEGERR/WO1 = cap-bmp2 = cap-bsg3 = cap-frm-a4 = cap-dpx-a
  1. Network Control
MIBOIDSYNTAXACCESSVALUE/RANGE
5 = cap-tif-a6 = cap-frm-b7 = cap-dpx b8 = cap-tif-b9 = cap-frm-c10 = cap-dpx-c11 = cap-tif-c12 = cap-frm-d13 = cap-dpx-d14 = cap-tif-d15 = log16 = dump17 = loud
  • I40systemTBL(2) group
MIBOIDSYNTAXACCESSVALUE/RANGE
I40sysInputTBLI40systemTBL.1Aggregate--
I40sysSdiInI40sysInputTBL.1INTEGERR/W1 = sys-4k-3g-qlink2 = sys-4k-3g-dlink3 = sys-4k-hd-qlink4 = sys-single-link5 = sys-hd-dlink6 = sys-3g-dlink7 = sys-3gb-dstream11 = sys-4k-12g
I40sysSdiColorimetryI40sysInputTBL.2INTEGERR/W1 = pid2 = bt7093 = bt20204 = dci
I40sysOutTBLI40systemTBL.2Aggregate--
I40sysMonitorOutTBLI40systemTBL.3Aggregate--
I40sysHdrTBLI40systemTBL.4Aggregate--
I40sysHdrInputAModeI40sysHdrTBL.1INTEGERR/W1 = off2 = hlg3 = pq4 = slog3
I40sysHdrInputBModeI40sysHdrTBL.2INTEGERR/W1 = off2 = hlg3 = pq4 = slog3
I40sysHdrInputCModeI40sysHdrTBL.3INTEGERR/W1 = off2 = hlg3 = pq4 = slog3
I40sysHdrInputDModeI40sysHdrTBL.4INTEGERR/W1 = off2 = hlg3 = pq4 = slog3
I40sysHdrInputASysGammaI40sysHdrTBL.5INTEGERR/W1 = off2 = on
I40sysHdrInputBSysGammaI40sysHdrTBL.6INTEGERR/W1 = off2 = on
I40sysHdrInputCSysGammaI40sysHdrTBL.7INTEGERR/W1 = off2 = on
I40sysHdrInputDSysGammaI40sysHdrTBL.8INTEGERR/W1 = off2 = on
I40sysHdrInputAHlgScaleI40sysHdrTBL.9INTEGERR/W1 = off
  1. Network Control
MIBOIDSYNTAXACCESSVALUE/RANGE
2 = on
I40sysHdrInputBHlgScaleI40sysHdrTBL.10INTEGERR/W1 = off2 = on
I40sysHdrInputCHlgScaleI40sysHdrTBL.11INTEGERR/W1 = off2 = on
I40sysHdrInputDHlgScaleI40sysHdrTBL.12INTEGERR/W1 = off2 = on
I40sysHdrInputARangeI40sysHdrTBL.13INTEGERR/W1 = narrow2 = full
I40sysHdrInputBRangeI40sysHdrTBL.14INTEGERR/W1 = narrow2 = full
I40sysHdrInputCRangeI40sysHdrTBL.15INTEGERR/W1 = narrow2 = full
I40sysHdrInputDRangeI40sysHdrTBL.16INTEGERR/W1 = narrow2 = full
I40sysSetupTBLI40systemTBL.5Aggregate--
I40sysDateTimeI40sysSetupTBL.1DisplayStringR/ODate and Time
I40sysInfoTBLI40systemTBL.6Aggregate--
I40sysInfoFirmwareI40sysInfoTBL.1DisplayStringR/OFirmware Version
I40sysInfoSer01I40sysInfoTBL.2INTEGERR/O1 = notavailable2 = available
I40sysInfoSer02I40sysInfoTBL.3INTEGERR/O1 = notavailable2 = available
I40sysInfoSer03I40sysInfoTBL.4INTEGERR/O1 = notavailable2 = available
I40sysInfoSer05I40sysInfoTBL.5INTEGERR/O1 = notavailable2 = available
  • 140wfmTBL(3) group
MIBOIDSYNTAXACCESSVALUE/RANGE
I40wfmIntenConfigTBLI40wfmTBL.1Aggregate--
I40wfmModeTBLI40wfmIntenConfigTBL.1Aggregate--
I40wfmModeModeI40wfmModeTBL.1INTEGERR/W1 = parade2 = overlay
I40wfmModeCh1YI40wfmModeTBL.2INTEGERR/W1 = off2 = on
I40wfmModeCh2CbI40wfmModeTBL.3INTEGERR/W1 = off2 = on
I40wfmModeCh3CrI40wfmModeTBL.4INTEGERR/W1 = off2 = on
I40wfmModeCh1GI40wfmModeTBL.5INTEGERR/W1 = off2 = on
I40wfmModeCh2BI40wfmModeTBL.6INTEGERR/W1 = off2 = on
I40wfmModeCh3RI40wfmModeTBL.7INTEGERR/W1 = off2 = on
I40wfmModeCh1RI40wfmModeTBL.8INTEGERR/W1 = off2 = on
I40wfmModeCh2GI40wfmModeTBL.9INTEGERR/W1 = off2 = on
I40wfmModeCh3BI40wfmModeTBL.10INTEGERR/W1 = off2 = on
I40wfmMode3gbdsI40wfmModeTBL.11INTEGERR/W1 = stream12 = stream23 = mix4 = align
  1. Network Control
MIBOIDSYNTAXACCESSVALUE/RANGE
I40wfmModeYParadeI40wfmModeTBL.12INTEGERR/W1 = off2 = on
I40wfmModeCh1XI40wfmModeTBL.13INTEGERR/W1 = off2 = on
I40wfmModeCh2YI40wfmModeTBL.14INTEGERR/W1 = off2 = on
I40wfmModeCh3ZI40wfmModeTBL.15INTEGERR/W1 = off2 = on
I40wfmIntenTBLI40wfmIntenConfigTBL.2Aggregate--
I40wfmIntenI40wfmIntenTBL.1INTEGERR/W-128 to 127
I40wfmColorI40wfmIntenTBL.2INTEGERR/W1 = white2 = yellow3 = cyan4 = green5 = magenta6 = red7 = blue8 = multi
I40wfmColorS1I40wfmIntenTBL.3INTEGERR/W1 = white2 = yellow3 = cyan4 = green5 = magenta6 = red7 = blue8 = multi
I40wfmColorS2I40wfmIntenTBL.4INTEGERR/W1 = white2 = yellow3 = cyan4 = green5 = magenta6 = red7 = blue8 = multi
I40wfmScaleTBLI40wfmIntenConfigTBL.3Aggregate--
I40wfmScaleIntenI40wfmScaleTBL.1INTEGERR/W-8 to 7
I40wfmScaleColorI40wfmScaleTBL.2INTEGERR/W1 = white2 = yellow3 = cyan4 = green5 = magenta6 = red7 = blue
I40wfmScaleUnitI40wfmScaleTBL.3INTEGERR/W1 = unit-hdv-sdp2 = unit-hdv-sdv3 = unit-hdp-sdp4 = unit-cv-dec5 = unit-cv-hex
I40wfmScaleUnitNtscI40wfmScaleTBL.4INTEGERR/W3 = unit-hdp-sdp
I40wfmScaleUnitPalI40wfmScaleTBL.5INTEGERR/W2 = unit-hdv-sdv
I40wfmScaleUnitFullRangeI40wfmScaleTBL.6INTEGERR/W3 = unit-hdp-sdp4 = unit-cv-dec5 = unit-cv-hex
I40wfmScale75perColI40wfmScaleTBL.7INTEGERR/W1 = off2 = on
I40wfmScaleDisplayI40wfmScaleTBL.8INTEGERR/W1 = off2 = on
  1. Network Control
MIBOIDSYNTAXACCESSVALUE/RANGE
2 = main (SER23)3 = hdr (SER23)4 = both (SER23)
I40wfmGainTBLI40wfmTBL.2Aggregate--
I40wfmGainVarI40wfmGainTBL.1INTEGERR/W1 = cal2 = variable
I40wfmGainMagI40wfmGainTBL.2INTEGERR/W1 = x12 = x5
I40wfmGainValueI40wfmGainTBL.3DisplayStringR/W0.2 to 2.000
I40wfmGainFilterI40wfmGainTBL.4INTEGERR/W1 = lowpass2 = flat
I40wfmGainFilterCmpI40wfmGainTBL.5INTEGERR/W2 = flat3 = lum4 = flatlum5 = lumchroma
I40wfmGainScaleJumpI40wfmGainTBL.6INTEGERR/W1 = pos-02 = pos-103 = pos-204 = pos-305 = pos-406 = pos-507 = pos-608 = pos-709 = pos-8010 = pos-9011 = pos-10012 = cursor
I40wfmSweepTBLI40wfmTBL.3Aggregate--
I40wfmSweepI40wfmSweepTBL.1INTEGERR/W1 = h2 = v
I40wfmSweepMagHI40wfmSweepTBL.2INTEGERR/W1 = x12 = x103 = x204 = blank5 = active
I40wfmSweepMagVI40wfmSweepTBL.3INTEGERR/W1 = x12 = x203 = x40
I40wfmSweepHI40wfmSweepTBL.4INTEGERR/W1 = sweep-1h2 = sweep-2h
I40wfmSweepVI40wfmSweepTBL.5INTEGERR/W1 = sweep-1v2 = sweep-2v
I40wfmSweepFieldI40wfmSweepTBL.6INTEGERR/W1 = field12 = field2
I40wfmBlankingI40wfmSweepTBL.7INTEGERR/W1 = remove2 = v3 = h4 = all
I40wfmBlankingCmpI40wfmSweepTBL.8INTEGERR/W1 = remove2 = v
I40wfmMatrixTBLI40wfmTBL.4Aggregate--
I40wfmMatrixI40wfmMatrixTBL.1INTEGERR/W1 = ycbcr2 = gbr3 = rgb4 = composite
I40wfmMatrixRgbI40wfmMatrixTBL.2INTEGERR/W2 = gbr3 = rgb
  1. Network Control
MIBOIDSYNTAXACCESSVALUE/RANGE
4 = composite
I40wfmMatrixYgbrI40wfmMatrixTBL.3INTEGERR/W1 = off2 = on
I40wfmMatrixYrgbI40wfmMatrixTBL.4INTEGERR/W1 = off2 = on
I40wfmCmpFormatI40wfmMatrixTBL.5INTEGERR/W1 = auto2 = ntsc3 = pal
I40wfmCmpSetupI40wfmMatrixTBL.6INTEGERR/W1 = setup-0p2 = setup-75p
I40wfmMatrixXyzI40wfmMatrixTBL.7INTEGERR/W2 = gbr3 = rgb4 = composite5 = xyz
I40wfmMatrixTBLI40wfmTBL.4Aggregate--
I40wfmCursorModeI40wfmCursorTBL.1INTEGERR/W1 = off2 = single3 = both
I40wfmCursorSelI40wfmCursorTBL.2INTEGERR/W1 = xf2 = y
I40wfmCursorUnitXI40wfmCursorTBL.3INTEGERR/W1 = sec2 = hz
I40wfmCursorUnitYI40wfmCursorTBL.4INTEGERR/W1 = mv2 = per3 = r-per4 = dec5 = hex6 = hdr
I40wfmCursorUnitYCmpI40wfmCursorTBL.5INTEGERR/W1 = mv2 = per3 = r-per
I40wfmCursorRefsetI40wfmCursorTBL.6INTEGERR/W1 (fixed)
I40wfmCursorRefXI40wfmCursorTBL.7INTEGERR/W0 to 927
I40wfmCursorDeltaXI40wfmCursorTBL.8INTEGERR/W0 to 927
I40wfmCursorTrackXI40wfmCursorTBL.9INTEGERR/W-927 to 927
I40wfmCursorRefYI40wfmCursorTBL.10INTEGERR/W-5000 to 15000
I40wfmCursorDeltaYI40wfmCursorTBL.11INTEGERR/W-5000 to 15000
I40wfmCursorTrackYI40wfmCursorTBL.12INTEGERR/W-15000 to 15000
I40wfmLineselTBLI40wfmTBL.6Aggregate--
I40wfmLineselI40wfmLineselTBL.1INTEGERR/W1 = off2 = on
I40wfmLineselNoI40wfmLineselTBL.2INTEGERR/W0 to 32767
I40wfmLineselFieldI40wfmLineselTBL.3INTEGERR/W1 = frame2 = field13 = field2
I40wfmExtSyncTBLI40wfmTBL.7Aggregate--
I40wfmExtSyncModeI40wfmExtSyncTBL.1INTEGER R/W1 = off2 = on
I40wfmExtSyncIntenI40wfmExtSyncTBL.2INTEGERR/W-128 to 127
I40wfmExtSyncColorI40wfmExtSyncTBL.3INTEGERR/W1 = white2 = yellow3 = cyan4 = green5 = magenta6 = red7 = blue
  • I40vectorTBL(4) group
MIBOIDSYNTAXACCESSVALUE/RANGE
I40vectorIntenConfigTBLI40vectorTBL.1Aggregate--
I40vectorDispMode I40vectorIntenConfigTBL.1INTEGER R/W1 = vector2 = fivebar3 = histogram4 = cie-diagram
I40vectorIntenI40vectorIntenConfigTBL.2INTEGERR/W-128 to 127
I40vectorColor I40vectorIntenConfigTBL.3INTEGER R/W1 = white2 = yellow3 = cyan4 = green5 = magenta6 = red7 = blue
I40vectorColorS1I40vectorIntenConfigTBL.4INTEGERR/W1 = white2 = yellow3 = cyan4 = green5 = magenta6 = red7 = blue
I40vectorColorS2 I40vectorIntenConfigTBL.5INTEGER R/W1 = white2 = yellow3 = cyan4 = green5 = magenta6 = red7 = blue
I40vectorDisp3gbdsI40vectorIntenConfigTBL.6INTEGERR/W1 = stream12 = stream23 = mix4 = align
I40vectorVectorMode I40vectorIntenConfigTBL.7INTEGER R/W1 = vector2 = rgb-vector3 = ycbcr-vector
I40vectorDispVecTBLI40vectorTBL.2Aggregate--
I40vectorDispVecScaleTBLI40vectorDispVecTBL.1Aggregate--
I40vectorDispVecScaleIntenI40vectorDispVecScaleTBL.1INTEGERR/W-8 to 7
I40vectorDispVecScaleColor I40vectorDispVecScaleTBL.2INTEGER R/W1 = white2 = yellow3 = cyan4 = green5 = magenta6 = red7 = blue
I40vectorDispVecScaleIqI40vectorDispVecScaleTBL.3INTEGERR/W1 = off2 = on
I40vectorDispVecVectorScaleI40vectorDispVecScaleTBL.4INTEGER R/W1 = auto2 = bt6013 = bt7094 = dci5 = bt2020
I40vectorDispRGBVecAdjustTargetI40vectorDispVecScaleTBL.5INTEGERR/W1 = gb2 = gr
  1. Network Control
MIBOIDSYNTAXACCESSVALUE/RANGE
I40vectorDispRGBVecAdjustPosHI40vectorDispVecScaleTBL.6INTEGERR/W-500 to 500
I40vectorDispRGBVecAdjustPosVI40vectorDispVecScaleTBL.7INTEGERR/W-500 to 500
I40vectorDispYCbCrVecTimingMarkerI40vectorDispVecScaleTBL.8INTEGERR/W1 = auto2 = hd3 = sd
I40vectorDispYCbCrVecVectorScaleI40vectorDispVecScaleTBL.9INTEGER R/W1 = auto2 = bt6013 = bt7094 = dci5 = bt2020
I40vectorDispVecGainTBLI40vectorDispVecTBL.2Aggregate--
I40vectorDispVecGainVar I40vectorDispVecGainTBL.1I40vectorDispVecGainTBL.1INTEGER R/W1 = cal2 = variable
I40vectorDispVecGainMag I40vectorDispVecGainTBL.2I40vectorDispVecGainTBL.2INTEGER R/W1 = x12 = x53 = iq
I40vectorDispVecGainValue I40vectorDispVecGainTBL.3I40vectorDispVecGainTBL.3DisplayStringR/W0.2 to 2.000
I40vectorDispRGBVecGainHI40vectorDispVecGainTBL.4DisplayStringR/W0.2 to 2.000
I40vectorDispRGBVecGainV I40vectorDispVecGainTBL.5I40vectorDispVecGainTBL.5DisplayStringR/W0.2 to 2.000
I40vectorDispYCbCrVecGainVarI40vectorDispVecGainTBL.6INTEGER R/W1 = cal2 = variable
I40vectorDispYCbCrVecGainMagI40vectorDispVecGainTBL.7INTEGER R/W1 = x12 = x5
I40vectorDispYCbCrVecObsPointI40vectorDispVecGainTBL.8INTEGERR/W1 = by-wh2 = by-yl3 = by-cy4 = by-g5 = by-timing6 = by-mg7 = by-r8 = by-b9 = bl10 = ry-b11 = ry-r12 = ry-mg13 = ry-timing14 = ry-g15 = ry-cy16 = ry-yl17 = ry-wh
I40vectorDispVecMarkerI40vectorDispVecTBL.3INTEGERR/W1 = off2 = on
I40vectorColorSystemTBLI40vectorDispVecTBL.4Aggregate--
I40vectorColorSysMatrix I40vectorColorSystemTBL.1I40vectorColorSystemTBL.1INTEGER R/W1 = component2 = composite
I40vectorColorSysColorBarI40vectorColorSystemTBL.2INTEGERR/W1 = cb-100p2 = cb75p
I40vectorColorSysCmpFormatI40vectorColorSystemTBL.3INTEGER R/W1 = auto2 = ntsc
  1. Network Control
MIBOIDSYNTAXACCESSVALUE/RANGE
3 = pal
I40vectorColorSysSetup I40vectorColorSystemTBL.4l40vectorDisp5barTBL.3INTEGERR/W1 = setup-0p2 = setup-75p
I40vectorDisp5barTBLl40vectorDisp5barTBL.1Aggregate--
I40vectorDisp5barScalel40vectorDisp5barTBL.2INTEGERR/W1 = p2 = mv3 = hex4 = dec
I40vectorDisp5barSeql40vectorDisp5barTBL.2INTEGERR/W1 = gbr2 = rgb
I40vectorDispHistTBLl40vectorTBL.4Aggregate--
I40vectorDispHistScalel40vectorDispHistTBL.1INTEGERR/W1 = per2 = hdr
I40vectorDispHistForml40vectorDispHistTBL.2INTEGERR/W1 = single2 = tile3 = align-h4 = align-v
I40vectorDispHistSetupTBLl40vectorDispHistTBL.3Aggregate--
I40vectorDispHistSetupY l40vectorDispHistSetupTBL.1l40vectorDispHistSetupTBL.1INTEGER R/W1 = off2 = on
I40vectorDispHistSetupR l40vectorDispHistSetupTBL.2l40vectorDispHistSetupTBL.2INTEGER R/W1 = off2 = on
I40vectorDispHistSetupG l40vectorDispHistSetupTBL.3l40vectorDispHistSetupTBL.3INTEGER R/W1 = off2 = on
I40vectorDispHistSetupB l40vectorDispHistSetupTBL.4l40vectorDispHistSetupTBL.4INTEGER R/W1 = off2 = on
I40vectorDispCieTBLl40vectorTBL.5Aggregate--
I40vectorDispCieScaleTBLl40vectorDispCieTBL.1Aggregate--
I40vectorDispCieColor l40vectorDispCieScaleTBL.1l40vectorDispCieScaleTBL.1INTEGERR/W1 = bg-white2 = bg-color3 = bg-black
I40vectorDispCieTriangle1 l40vectorDispCieScaleTBL.2l40vectorDispCieScaleTBL.2INTEGER R/W1 = off4 = bt601-5255 = bt601-6256 = bt7097 = dci8 = bt2020
I40vectorDispCieTriangle2 l40vectorDispCieScaleTBL.3l40vectorDispCieScaleTBL.3INTEGER R/W1 = off4 = bt601-5255 = bt601-6256 = bt7097 = dci8 = bt2020
I40vectorDispCieUserTrianglel40vectorDispCieScaleTBL.4INTEGER R/W1 = off2 = one3 = two
I40vectorDispCieUserPrimaryColorl40vectorDispCieScaleTBL.5INTEGER R/W1 = g2 = b3 = r
I40vectorDispCieUserTriangleXl40vectorDispCieScaleTBL.6DisplayStringR/W0 to 1.000
I40vectorDispCieUserTriangleYl40vectorDispCieScaleTBL.7DisplayStringR/W0 to 1.000
I40vectorDispCieTempScalel40vectorDispCieScaleTBL.8INTEGER R/W1 = off2 = on
I40vectorDispCieGridl40vectorDispCieScaleTBL.9INTEGER R/W1 = off2 = on
  1. Network Control
MIBOIDSYNTAXACCESSVALUE/RANGE
I40vectorDispCieD65 I40vectorDispCieScaleTBL.10INTEGER R/W1 = off2 = on
I40vectorDispCieTriangleCaptionI40vectorDispCieScaleTBL.11INTEGER R/W1 = off2 = on
I40vectorDispCieSettingTBLI40vectorDispCieTBL.2Aggregate--
I40vectorDispCieMode I40vectororDispCieSettingTBL.1INTEGER R/W1 = diagramam2 = temp
I40vectorDispCieStandard I40vectorvectorDispCieSettingTBL.2INTEGER R/W5 = cie13916 = cie1976
I40vectorDispCieClip I40vectorDispCieSettingTBL.3INTEGER R/W1 = off2 = on
I40vectorDispCieFilter I40vectorDispCieSettingTBL.4INTEGER R/W1 = off2 = on
I40vectorDispCieManualSetupI40vectorDispCieSettingTBL.5INTEGER R/W1 = off2 = on
I40vectorDispCieColorimetrySetupI40vectorDispCieSettingTBL.6INTEGERR/W1 = bt601-5252 = bt601-6253 = bt7094 = dci5 = bt2020
I40vectorDispCieGammaSetupI40vectorDispCieSettingTBL.7DisplayStringR/W1.50 to 3.00
I40vectorDispCieCursorI40vectorDispCieTBL.3INTEGERR/W1 = off2 = on
I40vectorLineselTBLI40vectorTBL.6Aggregate--
I40vectorLineselI40vectorLineselTBL.1INTEGERR/W1 = off2 = on
I40vectorLineselNoI40vectorLineselTBL.2INTEGERR/W0 to 32767
I40vectorLineselFieldI40vectorLineselTBL.3INTEGERR/W1 = frame2 = field13 = fiedl2

• I40pictureTBL(5) group

MIBOIDSYNTAXACCESSVALUE/RANGE
I40pictureConfigTBLI40pictureTBL.1Aggregate--
I40pictureModeI40pictureConfigTBL.1INTEGERR/W1 = fit2 = real3 = x24 = full
I40pictureAdjustTBLI40pictureConfigTBL.2Aggregate--
I40pictureAdjustColorI40pictureAdjustTBL.1INTEGERR/W1 = color2 = mono
I40pictureChromaI40pictureAdjustTBL.2INTEGERR/W1 = normal2 = up
I40pictureBrightnessI40pictureAdjustTBL.3DisplayStringR/W-50.0 to 50.0
I40pictureContrastI40pictureAdjustTBL.4DisplayStringR/W0 to 200.0
I40pictureGainRI40pictureAdjustTBL.5DisplayStringR/W0 to 200.0
I40pictureGainGI40pictureAdjustTBL.6DisplayStringR/W0 to 200.0
I40pictureGainBI40pictureAdjustTBL.7DisplayStringR/W0 to 200.0
I40pictureGainCromaI40pictureAdjustTBL.8DisplayStringR/W0 to 200.0
I40pictureBiasRI40pictureAdjustTBL.9DisplayStringR/W-50.0 to 50.0
I40pictureBiasGI40pictureAdjustTBL.10DisplayStringR/W-50.0 to 50.0
I40pictureBiasBI40pictureAdjustTBL.11DisplayStringR/W-50.0 to 50.0
I40pictureDispGamutI40pictureConfigTBL.3INTEGERR/W1 = off2 = white3 = red
  1. Network Control
MIBOIDSYNTAXACCESSVALUE/RANGE
4 = mesh
I40pictureDispStatusInfoI40pictureConfigTBL.4INTEGERR/W1 = off2 = on
I40pictureDisp3gbdsI40pictureConfigTBL.5INTEGERR/W1 = Stream12 = Stream23 = Mix4 = Align
I40pictureDispPosHI40pictureConfigTBL.6INTEGERR/W-32768 to 32767
I40pictureDispPosVI40pictureConfigTBL.7INTEGERR/W-32768 to 32767
I40pictureMarkerTBLI40pictureConfigTBL.8Aggregate--
I40pictureMarkerFrameI40pictureMarkerTBL.1INTEGERR/W1 = off2 = on
I40pictureMarkerCenterI40pictureMarkerTBL.2INTEGERR/W1 = off2 = on
I40pictureMarkerAspectI40pictureMarkerTBL.3INTEGERR/W1 = off2 = asp-17x93 = asp-16x94 = asp-14x95 = asp-13x96 = asp-4x37 = asp-239x18 = asp-afd
I40pictureAspectShadowI40pictureMarkerTBL.4INTEGERR/W0 to 100
I40pictureSafeActionI40pictureMarkerTBL.5INTEGERR/W1 = off2 = arib3 = smpte4 = user
I40pictureSafeTitleI40pictureMarkerTBL.6INTEGERR/W1 = off2 = arib3 = smpte4 = user
I40pictureSafeUser1WidthI40pictureMarkerTBL.7INTEGERR/W0 to 100
I40pictureSafeUser1HeightI40pictureMarkerTBL.8INTEGERR/W0 to 100
I40pictureSafeUser2WidthI40pictureMarkerTBL.9INTEGERR/W0 to 100
I40pictureSafeUser2HeightI40pictureMarkerTBL.10INTEGERR/W0 to 100
I40pictureSafeUserAspectI40pictureMarkerTBL.11INTEGERR/W1 = off2 = on
I40pictureSuperImposeTBLI40pictureConfigTBL.9Aggregate--
I40pictureStandard I40pictureSuperImposeTBL.1INTEGER R/W1 = off2 = smpte3 = arib4 = teletext
I40pictureSmpteFormat I40pictureSuperImposeTBL.2INTEGERR/W1 = fmt-608-7082 = fmt-608-6083 = fmt-vbi4 = fmt-708
I40pictureSmpteLanguageI40pictureSuperImposeTBL.3INTEGERR/W1 = cc12 = cc23 = cc34 = cc45 = text16 = text27 = text38 = text4
I40pictureSmpte708Service I40pictureSuperImposeTBL.4INTEGERR/W1 to 63
I40pictureAribFormatI40pictureSuperImposeTINTEGERR/W1 = hd
  1. Network Control
MIBOIDSYNTAXACCESSVALUE/RANGE
BL.5 2 = sd3 = analog4 = cellular
I40pictureAribLanguage I40pictureSuperImposeTBL.6INTEGERR/W1 = one2 = two
I40pictureTeletextWstI40pictureSuperImposeTBL.7INTEGERR/W1 = vbi2 = op47
I40pictureTeletextMagazin I40pictureSuperImposeTBL.8INTEGER R/W1 to 8
I40pictureTeletextPage I40pictureSuperImposeTBL.9INTEGERR/W0 to 255
I40pictureCITBLI40pictureTBL.7Aggregate--
I40pictureCIDisplayI40pictureCITBL.1INTEGERR/W1 = off2 = fstop3 = perdisplay4 = cinezone
I40pictureCIAdvanceI40pictureCITBL.2INTEGERR/W1 = off2 = on
I40pictureCIMeasureNumsI40pictureCITBL.3INTEGERR/W1 = p12 = p1p23 = p1p2p3
I40pictureCIMeasurePosI40pictureCITBL.4INTEGERR/W1 = p12 = p23 = p3
I40pictureCIMeasureSizeI40pictureCITBL.5INTEGERR/W1 = size-1x12 = size-3x33 = size-9x9
I40pictureCIUnitI40pictureCITBL.6INTEGERR/W1 = yper2 = rgbper3 = rgb2554 = codevalue5 = codevaluedec6 = hdr
I40pictureCIFstopRefSetI40pictureCITBL.7INTEGERR/WO1 (fixed)
I40pictureCIFstopGammaSelI40pictureCITBL.8INTEGERR/W1 = gamma-0452 = user13 = user24 = user35 = usera6 = userb7 = userc8 = userd9 = usere
I40pictureCISampleI40pictureCITBL.9INTEGERR/W0 to 32767
I40pictureCLLineI40pictureCITBL.10INTEGERR/W0 to 32767
I40pictureCICzTBLI40pictureCLTBL.11Aggregate--
I40pictureCICzHdrZoneI40pictureCICzTBL.1INTEGERR/W1 = off2 = on
I40pictureCICzFormI40pictureCICzTBL.2INTEGERR/W1 = gradate2 = step3 = search
I40pictureCICzUpperI40pictureCICzTBL.3DisplayStringR/W-6.3 to 109.4
I40pictureCICzLowerI40pictureCICzTBL.4DisplayStringR/W-7.3 to 108.4
I40pictureCICzRefI40pictureCICzTBL.5DisplayStringR/W-7.3 to 109.4
I40pictureCICzLevelI40pictureCICzTBL.6DisplayStringR/W-7.3 to 109.4
I40pictureMaxFallCITBLI40pictureTBL.3Aggregate--
I40pictureMaxFallCITDisplayI40pictureMaxFallCITBLLINTEGERR/W1 = off
  1. Network Control
MIBOIDSYNTAXACCESSVALUE/RANGE
.12 = on
I40pictureMaxFallCllMeasure I40pictureMaxFallCllTBLL .2INTEGERR/W1 = stop2 = start
I40pictureMaxFallCllClearI40pictureMaxFallCllTBLL .3INTEGERR/WO1 (fixed)
I40pictureEdgeTBLI40pictureTBL.4Aggregate--
I40pictureEdgeDetectI40pictureEdgeTBL.1INTEGERR/W1 = off2 = on
I40pictureEdgeSensitiveI40pictureEdgeTBL.2INTEGERR/W1 = low2 = middle3 = high4 = v-high5 = u-high
I40pictureEdgeLevelI40pictureEdgeTBL.3INTEGERR/W1 = lvl-off2 = lvl-253 = lvl-504 = lvl-755 = lvl-1006 = lvl-emboss
I40pictureEdgeColorI40pictureEdgeTBL.4INTEGERR/W1 = white4 = green6 = red7 = blue
I40pictureLineselTBLI40pictureTBL.5Aggregate--
I40pictureLineselI40pictureLineselTBL.1INTEGERR/W1 = off2 = on
I40pictureLineselNoI40pictureLineselTBL.2INTEGERR/W0 to 32767
I40pictureLineselFieldI40pictureLineselTBL.3INTEGERR/W1 = frame2 = field13 = field2
I40pictureDataTBLI40pictureTBL.6Aggregate--
I40pictureDataCineliteP1I40pictureDataTBL.1DisplayStringR/OCinelite Data
I40pictureDataCineliteP2I40pictureDataTBL.2DisplayStringR/OCinelite Data
I40pictureDataCineliteP3I40pictureDataTBL.3DisplayStringR/OCinelite Data

• I40statusTBL(6) group

MIBOIDSYNTAXACCESSVALUE/RANGE
I40statusModeTBLI40statusTBL.1Aggregate--
I40statusModeTopI40statusModeTBL.1INTEGERR/WO1 (fixed)
I40statusModeDumpI40statusModeTBL.2INTEGERR/WO1 (fixed)
I40statusModeExtrefI40statusModeTBL.3INTEGERR/WO1 (fixed)
I40statusModeAvPhaseI40statusModeTBL.4INTEGERR/WO1 (fixed)
I40statusModeAncViewI40statusModeTBL.5INTEGERR/WO1 (fixed)
I40statusModeAncViewDumpI40statusModeTBL.6INTEGERR/WO1 (fixed)
I40statusModeLogI40statusModeTBL.7INTEGERR/WO1 (fixed)
I40statusModeAncPktI40statusModeTBL.8INTEGERR/WO1 (fixed)
I40statusModeEdhI40statusModeTBL.9INTEGERR/WO1 (fixed)
I40statusModePayloadI40statusModeTBL.10INTEGERR/WO1 (fixed)
I40statusModeCtrlPktI40statusModeTBL.11INTEGERR/WO1 (fixed)
I40statusModeAribCcI40statusModeTBL.12INTEGERR/WO1 (fixed)
I40statusAribNetqI40statusModeTBL.13INTEGERR/WO1 (fixed)
I40statusModeAribTrigI40statusModeTBL.14INTEGERR/WO1 (fixed)
I40statusModeAribUser1I40statusModeTBL.15INTEGERR/WO1 (fixed)
I40statusModeAribUser2I40statusModeTBL.16INTEGERR/WO1 (fixed)
I40statusModeSmpte608I40statusModeTBL.17INTEGERR/WO1 (fixed)
I40statusModeSmpte708I40statusModeTBL.18INTEGERR/WO1 (fixed)
  1. Network Control
MIBOIDSYNTAXACCESSVALUE/RANGE
I40statusModeSmpteAfdI40statusModeTBL.19INTEGERR/WO1 (fixed)
I40statusModeSmpteProgI40statusModeTBL.20INTEGERR/WO1 (fixed)
I40statusModeSmpteVbiI40statusModeTBL.21INTEGERR/WO1 (fixed)
I40statusModeSearchI40statusModeTBL.22INTEGERR/WO1 (fixed)
I40statusModeErrClearI40statusModeTBL.23INTEGERR/WO1 (fixed)
I40statusLogTBLI40statusTBL.2Aggregate--
I40statusLoggingI40statusLogTBL.1INTEGERR/W1 = stop2 = start
I40statusLogModeI40statusLogTBL.2INTEGERR/W1 = overwrt2 = stop
I40statusLogClearI40statusLogTBL.3INTEGERR/WO1 (fixed)
I40statusDumpTBLI40statusTBL.3Aggregate--
I40statusDumpModeI40statusDumpTBL.1INTEGERR/W1 = run2 = hold
I40statusDumpModeCapI40statusDumpTBL.2INTEGERR/W1 = run2 = hold3 = frmcap
I40statusDumpDispI40statusDumpTBL.3INTEGERR/W1 = serial2 = compo3 = binary4 = linka5 = linkb6 = linkab7 = stream18 = stream29 = stream1210 = s1serial11 = s1compo12 = s1binary13 = s2serial14 = s2compo15 = s2binary
I40statusDumpJumpI40statusDumpTBL.4INTEGERR/W1 = eav2 = sav
I40statusDumpSampleI40statusDumpTBL.5INTEGERR/W0 to 32767
I40statusDumpLineI40statusDumpTBL.6INTEGERR/W0 to 32767
I40statusExtrefTBLI40statusTBL.4Aggregate--
I40statusExtrefSelI40statusExtrefTBL.3INTEGERR/W1 = ext2 = sdi
I40statusExtrefUserRefI40statusExtrefTBL.1INTEGERR/WO1 (fixed)
I40statusExtrefDefaultRefI40statusExtrefTBL.2INTEGERR/WO1 (fixed)
I40statusExtrefTimingI40statusExtrefTBL.4INTEGERR/W1 = legacy2 = serial
I40statusAvPhaseTBLI40statusTBL.5Aggregate--
I40statusAvPhaseScaleMaxI40statusAvphaseTBL.1INTEGERR/W1 = scale-50ms2 = scale-100ms3 = scale-500ms4 = scale-1000ms5 = scale-2500ms
I40statusAvPhaseRefreshI40statusAvphaseTBL.2INTEGERR/WO1 (fixed)
I40statusAncTBLI40statusTBL.6Aggregate--
I40statusAncDumpHoldI40statusAncTBL.1INTEGERR/W1 = hold-hold2 = hold-1s3 = hold-3s
I40statusAncDumpModeI40statusAncTBL.2INTEGERR/W1 = hex2 = binary
I40statusAncDumpSampleI40statusAncTBL.3INTEGERR/W0 to 258
  1. Network Control
MIBOIDSYNTAXACCESSVALUE/RANGE
I40statusAncEdhDispI40statusAncTBL.4INTEGERR/W1 = text2 = dump
I40statusAncEdhModeI40statusAncTBL.5INTEGERR/W1 = hex2 = binary
I40statusAncEdhSampleI40statusAncTBL.6INTEGERR/W0 to 19
I40statusAncViewStreamI40statusAncTBL.7INTEGERR/W1 = stream12 = stream2
I40statusAncPayloadStreamI40statusAncTBL.8INTEGERR/W1 = stream12 = stream2
I40statusAncCtrlDispI40statusAncTBL.9INTEGERR/W1 = text2 = dump
I40statusAncCtrlModeI40statusAncTBL.10INTEGERR/W1 = hex2 = binary
I40statusAncCtrlGroupI40statusAncTBL.11INTEGERR/W1 = group12 = group23 = group34 = group4
I40statusAncCtrlStreamI40statusAncTBL.12INTEGERR/W1 = stream12 = stream2
I40statusAribTBLI40statusTBL.7Aggregate--
I40statusAribCcDispI40statusAribTBL.1INTEGERR/W1 = text2 = dump
I40statusAribCcTypeI40statusAribTBL.2INTEGERR/W1 = hd2 = sd3 = analog4 = cellular
I40statusAribCcModeI40statusAribTBL.3INTEGERR/W1 = hex2 = binary
I40statusAribCcSampleI40statusAribTBL.4INTEGERR/W0 to 258
I40statusAribCcStreamI40statusAribTBL.5INTEGERR/W1 = stream12 = stream2
I40statusAribNetqDispI40statusAribTBL.6INTEGERR/W1 = text2 = dump3 = qlog4 = format
I40statusAribNetqModeI40statusAribTBL.7INTEGERR/W1 = hex2 = binary
I40statusAribNetqSampleI40statusAribTBL.8INTEGERR/W0 to 258
I40statusAribNetqLogPosI40statusAribTBL.9INTEGERR/W-50 to 50
I40statusAribNetqStreamI40statusAribTBL.10INTEGERR/W1 = stream12 = stream2
I40statusAribNetqClearI40statusAribTBL.11INTEGERR/WO1 (fixed)
I40statusAribTriggerDispI40statusAribTBL.12INTEGERR/W1 = text2 = dump
I40statusAribTriggerModeI40statusAribTBL.13INTEGERR/W1 = hex2 = binary
I40statusAribTriggerSampleI40statusAribTBL.14INTEGERR/W0 to 258
I40statusAribTriggerStreamI40statusAribTBL.15INTEGERR/W1 = stream12 = stream2
I40statusAribTriggerUser1ModeI40statusAribTBL.16INTEGERR/W1 = hex2 = binary
I40statusAribTriggerUser1SampleI40statusAribTBL.17INTEGERR/W0 to 258
I40statusAribTriggerUser1StreamI40statusAribTBL.18INTEGERR/W1 = stream12 = stream2
  1. Network Control
MIBOIDSYNTAXACCESSVALUE/RANGE
I40statusAribTriggerUser2ModeI40statusAribTBL.19INTEGERR/W1 = hex2 = binary
I40statusAribTriggerUser2SampleI40statusAribTBL.20INTEGERR/W0 to 258
I40statusAribTriggerUser2StreamI40statusAribTBL.21INTEGERR/W1 = stream12 = stream2
I40statusSmpteTBLI40statusTBL.8Aggregate--
I40statusSmpte608DispI40statusSmpteTBL.1INTEGERR/W1 = text2 = dump
I40statusSmpte608ModeI40statusSmpteTBL.2INTEGERR/W1 = hex2 = binary
I40statusSample608SampleI40statusSmpteTBL.3INTEGERR/W0 to 258
I40statusSample608StreamI40statusSmpteTBL.4INTEGERR/W1 = stream12 = stream2
I40statusSmpte708DispI40statusSmpteTBL.5INTEGERR/W1 = text2 = dump
I40statusSmpte708ModeI40statusSmpteTBL.6INTEGERR/W1 = hex2 = binary
I40statusSmpte708SampleI40statusSmpteTBL.7INTEGERR/W0 to 258
I40statusSmpte708StreamI40statusSmpteTBL.8INTEGERR/W1 = stream12 = stream2
I40statusSmpteProgStreamI40statusSmpteTBL.9INTEGERR/W1 = stream12 = stream2
I40statusSmpteVbiStreamI40statusSmpteTBL.10INTEGERR/W1 = stream12 = stream2
I40statusSmpteAfdDispI40statusSmpteTBL.11INTEGERR/W1 = text2 = dump
I40statusSmpteAfdModeI40statusSmpteTBL.12INTEGERR/W1 = hex2 = binary
I40statusSmpteAfdStreamI40statusSmpteTBL.13INTEGERR/W1 = stream12 = stream2
I40statusCustomTBLI40statusTBL.9Aggregate--
I40statusCustomSearchDidI40statusCustomTBL.1DisplayStringR/W0 to FF
I40statusCustomSearchSdidI40statusCustomTBL.2DisplayStringR/W-1 to FF
I40statusCustomSearchModeI40statusCustomTBL.3INTEGERR/W1 = hex2 = binary
I40statusCustomSearchYcI40statusCustomTBL.4INTEGERR/W1 = y2 = c
I40statusCustomSearchStreamI40statusCustomTBL.5INTEGERR/W1 = stream12 = stream2
I40statusCustomSearchSetI40statusCustomTBL.6INTEGERR/WO1 (fixed)
I40statusCustomSearchSampleI40statusCustomTBL.7INTEGERR/W0 to 258
I40statusDataTBLI40statusTBL.10Aggregate--
I40statusDataSignalAI40statusDataTBL.1DisplayStringR/OSignal Data
I40statusDataSignalBI40statusDataTBL.2DisplayStringR/OSignal Data
I40statusDataSignalCI40statusDataTBL.3DisplayStringR/OSignal Data
I40statusDataSignalDI40statusDataTBL.4DisplayStringR/OSignal Data
I40statusDataLinkAI40statusDataTBL.5DisplayStringR/OLink Data
I40statusDataLinkBI40statusDataTBL.6DisplayStringR/OLink Data
I40statusDataLinkCI40statusDataTBL.7DisplayStringR/OLink Data
I40statusDataLinkDI40statusDataTBL.8DisplayStringR/OLink Data
I40statusDataFormatAI40statusDataTBL.9DisplayStringR/OFormat Data
I40statusDataFormatBI40statusDataTBL.10DisplayStringR/OFormat Data
I40statusDataFormatCI40statusDataTBL.11DisplayStringR/OFormat Data
  1. Network Control
MIBOIDSYNTAXACCESSVALUE/RANGE
I40statusDataFormatDI40statusDataTBL.12DisplayStringR/OFormat Data
I40statusDataAudioAI40statusDataTBL.13DisplayStringR/OAudio Data
I40statusDataAudioBI40statusDataTBL.14DisplayStringR/OAudio Data
I40statusDataAudioCI40statusDataTBL.15DisplayStringR/OAudio Data
I40statusDataAudioDI40statusDataTBL.16DisplayStringR/OAudio Data
I40statusDataExtrefAI40statusDataTBL.17INTEGERR/O1 = userref2 = default
I40statusDataExtrefStatAI40statusDataTBL.18INTEGERR/O1 = int2 = sdi1a3 = sdi2a4 = sdi1c5 = sdi2c6 = linkA7 = link18 = exthd9 = extbb10 = normal
I40statusDataExtrefHtimeAI40statusDataTBL.19DisplayStringR/OH Phase [us]
I40statusDataExtrefHpixAI40statusDataTBL.20DisplayStringR/OH Phase [pix/dot]
I40statusDataExtrefVlineAI40statusDataTBL.21DisplayStringR/OV Phase
I40statusDataExtrefTotalAI40statusDataTBL.22DisplayStringR/OTotal Phase
I40statusDataExtrefBI40statusDataTBL.23INTEGERR/O1 = userref2 = default
I40statusDataExtrefStatBI40statusDataTBL.24INTEGERR/O1 = int2 = sdi1a3 = sdi2a4 = sdi1c5 = sdi2c6 = linkA7 = link18 = exthd9 = extbb10 = nosignal
I40statusDataExtrefHtimeBI40statusDataTBL.25DisplayStringR/OH Phase [us]
I40statusDataExtrefHpixBI40statusDataTBL.26DisplayStringR/OH Phase [pix/dot]
I40statusDataExtrefVlineBI40statusDataTBL.27DisplayStringR/OV Phase
I40statusDataExtrefTotalBI40statusDataTBL.28DisplayStringR/OTotal Phase
I40statusDataExtrefCI40statusDataTBL.29INTEGERR/O1 = userref2 = default
I40statusDataExtrefStatCI40statusDataTBL40INTEGERR/O1 = int2 = sdi1a3 = sdi2a4 = sdi1c5 = sdi2c6 = linkA7 = link18 = exthd9 = extbb10 = normal
I40statusDataExtrefHtimeCI40statusDataTBL.31DisplayStringR/OH Phase [us]
I40statusDataExtrefHpixCI40statusDataTBL.32DisplayStringR/OH Phase [pix/dot]
I40statusDataExtrefVlineCI40statusDataTBL.33DisplayStringR/OV Phase
I40statusDataExtrefTotalCI40statusDataTBL.34DisplayStringR/OTotal Phase
I40statusDataExtrefDI40statusDataTBL.35INTEGERR/O1 = userref2 = default
I40statusDataExtrefStatDI40statusDataTBL.36INTEGERR/O1 = int2 = sdi1a
  1. Network Control
MIBOIDSYNTAXACCESSVALUE/RANGE
3 = sdi2a4 = sdi1c5 = sdi2c6 = linkA7 = link18 = exthd9 = extbb10 = normal
I40statusDataExtrefHtimeDI40statusDataTBL.37DisplayStringR/OH Phase [us]
I40statusDataExtrefHpixDI40statusDataTBL.38DisplayStringR/OH Phase [pix/dot]
I40statusDataExtrefVlineDI40statusDataTBL.39DisplayStringR/OV Phase
I40statusDataExtrefTotalDI40statusDataTBL.40DisplayStringR/OTotal Phase
I40statusDataAncAudioCtrl1I40statusDataTBL.41INTEGERR/O1 = detect2 = missing
I40statusDataAncAudioCtrl2I40statusDataTBL.42INTEGERR/O1 = detect2 = missing
I40statusDataAncEdhI40statusDataTBL.43INTEGERR/O1 = detect2 = missing
I40statusDataAncLtc1I40statusDataTBL.44INTEGERR/O1 = detect2 = missing
I40statusDataAncLtc2I40statusDataTBL.45INTEGERR/O1 = detect2 = missing
I40statusDataAncVitc1I40statusDataTBL.46INTEGERR/O1 = detect2 = missing
I40statusDataAncVitc2I40statusDataTBL.47INTEGERR/O1 = detect2 = missing
I40statusDataAncPayload1I40statusDataTBL.48INTEGERR/O1 = detect2 = missing
I40statusDataAncPayload2I40statusDataTBL.49INTEGERR/O1 = detect2 = missing
I40statusDataAncEia708708I40statusDataTBL.50INTEGERR/O1 = detect2 = missing
I40statusDataAncEia708608I40statusDataTBL.51INTEGERR/O1 = detect2 = missing
I40statusDataAncEia608I40statusDataTBL.52INTEGERR/O1 = detect2 = missing
I40statusDataAncProgramI40statusDataTBL.53INTEGERR/O1 = detect2 = missing
I40statusDataAncBroadcastI40statusDataTBL.54INTEGERR/O1 = detect2 = missing
I40statusDataAncVbiI40statusDataTBL.55INTEGERR/O1 = detect2 = missing
I40statusDataAncAfd1I40statusDataTBL.56INTEGERR/O1 = detect2 = missing
I40statusDataAncAfd2I40statusDataTBL.57INTEGERR/O1 = detect2 = missing
I40statusDataAncJpnCc1I40statusDataTBL.58INTEGERR/O1 = detect2 = missing
I40statusDataAncJpnCc2I40statusDataTBL.59INTEGERR/O1 = detect2 = missing
I40statusDataAncJpnCc3I40statusDataTBL.60INTEGERR/O1 = detect2 = missing
I40statusDataAncNetq1I40statusDataTBL.61INTEGERR/O1 = detect2 = missing
I40statusDataAncNetq2I40statusDataTBL.62INTEGERR/O1 = detect2 = missing
I40statusDataAncTriggerI40statusDataTBL.63INTEGERR/O1 = detect
  1. Network Control
MIBOIDSYNTAXACCESSVALUE/RANGE
2 = missing
I40statusDataAncUser1I40statusDataTBL.64INTEGERR/O1 = detect2 = missing
I40statusDataAncUser2I40statusDataTBL.65INTEGERR/O1 = detect2 = missing
I40statusDataAncPktPayloadI40statusDataTBL.66DisplayStringR/OPayload ID
I40statusDataAncPktAribNetqStationI40statusDataTBL.67DisplayStringR/OStation Code
I40statusDataAncPktAribNetqVcurrI40statusDataTBL.68DisplayStringR/OVideo Current
I40statusDataAncPktAribNetqVNextI40statusDataTBL.69DisplayStringR/OVideo Next
I40statusDataAncPktAribNetqACurrI40statusDataTBL.70DisplayStringR/OAudio Current
I40statusDataAncPktAribNetqANextI40statusDataTBL.71DisplayStringR/OAudio Next
I40statusDataAncPktAribNetqDCurrI40statusDataTBL.72DisplayStringR/ODownmix Current
I40statusDataAncPktAribNetqDNextI40statusDataTBL.73DisplayStringR/ODownmix Next
I40statusDataAncPktSmpteAfdCodeI40statusDataTBL.74DisplayStringR/OAFD Code
I40statusDataAncPktSmpteAfdFrameI40statusDataTBL.75DisplayStringR/OCoded Frame
I40statusDataAncPktSmpteAfdBarFlgI40statusDataTBL.76DisplayStringR/OBar Data Flags
I40statusDataAncPktSmpteAfdBarVal1I40statusDataTBL.77DisplayStringR/OBar Data Value1
I40statusDataAncPktSmpteAfdBarVal2I40statusDataTBL.78DisplayStringR/OBar Data Value2
I40statusDataFreqDevI40statusDataTBL.79DisplayStringR/O<-100ppm, -100 to +100ppm, >+100ppm
  • I40eyeTBL(7) group
MIBOIDSYNTAXACCESSVALUE/RANGE
I40eyeConfigTBLI40eyeTBL.1Aggregate--
I40eyeModeI40eyeConfigTBL.1INTEGERR/W1 = eye2 = jit
I40eyeIntenI40eyeConfigTBL.2INTEGERR/W-128 to 127
I40eyeScaleIntenI40eyeConfigTBL.3INTEGERR/W-8 to 7
I40eyeColorI40eyeConfigTBL.4INTEGERR/W1 = white2 = yellow3 = cyan4 = green5 = magenta
  1. Network Control
MIBOIDSYNTAXACCESSVALUE/RANGE
6 = red7 = blue
I40eyeScaleColorI40eyeConfigTBL.5INTEGERR/W1 = white2 = yellow3 = cyan4 = green5 = magenta6 = red7 = blue
I40eyeJitIntenI40eyeConfigTBL.6INTEGERR/W-128 to 127
I40eyeJitScaleIntenI40eyeConfigTBL.7INTEGERR/W-8 to 7
I40eyeJitColorI40eyeConfigTBL.8INTEGERR/W1 = white2 = yellow3 = cyan4 = green5 = magenta6 = red7 = blue
I40eyeJitScaleColorI40eyeConfigTBL.9INTEGERR/W1 = white2 = yellow3 = cyan4 = green5 = magenta6 = red7 = blue
I40eyeGainTBLI40eyeTBL.2Aggregate--
I40eyeGainModeI40eyeGainTBL.1INTEGERR/W1 = cal2 = variable
I40eyeGainVarI40eyeGainTBL.2DisplayStringR/W0.50 to 2.00
I40eyeFilterI40eyeGainTBL.3INTEGERR/W1 = filter-100khz2 = filter-10khz3 = filter-1khz4 = filter-100hz5 = filter-10hz6 = filter-timing7 = filter-alignment
I40eyeSweepI40eyeGainTBL.4INTEGERR/W1 = sweep-2ui2 = sweep-4ui3 = sweep-16ui
I40eyeJitGainMagI40eyeGainTBL.5INTEGERR/W1 = x12 = x23 = x8
I40eyeJitGainMag12gI40eyeGainTBL.6INTEGERR/W1 = x12 = x23 = x44 = x16
I40eyeJitFilterI40eyeGainTBL.7INTEGERR/W1 = filter-100khz2 = filter-10khz3 = filter-1khz4 = filter-100hz5 = filter-10hz6 = filter-timing7 = filter-alignment
I40eyeJitSweepI40eyeGainTBL.8INTEGERR/W1 = sweep-1h2 = sweep-2h3 = sweep-1v4 = sweep-2v
I40eyePeakHoldTBLI40eyeTBL.3Aggregate--
  1. Network Control
MIBOIDSYNTAXACCESSVALUE/RANGE
I40eyePeakHoldModeI40eyePeakHoldTBL.1INTEGERR/W1 = off2 = on
I40eyePeakHoldClearI40eyePeakHoldTBL.2INTEGERR/WO1 (fixed)
I40eyeTriggerI40eyePeakHoldTBL.3INTEGERR/W1 = run2 = stop
I40eyeDisplayModeI40eyePeakHoldTBL.4INTEGERR/W1 = single2 = dual
I40eyeJitDisplayModeI40eyePeakHoldTBL.5INTEGERR/W1 = single2 = dual
I40eyeDataTBLI40eyeTBL.4Aggregate--
I40eyeDataAmpI40eyeDataTBL.1DisplayStringR/OAmp
I40eyeDataTrI40eyeDataTBL.2DisplayStringR/OTr
I40eyeDataTfI40eyeDataTBL.3DisplayStringR/OTf
I40eyeDataTjI40eyeDataTBL.4DisplayStringR/OTj
I40eyeDataJI40eyeDataTBL.5DisplayStringR/OJitter
I40eyeDataOrI40eyeDataTBL.6DisplayStringR/OOr
I40eyeDataOfI40eyeDataTBL.7DisplayStringR/OOf
I40eyeDataPeakTjI40eyeDataTBL.8DisplayStringR/OPeak Tj
I40eyeDataPeakJitI40eyeDataTBL.9DisplayStringR/OPeak Jitter
I40eyeHistogramTBLI40eyeTBL.5Aggregate--
I40eyeHistogramModeI40eyeHistogramTBL.1INTEGERR/W1 = off2 = on
I40eyeHistogramIntenI40eyeHistogramTBL.2INTEGERR/W-8 to 7
I40eyeHistogramColorI40eyeHistogramTBL.3INTEGERR/W1 = white2 = yellow3 = cyan4 = green5 = magenta6 = red7 = blue
  • I40audioTBL(8) group
MIBOIDSYNTAXACCESSVALUE/RANGE
I40audioDispModeI40audioTBL.1INTEGERR/W1 = lissajou2 = surround3 = meter4 = status5 = loudness
I40audioMeterTBLI40audioTBL.2Aggregate--
I40audioMeterRangeI40audioMeterTBL.1INTEGERR/W1 = range-60dBFS2 = range-90dBFS3 = mag
I40audioMeterResponseI40audioMeterTBL.2INTEGERR/W1 = truepeak2 = ppm3 = vu
I40audioMeterPpmModeI40audioMeterTBL.3INTEGERR/W1 = mode12 = mode2
I40audioMeterPeakMeterI40audioMeterTBL.4INTEGERR/W1 = true2 = ppm13 = ppm2
I40audioMeterPeakHoldI40audioMeterTBL.5INTEGERR/W0 = hold-05 = hold-500ms10 = hold-1000ms15 = hold-1500ms20 = hold-2000ms25 = hold-2500ms30 = hold-3000ms
  1. Network Control
MIBOIDSYNTAXACCESSVALUE/RANGE
35 = hold-3500ms40 = hold-4000ms45 = hold-4500ms50 = hold-5000ms55 = hold
I40audioMeterOverLevelI40audioMeterTBL.6DisplayStringR/W-40.0 to 0
I40audioMeterWarningLevelI40audioMeterTBL.7DisplayStringR/W-40.0 to 0
I40audioMeterRefLevelI40audioMeterTBL.8DisplayStringR/W-40.0 to 0
I40audioLissajouTBLI40audioTBL.3Aggregate--
I40audioLissajouIntenI40audioLissajouTBL.1INTEGERR/W-8 to 7
I40audioLissajouScaleIntenI40audioLissajouTBL.2INTEGERR/W-8 to 7
I40audioLissajouDisplayI40audioLissajouTBL.3INTEGERR/W1 = multi2 = single
I40audioLissajouFormI40audioLissajouTBL.4INTEGERR/W1 = xy2 = matrix
I40audioLissajouAutoGainI40audioLissajouTBL.5INTEGERR/W1 = off2 = on
I40audioSurroundTBLI40audioTBL.4Aggregate--
I40audioSurroundIntenI40audioSurroundTBL.1INTEGERR/W-8 to 7
I40audioSurroundScaleIntenI40audioSurroundTBL.2INTEGERR/W-8 to 7
I40audioSurroundModeI40audioSurroundTBL.3INTEGERR/W1 = normal2 = phantom
I40audioSurroundAutoGainI40audioSurroundTBL.4INTEGERR/W1 = off2 = on
I40audioStatusTBLI40audioTBL.5Aggregate--
I40audioStatusLogI40audioStatusTBL.1INTEGERR/WO1 (fixed)
I40audioStatusLoggingI40audioStatusTBL.2INTEGERR/W1 = stop2 = start
I40audioStatusLogClearI40audioStatusTBL.3INTEGERR/WO1 (fixed)
I40audioStatusLogModeI40audioStatusTBL.4INTEGERR/W1 = overwrt2 = stop
I40audioStatusDisplayChStatusI40audioStatusTBL.5INTEGERR/WO1 (fixed)
I40audioStatusChStatusI40audioStatusTBL.6INTEGERR/W1 = ch12 = ch23 = ch34 = ch45 = ch56 = ch67 = ch78 = ch89 = ch910 = ch1011 = ch1112 = ch1213 = ch1314 = ch1415 = ch1516 = ch16101 = A1 (A:CH1)102 = A2 (A:CH2)103 = A3 (A:CH3)104 = A4 (A:CH4)105 = A5 (A:CH5)106 = A6 (A:CH6)107 = A7 (A:CH7)108 = A8 (A:CH8)
  1. Network Control
MIBOIDSYNTAXACCESSVALUE/RANGE
109 = A9110 = A10111 = A11112 = A12113 = A13114 = A14115 = A15116 = A16201 = B1 (B:CH1)202 = B2 (B:CH2)203 = B3 (B:CH3)204 = B4 (B:CH4)205 = B5 (B:CH5)206 = B6 (B:CH6)207 = B7 (B:CH7)208 = B8 (B:CH8)209 = B9210 = B10211 = B11212 = B12213 = B13214 = B14215 = B15216 = B16301 = C1302 = C2303 = C3304 = C4305 = C5306 = C6307 = C7308 = C8309 = C9310 = C10311 = C11312 = C12313 = C13314 = C14315 = C15316 = C16401 = D1402 = D2403 = D3404 = D4405 = D5406 = D6407 = D7408 = D8409 = D9410 = D10411 = D11412 = D12413 = D13414 = D14415 = D15416 = D16
I40audioStatusChStatusAlignI40audioStatusTBL.7INTEGERR/W1 = lsb2 = msb
  1. Network Control
MIBOIDSYNTAXACCESSVALUE/RANGE
I40audioStatusDisplayUserBitI40audioStatusTBL.8INTEGERR/WO1 (fixed)
I40audioStatusUserBitI40audioConfigTBL.9INTEGERR/W1 = ch12 = ch23 = ch34 = ch45 = ch56 = ch67 = ch78 = ch89 = ch910 = ch1011 = ch1112 = ch1213 = ch1314 = ch1415 = ch1516 = ch16101 = A1 (A:CH1)102 = A2 (A:CH2)103 = A3 (A:CH3)104 = A4 (A:CH4)105 = A5 (A:CH5)106 = A6 (A:CH6)107 = A7 (A:CH7)108 = A8 (A:CH8)109 = A9110 = A10111 = A11112 = A12113 = A13114 = A14115 = A15116 = A16201 = B1 (B:CH1)202 = B2 (B:CH2)203 = B3 (B:CH3)204 = B4 (B:CH4)205 = B5 (B:CH5)206 = B6 (B:CH6)207 = B7 (B:CH7)208 = B8 (B:CH8)209 = B9210 = B10211 = B11212 = B12213 = B13214 = B14215 = B15216 = B16301 = C1302 = C2303 = C3304 = C4305 = C5306 = C6307 = C7308 = C8309 = C9
  1. Network Control
MIBOIDSYNTAXACCESSVALUE/RANGE
310 = C10311 = C11312 = C12313 = C13314 = C14315 = C15316 = C16401 = D1402 = D2403 = D3404 = D4405 = D5406 = D6407 = D7408 = D8409 = D9410 = D10411 = D11412 = D12413 = D13414 = D14415 = D15416 = D16
I40audioStatusUserBitAlignI40audioStatusTBL.10INTEGERR/W1 = lsb2 = msb
I40audioStatusErrorResetI40audioStatusTBL.11INTEGERR/WO1 (fixed)
I40audioPhonesVolumeI40audioTBL.6INTEGERR/W0 to 63
I40audioDataTBLI40audioTBL.7Aggregate--
I40audioDataStatusLevelCh1I40audioDataTBL.1DisplayStringR/OCh1 Level
I40audioDataStatusLevelCh2I40audioDataTBL.2DisplayStringR/OCh2 Level
I40audioDataStatusLevelCh3I40audioDataTBL.3DisplayStringR/OCh3 Level
I40audioDataStatusLevelCh4I40audioDataTBL.4DisplayStringR/OCh4 Level
I40audioDataStatusLevelCh5I40audioDataTBL.5DisplayStringR/OCh5 Level
I40audioDataStatusLevelCh6I40audioDataTBL.6DisplayStringR/OCh6 Level
I40audioDataStatusLevelCh7I40audioDataTBL.7DisplayStringR/OCh7 Level
I40audioDataStatusLevelCh8I40audioDataTBL.8DisplayStringR/OCh8 Level
I40audioDataStatusLevelCh9I40audioDataTBL.9DisplayStringR/OCh9 Level
I40audioDataStatusLevelCh10I40audioDataTBL.10DisplayStringR/OCh10 Level
I40audioDataStatusLevelCh11I40audioDataTBL.11DisplayStringR/OCh11 Level
I40audioDataStatusLevelCh12I40audioDataTBL.12DisplayStringR/OCh12 Level
I40audioDataStatusLevelCh13I40audioDataTBL.13DisplayStringR/OCh13 Level
I40audioDataStatusLevelCh14I40audioDataTBL.14DisplayStringR/OCh14 Level
I40audioDataStatusLevelCh15I40audioDataTBL.15DisplayStringR/OCh15 Level
I40audioDataStatusLevelCh16I40audioDataTBL.16DisplayStringR/OCh16 Level
I40audioLoudnessTBLI40audioTBL.8Aggregate--
I40audioLoudnessPeriodI40audioLoudnessTBL.1INTEGERR/W1 = period-2min2 = period-10min3 = period-30min4 = period-1hour5 = period-2hour
  1. Network Control
MIBOIDSYNTAXACCESSVALUE/RANGE
6 = period-6hour7 = period-12hour8 = period-24hour
I40audioLoudnessChartClearI40audioLoudnessTBL.2INTEGERR/WO1 (fixed)
I40audioLoudnessMeasureI40audioLoudnessTBL.3INTEGERR/W1 = stop2 = start
I40audioLoudnessMagI40audioLoudnessTBL.4INTEGERR/W1 = off2 = on
  • I40trapTBL(9) group
MIBOIDSYNTAXACCESSVALUE/RANGE
l40trapIpTBLl40trapTBL.1Aggregate--
l40trapIp1TBLl40trapIpTBL.1Aggregate--
l40trapManagerIp1l40trapIp1TBL.1IpAddressR/WIP Address
l40trapManagerIp1Actl40trapIp1TBL.2INTEGERR/W1 = enable2 = disable
l40trapIp2TBLl40trapIpTBL.2Aggregate--
l40trapManagerIp2l40trapIp2TBL.1IpAddressR/WIP Address
l40trapManagerIp2Actl40trapIp2TBL.2INTEGERR/W1 = enable2 = disable
l40trapIp3TBLl40trapIpTBL.3Aggregate--
l40trapManagerIp3l40trapIp3TBL.1IpAddressR/WIP Address
l40trapManagerIp3Actl40trapIp3TBL.2INTEGERR/W1 = enable2 = disable
l40trapIp4TBLl40trapIpTBL.4Aggregate--
l40trapManagerIp4l40trapIp4TBL.1IpAddressR/WIP Address
l40trapManagerIp4Actl40trapIp4TBL.2INTEGERR/W1 = enable2 = disable

20.5.5 Extended TRAP (Variable Binding List)

- index 1

OID: iso(1).org(3).dod(6).internet(1).mgmt(2).mib-2(1).system(1).sysUpTime(3).0

Syntax: TimeTicks

Range: 1 to 4294967295 (overflow occurs if this range is exceeded)

Description: Elapsed time after starting the agent

- index 2

OID: iso(1).org(3).dod(6).internet(1).snmpV2(6).snmpModules(3).snmpMIB(1).snmpMIBObjects(1).snmpTrap(4).snmpTrapOID(1).0

Syntax: OBJECT IDENTIFIER

Range: ---

Description: Trap OID

- index 3

OID: leader(20111).lv5600(40).lv5600ST1(1).l40notificationTBL(0).l40trapStrTBL(2).l40trapCounter(1)

Syntax: Counter32

Range: 1 to 4294967295

Description: The total number of enterprise traps sent after starting up

- index 4

OID: leader(20111).lv5600(40).lv5600ST1(1).l40notificationTBL(0).l40trapStrTBL(2).l40trapInternalTimestamp(2)

Syntax: DisplayString

Range: Up to 20 characters

Description: Date and time of error occurrence

- index 5

OID: leader(20111).lv5600(40).lv5600ST1(1).l40notificationTBL(0).l40trapStrTBL(2).l40trapInputCh(3)

Syntax: INTEGER

Range: a(1), b(2), c(3), d(4)

Description: Input channel where the error occurred (A/B/C/D)

- index 6

OID: leader(20111).lv5600(40).lv5600ST1(1).l40notificationTBL(0).l40trapStrTBL(2).l40trapInputSignal(4)

Syntax: DisplayString

Range: Up to 20 characters

Description: Format information

20. Network Control

- index 7

OID: leader(20111).lv5600(40).lv5600ST1(1).l40notificationTBL(0).
l40trapContentTBL(1).l40trapErrorTBL(1).X
or
leader(20111).lv5600(40).lv5600ST1(1).l40notificationTBL(0).
l40trapContentTBL(1).l40trapNormalTBL(2).X 

Syntax: DisplayString

Range: Up to 16 characters

Description: OID indicating the error and error information character string (see the table below)
When an error occurs, OID and error information character string of I40notificationTBL(0).I40trapContentTBL(1).I40trapErrorTBL(1).X (see the table below)
When an error recovers, OID and error information character string of I40notificationTBL(0).I40trapContentTBL(1). I40trapNormalTBL(2).X (see the table below) 

- index 8

OID: leader(20111).lv5600(40).lv5600ST1(1).l40notificationTBL(0).l40trapStrTBL(2).l40trapCableLen(5) 

Syntax: INTEGER

Range: 1 to 32767

Description: Cable length
Output only when index7 is l40trapContentTBL(1).l40TrapErrorTBL(1).l40trapErrorCableWarn(5). 
  • I40notificationTBL(0) group
MIBOIDSYNTAXACCESSVALUE/RANGE
I40trapContentTBLI40notificationTBL.1--
I40trapErrorTBLI40trapContentTBL.1Aggregate--
I40trapErrorFanI40TrapErrorTBL.1--FAN_STOP
I40trapErrorNoSignalI40TrapErrorTBL.2--NO_SIGNAL
I40trapErrorUnknownI40TrapErrorTBL.3--FORMAT_UNKNOWN
I40trapErrorNTPI40TrapErrorTBL.5--NTP_ERROR
I40trapErrorSdiCrcI40TrapErrorTBL.20--CRC
I40trapErrorSdiEdhI40TrapErrorTBL.21--EDH
I40trapErrorSdiTrsPositionI40TrapErrorTBL.22--TRS_POSITION
I40trapErrorSdiTrsCodeI40TrapErrorTBL.23--TRS_CODE
I40trapErrorSdiIllegalCodeI40TrapErrorTBL.24--ILLEGAL_CODE
I40trapErrorSdiLineNumberI40TrapErrorTBL.25--LINE_NUMBER
I40trapErrorCableErrorI40TrapErrorTBL.26--CABLE_ERROR
I40trapErrorCableWarningI40TrapErrorTBL.27--CABLE_WARNING
I40trapErrorSdiAncChecksumI40TrapErrorTBL.28--CHECK_SUM
I40trapErrorSdiAncParityI40TrapErrorTBL.29--PARITY
I40trapErrorSdiGamutI40TrapErrorTBL.30--GAMUT
I40trapErrorSdiGamutSt2I40TrapErrorTBL.31--GAMUT_ST2
I40trapErrorSdiCompGamutI40TrapErrorTBL.32--CMP_GAMUT
I40trapErrorSdiCompGamutSt2I40TrapErrorTBL.33--CMP_GAMUT_ST2
I40trapErrorSdiFreezeI40TrapErrorTBL.34--FREEZE
I40trapErrorSdiFreezeSt2I40TrapErrorTBL.35--FREEZE_ST2
I40trapErrorSdiBlackI40TrapErrorTBL.36--BLACK
I40trapErrorSdiBlackSt2I40TrapErrorTBL.37--BLACK_ST2
I40trapErrorSdiLevelYI40TrapErrorTBL.38--LEVEL_Y
I40trapErrorSdiLevelYST2I40TrapErrorTBL.39--LEVEL_Y_ST2
I40trapErrorSdiLevelCI40TrapErrorTBL.40--LEVEL_C
I40trapErrorSdiLevelCSt2I40TrapErrorTBL.41--LEVEL_C_ST2
I40trapErrorAudioBchI40TrapErrorTBL.42--AUDIO_BCH
I40trapErrorAudioParityI40TrapErrorTBL.43--AUDIO_PARITY
I40trapErrorAudioDbnI40TrapErrorTBL.44--AUDIO_DBN
I40trapErrorAudioInhibitI40TrapErrorTBL.45--AUDIO_INHIBIT
I40trapErrorAudioSampleI40TrapErrorTBL.46--AUDIO_SAMPLE
I40trapErrorSdiFrequencyI40TrapErrorTBL.47--FREQUENCY
I40trapErrorSdiFormatAlarmI40TrapErrorTBL.48--FORMAT_ALARM
I40trapErrorEye12GCurrentJitterI40TrapErrorTBL.60--EYE_12G_JITTER
I40trapErrorEye3GCurrentJitterI40TrapErrorTBL.62--EYE_3G_JITTER
I40trapErrorEyeHdCurrentJitterI40TrapErrorTBL.63--EYE_HD_JITTER
I40trapErrorEyeSdCurrentJitterI40TrapErrorTBL.64--EYE_SD_JITTER
I40trapErrorEye12GTimingJitterI40TrapErrorTBL.65--EYE_12G_T_JITTER
I40trapErrorEye3GTimingJitterI40TrapErrorTBL.67--EYE_3G_T_JITTER
I40trapErrorEyeHdTimingJitterI40TrapErrorTBL.68--EYE_HD_T_JITTER
I40trapErrorEyeSdTimingJitterI40TrapErrorTBL.69--EYE_SD_T_JITTER
I40trapErrorEye12GDeltaTimeTrTfI40TrapErrorTBL.70--EYE_12G_TR_TF
I40trapErrorEye3GDeltaTimeTrTfI40TrapErrorTBL.72--EYE_3G_TR_TF
I40trapErrorEyeHdDeltaTimeTrTfI40TrapErrorTBL.73 - - EYE_HD_TR_TF
I40trapErrorEyeSdDeltaTimeTrTfI40TrapErrorTBL.74--EYE_SD_TR_TF
I40trapErrorEye12GFalltimeI40TrapErrorTBL.75--EYE_12G_TF
I40trapErrorEye3GFalltimeI40TrapErrorTBL.77--EYE_3G_TF
  1. Network Control
MIBOIDSYNTAXACCESSVALUE/RANGE
I40trapErrorEyeHdFalltimeI40TrapErrorTBL.78--EYE_HD_TF
I40trapErrorEyeSdFalltimeI40TrapErrorTBL.79--EYE_SD_TF
I40trapErrorEye12GRisetimeI40TrapErrorTBL.80--EYE_12G_TR
I40trapErrorEye3GRisetimeI40TrapErrorTBL.82--EYE_3G_TR
I40trapErrorEyeHdRisetimeI40TrapErrorTBL.83--EYE_HD_TR
I40trapErrorEyeSdRisetimeI40TrapErrorTBL.84--EYE_SD_TR
I40trapErrorEye12GAMPI40TrapErrorTBL.85--EYE_12G_AMP
I40trapErrorEye3GAMPI40TrapErrorTBL.87--EYE_3G_AMP
I40trapErrorEyeHdAmpI40TrapErrorTBL.88--EYE_HD_AMP
I40trapErrorEyeSdAmpI40TrapErrorTBL.89--EYE_SD_AMP
I40trapErrorEye12GOverShoot RisingI40TrapErrorTBL.90--EYE_12G_OR
I40trapErrorEye3GOverShootRisingI40TrapErrorTBL.92--EYE_3G_OR
I40trapErrorEyeHdOverShootRisingI40TrapErrorTBL.93 - - EYE_HD_OR
I40trapErrorEyeSdOverShootRisingI40TrapErrorTBL.94--EYE_SD_OR
I40trapErrorEye12GOverShoot FallingI40TrapErrorTBL.95--EYE_12G_OF
I40trapErrorEye3GOverShootFallingI40TrapErrorTBL.97--EYE_3G_OF
I40trapErrorEyeHdOverShootFallingI40TrapErrorTBL.98 - - EYE_HD_OF
I40trapErrorEyeSdOverShootFallingI40TrapErrorTBL.99--EYE_SD_OF
I40trapErrorLogAudioValidityI40TrapErrorTBL.120--VALIDITY:XX (where XX is the channel on which the error is occurring in hexadecimal notation)
I40trapErrorLogAudioCrcI40TrapErrorTBL.121--CRC:XX (where XX is the channel on which the error is occurring in hexadecimal notation)
I40trapErrorLogAudioClipI40TrapErrorTBL.122--CLIP:XX (where XX is the channel on which the error is occurring in hexadecimal notation)
I40trapErrorLogAudioMuteI40TrapErrorTBL.123--MUTE:XX (where XX is the channel on which the error is occurring in hexadecimal notation)
I40trapErrorLogAudioLevelOverI40TrapErrorTBL.124--LEVEL_OV:XX (where XX is the channel on which the error is occurring in hexadecimal notation)
I40trapErrorLogAudioParityI40TrapErrorTBL.125--PARITY:XX (where XX is the channel on which the error is occurring in hexadecimal notation)
I40trapErrorLogAudioCodeViolationI40TrapErrorTBL.126--CODE_VIL:XX (where XX is the channel on which the error is occurring in hexadecimal notation)
I40trapNormalTBLI40trapContentTBL.2Aggregate--
I40trapNormalDetectI40TrapNormalTBL.4--FORMAT_DETECT
I40trapNormalSdiCrcI40TrapNormalTBL.20--CRC
  1. Network Control
MIBOIDSYNTAXACCESSVALUE/RANGE
I40trapNormalSdiEdhI40TrapNormalTBL.21--EDH
I40trapNormalSdiTrsPositionI40TrapNormalTBL.22--TRS_POSITION
I40trapNormalSdiTrsCodeI40TrapNormalTBL.23--TRS_CODE
I40trapNormalSdiIllegalCodeI40TrapNormalTBL.24--ILLEGAL_CODE
I40trapNormalSdiLineNumberI40TrapNormalTBL.25--LINE_NUMBER
I40trapNormalCableErrorI40TrapNormalTBL.26--CABLE_ERROR
I40trapNormalCableWarningI40TrapNormalTBL.27--CABLE_WARNING
I40trapNormalSdiAncChecksumI40TrapNormalTBL.28 - -CHECK_SUM
I40trapNormalSdiAncParityI40TrapNormalTBL.29--PARITY
I40trapNormalSdiGamutI40TrapNormalTBL.30--GAMUT
I40trapNormalSdiGamutSt2I40TrapNormalTBL.31--GAMUT_ST2
I40trapNormalSdiCompGamutI40TrapNormalTBL.32--CMP_GAMUT
I40trapNormalSdiCompGamutSt2I40TrapNormalTBL.33 - -CMP_GAMUT_ST2
I40trapNormalSdiFreezeI40TrapNormalTBL.34--FREEZE
I40trapNormalSdiFreezeSt2I40TrapNormalTBL.35--FREEZE_ST2
I40trapNormalSdiBlackI40TrapNormalTBL.36--BLACK
I40trapNormalSdiBlackSt2I40TrapNormalTBL.37--BLACK_ST2
I40trapNormalSdiLevelYI40TrapNormalTBL.38--LEVEL_Y
I40trapNormalSdiLevelYST2I40TrapNormalTBL.39--LEVEL_Y_ST2
I40trapNormalSdiLevelCI40TrapNormalTBL.40--LEVEL_C
I40trapNormalSdiLevelCSt2I40TrapNormalTBL.41--LEVEL_C_ST2
I40trapNormalSdiAudioBchI40TrapNormalTBL.42--AUDIO_BCH
I40trapNormalSdiAudioParityI40TrapNormalTBL.43--AUDIO_PARITY
I40trapNormalSdiAudioDbnI40TrapNormalTBL.44--AUDIO_DBN
I40trapNormalSdiAudioInhibitI40TrapNormalTBL.45--AUDIO_INHIBIT
I40trapNormalSdiAudioSampleI40TrapNormalTBL.46--AUDIO_SAMPLE
I40trapNormalSdiFrequencyI40TrapNormalTBL.47--FREQUENCY
I40trapNormalSdiFormatAlarmI40TrapNormalTBL.48--FORMAT_ALARM
I40trapNormalEye12GCurrentJitterI40trapNormalTBL.60 - -EYE_12G_JITTER
I40trapNormalEye3GCurrentJitterI40trapNormalTBL.62--EYE_3G_JITTER
I40trapNormalEyeHdCurrentJitterI40trapNormalTBL.63--EYE_HD_JITTER
I40trapNormalEyeSdCurrentJitterI40trapNormalTBL.64 - -EYE_SD_JITTER
I40trapNormalEye12GTimingJitterI40trapNormalTBL.65--EYE_12G_T_JITTER
I40trapNormalEye3GTimingJitterI40trapNormalTBL.67 - -EYE_3G_T_JITTER
I40trapNormalEyeHdTimingJitterI40trapNormalTBL.68 - -EYE_HD_T_JITTER
I40trapNormalEyeSdTimingJitterI40trapNormalTBL.69 - -EYE_SD_T_JITTER
I40trapNormalEye12GDeltaTimeTrTfI40trapNormalTBL.70--EYE_12G_TR_TF
I40trapNormalEye3GDeltaTimeTrTfI40trapNormalTBL.72 - -EYE_3G_TR_TF
I40trapNormalEyeHdDeltaTimeTrTfI40trapNormalTBL.73--EYE_HD_TR_TF
I40trapNormalEyeSdDeltaTimeTrTfI40trapNormalTBL.74 - -EYE_SD_TR_TF
I40trapNormalEye12GFalltimeI40trapNormalTBL.75--EYE_12G_TF
I40trapNormalEye3GFalltimeI40trapNormalTBL.77--EYE_3G_TF
  1. Network Control
MIBOIDSYNTAXACCESSVALUE/RANGE
I40trapNormalEyeHdFalltimeI40trapNormalTBL.78--EYE_HD_TF
I40trapNormalEyeSdFalltimeI40trapNormalTBL.79--EYE_SD_TF
I40trapNormalEye12GRisetimeI40trapNormalTBL.80--EYE_12G_TR
I40trapNormalEye3GRisetimeI40trapNormalTBL.82--EYE_3G_TR
I40trapNormalEyeHdRisetimeI40trapNormalTBL.83--EYE_HD_TR
I40trapNormalEyeSdRisetimeI40trapNormalTBL.84--EYE_SD_TR
I40trapNormalEye12GAmpI40trapNormalTBL.85--EYE_12G_AMP
I40trapNormalEye3GAmpI40trapNormalTBL.87--EYE_3G_AMP
I40trapNormalEyeHdAmpI40trapNormalTBL.88--EYE_HD_AMP
I40trapNormalEyeSdAmpI40trapNormalTBL.89--EYE_SD_AMP
I40trapNormalEye12GOverShootRisingI40trapNormalTBL.90 - -EYE_12G_OR
I40trapNormalEye3GOverShootRisingI40trapNormalTBL.92 - -EYE_3G_OR
I40trapNormalEyeHdOverShootRisingI40trapNormalTBL.93 - -EYE_HD_OR
I40trapNormalEyeSdOverShootRisingI40trapNormalTBL.94 - -EYE_SD_OR
I40trapNormalEye12GOverShootFallingI40trapNormalTBL.95--EYE_12G_OF
I40trapNormalEye3GOverShootFallingI40trapNormalTBL.97 - -EYE_3G_OF
I40trapNormalEyeHdOverShootFallingI40trapNormalTBL.98 - -EYE_HD_OF
I40trapNormalEyeSdOverShootFallingI40trapNormalTBL.99 - -EYE_SD_OF
I40trapNormalLogAudioValidityI40trapNormalTBL.120--VALIDITY
I40trapNormalLogAudioCrcI40trapNormalTBL.121--CRC
I40trapNormalLogAudioClipI40trapNormalTBL.122--CLIP
I40trapNormalLogAudioMuteI40trapNormalTBL.123--MUTE
I40trapNormalLogAudioLevelOverI40trapNormalTBL.124--LEVEL_OV
I40trapNormalLogAudioParityI40trapNormalTBL.125--PARITY
I40trapNormalLogAudioCodeViolationI40trapNormalTBL.126 - -CODE_VIL
I40trapStrTBLI40notificationTBL.2Aggregate--
I40trapCounterI40trapStrTBL.1INTEGERR/O1 to 4294967295
I40trapInternalTimestampI40trapStrTBL.2DisplayStringR/ODate and time
I40trapInputChI40trapStrTBL.3INTEGERR/O1 = a2 = b3 = c4 = d5:no-assignment
I40trapInputSignalI40trapStrTBL.4DisplayStringR/OSignal format
I40trapCableLenI40trapStrTBL.5INTEGERR/O0 to 32767
  • Trap Information Table
Trap No. (*1)Trap Information Character StringDescriptiontrapControlType "NO_ERROR" Judgment
ErrorNormal
1 FANSTOP Fan stop statusdetection Y N NotificationN
2NO_SIGNALNo input signal detectionYNNotifica tionN
3FORMAT_UNKNOWNUnknown signal format detectionYNNotifica tionN
4FORMAT_DETECTUnprocessable signal format detectionNYNotifica tionN
5NTP_ERRORNTP connection status detectionYNNotifica tionN
20CRCCRC error detectionYYStatus monitor ingY
21EDHEDH error detectionYYStatus monitor ingY
22TRS_POSITIONTRS Pos error detectionYYStatus monitor ingY
23TRS_CODETRS Code error detectionYYStatus monitor ingY
24ILLEGAL_CODEIllegal command error detectionYYStatus monitor ingY
25LINE_NUMBERLine number error detectionYYStatus monitor ingY
26CABLE_ERRORCable length measurement error detectionYYStatus monitor ingY
27CABLE_WARNINGCable length measurement warning detectionYYStatus monitor ingY
28CHECK_SUMChecksum error detectionYYStatus monitor ingY
29PARITYParity error detectionYYStatus monitor ingY
30GAMUTGamut error detectionYYStatus monitor ingY
31GAMUT_ST2Gamut error detection (stream2)YYStatus monitor ingY
32CMP_GAMUTComposite gamut error detectionYYStatus monitor ingY
33CMP_GAMUT_ST2Composite gamut error detection (stream2)YYStatus monitor ingY
34FREEZEFreeze error detectionYYStatus monitor ingY
  1. Network Control
Trap No. (*1)Trap Information Character StringDescriptiontrapControlType "NO_ERROR" Judgment
ErrorNormal
35FREEZE_ST2Freeze error detection (stream2)YYStatus monitoring
36BLACKBlack error detectionYYStatus monitoring
37BLACK_ST2Black error detection (stream2)YYStatus monitoring
38LEVEL_YLuminance level error detectionYYStatus monitoring
39LEVEL_Y_ST2Luminance level error detection (stream2)Y YStatus monitoringY
40LEVEL_CChrominance level error detectionYYStatus monitoring
41LEVEL_C_ST2Chrominance level error detection (stream2)Y YStatus monitoringY
42AUDIO_BCH(EMB AUDIO) BCH error detectionYYStatus monitoring
43AUDIO_PARITY(EMB AUDIO) PARITY error detectionYYStatus monitoring
44AUDIO_DBN(EMB AUDIO) DBN error detectionYYStatus monitoring
45AUDIO_INHIBIT(EMB AUDIO) INH error detectionYYStatus monitoring
46AUDIO_SAMPLE(EMB AUDIO) SAMPLE error detectionYYStatus monitoring
47FREQUENCYFREQUENCY error detectionYYStatus monitoring
48FORMAT_ALARMFormat alarm detectionYYStatus monitoring
60EYE_12G_JITTER(EYE) Current jitter error detection 12GYYStatus monitoring
62EYE_3G_JITTER(EYE) Current jitter error detection 3GYYStatus monitoring
63EYE_HD_JITTER(EYE) Current jitter error detection HDYYStatus monitoring
64EYE_SD_JITTER(EYE) Current jitter error detection SDYYStatus monitoring
65EYE_12G_T_JITTER(EYE) Timing jitter error detection 12GYYStatus monitor
  1. Network Control
Trap No. (*1)Trap Information Character StringDescriptiontrapControlType "NO_ERROR" Judgment
ErrorNormal
ing
67EYE_3G_T_JITTER(EYE) Timing jitter error detection 3GYYStatus monitoring
68EYE_HD_T_JITTER(EYE) Timing jitter error detection HDYYStatus monitoring
69EYE_SD_T_JITTER(EYE) Timing jitter error detection SDYYStatus monitoring
70EYE_12G_TR_TF(EYE) Delta Time error detection 12GYYStatus monitoring
72EYE_3G_TR_TF(EYE) Delta Time error detection 3GYYStatus monitoring
73EYE_HD_TR_TF(EYE) Delta Time error detection HDYYStatus monitoring
74EYE_SD_TR_TF(EYE) Delta Time error detection SDYYStatus monitoring
75EYE_12G_TF(EYE) Fall Time error detection 12GYYStatus monitoring
77EYE_3G_TF(EYE) Fall Time error detection 3GYYStatus monitoring
78EYE_HD_TF(EYE) Fall Time error detection HDYYStatus monitoring
79EYE_SD_TF(EYE) Fall Time error detection SDYYStatus monitoring
80EYE_12G_TR(EYE) Rise Time error detection 12GYYStatus monitoring
82EYE_3G_TR(EYE) Rise Time error detection 3GYYStatus monitoring
83EYE_HD_TR(EYE) Rise Time error detection HDYYStatus monitoring
84EYE_SD_TR(EYE) Rise Time error detection SDYYStatus monitoring
85EYE_12G_AMP(EYE) Amplitude error detection 12GYYStatus monitoring
87EYE_3G_AMP(EYE) Amplitude error detection 3GYYStatus monitoring
88EYE_HD_AMP(EYE) Amplitude error detection HDYYStatus monitoring
89EYE_SD_AMP(EYE) Amplitude error detection SDYYStatus
  1. Network Control
Trap No. (*1)Trap Information Character StringDescriptiontrapControlType "NO_ERROR" Judgment
ErrorNormal
monitoring
90EYE_12G_OR(EYE) Overshoot Rising error detection 12GY YStatusmonitoring
92EYE_3G_OR(EYE) Overshoot Rising error detection 3GY YStatusmonitoring
93EYE_HD_OR(EYE) Overshoot Rising error detection HDY YStatusmonitoring
94EYE_SD_OR(EYE) Overshoot Rising error detection SDY YStatusmonitoring
95EYE_12G_OF(EYE) Overshoot Falling error detection 12GY YStatusmonitoring
97EYE_3G_OF(EYE) Overshoot Falling error detection 3GY YStatusmonitoring
98EYE_HD_OF(EYE) Overshoot Falling error detection HDY YStatusmonitoring
99EYE_SD_OF(EYE) Overshoot Falling error detection SDY YStatusmonitoring
120VALIDITY(AUDIO) VALIDITY error detectionYYStatus monitoring
121CRC(AUDIO) CRC error detectionYYStatus monitoring
122CLIP(AUDIO) CLIP error detectionYYStatus monitoring
123MUTE(AUDIO) MUTE error detectionYYStatus monitoring
124LEVEL_OV(AUDIO) LEVEL error detectionYYStatus monitoring
125PARITY(AUDIO) PARITY error detectionYYStatus monitoring
1000 (*2)NO_ERROR(AUDIO) CODE VIOLATION error detectionNY-

*1 Each OID number of I40TrapErrorTBL(1) and I40TrapNormalTBL(2) of I40trapContentTBL(1)
*2 I40trapNormalNoError(60) is only defined for I40trapNormalTBL(2) and is not available for I40trapErrorTBL(1).

21. MENU TREE

21. MENU TREE

This chapter shows the menu trees that correspond to each key.

The default settings are underlined.

The menus and default values that are displayed vary depending on the instrument's settings, the configuration of options, and whether a USB memory device is connected to the instrument.

21.1 INPUT Menu

Leader LV5600 - INPUT Menu - 1

flowchart
graph TD
    INPUT --> F1
    F1 --> A["ON"]
    A --> (ON/OFF)
    F2 --> B["OFF"]
    B --> (ON/OFF)
    F3 --> C["OFF"]
    C --> (ON/OFF)
    F4 --> D["OFF"]
    D --> (ON/OFF)
    F1 --> A-B["ON"]
    A-B --> (ON/OFF)
    F2 --> C-D["OFF"]
    C-D --> (ON/OFF)
    F1 --> A-D["ON"]
    A-D --> (ON)
    F6 --> OPERATE
    F6 --> CHMODE
    F6 --> COMMON
    F7 --> DISPLAY
    F7 --> SINGLE
    DISPLAY --> SINGLE["SINGLE/SIMUL"]

21.2 SYS Menu
Leader LV5600 - INPUT Menu - 2

flowchart
graph TD
    A["SYS"] --> B["F1"]
    A --> C["SIGNAL IN OUT"]
    C --> D["F1"]
    C --> E["COMPLETE"]
    C --> F["F2"]
    F --> G["PREV TAB"]
    C --> H["F3"]
    H --> I["NEXT TAB"]
    C --> J["F7"]
    J --> K["up menu"]
    A --> L["F2"]
    L --> M["SYSTEM SETUP"]
    M --> N["F1"]
    M --> O["COMPLETE"]
    M --> P["F2"]
    P --> Q["PREV TAB"]
    M --> R["F3"]
    R --> S["NEXT TAB"]
    M --> T["F4"]
    T --> U["READ ONLY COMMUNITY"]
    U --> V["F1"]
    U --> W["CLEAR ALL"]
    U --> X["F2"]
    X --> Y["DELETE"]
    U --> Z["F3"]
    Z --> AA["INSERT"]
    U --> AB["F4"]
    AB --> AC["<="]
    U --> AD["F5"]
    AD --> AE["=>"]
    U --> AF["F6"]
    AF --> AG["CHAR SET"]
    U --> AH["F7"]
    AH --> AI["up menu"]
  1. MENU TREE
    Leader LV5600 - INPUT Menu - 3
flowchart
graph TD
    A["F5"] --> B["READ WRITE COMMUNITY"]
    B --> C["F1"]
    C --> D["CLEAR ALL"]
    B --> E["F2"]
    E --> F["DELETE"]
    B --> G["F3"]
    G --> H["INSERT"]
    B --> I["F4"]
    I --> J["<="]
    B --> K["F5"]
    K --> L["=>"]
    B --> M["F6"]
    M --> N["CHAR SET"]
    B --> O["F7"]
    O --> P["up menu"]
    A --> Q["F5"] --> R["CAMERA ID LOCAL LABEL INPUT"]
    R --> S["F1"]
    S --> T["CLEAR ALL"]
    R --> U["F2"]
    U --> V["DELETE"]
    R --> W["F3"]
    W --> X["INSERT"]
    R --> Y["F4"]
    Y --> Z["<="]
    R --> AA["F5"]
    AA --> AB["=>"]
    R --> AC["F6"]
    AC --> AD["CHAR SET"]
    R --> AE["F7"]
    AE --> AF["up menu"]
  1. MENU TREE
    Leader LV5600 - INPUT Menu - 4
flowchart
graph TD
    A["F5"] --> B["TALLY EXT COMMENT INPUT"]
    B --> C["F1"]
    C --> D["CLEAR ALL"]
    B --> E["F2"]
    E --> F["DELETE"]
    B --> G["F3"]
    G --> H["INSERT"]
    B --> I["F4"]
    I --> J["<="]
    B --> K["F5"]
    K --> L["=>"]
    B --> M["F6"]
    M --> N["CHAR SET"]
    B --> O["F7"]
    O --> P["up menu"]
    A --> Q["F5"] --> R["REMOTE LABEL INPUT"]
    R --> S["F1"]
    S --> T["CLEAR ALL"]
    R --> U["F2"]
    U --> V["DELETE"]
    R --> W["F3"]
    W --> X["INSERT"]
    R --> Y["F4"]
    Y --> Z["<="]
    R --> AA["F5"]
    AA --> AB["=>"]
    R --> AC["F6"]
    AC --> AD["CHAR SET"]
    R --> AE["F7"]
    AE --> AF["up menu"]
    A --> AG["F6"] --> AH["USB MEMORY"]
    AH --> AI["F1"]
    AI --> AJ["MIB FILE COPY"]
    AJ --> AK["F1"] --> AL["OVER WRITE YES"]
    AJ --> AM["F3"] --> AN["OVER WRITE NO"]
    A --> AO["F7"] --> AP["up menu"]
  1. MENU TREE
    Leader LV5600 - INPUT Menu - 5
flowchart
graph TD
    A["F3"] --> B["SYSTEM INFO"]
    C["F4"] --> D["LICENSE"]
    B --> E["F7"]
    D --> F["F1"]
    E --> G["up menu"]
    F --> H["CLEAR"]
    D --> I["F3"]
    I --> J["REGISTER"]
    D --> K["F5"]
    K --> L["REMOVE"]
    D --> M["F7"]
    M --> N["up menu"]
    O["F5"] --> P["LCD BACK LIGHT 28"]
    Q["F6"] --> R["LCD OFF"]
    S["F7"] --> T["INITIALIZE"]
    T --> U["F1"]
    U --> V["PARAMETER INIT YES"]
    T --> W["F2"]
    W --> X["LAYOUT INIT YES"]
    T --> Y["F3"]
    Y --> Z["OPERATE INIT YES"]
    T --> AA["F4"]
    AA --> AB["ALL INIT YES"]
    T --> AC["F5"]
    AC --> AD["INIT CANCEL"]

21. MENU TREE

21.3 CAP Menu
Leader LV5600 - MENU TREE - 1

flowchart
graph TD
    A["CAP"] --> B["F1"]
    A --> C["TRIGGER MANUAL (MANUAL/ERROR)"]
    B --> D["F2"]
    B --> E["REFRESH"]
    C --> F["F3"]
    C --> G["DISPLAY REAL (REAL/BOTH/HOLD)"]
    D --> H["F3"]
    D --> I["DISPLAY REAL (REAL/REPLAY/BOTH/HOLD)"]
    E --> J["F3"]
    E --> K["DISPLAY REAL (REAL/BOTH/HOLD)"]
    F --> L["F6"]
    F --> M["USB MEMORY"]
    M --> N["F1"]
    M --> O["AUTO FILENAME ON (ON/OFF)"]
    N --> P["F2"]
    N --> Q["NAME INPUT"]
    Q --> R["F1"]
    Q --> S["CLEAR ALL"]
    R --> T["F2"]
    S --> U["DELETE"]
    T --> V["F4"]
    U --> W["<="]
    V --> X["F5"]
    W --> Y["=>"]
    X --> Z["F6"]
    Y --> AA["CHAR SET"]
    Z --> AB["F7"]
    AA --> AC["up menu"]
  1. MENU TREE
    Leader LV5600 - MENU TREE - 2
flowchart
graph TD
    A["F3 STORE"] --> B["F1 OVER WR YES"]
    C["F3 STORE"] --> D["F3 OVER WR NO"]
    E["F4 DELETE FILE"] --> F["F1 DELETE YES"]
    G["F5 RECALL"] --> H["F3 DELETE NO"]
    I["F6 SELECT CH"] --> J["F4 DELETE FILE"]
    K["F7 up menu"] --> L["F7 up menu"]
    M["F7 SELECT CH"] --> N["F7 SELECT CH"]
    style A fill:#f9f,stroke:#333
    style C fill:#f9f,stroke:#333
    style E fill:#f9f,stroke:#333
    style G fill:#f9f,stroke:#333
    style I fill:#f9f,stroke:#333
    style K fill:#f9f,stroke:#333
    style M fill:#f9f,stroke:#333
    style N fill:#f9f,stroke:#333

21.4 MEM Menu
Leader LV5600 - MENU TREE - 3

flowchart
graph TD
    A["MEM"] --> B["F1"]
    A --> C["COMMENT INPUT"]
    C --> D["F1"]
    C --> E["F2"]
    C --> F["F3"]
    C --> G["F4"]
    C --> H["F5"]
    C --> I["F6"]
    C --> J["F7"]
    C --> K["UP menu"]
    B --> L["F2"]
    B --> M["STORE"]
    M --> N["F1"]
    M --> O["F3"]
    M --> P["F7"]
    M --> Q["OVER WR YES"]
    M --> R["OVER WR NO"]
    M --> S["up menu"]
    L --> T["F3"]
    L --> U["DELETE"]
    U --> V["F1"]
    U --> W["F3"]
    U --> X["DELETE YES"]
    U --> Y["DELETE NO"]
    T --> Z["F5"]
    T --> AA["ALL COPY USB->INT"]
    AA --> AB["F1"]
    AA --> AC["F3"]
    AA --> AD["COPY USB->INT YES"]
    AA --> AE["COPY USB->INT NO"]
    T --> AF["F6"]
    T --> AG["ALL COPY INT->USB"]
    AG --> AH["F1"]
    AG --> AI["F3"]
    AG --> AJ["COPY INT->USB YES"]
    AG --> AK["COPY INT->USB NO"]

21.5 RECALL Menu
Leader LV5600 - MENU TREE - 4

flowchart
graph TD
    A["RECALL"] --> B["F1"]
    A --> C["F2"]
    A --> D["F3"]
    A --> E["F4"]
    A --> F["F5"]
    A --> G["F6"]
    A --> H["F7"]
    B --> I["No.1"]
    C --> J["No.2"]
    D --> K["No.3"]
    E --> L["No.4"]
    F --> M["No.5"]
    G --> N["No.6"]
    H --> O["more"]
    H --> P["..."]
    P --> Q["F1"]
    P --> R["F2"]
    P --> S["F3"]
    P --> T["F4"]
    P --> U["F5"]
    P --> V["F6"]
    P --> W["F7"]
    Q --> X["No.55"]
    R --> Y["No.56"]
    S --> Z["No.57"]
    T --> AA["No.58"]
    U --> AB["No.59"]
    V --> AC["No.60"]
    W --> AD["more"]

21. MENU TREE

21.6 WFM Menu
Leader LV5600 - MENU TREE - 1

flowchart
graph TD
    A["WFM"] --> B["F1"]
    B --> C["WFM INTEN/CONFIG"]
    C --> D["F1"]
    D --> E["EXTERNAL SYNC OFF (ON/OFF)"]
    E --> F["F2"]
    F --> G["WFM MODE"]
    G --> H["F1"]
    H --> I["WFM MODE PARADE (OVERLAY/PARADE)"]
    H --> J["F2"]
    J --> K["Y ON (ON/OFF)"]
    H --> L["F2"]
    L --> M["G ON (ON/OFF)"]
    H --> N["F2"]
    N --> O["R ON (ON/OFF)"]
    H --> P["F2"]
    P --> Q["X ON (ON/OFF)"]
    H --> R["F3"]
    R --> S["Cb ON (ON/OFF)"]
    H --> T["F3"]
    T --> U["B ON (ON/OFF)"]
    H --> V["F3"]
    V --> W["G ON (ON/OFF)"]
    H --> X["F3"]
    X --> Y["Y ON (ON/OFF)"]
    H --> Z["F4"]
    Z --> AA["Cr ON (ON/OFF)"]
    H --> AB["F4"]
    AB --> AC["R ON (ON/OFF)"]
    H --> AD["F4"]
    AD --> AE["B ON (ON/OFF)"]
    H --> AF["F4"]
    AF --> AG["Z ON (ON/OFF)"]
    H --> AH["F5"]
    AH --> AI["4Y PARADE OFF (ON/OFF)"]
    H --> AJ["F5"]
    AJ --> AK["3G-B-DS DISPLAY ALIGN (STREAM1/STREAM2/MIX/ALIGN)"]
    H --> AL["F6"]
    AL --> AM["INPUT SELECT"]
    H --> AN["F7"]
    AN --> AO["up menu"]

    C --> AP["F3"]
    AP --> AQ["WFM INTENSITY 0 (-128 ~ 0 ~ 127)"]
    C --> AR["F3"]
    AR --> AS["EXT.SYNC INTENSITY 0 (-128 ~ 0 ~ 127)"]
    C --> AT["F4"]
    AT --> AU["WFM COLOR"]
    AU --> AV["F1"]
    AV --> AW["STREAM1 COLOR WHITE (WHITE/YELLOW/CYAN/GREEN/MAGENTA/RED/BLUE/MULTI)"]
    AU --> AX["F2"]
    AX --> AY["STREAM2 COLOR WHITE (WHITE/YELLOW/CYAN/GREEN/MAGENTA/RED/BLUE/MULTI)"]
    AU --> AZ["F6"]
    AZ --> BA["INPUT SELECT"]
    AU --> BB["F7"]
    BB --> BC["up menu"]
  1. MENU TREE
    Leader LV5600 - MENU TREE - 2
flowchart
graph TD
    A["EXT.SYNC COLOR WHITE"] --> B["F1"]
    A --> C["F2"]
    A --> D["F3"]
    A --> E["F6"]
    A --> F["F7"]
    B --> G["SCALE INTEN Δ"]
    C --> H["SCALE COLOR YELLOW"]
    D --> I["SCALE SETTING"]
    E --> J["INPUT SELECT"]
    F --> K["up menu"]
    G --> L["F1"]
    H --> M["F2"]
    I --> N["F3"]
    J --> O["F4"]
    K --> P["F5"]
    L --> Q["SCALE UNIT V"]
    M --> R["75% COLOR SCALE OFF"]
    N --> S["SCALE DISPLAY MAIN"]
    O --> T["REF. LEVEL [%"] 50.0]
    P --> U["REF. LEVEL [%"] 50.0]
    Q --> V["ON / OFF / MAIN / HDR / BOTH"]
    R --> W["ON / OFF / MAIN / HDR / BOTH"]
    S --> X["ON / OFF / MAIN / HDR / BOTH"]
    T --> Y["ON / OFF / MAIN / HDR / BOTH"]
    U --> Z["ON / OFF / MAIN / HDR / BOTH"]
    V --> AA["0.0 ~ Ref.level ~ 100.0"]
    W --> AB["0.0 ~ 50.0 ~ 100.0"]
    X --> AC["0.0 ~ 50.0 ~ 100.0"]
    Y --> AD["INPUT SELECT"]
    Z --> AE["up menu"]

    F["GAIN"] --> F1["F1"]
    F --> F2["F2"]
    F --> F3["F3"]
    F --> F4["F4"]
    F --> F5["F5"]
    F --> F6["F6"]
    F --> F7["F7"]

    G["GAIN VARIABLE CAL"] --> G1["(CAL / VARIABLE)"]
    H["GAIN MAG x1"] --> H1["(x1 / x5 / x10)"]
    I["GAIN VARIABLE CAL"] --> I1["(CAL / VARIABLE)"]
    J["GAIN MAG x1"] --> J1["(x1 / x5 / x10)"]
    K["GAIN VARIABLE CAL"] --> K1["(CAL / VARIABLE)"]
    L["GAIN VARIABLE Select"] --> L1["(CAL / VARIABLE)"]
    M["GAIN VARIABLE Select"] --> M1["(CAL / VARIABLE)"]
    N["GAIN VARIABLE Select"] --> N1["(CAL / VARIABLE)"]
    O["GAIN VARIABLE Select"] --> O1["(CAL / VARIABLE)"]
    P["GAIN VARIABLE Select"] --> P1["(CAL / VARIABLE)"]
    Q["GAIN VARIABLE Select"] --> Q1["(CAL / VARIABLE)"]
    R["GAIN VARIABLE Select"] --> R1["(CAL / VARIABLE)"]
    S["GAIN VARIABLE Select"] --> S1["(CAL / VARIABLE)"]
    T["GAIN VARIABLE Select"] --> T1["(CAL / VARIABLE)"]
    U["GAIN VARIABLE Select"] --> U1["(CAL / VARIABLE)"]
    V["GAIN VARIABLE Select"] --> V1["(CAL / VARIABLE)"]
    W["GAIN VARIABLE Select"] --> W1["(CAL / VARIABLE)"]
  1. MENU TREE
    Leader LV5600 - MENU TREE - 3
flowchart
graph TD
    A["F3"] --> B["Sweep"]
    B --> C["F1"]
    C --> D["H SWEEP"]
    C --> E["1H"]
    C --> F["V SWEEP"]
    C --> G["IV"]
    C --> H["Sweep MAG x1"]
    C --> I["FIELD FIELD1"]
    C --> J["BLANKING REMOVE"]
    C --> K["INPUT SELECT"]
    C --> L["up menu"]

    M["F4"] --> N["CURSOR"]
    N --> O["F1"]
    O --> P["CURSOR OFF"]
    O --> Q["XY SELECT Y"]
    Q --> R["X UNIT sec"]
    R --> S["Y UNIT mV"]
    S --> T["FD VALUE REF"]
    T --> U["REF SET sec"]
    U --> V["CURSOR VALUE OFF"]
    V --> W["INPUT SELECT"]
    V --> X["up menu"]

    Y["F5"] --> Z["LINE SELECT"]
    Z --> AA["F1"]
    AA --> AB["LINE SELECT OFF"]
    AA --> AC["F2"]
    AC --> AD["FIELD FRAME"]
    AD --> AE["F6 INPUT SELECT"]
    AE --> AF["up menu"]

    AG["F6"] --> AH["INPUT SELECT"]
    AH --> AI["F1"]
    AI --> AJ["COLOR MATRIX YCbCr"]
    AJ --> AK["YGBR OFF"]
    AK --> AL["YRGB OFF"]
    AL --> AM["COMPOSITE FORMAT AUTO"]
    AM --> AN["AUTO / NTSC / PAL"]
    AN --> AO["SETUP 0%"]
    AO --> AP["INPUT SELECT"]
    AP --> AQ["up menu"]

21. MENU TREE

21.7 VECT Menu
Leader LV5600 - MENU TREE - 1

flowchart
graph TD
    A["VECT"] --> B["F1"]
    A --> C["VECT INTEN/CONFIG"]
    C --> D["F1"]
    C --> E["F3"]
    E --> F["VECTOR INTENSITY 0"]
    F --> G["F4"]
    G --> H["VECTOR COLOR WHITE"]
    H --> I["F4"]
    H --> J["VECTOR COLOR"]
    J --> K["F1"]
    J --> L["F2"]
    L --> M["STREAM1 COLOR WHITE"]
    M --> N["F6"]
    M --> O["INPUT SELECT"]
    O --> P["F7"]
    P --> Q["up menu"]
    C --> R["F5"]
    R --> S["3G-B-DS DISPLAY ALIGN"]
    S --> T["F6"]
    T --> U["INPUT SELECT"]
    U --> V["F7"]
    V --> W["up menu"]
    C --> X["F2"]
    X --> Y["VECTOR SCALE"]
    Y --> Z["F1"]
    Y --> AA["SCALE INTENSITY 4"]
    AA --> AB["F2"]
    AA --> AC["SCALE COLOR YELLOW"]
    AC --> AD["F3"]
    AD --> AE["IQ AXIS OFF"]
    AE --> AF["F4"]
    AF --> AG["VECTOR SCALE AUTO"]
    AG --> AH["F6"]
    AG --> AI["INPUT SELECT"]
    AI --> AJ["F7"]
    AJ --> AK["up menu"]

    subgraph Legend
        L1["VECTOR / 5BAR / HISTGRAM / CIE DIAGRAM"] --> L1a
        L2["VECTOR / 5BAR / HISTGRAM / CIE DIAGRAM"] --> L2a
        L3["-128 ~ _0~ 127"] --> L3a
        L4["WHITE / YELLOW / CYAN / GREEN / MAGENTA / RED / BLUE"] --> L4a
        L5["WHITE / YELLOW / CYAN / GREEN / MAGENTA / RED / BLUE / MULTI"] --> L5a
        L6["WHITE / YELLOW / CYAN / GREEN / MAGENTA / RED / BLUE / MULTI"] --> L6a
        L7["WHITE / YELLOW / CYAN / GREEN / MAGENTA / RED / BLUE / MULTI"] --> L7a
        L8["WHITE / YELLOW / CYAN / GREEN / MAGENTA / RED / BLUE / MULTI"] --> L8a
    end
  1. MENU TREE
    Leader LV5600 - MENU TREE - 2
flowchart
graph TD
    A["F2"] --> B["CIE DIAGRAM SCALE"]
    B --> C["F1"]
    C --> D["COLOR B.G. COLOR (B.G. COLOR / B.G. WHITE / B.G. BLACK)"]
    C --> E["F2"]
    E --> F["TRIANGLE1 BT.709 (BT.601(525) / BT.601(625) / BT.709 / DCI / BT.2020 / OFF)"]
    C --> G["F3"]
    G --> H["TRIANGLE2 BT.2020 (BT.601(525) / BT.601(625) / BT.709 / DCI / BT.2020 / OFF)"]
    C --> I["F4"]
    I --> J["USER TRIANGLE"]
    J --> K["F1"]
    K --> L["TRIANGLE OFF (1/2/OFF)"]
    K --> M["F2"]
    M --> N["PRIMARY COLOR G (G/B/R)"]
    K --> O["F3"]
    O --> P["x VALUE 0.170 (0.000 ~ 0.170 ~ 1.000)"]
    K --> Q["F4"]
    Q --> R["y VALUE 0.797 (0.000 ~ 0.797 ~ 1.000)"]
    K --> S["F5"]
    S --> T["COMMENT INPUT"]
    T --> U["F1"]
    U --> V["CLEAR ALL"]
    T --> W["F2"]
    W --> X["DELETE"]
    T --> Y["F3"]
    Y --> Z["INSERT"]
    T --> AA["F4"]
    AA --> AB["<="]
    T --> AC["F5"]
    AC --> AD["=>"]
    T --> AE["F6"]
    AE --> AF["CHAR SET"]
    T --> AG["F7"]
    AG --> AH["up menu"]
    J --> AI["F6"]
    AI --> AJ["INPUT SELECT"]
    J --> AK["F7"]
    AK --> AL["up menu"]
  1. MENU TREE
    Leader LV5600 - MENU TREE - 3
flowchart
graph TD
    A["F5"] --> B["SUB SCALE"]
    B --> C["F1"]
    C --> D["TEMP SCALE OFF (ON/OFF)"]
    B --> E["F2"]
    E --> F["GRID ON (ON/OFF)"]
    B --> G["F3"]
    G --> H["D65 ON (ON/OFF)"]
    B --> I["F4"]
    I --> J["TRIANGLE CAPTION ON (ON/OFF)"]
    B --> K["F6"]
    K --> L["INPUT SELECT"]
    B --> M["F7"]
    M --> N["up menu"]

    O["F3"] --> P["VECTOR GAIN"]
    P --> Q["F1"]
    Q --> R["GAIN VARIABLE CAL (CAL/VARIABLE)"]
    P --> S["F2"]
    S --> T["GAIN MAG x1 (x1/x2/IQ-MAG)"]
    P --> U["F6"]
    U --> V["INPUT SELECT"]
    P --> W["F7"]
    W --> X["up menu"]

    Y["F3"] --> Z["5BAR SEQUENCE GBR (GBR/RGB)"]
    Z --> AA["F3"]
    AA --> AB["HISTGRAM FORM SINGLE (SINGLE/TILE/ALIGN_H/ALIGN_V)"]
  1. MENU TREE
    Leader LV5600 - MENU TREE - 4
flowchart
graph TD
    A["F3"] --> B["CIE DIAGRAM SETTING"]
    B --> C["F1"]
    C --> D["DISPLAY MODE DIAGRAM (DIAGRAM / TEMP)"]
    C --> E["F2"]
    E --> F["CIE STANDARD CIE1931 (CIE1931 / CIE1976)"]
    C --> G["F3"]
    G --> H["CLIP ON (ON / OFF)"]
    G --> I["F4"]
    I --> J["FILTER OFF (ON / OFF)"]
    I --> K["F5"]
    K --> L["MANUAL SETUP"]
    L --> M["F1"]
    M --> N["MANUAL SETUP OFF (ON / OFF)"]
    M --> O["F2"]
    O --> P["COLORIMETRY BT.709 (BT.601(525) / BT.601(625) / BT.709 / DCI / BT.2020)"]
    M --> Q["F5"]
    Q --> R["GAMMA SETUP 2.20 (1.50 ~ 2.20 3.00)"]
    Q --> S["F6"]
    S --> T["INPUT SELECT"]
    S --> U["F7"]
    U --> V["up menu"]

    W["F4"] --> X["MARKER OFF (ON / OFF)"]
    X --> Y["F4"]
    Y --> Z["HISTGRAM SETUP"]
    Z --> AA["F1"]
    AA --> AB["Y ON (ON / OFF)"]
    Z --> AC["F2"]
    AC --> AD["R OFF (ON / OFF)"]
    Z --> AE["F3"]
    AE --> AF["G OFF (ON / OFF)"]
    Z --> AG["F4"]
    AG --> AH["B OFF (ON / OFF)"]
    Z --> AI["F6"]
    AI --> AJ["INPUT SELECT"]
    AI --> AK["F7"]
    AK --> AL["up menu"]
  1. MENU TREE
    Leader LV5600 - MENU TREE - 5
flowchart
graph TD
    A["F4"] --> B["CURSOR OFF (ON/OFF)"]
    C["F5"] --> D["LINE SELECT"]
    D --> E["F1"]
    E --> F["LINE SELECT OFF (ON/OFF/CINELITE)"]
    D --> G["F2"]
    G --> H["FIELD FRAME (FIELD1/FIELD2/FRAME)"]
    D --> I["F6"]
    I --> J["INPUT SELECT"]
    I --> K["F7"]
    K --> L["up menu"]
    M["F6"] --> N["INPUT SELECT"]
    O["F7"] --> P["COLOR SYSTEM"]
    P --> Q["F1"]
    Q --> R["COLOR MATRIX COMPONENT (COMPONENT/COMPOSITE)"]
    P --> S["F2"]
    S --> T["COLOR BAR 100% (100%/75%)"]
    P --> U["F3"]
    U --> V["COMPOSITE FORMAT AUTO (AUTO/NTSC/PAL)"]
    P --> W["F4"]
    W --> X["SETUP 0% (0%/7.5%)"]
    P --> Y["F6"]
    Y --> Z["INPUT SELECT"]
    Y --> AA["F7"]
    AA --> AB["up menu"]

21. MENU TREE

21.8 PIC Menu
Leader LV5600 - MENU TREE - 1

flowchart
graph TD
    A["PIC"] --> B["F1"]
    A --> C["F2"]
    A --> D["F3"]
    A --> E["F4"]
    A --> F["F5"]
    A --> G["F6"]
    A --> H["F7"]
    A --> I["F8"]
    A --> J["F9"]
    A --> K["F10"]
    A --> L["F11"]
    A --> M["F12"]
    A --> N["F13"]
    A --> O["F14"]
    A --> P["F15"]
    A --> Q["F16"]
    A --> R["F17"]
    A --> S["F18"]
    A --> T["F19"]
    A --> U["F20"]
    A --> V["F21"]
    A --> W["F22"]
    A --> X["F23"]
    A --> Y["F24"]
    A --> Z["F25"]
    A --> AA["F26"]
    A --> AB["F27"]
    A --> AC["F28"]
    A --> AD["F29"]
    A --> AE["F30"]
    A --> AF["F31"]
    A --> AG["F32"]
    A --> AH["F33"]
    A --> AI["F34"]
    A --> AJ["F35"]
    A --> AK["F36"]
    A --> AL["F37"]
    A --> AM["F38"]
    A --> AN["F39"]
    A --> AO["F40"]
    A --> AP["F41"]
    A --> AQ["F42"]
    A --> AR["F43"]
    A --> AS["F44"]
    A --> AT["F45"]
    A --> AU["F46"]
    A --> AV["F47"]
    A --> AW["F48"]
    A --> AX["F49"]
    A --> AY["F50"]
    A --> AZ["F51"]
    A --> BA["F52"]
    A --> BB["F53"]
    A --> BC["F54"]
    A --> BD["F55"]
    A --> BE["F56"]
    A --> BF["F57"]
    A --> BG["F58"]
    A --> BH["F59"]
    A --> BI["F60"]
    A --> BJ["F61"]
    A --> BK["F62"]
    A --> BL["F63"]
    A --> BM["F64"]
    A --> BN["F65"]
    A --> BO["F66"]
    A --> BP["F67"]
    A --> BQ["F68"]
    A --> BR["F69"]
    A --> BS["F70"]
    A --> BT["F71"]
    A --> BU["F72"]
    A --> BV["F73"]
    A --> BW["F74"]
    A --> BX["F75"]
    A --> BY["F76"]
    A --> BZ["F77"]
    A --> CA["F78"]
    A --> CB["F79"]
    A --> CC["F80"]
    A --> CD["F81"]
    A --> CE["F82"]
    A --> CF["F83"]
    A --> CG["F84"]
    A --> DH["F85"]
    A --> DI["F86"]
    A --> DJ["F87"]
    A --> DK["F88"]
    A --> DL["F89"]
    A --> DV["F90"]
    A --> DW["F91"]
    A --> DX["F92"]
    A --> DXF["E100.0 ~ 100.0 ~ 200.0"]

    subgraph PC
        PC1["MONO/COLOR"]:::color
        PC2["UP/NORMAL"]:::color
        PC3["-50.0 ~ 0.0 ~ 50.0"]:::color
        PC4["CONTRAST"]:::color
        PC5["CONTRAST"]:::color
        PC6["GAIN/BIAS"]:::color
        PC7["BIAS"]:::color
        PC8["INPUT SELECT"]:::color
        PC9["INPUT SELECT"]:::color
        PC10["INPUT SELECT"]:::color
        PC11["INPUT SELECT"]:::color
        PC12["INPUT SELECT"]:::color
        PC13["INPUT SELECT"]:::color
        PC14["INPUT SELECT"]:::color
        PC15["INPUT SELECT"]:::color
        PC16["INPUT SELECT"]:::color
        PC17["INPUT SELECT"]:::color
        PC18["INPUT SELECT"]:::color
        PC19["INPUT SELECT"]:::color
        PC20["INPUT SELECT"]:::color
        PC21["INPUT SELECT"]:::color
        PC22["INPUT SELECT"]:::color
        PC23["INPUT SELECT"]:::color
        PC24["INPUT SELECT"]:::color
        PC25["INPUT SELECT"]:::color
        PC26["INPUT SELECT"]:::color
        PC27["INPUT SELECT"]:::color
        PC28["INPUT SELECT"]:::color
        PC29["INPUT SELECT"]:::color
        PC30["INPUT SELECT"]:::color
        PC31["INPUT SELECT"]:::color
        PC32["INPUT SELECT"]:::color
        PC33["INPUT SELECT"]:::color
        PC34["INPUT SELECT"]:::color
        PC35["INPUT SELECT"]:::color
        PC36["INPUT SELECT"]:::color
        PC37["INPUT SELECT"]:::color
        PC38["INPUT SELECT"]:::color
        PC39["INPUT SELECT"]:::color
        PC40["INPUT SELECT"]:::color
        PC41["INPUT SELECT"]:::color
        PC42["INPUT SELECT"]:::color
        PC43["INPUT SELECT"]:::color
        PC44["INPUT SELECT"]:::color
        PC45["INPUT SELECT"]:::color
        PC46["INPUT SELECT"]:::color
        PC47["INPUT SELECT"]:::color
        PC48["INPUT SELECT"]:::color
        PC49["INPUT SELECT"]:::color
        PC50["INPUT SELECT"]:::color
        PC51["INPUT SELECT"]:::color
        PC52["INPUT SELECT"]:::color
        PC53["INPUT SELECT"]:::color
        PC54["INPUT SELECT"]:::color
        PC55["INPUT SELECT"]:::color
        PC56["INPUT SELECT"]:::color
        PC57["INPUT SELECT"]:::color
        PC58["INPUT SELECT"]:::color
        PC59["INPUT SELECT"]:::color
        PC60["INPUT SELECT"]:::color
        PC61["INPUT SELECT"]:::color
        PC62["INPUT SELECT"]:::color
        PC63["INPUT SELECT"]:::color
        PC64["INPUT SELECT"]:::color
        PC65["INPUT SELECT"]:::color
        PC66["INPUT SELECT"]:::color
        PC67["INPUT SELECT"]:::color
        PC68["INPUT SELECT"]:::color
        PC69["INPUT SELECT"]:::color
        PC70["INPUT SELECT"]:::color
        PC71["INPUT SELECT"]:::color
        PC72["INPUT SELECT"]:::color
        PC73["INPUT SELECT"]:::color
        PC74["INPUT SELECT"]:::color
        PC75["INPUT SELECT"]:::color
        PC76["INPUT SELECT"]:::color
        PC77["INPUT SELECT"]:::color
        PC78["INPUT SELECT"]:::color
        PC79["INPUT SELECT"]:::color
        PC80["INPUT SELECT"]:::color
        PC81["INPUT SELECT"]:::color
        PC82["INPUT SELECT"]:::color
        PC83["INPUT SELECT"]:::color
        PC84["INPUT SELECT"]:::color
        PC85["INPUT SELECT"]:::color
        PC86["INPUT SELECT"]:::color
        PC87["INPUT SELECT"]:::color
        PC88["INPUT SELECT"]:::color
        PC89["INPUT SELECT"]:::color
        PC90["INPUT SELECT"]:::color
        PC91["INPUT SELECT"]:::color
        PC92["INPUT SELECT"]:::color
        PC93["INPUT SELECT"]:::color
        PC94["INPUT SELECT"]:::color
        PC95["INPUT SELECT"]:::color
        PC96["INPUT SELECT"]:::color
        PC97["INPUT SELECT"]:::color
        PC98["INPUT SELECT"]:::color
        PC99["INPUT SELECT"]:::color
        P1 fill:#f9f,stroke:#333,stroke-width:2px;
        P2 fill:#f9f,stroke:#333,stroke-width:2px;
        P3 fill:#f9f,stroke:#333,stroke-width:2px;
        P4 fill:#f9f,stroke:#333,stroke-width:2px;
        P5 fill:#f9f,stroke:#333,stroke-width:2px;
        P6 fill:#f9f,stroke:#333,stroke-width:2px;
        P7 fill:#f9f,stroke:#333,stroke-width:2px;
        P8 fill:#f9f,stroke:#333,stroke-width:2px;
        P9 fill:#f9f,stroke:#333,stroke-width:2px;
        P10 fill:#f9f,stroke:#333,stroke-width:2px;
        P11 fill:#f9f,stroke:#333,stroke-width:2px;
        P12 fill:#f9f,stroke:#333,stroke-width:2px;
        P13 fill:#f9f,stroke:#333,stroke-width:2px;
        P14 fill:#f9f,stroke:#333,stroke-width:2px;
        P15 fill:#f9f,stroke:#333,stroke-width:2px;
        P16 fill:#f9f,stroke:#333,stroke-width:2px;
        P17 fill:#f9f,stroke:#333,stroke-width:2px;
        P18 fill:#f9f,stroke:#333,stroke-width:2px;
        P19 fill:#f9f,stroke:#333,stroke-width:2px;
        P20 fill:#f9f,stroke:#333,stroke-width:2px;
        P21 fill:#f9f,stroke:#333,stroke-width:2px;
        P22 fill:#f9f,stroke:#333,stroke-width:2px;
        P23 fill:#f9f,stroke:#333,stroke-width:2px;
        P24 fill:#f9f,stroke:#333,stroke-width:2px;
        P25 fill:#f9f,stroke:#333,stroke-width:2px;
        P26 fill:#f9f,stroke:#333,stroke-width:2px;
        P27 fill:#f9f,stroke:#333,stroke-width:2px;
        P28 fill:#f9f,stroke:#333,stroke-width:2px;
        P29 fill:#f9f,stroke:#333,stroke-width:2px;
        P30 fill:#f9f,stroke:#333,stroke-width:2px;
        P31 fill:#f9f,stroke:#333,stroke-width:2px;
        P32 fill:#f9f,stroke:#333,stroke-width:2px;
        P33 fill:#f9f,stroke:#333,stroke-width:2px;
        P34 fill:#f9f,stroke:#333,stroke-width:2px;
        P35 fill:#f9f,stroke:#333,stroke-width:2px;
        P36 fill:#f9f,stroke:#333,stroke-width:2px;
        P37 fill:#f9f,stroke:#333,stroke-width:2px;
        P38 fill:#f9f,stroke:#333,stroke-width:2px;
        P39 fill:#f9f,stroke:#333,stroke-width:2px;
        P40 fill:#f9f,stroke:#333,stroke-width:2px;
        P41 fill:#f9f,stroke:#333,stroke-width:2px;
        P42 fill:#f9f,stroke:#333,stroke-width:2px;
        P43 fill:#f9f,stroke:#333,stroke-width:2px;
        P44 fill:#f9f,stroke:#333,stroke-width:2px;
        P45 fill:#f9f,stroke:#333,stroke-width:2px;
        P46 fill:#f9f,stroke:#333,stroke-width:2px;
        P47 fill:#f9f,stroke:#�4e6e6e6e6e6e6e6e6e6e6e6e6e6e6e6e6e6e6e6e6e6e6e6e6e6e6e6e6e6e6e6e6e6e6e6e6e6e6e6e6e6e6e6e6e6e6e6e6e6e6eE-mail:FPT/REAL/x2/FULLFRM|
  1. MENU TREE
    Leader LV5600 - MENU TREE - 2
flowchart
graph TD
    A["F4"] --> B["MARKER"]
    B --> C["F1"]
    C --> D["FRAME MARKER OFF"]
    D --> E["F2"]
    E --> F["CENTER MARKER OFF"]
    F --> G["F3"]
    G --> H["ASPECT MARKER OFF"]
    H --> I["F4"]
    I --> J["ASPECT SHADOW 50"]
    J --> K["F5"]
    K --> L["SAF ETY ZONE"]
    L --> M["F1"]
    M --> N["SAF E ACTION OFF"]
    N --> O["F2"]
    O --> P["SAF E TITLE OFF"]
    P --> Q["F3"]
    Q --> R["USER1/2 SET"]
    R --> S["F1"]
    S --> T["USER1 WIDTH [%"] 90]
    T --> U["F2"]
    U --> V["USER1 HEIGHT [%"] 90]
    V --> W["F3"]
    W --> X["USER2 WIDTH [%"] 80]
    X --> Y["F4"]
    Y --> Z["USER2 HEIGHT [%"] 80]
    Z --> AA["F5"]
    AA --> AB["USER1/2 ASPECT OFF"]
    AB --> AC["F6"]
    AC --> AD["INPUT SELECT"]
    AD --> AE["F7"]
    AE --> AF["up menu"]

    AG["F5"] --> AH["SUPER IMPDSE"]
    AH --> AI["F6"]
    AI --> AJ["INPUT SELECT"]
    AJ --> AK["F7"]
    AK --> AL["up menu"]

    AM["F1"] --> AN["STANDARD OFF"]
    AN --> AO["F2"]
    AO --> AP["FOR MAT 60B (70B)"]
    AP --> AQ["F2"]
    AQ --> AR["FOR MAT HD"]
    AR --> AS["F2"]
    AS --> AT["WST TRANSPORT VBI"]
    AT --> AU["F3"]
    AU --> AV["LANGUAGE CC1"]
    AV --> AW["F3"]
    AW --> AX["LANGUAGE 1"]
    AX --> AY["F3"]
    AY --> AZ["MAGAZINE 7"]
    AZ --> BA["F4"]
    BA --> BB["SERVICE DATA 1"]
    BB --> BC["F4"]
    BC --> BD["PAGE 77"]

    BE["F6"] --> BF["INPUT SELECT"]
    BF --> BG["F7"]
    BG --> BH["up menu"]

    BI["F6"] --> BJ["INPUT SELECT"]
    BJ --> BK["F7"]

    BL["F6"] --> BM["INPUT SELECT"]
    BM --> BN["F7"]

    BO["F6"] --> BP["INPUT SELECT"]
    BP --> BQ["F7"]

    BR["F6"] --> BS["INPUT SELECT"]
    BS --> BT["F7"]

    BU["F6"] --> BV["INPUT SELECT"]
    BV --> BW["F7"]

    BX["F6"] --> BY["INPUT SELECT"]
    BY --> BZ["F7"]

    CA["F6"] --> CB["INPUT SELECT"]
    CB --> CC["F7"]

    CE["F6"] --> CF["INPUT SELECT"]
    CF --> CG["F7"]

    CE --> CH["INPUT SELECT"]
    CH --> CI["F7"]

    CE --> CJ["INPUT SELECT"]
    CJ --> CK["F7"]

    CE --> CY["INPUT SELECT"]
    CY --> CZ["F7"]

    CE --> CE1["INPUT SELECT"]
    CE1 --> CE2["INPUT SELECT"]

    CE1 --> CE3["INPUT SELECT"]
    CE3 --> CE4["INPUT SELECT"]

    CE1 --> CE5["INPUT SELECT"]
    CE5 --> CE6["INPUT SELECT"]

    CE1 --> CE7["INPUT SELECT"]
    CE7 --> CE8["INPUT SELECT"]

    CE1 --> CE9["INPUT SELECT"]
    CE9 --> CE10["INPUT SELECT"]

    CE1 --> CE11["INPUT SELECT"]
    CE11 --> CE12["INPUT SELECT"]

    CE11 --> CE13["INPUT SELECT"]
    CE13 --> CE14["INPUT SELECT"]

    CE11 --> CE15["INPUT SELECT"]
    CE15 --> CE16["INPUT SELECT"]

    CE11 --> CE17["INPUT SELECT"]
    CE17 --> CE18["INPUT SELECT"]

    CE11 --> CE19["INPUT SELECT"]
    CE19 --> CE20["INPUT SELECT"]

    CE11 --> CE21["INPUT SELECT"]
    CE21 --> CE22["INPUT SELECT"]

    CE11 --> CE23["INPUT SELECT"]
    CE23 --> CE24["INPUT SELECT"]

    CE11 --> CE25["INPUT SELECT"]
    CE25 --> CE26["INPUT SELECT"]

    CE11 --> CE27["INPUT SELECT"]
    CE27 --> CE28["INPUT SELECT"]

    CE11 --> CE29["INPUT SELECT"]
    CE29 --> CE30["INPUT SELECT"]

    CE11 --> CE31["INPUT SELECT"]
    CE31 --> CE32["INPUT SELECT"]

    CE11 --> CE33["INPUT SELECT"]
    CE33 --> CE34["INPUT SELECT"]

    CE11 --> CE35["INPUT SELECT"]
    CE35 --> CE36["INPUT SELECT"]

    CE11 --> CE37["INPUT SELECT"]
    CE37 --> CE38["INPUT SELECT"]

    CE11 --> CE39["INPUT SELECT"]
    CE39 --> CE40["INPUT SELECT"]

    CE11 --> CE40
  1. MENU TREE
    Leader LV5600 - MENU TREE - 3
flowchart
graph TD
    A["F5"] --> B["CS LOG"]
    B --> C["F1"]
    C --> D["LOUDNESS MODE OFF"]
    D --> E["F2"]
    E --> F["LOG STOP"]
    F --> G["START / STOP."]
    C --> H["F3"]
    H --> I["CLEAR"]
    I --> J["F3"]
    J --> K["LOG/CH ART CLEAR"]
    K --> L["F4"]
    L --> M["LOG MODE OVER WT"]
    M --> N["F5"]
    N --> O["TINECOD E SET"]
    O --> P["F1"]
    P --> Q["COMPLETE"]
    P --> R["F7"]
    R --> S["up menu"]
    O --> T["F0"]
    T --> U["USB MEMORY"]
    U --> V["F1"]
    V --> W["AUTO FILENAME ON"]
    W --> X["F2"]
    X --> Y["NAME INPUT"]
    Y --> Z["F1"]
    Z --> AA["CLEAR ALL"]
    Y --> AB["F2"]
    AB --> AC["DELETE"]
    Y --> AD["F4"]
    AD --> AE["<="]
    Y --> AF["F5"]
    AF --> AG["=>"]
    Y --> AH["F6"]
    AH --> AI["CHAR SET"]
    Y --> AJ["F7"]
    AJ --> AK["up menu"]
    U --> AL["F3"]
    AL --> AM["STORE"]
    AL --> AN["F3"]
    AN --> AO["STORE"]
    AO --> AP["F1"]
    AP --> AQ["OVER WR YES"]
    AO --> AR["F3"]
    AR --> AS["OVER WR NO"]
    U --> AT["F5"]
    AT --> AU["FILE DELETE"]
    AU --> AV["F1"]
    AV --> AW["DELETE YES"]
    AU --> AX["F3"]
    AX --> AY["DELETE NO"]
    U --> AZ["F7"]
    AZ --> BA["up menu"]
    U --> BB["F7"]
    BB --> BC["up menu"]
  1. MENU TREE
    Leader LV5600 - MENU TREE - 4
flowchart
```mermaid
graph TD
    A["CINE LITE"] --> B["F1"]
    A --> C["F2"]
    A --> D["F3"]
    A --> E["F4"]
    A --> F["F5"]
    A --> G["F6"]
    A --> H["F7"]
    A --> I["F8"]
    A --> J["F9"]
    A --> K["F10"]
    A --> L["F11"]
    A --> M["F12"]
    A --> N["F13"]
    A --> O["F14"]
    A --> P["F15"]
    A --> Q["F16"]
    A --> R["F17"]
    A --> S["F18"]
    A --> T["F19"]
    A --> U["F20"]
    A --> V["F21"]
    A --> W["F22"]
    A --> X["F23"]
    A --> Y["F24"]
    A --> Z["F25"]
    A --> AA["F26"]
    A --> AB["F27"]
    A --> AC["F28"]
    A --> AD["F29"]
    A --> AE["F30"]
    A --> AF["F31"]
    A --> AG["F32"]
    A --> AH["F33"]
    A --> AI["F34"]
    A --> AJ["F35"]
    A --> AK["F36"]
    A --> AL["F37"]
    A --> AM["F38"]
    A --> AN["F39"]
    A --> AO["F40"]
    A --> AP["F41"]
    A --> AQ["F42"]
    A --> AR["F43"]
    A --> AS["F44"]
    A --> AT["F45"]
    A --> AU["F46"]
    A --> AV["F47"]
    A --> AW["F48"]
    A --> AX["F49"]
    A --> AY["F50"]
    A --> AZ["F51"]
    A --> BA["F52"]
    A --> BB["F53"]
    A --> BC["F54"]
    A --> BD["F55"]
    A --> BE["F56"]
    A --> BF["F57"]
    A --> BG["F58"]
    A --> BH["F59"]
    A --> BI["F60"]
    A --> BJ["F61"]
    A --> BK["F62"]
    A --> BL["F63"]
    A --> BM["F64"]
    A --> BN["F65"]
    A --> BO["F66"]
    A --> BP["F67"]
    A --> BQ["F68"]
    A --> BR["F69"]
    A --> BS["F70"]
    A --> BT["F71"]
    A --> BU["F72"]
    A --> BV["F73"]
    A --> BW["F74"]
    A --> BX["F75"]
    A --> BY["F76"]
    A --> BZ["F77"]
    A --> CA["F78"]
    A --> CB["F79"]
    A --> CC["F80"]
    A --> CD["F81"]
    A --> CE["F82"]
    A --> CF["F83"]
    A --> CG["OEF / f Stop / %DISPLAY / CINEZONE"]

    subgraph Memory Components
        direction TB
        direction LR
        F1,F2,F3,F4,F5,F6,F7,F8,F9,F10,F11,F12,F13,F14,F15,F16,F17,F18,F19,F20,F21,F22,F23,F24,F25,F26,F27,F28,F29,F30,F31,F32,F33,F34,F35,F36,F37,F38,F39,F40,F41,F42,F43,F44,F45,F46,F47,F48,F49,F50,F51,F52,F53,F54,F55,F56,F57,F58,F59,F60,F61,F62,F63,F64,F65,F66,F67,F68,F69,F70,F71,F72,F73,F74,F75,F76,F77,F78,F79,F80,F81,F82,F83,F84,F85,F86,F87,F88,F89,F90,F91,F92,F93,F94,F95,F96,F97,GAMMA
        F1,GAMMA SELECT 0.45
        F2,GAMMA CAL
        F3,I DATA CLEAR
        F4,CAL SET
        F5,CAL F
        F6,INPUT SELECT
        F7,UP menu
        F8,INPUT SELECT
        F9,UP menu
        F10,UP menu
        F11,UP menu
        F12,UP menu
        F13,UP menu
        F14,UP menu
        F15,UP menu
        F16,UP menu
        F17,UP menu
        F18,UP menu
        F19,UP menu
        F20,UP menu
        F21,UP menu
        F22,UP menu
        F23,UP menu
        F24,UP menu
        F25,UP menu
        F26,UP menu
        F27,UP menu
        F28,UP menu
        F29,UP menu
        F30,UP menu
        F31,UP menu
        F32,UP menu
        F33,UP menu
        F34,UP menu
        F35,UP menu
        F36,UP menu
        F37,UP menu
        F38,UP menu
        F39,UP menu
        F40,UP menu
        F41,UP menu
        F42,UP menu
        F43,UP menu
        F44,UP menu
        F45,UP menu
        F46,UP menu
        F47,UP menu
        F48,UP menu
        F49,UP menu
        F50,UP menu
        F51,UP menu
        F52,UP menu
        F53,UP menu
        F54,UP menu
        F55,UP menu
        F56,UP menu
        F57,UP menu
        F58,UP menu
        F59,UP menu
        F60,UP menu
        F61,UP menu
        F62,UP menu
        F63,UP menu
        F64,UP menu
        F65,UP menu
        F66,UP menu
        F67,UP menu
        F68,UP menu
        F69,UP menu
        F70,UP menu
        F71,UP menu
        F72,UP menu
        F73,UP menu
        F74,UP menu
        F75,UP menu
        F76,UP menu
        F77,UP menu
        F78,UP menu
        F79,UP menu
        F80,UP menu
        F81,UP menu
        F82,UP menu
        F83,UP menu
        F84,UP menu
        F85,UP menu
        F86,UP menu
        F87,UP menu
        F88,UP menu
        F89,UP menu
        F90,UP menu
        F91,UP menu
        F92,UP menu
        F93,UP menu
        F94,UP menu
        F95,UP menu
        F96,UP menu
        F97,UP menu
        F98,UP menu
        F99,UP menu
        GAMMA SELECT 0.45

    end

    subgraph Memory Components
        direction TB
        direction LR
        direction LR
        direction LR
        direction LR
        direction LR
        direction LR
        direction LR
        direction LR
        direction LR
        direction LR
        direction LR
        direction LR
        direction LR
        direction LR
      end

    %% Note: The image contains a diagram of a network or system layout for the CineLite Display (OFF) configuration.
  1. MENU TREE
    Leader LV5600 - MENU TREE - 5
flowchart
graph TD
    A["CINEZONE SETUP"] --> B["F1"]
    B --> C["UPPER [ % "] 100.0]
    B --> D["LOWER [ % "] 0.0]
    B --> E["LEVEL [ % "] 40.0]
    B --> F["INPUT SELECT"]
    B --> G["up menu"]
    H["CINEZONE FORM GRADATE"] --> I["GRAD ATE / STEP / SEARCH"]
    H --> J["-8.3 ~ 100.0 ~ 109.4"]
    H --> K["-7.3 ~ 0.0 ~ 108.4"]
    H --> L["-7.3 ~ 40.0 ~ 109.4"]
    M["CINELITE ADVANCE OFF"] --> N["ON/OFF"]
    O["CINELITE DISPLAY OFF"] --> P["OFF / fStop / %DISPLAY / CINEZONE"]
    Q["CINELITE HIDR"] --> R["F2"]
    R --> S["F3"]
    S --> T["F4"]
    T --> U["F5"]
    U --> V["F6"]
    V --> W["F7"]
    X["CINELITE STOP SETUP"] --> Y["F1"]
    Y --> Z["F2"]
    Z --> AA["F3"]
    AA --> AB["F4"]
    AB --> AC["F5"]
    AC --> AD["F6"]
    AD --> AE["F7"]
    AF["CINELITE FORM GRADATE"] --> AG["GRAD ATE / STEP / SEARCH"]
    AF --> AH["UPPER [ % "] 100.0]
    AF --> AI["LOWER [ % "] 0.0]
    AF --> AJ["LEVEL [ % "] 40.0]
    AF --> AK["INPUT SELECT"]
    AF --> AL["up menu"]
    AM["CINELITE ADDUCE OFF"] --> AN["F1"]
    AN --> AO["F2"]
    AO --> AP["F3"]
    AP --> AQ["F4"]
    AQ --> AR["F5"]
    AR --> AS["F6"]
    AS --> AT["F7"]
  1. MENU TREE
    Leader LV5600 - MENU TREE - 6
flowchart
graph TD
    A["F3 MAX FALL/CLL"] --> B["F1 MAX FALL/CLL DISPLAY OFF"]
    B --> C["ON / OFF"]
    A --> D["F2 MEASURE STOP"]
    D --> E["STOP / START"]
    A --> F["F3 CLEAR"]
    F --> G["F7 up menu"]
    A --> H["F4 CINELITE ADVANCE OFF"]
    H --> I["ON / OFF"]
    A --> J["F5 HDR ZONE OFF"]
    J --> K["OFF / ON"]
    A --> L["F6 INPUT SELECT"]
    L --> M["F7 up menu"]
    A --> N["F1 PICTURE MODE FIT"]
    N --> O["ELL / REAL / x2"]
    A --> P["F2 POCUS ASSIST OFF"]
    P --> Q["ON / OFF"]
    A --> R["F3 SENSITIVE MIDDLE"]
    R --> S["LOW / MIDDLE / HIGH / V-HIGH / U-HIGH"]
    A --> T["F4 PICTURE LEVEL 100"]
    T --> U["OFF / EMBOSS / 25 / 50 / 75 / 100"]
    A --> V["F5 EDGE COLOR WHITE"]
    V --> W["WHITE / RED / GREEN / BLUE"]
    A --> X["F6 INPUT SELECT"]
    X --> Y["UP menu"]
    A --> Z["F7 up menu"]
    Z --> AA["LINE SELECT"]
    AA --> AB["F1 LINE SELECT OFF"]
    AB --> AC["ON / OFF"]
    AA --> AD["F2 FIELD FRAME"]
    AD --> AE["FIELD1 / FIELD2 / FRAME"]
    AA --> AF["F4 AV PHASE"]
    AF --> AG["AV MEASURE TOP 50"]
    AG --> AH["0 ~ 50 ~ 100"]
    AG --> AI["F2 AV MEASURE LEFT 0"]
    AI --> AJ["0 ~ 99"]
    AG --> AK["F3 AV MEASURE RIGHT 0"]
    AK --> AL["0 ~ 99"]
    AG --> AM["F4 AV MEASURE LINK 1A"]
    AM --> AN["1[A"] / 2["B"] / 3["C"] / 4["D"]]
    AG --> AO["F6 INPUT SELECT"]
    AO --> AP["INPUT SELECT"]
    AG --> AQ["F7 UP MENU"]

21. MENU TREE

21.9 AUDIO Menu
Leader LV5600 - MENU TREE - 1

flowchart
graph TD
    A["AUDIO"] --> B["F1"]
    A --> C["F2"]
    B --> D["DISPLAY MODE LISSAJOU"]
    C --> D
    D --> E["METER SETUP"]
    E --> F["F1"]
    E --> G["F2"]
    F --> H["DYNAMIC RANGE 60DBFS (60DBFS / 90DBFS / MAG)"]
    G --> I["RESPONSE TRUEPEAK (TRUEPEAK / PPM / VU)"]
    I --> J["F3"]
    I --> K["PPM MODE PPM(I) (PPM(I) / PPM(II))"]
    J --> L["F3"]
    J --> M["PEAK METER TRUE (TRUE / PPM(I) / PPM(II))"]
    K --> N["F4"]
    K --> O["PEAK HOLD 0.5 (0.0 ~ 0.5 ~ 5.0 / HOLD)"]
    O --> P["F5"]
    O --> Q["LEVEL SETTING"]
    Q --> R["F1"]
    Q --> S["F2"]
    Q --> T["F3"]
    Q --> U["F7"]
    R --> V["OVER dBFS 0.0 (-40.0 ~ 0.0)"]
    S --> W["WARNING dBFS -18.0 (-40.0 ~ -18.0 ~ 0.0)"]
    T --> X["REF dBFS -20.0 (-40.0 ~ -20.0 ~ 0.0)"]
    U --> Y["up menu"]
    Z["F3"] --> AA["LISSAJOU SETUP"]
    AA --> AB["F1"]
    AA --> AC["F2"]
    AB --> AD["LISSAJOU INTEN 0 (-8 ~ 0 ~ 7)"]
    AC --> AE["SCALE INTEN 4 (-8 ~ -4 ~ 7)"]
    AD --> AF["DISPLAY MULTI (MULTI / SINGLE)"]
    AE --> AG["FORM X-Y (X-Y / MATRIX)"]
    AF --> AH["AUTO GAIN ON (QN / OFF)"]
    AG --> AI["INPUT SELECT"]
    AH --> AJ["up menu"]
  1. MENU TREE
    Leader LV5600 - MENU TREE - 2
flowchart
graph TD
    A["F3"] --> B["SURROUND SETUP"]
    B --> C["F1"]
    C --> D["SURROUND INTEN 4 (-8 ~ 4 ~ 7)"]
    C --> E["F2"]
    E --> F["SCALE INTEN 4 (-8 ~ 4 ~ 7)"]
    C --> G["F3"]
    G --> H["SURROUND 5.1 NORMAL (NORMAL / PH ANTOM)"]
    G --> I["F5"]
    I --> J["AUTO GAIN ON (ONL / OFF)"]
    G --> K["F6"]
    K --> L["INPUT SELECT"]
    K --> M["F7"]
    M --> N["up menu"]
    O["F3"] --> P["STATUS SETUP"]
    P --> Q["F1"]
    Q --> R["EVENT LOG"]
    R --> S["F1"]
    S --> T["LOG STOP START / STOP"]
    S --> U["F2"]
    U --> V["CLEAR"]
    S --> W["F3"]
    W --> X["LOG MODE OVER WRT OVER WRT / STOP"]
    W --> Y["F6"]
    Y --> Z["USB MEMORY"]
    Z --> AA["F1"]
    AA --> AB["AUTO FILENAME ON (ONL / OFF)"]
    AA --> AC["F2"]
    AC --> AD["NAME INPUT"]
    AD --> AE["F1"]
    AE --> AF["CLEAR ALL"]
    AD --> AG["F2"]
    AG --> AH["DELETE"]
    AD --> AI["F4"]
    AI --> AJ["<="]
    AD --> AK["F5"]
    AK --> AL["=>"]
    AD --> AM["F6"]
    AM --> AN["CHAR SET"]
    AD --> AO["F7"]
    AO --> AP["up menu"]
    Q --> AQ["F3"]
    AQ --> AR["STORE"]
    AQ --> AS["F3"]
    AS --> AT["STORE"]
    AQ --> AU["F5"]
    AU --> AV["FILE DELETE"]
    AQ --> AW["F7"]
    AW --> AX["up menu"]
    AQ --> AY["F1"]
    AY --> AZ["OVER WR YES"]
    AQ --> BA["F3"]
    BA --> BB["OVER WR NO"]
    AQ --> BC["F1"]
    BC --> BD["DELETE YES"]
    AQ --> BE["F3"]
    BE --> BF["DELETE NO"]
  1. MENU TREE
    Leader LV5600 - MENU TREE - 3
flowchart
graph TD
    A["F3"] --> B["CHANNEL STATUS"]
    B --> C["F1"]
    B --> D["DISPLAY CHANNEL 1"]
    C --> E["F2"]
    D --> F["ALIGN LSB FIRST"]
    E --> G["F6"]
    F --> H["INPUT SELECT"]
    G --> I["F7"]
    H --> J["up menu"]

    K["F4"] --> L["USER BIT"]
    L --> M["F1"]
    L --> N["DISPLAY CHANNEL 1"]
    M --> O["F2"]
    N --> P["ALIGN LSB FIRST"]
    O --> Q["F6"]
    P --> R["INPUT SELECT"]
    Q --> S["F7"]
    R --> T["up menu"]

    U["F5"] --> V["ERROR RESET"]
    V --> W["F6"]
    W --> X["INPUT SELECT"]
    X --> Y["F7"]
    Y --> Z["up menu"]

    AA["F3"] --> AB["LOUDNESS SETUP"]
    AB --> AC["F1"]
    AB --> AD["PERIOD 2 MIN (2 MIN / 10 MIN / 30 MIN / 1 HOUR / 2 HOUR / 6 HOUR / 12 HOUR / 24 HOUR)"]
    AC --> AD
    AD --> AE["F2"]
    AD --> AF["CHART CLEAR"]
    AE --> AG["F3"]
    AG --> AH["MEASURE STOP (STOP / START)"]
    AH --> AI["F4"]
    AI --> AJ["MAG OFF (ON / OFF)"]
    AJ --> AK["F5"]
    AK --> AL["LOUDNESS SETTING"]
    AL --> AM["F1"]
    AL --> AN["COMPLETE"]
    AM --> AO["F2"]
    AN --> AP["PREV TAB"]
    AO --> AQ["F3"]
    AP --> AR["NEXT TAB"]
    AQ --> AS["F7"]
    AR --> AT["up menu"]
  1. MENU TREE
    Leader LV5600 - MENU TREE - 4
flowchart
graph TD
    A["USB MEMORY"] --> B["F1"]
    A --> C["F2"]
    A --> D["NAME INPUT"]
    A --> E["AUTO FILENAME ON"]
    B --> F["F3"]
    B --> G["F3"]
    C --> H["STORE"]
    D --> I["STORE"]
    E --> J["FILE DELETE"]
    F --> K["F5"]
    G --> L["F7"]
    H --> M["OVER WR YES"]
    I --> N["OVER WR NO"]
    J --> O["DELETE YES"]
    K --> P["F1"]
    L --> Q["F3"]
    M --> R["UP menu"]
    N --> S["DELETE NO"]
    O --> T["F7"]
    P --> U["F7"]
    Q --> V["F7"]
    R --> W["F4"]
    S --> X["F6"]
    T --> Y["F7"]
    U --> Z["ERROR SETUP"]
    V --> AA["F1"]
    W --> AB["F7"]
    X --> AC["F5"]
    Y --> AD["F6"]
    Z --> AE["PHONES VOLUME 0 (0~63)"]
    AA --> AF["INPUT SELECT"]
    AB --> AG["MAPPING"]
    AC --> AH["F1"]
    AD --> AI["F2"]
    AE --> AJ["F3"]
    AF --> AK["F7"]
    AG --> AL["F7"]
    AH --> AM["COMPLETE"]
    AI --> AN["PREV TAB"]
    AJ --> AO["NEXT TAB"]
    AK --> AP["up menu"]

21. MENU TREE

21.10 STATUS Menu
Leader LV5600 - MENU TREE - 1

flowchart
graph TD
    A["STATUS"] --> B["F1"]
    B --> C["EVENT LOG"]
    C --> D["F1"]
    D --> E["LOG STOP"]
    E --> F["START / STOP"]
    C --> G["F2"]
    G --> H["CLEAR"]
    C --> I["F3"]
    I --> J["LOG MODE OVER WRT"]
    J --> K["OVER.WRT / STOP"]
    C --> L["F4"]
    L --> M["USB MEMORY"]
    M --> N["F5"]
    N --> O["AUTO FILENAME ON (ON / OFF)"]
    O --> P["F2"]
    P --> Q["NAME INPUT"]
    Q --> R["F1"]
    R --> S["CLEAR ALL"]
    Q --> T["F2"]
    T --> U["DELETE"]
    Q --> V["F3"]
    V --> W["<<"]
    Q --> X["F4"]
    X --> Y[">="]
    Q --> Z["F5"]
    Z --> AA["=>"]
    Q --> AB["F6"]
    AB --> AC["CHAR SET"]
    Q --> AD["F7"]
    AD --> AE["up menu"]
    O --> AF["F3"]
    AF --> AG["STORE"]
    AG --> AH["F3"]
    AH --> AI["STORE"]
    AI --> AJ["F3"]
    AJ --> AK["OVER WR YES"]
    AJ --> AL["F3"]
    AL --> AM["OVER WR NO"]
    O --> AN["F5"]
    AN --> AO["PILE DELETE"]
    AO --> AP["F1"]
    AP --> AQ["DELETE YES"]
    AO --> AR["F3"]
    AR --> AS["DELETE NO"]
    O --> AT["F7"]
    AT --> AU["up menu"]

    B --> V
    C --> U
    D --> V
    E --> U
    F --> V
    G --> U
    H --> V
    I --> V
    J --> V
    K --> V
    L --> V
    M --> V
    N --> V
    O --> W
    P --> X
    Q --> Y
    R --> X
    S --> Y
    T --> X
    U --> X
    V --> X
    W --> X
    X --> Y
    Y --> AA
    Z --> AA
    AA --> AB
    AD --> AU
  1. MENU TREE
    Leader LV5600 - MENU TREE - 2
flowchart
graph TD
    A["F2"] --> B["MODE RUN"]
    A --> C["DISPLAY SERIAL"]
    A --> D["LINK PICTURE"]
    A --> E["SUB PICTURE"]
    A --> F["INPUT SELECT"]
    A --> G["up menu"]

    H["F3"] --> I["AV PHASE E"]
    H --> J["F1"]
    H --> K["F2"]
    H --> L["F6"]
    H --> M["F7"]

    N["F4"] --> O["IP"]
    N --> P["F2"]
    N --> Q["PACKET JITTER"]

    R["F5"] --> S["F3"]
    R --> T["PTP"]

    U["F6"] --> V["F3"]
    U --> W["F4"]
    U --> X["F5"]

    Y["F7"] --> Z["F1"]
    Y --> AA["F2"]
    Y --> AB["F3"]

    AC["F8"] --> AD["F5"]
    AC --> AE["F6"]

    AF["F9"] --> AG["F7"]

    AH["F10"] --> AI["F2"]
    AH --> AJ["F3"]

    AK["F11"] --> AL["F4"]
    AK --> AM["F5"]

    AN["F12"] --> AO["F6"]
    AN --> AP["F7"]

    AQ["F13"] --> AR["F2"]
    AQ --> AS["F3"]

    AT["F14"] --> AU["F3"]
    AT --> AV["F4"]

    AW["F15"] --> AX["F4"]
    AW --> AY["F5"]

    AZ["F16"] --> BA["F5"]
    AZ --> BB["F6"]

    BC["F17"] --> BD["F6"]
    BC --> BE["F7"]

    BF["F18"] --> BG["F7"]

    BH["F19"] --> BI["F6"]
    BH --> BJ["F7"]

    BK["F20"] --> BL["F7"]

    BM["F21"] --> BN["F6"]
    BM --> BO["F7"]

    BP["F22"] --> BQ["F7"]

    BQ --> BR["F6"]

    BS["F23"] --> BT["F7"]

    BU["F24"] --> BV["F6"]
    BU --> BW["F7"]

    BX["F25"] --> BY["F7"]

    BZ["F26"] --> CA["F6"]
    BZ --> CB["F7"]

    CC["F27"] --> CD["F7"]

    CE["F28"] --> CF["F6"]
    CE --> CG["F7"]

    DH["F29"] --> DI["F7"]

    EJ["REF SELECT EXT (EXT / SDI)"]
    EJ --> EJ_REF_SET_USER
    EJ --> EJ_REF_SET_DEFAULT
    EJ --> EJ_OH_TIMING LEG_ACY
    EJ --> EJ_INPUT_SELECT
    EJ --> EJ_up_menu

    AFJ["SCALE MAX 50ms (50ms / 300ms / 500ms / 1.0s / 2.5s)"]
    AFJ --> AFJ_REFRESH
    AFJ --> AFJ_AV_PHASE_E_SETUP
    AFJ --> AFJ_F1["COMPLETE"]
    AFJ --> AFJ_up_menu

    AG["PERIOD 2MIN 2MIN/10MIN/30MIN/1HOUR/2HOUR/6HOUR/12HOUR/24HOUR/72HOUR"]
    AG --> AH["CHART CLEAR<br>STREAM1 / STRE AND / S TREAMS / STR EAMM"]

    AI["PERIOD 2MIN 2MIN/10MIN/30MIN/1HOUR/2HOUR/6HOUR/12HOUR/24HOUR/72HOUR"]
    AI --> AJ["CHART CLEAR<br>STREAM1 / STRE AND / S TREAMS / STR EAMM"]

    AK["PERIOD 2MIN 2MIN/10MIN/30MIN/1HOUR/2HOUR/6HOUR/12HOUR/24HOUR/72HOUR"]
    AK --> BA["MODE DELAY TIME DELAY TIME / OFFSET TIME"]

    BB["PERIOD 2MIN 2MIN/10MIN/30MIN/1HOUR/2HOUR/6HOUR/12HOUR/24HOUR/72HOUR"]
    BB --> BC["CHART CLEAR<br>STREAM1 / STRE AND / STR EAMM / STREAMC"]

    BD["PERIOD 2MIN 2MIN/10MIN/30MIN/1HOUR/2HOUR/6HOUR/12HOUR/24HOUR/72HOUR"]
    BD --> BD_UPDMOUT
  1. MENU TREE
    Leader LV5600 - MENU TREE - 3
flowchart
graph TD
    A["ANC DATA HENSR"] --> B["F3"]
    B --> C["F4"]
    C --> D["F5"]
    D --> E["F6"]
    E --> F["F7"]
    F --> G["F8"]
    G --> H["F9"]
    H --> I["F10"]
    I --> J["F11"]
    J --> K["F12"]
    K --> L["F13"]
    L --> M["F14"]
    M --> N["F15"]
    N --> O["F16"]
    O --> P["F17"]
    P --> Q["F18"]
    Q --> R["F19"]
    R --> S["F20"]
    S --> T["F21"]
    T --> U["F22"]
    U --> V["F23"]
    V --> W["F24"]
    W --> X["F25"]
    X --> Y["F26"]
    Y --> Z["F27"]
    Z --> AA["F28"]
    AA --> AB["F29"]
    AB --> AC["F30"]
    AC --> AD["F31"]
    AD --> AE["F32"]
    AE --> AF["F33"]
    AF --> AG["F34"]
    AG --> AH["F35"]
    AH --> AI["F36"]
    AI --> AJ["F37"]
    AJ --> AK["F38"]
    AK --> AL["F39"]
    AL --> AM["F40"]
    AM --> AN["F41"]
    AN --> AO["F42"]
    AO --> AP["F43"]
    AP --> AQ["F44"]
    AQ --> AR["F45"]
    AR --> AS["F46"]
    AS --> AT["F47"]
    AT --> AU["F48"]
    AU --> AV["F49"]
    AV --> AW["F50"]
    AW --> AX["F51"]
    AX --> AY["F52"]
    AY --> AZ["F53"]
    AZ --> BA["F54"]
    BA --> BB["F55"]
    BB --> BC["F56"]
    BC --> BD["F57"]
    BD --> BE["F58"]
    BE --> BF["F59"]
    BF --> BG["F60"]
    BG --> BH["F61"]
    BH --> BI["F62"]
    BI --> BJ["F63"]
    BJ --> BK["F64"]
    BK --> BL["F65"]
    BL --> BM["F66"]
    BM --> BN["F67"]
    BN --> BO["F68"]
    BO --> BP["F69"]
    BP --> BQ["F70"]
    BQ --> BR["F71"]
    BR --> BS["F72"]
    BS --> BT["F73"]
    BT --> BU["F74"]
    BU --> BV["F75"]
    BV --> BW["F76"]
    BW --> BX["F77"]
    BX --> BY["F78"]
    BY --> BZ["F79"]
    BZ --> CA["F80"]
    CA --> CB["F81"]
    CB --> CC["F82"]
    CC --> CD["F83"]
    CD --> CE["F84"]
    CE --> CF["F85"]
    CF --> CG["F86"]
    CG --> CH["F87"]
    CH --> CI["F88"]
    CI --> CJ["F89"]
    CJ --> CK["F90"]
    CK --> CL["F91"]
    CL --> CD
  1. MENU TREE
    Leader LV5600 - MENU TREE - 4
flowchart
graph TD
    A["F2"] --> B["NET Q"]
    B --> C["F1"]
    C --> D["DISPLAY TEXT"]
    D --> E["F2"]
    E --> F["DUMP MODE HEX"]
    F --> G["F3"]
    G --> H["Q LOG CLEAR"]
    H --> I["F4"]
    I --> J["BIT MAX"]
    J --> K["F5"]
    K --> L["LINK A [A"]]
    L --> M["F6"]
    M --> N["INPUT SELECT"]
    N --> O["F7"]
    O --> P["USB MEMORY"]
    P --> Q["F8"]
    Q --> R["DATA TRIGGER"]
    R --> S["F9"]
    S --> T["UP menu"]

    subgraph Text / DUMP / Q LOG / FORMAT |
        U["F1"] --> V["COMPLETE"]
        W["F4"] --> X["ALL ON"]
        Y["F5"] --> Z["ALL OFF"]
        AA["F7"] --> AB["up menu"]
    end

    subgraph Text / DUMP / Q LOG / FORMAT
        AC["F1"] --> AD["A/L / B [B"] / A["C"] / B["D"] / 1["A"] / 3["C"] / 4["D"]]
        AE["F4"] --> AF["<<"]
        AG["F5"] --> AH[">>"]
        AI["F6"] --> AJ["CHAR SET"]
        AK["F7"] --> AL["up menu"]
    end

    subgraph Text / DUMP / Q LOG / FORMAT
        AM["F1"] --> AN["A/B / B [B"] / A["C"] / B["D"] / 1["A"] / 3["C"] / 4["D"]]
        AO["F4"] --> AP["A/B / B [B"] / A["C"] / B["D"] / 1["A"] / 3["C"] / 4["D"]]
        AQ["F5"] --> AR["A/B / B [B"] / A["C"] / B["D"] / 1["A"] / 3["C"] / 4["D"]]
        AS["F6"] --> AT["A/B / B [B"] / A["C"] / B["D"] / 1["A"] / 3["C"] / 4["D"]]
    end

    subgraph Text / DUMP / Q LOG / FORMAT
        AU["F1"] --> AV["A/B / B [B"] / A["C"] / B["D"] / 1["A"] / 3["C"] / 4["D"]]
        AW["F4"] --> AX["A/B / B [B"] / A["C"] / B["D"] / 1["A"] / 3["C"] / 4["D"]]
        AY["F5"] --> AZ["A/B / B [B"] / A["C"] / B["D"] / 1["A"] / 3["C"] / 4["D"]]
        BA["F6"] --> BB["A/B / B [B"] / A["C"] / B["D"] / 1["A"] / 3["C"] / 4["D"]]
    end
  1. MENU TREE
    Leader LV5600 - MENU TREE - 5
flowchart
graph TD
    A["INPUT SELECT"] --> B["F6"]
    C["ERROR CLEAR"] --> D["F7"]
    E["LIST CLEAR"] --> F["F4"]
    G["STATUS SETUP"] --> H["F5"]
    I["INPUT SELECT"] --> J["F6"]
    K["INPUT SELECT"] --> L["F7"]
    M["INPUT SELECT"] --> N["F6"]
    O["INPUT SELECT"] --> P["F7"]
    Q["INPUT SELECT"] --> R["F6"]
    S["INPUT SELECT"] --> T["F7"]
    U["INPUT SELECT"] --> V["F6"]
    W["INPUT SELECT"] --> X["F7"]
    Y["INPUT SELECT"] --> Z["F6"]
    AA["INPUT SELECT"] --> AB["F7"]
    AC["INPUT SELECT"] --> AD["F6"]
    AE["INPUT SELECT"] --> AF["F7"]
    AG["INPUT SELECT"] --> AH["F6"]
    AI["INPUT SELECT"] --> AJ["F7"]
    AK["INPUT SELECT"] --> AL["F6"]
    AM["INPUT SELECT"] --> AN["F7"]
    AO["INPUT SELECT"] --> AP["F6"]
    AQ["INPUT SELECT"] --> AR["F7"]
    AS["INPUT SELECT"] --> AT["F6"]
    AU["INPUT SELECT"] --> AV["F7"]
    AW["INPUT SELECT"] --> AX["F6"]
    AY["INPUT SELECT"] --> AZ["F7"]
    BA["INPUT SELECT"] --> BB["F6"]
    BC["INPUT SELECT"] --> BD["F7"]
    BE["INPUT SELECT"] --> BF["F6"]
    BG["INPUT SELECT"] --> BH["F7"]
    BI["INPUT SELECT"] --> BJ["F6"]
    BK["INPUT SELECT"] --> BL["F7"]
    BM["INPUT SELECT"] --> BN["F6"]
    BO["INPUT SELECT"] --> BP["F7"]
    BQ["INPUT SELECT"] --> BR["F6"]
    BS["INPUT SELECT"] --> BT["F7"]
    BU["INPUT SELECT"] --> BV["F6"]
    BW["INPUT SELECT"] --> BX["F7"]
    BY["INPUT SELECT"] --> BZ["F6"]
    CA["INPUT SELECT"] --> CB["F7"]
    CC["INPUT SELECT"] --> CD["F6"]
    CE["INPUT SELECT"] --> CD
    CF["INPUT SELECT"] --> DD["F7"]
    DE["INPUT SELECT"] --> DD
    DF["INPUT SELECT"] --> DG["F6"]
    DH["INPUT SELECT"] --> DG
    DI["INPUT SELECT"] --> DJ["F7"]
    DK["INPUT SELECT"] --> DL["F6"]
    DJ --> DV["F7"]
    DW["INPUT SELECT"] --> DX["F6"]
    DX --> DBF["F7"]
    DCG["INPUT SELECT"] --> DBD["F6"]
    DBG --> DCX["F7"]
    DCY["INPUT SELECT"] --> DCY
    DCZ["INPUT SELECT"] --> DCZ
    DCY --> DCX
    DCZ --> DCX
    DCX --> DCX
    DCX --> DCX
    DCX --> DCX
    DCX --> DCX
    DCX --> DCX
    DCX --> DCX
    DCX --> DCX
    DCX --> DCX
    DCX --> DCX
    DCX --> DCX
    DCX --> DCX
    DCX --> DCX
    DCX --> DCX
    DCX --> DCX
    DCX --> AC
    DCX --> AC
    DCX --> AC
    DCX --> AC
    DCX --> AC
    DCX --> AC
    DCX --> AC
    DCX --> AC
    DCX --> AC
    DCX --> AC
    DCX --> AC
    DCX --> AC
    DCX --> AC
    DCX --> AC
    DCX --> AC
    DCX --> AC
    DCX --> AC
    DCZ --> AD
    AD --> AE
    AE --> AF
    AF --> AG
    AG --> AH
    AH --> AI
    AI --> AJ
    AJ --> AK
    AK --> AL
    AL --> AM
    AM --> AN
    AN --> AO
    AO --> AP
    AP --> AQ
    AQ --> AR
    AR --> AS
    AS --> AT
    AT --> AU
    AU --> AV
    AV --> AW
    AW --> AX
    AX --> AY
    AY --> AZ
    AZ --> BA
    BA --> BB
    BB --> BC
    BC --> BD
    BD --> BE
    BE --> BF
    BF --> BG
    BG --> BH
    BH --> BH

21. MENU TREE

21.11 EYE Menu (SER02)
Leader LV5600 - MENU TREE - 1

flowchart
graph TD
    A["EYE"] --> B["F1"]
    B --> C["EYE/JITTER INTEN/CONFIG"]
    C --> D["F1"]
    D --> E["EYE/JITTER MODE EYE (EYE / JITTER)"]
    C --> F["F3"]
    F --> G["INTENSITY"]
    G --> H["F1"]
    H --> I["EYE INTENSITY 0 -128 ~ _0 ~ 127}"]
    G --> J["F1"]
    J --> K["JITTER INTENSITY 0 -128 ~ _0 ~ 127}"]
    G --> L["F3"]
    L --> M["EYE SCALE INTENSITY 4 -8 ~ _4 ~ 7}"]
    L --> N["F3"]
    N --> O["JITTER SCALE INTENSITY 4 -8 ~ _4 ~ 7}"]
    L --> P["F6"]
    P --> Q["INPUT SELECT"]
    P --> R["F7"]
    R --> S["up menu"]
    C --> T["F4"]
    T --> U["COLOR"]
    U --> V["F1"]
    V --> W["EYE COLOR WHITE"]
    V --> X["F1"]
    X --> Y["JITTER COLOR WHITE"]
    V --> Z["F3"]
    Z --> AA["EYE SCALE COLOR YELLOW"]
    V --> AB["F3"]
    AB --> AC["JITTER SCALE COLOR YELLOW"]
    V --> AD["F6"]
    AD --> AE["INPUT SELECT"]
    V --> AF["F7"]
    AF --> AG["up menu"]
    C --> AH["F5"]
    AH --> AI["ERROR SETUP"]
    AI --> AJ["F1"]
    AJ --> AK["COMPLETE"]
    AI --> AL["F2"]
    AL --> AM["PREV TAB"]
    AI --> AN["F3"]
    AN --> AO["NEXT TAB"]
    AI --> AP["F6"]
    AP --> AQ["INPUT SELECT"]
    AI --> AR["F7"]
    AR --> AS["up menu"]
    C --> AT["F6"]
    AT --> AU["INPUT SELECT"]
    C --> AV["F7"]
    AV --> AW["up menu"]
  1. MENU TREE
    Leader LV5600 - MENU TREE - 2
flowchart
graph TD
    A["F2"] --> B["GAIN/FILTER /SWEEP"]
    B --> C["F1"]
    C --> D["CAI (CAL / VARIABLE)"]
    C --> E["F2"]
    E --> F["GAIN MAG x8 (x1 / x2 / x4 / x8 / x16)"]
    C --> G["F3"]
    G --> H["FILTER 100kHz (100kHz / 10kHz / 1kHz / 100Hz / 10Hz / TIMING / ALIGNMENT)"]
    C --> I["F2"]
    I --> J["Sweep 4UI (2UI / 4UI / 16UI)"]
    C --> K["F2"]
    K --> L["Sweep 1H (1H / 2H / 1V / 2V)"]
    C --> M["F6"]
    M --> N["INPUT SELECT"]
    C --> O["F7"]
    O --> P["up menu"]

    Q["F3"] --> R["PEAK HOLD"]
    R --> S["F1"]
    S --> T["PEAK HOLD OFF (ON / QEE)"]
    R --> U["F2"]
    U --> V["CLEAR"]
    R --> W["F6"]
    W --> X["INPUT SELECT"]
    R --> Y["F7"]
    Y --> Z["up menu"]

    AA["F4"] --> AB["CURSOR"]
    AB --> AC["F1"]
    AC --> AD["CURSOR OFF (ON / OFF)"]
    AB --> AE["F2"]
    AE --> AF["XY SEL X (X / Y / Tr, Tf)"]
    AB --> AG["F3"]
    AG --> AH["X UNIT sec. (sec. / Hz / Ulp-p)"]
    AB --> AI["F3"]
    AI --> AJ["Y UNIT V (V. / %)"]
    AB --> AK["F4"]
    AK --> AL["FD VALUE REF (REF / DELTA / TRACK)"]
    AB --> AM["F5"]
    AM --> AN["REF SET"]
    AB --> AO["F6"]
    AO --> AP["CURSOR RESET"]
    AB --> AQ["F7"]
    AQ --> AR["up menu"]

    AS["F5"] --> AT["TRIGGER RUN (RUN / STOP)"]
    AT --> AU["F6"]
    AU --> AV["INPUT SELECT"]
    AT --> AW["F7"]
    AW --> AX["DISPLAY MODE SINGLE (SINGLE / DUAL)"]

21. MENU TREE

21.12 MULTI menu
Leader LV5600 - MENU TREE - 1

flowchart
graph TD
    A["MULTI"] --> B["F1"]
    A --> C["F2"]
    A --> D["F3"]
    A --> E["F4"]
    A --> F["F5"]
    A --> G["F6"]
    A --> H["F7"]
    B --> I["LAYOUT SELECT USER 1 (USER 1 / USER 2 / USER 3 / USER 4 / USER 5 / USER 6)"]
    C --> J["LAYOUT USER 1"]
    D --> K["MULTI WFM"]
    D --> L["LAYOUT USER 2"]
    D --> M["MULTI VECTOR"]
    E --> N["LAYOUT USER 3"]
    E --> O["MULTI PICTURE"]
    F --> P["LAYOUT USER 4"]
    F --> Q["MULTI AUDIO"]
    G --> R["LAYOUT USER 5"]
    G --> S["MULTI STATUS"]
    H --> T["LAYOUT USER 6"]
    H --> U["MULTI EYE"]

22. Firmware Update History

22. FIRMWARE UPDATE HISTORY

This manual is written for firmware version 2.0.

You can view the firmware version by pressing F•3 SYSTEM INFO on the SYS menu.

- Ver. 2.0

- [LV5600/LV7600] Network control functions (Telnet, FTP, SNMP, Web server, LV7290) are now supported.

- [LV5600/LV7600] Reduced the time until the start logo appears after power-on by 15 to 20 seconds.

- [SER01/SER02] The frame capture function supports 16 frames for manual mode and error triggers.

- [SER01/SER02] External sync signal waveform display is now supported.

- [SER01/SER02] XYZ color matrix signals are now supported.

- [SER01/SER02] English and European closed captions are now supported.

- [SER01/SER02] Japanese closed captions are now supported for 4K systems.

- [SER01/SER02] NET-Q is now supported for 4K systems.

• [SER03] Loudness is now supported.

• [SER05] Added an IP packet header analysis display.

• [SER05] IP event log is now supported.

• [SER05] NMOS (IS-04) is now supported.

• [SER05] Added an SFP information display function.

• [SER05] ST2110-30 (audio) is now supported.

- [SER05] Added a message rate setting to PTP Setup on the IP SETUP2 tab.

• [SER23] Full range is now supported in HLG and PQ modes.

- Ver. 1.4

- [SER01/SER02] Improved so that HDR can be selected for the V cursor value display on the waveform display when the variable gain function is enabled in HDR mode.

- [SER01/SER02] Histogram was added to the vectorscope display.

- [SER01/SER02] Improved so that the individual settings of streams 1 and 2 work for the 3G-B-DS system in the waveform color setting of the vector display.

- [SER01/SER02] Improved so that BT.709 and BT.2020 scale and caption are displayed on the initial chromaticity diagram screen.

- [SER01/SER02] Improved so that the background of the Japanese closed caption display on the picture is changed from black to transparent in sync with the on/off state of the status information.

- [SER05] LV5600-SER05 and LV7600-SER05 (10G IP INPUT) are now supported.

Index

%

%DISPLAY SETUP....327

0

OH TIMING 397

1

18% REF-SET 299

3

3G-B-DS DISPLAY 215, 249, 281

4

4Y PARADE....215

5

5BAR 260

5BAR SCALE 261

5BAR SEQUENCE....263

7

75% COLOR SCALE 219

A

AFD 425

ALIGN 353, 354

ALL COPY INT->USB 209

ALL COPY USB->INT 210

ALL INIT ....193

ANC DATA VIEWER....412

ANC DUMP....413

ANC PACKET 415

ARIB....419

ASPECT MARKER....283

ASPECT SHADOW....285

AUDIO 332

AUTO FILENAME 293, 386

AUTO GAIN.... 348, 350

AV MEASURE LINK ....316

AV MEASURE RIGHT 316

AV MEASURE TOP 316

AV MESURE LEFT 316

AV PHASE 316, 399

AV PHASE SETUP 401

B

B BIAS[%] 278

B GAIN[%]......278

BIAS 278

BIT MASK 422

BLANKING 233

BRIGHTNESS[%] 277

C

CAL F 303

CAL SET 303

CAP....194

CENTER MARKER 282

CHANNEL STATUS.... 353

CHART SETUP 406

CHROMA GAIN[%] 278

CHROMA UP 277

CIE DIAGRAM....267

CIE DIAGRAM SCALE 267

CIE DIAGRAM SETTING 272

CIE STANDARD....272

CINELITE 297

CINELITE ADVANCE 308, 329

CINELITE DISPLAY....297, 326

CINELITE/HDR 326

CINEZONE 309

CINEZONE FORM 309

CINEZONE SETUP 328

CLEAR 291, 295, 331, 385, 445, 452

CLIP 273

CLOSED CAPTION 419

COLOR 268,434

COLOR BAR....258

COLOR MATRIX 240, 257

COLOR SYSTEM....240, 257

COMMENT INPUT....205

COMPOSITE FORMAT 242, 259

CONTRAST[%] 277

CONTROL PACKET 418

CS LOG 290

CURSOR....234, 446, 453

CURSOR RESET 450, 455

CURSOR VALUE....236

CUSTOM SEARCH ....426

D

D65....271

DATA DUMP 388

DATA TRIGGER 423

DELETE 208

DELETE FILE....198, 204

DID 426

DISPLAY..84, 195, 202, 346, 392, 417, 418, 419, 420, 423, 425

DISPLAY CHANNEL 353, 354

DISPLAY MODE ....272, 337, 450, 455

DUMP MODE. 414, 417, 418, 419, 422, 423, 424, 425, 427

DUMP OPERATION....390

DYNAMIC RANGE 342

E

EDGE COLOR 314

EDH....417

End Time....292

ERROR CLEAR....381

ERROR RESET....354

ERROR SETUP....340, 372, 435

EVENT LOG.... 352, 381

EXT REF PHASE....395

EXT.SYNC COLOR 244

EXT.SYNC INTENSITY 244

EXTERNAL SYNC 244

EYE....428

EYE COLOR....434

EYE INTENSITY....433

F

f STOP SETUP ....298

FD 1CLICK....391

FD FUNCTION....391

FD VALUE....236

FD VAR 449, 454

FIELD....229, 239, 256, 316

FILE DELETE 294, 387

FILE LIST.... 303

FILE LOAD 303

FILTER....222, 273, 443, 451

FOCUS....313

FOCUS ASSIST 313

FORM 347

FORMAT....288, 289

FRAME MARKER....282

G

G BIAS[%] 278

G GAIN[%] 278

GAIN 221, 278

GAIN MAG.... 221, 253, 451

GAIN VARIABLE.... 221, 253, 443

GAIN/BIAS....278

GAIN/FILTER 221

GAIN/FILTER/SWEEP....443, 450

GAMMA....303

GAMMA CAL....303

GAMMA FILE 303

GAMMA SELECT....299, 303

GAMMA SETUP 273

GAMUT ERR. DISPLAY 279

GRADATE....309

GRID 271

GROUP 418

H

H POS 212,432

H SWEEP 228

HDR 317

HDR ZONE 328

HISTGRAM 264

HISTGRAM FORM 264

HISTGRAM SCALE 325

HISTGRAM SETUP....266

HOLD TIME 413

I

ID SET 426

INDICATION SETTING 279

INIT CANCEL....192, 193

INITIALIZE....192

INPUT SELECT....86

INTENSITY 433

IP 404

IQ AXIS....251

J

JITTER INTENSITY ....433

JUMP 390

L

LANGUAGE 288, 289

LAYOUT INIT ....193

LCD BACK LIGHT....191

LCD OFF....191

LEVEL SETTING 344

LICENSE....190

LINE SEL 274

LINE SELECT 238, 255, 315

LINK394, 412, 415, 417, 418, 420, 422, 423, 424, 426, 427

LISSAJOU INTEN....345

LISSAJOU SETUP....345

LOG....385

LOG MODE....291, 385

M

MAGAZINE....296

MANUAL SETUP....273

MAPPING....333

MARKER 254, 282

MAX FALL/CLL....330

MAX FALL/CLL DISPLAY 330

MEASURE 330

MEASURE NUMBERS....302

MEASURE POSITION....302

MEASURE SIZE 302

MEM 205

METER SETUP....342

MODE 391,432

MONO/COLOR....277

N

NAME INPUT....293, 386

NET-Q....420

SCALE DISPLAY....219, 245, 322

SCALE INTEN....216, 244, 345, 349

SCALE INTENSITY 250, 433

SCALE JUMP 225

SCALE MAX....400

SCALE SELECT 252

SCALE SETTING 217, 219, 245

SCALE UNIT....217, 245

SDI / IP ANALYSIS....404

SDI ANALYSIS....388, 395, 399

SDID/DBN 426

SENSITIVE 314

SERCH 312

SERVICE DATA....288

SET 426

SETUP....243, 260

SIGNAL IN OUT....143

SMPTE 425

SRAM/FLASH INIT....192

STANDARD 288

Start Time....292

STATUS....367

STATUS INFORMATION 280

STAUS SETUP 351

STEP....310

STORE 196, 203, 205

STREAM SELECT ...... 412, 417, 418, 426, 427

STREAM1 COLOR 216, 248

STREAM2 COLOR 216, 248

SUB 394, 412, 415, 417, 418, 426, 427

SUB SCALE....271

SUPER IMPOSE ......288

SURROUND 5.1....350

SURROUND INTEN 349

SURROUND SETUP ....348

SWEEP 227, 444, 451

SWEEP MAG 230

SYS 143

SYSTEM INFO ....189

SYSTEM SETUP ....164

T

TABLE CLEAR....303

TEMP SCALE 271

TIMECODE SET 292

TRIANGLE CAPTION ......271

TRIANGLE1 269

TRIANGLE2 269

TRIGGER 200, 450, 455

TYPE 419

U

UNIT SELECT 300

USB MEMORY 293, 386, 394

USER BIT 354

USER DATA 1 424

USER DATA 2 424

USER TRIANGLE 269, 270

V

V POS....212, 432

V SWEEP 229

V-ANC 419, 425

VECT 246

VECT INTEN/CONFIG 247

VECTOR COLOR....248

VECTOR DISPLAY....247

VECTOR GAIN 253

VECTOR INTENSITY 248

VECTOR SCALE....250

W

WFM 211

WFM COLOR....216

WFM INTEN/CONFIG....213, 244

WFM INTENSITY....215

WFM MODE....213, 214

WFM SCALE 216, 244

WST TRANSPORT 296

X

X UNIT 236,449,454

XY SEL 447, 453

XY SELECT 234

Y

Y UNIT 235, 324, 449, 454

Y/C SELECT....427

YGBR....242

YRGB 242

所含有毒有害物质信息

部件号码:LV 5600

Leader LV5600 - 部件号码:LV 5600 - 1

Head office Sales Department

Tel 81-45-541-2123

Fax 81-45-541-2823

Email sales@leader.co.jp

Leader Electronics Corporation

2-6-33 Tsunashimahigashi, Kohoku-ku, Yokohama-shi,

Kanagawa, 223-8505, Japan

www.leader.co.jp

Oct. 29, 2018

Ver.3 (Firmware Ver. 2.0)

Table of contents Click a title to access it
Manual assistant
Powered by Anthropic
Waiting for your message
Product information

Brand : Leader

Model : LV5600

Category : Measurement