
PQ55A - Energy meter Amprobe - Free user manual and instructions
Find the device manual for free PQ55A Amprobe in PDF.


| Product Type | Portable 3-phase Power and Energy Analyzer |
| Dimensions (Instrument) | 235 x 117 x 54 mm |
| Weight (Instrument with batteries) | Approx. 730 g |
| Power Supply | 8 x 1.5V LR6 alkaline batteries (typical 50 h life) or mains adapter 12-15V/300 mA |
| Voltage Measurement Range | 0 to 600 Vrms (display up to 999.9 Vrms) |
| Current Measurement Range | 3 A to 999.9 A (inputs I1,I2,I3); 3 A to 250 A (input I4) |
| Voltage Accuracy | ±(1% of reading + 10 digits) for >80 V |
| Current Accuracy | ±(2.5% of reading + 15 digits) |
| Active Power Accuracy (PF ≥ 0.5) | ±(3.5% of reading + 20 digits); for PF < 0.5: ±(4.5% of reading + 40 digits) |
| Frequency Measurement Range | 45 to 80 Hz |
| Data Logger | 512 kB non-volatile memory; max. 21,000 values in up to 10 series |
| Manual Data Memory | Max. 99 individual measurements |
| Interface | Optically isolated RS-232 |
| Display | Multi-function LCD with backlight (auto-off after 30 s) |
| Included Accessories | 4 current clamps (1000 A), 4 alligator clips, 4 safety test leads, mains adapter, RS-232 cable, carrying bag, PC software CD |
| Safety Standards | CAT III 600V, double insulation, IP30 |
| Warranty | 1 year from date of purchase |
| Operating Temperature | 0°C to +50°C (max. 80% RH) |
| Storage Temperature | -10°C to +60°C (max. 70% RH) |
Frequently Asked Questions - PQ55A Amprobe
User questions about PQ55A Amprobe
0 question about this device. Answer the ones you know or ask your own.
Ask a new question about this device
Download the instructions for your Energy meter in PDF format for free! Find your manual PQ55A - Amprobe and take your electronic device back in hand. On this page are published all the documents necessary for the use of your device. PQ55A by Amprobe.
USER MANUAL PQ55A Amprobe
Limited Warranty and Limitation of Liability
Your Amprobe product will be free from defects in material and workmanship for 1 year from the date of purchase. This warranty does not cover fuses, disposable batteries or damage from accident, neglect, misuse, alteration, contamination, or abnormal conditions of operation or handling. Resellers are not authorized to extend any other warranty on Amprobe's behalf. To obtain service during the warranty period, return the product with proof of purchase to an authorized Amprobe Test Tools Service Center or to an Amprobe dealer or distributor. See Repair Section for details. THIS WARRANTY IS YOUR ONLY REMEDY. ALL OTHER WARRANTIES - WHETHER EXPRESS, IMPLIED OR STAUTORY - INCLUDING IMPLIED WARRANTIES OF FITNESS FOR A PARTICULAR PURPOSE OR MERCHANTABILITY, ARE HEREBY DISCLAIMED. MANUFACTURER SHALL NOT BE LIABLE FOR ANY SPECIAL, INDIRECT, INCIDENTAL OR CONSEQUENTIAL DAMAGES OR LOSSES, ARISING FROM ANY CAUSE OR THEORY. Since some states or countries do not allow the exclusion or limitation of an implied warranty or of incidental or consequential damages, this limitation of liability may not apply to you.
Repair
All test tools returned for warranty or non-warranty repair or for calibration should be accompanied by the following: your name, company's name, address, telephone number, and proof of purchase. Additionally, please include a brief description of the problem or the service requested and include the test leads with the meter. Non-warranty repair or replacement charges should be remitted in the form of a check, a money order, credit card with expiration date, or a purchase order made payable to Amprobe® Test Tools.
In-Warranty Repairs and Replacement – All Countries
Please read the warranty statement and check your battery before requesting repair. During the warranty period any defective test tool can be returned to your Amprobe® Test Tools distributor for an exchange for the same or like product. Please check the "Where to Buy" section on www.amprobe.com for a list of distributors near you. Additionally, in the United States and Canada In-Warranty repair and replacement units can also be sent to a Amprobe® Test Tools Service Center (see address below).
Non-Warranty Repairs and Replacement – US and Canada
Non-warranty repairs in the United States and Canada should be sent to a Amprobe® Test Tools Service Center. Call Amprobe® Test Tools or inquire at your point of purchase for current repair and replacement rates.
In USA In Canada
Amprobe Test Tools Amprobe Test Tools
Everett, WA 98203 Mississauga, ON L4Z 1X9
Tel: 877-AMPROBE (267-7623) Tel: 905-890-7600
Non-Warranty Repairs and Replacement – Europe
European non-warranty units can be replaced by your Amprobe® Test Tools distributor for a nominal charge. Please check the "Where to Buy" section on www.amprobe.com for a list of distributors near you.
European Correspondence Address*
Amprobe® Test Tools Europe
P.O. Box 1186
5602 BD Eindhoven
The Netherlands
*(Correspondence only – no repair or replacement available from this address.
European customers please contact your distributor.)
Contents
Introduction/ Contents ....4
Safety Information....5
Appropriate Usage ....5
Transport and Storage....5
Power Supply....6
Operation Elements and Connections....6
Casing bottom 8
Display 8
General information 11
Carrying out Measuremetns....11
Connection Power Supply....11
Single-phase Power Measurement – Type of connection 1P2W ....12
Two-phase Power Measurement - Type of Connection 1P3W ....14
Three-phase Power Measurement, Aron connection – type of connection 3P3W2M .....16
Three-phase Power Measurement, Star connection – type of connection 3P4W ....18 Single-phase Current Measurement....20
Data Memory – Saving individual measurements ....21 Recording with the Data Logger....21
Delete Measurement Data within the Data Logger 21
Basic Settings....22
Performing a Recording....22
Determining the Rotary Field....23
Curve Shape and Harmonic Wave Measurement ....24
Connection to the PC Interface....24
Windows-Software....24
System Requirements 24
Installation 25
Program Functions 25
Online Register: Online Measurement....26
Ordinal number of the harmonics: 29
Harmonics Register: Harmonics Measurement 30
Data logger Register : Data Logger – Anaylsis of the Data ....32
Saved Data Register: Analysis of Data saved on the PC 36
Maintenance....37
Cleaning 37
Calibration Interval....37
Replacement of batteries....37
Round Cells 38
Technical Data 39
References marked on instrument or in users manual
 | Warning of a potential danger, comply with users manual. | [YS2B] | Equipment protected throughout by double insulation or reinforced insulation IEC 61140. |
 | Caution! Dangerous voltage. Danger of electrical shock. | [ACBB] | Conformity symbol, the instrument complies with the valid directives. It complies with the EMC Directive (89/336/EEC) and the Low Voltage Directive (73/23/EEC) with their valid standards. |
 | Conforms to Relevant Australian Standards | ||
| Reference. Please use utmost attention. | Symbol for the marking of electrical and electronic equipment (WEEE Directive 2002/96/EC). |
The users manual contains information and references, necessary for safe operation and maintenance of the instrument.
Prior to using the instrument (commissioning / assembly) the user is kindly requested to thoroughly read the users manual and comply with it in all sections.
Failure to read the users manual or to comply with the warnings and references contained herein can result in serious bodily injury or instrument damage.
Introduction/ Contents
The Amprobe PQ55A Power Analyzer is a portable measurement instrument for power measurements within public mains supplies. The power measuring device is characterized by the following features:
Characteristics
- Portable 3-phase power and energy measurement instrument
- Comprehensive real time monitoring, recording and analysis of three-phase systems
Measurement functions:
Voltage (rms)
Current (rms)
Power (active, apparent and idle power)
Power factor, phase angle
- Multi-functional measurement value display
- Internal data logger of 512 kb for long-term monitoring
- Internal data memory for max. 99 individual measurements
- Power supply either via batteries or via external mains adapter
• Data transfer via optically isolated RS 232 interface - Windows software for data analysis and instrument control.
Contents
1 piece Power Analyzer
4 pieces current clamps 1000 A
4 pieces alligator clips, isolated
4 pieces safety test leads
8 pieces 1.5 V batteries LR6
1 piece mains adapter
1 piece RS-232 cable
1 piece large carrying bag
1 piece operation instructions
1 piece PC software (for Windows ME/2000/XP),
⚠️ ⚠ Safety Information
- The respective accident prevention regulations established by the professional associations for electrical systems and equipment must be strictly met at all times.
- The instrument may only be connected to input voltage as indicated on the back decal.
- In order to avoid electrical shock, the valid safety and national regulations regarding excessive contact voltages must receive utmost attention, when working with voltages exceeding 120V (60V) DC or 50V (25V) rms AC. The values in brackets are valid for limited ranges (as for example medicine and agriculture).
- Measurements in dangerous proximity of electrical installations are only to be executed when instructed by a responsible electrical specialist, and never alone.
- If the operator's safety is no longer ensured, the instrument is to be put out of service and protected against use. The safety is no longer insured, if the instrument:
- shows obvious damage
- does not carry out the desired measurements
- has been stored for too long under unfavourable conditions
- has been subjected to mechanical stress during transport.
- The instrument may only be used within the operating ranges as specified in the Specification section.
- Avoid any heating up of the instrument by direct sunlight to ensure proper functioning and long instrument life.
- Never try to disassemble battery cells! The battery contains highly alkaline electrolyte. Danger of causticization. If electrolyte gets in contact with skin or clothing, rinse immediately with water. If electrolyte gets in contact with the eyes, immediately flush by using pure water and consult a doctor.
- Never try to make contact between both battery cell poles, for example by using a wire connection. The resulting short-circuit current is very high and causes extreme heat. Danger of fire and explosion.
- Never throw battery cells into a fire as this could cause an explosion.
- Never expose batteries or accumulators to humidity.
- When replacing or changing the battery, make certain of correct polarity.
- Only use batteries as described in the specifications
⚠️ Appropriate Usage
- The instrument may only be used under those conditions and for those purposes for which it was conceived. For this reason, in particular the safety references, the specifications including environmental conditions and the usage in dry environments must be followed.
- When modifying or changing the instrument, the operational safety is no longer ensured.
⚠️ Transport and Storage
- Please keep the original packaging for later transport, e.g. for calibration. Any transport damage due to faulty packaging will be excluded from warranty claims
- In order to avoid instrument damage, it is advised to remove batteries when not using the instrument over a certain time period. However, should the instrument be contaminated by leaking battery cells, you are kindly requested to return it to the factory for cleaning and inspection.
- Instruments must be stored in dry and closed areas. In the case of an instrument being transported in extreme temperatures, a recovery time of minimum 2 hours is required prior to instrument operation.
Power Supply
The power to the unit is realized by means of a mains adapter or by six 1.5 volt batteries.
The mains adapter may only be connected to input voltage as indicated on the name plate.
⚠️ Never use the batteries and the mains adapter simultaneously as the batteries will warm up and can explode.
⚠️ Only the mains adapter shipped with the PQ55A may be connected and used.
Operation Elements and Connections
Side view – connecting fields

| 1. | Connections for voltage measurement (U1, U2, U3, N)The 3 input ports are not galvanically isolated, they have the common reference point “N” (neutral).Only safety test leads with CAT III 600V ratings are to be used. | |
| 2. | Connections for clamp adapter (I1, I2, I3, I4=N, neutral)The correct assignment of connections regarding voltage and current must imperatively be observed. |
Front view – operation elements

Figure: Front view – operation elements
| 3. | Lateral connection for electric power supply. The instrument may only be connected to the mains adapter shipped with the PQ55A or a mains adapter complying with the data defined within the specification section. | |
| 4. | Lateral optically isolated connection for the RS-232 interface | |
| 5. | LCD (liquid crystal display) | |
| 6. |  | Key for type of connection. Function key to select the type of connection. Selection can be made among the following type of connections (please also refer to chapter 5.3.1 Connection to the electric power supply system): 1P2W: ......single phase power measurement1P3W: ......two-phase power measurement3P3W2M: ......three-phase power measurement, Aron connection3P4W: ......three-phase power measurement, star connection |
| 7. |  | Key for rotary field determination. The rotary field is determined when selecting the type of connection "3P4W" by pressing this key and is indicated on the display as follows:123: clockwise rotary field123: counterclockwise rotary field |
| 8. |  | Key for Data Hold, to hold the display value. If the HOLD function is activated, the symbol [HOLD] is displayed on the screen. |
| 9. |  | Key for display illumination (backlight)The backlight switches off automatically after approx. 30 seconds. |
| 10. |  | Power factor indication. Key to switch to the power factor indication. If the display selection is switched on, the symbol "PF" is indicated. |
| 11. |  | Phase angle indication. Key to commute to the phase angle indication. If the display selection is switched on, the symbol "0" is indicated. |
| 12. |  | Mains frequency indication. Key to commute to the mains frequency display. If the display selection is switched on, the symbol "Hz" is indicated. |
| 13. |  | Indication of current measurement via clamp 4. Key to switch to indicate the current measurement via input "I4". If the display selection is switched on, the symbol "I4 A" is indicated. |
| 14. |  | Time setting. Key used to activate the time setting. Simultaneous pressing of keys "SET" and "TIME" activates the date and time setting as well as the sampling rate. |
| 15. |  | Key used to display the date and time. Reference: This display is automatically switched off after approx. 10 seconds. |
| 16 |  | Navigation keys. Keys used to set the time and to call the memorised values. |
| 16a. | [77SG] | ENTER key to confirm any setting |
| 17. |  | Data logger - Key to start the recording of measurement valuesIf the recording function is activated, the symbol [M] blinking with the preset measurement rate. Below, the number of the current series of measurements is displayed. |
| 18. |  | Dater logger - Key to terminate the recording of measurement values. |
| 19. |  | Measurement data memory - Key to save individual measurement data. When saving a measurement, the symbol [M] is briefly displayed on the screen with the indication of the storage place number below. It is possible to save up to 99 measurement values. |
| 20 |  | Measurement data memory - Key to save individual measurement data.If After selecting the display of measurement data, the symbol [R] is displayed. The navigation keys 5 and 6 are used to select and display the measurement values, starting with the first storage place. The memory mode can be left again when pressing the key. |
| 21 |  | Power display. Toggle switch to change the display of power data. The selected display is characterised on the screen as follows:t = total value1 = phase 12 = phase 23 = phase 3 |
| 22 |  | Energy measurementKey to change to the energy data display |
| 23 |  | Keyboard lock - The activated keyboard lock can be recognised by the “LOCK” symbol. It is not possible to lock keys and |
| 24 |  | Key to switch on and off. When switching the instrument On/Off and Backlight, the auto-power-off function is automatically activated, i.e. 30 minutes after the last keystroke, the instrument switches off automatically. To perform longterm measurements for example, the auto-power-off function must be deactivated as follows:1)Switch off the instrumentPress the “HOLD” key and keep it pressed while switching on the instrument. Keep the “HOLD” key pressed until the total display appears. If the HOLD function has also be activated, press the “HOLD” key again. If the HOLD function has also be activated, press the “HOLD” key again. auto-power-off function has been deactivated, the symbol ø is no longer displayed on the screen ø. auto-power-off function has been deactivated, the symbol ø is no longer displayed on the screen ø. |
Casing bottom
The instrument stand and the battery case are located at the instrument bottom.
Display


The multi-function display contains the currently measured primary quantities. The display format and the units (V, kV, A, kA, W, kW, MW etc...) are automatically displayed in compliance with the selected values.
The following symbols and values are displayed:
| 5.1 | 0 Auto-power-off function is activated |
| 5.2 | P1 Display of the active power on phase 1P2 Display of the active power on phase 2P3 Display of the active power on phase 3Pt Display of the total active power |
| 5.3 | HOLD] Activated HOLD fonction |
| 5.4 | Display value for active power |
| 5.5 | Unit of the active power: kW or Unit of the energy: kWh or MWh |
| 5.6 | Unit of the idle power: kvar or Unit of the energy: kvarh or Mvarh |
| 5.7 | Display value for idle power |
| 5.8 | Q1 display of the idle power on phase 1Q2 display of the idle power on phase 2Q3 display of the idle power on phase 3Qt Display of the total idle powerA negative sign “-” indicates a leading current. |
| 5.9 | DATA No.xx Display of the storage place. Manual data memory: display of the last saved manual measurement value (01 through 99). Data logger: display of the last saved series of measurements (01 through 10)Maximum 10 series of measurements or 21.000 measurement values can be saved.If “FF” is displayed, the data memory is full.If “00” is displayed, the data memory is empty. |
| 5.10 | M] display for active saving processThe symbol [M] is briefly displayed for manual measurement data saving.The symbol is permanently displayed for active data logger recording and is briefly hidden during automatic saving.[R] display of individually saved measurement valuesDATA [R] No. xx display of the storage place for the measurement value |
| 5.11 | 1P2W single-phase power measurement1P3W two-phase power measurementP3W2M three-phase power measurement, Aron connection3P4W three-phase power measurement, start connection |
| 5.12 | PF1 –power factor display on phase 1PF2 power factor display on phase 2PF3 power factor display on phase 3PFt –display of the total power factorA negative sign “-” indicates a leading current. |
| 5.13 | Display value of additional display |
| 5.14 | [LOCK] keyboard lock is active |
| 5.15 | [BT] display for used batteries |
| 5.16 | display of phase angle ° unit of phase angle |
| 5.17 | display of the current measured via input “l4” |
| 5.18 | unit of the current |
| 5.19 | unit of the frequency |
| 5.20 | unit of the apparent power: kVA or unit of the energy: kVAh or MVAh |
| 5.21 | display value of apparent power |
| 5.22 | S1 display of apparent power on phase 1S2 display of apparent power on phase 2S3 display of apparent power on phase 3St display of the total apparent power |
| 5.23 | U1 or U12 display of voltage on phase 1 (U1) or the conductor voltage U12 |
| 5.24 | Y-M display for year (Y) and month (M) |
| 5.25 | display value for voltage or date |
| 5.26 | U2 or U23 display of voltage on phase 2 (U2) or the conductor voltage U23 |
| 5.27 | D-h display for day (D) and hour (h) |
| 5.28 | display value for voltage or date/ time |
| 5.29 | <-123 or 123-> display of the rotary field |
| 5.30 | U3 display for voltage on phase 3 |
| 5.31 | m-s display for minute (m) and second (s) |
| 5.32 | display value for voltage or time |
| 5.33 | units for phase 3 |
| 5.34 | 250 A, 500 A, 1000 A display of current measurement rangeChange-over over is carried out automatically (autorange function). |
| 5.35 | Display value for current or time |
| 5.36 | units for phase 2 |
| 5.37 | display value for current or date/ time |
| 5.38 | 1000 V display of voltage measurement range |
| 5.39 | units for phase 1 |
| 5.40 | display value for current or date |
| 5.41 | STOP display for final time of the energy calculation |
| 5.42 | INTV display for preset sampling rateThe following settings are possible:5 s, 30 s, 1 min, 2 min. |
| 5.43 | STAR display of starting time for energy caculation |
| 5.44 | TIME display for date and time |
Preparation for Operation
Before putting the instrument into operation, the batteries must be installed. The steps described
in point 2.0 regarding the handling of batteries must imperatively be observed.
Installing the Batteries
1) Unscrew both screws of the battery compartment cover on the casing rear.
2) Remove the battery compartment cover.
3) Insert the batteries supplied observing correct polarity
The correct battery position is shown on the inside of the battery compartment.
4) Replace the battery compartment cover and retighten the screws.
Backside

General information
⚠ The safety references must be followed.
The respective accident prevention regulations established by the professional associations for electrical systems and equipment must be strictly met at all times.
Carrying out Measurements
Connection Power Supply
The respective accident prevention regulations established by the professional associations for electrical systems and equipment must be strictly met at all times.
⚠ To avoid electric shock, safety measures must be observed when working with voltages higher than 120 V (60 V) DC or 50 V (25 V) RMS AC. These are the values of threshold contact voltages given by DIN VDE. The values in brackets apply to medical and agricultural applications.
⚠️ Measurements in dangerous proximity of electrical installations are only to be executed when instructed by a responsible electrical specialist, and never alone.
⚠️ Before connecting the test leads, the measurement instrument must be set to the correct type of connection.
⚠ The correct connection assignment for voltage and current must imperatively be observed.
Phase assignment: The measurement inputs may not be exchanged. I.e. if, for example, the voltage clips for the first phase are connected to voltage input U1, the current clamp pertaining to this phase must be connected to current input I1. Observe the markings of the clamp adapters and the connection field.
⚠️ Before connecting the test leads, determine the neutral conductor for N input using an appropriate measurement instrument
The test leads and test probes may only be touched at the handles provided for this purpose. Any direct contact with the test probes must imperatively be avoided.
The measurement inputs U1, U2, and U3 are galvanically connected. Input N is the common reference point. Measurement inputs which are not required may not be connected!
When using clamp adapters, special care has to be applied that they are connected to a measurement instrument before they surround a live conductor. Open clamp adapter outputs can be dangerous for the user and can lead to the destruction of the clamp adapter, caused by high induction voltages.
When connecting clamp adapters, special care has to be applied that the arrow marked on the current clamps (direction of current flow) must point from the electric power supply to the load. I.e. the printed arrow must point to the electric power supply.
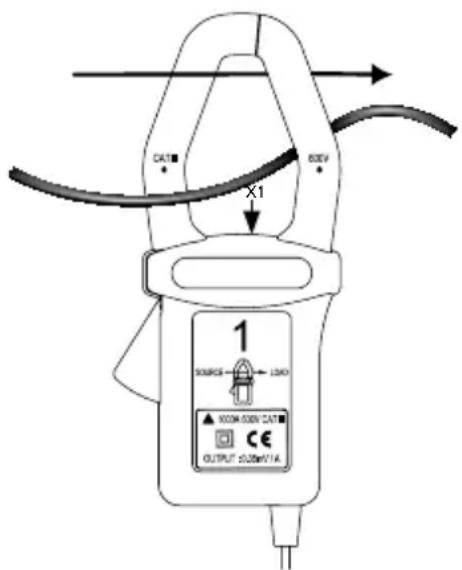
Shaft direction (X1)
If a clamp is connected in the opposite direction, the power measured at this phase would appear to be negative.
As the voltage input U1 represents the main signal for the Power Analyzer, this input must always be connected, i.e. even for measurements of U2, U3, I1, I2, and I3. If this input is not connected or if no voltage is present, the measurement instrument will not record any measurement values.
Single-phase Power Measurement – Type of connection 1P2W
1) Switch on the instrument.
2) Select the type of connection 1P2W using the "Wiring" function key (6). After selection, the following display is indicated with the symbol 1P2W (5.11):

Display type of connection 1P2W
3) The measurement inputs are connected as illustrated in the following drawing:

Type of connection 1P2W
L1: phase
N: neutral conductor
G: protective earth
Shaft direction (X1) (see also page 12).
Current flow direction: The printed arrow on the clamp adapter must point to the electric power supply.
Connect the test leads to the measurement instrument as follows:
1) Connect black test lead to socket N.
2) Connect red test lead to socket U1.
3) Connect clamp adapter 1 to socket I1.
4) If required, connect clamp adapter 4 to socket I4.
This connection can be used to monitor the protective earth current.
Now, connect the tests leads and the clamp adapter to the electric power supply to be tested using
the alligator clips.
1) Connect black test lead to neutral conductor N.
2) Connect red test lead to phase L1.
3) Open the clamp adapter 1 using the clamp opening lever and surround the live phase L1.
Make sure that the clamp completely surrounds the conductor and that there is no air gap.
4) If required, connect the clamp adapter 4 in the same way to the protective earth. The current measurement values are indicated on the display.
The following additional measurement values can be selected subsequently and indicated on the additional display (5.13):
 | To display the mains frequency, press the “Hz” key (12). |
 | To display the phase angle, press the 0 key (11). |
 | To display the power factor, press the “PF” key (10). |
 | If required, press the “I4” key (13) to display the protective earth current |
 | Individual measurements may be saved using the “M/MEMORY” key (19) |
 | To measure the energy values, press the “ENERGY” key (22). |
When this measurement type is selected, the automatic-power-off function of the instrument is deactivated.
The following values are displayed.
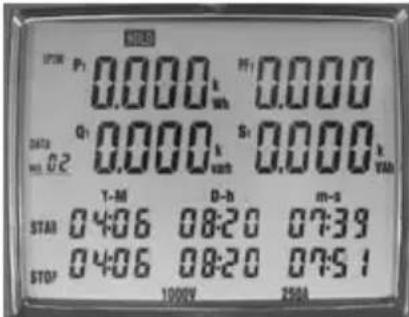
Display Measurement type energy
In the lower part, the starting time of the measurement is displayed in the "STAR" line (5.43). Below, the current date and time are displayed during the measurement. I.e. the energy values are permanently calculated during running display.
In the upper part of the display, the total values for the active power (5.4), the idle power (5.7), the apparent power (5.21), and the power factor (5.13) are displayed (to be recognised by the suffix "t").
 | The measurement is terminated when pressing the STOP key (18).The [HOLD] symbol is displayed on the screen and the final calculation time appears in the “STOP” line (5.41). |
 | The instrument returns to normal measurement when pressing the “ ” key (16a). |
The measurement values for the energy measurement cannot be saved.
Two-phase Power Measurement – Type of Connection 1P3W
1) Switch on the instrument.
2) Select the type of connection 1P3W using the "Wiring" function key (6). After selection, the following display is indicated with the symbol 1P3W (5.11):
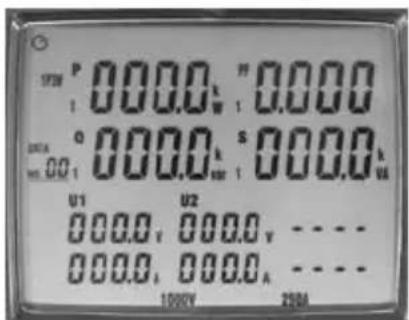
Display Type of connection 1P3W
3) The measurement inputs are connected as illustrated in the following drawing:

Type of connection 1P3W
L1: phase 1 N: neutral conductor
L2: phase 2 G: protective earth
Shaft direction (X1) (see also page 12).
Current flow direction: The printed arrow on the clamp adapter must point to the electric power supply.
The printed arrow on the clamp adapter must point to the electric power supply.
Connect the test leads to the measurement instrument as follows:
1) Connect black test lead to socket N.
2) Connect red test lead to socket U1.
3) Connect yellow test lead to socket U2.
4) Connect clamp adapter 1 to socket I1.
5) Connect clamp adapter 2 to socket I2.
6) If required, connect clamp adapter 4 to socket I4.
This connection can be used to monitor the protective earth current.
Now, connect the tests leads using the alligator clips and the clamp adapter to the electric power supply to be tested.
1) Connect black test lead to neutral conductor N.
2) Connect red test lead to phase L1.
3) Connect yellow test lead to phase L2.
4) Open the clamp adapter 1 using the clamp opening lever and surround the live phase L1.
Make sure that the clamp completely surrounds the conductor and that there is no air gap.
5) Connect in the same way clamp adapter 2 to the phase L2.
6) If required, connect the clamp adapter 4 in the same way to the protective earth.
The current measurement values are displayed on the screen.

Press the "POWER" key to switch between the measurement values of Phase L1, Phase L2, and the total value. The respectively displayed value can be assigned by means of the suffix 1, 2, or t (5.2.).
The following additional measurement values can be selected subsequently and indicated on the additional display (5.13):
 | To display the mains frequency, press the “Hz” key (12). |
 | To display the phase angle, press the 0 key (11). |
 | To display the power factor, press the “PF” key (10). |
 | If required, press the “I4” key (13) to display the protective earth current |
 | Individual measurements may be saved using the “M/MEMORY” key (19) |
 | To measure the energy values, press the “ENERGY” key (22). |
When this measurement type is selected, the automatic-power-off function of the instrument is deactivated.
The following values are displayed.

Display Measurement type energy in the lower part, the starting time of the measurement is displayed in the "STAR" line (5.43). Below, the current date and time are displayed during the measurement. I.e. the energy values are permanently calculated during running display. In the upper part of the display, the total values for the active power (5.4), the idle power (5.7), the apparent power (5.21), and the power factor (5.13) are displayed (to be recognised by the suffix "t").
| [cxwt] | The measurement is terminated when pressing the STOP key (18).The [HOLD] symbol is displayed on the screen and the final calculation time appears in the "STOP" line (5.41). |
 | The instrument returns to normal measurement when pressing the "[AGSA]" key (16a). |
The measurement values for the energy measurement cannot be saved.
Three-phase Power Measurement, Aron connection – type of connection 3P3W2M
1) Switch on the instrument.
2) Select the type of connection 3P3W2M using the "Wiring" function key (6). After selection, the following display is indicated with the symbol 3P3W2M (5.11):

Display Type of connection 3P3W2M
3) The measurement inputs are connected as illustrated in the following drawing:

Type of connection 3P3W2M
L1: phase 1
L2: phase 2
L3: phase 3
Shaft direction (X1) (see also page 12)
Current flow direction: The printed arrow on the clamp adapter must point to the electric power supply.
Connect the test leads to the measurement instrument as follows:
1) Connect black test lead to socket N.
2) Connect red test lead to socket U1.
3) Connect yellow test lead to socket U2.
4) Connect clamp adapter 1 to socket I1.
5) Connect clamp adapter 2 to socket I2.
Now, connect the tests leads using the alligator clips and the clamp adapter to the electric power supply to be tested.
1) Connect black test lead to Phase L2.
2) Connect red test lead to phase L1.
3) Connect yellow test lead to phase L3.
4) Open the clamp adapter 1 using the clamp opening lever and surround the live phase 1.
Make sure that the clamp completely surrounds the conductor and that there is no air gap.
5) Connect in the same way clamp adapter 2 to the phase L3.

Press the "POWER" key to switch between the measurement values of Phase L1, Phase and L2, and the total value. The respectively displayed value can be assigned by means of the suffix 1, 2, or t (5.2.).
The following additional measurement values can be selected subsequently and indicated on the additional display (5.13):
 | To display the mains frequency, press the “Hz” key (12). |
 | To display the phase angle, press the 0 key (11). |
 | To display the power factor, press the “PF” key (10). |
 | If required, press the “I4” key (13) to display the protective earth current |
 | Individual measurements may be saved using the “M/MEMORY” key (19) |
 | To measure the energy values, press the “ENERGY” key (22). |
When this measurement type is selected, the automatic-power-off function of the instrument is deactivated. The following values are displayed.

Display Measurement type energy
In the lower part, the starting time of the measurement is displayed in the "STAR" line (5.43). Below, the current date and time are displayed during the measurement. I.e. the energy values are permanently calculated during running display. In the upper part of the display, the total values for the active power /5.4), the idle power (5.7), the apparent power (5.21), and the power factor (5.13) are displayed (to be recognised by the suffix "t").
 | The measurement is terminated when pressing the STOP key (18).The [HOLD] symbol is displayed on the screen and the final calculation time appears in the “STOP” line (5.41). |
 | The instrument returns to normal measurement when pressing the “ ” key (16a). |
The measurement values for the energy measurement cannot be saved.
Three-phase Power Measurement, Star connection – type of connection 3P4W
1) Switch on the instrument.
2) Select the type of connection 3P4W using the "Wiring" function key (6). After selection, the following display is indicated with the symbol 3P4W (5.11):

Display Type of connection 3P4W The measurement inputs are connected as illustrated in the following
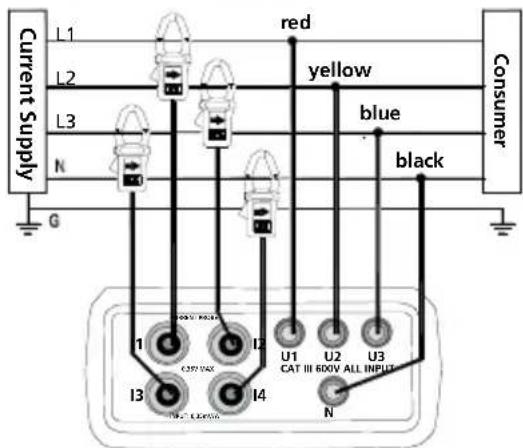
Type of connection 3P4W
L1: phase 1
L2: phase 2
L3: phase 3
N: neutral conductor
G: protective earth
Shaft direction (X1) (see also page 12)
Current flow direction: The printed arrow on the clamp adapter must point to the electric power supply.
The printed arrow on the clamp adapter must point to the electric power supply.
Connect the test leads to the measurement instrument as follows:
1) Connect black test lead to socket N.
2) Connect red test lead to socket U1.
3) Connect yellow test lead to socket U2.
4) Connect blue test lead to socket U3.
5) Connect clamp adapter 1 to socket I1.
6) Connect clamp adapter 2 to socket I2.
7) Connect clamp adapter 3 to socket 13.
8) Connect clamp adapter 4 to socket I4.
Now, connect the tests leads using the alligator clips and the clamp adapter to the electric power supply to be tested.
1) Connect black test lead to neutral conductor N.
2) Connect red test lead to phase L1.
3) Connect yellow test lead to phase L2.
4) Connect blue test lead to phase L3.
5) Open the clamp adapter 1 using the clamp opening lever and surround the live phase L1.
Make sure that the clamp completely surrounds the conductor and that there is no air gap.
1) Connect in the same way clamp adapter 2 to the phase L2.
2) Connect in the same way clamp adapter 3 to the phase L3.
3) Connect the clamp adapter 4 in the same way to the neutral conductor N.

Press the "POWER" key to switch between the measurement values of Phase L1, Phase L2 and Phase 3 and the total value. The respectively displayed value can be assigned by means of the suffix 1, 2, 3, or t (5.2.).
The following additional measurement values can be selected subsequently and indicated on the additional display (5.13):
 | To display the mains frequency, press the "Hz" key (12). |
 | To display the phase angle, press the 0 key (11). |
 | To display the power factor, press the "PF" key (10). |
 | If required, press the "I4" key (13) to display the protective earth current |
 | Individual measurements may be saved using the "M/MEMORY" key (19) |
 | To measure the energy values, press the "ENERGY" key (22). |
When this measurement type is selected, the automatic-power-off function of the instrument is deactivated.
The following values are displayed.

Display Measurement type energy
In the lower part, the starting time of the measurement is displayed in the "STAR" line (5.43). Below, the current date and time are displayed during the measurement. I.e. the energy values are permanently calculated during running display.
In the upper part of the display, the total values for the active power (5.4), the idle power (5.7), the apparent power (5.21), and the power factor (5.13) are displayed (to be recognised by the suffix "t").
 | The measurement is terminated when pressing the STOP key (18).The [HOLD] symbol is displayed on the screen and the final calculation time appears in the “STOP” line (5.41). |
 | The instrument returns to normal measurement when pressing the “ ” key (16a). ” key (16a). |
The measurement values for the energy measurement cannot be saved.
Single-phase Current Measurement
1) Switch on the instrument.
2) Select the type of connection 1P2W using the "Wiring" function key (6). After selection, the following display is indicated with the symbol 1P2W (5.11):

Display Type of connection 1P2W
The measurement inputs are connected as illustrated in the following drawing:

Type of connection current measurement
L1: phase 1
L2: phase 2
L3: phase 3
N: neutral conductor
G: protective earth
The printed arrow on the clamp adapter must point to the electric power supply.
1) Connect the test leads to the measurement instrument as follows:
2) Connect clamp adapter 4 to socket I4.
3) Now, connect clamp adapter to the conductor to be tested.
4) Open the clamp adapter 4 using the clamp opening lever and surround the live phase.
Make sure that the clamp completely surrounds the conductor and that there is no air gap.

To display the current in the additional display (5.13), press the "I4" key (13).
The measurement range for the current measurement is between 0 and 250 A. When exceeding the measurement range, "OL" appears on the display.

Individual measurements can be saved using the "M/MEMORY" key (19).
Data Memory – Saving individual measurements
This functions allows saving maximum 99 individual measurements.
A) Saving measurements
1) Switch on the instrument
2) Perform the measurement
3) Save the desired measurement pressing the "M/MEMORY" key (19).
When saving a measurement, the symbol [M] is briefly displayed, the storage place is indicated below.
B) Read out the measurement
1) Press the "R/READ" key (20). The symbol [R] (5.43) is displayed.
2) The navigation keys “▲” and “▼” (16) allow to select and display the measurements, starting with the first storage place.
3) Press the key (16a) to leave the memory mode again.
C) Delete measurements
1) Switch off the instrument
2) Press the "M/MEMORY" key (19) and keep it pressed.
3) Switch on the instrument.
4) Keep the "M/MEMORY" key pressed until the symbol "CLr" is briefly indicated in the lower right corner of the display.
Recording with the Data Logger
This functions allows to record up to 21,000 measurement values by means of the internal data logger. For evaluation purposes, the internally recorded data must be transferred to a PC (please refer to page 32).
To use the total data memory, delete the data memory for the data logger before starting the recording.
Delete Measurement Data within the Data Logger
The values within the data logger may only be deleted using the software supplied (please refer to page 32).
Basic Settings
The data and the sampling rate should be set before starting the recording.

For time setting, simultaneously press the "SET" (14) and "TIME" keys (15).

The TIME" symbol (5.44) is displayed and the line "Date and Time" is indicated with the following assignment:
| Y-M (5.24) | display for year (Y) and month (M) |
| D-h (5.27) | display for day (D) and hour (h) |
| m-s (5.31) | display for minute (m) and second (s) |
1) The respectively blinking value may now be modified using the navigation keys "▲" and "▼" (16).
2) The navigation keys "▶" and "◀" (16) may be used to change to the following or previous field.
3) If the setting is correct, the entry is terminated pressing the " " key (16a).
Now, the symbol "INTV" (5.42) is displayed as well as the field to enter the sampling rate (5.32).
4) The value can be set using the navigation keys "▲" and "▼" (16).
The following settings are possible: 5 s, 30 s, 1 min, 2 min.
5) After having entered the sampling rate, the basic setting is terminated with the “key (16a).
Performing a Recording
1) Perform the measurement
2) Press the "START" key (17) to start the measurement.
The symbol [M] (5.10) is displayed which will be briefly hidden during automatic saving, depending on the pre-set sampling rate.
The number of the current measurement series (5.9) is displayed below the symbol [M].
It is possible to save maximum 10 measurement series.
Maximum 12,000 measurement values can be saved within one measurement series.
The memory is full if FF is displayed.
3) Terminate the recording by pressing the "STOP" key (18).
If the instrument is switched off during running measurement, the recording data will be lost.
Determining the Rotary Field
1) Switch on the instrument
2) Select the type of connection 3P4W using the "Wiring" function key (6). After selection, the following display is indicated with the symbol 3P4W (5.11):

Display Type of connection 3P4W
The measurement inputs are connected as illustrated in the following drawing:

Type of connection 3P4W rotary field
L1: phase 1
L2: phase 2
L3: phase 3
N: neutral conductor
G: protective earth
Connect the test leads to the measurement instrument as follows:
1) Connect black test lead to socket N.
The connection to the neutral conductor is not required as the rotary field detection functions even without this connection.
2) Connect red test lead to socket U1.
3) Connect yellow test lead to socket U2.
4) Connect blue test lead to socket U3
5) Now, connect the tests leads to the electric power supply to be tested using the alligator clips.
6) Connect black test lead to neutral conductor N.
7) Connect red test lead to phase L1.
8) Connect yellow test lead to phase L2.
9) Connect blue test lead to phase L3.
The minimum voltage for the rotary field detection amounts to 30 V.
10) Press the key.
For clockwise rotary field, the symbol (3.29) is displayed on the screen.
Counterclockwise rotary field . 123
If one or more conductor voltages are missing, an acoustic signal is audible and the rotary field detection is disabled.
Curve Shape and Harmonic Wave Measurement
These measurements can only be performed via the PC using the supplied software (please refer to page 29).
Auto-Power-Off Function
This functions switches the instrument off, 30 minutes after the last keystroke.
The activated auto-power-off function can be recognised by the symbol (5.1) on the display.
To perform long-term measurements, for example, the auto-power-off function must be deactivated as follows:
1) Switch off the instrument
2) Press the "HOLD" key and keep it pressed while switching on the instrument. Keep the "HOLD" key pressed until the total display appears.

If the HOLD function has also be activated, press the "HOLD" key again.
If the auto-power-off function has been deactivated, the symbol is no longer displayed on the screen.
Every time after the instrument has been switched on, the auto-pwer-off function is automatically activated.
The auto-power-off function is automatically deactivated for the following measurement functions:
• Energy measurement
• Recording with the data logger
- Connection to the PC
Connection to the PC Interface
The Amprobe Power Analyzer is connected to a free interface (COM1 through COM 8) using the interface cable included with the delivery. The interface is selected after the program start.
Windows-Software
To use the software supplied with the instrument, it must be installed on a PC. To install or operate the software, you require basic PC and operating system knowledge.
System Requirements
Minimum requirements:
• PC with Pentium III / Celeron 600 MHz processor or higher
- CD-ROM drive
- two serial interfaces (one for the mouse and one for the Power Analyzer)
- at least 512 MB RAM
- at least 1 GB hard-disk memory
• Windows XP/2000 or later
• Screen resolution: 1024 x 768 pixels
- Mouse
Recommended:
• PC as from Pentium III 600 MHz processor or comparable
- CD-ROM drive
- 2 serial interfaces (one for the mouse, the other for the Power Analyzer)
• minimum 256 MB RAM
• minimum 155 MB hard disk memory
• Windows 2000/XP or higher
• Screen resolution: 1024 X 768 pixel
- Mouse
Installation
⚠ Viruses! In the present state of the art it cannot be guaranteed 100 % that the enclosed data carrier is free from viruses. Despite a careful virus test with the latest anti-virus programs we cannot be held liable for any damage caused by viruses.
On installation of the software the required files are copied onto the hard disk.
Restart Windows or quit these programs in case of running processes.
Programs running or active in the background (such as virus scanner, et cetera) have to be shut-down as well. Especially virus scanners might influence the installation and result in malfunctions of an installed software.
Place the data carrier in the drive to be used for this purpose.
Start the Explorer and select the drive.
Select the "Setup.exe" or "Autorun.exe" file, start the installation with a double click and follow the other installation instructions.
Program Functions
After the program start of the "PowerAnalyzer" software, the window for the selection of the interface will appear.

Select the requested interface and press OK to confirm.
Now, the following main menu will be displayed:
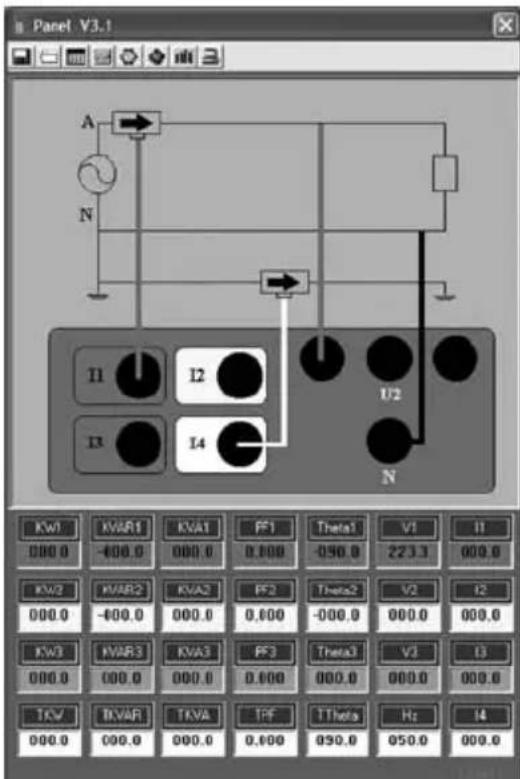
The main menu is divided into three areas:
A: Buttons – Programme functions

(a) Starting and saving measurement
(b) Opening the file
(c) Online measurement / data in form of a list
(d) Online measurement / data in form of a graph
(e) Sampling rate
(f) Data logger – Analysis of the data saved in the measuring instrument
(g) Harmonic measurement
(h) Setting date and time
B: Graph with the type of connection selected on the measuring instrument.
C: Current measured values
Used symbols
KW1, KW2, KW3 Effective power in kW on phase 1 to 3
KVAR1, KVAR2, KVAR3 Reactive power in kVAR on phase 1 to 3
KVA1, KVA2, KVA3 Apparent power in kVA on phase 1 to 3
PF1, PF2, PF3 Power factor on phase 1 to 3
Theta1, Theta2, Theta3 Phase angle on phase 1 to 3
V1, V2, V3 Voltage on phase 1 to 3
I1, I2, I3 Current on phase 1 to 3
TKW Total value of the effective power
TKVAR Total value of the reactive power
TKVA Total value of the apparent power
TPF Total power factor
TTheta Total phase angle (theoretical value)
Hz Mains frequency
14 Current on measuring input 14
If no device is connected or still switched off when starting the program, no measured values will be indicated, i. e. these fields will remain empty.
In case of an existing connection, the messages COM and the nos. of the enabled interfaces will be indicated in a message. If there is no connection, the message No COM will be displayed.
Starting and saving measurement:
Click the (a) [Insert graph] button to start the online measurement.
After having clicked the button, the window for the entry of the file name and of the path for the measurement or measurements to be saved will be displayed.
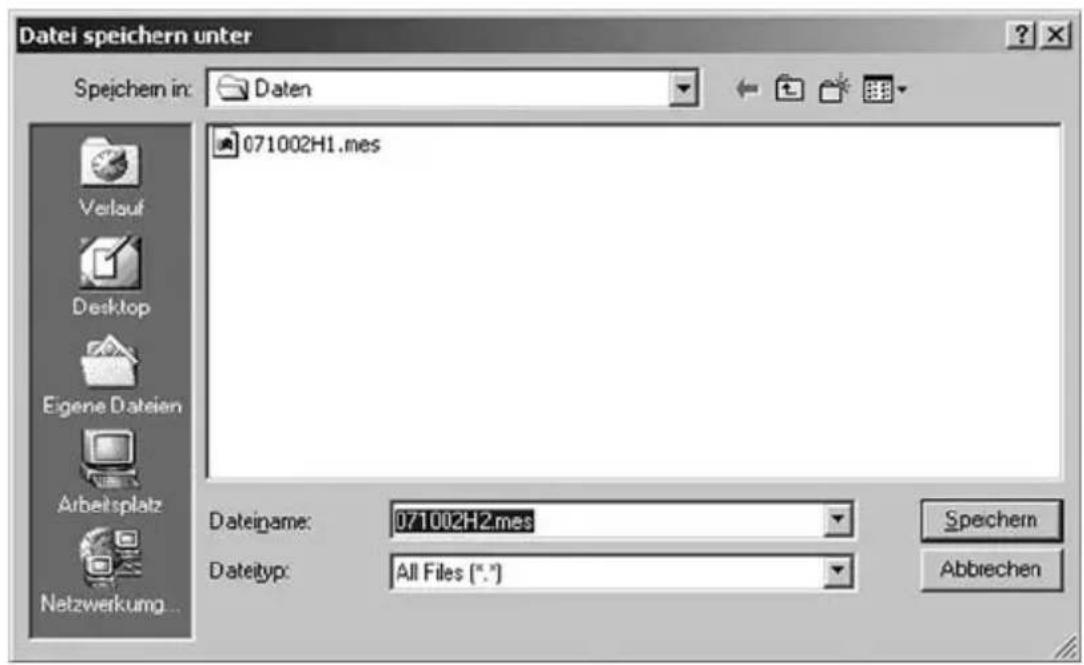
The file name may consist of the current date and must consist of the .mes file index.
If more than 10000 measured values are saved, the measured values will be saved automatically. The file name will consist of the selected file name and the supplement -1. The next measured values from 10001 to 20000 will be saved in a second file with the supplement -2. This shall also apply to all 10000 measured values to follow – until the measurement is aborted.

For checking purposes, the number of the already saved measured values and the file name are displayed in the line at the bottom.
When clicking the button, the running measurement will be completed and the saving process will be completed.
Opening file – Analysis of the data saved in the PC
By clicking the (b) [Insert graph] button, the saved measurements can be loaded. After clicking on the button, the window for the selection of the file will appear.

After having selected the requested file, the saved data will be displayed in form of a table.
| No. s | Date | Time | KV1 | KVAR1 | KVA1 | PF1 | Thielo2 | V1 | I1 | KV2 | KV6R2 |
| 209968 | 2007.07.12 | 22:45.30 | 014.8 | -00.9 | 014.9 | 0.997 | -0039 | 224.4 | 066.4 | (15.2) | -000.0 |
| 209968 | 2007.07.12 | 22:45.31 | 014.8 | -00.0 | 014.8 | 1.000 | -0000 | 224.3 | 066.4 | (15.2) | -000.0 |
| 209967 | 2007.07.12 | 22:45.32 | 014.8 | -00.0 | 014.8 | 1.000 | -0000 | 224.3 | 066.4 | (15.1) | -000.0 |
| 209968 | 2007.07.12 | 22:45.33 | 014.8 | -00.0 | 014.8 | 1.000 | -0000 | 224.0 | 066.3 | (15.1) | -000.0 |
| 209968 | 2007.07.12 | 22:45.34 | 014.8 | -00.0 | 014.8 | 1.000 | -0000 | 224.2 | 066.4 | (15.1) | -000.0 |
| 209976 | 2007.07.12 | 22:45.35 | 014.8 | -00.0 | 014.8 | 1.000 | -0000 | 224.2 | 066.4 | (15.1) | -000.0 |
| 209971 | 2007.07.12 | 22:45.36 | 014.8 | -00.0 | 014.8 | 1.000 | -0000 | 224.1 | 066.4 | (15.1) | -000.0 |
| 209972 | 2007.07.12 | 22:45.37 | 014.8 | -00.0 | 014.8 | 1.000 | -0000 | 224.1 | 066.4 | (15.1) | -000.0 |
| 209973 | 2007.07.12 | 22:45.38 | 014.8 | -00.0 | 014.8 | 1.000 | -0000 | 224.2 | 066.4 | (15.1) | -000. 6 |
| 209974 | 2007. 7 1 2 2 4 5 6 7 8 9 1 1 1 1 1 1 1 1 1 1 1 1 1 1 1 1 1 1 1 1 | ||||||||||
| 209975 | 2007. 7 1 2 2 4 5 6 7 8 9 1 1 1 1 1 1 1 1 1 1 1 1 1 | ||||||||||
| 209976 | 2007. 7 1 2 2 4 .5 . . . . . . . . . . . . . . . . . . . . . . . . . . . . . . . . . . . . . . . . . . . . . . . . . . . . . . . . . . . . . . . . . . . | ||||||||||
| 209977 | 2007. 7 1 2 2 4 .5 . . . . . . . . . . . . . . . . . . . . . . . . . . . . . . . . . . . . . . . . . . . . . . . . . . . . . | ||||||||||
| 209978 | 2007. 7 1 2 2 4 ,3 ,3 ,3 ,3 ,3 ,3 ,3 ,3 ,3 ,3 ,3 ,3 ,3 ,3 ,3 ,3 ,3 ,3 ,3 ,3 ,3 ,3 ,3 ,3 ,3 ,3 ,3 ,3 ,3 ,3 ,3 ,3 ,3 ,3 | ||||||||||
| 209979 | 2007. \( {7}^{ \circledR }{7}^{ \circledR }{7}^{ \circledR }{7}^{ \circledR }{7}^{ \circledR }{7}^{ \circledR }{7}^{ \circledR }{7}^{ \circledR }{7}^{ \circledR }{7}^{ \circledR }{7}^{ \circledR }{7}^{ \circledR }{8}^{ \circledR }{8}^{ \circledR }{8}^{ \circledR }{8}^{ \circledR }{8}^{ \circledR }{8}^{ \circledR }{8}^{ \circledR }{8}^{ \circledR }{8}^{ \circledR }{8}^{ \circledR }{8}^{ \circledR }{8}{8}^{ \circledR }{8}^{ \circledR }{8}^{ \circledR }{8}^{ \circledR }{8}^{ \circledR }{8}^{ \circledR }{8}^{ \circledR }{8}^{ \circledR }{8}^{ \circledR }{8}^{ \circledR }{8}^{ \circledR }{9}^{ \circledR }{9}^{ \circledR }{9}^{ \circledR }{9}^{ \circledR }{9}^{ \circledR }{9}^{ \circledR }{9}^{ \circledR }{9}^{ \circledR }{9}^{ \circledR }{9}^{ \circledR }{9}^{ \circledR }{9}_{\mathrm {B}}^{ \circledR }{9}^{ \circledR }{9}^{ \circledR }{9}^{ \circledR }{9}^{ \circledR }{9}^{ \circledR }{9}^{ \circledR }{9}^{ \circledR }{9}^{ \circledR }{9}^{ \circledR }{9}^{ \circledR }{9}^{\mathrm {B}}{}^{\mathrm {B}}{}^{\mathrm {B}}{}^{\mathrm {B}}{}^{\mathrm {B}}{}^{\mathrm {B}}{}^{\mathrm {B}}{}^{\mathrm {B}}{}^{\mathrm {B}}{}^{\mathrm {B}}{}^{\mathrm {B}}{}^{\mathrm {B}}{}^{\mathrm {B}}{}^{\mathrm {B}}{}^{\mathrm {B}}{}^ {\mathrm {B}}{}^{\mathrm {B}}{}^{\mathrm {B}}{}^{\mathrm {B}}{}^{\mathrm {B}}{}^{\mathrm {B}}{}^{\mathrm {B}}{}^{\mathrm {B}}{}^{\mathrm {B}}{}^{\mathrm {B}}{}^{\mathrm {B}}{}^{\mathrm {B}}{}^{\mathrm {B}}{}^{\mathrm {B}}{}^{\mathrm {\Delta }}{}^{\mathrm {B}}{}^{\mathrm {B}}{}^{\mathrm {B}}{}^{\mathrm {B}}{}^{\mathrm {B}}{}^{\mathrm {B}}{}^{\mathrm {B}}{}^{\mathrm {B}}{}^{\mathrm {B}}{}^{\mathrm {B}}{}^{\mathrm {B}}{}^{\mathrm {B}}{}^{\mathrm {B}}{}^{\mathrm {B}}{} ^{\mathrm {\Delta }}{}^{\mathrm {\Delta }}{}^{\mathrm {\Delta }}{}^{\mathrm {\Delta }}{}^{\mathrm {\Delta }}{}^{\mathrm {\Delta }}{}^{\mathrm {\Delta }}{}^{\mathrm {\Delta }}{}^{\mathrm {\Delta }}{}^{\mathrm {\Delta }}{}^{\mathrm {\Delta }}{}^{\mathrm {\Delta }}{}^{\mathrm {\Delta }}{}^{\mathrm {\Delta }}{}^{\mathrm {\Delta }}{}^{\texttt {A}}{}^{\texttt {A}}{}^{\texttt {A}}{}^{\texttt {A}}{}^{\texttt {A}}{}^{\texttt {A}}{}^{\texttt {A}}{}^{\texttt {A}}{}^{\texttt {A}}{}^{\texttt {A}}{}^{\texttt {A}}{}^{\texttt {A}}{}^{\texttt {A}}{}^{\prime }\texttt {A}\texttt {A}\texttt {A}\texttt {A}\texttt {A}\texttt {A}\texttt {A}\texttt {A}\texttt {A}\texttt {A}\texttt {A}\texttt {A}\texttt {A}\texttt {A}\texttt {A}\texttt {A}\texttt {A}\texttt {A}\texttt {A}\texttt {A}\texttt {A}\\ |
Click the 📄 button to print the values in form of a table.
Click the 🔒 button to change over to the graphical representation.

For a better general survey, all input signals are represented in form of a graph.
Click the graph to enlarge it.

"Graph Range" area
The display area can be modified by direct input or using the arrow keys.
"Track Mode" area
Mouse functions for the graphic display

Normal: no function
Cursor
Coordinates: Cursor display with additional indication of the measured value in the "Cursor Information" area.
PanXY: Shifting the graph in X and Y direction
PanX: Shifting the graph in X direction
PanY: Shifting the graph in Y direction
Note: To shift the graph, click the graph, keep the left mouse key pressed and drag in the requested direction.
ZoomXY: Zoom-up of the section: Enlargement of the X and Y axis.
ZoomX: Zoom-up of the section: Enlargement of the X axis.
ZoomY: Zoom-up of the section: Enlargement of the Y axis.
Use the mouse to select the part of the graph to be zoomed up with a rectangle or border lines.
"Reset Scale" button:
Change back to the display of the complete diagram.
"Print Graph" button:
Print-out of the displayed diagram (screen).
Saved data can be exported to external programs for further processing, such as MS EXCEL.
Online measurement / data in form of a list
Click the (c) button to start the online measurement.
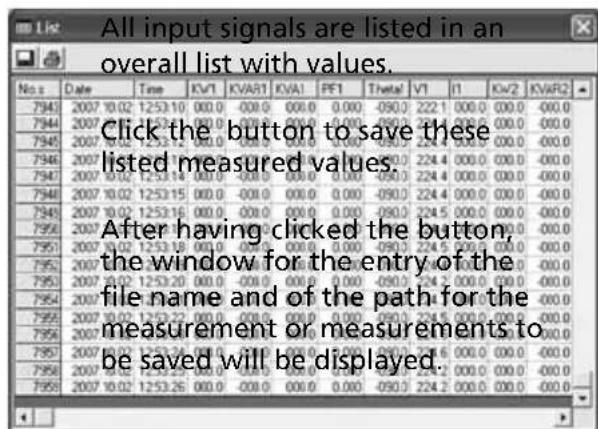
The file name may consist of the current date and must consist of the .mes file index.
If more than 10000 measured values are saved, the measured values will be saved automatically. The file name consists of the date and the current time, e.g. 1002132833.mes [Date 02.10., time 13:28:33]. After having saved the measurement, it will be carried on with the measured value no. 10001. The same applies to the next or all further 10000 measured values.
Click the button to print the values in form of a table.
Online measurement / data in form of a graph
Click the (d) [Insert graph] button to start the online measurement.
The input signals are represented in form of a graph over an extended period of time.
Click the graph to zoom it up.
For the description of the other display functions and buttons, please refer to page 29.
Sampling rate
Click the (e) [Insert graph] button to open the window to set the sampling rate for the online measurement.
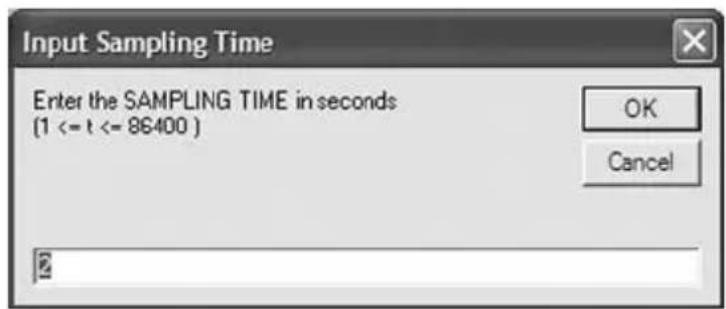
The permissible input values range between 1 and 86400 sec. The preset value is 2 s
Data logger – Analysis of the data saved in the measuring instrument
Click the (f) [Insert graph] button to open the window to read the data saved in the measuring instrument.
If there are no saved data, the following error message will be displayed:

If a measured value recording is enabled in the measuring instrument, a data transmission is not possible.
The reading and generation of the list can take some minutes in case of a large number of measured values or in case of full memory.
If one measurement includes more than 10000 measured values, they will be divided into two lists or files. The following note will be displayed:
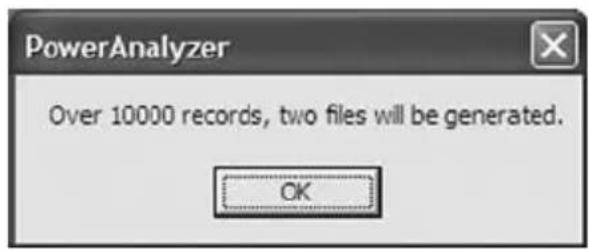
will be generated.
Click OK t
| No. | Date | Time | KvWt | 0VWRt | KvWt | PEt | Tsetd | Vt | S | Kw2 | KvWt/R2 |
| 1 | 2007/07/10 | 18:03:19 | 01:47 | 034.4 | 01.7 | 0.955 | 018.2 | 222.2 | 066.3 | 015.0 | -000.4 |
| 2 | 2007/07/10 | 18:03:24 | 01:47 | 034.3 | 01.7 | 0.955 | 018.2 | 222.1 | 066.3 | 015.0 | -000.4 |
| 3 | 2007/07/10 | 18:03:29 | 01:47 | 034.4 | 01.7 | 0.955 | 018.2 | 222.2 | 066.3 | 015.0 | -005.4 |
| 4 | 2007/07/10 | 18:03:34 | 01:47 | 034.5 | 01.7 | 0.952 | 018.2 | 222.5 | 066.3 | 015.0 | -000.4 |
| 5 | 2007/07/10 | 18:03:39 | 01:47 | 034.6 | 01.7 | 0.953 | 018.2 | 222.5 | 066.3 | 015.0 | -000.6 |
| 6 | 2007/07/10 | 18:03:44 | 01:47 | 034.4 | 01.7 | 0.953 | 018.2 | 222.2 | 066.3 | 015.1 | -001.4 |
| 7 | 2007/07/10 | 18:03:49 | 01:47 | 034.6 | 01.7 | 0.955 | 018.2 | 222.6 | 066.3 | 015.0 | -003.6 |
| 8 | 2007/07/10 | 18:03:54 | 01:47 | 034.5 | 01.7 | 0.952 | 018.2 | 222.4 | 066.3 | 015.0 | -003.1 |
| 9 | 2007/07/10 | 18:03:59 | 01:47 | 034.6 | 01.7 | 0.953 | 018.2 | 222.4 | 066.3 | 015.1 | -003.4 |
| 10 | 2007/07/10 | 18:03:64 | 01:47 | 034.6 | 01.7 | 0.955 | 019.9 | 222.7 | 066.3 | 015.1 | -001.4 |
| 11 | 2007/07/10 | 18:03:69 | 01:47 | 034.6 | 01.7 | 0.955 | 019.9 | 222.7 | 066.3 | 015.0 | -003.9 |
| 12 | 2007/07/10 | 18:03:74 | 01:48 | 034.7 | 01.8 | 0.947 | 019.9 | 222.9 | 066.3 | 015.0 | -003.4 |
| 13 | 2007/07/10 | 18:03:79 | 01:48 | 034.8 | 01.8 | 0.947 | 019.9 | 222.9 | O66.3 | O15.6 |

Click the button to save these listed measured values.
For the further analysis of the saved data please refer to the description given in page 29.
Deleting data logger memory
Click the (ERASE) button to delete all measurements saved in the Power Analyzer.
There will be an additional safety query prior to the deletion process.
![Warning! Click [OK] to confirm the de All data in memory will be deleted! process or click [Cancel] to c OK Cancel](/content/2026/05/825686/images/6fb66207067ecb4d12dcc654232f6f2aac27e8176edfc617b221ee1bfd3700f8.jpg)
Harmonic measurement
In this window you can carry out simple harmonic measurements up to the 31st harmonic.
The total value of the harmonic distortion THD in percent is calculated according to the following equation:
% THD = 1 0 ^ where √ A (f _ 2) ^ 2 + A (f _ 3) ^ 2 + ... + A (f _ N) ^ 2A (T1) = fundamental wave, A (fn) = harmonic with number n.
The number of harmonics (n) for the calculation of THD can be selected.
Click the (g) [Insert graph] button, to open the window for the harmonic measurement.
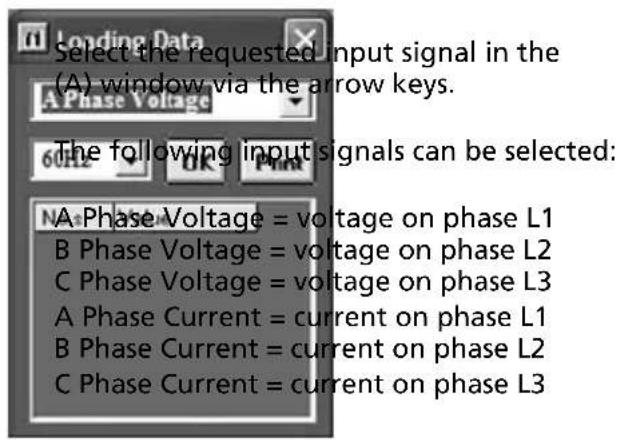
Via the I4 input, harmonics cannot be measured.
Select the requested input frequency in the (B) window.
Click the [OK] button to start the measurement.


The values of the 64 sampling values are listed under No.s. In addition, a window with the representation of the signal curve will be displayed during the measured time interval of 20 ms (at 50 Hz).
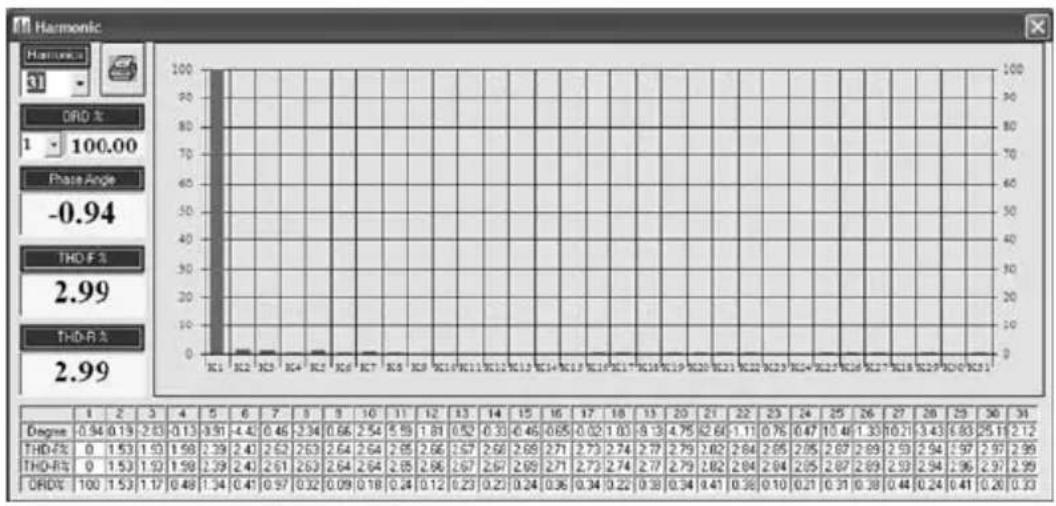
Field "Harmonics" - Number of harmonics for the calculation of THD:
To select the requested last harmonic use the arrow keys or directly enter or modify it in the display field.
Example: If 5 is selected, the total value THD from number 1 to 5 will be calculated. The "Harmonic number 1" is identical to the fundamental wave.
"ORD%" field - ordinal number of the harmonic:
Use the arrow keys to select the requested harmonic. The percentage of this harmonic is shown in the adjacent field.
"Phase Angle" field
Phase angle between voltage and current (is calculated via Fast Fourier Transformation)
The displayed value refers to the ordinal number selected under "ORD%".
" THD-F% field: Total value " of the harmonic distortion, defined for voltage as
THD - F% (v) = √n = 240Vn2V1
" THD-R% field: Total value " of the harmonic distortion, defined for voltage as
THD - R% (v) = √n = 240Vn2√n = 140Vn2
The displayed values refer to the harmonic selected under "Harmonics".
If the distortions are only slight, both values are nearly identical.
In the "NaN" message is displayed in a window, there is no valid value.
Click the button to print the complete screen
Setting date and time
Click the (h) [Insert graph] button to transmit the current system time of the PC to the power measuring instrument.
Data transfer to an external program
Example: Evaluation of the measured values by importing the data to MS EXCEL. Open the "Open file" function in MS EXCEL.

Select "Alle Dateien" (All files) data type
Settings in MS EXCEL text wizard

Setting the data type: Do not select "fixed width", but "delimited".

Setting the delimiter: select Tab and text qualifier: select "none".

The data format of the second column has to be set to YMT date format.
As a result, you will receive the read raw data in the correct spreadsheet form.

Now, you can edit the data at discretion.
Maintenance
When using the instrument in compliance with the users manual, no special maintenance is required.
Cleaning
If the instrument is dirty after daily usage, it is advised to clean it by using a damp cloth and a mild household detergent
Prior to cleaning, ensure that instrument is switched off and disconnected from external voltage supply and any other instruments connected (such as UUT, control instruments, etc.).
Never use acid detergents or dissolvants for cleaning.
Calibration Interval
We suggest a calibration interval of one year. If the instrument is used very often or if it is used under rough conditions we recommend shorter intervals. If the instrument is used few times only the calibration interval can be extended on to 3 years.
Replacement of batteries
If the symbol (516) is displayed change the batteries.
⚠️ Remove all test leads before opening the case.
⚠ The safety references must be followed.

1) Using a screwdriver to remove the two screws from the bottom case (backside)
2) Remove the battery cover
3) Take out old batteries
4) Insert new batteries (respect battery polarity)
The correct polarity of the batteries is indicated on the inside of the bottom case.
5) Close battery cover and tighten the screws.
Batteries
If the adjusted date and time is not being saved, the small coin cell needs to be replaced.
1) Use a screwdriver to remove the four screws from the case (backside)
2) Remove the holster
3) Remove the battery cover
4) Insert new battery

The correct polarity of the batteries is indicated on the rear case. The connection "+" must be on the upper side.
5) Close cover and tighten the screws.
Always be careful with the connection cable for power supply
Please consider your environment when you dispose of your one-way batteries. They belong in a disposal for hazardous waste. In most cases, the batteries can be returned to their point of sale.
⚠️ Please, comply with the respective valid regulation regarding the return, recycling and disposal of used batteries.
Technical Data
(valid for 23\ °C ± 5\ °C , for less than 70 % relative humidity).
Voltage measurement: ....3 input channels with common reference point "N"
Measurement range: ....0 to 600 Vrms
Display range: 0 to 999.9 Vrms
Resolution: 0.1V
Accuracy: ....± (1% rdg + 10D) for voltage > 80 V
Mains frequency: .....50 Hz
Input impedance: ......2 MOhm
Overload protection: ....1000 Vrms
Current measurement
Measurement range:
Input I1, I2, I3 ......3 A to 999.9 A
Input 14 ....3 A to 250 A
Display range: 0 A to 999.9 A
Resolution: 0.1 A
Accuracy: ....± (2.5 % rdg +15 D)
Reduction ratio of current clamp: 0.35 mV/A
Clamp opening: .....40 mm
Admissible overload: ....10 % (for sinusoidal wave form); max. 30 seconds
Active power P
Display of active power of individual input or total value, as desired
Display range: 0 to 999.9 kW
A negative active power can be recognised by the sign "-".
Resolution : 0.1 kW
Accuracy (for PF ≥ 0,5): ± (3.5 % rdg + 20 D)
Accuracy (for PF < 0,5): ± (4.5 % rdg + 40 D)
Apparent power S (calculation from the rms values of voltage and current)
Display of apparent power of an individual input or the total value, as desired
Display range: 0 - 999.9 kVA
Resolution: 0.1 kVA
Type of connection 1P2W
Accuracy (for PF ≥ 0,5): ± (3.5 % rdg + 20 D)
Accuracy (for PF < 0,5): ± (4.5 % rdg + 40 D)
Type of connection 1P3W, 3P3W, 3P4W
Accuracy (for PF ≥ 0,5): ± (3.5 % rdg + 20 D)
Accuracy (for PF < 0,5): ± (7.5 % rdg + 40 D)
Idle power Q (calculation out of active and apparent power)
Display of idle power of an individual input or the total value, as desired
Display range: 0 to 999.9 kVAr
A negative sign “-” shows a leading current.
Resolution: 0.1 kVAr
Formula: Q = √2 - S2
Power factor PF (cos (f) (calculation out of active and apparent power))
Display of power factor of an individual input or the total value, as desired
Measurement range: .... 0 ...+1
A negative sign “-” shows a leading current.
Resolution: 0.001
Accuracy: ....± (1 % rdg + 25 D)
Phase angle (f) (calculation out of power factor)
Display of phase angle of an individual input or the total value, as desired
Measurement range: .... 0° to 90°
A negative sign "- "shows a leading current.
Resolution: 0.1°
Accuracy: ± 4°
Frequency measurement (for voltage range > 80 V)
Measurement range: ....45 to 80 Hz
Resolution: 0.1 Hz
Accuracy: ....± (1 % rdg + 10D) for voltage > 80 V
Rotary field detection (for conductor voltages > 80 V)
Display for clockwise rotary field: 123 Display for counterclockwise rotary field:

Energy measurement – active power (kWh)
Display of the total value of all active power values
| Range Resolution Accuracy Sampling Rate | ||
| 3.999 kWh 0.001 kWh | ± (3.5% rdg. + 20D) 1 second | |
| 39.99 kWh 0.01 kWh | ||
| 399.9 kWh 0.1 kWh | ||
| 3.999 MWh 0.001 MWh | ||
| 39.99 MWh 0.01 MWh | ||
| 119.3 MWh 0.1 MWh |
Energy measurement - apparent power (kVAh)
Display of the total value of all apparent power values.
| Range Resolution Accuracy Sampling Rate | ||
| 3.999 kVAh 0.001 kVAh | ± (3.5% rdg. + 20D) 1 second | |
| 39.99 kVAh 0.01 kVAh | ||
| 399.9 kVAh 0.1 kVAh | ||
| 3.999 MVAh 0.001 MVAh | ||
| 39.99 MVAh 0.01 MVAh | ||
| 119.3 MVAh 0.1 MVAh |
Energy measurement – idle power (kvarh)
Display of total values of all idle power values.
| Range Resolution Accuracy Sampling Rate | ||
| 3.999 kvarh 0.001 kvarh | ± (3.5% rdg. + 20D) 1 second | |
| 39.99 kvarh 0.01 kvarh | ||
| 399.9 kvarh 0.1 kvarh | ||
| 3.999 Mvarh 0.001 Mvarh | ||
| 39.99 Mvarh 0.01 Mvarh | ||
| 119.3 Mvarh 0.1 Mvarh |
Harmonics measurement
This measurement is only possible via a PC.
Measurement up to the 31st harmonics
Measurement inputs: U1, U2, U3, I1, I2, I3
Voltage range > 80 V
Current range > 50 A
Sampling range: approx. 3 s.
Sampling resolution per measurement: 64 points
Technical Data – General Information
Display: multiple function LCD
Refresh rate: ....approx. 2 seconds
(Backlight):......automatic-power-off after approx. 30 s
Data logger:....512 Kb, non-volatile memory
max. 21 000 measurement values, max. 10 measurement series 0max. 10 000 measurement values for on measurement series
Sampling rate (adjustable): ....5 seconds, 30 seconds, 1 min, 2 min
Data transfer: ......via optically isolated RS-232 interface
Manual data memory: ......Max: 99 measurement
Power supply: 8 x 1.5V batteries LR6 (Alkaline)
Battery life cycle: ....typ. 50 h
Auto-power-off (can be switched off) after approx. 30 min
Internal memory Speicher: ......1 x 3 V-Lithium battery CR2032
Battery life cycle: ....Typ. 2400 h
Mains adapter: 12 - 15 V/300 mA
Electrical supply voltage: ....230 VAC (+10 %/-20 %)
Frequency range: 42 to 63 Hz
Power consumption: ....approx. 10 VA
Overvoltage class: CAT III 600 V
Degree of contamination: ......2
Protection: ....II
Type of protection: IP 30
Dimensions (L x W x H)
Measurement instrument ....235 x 117 x 54 mm
Current clamp 193 x 88 x 40 mm
Weight
Measurement instrument
(incl. Batteries):......approx. 730 g
Current clamp ....approx. 335 g
Height above sea level: ....up to 2000 m
Service temperature range: ....0°C to +50°C/ max. 80% rel. humidity, 0°C to +40°C/ max. 80% rel. humidity
(mains power supply unit)
Storage temperature range: ......-10°C to +60°C/ max. 70% rel. humidity
Temperature coefficient for
the ranges 0°C to +18°C and
+28°C to +50°C: ....0.1/K times the specified accuracy
Visit www.Amprobe.com for
- Catalog
- Application notes
• Product specifications - User manuals
- REPAIR
- IN-WARRANTY REPAIRS AND REPLACEMENT – ALL COUNTRIES
- NON-WARRANTY REPAIRS AND REPLACEMENT – US AND CANADA
- IN USA IN CANADA
- NON-WARRANTY REPAIRS AND REPLACEMENT – EUROPE
- EUROPEAN CORRESPONDENCE ADDRESS
- CONTENTS
- REFERENCES MARKED ON INSTRUMENT OR IN USERS MANUAL
- INTRODUCTION/ CONTENTS
- CHARACTERISTICS
- MEASUREMENT FUNCTIONS
- ⚠️ ⚠ SAFETY INFORMATION
- ⚠️ APPROPRIATE USAGE
- ⚠️ TRANSPORT AND STORAGE
- POWER SUPPLY
- OPERATION ELEMENTS AND CONNECTIONS
- FRONT VIEW – OPERATION ELEMENTS
- CASING BOTTOM
- PREPARATION FOR OPERATION
- INSTALLING THE BATTERIES
- GENERAL INFORMATION
- CARRYING OUT MEASUREMENTS
- CONNECTION POWER SUPPLY
- SINGLE-PHASE POWER MEASUREMENT – TYPE OF CONNECTION 1P2W
- TWO-PHASE POWER MEASUREMENT – TYPE OF CONNECTION 1P3W
- THREE-PHASE POWER MEASUREMENT, ARON CONNECTION – TYPE OF CONNECTION 3P3W2M
- DISPLAY MEASUREMENT TYPE ENERGY
- THREE-PHASE POWER MEASUREMENT, STAR CONNECTION – TYPE OF CONNECTION 3P4W
- SINGLE-PHASE CURRENT MEASUREMENT
- DATA MEMORY – SAVING INDIVIDUAL MEASUREMENTS
- SAVING MEASUREMENTS
- READ OUT THE MEASUREMENT
- DELETE MEASUREMENTS
- RECORDING WITH THE DATA LOGGER
- DELETE MEASUREMENT DATA WITHIN THE DATA LOGGER
- BASIC SETTINGS
- PERFORMING A RECORDING
- DETERMINING THE ROTARY FIELD
- CURVE SHAPE AND HARMONIC WAVE MEASUREMENT
- AUTO-POWER-OFF FUNCTION
- CONNECTION TO THE PC INTERFACE
- WINDOWS-SOFTWARE
- SYSTEM REQUIREMENTS
- INSTALLATION
- PROGRAM FUNCTIONS
- THE MAIN MENU IS DIVIDED INTO THREE AREAS
- STARTING AND SAVING MEASUREMENT
- OPENING FILE – ANALYSIS OF THE DATA SAVED IN THE PC
- GRAPH RANGE" AREA
- TRACK MODE" AREA
- RESET SCALE" BUTTON
- PRINT GRAPH" BUTTON
- ONLINE MEASUREMENT / DATA IN FORM OF A LIST
- ONLINE MEASUREMENT / DATA IN FORM OF A GRAPH
- SAMPLING RATE
- DATA LOGGER – ANALYSIS OF THE DATA SAVED IN THE MEASURING INSTRUMENT
- HARMONIC MEASUREMENT
- FIELD "HARMONICS" - NUMBER OF HARMONICS FOR THE CALCULATION OF THD
- ORD%" FIELD - ORDINAL NUMBER OF THE HARMONIC
- PHASE ANGLE" FIELD
- SETTING DATE AND TIME
- DATA TRANSFER TO AN EXTERNAL PROGRAM
- MAINTENANCE
- CLEANING
- CALIBRATION INTERVAL
- REPLACEMENT OF BATTERIES
- BATTERIES
- TECHNICAL DATA
- CURRENT MEASUREMENT
- ACTIVE POWER P
- TECHNICAL DATA – GENERAL INFORMATION
- VISIT WWW.AMPROBE.COM FOR
Brand : Amprobe
Model : PQ55A
Category : Energy meter