LinkRunner 10G - Uncategorized NetAlly - Free user manual and instructions
Find the device manual for free LinkRunner 10G NetAlly in PDF.


User questions about LinkRunner 10G NetAlly
0 question about this device. Answer the ones you know or ask your own.
Ask a new question about this device
Download the instructions for your Uncategorized in PDF format for free! Find your manual LinkRunner 10G - NetAlly and take your electronic device back in hand. On this page are published all the documents necessary for the use of your device. LinkRunner 10G by NetAlly.
USER MANUAL LinkRunner 10G NetAlly
Tap a link to go directly to the app's chapter. Search this PDF fora specific term or phrase. Scroll down to view the full list of Contents.
NetAlly Network Testing Apps
AutoTest Ping/TCP
Capture Cable
Discovery Path Analysis
Performance iPerf
Link-Live
App Store
Contents
Contact Us 12
Introduction 13
How to Use this Guide 14......
The PDF Reader App. 14 ......
Buttons and Ports 19....
Charging and Power 23......
Safety and Maintenance 25......
Legal Notification 28
Home and Android Interface 29
Home Screen 30
Navigating the Android System 32
Android Status Bar and Notifications 36
Notification Panel 36
Apps Screen and Store 39
Device Settings 42
Quick Settings Panel 43
Connecting to Wi-Fi 47
Captive Portals 50
Sharing 52
Sharing Files to Link-Live 53
Sharing from the Files App 55
Saving a Screenshot .58....
LinkRunner 10G Settings and Tools
Navigation Drawer 61....
About Screen 63
Exporting Logs 64
Test and Management Ports 65
Configuring the Ports 66
Test Ports 68
Management Port 69
Test and Port Status Notifications 70
Test Port Notifications 71
Management Port Notifications ..... 72
Discovery Notifications 73
VNC/Link-Live Remote 73
LinkRunner 10G General Settings....75
Wired 76
Management 77
Preferences 81
Trending Graphs 82
Common Icons 86
Floating Action Button (FAB) and Menu 87
Common Tools 90
Web Browser/Chrome 90
Telnet/SSH 90......
Camera and Flashlight.92......
Software Management 94
Managing Files 95
Files Application 95
How to Move or Copy a File 98
Using a Micro SD Card 99
Using a USB Drive 100
Ejecting Storage Media 101
Using a USB Type-C to USB Cable 102
Updating Software 104
Remote Access 110
Using VNC 112
Using Link-Live Remote 113
Managing NetAlly App Settings 115
Resetting Testing App Defaults 115
Saving App Settings Configurations . 119
Exporting and Importing Settings 122
Restoring LinkRunner 10G Factory
Defaults 127
Changing the Language 129
LinkRunner 10G Testing
Applications 131
AutoTest App and Profiles...132
AutoTest Overview .134....
Managing Profiles and Profile Groups 137
Factory Default Profiles .137......
Adding New Profiles.138......
Profile Groups 140....
Creating New Profile Groups.145....
Main AutoTest Screen 149....
Periodic AutoTest 151
Periodic AutoTest Settings 151
Running Periodic AutoTest ..... 153
Wired AutoTest Profiles 156
Wired Profile Results 161
PoE Test Results 163
Wired Link Test Results 166
802.1X Test Results 172
VLAN Test Results.... 174
Switch Test Results 176
Wired Profile FAB 183
Wired Profile Settings .187......
PoE Test Settings .188....
Wired Connection Settings .191......
VLAN Settings 196
Stop After 199....
HTTP Proxy 199....
DHCP, DNS, and Gateway Tests for Wired AutoTests 201
DHCP or Static IP Test 202
DNS Test 214
Gateway Test 219
Test Targets for Wired AutoTests 224
Adding and Managing Test Targets 225
Target Test Results Screens 229
AutoTest Ping Test 232
AutoTest TCP Connect Test 238
HTTP Test 242
FTP Test 253
Ping/TCP Test App 263
Ping/TCP Settings 264
Populating Ping/TCP from Another
App 264
Configuring Ping/TCP Settings
Manually 267
Running Ping/TCP Tests 271......
Capture App 275
Capture Settings 276
Running and Viewing Captures 280
Discovery App...285.
Introduction to Discovery .287......
Main Discovery List Screen. 289
Searching the Discovery List.292....
Filtering the Discovery List 294....
Sorting the Discovery List.297.....
Security Auditing - Batch
Authorization 299
Refreshing Discovery 304
Uploading Discovery Results to Link-
Live 305
Discovery Details Screens 307
Top Details Card 309
Lower Cards in Device Details 314
Problems 316
Addresses 317
TCP Port Scan 318
VLANs 321
Interfaces 322....
SNMP 328....
Connected Devices 330......
Resources 331
SSIDs 332....
Discovery App Floating Action Menu 334
Device Types 340
Routers 341.
Switches 342....
Unknown Switches 343
Network Servers 345
Hypervisors 346
Virtual Machines 347
Wi-Fi Controllers 349
Access Points (APs) 350....
Wi-Fi Clients 351
VoIP Phones 351
Printers 353
SNMP Agents 354
NetAlly Tools 355
Hosts/Clients 356
Discovery Settings 358
SNMP Configuration 361
Active Discovery Ports .369......
Extended Ranges 370....
Devices Discovered Through Other
Devices 375
Device Health Interval 381
ARP Sweep Rate 382
SNMP Query Delay 383
Problem Settings 384
TCP Port Scan Settings 388
Path Analysis App 391
Introduction to Path Analysis 392....
Path Analysis Settings 393
Populating Path Analysis from
Another App 393
Configuring Path Analysis Manually 393
Running Path Analysis 397
Path Analysis Results and Source
LinkRunner Cards 399
Layer 3 Hops 402
Layer 2 Devices 407
Uploading Path Analysis Results to
Link-Live 412
Performance Test App 414
Introduction to Performance Testing.416
Running LinkRunner as a Performance
Peer 418
iPerf Test App...422
iPerf Settings .424
Saving Custom iPerf Settings.424...
Test Accessories in Discovery. 425...
Configuring iPerf Settings 428.....
Running an iPerf Test. 432
Uploading iPerf Results to Link-Live 436
Link-Live Cloud Service 438
Getting Started in Link-Live Cloud
Service 440
Quick Claiming on the Unit 440
Claiming Manually 443
After Claiming 445
Unclaiming 446
Link-Live App Features 448
Saving Locally Only 451
Job Comment 453
Link-Live and Testing Apps 456
Link-Live Sharing Screens 457
Sharing a Text File to Link-Live.460
Cable Test App 463
Cable Test Settings 464
Running Cable Test 465
Open Cable TDR Testing 466
Terminated WireView Testing 469...
Toning Function 471
Uploading Cable Test Results to Link-Live 472.
Specifications and Compliance 473
Specifications 474
General 474
Environmental Specifications 475
Certifications and Compliance 477
Contact Us
Online: NetAlly.com
Phone: (North America) 1-844-TRU-ALLY
(1-844-878-2559)
NetAlly
2075 Research Parkway
Colorado Springs, CO 80920
For additional product resources, visit
NetAlly.com/Products/LinkRunner10G.
For customer support, visit
NetAlly.com/Support.
Register your LinkRunner 10G
Registering your product with NetAlly gives you access to valuable information on product updates, troubleshooting procedures, and other services.
Register on the NetAlly Support Page.
Introduction
The LinkRunner 10G is a rugged, hand-held tool for testing and analyzing copper and fiber. It features applications developed by NetAlly for network discovery, measurement, and validation, which are available from the Home and Apps screens.
All NetAlly hand-held testers include access to Link-Live Cloud Service at Link-Live.com. Link-Live is an online system for collecting, organizing, analyzing, and reporting your test results. Test data is automatically uploaded once your tester is properly configured. Visit Link-Live.com and "Claim" your LinkRunner to access these features.
How to Use this Guide
This User Guide describes the LinkRunner 10G's testing functionality and basic elements of the Android interface.
The guide is meant for users who are knowledgeable about network operations, tests, and measurements.
The LinkRunner 10G may also be referred to as just LinkRunner or the "unit" in this guide.
The PDF Reader App
A PDF reader application is pre-installed on your LinkRunner to allow easy navigation of this guide:
- Tap blue links to go to their destinations. Underlined blue links open external websites.
- Touch headings in the Contents list that starts on page 2 to go to the corresponding sections.
- Use the Search function in the upper toolbar to find specific terms in the guide.
Once you enter a term and search, the terr appears at the top of the PDF reader screen. Touch the left and right arrows to search forwards and backwards in the guide for the term. In the image below, the user has searched "problems."
| problems 1/39 × < > |
| Searching the Discovery List ....302 |
| Filtering the Discovery List ....304 |
| Sorting the Discovery List ....307 |
| Refreshing Discovery ....310 |
| Uploading Discovery Results to Link-Live ....311 |
| Discovery Details Screens ....313 |
| Top Details Card ....315 |
| Lower Cards in Device Details ....321 |
| Problems ....323 |
| Addresses ....324 |
| TCP Port Scan ....325 |
| VLANs ....328 |
- To scroll quickly up or down in the guide, touch and drag the page number tab at the right. Drag the tab to the very top c
the screen to return to the title page.
- Touch and hold the page number tab 141 to open a dialog that allows you to return to the previous page you were viewing.
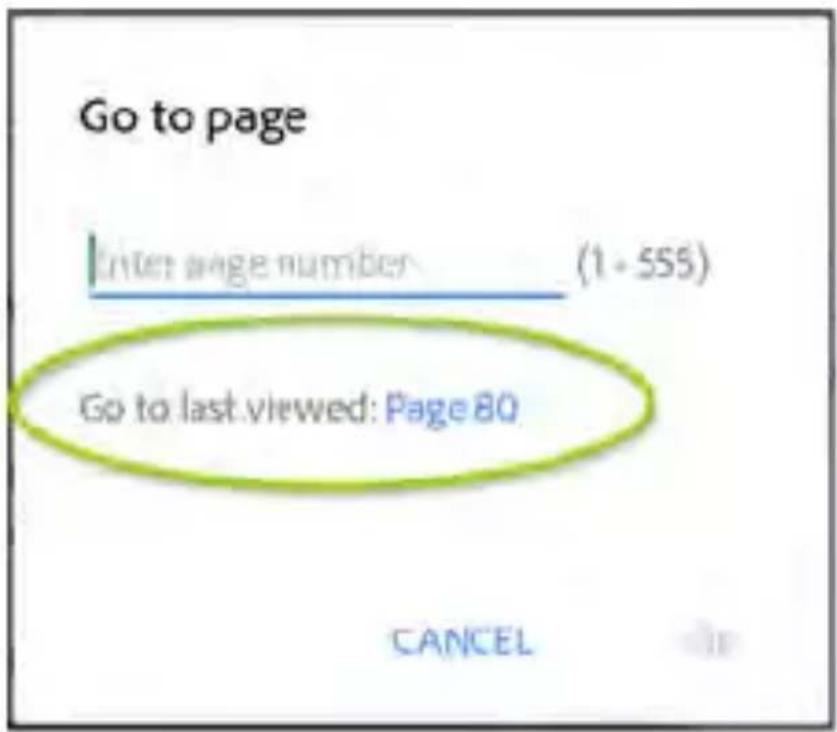
text_image
Go to page Enter page number (1 - 555) Go to last viewed: Page 80 CANCELNOTE: Touching the back buttons, or ←, will not take you back to your previous place in a PDF.
- To browse the PDF Contents or Bookmarks, touch the action overflow icon in the upper tool bar.
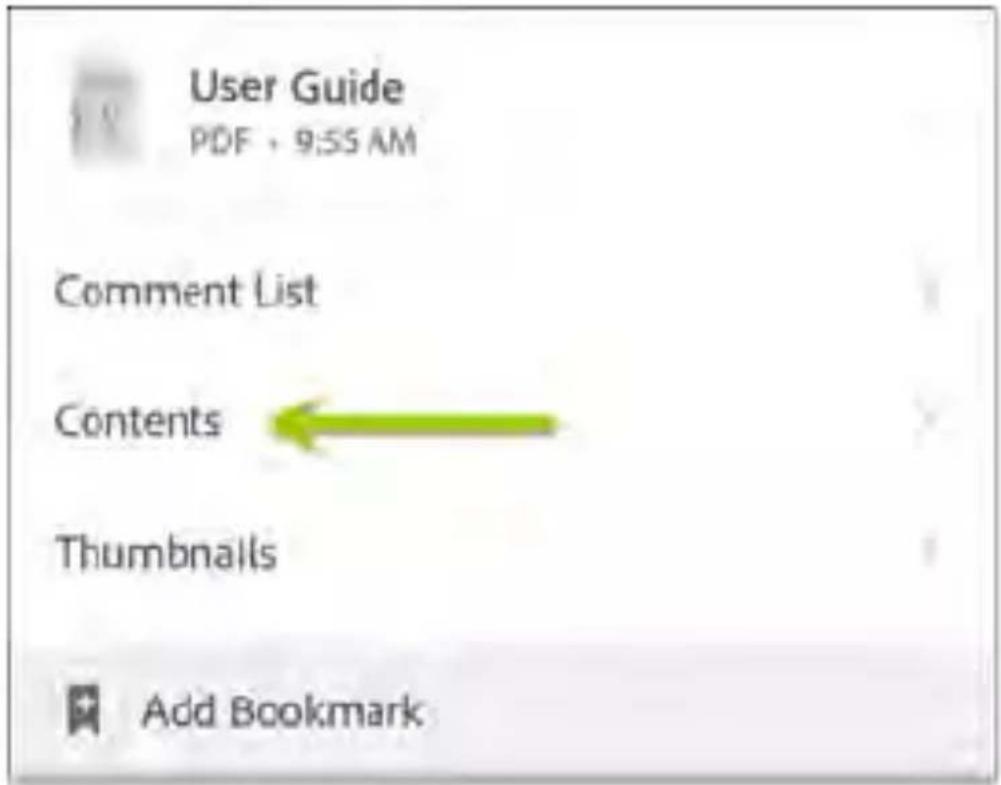
text_image
User Guide PDF + 9:55 AM Comment List Contents Thumbnails Add BookmarkSelect Contents to view the list of chapters and choose a section to read.
| Contents | |
| Contact Us | |
| Introduction | > |
| Home and Android Interface | > |
| LinkRunner 10G Settings and Tools | > |
- Tap the blue Back to Title and Contents link wherever it appears to return to the title page with app links.
- Scroll to show or hide the app toolbars at the top of the Adobe Reader screen and the floating action button (FAB) at the bottom right.
- Tap the screen twice to zoom in or out.
To download this guide onto another device, you can transfer the PDF file using one of the methods described in the Managing Files section, or go to
NetAlly.com/Products/LinkRunner10G.
Buttons and Ports
Button and port functions on your LinkRunner unit are described below.
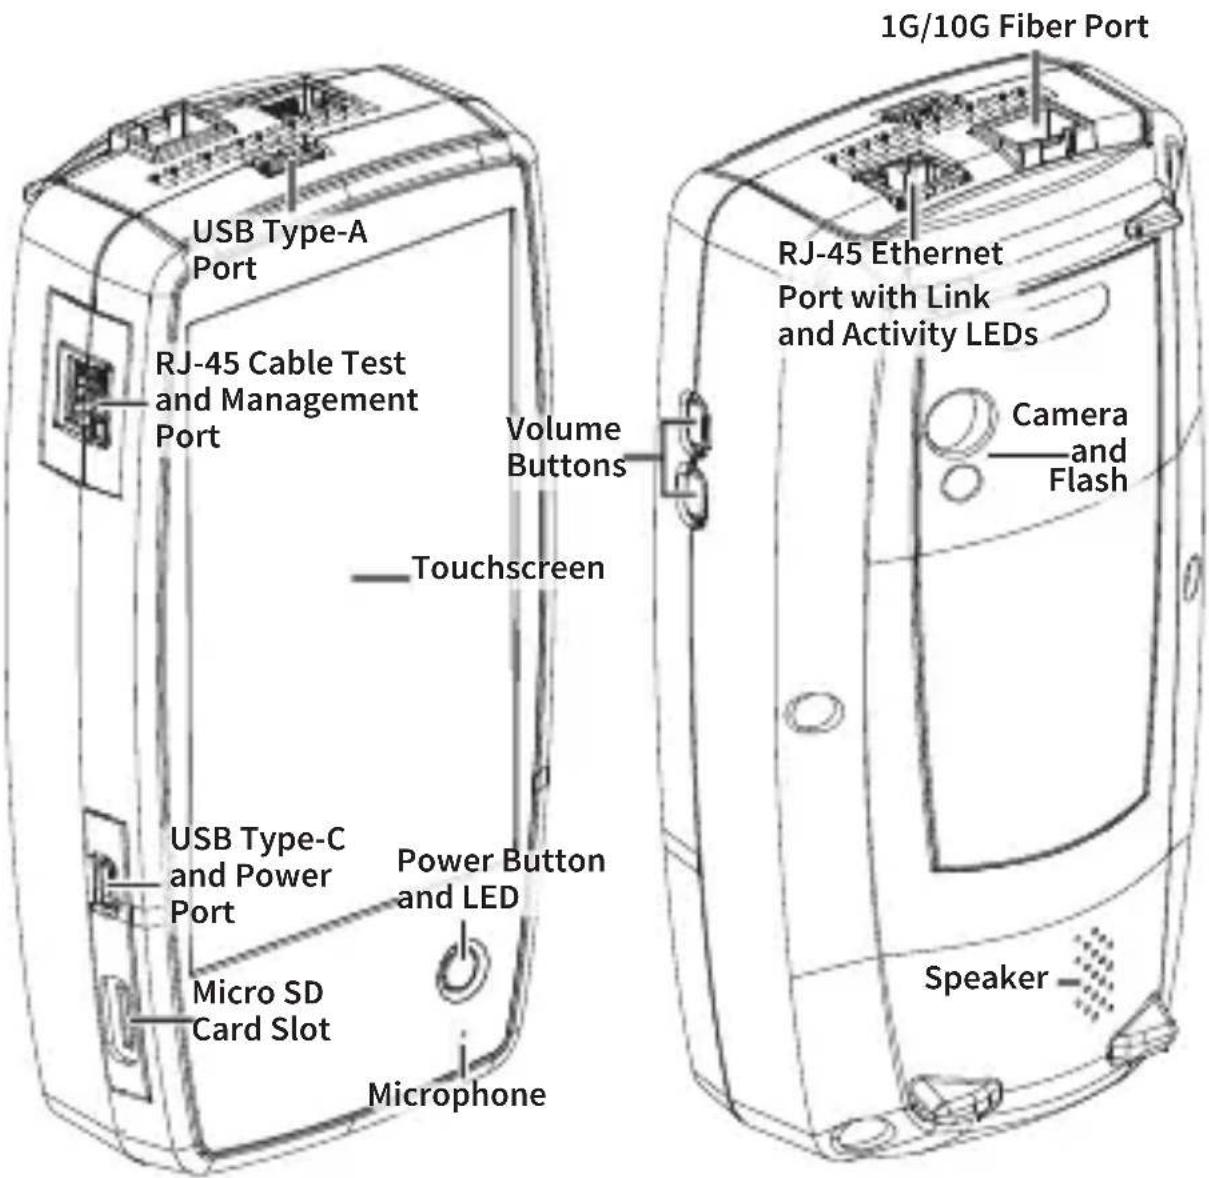
text_image
USB Type-A Port RJ-45 Cable Test and Management Port Volume Buttons Touchscreen USB Type-C and Power Port Power Button and LED Micro SD Card Slot Microphone 1G/10G Fiber Port RJ-45 Ethernet Port with Link and Activity LEDs Camera and Flash SpeakerFEATURE DESCRIPTION
| Fiber Port1G/10GBASE-X | Connects to an SFP adapter and fiber cable for network testing.NOTE: 100FX SFPs are not supported. |
FEATURE DESCRIPTION
| RJ-45 LAN Port10M/100M/1G/2.5G/5G/10G-BASE-T | Connects to a copper Ethernet cable for network testingCharges the unit if PoE Class or higher is available |
| Transmit LEDs | Green LED lit: LinkedYellow LED flashing: Activity |
| USB Type-A Port | Connects to any USB device |
| RJ-45 Cable Test and Management Port | Connects to an Ethernet cable for patch cable testing and unit management |
| USB Type-C On-the-Go Port | Connects to a USB Type-C connector for file transfer and to the included AC adapter fo charging the unit |
| Power Button and LED | Green LED: Unit is powered onRed LED: Unit is charging |
| Microphone | Allows voice input |
| Camera and Flash | Captures images and acts as a flashlight |
| Micro SD Card Slot | Used for removable storage expansion (See Inserting a Micro SD Card below.) |
| Volume Buttons | Increase or decrease the audio volume |
| Speaker | Produces audio |
See Test and Management Ports for detailed explanations of the port functions.
Refer to the product Specifications if needed.
Inserting a Micro SD Card
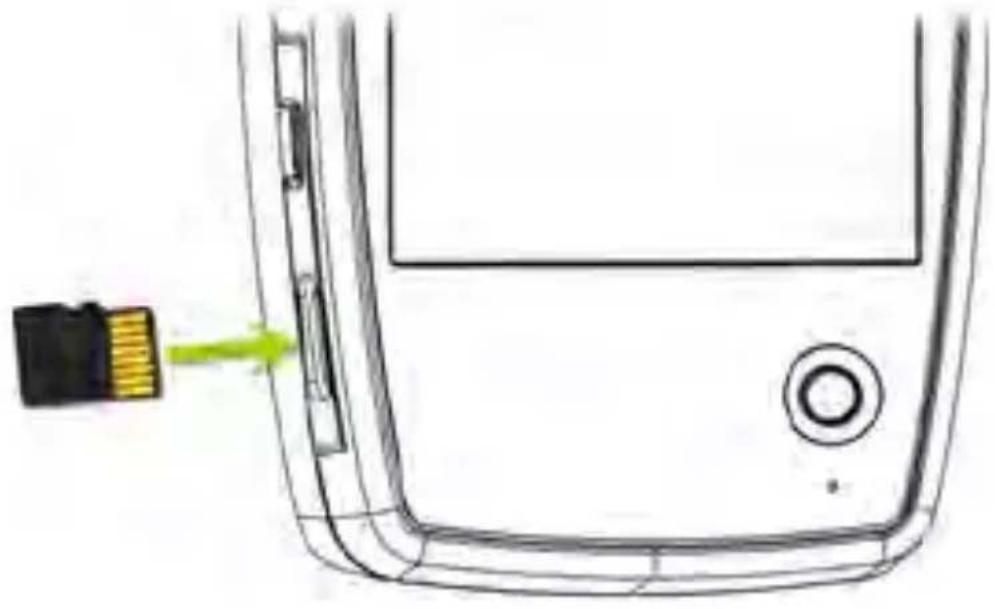
A Micro SD card must be inserted with the metal contacts facing the fronttowards the touchscreen) of the unit, as shown below.
natural_image
Diagram of a mobile phone rear panel with a battery icon pointing to its side panel (no text or symbols present)The card should slide in easily when properly oriented. You may need a paperclip or thumbnail to carefully push the SD card in far enough to engage the spring mechanism for insertion and removal.
Using a Kensington Lock
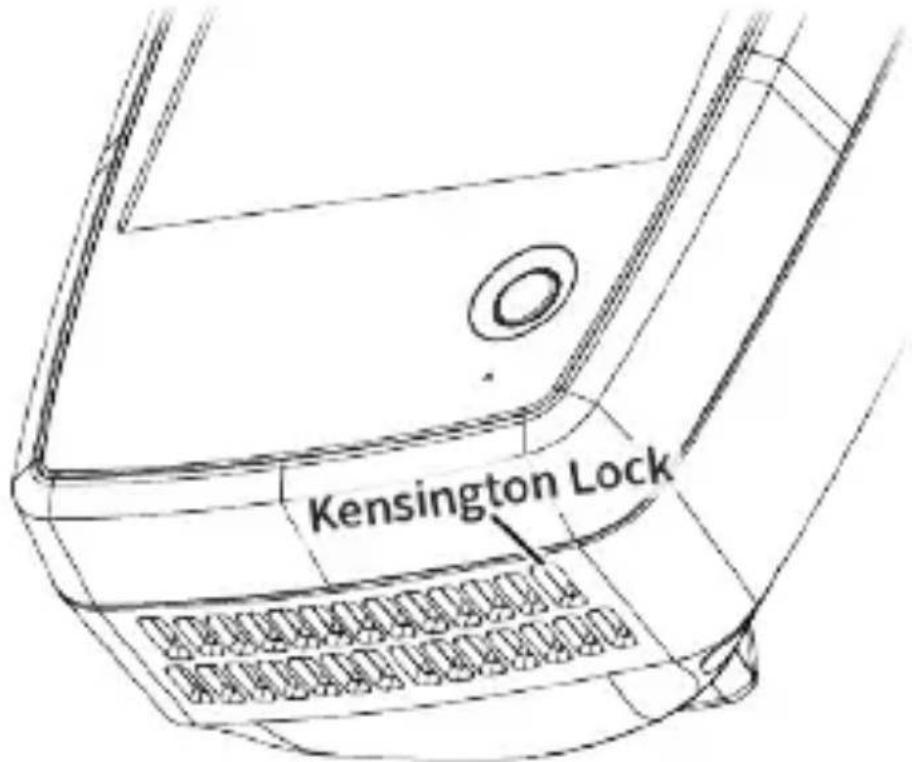
The Kensington Lock slot is the right, front ver hole on the bottom of the unit, as shown below.
text_image
Kensington LockCharging and Power
Your LinkRunner 10G includes a USB-C 15V/3A power adapter.
CAUTION: Only the NetAlly-supplied power adapter is supported.
To begin charging the internal Lithium Ion battery, plug the included power adapter into an AC outlet and the USB-C charging port on the left side of the unit. The Power LED button turns red when the unit is in charging mode and turns off at full charge. The unit will fully charge in 2-4 hours via AC power.
When in charging mode (meaning the unit is o but plugged into an AC power source), the unit will turn on once every 24 hours and top off the battery charge, then power off again.
Tap the power button briefly to view the battery level on the screen while the unit is in charging mode.
When on battery power only, the unit will run for 3-4 hours, depending on the type of testing being conducted.
Powering On
- To start up the unit, hold down the power button for approximately one second, until the power button LED turns green.
- When the display goes into Sleep mode, the power LED remains on. Touch the power button briefly to wake up the display. Set the timing for display sleep and auto power off in the Device Settings.
- To shut down or restart, hold the power button for one second until the “Power off” and "Restart" dialog box appears on the touchscreen, and then touch Power off or Restart.
- If the unit is unresponsive to a normal power off, press and hold the power button for five seconds to perform a hard shutdown.
Safety and Maintenance
Observe the following safety information:
Use only the Adapter provided to charge the battery.
Ensure that the Adapter is easily accessible.
Use the proper terminals and cables for all connections.
⚠️ CAUTION: To avoid possible electric shock or personal injury, follow these guidelines:
- Do not use the product if it is damaged. Before using the product, inspect the case, and look for cracked or missing plastic.
- Do not operate the product around explosive gas, vapor, or dust.
- Do not try to service the product. There are no serviceable parts.
- Do not replace the battery. There is risk of explosion if the battery is replaced by an incorrect battery type.
- Dispose of battery packs and electronics in compliance with your institution's disposal instructions.
- Use as directed. If this product is used in a manner not specified by the manufacturer, the protection provided by the product may be impaired.
Safety Symbols
 | Warning or Caution: Risk of damage to or destruction of equipment or software. |
 | Warning: Risk of electrical shock. |
 | Not for connection to a public telephone system. |
 | Class 1 Laser Product. Do not look into the laser. |
Cleaning
To clean the display, use a lens cleaner and a soft, lint-free cloth.
To clean the case, use a soft cloth that is moi with water or a weak soap.
Scratches on the dark-colored plastic can be removed by lightly scrubbing a 1:2 mixture of
toothpaste to water onto the affected surface with a bristled brush.
CAUTION: Do not use solvents or abrasive materials that may damage the product.
Legal Notification
Use of this product is subject to the Terms and Conditions available at
http://NetAlly.com/terms-and-conditions or which accompanies the product at the time of shipment or, if applicable, the legal agreement executed by and between NetAlly and the purchaser of this product.
Open-Source Software Acknowledgment: This product may incorporate open-source components. NetAlly will make available open-source code components of this product, if any, at Link-Live.com/OpenSource.
NetAlly reserves the right, at its sole discretion, to make changes at any time in its technical information, specifications, service, and support programs.
© 2019, 2020 NetAlly
Home and Android Interface
This chapter explains how to use the features of the Android Home screen and user interface to navigate and organize your device.
The LinkRunner 10G interface supports many of the operations typical of any Android device. Use dragging and swiping motions on the touchscreen to navigate through apps, open side menus, drag down the Notification Panel from the Status Bar at the top of the Home screen, or drag up the Apps screen from the bottom.
Home Screen
text_image
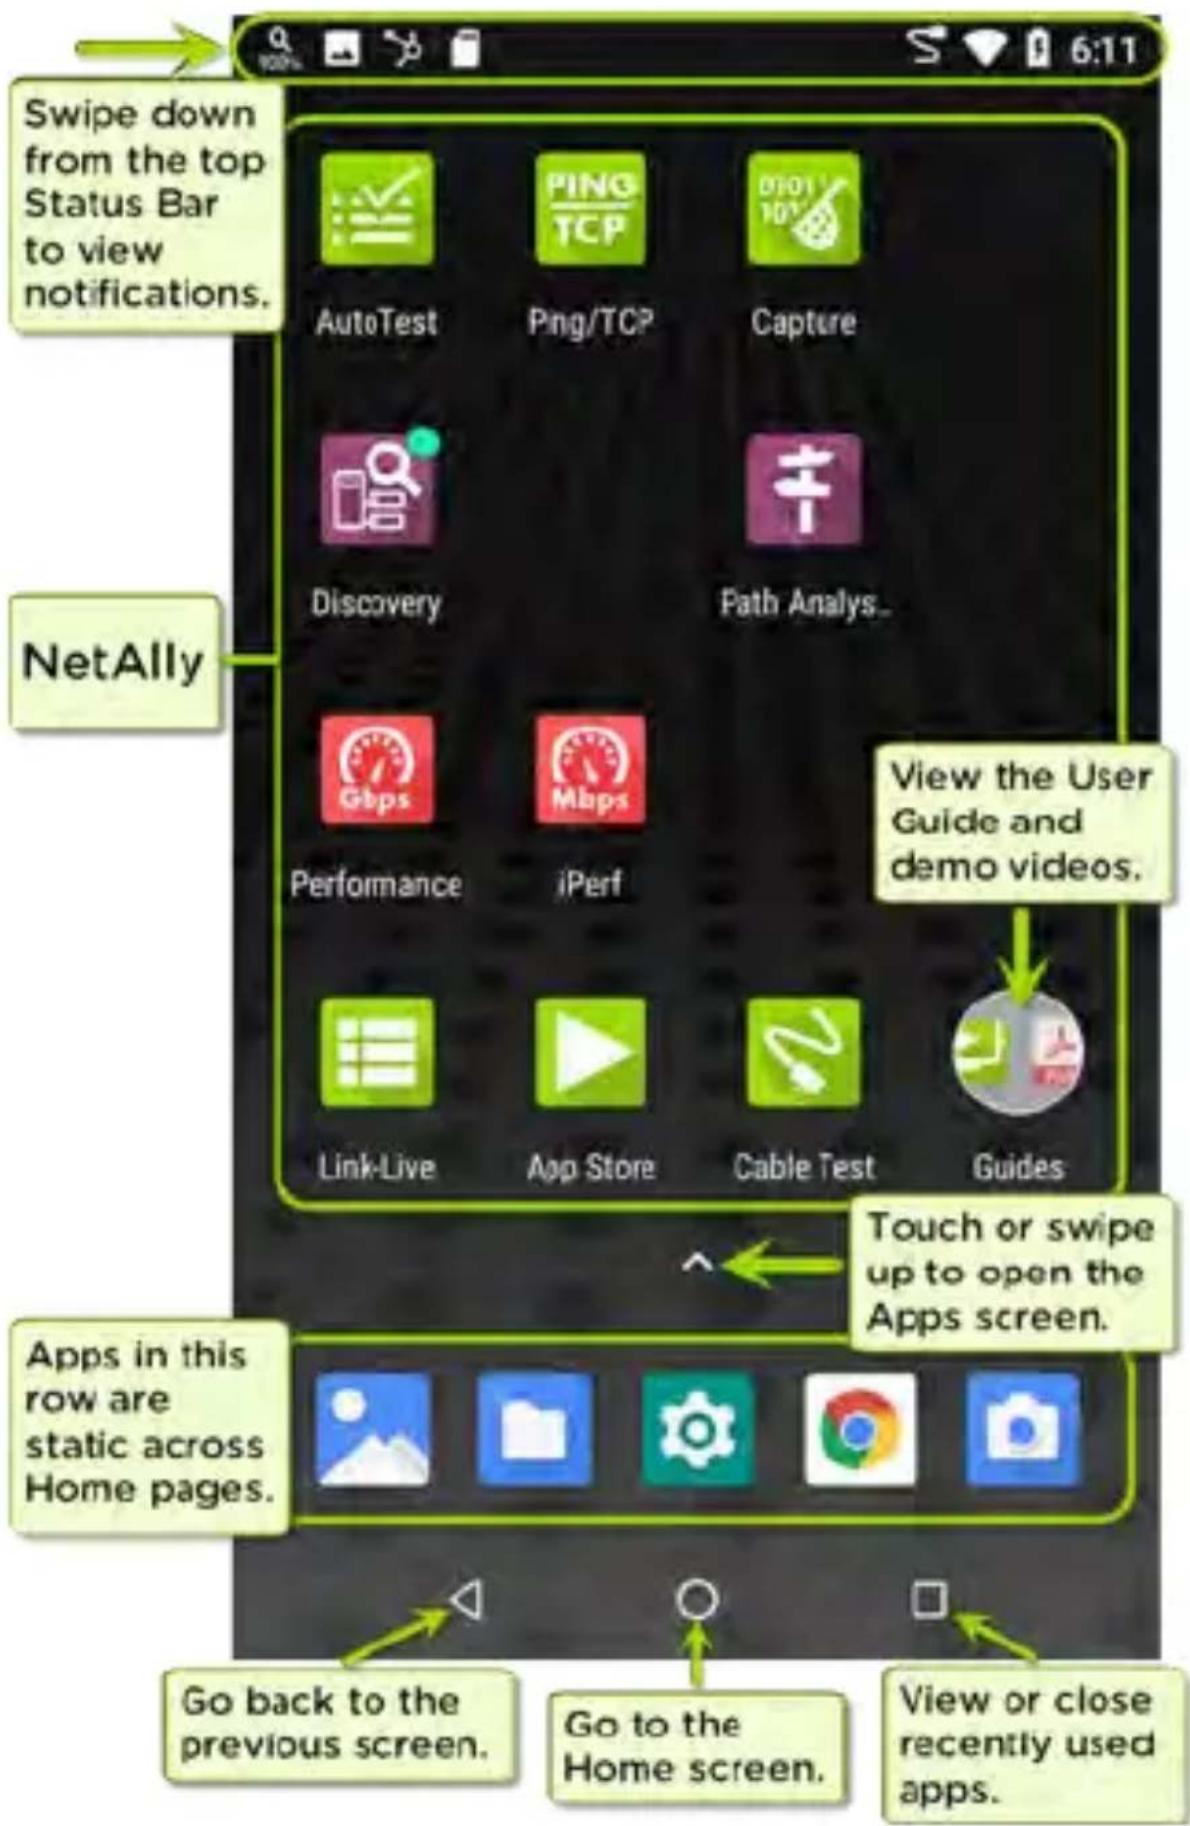
Swipe down from the top Status Bar to view notifications. NetAlly View the User Guide and demo videos. Touch or swipe up to open the Apps screen. Apps in this row are static across Home pages. Go back to the previous screen. Go to the Home screen. View or close recently used apps.Like other Android devices, your LinkRunner 10G Home screen is customizable. The image above shows the default configuration, but you can add, remove, and reorganize app icons and widgets to serve your purposes.
You can also create more Home pages by touching, holding, and dragging an app icon to the right from the main Home screen.
See the Apps screen section for instructions on adding more apps to your Home pages.
Navigating the Android System
The navigation actions you can perform to move through screens and panels on the LinkRunner 10G are the same as those you would use to navigate an Android phone or tablet.
The main device navigation buttons appear at the bottom of the touch screen.

The back icon returns to the previous screen.

The circle icon opens the Home screen.

The square icon displays your recently used applications for easily switching between then. This is also the screen where you can close, or stop, the open applications.
TIP: Double tap the square icon to switch back to the previous app you were using and to switch back and forth between two app screens (like a testing app and this User Guide).
Swiping
Touch and drag your finger or "swipe" up, down, left, and right to move through pages of the Home screen and applications, scroll up or down, and pull out navigation drawers and panels.
Long Pressing
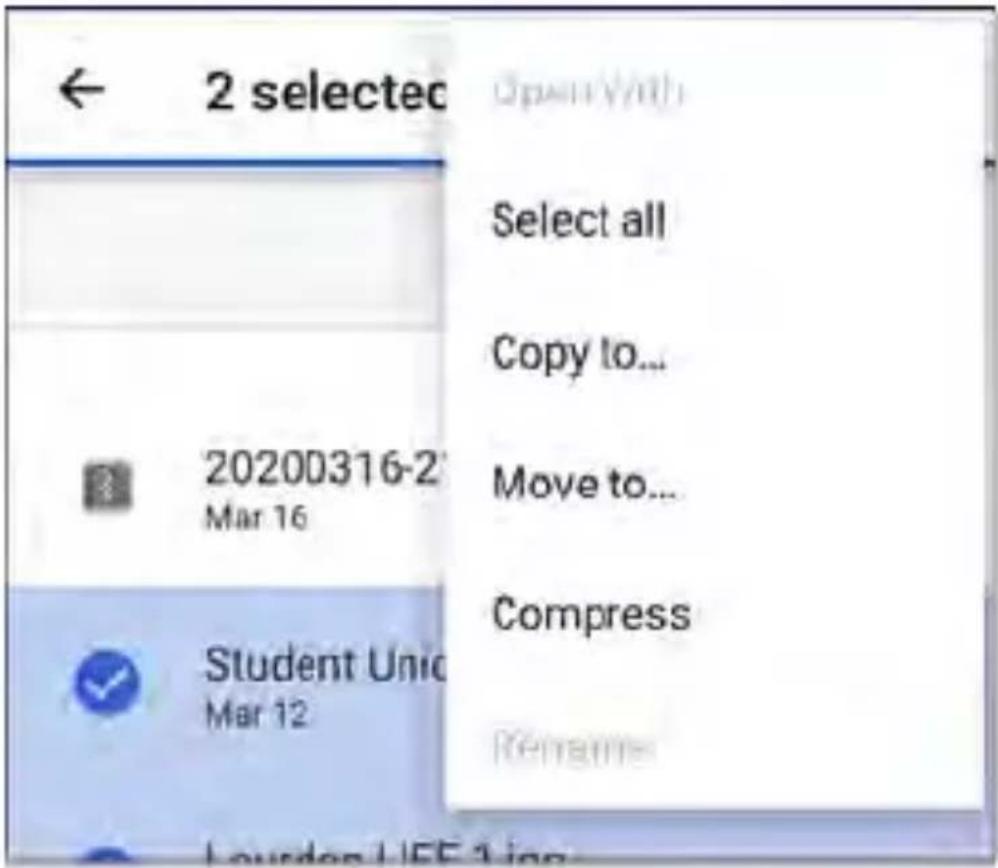
Touch and hold or "long press" files or application icons to reveal additional operations.
For example, you can long press a file name in the Files Application to reveal the top toolbar with options for sharing, deleting, or moving the file.

text_image
← 2 selected < ↑ :Additional options often appear in an overflow menu, designated by the action overflow icon ⋮.
text_image
2 selected OpenWith Select all Copy to... 20200316-2 Mar 16 Move to... Compress Student Unic Mar 12 RenameYou can also long press on text on most scree to open options for copying and sharing the text.
Left-Side Navigation Drawer
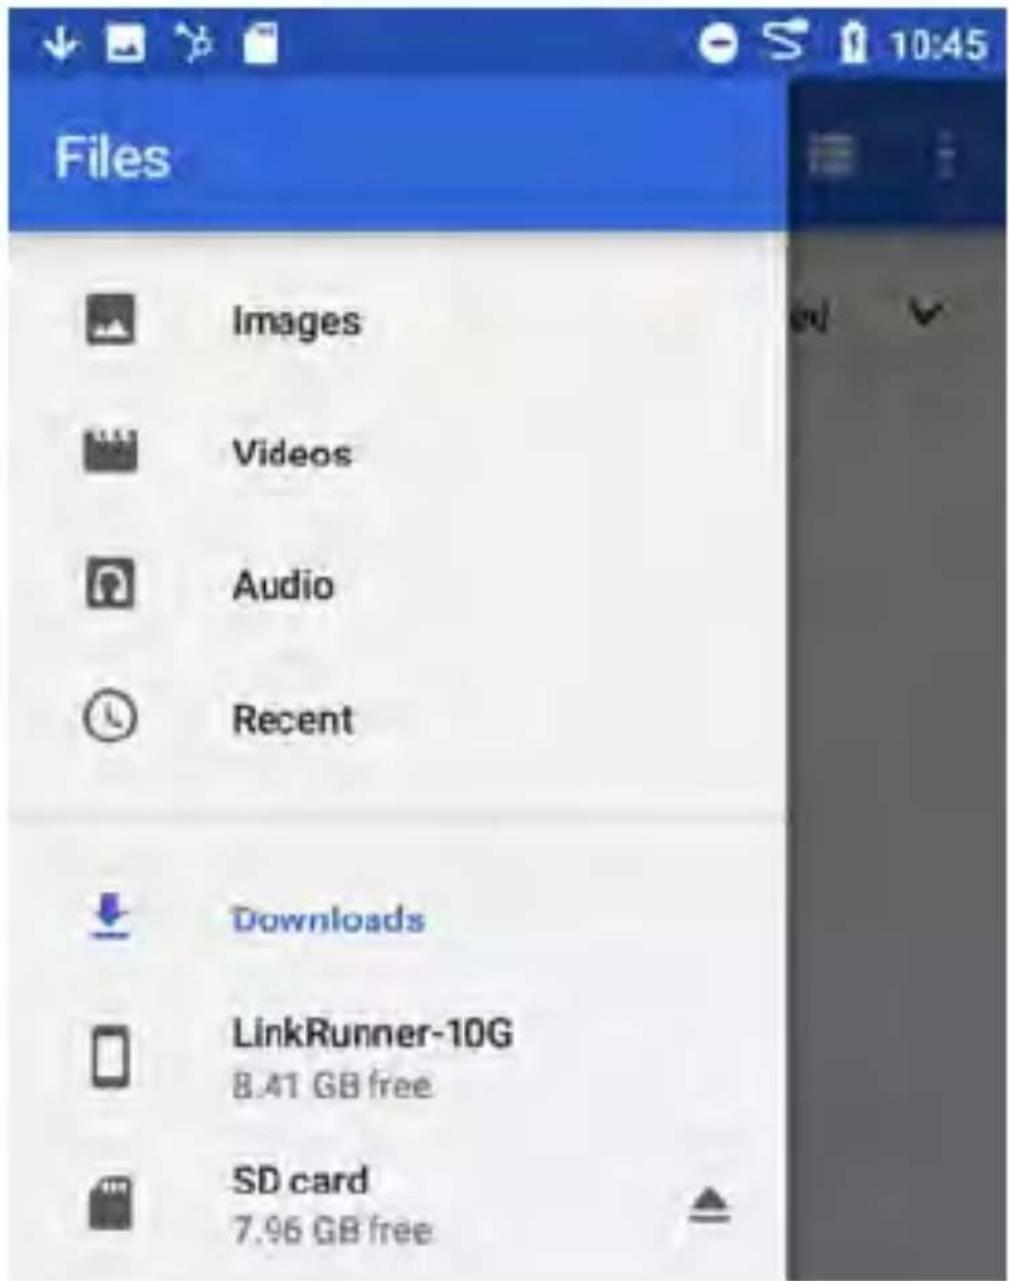
Touch the Menu icon or swipe right in the Files app to open the navigation drawer. It displays the folders in your file system.
text_image
Files Images Videos Audio Recent Downloads LinkRunner-10G 8.41 GB free SD card 7.96 GB freeNOTE: In the Files app, you may need to take the action overflow icon at the top right and select Show Internal Storage to navigate to the LinkRunner-10G folder and sub-folders, as shown above.
See the Navigation Drawer topic for more.
Android Status Bar and Notifications

text_image
Mobile phone status bar with icons for start, stop, zoom, refresh, and next buttonThe Status Bar across the top of the screen displays notification icons from the Android system as well as LinkRunner 10G-specific icons related to your network connections and test statuses.
See Test and Port Status Notifications for details about the icons and notifications related to LinkRunner 10G network connections, testing, and management.
Touch and swipe down on the Status Bar to open the Notification Panel.
Notification Panel
The Notification Panel contains notifications from your device, such as downloads and installs, inserted hardware, captured screenshots, app and connection statuses, and updates. The panel also displays common Android settings icons for quick access.
Swipe (touch and drag) downwards on the Status Bar at very top of the screen to slide down the Notification Panel.

text_image
100% 10:48 Mon, Jun 29
LinkRunner 10G
Wired Management Port
IP Address: 192.168.0.123

Android System
SD card
For transferring photos and media
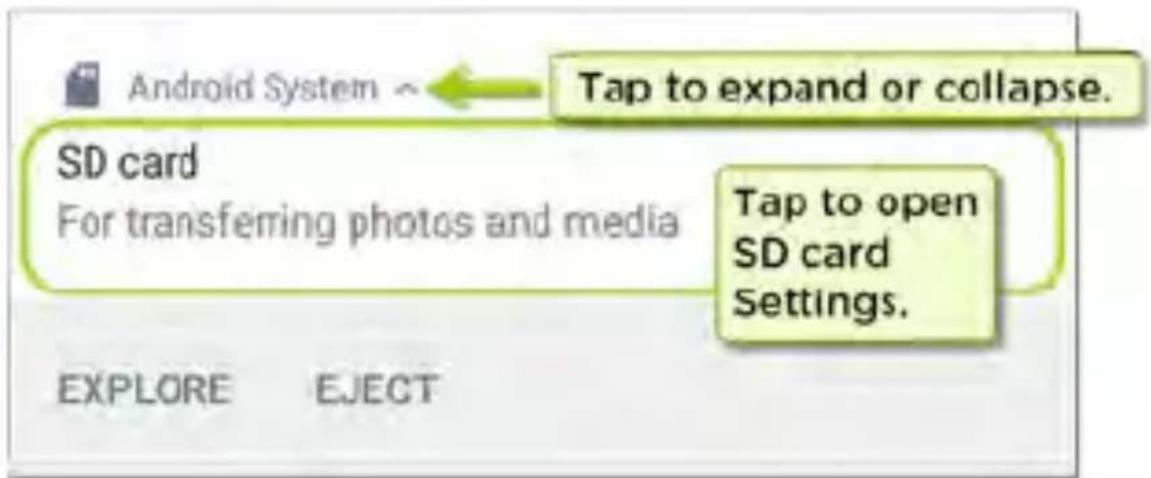
- Touch the title and down arrow on a notification (or swipe down on it) to expand the box and view more details or options.
text_image
Android System Tap to expand or collapse. SD card For transferring photos and media Tape to open SD card Settings. EXPLORE EJECT- Touch the middle of a notification to open the related app, image, or device settings o to perform other related actions.
- Swipe left on a notification to dismiss it. NOTE: Because they are essential to the LinkRunner testing functions, you cannot dismiss the test and management port-related test and port status notifications.
- Touch CLEAR ALL at the lower right of the panel to dismiss all Android System notifications.
Apps Screen and Store
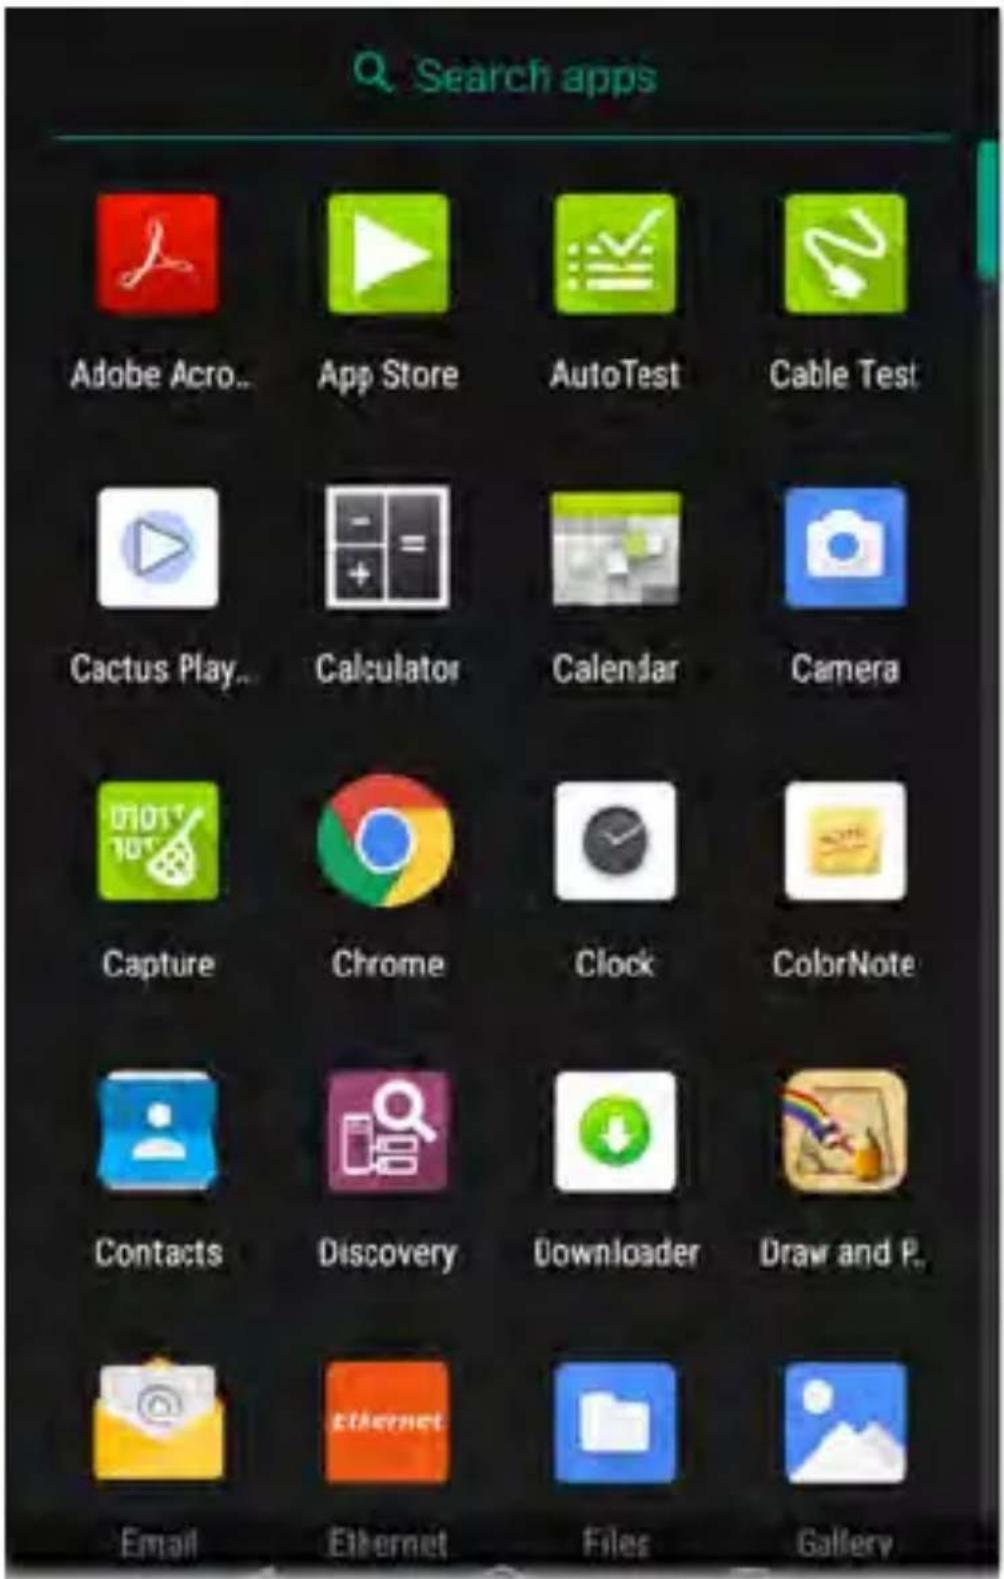
To access the apps that are not shown on the Home screen, swipe up on the Home screen or touch the up arrow icon
text_image
Search apps Adobe Acrobat App Store AutoTest Cable Test Cactus Play Calculator Calendar Camera Capture Chrome Clock ColorNote Contacts Discovery Downloader Draw and P. Email Ethernet Files GalleryThe Apps screen displays all the apps on your device. The image above is an example. Your Apps screen may contain different third-party apps.
- Tap an app's icon to open the app.
- Hold and drag an icon upwards to add it to your Home screens.
- Touch and hold (long press) an icon to view App Info or access widgets you can add to the Home screen and other actions you can perform.
App Store
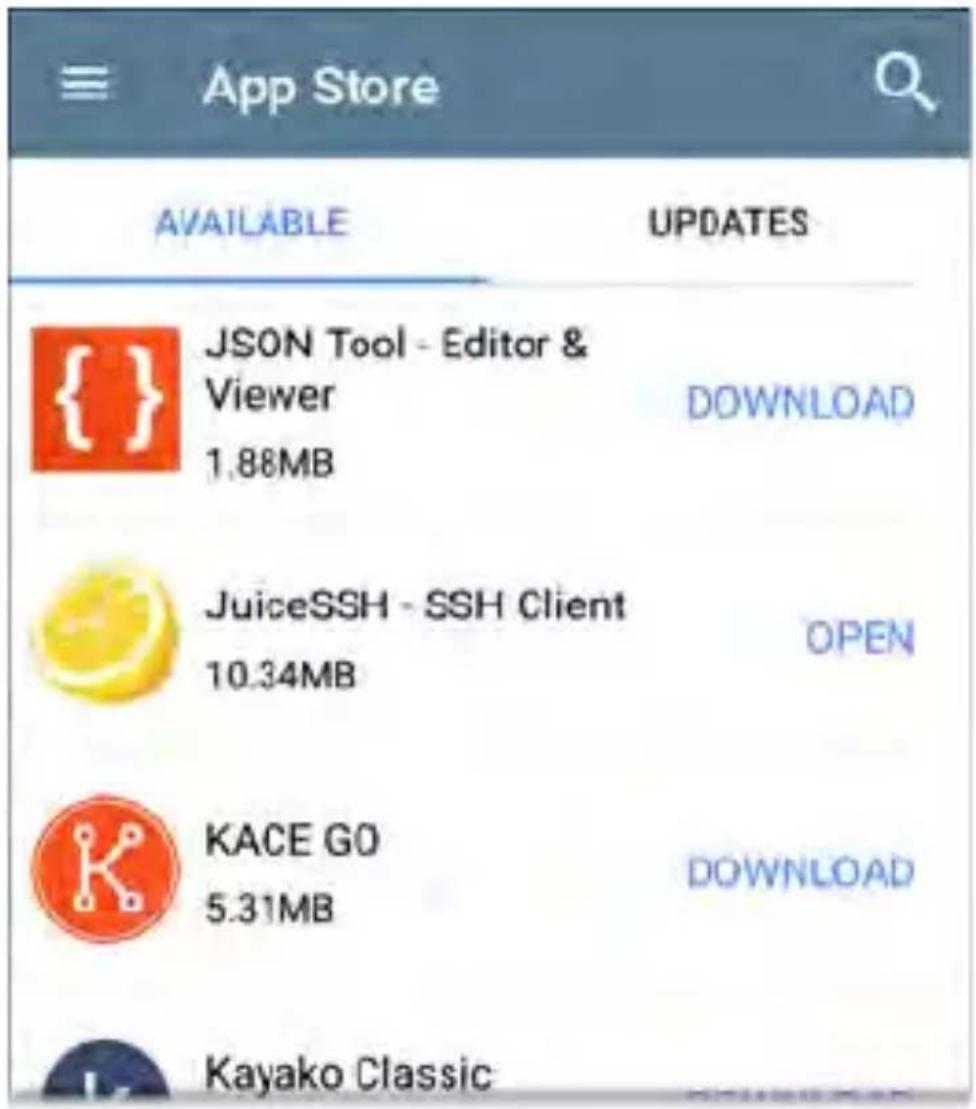
From the Home Screen or Apps Screen, open the NetAlly App Store to download third-party Android applications to use on your LinkRunner 10G.
NOTE: Your unit must be "claimed" to Link-Live Cloud Service at Link-Live.com to access the App Store.
text_image
App Store AVAILABLE UPDATES JSON Tool - Editor & Viewer 1.88MB DOWNLOAD JuiceSSH - SSH Client 10.34MB OPEN KACE GO 5.31MB DOWNLOAD Kayako ClassicTouch the search icon to search for an App.
To request that an App be added to the App Store, visit the Apps page at Link-Live.com, and select the floating action button (FAB) at

the lower right corner to Request or Upload an App.
Device Settings
To access the Android system device settings, touch the Settings icon at the bottom of the Home screen.

text_image
Search settings Network & Internet WiFi Connected devices Bluetooth, USB Apps & notifications Permissions, default apps Battery 56% - 51m until fully charged Display Wallpaper, sleep, font size Sound Volume, vibration Storage 50% used - 8.05 GB freeUse the device settings screen to adjust the display, sound, and date/time; view installed applications and memory devices; connect to Wi-Fi; or reset to factory defaults.
Quick Settings Panel
You can also access some of the most common device settings, like Wi-Fi, from the Quick Settings Panel by swiping down from the Status Bar at the top of the touchscreen.
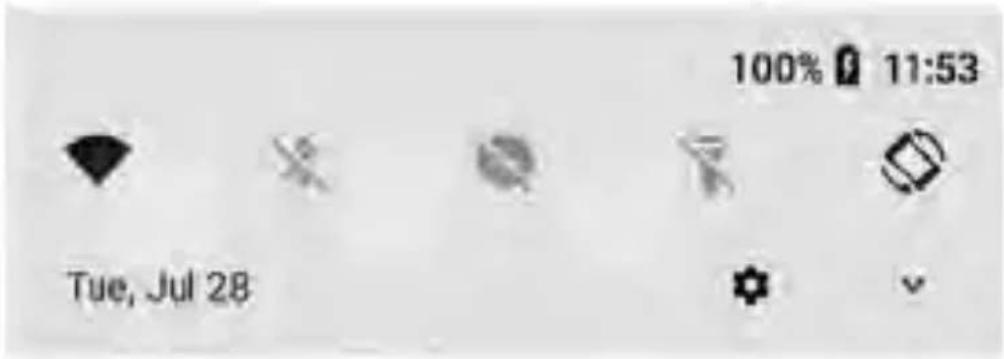
text_image
100% 11:53 Tue, Jul 28LinkRue=nc 100 - Wi-Fi Management Port IP Address: 10.0.0.118 SSID: NetAlly Test 2.4 GHz Channel: 1
Swipe down twice to open the full Quick Settings Panel.
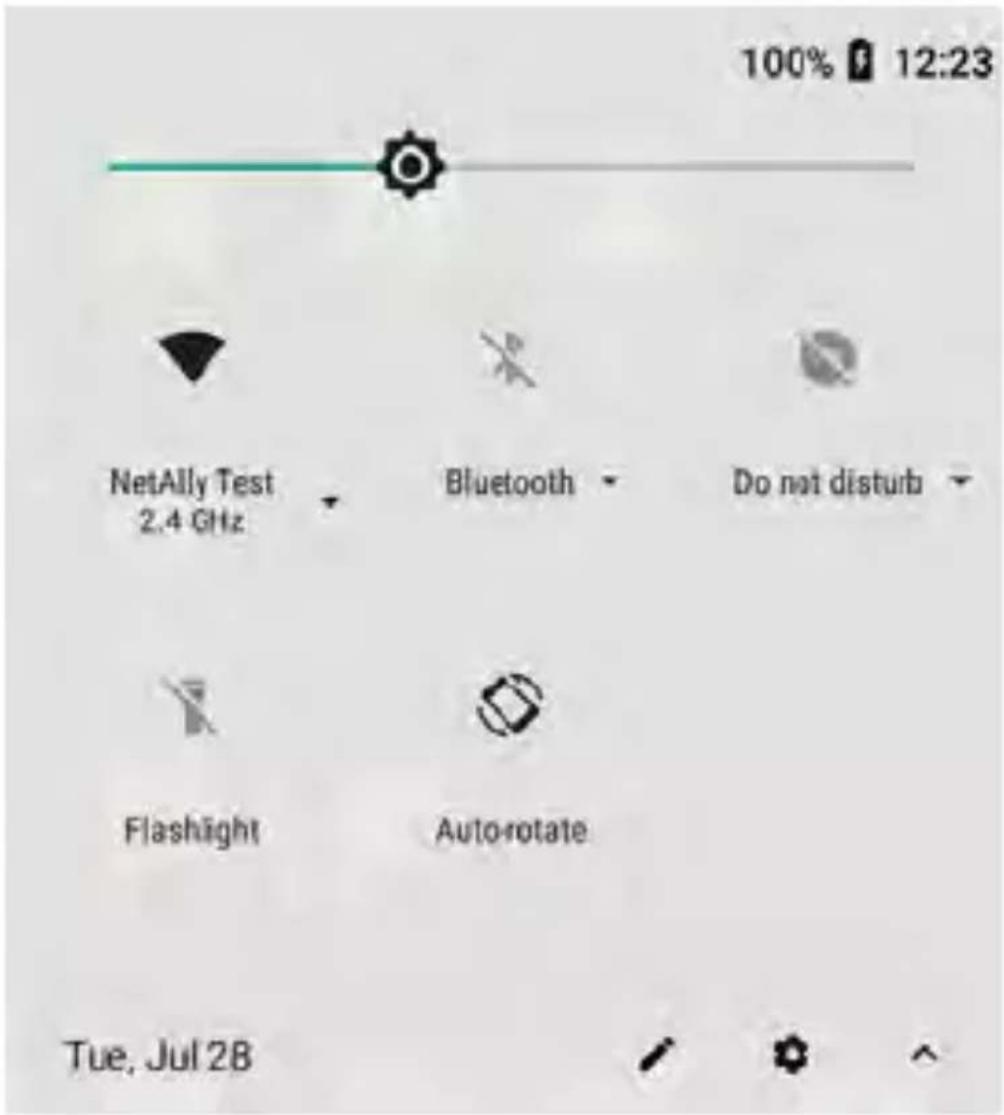
text_image
100% 12:23 NetAlly Test 2.4 GHz Bluetooth Do not disturb Flashlight Auto-rotate Tue, Jul 28- Touch and drag the slider control at the top of the panel to adjust the screen's brightness.
- Tap an icon in the panel to enable or disable the corresponding feature. For
example, you can turn the unit's Wi-
or screen Auto-rotate functions on or off from the quick settings.

- Touch and hold an icon to open the relevant device setting screen, if there is one. For example, touch and hold the Wi-Fi icon to open Android's Wi-Fi settings or the Auto-Rotate icon to open Display settings.
- Tap the pencil icon at the bottom of the Quick Settings Panel to configure the icon controls that appear in the panel.
Auto Power Off
Activating the Auto Power Off function helps to extend the battery run time.
-
From the Device Settings, select Display.
-
On the Display settings screen, touch Device auto power off.
-
In the pop-up dialog box, select how long you want the unit to remain On with no activity occurring. It will automatically power off after the selected period of inactivity has passed.
Similarly, you can adjust the setting that controls when the display goes into Sleep mode from the Display settings screen.
Connecting to Wi-Fi
NOTE: Wi-Fi connectivity requires the use of a supported external USB adapter:
- Edimax N150
- Edimax AC1200
To connect your LinkRunner to a Wi-Fi network, access the Android Wi-Fi Device Settings using either method below:
- Open the device Wi-Fi settings from the main Device Settings screen by touching the Settings icon and selecting Network & Internet > Wi-Fi.
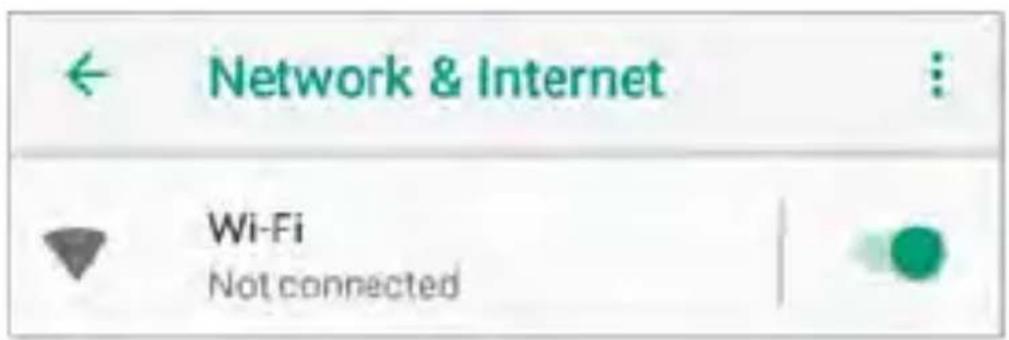
text_image
Network & Internet Wi-Fi Not connected- Open device Wi-Fi settings from the Quick Settings panel by dragging down the top Status Bar and touching and holding (long pressing) the Wi-Fi icon.
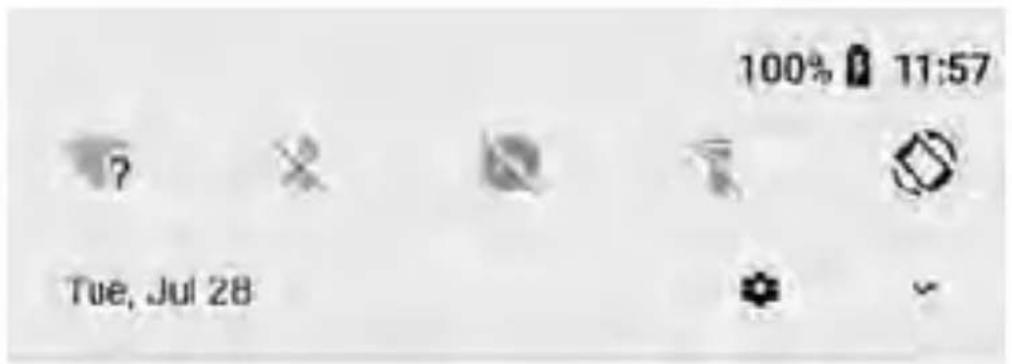
text_image
100% 11:57 Tue, Jul 28LinkRunee 10G No Management Port Connection
Either path opens the Wi-Fi settings screen.
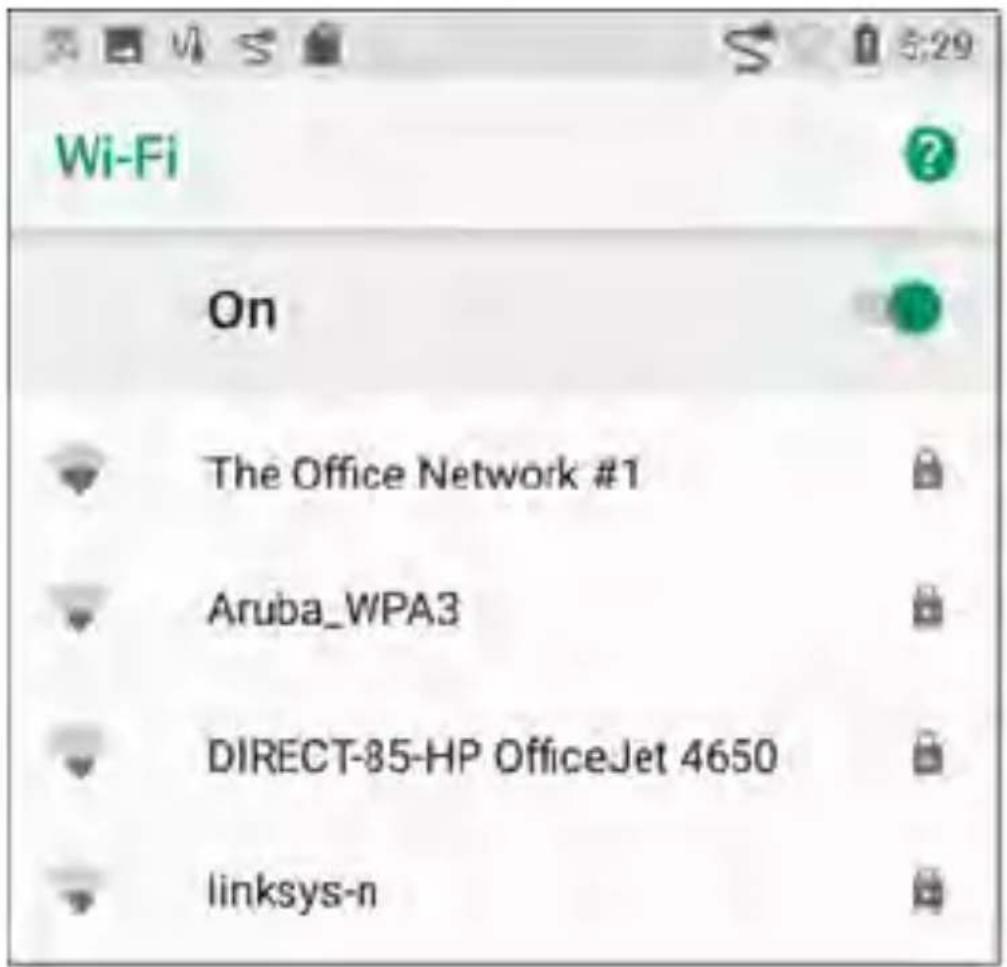
text_image
Wi-Fi On The Office Network #1 Aruba_WPA3 DIRECT-85-HP OfficeJet 4650 linksys-n-
Ensure the Wi-Fi feature is On.
-
Touch an available Wi-Fi network in the list.
-
Enter the network's security credentials.
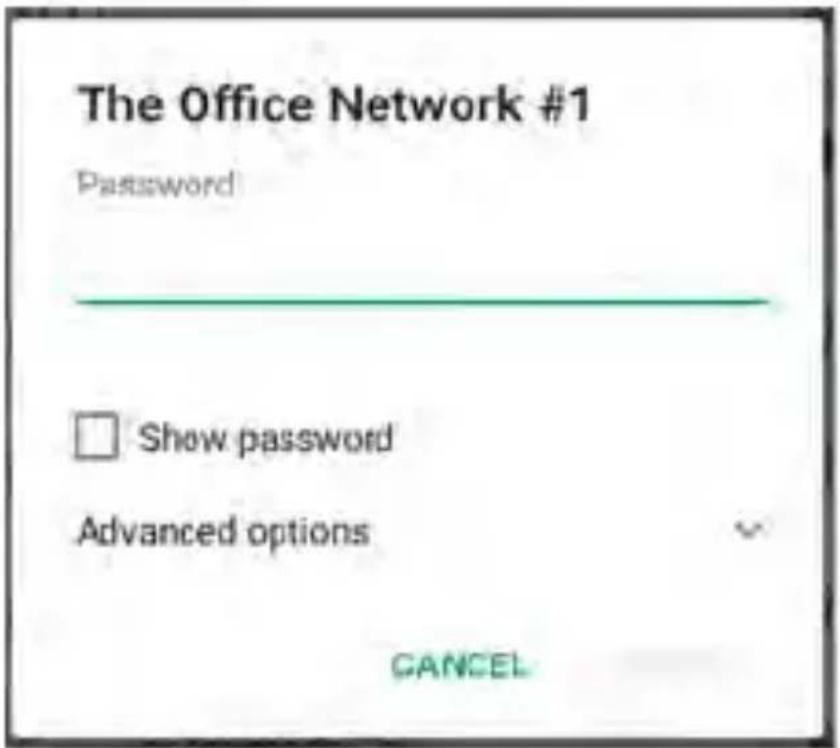
text_image
The Office Network #1 Password Show password Advanced options CANCELMost networks only require a password, but depending on the security settings, some may also require a company username, EAP type, authentication type, certificate, or other credentials.
- After entering credentials, touch CONNECT.
The network you selected moves to the top of the list, and your connection status is displayed below its name in device and quick settings.
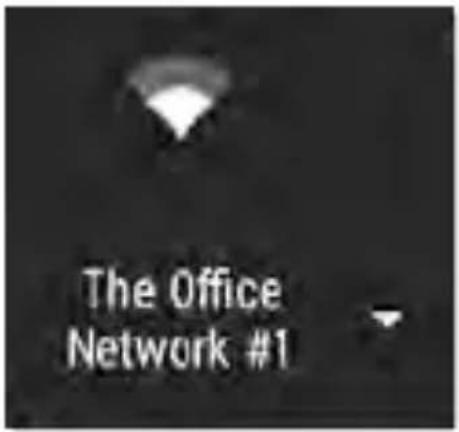
text_image
The Office Network #1The Status Bar displays the Wi-Fi status icon at the top right of the screen.
Captive Portals
When you try to connect to a network with a Captive Portal requirement, this Android notification icon appears in the top Status Bar. Drag down from the top of the screen to open the notification.
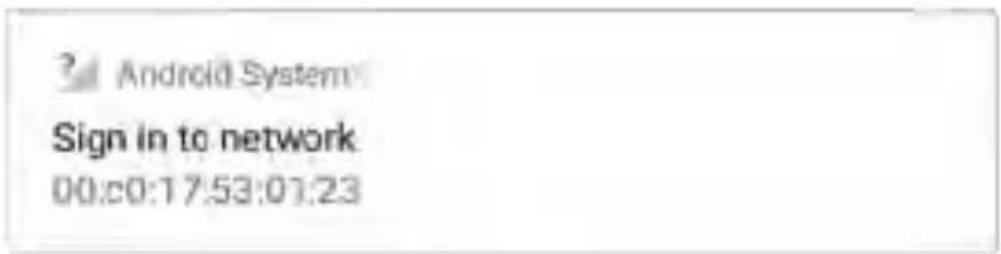
text_image
? Android System Sign in to network 00:c0:17:53:01:23Touch the notification to open a web browser window where you can enter the required information for the captive portal. When finished, you should be able to access the internet through the connected network.
If you are trying to connect to a network with captive portal, but the Android notification is not appearing, check that the Captive Portal Detection setting is enabled in Device Settings > Network & Internet.
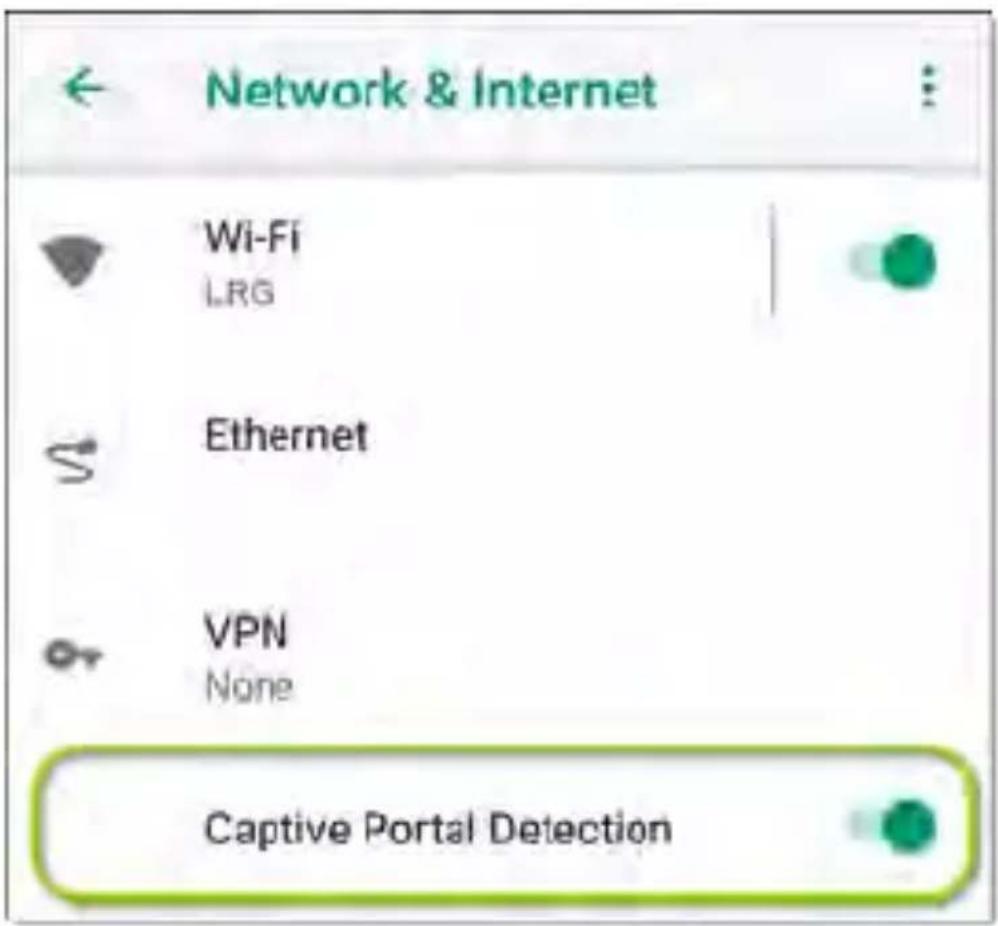
text_image
Network & Internet Wi-Fi LRG Ethernet VPN None Captive Portal DetectionSharing
LinkRunner 10G allows you to “share” images and files like you would on any Android device. When you see the Share icon, touch it to view your configured sharing options.
For example, the image below shows an expanded Screenshot notification from the top notification panel.
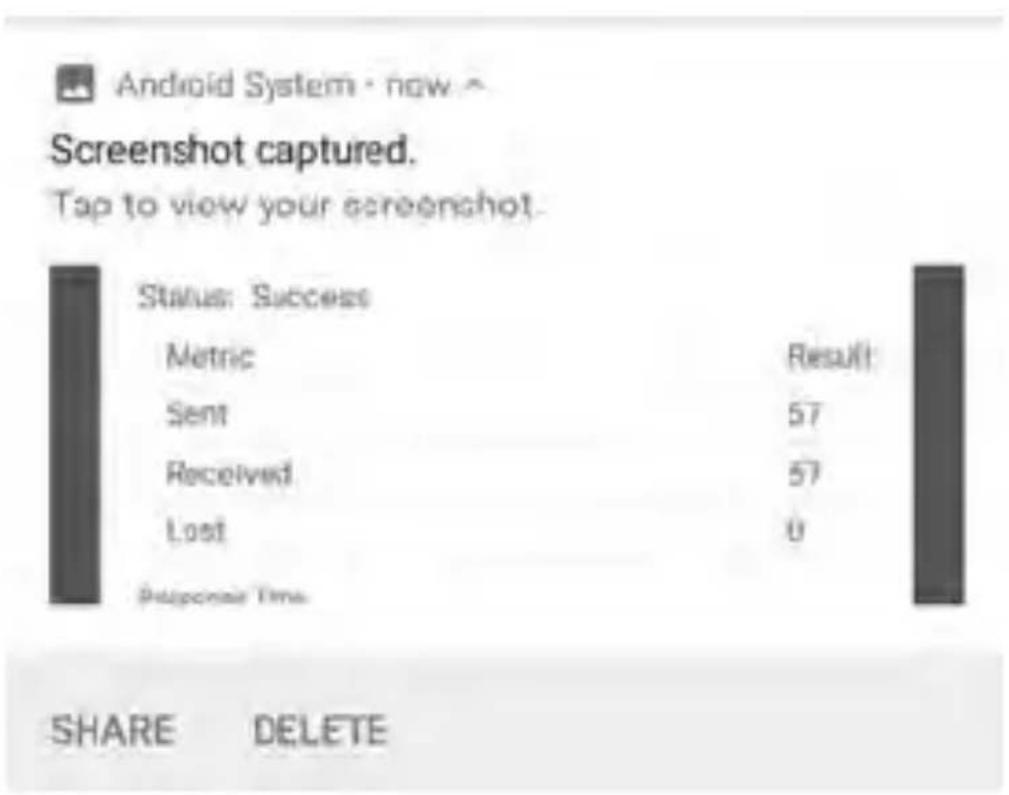
text_image
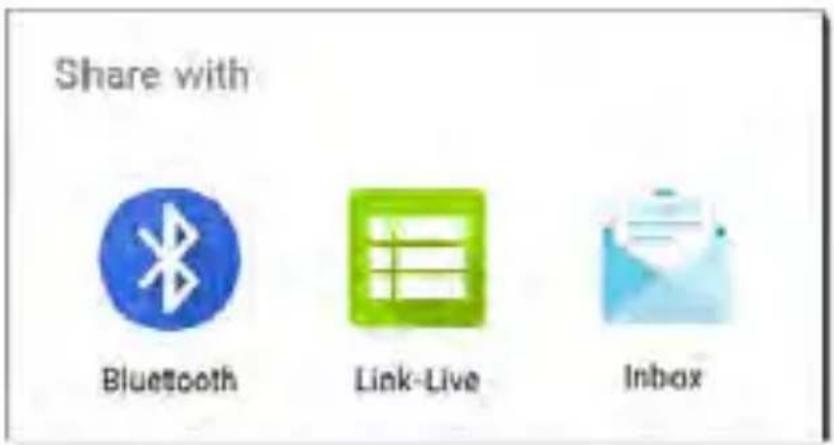
Android System - now Screenshot captured. Tap to view your screenshot. Status: Success Metric Sent Received Lost Response Time Result: 57 57 0 SHARE DELETETouch SHARE to open the “Share with” pop-up dialog, where you can choose a sharing method, such as email, messaging, or uploading to Link-Live Cloud Service online.
text_image
Share with Bluetooth Link-Live InboxSharing Files to Link-Live
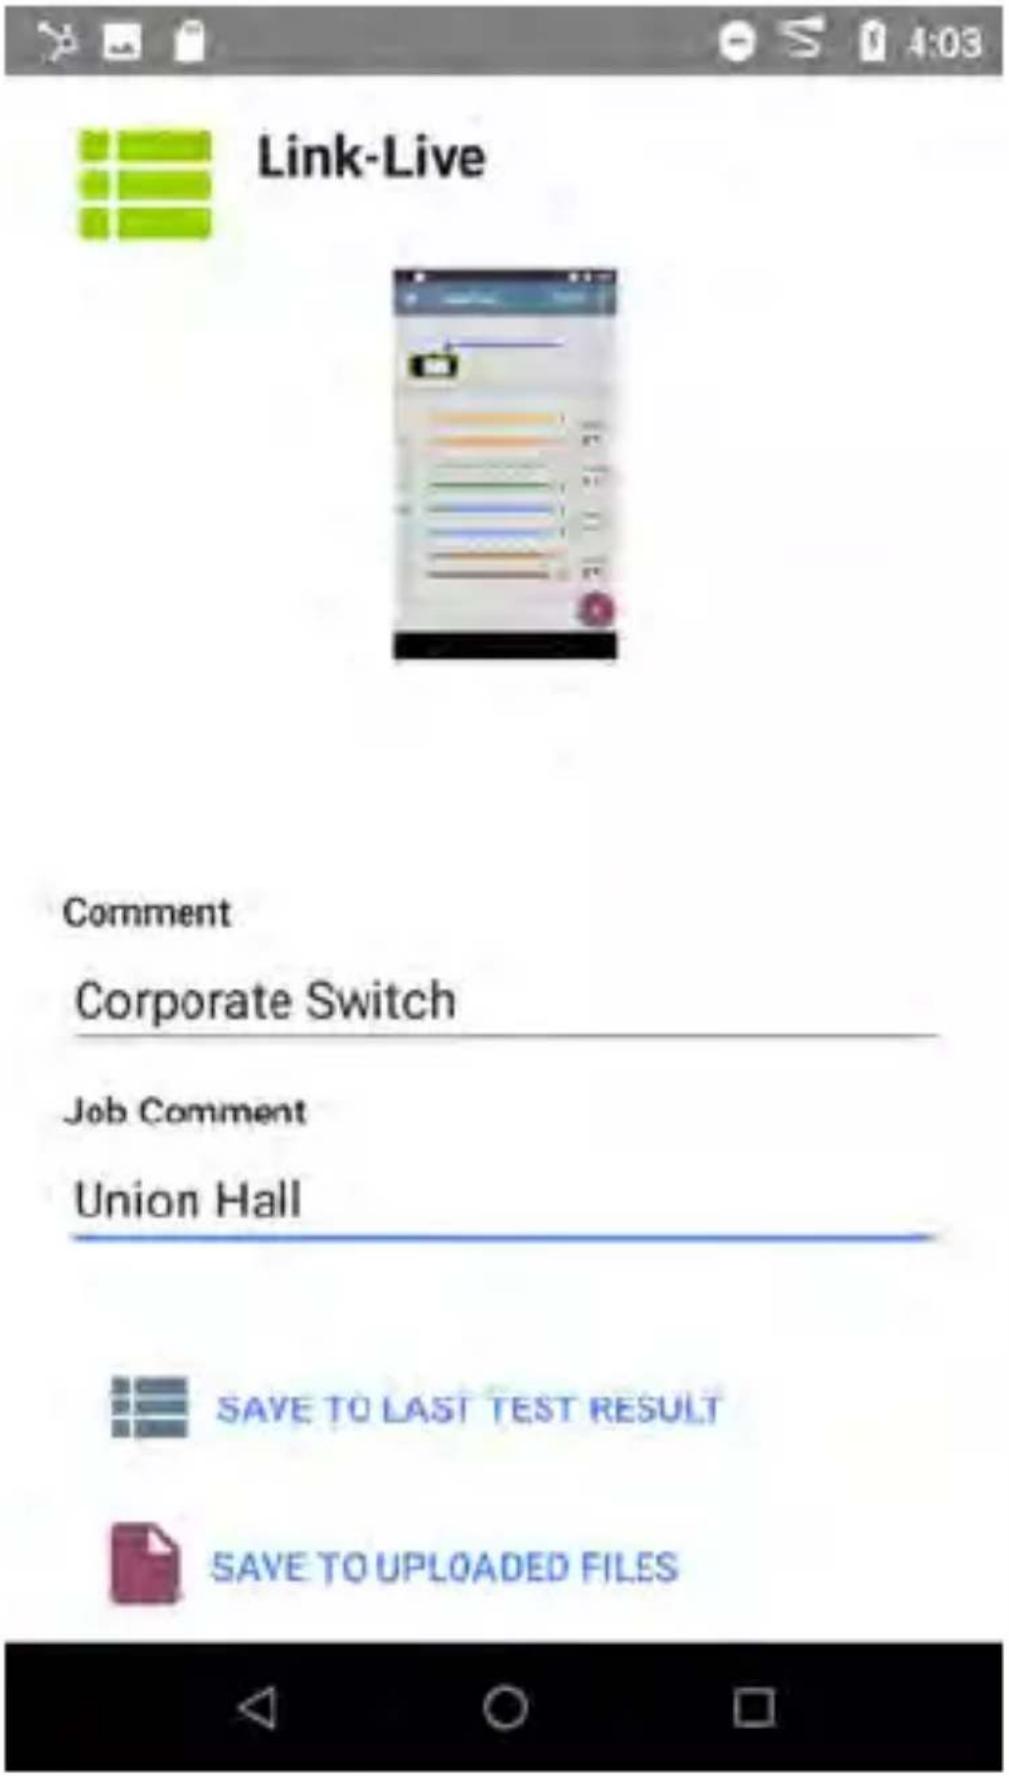
From the “Share with” dialog box (and other screens on the LinkRunner), touch the Link-Live option to share (upload) a file to Link-Live Cloud Service at Link-Live.com.
Files can be attached to a test result or uploaded individually to the Uploaded Files page on Link-Live.
The example below shows the Link-Live sharing screen for a screenshot image.
text_image
Link-Live Comment Corporate Switch Job Comment Union Hall SAVE TO LAST TEST RESULT SAVE TO UPGLOADED FILESThe SAVE TO LAST TEST RESULT option attaches the image to your most recently run
AutoTest, Performance, iPerf, or Cable Test result on Link-Live.com.
Sharing from the Files App
Files from internal or external storage can also be shared to Link-Live.com from the Android Files app. You can upload one selected file or multiple files at once.
- With the Files app opened, navigate to the folder containing the files you want to share using the left-side navigation drawer.
- Long press on one or multiple files to select it.
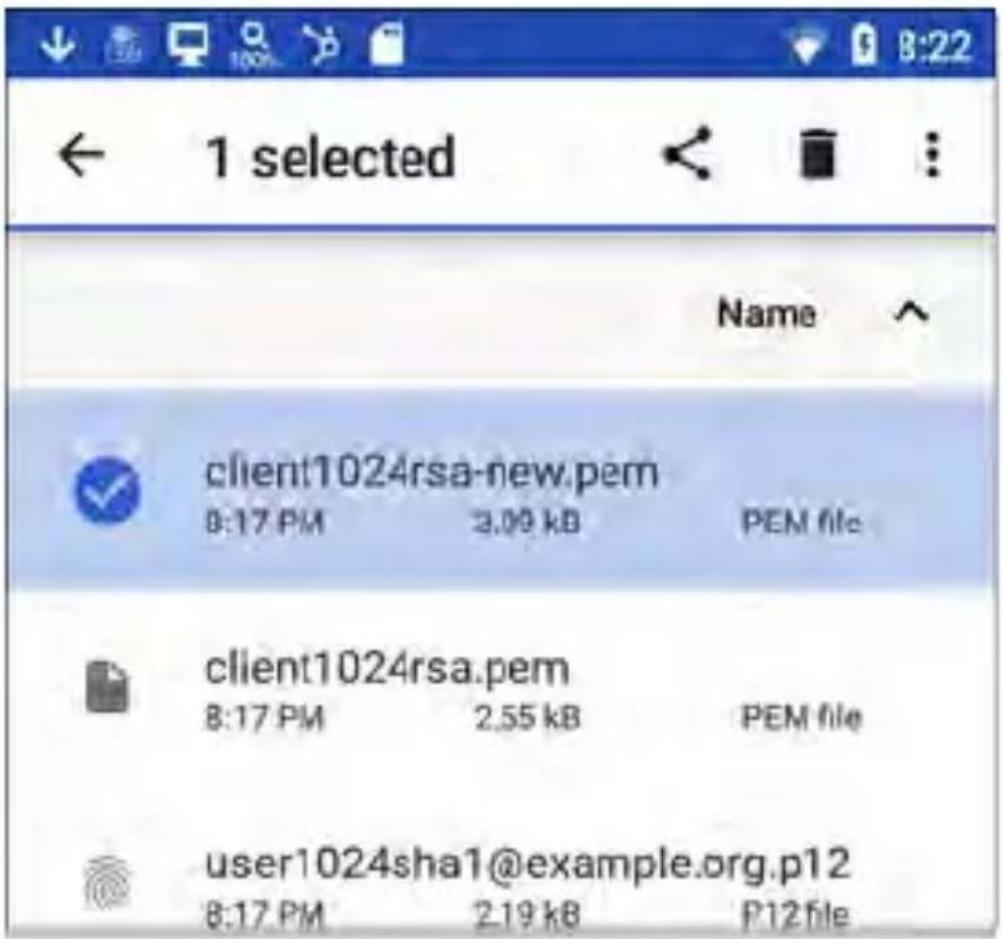
text_image
1 selected Name client1024rsa-new.pem 8:17 PM 3.09 kB PEM file client1024rsa.pem 8:17 PM 2.55 kB PEM file user1024sha1@example.org.p12 8:17 PM 2.19 kB P12file- Touch the share icon in the top toolbar.
- If needed, touch the Link-Live option.
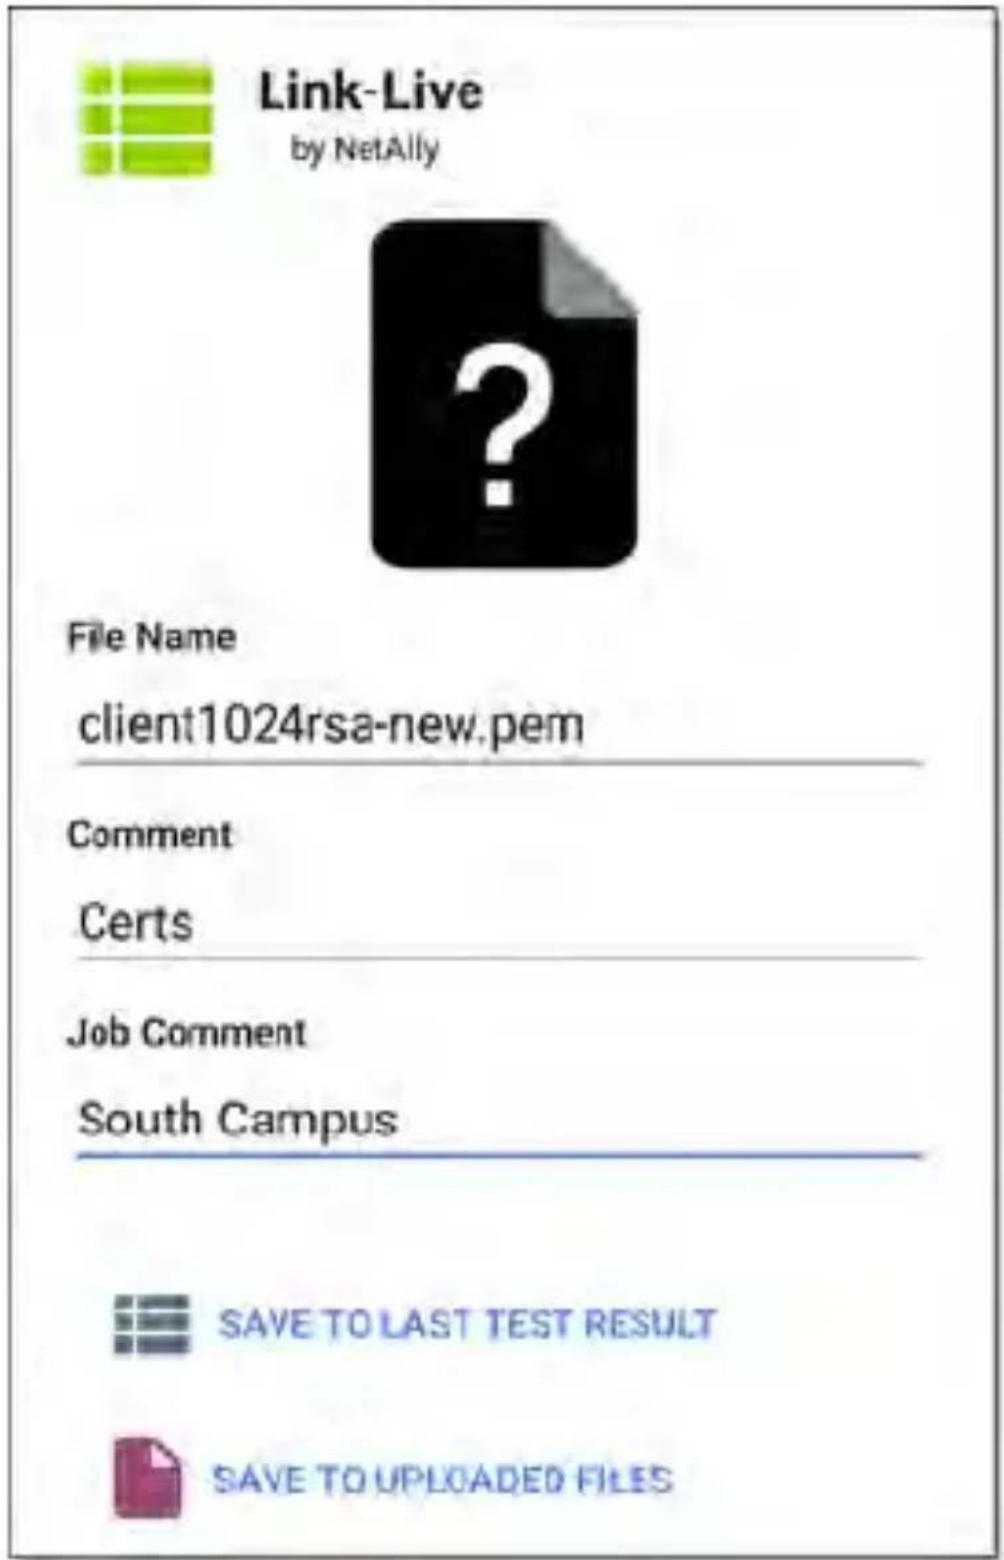
text_image
Link-Live by NetAlly File Name client1024rsa-new.pem Comment Certs Job Comment South Campus SAVE TO LAST TEST RESULT SAVE TO UPLLOADED FILES- Enter any Comments you would like attached to your file.
- Select SAVE TO LAST TEST RESULT or SAVE TO UPLOADED FILES.
You files are uploaded and viewable on LinkLive.com.
See the Link-Live chapter for more information on using Link-Live with your LinkRunner 10G.
Saving a Screenshot
On the LinkRunner 10G unit, press and hold the Power button and the Volume Down button at the same time for one second to save a screenshot of the current screen. (See Buttons and Ports for button locations).
When a screenshot is taken, the unit beeps and displays the captured screenshot notification in the Notification Panel. Open the notification to share the image using Link-Live, Bluetooth, or another configured application.
LinkRunner 10G Settings and Tools
The LinkRunner 10G features a common set of tools and General Settings that apply to multiple NetAlly apps and testing behaviors. This chapter covers settings, icons, and notifications specific to LinkRunner 10G.
(See the Device Settings topic for information on the Android system settings.)
Access common settings and informational screens for the NetAlly testing apps (like AutoTest or Capture) by opening the left-side Navigation Drawers or Settings.
Navigation Drawer
Many Android apps, including the NetAlly test apps, contain additional settings, tools, and information in a "navigation drawer" that slides out from the left side of the screen.
To open the navigation drawer:
- Touch the menu icon at the top left of the testing application screens.
- Touch and drag (swipe) to the right from the very left side of the app screens.
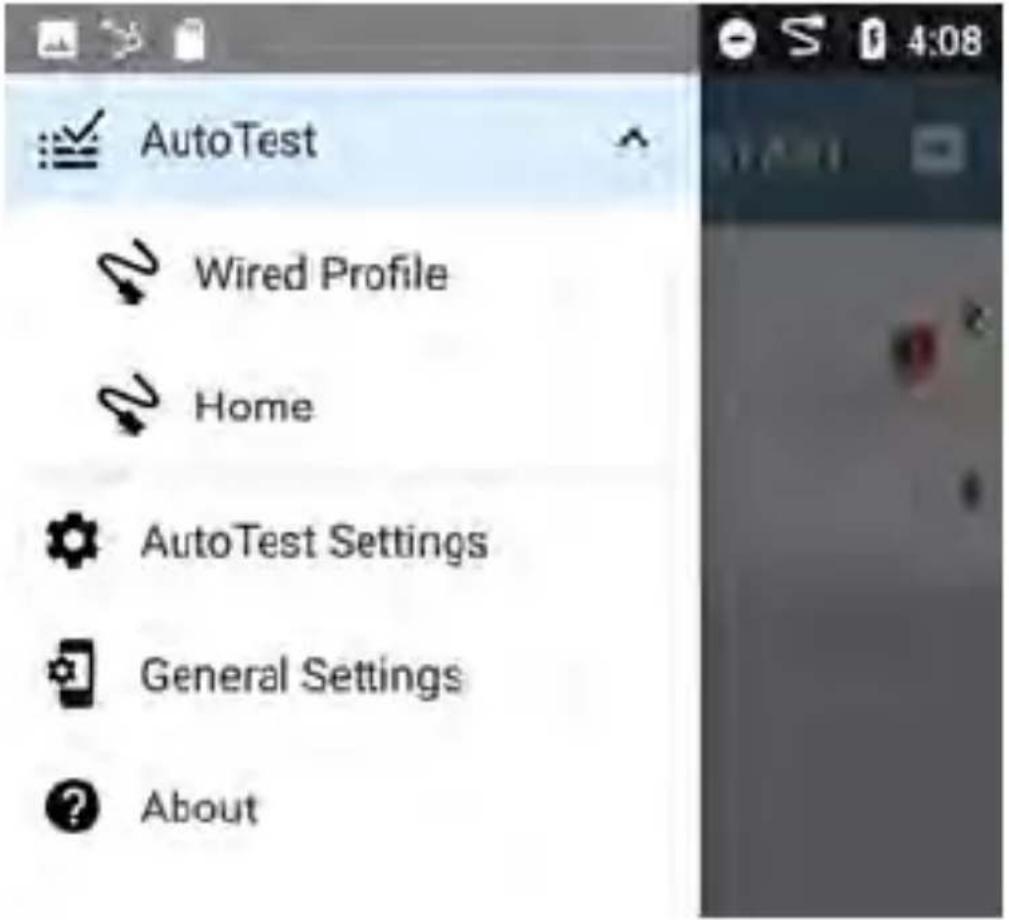
text_image
AutoTest Wired Profile Home AutoTest Settings General Settings ? AboutAs an example, the AutoTest navigation drawer (above) provides access to the enabled AutoTest profiles, AutoTest Settings, General Settings, and the About screen.
Settings for each specific app are described in the chapter for the app.
About Screen
text_image
About
LinkRunner 10G Analyzer
Serial: 2008007
MAC Addresses
Wired: 00c017-530aa0
Wired Management: 00c017-530aa1
Wi-Fi Management: 74da38-cc78ae
Versions
Software: 1.3.0.81
Android: B.1.0
Android Build: 1.3.0.81
AllyCare: Enabled
Expires: 12/31/2021
SFP Details
Type: 10GBASE-SR/1000BASE-SX (850 nm)
Vendor: FINISAR CORP
Version: A
Model: FTLX8574D3BCV
Rx Power: -4.11 dBm
UNCLAIM
EXPORT LOGS
Copyright 2019, 2020
NetAlly

natural_image
Three simple geometric shapes (triangle, circle, square) on a black background, no text or symbols present.The About screen displays the serial number, MAC addresses, software versions, SFP details and current AllyCare contract status for your LinkRunner 10G.
If a User-Defined MAC is enabled in the NetAlly apps' General Settings, (User-defined) appears next to the MAC address on the About screen.
Exporting Logs
The About screen contains the Export Logs function, which allows you to save your unit's logs for analysis by NetAlly's technical support team.
Touch the EXPORT LOGS link on the About screen to download a .tgz file to the Downloads folder on your unit. Open the Files app to transfer the file using email or another method. (See Managing Files.)
Test and Management Ports
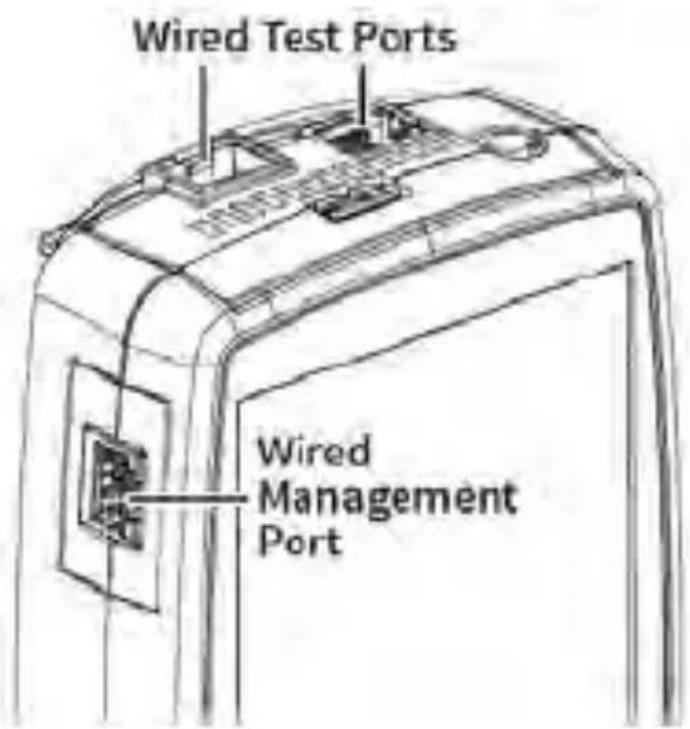
The LinkRunner 10G has two wired RJ-45 copper ports and a fiber port, each with specific test or management functions described in this section.
text_image
Wired Test Ports Wired Management PortEither the top copper port or fiber port can ac as the Wired Test Port, so in total, the LinkRunner has two network interfaces: 1 Wired Test, and 2 Wired Management.
Refer to Buttons and Ports and the technical Specifications if needed.
Configuring the Ports
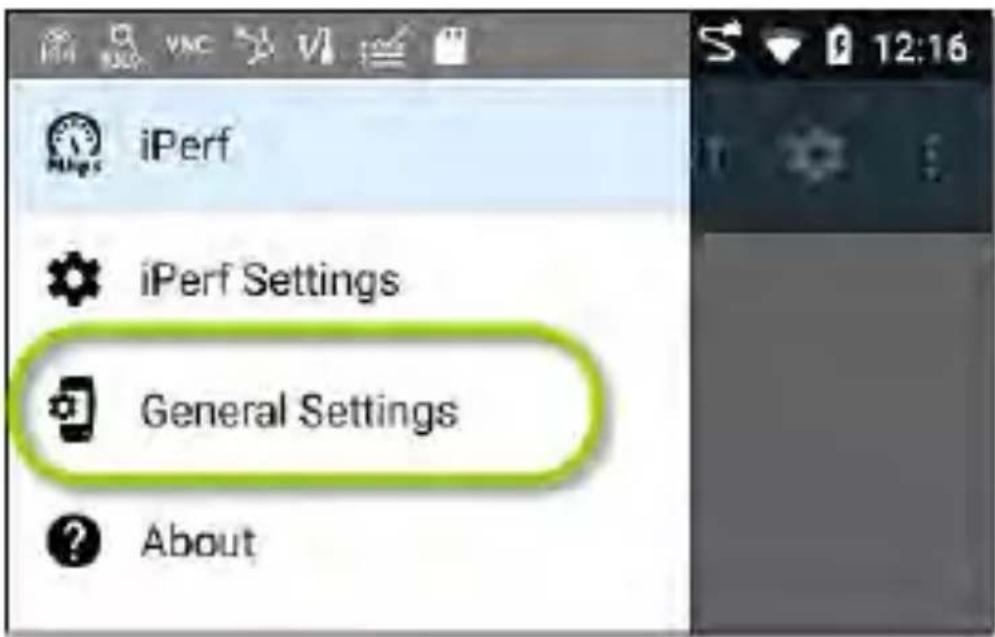
The NetAlly apps' General Settings control LinkRunner's use of the test and management ports. The General Settings are accessible from the left-side navigation drawer in NetAlly's testing apps, such as AutoTest, Capture, and iPerf.
text_image
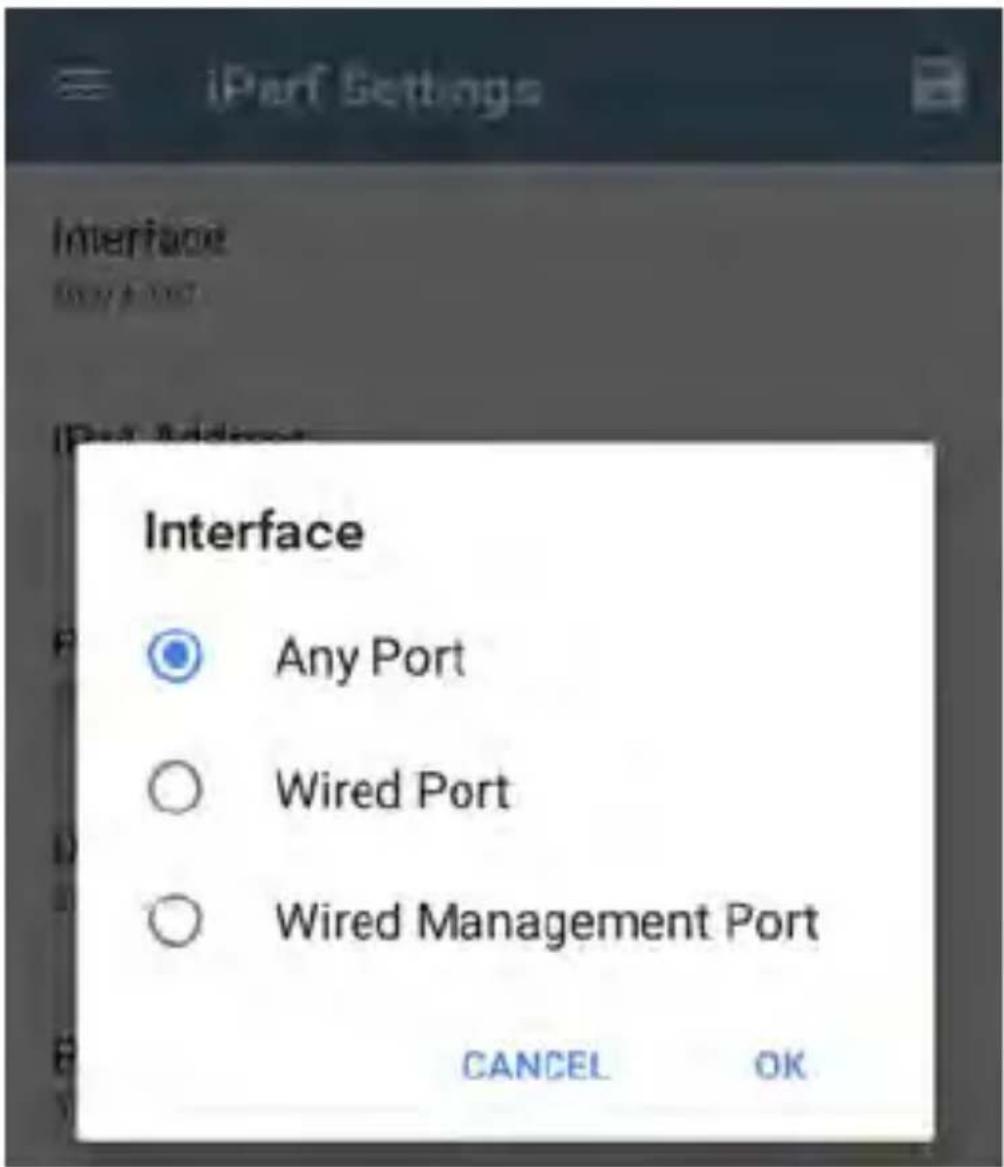
iPerf iPerf Settings General Settings AboutThe app-specific settings for many of the individual NetAlly testing apps (like the iPerf Settings above) also let you choose which ports the app uses for its test or analysis.
text_image
iParf Settings Interface Any Port Wired Port Wired Management Port CANCEL OKAll of the ports are described below next to their corresponding status icons.
Test Ports
LinkRunner runs Wired AutoTests, Captures, Discovery, and comprehensive network analyses over the test ports.
You must run an AutoTest Wired Profile in order to establish a link on the Wired test ports. If the AutoTest app is not currently open, the last Wired Profile in the profile list runs automatically when you power on the unit or LinkRunner detects a new copper link in the top Wired Test Port. Wired fiber connections must be started manually in the AutoTest app.
NOTE: If both the top fiber and copper ports are connected to an active network, the LinkRunner uses the fiber link as the Wired Test Port connection.

Wired Copper Test Port: The copper test port is the RJ-45 port on the top of the unit. To disable, unplug the connection.

Wired Fiber Test Port: The SFP and fiber test port is also on the top of the uni To disable, unplug the connection.

Management Port
LinkRunner can run Discovery, Ping/TCP Connect tests, Path Analysis, and iPerf tests on the management port, but not AutoTests, packet captures, or Performance tests.
The Management Port provide a more stable network connection than the Test Ports, as the Test Ports may frequently drop link and reconnect or resume scanning.

Wired Management Port: The wired management port is the RJ-45 port on the left side of the unit.
Test and Port Status Notifications
LinkRunner 10G shows notifications from the NetAlly testing apps and unit ports in the top Status Bar and Notification Panel. Swipe down on the Status Bar to view the notifications.
On each notification, you can touch the title and down arrow to expand the box and view more details or options.
LinkRunner 10G
Wired Port
IP Address: 192.168.0.124
The following LinkRunner icons may appear in your Status Bar with the meanings described.
NOTE: Read Test and Management Ports for descriptions of the port functions.
Also, see General Settings for settings that control port functions.
Test Port Notifications
Active network connections on the test ports are established using the AutoTest app.

A Wired Test Port connection, called the "Wired Port" in app settings, is established in either the top RJ-45 Ethernet port or the top Fiber port.
LinkRunner 10G
Wired Port
Speed: 100 M FDx
IP Address: 192.168.0.124
NOTE: If both the fiber and top copper ports are connected to an active network, the LinkRunner uses the fiber link as the "Wired Port" for testing.
Periodic AutoTest is running or has
completed. When Periodic AutoTest is running, the Wired Test Port may not be available to other testing apps.
AutoTest
Periodic AutoTest Running
Passed: 3
Failed: 2
Skipped: 1
Time Remaining: 54 m
Management Port Notifications

A Management Port connection is
established through the left-side RJ-45
Management port and/or the main Android Wi-Fi adapter.
LinkRunner 10G
Wired Management Port
IP Address: 192.168.0.123

A Wired Management Port connection
is established through the left-side RJ-45
Management port. Its details are displayed
under the Management Port notification (above).
If your Management connection is lost, the following notification displays.
now
No Management Port Connection
Discovery Notifications
The Discovery notifications show the progress of the discovery process. See the Discovery app chapter for more information.

The active discovery process is running and has progressed to the specified percentage.

No links are currently available for active discovery, either because none of the ports enabled for discovery are connected or AutoTest is running. Discovery is temporarily disabled when AutoTest is running.
VNC/Link-Live Remote

A remote VNC connection is active through a standalone VNC client and/or the Remote
function in Link-Live Cloud Service.

LinkRunner 10G ^
Remote Connected
Clients
10.0.0.14
LinkRunner 10G General Settings
LinkRunner's General Settings control test and management-related connections that affect multiple test apps.
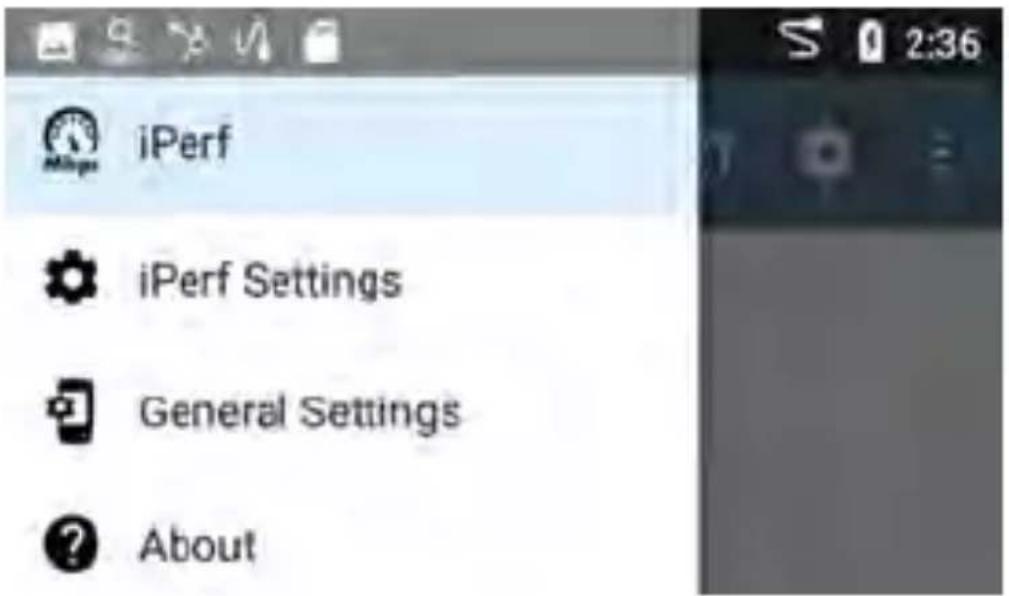
Access the General Settings from the left-side navigation drawer in the NetAlly testing apps, such as AutoTest, Discovery, Capture, iPerf, etc.
text_image
iPerf iPerf Settings General Settings AboutSee also Test and Management Ports and Test and Port Status Notifications for related information on port functionality and status icons.

Wired
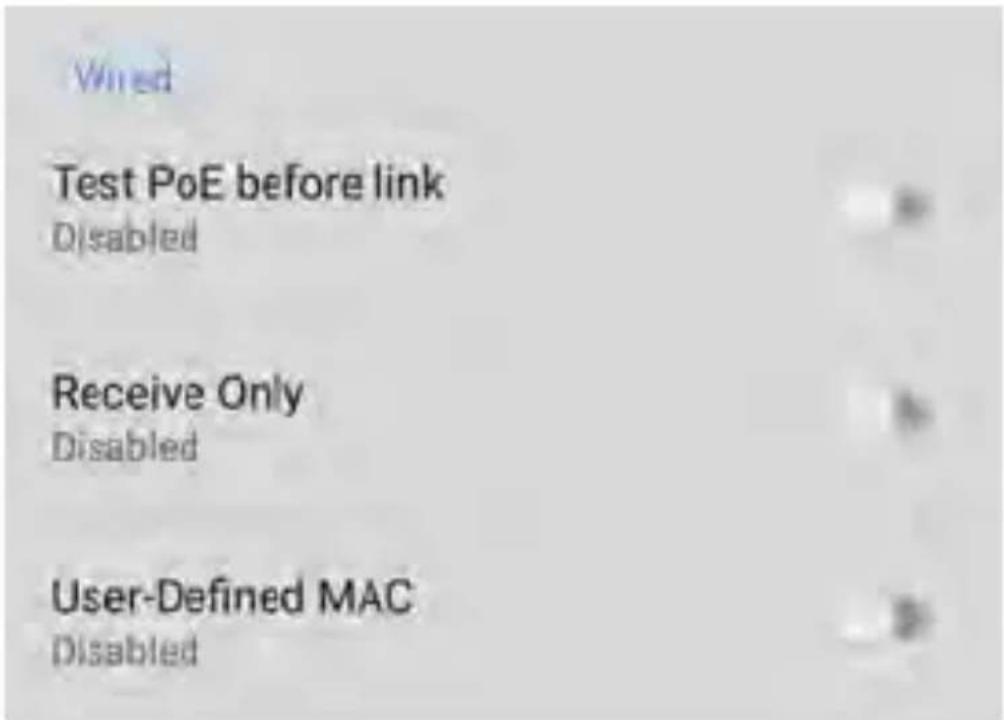
Wired General Settings control functions of the Wired Test Port.
text_image
Wired Test PoE before link Disabled Receive Only Disabled User-Defined MAC DisabledTest PoE before Link: By default, an AutoTest Wired Profile performs the Link test before the PoE test may be able to complete. Enable this setting to make your LinkRunner complete the PoE test before the Link test. Enabling this setting forces PoE negotiation to be completed before establishing link, improving compatibility with some switches.
Receive Only: Enabling this setting prevents the LinkRunner from transmitting packets on the Wired Test Port. You can also use the Stop After function in Wired AutoTest Profile Settings to hide the AutoTest cards that require transmit capability. Set the AutoTest Stop After setting to Switch. Otherwise, when Receive Only is enabled, the Wired DHCP/Static IP test shows a Result Code of "Interface is configured to only receive packets," and the subsequent tests do not run.
User-Defined MAC: This setting affects the Wire Test Port only. Tap the toggle switch to enable a user-defined MAC address. When enabled, an additional User-Defined MAC field appears under the toggle setting. Touch the lower field to enter your desired MAC address for the LinkRunner. When a User-Defined MAC is enabled, (User-defined) appears next to the MAC address on the About screen and on relevant test result screens.

Management
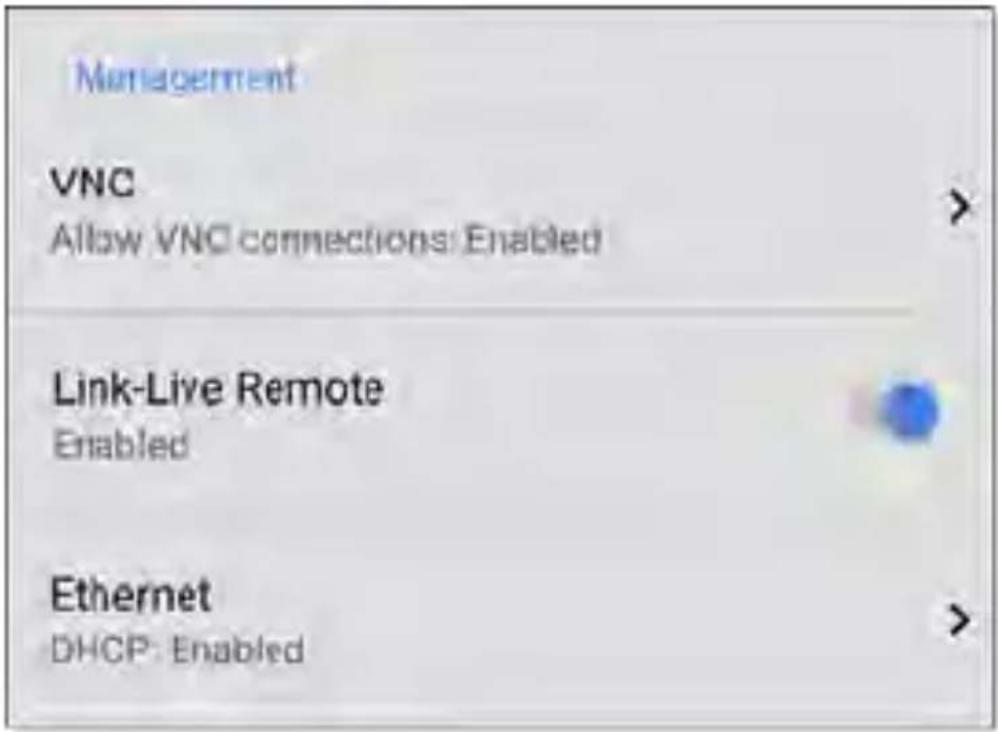
These settings affect management-related functions on the LinkRunner, including remote
access.
text_image
Management VNC Allow VNC connections: Enabled Link-Live Remote Enabled Ethernet DHCP: Enabled
VNC
Touch VNC to open the VNC settings screen and configure your unit's VNC connections for remote operation.
See Remote Access for more information about connecting to a VNC client or Link-Live Remote
text_image
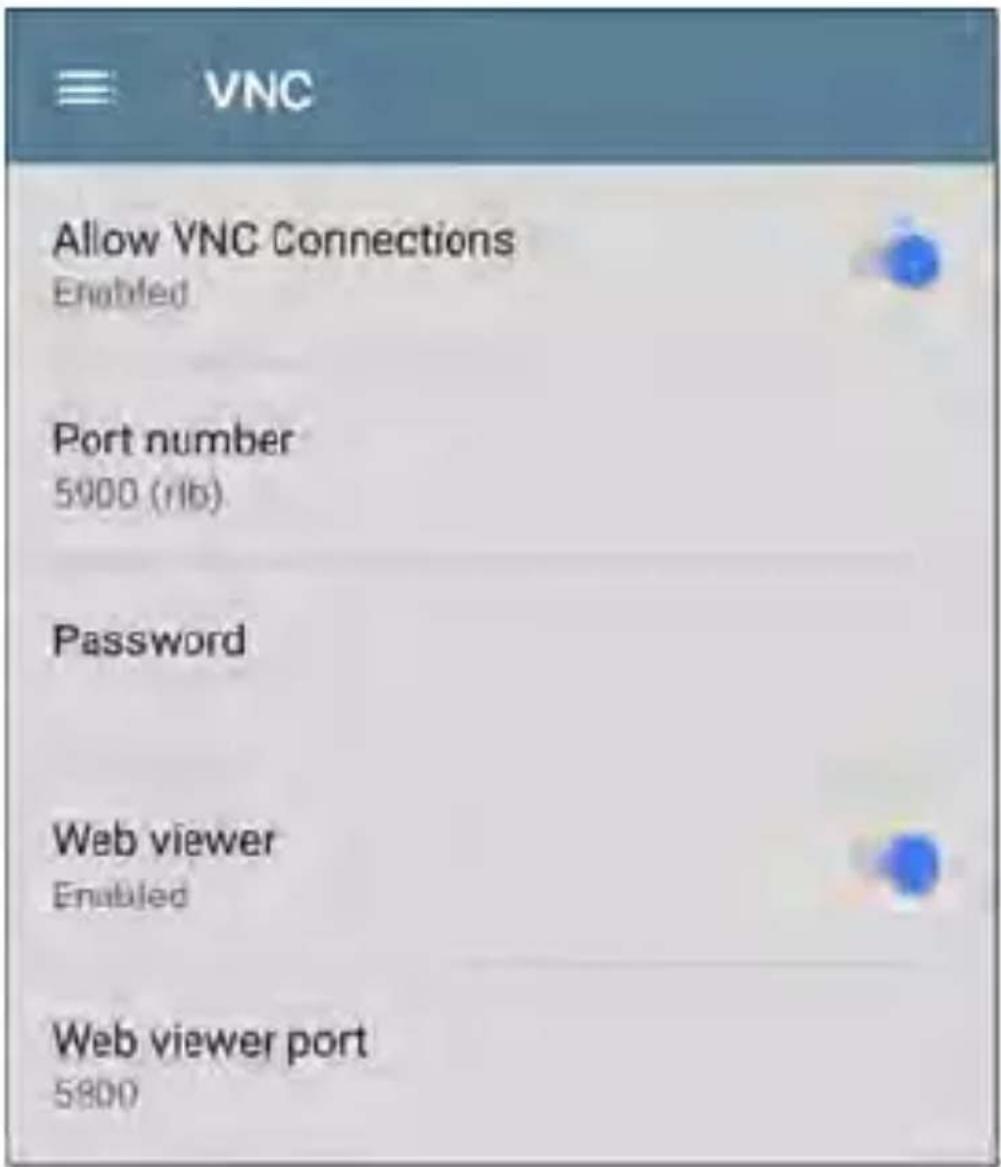
VNC Allow VNC Connections Enabled Port number 5000 (rib) Password Web viewer Enabled Web viewer port 5800Allow VNC Connections: Touch the toggle button to enable or disable remote connections from VNC clients.
Port number: Touch to enter a port number other than the default.
Password: Touch to enter a password, which a VNC user must enter to access the LinkRunner interface remotely.
NOTE: If you set a Password here in the VNC settings, the password is required to connect to both a standalone VNC client and the Remote feature at Link-Live.com.
Web viewer: Touch the toggle to enable or disable web viewer access.
Web viewer port: Touch to enter a port number other than the default.

Link-Live Remote
This setting enables or disables the LinkRunner's remote control function in Link-Live Cloud Service at Link-Live.com.
NOTE: The Link-Live Remote feature is only available to customers with an active AllyCare subscription. Your LinkRunner must be claimed.See NetAlly.com/Support for more information.
Access the Remote function on the Units page at Link-Live.com by selecting the claimed LinkRunner 10G.

Ethernet
DHCP: This setting controls IP address assignment of the RJ-45 Wired Management Port on the left side of the LinkRunner. By default, DHCP is enabled. Touch this field and tap the toggle button to disable DHCP and enter static IP information.
Preferences

text_image
Preferences Distance Unit FeetDistance Unit: This is the unit LinkRunner uses for distance measurements in the testing apps, specifically Cable Test. Touch the field to switch between Feet and Meters.
Trending Graphs
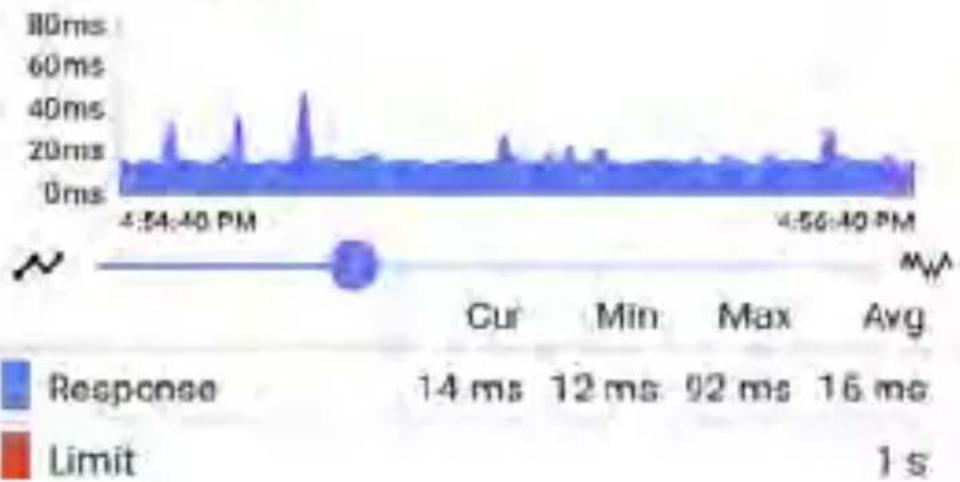
Many of the LinkRunner 10G testing apps feature time-based line graphs of recorded measurements, which you can pan and zoom to view different time intervals. For example, the image below shows the Response Time graph from the Ping Test Results Screen.
Results
Started: 4:43:12 PM
Status: Success
| Metric | Result |
| Sent | 808 |
| Received | 807 |
| Lost | 1 (0.12 %) |
Response Time
line
| Time | Response | Min | Max | Avg | | ---------- | -------- | ----- | ----- | ----- | | 4:54:40 PM | 14 ms | 12 ms | 92 ms | 16 ms | | 4:56:40 PM | | | | 1 s |These graphs update in real time and save and display data for up to 24 hours (depending on test type and/or link status).
Under each graph, a legend table indicates the measurements that correspond to each plotted color.
For another example, the image below shows the Capture app graph.
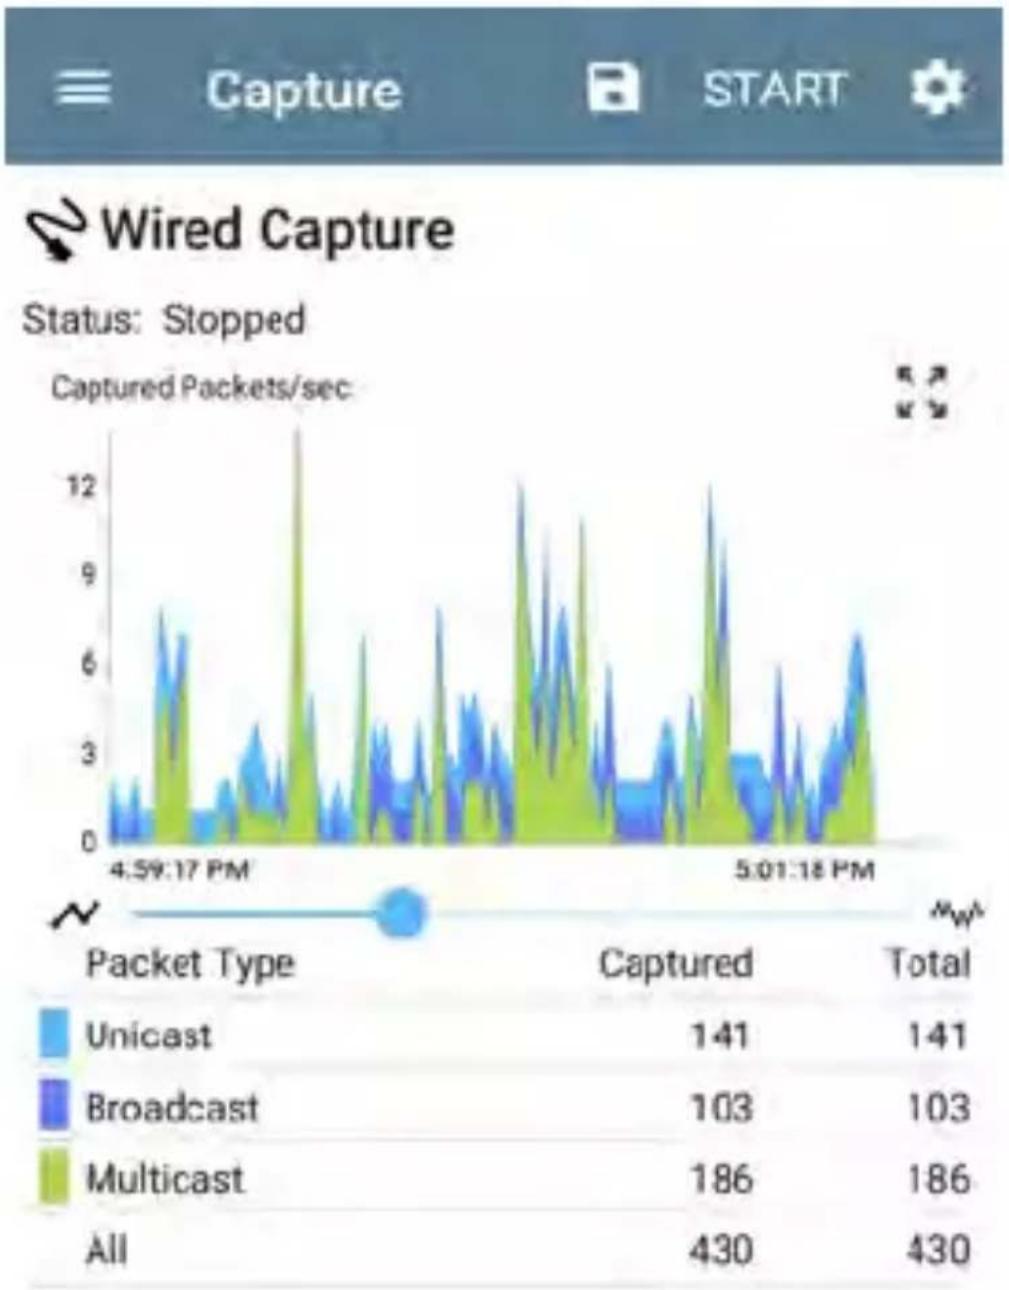
line
| Packet Type | Captured | Total | |-------------|----------|-------| | Unicast | 141 | 141 | | Broadcast | 103 | 103 | | Multicast | 186 | 186 | | All | 430 | 430 |• To pan, or move backward and forward in time, touch and drag (swipe) left and right
on each graph.
- To zoom in on a specific point in time, double tap the point on the graph. The view zooms in 2x (or displays half the amount of time) for each double tap.
- To zoom in or out, decreasing or increasing the time interval displayed, drag the slider or tap the slider bar below the graphs.
- The largest time interval (maximum zoom out) is the total time data has accumulated.
- To reset the graph to the default time interval, tap the zoom reset icon
- The zoom reset icon appears once you have zoomed or panned on the graph.
- The default time interval varies across different apps.
The following apps and screens contain trending graphs:
- Ping/TCP - Ping Test
- Capture
• Discovery – Interface Statistics - Performance
• iPerf
Common Icons
The icons below appear in multiple NetAlly test and Android apps.

Menu Icon - opens the left navigation drawer or other menus

Refresh Icon - restarts testing and measuring on the current screen

Settings Icon - opens configuration options for the current app

Save Icon - saves settings or files or loads saved configurations

Floating Action Button (FAB) - opens the Floating Action Menu, which contains additional actions

Action Overflow Icon - contains additional actions

Directional Arrows (or Carets) - indicate the ability to "drill in," open a screen, or expand a panel for more detailed information, or to change the order of a list
For explanations of the LinkRunner icons that appear in the Status Bar at the top of the screen, see Test and Port Status Notifications.
Floating Action Button (FAB) and Menu
Many Android applications, including NetAlly's AutoTest and Discovery apps, feature a Floating Action Button or "FAB" that opens a floating action menu with more options for analysis.
The FAB on the main AutoTest app screen allows you to add new testing Profiles.

The FAB on the Discovery app's Details screen opens other apps for further testing of the selected device.
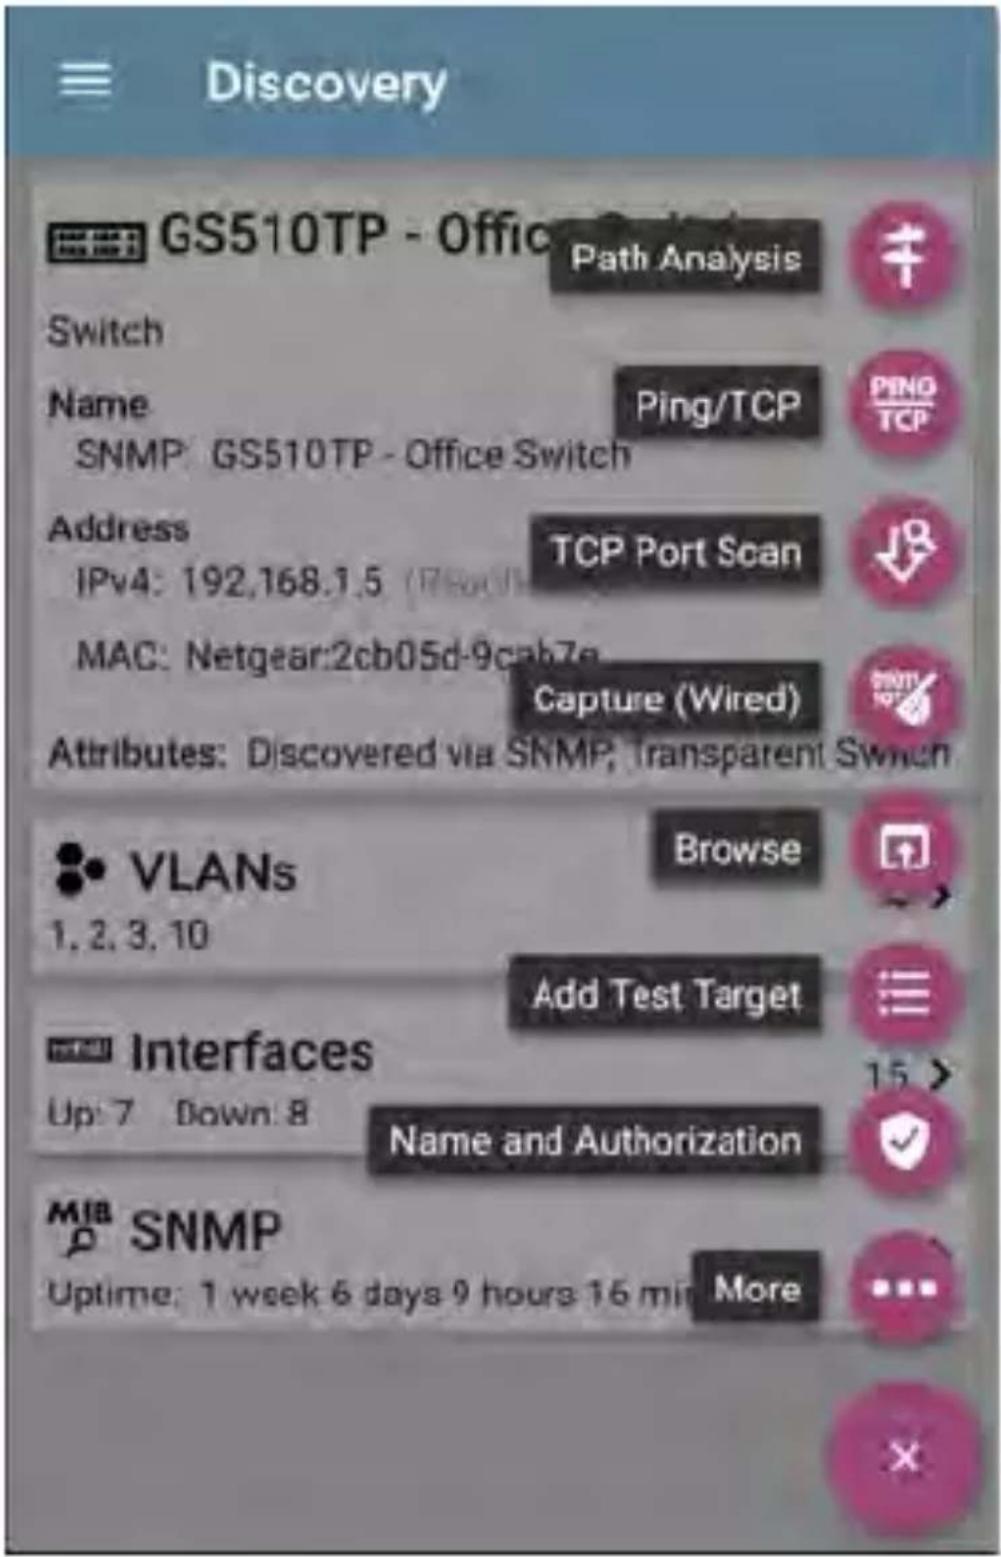
text_image
Discovery GS510TP - Office Path Analysis Switch Name Ping/TCP SNMP: GS510TP - Office Switch Address TCP Port Scan IPv4: 192,168.1.5 (7-9) (17-18) MAC: Netgear:2cb05d-9cab7a Capture (Wired) Attributes: Discovered via SNMP; transparent switch VLANs Browse 1.2.3.10 Add Test Target Interfaces Up: 7 Down: 8 Name and Authorization MIB SNMP Uptime: 1 week 6 days 9 hours 16 min MoreFloating action menus that appear in the testing applications are described more specifically in the relevant chapters. For example, see Discovery App Floating Action Menu in the
Discovery app chapter for a more detailed illustration.
Common Tools
Web Browser/Chrome
Some of the testing apps, like AutoTest, Ping/TCP, and Discovery, give you the option to Browse to internet addresses using a web browser application. LinkRunner has Google Chrome pre-installed.
Telnet/SSH
Starting with v1.1, LinkRunner has the JuiceSSH application pre-installed. Both the AutoTest and Discovery apps provide options to start a Telnet or SSH session using the current device address. Selecting these options opens JuiceSSH and starts a session. You can also open JuiceSSH from the Apps screen.
The JuiceSSH app maintains a list of previous connections. When opened from a NetAlly app, JuiceSSH uses the first connection in the list that matches the IPv4 address or device name and type. If no match is found, a new connection entry is created and used.
As a third-party app, JuiceSSH contains its own tutorials. For additional help, touch the action overflow button at the top right of the JuiceSSH app screen, and select View our FAQ.
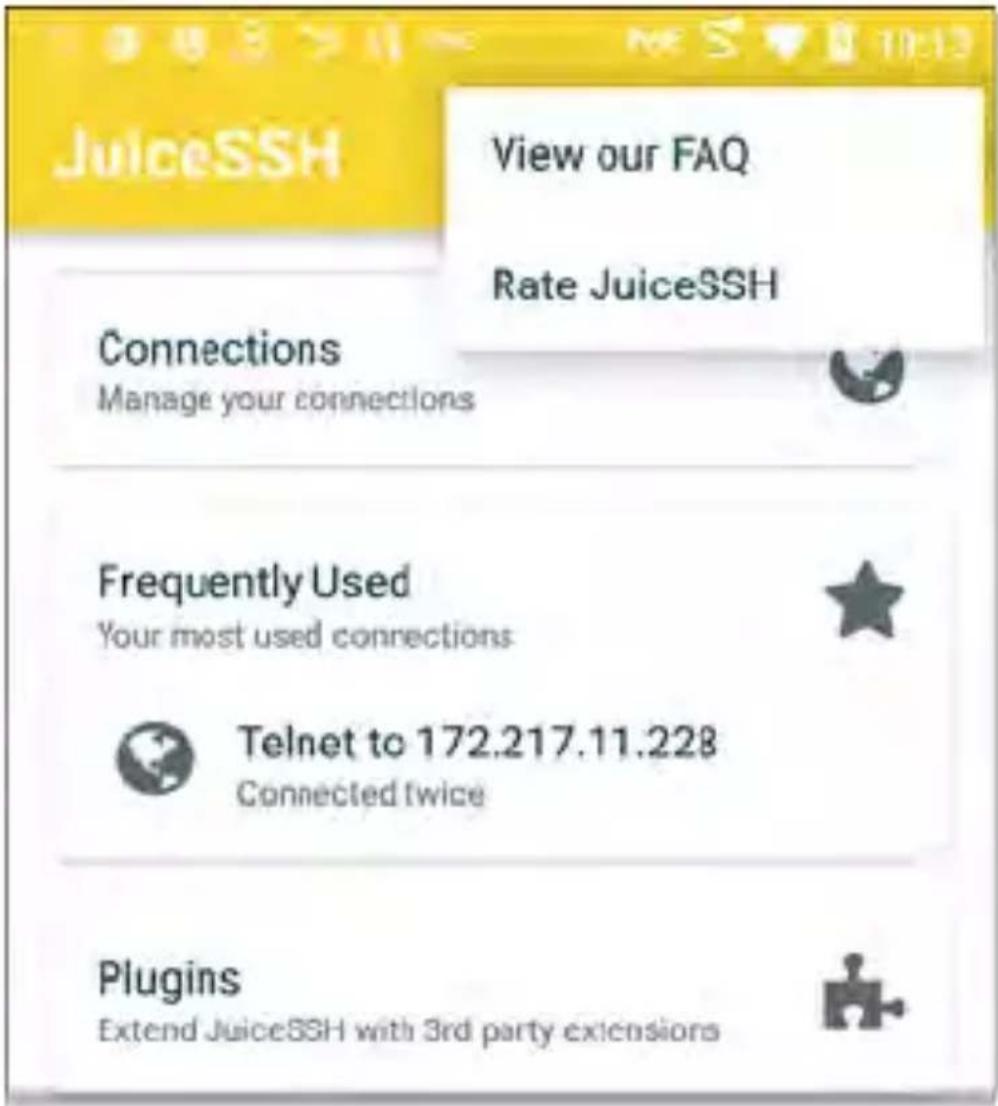
text_image
JuiceSSH View our FAQ Rate JuiceSSH Connections Manage your connections Frequently Used Your most used connections Telnet to 172.217.11.228 Connected twice Plugins Extend JuiceSSH with 3rd party extensionsCamera and Flashlight
The camera lens and flash are located on the back of the unit. (See Buttons and Ports.)
The Camera application is located in the Apps screen and on the Home screen by default. Tap the icon to open the camera app and take a photo, which you can then share to other applications.
Additionally, once a Wired AutoTest Profile has completed, the floating action button appears and provides the option of opening the camera application to take and attach a picture to the AutoTest result uploaded to Link-Live Cloud Service.
The Flashlight feature can be accessed from the Quick Settings Panel by swiping down twice from the top of the screen.
Software Management
This chapter explains how to save and transfer files, reset app and device defaults, update you software, and remotely access your LinkRunner 10G.
Tap a link below to skip to your desired topic:
Managing Files
Updating Software
Remote Access
Resetting App Defaults
Restoring Factory Defaults
Managing Files
In LinkRunner 10G's Android operating system, images, documents, and other files reside in a folder system, where you can copy, move, and paste them between folders or to external storage locations.
See also Navigating LinkRunner 10G.

Files Application
The Files app allows you to access the files saved on your LinkRunner. Touch the icon at the bottom of the Home Screen (or from the Apps screen) to manage your files.
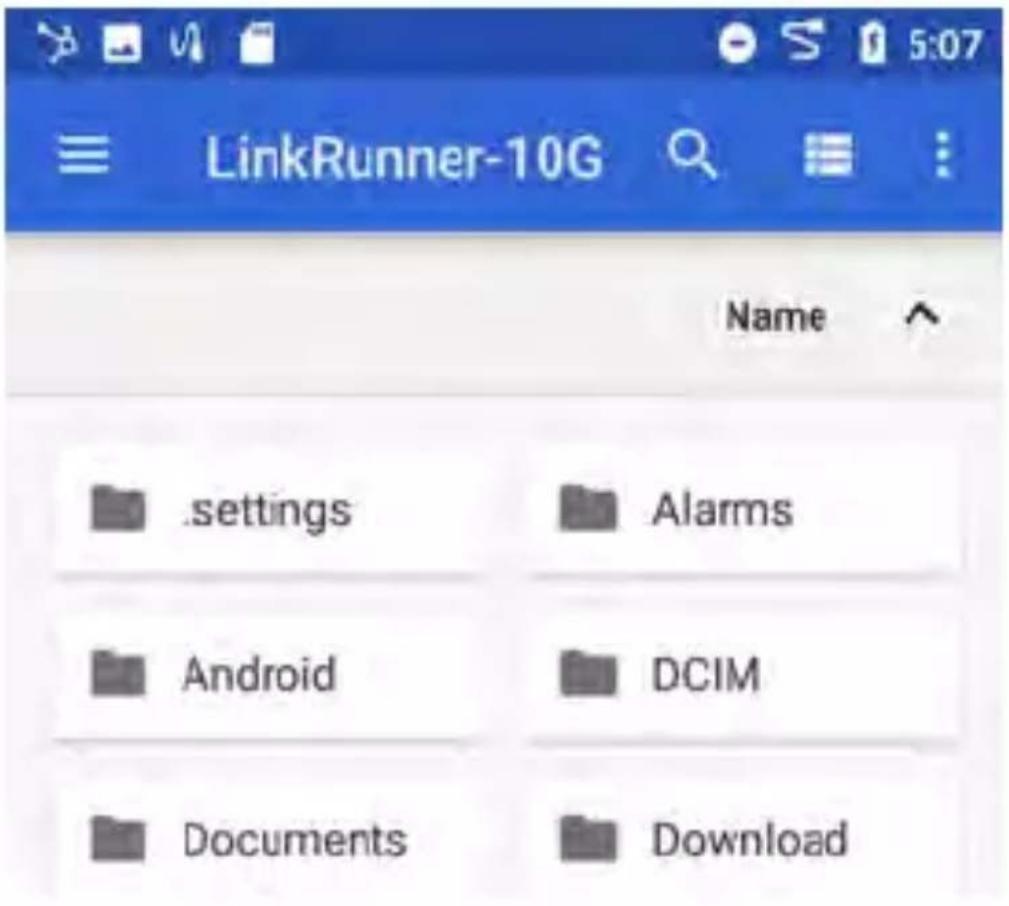
NOTE: In the Files app, you may need to take the action overflow icon at the top right and select Show Internal Storage to navigate to the LinkRunner-10G folder and sub-folders, as shown below.
text_image
LinkRunner-10G Name .settings Alarms Android DCIM Documents Download- Tap a folder or file to open it.
- Long press on folders or files to select multiple and to view additional file management operations in the top toolbar, including the Share and Delete buttons.

text_image
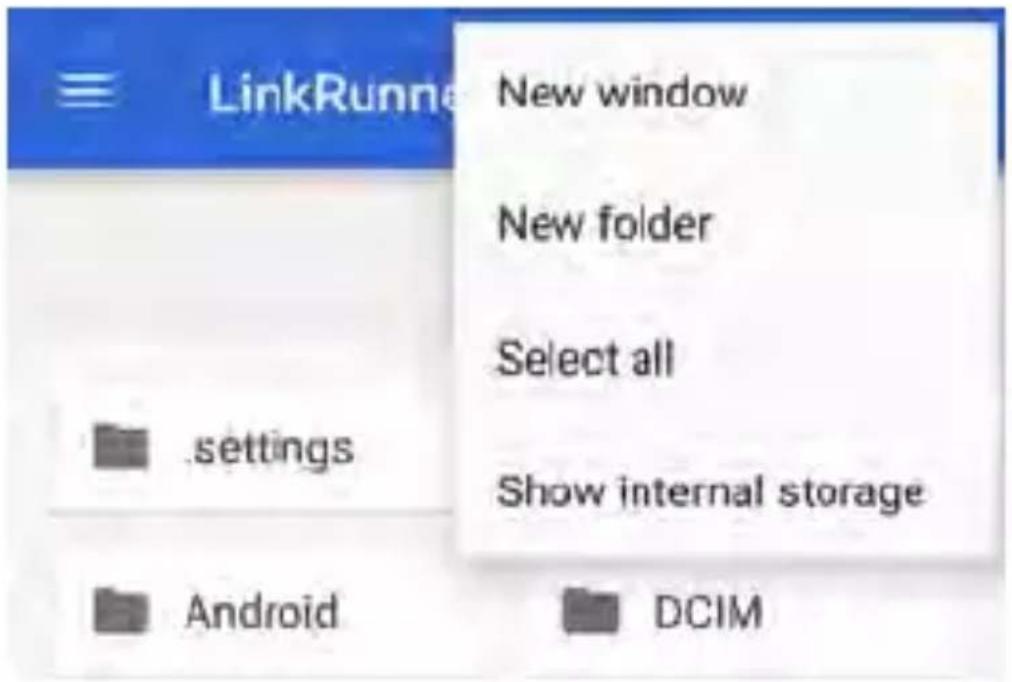
← 2 selected < | :- Tap the action overflow icon to see even more actions, such as to create a new folder, move a file, delete an item, and to
show or hide the main internal storage folder.
text_image
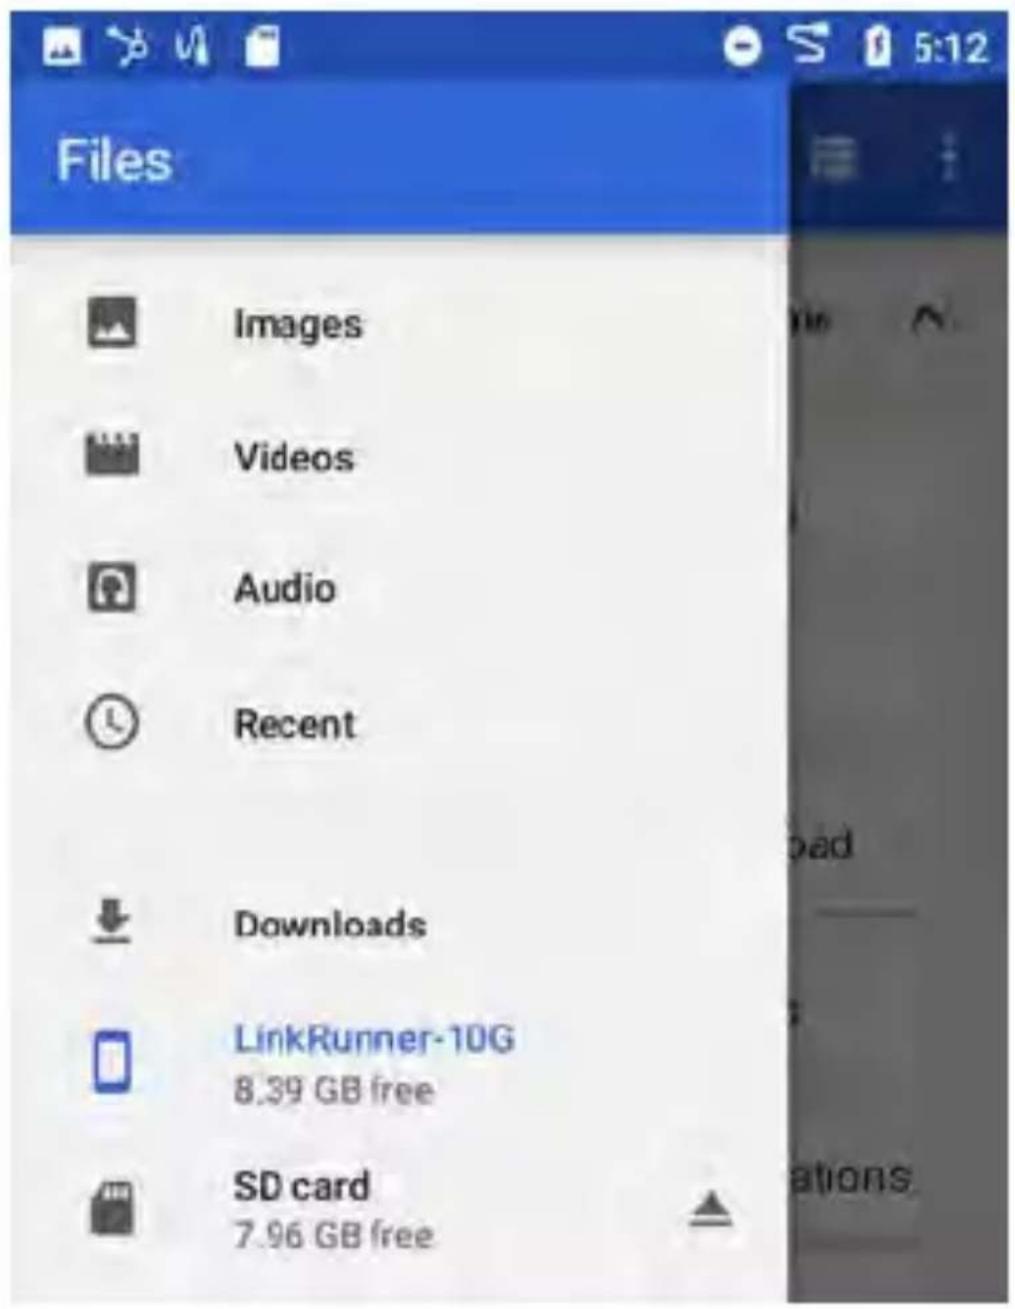
LinkRunne settings Android New window New folder Select all Show internal storage DCIM- Open the left-side navigation drawer to easily navigate through the top-level folders and attached storage devices.
text_image
Files Images Videos Audio Recent Downloads LinkRunner-10G 8.39 GB free SD card 7.96 GB freeHow to Move or Copy a File
- Long press on a file to select it. You can then select more files as needed by tapping them.

text_image
← 2 selected < ↑ :- Touch the overflow icon at the top right.
- Select Copy to... or Move to.... Your selected action button appears at the bottom of the screen.
CANCEL
MOVE
- Navigate to the folder where you want to move or copy the file.
- Touch the Move or Copy button at the bottom of the screen.
Using a Micro SD Card
To use a Micro SD card for storage, insert it into the Micro SD card slot on the left side of your LinkRunner 10G. See Inserting a Micro SD card.
A Micro SD card icon appears in the Status Bar at the top of the screen. Pull down the to Notification Panel to reveal the SD card notification.

Android System
SD card
For transferring photos and media
The SD card storage location is also available from the Files application.
CAUTION: As with any Android device, use the EJECT function before physically removing your Micro SD card from the USB port to avoid potential corruption of your storage device's file system.
Using a USB Drive
Insert a USB flash drive into the USB port on the top of the LinkRunner.
A USB icon appears in the Status Bar at the top of the screen. Pull down the top Notification Panel to reveal the USB drive notification.
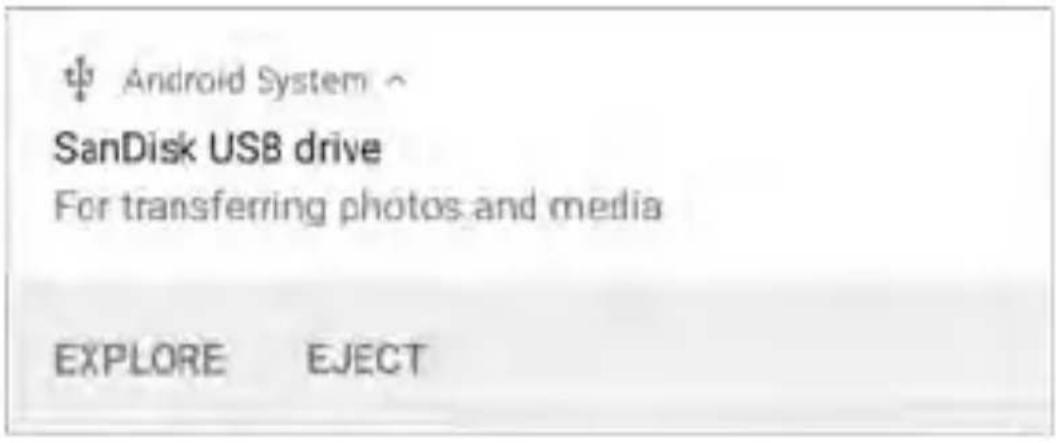
text_image
Android System SanDisk USB drive For transferring photos and media EXPLORE EJECTThe USB storage location is now available from the Files application.
CAUTION: As with any Android device, use the EJECT function before physically removing your USB drive from the USB port to avoid potential corruption of your storage device's file system.
Ejecting Storage Media
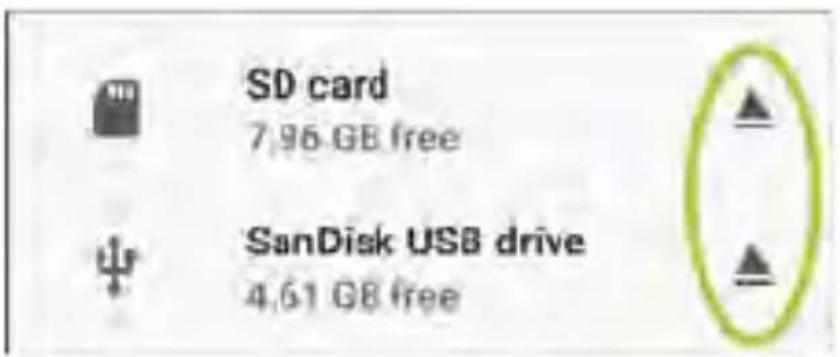
You can eject storage media from the expanded Android notification (as shown above) in the Notification Panel or from the left-side navigation drawer in the Files app (below).
text_image
SD card 7.96 GB free SanDisk USB drive 4.61 GB freeUsing a USB Type-C to USB Cable
-
Plug a USB-C cable into the USB-C port on the left side of the LinkRunner, and connect to a PC or tablet.
-
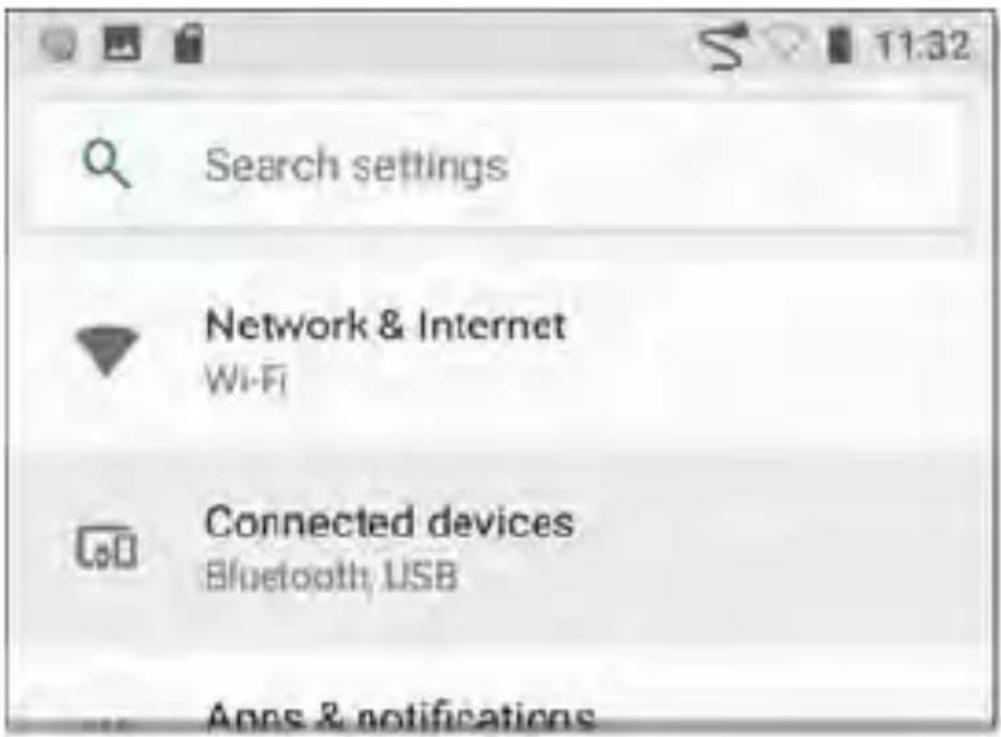
On the LinkRunner Unit, open the Android device settings by tapping the Settings icon at the bottom of the Home screen.
-
Select Connected devices.
text_image
Search settings Network & Internet Wi-Fi Connected devices Bluetooth, USB Apps & notifications-
On the Connected devices screen, select USB.
-
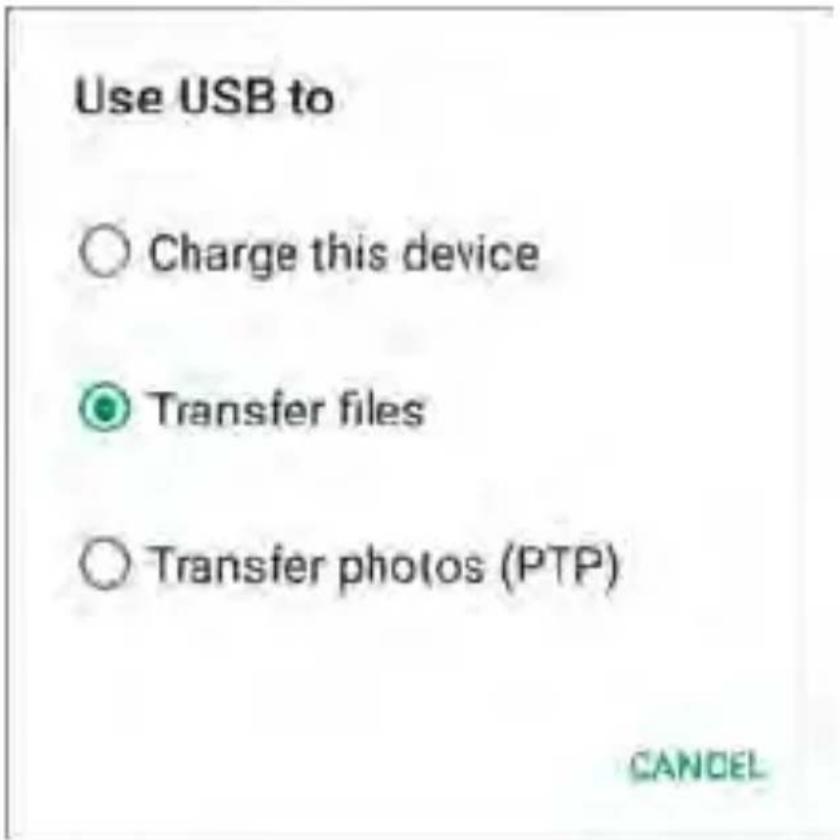
In the pop-up dialog, touch Transfer files to enable file transfer.
text_image
Use USB to ○ Charge this device ● Transfer files ○ Transfer photos (PTP) CANCELNOTE: LinkRunner does not charge through a USB cable connected to a PC.
- On your PC or tablet, navigate to the LinkRunner 10G folder if it does not pop u automatically. From there, you can move, copy, and paste files to and from the LinkRunner 10G's file system.
CAUTION: As with any Android device, use the EJECT function before physically disconnecting the USB cable from your PC or LinkRunner to avoid potential corruption of your storage device's file system. See Ejecting Storage Media above.
Updating Software
Your LinkRunner 10G accesses software updates from the Link-Live Cloud Service "Over-the-Air" (OTA). However, you can also manually download and install updates if you do not want to claim your unit to Link-Live. See Manual Updates below.
Over-the-Air Updates
You must create an account and "claim" your LinkRunner 10G unit at Link-Live.com for the LinkRunner to find and download software updates. See Getting Started in Link-Live.
The first time you claim your LinkRunner 10G to Link-Live, a software update may be available. If so, an update icon appears in the Status Bar. Slide down the Top Notification Panel, and select the notification to update your unit.
↓ Link-Live
Software Update Notification
Software update available.
-
To check for available software updates at any time, open the Link-Live App from the Home screen.
-
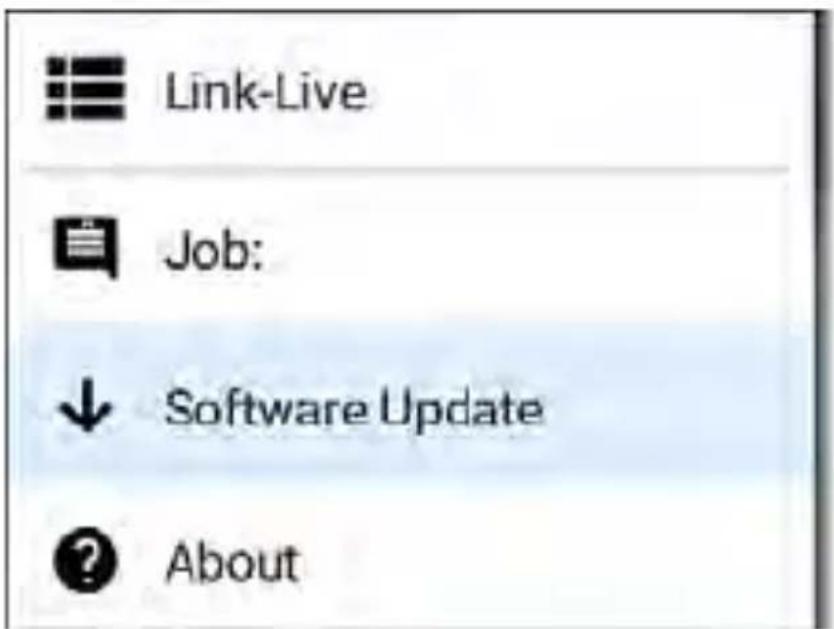
In the Link-Live App, touch the menu icon or swipe right to open the left-side Navigation Drawer.
text_image
Link-Live Job: Software Update About- Touch Software Update.
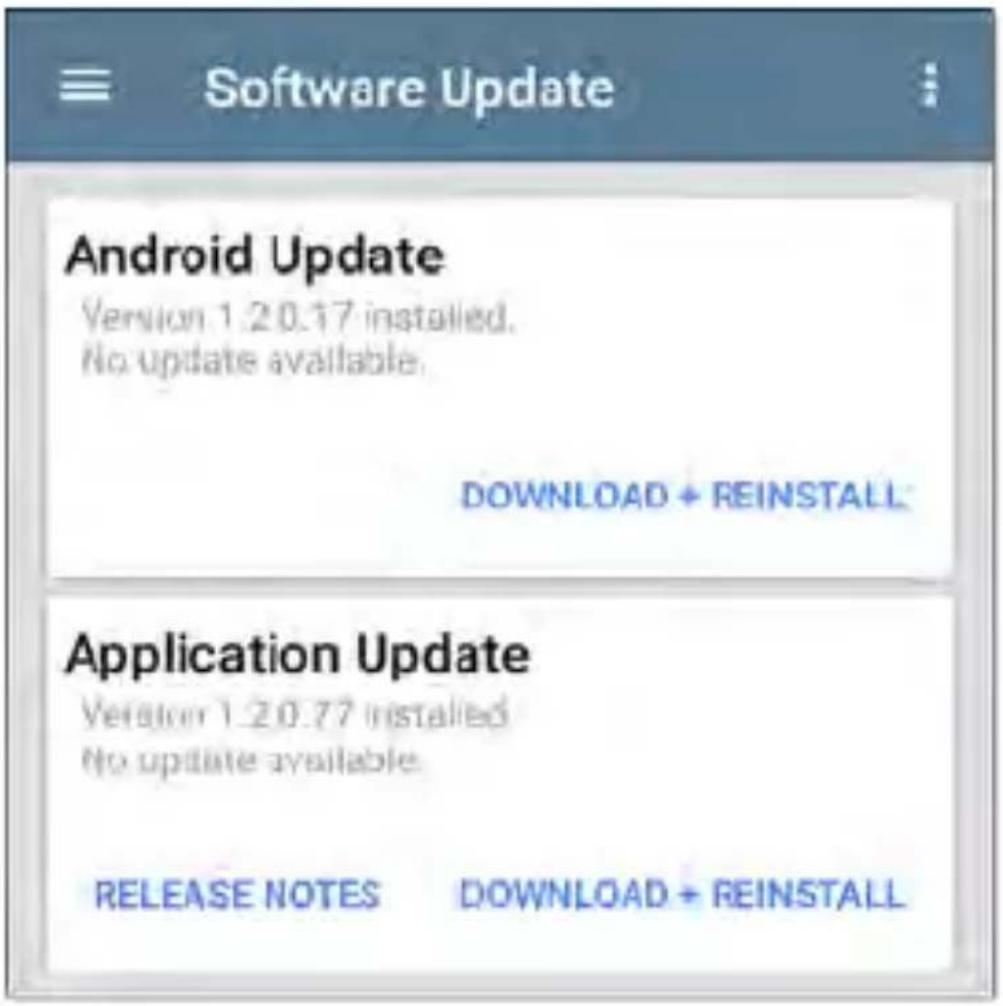
The Software Update screen opens and displays the version number of any available updates. You can touch the blue-linked Release Notes to read descriptions of the updated features in the new version.
text_image
Software Update Android Update Version 1.20.17 installed. No update available. DOWNLOAD + REINSTALL Application Update Version 1.20.77 installed No update available. RELEASE NOTES DOWNLOAD + REINSTALL- If both an Android and an Application Update are available, install the Android update first.
- Touch Download + Install to update the Android operating system or the NetAlly Applications. Each update must be installed separately.
The files download and install. When finished, the unit will restart.
After updating Android, check the Software Update screen again in case an Application Update is still required.
Manual Updates
You can acquire the update files from LinkLive.com or by contacting NetAlly's Technical Support at NetAlly.com/Support.
To download the software update files from the Link-Live.com website, open the left-side navigation drawer by clicking the menu icon , and select Support > Software Downloads.
-
Download the update files for the Android system (lr10g-ota-user.zip) and Applications (.apk) to a PC or your LinkRunner unit.
-
If you are updating both the Android OS and Applications, install the Android update first.
Updating the Android OS
Reference Buttons and Ports if needed.
- Copy the .zip file to a Micro SD card inserted into your LinkRunner.
- Power off your LinkRunner unit.
- Press and hold the volume up button and press the power button to start up the LinkRunner in Recovery Mode. Continue holding the volume up button until the Recovery screen appears.
- In Recovery Mode, use the volume buttons to highlight “apply update from SD card,” and press the power button to confirm the selection.
- Use the volume buttons to highlight the correct update file on the Micro SD card, and press the power button to confirm.
The LinkRunner will open the Updater, install the Android update, and then restart with the update installed.
After updating Android, be sure to check the available Applications update version to determine if an Applications update is still required.
Updating the Applications
- Copy the .apk file to a USB flash drive or a Micro SD card inserted into your LinkRunner.
- In the Link-Live App, open the left-side navigation drawer, and select Software Update.
- On the Software Update screen, touch the action overflow icon at the top right, and select Manual Update.
- Navigate to the USB drive or Micro SD card where you saved the update file.
- Tap the update file to select it.
The LinkRunner will open the Updater, install the .apk files for the NetAlly apps, and then restart with the updates installed.
Remote Access
LinkRunner supports remote access and control using either a standalone VNC client or the Link-Live Remote feature, which utilizes a VNC client through the Link-Live website.
NOTE: The Link-Live Remote feature is only available to customers with an active AllyCare subscription. Your LinkRunner must be claimed. See NetAlly.com/Support for more information.
While you can establish remote connections using the Wired Test Port on the LinkRunner, the Management Port provide more stable links for remote control; the test ports may disconnect and reconnect frequently.
See Test and Management Ports.
The top notifications are the quickest way to find assigned IP addresses for your LinkRunner ports. Swipe down from the Status Bar to view them.
- For a wired management connection, you must have an Ethernet cable with an active network connection plugged into the left-side RJ-45 Management Port.
When a remote session is active, the remote icon appears in the top Status bar, along with a notification.
LinkRunner 10G \~
Remote Connected
Clients
Link-Live Remote: Thomas
Using VNC
Remotely access the LinkRunner 10G using a peer-to-peer VNC client installed on a PC or other machine.
See General Settings > VNC to enable and configure VNC connections.
To connect to LinkRunner using a VNC client:
-
Get the IP address of a connected port (preferably a management port) by swiping down from the Status Bar at the top of the screen to view the notification panel.
-
Provide the Test or Management Port's IP address to your chosen VNC client application.
-
Connect using your VNC client.
-
If needed, enter the password that is set in the VNC settings.
Using Link-Live Remote
The Link-Live Remote feature uses end-to-end encryption, allowing secure remote control of your LinkRunner.
On your LinkRunner, go to General Settings >Link-Live Remote to ensure the feature is enabled.
NOTE: If a Password is enabled in the VNC General Settings, you must also enter the same password to access the Remote feature in Link-Live.
-
If you have AllyCare, sign in to LinkLive.com to access the Link-Live Remote feature. Your LinkRunner must be claimed.
-
Navigate to the Units page at LinkLive.com.
-
Select the LinkRunner you want to remote control from the list of claimed units.
-
Click or touch the REMOTE icon at the top right of the page to open an embedde window containing the LinkRunner interface.
-
If necessary, at the top of the window, enter the Password set in General Settings > Management > VNC on the LinkRunner unit.
To use the Link-Live website while your remote session is active, you will need to open a new Link-Live tab or window.
Managing NetAlly App Settings
This chapter explains the processes for resetting, loading, saving, importing, and exporting the test settings for individual NetAlly testing apps, such as AutoTest, Discovery, and Performance.
For instructions on restoring factory defaults to the entire EtherScope unit, see Restoring LinkRunner 10G Factory Defaults.
Resetting Testing App Defaults
Once you have adjusted settings in the NetAlly apps, at some point, you may need to reset an app's settings to the defaults. The following process resets all app-specific settings to the factory defaults.
CAUTION: This operation will delete all saved settings, including testing profiles and other application data.
The Discovery app is used as an example in the following steps:
- Access the App Info screen by long pressing (touch and hold) on a app's icon on the Home or Apps screen.
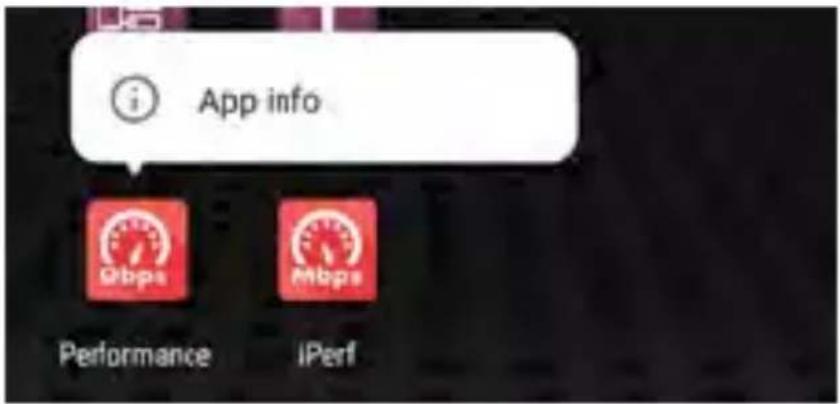
text_image
i App info Qbps Mbps Performance iPerf- Touch App info.
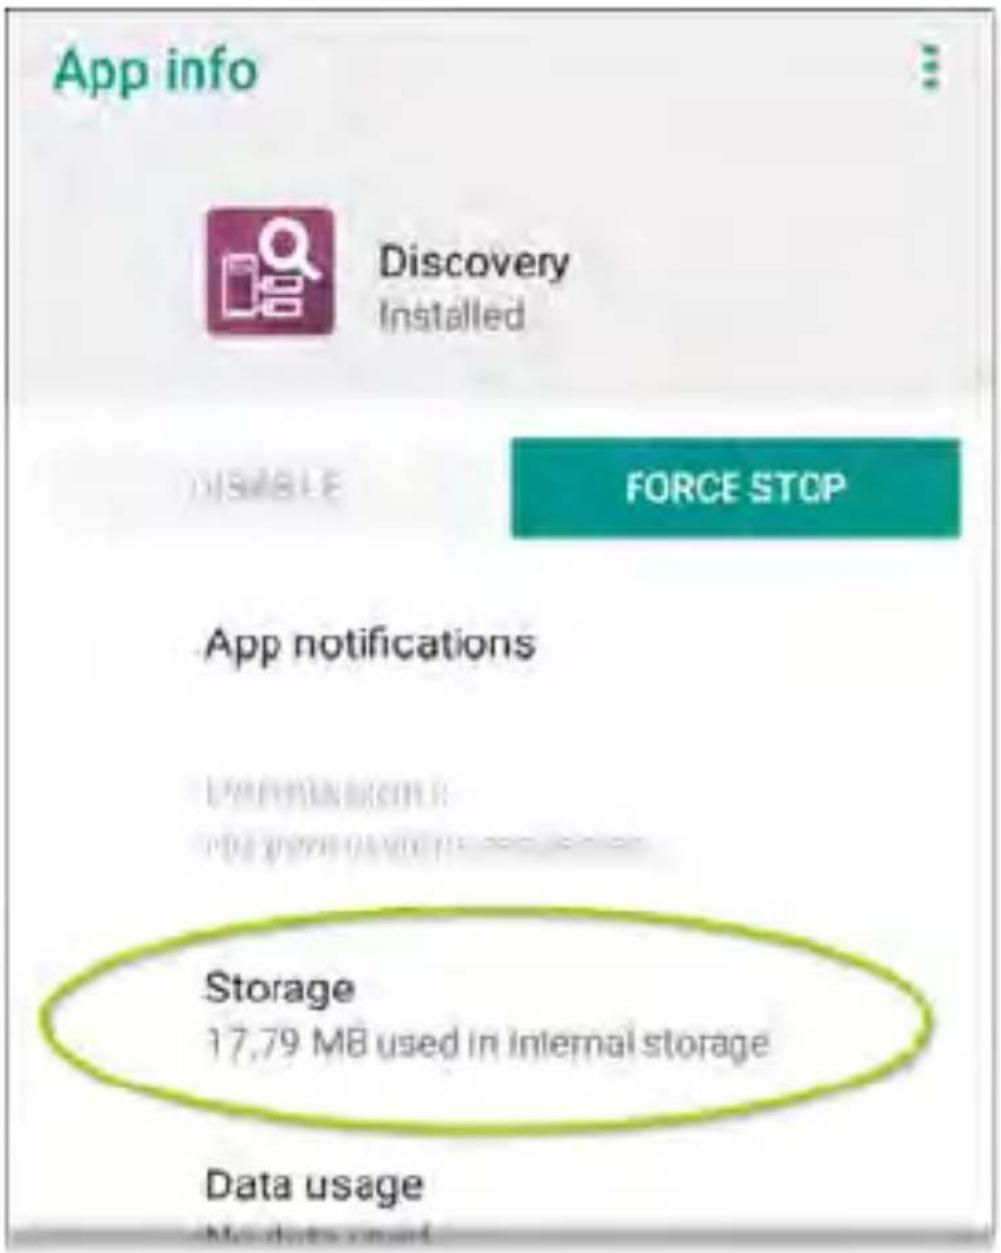
text_image
App info Discovery Installed DISABLE FORCE STOP App notifications Storage 17.79 MB used in internal storage Data usage-
On the App info screen, select Storage. (You can also access the App Storage scree from Device Settings > Storage > Internal shared storage > Other apps.)
-
On the Storage screen for the app you selected, touch CLEAR DATA.
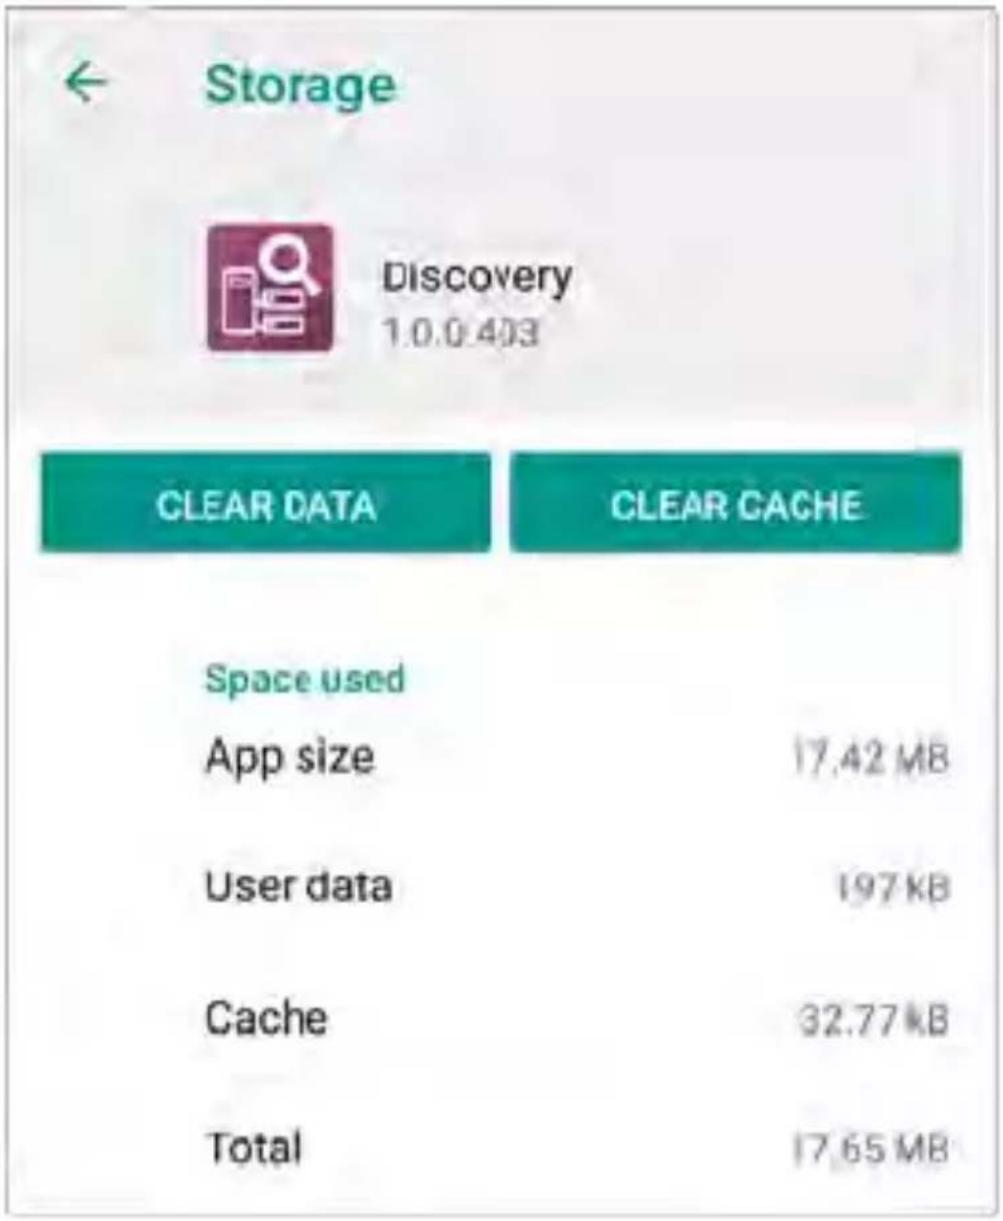
text_image
Storage Discovery 1.0.0.403 CLEAR DATA CLEAR CACHE Space used App size 17.42 MB User data 197 KB Cache 32.77 KB Total 17.65 MB- When the "Delete app data?" dialog appears, tap OK.
All of the app's settings are reset to factory defaults.
Saving App Settings Configurations
Many of the NetAlly testing applications allow you to save and load a configuration of setting by selecting the save button that appears at the top right within the app's main screen.
The following apps enable you to save and loa settings configurations:
• AutoTest Settings, including Profile Groups
• Discovery Settings
• Discovery > Problem Settings
• Performance Settings
- iPerf Settings
The iPerf app is shown below as an example.
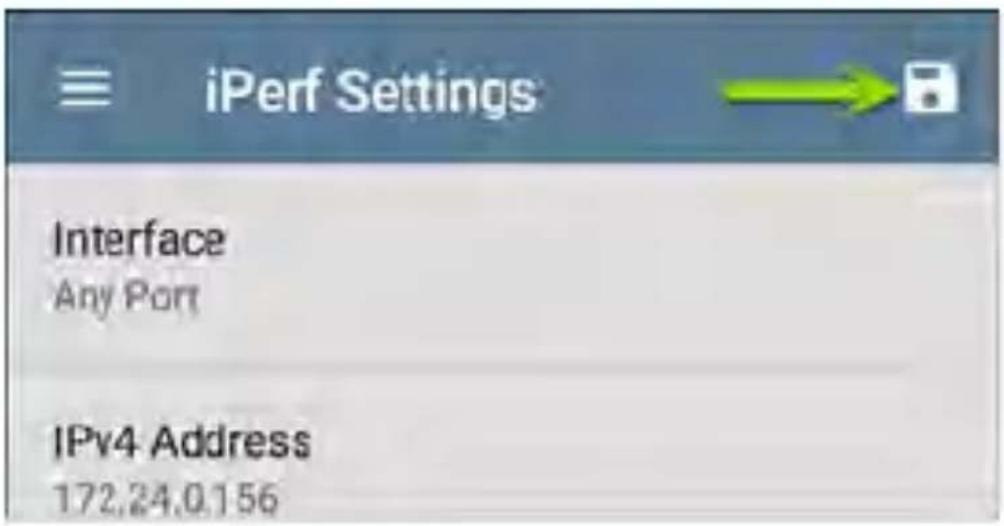
text_image
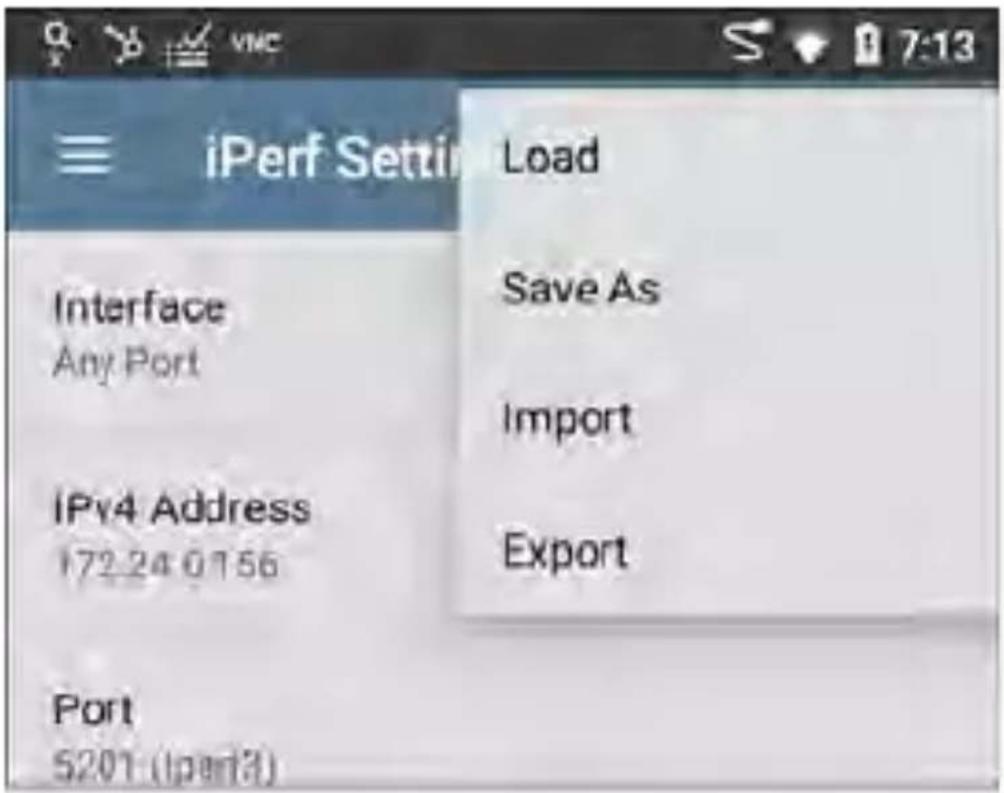
iPerf Settings Interface Any Port IPv4 Address 172.24.0.156The following options display in a drop-down menu:
text_image
iPerf Setting Load Interface Save As Any Port IPv4 Address Import 172.24 0156 Export Port 5201 (Iperf3)- Load: Open a previously saved and named settings configuration.
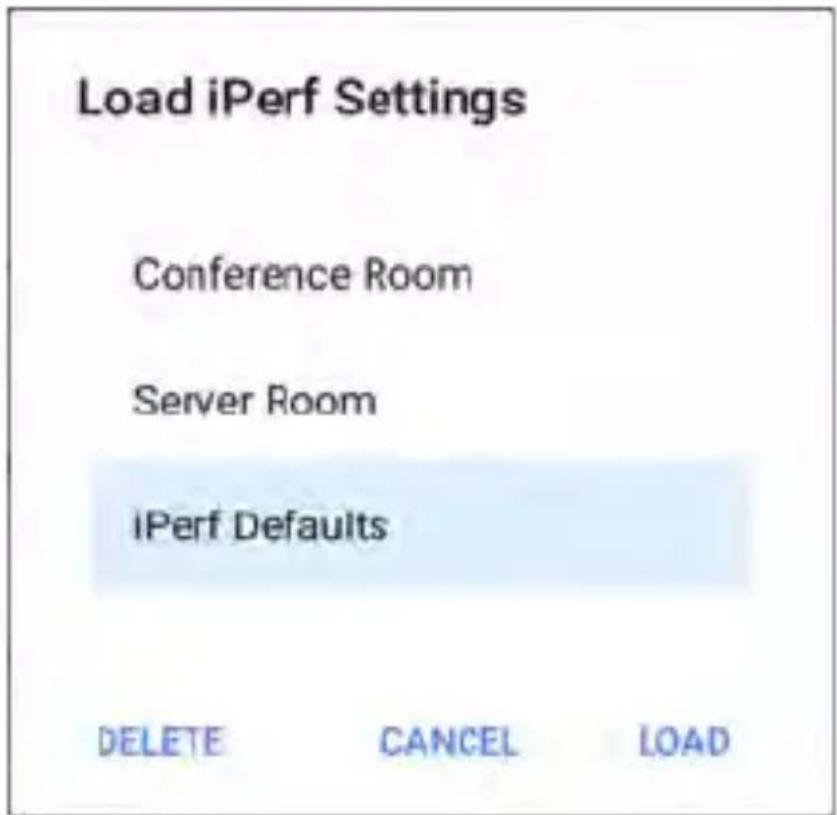
text_image
Load iPerf Settings Conference Room Server Room iPerf Defaults DELETE CANCEL LOAD- Save As: Save the current settings with an existing name, or enter a new custom name
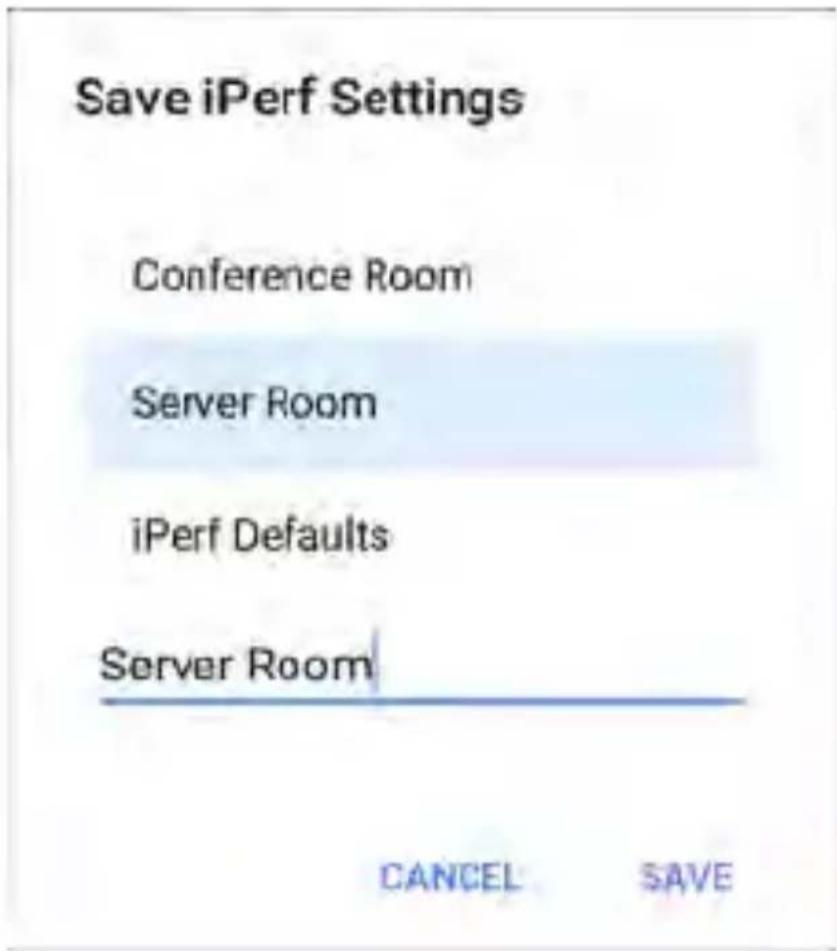
text_image
Save iPerf Settings Conference Room Server Room iPerf Defaults Server Room CANCEL SAVE- Import: Import a previously exported settings file.
- Export: Create an export file of the current settings, and save it to internal or connected external storage.
See Exporting and Importing App Settings (below) for more details.
Saving a Default Test App Configuratio
If you find you are frequently resetting app defaults, you can save the default configuration of settings for later use within the NetAlly testing apps. Loading a saved default configuration within an app allows you to access the default settings without deleting other configurations. This strategy can be most useful for Discovery Settings and Problem Settings.
- Go to an app's settings screen.
- With all settings set to the defaults, tap the save button and Save As.
- Save a default configuration with an obvious name like "Default Profiles" or "Discovery Defaults."
- Do not change the settings in your default configuration to non-defaults without also saving a new, custom-named configuration.
Exporting and Importing Settings
LinkRunner 10G provides functionality for exporting and importing saved test app settings
for transfer to additional units.
The following apps enable you to import and export settings configurations:
• AutoTest Settings, including Profile Groups
• Discovery Settings
• Discovery > Problem Settings
• Performance Settings
- iPerf Settings
The AutoTest Settings are shown as an example in the images below.
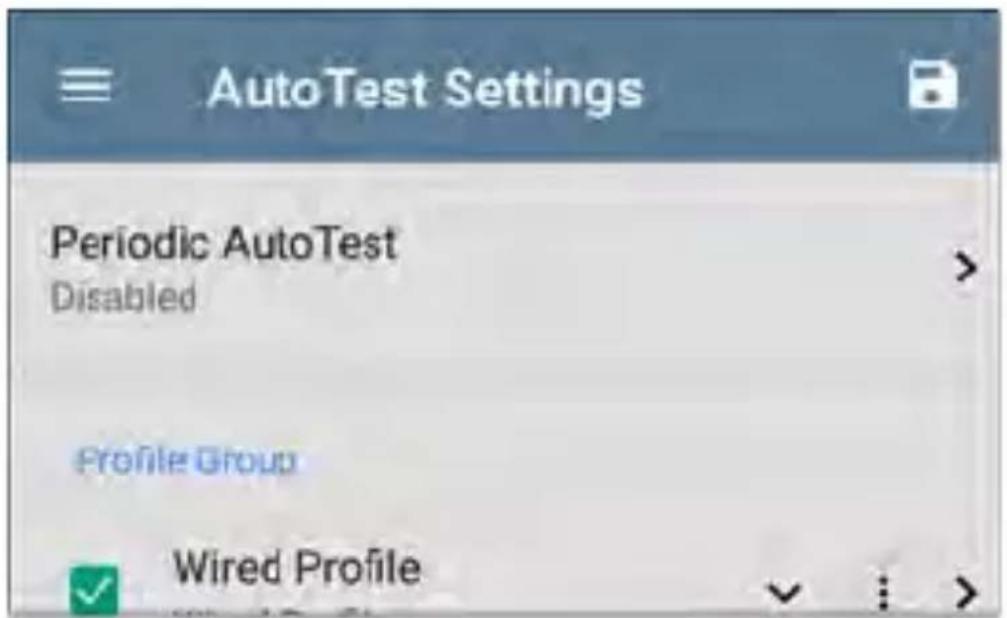
text_image
AutoTest Settings Periodic AutoTest Disabled Profile Group Wired Profile- Touch the save button to import new app settings or export the currently active and selected app settings.
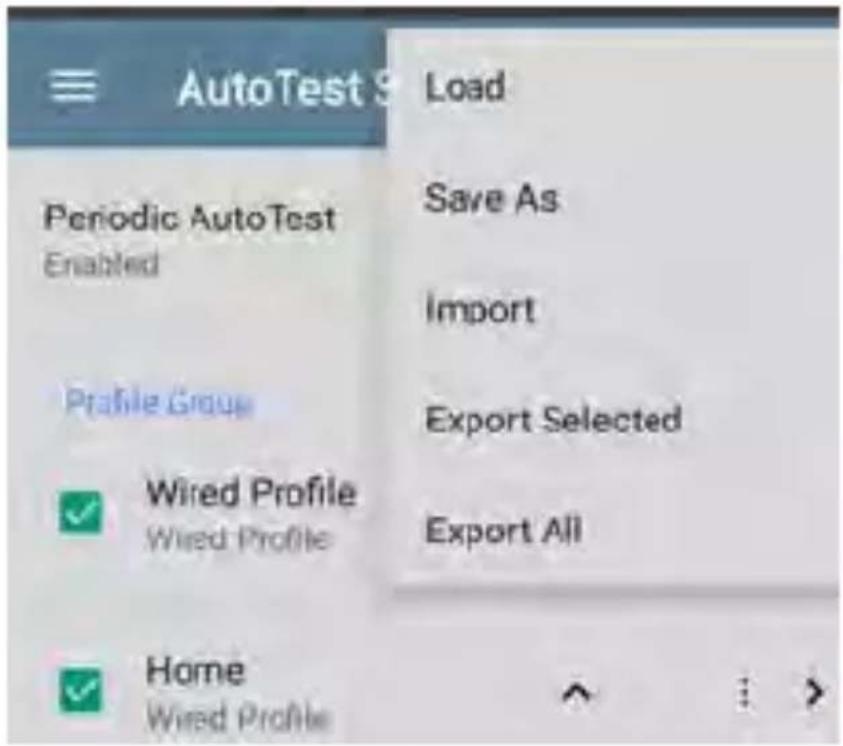
text_image
AutoTest 9 Periodic AutoTest Enabled Profile Group Wired Profile Wired Profile Home Wired Profile Load Save As Import Export Selected Export All- Selected (checked) items in shared lists of configurations are the only ones exported when “Export Selected” is chosen.
- Unsaved configurations without a custom name are auto-named with the app name and date:

text_image
<< autotest-20-03-11 SAVE- Saved configurations are auto-named with the app name and custom settings name:
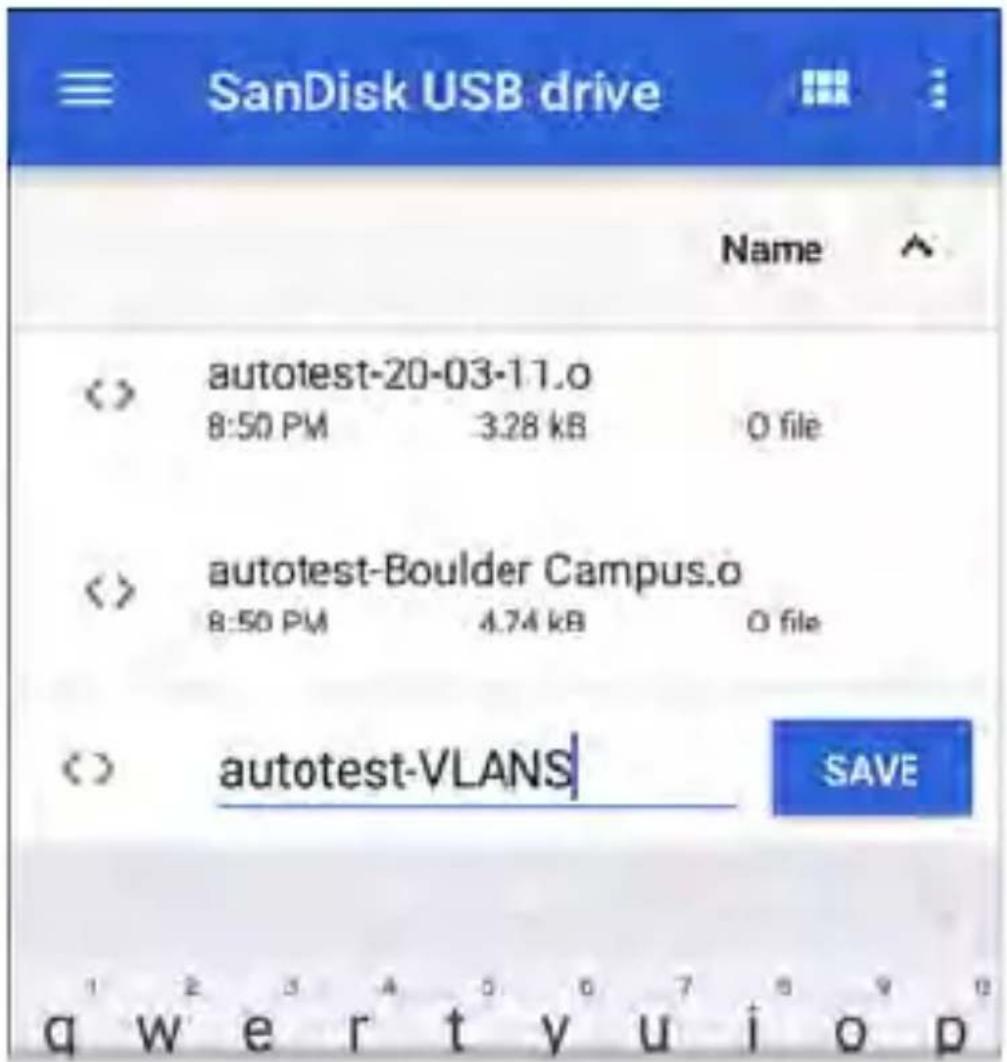
text_image
SanDisk USB drive Name autotest-20-03-11.0 8:50 PM 3.28 kB O file autotest-Boulder Campus.0 8:50 PM 4.74 kB O file autotest-VLANS SAVE q w e r t y u i o p- You can rename the export file as needed.
- Settings can be saved to any connected external or internal storage. See Managing Files for instructions on accessing folders and moving files.
- Settings are saved with the .o file extension.
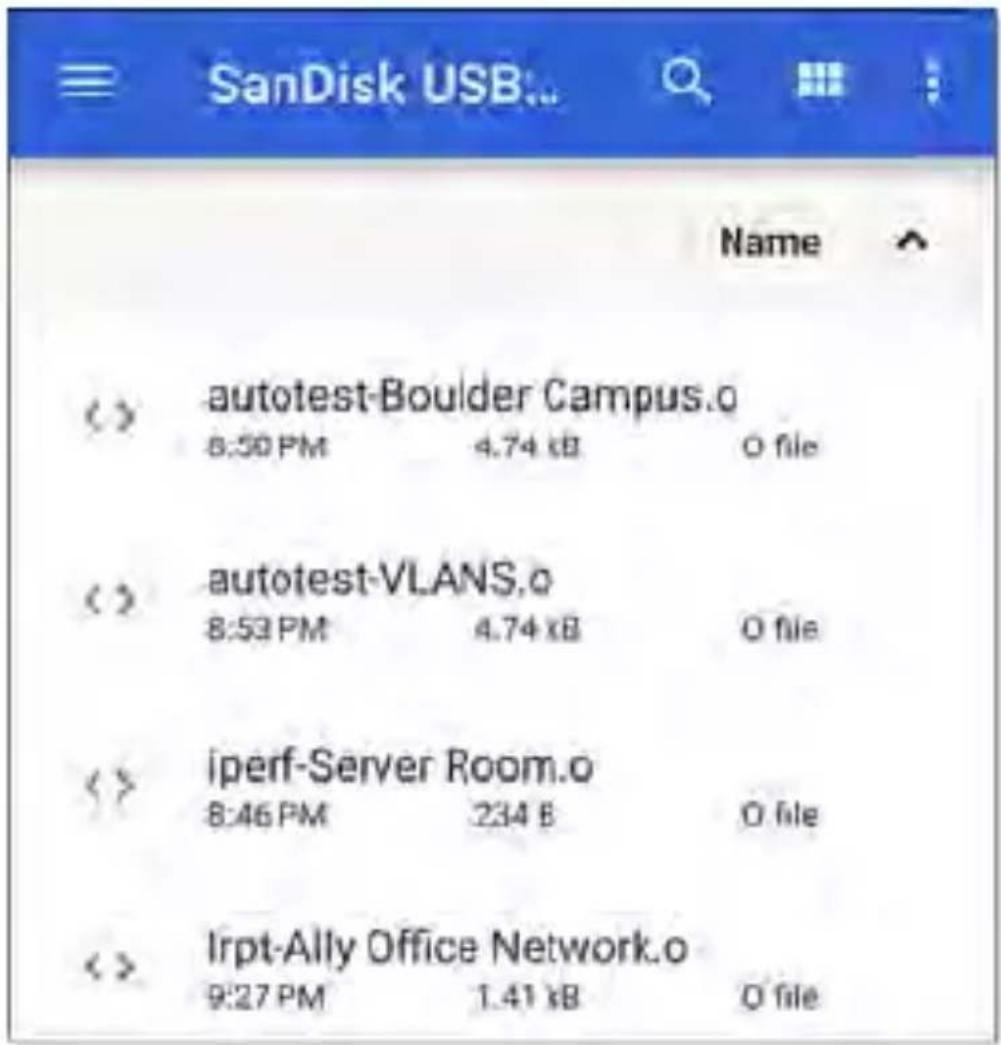
text_image
SanDisk USB... Name autotest-Boulder Campus.o 8:50 PM 4.74 KB O file autotest-VLANS.o 8:53 PM 4.74 KB O file iperf-Server Room.o 8:46 PM 234 B O file Irpt-Ally Office Network.o 9:27 PM 1.41 KB O file- Selecting Import from an app opens the Files app, where you can navigate to and select the .o file you want to import.
- Imported settings configurations will overwrite existing saved configurations with the same name that are already in the app
Restoring LinkRunner 10G Factory Defaults
CAUTION: Depending on the reset option you select, this operation can delete all test results, user-installed applications, testing app settings, and saved files, and reset device settings to the factory default state. Make sure to back up any files you desire to keep.
- To access the Android Device Settings, touch the Settings icon at the bottom of the Home Screen.
- On the Settings screen, scroll down and tap the System section.
- On the System screen, touch Reset options.

Reset options
Network, apps, or device can be reset
- On the Reset options screen, select an option based on which defaults you want restored. Whichever option you choose,
LinkRunner displays a list of the items that will be reset based on the option.
- Touch RESET to initiate your chosen reset type.
- The unit may ask you to confirm a final time before resetting. Touch the final confirmation button to reset your LinkRunner's defaults.
The device restarts with factory default settings.
Changing the Language
NOTE: The LinkRunner 10G supports Japanese beginning with version 1.1.
-
To change the interface language, go to Device Settings by touching the Settings icon at the bottom of the Home screen.
-
On the Settings screen, scroll down and select the System section, and then, Languages & input.
-
On the Languages & input screen, touch Languages.
-
On the Language preferences screen, select + Add a language.
-
Touch to select the name of your desired language option.
-
On the Language preferences screen, touch the icon to the right of the language, and drag your desired language option to the
top (1) spot on the list.
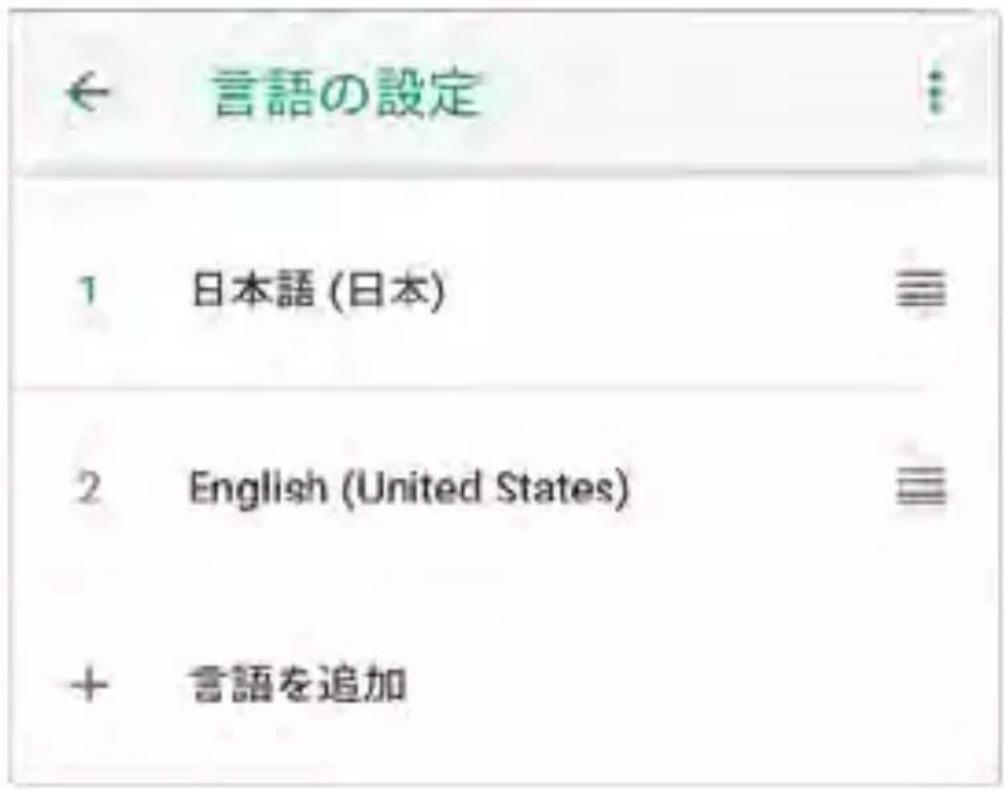
The LinkRunner displays the chosen languages, as available, in the priority order shown on the Language preferences screen.
LinkRunner 10G Testir Applications
This section of the User Guide describes the NetAlly-developed network testing apps. Each app is specially designed for fast analysis and intuitive operation to enhance and simplify your network tasks.
Open the testing apps by selecting their icons from the Home screen or the Apps screen.

natural_image
Green square icon with a white checkmark over a document symbol (no text or numbers)AutoTest App and Profiles
AutoTest is the most comprehensive NetAlly testing application on LinkRunner 10G. It allows you to quickly run a variety of test type and save their configurations and network credentials for access whenever you need them. The app is fully customizable with test "Profiles" for Wired network connections, and individual Test Targets.
AutoTest establishes the Wired Test Port connection used by other testing apps, like Ping/TCP, Capture, and Performance.
AutoTest results are automatically uploaded to Link-Live Cloud Service once you have claimed your LinkRunner.
AutoTest Chapter Contents
This chapter describes AutoTest Profiles, screens, settings, and test results.
AutoTest Overview
Managing Profiles and Profile Groups
Main AutoTest Screen
Periodic AutoTest
Wired AutoTest Profiles
DHCP, DNS, and Gateway Test for Wired Profiles
Test Targets for Wired Profiles
AutoTest Overview
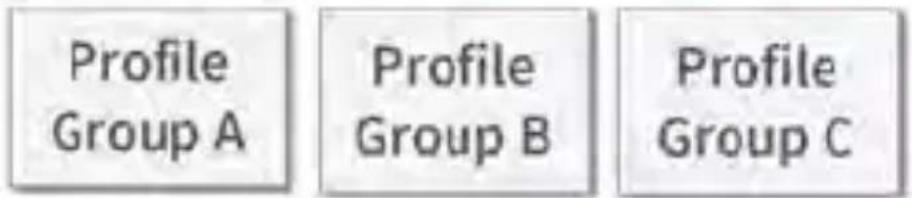
AutoTest consists of three distinct testing levels: Test Targets, Profiles, and Profile Groups.
Profile Groups
text_image
Profile Group A Profile Group B Profile Group CProfiles
Test Targets
text_image
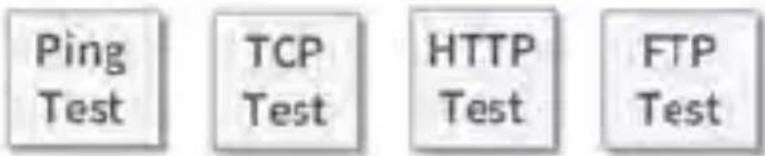
Ping Test TCP Test HTTP Test FTP TestAt the bottom level is a set of individual Test Targets that connect to network services, such as a web app or FTP site. A Test Target defines parameters including type, target URL/IP address, port number, and Pass/Fail thresholds. More complex tests, like HTTP, allow further Pass/Fail criteria, such as strings that must or must not be contained in the HTTP body.
A Test Target can be added to and used in an number of Profiles.
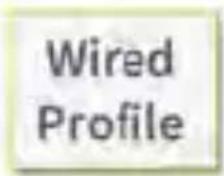
A Profile contains a series of individual network tests. There is one Profile type: Wired which includes connection tests and credentials for a Wired VLAN. Profiles provide an automated and consistent way to verify a network from layer 1 through layer 7.
A Profile can be added to and used in any number of Profile Groups.
A Profile Group is a custom-named collection of Profiles. Profile Groups are designed to allow further automation for testing multiple networks or network elements with a single tap of the START button.
Here are some examples of useful Profile Grouping schemes:
^1 Testing multiple Wired VLANs on a trunk port.
^1 Testing wired access from a conference room.
You can create as many Profile Groups, Profiles and Test Targets as you want.
Managing Profiles and Profile Groups
Profiles are a series, or suite, of tests designed to analyze the different characteristics of your networks. The LinkRunner 10G AutoTest app features one type of test profile:
Wired Profiles test copper and fiber connections.
Factory Default Profiles
The LinkRunner begins with a default version of the Wired AutoTest profile type which you can customize, delete, or replace for your purposes.
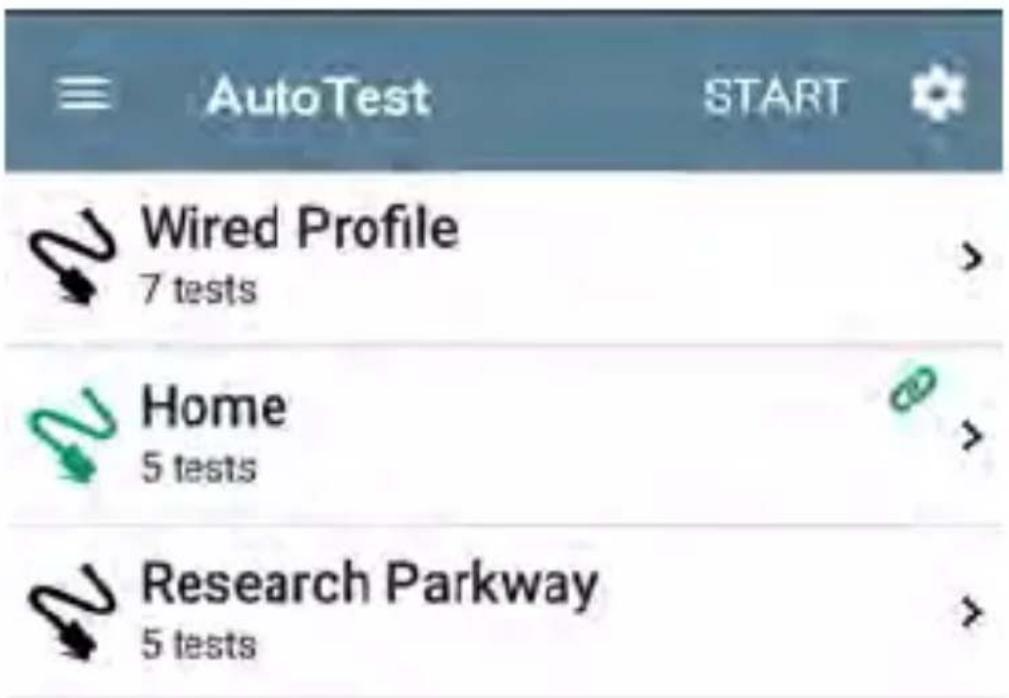
text_image
AutoTest START Wired Profile 7 tests Home 5 tests Research Parkway 5 testsTo customize each Profile with the required network settings and a custom name, touch the Profile name first, and then select the settings icon.
NOTE: Touching the settings icon on the main AutoTest screen (shown above) opens the AutoTest Settings and Profile Group screen, not the individual Profile settings.
- The default Wired Profile runs automatically and establishes a wired link as soon as you unit is powered on and an active Ethernet connection is available on the top RJ-45 port.
NOTE: The default Wired Profile does not run automatically over a fiber link. You must touch START in AutoTest to run a Wired Profile on a fiber connection.
Adding New Profiles
To add new test profiles to the current AutoTest, tap the floating action button (FAB) on the AutoTest screen.
The profile's configuration screen appears after you select the type of profile you want to add
See the topic for each profile type for a description of its settings.
Once you have configured the profile's settings, tap the back button at the bottom of the screen to open and run the new test profile.
Profile Groups
LinkRunner 10G also allows you to save Profile Groups. Profile Groups are simply the included list of test Profiles and the order in which the run when you start an AutoTest. (See AutoTest Overview for more explanation of Profile Groups.) You can configure and select Profiles and Profile Groups for different locations, jobs, networks, or other purposes.
To manage your Profiles and Profile Groups, touch the Settings button on the main AutoTest screen (with the list of Profiles).
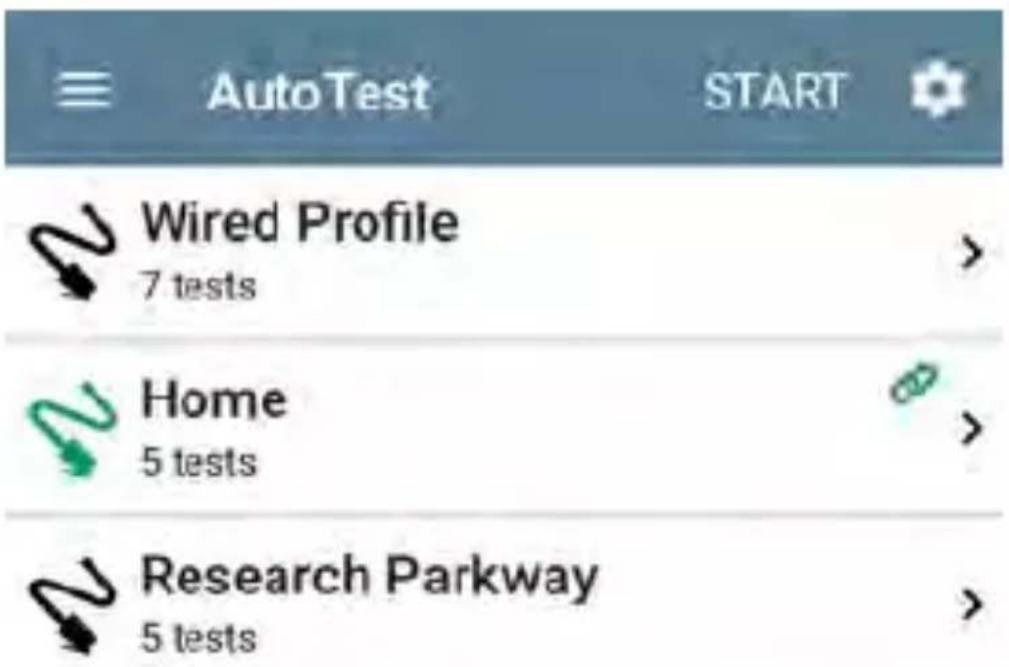
text_image
AutoTest START Wired Profile 7 tests > Home 5 tests > Research Parkway 5 tests >AutoTest Settings Screen
The AutoTest Settings screen contains the Periodic AutoTest and Profile Group settings.
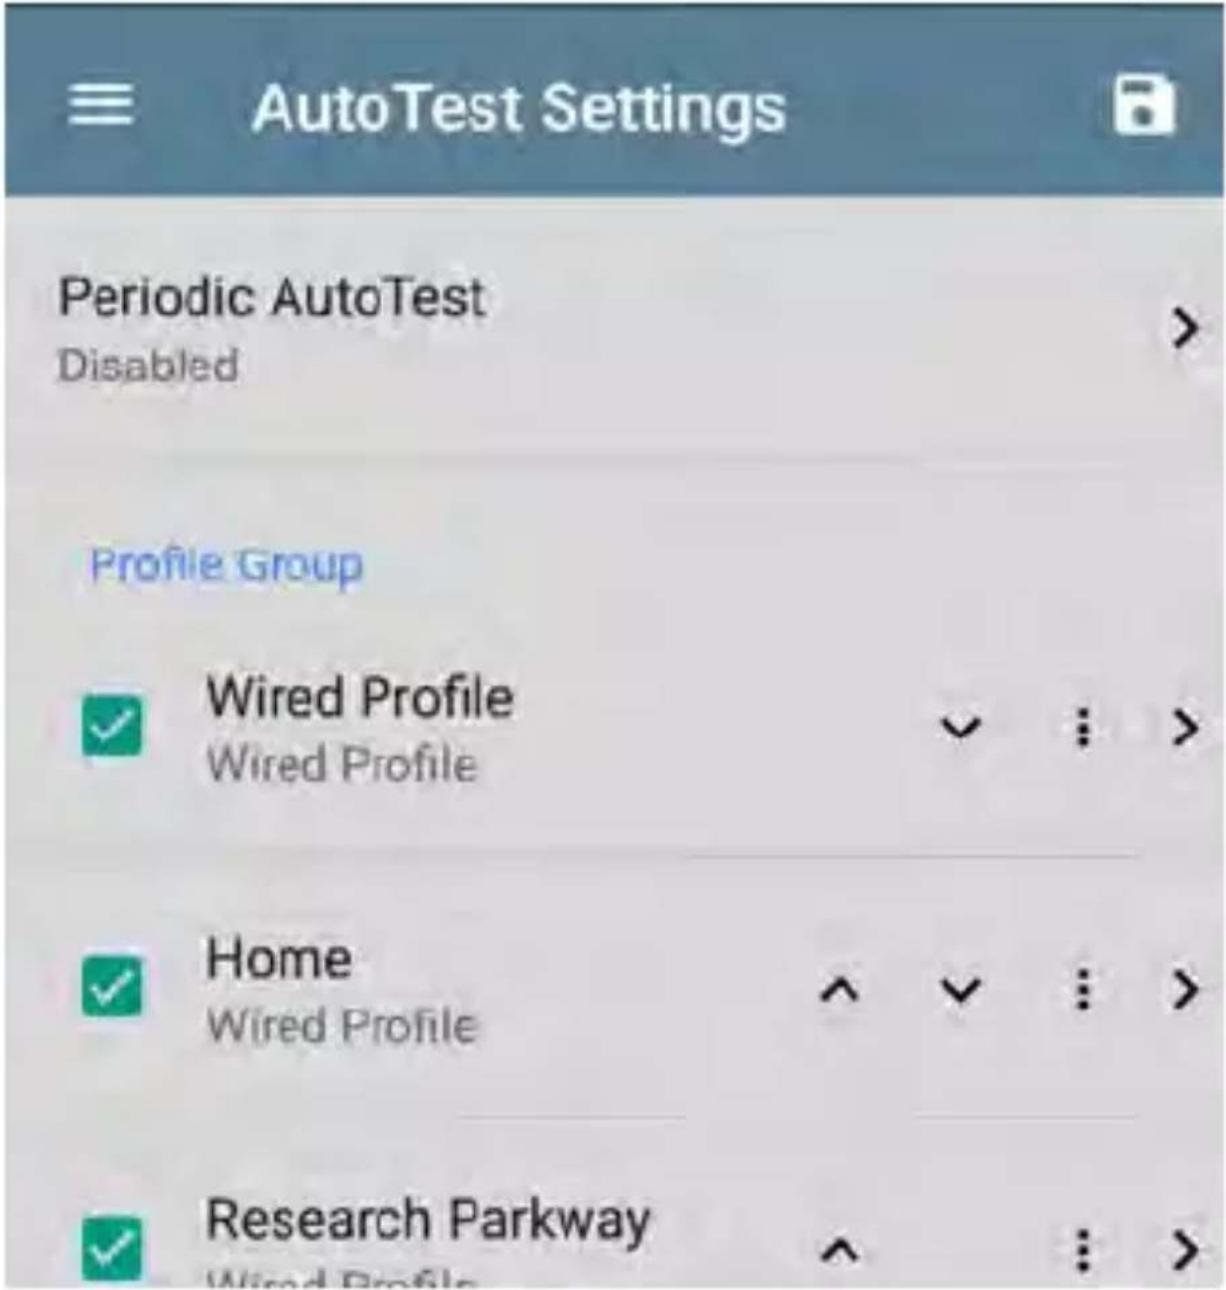
text_image
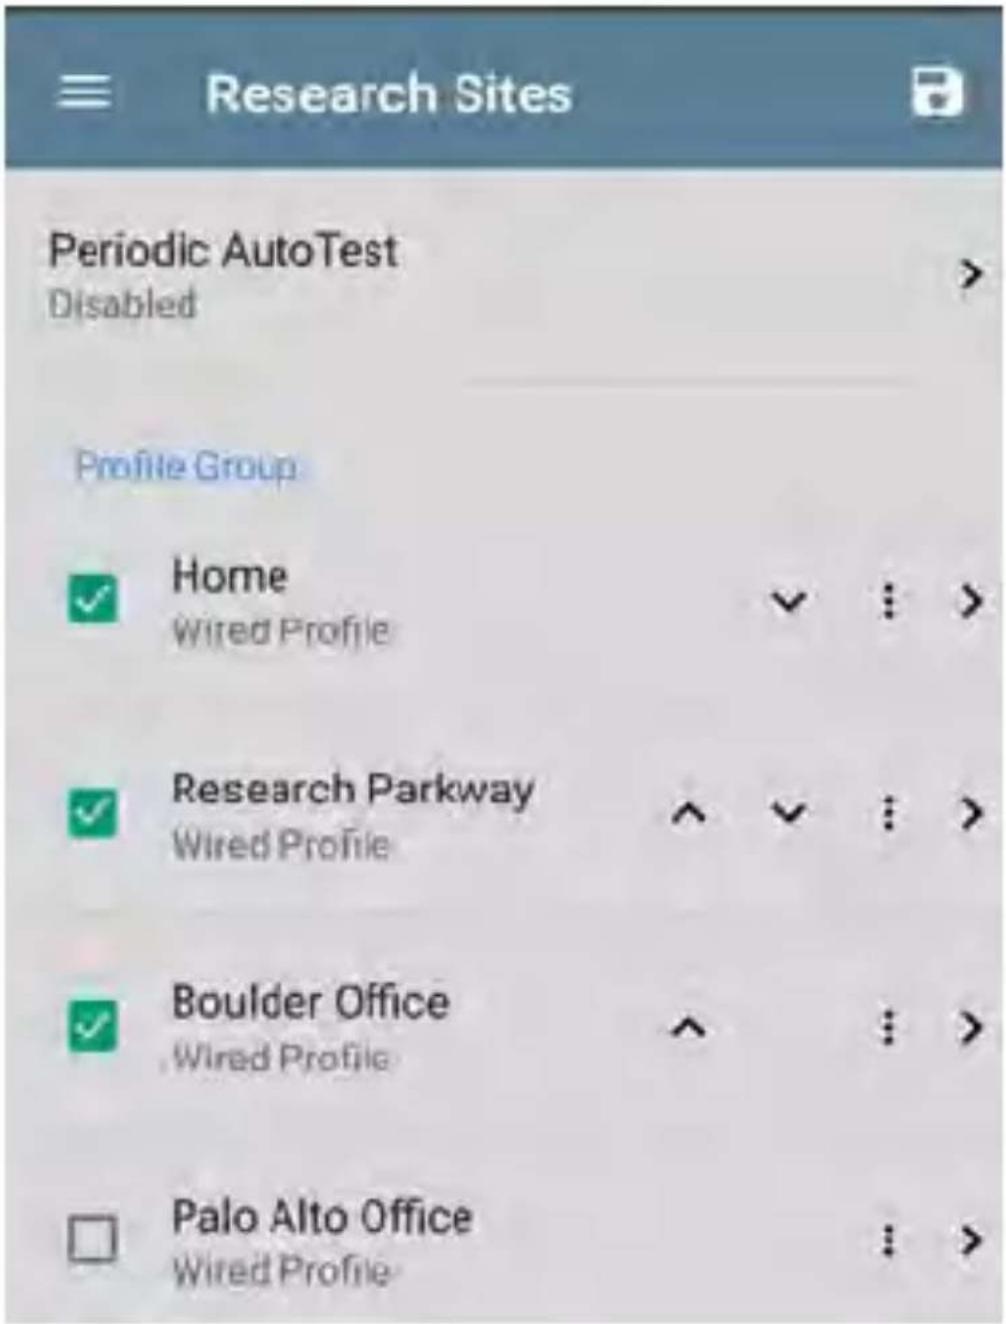
AutoTest Settings Periodic AutoTest Disabled Profile Group ✓ Wired Profile Wired Profile Home Wired Profile ✓ Research Parkway Wired ProfileYou can perform these actions on the AutoTest Settings screen:
- Check or uncheck the boxes to include or exclude a test Profile from the currently
active Profile Group.
- Tap the up and down arrows to reorder the test Profiles on this and the main AutoTest screen for the Profile Group.
- Touch the action overflow icon to Duplicate or Delete a Profile.
CAUTION: When you delete a Profile, it is deleted from all Profile Groups. To remove a Profile from the current group, simply uncheck it.
- Touch any Profile's name to open the test and connection settings for the Profile.
- Touch the save icon to perform the following actions:
- Load: Open a previously saved settings configuration, which includes the Profile Group.
- Save As: Save the current settings and Profile Group with an existing name or a new custom name.
See also Saving App Settings Configurations.
- Import: Import a previously exported settings file.
- Export: Create an export file of the current settings, and save it to internal or connected external storage.
See Exporting and Importing App Settings for more details.
Each Profile Group can run one or many of the three Profiles types. Your saved Profiles are available across all of your Profile Groups.
Custom AutoTest Settings/Profile Group Names
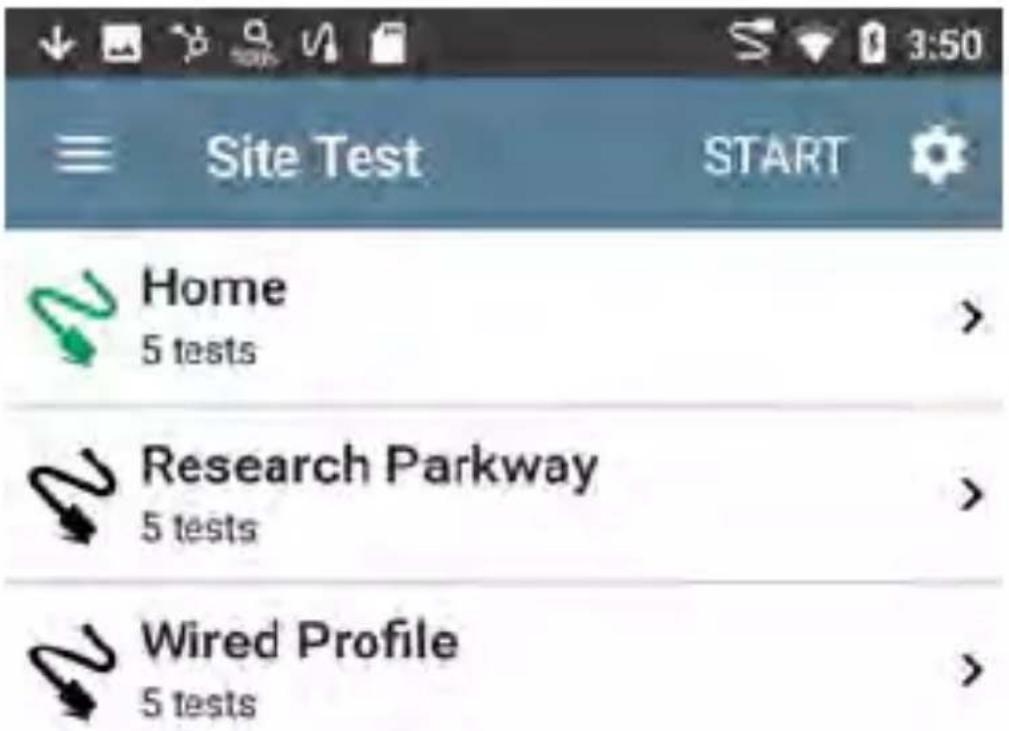
By default, the AutoTest app screen shows "AutoTest" in the header, and the AutoTest Settings screen header is "AutoTest Settings." Once you save a custom name, the name displays in the AutoTest app header and in the AutoTest Settings screen header.
In the example below, the user saves a custom AutoTest configuration named "Springs Campus."
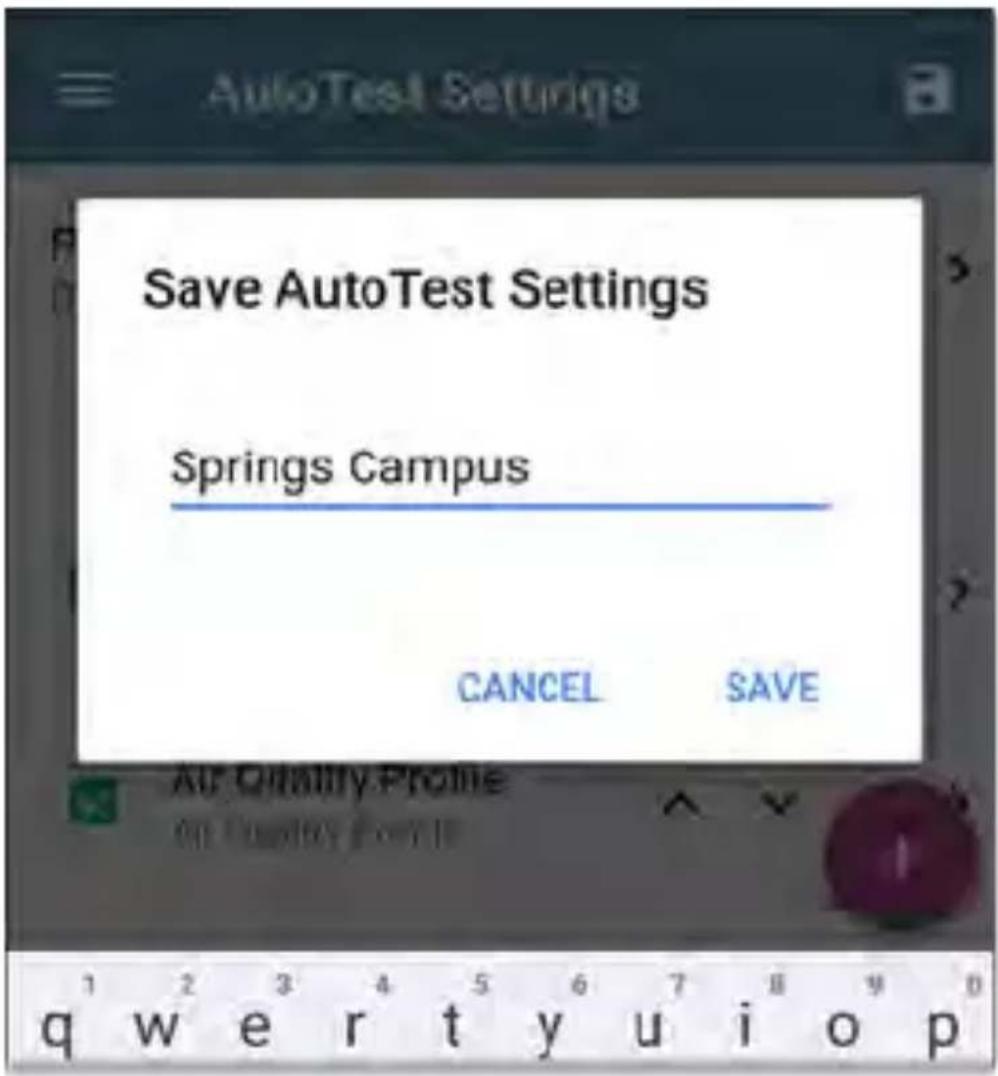
text_image
AutoTest Settings Save AutoTest Settings Springs Campus CANCEL SAVE q w e r t y u i o pThe main AutoTest app screen now displays the custom name in the header.
text_image
Site Test START Home 5 tests > Research Parkway 5 tests > Wired Profile 5 tests >Creating New Profile Groups
To create a new Profile Group, follow these steps:
- Go to the AutoTest Settings and Profile Group screen by touching on the main AutoTest screen.
- Uncheck the boxes for any Profiles you do not want included in the new Profile Group.
-
Touch the FAB to add new test Profiles to be included in your new Profile Group.
-
Tap the up and down arrows to change the order in which the test Profiles will run. Unchecked profiles will automatically move to the bottom of the list once you leave and revisit this screen.
-
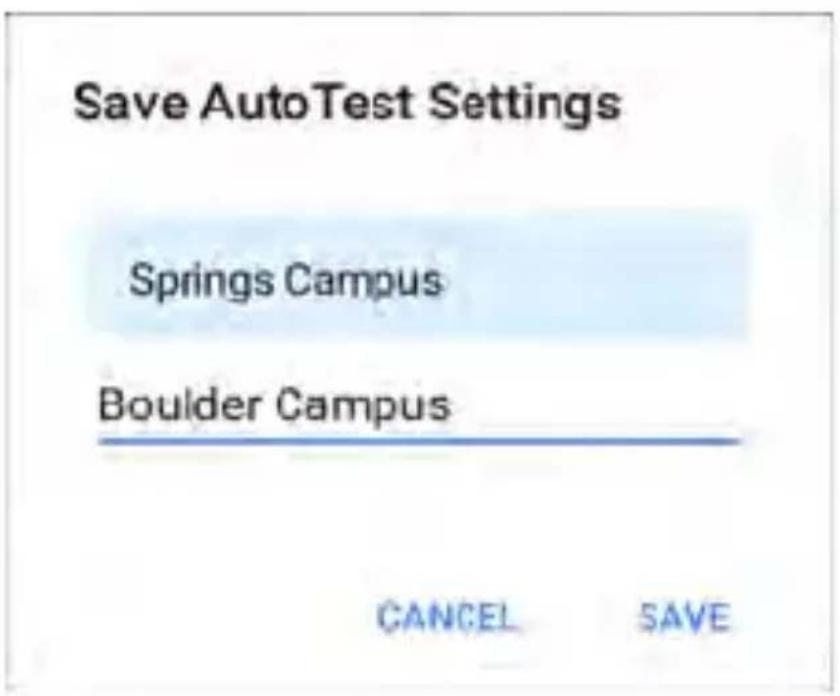
Tap, and select Save As. A dialog box opens, where you can enter the new name
text_image
Save AutoTest Settings Springs Campus Boulder Campus CANCEL SAVE- Enter a new Profile Group name, and touch SAVE. The LinkRunner returns to the Profile Group screen with the new group name shown as the title.
text_image
Research Sites Periodic AutoTest Disabled Profile Group ✓ Home Wired Profile ✓ Research Parkway Wired Profile ✓ Boulder Office Wired Profile □ Palo Alto Office Wired ProfileMain AutoTest Screen
To open the AutoTest app, touch the AutoTest icon on the Home screen.
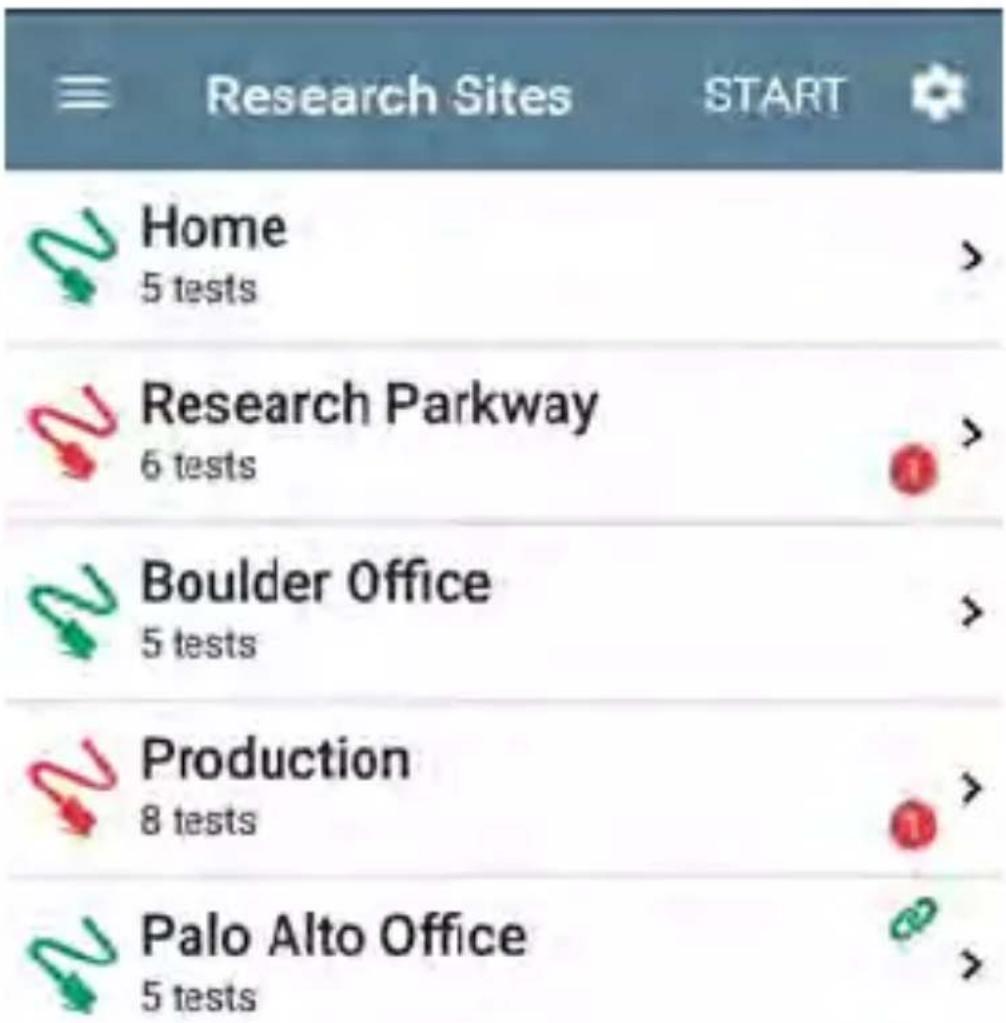
Touch the START button on the main AutoTest screen to run all the Profiles in the currently active Profile Group.
text_image
Home 5 tests Research Parkway 6 tests Boulder Office 5 tests Production 8 tests Palo Alto Office 5 testsThe AutoTest screens display icons that correspond to the type of profile, test, or measurement. After running, these icons change color to indicate the status of the test:
- Green indicates a successful test or measurement within the set threshold.
- Yellow indicates a Warning condition.
• Red indicates test Failure.
The number of warnings or failures within each test profile is also displayed in a colored circle to the right of each profile card: (2)
Warnings, 1 Failure). The thresholds that control the colored test gradings are adjustable in the settings screens for each profile and test type.
The green link icon indicates an active network connection.
Each profile and test is summarized on a card. Touch a profile's or individual test's card to open and view test result details, including the causes of any Warnings or Failures.
Periodic AutoTest
The Periodic AutoTest feature allows you to repeatedly run AutoTests for a specified amount of time.
Periodic AutoTest Settings
To enable and configure Periodic AutoTest, open the AutoTest Settings and Profile Group screen, and tap Periodic AutoTest.
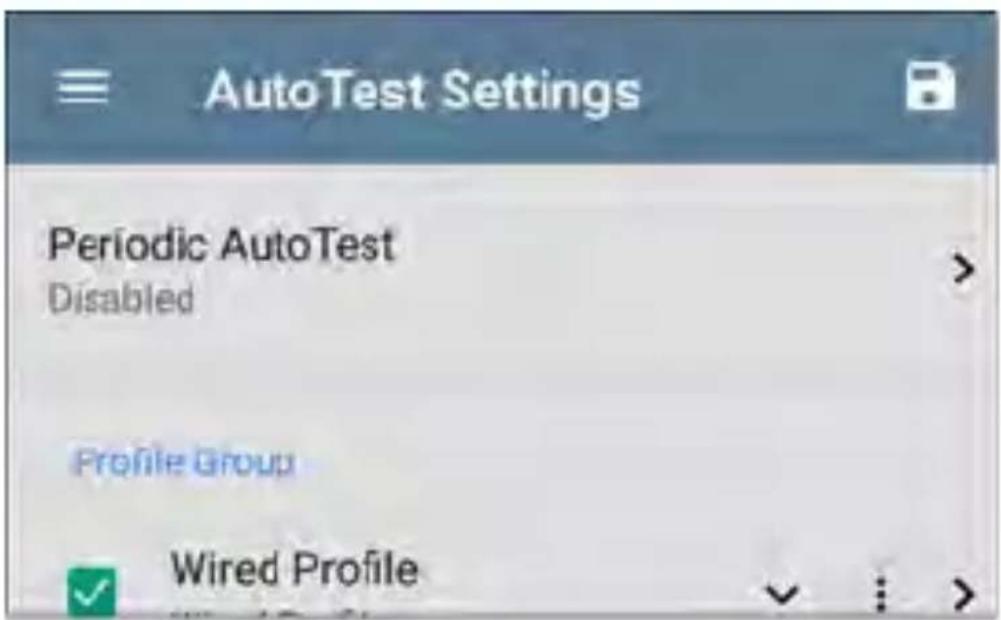
text_image
AutoTest Settings Periodic AutoTest Disabled Profile Group Wired ProfileThe Periodic AutoTest settings screen displays.
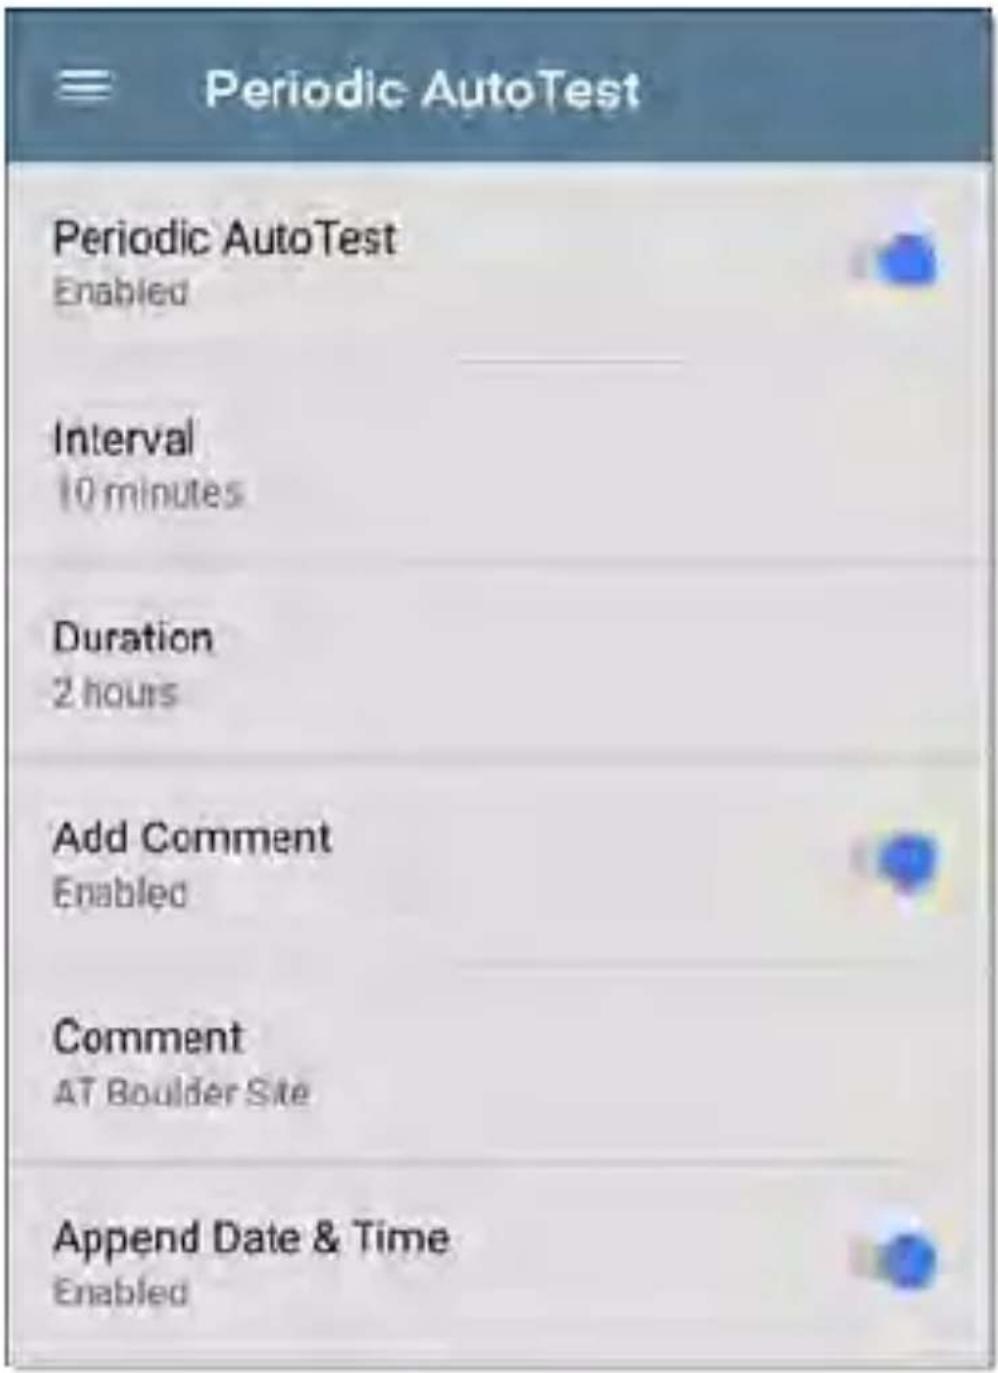
text_image
Periodic AutoTest Periodic AutoTest Enabled Interval 10 minutes Duration 2 hours Add Comment Enabled Comment AT Boulder Site Append Date & Time EnabledTap the Periodic AutoTest field to enable, and adjust the settings below as needed.
Interval: Amount of time between each AutoTest run
Duration: Total length of time Periodic AutoTests run
Add Comment: Enabling this setting allows you to attach a comment to the Periodic AutoTest result in Link-Live Cloud Service. The comment will appear as a label on the Link-Live.com Results page. This setting and the Comment setting below are enabled by default.
Comment: This field appears if the Add Comment setting is enabled. Enter the label you want to be attached to the uploaded Periodic AutoTest result on Link-Live. The default is "Periodic AutoTest."
Append Date & Time: This field appears if the Add Comment setting is enabled and adds a numeric date and time to the end of the Comment above.
Running Periodic AutoTest
Touch START on the main AutoTest screen to begin Periodic AutoTests. AutoTests will continue to run at the set Interval for the selected Duration or until you touch STOP in AutoTest.
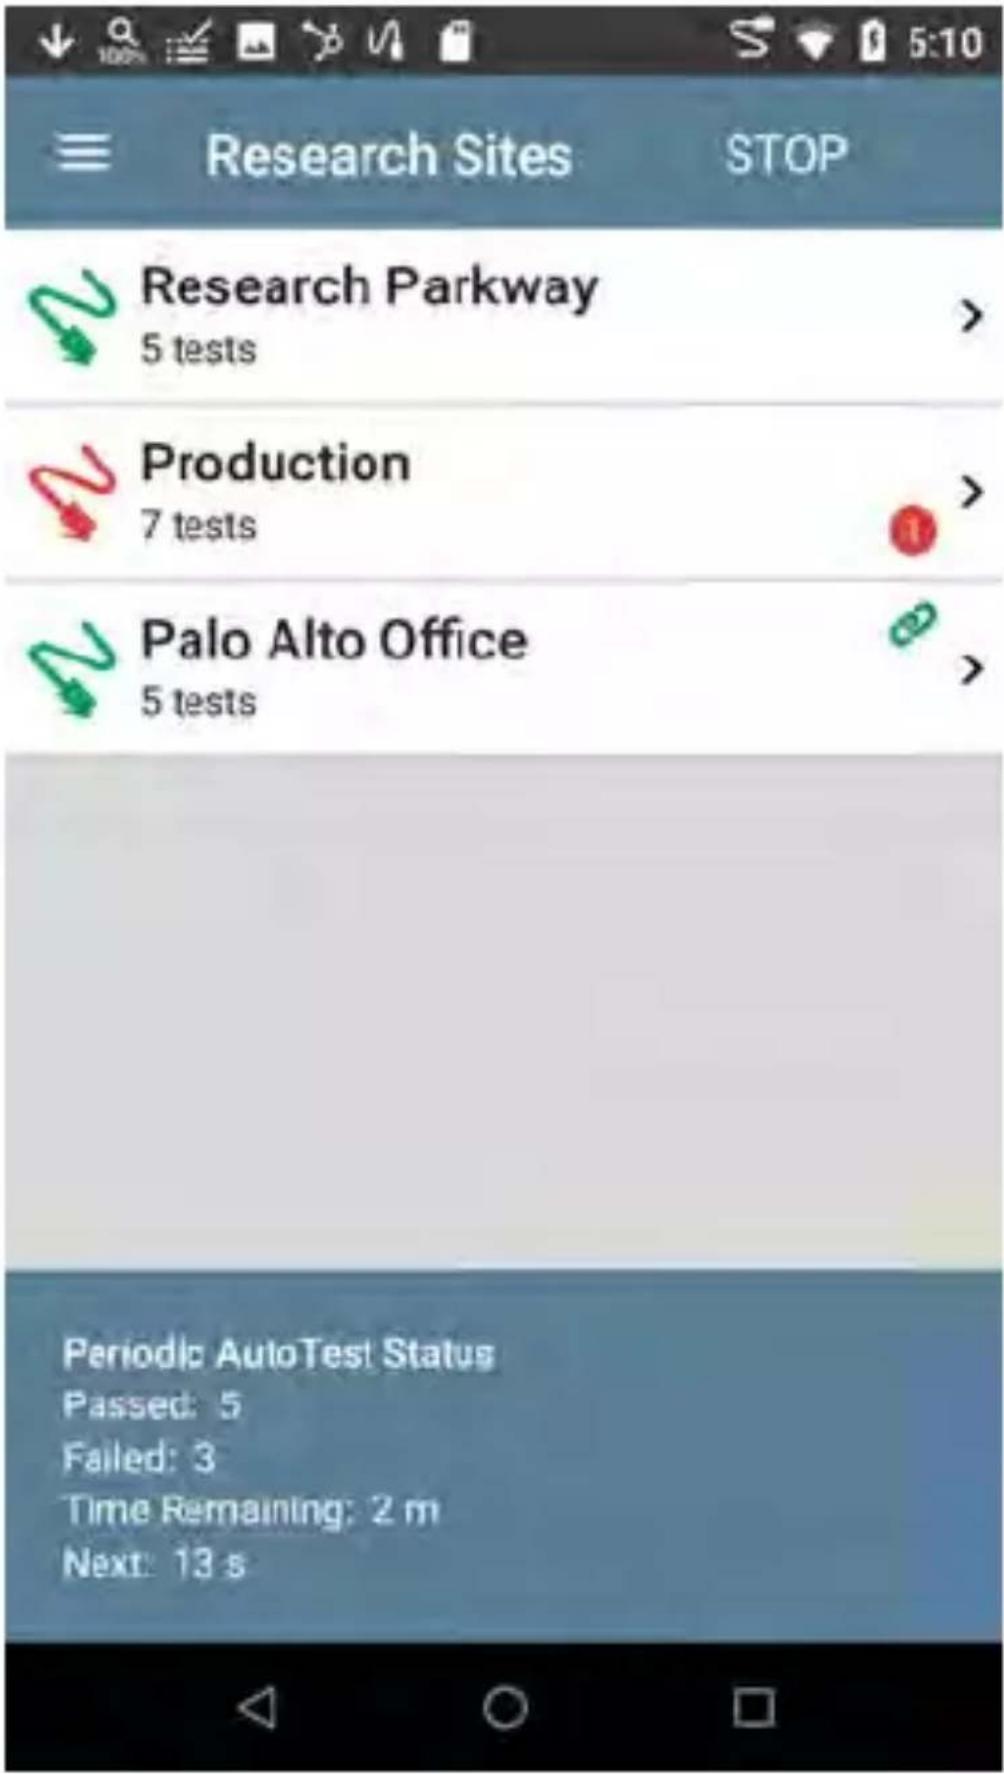
text_image
Research Sites STOP Research Parkway 5 tests > Production 7 tests > Palo Alto Office 5 tests > Periodic AutoTest Status Passed: 5 Failed: 3 Time Remaining: 2 m Next: 13 sThe Periodic AutoTest Status is summarized at the bottom of the AutoTest screens. Passes and
failures are reported for each run of the entire Profile Group, rather than individual Profiles. Periodic AutoTests are skipped if the previous interval's test is still running when the next time interval occurs, such that the next run could not start.
The Periodic AutoTest icon appears in the top Status Bar when Periodic AutoTest is running or has completed. Drag down on the Status Bar to view the corresponding notification.
AutoTest
Periodic AutoTest Running
Passed: 3
Failed: 2
Skipped: 1
Time Remaining: 54 m
NOTE: AutoTest has priority control of the Test Ports, so other apps, including Discovery, are paused while AutoTest completes.

Wired AutoTest Profiles
A Wired Profile runs a series of tests over your copper or fiber network connection.
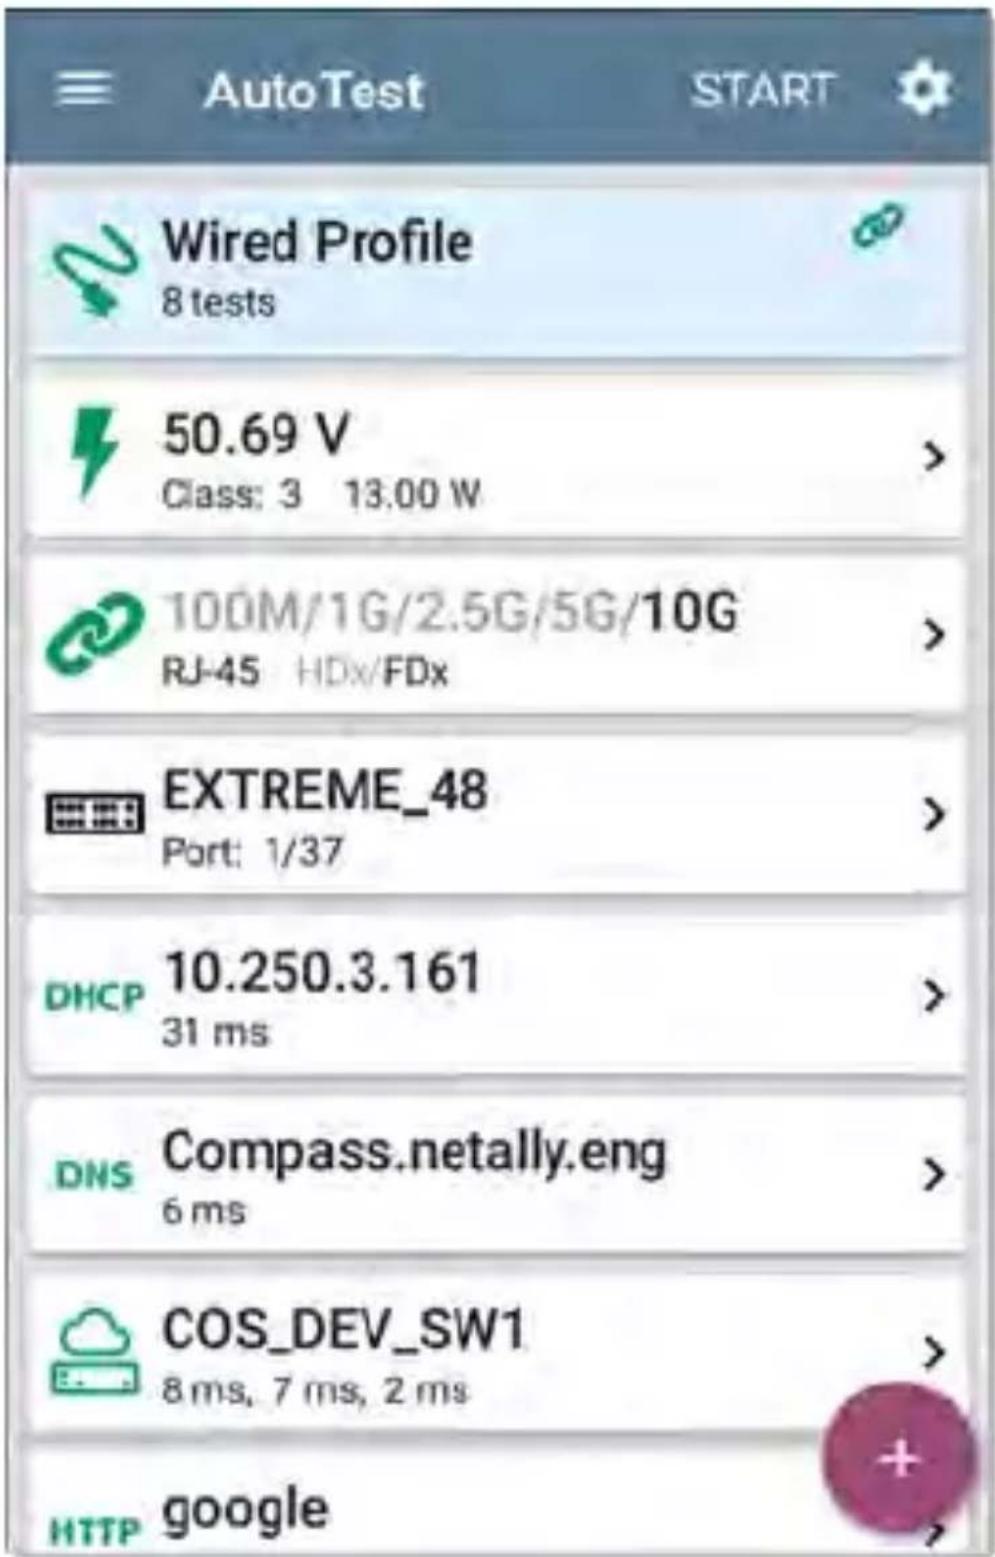
text_image
AutoTest START Wired Profile 8 tests 50.69 V Class: 3 13.00 W 100M/1G/2.5G/5G/10G RJ-45 HDx/FDx EXTREME_48 Port: 1/37 DHCP 10.250.3.161 31 ms DNS Compass.netally.eng 6 ms COS_DEV_SW1 8ms, 7ms, 2ms HTTP googleLike the main AutoTest screen, Wired Profile tests are summarized on cards. Touch a card t view individual test screens.
Each test icon (except the switch) displays green, yellow, or red to indicate the status of the completed test step: Success/Warning/Fail.
The Switch Test card shows the name and port of the nearest switch, but does not turn green to indicate success.
When Wired Profiles Run Automatically
The last enabled Wired Profile in the currently active Profile Group runs automatically when a copper cable is connected or energy is detected to the top RJ-45 port, unless the AutoTest app is open in the foreground and there is more than one enabled Wired Profile. A Wired Profile does not start automatically if Periodic
AutoTest is running.
After a Wired Profile runs, a wired network link is maintained for further testing. Wired Test
Port linkage is indicated in the top Status Bar
with this notification icon:
Wired-Profile-Specific Tests
The tests that are specific to a Wired Profile include the following:
• PoE
- Wired Link
- 802.1X
• VLAN
- Switch
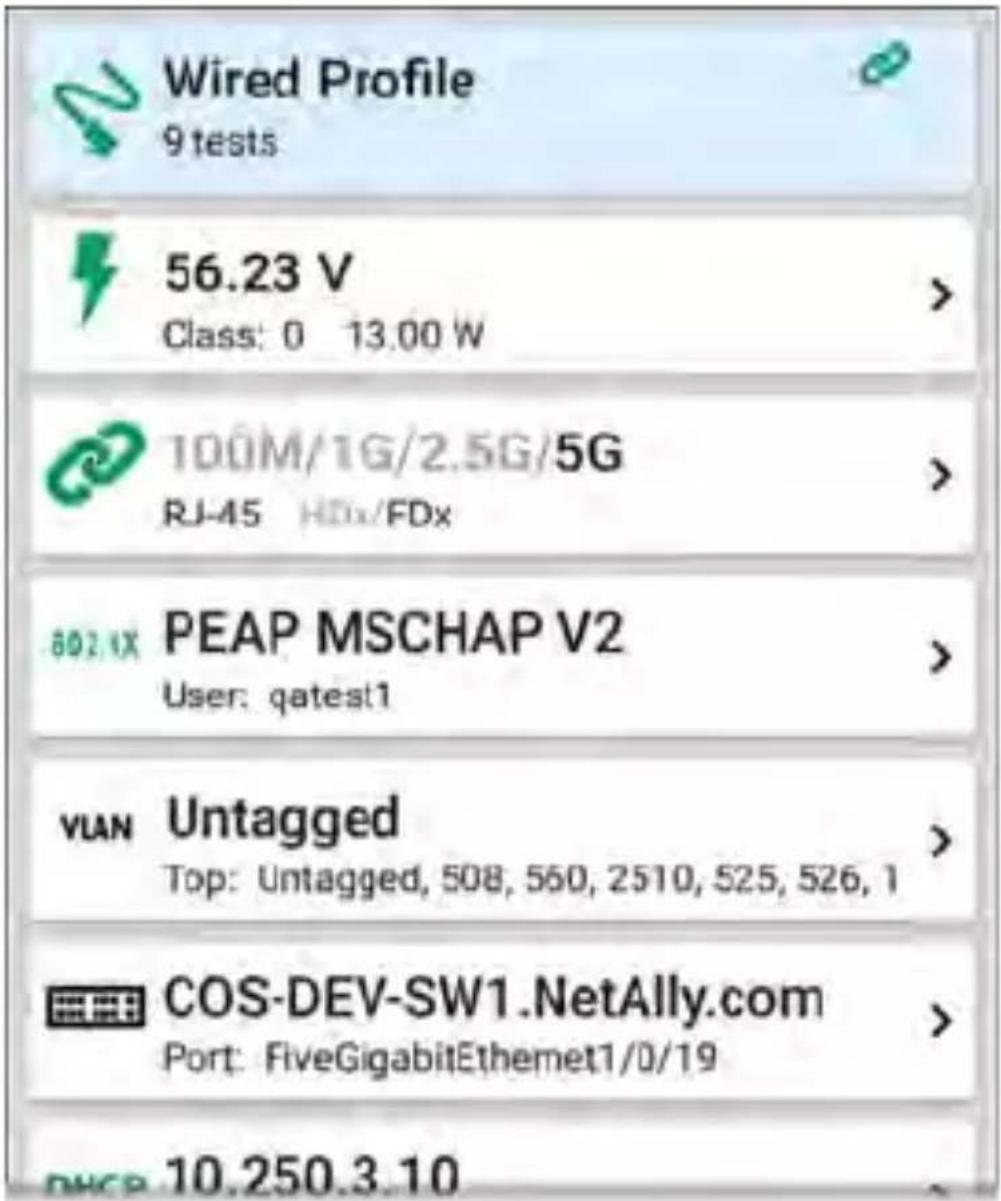
text_image
Wired Profile 9 tests 56.23 V Class: 0 13.00 W 100M/1G/2.5G/5G RJ-45 HDx/FDx 802.1X PEAP MSCHAP V2 User: qatest1 VLAN Untagged Top: Untagged, 508, 560, 2510, 525, 526, 1 COS-DEV-SW1.NetAlly.com Port: FiveGigabitEthernet1/0/19 DHCP 10.250.3.10The 802.1X card only appears if the 802.1X setting is enabled for the Wired Profile.
The VLAN test card appears if the VLAN setting is enabled or if VLAN-tagged traffic is detected during the AutoTest.
PoE, Wired Link, 802.1X, VLAN, and Switch Results are described next.
- Skip to Wired Profile Settings.
- Skip to DHCP, DNS, and Gateway Tests.
- Skip to Test Targets.
Wired Profile Results
The image below shows a completed AutoTest Wired Profile.
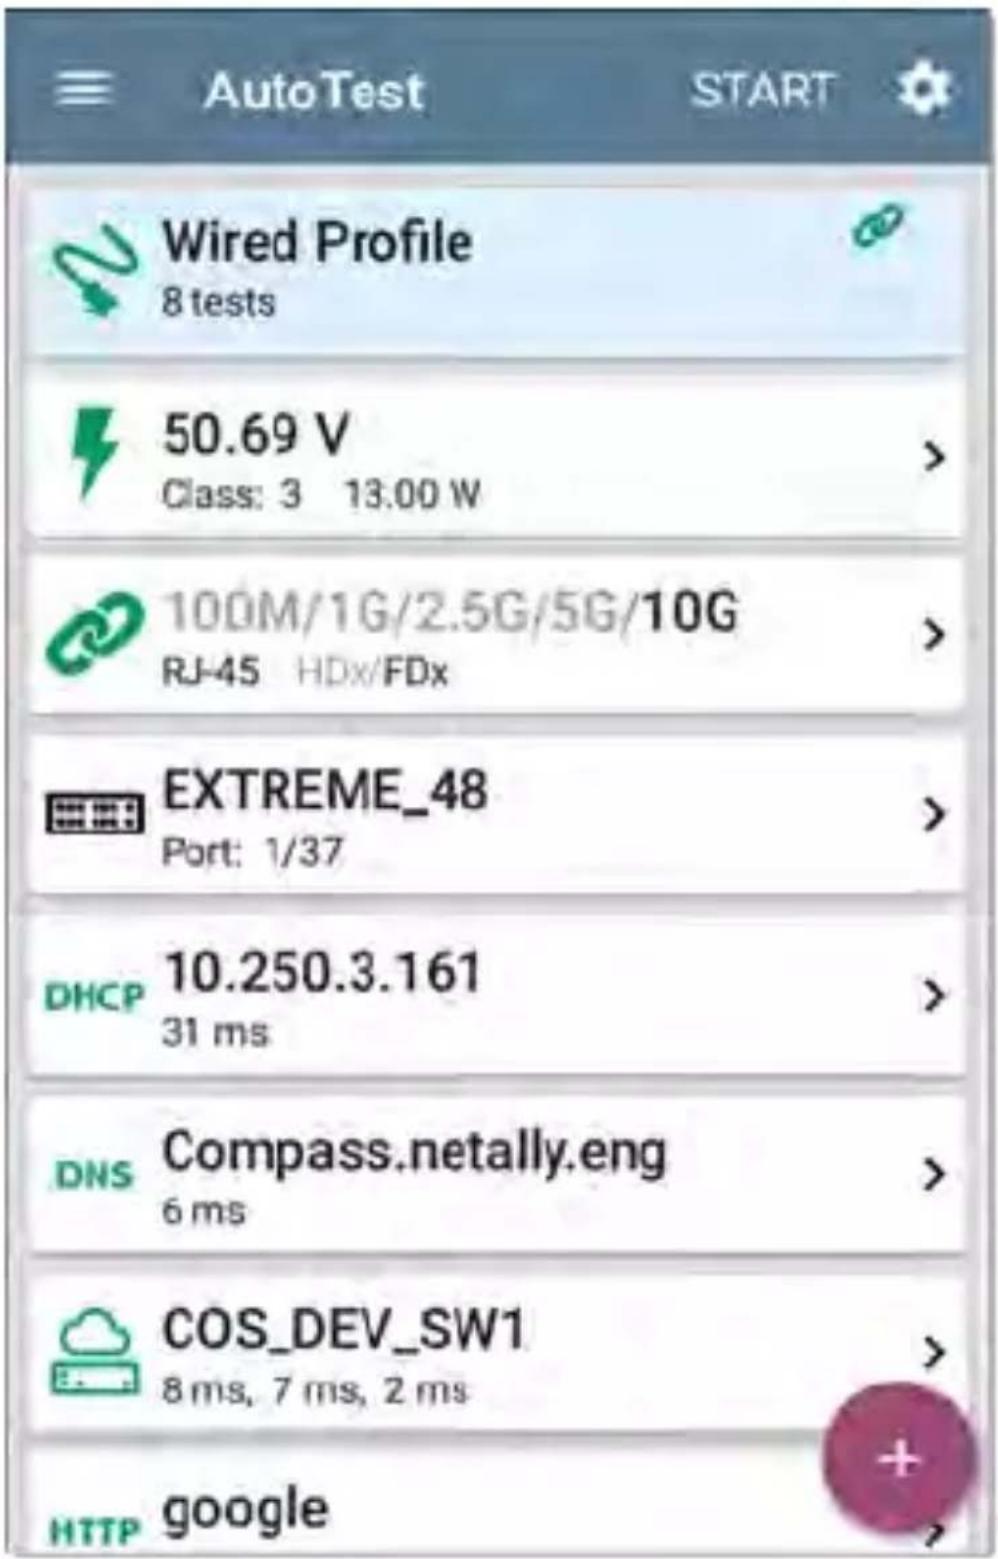
text_image
AutoTest START Wired Profile 8 tests 50.69 V Class: 3 13.00 W 100M/1G/2.5G/5G/10G RJ-45 HDx/FDx EXTREME_48 Port: 1/37 DHCP 10.250.3.161 31 ms DNS Compass.netally.eng 6 ms COS_DEV_SW1 8 ms, 7 ms, 2 ms HTTP googleOn the Wired Profile screens, you can perform these actions:
- Touch any of the test result cards, like PoE, Link, or Switch to open the individual test result screens.
- From any individual test screen, tap the settings icon to go directly to the settings for the current test.
- On the individual test screens, touch blue underlined links to open a Discovery app Details screen showing the selected device or ID.
NOTE: You may need to Configure SNMP settings in the Discovery app to see all the available information about a network component, such as name and port information.
- Touch other BLUE LINKS or the blue action overflow icon at the bottom of the test results screens for additional actions.
NOTE: Blue links and action icons do not appear on every test results screen, and if the active connection is dropped, you may
need to rerun the Profile to re-establish link and enable additional actions.

PoE Test Results

text_image
53.15 V Class: 0 13.00 WThe card for the Power over Ethernet (PoE) tests displays the measured Voltage, Class, and Wattage.
Refer to PoE Settings if needed.
Touch the card to open the PoE results screen
PoE Test Results Screen
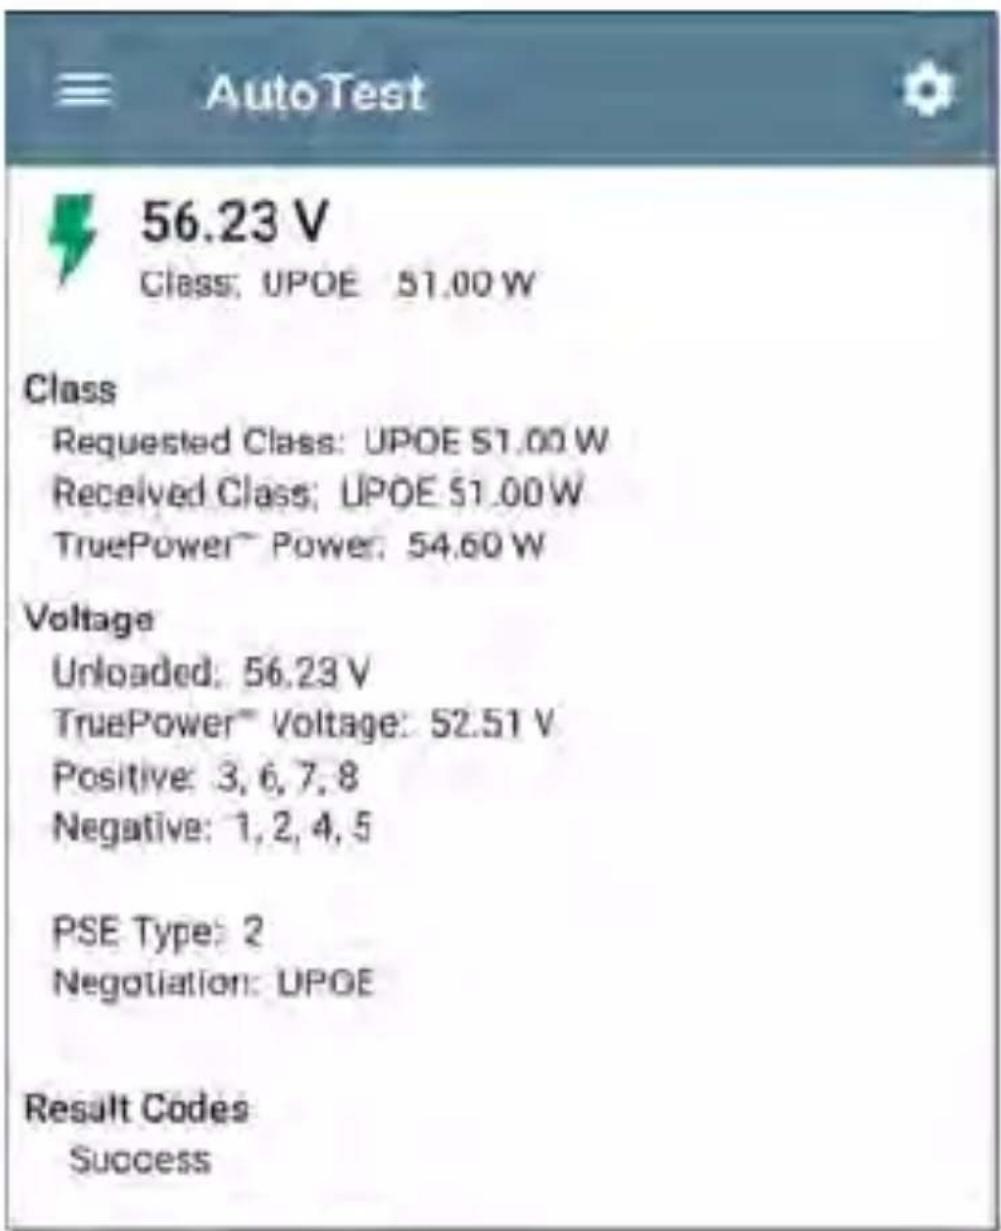
text_image
AutoTest 56.23 V Class: UPOE 51.00 W Class Requested Class: UPOE 51.00 W Received Class: UPOE 51.00 W TruePower~ Power: 54.60 W Voltage Unloaded: 56.23 V TruePower~ Voltage: 52.51 V Positive: 3, 6, 7, 8 Negative: 1, 2, 4, 5 PSE Type: 2 Negotiation: UPOE Result Codes SuccessIn addition to the information from the PoE card, the PoE test screen shows these results:
Class
Requested Class: Class selected in the PoE test settings
Received Class: Class acknowledgment received from the switch
TruePower™ Power: Measured wattage with load.
NOTE: The PoE card displays additional TruePower™ results only if TruePower is enabled in the Wired Profile PoE Settings.
Voltage
Unloaded: Measured voltage without load
TruePower™ Voltage: Measured voltage with load
Positive: Positive PoE cable pair IDs
Negative: Negative PoE cable pair IDs
PSE Type: Switch's advertised Power Sourcing Equipment (PSE) type. Recognized types are 1 – 4, LTPoE++, Cisco UPOE, and PoE Injectors. PSE supporting UPOE are classified under Type 2. If the type cannot be determined, "1/2" is displayed.
Negotiation: Negotiation status for UPOE and Class 4 (UPOE or LLDP)
Result Codes: Final status of the test (Success or Failure)

Wired Link Test Results
The Wired Link card indicates whether you can connect to an active network switch.

text_image
100M/1G/2.5G/SG/10G RJ-45 HDx/FDx >The Link test card for a copper Ethernet connection displays the advertised speed and duplex capabilities in gray text and the detected speed and duplex in black text.
LinkRunner can test and display information for link speeds up to 10G.

text_image
10G SFP+ FDx >For a Fiber connection, the Link test card shows the connection speed and duplex.
The link icon turns yellow (displays a Warning) under the following conditions:
- LinkRunner has linked at a speed slower than the maximum advertised speed.
- The link is using half duplex.
- For links faster than 1G, LinkRunner has detected a minimum SNR value below the set threshold.
Touch the card to open the Link test screen.
Wired Link Test Screen
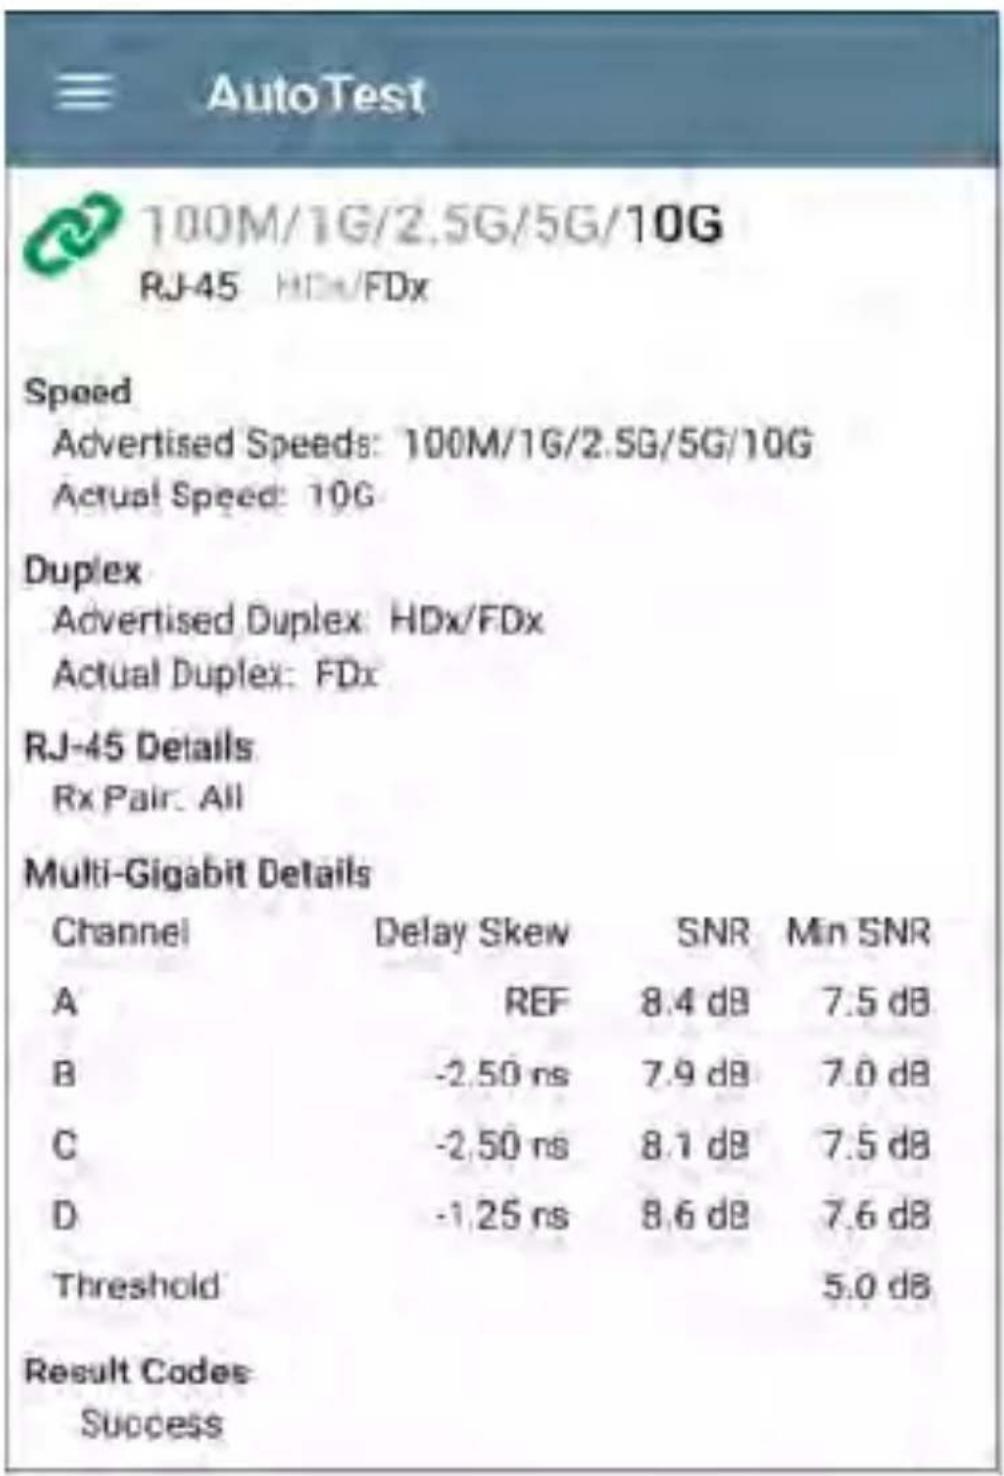
text_image
AutoTest 100M/1G/2.5G/5G/10G RJ-45 HDx/FDx Speed Advertised Speeds: 100M/1G/2.5G/5G/10G Actual Speed: 10G Duplex Advertised Duplex: HDx/FDx Actual Duplex: FDx RJ-45 Details Rx Pair: All Multi-Gigabit Details Channel Delay Skew SNR Min SNR A REF 8.4 dB 7.5 dB B -2.50 ns 7.9 dB 7.0 dB C -2.50 ns 8.1 dB 7.5 dB D -1.25 ns 8.6 dB 7.6 dB Threshold 5.0 dB Result Codes SuccessThe Wired Link test screen shows the following
Speed
Advertised Speed: Speed capability as reported by the switch
Actual Speed: Link speed as measured by LinkRunner 10G
Duplex
Advertised Duplex: Duplex capabilities reported by the switch
Actual Duplex: Duplex in use as detected by LinkRunner
RJ-45 Details (Copper)
Rx Pair: Link receive pair
Multi-Gigabit Details (Copper)
This table appears only when the Wired Profile is linked at speeds higher than 1G. Each twice pair channel is graded based on the minimum SNR observed. Data in the table updates each second as long as the link persists.
Channel: Channels A, B, C, and D representing the twisted pairs in the cable
Delay Skew: Difference in propagation delay between sets of wired pairs. Channel A acts as the reference for the other channel measurements.
SNR: Current signal-to-noise ratio on each channel
Min SNR: Lowest SNR measurement since link was established
Threshold: Multi-Gigabit SNR Threshold from the Wired Connection settings
SFP Details (Fiber)
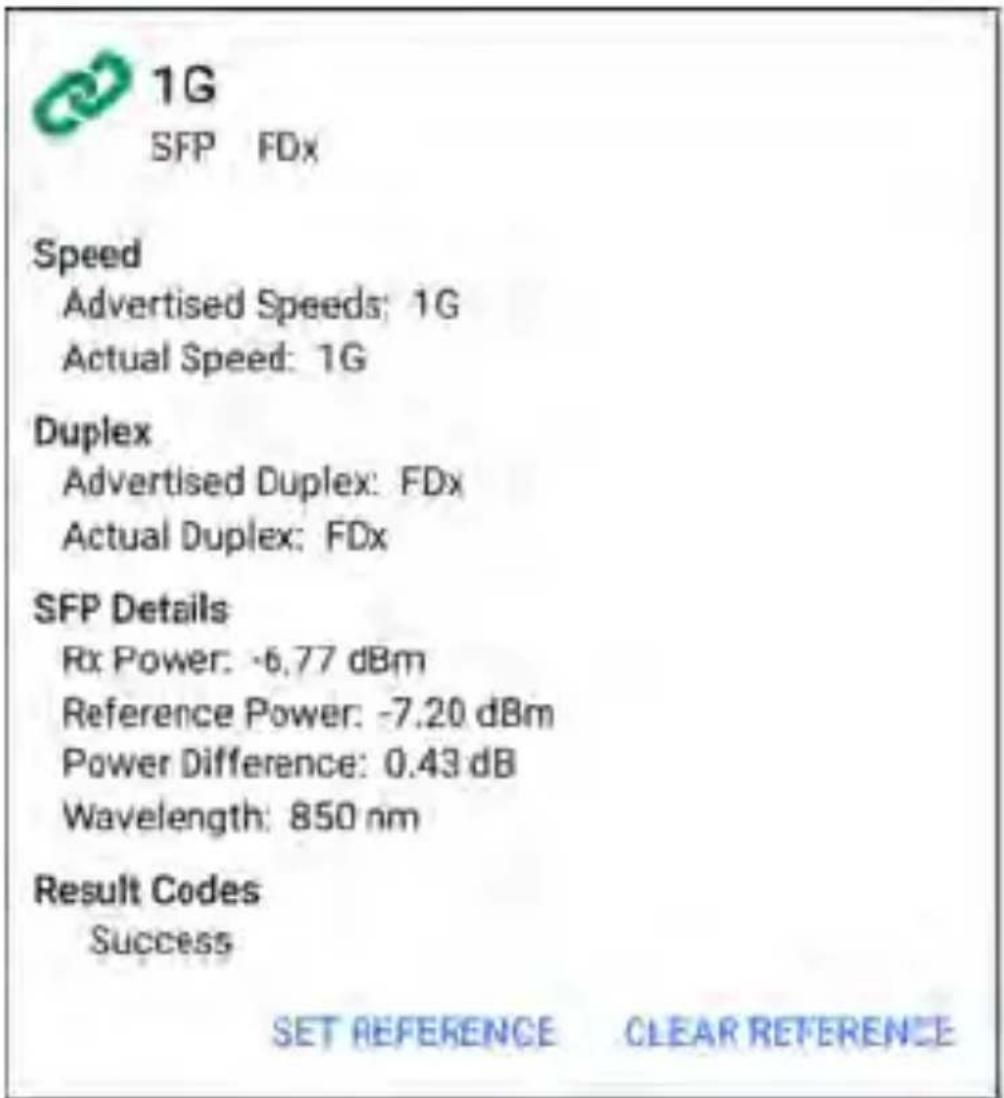
text_image
1G SFP FDx Speed Advertised Speeds: 1G Actual Speed: 1G Duplex Advertised Duplex: FDx Actual Duplex: FDx SFP Details Rx Power: -6.77 dBm Reference Power: -7.20 dBm Power Difference: 0.43 dB Wavelength: 850 nm Result Codes Success SET REFERENCE CLEAR REFERENCERx Power: Link receive power
Reference Power: The user can set a Reference Power by pressing the SET REFERENCE button. This will remember the current Rx Power as the reference. This value will be saved until cleared via the CLEAR REFERENCE button. It is saved across reboots.
Power Difference: The difference between the current Rx Power and the reference. It will be positive if the current value is greater than the reference value.
Wavelength: Wavelength (in nanometers) at which the fiber connection is operating
Results Codes: Final status of the test (Success or Failure)
802.1X Test Results
The 802.1X test card only displays if the 802.1X setting is enabled in the Wired Profile Settings.

text_image
802 IX PEAP MSCHAP V2 User: gates1The card shows the EAP type selected in the Wired Connection settings and the username or certificate used. The 802.1X icon turns green if the connection is successful and yellow if 802.1X authentication fails.
802.1X Test Screen
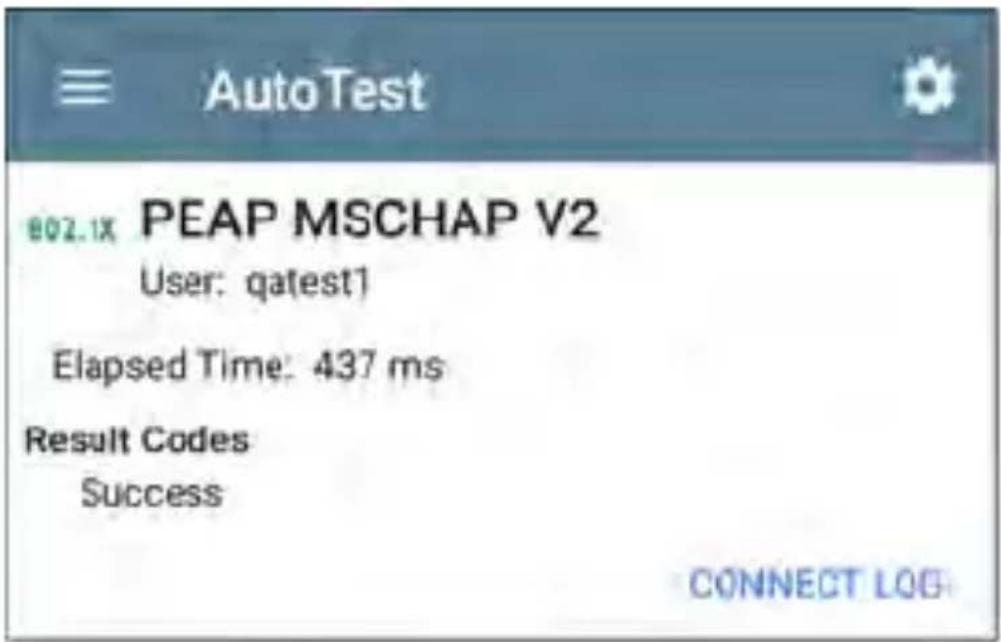
text_image
AutoTest 802.1X PEAP MSCHAP V2 User: qatest1 Elapsed Time: 437 ms Result Codes Success CONNECT LOGThe 802.1X screen also shows the time it took for the authentication process to complete along with Result Codes.
Tap the blue CONNECT LOG link to view the 802.1X Connect Log.
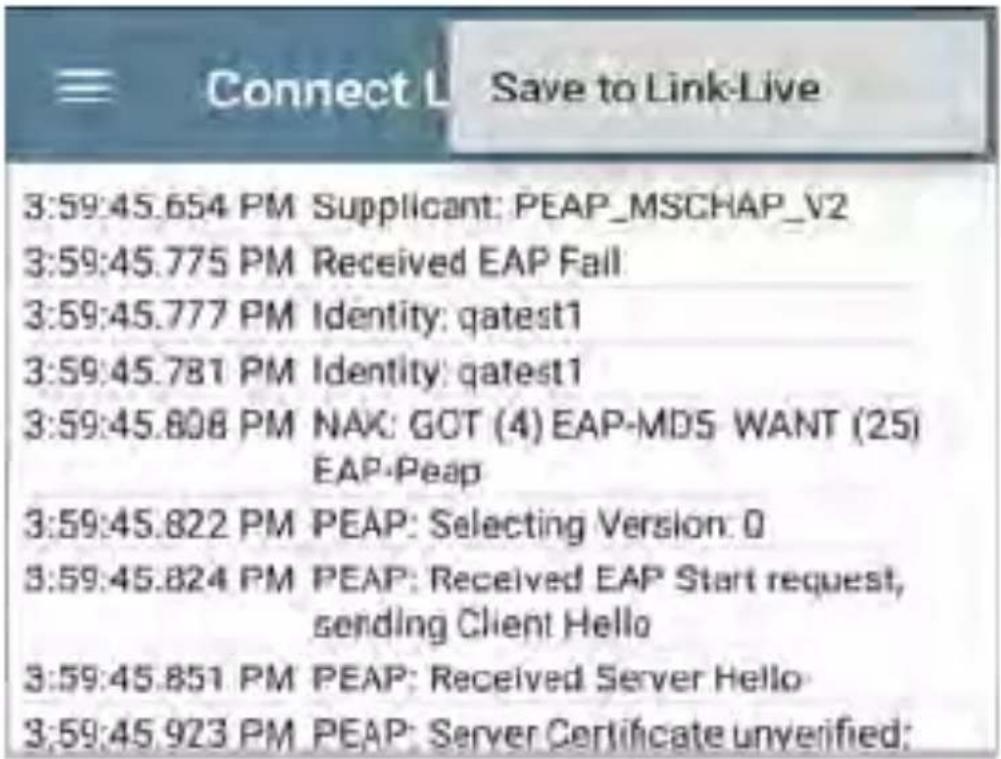
text_image
3:59:45.654 PM Supplicant: PEAP_MSCHAP_V2 3:59:45.775 PM Received EAP Fail 3:59:45.777 PM Identity: qatest1 3:59:45.781 PM Identity: qatest1 3:59:45.808 PM NAX: GOT (4) EAP-MDS WANT (25) EAP-Peap 3:59:45.822 PM PEAP: Selecting Version: 0 3:59:45.824 PM PEAP: Received EAP Start request, sending Client Hello 3:59:45.851 PM PEAP: Received Server Hello 3:59:45.923 PM PEAP: Server Certificate unverified:Select the action overflow icon at the top right on the Connect Log screen to attach the log to its associated AutoTest result on the Link-Live website. You can also attach the Connect Log from the floating action menu on the main Wired Profile screen.
VLAN Test Results
The VLAN card only displays if the VLAN setting is enabled in the Wired Profile Settings or if AutoTest detects VLAN-tagged traffic.
VLAN 508, Best Effort (0)
Top: Untagged
The top line on the VLAN test card shows the configured VLAN settings (image above) or "Untagged" (image below) if VLAN disabled but VLAN-tagged traffic is seen.
VIAN Untagged
Top: Untagged, 560, 508, 2510, 811, 525, 526...
Untagged indicates that no VLAN tag is present in either received or transmitted frames, also referred to as the Native VLAN.
The second line on the VLAN card displays the top VLANs with the most detected traffic.
Touch the card to open the full VLAN screen.
VLAN Test Screen
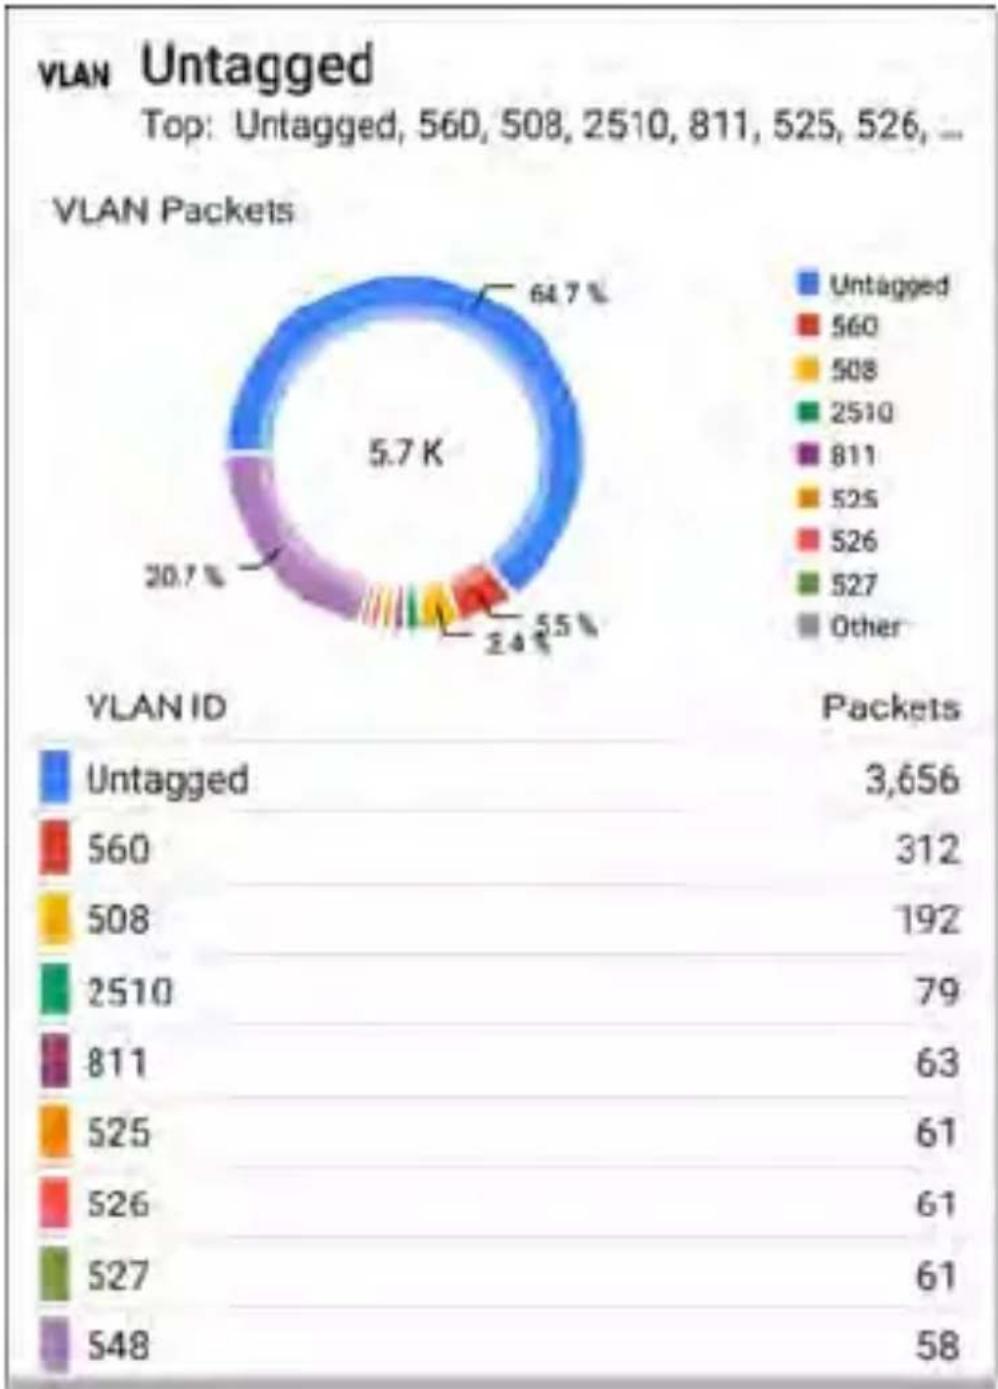
pie
VLAN Untagged Top: Untagged, 560, 508, 2510, 811, 525, 526, ... VLAN Packets YLAN ID Packets 5.7K 64.7% 20.7% 2.4% 5.5% 560 508 2510 811 525 526 527 548 3,656 312 192 79 63 61 61 61 58The VLAN test screen displays the real-time traffic the LinkRunner detects on the top VLANs. Up to nine VLANs with the highest traffic are displayed as colored portions of the pie chart. The table on the lower part of the VLAN screen lists all the VLANs seen.
Switch Test Results
The results available for the Switch Test are based on Discovery Protocol advertisements and SNMP system group information. SNMP forwarding table data is used to determine the Nearest Switch. See Discovery Settings for SNMP configuration instructions.

text_image
COS_DEV_SW1 Port: GigabitEthernet1/0/13The Switch test card displays the Nearest Switch and the port name. The Switch icon remains black if the test is successful.
- If the LinkRunner does not detect any network traffic moving through the switch after 45 seconds, the switch icon turns yellow.

text_image
DEMO_KIT_SW_3 Port: g7- If the connection is lost while the Wired Autotest is running, the switch icon turns red.

text_image
Nearest Switch Port: —- If the LinkRunner was unable to identify the nearest switch, "Nearest Switch Not Found" displays on the Switch card.

text_image
Nearest Switch Not Found Port: -The LinkRunner continues to search for the nearest switch, even after the AutoTest completes.
Touch the Switch card to open the full switch results screen.
Switch Test Results Screen
Information on the Switch Test screen is organized by the order in which it was
received, either via Discovery Protocol advertisements or SNMP.
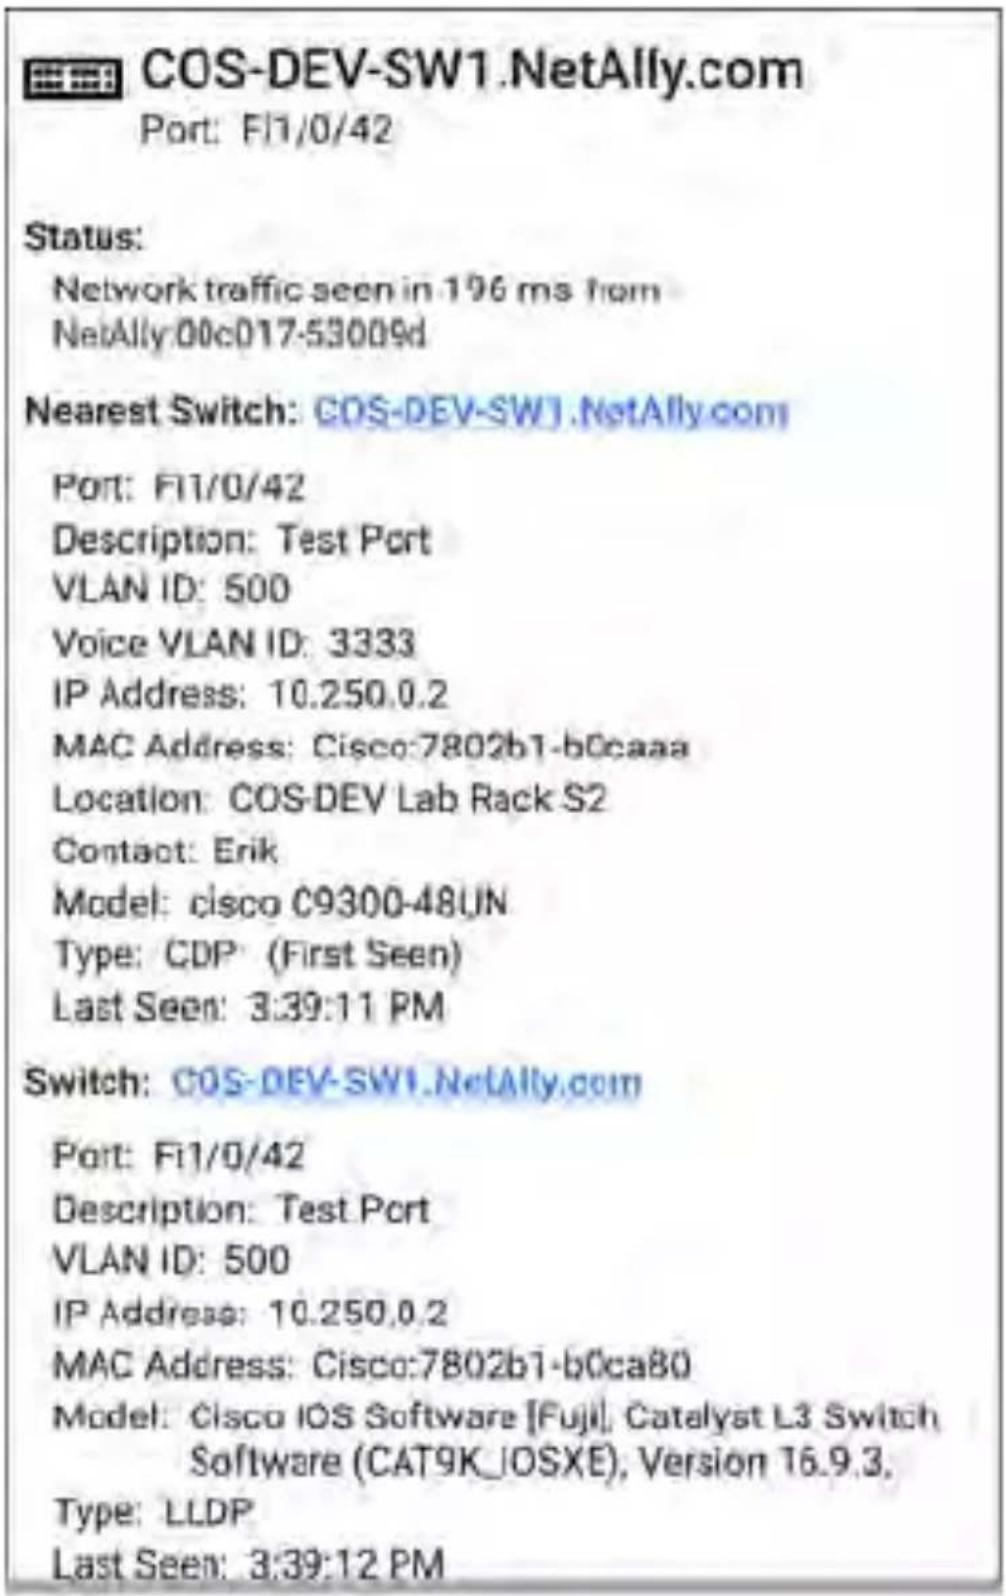
text_image
COS-DEV-SW1.NetAlly.com Port: F11/0/42 Status: Network traffic seen in 196 ms from NetAlly:00c017-53009d Nearest Switch: COS-DEV-SW1.NetAlly.com Port: F11/0/42 Description: Test Port VLAN ID: 500 Voice VLAN ID: 3333 IP Address: 10.250.0.2 MAC Address: Cisco:7802b1-b0caaa Location: COS-DEV Lab Rack S2 Contact: Erik Model: cisco C9300-48UN Type: CDP (First Seen) Last Seen: 3:39:11 PM Switch: COS-DEV-SW1.NetAlly.com Port: F11/0/42 Description: Test Port VLAN ID: 500 IP Address: 10.250.0.2 MAC Address: Cisco:7802b1-b0ca80 Model: Cisco IOS Software [Fuji], Catalyst L3 Switch Software (CAT9K_IOSXE), Version 16.9.3, Type: LLDP Last Seen: 3:39:12 PMEach section represents a unique port advertisement as defined by protocol type and MAC address.
The switch results screen shows the following data fields:
Status: Time elapsed after link was established before network traffic was received from the switch. The MAC address of the device that ser the packet is also shown.
Nearest Switch: Name of the switch determined to be closest to the LinkRunner
Port: Detected Port name
Description: Configured description reported by the switch
VLAN ID: VLAN ID number (if present)
Voice VLAN ID: Voice VLAN ID number (if present)
IP and MAC Addresses: Discovered switch addresses
Location: Configured location reported by the switch. This field only appears if the
LinkRunner has SNMP access to the Nearest Switch.
Contact: Configured contact person reported by the switch. This field only appears if the LinkRunner has SNMP access to the Nearest Switch.
Model: Switch model name and/or number
Type: Discovery Protocol - CDP, LLDP, EDP, FDP, or SNMP. (First Seen) displays next to the protocol type first seen by the LinkRunner.
Last Seen: For non-SNMP discovery protocols (CDP, LLDP, EDP, or FDP), the time the advertisement was last received by the LinkRunner
Last Updated: For SNMP only, the time the information was gathered from SNMP tables SNMP information, if available, appears at the bottom of the screen once the discovery process has acquired relevant data.
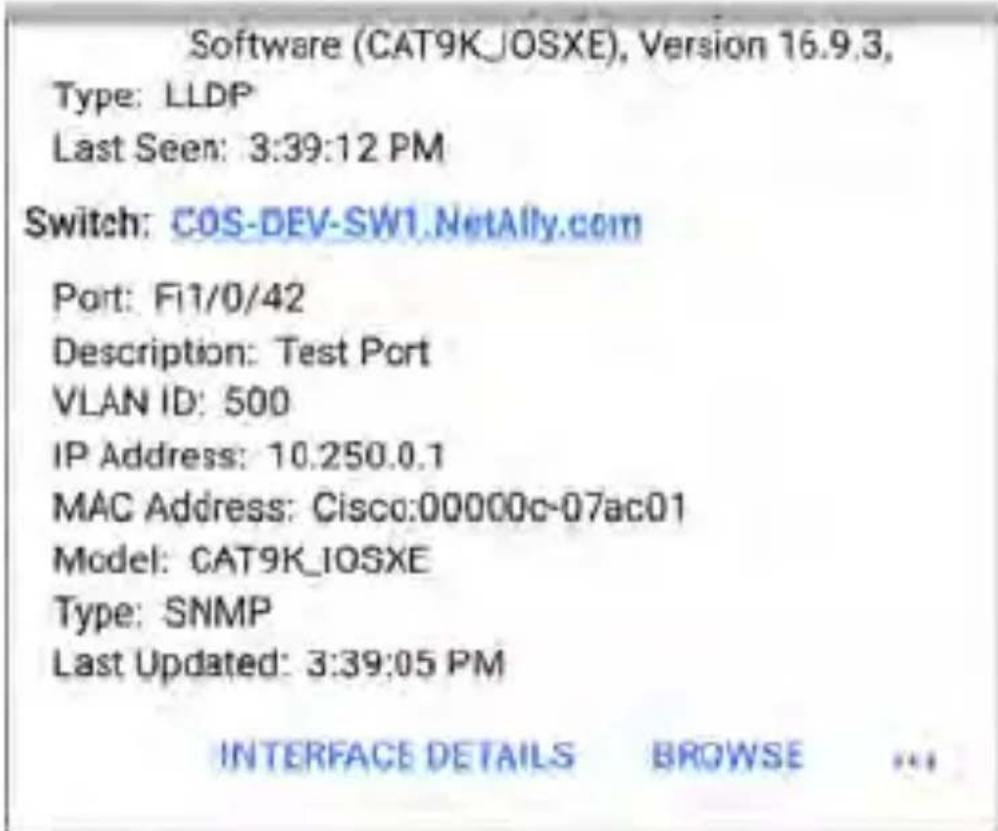
text_image
Software (CAT9KIOSXE), Version 16.9.3, Type: LLDP Last Seen: 3:39:12 PM Switch: COS-DEV-SW1.NetAlly.com Port: Fi1/0/42 Description: Test Port VLAN ID: 500 IP Address: 10.250.0.1 MAC Address: Cisco:00000c-07ac01 Model: CAT9KIOSXE Type: SNMP Last Updated: 3:39:05 PM INTERFACE DETAILS BROWSESwitch: Below the Nearest Switch, other switches seen via advertisements or SNMP
At the bottom of the switch test screen, touch the blue links or the action overflow icon to open other apps or tools with the target (in this case, the Nearest Switch) pre-populated.
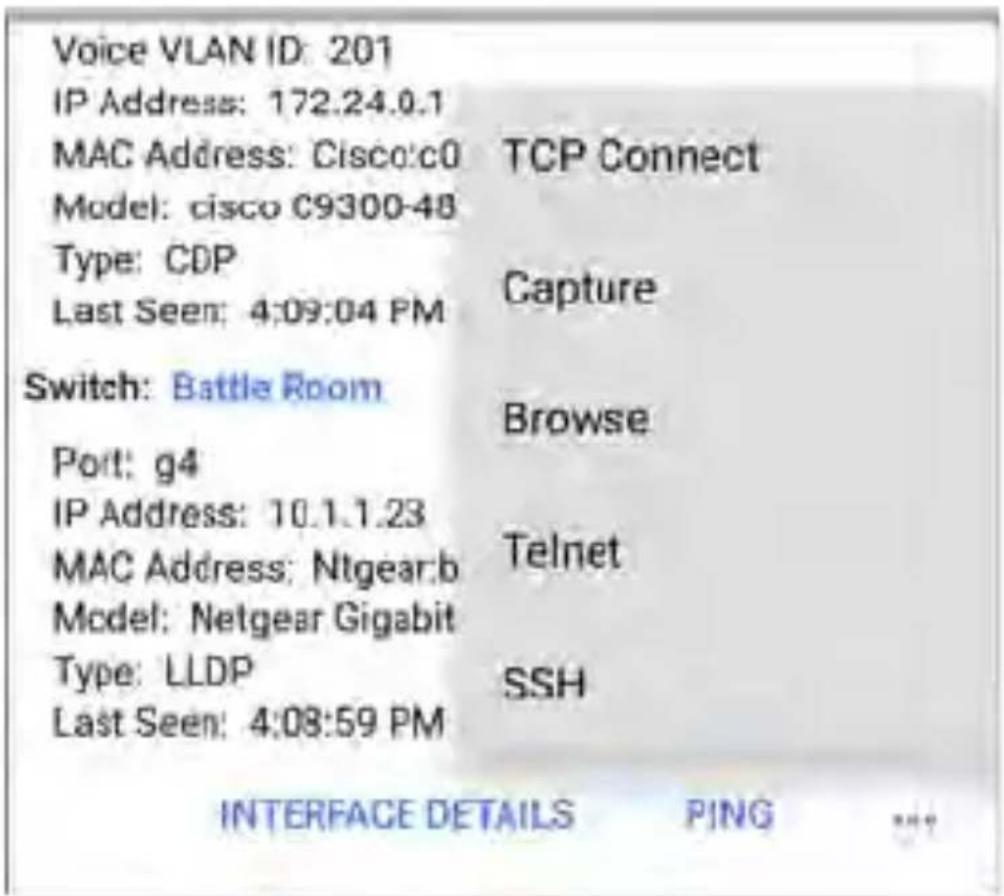
text_image
Voice VLAN ID: 201 IP Address: 172.24.0.1 MAC Address: Cisco:c0 TCP Connect Model: cisco C9300-48 Type: CDP Capture Last Seen: 4:09:04 PM Switch: Battle Room Browse Port: g4 IP Address: 10.1.1.23 Telnet MAC Address: Ntgear:b Model: Netgear Gigabit Type: LLDP SSH Last Seen: 4:08:59 PM INTERFACE DETAILS PING ...For example, INTERFACE DETAILS opens the Interface Details screen for the Switch Port in the Discovery app.
NOTE: The Interface Details action link only appears in the Switch results if LinkRunner has current Discovery data, and AutoTest was able to identify the nearest switch and connected interface.
The Ping, TCP Connect, and Capture selections open the corresponding NetAlly apps, populated with the switch's address. Browse
opens Google Chrome, and Telnet or SSH open the JuiceSSH app.
DHCP, DNS, and Gateway Results
See DHCP, DNS, and Gateway Tests.
PING FTP TCP HTTP Target Tests
See the Test Targets topic for information on target test results.
Wired Profile FAB
The floating action button (FAB) on AutoTest Profile screens allows you to add Test Targets to the Profile, as well as attach comments, an image, and an 802.1X Connection Log to this AutoTest result on the Link-Live website.
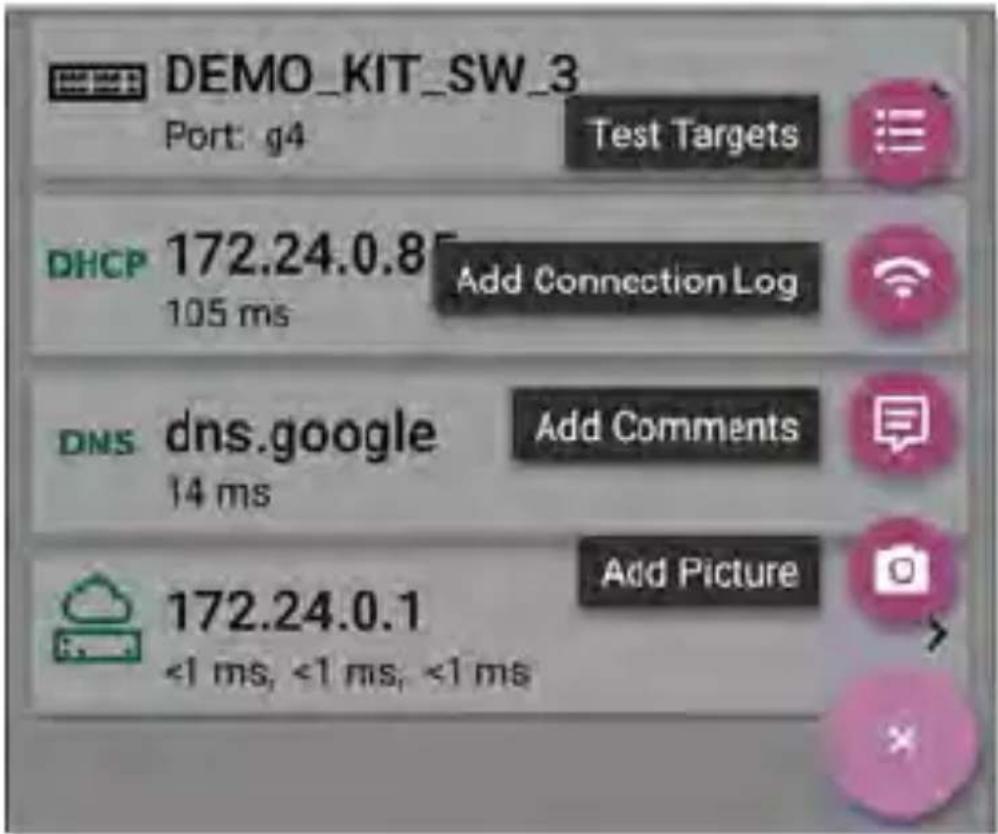
text_image
DEMO_KIT_SW_3 Port: g4 Test Targets DHCP 172.24.0.8 105 ms Add Connection Log DNS dns.google Add Comments 14 ms 172.24.0.1 <1 ms, <1 ms, <1 ms Add Picture- The Test Targets option opens the Test Targets screen, where you can add Ping, TCP Connect, HTTP, and FTP target tests to the current profile.
- Add Connection Log opens a Link-Live sharing screen that allows you to custom name the log file before saving to the test result.
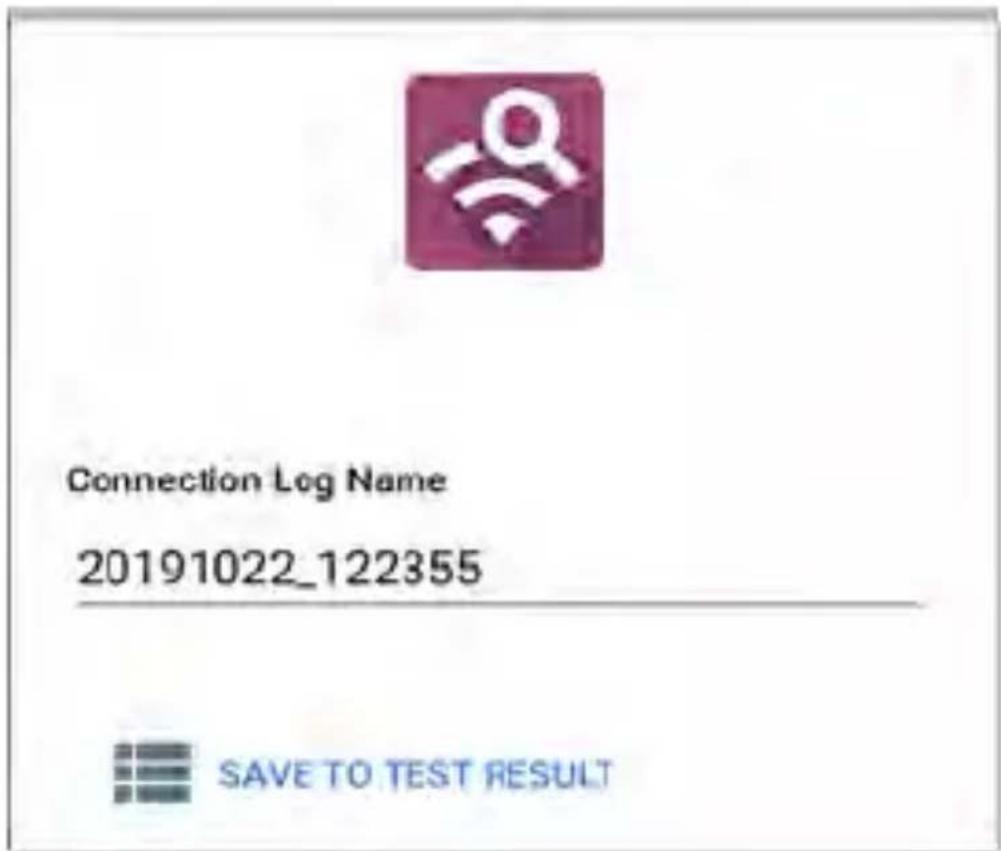
text_image
Connection Log Name 20191022_122355 SAVE TO TEST RESULTTouch the field to enter your desired log name, and tap SAVE TO TEST RESULT to upload.
- Add Comments also opens a Link-Live sharing screen where you can enter comments.
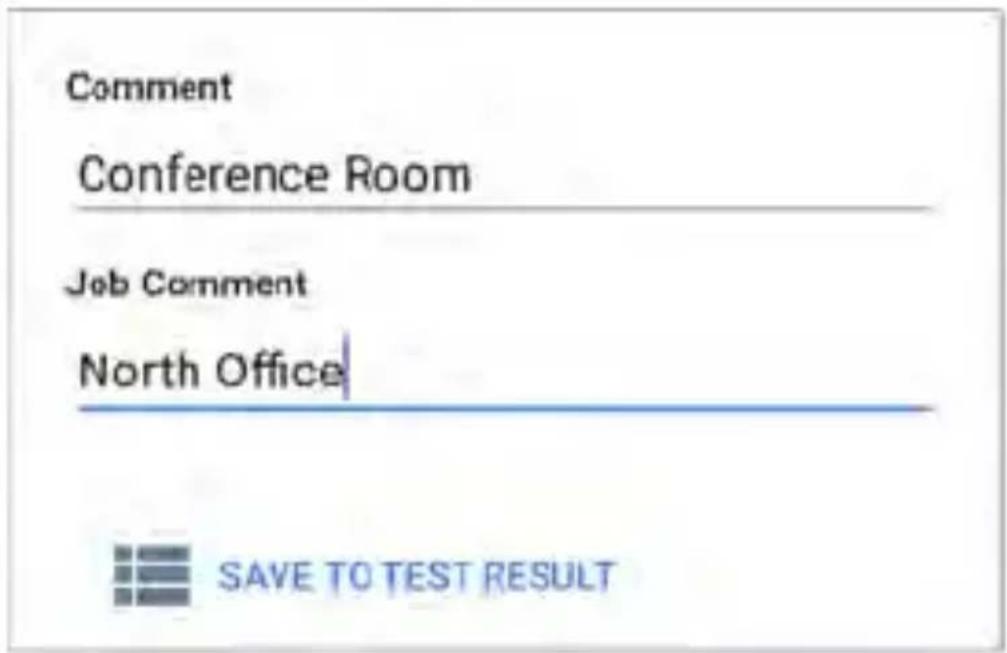
text_image
Comment Conference Room Job Comment North Office SAVE TO TEST RESULTTouch the fields to enter your desired comments, and tap SAVE TO LAST TEST RESULT to upload them.
- The Add Picture function lets you open the Gallery or Camera app to select or take a photo that is then uploaded and attached to your test result.
See the Link-Live App chapter to learn about Link-Live and uploading.
Wired Profile Settings
These settings control the wired test port connection, PoE test, the thresholds for
Pass/Warning/Fail results, and any user-added test targets.
Touch the settings icon on the Wired profile screen, or add a new Wired profile, to configure the profile's settings.
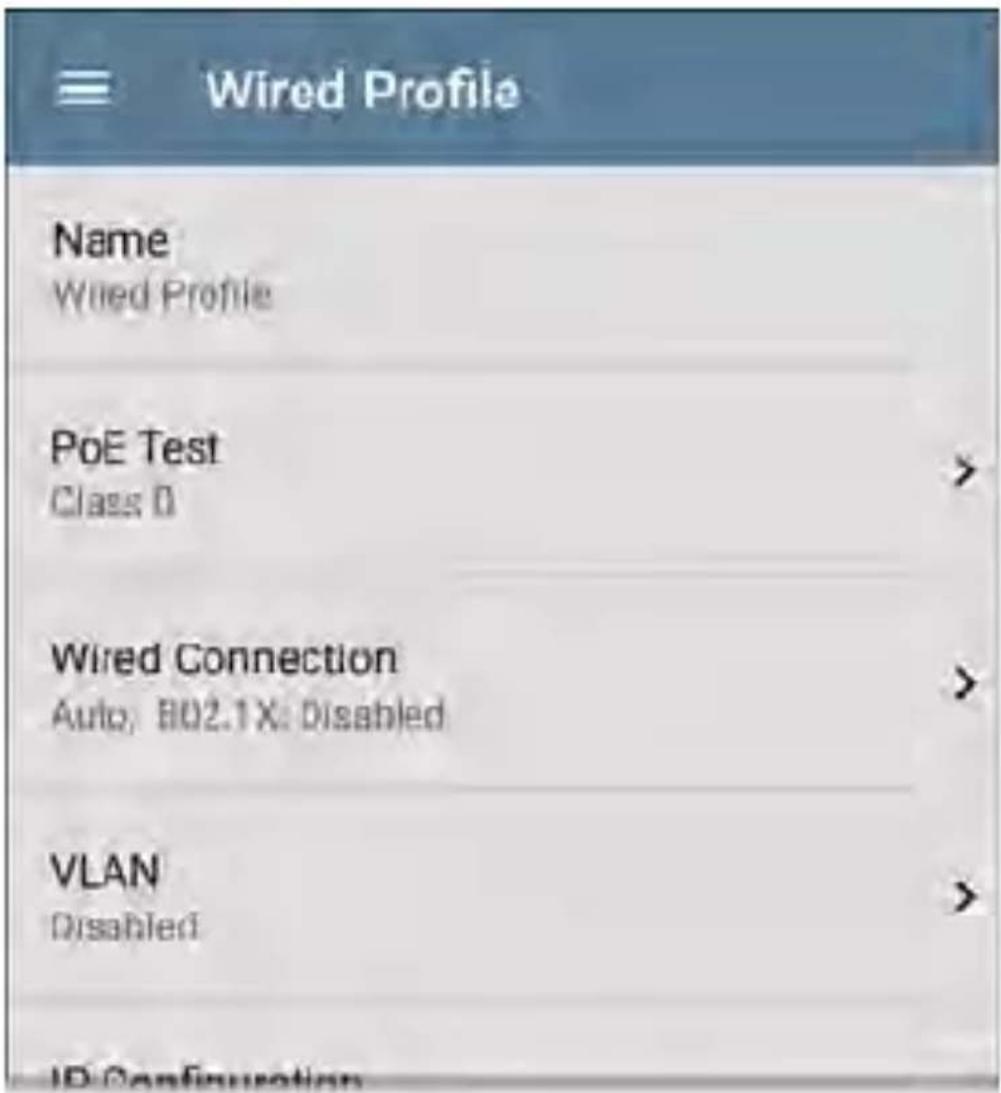
text_image
Wired Profile Name Wired Profile PoE Test Class 0 Wired Connection Auto, B02.1X: Disabled VLAN Disabled IP ConfigurationOn the Wired Profile settings screen, touch each field described below as needed to configure the profile. Changed settings are automatically applied. When you finish configuring, tap the back button to return to the profile.
Name
Touch the Name field to enter a custom name for the profile. This name appears on the main AutoTest screen profile card and the Wired Profile screen header.

PoE Test Settings
Open PoE Test settings to enable or disable Pc and configure the PD Class.
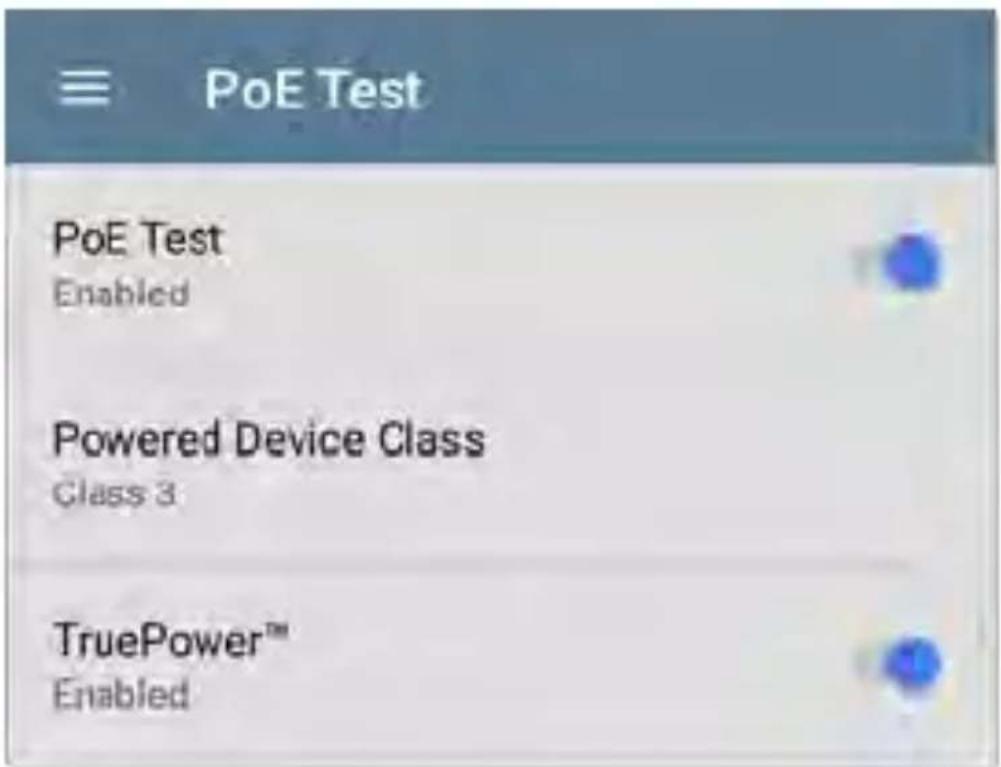
text_image
PoE Test PoE Test Enabled Powered Device Class Class 3 TruePower™ EnabledPoE Test
Touch the toggle button to enable or disable the PoE test portion of the current Wired Profile.
Powered Device Class
Touch to select a PoE class setting to match your switch's (or PoE injector's) available class. LinkRunner supports these classes:
• 802.3af Classes 0-3
• 802.3at PoE+ Class 4
- Cisco's UPOE, which can provide up to 51 W
• 802.3bt Classes 5-8
Select the PoE Injector option if you are using a non-IEEE injector.
NOTE: LinkRunner may not receive the total wattage advertised by your switch or injector because of power loss over the cable.
NOTE: LinkRunner automatically negotiates Cisco UPOE over LLDP, up to 51W. LLDP must be enabled on the switch for
negotiation to succeed. If the UPOE Class is selected on your LinkRunner but LLDP is not enabled on your Cisco switch, negotiation will fail.
LLDP
This toggle button appears if Class 4 (25.50 W) selected. Enable this setting if LLDP is enabled on the switch you are testing. Class 4 LLDP must be enabled on the switch for AutoTest to detect it successfully. If the LLDP setting is enabled but your switch does not support LLDP, negotiation will fail.
Requested Power (W)
This setting appears if UPOE is selected in the Powered Device Class setting shown above or the Powered Device Class is set to PoE Injecto and TruePower is enabled. Touch to enter a Requested Power other than the default, if needed. If you touch the backspace button on the pop-up number pad and clear the default value, the valid power range is displayed.
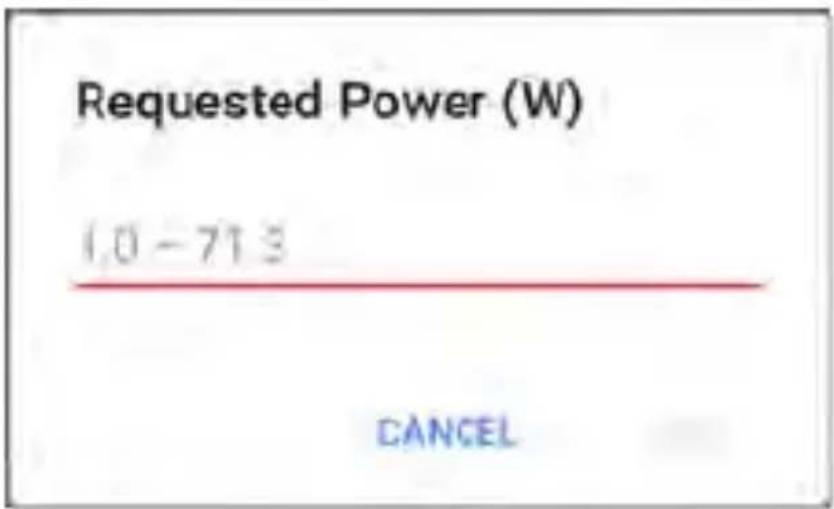
text_image
Requested Power (W) 1.0 - 713 CANCELTruePower™
TruePower validates that the Switch (Power Sourcing Equipment) and cabling can provide the requested power under load by applying a load equivalent to the selected class to mimic Powered Device (PD). Tap the toggle button to enable the TruePower feature.
General Settings that Affect PoE
See the Wired section in General Settings for a description of the Test PoE before Link setting

Wired Connection Settings
Open Wired Connection settings to configure speed and duplex.
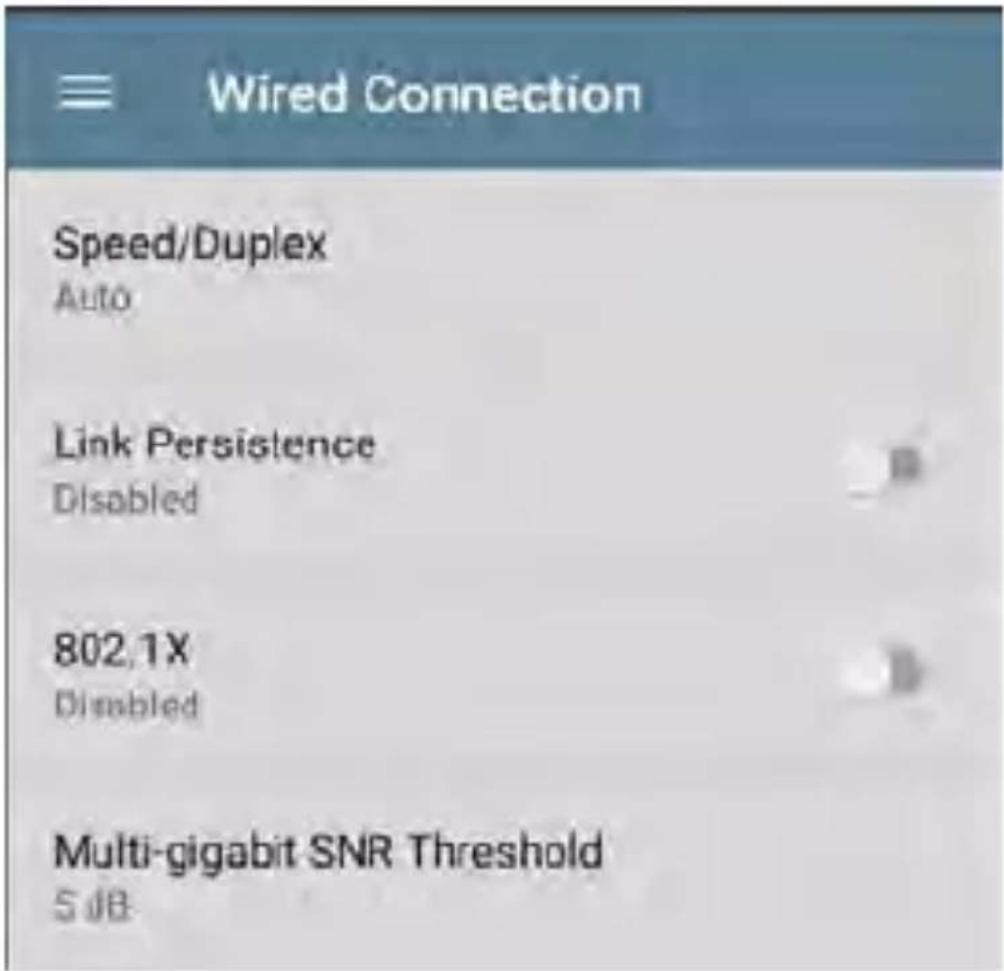
text_image
Wired Connection Speed/Duplex Auto Link Persistence Disabled 802.1X Disabled Multi-gigabit SNR Threshold SUBLink Persistence
Link Persistence controls product behavior prior to link and also after link goes down.
Link Persistence and Establishing Link: When enabled there is no timeout on how long to wait for link to be established. When disabled the link step will fail if not successful in 25 to 30 seconds.
Link Persistence and Link Dropping: When enabled and link drops, the product will attempt to relink. When disabled and link
drops, the profile will be considered done and no further link attempts will be done until a Wired Profile is run again.
The default setting for Link Persistence is disabled.
Speed/Duplex
Touch to select the speed and duplex option that you want to test your network against. The default is Auto negotiation.
When speed is set to Auto, LinkRunner auto-negotiates to the highest possible speed/duplex supported by the link partner. You can select a fixed speed/duplex for the copper interface. For 10 and 100Mbps you can optionally force the speed and duplex.
This setting does not force the link speed/-duplex on the fiber interface, but does control which speed is attempted first when using a multi-rate SFP. As a result, this setting can enable the EtherScope to connect faster via fiber.
802.1X
Touch the toggle field to enable wired 802.1X authentication in the current Profile. Enabling this setting also enables an 802.1X test card or the Wired AutoTest results screen.
The following settings appear when 802.1X authentication is enabled. Enter all necessary credentials, such as EAP type, username and password, or certificate.
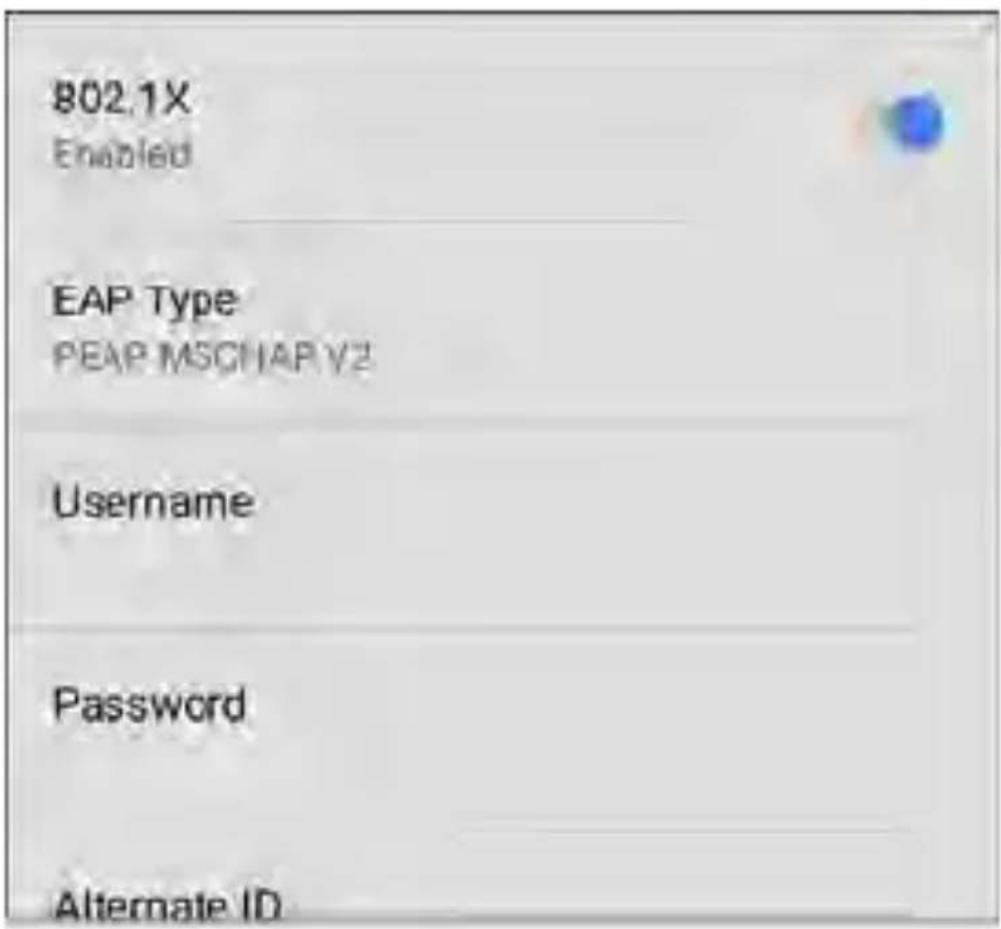
text_image
802.1X Enabled EAP Type PEAP MSCHAP V2 Username Password Alternate IDEAP Type
Touch to select a different EAP type if needed. The default is PEAP MSCHAP V2.
Certificate
This setting appears if one of the following EAI types is selected in the setting above: EAP TLS PEAP TLS, or TTLS EAP TLS.
See How to Import a Certificate.
Username
This field appears along with multiple authentication types. Touch the Username field to enter your username.
Password
This field appears along with multiple authentication types. Touch the Password field to enter the network password.
Alternate ID
Enter an Alternate ID if necessary. This is an Advanced Authentication setting.
Multi-gigabit SNR Threshold
When a Wired Profile links at speeds higher than 1 Gbps, a table appears on the Link Test screenshot showing Multi-gigabit Details. This threshold grades SNR measurements on the four twisted pairs. A Minimum SNR below the selected threshold will display a yellow warning condition. The default is 5 dB.
VLAN Settings
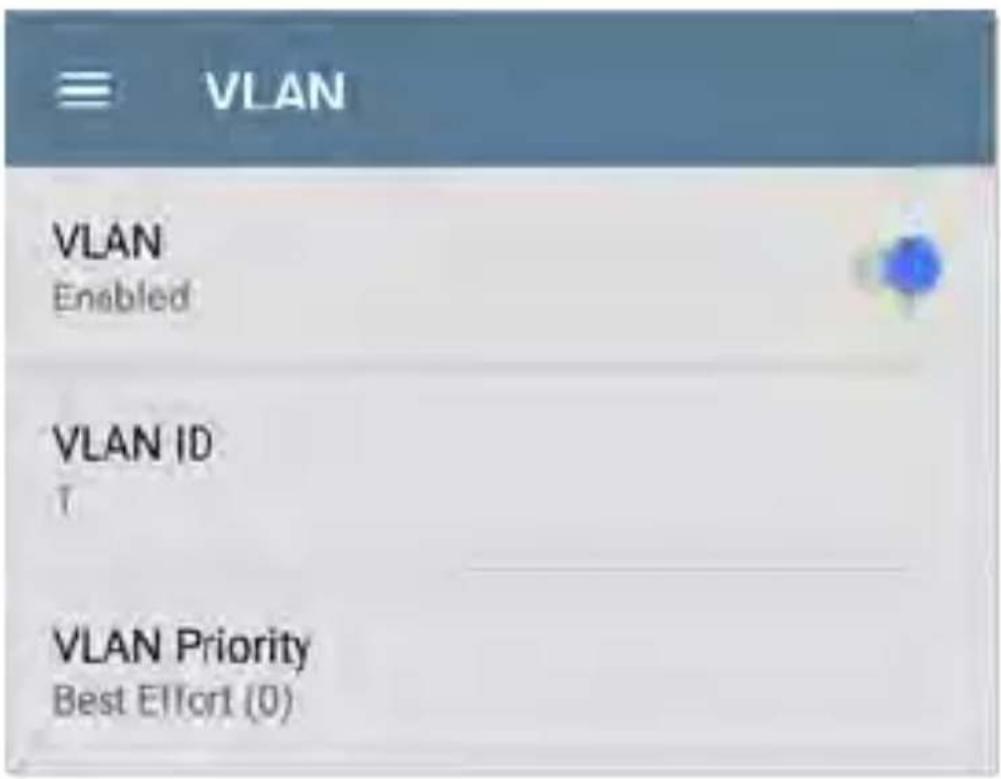
text_image
VLAN VLAN Enabled VLAN ID T VLAN Priority Best Effort (0)Touch to open the VLAN settings screen. Slide the toggle to the right to enable VLAN testing. Enabling this setting also enables a VLAN test
card on the Wired AutoTest results screen. Onc enabled, VLAN ID and VLAN Priority fields appear. Touch these fields to open a pop-up number pad and enter the correct ID and priority. Touch OK to save them.
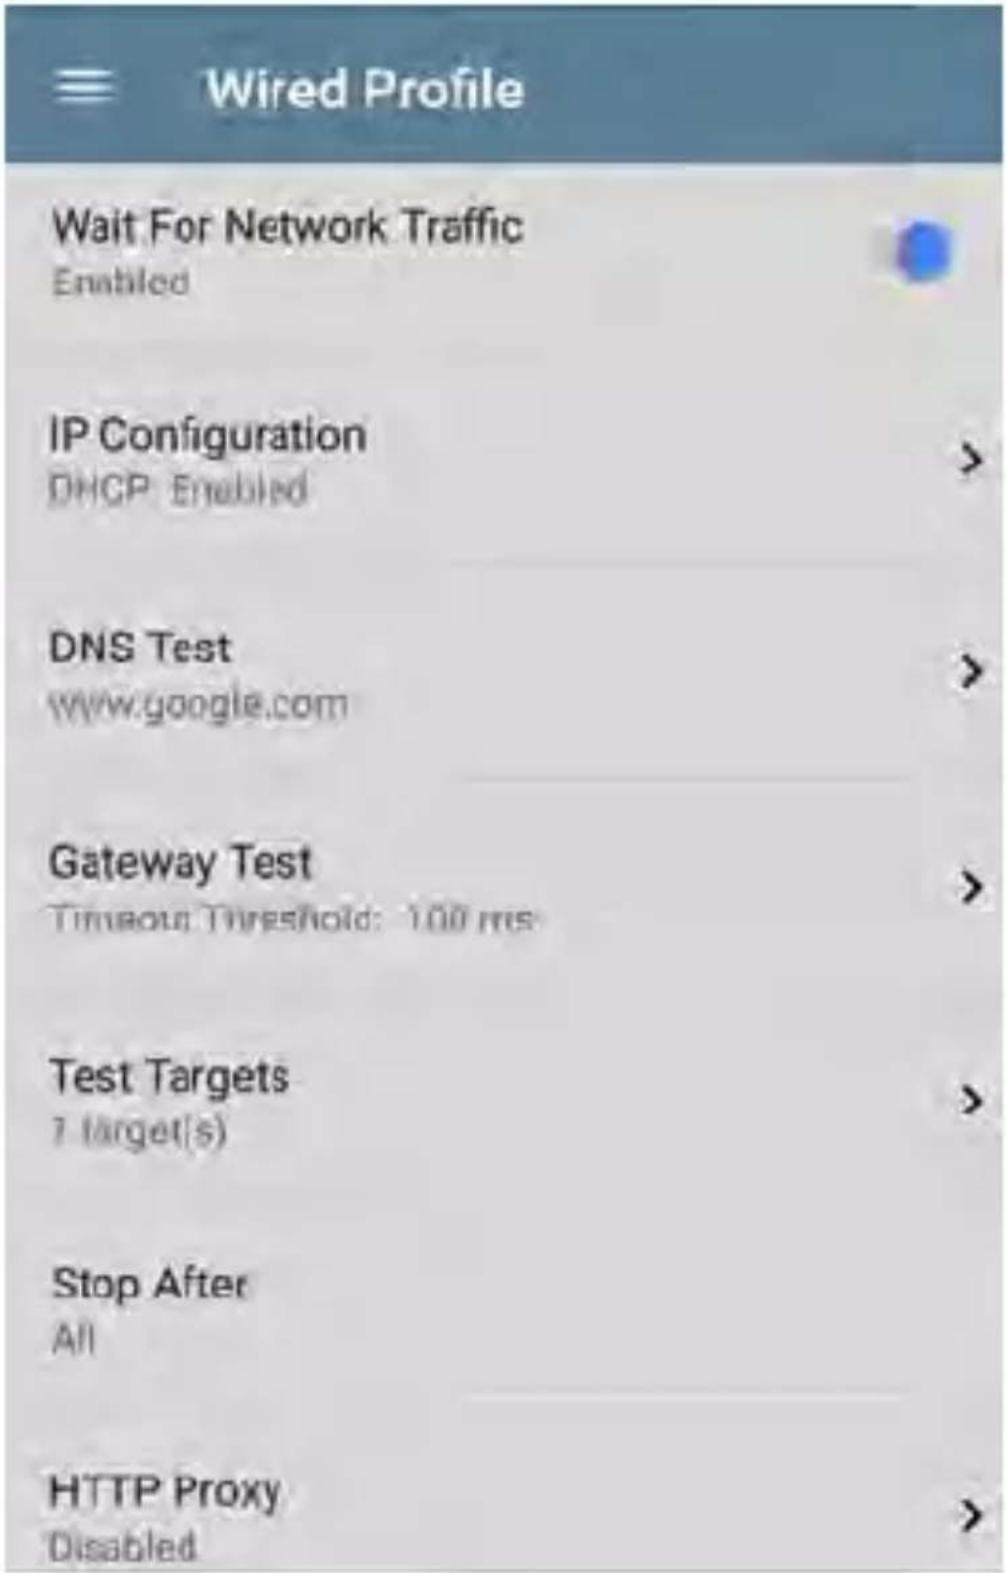
text_image
Wired Profile Wait For Network Traffic Enabled IP Configuration DHCP Enabled DNS Test www.google.com Gateway Test Timeout Threshold: 100 ms Test Targets 7 target(s) Stop After All HTTP Proxy DisabledWait For Network Traffic
Wait for Network Traffic controls whether there is any delay after link comes up before proceeding to the next step. When enabled there is a delay waiting for packets to be forwarded from the network by the nearest switch. This is useful for switches that are configured to search for networking loops prior to forwarding traffic. On networks with very little traffic, the user may choose to disable this delay. The maximum time to delay is 45 seconds.
DHCP, DNS, and Gateway Settings
See DHCP, DNS, and Gateway Tests.
PING FTP TCP HTTP Test Targets
Touch the Test Targets field to open the Test Targets screen and add custom Ping, TCP Connect, HTTP, or FTP Tests to your AutoTest profile.
See Test Targets for Wired Profiles.
Stop After
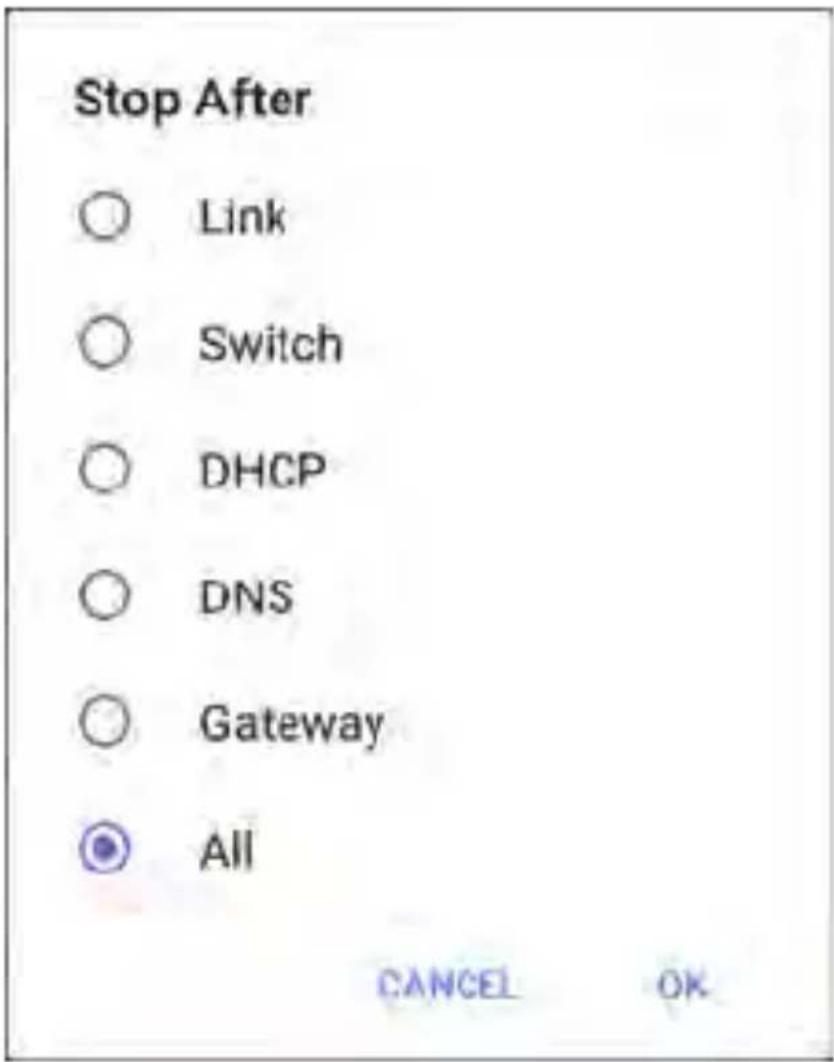
text_image
Stop After ○ Link ○ Switch ○ DHCP ○ DNS ○ Gateway ● All CANCEL OKThis setting directs the Wired Profile to stop testing after the selected test step. The excluded test cards will not appear on the Profile results screen.
HTTP Proxy
The Proxy control lets you specify a proxy server through which the LinkRunner establishes a network connection. In AutoTest,
these settings are used when HTTP Proxy is enabled in an HTTP or FTP Test Target.
To use the proxy settings with a web browser, run the Profile, and then, open the web browser while the unit remains linked.
Open the HTTP Proxy screen to enable proxy settings.
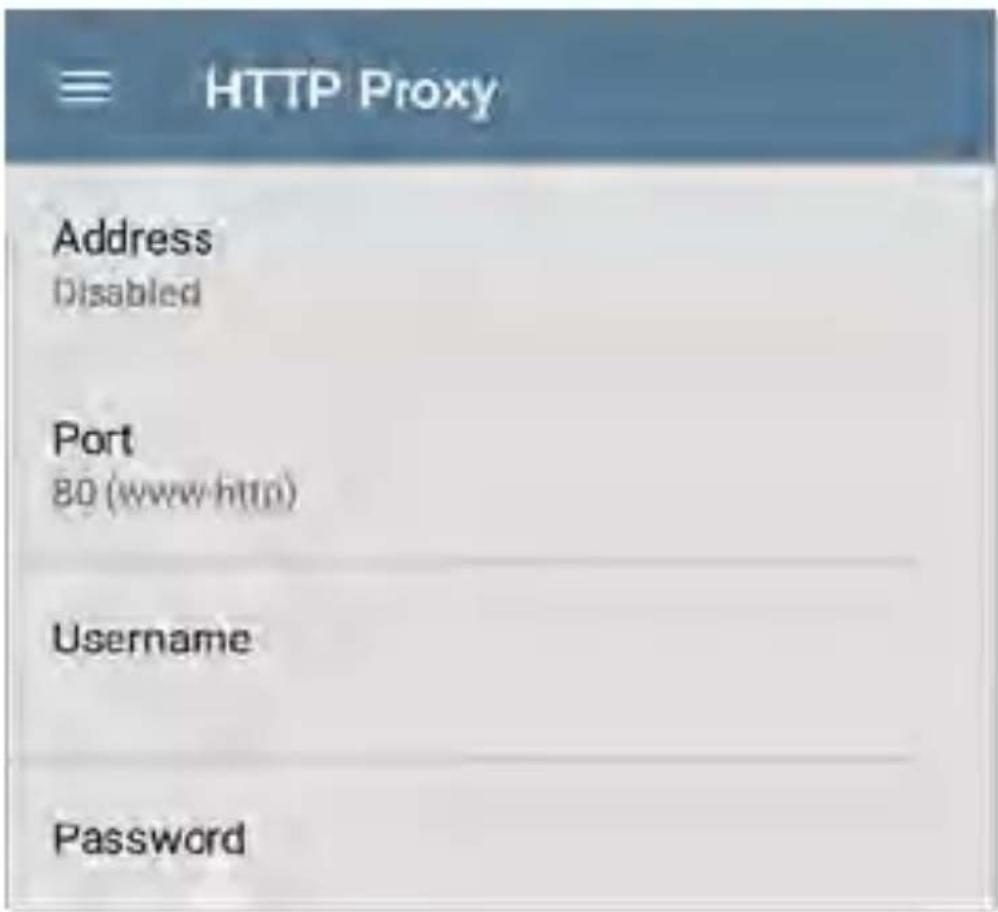
text_image
HTTP Proxy Address Disabled Port 80 (www.http) Username PasswordTouch each field to open a pop-up keyboard and enter the appropriate Address, Port, Username, and Password. Touch OK to save your entries.
DHCP, DNS, and Gateway Tests for Wired AutoTests
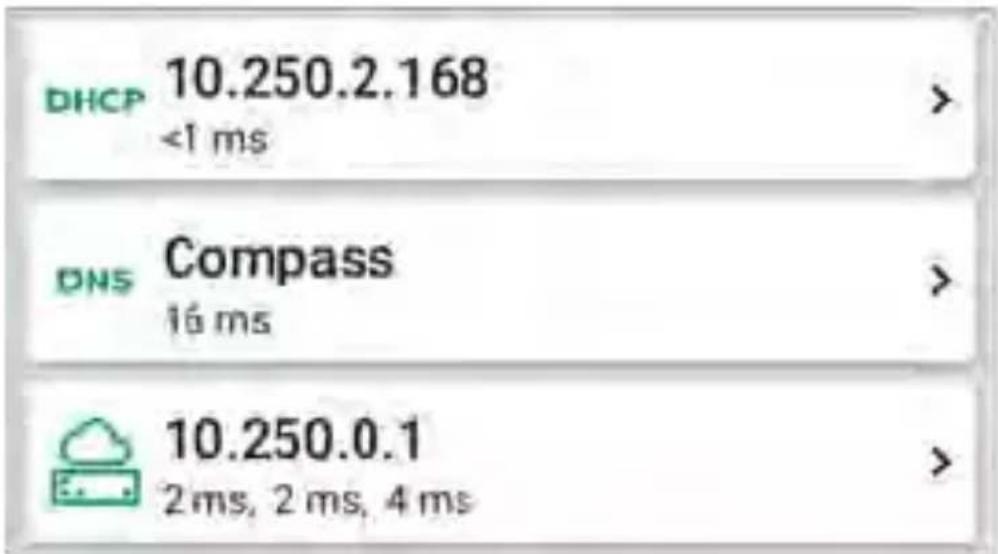
text_image
DHCP 10.250.2.168 <1 ms > DNS Compass 16 ms > 10.250.0.1 2ms, 2 ms, 4 ms >These tests are included in Wired AutoTest Profiles.
Access AutoTest's DHCP, DNS, and Gateway settings from the Wired Profile settings screen, or by touching the settings button from the full results screen for each test type.
Touch blue links or the blue action overflow icon on the test results screens for additional actions.
DHCP or Static IP Test
The DHCP (Dynamic Host Configuration Protocol) test indicates whether the LinkRunner receives an IP address assignment from the DHCP server.
DHCP Settings - IP Configuration
Access the DHCP test settings from the Wired Profile settings or by tapping the settings button on the DHCP test results screen.
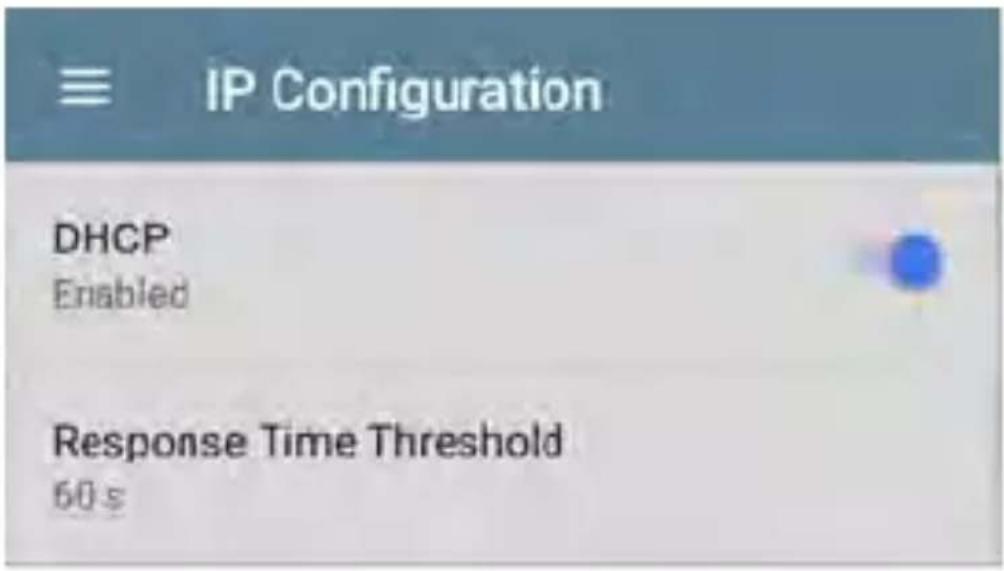
text_image
IP Configuration DHCP Enabled Response Time Threshold 60 sBy default, DHCP is enabled. On the IP Configuration screen, you can adjust the DHCP Response Time Threshold or configure a Static IP Address.
DHCP
DHCP is enabled by default. Touch the toggle button to disable DHCP and enter static IP addresses.
(DHCP only) Response Time Threshold
This field only appears if DHCP is enabled. The Response Time Threshold controls how long the LinkRunner waits for a DHCP server response before failing the Link and DHCP tests
Static IP Address
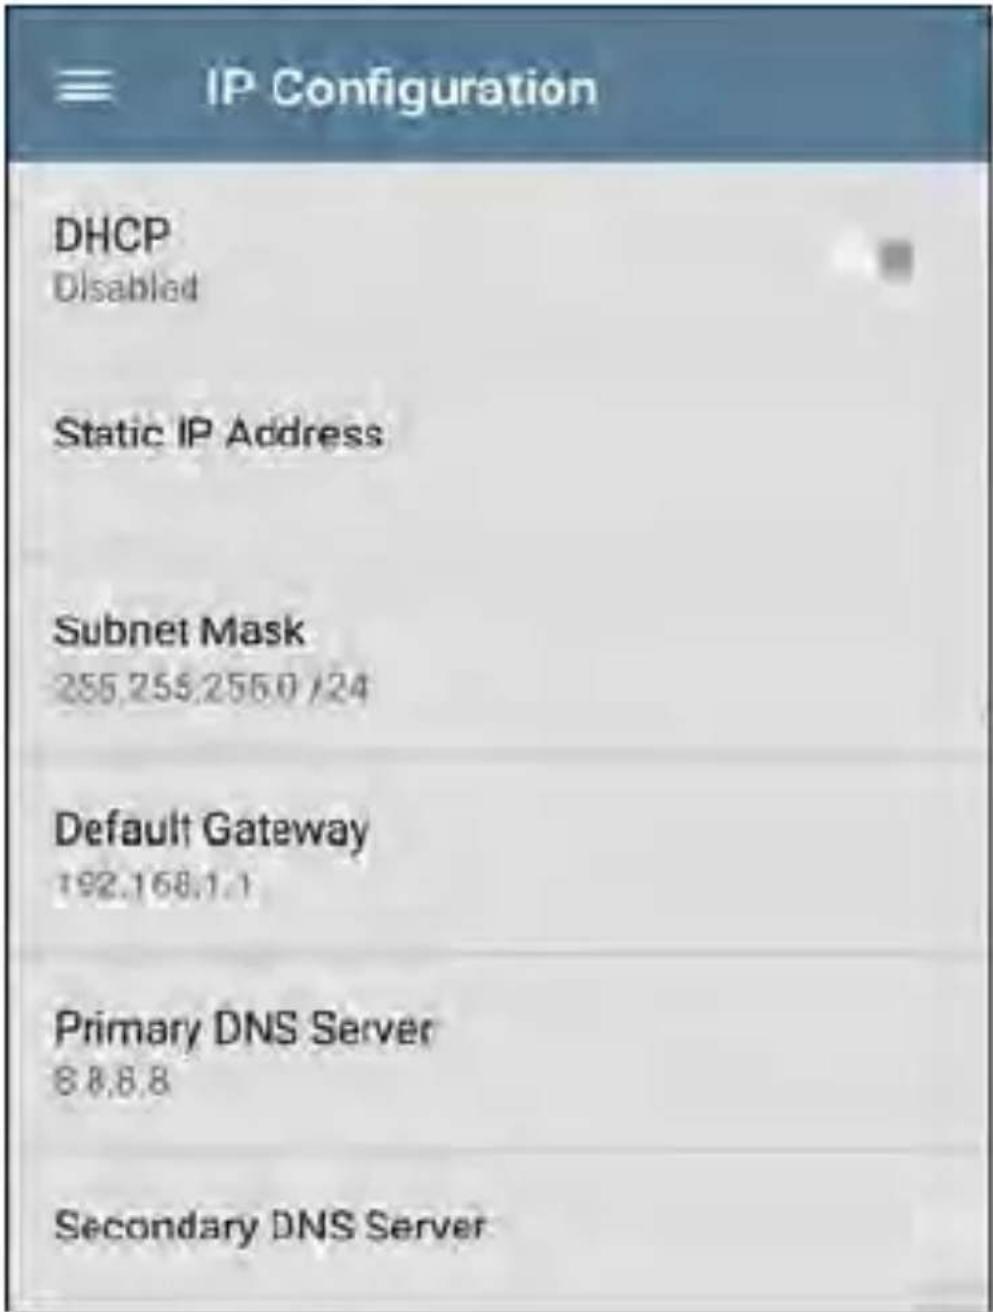
text_image
IP Configuration DHCP Disabled Static IP Address Subnet Mask 255.255.255.0 /24 Default Gateway 192.168.1.1 Primary DNS Server 8888 Secondary DNS ServerThe Static IP address fields for Subnet Mask, Default Gateway, and Primary and Secondary DNS Servers only appear if DHCP is disabled.
Touch each field to open a pop-up number packet and enter the static addresses as needed. Touch OK to save your entries.
DHCP Test Results
When DHCP is enabled, the DHCP test card and results screen are displayed in the Profile.
text_image
DHCP 10.250.2.168 <1 ms >The DHCP Test card displays the DHCP server's IP address and the total time for the discover, offer, request, and acknowledgment to complete.
Touch the card to open the DHCP test screen.
NOTE: If a User-Defined MAC is enabled for this Wired connection in General Settings, (User-defined) appears next to the MAC address beneath the DHCP IP address on results screen.
text_image
AutoTest DHCP 192.168.1.32 736 ms 60c017-530234 (User-defined) Device Name: Mike's home AP IPv4 Address: 192.168.1.1DHCP Test Results Screen
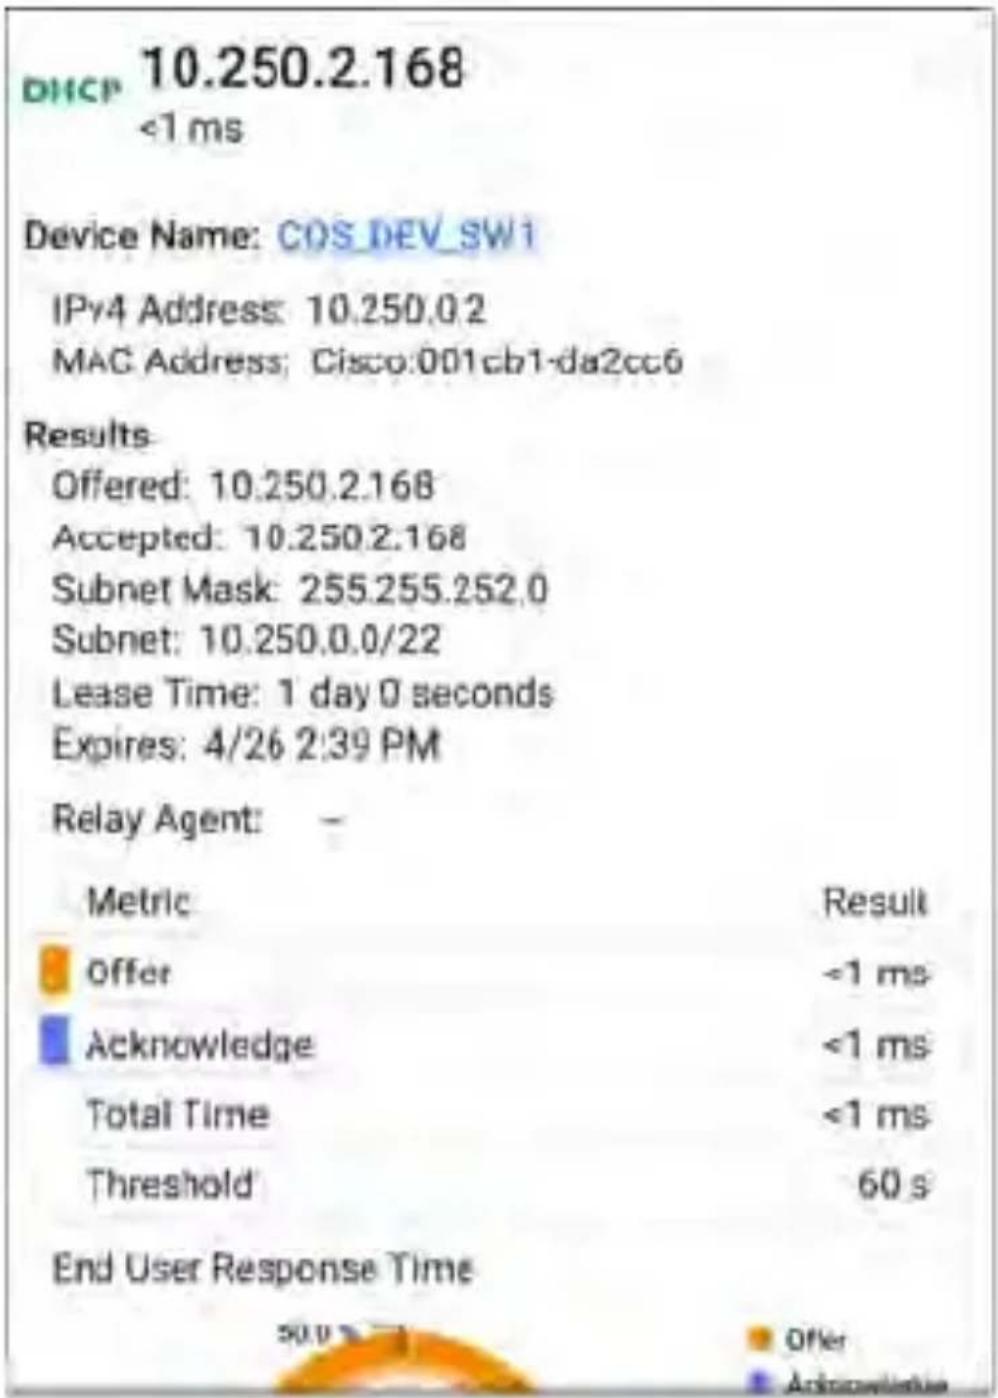
text_image
DHCP 10.250.2.168 <1 ms Device Name: COS_DEV_SW1 IPv4 Address: 10.250.0.2 MAC Address: Cisco:001cb1-da2cc6 Results Offered: 10.250.2.168 Accepted: 10.250.2.168 Subnet Mask: 255.255.252.0 Subnet: 10.250.0.0/22 Lease Time: 1 day 0 seconds Expires: 4/26 2:39 PM Relay Agent: Metric Result Offer <1 ms Acknowledge <1 ms Total Time <1 ms Threshold 60 s End User Response Time 50.0 % Offer ApproveDevice Name: The discovered name of the DHCP Server, or, if no name could be discovered, the IP address
IPv4 Address: IP address of the server
MAC Address: Server's MAC address. Two dashes -- indicate that no MAC address was provided from the server.
Results
Offered: IP address offered by the DHCP server
Accepted: IP address accepted by the LinkRunner
Subnet Mask: Used to determine which addresses are local and which must be reached via a gateway
Subnet: Combination of the subnet mask and the offered IP address
Lease Time: The amount of time the IP address is leased to the LinkRunner by the DHCP server
Expires: Expiration date and time of the IP address
Relay Agent: If a BOOTP DHCP relay agent present, this field shows its IP address. The relay agent relays DHCP messages between
DHCP clients and DHCP servers on different IP networks.
End User Response Time table and chart: Breakdown of the times for the process of acquiring a DHCP IP address
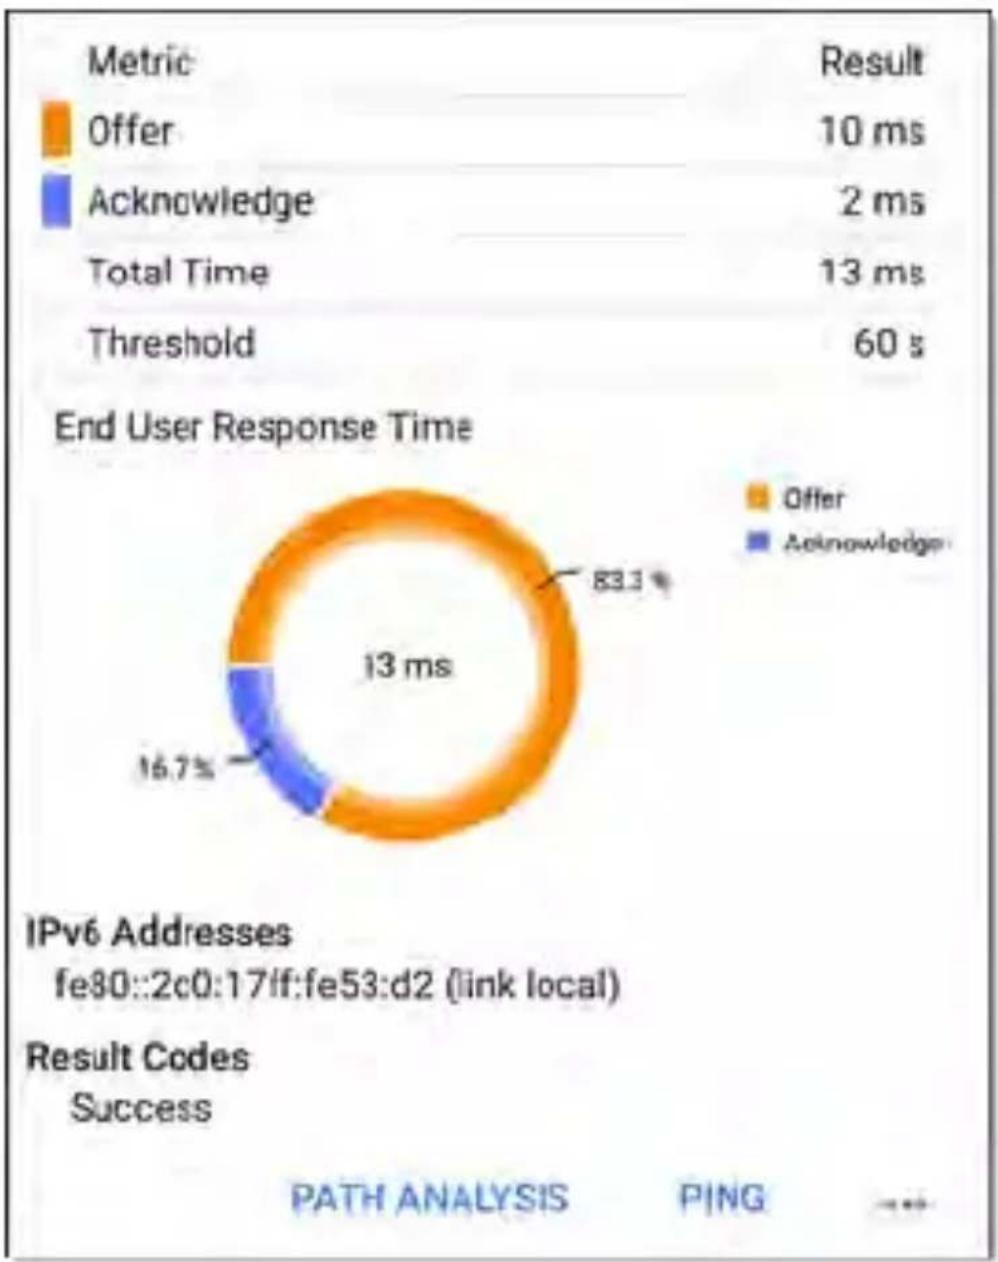
donut
| Metric | Value | | :--- | :--- | | Offer | 10 ms | | Acknowledge | 2 ms | | Total Time | 13 ms | | Threshold | 60 s | End User Response Time IPv6 Addresses fe80::2c0:17lf:fe53:d2 (link local) Result Codes Success PATH ANALYSIS PING ...Offer: Time between when the LinkRunner sent the discovery and received an address offer from the DHCP server
Acknowledge: Time between LinkRunner sending the request and receiving the acknowledgment from the DHCP server
Total Time: Total amount of time consumed by the DHCP process
Threshold: The DHCP Response Time Threshold from the DHCP test settings, which controls how long the LinkRunner waits for a DHCP server response before failing the DHCP test.
End User Response Time: A pie chart showing the Offer and Acknowledgment times as percentages
IPv6 Addresses: Addresses obtained via router advertisement
Results Codes: Final status of the test (Success or Failure)
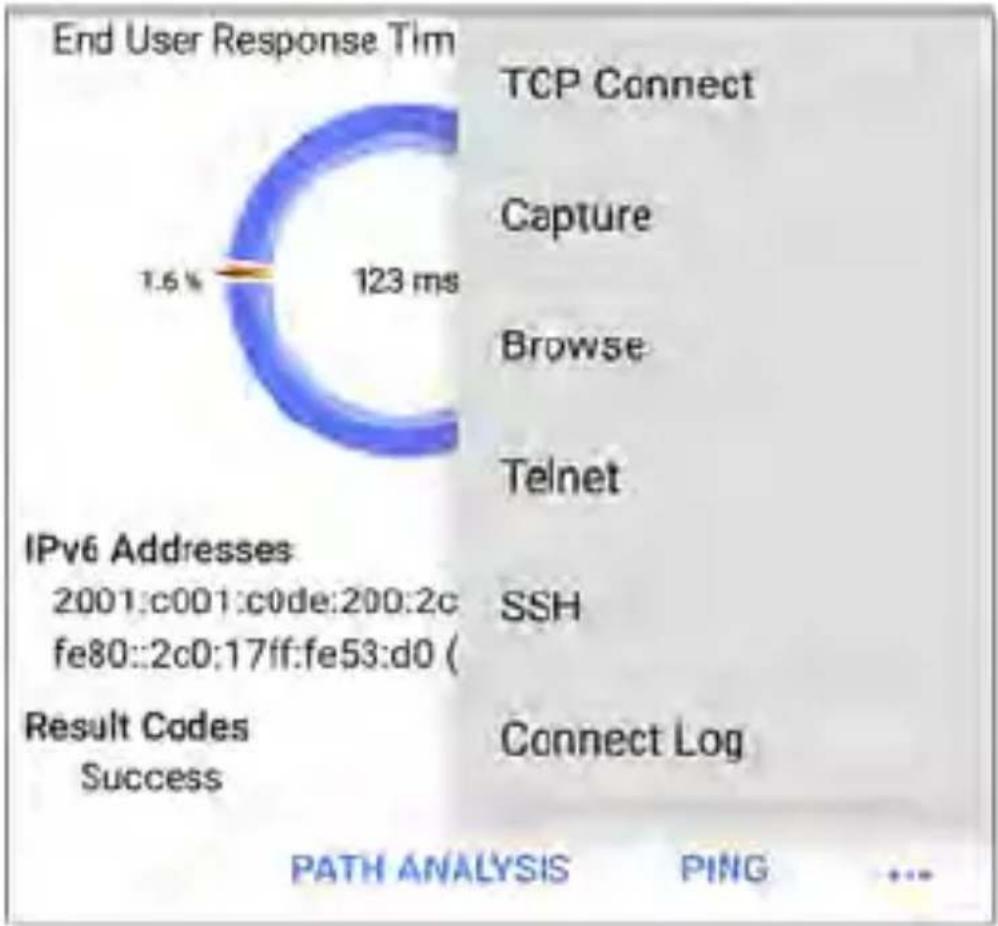
gauge
End User Response Tim | Protocol | End User Response Tim (ms) | | :--- | :--- | | TCP Connect | 123 | | Capture | 1.6 | | Browse | 123 | | Telnet | 123 | | SSH | 123 | | Connect Log | 123 | IPv6 Addresses: 2001:c001:c0de:200:2c fe80::2c0:17ff:fe53:d0 ( Result Codes Success PATH ANALYSIS PING ...The additional actions available on the DHCP test screen include opening the Path Analysis, Ping/TCP, or Capture apps populated with the DHCP server address, browsing to the IPv4 address in the web browser, starting a Telnet (SSH) session, or viewing the Connect Log.
Static IP Test Results
If DHCP is disabled, the DHCP test becomes a "Static IP" test and the Subnet and addresses that were entered in the DHCP test settings are displayed.

text_image
Static 192.65.49.18 IP Subnet: 192.65.49.0/24The Static IP card displays the configured IP and Subnet addresses.
Touch the card to open the test results screen.
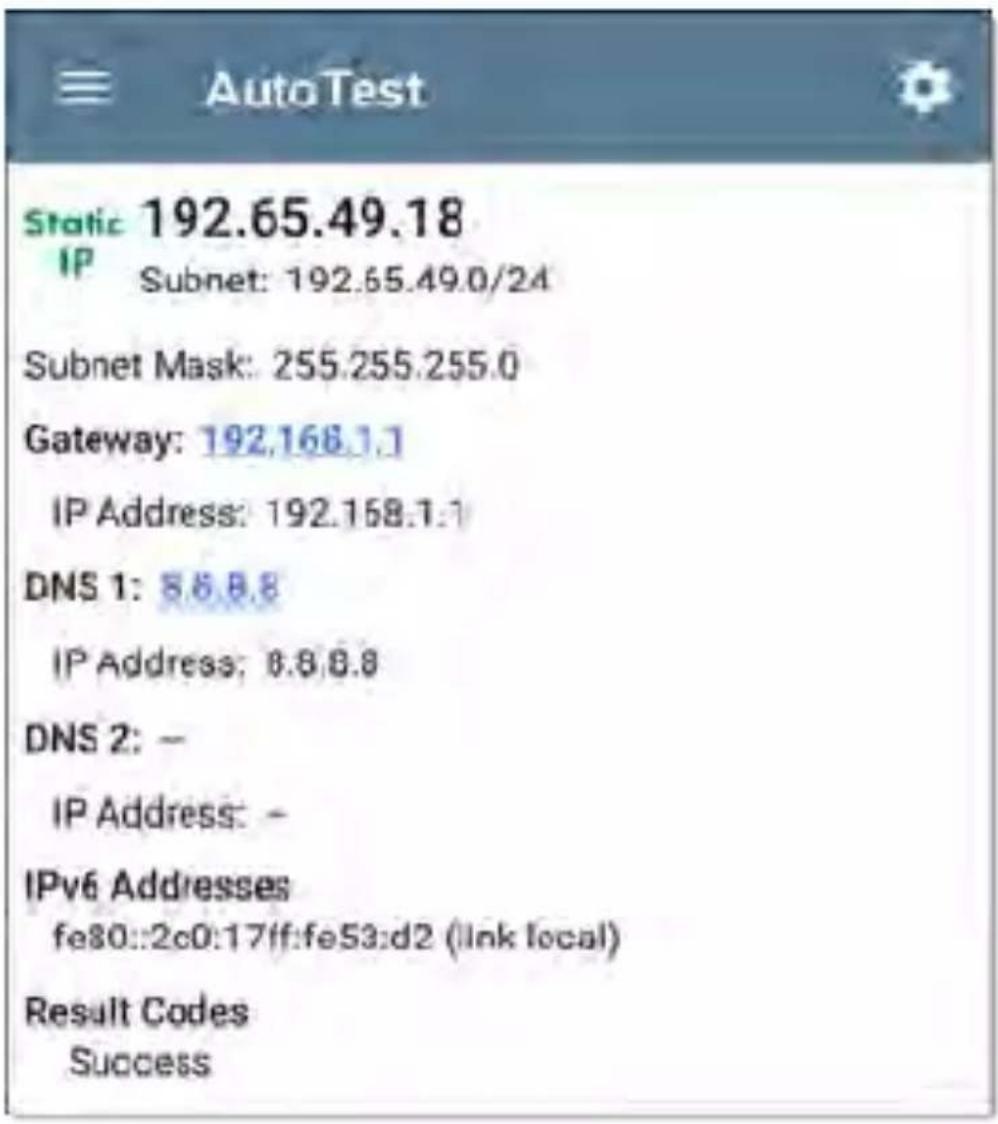
text_image
Static 192.65.49.18 IP Subnet: 192.65.49.0/24 Subnet Mask: 255.255.255.0 Gateway: 192.168.1.1 IP Address: 192.168.1.1 DNS 1: 8.8.8.8 IP Address: 8.8.8.8 DNS 2: - IP Address: - IPv6 Addresses fe80::2c0:17ff:fe53:d2 (link local) Result Codes SuccessThe Static IP test screen displays the configure addresses.
Subnet: Combination of the subnet mask and the offered IP address
Subnet Mask: Used to determine which addresses are local and which must be reached via a gateway
Gateway: Resolved hostname of the Gateway o its IP address if no name could be discovered
IP Address: IP address of the Gateway
DNS (1 and 2): Names and IP addresses of Primary and Secondary DNS servers
IPv6 Addresses: Addresses obtained via router advertisement
Results Codes: Final status of the test (Success or Failure)
Duplicate IP Address
The DHCP and Static IP tests also detect and report the presence of a device using the same IP address (duplicate IP). If the configured address is in use, the AutoTest fails.
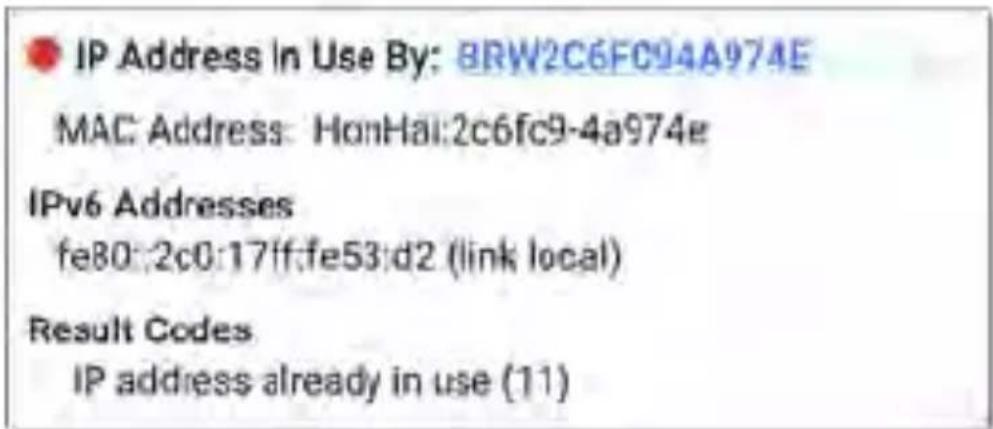
text_image
IP Address In Use By: BRW2C6FC94A974E MAC Address: HonHai:2c6fc9-4a974e IPv6 Addresses fe80:2c0:17ff:fe53:d2 (link local) Result Codes IP address already in use (11)IP Address In Use By: Shows the name of the device currently using the configured static IP address. Touch the blue underlined link to open a Discovery Details screen for the device.
MAC Address: MAC of the device using the IP address
DNS Test
For overview information, see DHCP, DNS, and Gateway Tests.
The DNS (Domain Name System) server test checks the performance of DNS servers resolving the specified URL. The LinkRunner obtains DNS addresses through DHCP or static address configuration.
DNS Test Settings
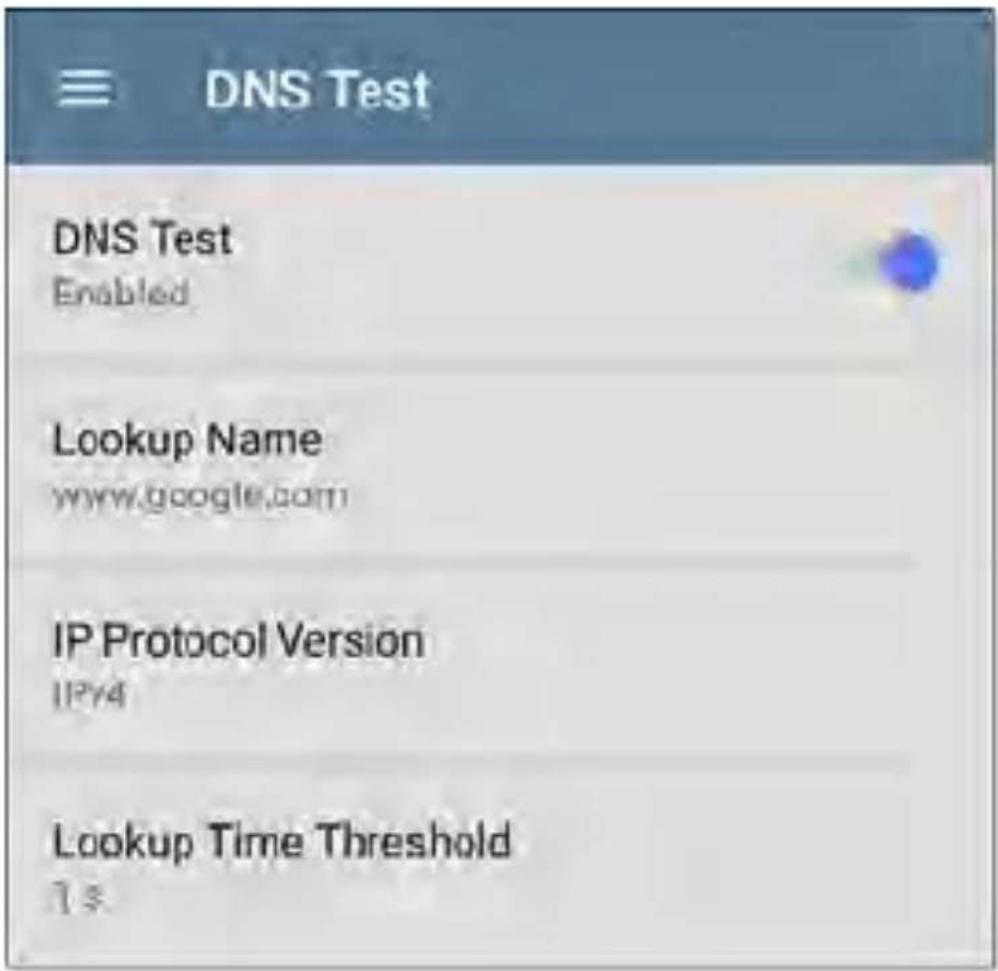
text_image
DNS Test DNS Test Enabled Lookup Name www.google.com IP Protocol Version IP44 Lookup Time Threshold 1:$DNS Test
If desired, you can tap the top field on the DNS Settings screen and switch the toggle to disable the DNS test in your current AutoTest. When this setting is disabled, the DNS card does not appear on the main AutoTest results screen, and the following settings are hidden.
Lookup Name
This is the URL the DNS server(s) will attempt to resolve. Touch the field to enter a URL other than the default: www.google.com.
IP Protocol Version
Touch the field to switch between IPv4 and IPv6.
Lookup Time Threshold
This threshold controls how long the LinkRunner waits for a response from the DNS server(s) before the test is failed. The default is 1 second. Touch the field to select or enter a new threshold.
DNS Test Results
The server name and lookup time for DNS 1 a shown on the DNS test card.

text_image
dns.dns.google 16 msTouch the card to open the DNS test results screen.
DNS Test Results Screen
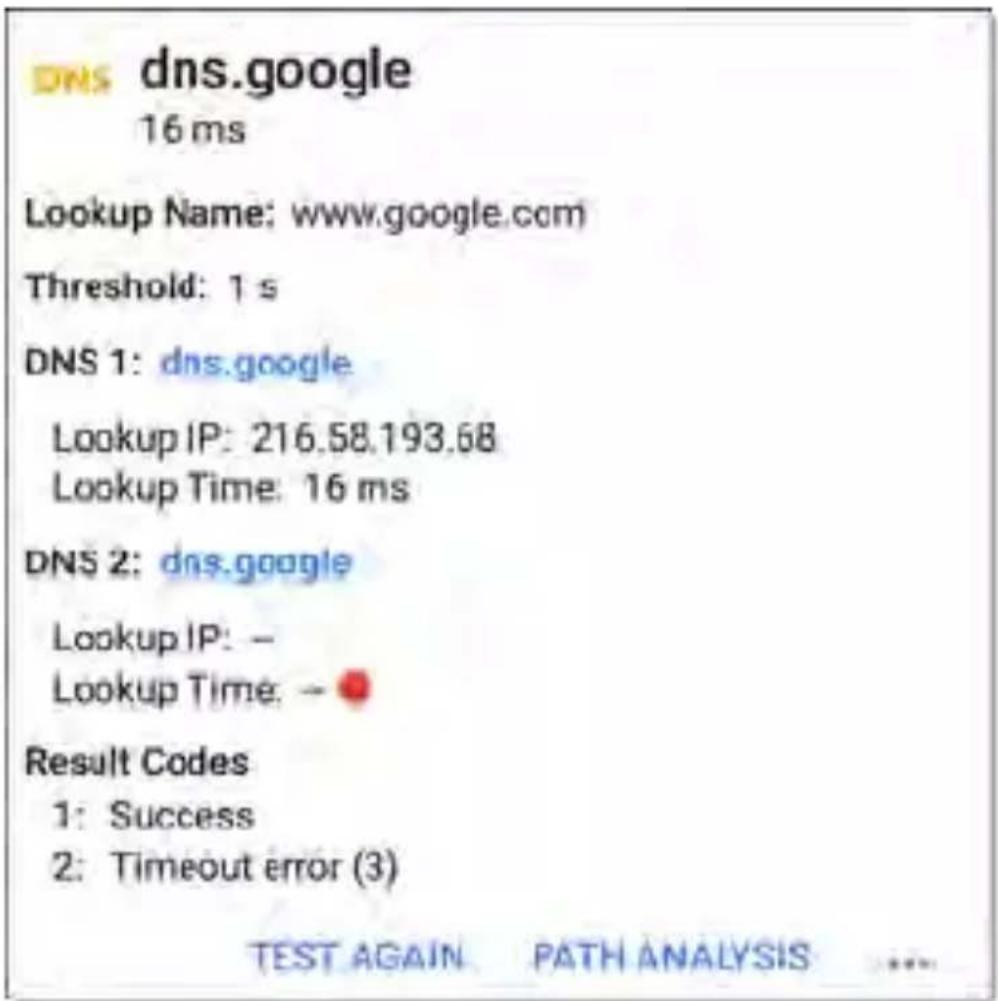
text_image
DNS dns.google 16 ms Lookup Name: www.google.com Threshold: 1 s DNS 1: dns.google Lookup IP: 216.58.193.68 Lookup Time: 16 ms DNS 2: dns.google Lookup IP: - Lookup Time: - ● Result Codes 1: Success 2: Timeout error (3) TEST AGAIN PATH ANALYSIS ...Lookup Name: Name resolved by the DNS servers
Threshold: Lookup Time Threshold from the DNS test settings
DNS #: Name of the listed DNS server
Lookup IP: Resolved IP address
Lookup Time: Time to receive the IP address after the lookup request sent
Results Codes: Final status of the test (Success or Failure) for each DNS server
| 14 ms | |
| Ping | |
| Lookup Name: www.goo | |
| Threshold: 1 s | TCP Connect |
| DNS 1: dns.google | |
| Lookup IP: 172.217.11 | Capture |
| Lookup Time: 14 ms | |
| DNS 2: dns.google | Browse |
| Lookup IP: 172.217.11 | |
| Lookup Time: 14 ms | Telnet |
| Result Codes | |
| 1: Success | SSH |
| 2: Success | |
| TEST AGAIN | PATH ANALYSIS |
Touch blue links or the blue action overflow icon at the bottom of the test results screens to run the DNS Test Again, open another app populated with the name and IP address of DNS 1, or Browse to the Primary DNS server in your web browser.
Gateway Test
For overview information, see DHCP, DNS, and Gateway Tests.
This test indicates whether the default Gateway could be successfully pinged and identifies the address of the current IPv4 and IPv6 routers.
Gateway Test Settings
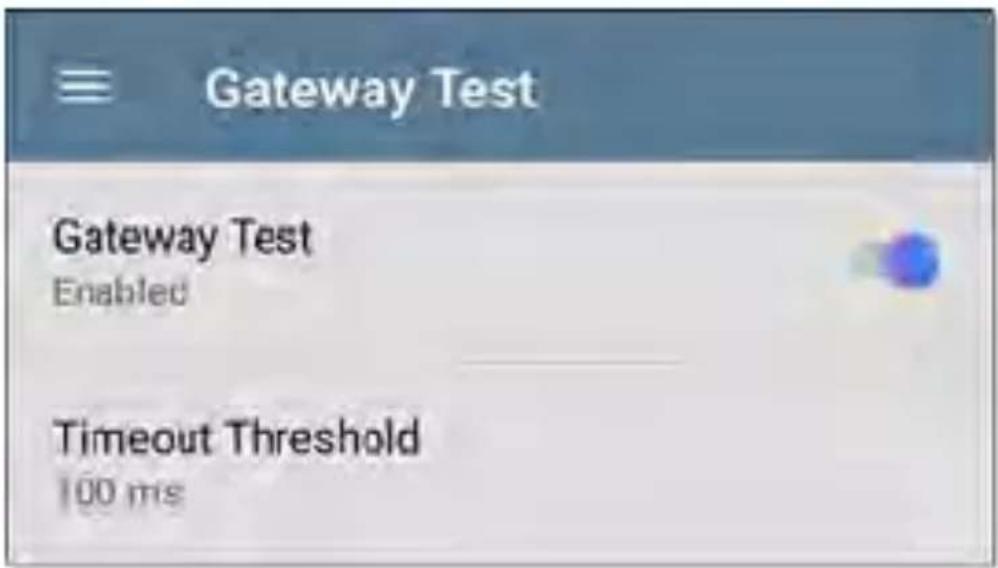
text_image
Gateway Test Gateway Test Enabled Timeout Threshold 100 msGateway Test
If desired, you can tap the top field on the Gateway Test screen and switch the toggle to disable the Gateway test in your current AutoTest. When this setting is disabled, the Gateway card does not appear on the main AutoTest results screen, and the following setting is hidden.
Timeout Threshold
The only other setting for the Gateway Test is the timeout threshold, which indicates how long the LinkRunner will wait for a response from the gateway before grading the test as a fail. Tap the field to select one of the value options, or enter a custom value.
Gateway Test Results
LinkRunner gets the Gateway's IP address from DHCP or the static IP configuration, and uses SNMP to acquire system group information and statistics for the port that services the LinkRunner's subnet. See Discovery Settings for information about SNMP configuration.

text_image
10.250.0.1 2 ms, 2 ms, 4 msThe Gateway test card shows the gateway's IP address and the three Ping response times.
Gateway Test Results Screen
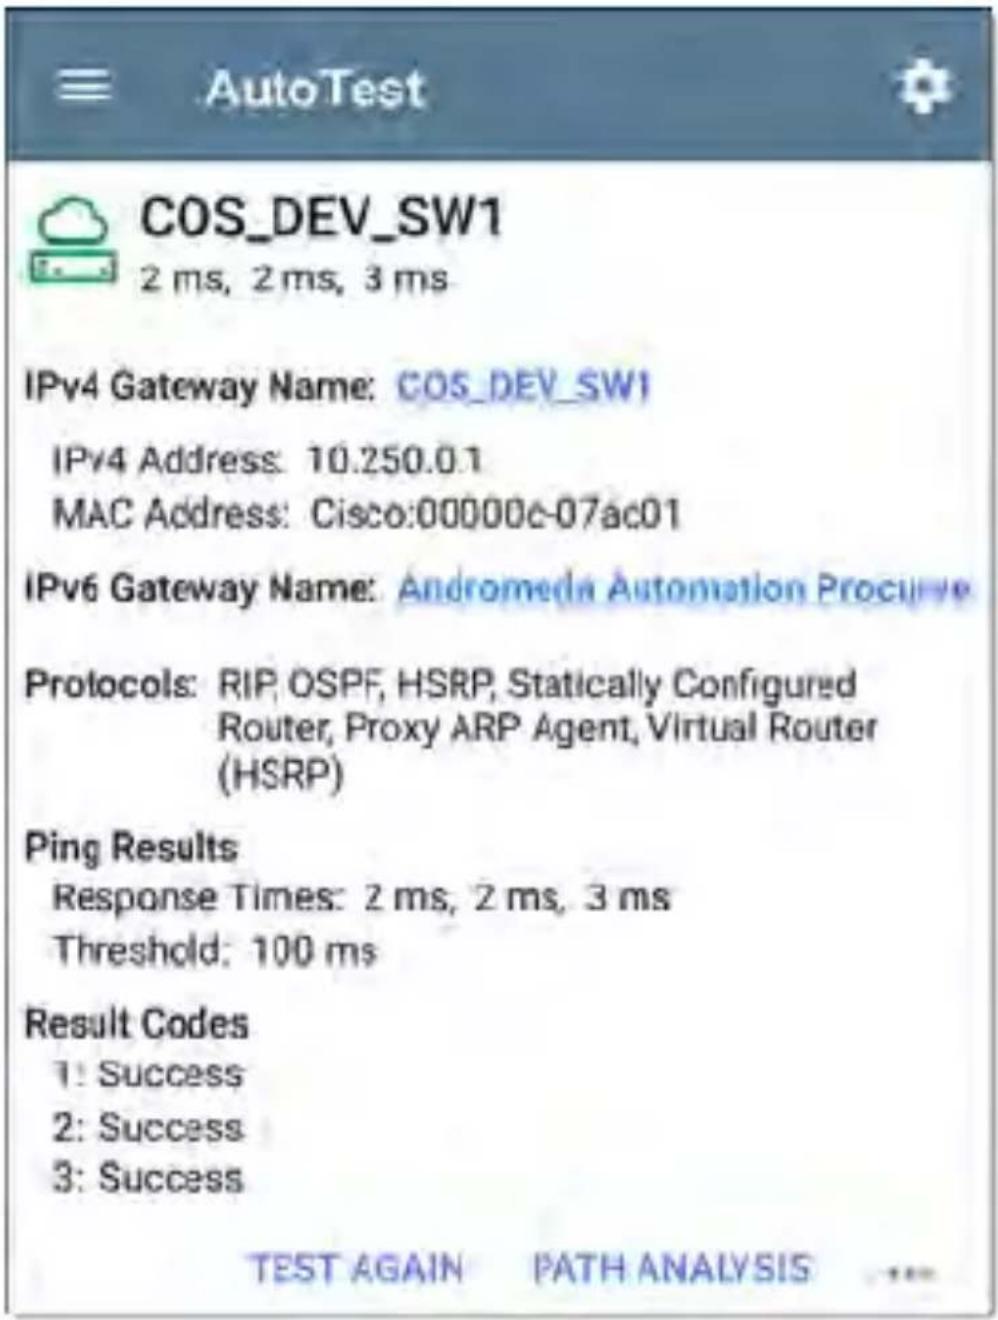
text_image
AutoTest COS_DEV_SW1 2 ms, 2 ms, 3 ms IPv4 Gateway Name: COS_DEV_SW1 IPv4 Address: 10.250.0.1 MAC Address: Cisco:00000c-07ac01 IPv6 Gateway Name: Andromedia Automation Procive Protocols: RIP, OSPF, HSRP, Statically Configured Router, Proxy ARP Agent, Virtual Router (HSRP) Ping Results Response Times: 2 ms, 2 ms, 3 ms Threshold: 100 ms Result Codes 1: Success 2: Success 3: Success TEST AGAIN PATH ANALYSIS ...IPv4 Gateway Name: Resolved hostname of the Gateway or its IP address if no name could be discovered
IPv4 Address: Internal IPv4 address of the Gateway
MAC Address: Server's MAC address. Two dashes -- indicate that no MAC address was provided from the server.
IPv6 Address: Router's IPv6 address (if available)
IPv6 Gateway Name: Name advertised by the IPv6 router (if available)
Protocols: Routing protocols the LinkRunner used to obtain the Gateway data
Ping Results
- Response Times from the three Pings sent to the gateway
- Threshold: Gateway Timeout Threshold configured in the gateway settings
Results Codes: Final status of the test (Success or Failure) for each of the three Gateway Pings
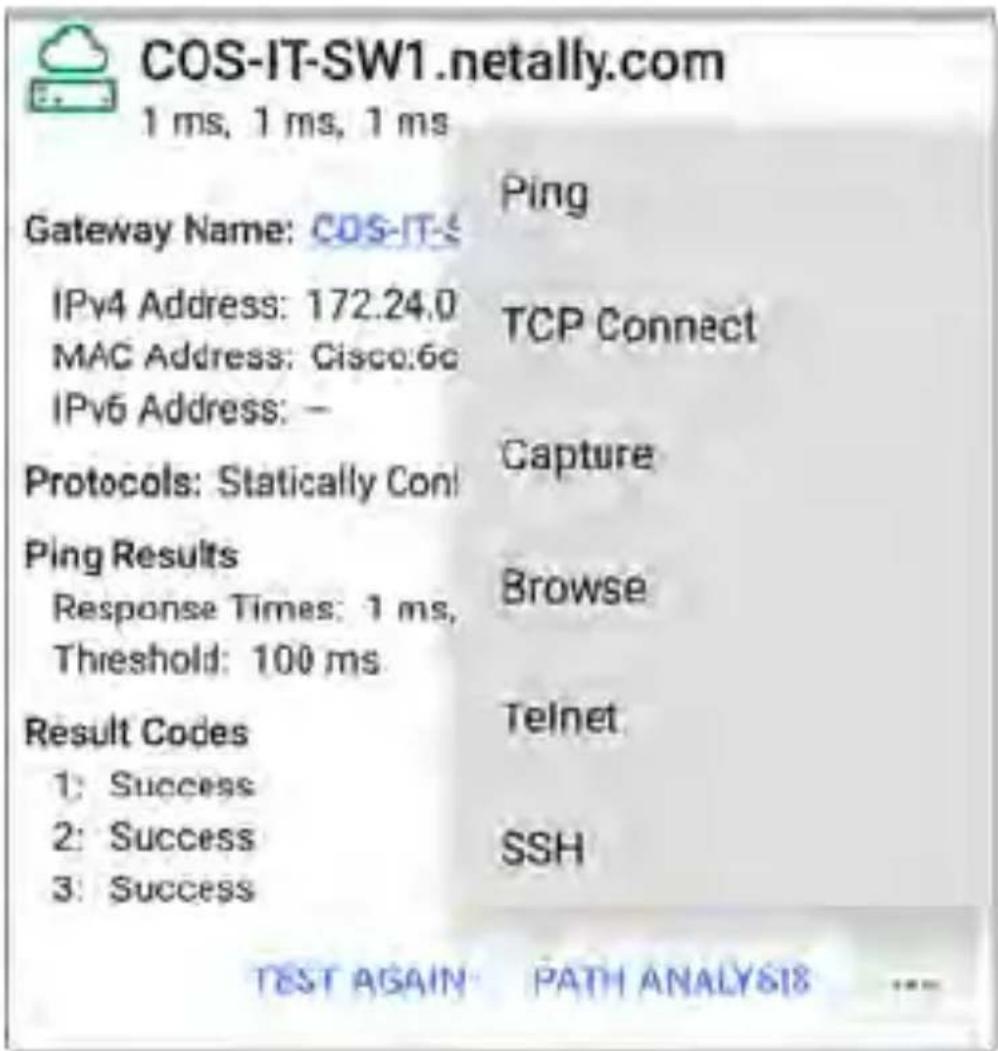
text_image
COS-IT-SW1.netally.com 1 ms, 1 ms, 1 ms Gateway Name: COS-IT-S IPv4 Address: 172.24.0 MAC Address: Cisco:6c IPv6 Address: - Protocols: Statically Con! Ping Results Response Times: 1 ms, Threshold: 100 ms. Result Codes 1: Success 2: Success 3: Success Ping TCP Connect Capture Browse Telnet SSH TEST AGAIN PATH ANALYSIS ...Touch blue links or the blue action overflow icon at the bottom of the test results screens to run the Gateway TEST AGAIN, open another app, Browse to the Gateway's IPv4 Address, or start a Telnet or SSH session to the Gateway.
Test Targets for Wired AutoTests
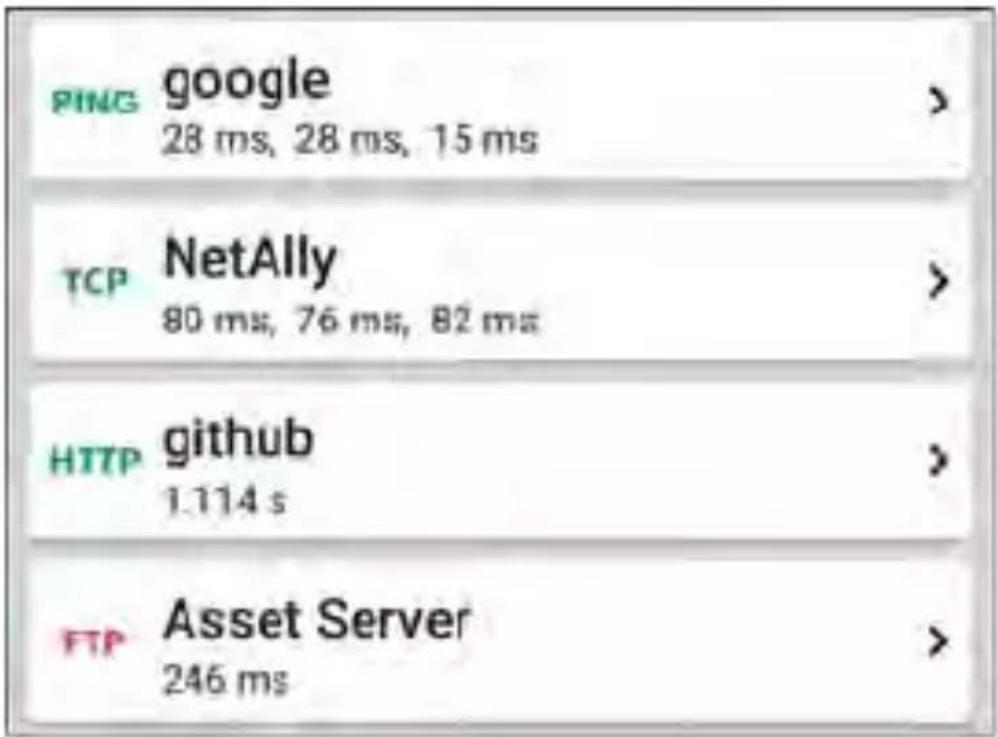
text_image
PING google 28 ms, 28 ms, 15 ms TCP NetAlly 80 ms, 76 ms, 82 ms HTTP github 1.114 s FTP Asset Server 246 msAutoTest Target tests are user-assignable endpoints to which LinkRunner 10G attempts to connect each time the AutoTest profile runs. These tests ensure availability of internal or external websites, servers, and devices to users of your network.
Tap a link below to go to the test's topic:
Ping
TCP Connect
HTTP
FTP
Adding and Managing Test Target:
To add test targets to AutoTest profiles and manage your saved targets, open the Test Targets screen from the Wired Profile Settings or by touching the FAB on the Wired
Profile results screens.
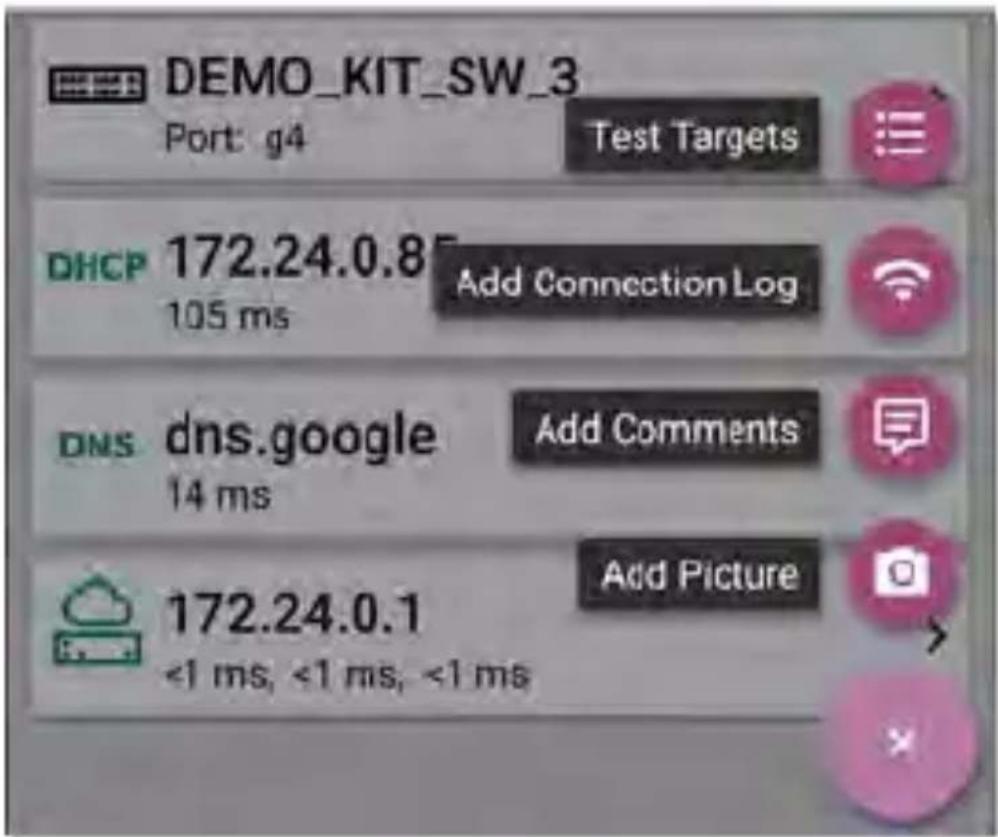
text_image
DEMO_KIT_SW_3 Port: g4 Test Targets DHCP 172.24.0.8 105 ms Add Connection Log DNS dns.google Add Comments 14 ms 172.24.0.1 <1 ms, <1 ms, <1 ms Add PictureThe Test Targets screen lists all of the defined and saved Test Targets. Checked boxes indicate the Test Targets that are enabled in the current Profile. Remember, Test Targets can be added to and used in any number of Wired Profiles.
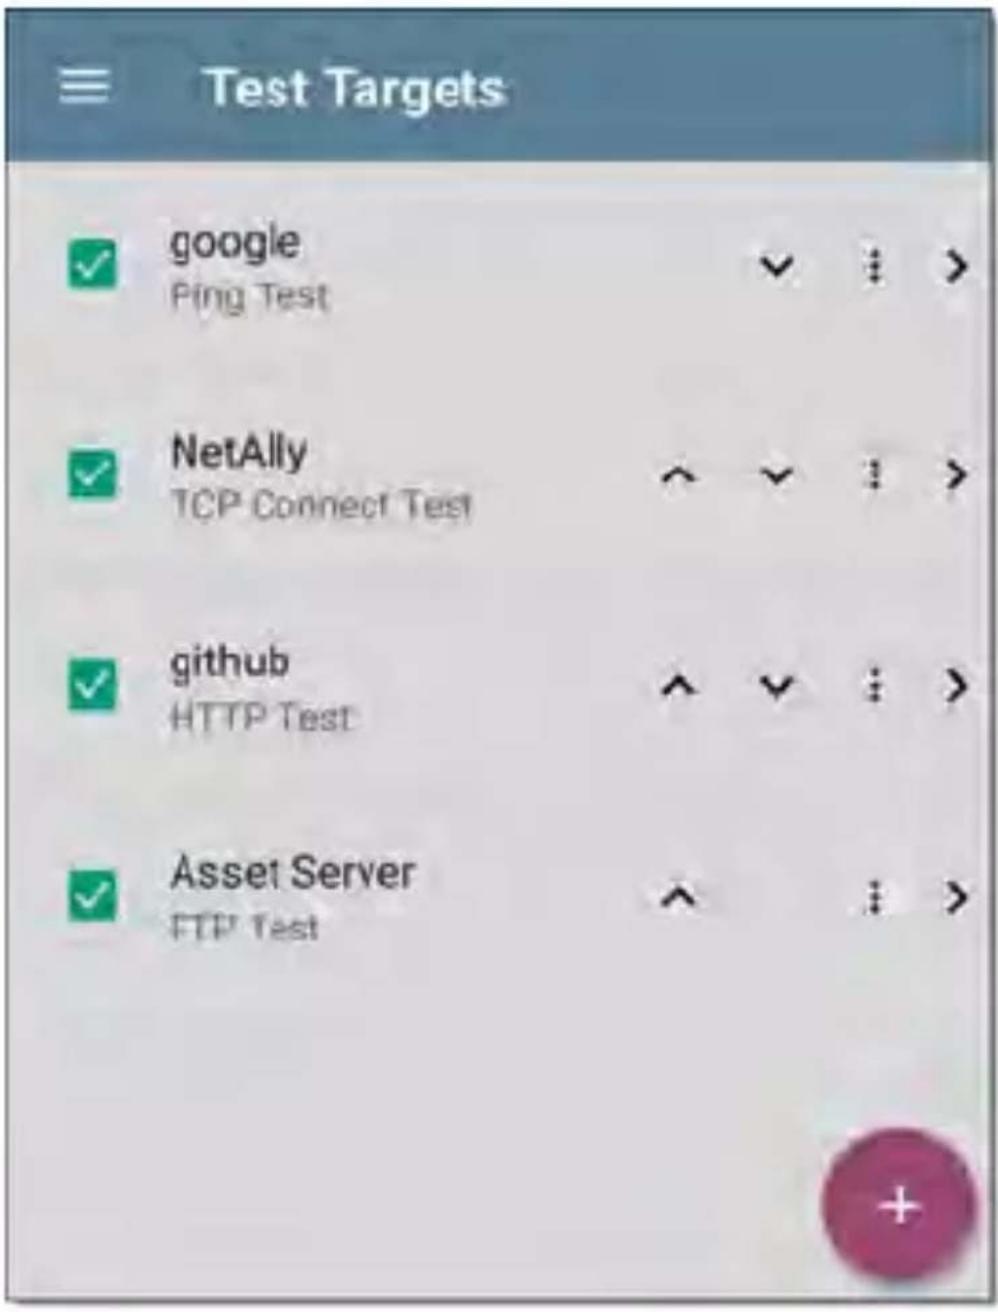
text_image
Test Targets ✓ google Ping Test ✓ NetAlly TCP Connect Test ✓ github HTTP Test ✓ Asset Server FTP TestOn the Test Targets screen, you can perform these actions:
- Select the checkboxes for each Target you want to include in the current Wired profile.
- Tap the up and down arrows to reorder the saved Test Targets on this
screen and the main AutoTest Profile screen.
- Touch the action overflow icon to Duplicate or Delete a target test.
CAUTION: When you delete a Test Target, you delete it from all Profiles. To remove a Test Target from the current profile, simply uncheck it. - Touch the FAB icon to add a new target test: Ping, TCP Connect, HTTP, or FTP.
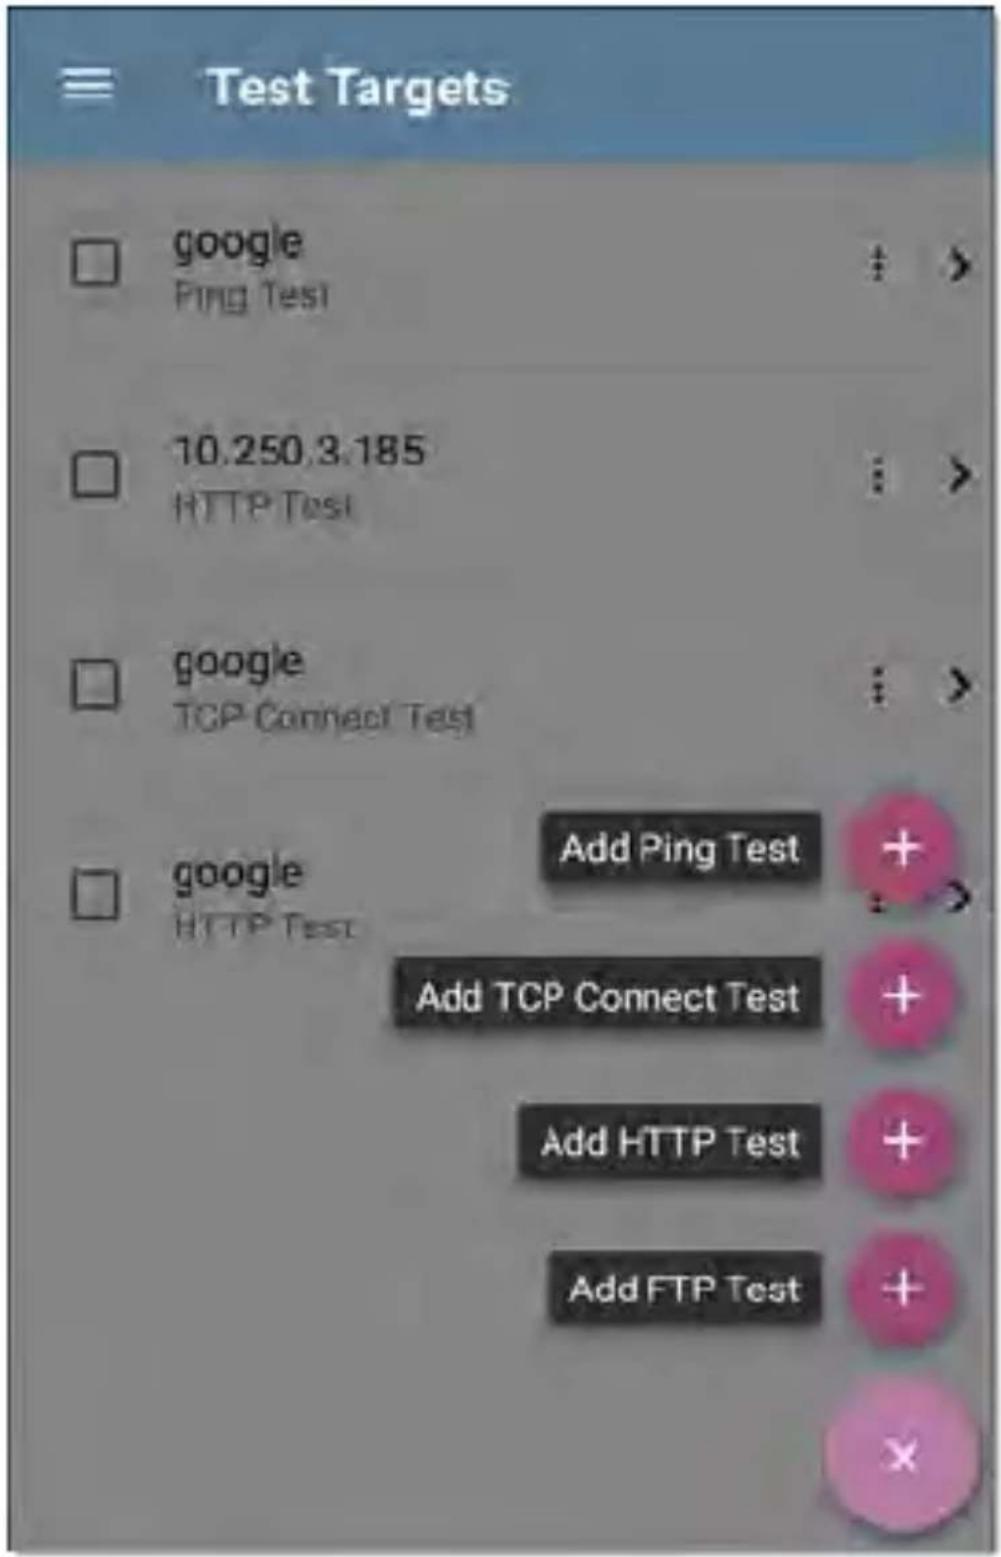
text_image
Test Targets □ google Ping Test □ 10.250,3.185 HTTP Test □ google TCP Connect Test □ google HTTP Test Add Ping Test Add TCP Connect Test Add HTTP Test Add FTP Test + + + +- Touch any target's name, or add a new target, to open the test's settings, where you can enter a custom test name, target address, and thresholds.
Target Test Results Screens
The Target Test type icons display green, yellow, or red to indicate the status (or grade) of the completed test portions:
Success/Warning/Fail.
As an example, in the Ping test image below, the entire Ping test is graded with a Warning because the third Ping was not returned within the Timeout Threshold configured in the settings.
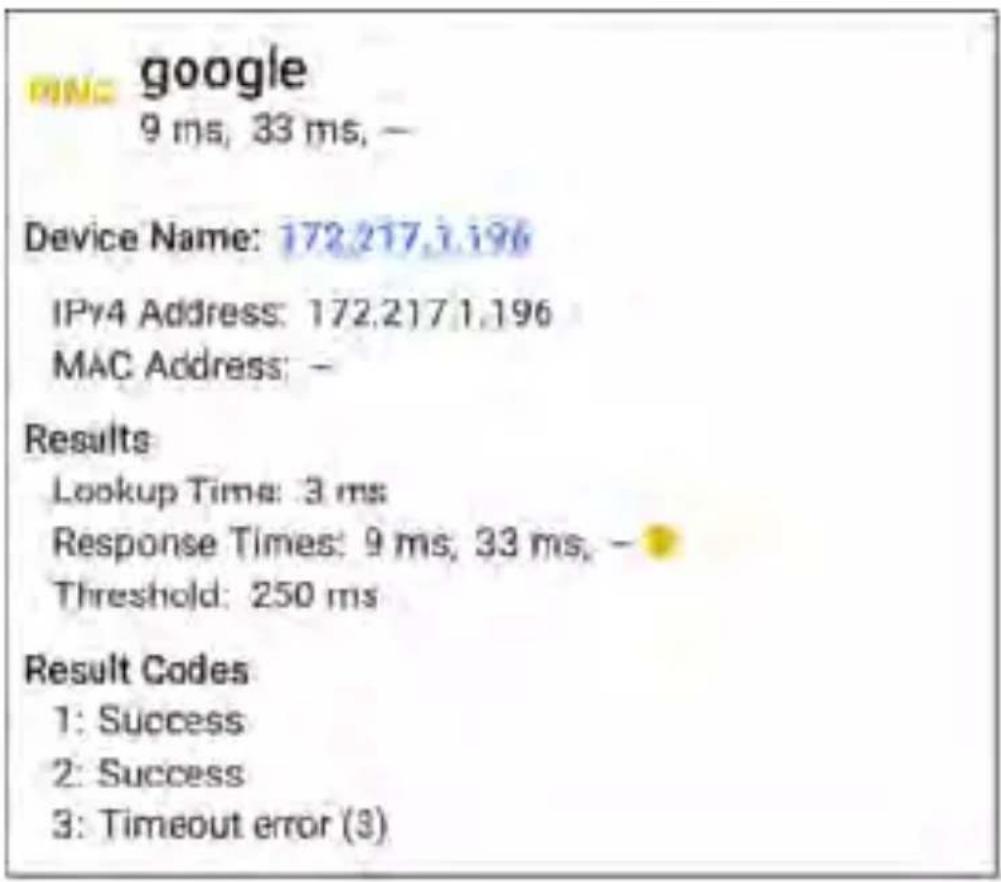
text_image
google 9 ms, 33 ms, — Device Name: 172.217.1.196 IPv4 Address: 172.217.1.196 MAC Address: — Results Lookup Time: 3 ms Response Times: 9 ms, 33 ms, — Threshold: 250 ms Result Codes 1: Success 2: Success 3: Timeout error (3)The third Response Time displays two dashes - to indicate that no response was received, and
under the Results heading, the yellow dot points out the third Response Time as the reason for the Warning. Additionally, the third Result Code lists "Timeout error" as the reason for the Warning.
Additional Target Test Actions
TEST AGAIN
PATH ANALYSIS

After the Target test has completed, touch any of the blue links to perform additional actions, including opening other testing apps.
- Touch the blue linked Device Name to open a Discovery Details app screen for the selected device. From there, you can open other apps and run additional tests.
- Touch TEST AGAIN to run just the target test again.
- Touch PATH ANALYSIS to open the Path Analysis app. The path Destination will be configured with the current target.
- Touch the action overflow icon to open the listed apps or tools with the target
pre-populated, for example:
- Open the Ping/TCP app with the current target address.
- Run a packet Capture on traffic from the test target.
- Browse to the target URL on the interne with your web browser app.
AutoTest Ping Test
A Ping test sends an ICMP echo request to the selected target to determine whether the server or client can be reached and how long it takes to respond. The AutoTest Target Ping Test sends three Pings to the target and reports the response times. The target can be an IPv4 address, IPv6 address, or named server (URL or DNS).
Ping Test Settings
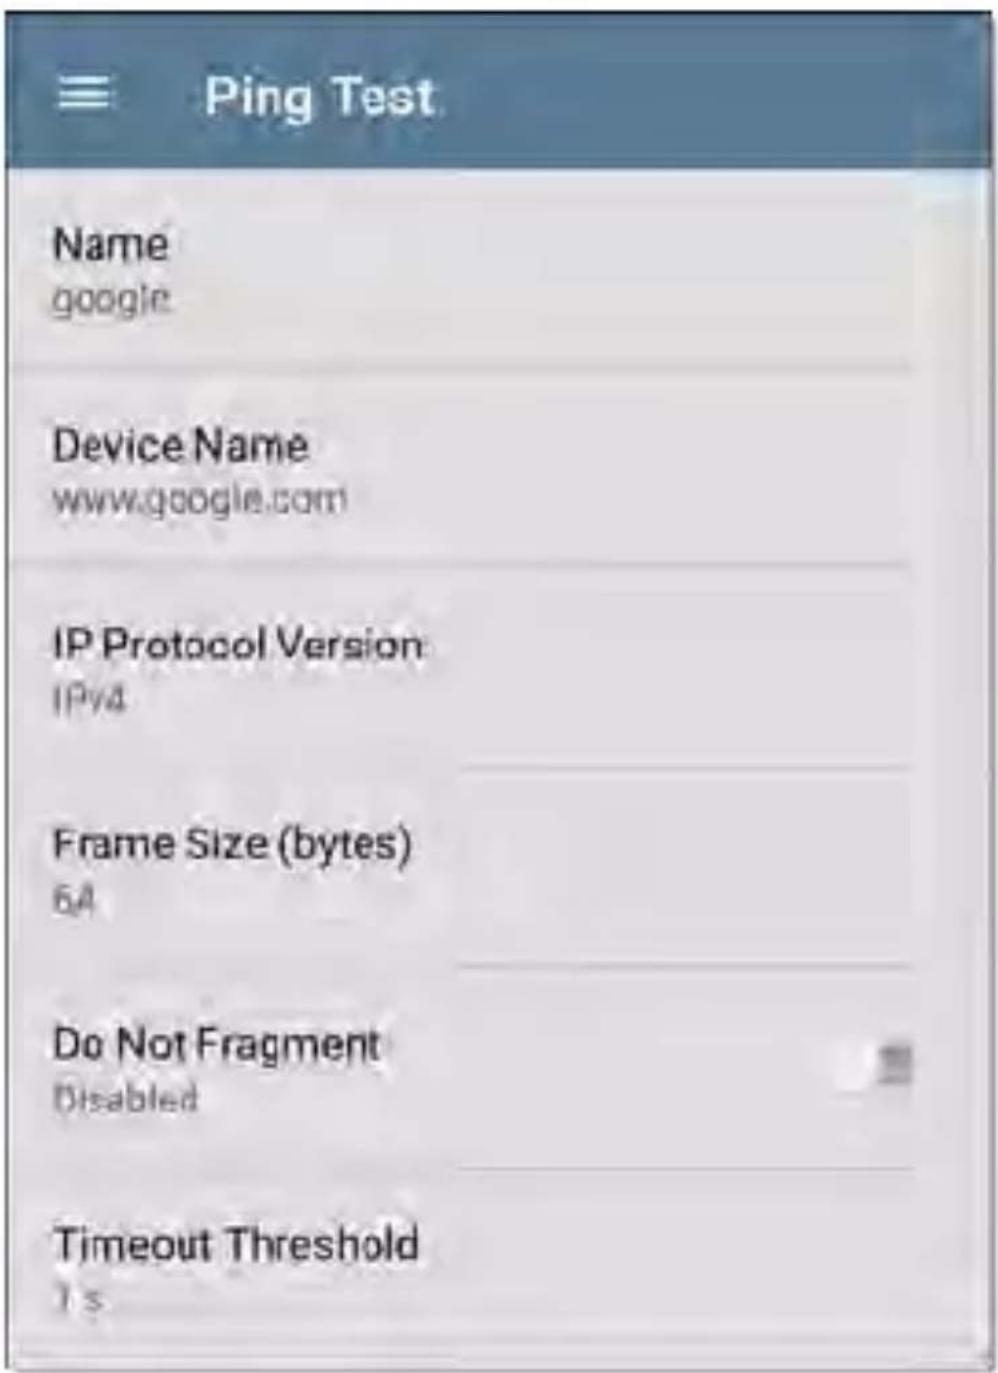
text_image
Ping Test Name google Device Name www.google.com IP Protocol Version IPv4 Frame Size (bytes) 6A Do Not Fragment Disabled Timeout Threshold 1sName: This field allows you to assign a custom name to the test. The name appears on the target test card in the profile.
Device Name: Enter the IP address or URL of the server you want to ping. If you enter an IF
address, the DNS lookup portion of the test is skipped.
IP Protocol Version: IPv4 is used by default. Touch the field to switch between IPv4 and IPv6.
Frame Size (bytes): This setting specifies the total size of the payload and the header sent. Valid sizes are 64 bytes to 1518 bytes. To test the Maximum Transmission Unit (MTU) along a route to a target, select the MTU frame size you want to test, and set Do Not Fragment to Enabled.
Do Not Fragment: Touch the toggle button to enable.
Timeout Threshold: This threshold controls how long the LinkRunner waits for a response from the target before failing the test.
Ping Test Results
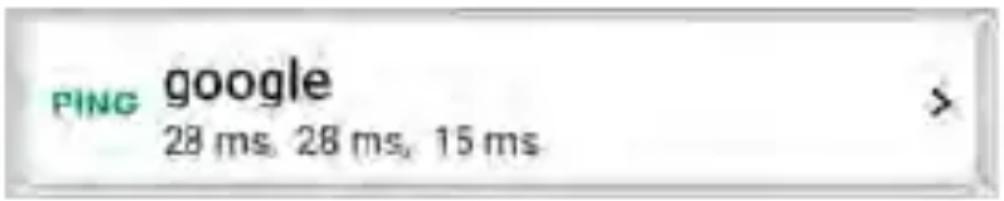
text_image
PING google 28 ms, 28 ms, 15 msThe Ping card shows the Ping test name entered in the Ping test settings and the three Ping response times from the target.
Touch the card to open the Ping results screer
AutoTest Ping Results Screen
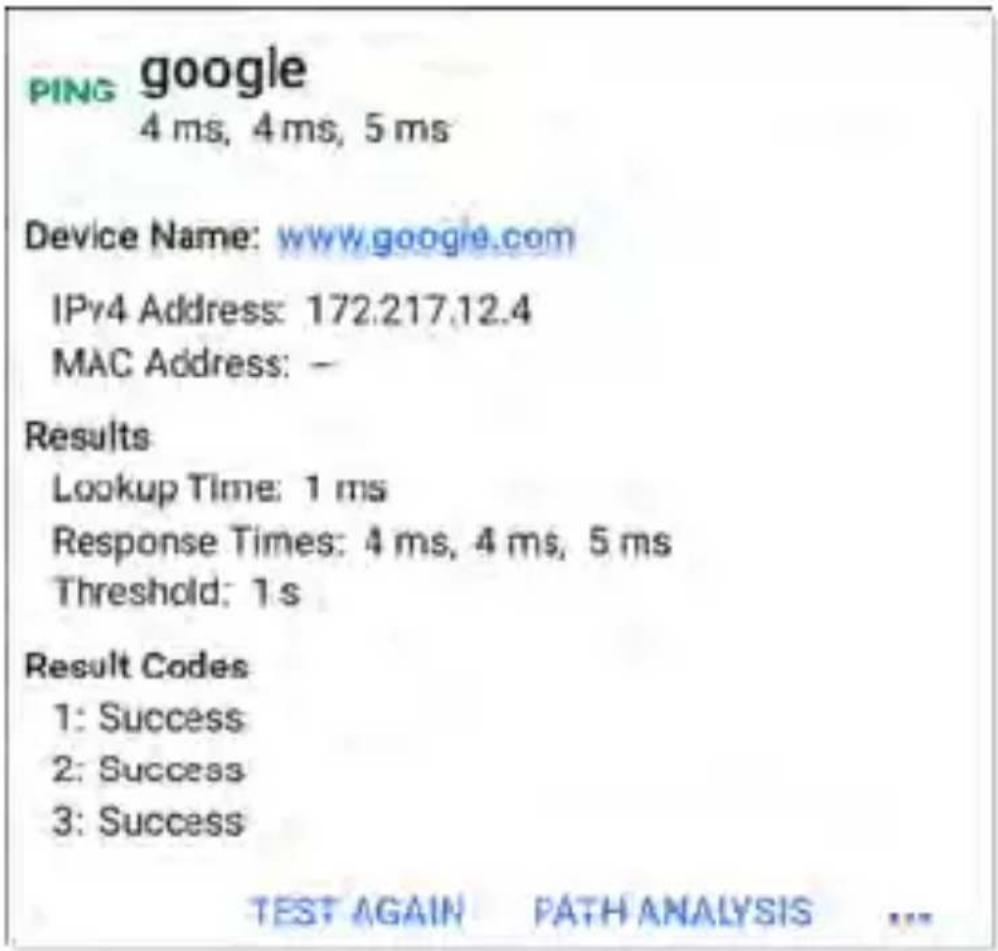
text_image
PING google 4 ms, 4 ms, 5 ms Device Name: www.google.com IPv4 Address: 172.217.12.4 MAC Address: - Results Lookup Time: 1 ms Response Times: 4 ms, 4 ms, 5 ms Threshold: 1 s Result Codes 1: Success 2: Success 3: Success TEST AGAIN PATH ANALYSIS ...Device Name: Hostname or address of the target device
- IPv4 or IPv6 Address: IP address of the target device
- MAC Address: Target device's MAC address. The two dashes -- indicate that no MAC address was provided from the server.
Results
- Lookup Time: How long it took to resolve the URL into an IP address
- Response Times: How long it took for the LinkRunner to receive a response from the target after sending each of the three Pings
- Threshold: The Timeout Threshold indicated in the test's settings
Results Codes: Final status of the test (Success or Failure) for each of the three Pings
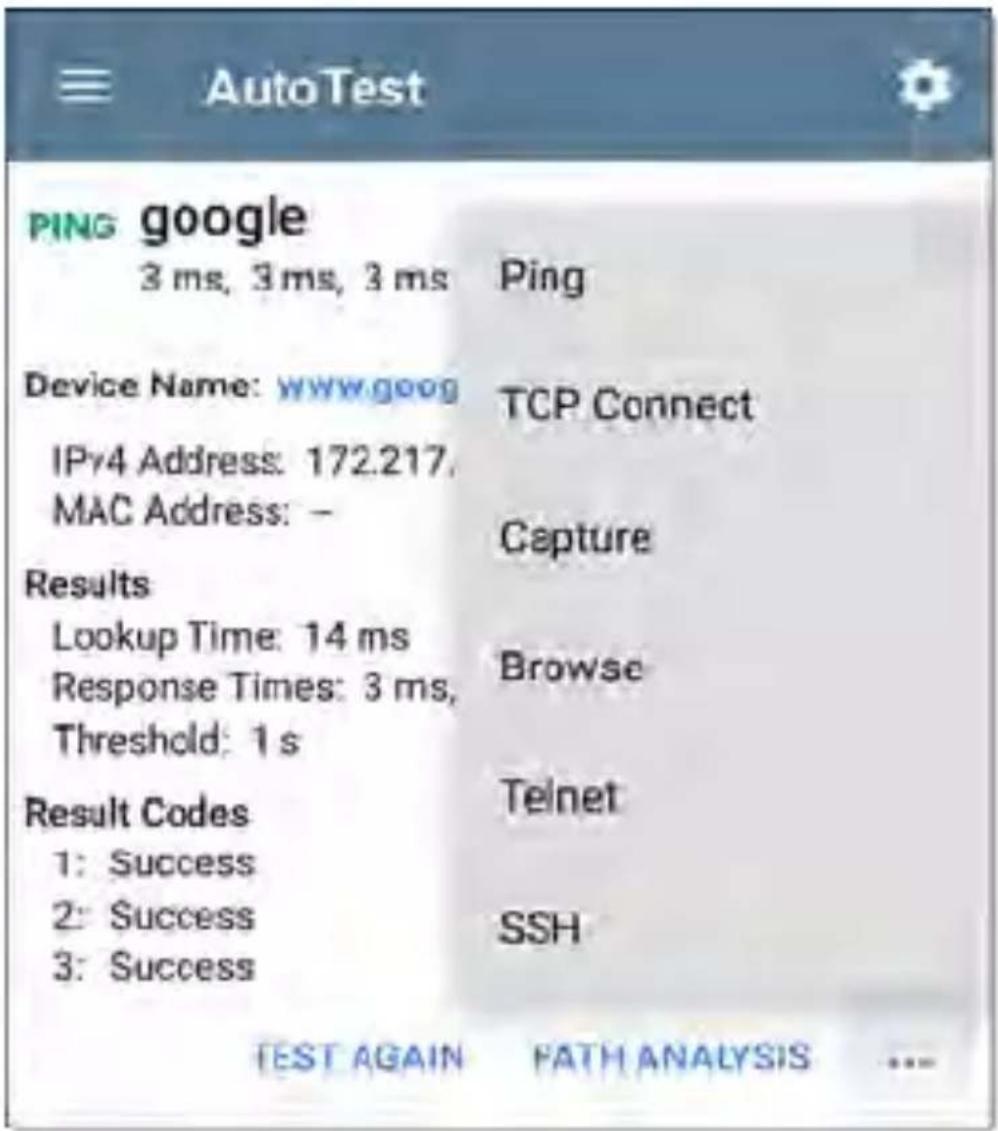
text_image
AutoTest PING google 3 ms, 3 ms, 3 ms Ping Device Name: www.goog TCP Connect IPv4 Address: 172.217, MAC Address: - Capture Results Lookup Time: 14 ms Response Times: 3 ms, Threshold: 1 s Browse Result Codes 1: Success 2: Success 3: Success Telnet SSH TEST AGAIN FATH ANALYSIS ...Touch blue links or the blue action overflow icon at the bottom of the test results screens to run the Ping TEST AGAIN, open another testing app, Browse to the Ping target address in your web browser, or start a Telnet or SSH session.
AutoTest TCP Connect Test
A TCP Connect test opens a TCP connection with the selected target to test for port availability using a 3-way handshake (SYN, SYN/ACK, ACK). The AutoTest Target TCP Connect test runs three connection tests and reports the response times.
TCP Connect Test Settings
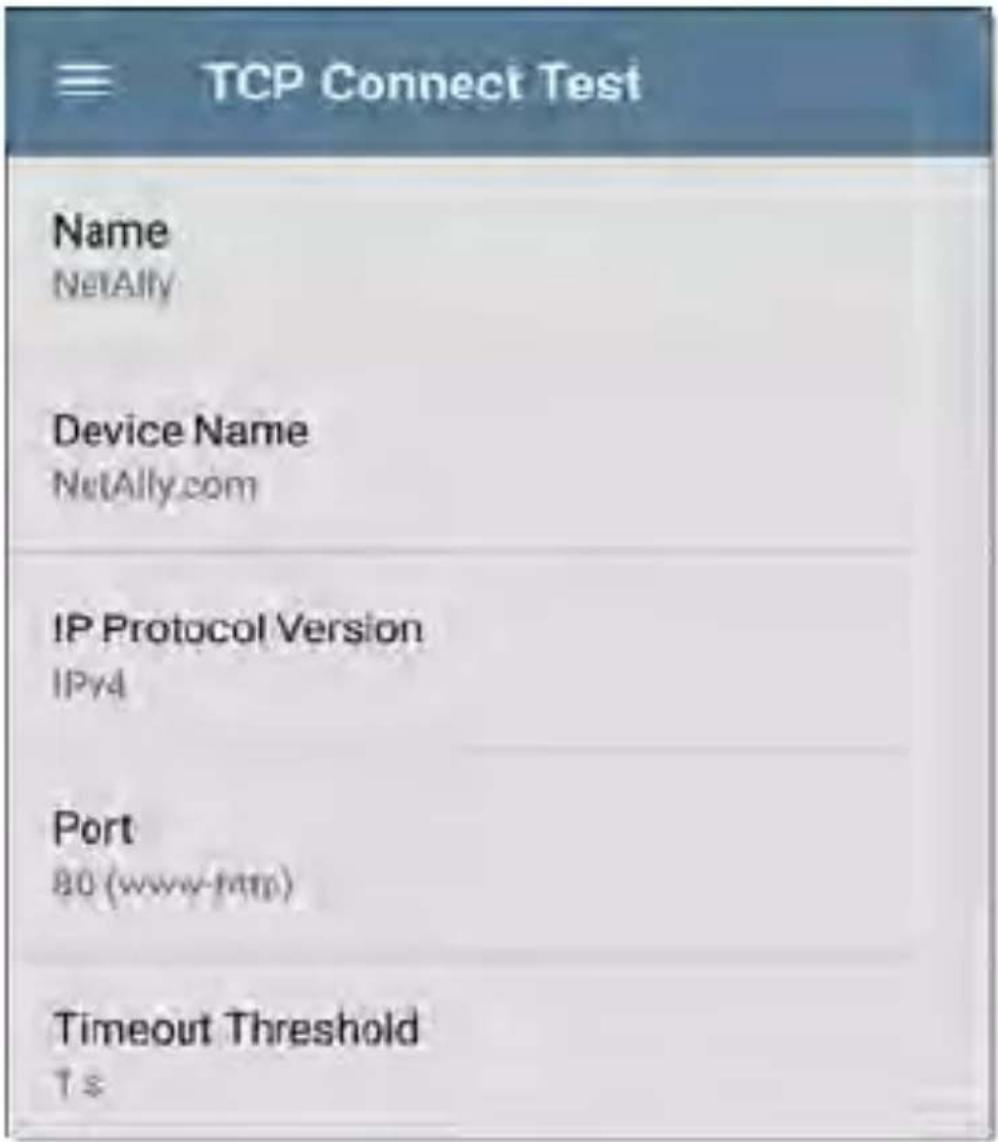
text_image
TCP Connect Test Name NetAlly Device Name NetAlly.com IP Protocol Version IPv4 Port 80 (www-rntp) Timeout Threshold 1 sName: This field allows you to assign a custom name to the test. The name appears on the target test card in the profile.
Device Name: Enter the IP address or URL of the target you want to test. If you enter an IP address, the DNS lookup portion of the test will be skipped.
IP Protocol Version: IPv4 is used by default. Touch the field to switch between IPv4 and IPv6.
Port: Specify the TCP port number LinkRunner will use to connect to the target.
Timeout Threshold: This threshold controls how long the LinkRunner waits for a response from the target before failing the test.
TCP Connect Test Results

text_image
TCP NetAlly 80 ms, 76 ms, 82 ms >The TCP card shows the test name entered in the settings and the three response times from the target.
Touch the card to open the TCP results screen
AutoTest TCP Results Screen
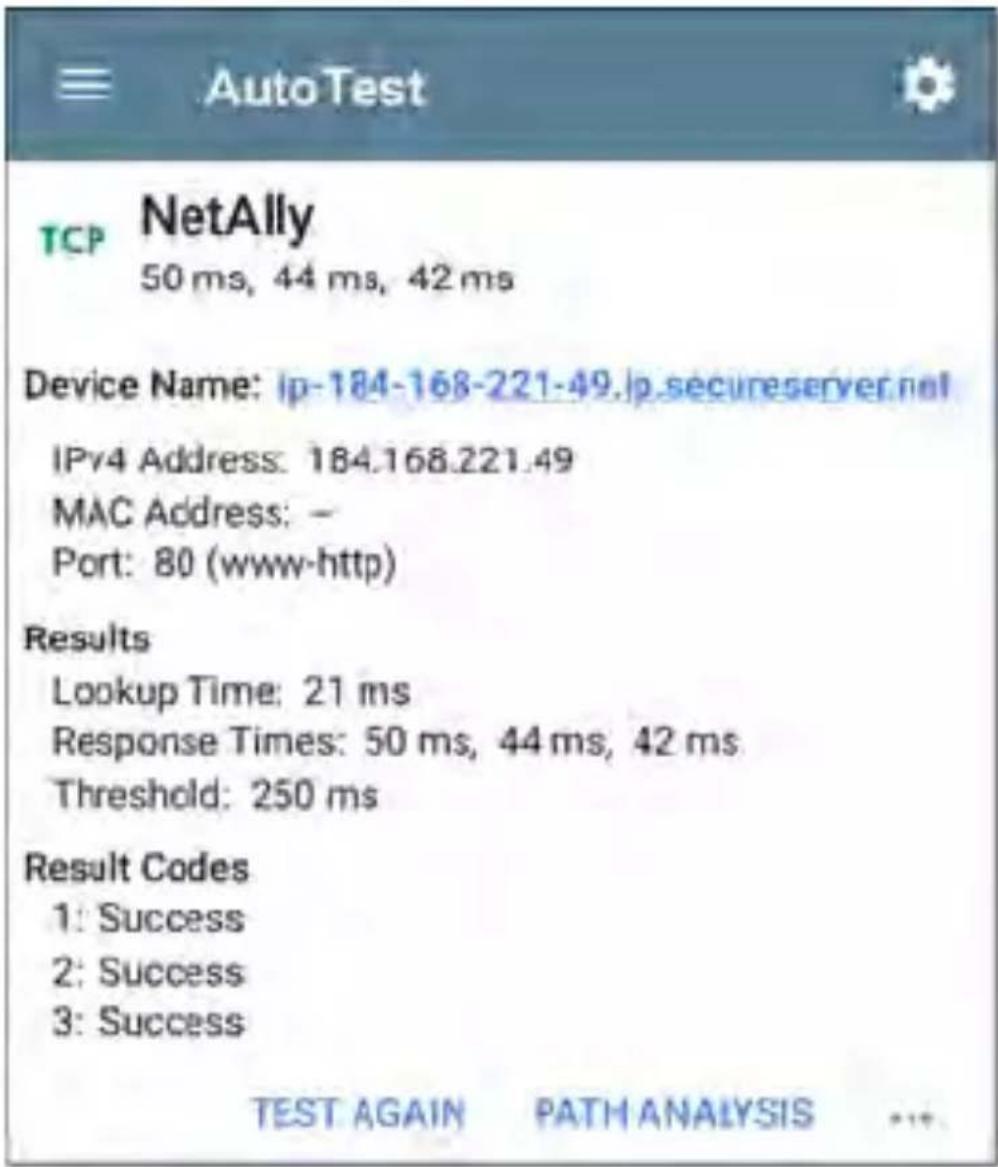
text_image
TCP NetAlly 50 ms, 44 ms, 42 ms Device Name: ip-184-168-221-49.jp.secureserver.net IPv4 Address: 184.168.221.49 MAC Address: - Port: 80 (www-http) Results Lookup Time: 21 ms Response Times: 50 ms, 44 ms, 42 ms Threshold: 250 ms Result Codes 1: Success 2: Success 3: Success TEST AGAIN PATH ANALYSIS ...Device Name: DNS name of the device tested
IPv4 or IPv6 Address: IP address of the target device
MAC Address: Device's MAC address. The two dashes -- indicate that no MAC address was provided.
Port: Port number tested
Results
Lookup Time: How long it took to resolve the URL into an IP address
Response Times: How long it took for the LinkRunner to receive a response from the server for each of the three connect tests
Threshold: The Timeout Threshold indicated in the test's settings
Results Codes: Final status of the test (Success or Failure) for each of the three Pings
HTTP Test
The HTTP test performs a comprehensive end user response time (EURT) measurement when downloading the specified web page. The target can be an IPv4 address, IPv6 address, or URL.
HTTP Test Settings
HTTP settings allow test grading criteria based on responses and return code in addition to the time threshold.
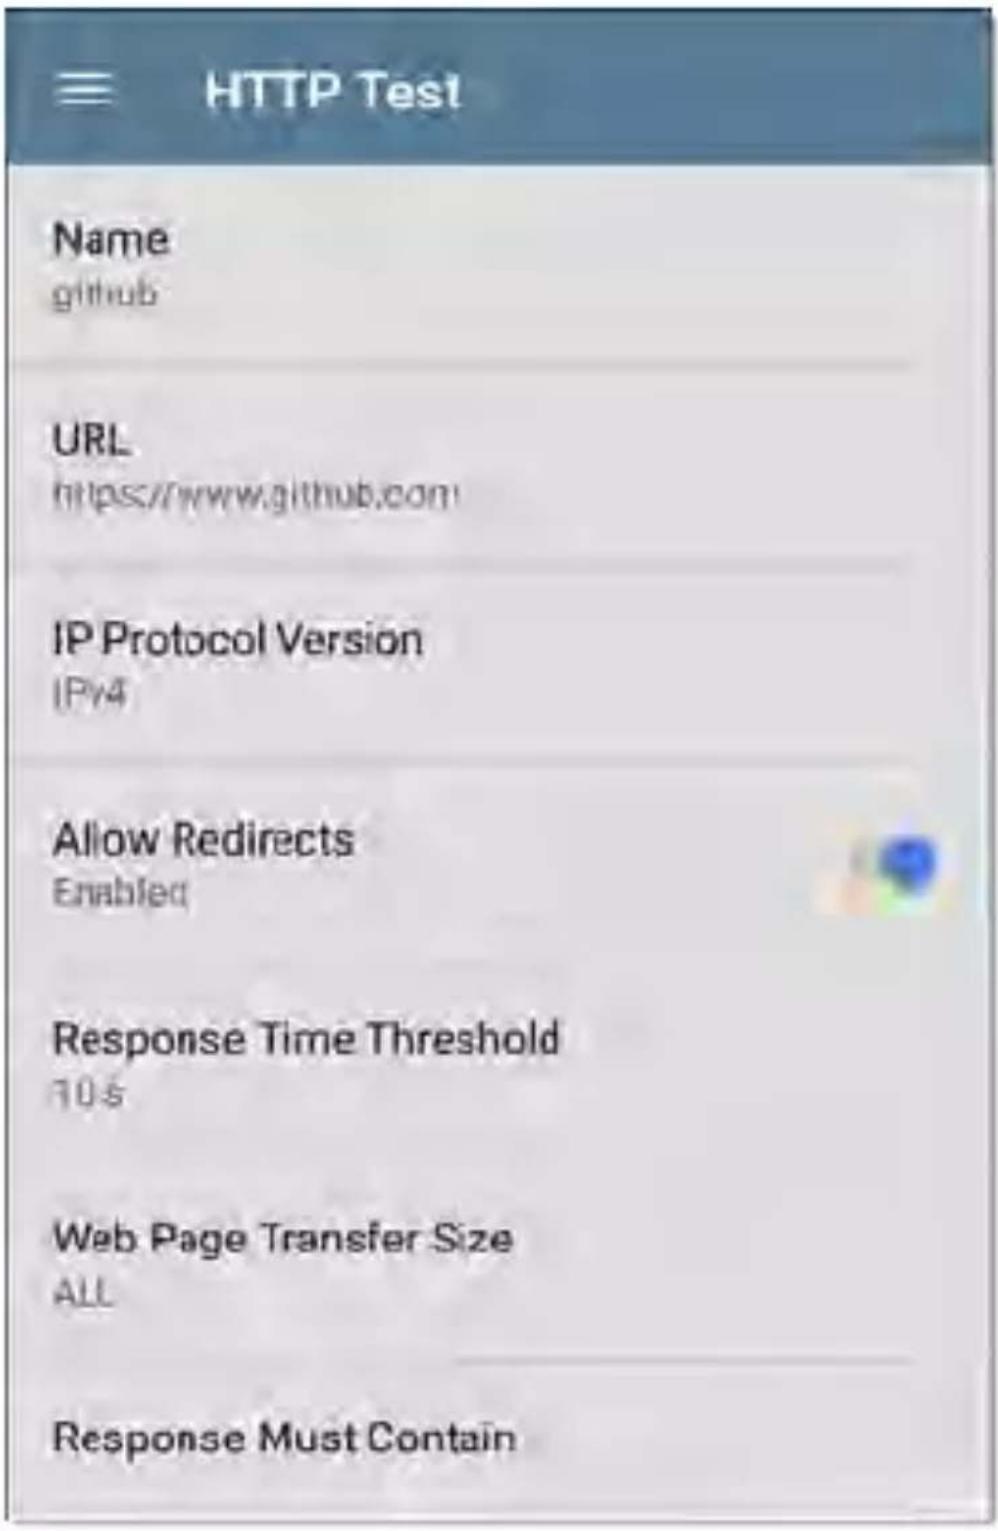
text_image
HTTP Test Name github URL https://www.github.com/ IP Protocol Version IPv4 Allow Redirects Enabled Response Time Threshold 10.5 Web Page Transfer Size ALL Response Must ContainName
This field allows you to assign a custom name to the test. The name appears on the target to card in the profile.
URL
Enter a target address. To reach web servers that operate on a non-default port, enter a colon (:) and specify the port number after the URL.
IP Protocol Version
IPv4 is used by default. Touch the field to switch between IPv4 and IPv6.
Allow Redirects
Touch the toggle button to permit web redirects when trying to connect to the target.
Response Time Threshold
This threshold controls how long the LinkRunner waits for a response from the URL before failing the test. Touch the field to change the value.
Web Page Transfer Size
This setting allows you to limit the amount of data downloaded, ranging from the HTML Header Only to the entire page (ALL). Touch the field to select a different transfer size.
| Response Must Contain |
| Response Must Not Contain |
| Return Code200 - OK |
| HTTP ProxyDisabled |
Response Must Contain
Text entered here functions as pass/fail test criteria based on the presence of the text string on a specified server or URL. To construct a text string, enter a word or several words with exact spacing. When specifying several words, they must appear consecutively at the source. The test passes if the text string is found. If the string is not found, the test fails with the Return Code: "Response does not contain required text."
Response Must Not Contain
Like the setting above, except text entered here functions as pass/fail test criteria based on the absence of the text string on a specified server or URL. The test passes if the text string is no found. If the string is found, the test fails with the return code: "Response contains excluded text."
Return Code
The Return Code set here functions as pass/fai test criteria. The default is "OK (HTTP 200)." Touch the field to select a different Return Code from the list. If your selected Return Code value matches the actual return code value, the test passes, and if LinkRunner receives a different return code, the test fails.
HTTP Proxy
The Proxy control in target test settings utilizes the server address and port specified in the main profile settings. Touch the toggle to use those Proxy settings. See Wired Profile Settings.
HTTP Test Results

text_image
HTTP github 1.114 s >The HTTP card shows the test name entered in the test settings and response time from the target.
HTTP Test Results Screen
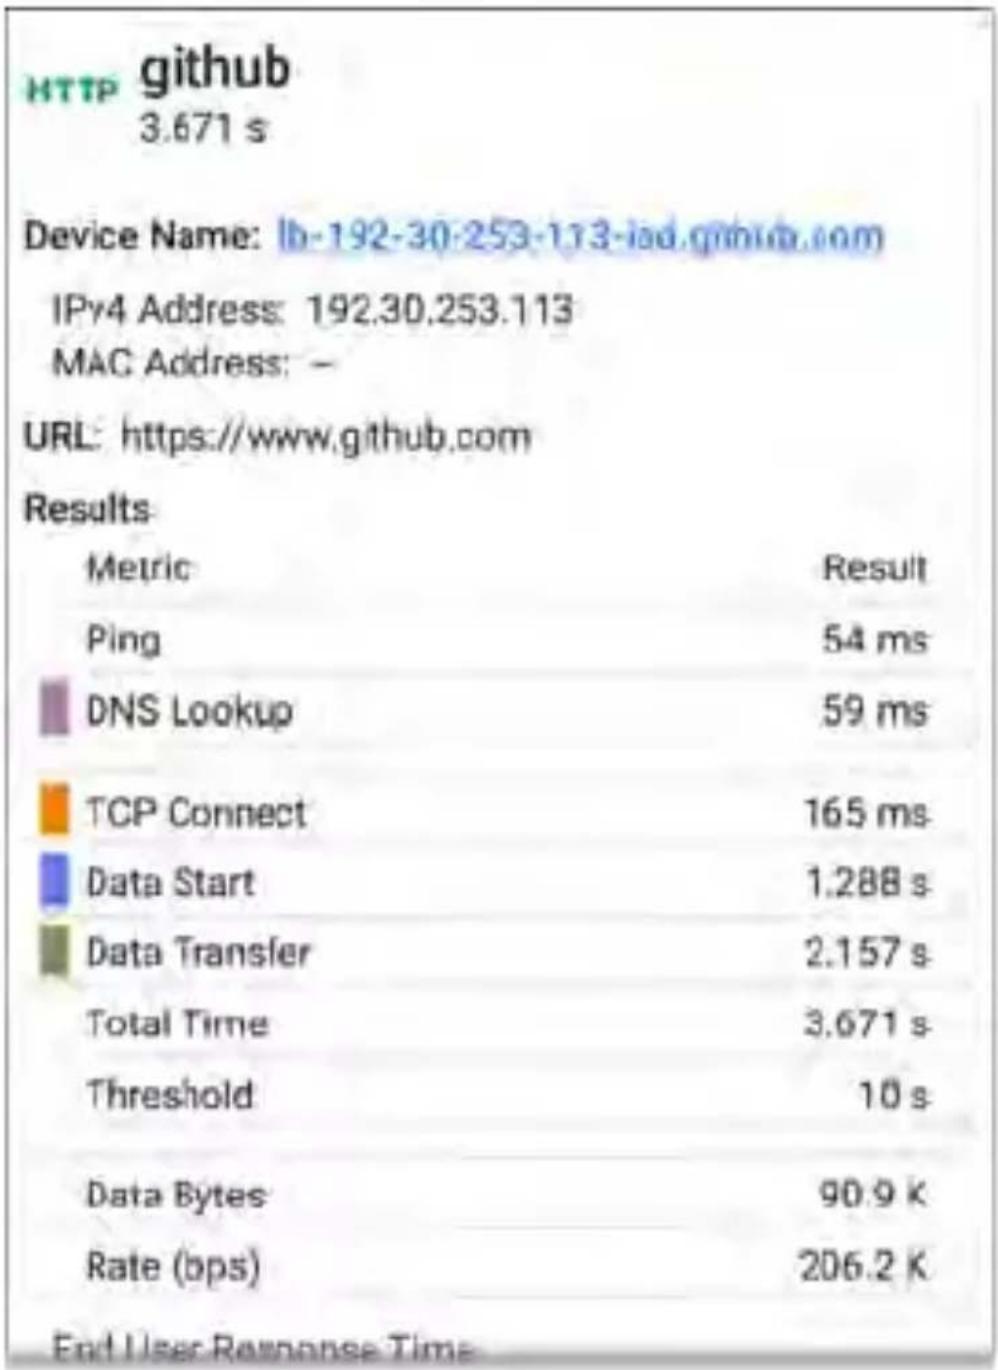
text_image
HTTP github 3.671 s Device Name: lb-192-30-253-113-iad.github.com IPv4 Address: 192.30.253.113 MAC Address: - URL: https://www.github.com Results Metric Result Ping 54 ms DNS Lookup 59 ms TCP Connect 165 ms Data Start 1.288 s Data Transfer 2.157 s Total Time 3.671 s Threshold 10 s Data Bytes 90.9 K Rate (bps) 206.2 K End User Response TimeDevice Name: DNS name of the server tested IPv4 or IPv6 Address: IP address of the server
MAC Address: Server's MAC address. The two dashes -- indicate that no MAC address was provided from the server.
URL: The target URL
Results
Ping: A ping test runs simultaneously with the HTTP test, and this result field displays the Pir response time. If the HTTP test finishes before the ICMP echo reply packet arrives, dashes -- a displayed for the ping test results. Ping results do not affect the Pass/Fail status of the test.
DNS Lookup: Amount of time it took to resolve the URL to an IP address. If you enter an IP address, DNS lookup is not required, so dashes are displayed to indicate that this part of the test was not executed.
TCP Connect: Amount of time it took to open the port on the server
Data Start: Time to receive the first frame of HTML from the web server
Data Transfer: Time to receive the data from the target server
Total Time: The end user response time (EURT) which is the total time it took to download the web page. It is the sum of DNS lookup, TCP connect, data start, and data transfer time. If the Total Time exceeds the Response Time Threshold in the settings, test will fail.
If the Response Time Threshold is exceeded during a step in the test, the current phase of the test (DNS, Lookup, TCP Connect, Data Start, or Data Transfer) is denoted with a red dot, and the rest of the test is aborted.
Threshold: The Response Time Threshold from the test settings
Data Bytes: Total number of data bytes transferred. This does not include header bytes
Rate (bps): The measured data transfer rate
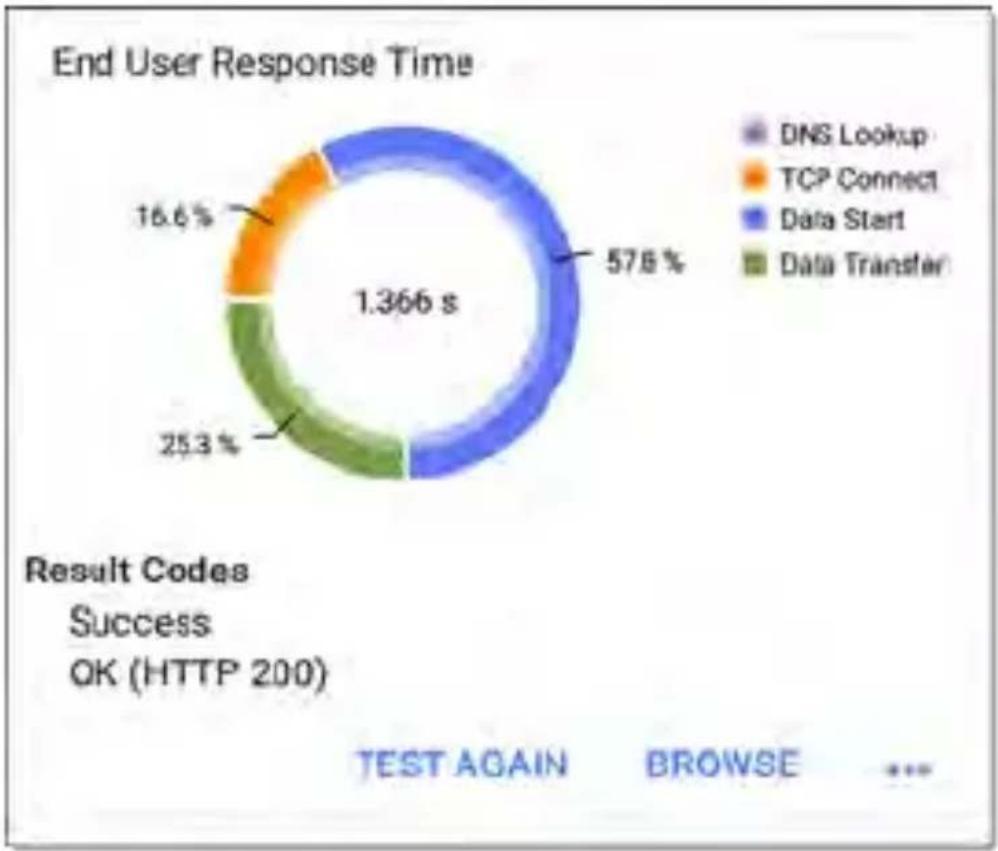
pie
End User Response Time | Category | Percentage (%) | | :--- | :--- | | DNS Lookup | 16.6 | | TCP Connect | 57.8 | | Data Start | 25.3 | | Data Transfer | 13.66 |End User Response Time : Pie chart of the times for each phase of the test (DNS, Lookup, TCP Connect, Data Start, and Data Transfer)
Results Codes: Final status of the test (Success or Failure)
The HTTP test also shows the Return Code fro the website server.
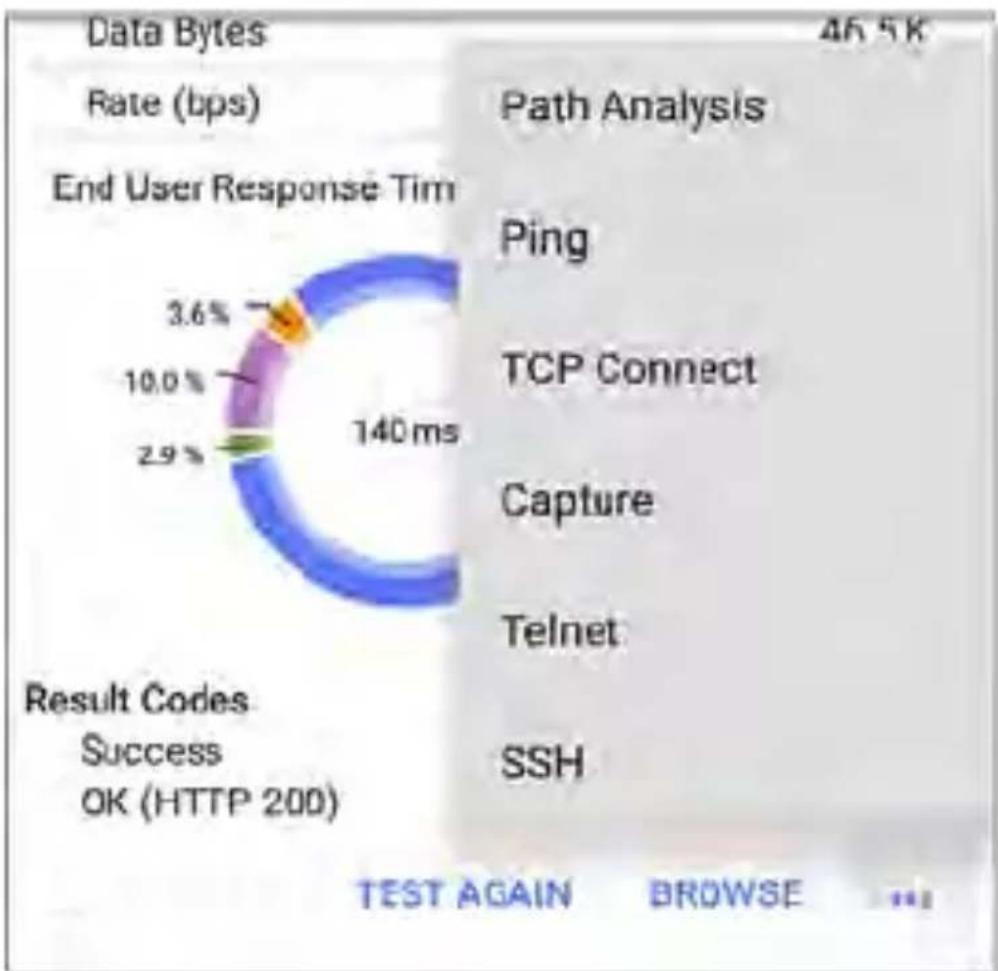
pie
| Category | Value (%) | |---|---| | End User Response Tim | 3.6 | | Data Bytes | 10.0 | | Rate (bps) | 2.9 | | Path Analysis | 46.5K | | Ping | | | TCP Connect | | | Capture | | | Telnet | | | SSH | | Result Codes: Success OK (HTTP 200) TEST AGAIN BROWSETouch blue links or the blue action overflow icon at the bottom of the test results screens to run the HTTP TEST AGAIN, open another testing app, or Browse to the target address in your web browser.
FTP Test
The FTP test performs a file upload to or download from an FTP server, allowing verification of server and network performance.
The target can be an IPv4 address, IPv6 address or URL. The results provide a complete breakdown of the overall file transfer time into its component parts.
FTP Test Settings
FTP settings allow you to specify a Get or Put test and the file path and name.
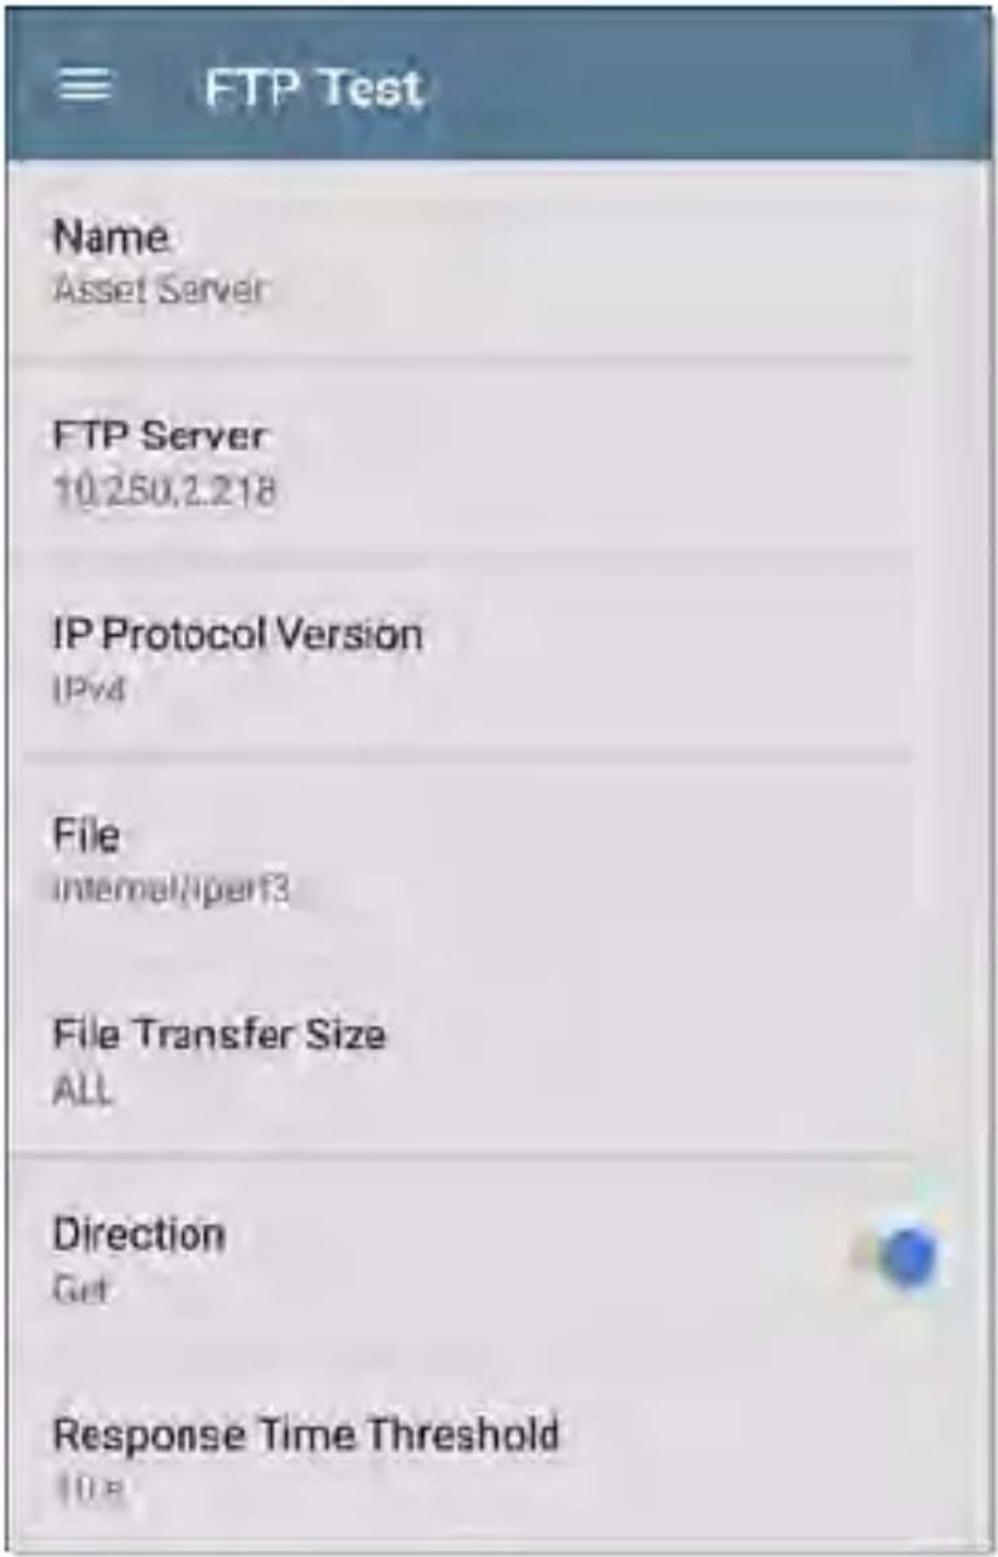
text_image
FTP Test Name Asset Server FTP Server 10.250.2.218 IP Protocol Version IPv4 File Internal/Perf3 File Transfer Size ALL Direction Get Response Time Threshold 10.8Name
This field allows you to assign a custom name to the test. The name appears on the target to card in the profile.
FTP Server
Enter the IPv4 address or URL of the FTP serve you want to test. If you enter an IP address, t DNS Lookup portion of the test is skipped.
IP Protocol Version
IPv4 is used by default. Touch the field to switch between IPv4 and IPv6.
File
This setting specifies the path and filename of the file that is downloaded from (Get) or uploaded to (Put) the server, based on the Direction setting below. Touch the field to enter the file path and name.
File Transfer Size
This setting lets you limit the amount of data to be downloaded or uploaded. The default transfer size is ALL.
- When the Direction setting is Get, a transfer size of ALL causes the download to continue until the entire file is downloaded or the Response Time Threshold is exceeded.
Specifying a transfer size that is greater than file being retrieved does not cause the test to fail. The test stops when the file has finished downloading.
- When the Direction setting is Put, the default transfer size of ALL causes the LinkRunner to create and upload a file that is 10 MB.
Direction
Touch the toggle button to switch between a Get (download the File from the server) or Put (upload the File to the server) test.
- If Direction is set to Get, the file is retrieved, and the size and data rate are calculated. This data is discarded as soon as it is downloaded and is not retained on the LinkRunner.
- If Direction is set to Put, the File named above is created on the FTP server. The size of this file is determined by the File Transfer Size setting. The file contains a text string indicating that it was sent from
the LinkRunner, and the test string is repeated to produce the set file size.
Response Time Threshold
This threshold controls how long the LinkRunner waits for a response from the FTP server before failing the test. Touch the field to change the value.
text_image
Username Password HTTP Proxy DisabledUsername and Password
Enter these credentials to access the target server you specified. Enter "anonymous" as the username to establish an anonymous connection. The test will fail if the configured username or password are not valid on the target FTP server.
HTTP Proxy
The Proxy control in target test settings utilizes the server address and port specified in the main profile settings. See Wired Profile Settings.
FTP Test Results

text_image
FTP Asset Server 171 ms >The FTP card shows the test name entered in the test settings and response time from the target.
FTP Test Results Screen
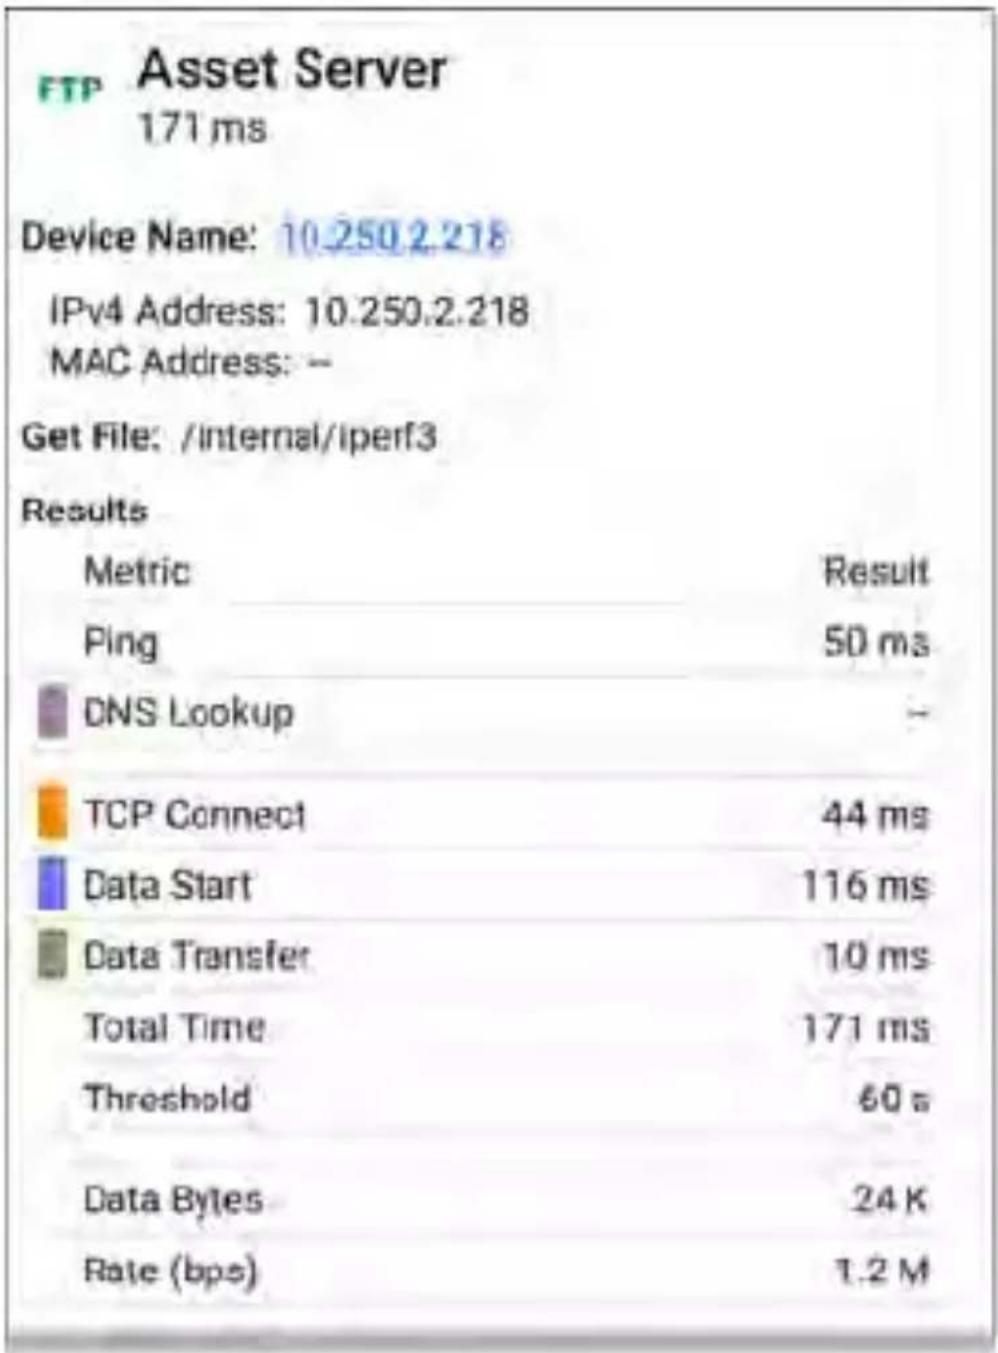
text_image
FTP Asset Server 171 ms Device Name: 10.250.2.218 IPv4 Address: 10.250.2.218 MAC Address: — Get File: /internal/iperf3 Results Metric Result Ping 50 ms DNS Lookup — TCP Connect 44 ms Data Start 116 ms Data Transfer 10 ms Total Time 171 ms Threshold 60 s Data Bytes 24 K Rate (bps) 1.2 MDevice Name: Hostname of the server tested IPv4 or IPv6 Address: IP address of the server
MAC Address: Server's MAC address. The two dashes -- indicate that no MAC address was provided from the server.
Get File: File path and name entered in the settings that was transferred to or from the FT server.
Results
Ping: A ping test runs simultaneously with the FTP test, and this result field displays the Ping response time. If the FTP test finishes before the ICMP echo reply packet arrives, dashes -- a displayed for the ping test results. Ping results do not affect the Pass/Fail status of the test.
DNS Lookup: Amount of time it took to resolve the URL to an IP address. If you enter an IP address, DNS lookup is not required, so dashes are displayed to indicate that this part of the test was not executed.
TCP Connect: Amount of time it took to open the port on the server
Data Start: Time to receive the first frame from the FTP server
Data Transfer: Time to receive the file from the target server
Total Time: The end user response time (EURT) which is the total time it took to download the web page. It is the sum of DNS lookup, TCP connect, data start, and data transfer time. If the Total Time exceeds the Response Time Threshold in the settings, the test will fail.
If the Response Time Threshold is exceeded during a step in the test, the current phase of the test (DNS, Lookup, TCP Connect, Data Start, or Data Transfer) is denoted with a red dot, and the rest of the test is aborted.
Threshold: The Response Time Threshold from the test settings
Data Bytes: Total number of data bytes transferred. This does not include header bytes
Rate (bps): The measured data transfer rate

pie
End User Response Time | Category | Rate (ups) (%) | | :--- | :--- | | DNS Lookup | 171 | | TCP Connect | 259 | | Data Start | 68.2 | | Data Transfer | 5.9 | Result Codes Success Closing data connection; requested file action successful (FTP 226) TEST AGAIN PATH ANALYSISEnd User Response Time: Pie chart of the time for each phase of the test (DNS, Lookup, TCP Connect, Data Start, and Data Transfer)
Results Codes: Final status of the test (Success or Failure)
The FTP test also shows the Return Code from the server.
Touch blue links or the blue action overflow icon at the bottom of the test results screens to run the FTP Test Again, open another testing app, or Browse to the FTP server in your web browser.
text_image
PING /TCPPing/TCP Test App
The Ping/TCP test app runs a Ping or TCP Connect test to your chosen target, allowing you to monitor connectivity changes.
A Ping test sends an ICMP echo request to the selected target to determine whether the server or client can be reached and how long it takes to respond. A TCP Connect test opens a TCP connection with the selected target to test for port availability using a 3-way handshake (SYN, SYN/ACK, ACK).
You can open the TCP/Ping app from the Home screen, or you can select Ping or TCP Connect from another app, such as AutoTest or Discovery, while viewing a device's details.
Ping/TCP Settings
To configure a test, you can manually enter a hostname or IP address in the settings, or you can select Ping or TCP Connect from another testing app's device screen.
Populating Ping/TCP from Another App
When you open the Ping/TCP app from another app, the address is pre-populated as the Ping TCP target device. For example, the FAB menu on the Discovery app screen shown below contains the option to open the Ping/TCP app.
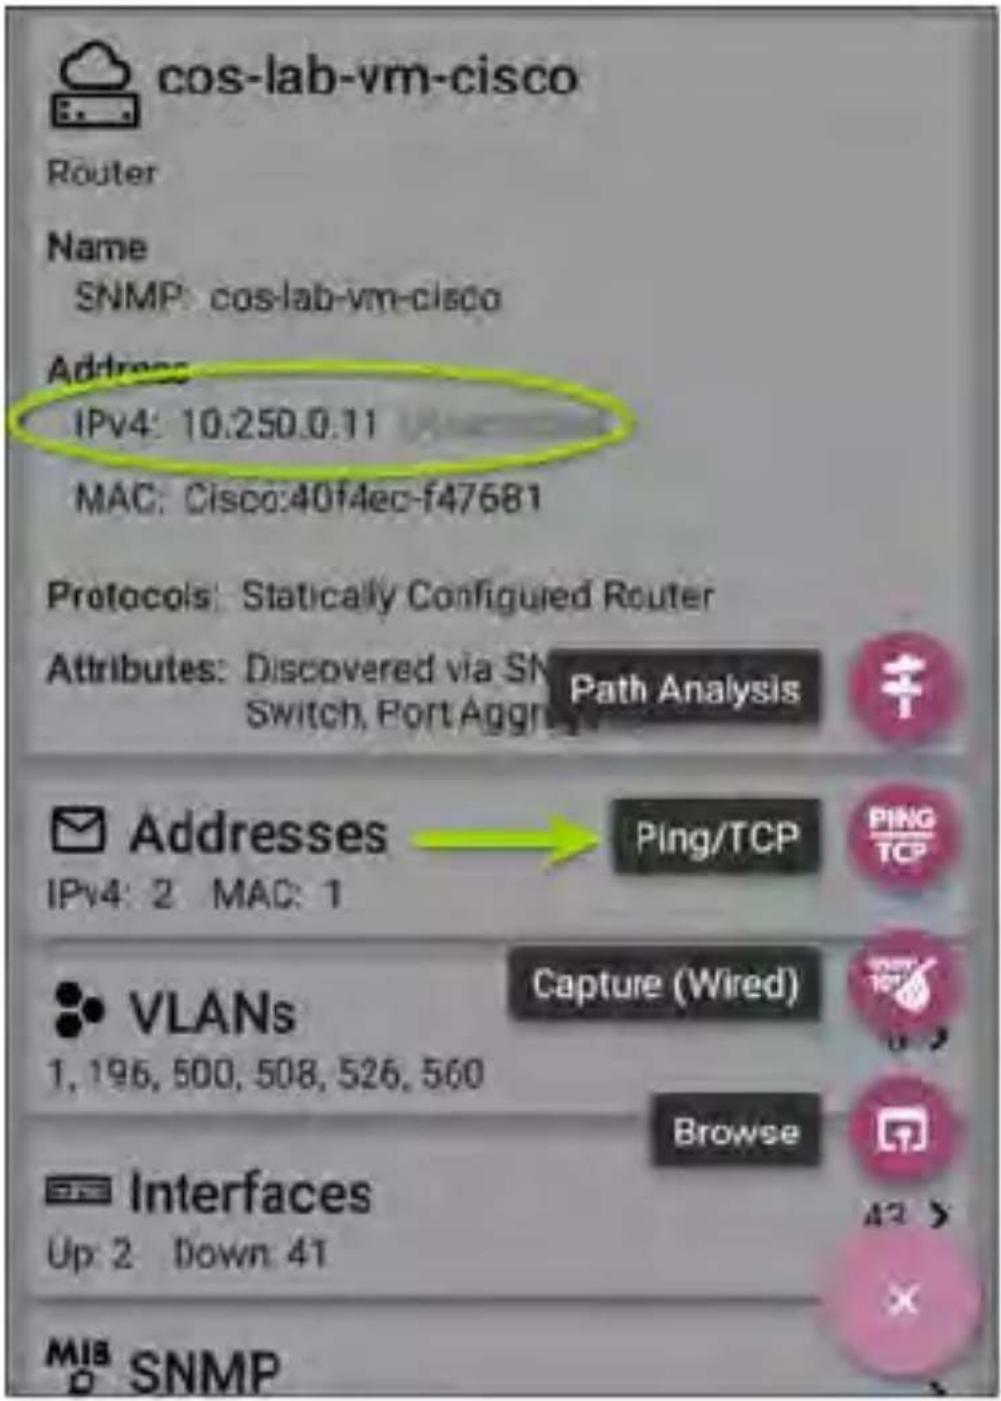
text_image
cos-lab-vm-cisco Router Name SNMP: cos-lab-vm-cisco Address: IPv4: 10.250.0.11 MAC: Cisco:40f4ec-f47681 Protocols: Statically Configured Router Attributes: Discovered via SN Switch, Port Aggr Path Analysis Addresses IPv4: 2 MAC: 1 Pling/TCP PING TCP VLANs Capture (Wired) 1, 196, 500, 508, 526, 560 Browse Interfaces Up 2 Down 41 MIS SNMPIf the Ping/TCP app is opened from this screen the IPv4 address from the Discovery app is already configured as the Ping/TCP target.
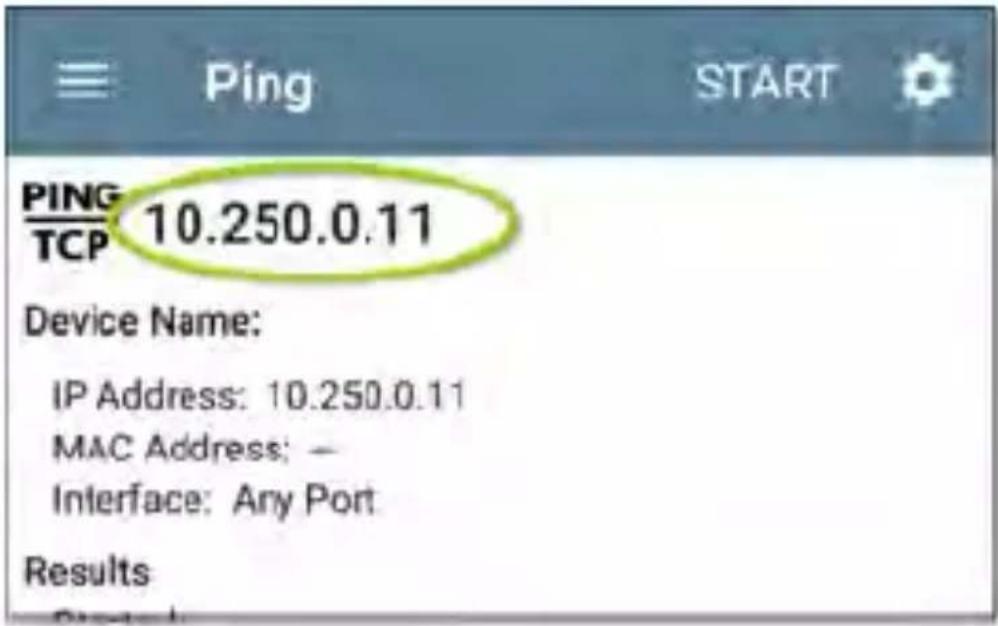
text_image
PING TCP 10.250.0.11 Device Name: IP Address: 10.250.0.11 MAC Address: - Interface: Any Port ResultsConfiguring Ping/TCP Settings Manually
To configure the target and settings manually, open the app's settings.
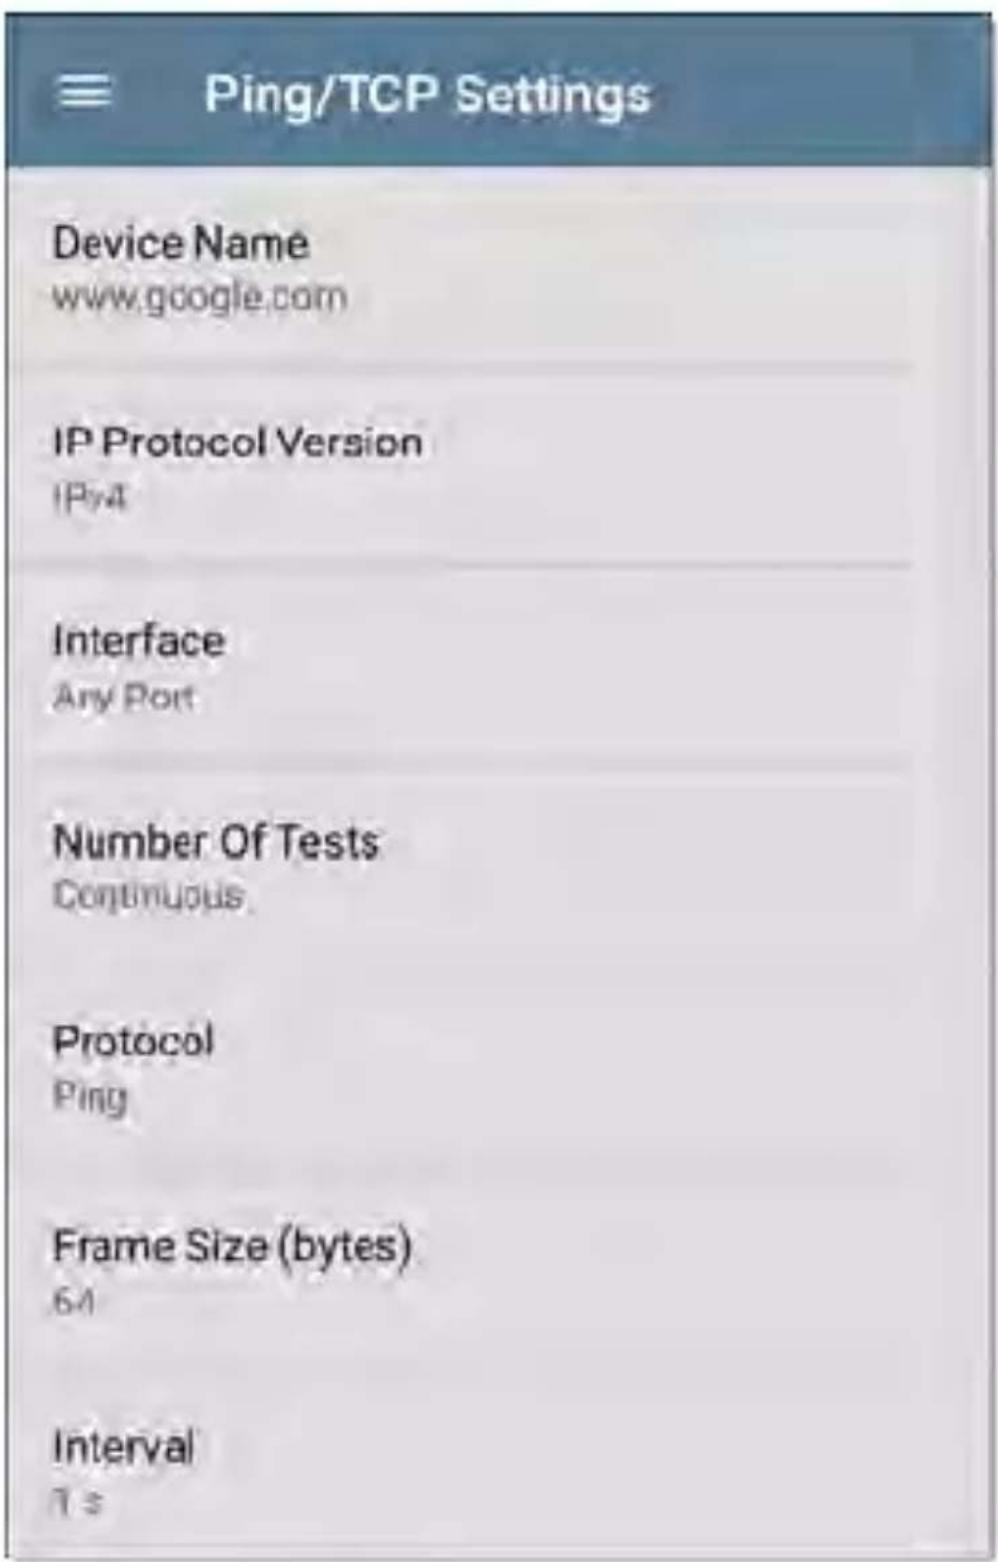
text_image
Ping/TCP Settings Device Name www.google.com IP Protocol Version IPvt Interface Any Port Number Of Tests Continuous Protocol Ping Frame Size (bytes) 64 Interval 1 sDevice Name: Enter the IP address or DNS name of the target.
IP Protocol Version: IPv4 is used by default. Touch the field to enable IPv6 instead.
Interface: This setting determines the LinkRunner port from which the test runs. Touch the field to select Any Port, Wired
See Test and Management Ports for explanations of the different ports.
Number of Tests: Touch to select the number of Ping or TCP connect tests you want to run. The default setting of Continuous keeps running tests until you touch the STOP button.
Protocol: Tap to select the Ping or TCP Connect protocol for the test.
Some of the following settings depend on the selected protocol.
Frame Size (bytes): This setting only appears if the Ping Protocol is selected. It specifies the total size of the payload and header the LinkRunner sends. Tap a radio button to select a new size, or enter a Custom Value from 64 t 1518 bytes.
To test the Maximum Transmission Unit (MTU) along a route to a target, select the MTU fram size you want to test, and set the Do Not Fragment setting (below) to Enabled.
Interval: This setting only appears if the Ping Protocol is selected. It controls how much time passes between each Ping sent from the LinkRunner. By default, Pings are sent once every second (1 s). Tap a radio button to select a different interval, or enter a Custom Value between 100 and 10,000 milliseconds.
Port: This setting only appears if the TCP Connect Protocol is selected. It indicates the port number your LinkRunner will use to connect to the target address for a TCP Port Open test. If needed, touch the Port field to open a pop-up number pad and enter a new port number. Touch OK to save it.
Timeout Threshold: This threshold controls how long the LinkRunner waits for a response from the target before the test is failed.
Do Not Fragment: This setting only appears if the Ping Protocol is selected. Touch the toggle
button to enable. See the Frame Size setting description above.
Running Ping/TCP Tests
Your unit must be connected to an active wire network (Test or Management Port) to run Ping and TCP Connect tests. Icons in the top Status Bar indicate whether and how your LinkRunner is connected. See Connection Notifications for descriptions of the connection status icons, and select the appropriate Interface (or Any Port) from the Ping/TCP settings.
The default target is google.com. Open the app settings to enter a new target.
To begin the test, touch START.
If the Number of Tests setting is set to Continuous, the Ping/TCP app runs tests to your selected target until you touch STOP.
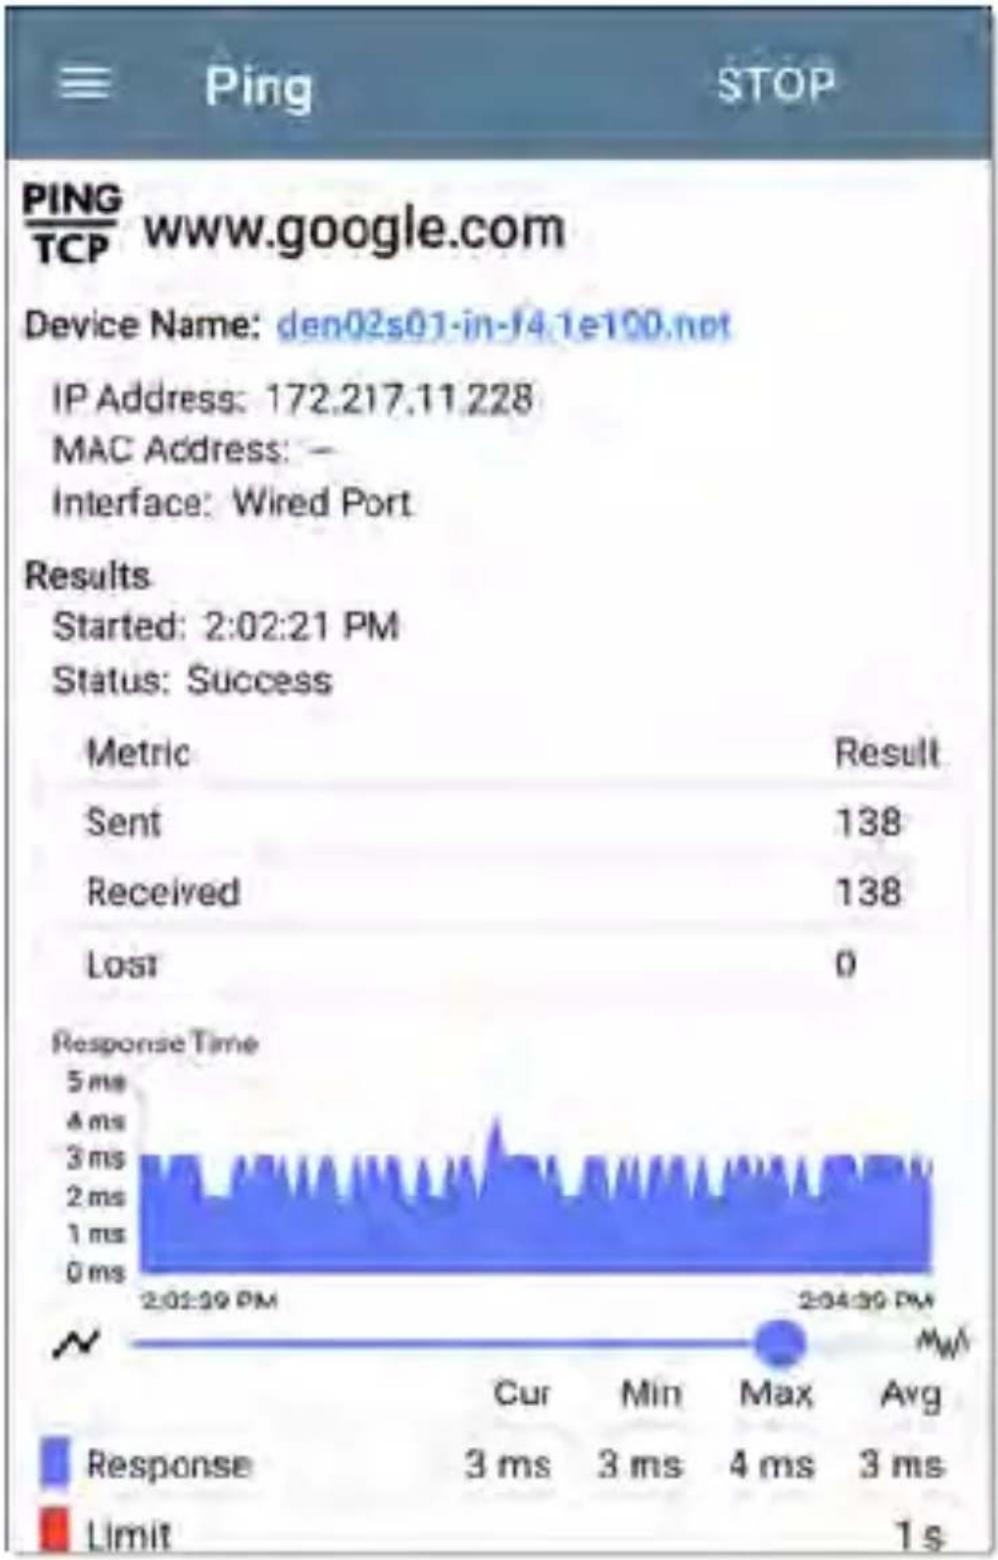
line
| Metric | Value | |--------|-------| | Sent | 138 | | Received | 138 | | Lost | 0 |Device Name: Hostname or address of the target device
IPv4 or IPv6 Address: IP address of the target device
MAC Address: Target device's MAC address. The two dashes -- indicate that no MAC address was provided from the device.
Port: The port number used for the TCP
Connect test. This field does not appear in Pin test results.
Interface: The LinkRunner Test or Management Port from which the test is running
Results
- Started: Time the test started
• Status: Most recent test status - Sent: Number of Pings or TCP SYN packets sent to the target
- Received: Number of Ping or TCP SYN/ACK packets returned from the target
- Lost: Number of Pings or TCP packets that were not returned from the target
Response Time graph: Plots the target device's response times in milliseconds. The graph saves and displays data for up to 24 hours in the past if the unit stays linked.
To pan and zoom on the graph, you can swipe double tap, and move the slider. See the Trending Graphs topic for an overview of the graph controls.
Response: Table display of the Current, Minimum, Maximum, and Average response time measurements
Limit: The Timeout Threshold from the Ping/TCP app's settings
natural_image
Green square icon with white tennis racket symbol (no text or numbers)Capture App
Packet capture is the process of recording network traffic in the form of packets as data streams back and forth over the wired connection. Packet captures can help you analyze network problems, debug client/server communications, track applications and content, ensure that users are adhering to administration policies, and verify network security.
On LinkRunner, the capture process uses the Wired Test port.
You can open the Capture app from the Home screen or using a link from another app, such AutoTest or Discovery.
Capture Settings
The Capture app settings allow you to designate file and slice sizes, and apply filters capture and analyze only certain packet types. For example, you can set a filter to capture only packets related to a specific application (based on IP address and port number).
When you open Capture from Home and do no configure any filters, all packets from the switch are captured. The default capture saves all the packets sent from the local switch to the LinkRunner.
If you open the Capture app from another NetAlly test app, Capture filters are automatically applied. Filters that can be applied from other apps include Wired IP and MAC.
The Capture settings are saved until you clear the filters or open the app with new filters applied.
Touch the settings icon in the Capture screen to configure capture settings.
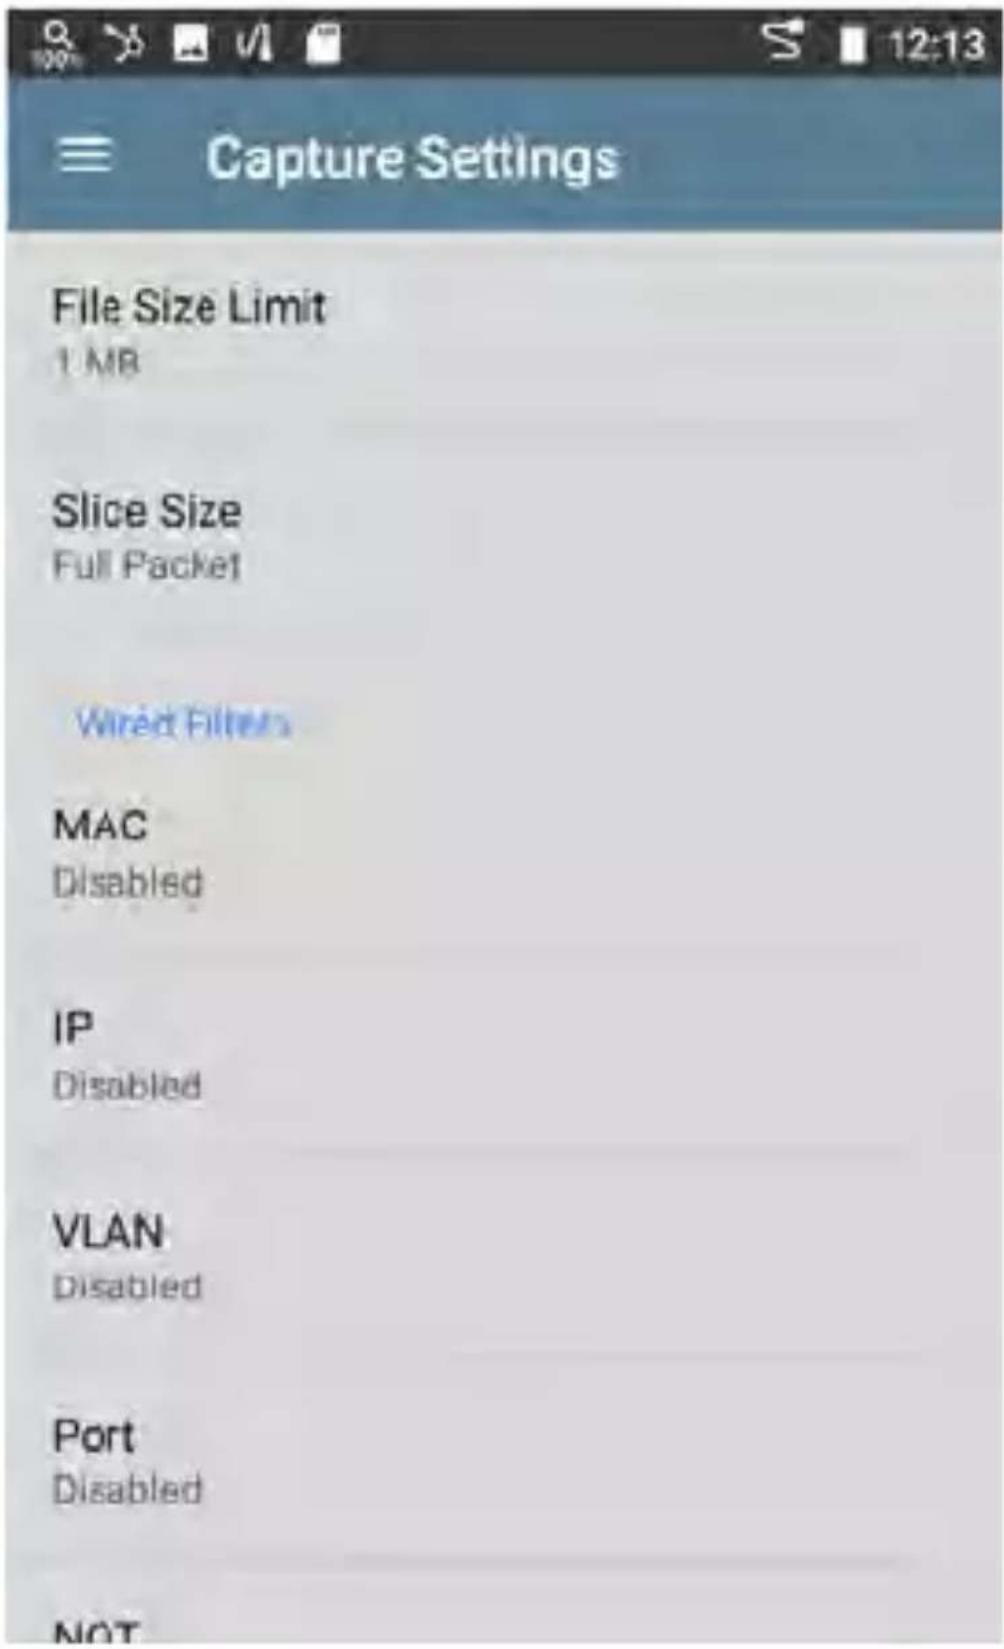
text_image
Capture Settings File Size Limit 1 MB Slice Size Full Packet Wired Filters MAC Disabled IP Disabled VLAN Disabled Port Disabled NOTFile Size Limit: Touch this field to specify a size for the capture file. The default size is 1 MB, and largest size allowed is 1000 MB. The captu
stops when the captured file reaches this size. When capture is running, the capture screen displays the current file size as data is capture
Slice Size: Touch this field to select a specific frame slice size or enter a custom value. The Slice Size setting limits how much of each packet is captured. A smaller slice size is useful when you are interested in the packet's header but do not need to see all the payload data. The default is Full Packet.
Wired Filters
All filters are disabled by default unless you open Capture from another app. Touch the fields below to enable and enter filter values.
MAC: Enter the MAC address of a host to capture only packets that contain the host's MAC address as the source or destination.
IP: Enter the IP address of a host to capture only traffic to and from the host. You can specify an IPv4 or IPv6 address.
VLAN: Enter a VLAN number to capture only traffic tagged for that VLAN.
Port: Specify a port number to capture only traffic from that UDP or TCP port. For example select port 80 to capture HTTP traffic only.
NOT: Touch the toggle to enable this setting, which directs the LinkRunner NOT to capture the values you have entered in the filters above. For example, if you have set up a filter to capture traffic to and from IP 10.250.0.70 on Port 80 and you enable NOT, all traffic will be captured except traffic to and from 10.250.0.70 on port 80.
Running and Viewing Captures
To start Capturing, tap START at the top of the app screen.
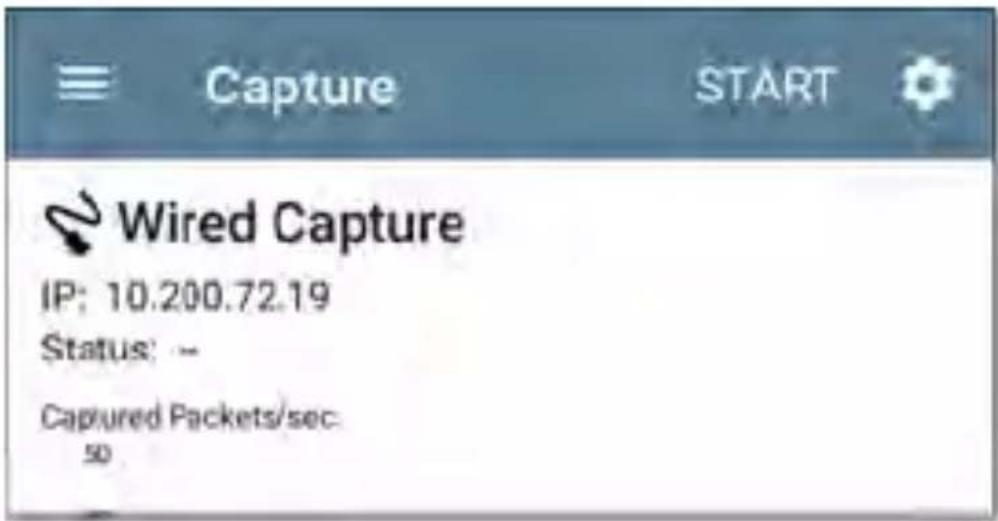
text_image
Capture START Wired Capture IP: 10.200.72.19 Status: -- Captured Packets/sec: 50The current Status of the capture and any applied filters are shown under the capture type. The image above indicates that the app will only capture traffic for IP 10.200.72.19.
View the real-time status of the capture as it is running. If you navigate away from the Capture app, the capture process will continue to run in the background until the File Size Limit (in Capture Settings) is reached.
Tap STOP to stop the running capture before i reaches the File Size Limit.
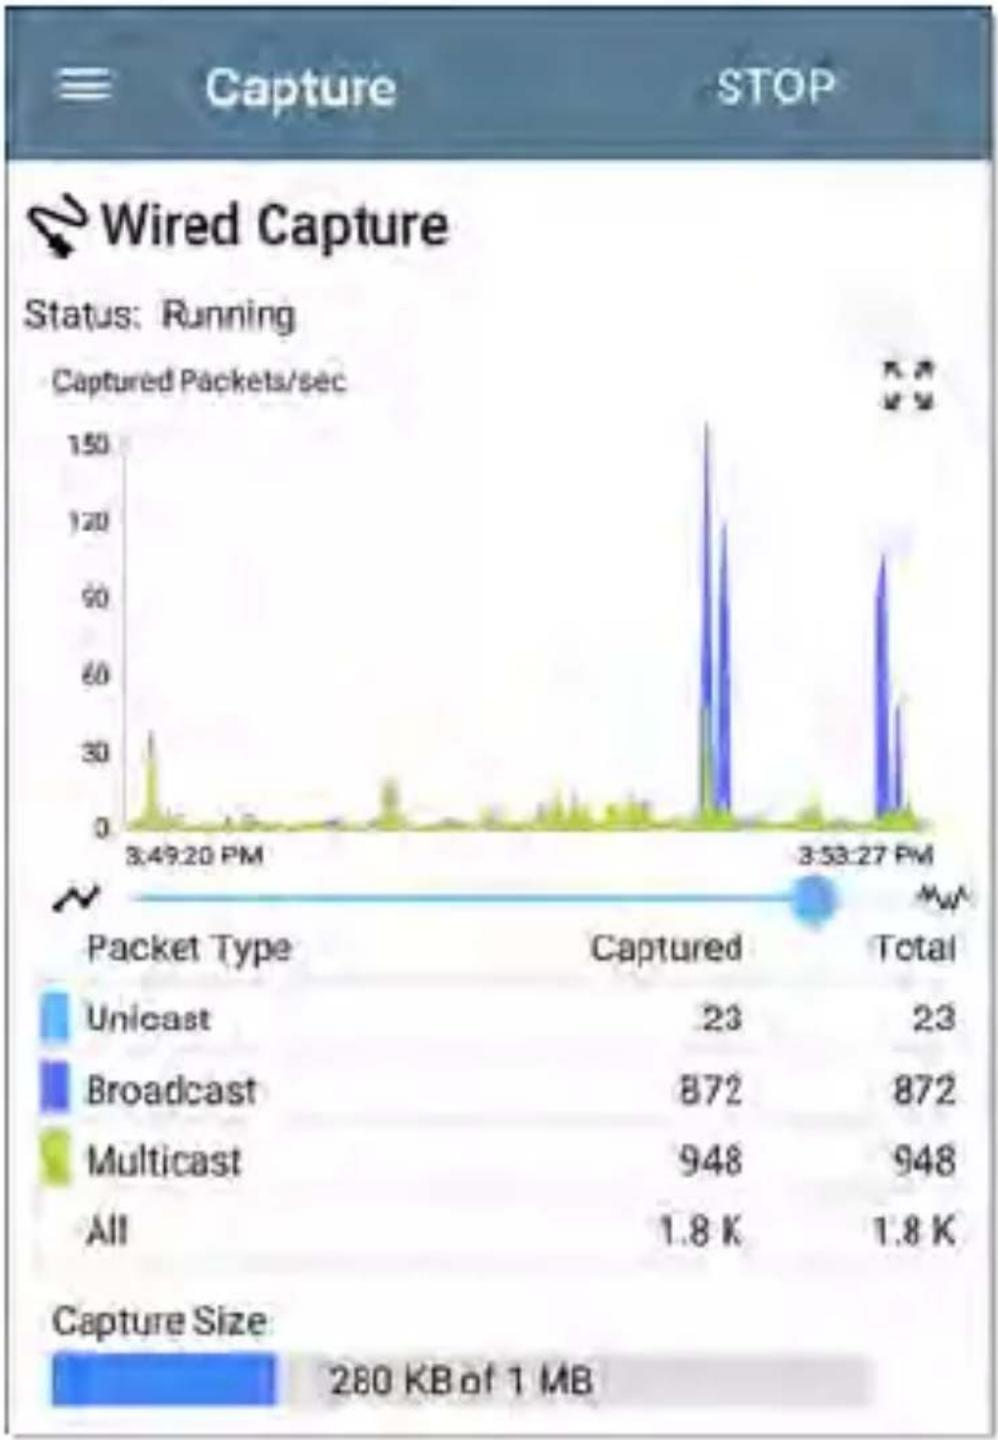
line
| Packet Type | Captured | Total | |-------------|----------|-------| | Unicast | 23 | 23 | | Broadcast | 872 | 872 | | Multicast | 948 | 948 |The Wired graph plots the type and number of packets being captured during the time the capture is running. By default, wired captures include Unicast, Broadcast, and Multicast packet types.
To pan and zoom on the graphs, you can swipe, double tap, and move the slider. See th Trending Graphs topic for an overview of the graph controls.
Once a capture is completed, the Save Capture dialog appears automatically.
Tap the Save icon to reopen this dialog.
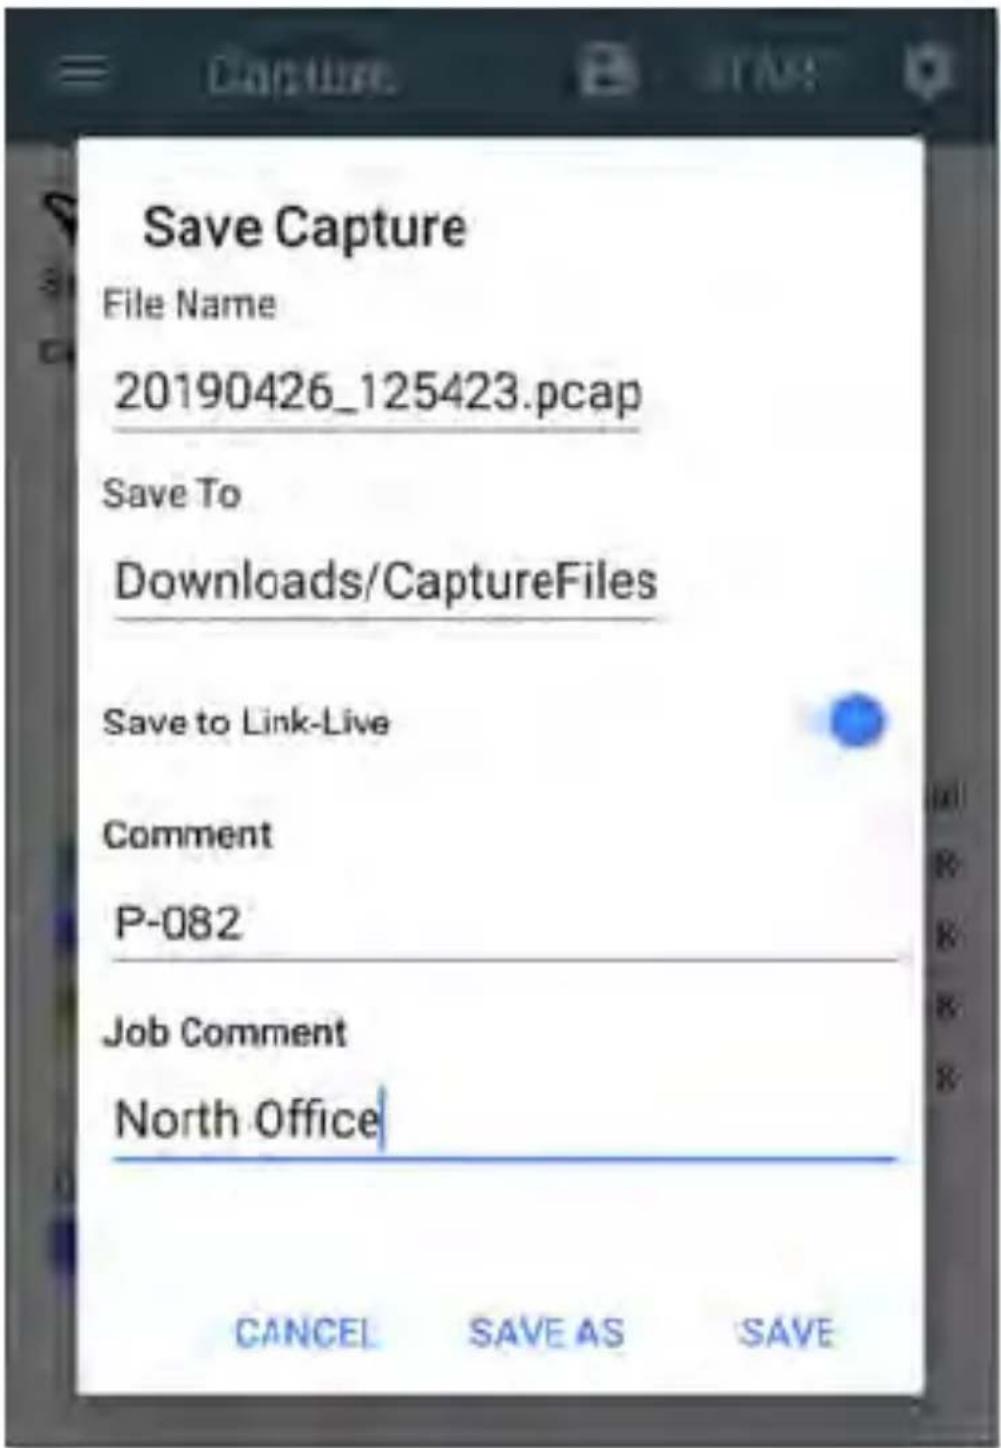
text_image
Save Capture File Name 20190426_125423.pcap Save To Downloads/CaptureFiles Save to Link-Live Comment P-082 Job Comment North Office CANCEL SAVE AS SAVECaptures are saved as .pcap files. Touch any of the fields in the dialog to enter changes.
File Name: Capture files are automatically named using the date and time. Touch this field to enter a custom name.
Save to: By default, capture files are saved in the Downloads folder in the LinkRunner file system, but you can also save them to a Micro SD card or USB storage device or choose a different folder by touching the Save to field. See also Managing Files.
Save to Link-Live: You can also upload capture files to Link-Live and then download them for analysis on a PC. Capture (.pcap) files appear of the Uploaded Files page in Link-Live.
Comment: This comment will be attached to your capture file when it is uploaded to Link-Live.
Job Comment: This is the persistent Job Comment that uploads to Link-Live with all tes results and files, until you change it. Changing the Job Comment here will change it throughout your unit.
natural_image
Icon depicting a magnifying glass over server racks, symbolizing search or data analysis (no text present)Discovery App
The LinkRunner 10G Discovery application creates an inventory of the devices on your networks along with their attributes: device types, names, addresses, interfaces, VLANs, resources, and other connected or associated devices. The app allows you to identify and analyze network devices and acts as a jumping off point for further analysis using other apps, such as Path Analysis and connection tests. Devices are discovered in the local broadcast domains where the LinkRunner is physically connected. By default, discovery processes run out of both test and management ports.
Note: AllyCare is required to use this application. Your LinkRunner must be claimed. Please visit: NetAlly.com/AllyCare Support and Features.
Discovery Chapter Contents
This chapter describes how the Discovery process and app screens work, shows examples of Discovery data, and details the Discovery settings.
Introduction to Discovery Main Discovery List Screen Discovery Details Screens Device Types Discovery Settings Problem Settings TCP Port Scan Settings
Introduction to Discovery
Discovery finds, classifies, and displays the details of network components. Information provided by Discovery can include the following:
• IP, BSSID, and MAC addresses
- Device Names
• Device Connectivity
- SNMP Data
• Network Problems
• Interface Details and Statistics
Devices are discovered via ARP and Ping sweeps; SNMP, DNS, mDNS, and netBIOS queries; and passive traffic monitoring.
Discovery classifies each device as it is found.
Up to 2,000 devices can be reported.
The Discovery app also detects Problems with discovered devices, including Warning and Failure conditions.
The LinkRunner's discovery process begins when the unit is powered on. Once a network
connection (test or management) is established, the active discovery process begins.
Discovery notification icons indicate the progress of active discovery. This icon indicates that no links are currently available for active discovery, either because none of the ports enabled for discovery are connected or because AutoTest is running.
The Discovery app consistently monitors network traffic, but the active discovery process reruns every 90 minutes by default. You can select a different Refresh Interval in the Discovery Settings.
Main Discovery List Screen
The main Discovery screen lists all the devices the LinkRunner has discovered.
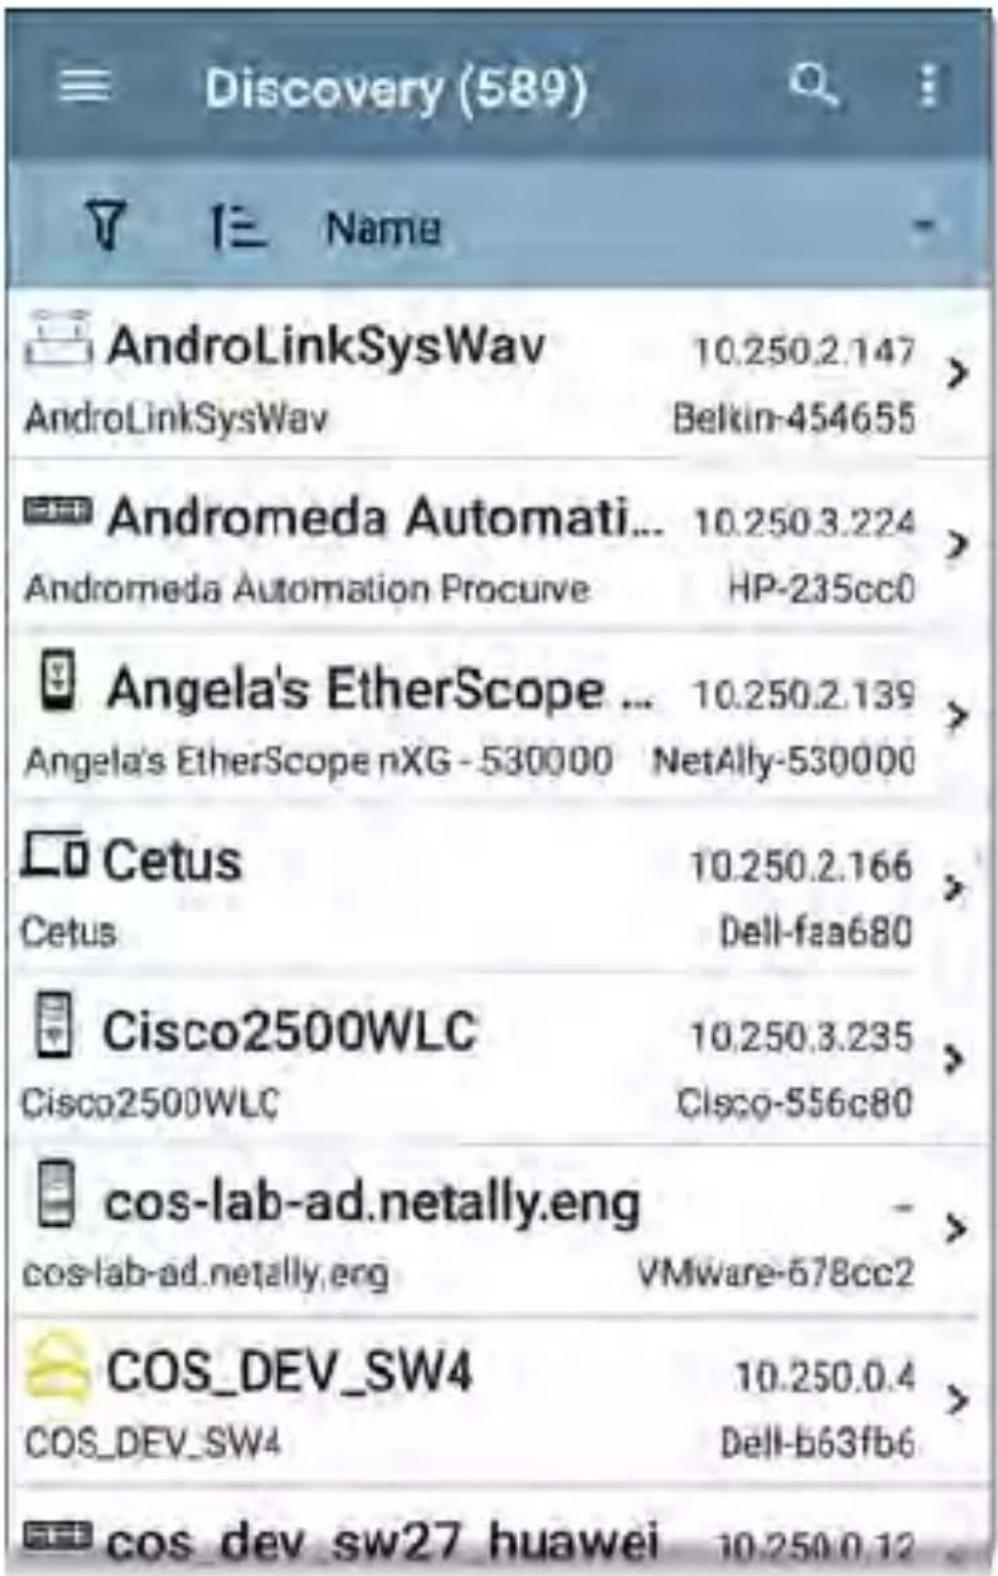
text_image
Discovery (589) AndroLinkSysWav 10.250.2.147 AndroLinkSysWav Belkin-454655 Andromeda Automati... 10.250.3.224 Andromeda Automation Procurve HP-235cc0 Angela's EtherScope ... 10.250.2.139 Angela's EtherScope nXG - 530000 NetAlly-530000 Cetus 10.250.2.166 Cetus Dell-faa680 Cisco2500WLC 10.250.3.235 Cisco2500WLC Cisco-556c80 cos-lab-ad.netally.eng cos-lab-ad.netally.eng VMware-678cc2 COS_DEV_SW4 10.250.0.4 COS_DEV_SW4 Dell-b63fb6 cos_dev_sw27 huawei 10.250.0.12Like in AutoTest and other LinkRunner screens, the icons in Discovery change color to indicate a Warning or Failure condition. Discovery also displays device icons in Blue to indicate Problem-related information that does not constitute a warning or failure, and Green to indicate that a previous Problem has been resolved. (See the Problem Settings to adjust enabled Problems and thresholds.)
The Discovery screen, and other app screens with long lists, support fast scrolling. Touch and drag the scrollbar handle to the right of the list to scroll quickly up and down.
text_image
HNT_QA_Prod_Temp Ntgear-8caaaa IM C3000 172.24.0.25 IM C3000 RICOH-1faff4 lap-cos-us-1 lap-cos-us-1 Cisco-8ecc2e lap-cos-us-3From the main Discovery screen, you can filter and sort the listed devices, open the left side
navigation drawer to configure settings, and touch a device's card to view its details.
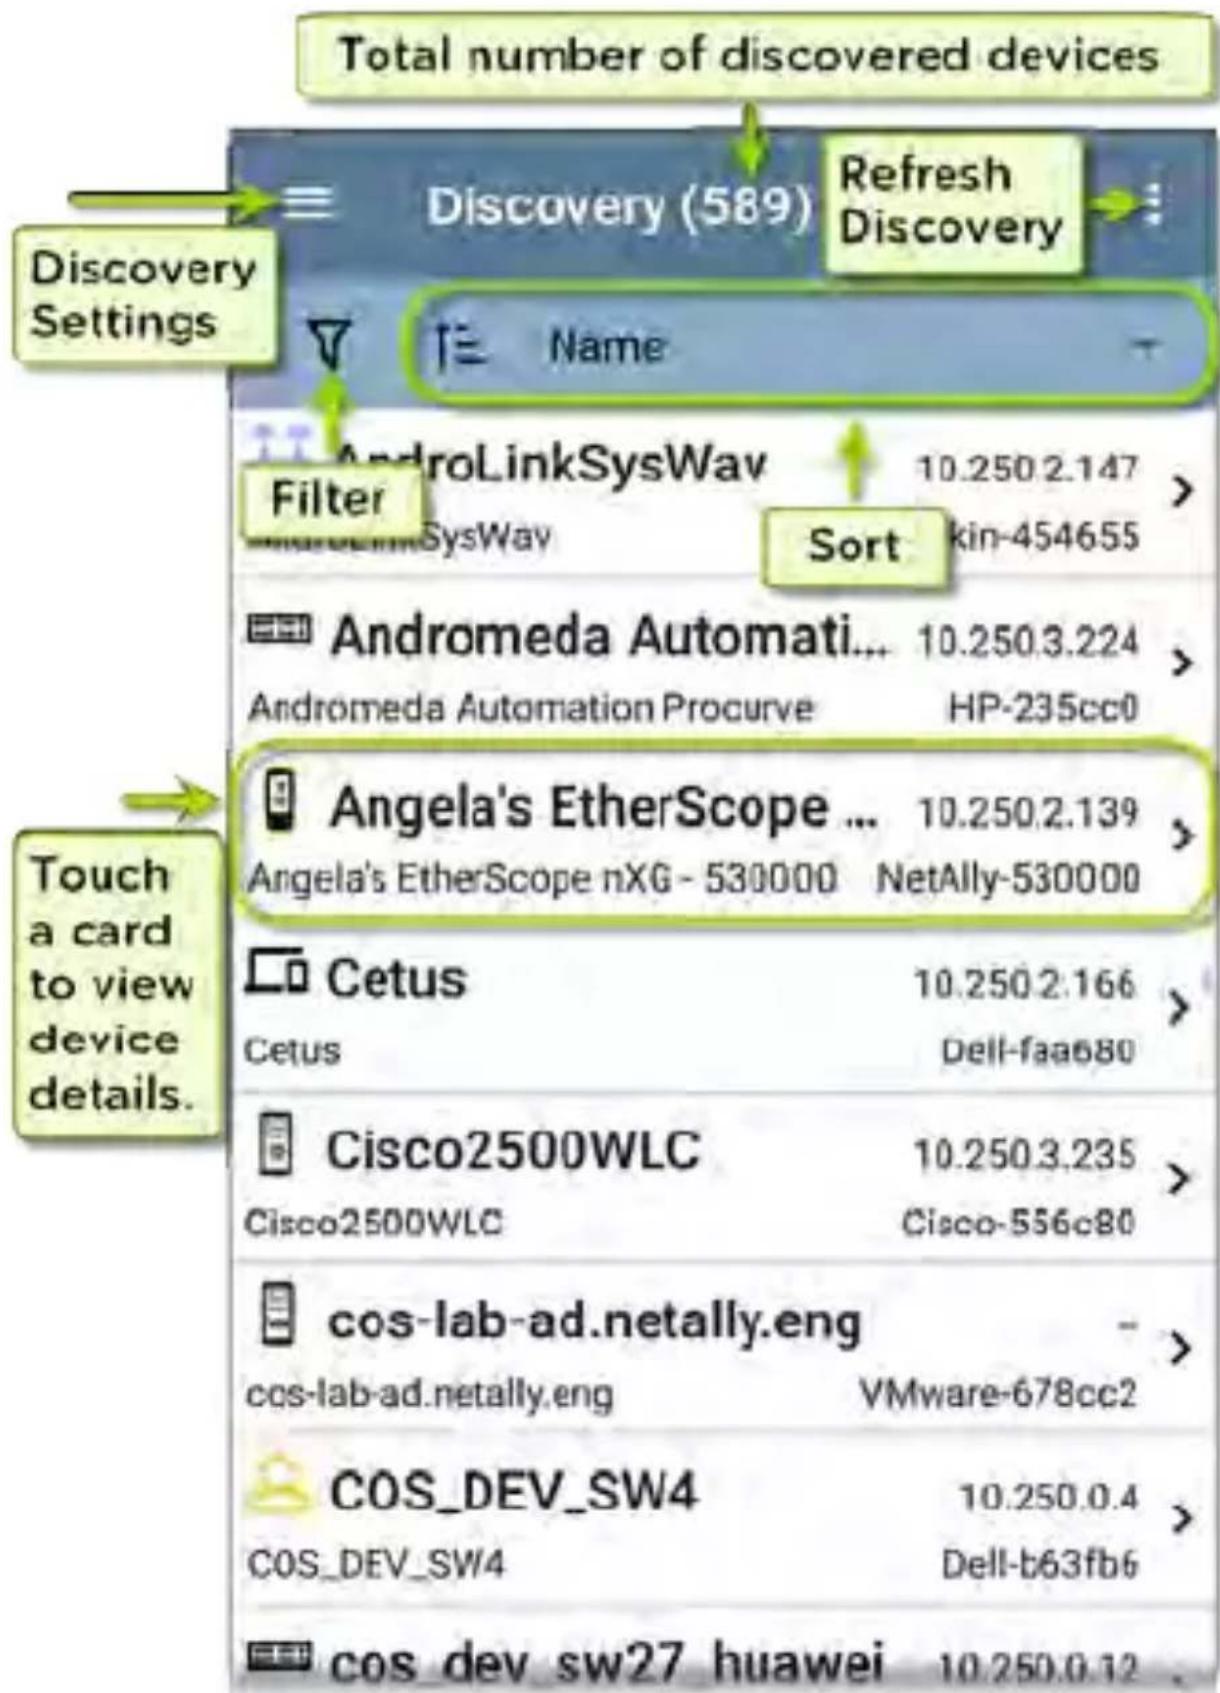
text_image
Total number of discovered devices Discovery Settings Discovery (589) Name Refresh Discovery Filter AndroLinkSysWav 10.250.2.147 SysWav Sort Andromeda Automati... 10.250.3.224 Andromeda Automation Procurve HP-235cc0 Angela's EtherScope ... 10.250.2.139 Angela's EtherScope nXG - 530000 NetAlly-530000 Cetus 10.250.2.166 Cetus Dell-faa680 Cisco2500WLC 10.250.3.235 Cisco2500WLC Cisco-556c80 cos-lab-ad.netally.eng ccs-lab-ad.netally.eng VMware-678cc2 COS_DEV_SW4 10.250.0.4 COS_DEV_SW4 Dell-b63fb6 cos_dev_sw27 huawei 10.250.0.12Discovery List Cards
The information displayed on each device card varies depending on the selected Sort element and the data the LinkRunner was able to discover.
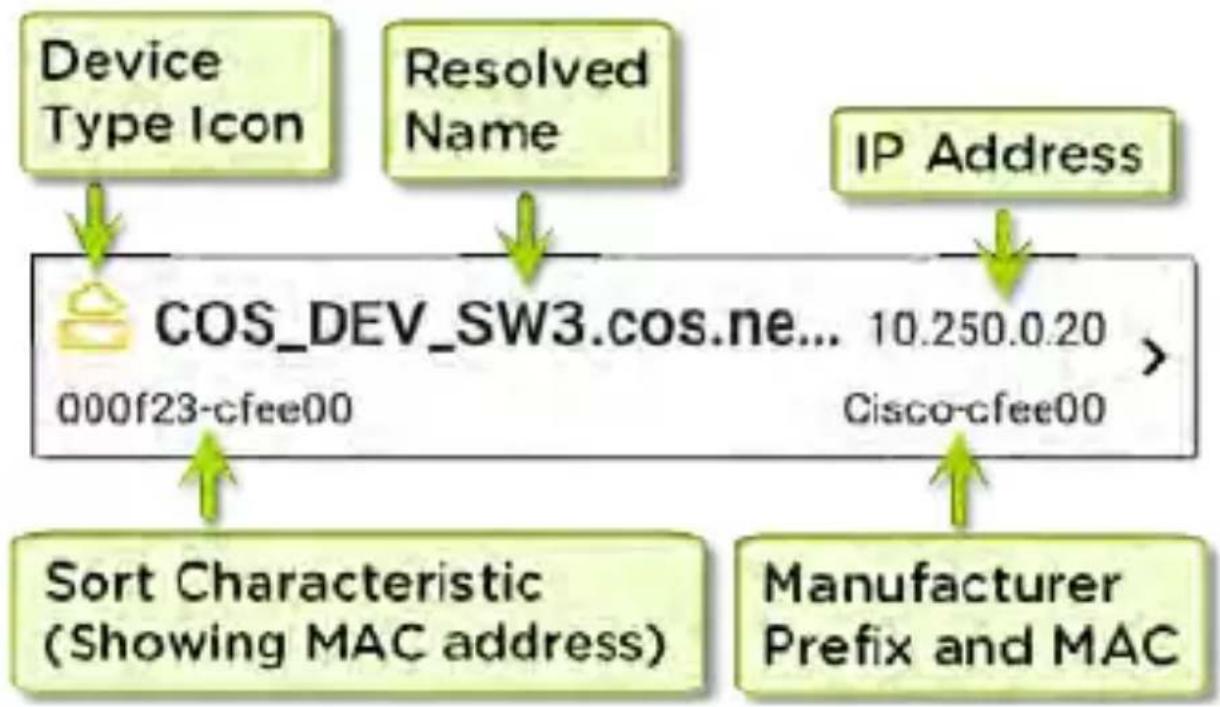
flowchart
graph TD
    A["Device Type Icon"] --> C["COS_DEV_SW3.cos.ne... 10.250.0.20"]
    B["Resolved Name"] --> C
    D["IP Address"] --> C
    E["Sort Characteristic (Showing MAC address)"] --> C
    F["Manufacturer Prefix and MAC"] --> C
The lower left field displays the characteristic by which the Discovery list is currently sorted. In the image above, the list is sorted by MAC address. See Discovery Sorts in this topic for more about sorting.

Searching the Discovery List
The main Discovery screen offers a search feature. Tap the search icon at the top of
the screen to search discovered devices.
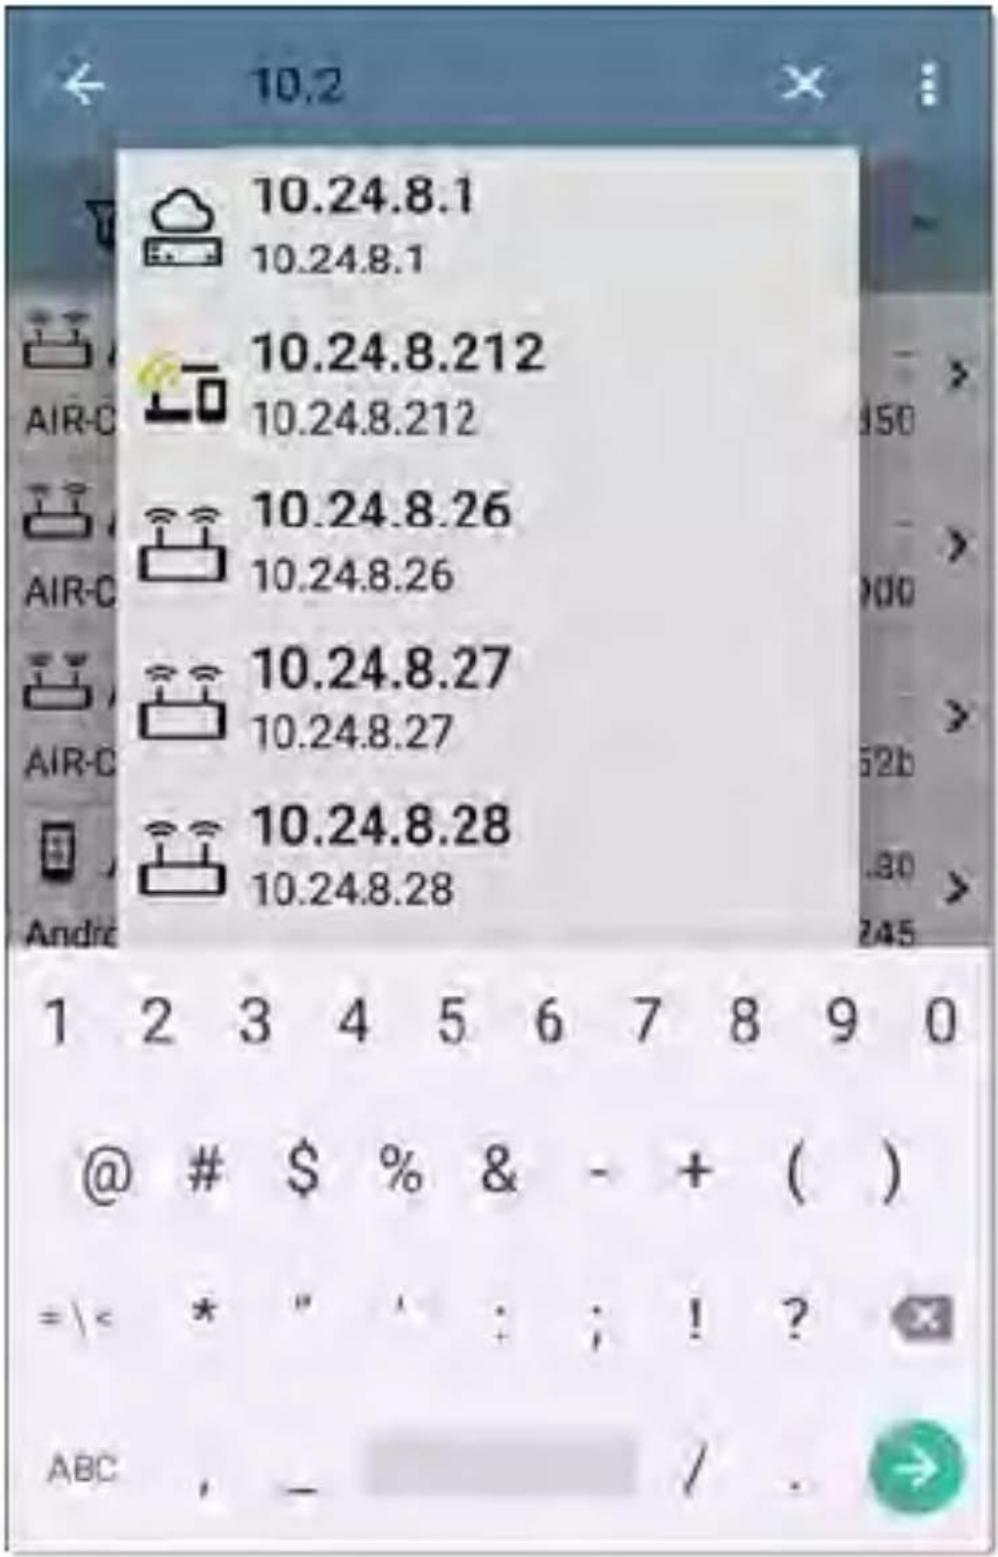
text_image
10.24.8.1 10.24.8.1 10.24.8.212 10.24.8.212 10.24.8.26 10.24.8.26 10.24.8.27 10.24.8.27 10.24.8.28 10.24.8.28 1 2 3 4 5 6 7 8 9 0 @ # $ % & - + ( ) = | < * " : ! ? ABC , - / .
Filtering the Discovery List
Touch the filter button near the top left of the main Discovery screen to set filters that control which devices are displayed in the list.
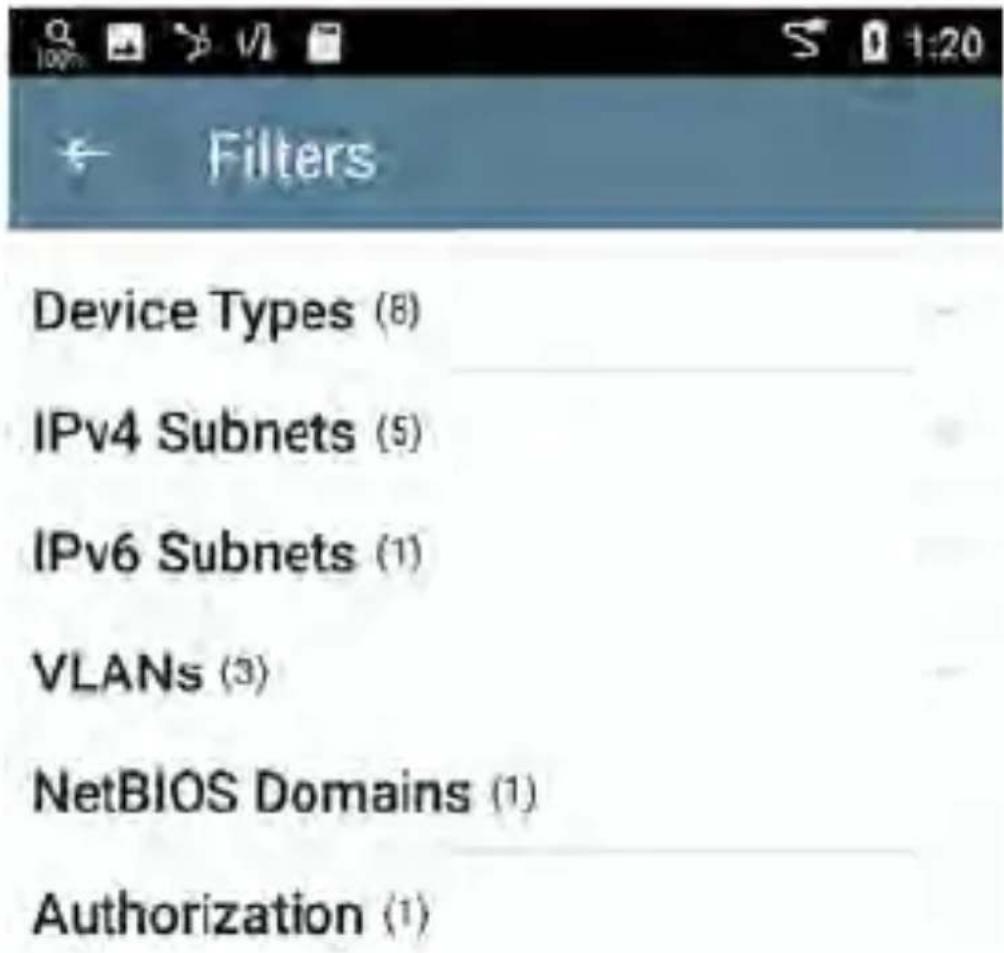
text_image
Filters Device Types (8) IPv4 Subnets (5) IPv6 Subnets (1) VLANs (3) NetBIOS Domains (1) Authorization (1)The Filters screen displays the number of devices or domains discovered for each category. Touch a category name to select filters by checking the boxes. The main Discovery screen will show only those devices or IDs that fall under your chosen filter parameters.
When filters are selected, those active filters are displayed at the top of the Filters screen.
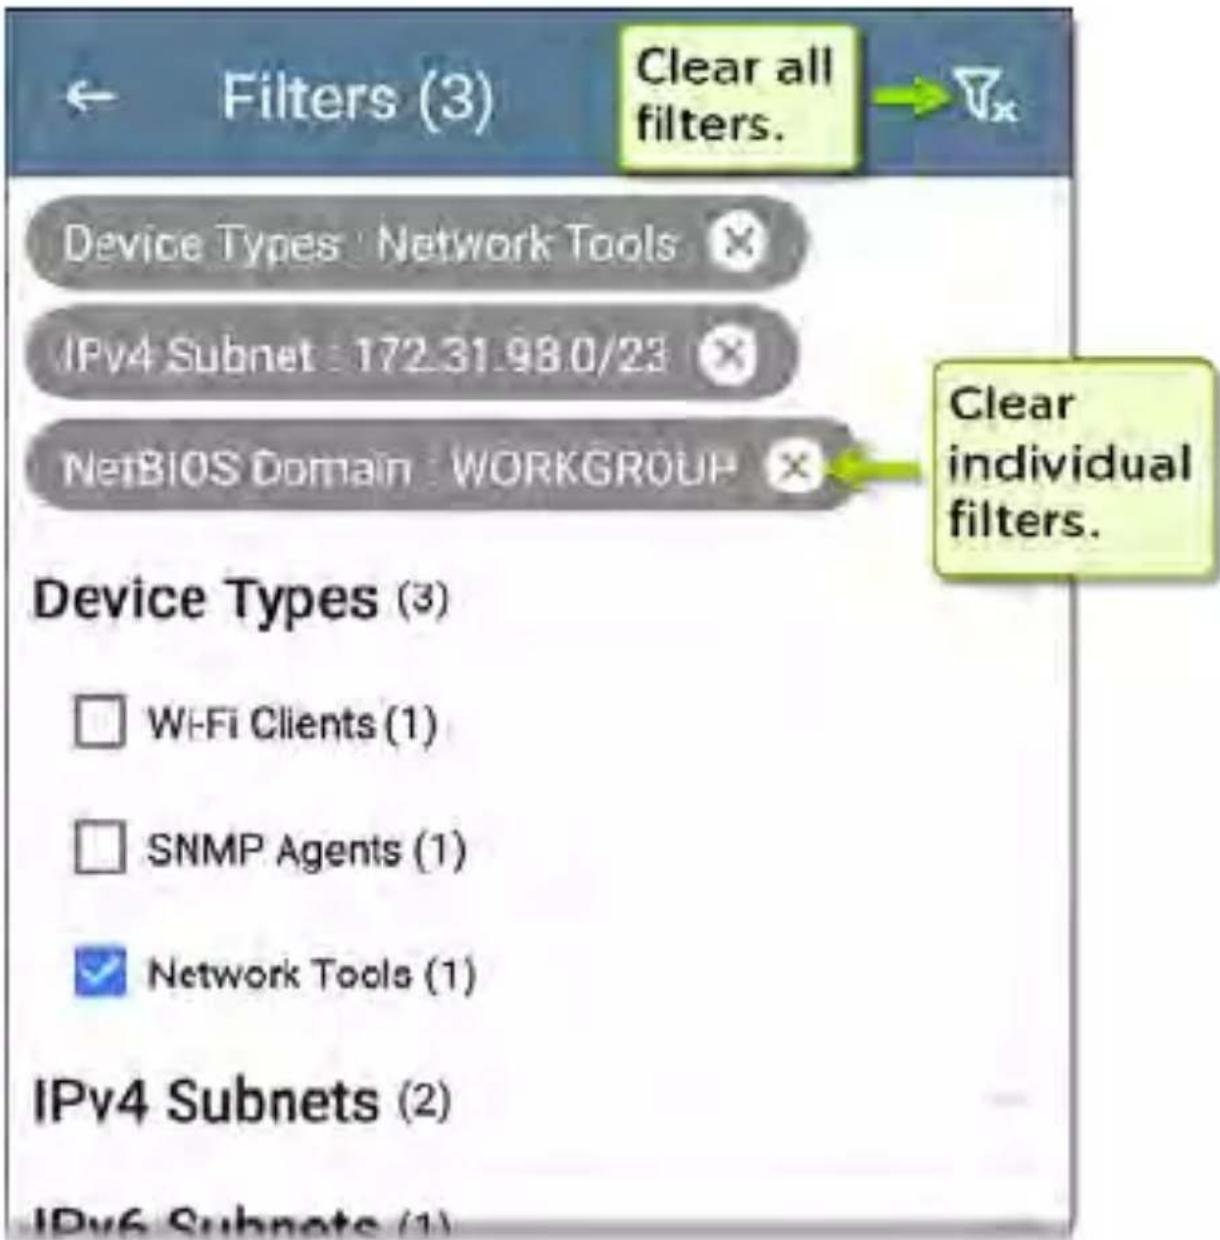
text_image
Filters (3) Clear all filters. Device Types : Network Tools IPv4 Subnet : 172.31.98.0/23 NetBIOS Domain : WORKGROUP Device Types (3) □ Wi-Fi Clients (1) □ SNMP Agents (1) ✓ Network Tools (1) IPv4 Subnets (2) IPv6 Subnets (1) Clear individual filters.- Tap the × button to the right of each filter to clear it.
- Touch the clear filter icon at the top right to clear all filters.
Once you have selected a filter, the Filters screen is also filtered for that characteristic. Fo example, in the image above, the user has selected the "Network Tools" device type. As a result, only those subnets, addresses, etc. with a discovered Network Tool remain selectable in the filters list.
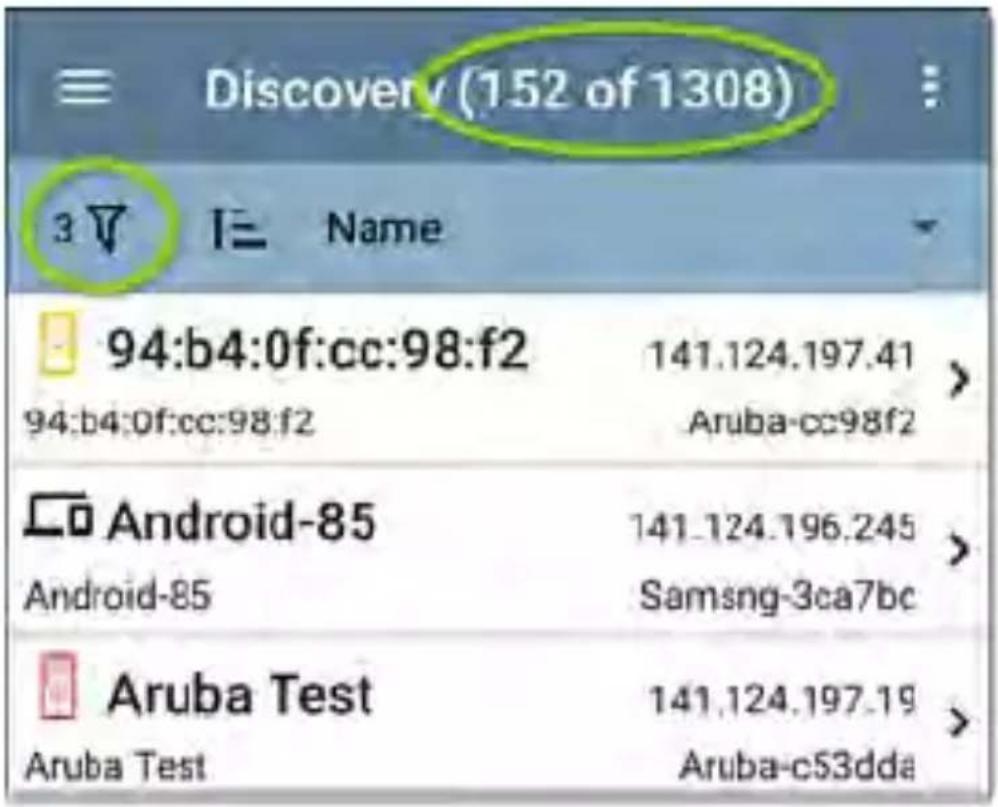
text_image
Discovery (152 of 1308) 3 ▼ I= Name 94:b4:0f:cc:98:f2 141.124.197.41 94:b4:0f:cc:98:f2 Aruba-cc98f2 Android-85 141.124.196.245 Android-85 Samsng-3ca7bc Aruba Test 141.124.197.19 Aruba Test Aruba-c53ddaBack on the main Discovery screen, the screen title shows the number of filtered devices out of the total discovered devices (in the image above, 152 filtered devices out of 1308 total).
The number of active filters displays to the left of the filter icon (3 active filters in the image above).
Sorting the Discovery List
Tap the Sort bar or down arrow to open the Sort drop-down menu.
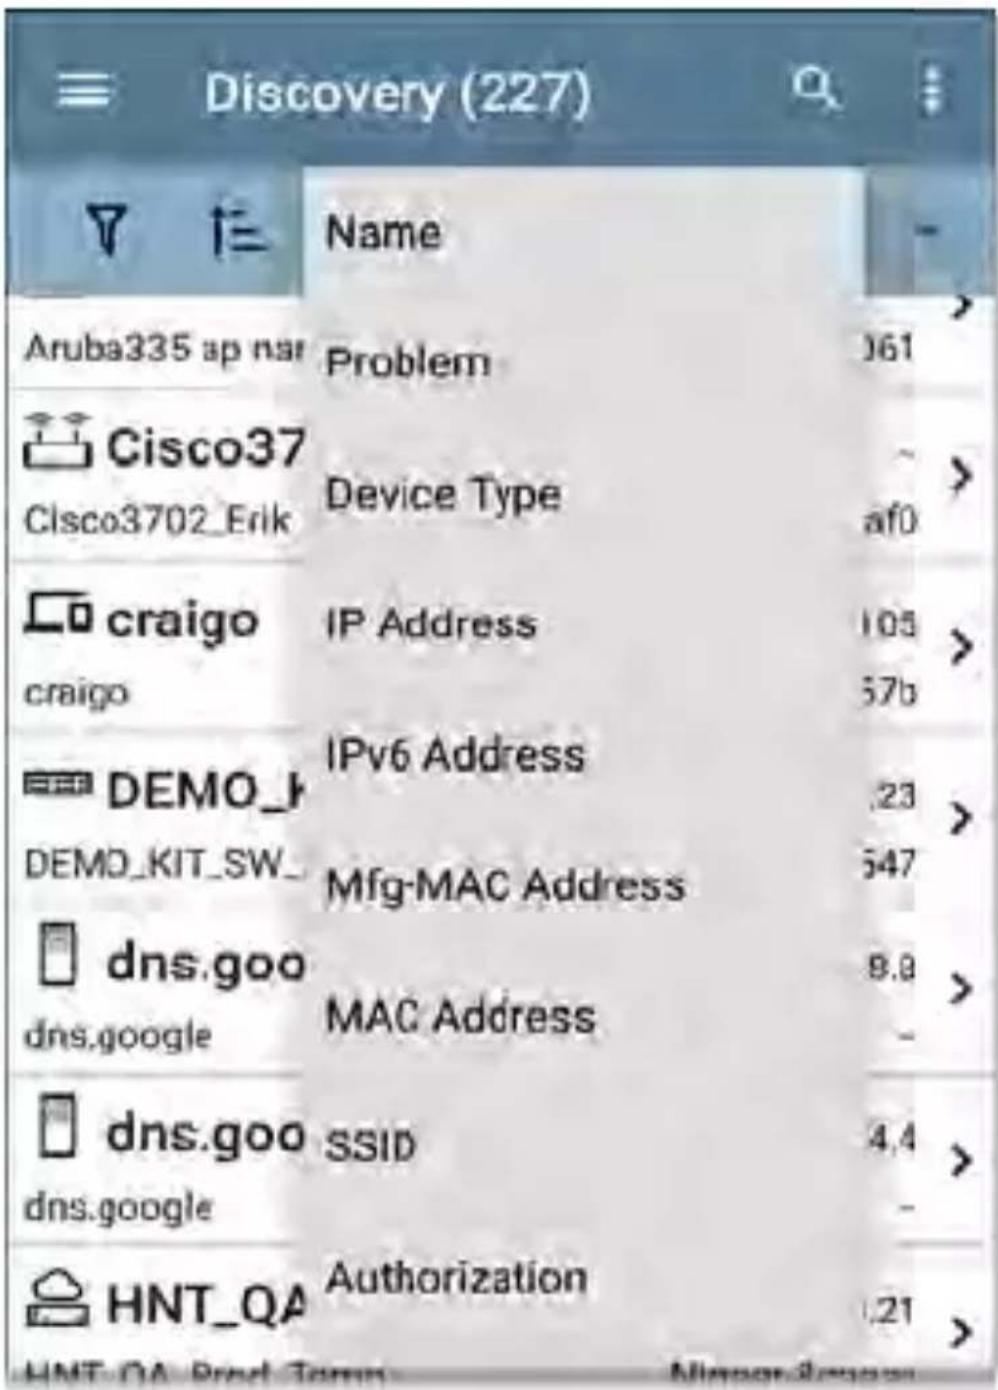
text_image
Discovery (227) Name Aruba335 ap nar Problem 061 Cisco37 Cisco3702_Erik Device Type af0 craigo IP Address 105 craigo 57b DEMO_ DEMO_KIT_SW_ IPv6 Address 23 Mfg-MAC Address 547 dns.goo MAC Address 8.9 dns.google dns.goo SSID 4.4 dns.google HNT_QA Authorization 121 HNT.QA Pred Term Minnoa-20000Select a Sort option to order the devices based on your selected characteristic.
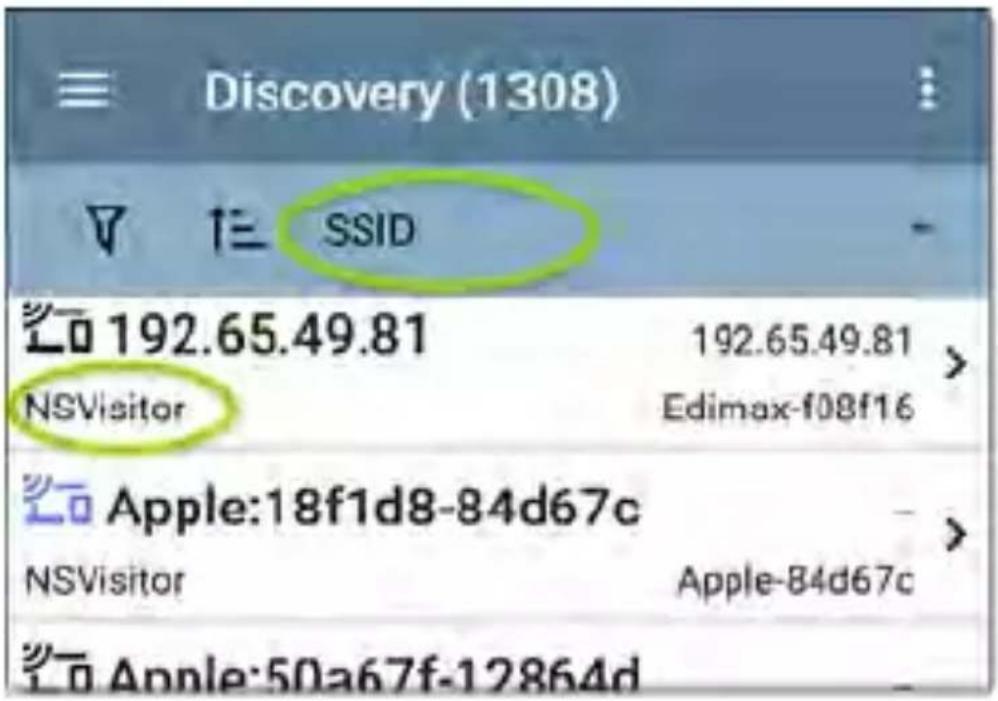
text_image
Discovery (1308) SSID 192.65.49.81 NSVisitor 192.65.49.81 Edimax-f08f16 Apple:18f1d8-84d67c NSVisitor Apple-84d67c Apple:50a67f-12864dThe selected Sort option displays in the Sort bar above the device list, and the sort characteristic for each device is shown under the device type icon. In the image above, all the devices associated with the "NSVisitor" SSID are sorted together. Individual devices on the same SSID are sorted numerically and alphabetically.
Tap the sort order icon to switch the sort order between normal and reverse order.
Devices are sorted in groups. Those with resolved names appear at the top (in normal order), and then devices with only IPv4, IPv6,
and MAC addresses appear below, respectively. Reversing the normal sort order reverses the devices within the groups but does not change the order of the groups.
Security Auditing – Batch Authorization
Batch Authorization allows the user to extend the LinkRunner 10G's filtering to organize devices into the following security categories:
- Authorized: For devices approved for use on your network
- Neighbor: For devices owned and controlled by neighboring organizations
- Flagged: To give visibility to a specific device
- Unknown: For devices that have not been identified or classified
- Unauthorized: For devices that should not be on the network and may present a security risk
- Unspecified:Default unassigned Authorization status
Once categorized, it is simple to immediately identify any new devices on the network by filtering according to Authorization type. New devices will be identified as Unspecified.
To use the Batch Authorization feature, create a filter that identifies the devices you want to categorize. For example, you could filter on SSIDs used by other offices in your building. Once you have filtered the list of discovered devices, select the overflow menu.
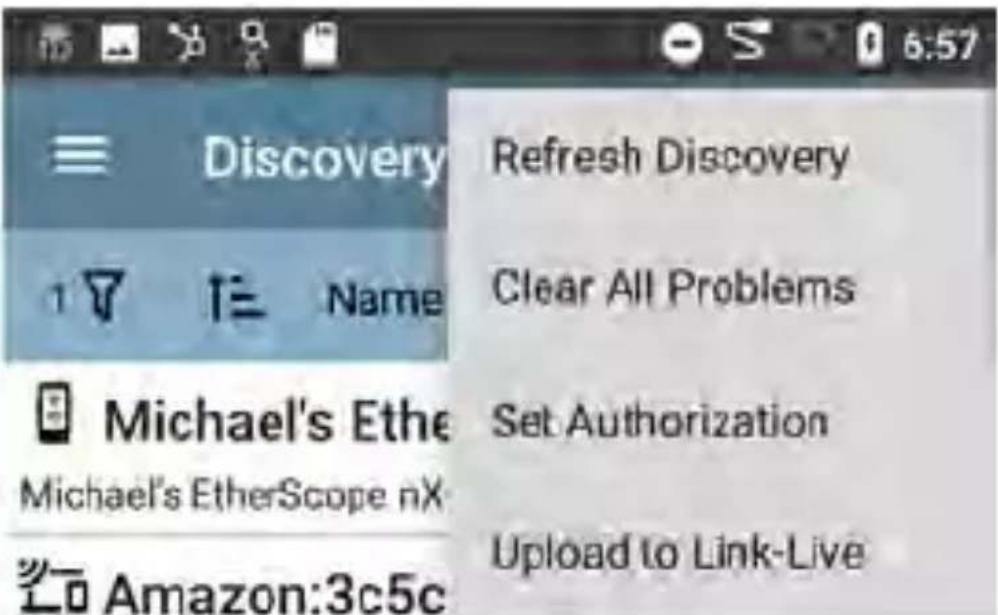
text_image
Discovery Refresh Discovery Name Clear All Problems Michael's Ethe Set Authorization Michael's EtherScope nX Amazon:3c5c Upload to Link-LiveSelect Set Authorization to see how these devices are currently categorized and the number of devices in each category.
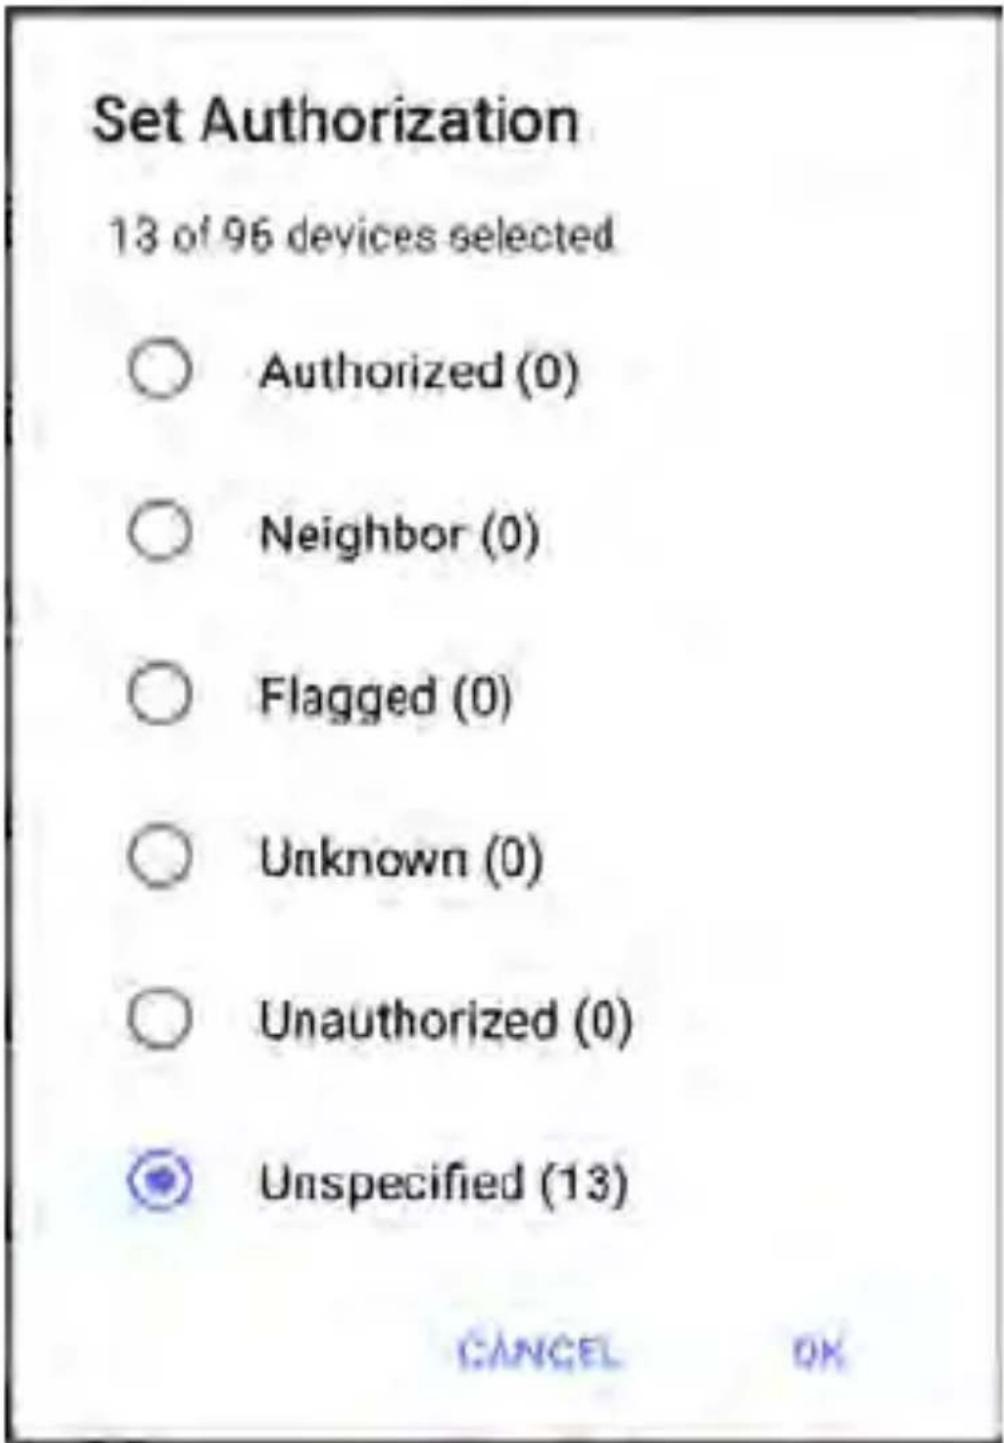
text_image
Set Authorization 13 of 96 devices selected ○ Authorized (0) ○ Neighbor (0) ○ Flagged (0) ○ Unknown (0) ○ Unauthorized (0) ● Unspecified (13) CANCEL OKNOTE: The initial selection on this screen defaults to the category with the highest count. If other categories have non-zero counts, selecting OK will change the authorization setting for all devices to the selected category.
Select the appropriate security category. As in the example, if these devices belong to other offices, select: Neighbor and then tap the OK button.
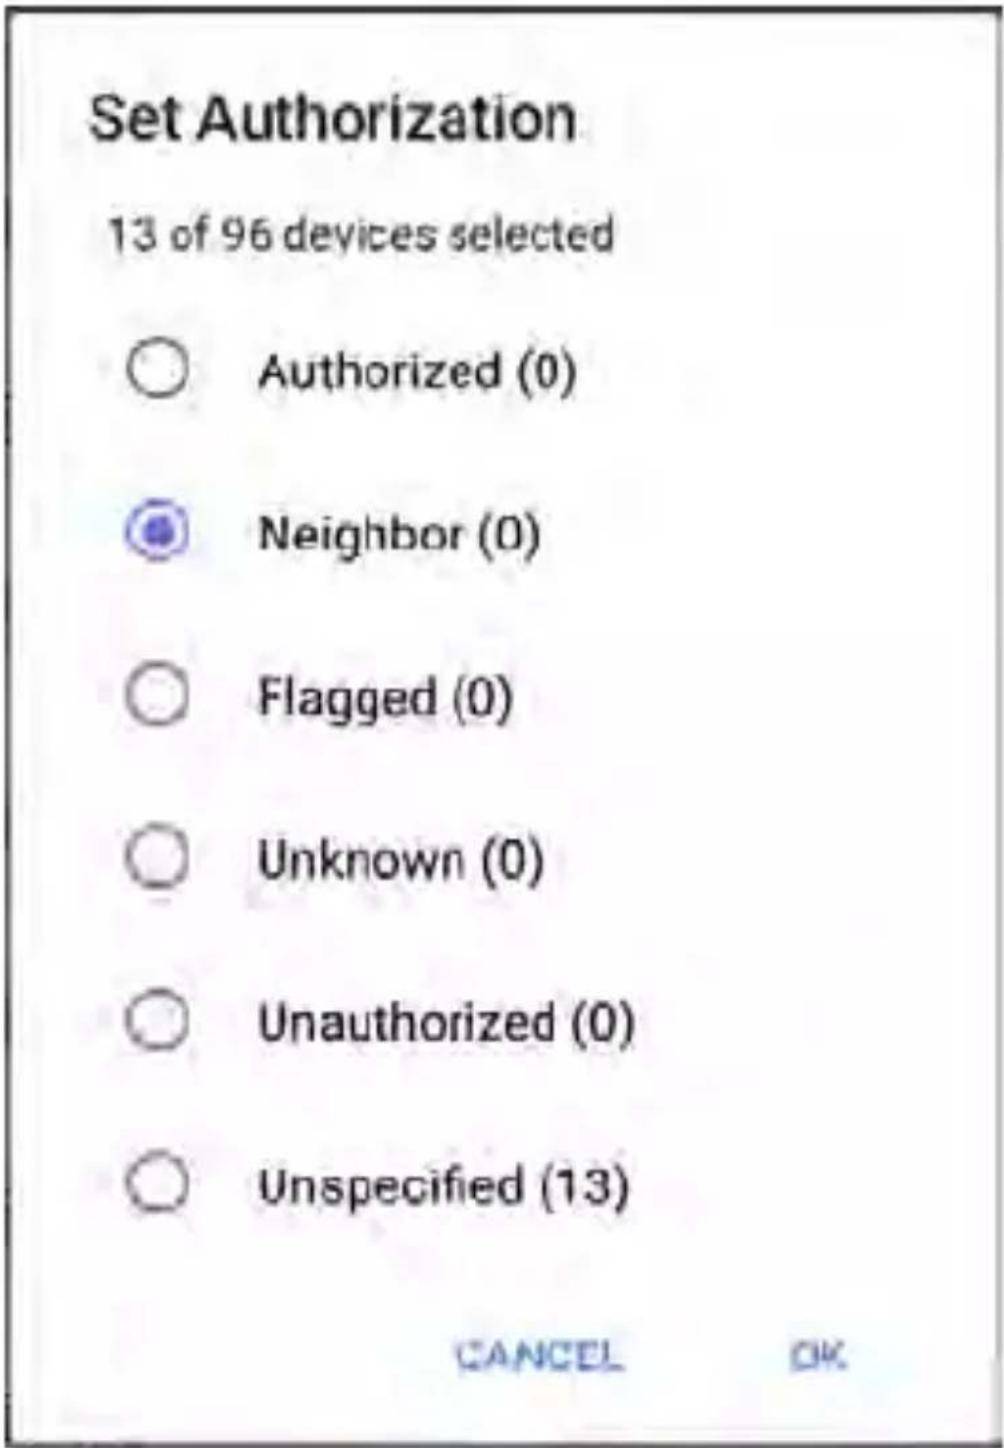
other
Set Authorization | Category | Count | | :--- | :--- | | Authorized (0) | 0 | | Neighbor (0) | 0 | | Flagged (0) | 0 | | Unknown (0) | 0 | | Unauthorized (0) | 0 | | Unspecified (13) | 0 | CANCEL OKYou will now be able to sort the list of discovered devices and clearly identify the
security category of the devices. Devices from other offices will be identified as: Neighbor
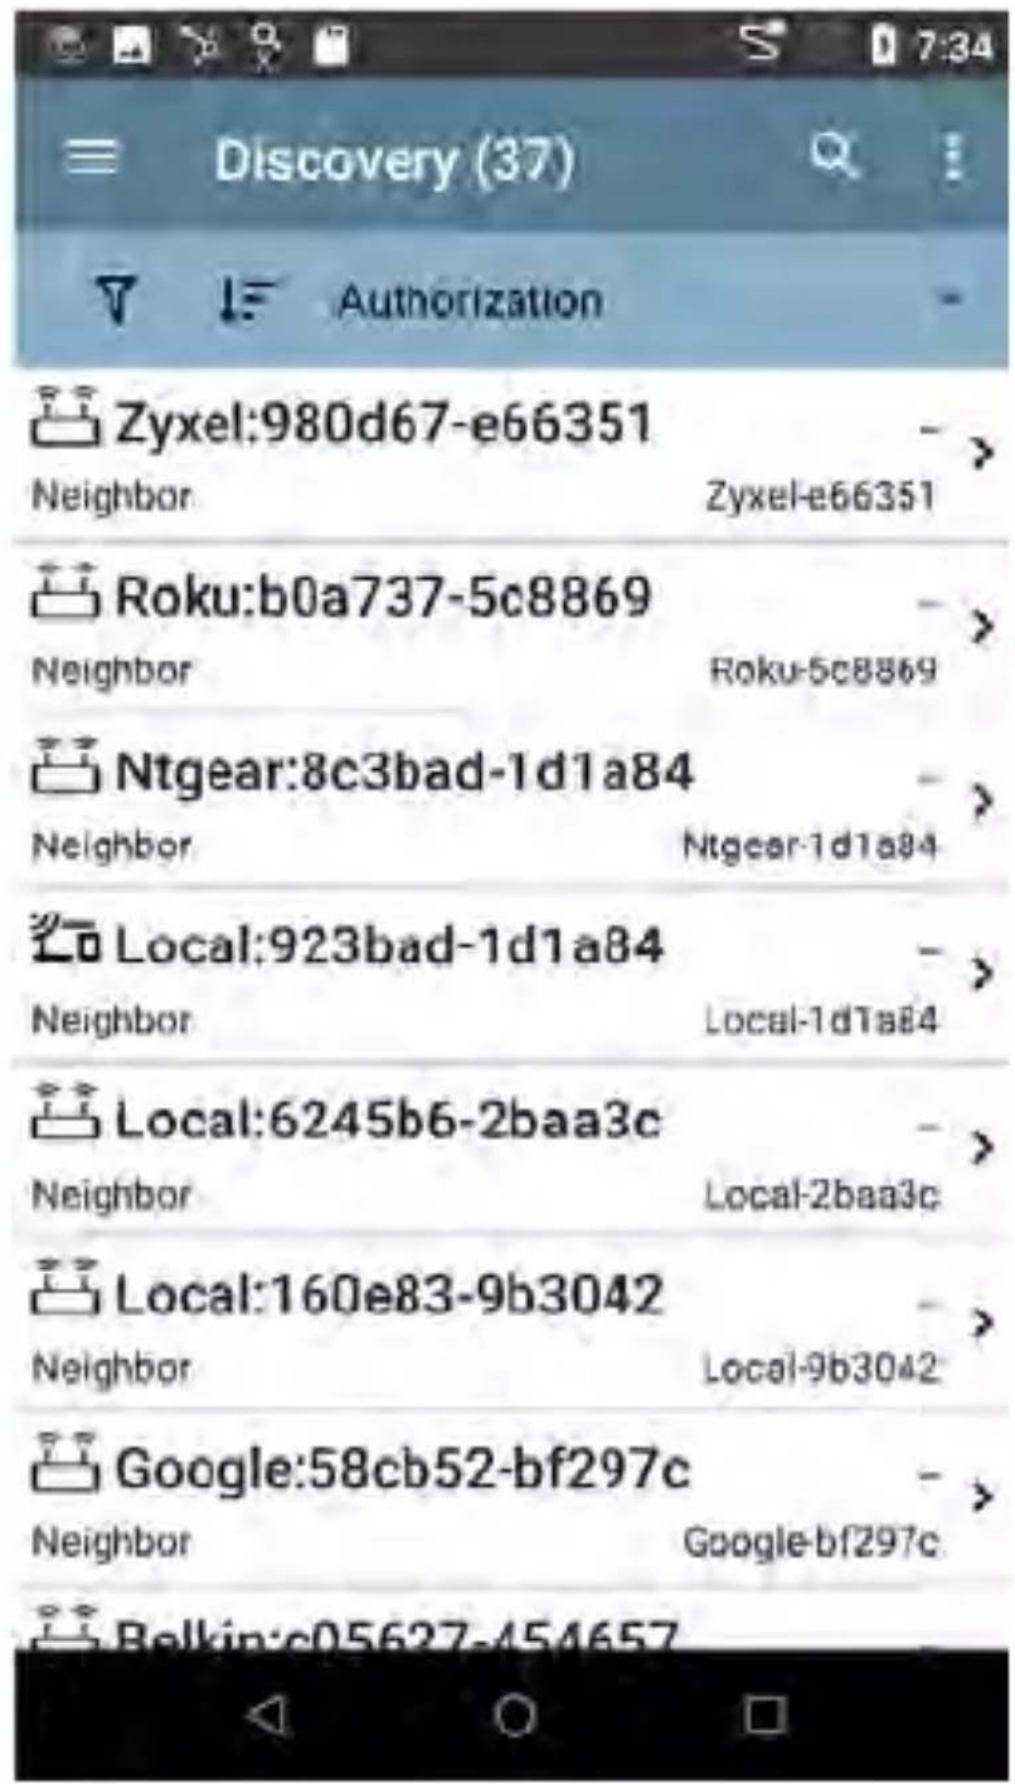
text_image
Discovery (37) Authorization Zyxel:980d67-e66351 Neighbor Zyxel-e66351 Roku:b0a737-5c8869 Neighbor Roku-5c8869 Ntgear:8c3bad-1d1a84 Neighbor Ntgear-1d1a84 Local:923bad-1d1a84 Neighbor Local-1d1a84 Local:6245b6-2baa3c Neighbor Local-2baa3c Local:160e83-9b3042 Neighbor Local-9b3042 Google:58cb52-bf297c Neighbor Google-bf297c Belkin:c05627-454657NOTE: Batch Authorization operates on the default MAC address of a device. If a device has multiple MACs, authorization will only be set on the default MAC address. Devices that do not have a discovered MAC address such as unknown switches and off-net devices, cannot have an authorization setting.
Refreshing Discovery
Touch the action overflow icon at the top right of the main Discovery screen, and select Refresh Discovery to refresh the active Discovery process.
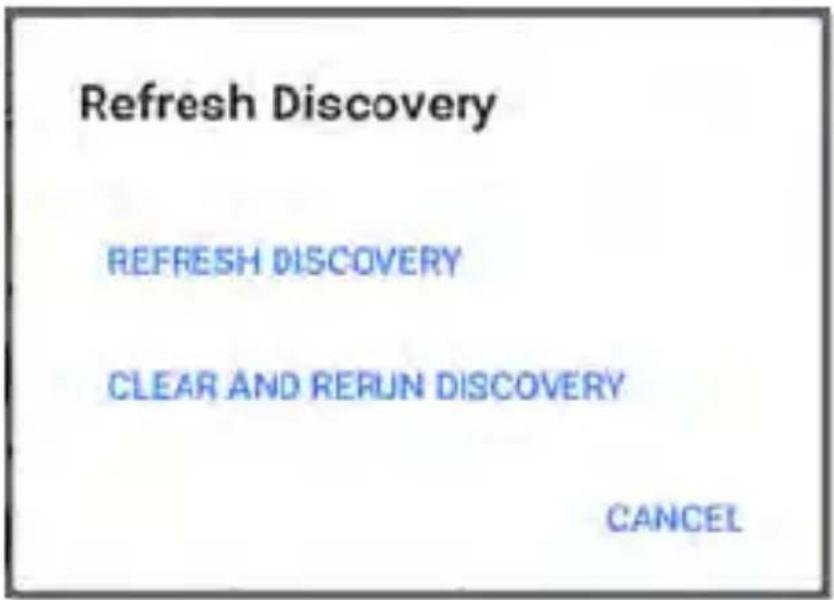
text_image
Refresh Discovery REFRESH DISCOVERY CLEAR AND RERUN DISCOVERY CANCELREFRESH DISCOVERY restarts the active discovery process without clearing the already discovered devices.
CLEAR AND RERUN DISCOVERY clears the accumulated results and restarts the discovery process.
Uploading Discovery Results to Link-Live
Touch the action overflow icon at the top right of the main Discovery screen, and select Upload to Link-Live to send the current Discovery results to the Analysis page on Link-Live.com.

Link-Live
by NutAlly
natural_image
Icon depicting a magnifying glass over server racks, symbolizing search or data analysis (no text or symbols present)Discovery Snapshot Name
20190802_131842
Comment
1st Floor
Job Comment
Psych Building

SAVE TO ANALYSIS FILES
See the Link-Live chapter for more information.
Discovery Details Screens
Tap any of the device cards on the main Discovery list screen to view Device Details.
The example below calls out a Router card and its Details screen.
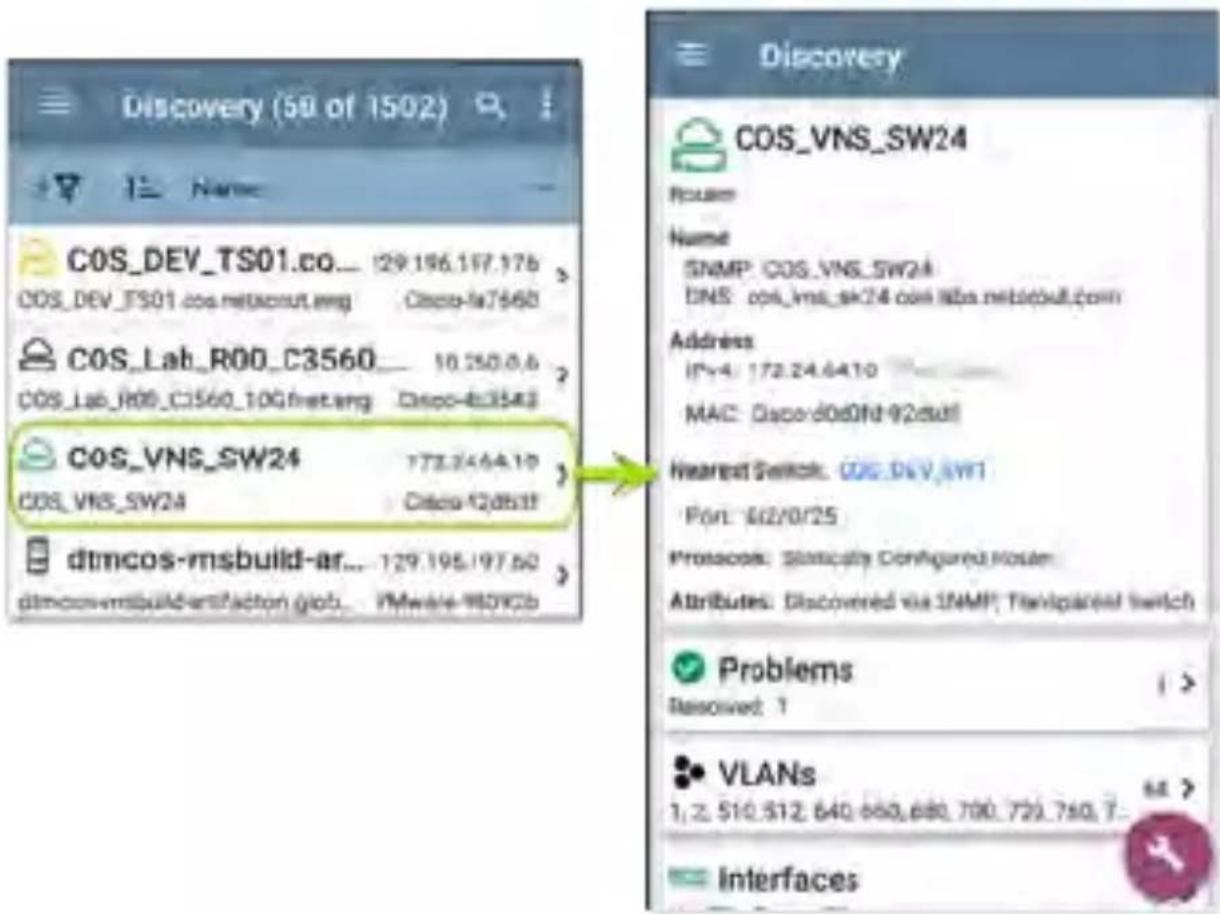
text_image
Discovery (59 of 1502) COS_DEV_TS01.co... 129.196.197.176 COS_DEV_TS01.cos.metscout.org Cisco-la7560 COS_Lab_R00_C3560... 10.250.0.6 COS_Lab_R00_C3560_10Gfirst.org Cisco-8c3543 COS_VNS_SW24 173.2464.10 COS_VNS_SW24 Cisco-12d831 dtmcos-rmsbuild-ar... 129.195.197.50 dtmcos-rmsbuild-artifactor.gob... VMware-980K2b Discovery COS_VNS_SW24 Rouan Name SNMP: COS_VNS_SW24 DNS: cps_vns_sk24.com@ba.metsout.com Address IP=4: 173.24.6410 MAC: Dacord0d0fd-92dut Nearest Switch: COS_DEV_SW1 Port: 62/0/25 Protocols: Staticify Configured Router Attributes: Discovered via SNMP; Transparent switch Problems Resolved: 1 VLANs 1,2,510,512,640,660,680,700,720,740,7... InterfacesThe available data and actions on the Details screens vary significantly depending on the device type, connections, and data the LinkRunner was able to discover. In other words, only the discoverable information for each device is shown on the Details screen.
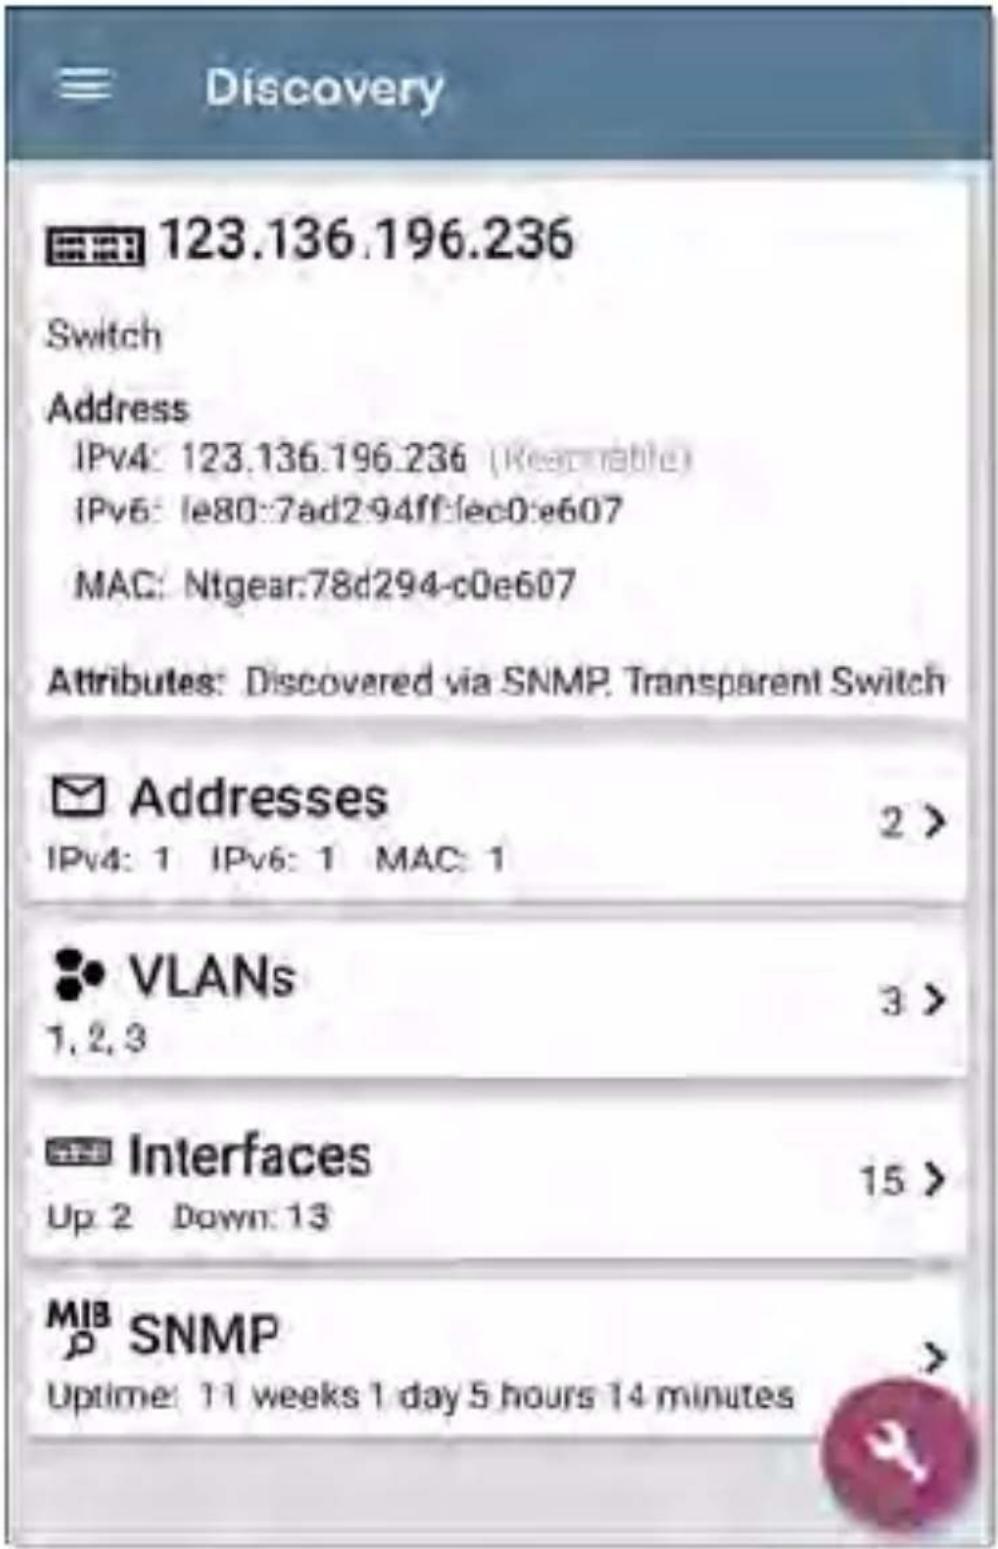
text_image
Discovery 123.136.196.236 Switch Address IPv4: 123.136.196.236 (Receivable) IPv6: 1e80:7ad2:94ff:ec0:e607 MAC: Ntgear:78d294-c0e607 Attributes: Discovered via SNMP. Transparent Switch Addresses IPv4: 1 IPv6: 1 MAC: 1 2 > VLANs 1,2,3 3 > Interfaces Up 2 Down: 13 15 > MIB SNMP Uptime: 11 weeks 1 day 5 hours 14 minutesFor the Switch screen shown above, Discovery was able to find an IP address but not a name for the switch.
Each Details screen shows additional information about the selected device, any Problems detected by the LinkRunner, and counts for other connected or corresponding network elements.
See Device Types for specifics about the different devices the LinkRunner can discover.
Top Details Card
The top card on the Details screen summarizes the discovered data for the selected device.
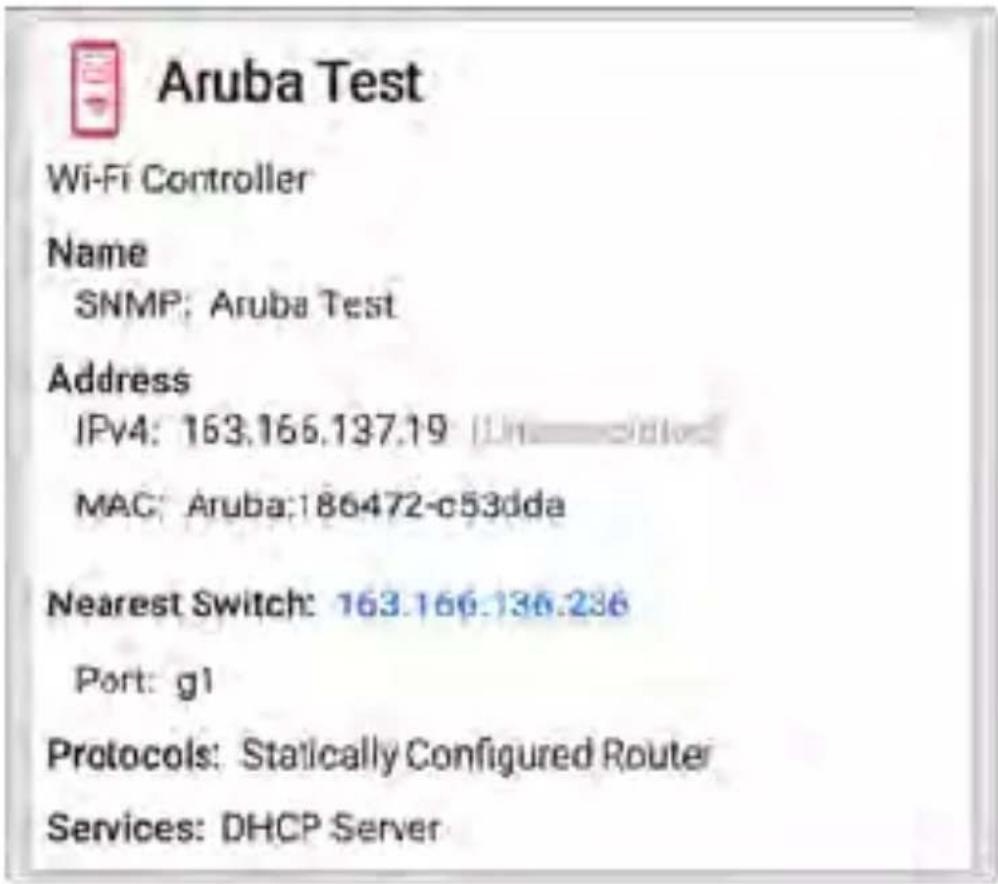
text_image
Aruba Test Wi-Fi Controller Name SNMP: Aruba Test Address IPv4: 163.166.137.19 Unid MAC: Aruba:186472-c53dda Nearest Switch: 163.166.136.236 Port: g1 Protocols: Statically Configured Router Services: DHCP ServerThe top of the card shows the device type and icon (a Wi-Fi Controller with a Failure or Error status in the example image above).
The rest of the fields that appear on the top Details screen card depend on the device type and what the LinkRunner can discover about the device.
On the Discovery Details screens, you can touch any blue linked name or address to open a Discovery screen for the linked device.
NOTE: Non-underlined links open in the same app (in this case Discovery), and underlined links open in a different app.
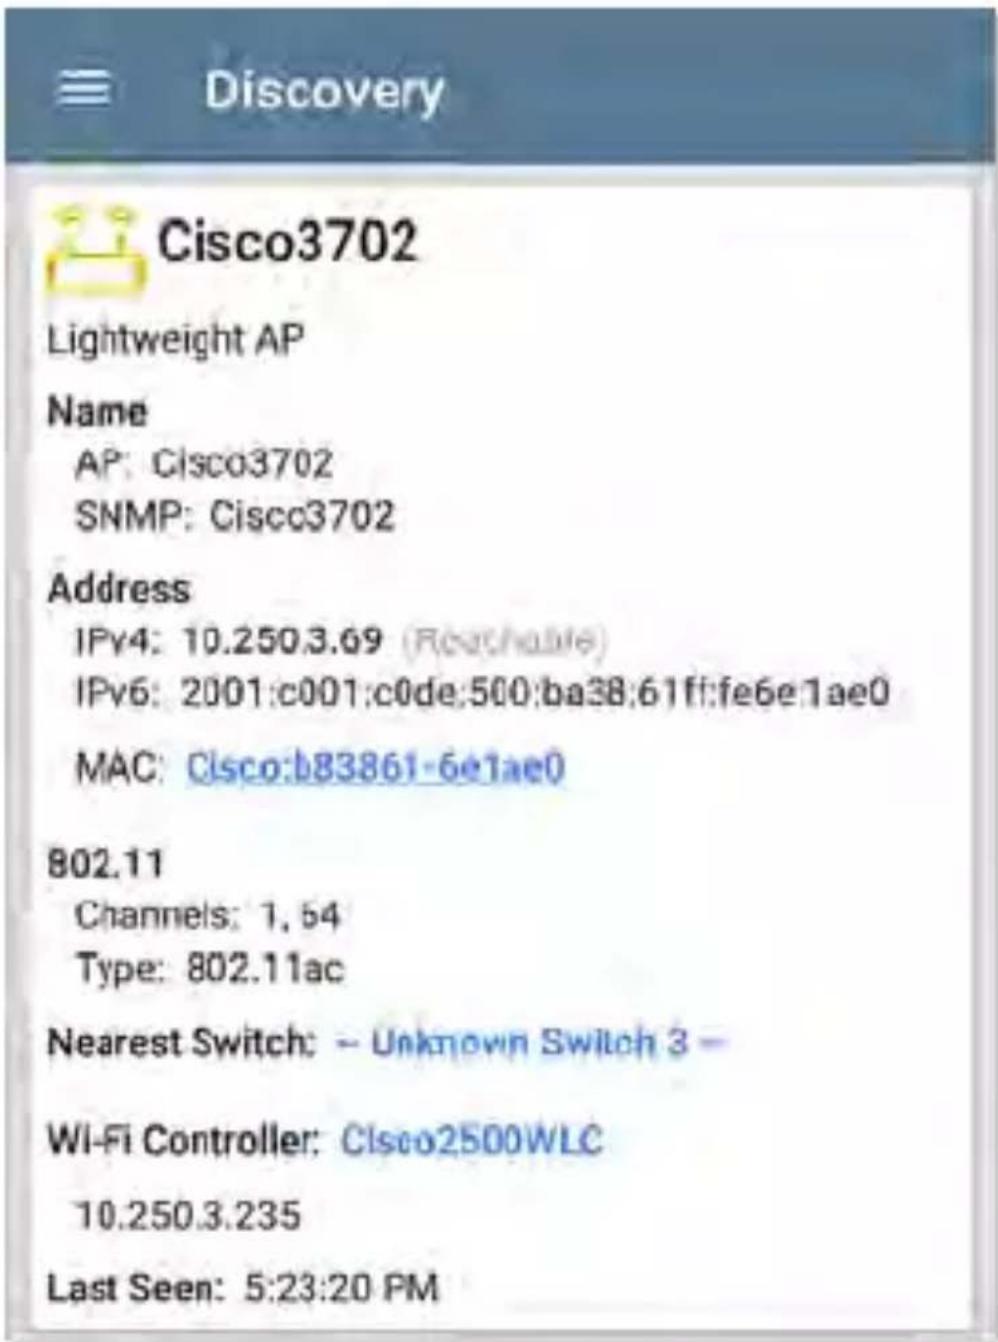
text_image
Discovery Cisco3702 Lightweight AP Name AP: Cisco3702 SNMP: Cisco3702 Address IPv4: 10.250.3.69 (Reachable) IPv6: 2001:c001:c0de:500:ba38:61ff:fe6e1ae0 MAC: Cisco:b83861-6e1ae0 802.11 Channels: 1, 54 Type: 802.11ac Nearest Switch: - Unknown Switch 3 - Wi-Fi Controller: Cisco2500WLC 10.250.3.235 Last Seen: 5:23:20 PMThe Nearest Switch and Wi-Fi Controller links open a Discovery app Details screen for those devices.
Data Fields on the Top Details Card
The following fields may appear on the top card on a Device Details screen, depending on
the device type and the information LinkRunner was able to discover:
Name: Discovered hostname(s) of the device. This section can display user-defined, DNS, mDNS, SNMP, NetBIOS, AP, and Virtual Machine names as discovered.
Address: Discovered IPv4, IPv6, BSSID, and/or MAC addresses of the device. This section displays the default (first discovered) addresses of each type. For more addresses, select the Addresses card when available.
Authorization: This field shows the user-assigned Authorization status of the device. See Assigning a Name and Authorization to a Device.
Nearest Switch: Name or address of the switch identified as closest to the device
Port: Physical port where the device is connected
VLAN ID: ID of the VLAN the device is on Protocols: Routing protocols, discovered via packet analysis, operating on the device or network
Services: Network services provided by this device, such as DHCP or DNS
Attributes: Other discovered attributes about the device
Wi-Fi Controller: Name and address of the Wi-Fi Controller for a Lightweight AP
AP: Access Point to which the device is connected
SSID: Name of the network on which the device is operating
Security: AP's security type
Hypervisor: Name of the hypervisor on which a virtual machine is operating
Virtual Machine: Name of the virtual machine
Guest OS: Operating system running on the virtual machine
Memory Reservation: Amount of memory reserved for the virtual machine
Last Seen: Time at which LinkRunner most recently detected the device
Lower Cards in Device Details
Tap any of the lower cards on a Device Details screen to view more discovered characteristics and "drill down" to specific Problems,
Addresses, Interfaces, etc. for the selected device.
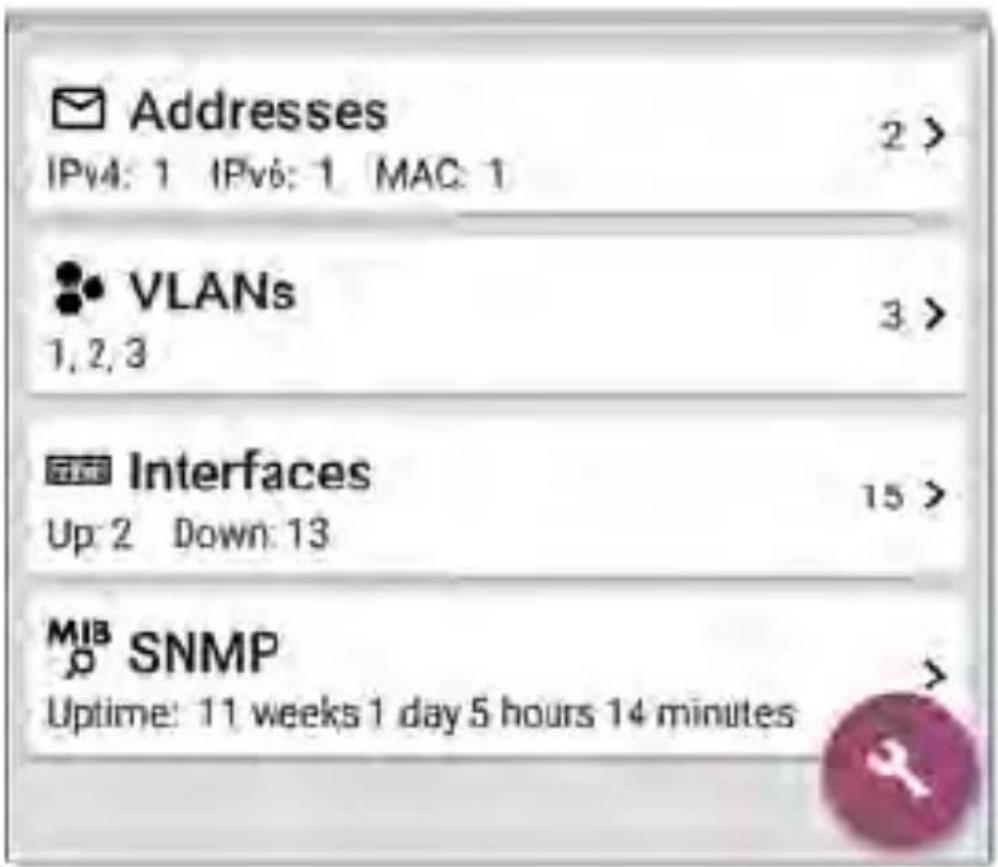
text_image
Addresses IPv4: 1 IPv6: 1 MAC: 1 2 > VLANs 1, 2, 3 3 > Interfaces Up: 2 Down: 13 15 > MIB SNMP Uptime: 11 weeks 1 day 5 hours 14 minutesScreens with a list, such as Addresses shown below, also offer Sort options.
| Addresses (3) | ||
| Address | ||
| IPv4 10.250.1 10.250.0.120 | BSSID | /22 349 |
| IPv6 2001:c0 2001:c001:c0de | IP Address IPv6 Address | |
| IPv6 fe80::16 fe80::1618:77ff: | Mfg-MAC Address MAC Address | 549 |
The rest of this topic provides examples of each type of Details screen and options for additional analysis.
Remember, you can touch any card with a right pointing arrow to open a new screen with more information about the device or characteristic.
Problems
The Problems card shows the icon color of the highest severity problem, and the number of detected Warning, Failure or Error,
Information, and Resolved conditions for the device or network component.
text_image
Problems Warnings: 2Tap the Problems card to view the Problems list screen (unless only 1 Problem is detected, in which case, the detailed Problem description opens, skipping the list screen).
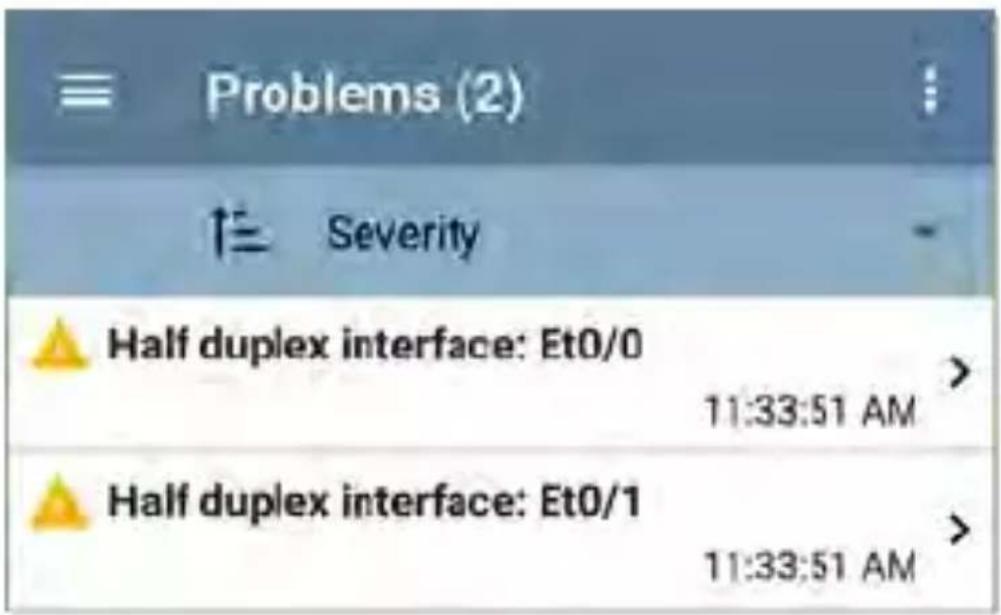
text_image
Problems (2) ↑ Severity Half duplex interface: Et0/0 11:33:51 AM > Half duplex interface: Et0/1 11:33:51 AM >Tap the sort field to sort the list by Severity of by the time when the problem was First Detected.
On the Problems list screen, touch a Problem's row to read a detailed description.
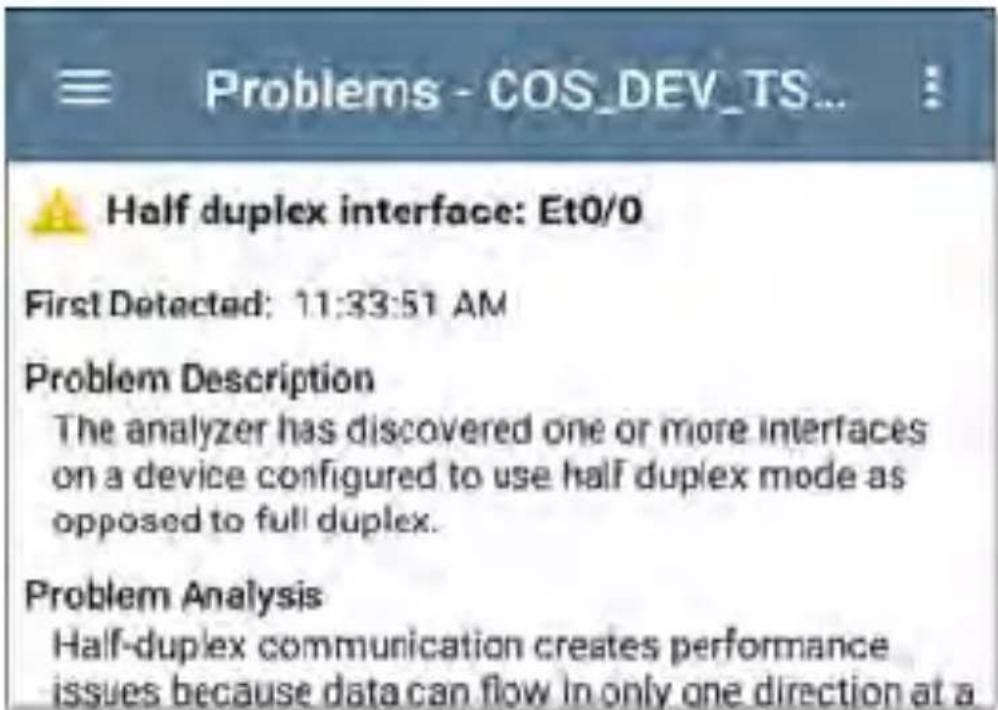
text_image
Problems - COS_DEV_TS... Half duplex interface: Et0/0 First Detected: 11:33:51 AM Problem Description The analyzer has discovered one or more interfaces on a device configured to use half duplex mode as opposed to full duplex. Problem Analysis Half-duplex communication creates performance issues because data can flow in only one direction at aTouch the action overflow button: at the top right of the Problem list or description screen to Clear Problems.
See Problem Settings to select which problems are detected and displayed by your unit.
Addresses

text_image
Addresses IPv4: 1 IPv6: 2 MAC: 1 3 >The Addresses card displays the number of each type of address discovered: IPv4, IPv6, MAC, and/or BSSID. Tap to view the addresses and related information.
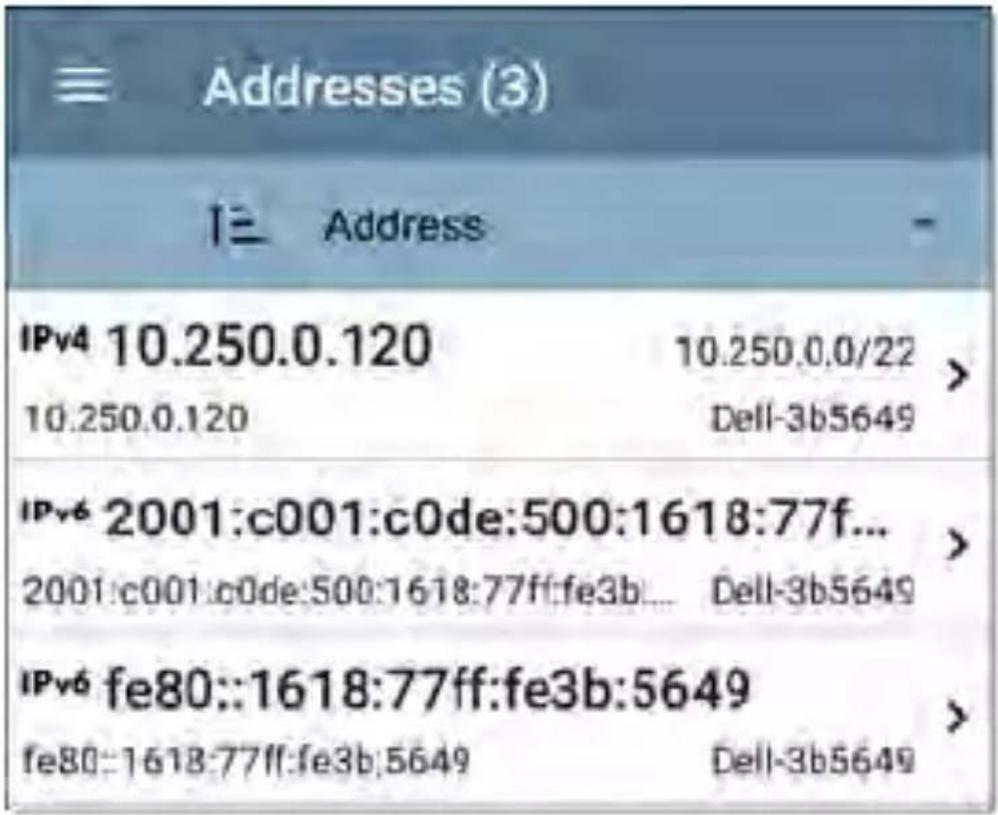
text_image
Addresses (3) Address IPv4 10.250.0.120 10.250.0.0/22 10.250.0.120 Dell-3b5649 IPv6 2001:c001:c0de:500:1618:77f... 2001:c001:c0de:500:1618:77ff:fe3b... Dell-3b5649 IPv6 fe80::1618:77ff:fe3b:5649 fe80::1618:77ff:fe3b:5649 Dell-3b5649From the Addresses list screen, you can sort the list order and tap any of the discovered addresses to investigate the address further.
TCP Port Scan
If you have run a TCP Port Scan (from the Discovery FAB) on a device or IP address, a TC Port Scan card appears on the device's Details screen.

TCP Port Scan
23,80
2>
This card lists open port numbers and shows the total quantity of open ports. Tap the card to open the TCP Port Scan screen.
You can also open this screen from the Discovery floating action menu.
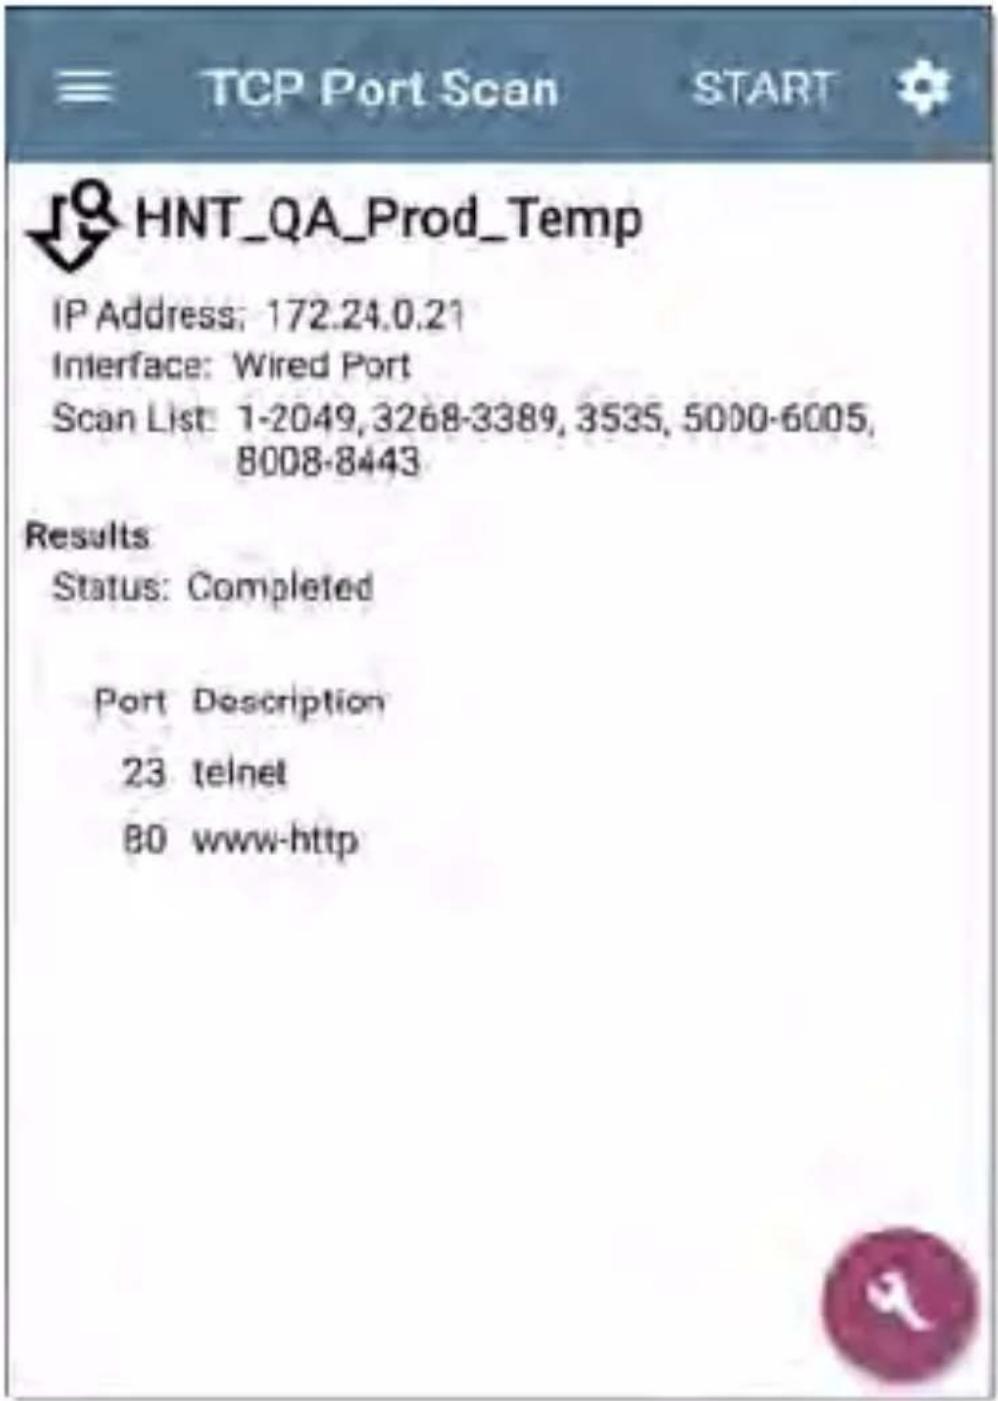
text_image
HNT_QA_Prod_Temp IP Address: 172.24.0.21 Interface: Wired Port Scan List: 1-2049,3268-3389,3535,5000-6005, 8008-8443 Results Status: Completed Port Description 23 telnet B0 www-httpThe top of the TCP Port Scan results screen shows the name or IP address of the tested device and the following fields:
IP address: IP address of the device that was scanned
Interface: Test or management port from which the test ran, set in the TCP Port Scan settings
Scan List: List of port numbers tested Results
Status: Current status of the port scan Port/Description: List of all the detected open ports with their descriptions
See also TCP Port Scan Settings.
VLANs
The VLANs card displays the VLAN IDs this device is using or for which it is configured.

text_image
VLANs 1, 444, 500, 508, 666, 1002, 1003, 1004, 1005This card does not appear if no VLANs are detected or configured. Tap the card to open the VLANs screen.
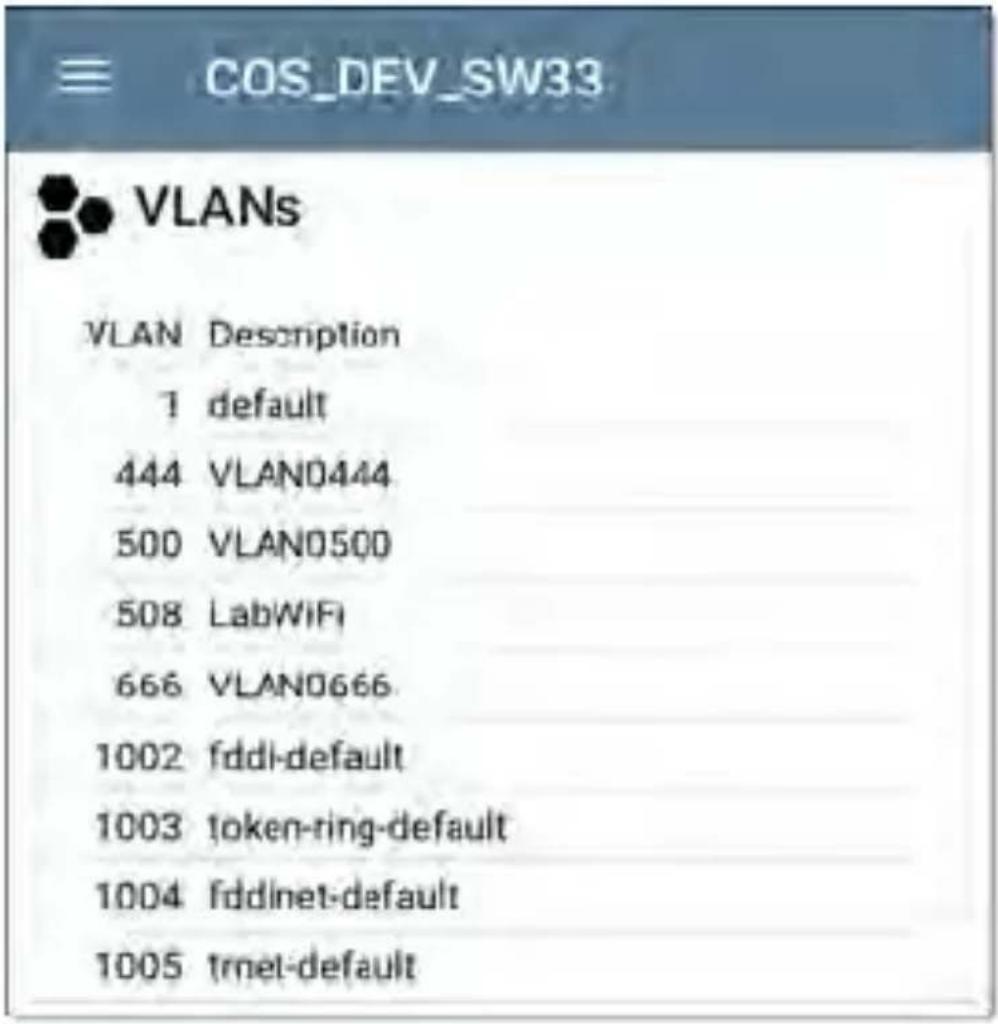
text_image
COS_DEV_SW33 VLANs VLAN Description 1 default 444 VLAN0444 500 VLAN0500 508 LabWIFI 666 VLAN0666 1002 fddi-default 1003 token-ring-default 1004 fddinet-default 1005 trnet-defaultThe VLANs Details screen also shows the description with each VLAN ID.
Interfaces
Interface are discovered using SNMP.

text_image
Interfaces Up: 20 Down: 151 171 >The Interfaces card shows the number of Up and Down interfaces and the total number of Interfaces to the right.
Tap the card to view the list of Interfaces.
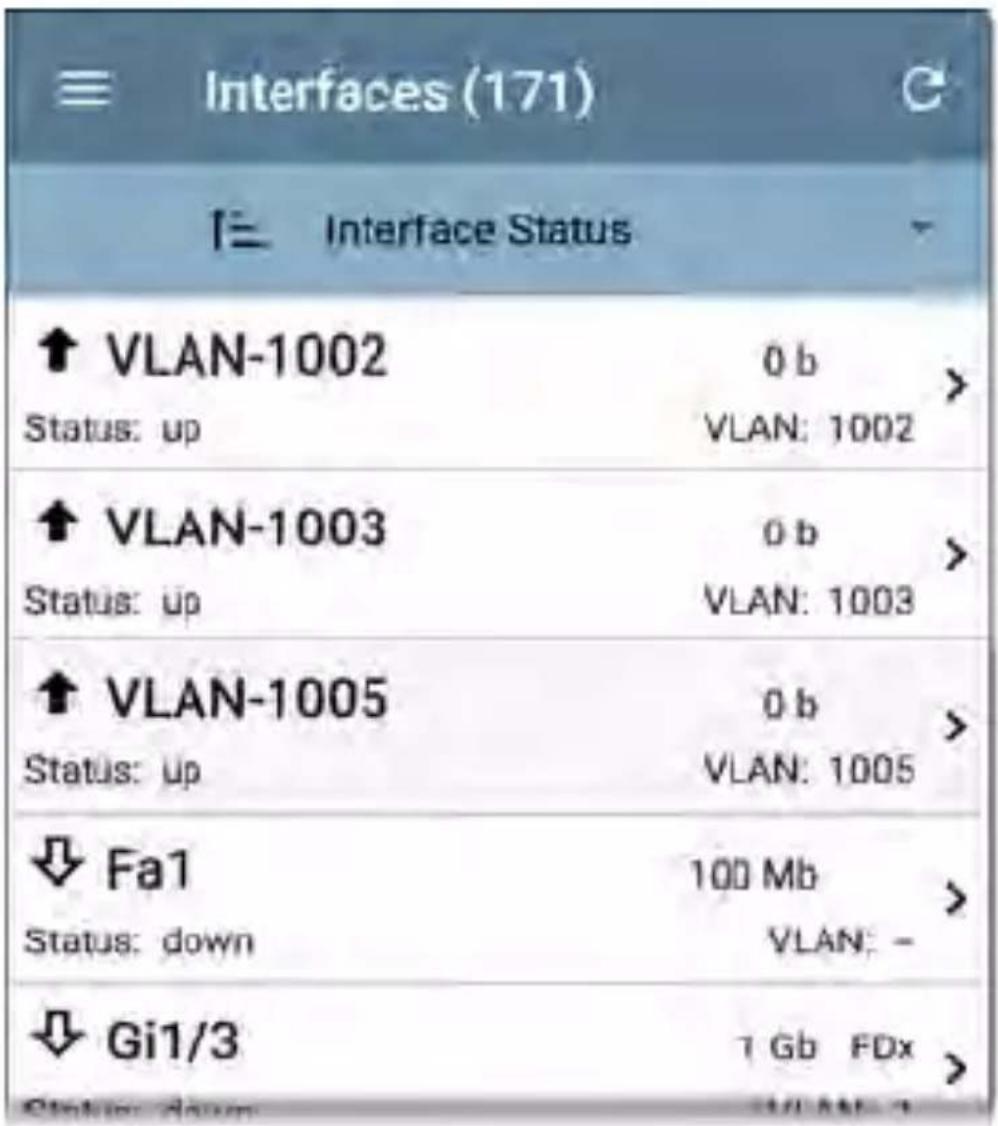
text_image
Interfaces (171) Interface Status ↑ VLAN-1002 Status: up 0 b VLAN: 1002 ↑ VLAN-1003 Status: up 0 b VLAN: 1003 ↑ VLAN-1005 Status: up 0 b VLAN: 1005 ↓ Fa1 Status: down 100 Mb VLAN: - ↓ Gi1/3 7 Gb FDx Status: downLike other Discovery list screens, the Interfaces list provides a number of Sort options, and the selected sort option affects the type of information displayed. The image above shows Interfaces sorted by Status (up or down). The image below shows Interfaces sorted by MAC Address, so each Interface's MAC address is displayed.
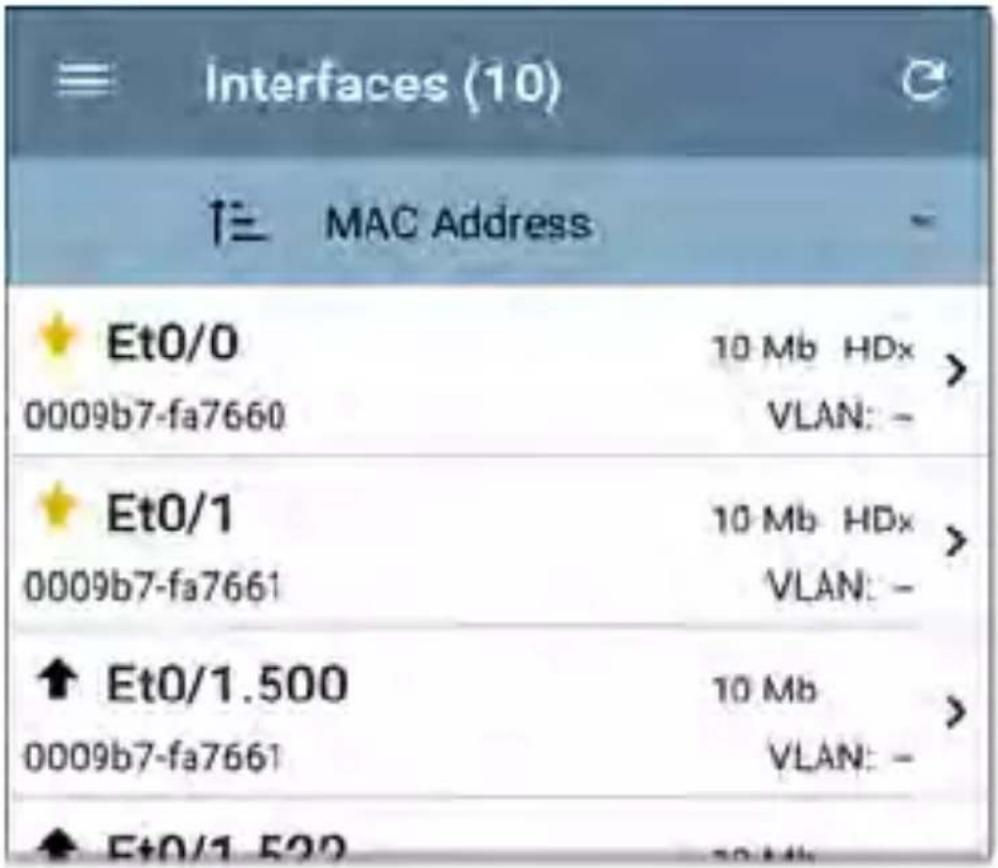
text_image
Interfaces (10) MAC Address Et0/0 0009b7-fa7660 10 Mb HDx VLAN: - Et0/1 0009b7-fa7661 10 Mb HDx VLAN: - Et0/1.500 0009b7-fa7661 10 Mb VLAN: - Et0/1.522Touching an Interface row opens a new Discovery Details screen for the selected Interface.
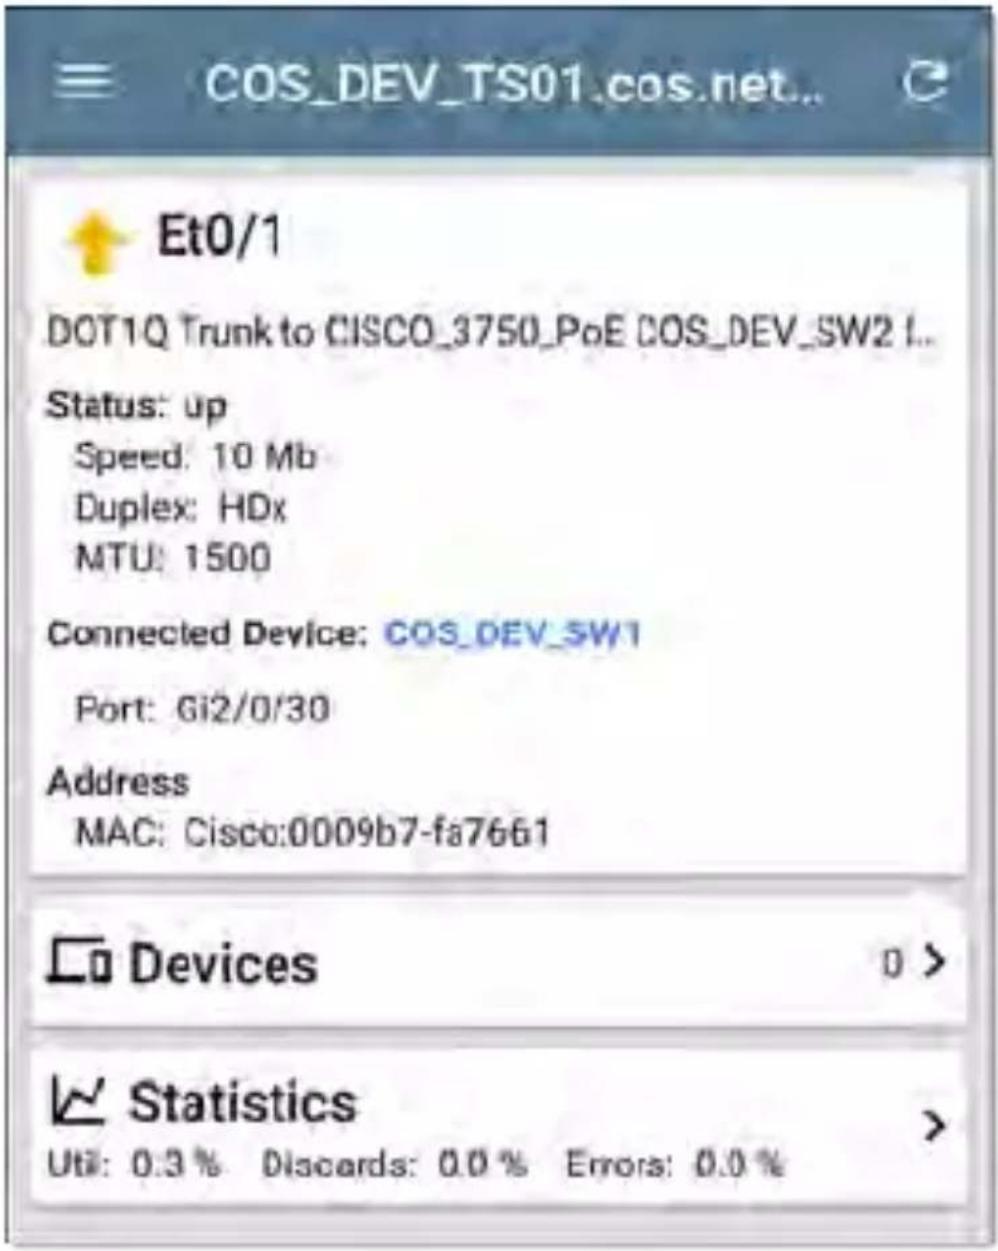
text_image
COS_DEV_TS01.cos.net.. Et0/1 DOT1Q Trunk to CISCO_3750_PoE COS_DEV_SW2 I.. Status: up Speed: 10 Mb Duplex: HDx MTU: 1500 Connected Device: COS_DEV_SW1 Port: Gi2/0/30 Address MAC: Cisco:0009b7-fa7661 Devices Statistics Util: 0.3 % Discards: 0.0 % Errors: 0.0 %The Interface Details screen contains a description of the interface and information about its Status, Connected Device and Port, and Address.
MTU: Maximum Transmission Unit, the maximum packet frame size configured on the interface port
From this screen, you can touch the lower cards to review any discovery VLANs and Devices for the Interface as well as graphs of the Interface Statistics.
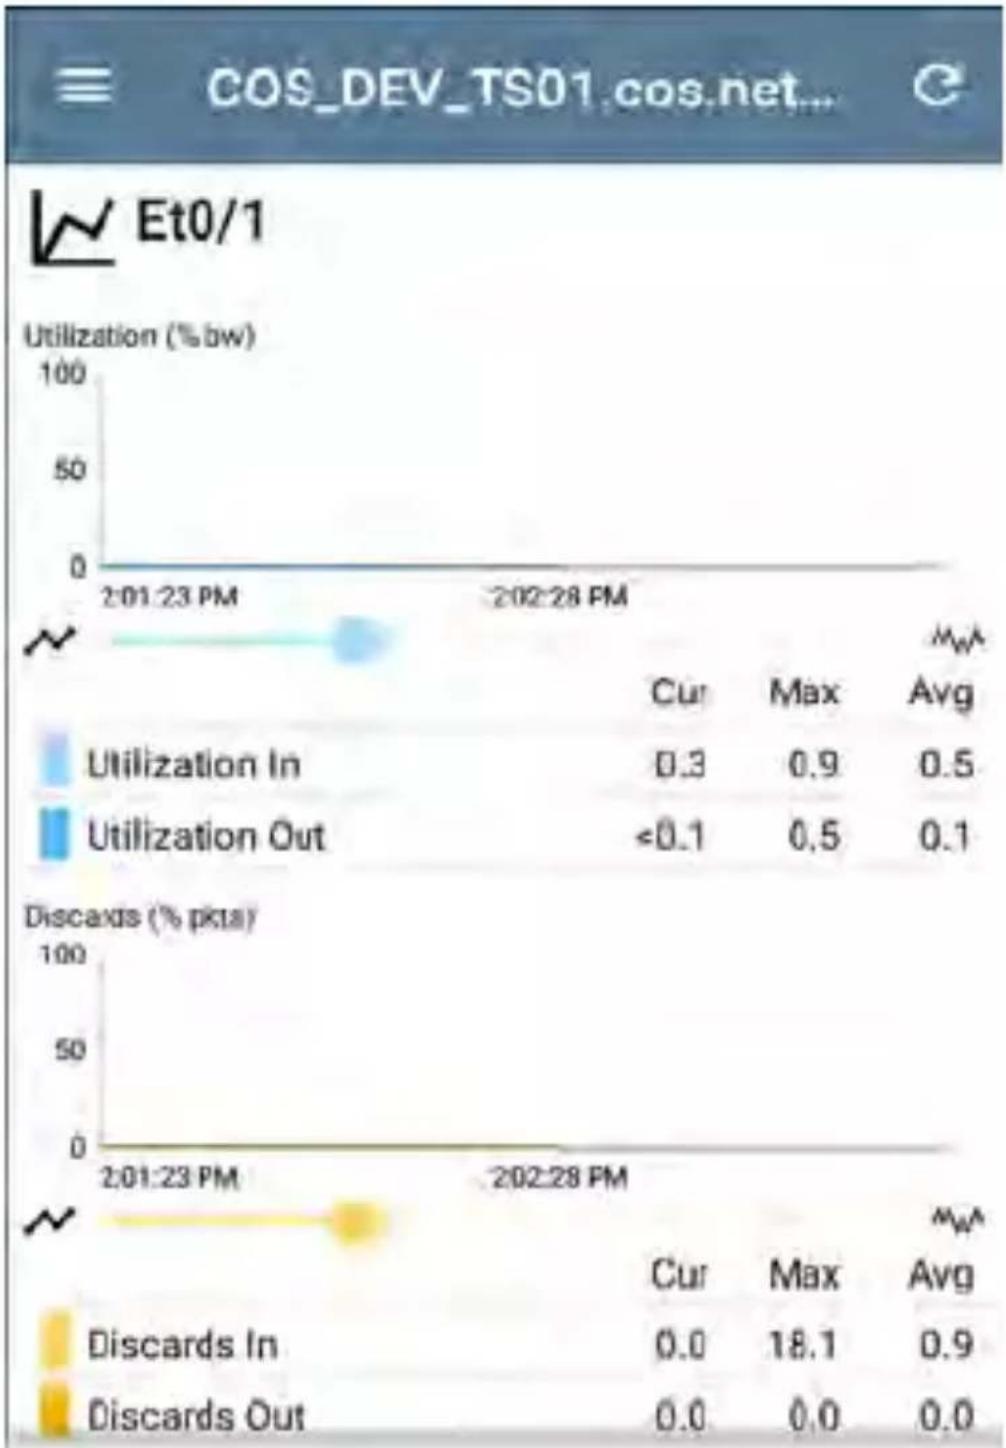
line
| Metric | Cur | Max | Avg | | ---------------- | ---- | ---- | ---- | | Utilization In | 0.3 | 0.9 | 0.5 | | Utilization Out | <0.1 | 0.5 | 0.1 | | Discards In | 0.0 | 18.1 | 0.9 | | Discards Out | 0.0 | 0.0 | 0.0 |The Statistics screen displays real-time trending graphs of Utilization, Packet Discards, Packet Errors. See the Trending Graphs topic for an overview of the graphs' pan and zoom controls
Below the trending graphs are pie charts of Packet transfers to and from the Interface.
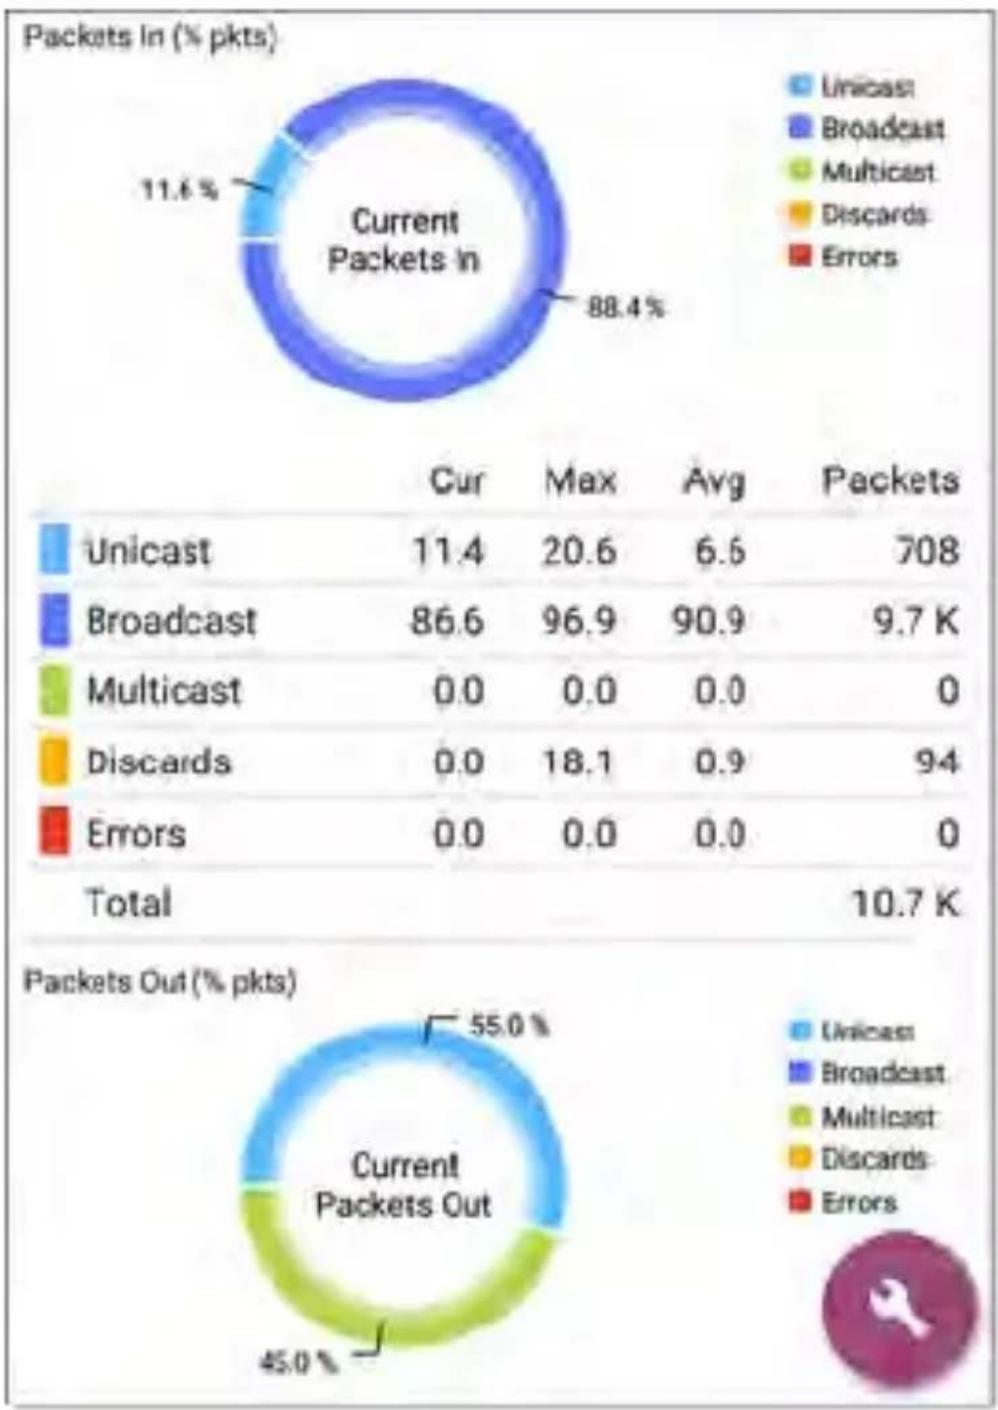
pie
Packets In (% pkts) | Category | Current Packets In (%) | Cur | Max | Avg | Packets | | :--- | :--- | :--- | :--- | :--- | :--- | | Unicast | 11.6 | 11.4 | 20.6 | 6.6 | 708 | | Broadcast | 88.4 | 86.6 | 96.9 | 90.9 | 9.7 K | | Multicast | 0.0 | 0.0 | 0.0 | 0.0 | 0 | | Discards | 0.0 | 0.0 | 18.1 | 0.9 | 94 | | Errors | 0.0 | 0.0 | 0.0 | 0.0 | 0 | Total Packets Out (% pkts) Current Packets Out Unicast Broadcast Multicast Discards ErrorsSNMP
This card shows device details gathered via SNMP and SNMP connectivity to the device.
MIB SNMP
Uptime: 5 weeks 6 days 2 hours 57 minutes
The SNMP card displays the SNMP Uptime. Touch the card for SNMP Details.
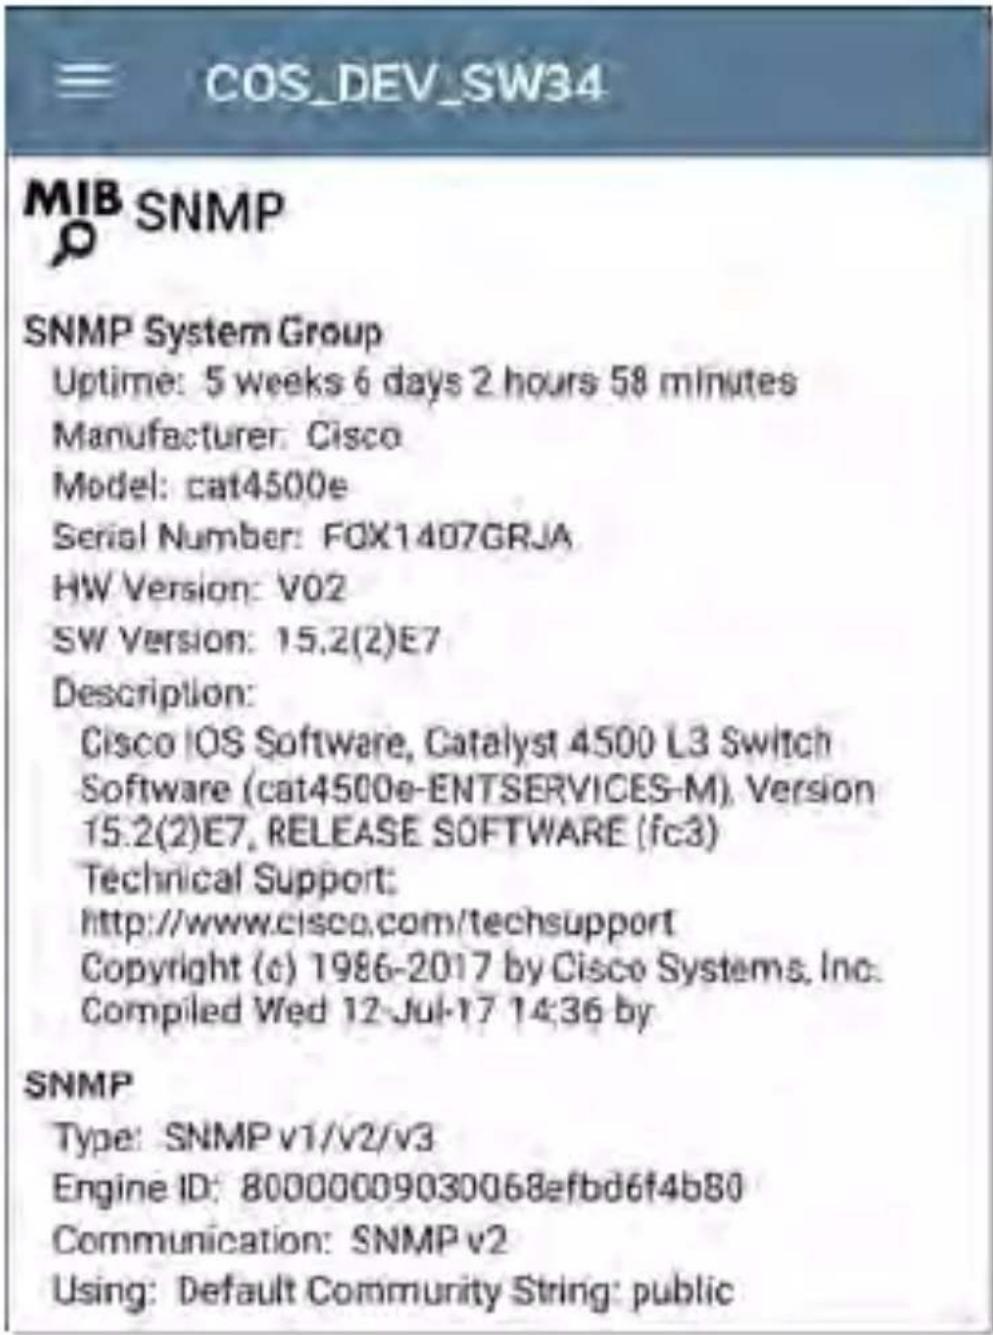
text_image
COS_DEV_SW34 MIB SNMP SNMP System Group Uptime: 5 weeks 6 days 2 hours 58 minutes Manufacturer: Cisco Model: cat4500e Serial Number: FOX1407GRJA HW Version: V02 SW Version: 15.2(2)E7 Description: Cisco IOS Software, Catalyst 4500 L3 Switch Software (cat4500e-ENTSERVICES-M), Version 15.2(2)E7, RELEASE SOFTWARE (fc3) Technical Support: http://www.cisco.com/techsupport Copyright (c) 1986-2017 by Cisco Systems, Inc. Compiled Wed 12-Jul-17 14:36 by SNMP Type: SNMP v1/v2/v3 Engine ID: 80000009030068efbd6f4b80 Communication: SNMP v2 Using: Default Community String: publicSNMP System Group: These data fields are gathered from the system group and other key device version information.
SNMP: SNMP versions the device supports, Engine ID (for v3), and how the LinkRunner is currently communicating with the device,
along with credentials, including the Community String in use
Connected Devices
The Connected Devices card appears on the Details screen for Unknown Switches. While the LinkRunner may be unable to directly identify the connected switch, the devices connected to it provide clues about where the switch is operating.
☐ Connected Devices
8 >
The Connected Devices card shows the number of discovered devices that are connected to the Unknown Switch. Touching the card opens a Discovery list screen with the connected devices.
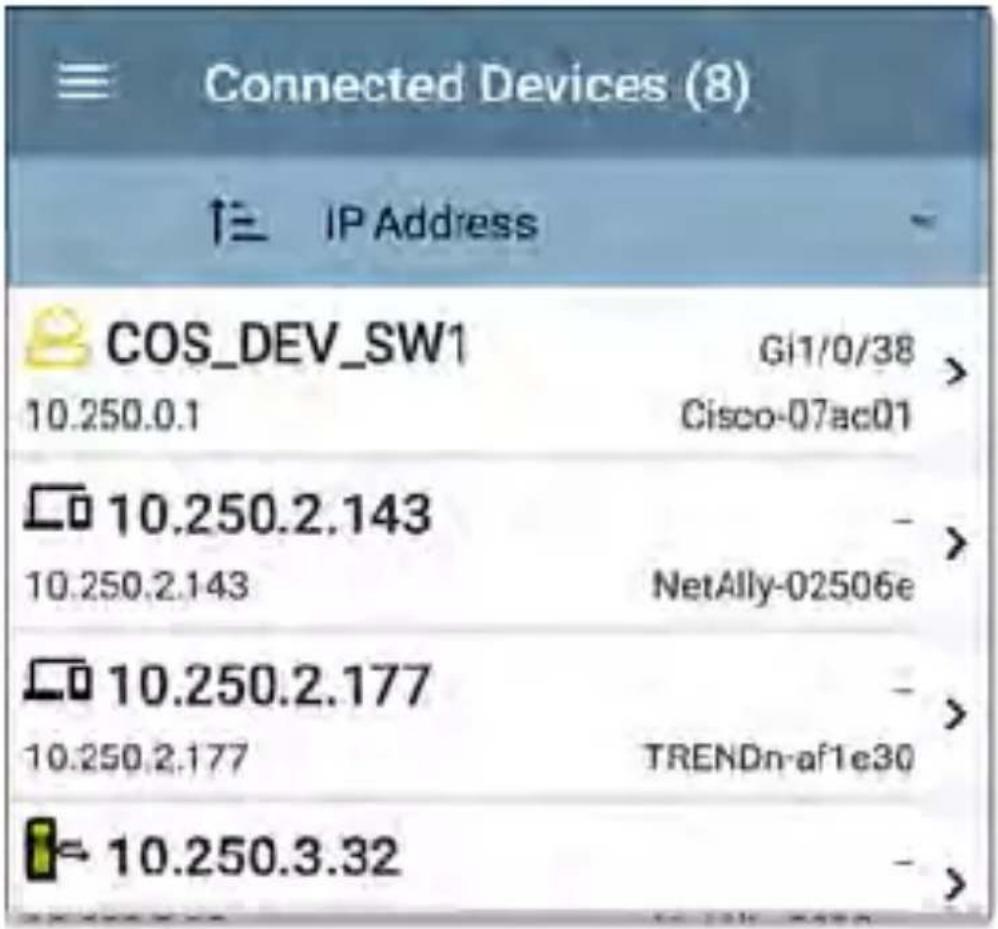
text_image
Connected Devices (8) IP Address COS_DEV_SW1 Gi1/0/38 10.250.0.1 Cisco-07ac01 10.250.2.143 10.250.2.143 NetAlly-02506e 10.250.2.177 10.250.2.177 TRENDn-af1e30 10.250.3.32Resources

text_image
Resources CPU: 28% Memory: 35% >The Resources card shows the percentages of CPU, memory, and storage usage on the device. This information is gathered via SNMP.
Touch the card to view current and maximum resource utilization measurements.
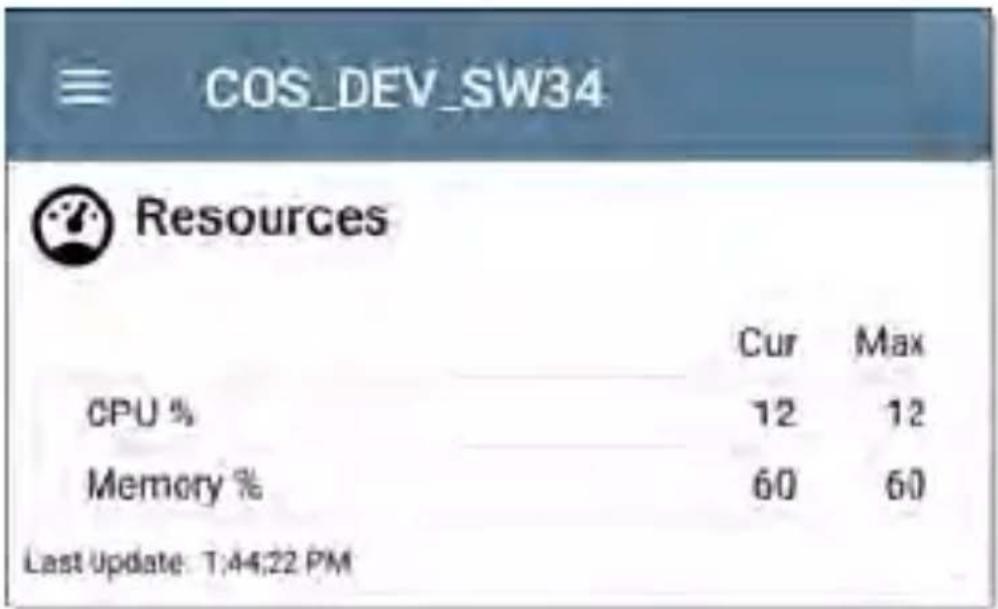
text_image
COS_DEV_SW34 Resources CPU % 12 12 Memory % 60 60 Last Update: 1:44:22 PMBy default, LinkRunner displays a Warning condition if CPU, Memory, or Storage utilization is above 90%. You can adjust problem detection and thresholds in the Wired Problem Settings accessed from the Discovery navigation drawer.
SSIDs
The SSIDs card appears in the Details for Wi-Fi Controllers. This information is gathered via SNMP.

SSIDs
16>
This card shows the number of SSIDs gathered from SNMP. Tap the card to view the list of SSIDs.
| SSIDs | ||
| SSID | Security | VLAN |
| √ CiscoQATest-maana | WPA2-P, WPA-P | - |
| √ Cisco WEP64 QA | WEP | - |
| √ aa-Cisco-Wep | WEP | - |
| √ aonly | WPA2-P, WPA-P | - |
| √ Cisco ISE | WPA2-E | - |
| √ RF Chamber | WPA2-P, WPA-P | - |
| √ Lobo | WPA2-P, WPA-P | - |
| √ COS Cisco Captive Portal | Web | - |
| × Portal Test | Web | - |
| √ [Cisco Hidden] | WPA2-P | - |
| √ Cisco 2.4G | WPA2-P | - |
On the SSIDs screen, each SSID is shown with its Security type(s) and any VLANs. SSIDs with checkmark to the left are enabled, and those with an × are disabled.

Discovery App Floating Action Menu
The floating action button (FAB) on Details screens offers additional actions depending on the device type and connection available.
Opening other NetAlly apps, such as Path Analysis, Ping/TCP, or
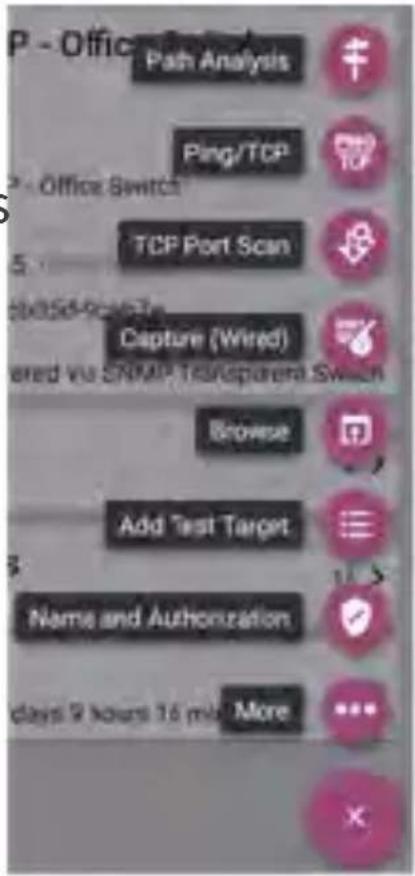
text_image
P - Office Path Analysis Ping/TCP Office Switch TCP Port Scan Capture (Wired) wired via SNMP Transparena Switch Browse Add Test Target Name and Authorization days 9 hours 16 m/s More ...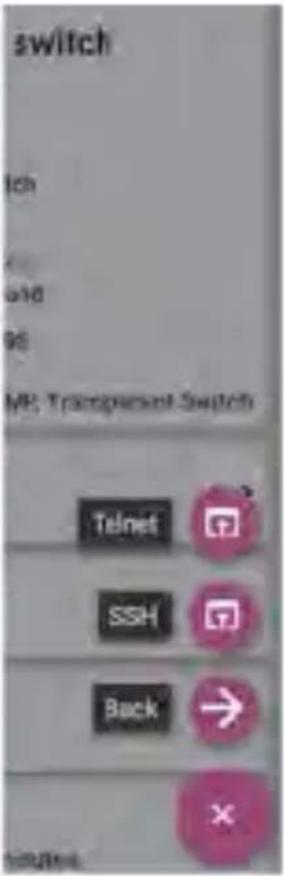
text_image
switch ch old 96 MP; Transparent Switch Telnet SSH Back XCapture, from a Details screen will auto-populate the new app with the device's name and/or address. In this way, the Discovery app provides a helpful shortcut and prevents you from needing to type in target addresses or hostnames in other testing apps.
- Touching TCP Port Scan opens the TCP Port Scan screen in the Discovery app.
- Selecting Browse opens Google Chrome.
- Touching Add Test Target creates a new AutoTest target matching the currently selected device. A dialog first displays to select the test type, then the AutoTest app opens, displaying the newly added target's settings, where you can further customize it.
- For devices with a MAC address or BSSID, touching Name and Authorization opens a dialog where you can assign a custom user name and Authorization status.
- Touching More opens a secondary list of additional floating action buttons. Touching Back returns to the original list.
- Telnet or SSH open the JuiceSSH app.
Auto-Populating Device Addresses
When another app is opened from the FAB, the default address and name shown on the Top Details Card are the targets populated.
For example, the Router shown in the Details screen below has multiple IPv4 and MAC addresses (which can be viewed by touching the Addresses card).
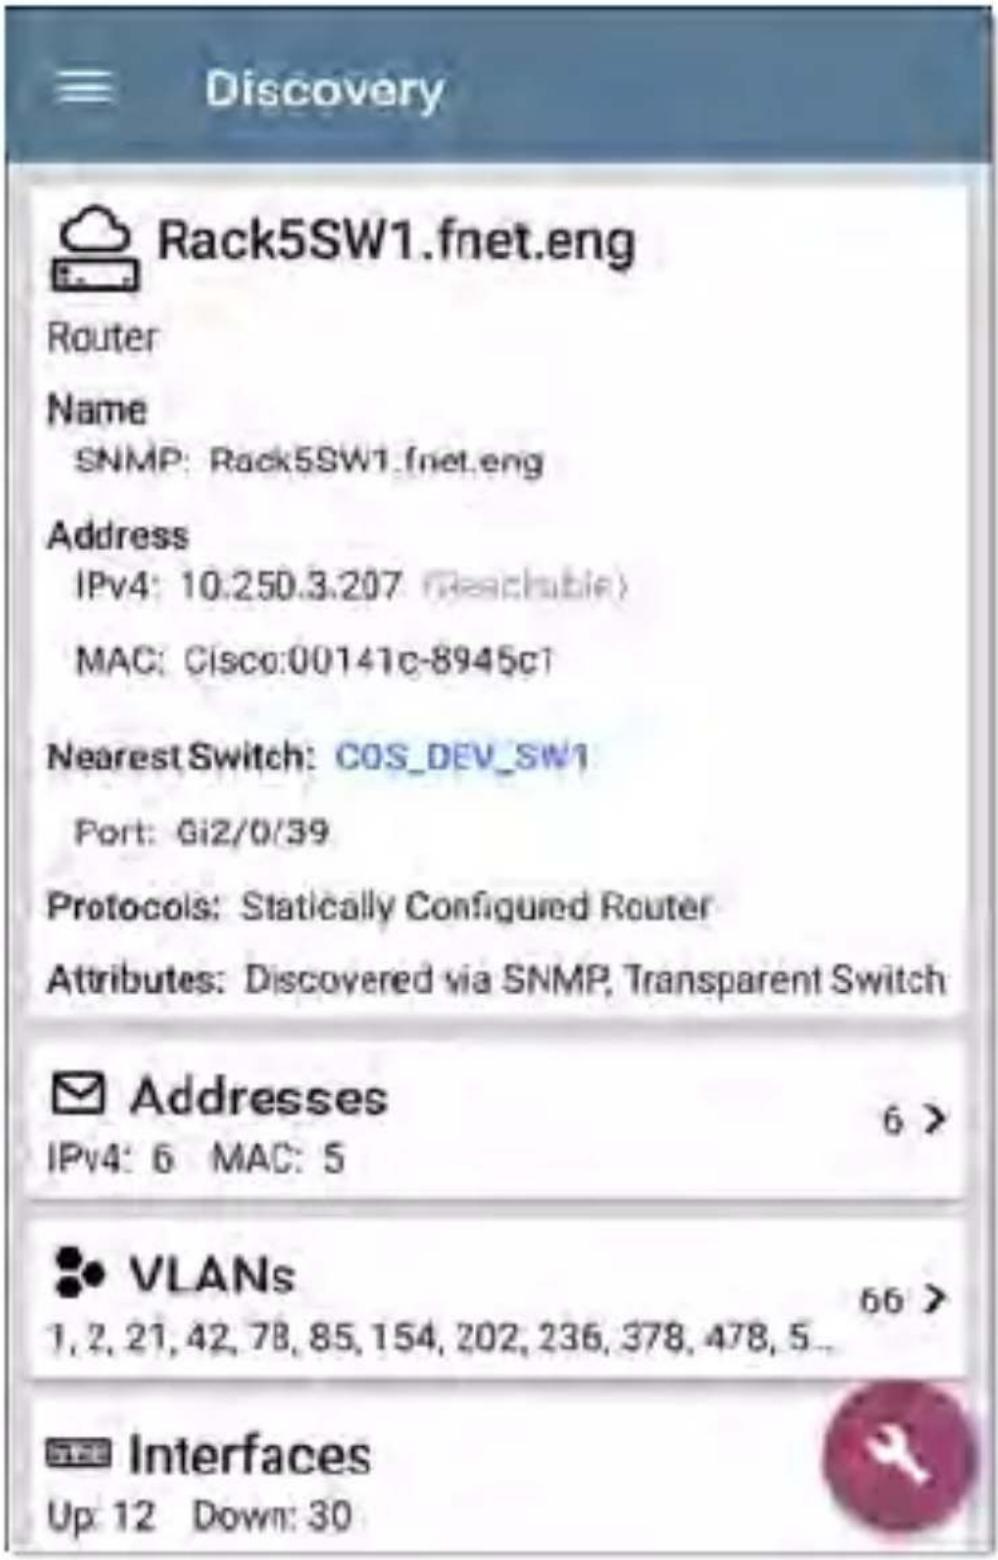
text_image
Discovery Rack5SW1.fnet.eng Router Name SNMP: Rack5SW1.fnet.eng Address IPv4: 10.250.3.207 ( Reachable ) MAC: Cisco:00141c-8945c1 Nearest Switch: COS_DEV_SW1 Port: Gi2/0/39 Protocols: Statically Configured Router Attributes: Discovered via SNMP, Transparent Switch Addresses IPv4: 6 MAC: 5 6 > VLANs 1, 2, 21, 42, 78, 85, 154, 202, 236, 378, 478, 5... Interfaces Up 12 Down: 30When a user opens the FAB and selects a different app, such as Path Analysis, only the address and name listed at the top of the Details screen will be populated in the Path Analysis app.
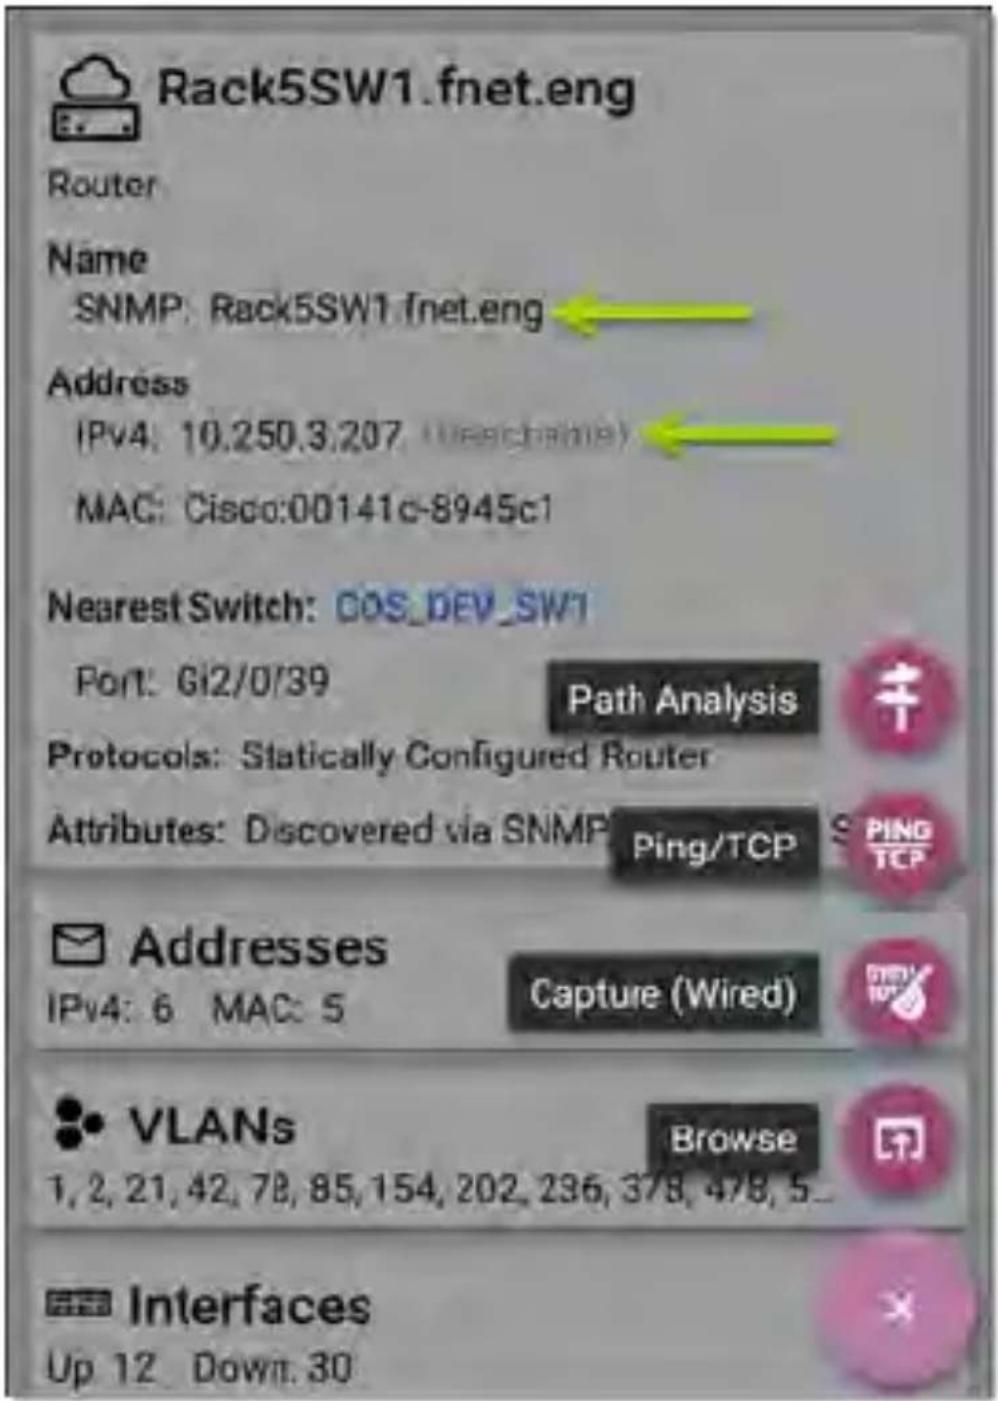
text_image
Rack5SW1.fnet.eng Router Name SNMP: Rack5SW1.fnet.eng Address IPv4: 10.250.3.207 (USBCHN018) MAC: Cisco:00141c-8945c1 Nearest Switch: COS_DEV_SW1 Port: Gi2/0/39 Path Analysis Protocols: Statically Configured Router Attributes: Discovered via SNMP Ping/TCP Addresses IPv4: 6 MAC: 5 Capture (Wired) VLANs Browse 1, 2, 21, 42, 78, 85, 154, 202, 236, 378, 478, 5 Interfaces Up 12 Down 30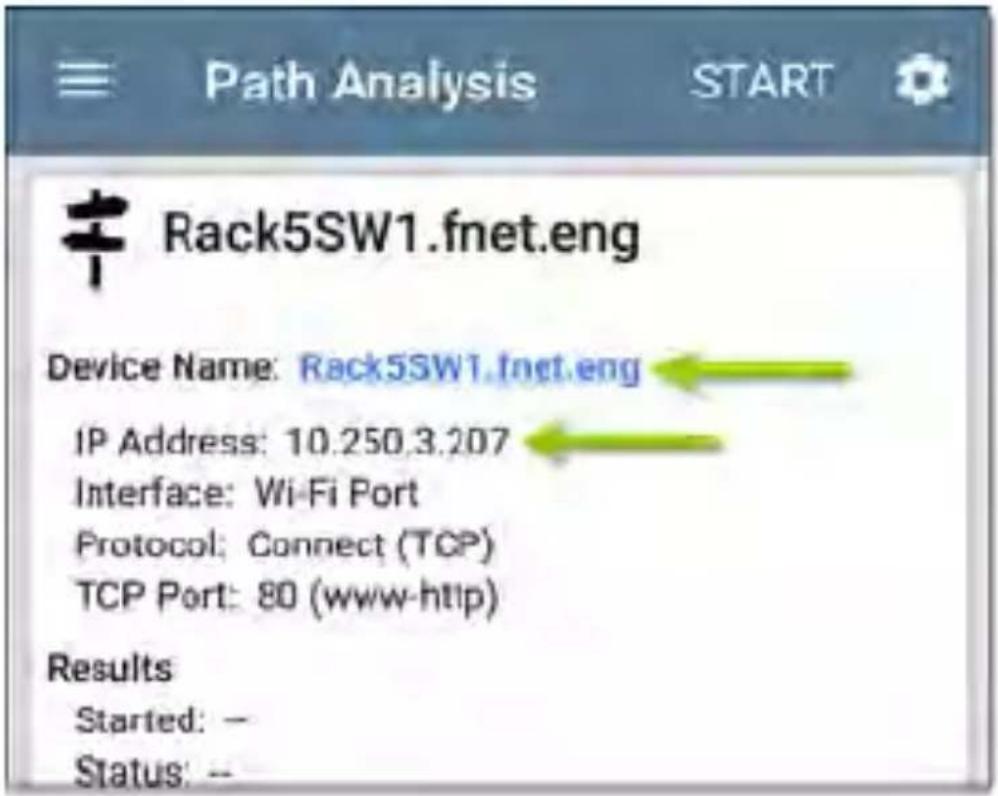
text_image
Path Analysis START Rack5SW1.fnet.eng Device Name: Rack5SW1.fnet.eng IP Address: 10.250.3.207 Interface: Wi-Fi Port Protocol: Connect (TCP) TCP Port: 80 (www-http) Results Started: - Status: -To open another screen or app with a different address, open the Addresses card, and select another address to view its Details screen.
Device Types
The Discovery app lists and analyzes the types of devices explained in this section. Different data may be available to the LinkRunner depending on the device type, how it was discovered, and your configured settings.
See Discovery Settings for SNMP Configuration and Devices Discovered Through Other Devices options.
For descriptions of the different Details cards and screens, see Discovery Details.
The images in the rest of this section represent an example of the data Discovery may display for each device type.
Routers
LinkRunner discovers IP routers by monitoring traffic and querying hosts.
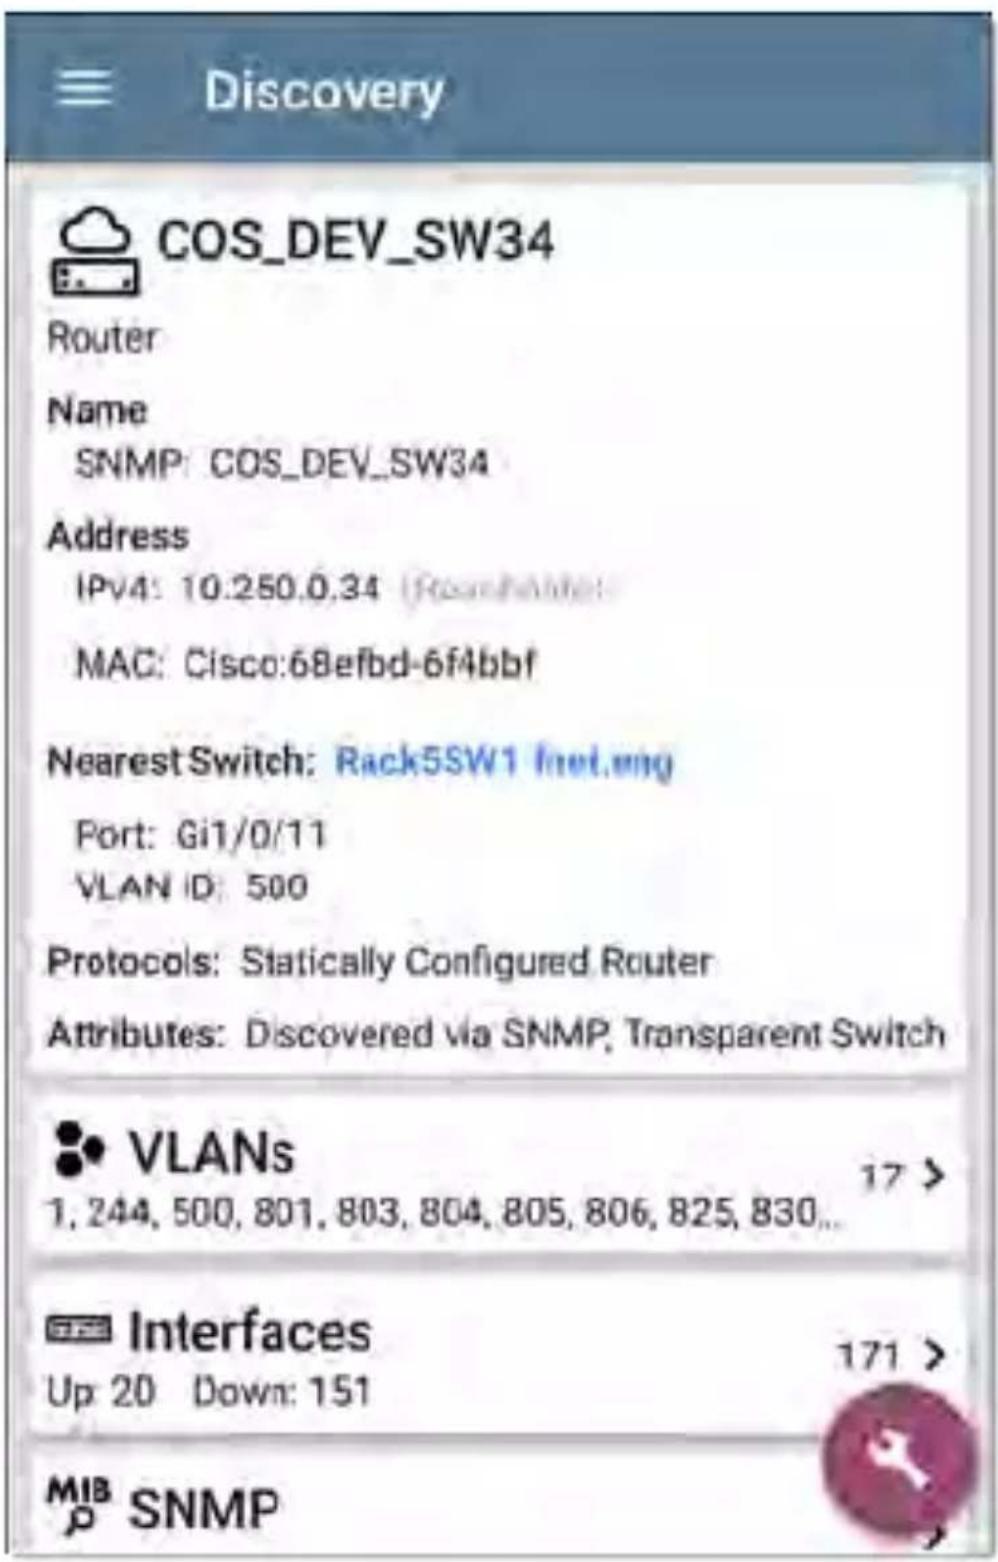
text_image
Discovery COS_DEV_SW34 Router Name SNMP: COS_DEV_SW34 Address IPv4: 10.250.0.34 (Ro#e#bfb) MAC: Cisco:68efbd-6f4bbf Nearest Switch: Rack5SW1 Inet.eng Port: Gi1/0/11 VLAN ID: 500 Protocols: Statically Configured Router Attributes: Discovered via SNMP, Transparent Switch VLANs 1,244,500,801,803,804,805,806,825,830... Interfaces Up 20 Down: 151 MIB SNMPSwitches
Switches are also discovered by monitoring traffic and querying hosts.
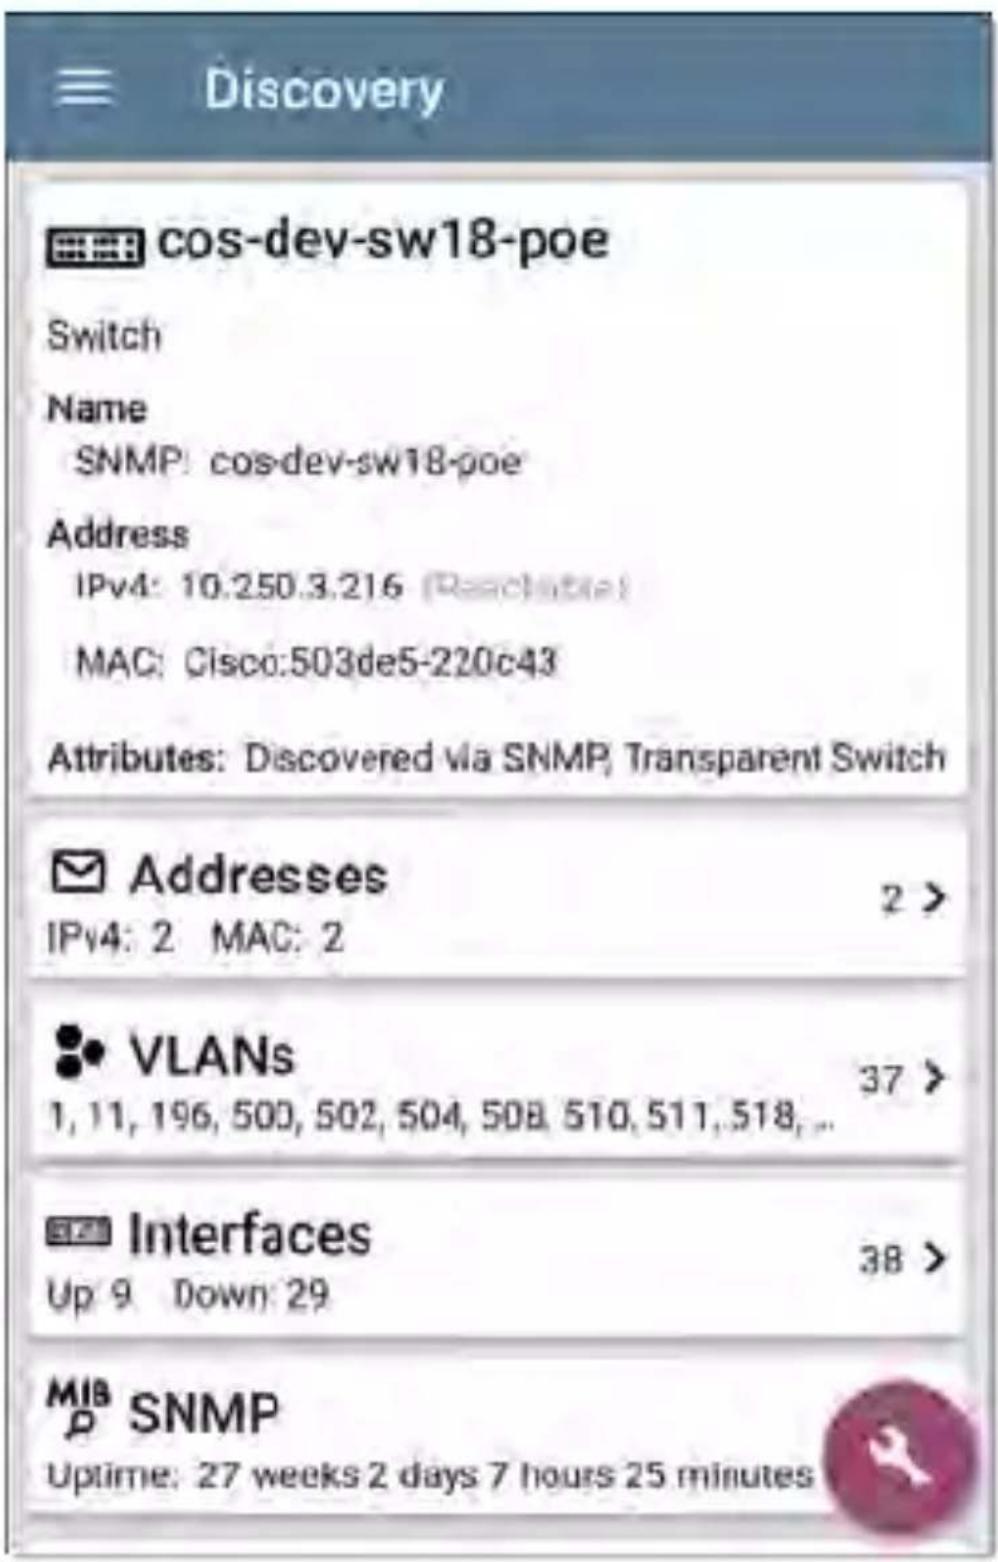
text_image
Discovery cos-dev-sw18-poe Switch Name SNMP: cos-dev-sw18-poe Address IPv4: 10.250.3.216 (Reselective) MAC: Cisco:503de5-220c43 Attributes: Discovered via SNMP; Transparent Switch Addresses IPv4: 2 MAC: 2 2 > VLANs 1, 11, 196, 500, 502, 504, 508, 510, 511, 518, ... Interfaces Up 9 Down: 29 38 > MIB SNMP Uptime: 27 weeks 2 days 7 hours 25 minutesUnknown Switches
Unknown switches are detected indirectly based on analysis of the traffic going through surrounding switches. Though the LinkRunner cannot identify the switch itself, it can sense where a switch is active on the network via the device MAC addresses in that space.
Unknown Switches are numbered by the LinkRunner as they are discovered. These numbers may change the next time the discovery process runs.
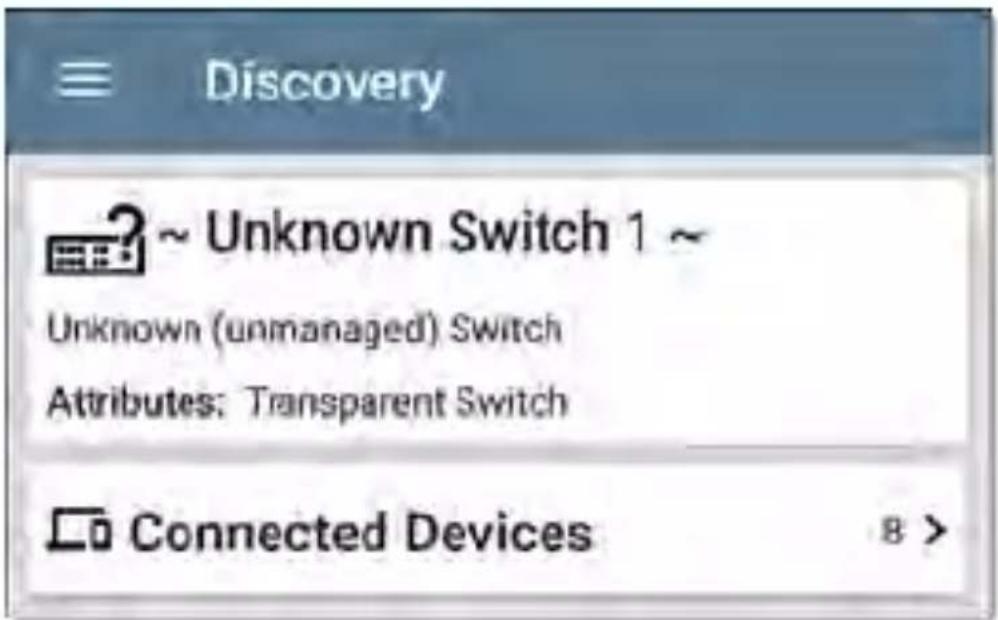
text_image
Discovery ~ Unknown Switch 1 ~ Unknown (unmanaged) Switch Attributes: Transparent Switch Connected DevicesThe Unknown Switches Details screen shows the number of devices connected to the switch and allows you to view the devices that are connected by tapping the Connected Devices
card. The connected devices provide clues about where the unknown switch may be located.
Network Servers
Network servers include NetBIOS, DHCP, and DNS servers.
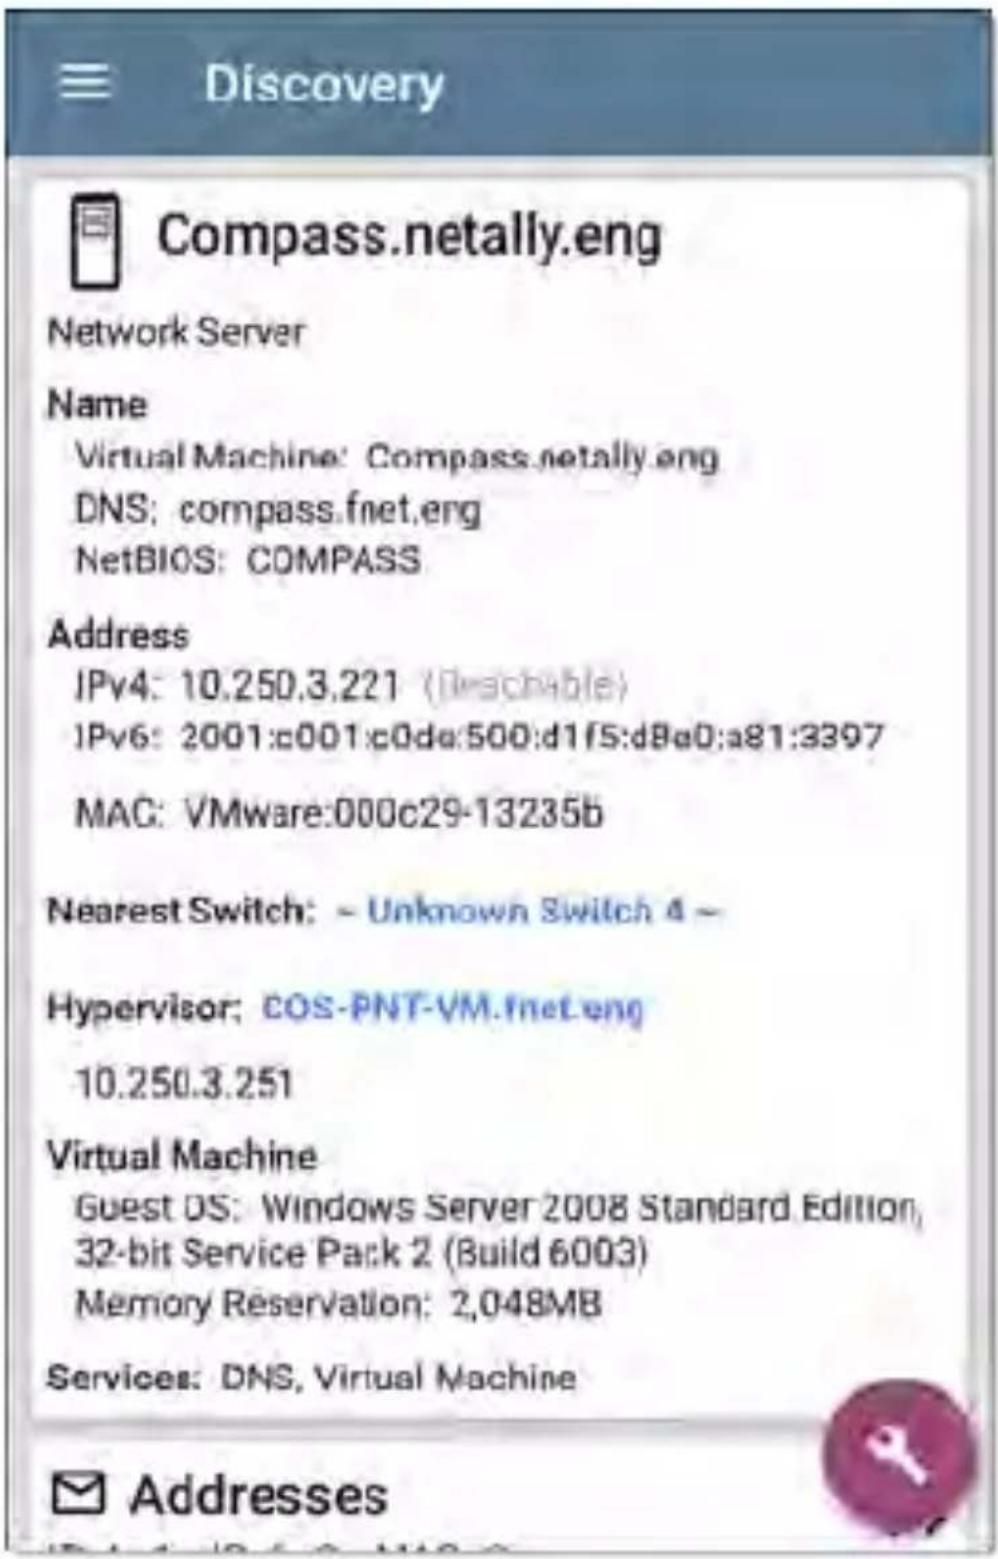
text_image
Discovery Compass.netally.eng Network Server Name Virtual Machine: Compass.netally.eng DNS: compass.fnet.eng NetBIOS: COMPASS Address IPv4: 10.250.3.221 (Ibeachable) IPv6: 2001:c001:c0de:500:d1f5:d8e0:a81:3397 MAC: VMware:000c29-13235b Nearest Switch: - Unknown Switch 4 - Hypervisor: COS-PNT-VM.fnet.eng 10.250.3.251 Virtual Machine Guest DS: Windows Server 2008 Standard Edition, 32-bit Service Pack 2 (Build 6003) Memory Reservation: 2,048MB Services: DNS, Virtual Machine AddressesHypervisors
VMware hypervisors are discovered via SNMP. The hypervisor's SNMP agent must be enabled for the LinkRunner to discover it and classify it as a hypervisor.
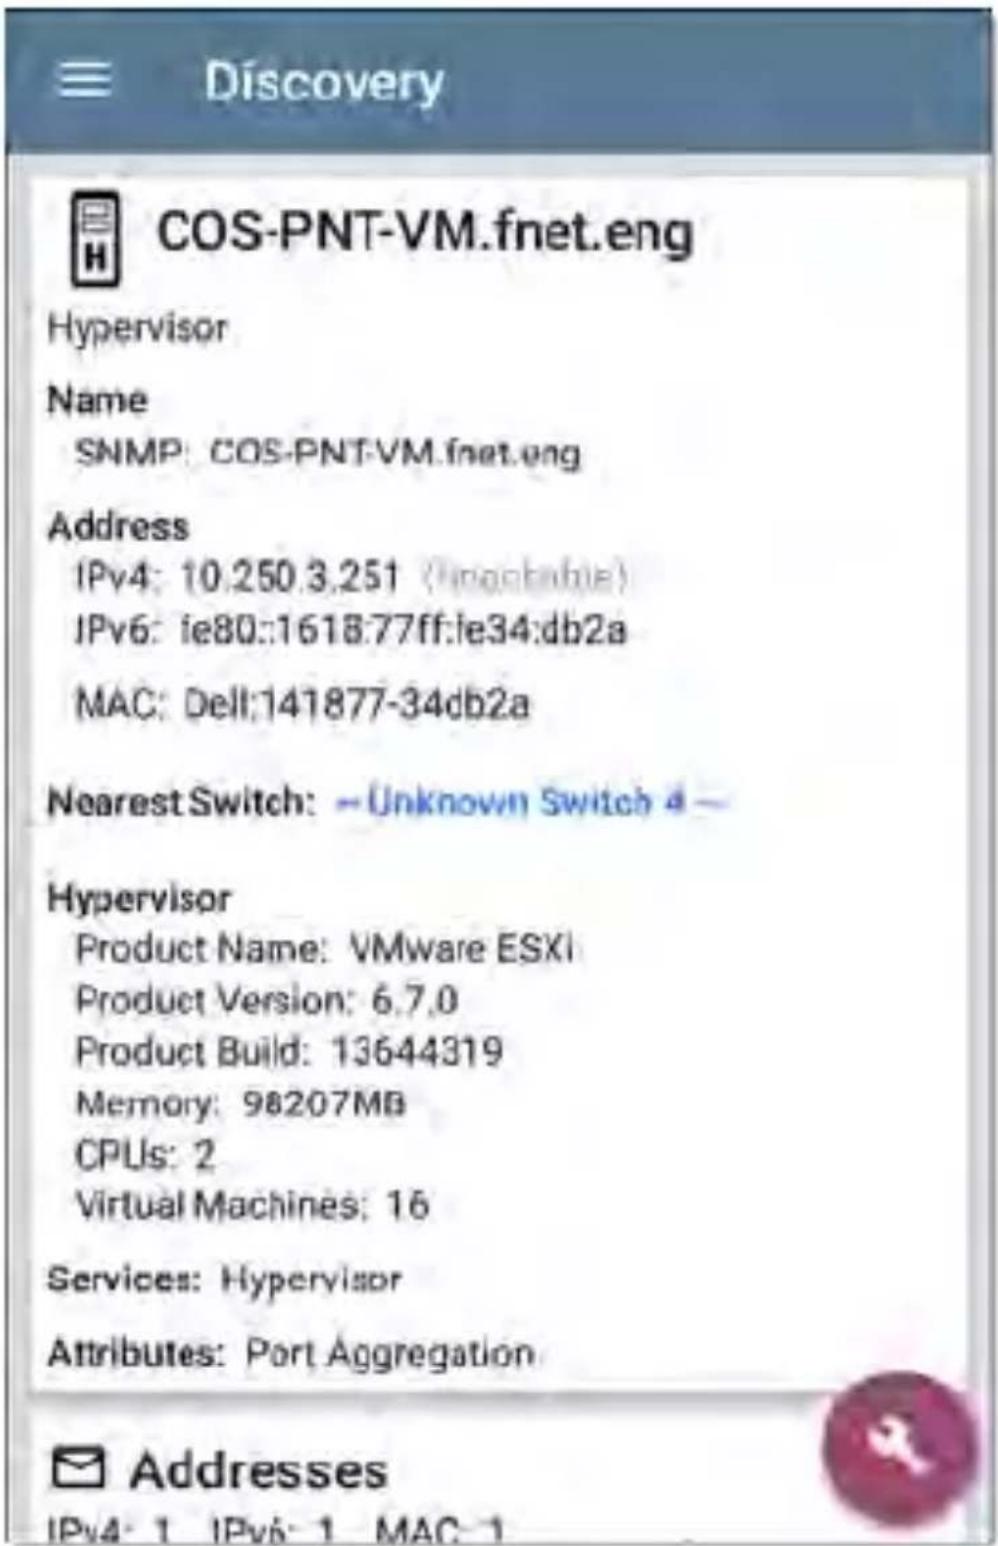
text_image
Discovery COS-PNT-VM.fnet.eng Hypervisor Name SNMP: COS-PNT-VM.fnet.eng Address IPv4: 10.250.3.251 (Insgnubie) IPv6: ie80::1618:77ff:le34:db2a MAC: Dell:141877-34db2a Nearest Switch: - Unknown Switch 4 - Hypervisor Product Name: VMware ESXi Product Version: 6.7.0 Product Build: 13644319 Memory: 98207MB CPUs: 2 Virtual Machines: 16 Services: Hypervisor Attributes: Port Aggregation Addresses IPv4: 1 IPv6: 1 MAC: 1Virtual Machines
VMware virtual machines are discovered from VMware client table in SNMP-enabled VMware hypervisors. Devices are also classified as Virtual Machines if they have a VMware MAC.
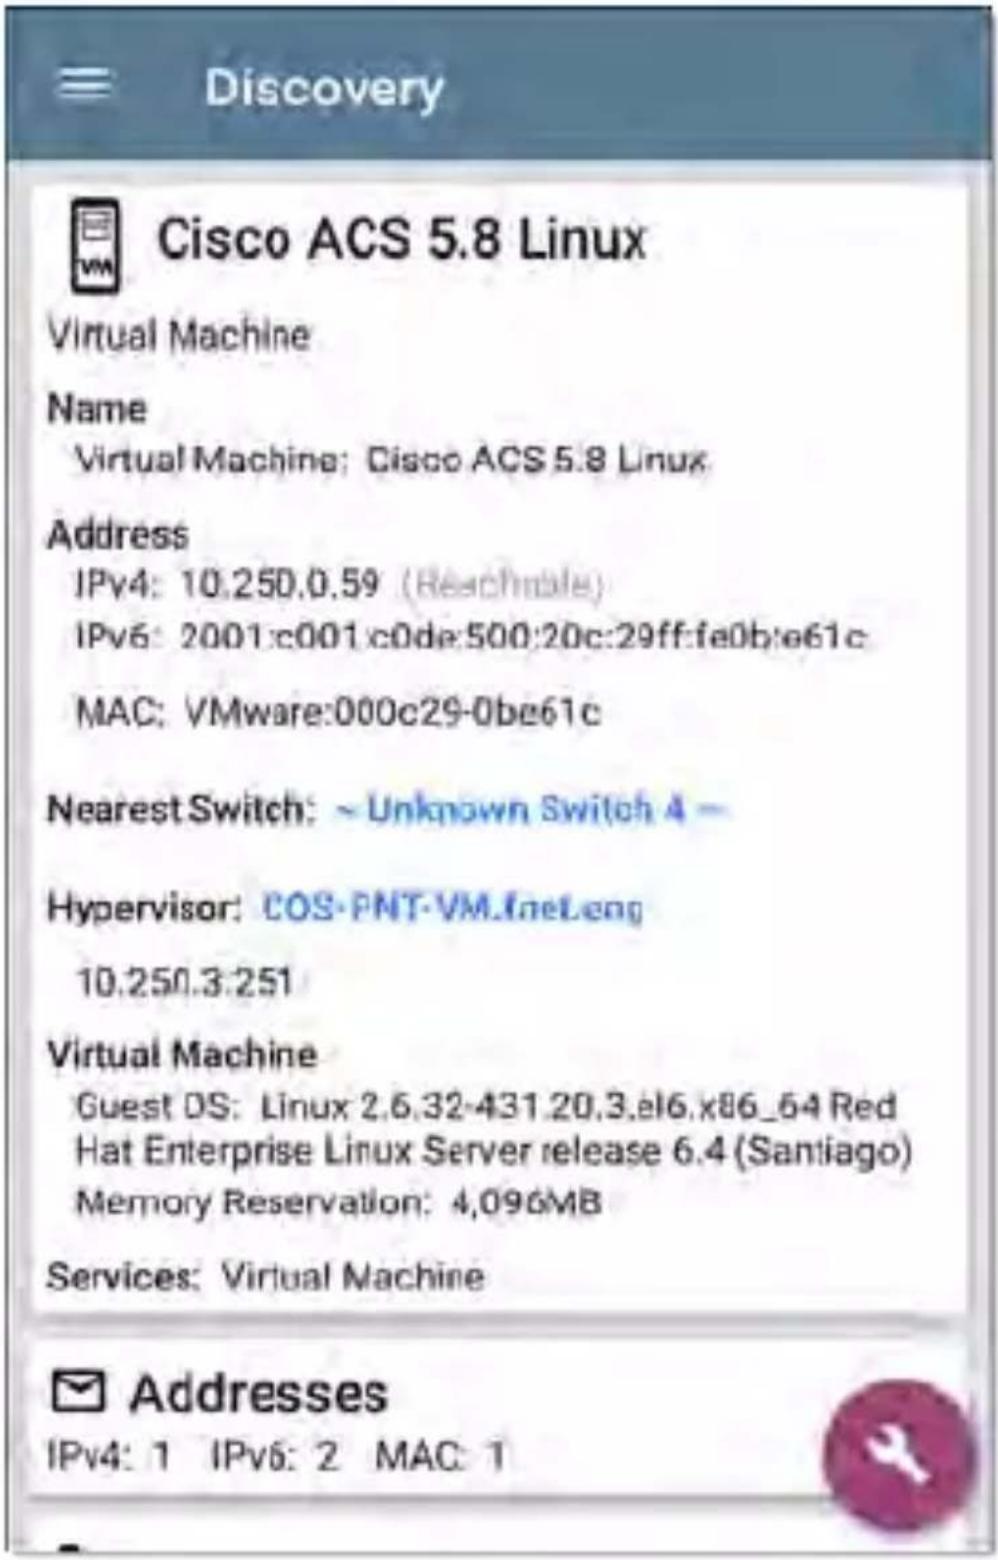
text_image
Discovery Cisco ACS 5.8 Linux Virtual Machine Name Virtual Machine: Cisco ACS 5.8 Linux Address IPv4: 10.250.0.59 (Reachable) IPv6: 2001:c001:c0de:500:20c:29ff:fe0b:e61c MAC: VMware:000c29-0be61c Nearest Switch: ~ Unknown Switch 4 ~ Hypervisor: COS-PNT-VM.IneLeng 10.250.3:251 Virtual Machine Guest DS: Linux 2.6.32-431.20.3.el6.x86_64 Red Hat Enterprise Linux Server release 6.4 (Santiago) Memory Reservation: 4,096MB Services: Virtual Machine Addresses IPv4: 1 IPv6: 2 MAC: 1Wi-Fi Controllers
LinkRunner can discover SNMP enabled Wi-Fi controllers, including Cisco and Aruba Wi-Fi Controllers.
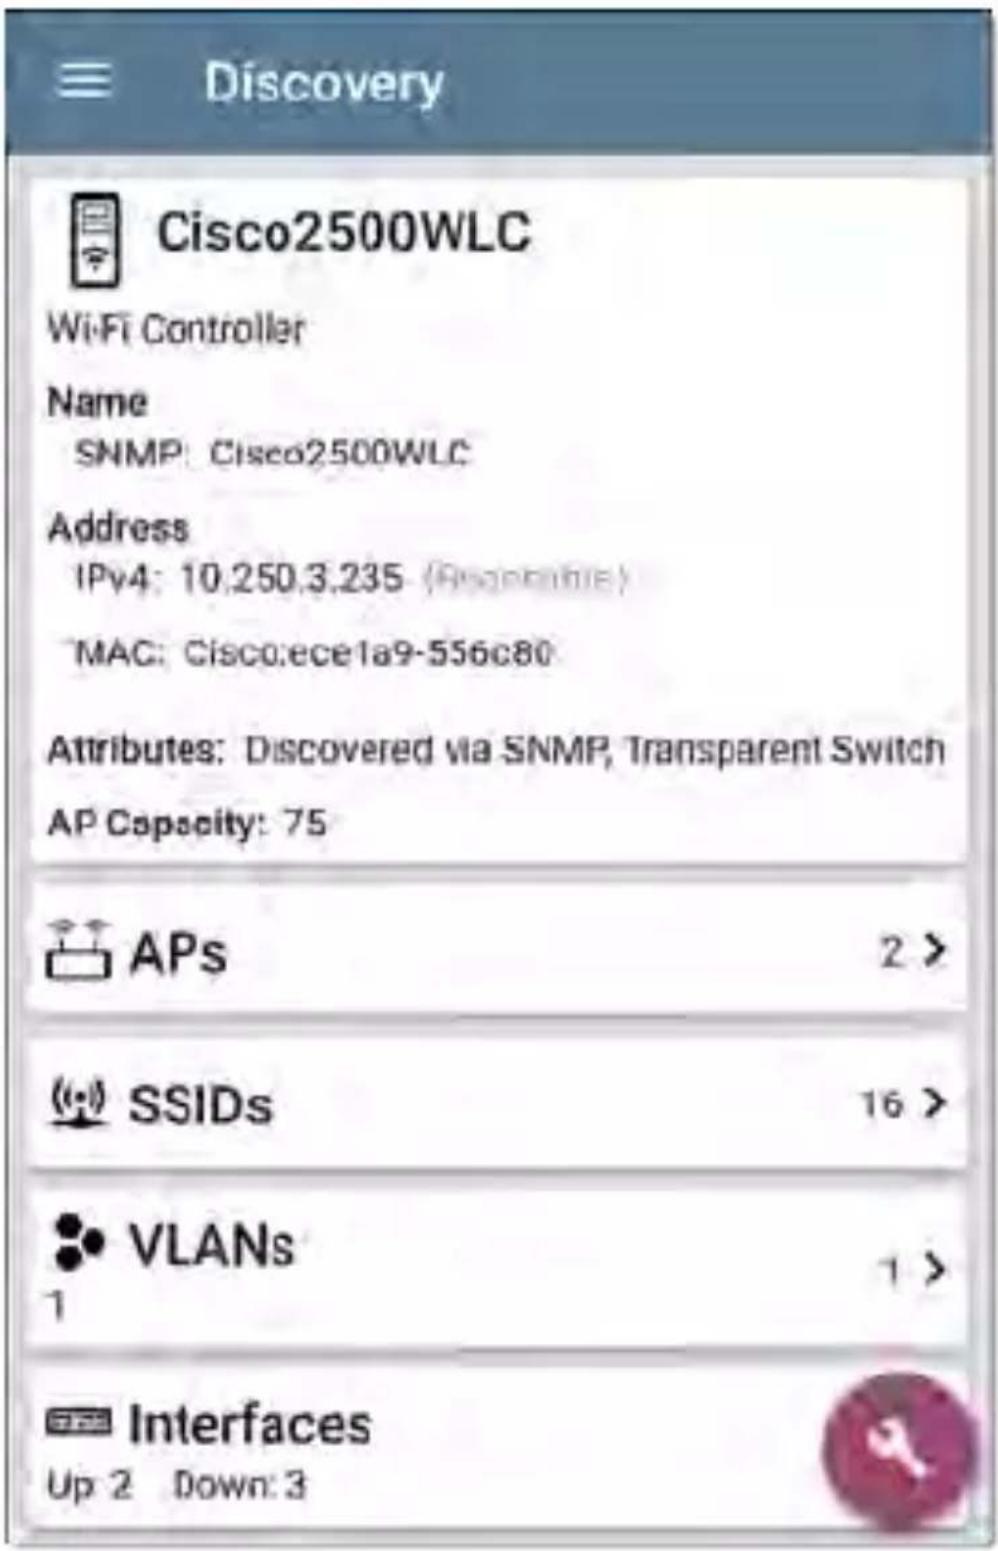
text_image
Discovery Cisco2500WLC WiFi Controller Name SNMP: Cisco2500WLC Address IPv4: 10.250.3.235 (Accessible) MAC: Cisco:ece1a9-556c80 Attributes: Discovered via SNMP, Transparent Switch AP Capacity: 75 APs 2 > SSIDs 16 > VLANs 1 > Interfaces Up 2 Down 3Access Points (APs)
The LinkRunner discovers APs through SNMP queries via the wired side of the network.
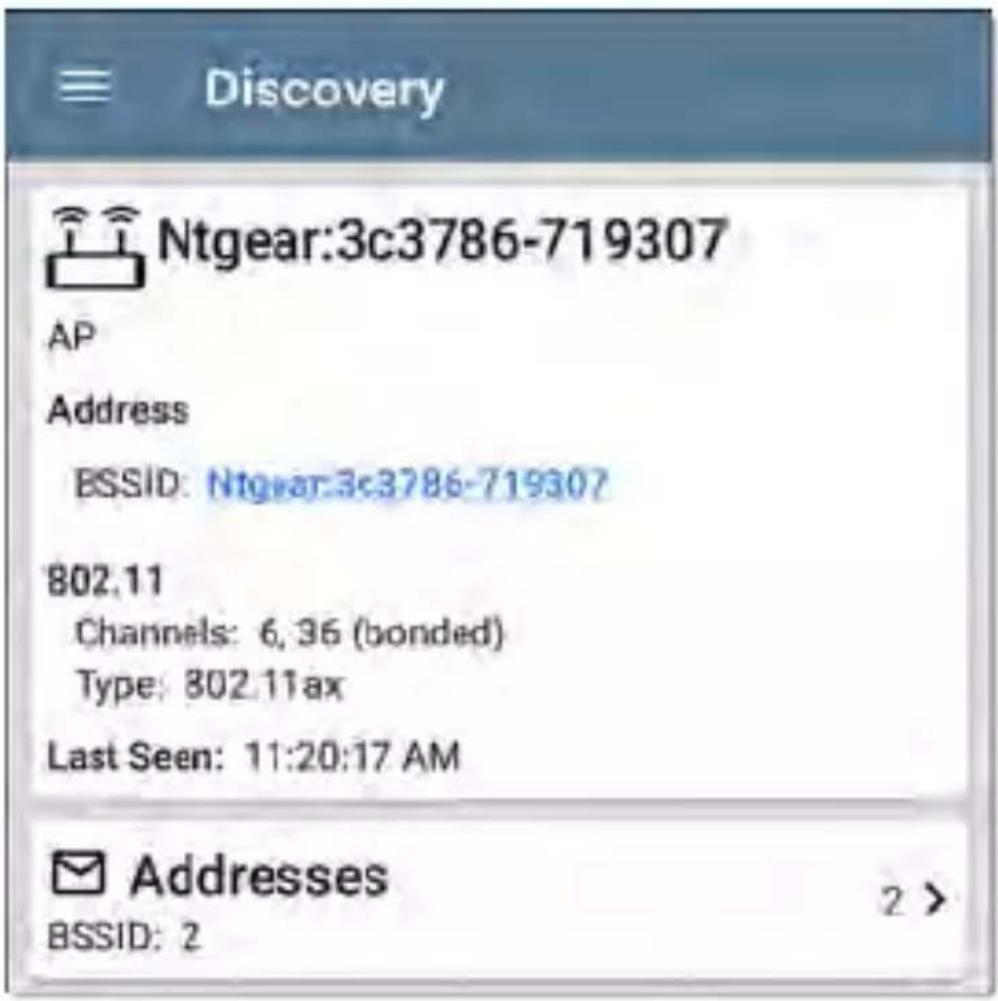
text_image
Discovery Ntgear:3c3786-719307 AP Address BSSID: Ntgear:3c3786-719307 802.11 Channels: 6, 36 (bonded) Type: 802.11ax Last Seen: 11:20:17 AM Addresses BSSID: 2Wi-Fi Clients
Wireless clients are discovered through SNMP queries through the wired side of the network.
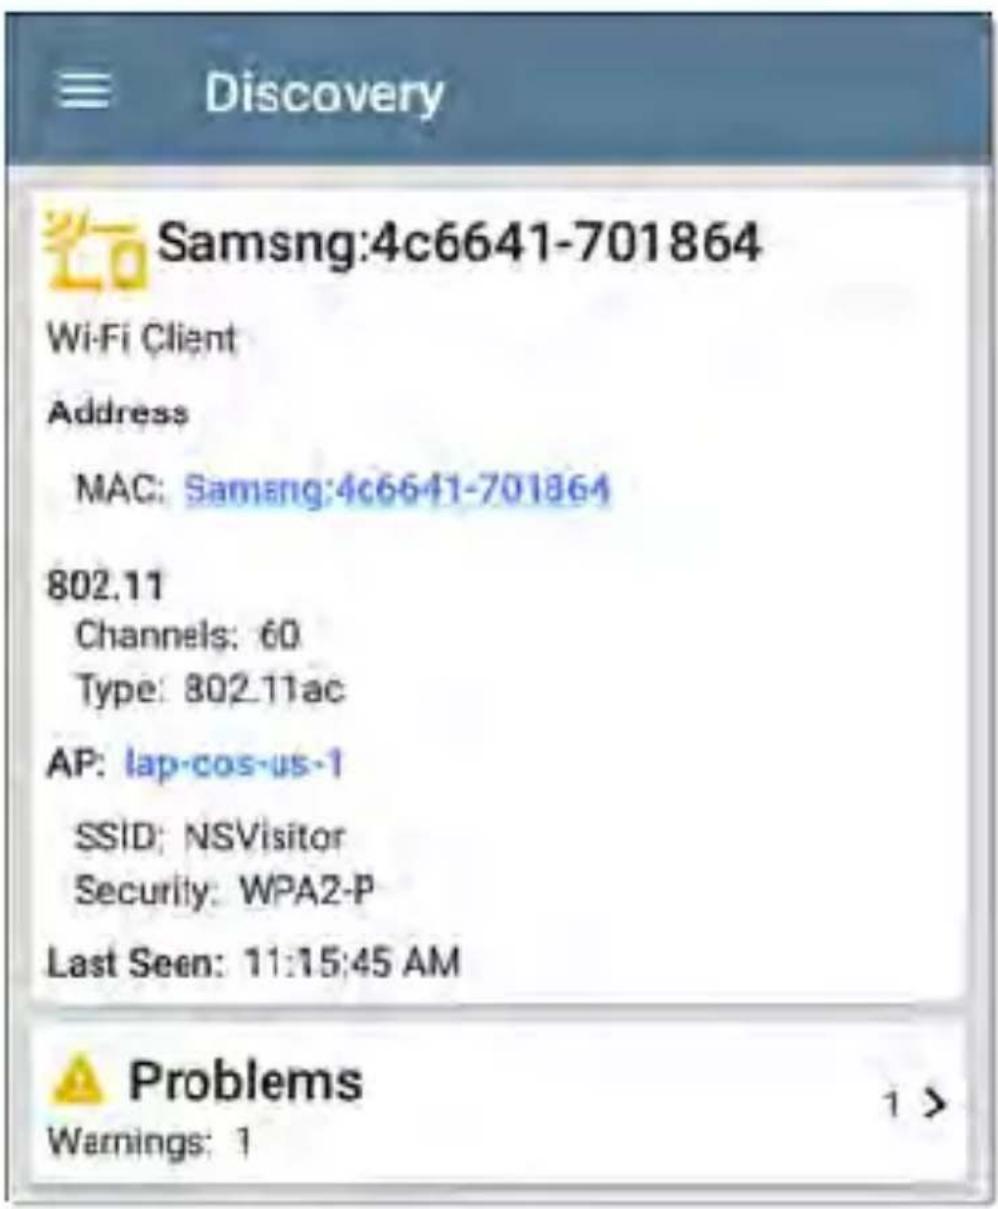
text_image
Discovery Samsng:4c6641-701864 Wi-Fi Client Address MAC: Samang:4c6641-701864 802.11 Channels: 60 Type: 802.11ac AP: lap-cos-us-1 SSID: NSVisitor Security: WPA2-P Last Seen: 11:15:45 AM Problems Warnings: 1 >VoIP Phones
VoIP discovery provides visibility into the VoIP and layer 2/3 configuration of the network.
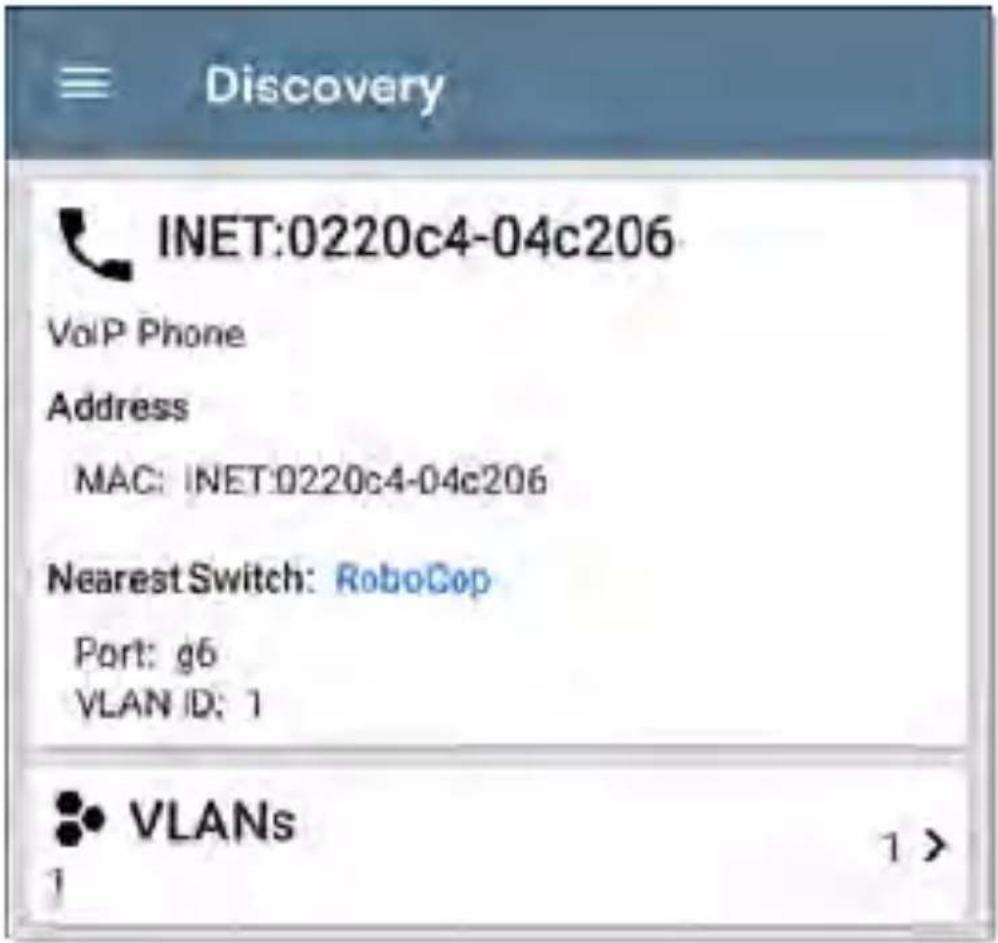
text_image
Discovery INET:0220c4-04c206 VoIP Phone Address MAC: INET:0220c4-04c206 Nearest Switch: RoboCop Port: g6 VLAN ID: 1 VLANs 1 >Printers
The LinkRunner identifies IP printers via the SNMP Printer MIB and IPX printers via diagnostic requests and queries.
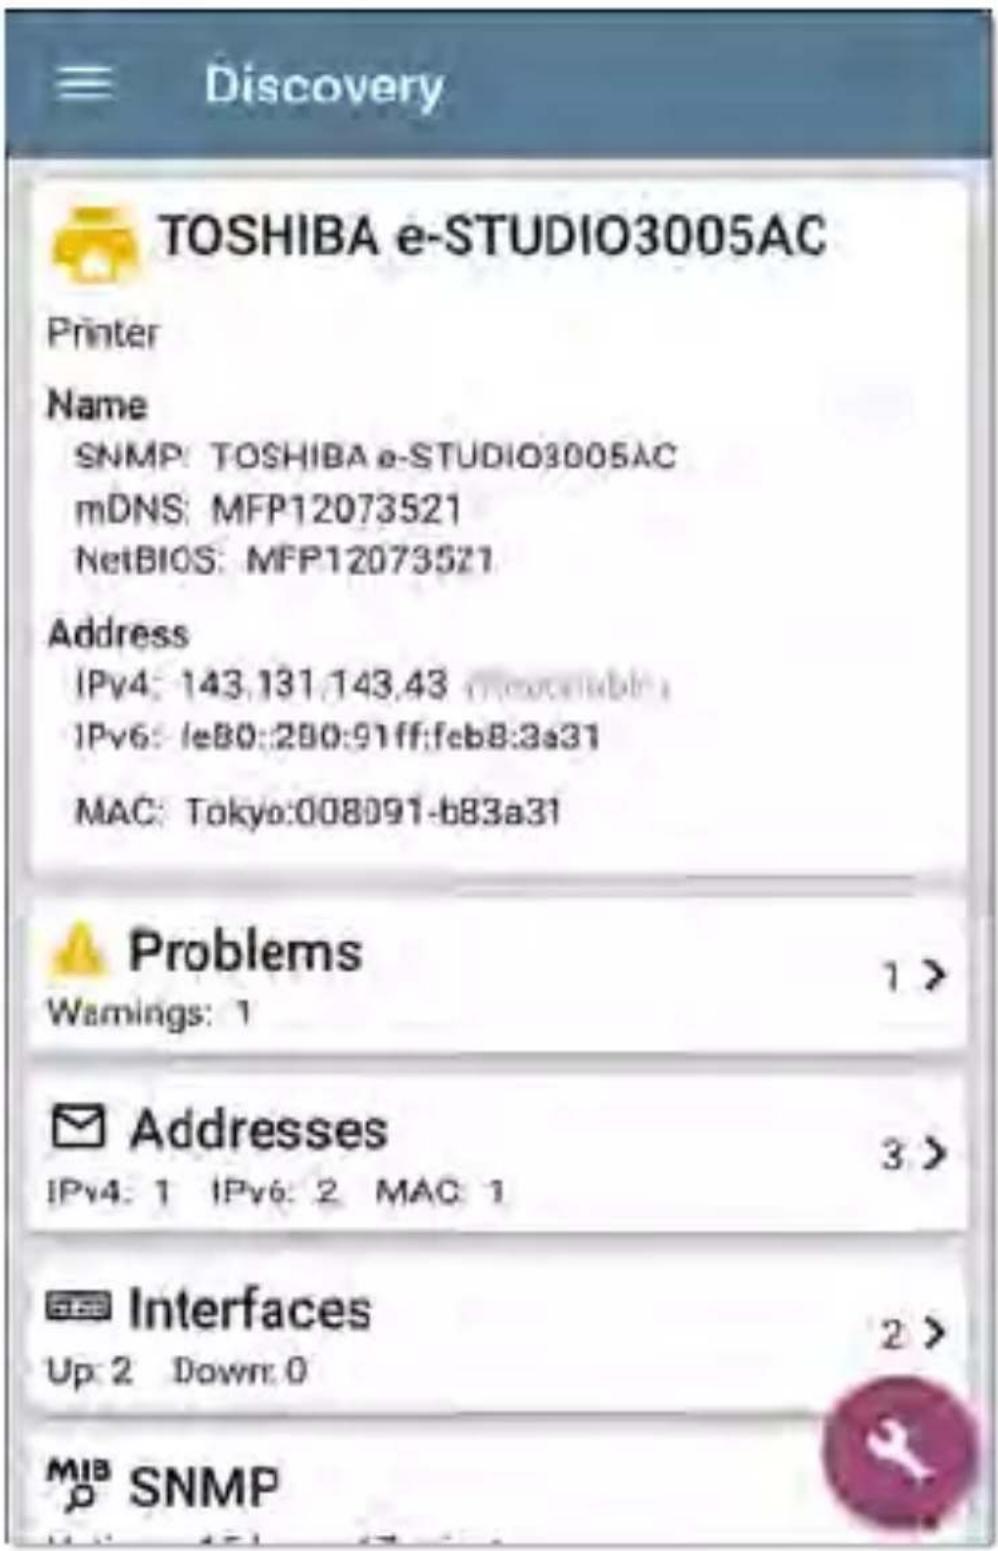
text_image
Discovery TOSHIBA e-STUDIO3005AC Printer Name SNMP: TOSHIBA e-STUDIO3005AC mDNS: MFP12073521 NetBIOS: MFP12073521 Address IPv4: 143.131.143.43 (optional) IPv6: le80:280:91ff;feb8:3a31 MAC: Tokyo:008091-b83a31 Problems Warnings: 1 > Addresses IPv4: 1 IPv6: 2 MAC: 1 > Interfaces Up: 2 Down: 0 MIB SNMPSNMP Agents
SNMP agents are discovered using SNMP queries. See SNMP Configuration.
NOTE: If LinkRunner cannot discover the SNMP agents on your devices, they may be connected to another subnet, like a management subnet. Solve this issue by adding the subnet to Extended Ranges.
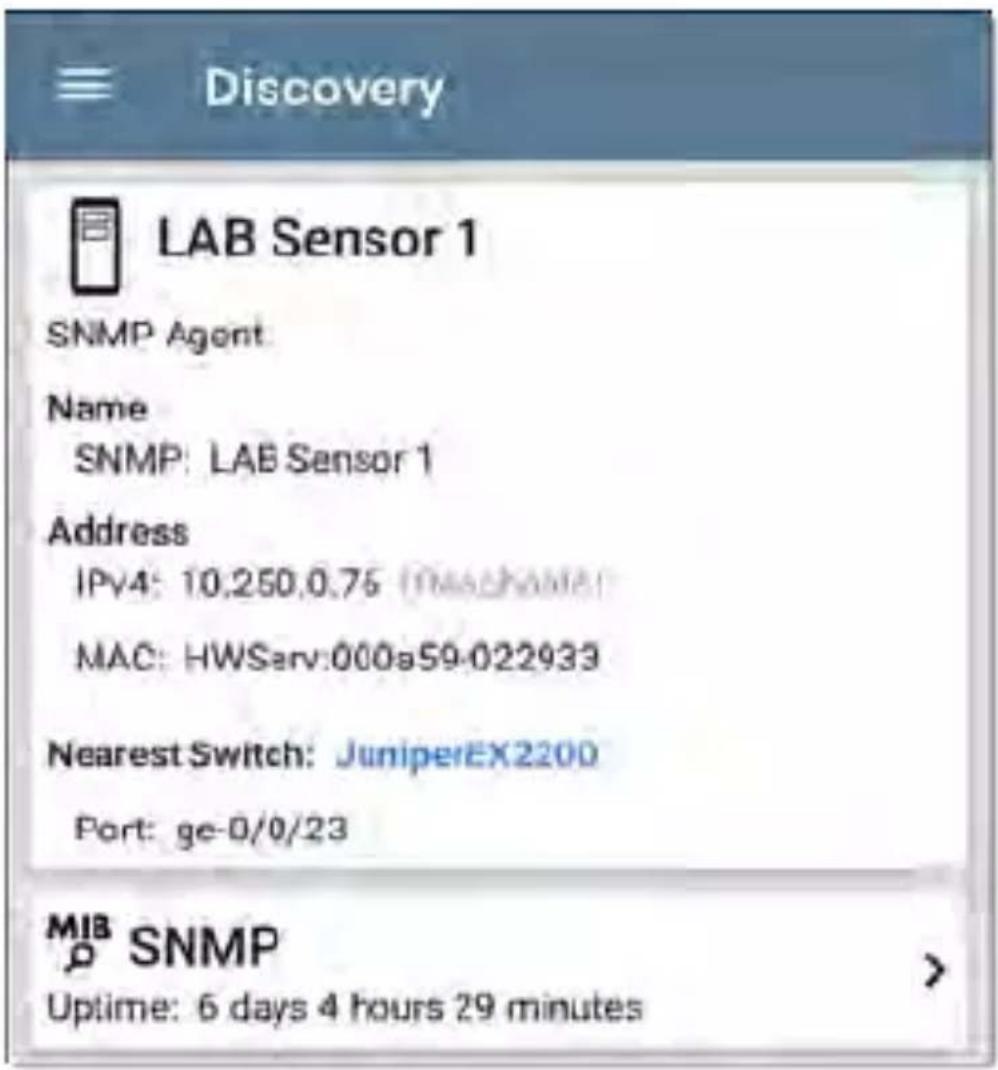
text_image
Discovery LAB Sensor 1 SNMP Agent Name SNMP: LAB Sensor 1 Address IPV4: 10,250,0.75 (Meachcraft) MAC: HWServ:000a59-022933 Nearest Switch: JuniperEX2200 Port: ge-0/0/23 MIB SNMP Uptime: 6 days 4 hours 29 minutesSee also SNMP Details.
NetAlly Tools
The LinkRunner can also identify other NetAlly network testers, including LinkRunners, AirCheck G2s, OneTouches, LinkRunners (AT and G2), and Test Accessories.
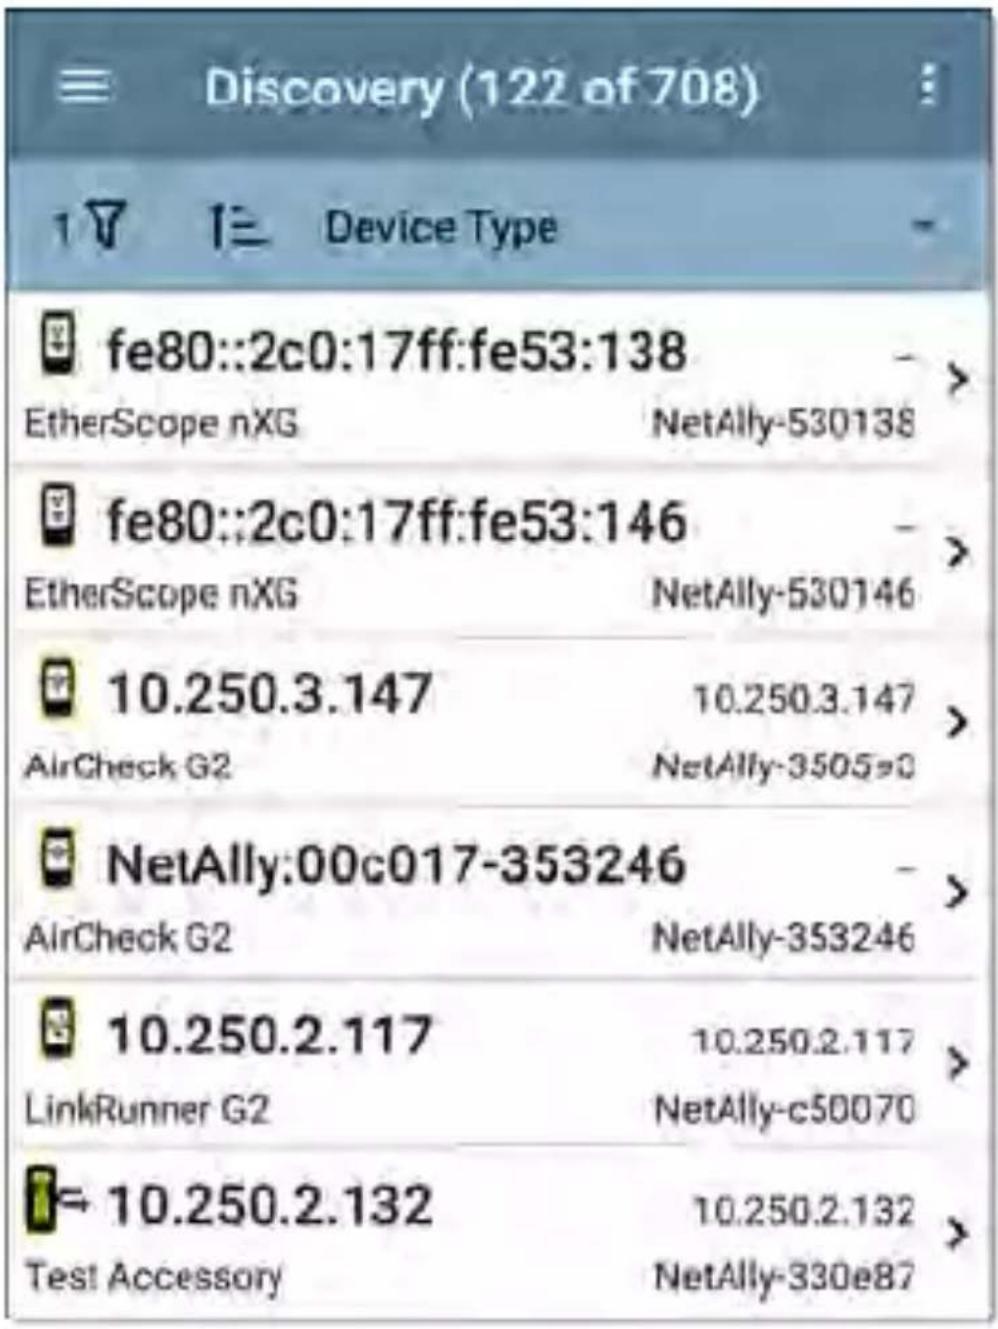
text_image
Discovery (122 of 708) 1 Device Type fe80::2c0:17ff:fe53:138 EtherScope nXG NetAlly-530138 fe80::2c0:17ff:fe53:146 EtherScope nXG NetAlly-530146 10.250.3.147 10.250.3.147 AirCheck G2 NetAlly-3505s0 NetAlly:00c017-353246 AirCheck G2 NetAlly-353246 10.250.2.117 10.250.2.117 LinkRunner G2 NetAlly-c50070 1= 10.250.2.132 10.250.2.132 Test! Accessory NetAlly-330e87The image above shows several NetAlly tools as they appear in the main Discovery list.
LinkRunner displays all the information it can gather about each tool on the Details screen.
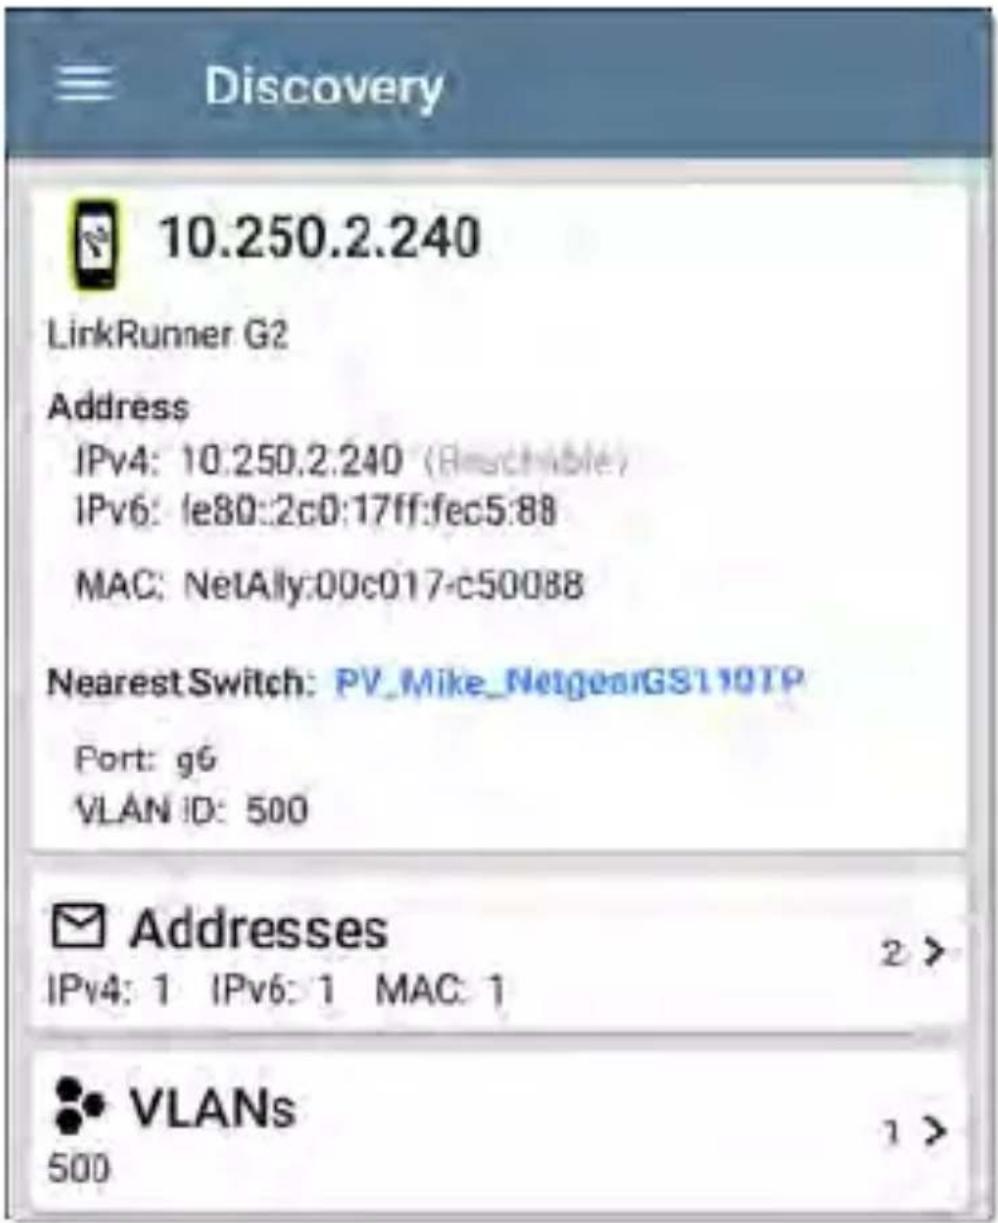
text_image
Discovery 10.250.2.240 LinkRunner G2 Address IPv4: 10.250.2.240 (Accessible) IPv6: le80::2c0:17ff:fec5:88 MAC: NetAlly:00c017-c50088 Nearest Switch: PV_Mike_NetgearGS110TP Port: g6 VLAN ID: 500 Addresses IPv4: 1 IPv6: 1 MAC: 1 VLANs 500Hosts/Clients
Other hosts and clients are discovered by traffi monitoring and querying. If a host cannot be identified as belonging to one of the other categories (Switch, Router, VoIP device, etc.) then it is categorized as Host/Client.
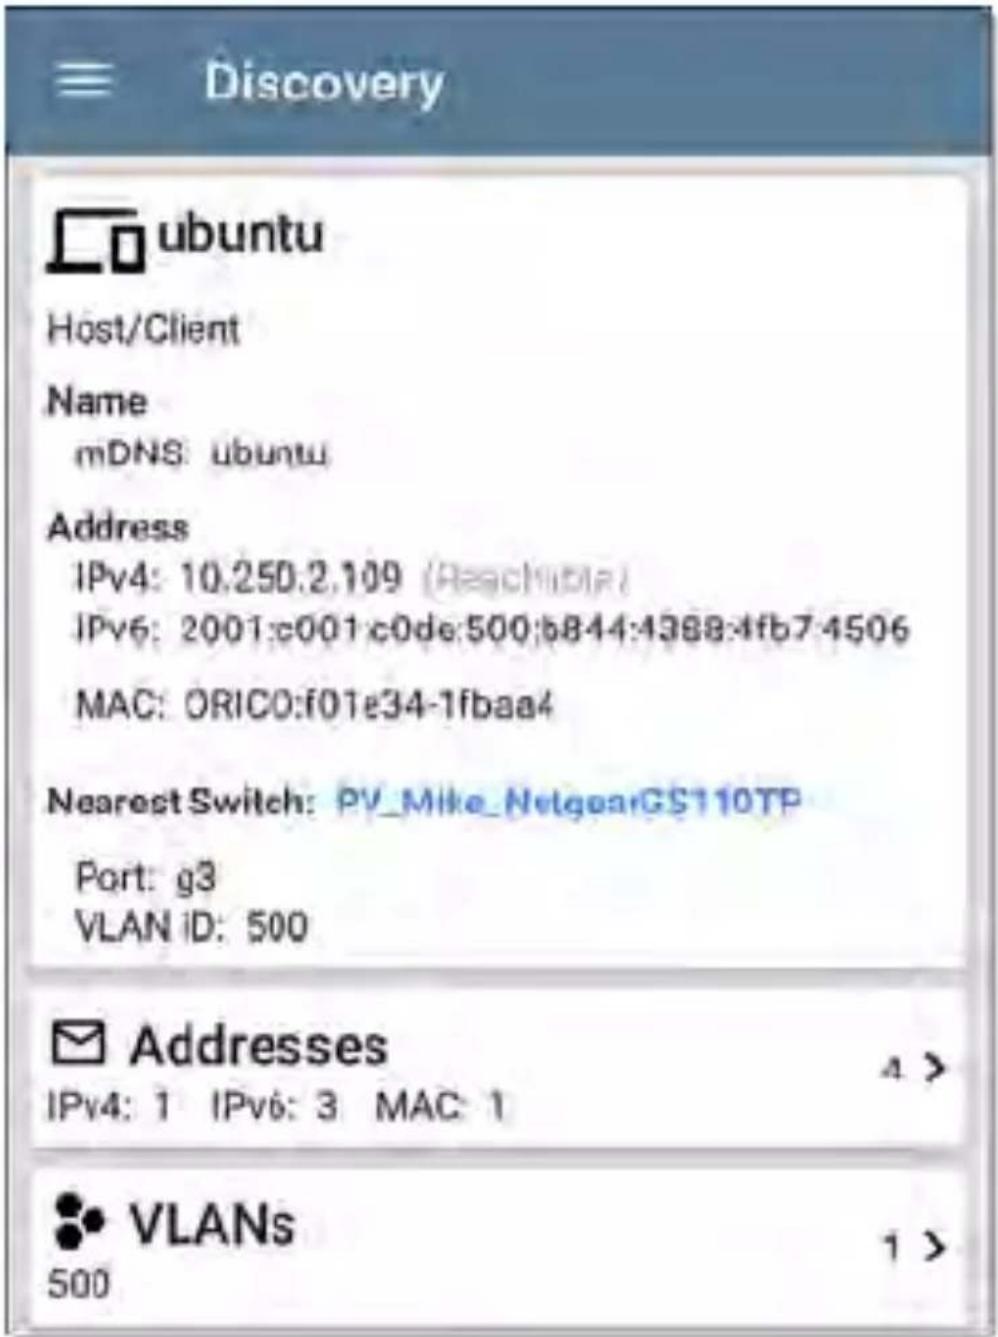
text_image
Discovery ubuntu Host/Client Name mDNS: ubuntu Address IPv4: 10.250.2.109 (Accessible) IPv6: 2001:c001:c0de:500:b844:4388:4fb7:4506 MAC: ORICO:f01e34-1fbaa4 Nearest Switch: PV_Mike_NetgearGS110TP Port: g3 VLAN ID: 500 Addresses IPv4: 1 IPv6: 3 MAC: 1 VLANs 500 1 >Discovery Settings
Discovery configurations include SNMP settings, Community Strings and the order in which they are used, Credential Sets, Ports, Extended Ranges, and process intervals.
Access the Discovery settings screen by sliding out the left-side navigation drawer or tapping the menu icon, and selecting Discovery Settings.
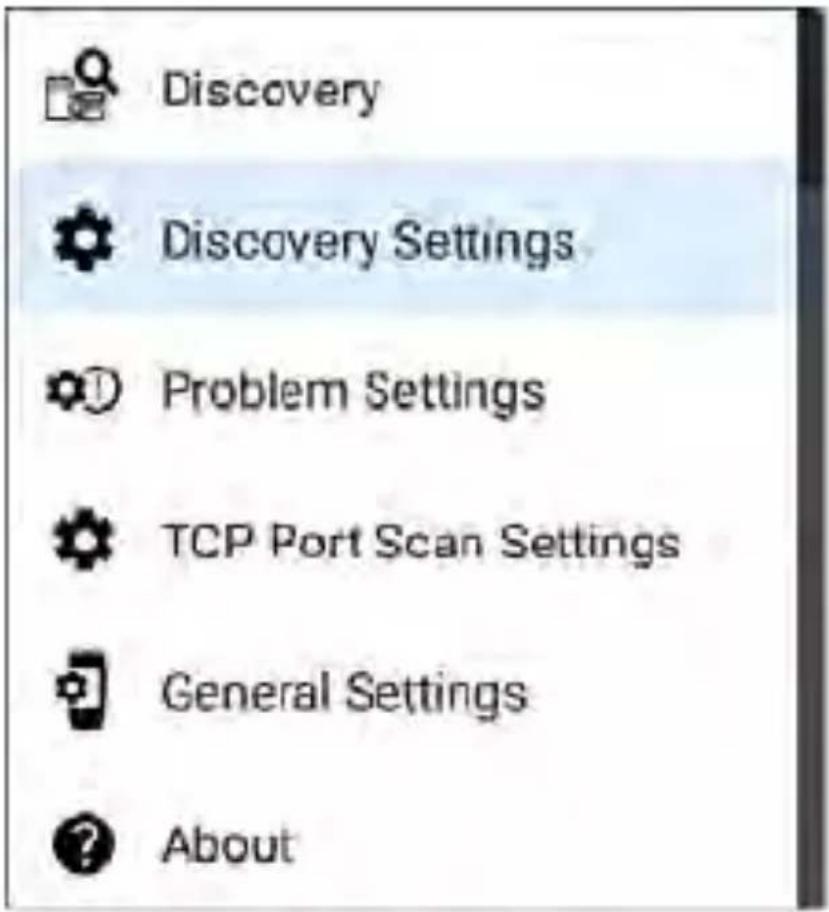
text_image
Discovery Discovery Settings Problem Settings TCP Port Scan Settings General Settings About(Touch here to skip to Problem Settings, TCP Port Scan, or back to General Settings.)
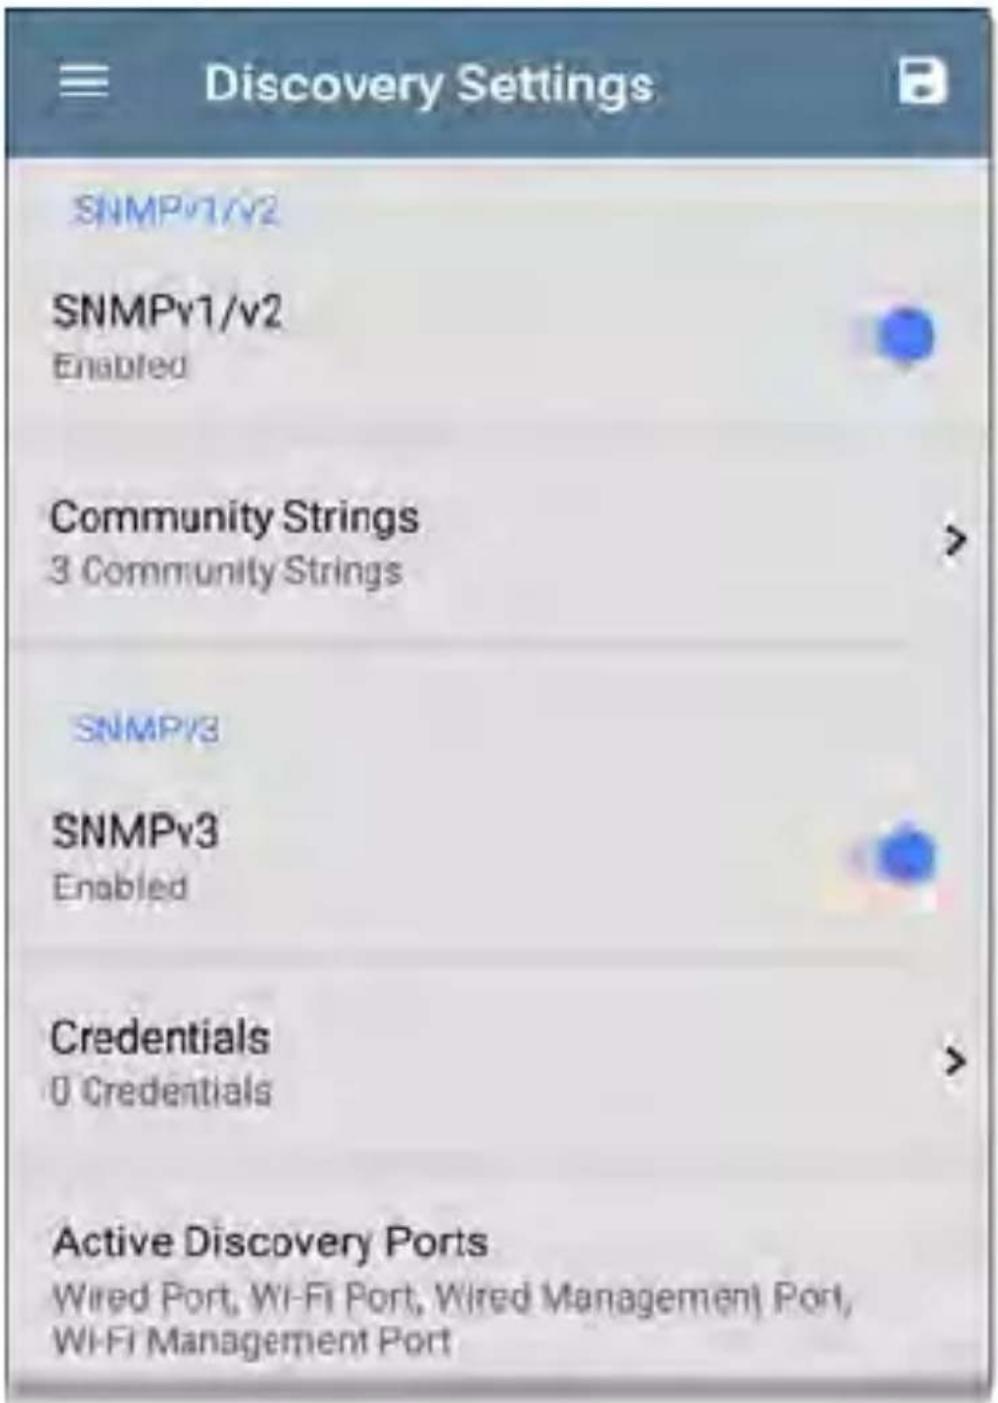
text_image
Discovery Settings SNMPv1/v2 SNMPv1/v2 Enabled Community Strings 3 Community Strings SNMPv3 SNMPv3 Enabled Credentials 0 Credentials Active Discovery Ports Wired Port, Wi-Fi Port, Wired Management Port, Wi-Fi Management PortTo adjust Discovery Settings:
-
On the Discovery Settings screen, touch each field described in this topic, as needed, to select or enter your required configuration elements.
-
When you finish configuring, tap the back button to return to the main Discovery List screen.
- Then, Refresh Discovery from the action overflow menu to apply the new configuration.
You can load, save, import, and export configured Discovery settings by touching the save button on this screen.
- Load opens a previously saved Discovery configuration.
- Save As saves the current configuration with an existing name or a new custom name.
- Import: Import a previously exported settings file.
- Export: Create an export file of the current settings, and save it to internal or connected external storage.
See Managing Testing App Settings for more instructions.
After you have saved a configuration, the custom name you entered appears in the title of the Discovery Settings screen. In the image below, a user has saved a custom configuration named "South Campus," which replaces the "Discovery Settings" screen title.
text_image
South Campus SNMPv1/v2 SNMPv1/v2 Enabled Community Strings 2 Community StringsSNMP Configuration
The MIB (Management Information Base) of SNMP managed devices contains information such as device configuration, interface configuration and statistics, SNMP tables (like host resource and route tables) and VLAN details. Through the Discovery process, the LinkRunner interrogates MIBs to determine the device type, ports, connected subnets, and other data.
SNMP credentials are required to communicate with the SNMP agents on your interconnect devices, such as switches and routers. The Discovery Settings allow you to enter the SNMP community strings and credential sets the LinkRunner uses to communicate with those devices.
SNMPv1/v2
Touch the toggle button to enable or disable SNMPv1 and v2 queries. This setting is enabled by default and uses the Community Strings configured in the next setting.
Community Strings
Touch this field to open the Community Strings list screen and add, edit, or remove community strings.
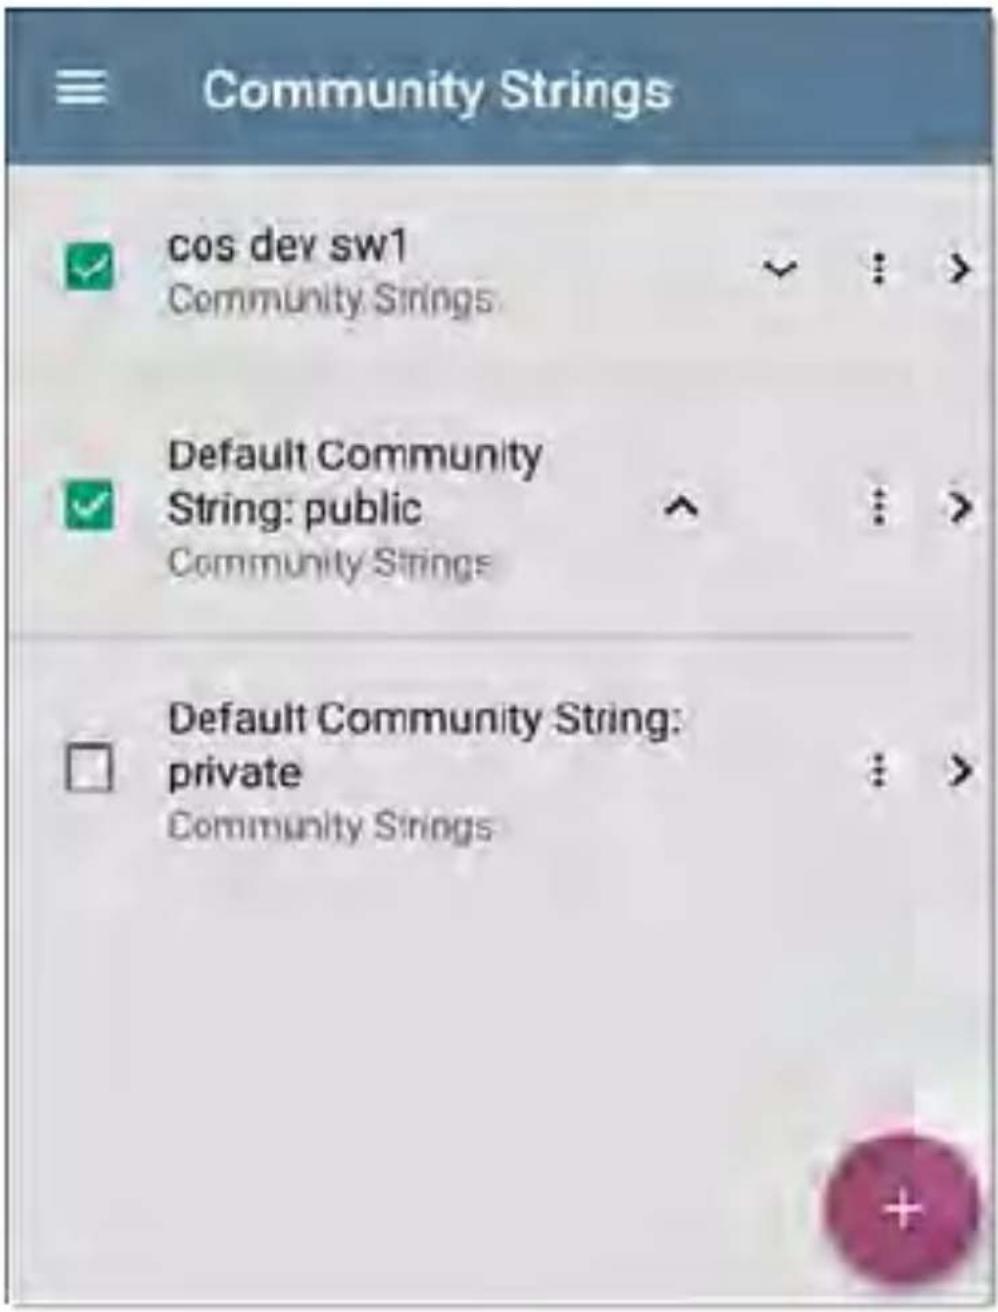
text_image
Community Strings cos dev sw1 Community Strings Default Community String: public Community Strings Default Community String: private Community StringsThe LinkRunner uses the checked strings in the order shown on this screen. If it does not receive a response from the queried device using one string, it sends the next string.
NOTE: This screen and others in the Discovery settings operate much like the AutoTest Profile Group screen.
On the Community Strings screen, you can perform these actions:
- Check or uncheck the boxes to include or exclude a string from use in the current Discovery configuration.
- Tap the up and down arrows to change the order in which the LinkRunner uses the strings to query a device.
- Touch the action overflow icon to Duplicate or Delete a Community String. CAUTION: When you delete a string, you delete it from all saved Discovery configurations. To remove a string from those used by the current Discovery configuration, simply uncheck it.
- Touch the FAB to add new Community Strings.
- Touch any Community String's row to edit the string and its description.
TIP: To minimize discovery time, uncheck or delete all unused community strings, as every failed query extends the discovery
time. You can also arrange the community strings in the order they are used most.
SNMPv3
Touch the toggle button to enable or disable SNMPv3 queries. This setting is enabled by default and uses the Credentials configured in the next setting.
NOTE: If this setting is enabled, but no SNMPv3 credentials are configured, the LinkRunner will discover the engine IDs of all SNMPv3 agents. This is a good way to discover if a device support SNMPv3.
Credentials
Touch this field to open the Credentials list screen.
text_image
Credentials Default Name Credentials COS DEV Credentials N Guest Network CredentialsThis screen interface works like the Community Strings screen above. LinkRunner uses the Credentials in the order shown.
- Check or uncheck the boxes to include or exclude a set of Credentials from use in the current Discovery configuration.
- Touch a row to edit its credentials.
- Touch the FAB to add new credentials.
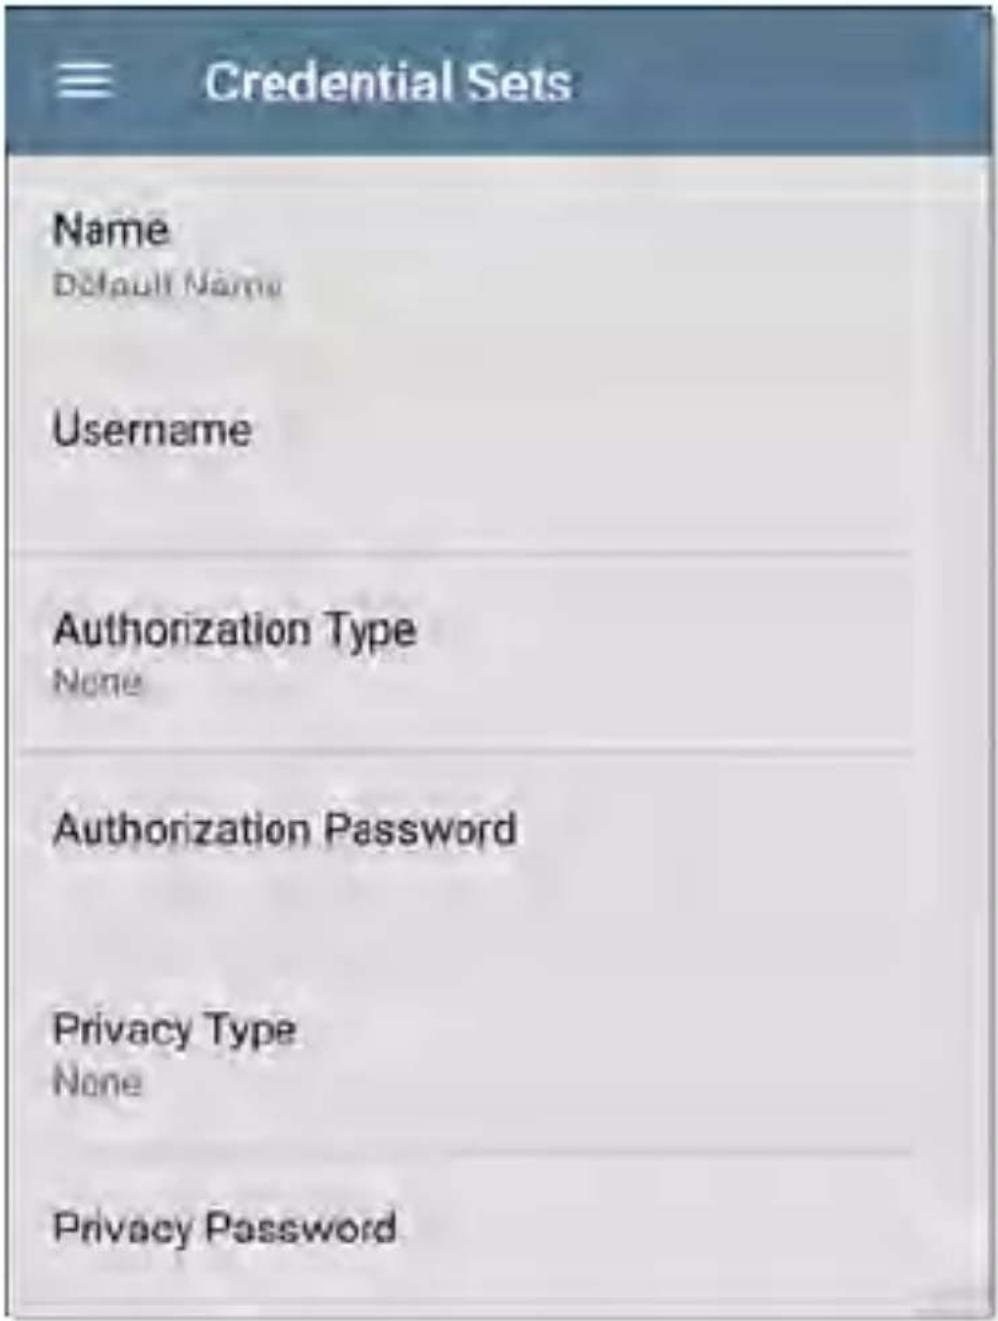
text_image
Credential Sets Name Default Name Username Authorization Type None Authorization Password Privacy Type None Privacy PasswordOn the Credentials Sets screen, tap each field to select or enter the credentials required.
Name
Touch the Name field to enter a custom name for the Credential Set.
Username
Touch to enter the SNMPv3 username.
Authorization Type and Password
LinkRunner Discovery supports two SNMPv3 Authorization types: HMAC-SHA and HMAC-MD5. If Authorization is required, enter the appropriate password.
Privacy Type and Password
LinkRunner Discovery supports four Privacy Types: CBC-DES, AES-128, AES-192, AND AES-256. If needed, enter the appropriate Privacy Password.
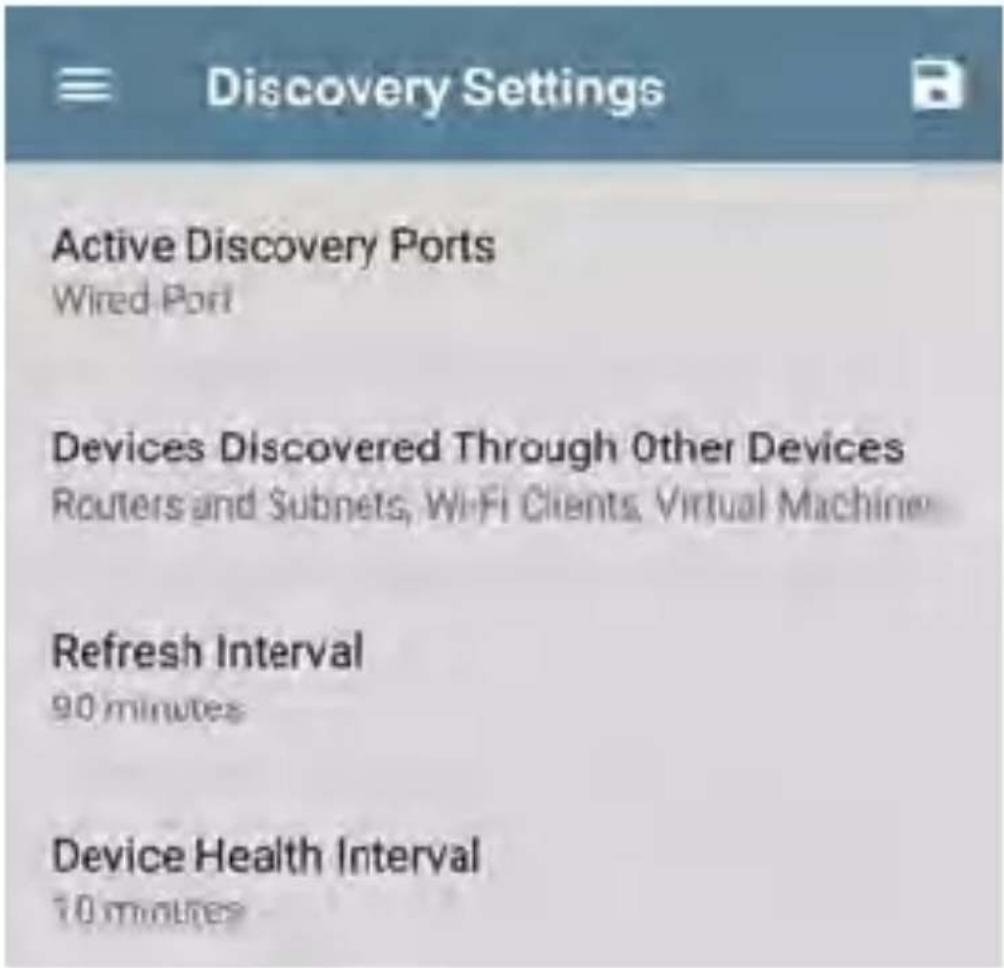
text_image
Discovery Settings Active Discovery Ports Wired Port Devices Discovered Through Other Devices Routers and Subnets, Wi-Fi Clients, Virtual Machine Refresh Interval 90 minutes Device Health Interval 10 minutesActive Discovery Ports
Touch Active Discovery Ports to select the port Discovery uses to gather data. Discovery only runs through the enabled ports if an active network link is available.
Active Discovery Ports

Wired Port

Wired Management Port
CANCEL
OK
Discovery uses all of the ports by default. Uncheck them to limit which ports are used. NOTE: The top Wired Port refers to the Test port. An AutoTest Wired Profile must run to establish test port links. The last listed Wired Profile runs automatically when you start up the LinkRunner if a connection is available.
See also Test and Management Ports.
Extended Ranges
The Extended Ranges screen allows you to enter addresses of non-local subnets on which you want the Discovery process to run.
Discovery sweeps all of the enabled Extended Ranges for devices, whether directly connected or off-net. The LinkRunner performs Ping
sweeps on subnets that are not directly connected and ARP sweeps on connected subnets.
When the SNMP agents are on a subnet that is separate from the hosts (PC's and servers) subnet, additional networks must be configured for discovery:
- The network address of the remote subnet you want to discover, meaning the host (PC and server) network.
- The network address of the switch and router SNMP agents in the remote subnet, e.g. a management subnet.
Configure both SNMP Credential Sets and Extended Ranges to ensure that the LinkRunner always discovers management subnets, regardless of your network port connections.
Touch the field to open the Extended Ranges list screen.
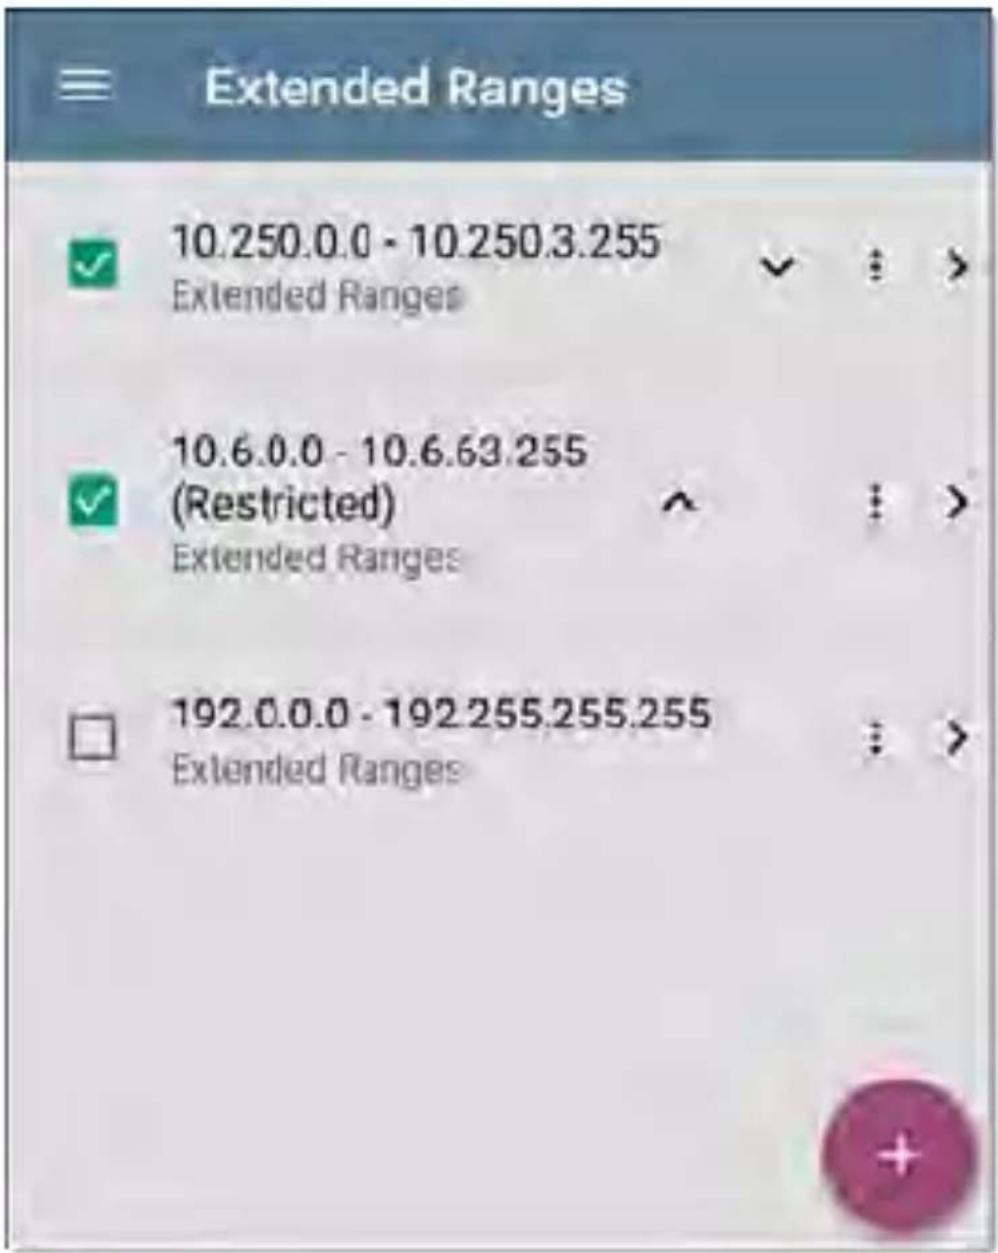
bar
| Range | Value | | :--- | :--- | | 10.250.0.0 - 10.250.3.255 Extended Ranges | ✓ | | 10.6.0.0 - 10.6.63.255 (Restricted) Extended Ranges | ^ | | 192.0.0.0 - 192.255.255.255 Extended Ranges | : |- Check or uncheck the boxes to include or exclude an extended range from the current Discovery configuration. Unchecked Extended Ranges do not affect the default Discovery behavior in the current configuration, but they may be used in other Discovery configurations (like Community Strings and Credentials).
- Touch any Extended Range's row to edit its address and subnet.
- Touch the FAB to add new extended ranges.
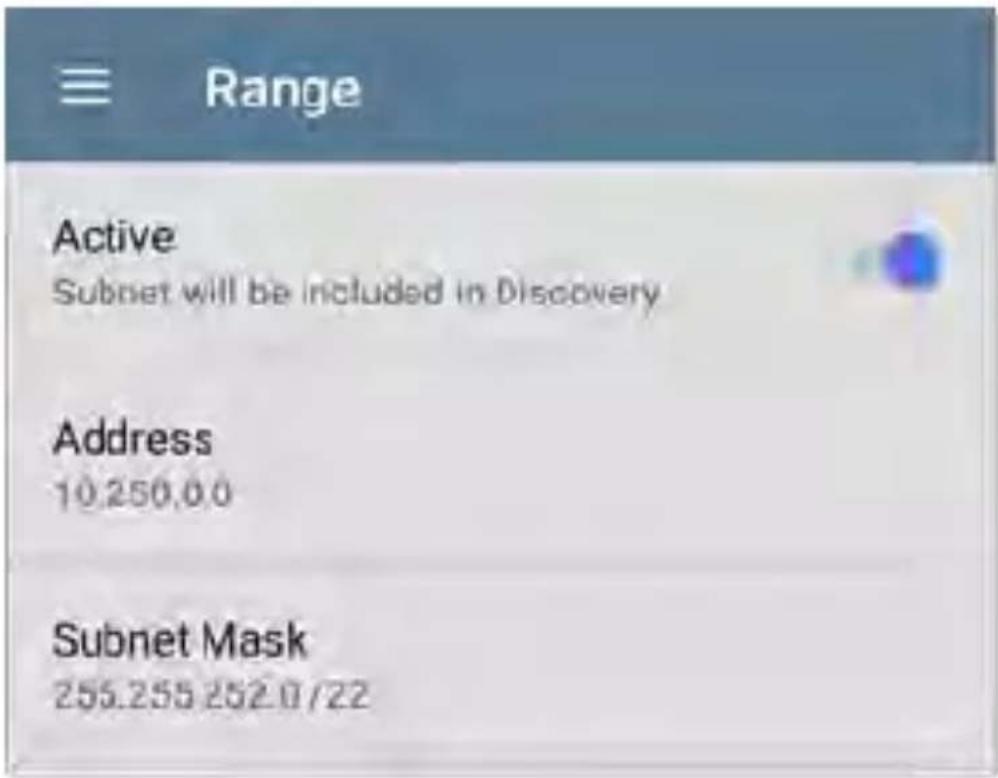
text_image
Range Active Subnet will be included in Discovery Address 10.250.0.0 Subnet Mask 255.255 252.0/22Active vs. Restricted Subnets
For each configured Extended Range, you can tap the toggle button to switch from Active to Restricted. Discovery is performed on Active Ranges. Setting a Range to Restricted disables the discovery process on that network or subnet, meaning the LinkRunner will not communicate with devices within the restricted range.
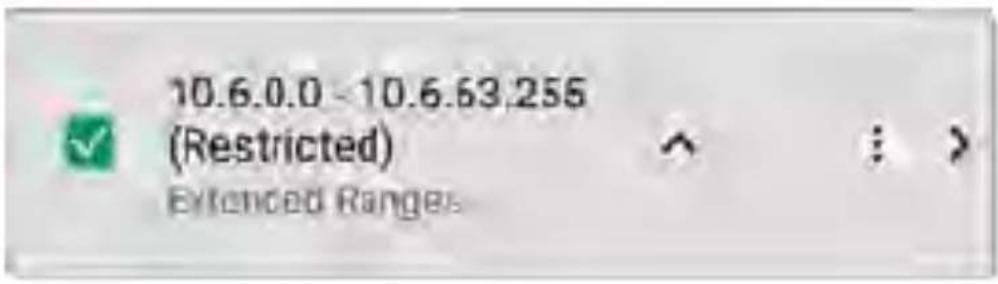
text_image
10.6.0.0 - 10.6.63.255 (Restricted) Extended Ranges- Restricted Ranges take precedence regardless of the order in which they are listed on the Extended Ranges screen.
- You can Restrict a part of a configured Active Extended Range.
- You can also restrict a single device, whether it is part of an Active Range or no To enter a single device that you do not want discovered, enter its IP address in the Address field, and set the Subnet Mask field to 255.255.255.255.
Address
Tap the Address field to enter or select an IP address range.
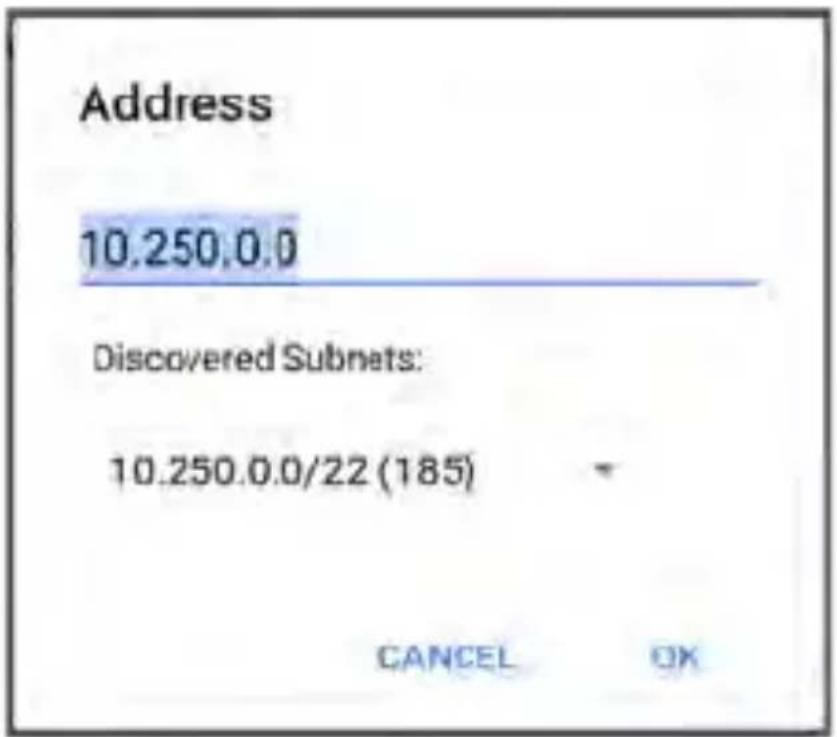
text_image
Address 10.250.0.0 Discovered Subnets: 10.250.0.0/22 (185) CANCEL OKTap the drop-down menu to select a previously Discovered Subnet. The Address field will be automatically populated with your selection.
Subnet Mask
Touch this field to select a subnet mask. If you select an already Discovered Subnet, the Subnet Mask is also pre-populated.
Devices Discovered Through Other Devices
By default, LinkRunner discovers devices from SNMP tables of other devices. If you do not want Discovery to automatically find devices
from SNMP tables of the device types listed here, you can uncheck their boxes.
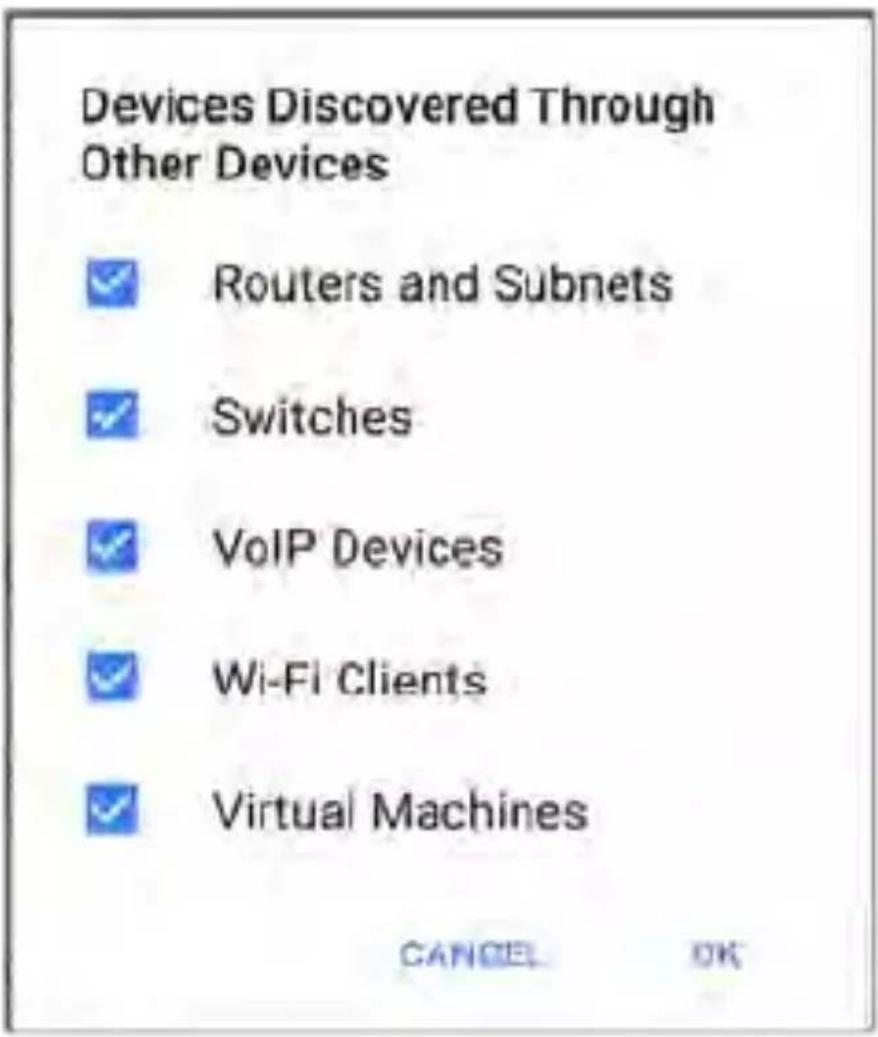
text_image
Devices Discovered Through Other Devices ✓ Routers and Subnets ✓ Switches ✓ VoIP Devices ✓ Wi-Fi Clients ✓ Virtual Machines CANCEL OKRouters and Subnets
When the Routers and Subnets checkbox is enabled, any discovered routers are included in discovery results. In addition, if Discovery has SNMP access to a discovered router, its routing tables are read, and the next hop routers are added to the Discovery list. If any local subnet are available in the routing tables, these are
also added to the Subnets list. This process continues until all the available SNMP credentials are tried for the added routers.
NOTES: Discovery does not sweep every discovered subnet; discovered subnets are only added to the subnets list. To perform discovery in a specific subnet, see Extended Ranges above.
If another site has routers you want to discover using this process, but there isn't a local next hop link from this site, you can add one of the routers of that site to discovery, and the process will run from that router and find the routers on that site as well. Add the subnet of the router or just the router's IP address with a mask of /32 Extended Ranges.
Switches
When the Switches checkbox is enabled, discovery adds any switches that it finds in SNMP neighbor tables of other devices to the Discovery list.
For example, when LinkRunner is reading the CDP and LLDP caches of one switch, it will contain other switches. If this option is enabled, the LinkRunner adds those other switches, even if they are not in discovery ranges.
NOTE: To Discover switches at another site, add one of the switches of that site to Discovery Extended Ranges.
VoIP Devices
When the VoIP Devices checkbox is enabled, discovery will add any VoIP devices that it find in SNMP tables of other devices regardless of the subnet. These are usually found in the LLDP-MED tables of the switches. Enabling the Switches option provides the best chance of finding all your VoIP devices.
Wi-Fi Clients
When the Wi-Fi Clients checkbox is enabled, discovery will add any wireless clients it finds in SNMP tables of APs and Wireless LAN Controllers. Enabling this option along with
Switches provides best chance of finding all Wi Fi clients.
Virtual Machines
When the Virtual Machines checkbox is enabled discovery adds any virtual machines that it finds in SNMP tables of other devices. These are usually found in the ESX host > SNMP tables. Adding the subnets of your ESX hosts to Extended Ranges helps with finding your virtual machines.
| Refresh Interval90 minutes |
| Device Health Interval10 minutes |
| ARP Sweep Rate100/second |
| SNMP Query DelayNo delay |
Refresh Interval
This setting controls the time between runs of the Discovery process. By default, Discovery runs every 90 minutes. Touch the Refresh Interval field to select a different interval, up to 8 hours.
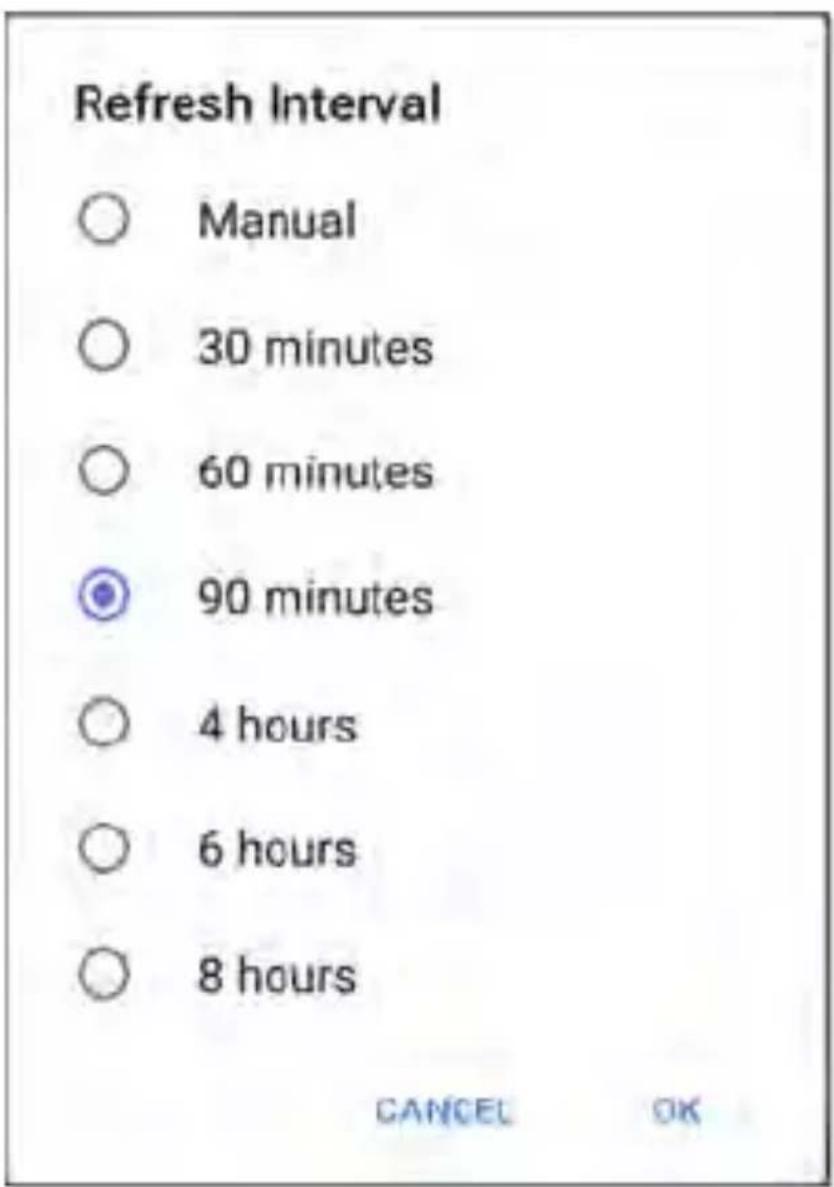
text_image
Refresh Interval ○ Manual ○ 30 minutes ○ 60 minutes ◎ 90 minutes ○ 4 hours ○ 6 hours ○ 8 hours CANCEL OKThe Manual option turns off regular automatic Discovery, and the process will only refresh if
you select Refresh Discovery from the main Discovery list screen.
Device Health Interval
Discovery automatically runs a set of network health tests to search for network Problems, such as high utilization, discards, or errors on all discovered interfaces and device resources.
The selected time Refresh Interval is the minimum time between each run of the Device Health tests. Touch the field to disable Device Health testing or to change the interval from the default of 10 minutes to 30 or 60 minutes.
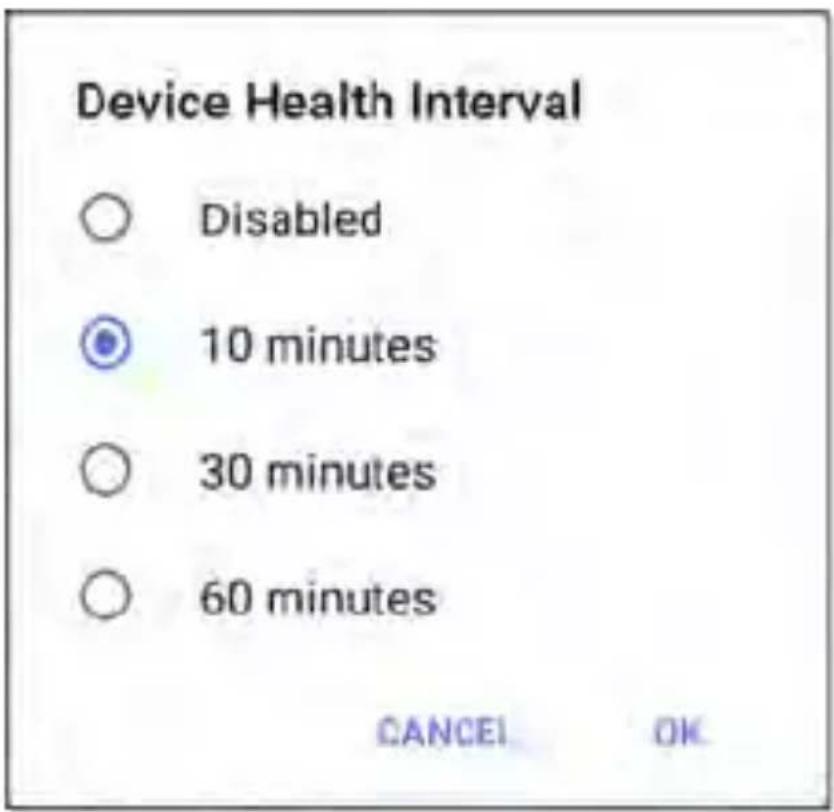
text_image
Device Health Interval ○ Disabled ● 10 minutes ○ 30 minutes ○ 60 minutes CANCEL OKDisabling the Device Health testing affects the types of Problems that Discovery can detect.
See also Problem Settings.
ARP Sweep Rate
Touch the ARP Sweep Rate field to select a ra between 5 and 100 ARP requests per second.
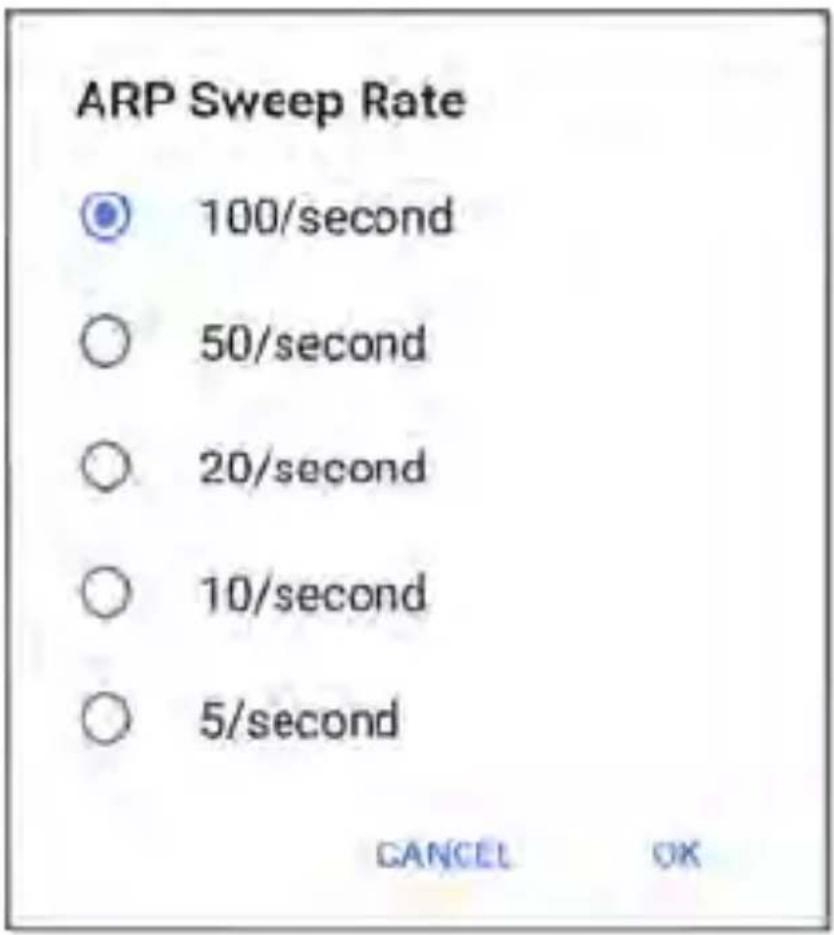
pie
ARP Sweep Rate | Time Interval | Value | | :--- | :--- | | 100/second | ● | | 50/second | ○ | | 20/second | ○ | | 10/second | ○ | | 5/second | ○ | CANCEL OKThis setting can prevent the LinkRunner from shutting down ports that sense too many ARPs are being sent.
SNMP Query Delay
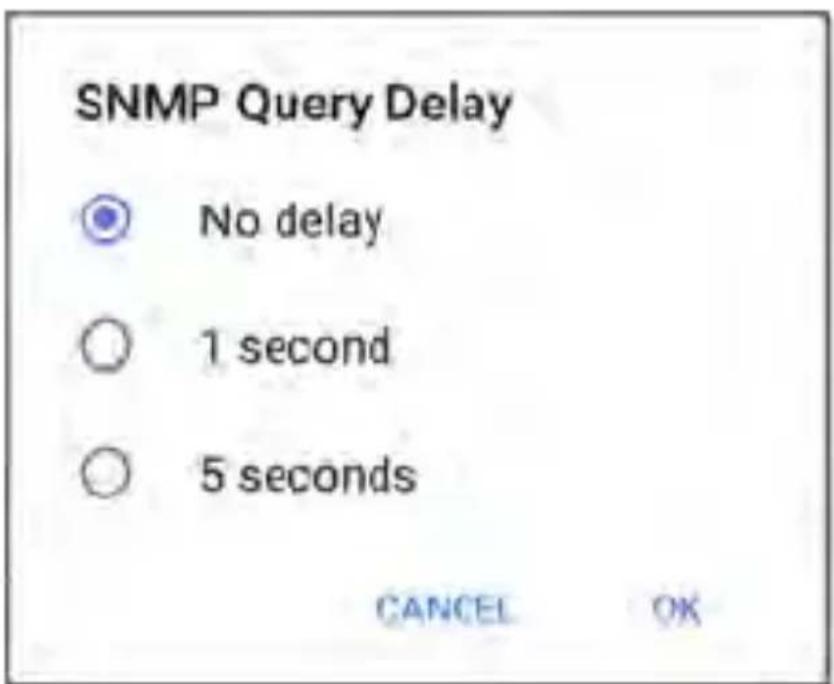
text_image
SNMP Query Delay No delay 1 second 5 seconds CANCEL OKThis function controls how long your LinkRunner waits between SNMP queries to key tables that can cause CPU spikes in the SNMP agents, including the ARP cache, IP address table, routing tables, and FDB tables.
The default SNMP Query delay is No Delay. When querying the key large tables, the LinkRunner asks for more data as soon as a response has been received. You can select a 1 or 5 second delay if needed.
Problem Settings
The Problem settings determine which issues are detected and displayed by the Discovery app as well as the thresholds for enabled problems, such as Packet Discards and Utilization.
Access the Problem Settings screen by sliding out the left-side navigation drawer or tapping the menu icon in the Discovery app, and selecting Problem Settings.
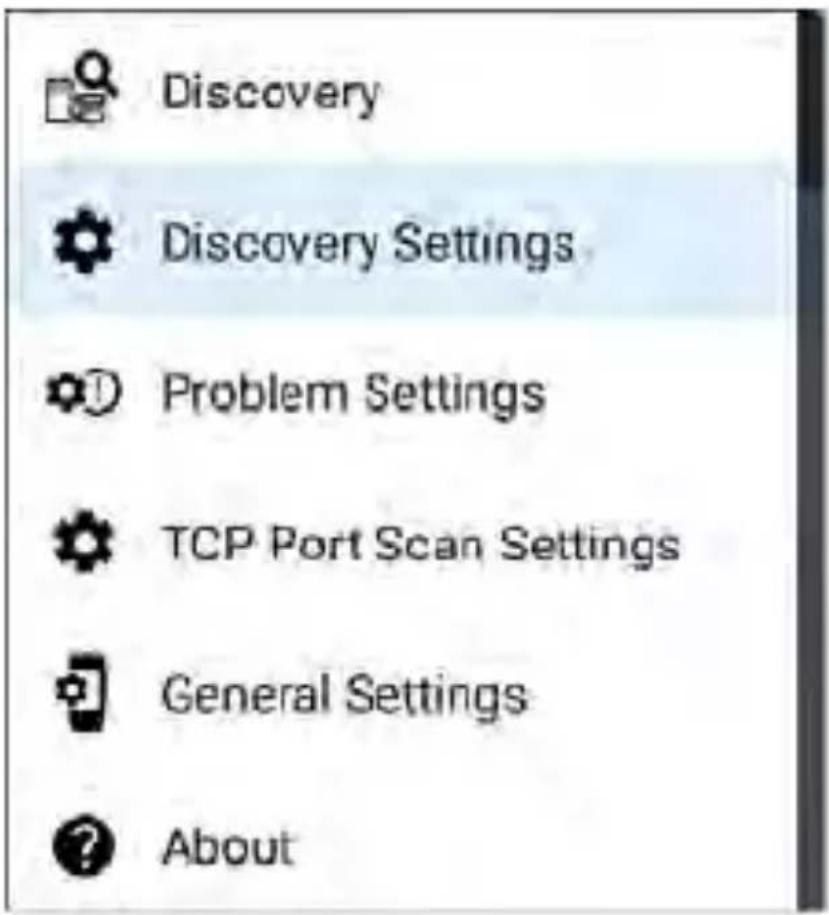
text_image
Discovery Discovery Settings Problem Settings TCP Port Scan Settings General Settings About(Touch here to go to Discovery Settings or bac to General Settings.)
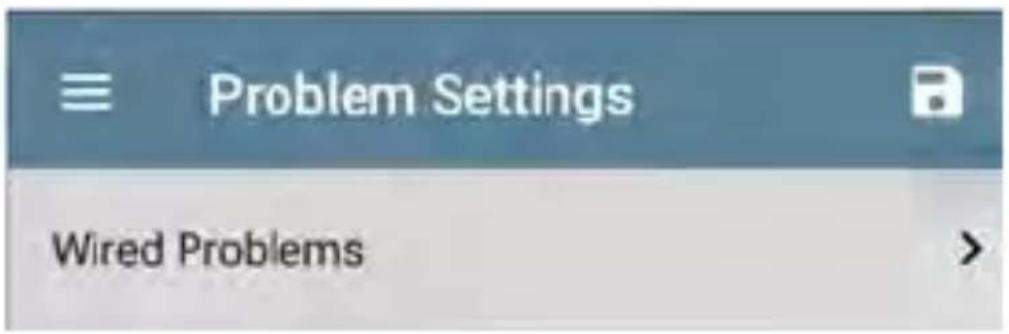
text_image
Problem Settings Wired Problems >As with Discovery Settings, you can save, load, import, and export configured Problem Settings by touching the save button on this screen. See Managing Testing App Settings for more instructions.
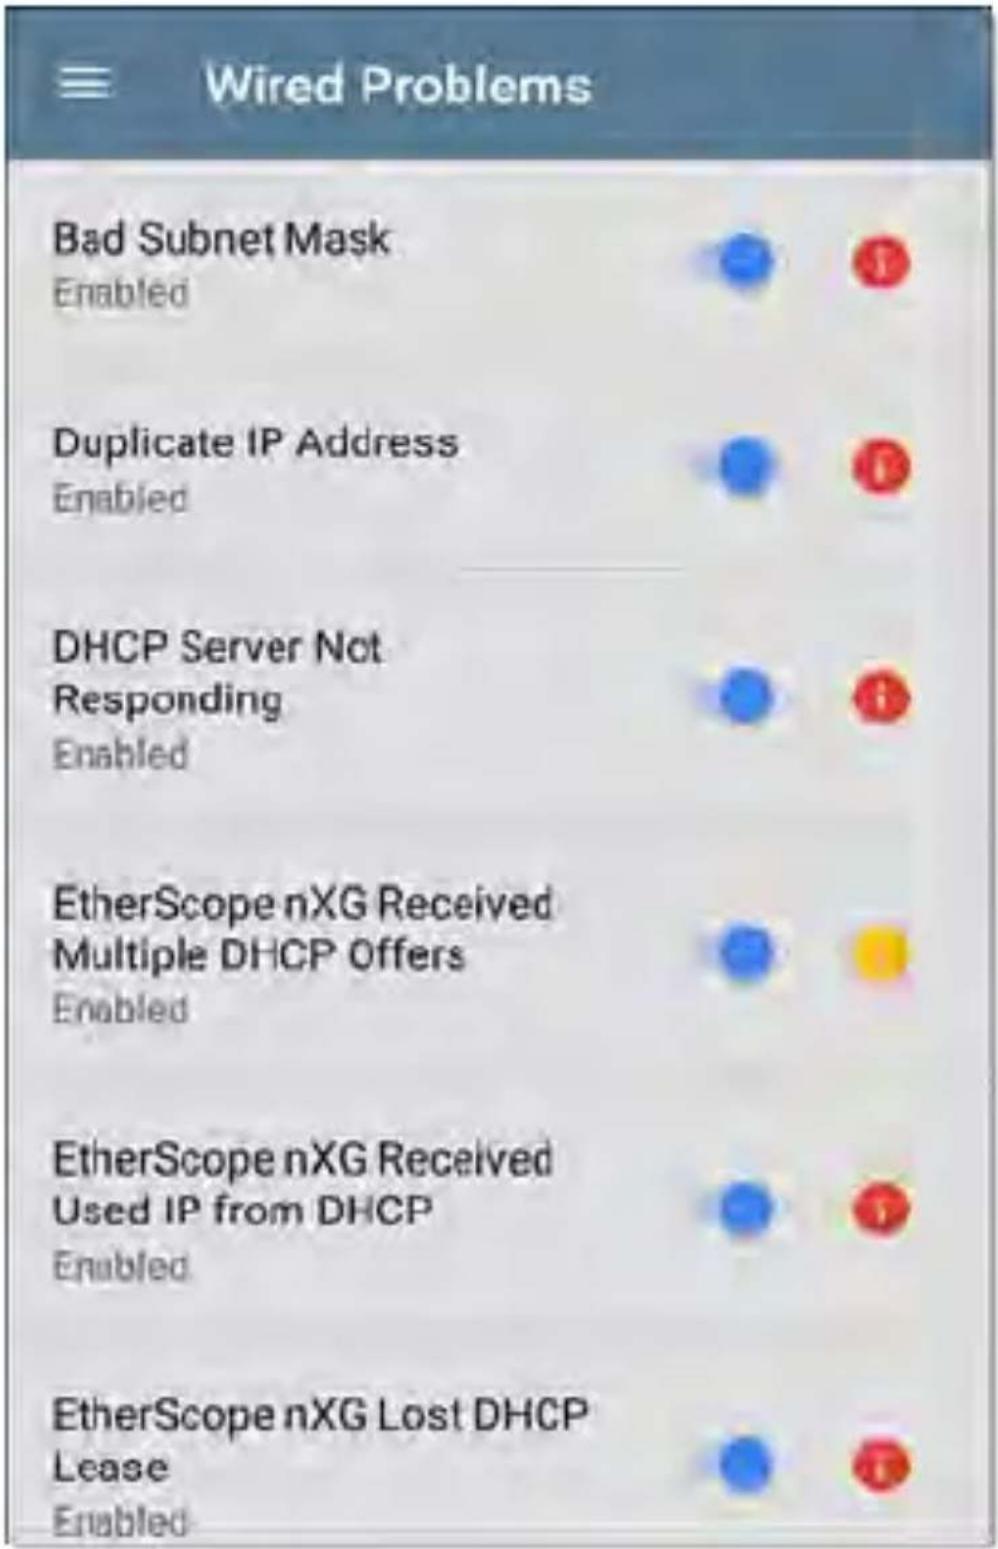
bar
Wired Problems | Status | Value | |---|---| | Bad Subnet Mask Enabled | 1 | | Duplicate IP Address Enabled | 1 | | DHCP Server Not Responding Enabled | 1 | | EtherScope nXG Received Multiple DHCP Offers Enabled | 1 | | EtherScope nXG Received Used IP from DHCP Enabled | 1 | | EtherScope nXG Lost DHCP Lease Enabled | 1 |All Problem types are enabled by default. Tap the toggle button to the right to disable each one.
Touch the red, yellow, or blue information icons to the right of each Problem to read a detailed description and recommended actions. Red icons indicate Failure conditions and yellow indicate Warning conditions. Blue icons are simply informational.
When you finish configuring, tap the back button 📋 return to the main Discovery screen.
TCP Port Scan Settings
The TCP Port Scan feature checks for open ports on the current device from the Discovery Details screen's FAB. The LinkRunner scans many ports simultaneously and reports the open port's numbers.
Access the TCP Port Scan Settings by sliding out the left-side navigation drawer or tapping the menu icon in the Discovery app.
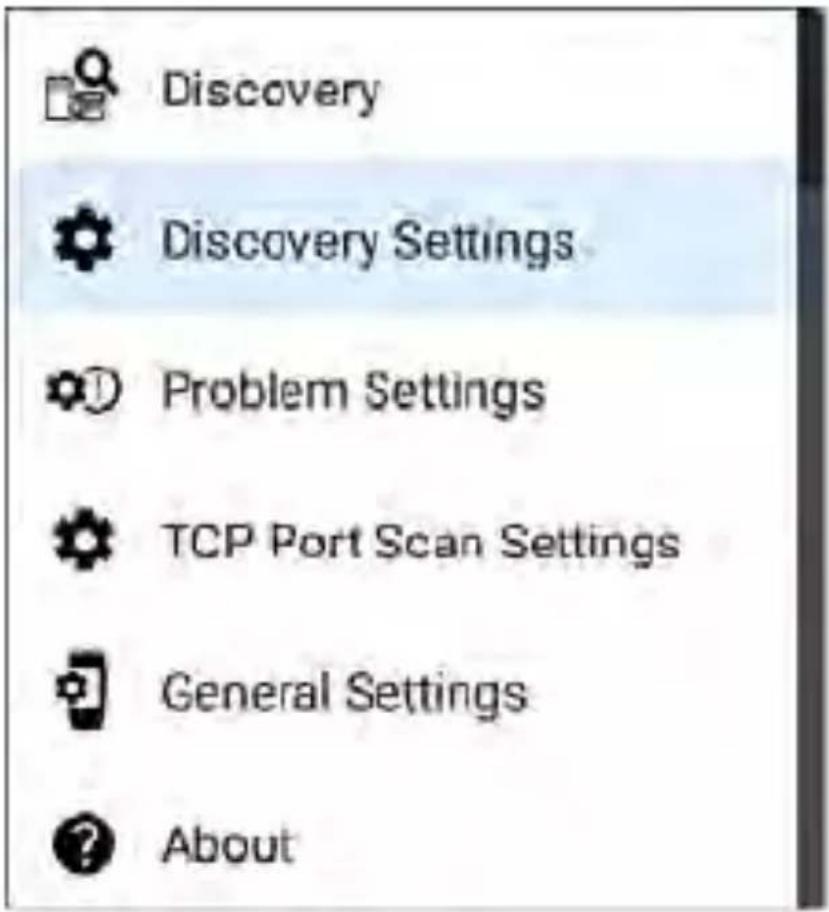
text_image
Discovery Discovery Settings Problem Settings TCP Port Scan Settings General Settings AboutSelect TCP Port Scan Settings.
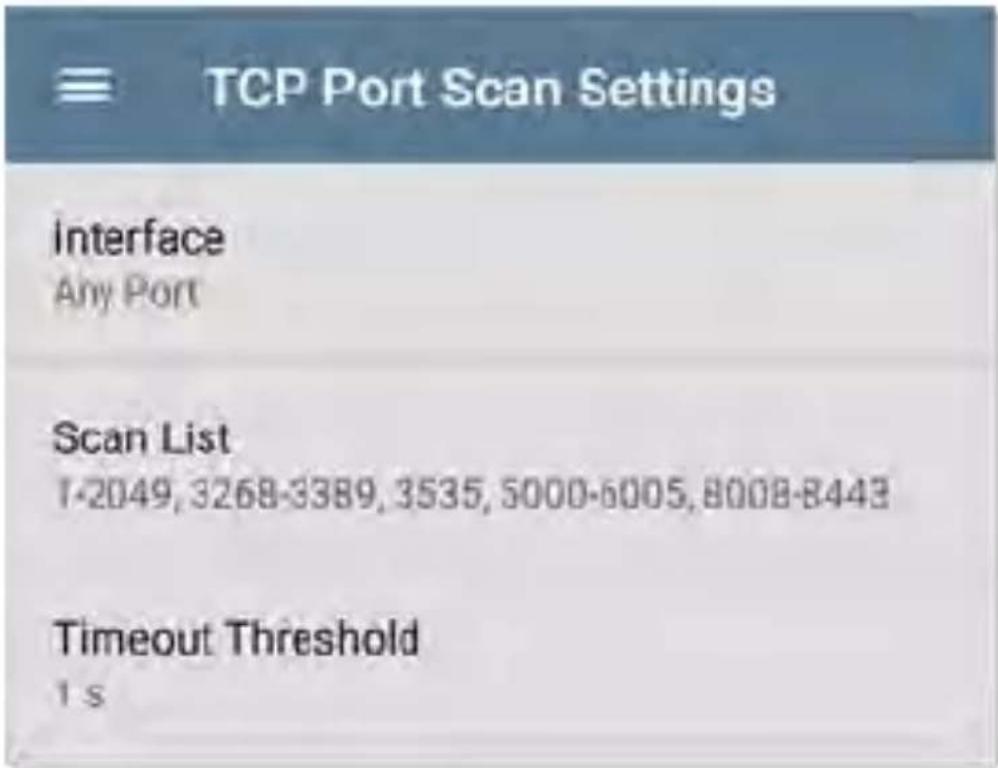
text_image
TCP Port Scan Settings interface Any Port Scan List 1-2049,3268-3389,3535,5000-6005,8008-8443 Timeout Threshold 1 sInterface
This setting determines the LinkRunner port from which the port scan runs. Touch the field to select Any Port, Wired Test Port, or Wired Management Port. See Test and Management Ports for explanations of the different ports.
Scan List
This setting contains the port numbers that are tested during the port scan. Tap the field to enter different port numbers, or ranges, separated by commas.
Timeout Threshold
This threshold controls how long the LinkRunner waits for a response from each port. Once all the ports in the Scan List have had this amount of time to respond, the scan ends, and the TCP Port Scan results screen list the ports that responded within the threshold.
See also the TCP Port Scan results card and screen.

natural_image
Simple directional signpost icon with white arrows pointing in each quadrant (no text or symbols)Path Analysis App
Path Analysis traces the connection points, including intermediate routers and switches, between the LinkRunner 10G and a destination URL or IP address. You can use Path Analysis to identify issues such as overloaded interfaces, overloaded device resources, and interface errors. It also shows how devices within your network (and off-net devices) are connected to each other along a path.
All switches are pre-discovered through SNMP queries. When the measurement is complete, LinkRunner shows the number of hops to the destination device. A maximum of 30 hops can be reported.
Note: AllyCare is required to use this application. Your LinkRunner must be claimed. Please visit:
NetAlly.com/AllyCare Support and Features.
Introduction to Path Analysis
Path Analysis combines Layer 3 and Layer 2 measurements.
The Layer 3 measurement combines the classic Layer 3 IP (UDP, ICMP, or TCP) traceroute measurement with a view of the path through the Layer 2 switches.
The Layer 2 measurement discovers switches between the router hops by looking for the routers' MAC addresses in the switch forwarding tables by sending SNMP queries to all discovered switches. The switches found in the path are displayed between the router hop when the measurement finishes.
Path Analysis is most effective when you have configured the Discovery app with SNMP credentials. See SNMP Configuration in the Discovery Settings topic to learn how.
Path Analysis Settings
The Path Analysis source device is always your LinkRunner 10G. The default destination is www.google.com.
Populating Path Analysis from Another App
Like other LinkRunner testing apps, when you open Path Analysis from another app, like Discovery, the address of the network component you were viewing in the previous app is pre-populated as the Path Analysis Destination.
Configuring Path Analysis Manually
Open the app settings to configure a custom destination and select an Interface and Protocol. To open, from the Path Analysis app screen, touch the settings icon, or open the left-side navigation drawer and select Path Analysis Settings.
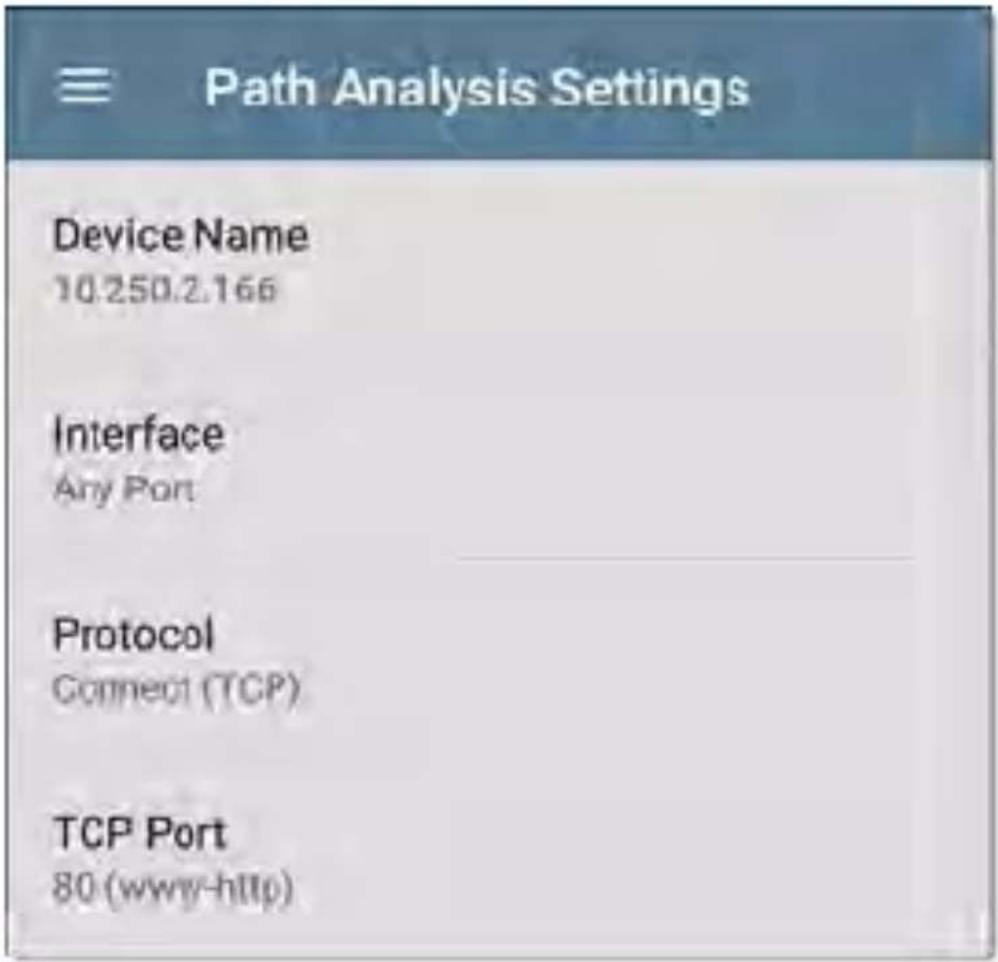
text_image
≡ Path Analysis Settings Device Name 10.250.2.166 Interface Any Port Protocol Connect (TCP) TCP Port 80 (www-http)On the Path Analysis Settings screen, touch each field as needed to configure your target:
Device Name: Touch to enter the IP address of DNS name of the Path destination. The default is www.google.com.
Interface: This setting determines the LinkRunner port from which the test runs. Touch the field to select Any Port, Wired Test Port, or Wired Management Port.
Interface

Any Port

Wired Port

Wired Management Port
CANCEL
OK
LinkRunner must have an active network link on the selected port to run a Path Analysis. If Any Port is selected, available links are used in the order shown in the Interface dialog above.
See Test and Management Ports for explanations of the different ports and how to link.
Protocol: Tap to select the Connect (TCP), Ping (ICMP), or Echo (UDP/7) protocol for your Path Analysis.
TCP Port: This field only appears if you have selected the Connect (TCP) Protocol. Tap to enter the port number over which you want to run Path Analysis. You may need to enter a specific port number because routes can vary
based on the port number and/or may be blocked by firewalls.
Running Path Analysis
Touch the START button at the top of the app screen to begin a Path Analysis.
NOTE: LinkRunner must be linked on the Interface (Port) selected in the app's settings. See Test and Management Ports fo help.
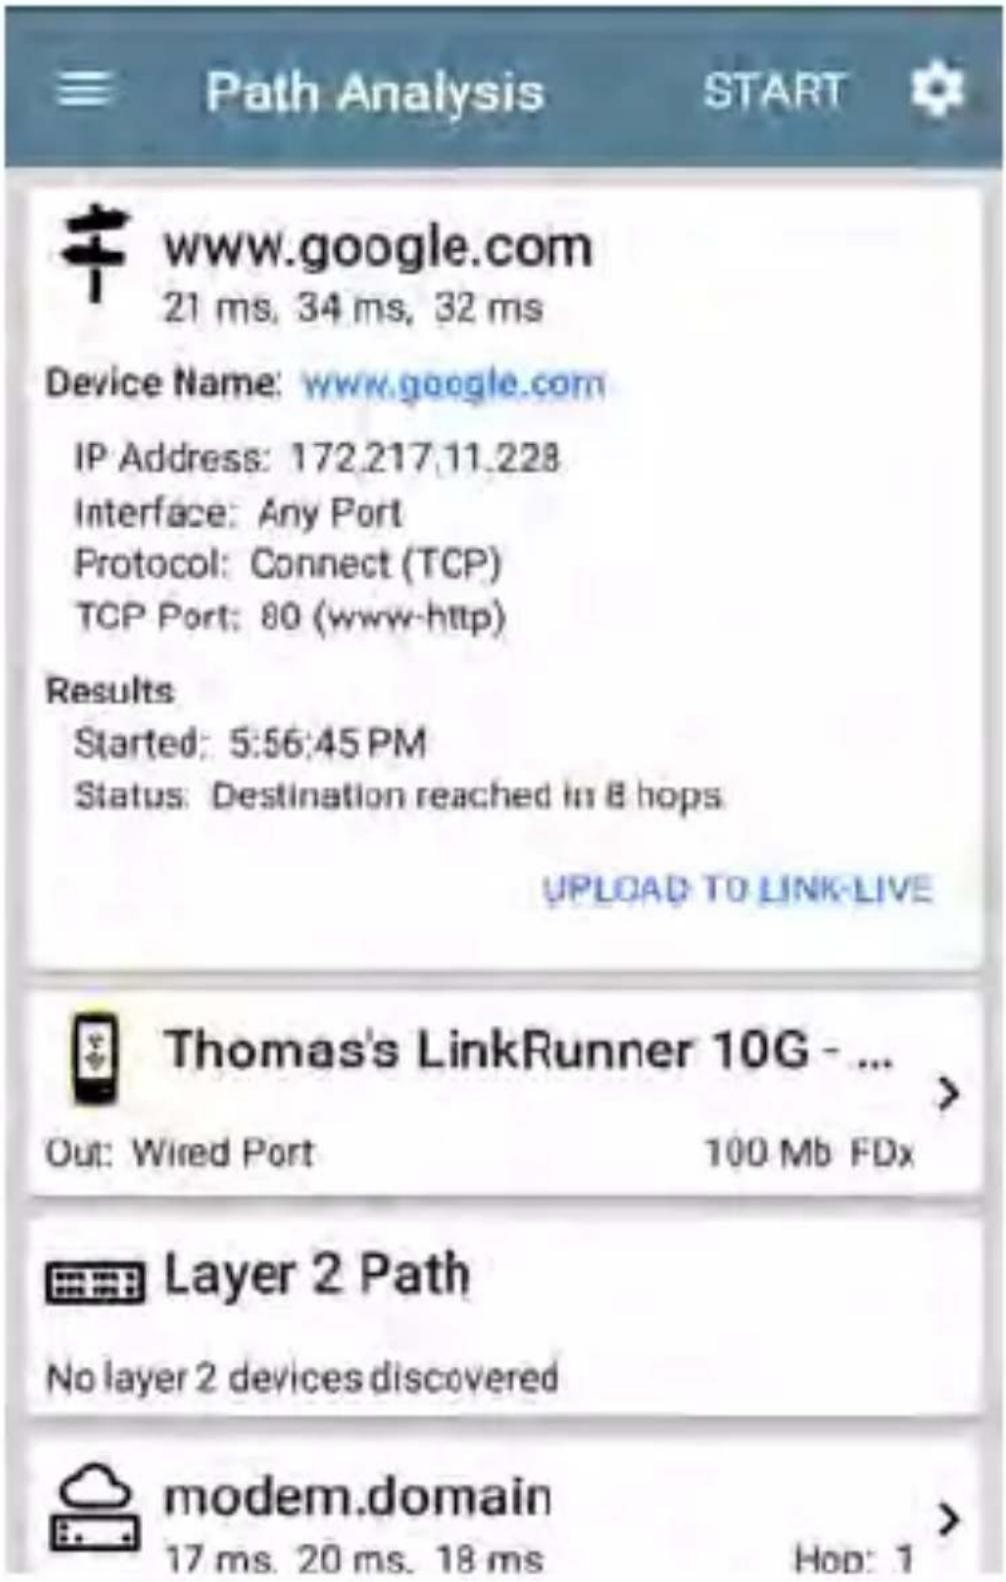
text_image
Path Analysis START www.google.com 21 ms, 34 ms, 32 ms Device Name: www.google.com IP Address: 172.217.11.228 Interface: Any Port Protocol: Connect (TCP) TCP Port: 80 (www-http) Results Started: 5:56:45 PM Status: Destination reached in 8 hops. UPLOAD TO LINK-LIVE Thomas's LinkRunner 10G - ... Out: Wired Port 100 Mb FDx Layer 2 Path No layer 2 devices discovered modem.domain 17 ms, 20 ms, 18 ms Hop: 1Like AutoTest, Path Analysis results are presented on cards. The top card shows the main test details, the second card shows information for the source device (your
LinkRunner 10G), and the following cards show the Layer 2 and Layer 3 Hops in the path, which are sequentially ordered.
Touch any blue linked name or address in the Path Analysis results screens to open the Discovery app and further examine the linked element.
Path Analysis Results and Source LinkRunner Cards
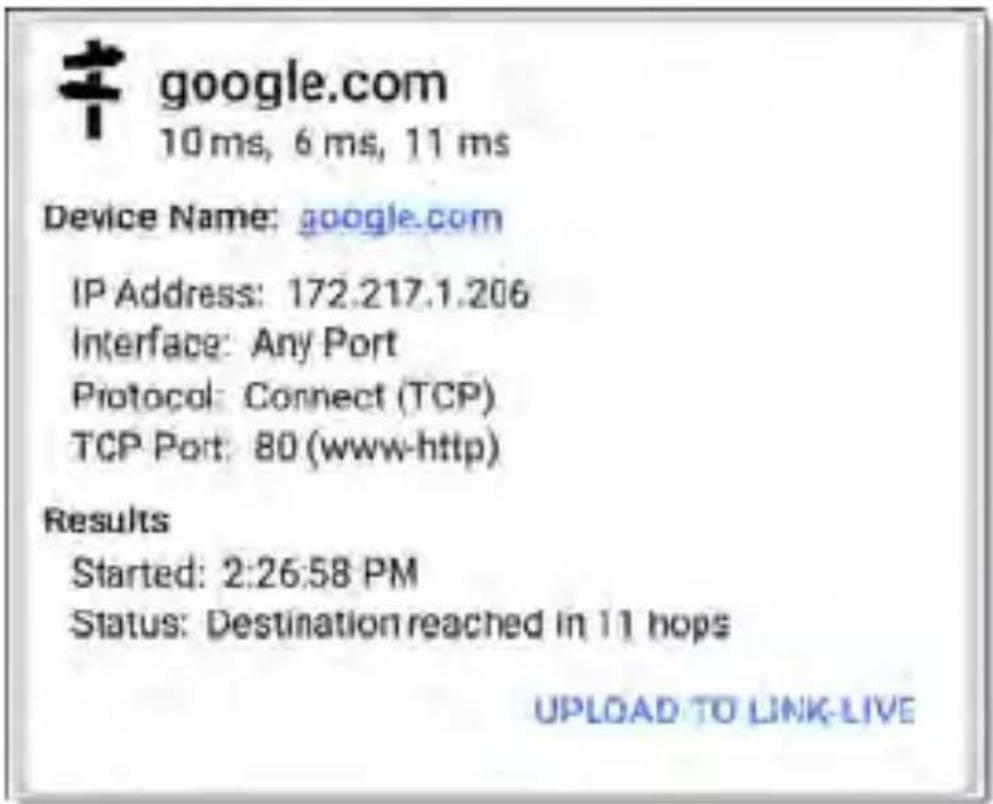
text_image
google.com 10ms, 6 ms, 11 ms Device Name: google.com IP Address: 172.217.1.206 Interface: Any Port Protocol: Connect (TCP) TCP Port: 80 (www-http) Results Started: 2:26:58 PM Status: Destination reached in 11 hops UPLOAD TO LINK-LIVEThe top Path Analysis results card shows the path's Destination address at the top, followed
by the three response times from the TCP Connect, Ping, or Echo tests.
Device Name: Resolved DNS name or IP address of the destination entered in the settings
IP Address: IPv4 address of the target destination
Interface: The Interface option selected in the settings
Protocol: The Protocol selected in the settings (TCP, Ping, or Echo)
TCP Port: The port number used for a TCP Connect Protocol. This field does not appear for Ping or Echo Protocol results.
Results
Started: Time at which the Path Analysis began
Status: Current status of the Path Analysis test, including any error messages
UPLOAD TO LINK-LIVE: Touch this link to upload your results to a Link-Live account. See Uploading Path Analysis Results to Link-Live later in this topic.
Source LinkRunner Card
text_image
Thomas' LinkRunner 10G - ... Out: Wired Port 100 Mb FDxThe source This LinkRunner card displays the port from which the Path Analysis ran.
- For Wired Test or Management port analyses (shown above), this card displays connection speed and duplex.
NOTE: This card and screen only display a custom name for your LinkRunner if you have claimed it to Link-Live.
Touch the card to view more details.
The image below shows the source LinkRunner card from a Wired Path Analysis, which displays the link speed and duplex.

text_image
≡ Path Analysis
Thomas's LinkRunner 10G - 530...
Device Name: Thomas's LinkRunner 10G - 530AB0
IP Address: 192.168.0.124

Out: Wired Port
Speed: 100 Mb
Duplex: FDx
Beneath the LinkRunner source card, the Hop cards show Layer 2 and Layer 3 devices determined to be in the Path.
Layer 3 Hops
Each Layer 3 Hop card displays the device type icon, DNS name (if discovered), and IP address.

text_image
192.168.249.81 8 ms, 4 ms, 3 ms Hop: 2Beneath the name (or IP), the response times for each Connect (TCP), Ping (ICMP), or Echo (UDP/7) display in milliseconds. On the right side is the router Hop number of this device in the path.
Touch the card to view the hop Details screen.
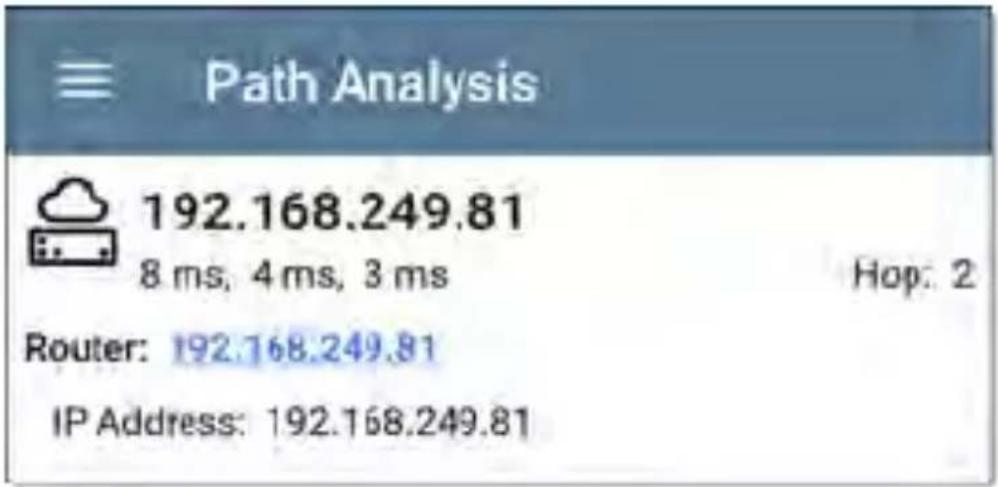
text_image
Path Analysis 192.168.249.81 8 ms, 4 ms, 3 ms Router: 192.168.249.81 IP Address: 192.168.249.81 Hop: 2No Reply
Sometimes Path Analysis displays Hop cards with "No Reply" (as shown below). This result means that the device in that portion of the path did not send an ICMP TTL timeout response.
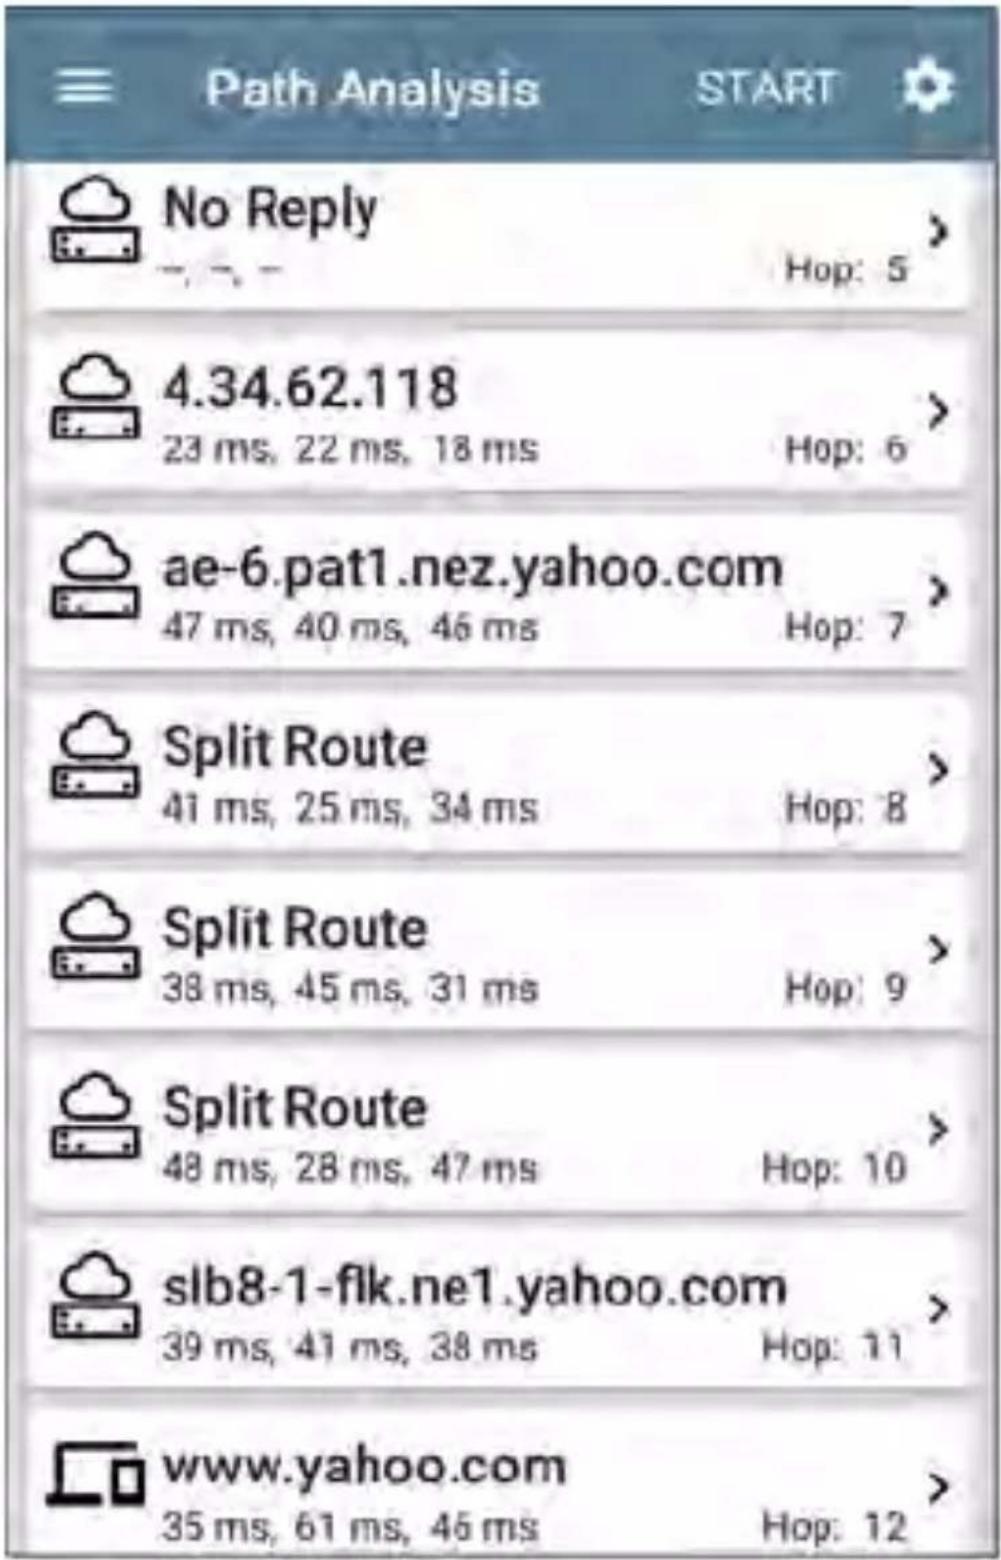
text_image
Path Analysis START No Reply Hop: 5 4.34.62.118 23 ms, 22 ms, 18 ms Hop: 6 ae-6.pat1.nez.yahoo.com 47 ms, 40 ms, 46 ms Hop: 7 Split Route 41 ms, 25 ms, 34 ms Hop: 8 Split Route 38 ms, 45 ms, 31 ms Hop: 9 Split Route 48 ms, 28 ms, 47 ms Hop: 10 slb8-1-flk.ne1.yahoo.com 39 ms, 41 ms, 38 ms Hop: 11 www.yahoo.com 35 ms, 61 ms, 46 ms Hop: 12Split Route
Path Analyses may obtain a "Split Route" result (as shown above), meaning that two or three
different routers within same hop responded to the three requests.
Tap a Split Route card to view the DNS names and IP addresses of the responding routers.
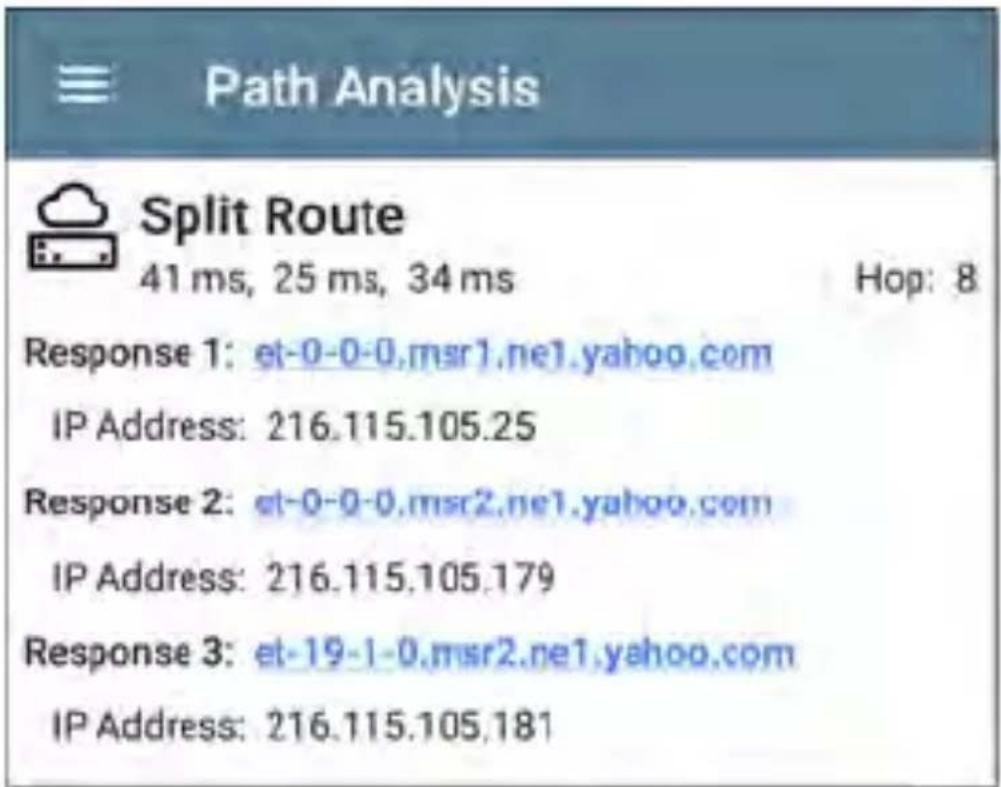
text_image
Path Analysis Split Route 41 ms, 25 ms, 34 ms Hop: 8 Response 1: et-0-0-0.msr1.ne1.yahoo.com IP Address: 216.115.105.25 Response 2: et-0-0-0.msr2.ne1.yahoo.com IP Address: 216.115.105.179 Response 3: et-19-1-0.msr2.ne1.yahoo.com IP Address: 216.115.105.181Layer 3 Interfaces and Statistics
Statistics for Interfaces on Layer 3 devices may be identified and measured if the LinkRunner has SNMP access.
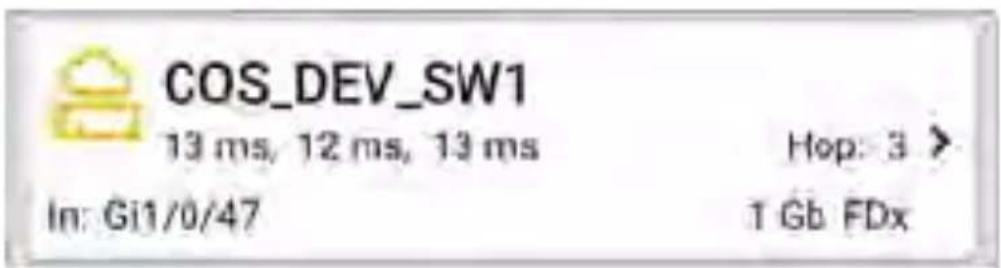
Touch a Hop card to see a summary of Interfa Details and Statistics, if they are available.
See also Layer 2 Switch Interfaces and Statistic below.
Network Problems in Path Analysis
The Hop cards can also show detected Problems based on the Problem Settings in the Discovery app and display the device type icon in the corresponding colors.
The yellow switch icon in the image above indicates a Warning status.
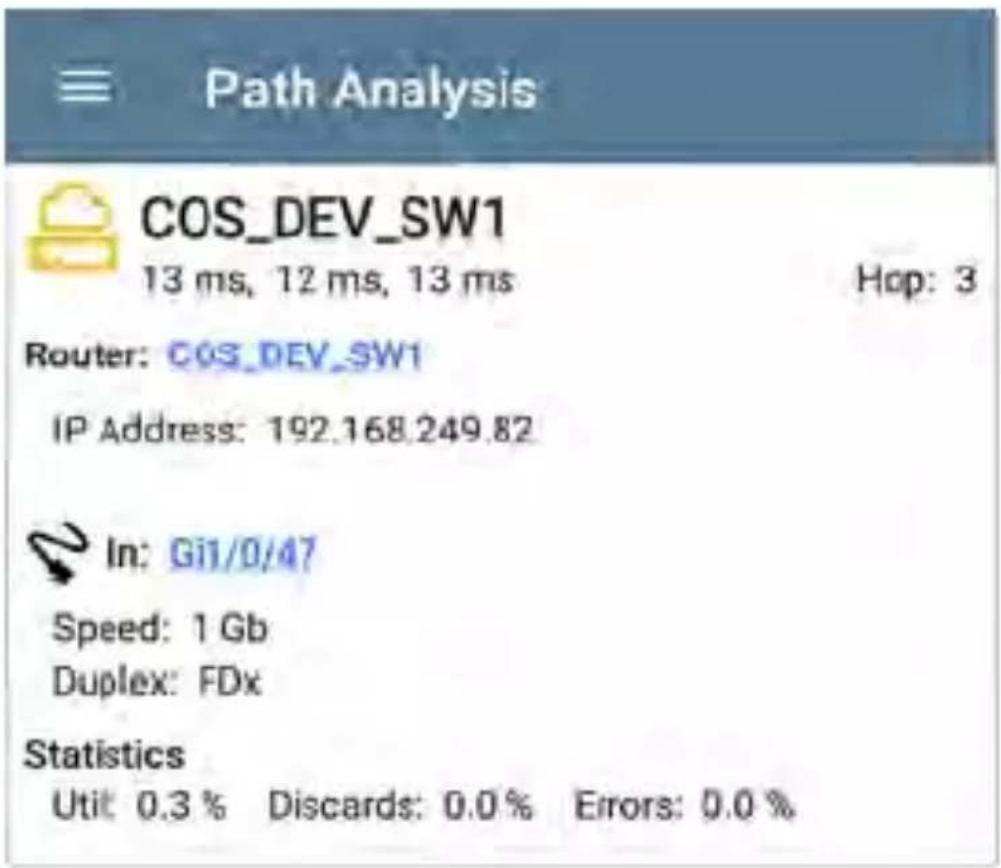
text_image
Path Analysis COS_DEV_SW1 13 ms, 12 ms, 13 ms Hop: 3 Router: COS_DEV_SW1 IP Address: 192.168.249.82 In: Gi1/0/47 Speed: 1 Gb Duplex: FDx Statistics Util: 0.3% Discards: 0.0% Errors: 0.0%Tapping the blue linked switch name will open a Discovery Details screen for the switch, where the user can investigate the cause of the Warning.
Layer 2 Devices
Layer 2 devices can be switches or APs.
Layer 2 Switches
The image below displays an example of a Pat Analysis to a device on the local broadcast domain with two switches in the Layer 2 portion of the path.

text_image
Path Analysis START Interface: Any Port Protocol: Connect (TCP) TCP Port: 80 (www-http) Results Started: 3:41:34 PM Status: Destination reached in 1 hop UPLOAD TO LINK-LIVE Angela Out: Wired Port 1 Gb FDx COS_DEV_SW1 In: Gi1/0/13 VLAN: 500 1 Gb FDx Out: Gi2/0/24 VLAN: 500 1 Gb FDx cos-dev-sw18-poe In: Gi0/1 VLAN: 500 1 Gb FDx Out: Gi0/7 VLAN: 500 1 Gb FDx Cetus 6 ms, 4 ms, 6 ms Hop: 1The LinkRunner is able to identify these Layer switches and their interfaces because it has configured SNMP access to the switches.
The switch cards display the In and Out Interface IDs, VLAN ID, and the link speed and duplex (if detected) of the interfaces.
Touching a Layer 2 card opens a Details screer for the device.
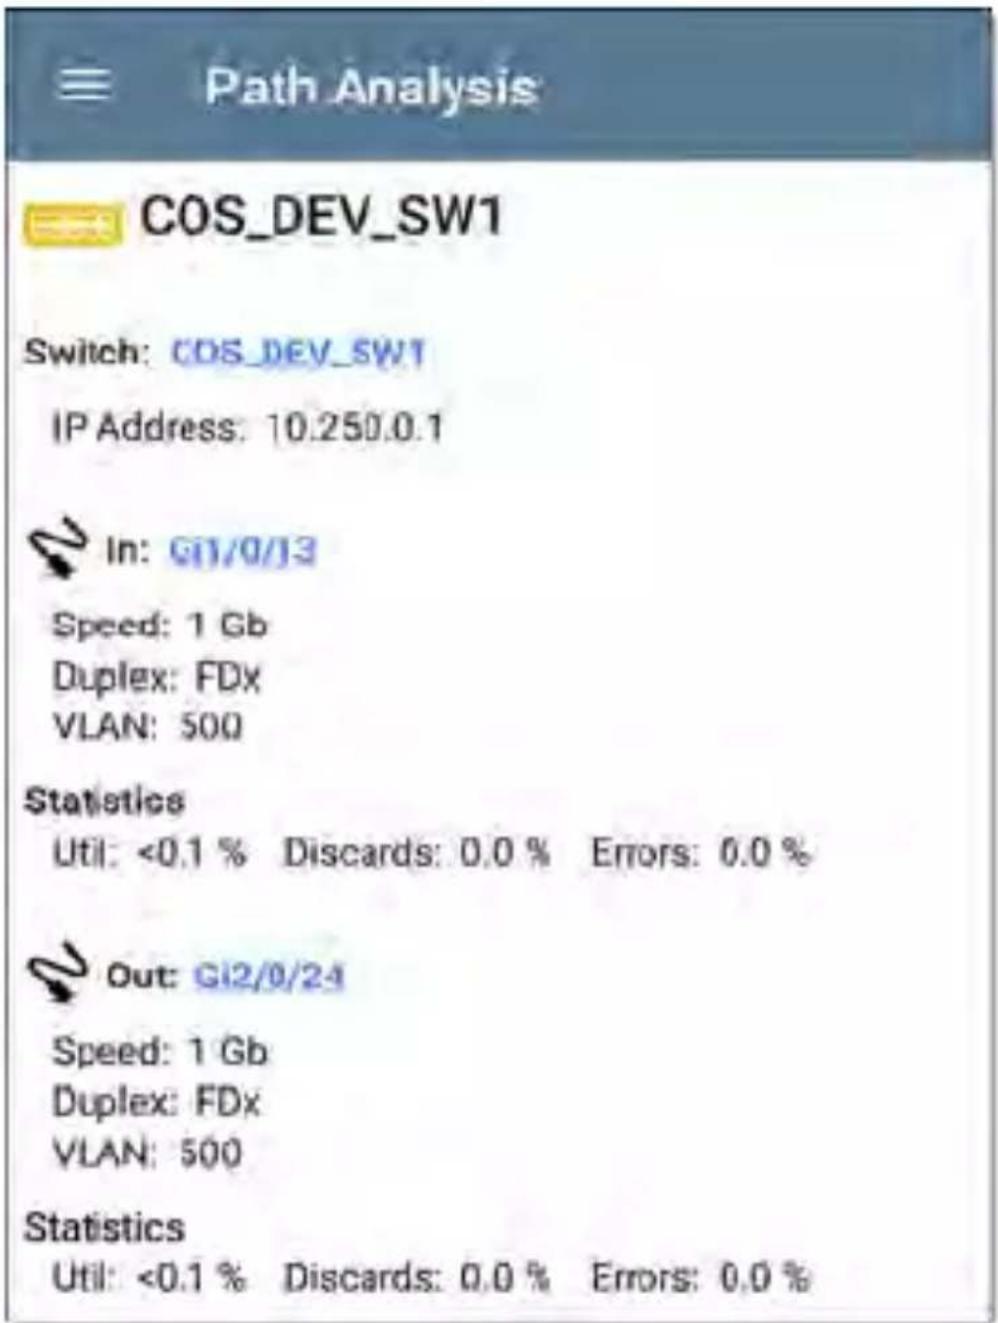
text_image
Path Analysis COS_DEV_SW1 Switch: COS_DEV_SW1 IP Address: 10.250.0.1 In: G11/0/13 Speed: 1 Gb Duplex: FDX VLAN: 500 Statistics Util: <0.1 % Discards: 0.0 % Errors: 0.0 % Out: G12/0/24 Speed: 1 Gb Duplex: FDX VLAN: 500 Statistics Util: <0.1 % Discards: 0.0 % Errors: 0.0 %A Layer 2 Details screen displays the device name and IP address at the top.
NOTE: The yellow switch icon in the image above indicates a Warning status. See Network Problems in Path Analysis later in this topic.
Layer 2 Switch Interfaces and Statistics
Layer 2 Switch Details screens in Path Analysis display a summary of the Interface Statistics (described below). To view all available information for these interfaces, tap their blue links to open a Interface Details screen in the Discovery app.
Statistics for Interfaces on Layer 2 switches ma be identified and measured if the LinkRunner has SNMP access.
In/Out: Indicates the interface type and name. The interface name often contains the physical port number where the switch is connected to the network.
Util: Percentage of total interface capacity being used
Discards: Percentage of total packets that have been dropped
Errors: Percentage of packets containing errors
Layer 2 APs
If the Layer 2 path starts or ends with a Wi-Fi device, its AP is shown as a Layer 2 device in the path.
A Layer 2 AP card indicates the connected network SSID, channel, and 802.11 type in use.
text_image
Cisco3702_Erik SSID: Lobo CH 36 802.11acNo layer 2 devices discovered
text_image
Layer 2 Path No layer 2 devices discoveredIn some cases, the LinkRunner does not discover Layer 2 devices between Layer 3 devices. There may not be any Layer 2 devices or LinkRunner might not have SNMP access to those switches.
The Layer 2 card may also display a result of "No switches found," which indicates that Discovery has not found any switches with SNMP access to determine if the switches are in the path. If this is an unexpected result, check and verify your SNMP Configuration and Extended Ranges in the Discovery app settings.
Uploading Path Analysis Results to Link-Live
Touching the UPLOAD TO LINK-LIVE link on the top card opens the Link-Live sharing screen for path analysis results:
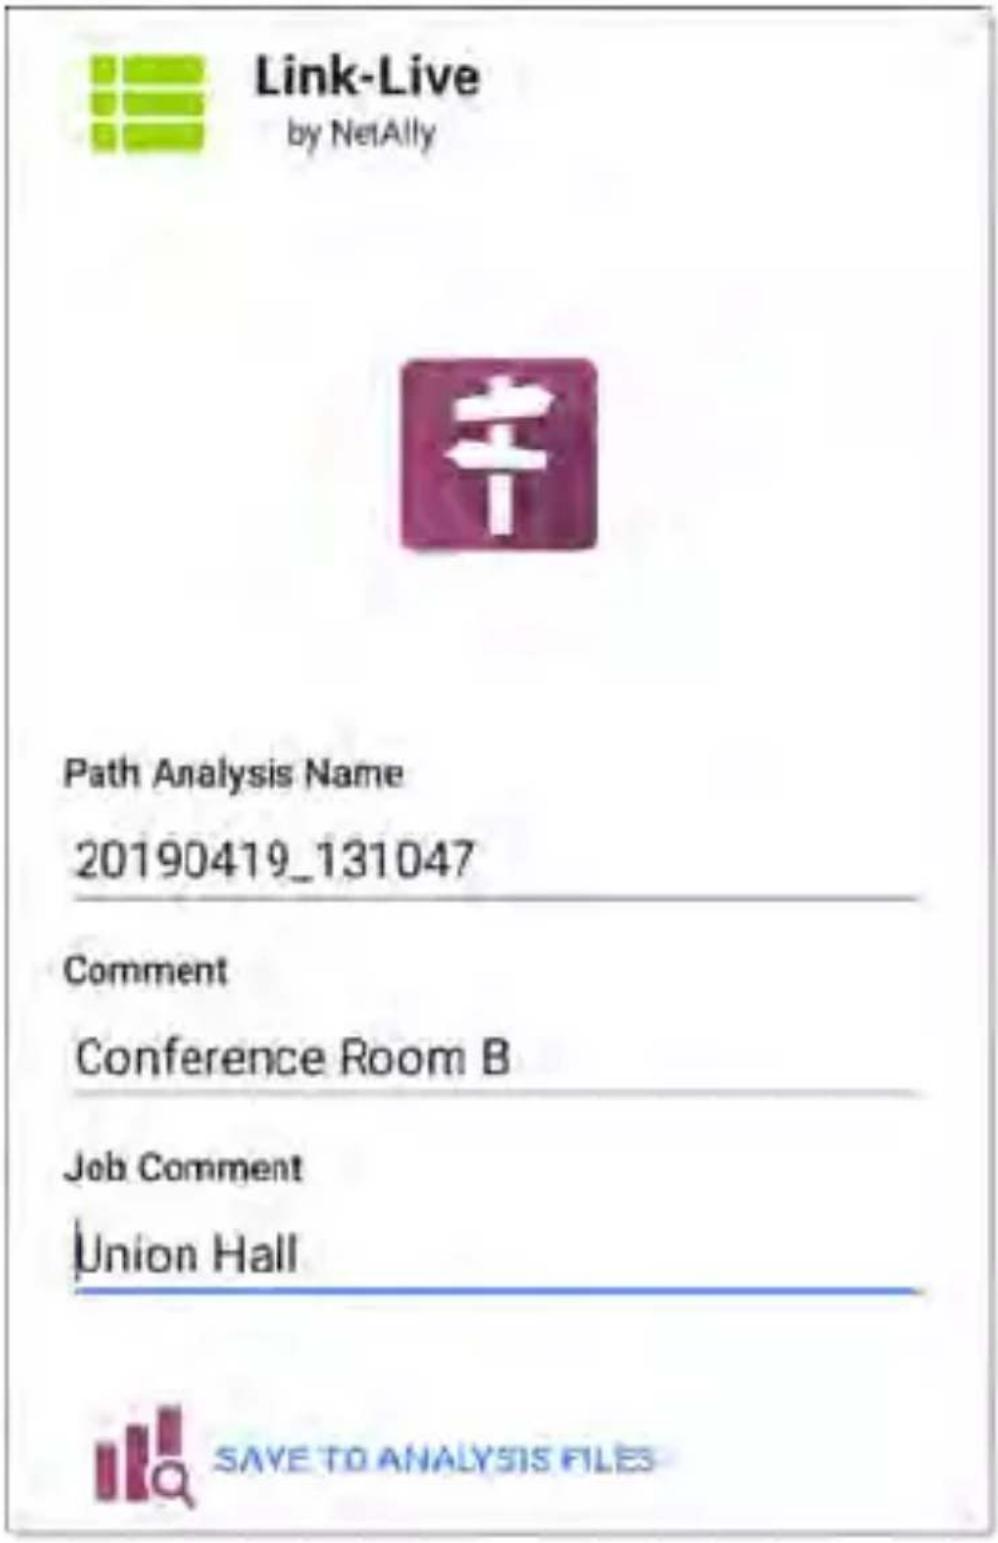
text_image
Link-Live by NetAlly Path Analysis Name 20190419_131047 Comment Conference Room B Job Comment Union Hall SAVE TO ANALYSIS FILESPath Analysis results are uploaded to the Analysis page on Link-Live.
text_image
GbpsPerformance Test App
The LinkRunner 10G's line rate Performance Test provides Peer capability to support point-to-point performance testing of a traffic stream across wired IPv4 network infrastructure. This test quantifies network performance in terms of target rate, throughput, loss, latency, and jitter.
The Performance Test runs from the Wired Test Port (top RJ-45 or Fiber port), and an AutoTest Wired Profile must connect successfully to establish link on the port. When you start up the LinkRunner, the last Wired Profile in the list of active AutoTest profiles runs automatically if an active Ethernet connection is detected on the top RJ-45 port. Otherwise, you may need to manually run a Wired AutoTest to link. See Wired AutoTest Profiles to review.
Introduction to Performance Testing
Network performance is measured between a Source device, on which the test is configured and controlled, and up to four Endpoint devices that exchange traffic with the source. There are two endpoint types: Peers and Reflectors.
When using a Peer endpoint, separate upstream and downstream measurements can be shown for Throughput, Loss, Latency, and Jitter.
When using a Reflector, the LinkRunner reports round-trip data for all measurements. Separate upstream and downstream traffic measurements are not possible.
The LinkRunner 10G can act as a Peer for a test conducted by a different source device, such as an EtherScope nXG or a OneTouch AT 10G.
Other NetAlly testers work with the LinkRunner to perform network performance testing:
- EtherScope nXG can act as the Source or a Peer for Performance tests.
(NetAlly.com/products/EtherScopenXG)
- OneTouch AT 10G can act as the Source or Peer for Performance tests.
(NetAlly.com/products/OneTouch)
In this Chapter
Running LinkRunner as a Performance Peer
Running LinkRunner as a Performance Peer
LinkRunner 10G can act as a Peer for a EtherScope nXG or a OneTouch AT 10G acting as the source and controller.
To access the LinkRunner Performance Peer, tap the menu button in the Performance app and select Performance Peer.
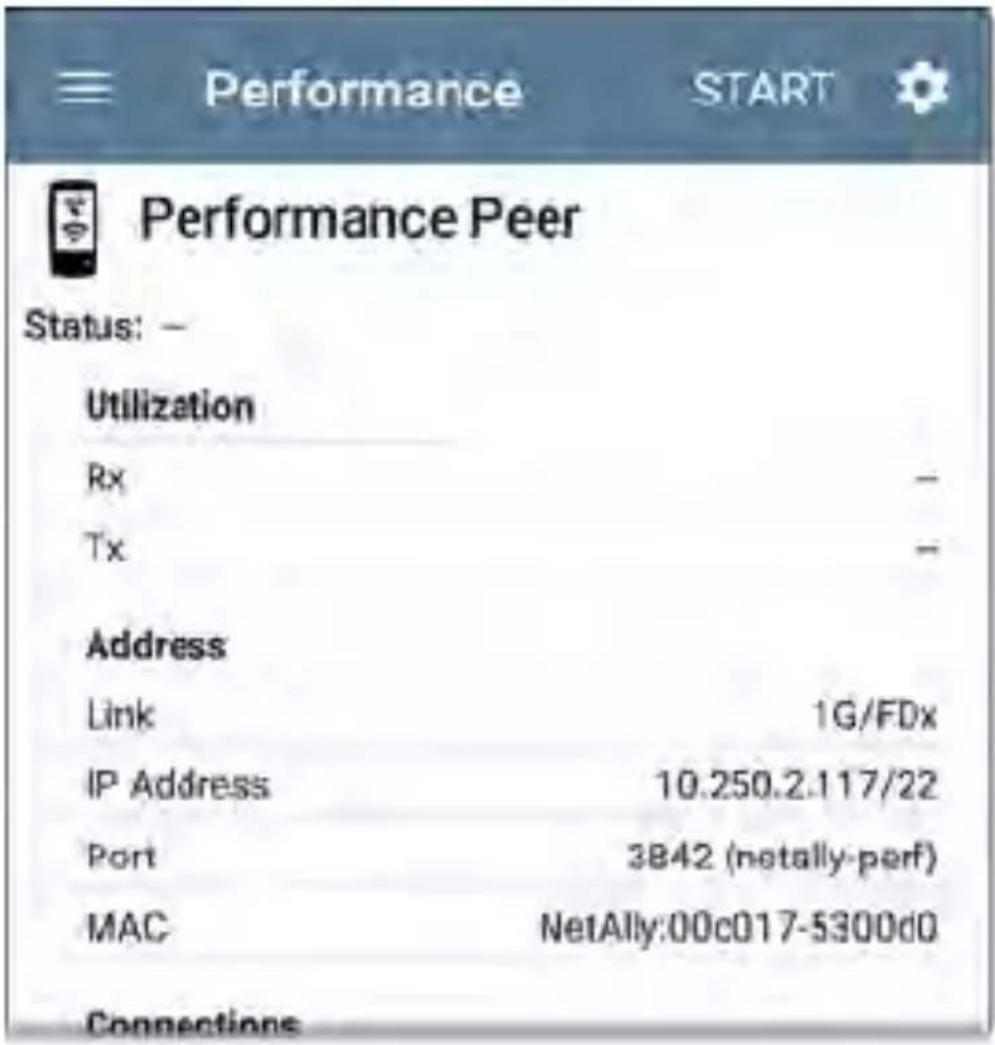
text_image
Performance START Performance Peer Status: - Utilization Rx - Tx - Address Link 1G/FDx IP Address 10.250.2.117/22 Port 3B42 (notally-perf) MAC NetAlly:00c017-5300d0 ConnectionsThe Wired Test Port must be linked (by runnin an AutoTest Wired Profile) for the Performance
Peer function to run. If the port is not linked, Status message displays, "The wired test port i not linked."
Performance Peer Setting
The only setting for the Performance Peer function is the Communication UDP Port.
Touch the settings button on the Performance Peer screen to change the port number. The default NetAlly performance test port is 3842.
NOTE: The UDP port number entered here must match the port number used by your source device.
Running the Peer
Tap START on the Performance Peer screen to start the Peer.
| Performance STOP | |
| Performance Peer | |
| Status: Running | |
| Utilization | |
| Rx | 1.02% |
| Tx | 1% |
| Address | |
| Link | 1G/FDx |
| IP Address | 10.250.2.244/22 |
| Port | 3842 (netally-perf) |
| MAC | NetAlly:00c017-5300d0 |
| Connections | |
| Last Peer | 10.250.2.247 |
| Connected Peer | 10.250.2.247 |
| Time Remaining | 4 minutes 23 seconds |
The screen displays real-time status, utilization, and rates for as long as the test is running.
Status: The current status of the peer
Utilization
Rx: Receive percentage of the link speed
Tx: Transmit percentage of the link speed
Address
Link: Link speed and duplex of the established Wired Test Port connection
IP Address: Address of the LinkRunner to be entered into the controlling source device
Port: UDP Communication port in use by the peer
MAC: The LinkRunner's MAC address
Connections
Last Peer: Address of the previous peer tha was connected to the LinkRunner
Connected Peer: Address of the peer that is currently connected to the LinkRunner
Time Remaining: Amount of time left for the current test
text_image
MbpsiPerf Test App
iPerf is a standardized network performance tool used to measure UDP or TCP throughput and loss.
The iPerf app runs an iPerf3 performance test to a NetAlly Test Accessory or an iPerf server endpoint.
text_image
Spare UK For More thanThe NetAlly Test Accessory runs network connection tests, uploads results to Link-Live Cloud Service, and acts as an iPerf server endpoint for iPerf tests run by other NetAlly handheld testers.
Learn more about the Test Accessory from NetAlly.com/products/TestAccessory.
If you are using an iPerf server installed on a or other device as an endpoint, iPerf version 3 is required to run the LinkRunner iPerf test. You can download iPerf server software from https://iperf.fr.
iPerf Settings
To run an iPerf test, you must configure your LinkRunner unit to communicate with your iPerf endpoint. You can manually enter an iPer server address, or select a NetAlly Test Accessory's address in the iPerf settings.
Saving Custom iPerf Settings
The iPerf app allows you to save a con- figuration of settings for running an iPerf test to the same endpoint later.
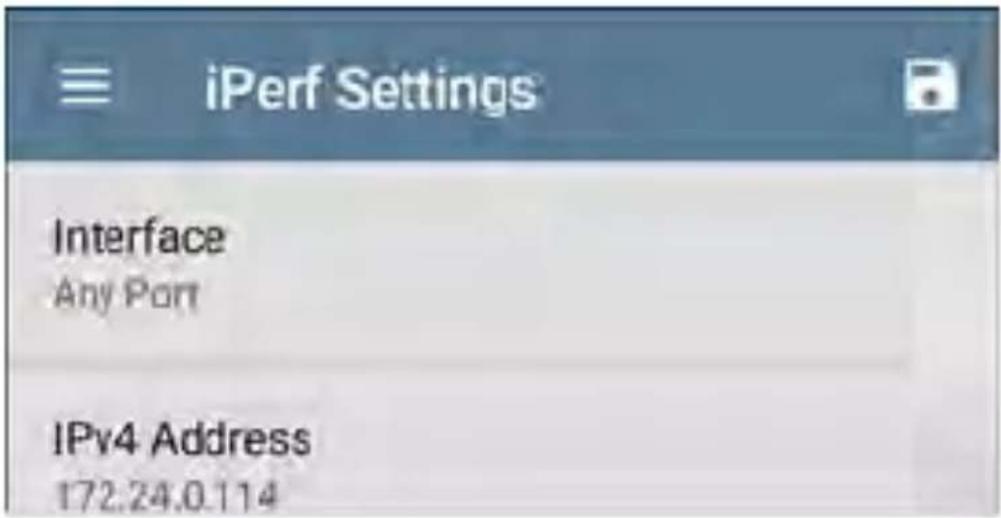
text_image
iPerf Settings Interface Any Port IPv4 Address 172.24.0.114Touch the save icon to load, save, import, and export configured settings. See Saving App Settings Configurations for more instructions.
Once you save a settings configuration, thecustom name you entered appears at the top
the iPerf settings and results screens. In the example images here, the user has saved a custom iPerf configuration called "Server Room Endpoint."
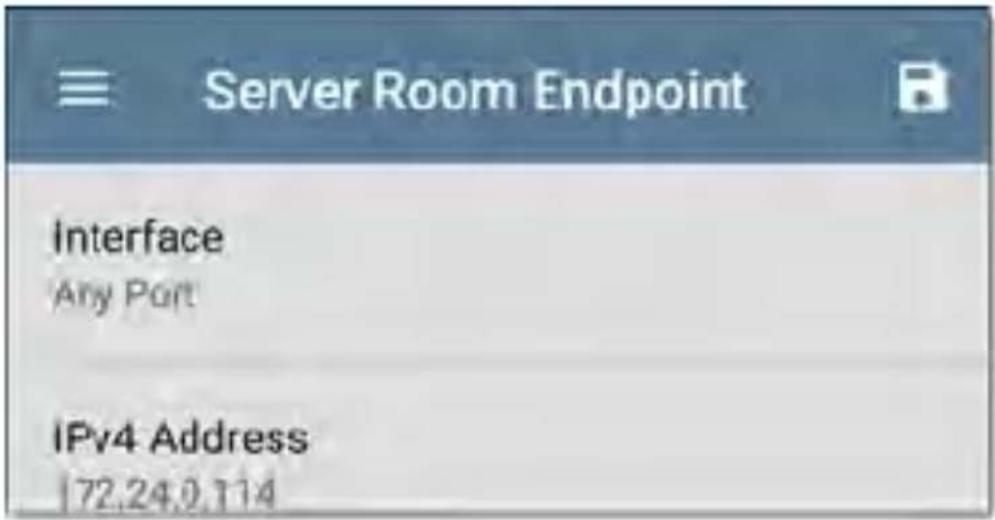
text_image
Server Room Endpoint Interface Any Port IPv4 Address 172.24.0.114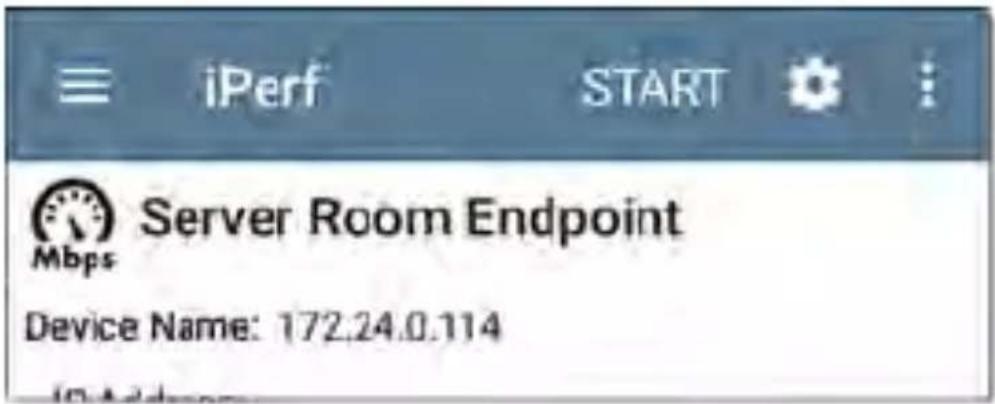
text_image
iPerf START Server Room Endpoint Mbps Device Name: 172.24.0.114Test Accessories in Discovery
You can start an iPerf test from the Details screen for a Test Accessory in the Discovery app using the floating action button.
- Open the Discovery app, and select an active Test Accessory from the main
Discovery list to open its Details screen.
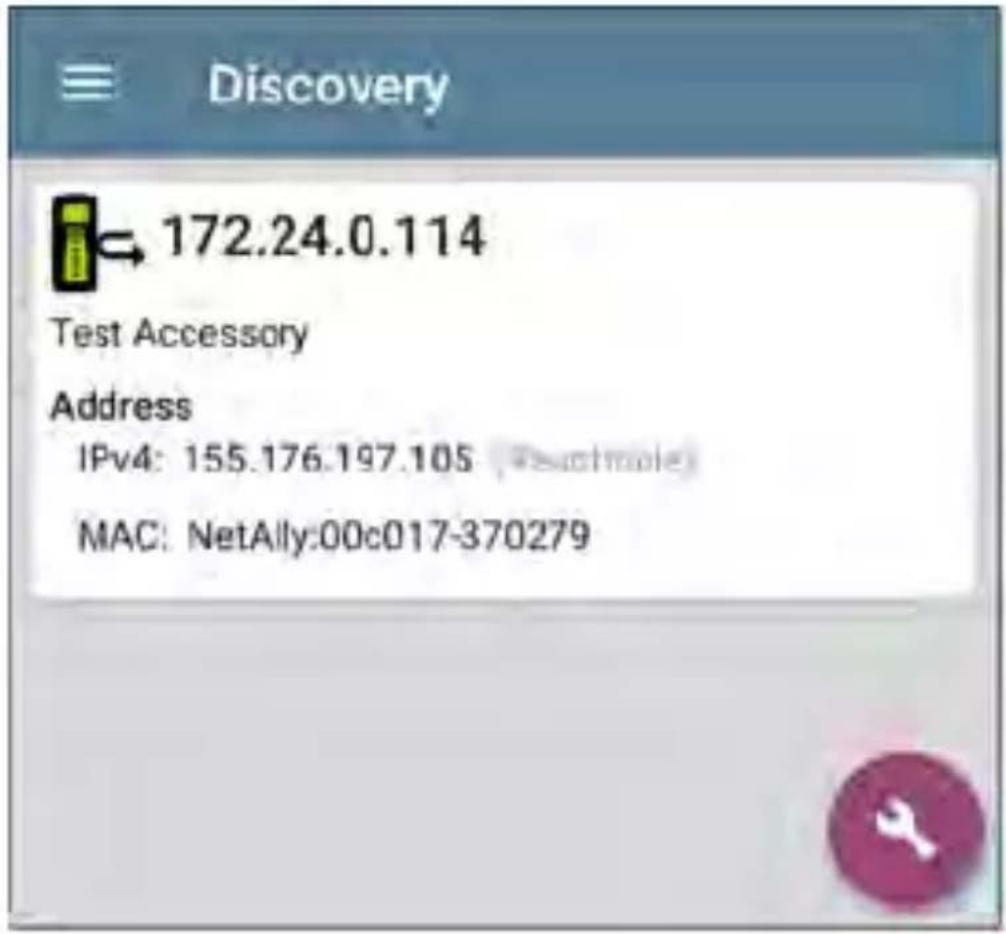
text_image
Discovery 172.24.0.114 Test Accessory Address IPv4: 155.176.197.105 MAC: NetAlly:00c017-370279- Open the floating action button (FAB) menu.

text_image
Discovery 172.24.0.114 Ping/TCP PING/TCP Test Accessory Address TCP Port Scan IPv4: 172.24.0.114 (Printchairs) MAC: NetAlly:00c017-330031 iPerf Capture (Wired) Browse Name and AuthorizationNOTE: You can select Browse in the floating action menu to open the Test Accessory's Web Interface, where you can view its status and configure its settings.
- Then, select the iPerf app button.
The iPerf app opens with the IP address populated from the Test Accessory in Discovery.
Configuring iPerf Settings
To configure the iPerf test settings manually, open the settings on the iPerf screen.
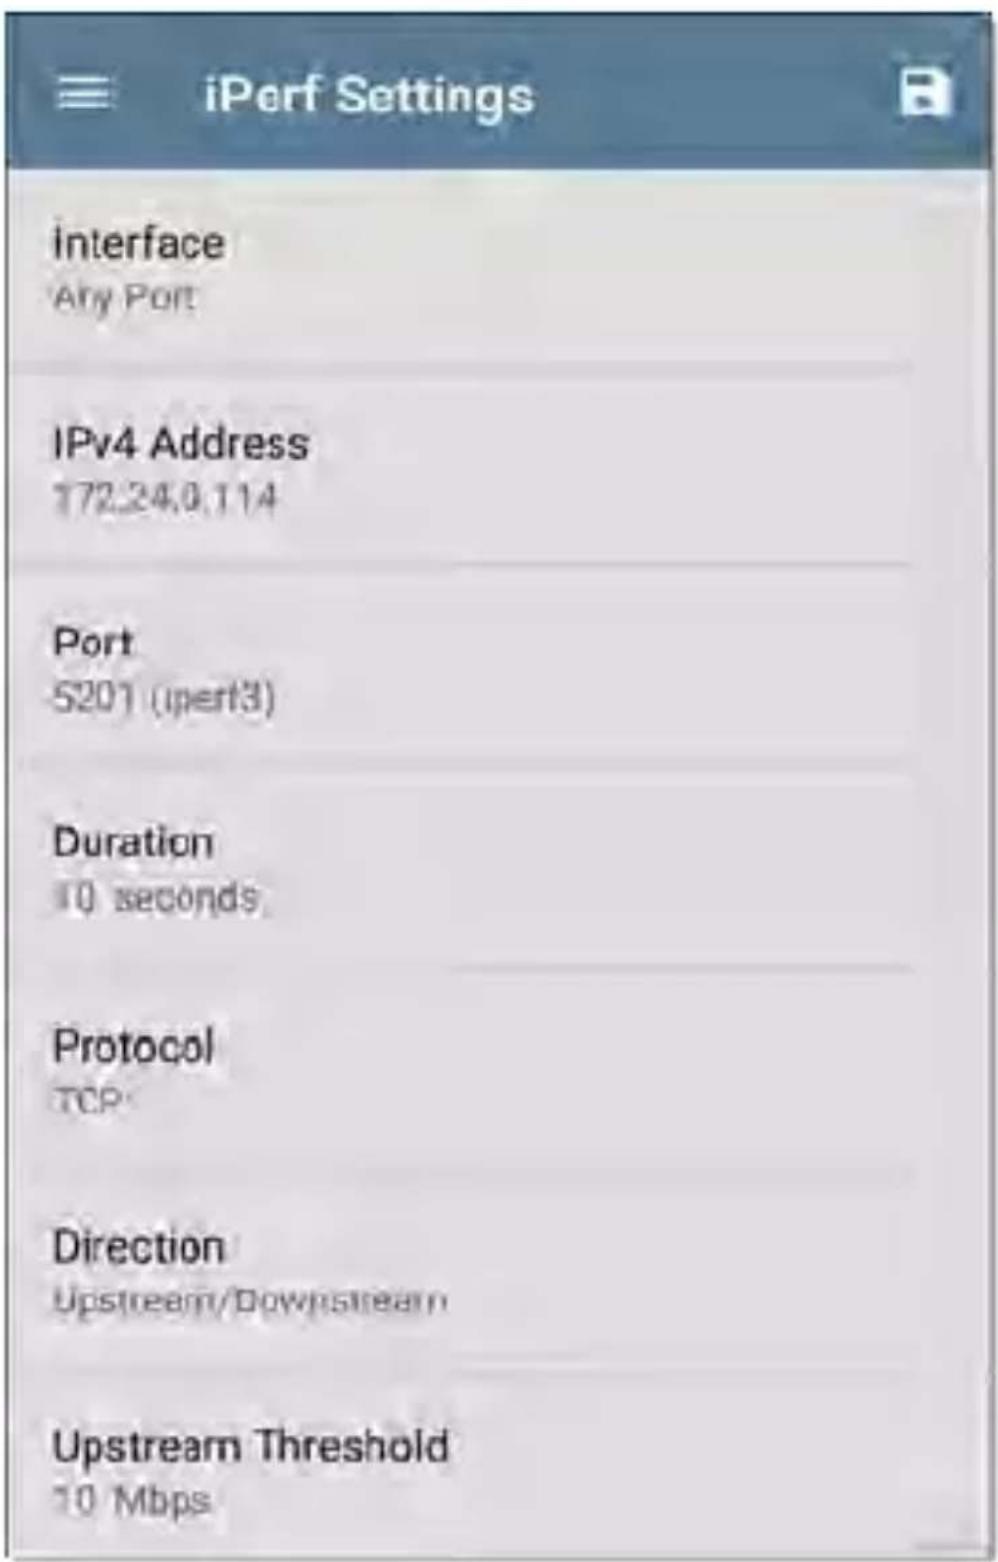
text_image
iPerf Settings interface Any Port IPv4 Address 172.24.0.114 Port 5201 (ipert3) Duration 10 seconds Protocol TCP Direction Upstream/Downstream Upstream Threshold 10 MbpsTouch each field to enter or revise selections a needed. Changed settings are automatically applied. When you finish configuring, tap the back button 📄 return to the iPerf test screen.
Interface: This setting determines the LinkRunner port from which the test runs. Touch the field to select Any Port, Wired Test Port, or Wired Management Port. See Test and Management Ports for explanations of the different ports.
IPv4 Address: Touch the field to enter or select the IPv4 address of the target iPerf server. Only IPv4 addresses are allowed for iPerf testing.
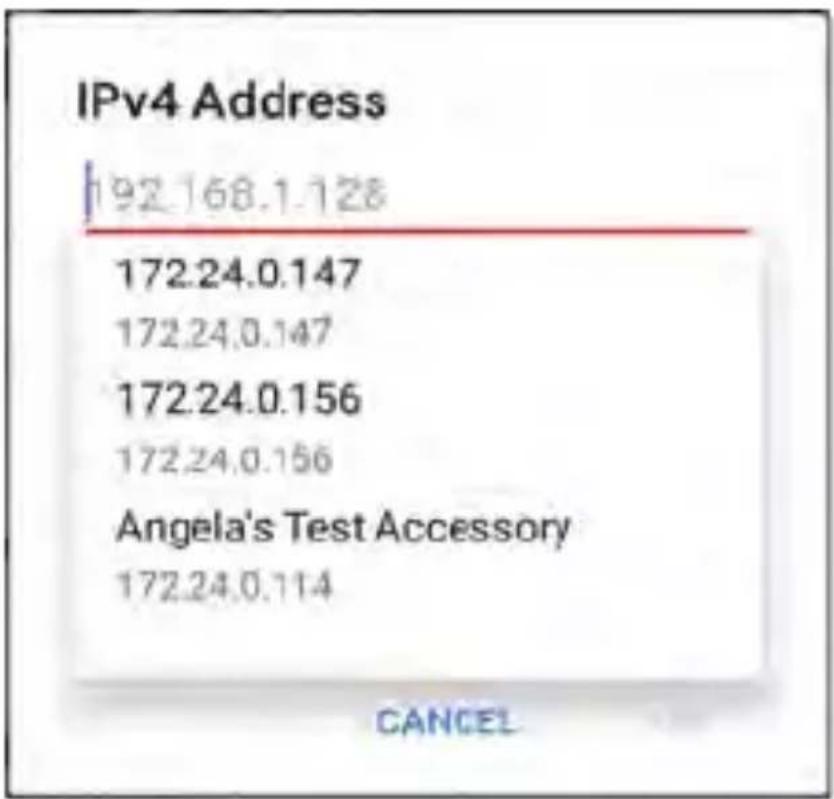
text_image
IPv4 Address 192.168.1.128 172.24.0.147 172.24.0.147 172.24.0.156 172.24.0.156 Angela's Test Accessory 172.24.0.114 CANCELA drop-down list in the IPv4 Address dialog shows all the Test Accessories the LinkRunner has discovered through the discovery process, as well as any Test Accessories that are claimed to the same Link-Live organization as your LinkRunner.
NOTE: Clear the address field in the dialog to see the full list of discovered Test Accessory addresses.
Port: The default iPerf3 port number is 5201. Tap the field to enter a different port number.
NOTE: The iPerf port number entered here must match the port number used by your iPerf server. If needed, consult the Test Accessory User Guide
(NetAlly.com/products/TestAccessory).
Duration: This setting is the length of time for one direction, Upstream or Downstream, of the iPerf test. If the Direction setting below is set to both Upstream/Downstream, the total test time will be twice the value set here. Tap the field to select a new duration or enter a custo value. The default is 10 seconds.
Protocol: TCP is the default protocol. Tap the UDP selector to switch to UDP.
NOTE: iPerf tests running the TCP protocol automatically run at the fastest rate possible. When running a UDP protocol test, the iPerf app attempts to run at the selected Bandwidth.
Direction: You can run an iPerf test Upstream, Downstream, or both. The default is Upstream and Downstream. Touch this field to set the test for only one direction.
Upstream and Downstream Bandwidth: These fields only appear if the UDP Protocol is selected. They specify the desired target bandwidth for the iPerf Test using the UDP protocol.
Upstream and Downstream Thresholds:
Thresholds are the values the LinkRunner uses to grade the test as Pass or Fail. iPerf thresholds are throughput rates. The default is 10 Mbps. Tap the threshold fields to select a different value or enter a custom one.
Running an iPerf Test
Ensure that you have an active link on the Interface (Test or Management Port) from which you are running the iPerf test. The Wired test port requires that an AutoTest Wirec Profile (which runs automatically) has run to establish link. The Management port links automatically if a connection is available.
Tap the START button on the main iPerf screen to begin testing.
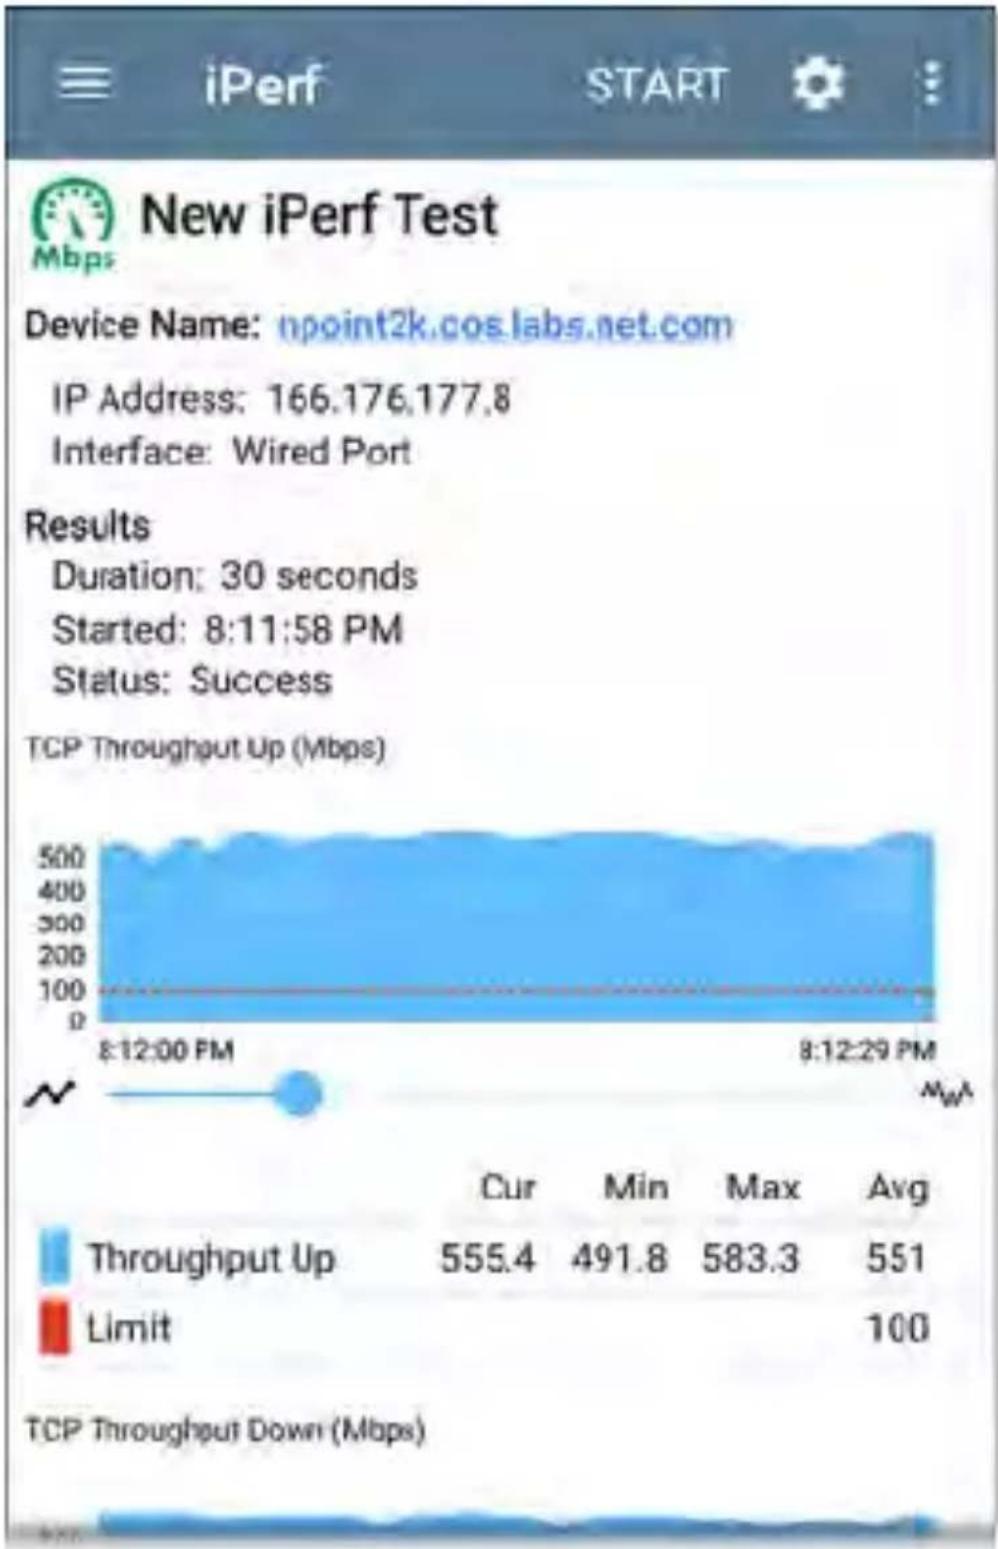
line
| Metric | Current Value | | ---------------- | ------------- | | Cur | 555.4 | | Min | 491.8 | | Max | 583.3 | | Avg | 551 | | TCP Throughput Down (Mbps) | 100 |Test characteristics and status are displayed at the top of the iPerf results screen while the lower part of the screen displays a real-time graph of the TCP or UDP Upload and/or Download speeds.
To pan and zoom on the graphs, you can swipe, double tap, and move the slider. See th Trending Graphs topic for an overview of the graph controls.
Device Name: Hostname or address of the iPer server or Test Accessory
IP Address: IPv4 address of the iPerf server
Interface: The LinkRunner Test or Management Port from which the test is running
Results
- Duration: Configured Duration from the iPerf settings
- Started: Time the test started
• Status: Success or failure status of the test
TCP/UDP Throughput Up and Down graphs: The iPerf graphs plot the throughput rate to (Up) or from (Down) the iPerf server in Mbps.
The table below each graph displays the Current, Minimum, Maximum, and Average rates.
Limit: This is the Threshold from the iPerf app's settings. The threshold value is also displayed on the graph as a red dotted line.
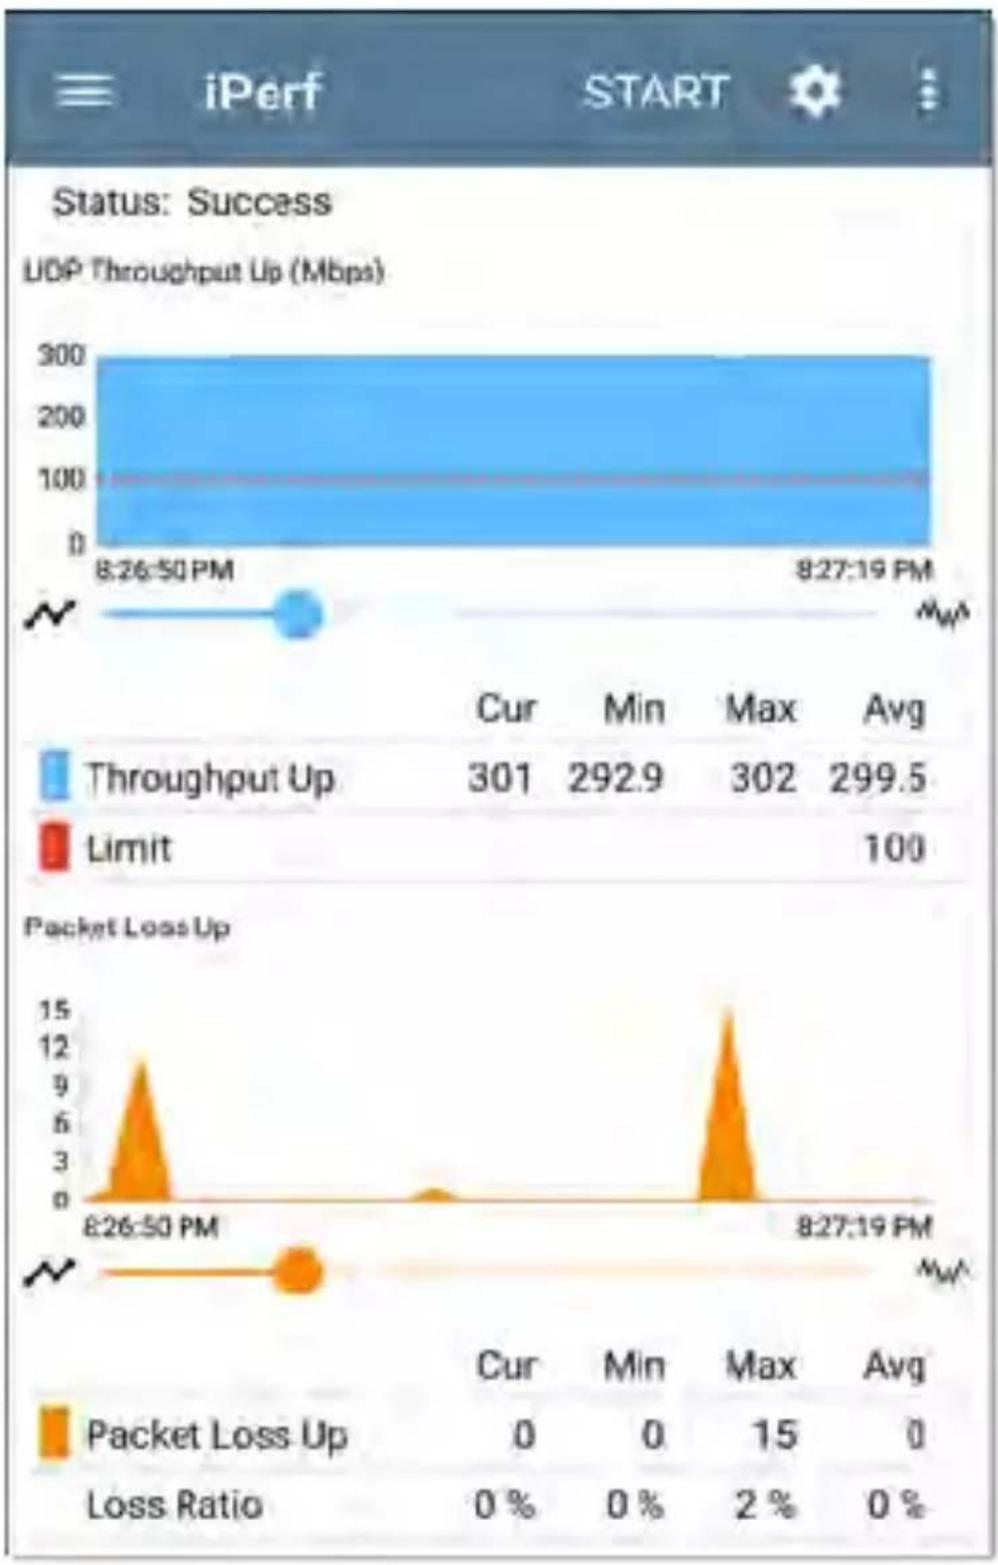
bar_line
| Metric | Cur | Min | Max | Avg | | ------------------ | ---- | ---- | ---- | ---- | | Throughput Up | 301 | 292.9| 302 | 299.5| | Limit | | | | 100 | | Packet Loss Up | 0 | 0 | 15 | 0 | | Loss Ratio | 0% | 0% | 2% | 0% |UDP Packet Loss Up and Down graphs: When running a UDP protocol test, the iPerf results also display graphs and tables of Packet Loss. Values for the number and percentage of packets lost are displayed in the table below the graph. The Packet Loss Up graph and table do not display measurements until results are received from the iPerf server at the end of the upstream test.
Note that the Packet Loss Up number could be much less than the Packet Loss Down number.
Uploading iPerf Results to Link-Live
To send your iPerf results to the Link-Live website, touch the action overflow button at the top right of the iPerf screen, and then touch Upload to Link-Live.
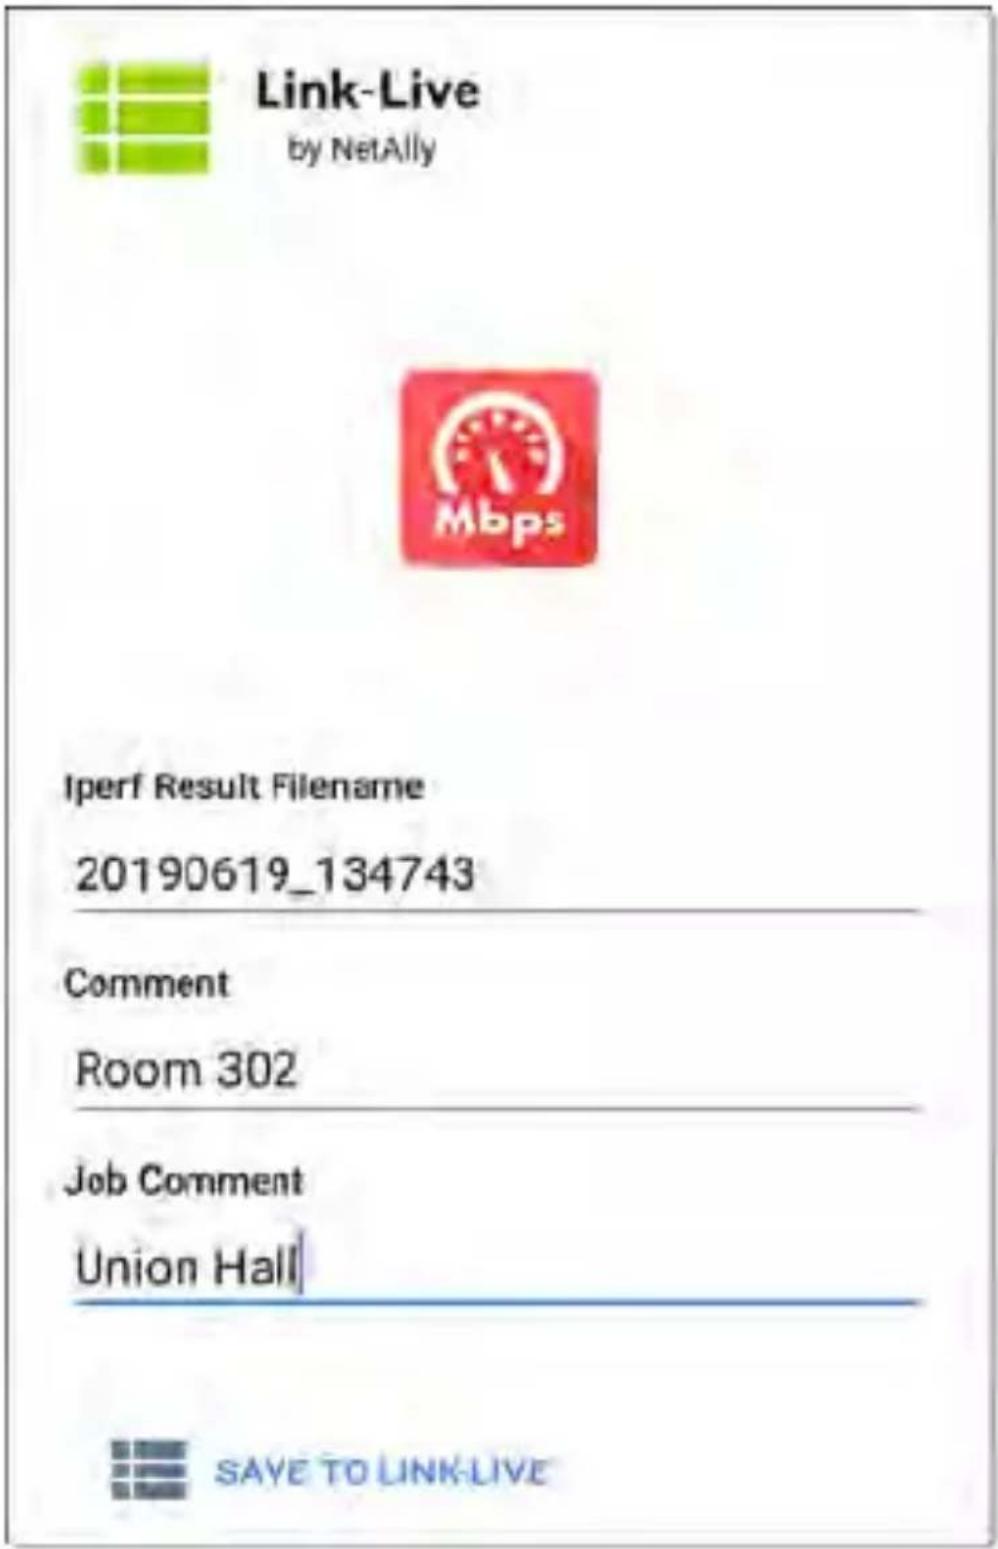
text_image
Link-Live by NetAlly Iperf Result Filename 20190619_134743 Comment Room 302 Job Comment Union Hall SAVE TO LINK-LIVEThe Link-Live sharing screen opens and allows you to revise the auto-generated filename and attach comments to the iPerf result, which will be displayed on the Results page on Link-Live.com.

natural_image
Green square icon with three horizontal white lines and a grid of three, resembling a menu or list symbol (no text or numbers present)Link-Live Cloud Service
text_image
Angela's EtherScope xG - 5300D0 File Edit View Help to FX4 Search Angela's EtherScope xG - 5300D0 File Edit View Help to FX4 Search Text Name: XXXX180000000000000000000000000000000000000000000000000000000000000000000000000000000000000 Origin: C21A/86x Origin: 8.5 Origin: -47.65% Origin: -92.45% Origin: -79.68 Link File Info: C21A/86x Foreign Name: 8.5 Origin: -47.65% Origin: -92.45% Origin: -79.68 Exchange Acquisition Method 2011.1.1 2012.1.1 2013.1.1 2014.1.1 2015.1.1 2016.1.1 2017.1.1 2018.1.1 2019.1.1 2020.1.1 2021.1.1 2022.1.1 2023.1.1 2024.1.1 2025.1.1 2026.1.1 2027.1.1 2028.1.1 2029.1.1 2030.1.1 2031.1.1 2032.1.1 2033.1.1 2034.1.1 2035.1.1 2036.1.1 2037.1.1 2038.1.1 2039.1.1 2040.1.1 2041.1.1 2042.1.1 2043.1.1 2044.1.1 2045.1.1 2046.1.1 2047.1.1 2048.1.1 2049.1.1 2050.1.1 2051.1.1 2052.1.1 2053.1.1 2054.1.1 2055.1.1 2056.1.1 2057.1.1 2058.1.1 2059.1.1 2060.1.1 2061.1.1 2062.1.1 2063.1.1 2064.1.1 2065.1.1 2066.1.1 2067.1.1 2068.1.1 2069.1.1 2070.1.1 2071.1.1 2072.1.1 2073.1.1 2074.1.1 2075.1.1 2076.1.1 2077.1.1 2078.1.1 2079.1.1 2080.1.1 2081.1.1 2082.1.1 2083.1.1 2084.1.1 2085.1.1 2086.1.1 2087.1.1 2088.1.1 2089.1.1 2090.1.1 2091.1.1 2092.1.1 2093.1.1 2094.1.1 2095.1.1 2096.1.1 2097.1.1 2098.1.1 2099.1.1 3 3 3 3 3 3 3 3 3 3 3 3 3 3 3 3 3 3 3 3 3 3 3 3 3 3 3 3 3 3 3 3 3 3 3 3 3 3 3 3 3 3 3 3 3 3 3 3 3 3 3Link-Live Cloud Service is a free, online system for collecting, tracking, organizing, analyzing, and reporting your test results. AutoTest results are automatically uploaded once your LinkRunner 10G is claimed.
The comprehensive LinkRunner 10G offers more features for analyzing your network in Link-Live than previous testers. Claim your LinkRunner to Link-Live.com to access these functions:
- Check for software updates and update your LinkRunner 10G software.
- Download third-party applications from the NetAlly App Store to use on your LinkRunner.
- Automatically upload AutoTest results each time you run AutoTest.
- Attach test and Job comments to Link-Live uploads, and automatically sort your results and files into folders in Link-Live.
- Upload test, discovery, and analysis results from the NetAlly apps, including Discovery, Path Analysis, and iPerf. See Link-Live and Testing Apps for more about uploading.
Getting Started in Link- Live Cloud Service
To start, create a user account at LinkLive.com, and sign in. You can open the LinkLive website in the LinkRunner's web browser to create and manage your account.
Quick Claiming on the Unit
- Open the Link-Live app, and touch CLAIM NOW on the app screen.
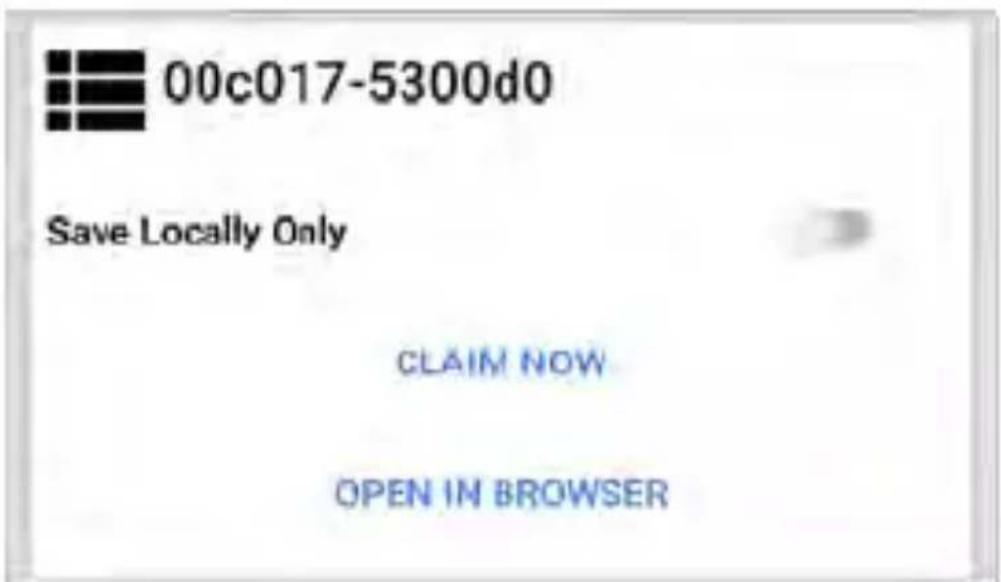
text_image
00c017-5300d0 Save Locally Only CLAIM NOW OPEN IN BROWSER- In the Link-Live claiming dialog, touch QUICK CLAIM.
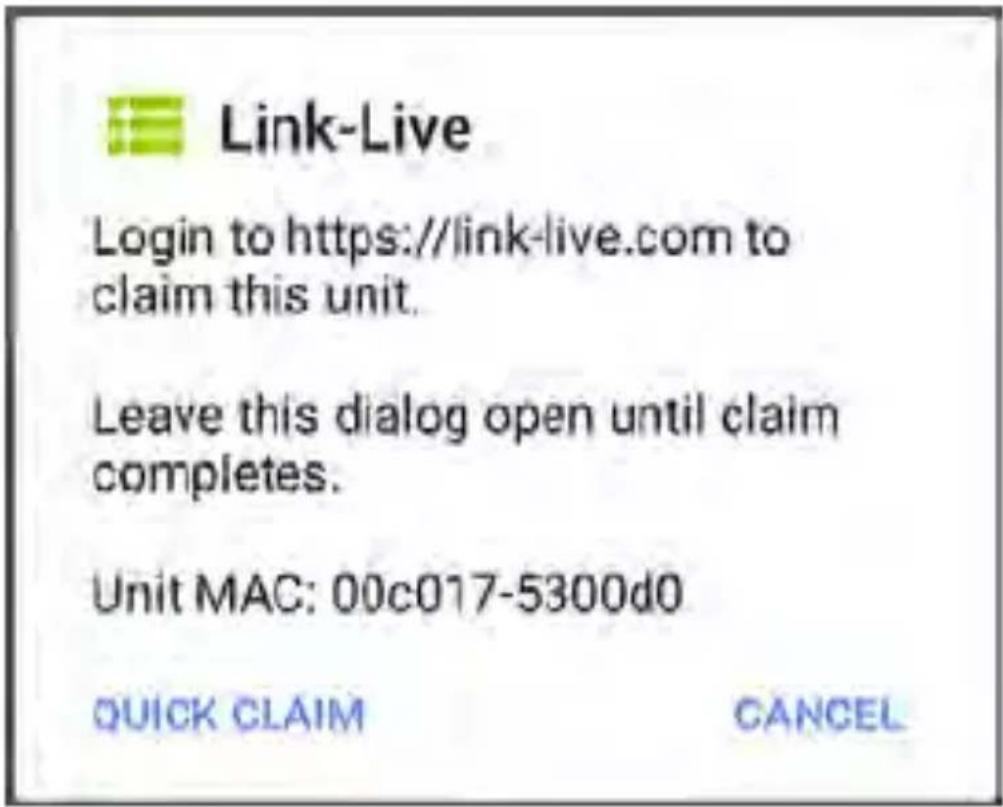
text_image
Link-Live Login to https://link-live.com to claim this unit. Leave this dialog open until claim completes. Unit MAC: 00c017-5300d0 QUICK CLAIM CANCELA web browser window opens to the LinkLive.com website.
- Sign in if you haven't already.
Once you are signed in, Link-Live attempts to claim your unit. You do not need to enter the MAC.
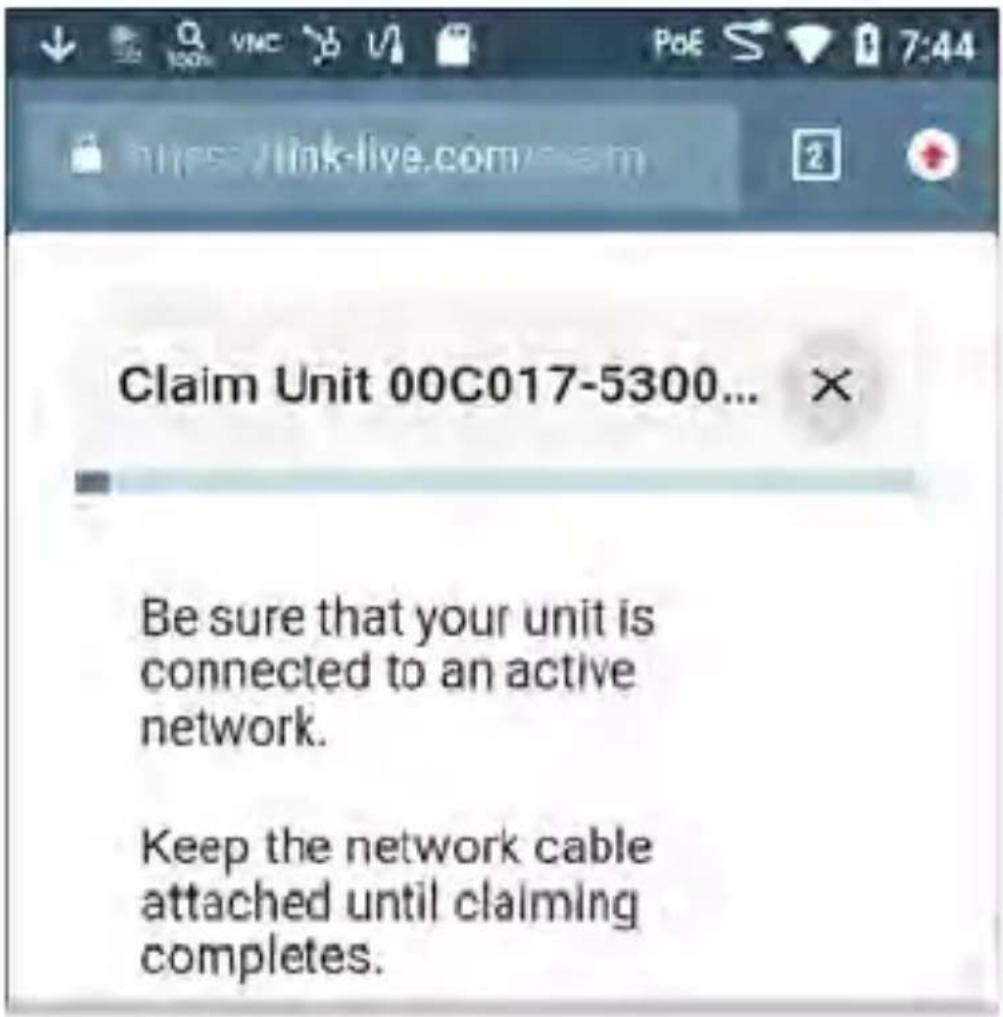
text_image
Claim Unit 00C017-5300... Be sure that your unit is connected to an active network. Keep the network cable attached until claiming completes.- If an Update is available, note the updating instructions, and touch CONTINUE.
- If desired, revise the name and description of your LinkRunner unit.
Claim Unit 00C017-530A... ×
Thomas's LinkRunner 10G-530AB0
D=0.16(%)
Unit with MAC address 00C017-530ABD
Otherwise, touch the × to finish the claiming process.
Claiming Manually
On Link-Live.com
- The first time you sign in to Link-Live.com, a pop-up window appears, prompting you to claim a device.
If you already have a user account and other devices claimed to Link-Live, navigate to the Units page from the left side navigation drawer, and click the Claim Unit button at the lower right corner of the screen.
- Then, select the LinkRunner 10G image, and follow the claiming instructions on the Link-Live website.
On the LinkRunner 10G Unit
- Open the Link-Live app. Your unit's MAC address is displayed.
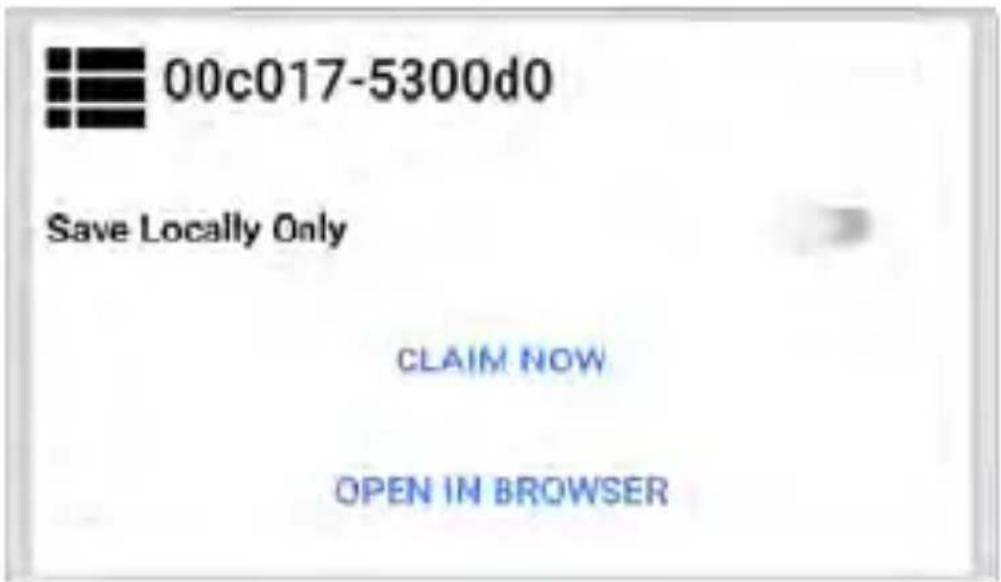
text_image
00c017-5300d0 Save Locally Only CLAIM NOW OPEN IN BROWSER- Touch CLAIM NOW on the Link-Live app screen.
- When prompted by the instructions on the Link-Live website, enter the MAC address.
After you claim your LinkRunner 10G to LinkLive, a software update may be available. If so a notification appears in the Status Bar.
Open the Top Notification Panel, and select the notification to update your unit.

Link-Live
Software Update Notification
Software update available.
See Updating Software for more information.
After Claiming
Once your LinkRunner is claimed to the Link-Live Cloud Service, it will automatically upload your AutoTest results each time you run AutoTest. You can also upload a test comment and a picture with your test results using the AutoTest Wired Profile's floating action buttons (FABs), and you can automatically sort your results into folders in Link-Live using test and Job comments.
If your LinkRunner is not connected to an active network, any test results, comments, or images are stored in memory (buffered) and uploaded once a connection is established.
For more information on how to the use the Link-Live.com website, click or touch the navigation menu icon at the top left of the Link-Live.com pages, and select? Support
Unclaiming
You may need to unclaim your unit from Link-Live to transfer it to another user or if you no longer want to send any information to Link-Live.com.
To unclaim your LinkRunner from Link-Live from your unit, open the About screen from the left-side navigation drawer in the Link-Live app, and touch UNCLAIM.

About

LinkRunner 10G Analyzer
Serial: 2008008
MAC Addresses
Wired: 00c017-530ab0
Wired Management: 00c017-530ab1
Wi-Fi Management: 74da38-afacd4
Versions
Software: 1.3.0.68
Android: 8.1.0
Android Build: 1.3.0.21
AllyCare: Enabled
Expires: 12/31/2020
SFP Details
Type: 1000BASE-SX (850 nm)
Vendor: AVAGO
Version: -
Model: AFBR-57M5AP2
Rx Power: -
UNCLAIM
EXPORT LOGE
Copyright 2019, 2020
NetAlly
Link-Live App Features
The main Link-Live app screen on your LinkRunner 10G facilitates the claiming process, displays Link-Live related information, and allows you to enable or disable Link-Live.com uploads as needed.
Link-Live App Screen
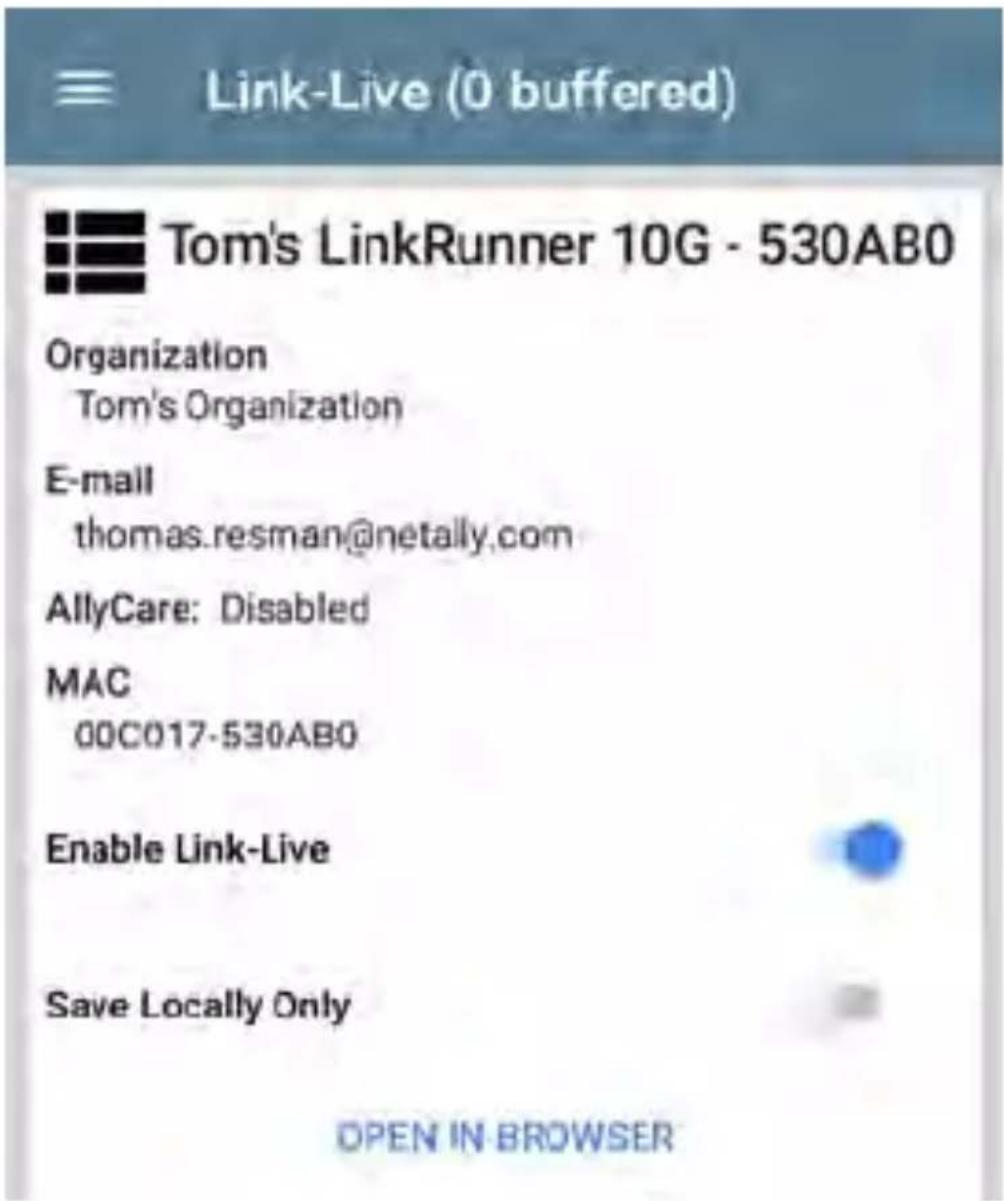
text_image
Link-Live (0 buffered) Tom's LinkRunner 10G - 530AB0 Organization Tom's Organization E-mail thomas.resman@netally.com AllyCare: Disabled MAC 00C017-530AB0 Enable Link-Live Save Locally Only OPEN IN BROWSERThe "(# buffered)" in the Link-Live screen header indicates the number of files stored in the device memory when no active network connection is available. The buffered file types are listed below the main app card.
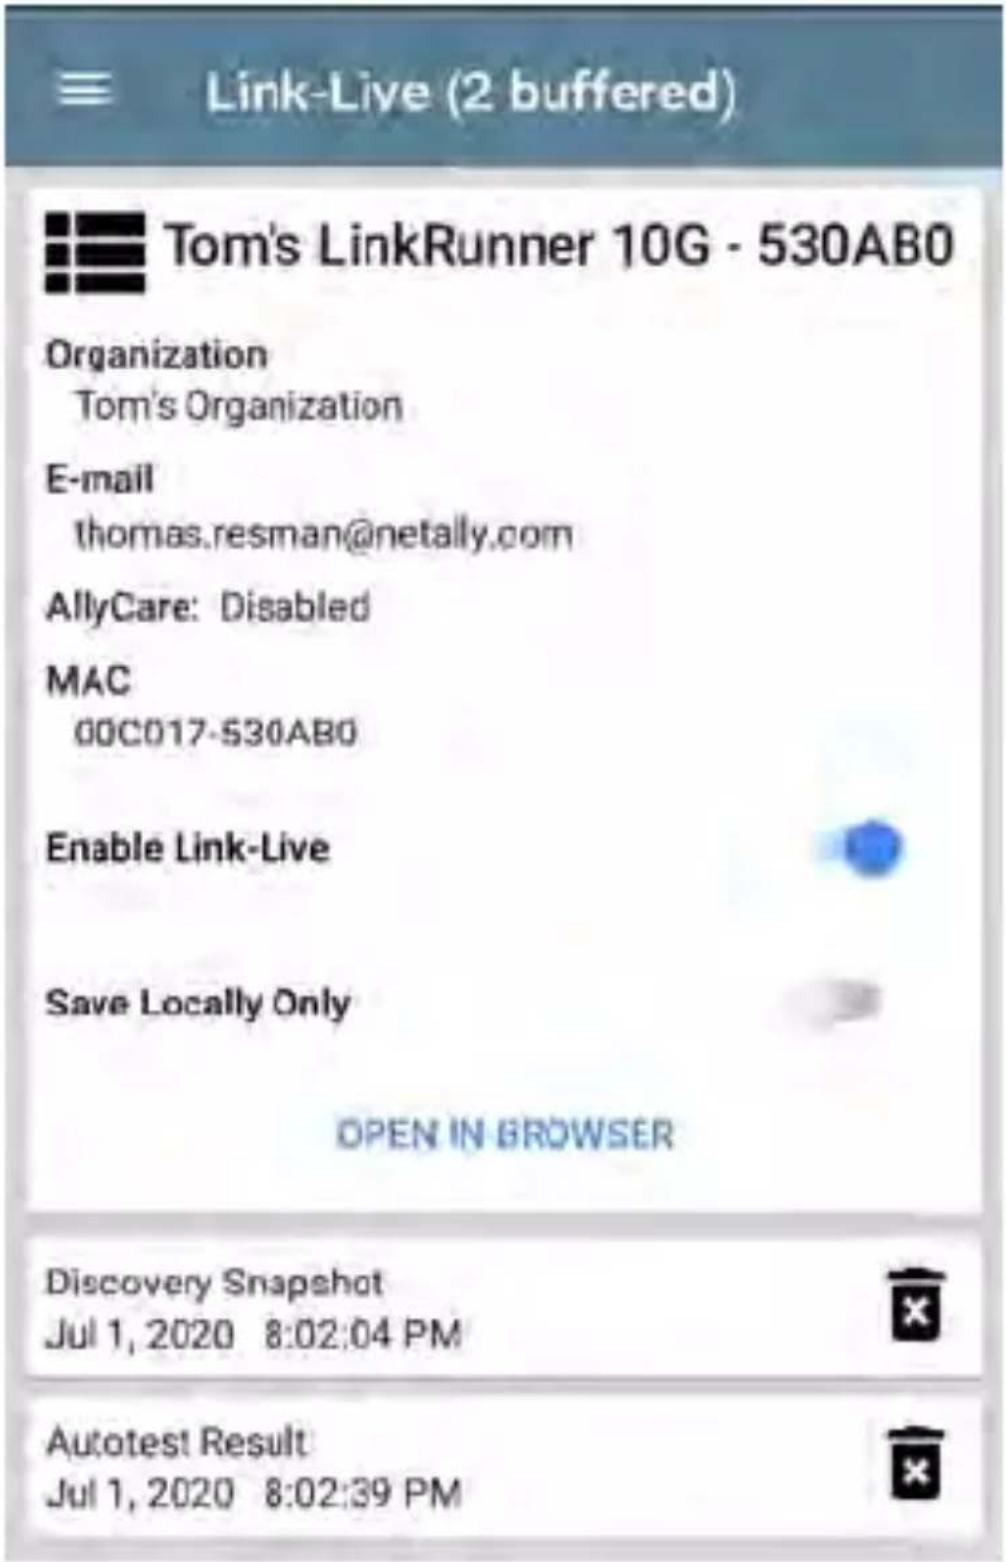
text_image
Link-Live (2 buffered) Tom's LinkRunner 10G - 530AB0 Organization Tom's Organization E-mail thomas.resman@netally.com AllyCare: Disabled MAC 00C017-530AB0 Enable Link-Live Save Locally Only OPEN IN BROWSER Discovery Snapshot Jul 1, 2020 8:02:04 PM Autotest Result Jul 1, 2020 8:02:39 PMThese will upload to Link-Live.com once your LinkRunner is connected to an active network.
The LinkRunner unit's name that displays on the Link-Live.com is shown to the right of the Link-Live icon. You can change this name on the Link-Live.com Units page.
Organization is the Link-Live organization where the unit is claimed.
E-mail is the first e-mail address assigned to the unit, which receives test result notification emails.
The Organization and Email address shown here are assigned on the Link-Live.com website The fields displayed in LinkRunner's Link-Live app are informational.
The Enable Link-Live toggle button turns the Link-Live features on or off. If Link-Live is disabled here, the LinkRunner cannot upload test results or check for software updates. The Upload to Link-Live options will not appear in the testing apps.
Touch the OPEN IN BROWSER link to open Link-Live.com on the LinkRunner's web browser.
Saving Locally Only
If you do not want to send your results to the Link-Live website, you can still save results locally to your LinkRunner as JSON files.
Touch the Save Locally Only toggle field in the Link-Live app to save the JSON files to your unit.
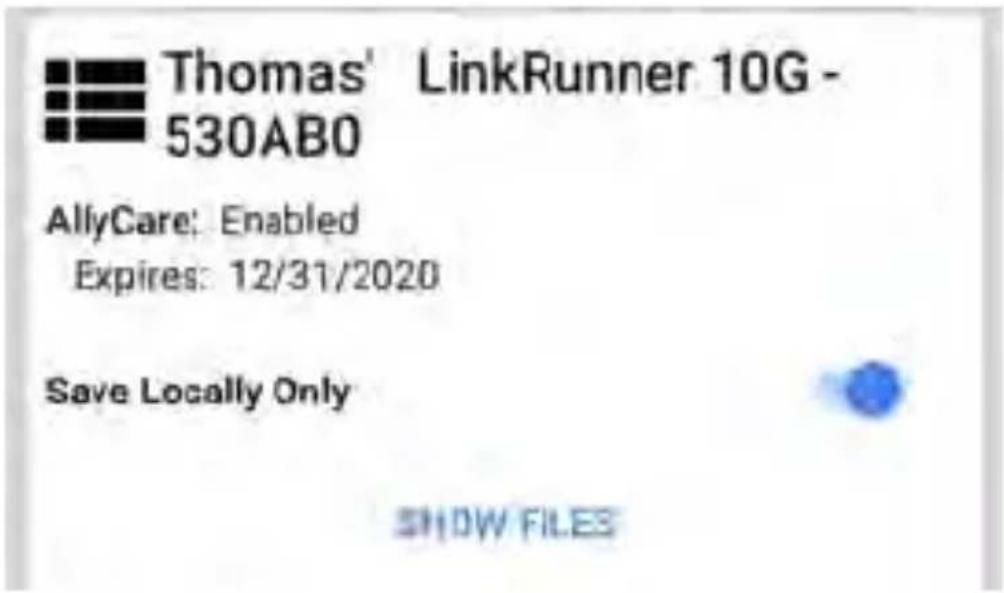
text_image
Thomas' LinkRunner 10G - 530AB0 AllyCare: Enabled Expires: 12/31/2020 Save Locally Only SHOW FILESSelect SHOW FILES to open the Files app. The .json files are saved in the Downloads > TestResults folder.
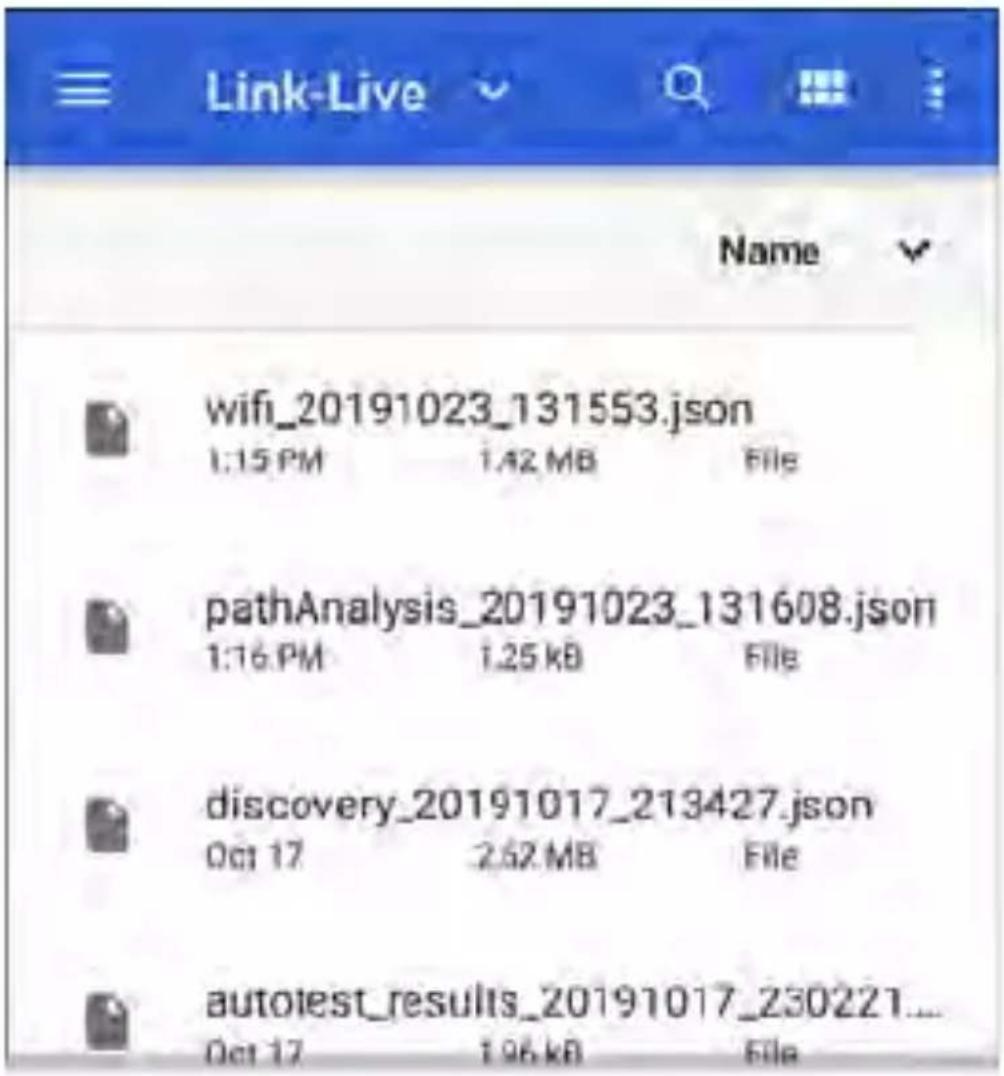
text_image
Link-Live Name wifi_20191023_131553.json 1:15 PM 1.42 MB File pathAnalysis_20191023_131608.json 1:16 PM 1.25 KB File discovery_20191017_213427.json Oct 17 2.62 MB File autotest_results_20191017_230221... Oct 17 1.96 kB FileSee the Managing Files topic for an overview of the Files app.
You can transfer the JSON files to a PC for analysis, or you can download a JSON viewer app from the App Store on your LinkRunner.
With Save Locally Only enabled, options for uploading or saving to Link-Live (described in the Link-Live and Testing Apps section below) will still display in the NetAlly testing apps.
However, the results will be saved to the internal Link-Live storage folder, and not uploaded to Link-Live.com.
Job Comment
The left-side navigation drawer for the Link-Live app lets you enter or change the Job Comment The Job Comment attaches to all test results and files uploaded to Link-Live, until you change or delete it. In contrast, other Comments, like those attached to Wired AutoTest profiles or Discovery results, are only attached to one set of test results or uploaded file.
Both comment types appear on Link-Live sharing screens like the one below:
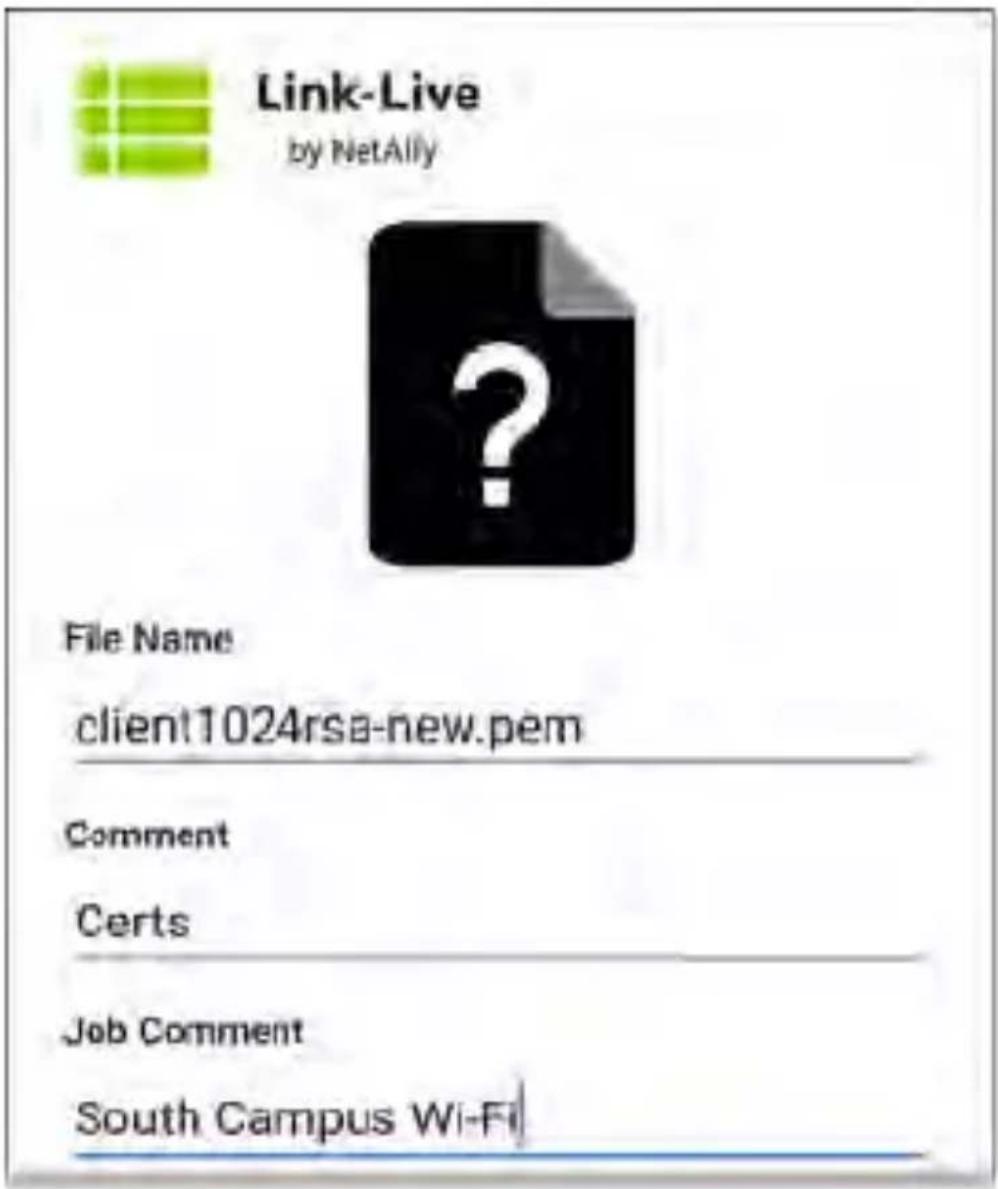
text_image
Link-Live by NetAlly File Name client1024rsa-new.pem Comment Certs Job Comment South Campus Wi-FiTo enter or change the Job Comment in the Link-Live app:
- With the Link-Live app open, touch the menu icon or swipe right from the left side of the screen.
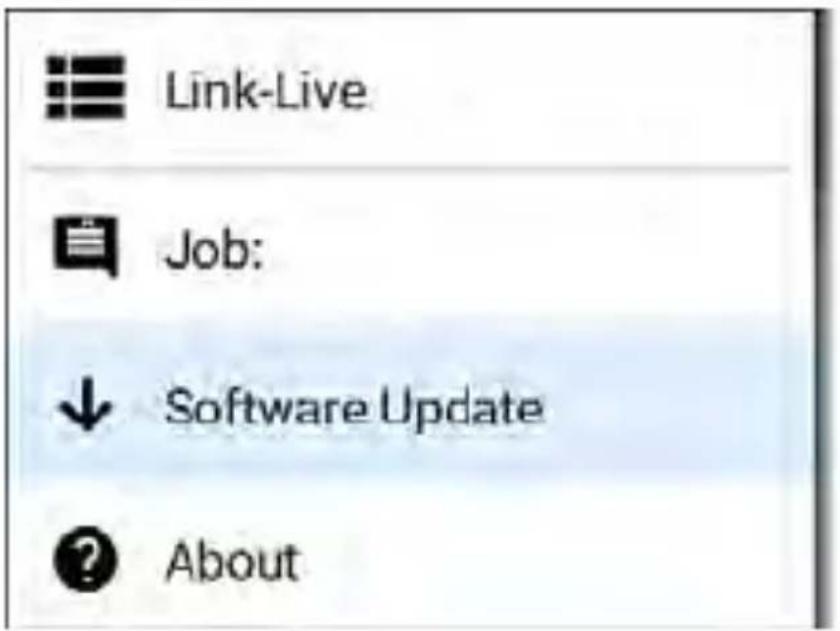
text_image
Link-Live Job: Software Update About- Touch the Job: field.
- Enter a comment in the dialog box.
- Touch SAVE.
Note that the Job Comment field appears in other Link-Live sharing screens, allowing you to change it from multiple locations on the LinkRunner. No matter where you change the Job Comment, it is updated everywhere on the unit.
Software Updates
The left-side navigation drawer for the Link-Live app also lets you check for and download any available software updates. See Updating Software in the Software Management chapter.
Link-Live and Testing Apps
Once your unit is claimed, the Link-Live app works with several of the testing apps to upload test results, discovery and analysis data comments, and images to the Link-Live website Link-Live.com categorizes the uploads from different apps on corresponding webpages, as shown below:
| LINK-LIVE WEBPAGE | APP UPLOADS | |
 | Results | AutoTest,Performance,iPerf,and Cable Test resultsImages,Connection Logs,andother files when saved to a test result |
 | Uploaded Files | Captures,Images,Connection Logs,and other file types |
 | Analysis | Discovery and Path Analysis results |
If your unit is not claimed to Link-Live.com or if Link-Live is disabled on the app screen, the links and buttons for uploading to Link-Live in the testing apps will not appear.
Link-Live Sharing Screens
Save to Link-Live

UPLOAD TO LINK-LIVE
Whenever you select a button or link, like those above, to Upload, Save, or Share to Link-Live, Link-Live sharing screen appears with the appropriate options for the data type.
For example, the Link-Live sharing screen for Discovery app data allows you to upload to the Analysis page on Link-Live.com.
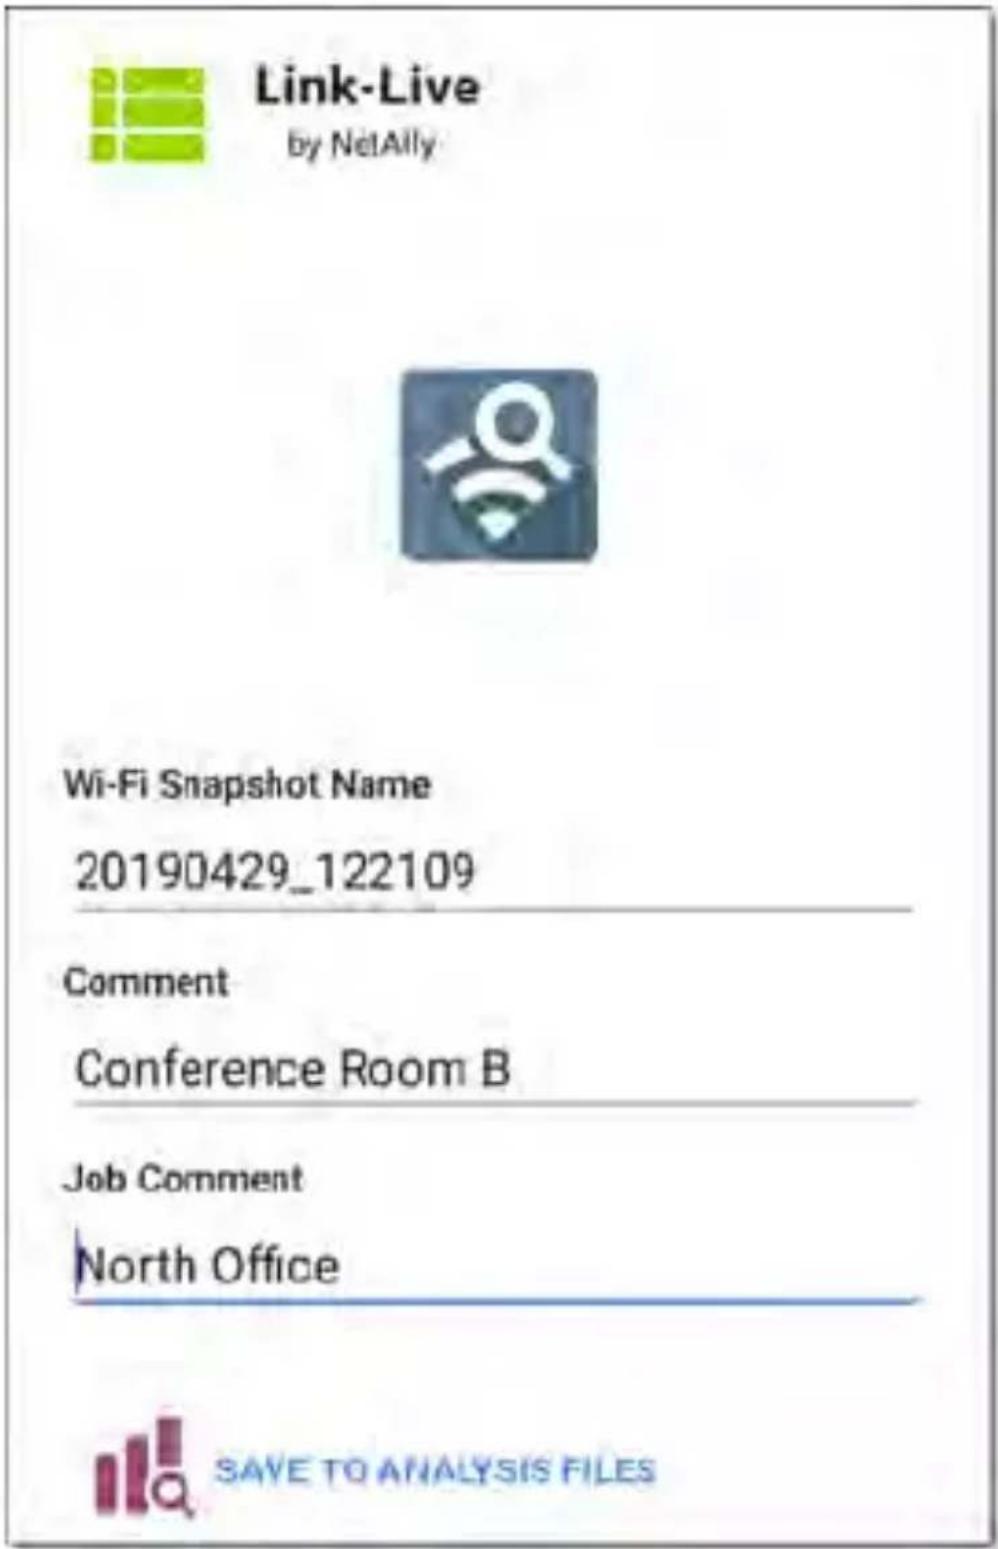
text_image
Link-Live by NetAlly Wi-Fi Snapshot Name 20190429_122109 Comment Conference Room B Job Comment North Office SAVE TO ANALYSIS FILESThe Link-Live sharing screen for a screenshot of other image allows you to attach it to the most recently run (AutoTest, iPerf, or Cable) test result on the Results page, or just to the Uploaded Files page on Link-Live.com.
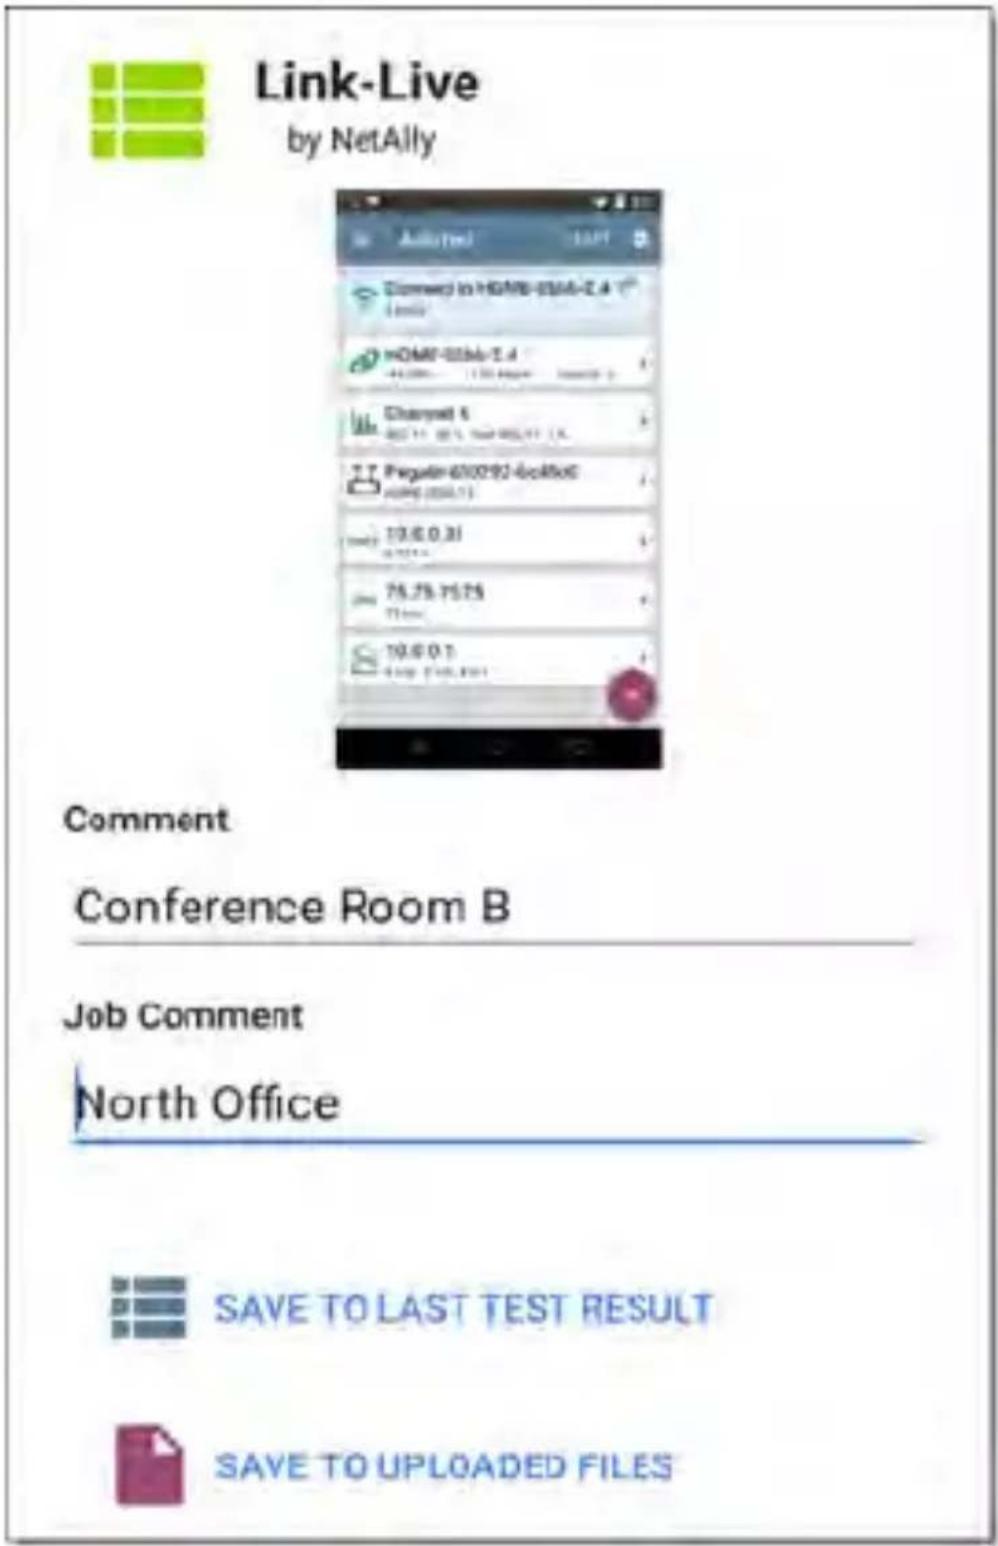
text_image
Link-Live by NetAlly Comment Conference Room B Job Comment North Office SAVE TO LAST TEST RESULT SAVE TO UPLOADED FILESRemember, the regular Comment field uploads only to the current result or file, while the Job Comment field uploads with all results and file until you change it.
Sharing a Text File to Link-Live
You can also select and share text by long pressing text on the unit's screen. Text files are attached to the last test results on Link-Live.com.
- Long press a text string to select it.
text_image
AUTOTest COPY SHARE SELECT ALL 0 SSID: HOME-0366-2.4 Security: WPA2-P Roams: 0 AP: Pegatn:600292-bc48c0 RSSID: Pegatn:600292-bc48c0- Touch Select All if needed.
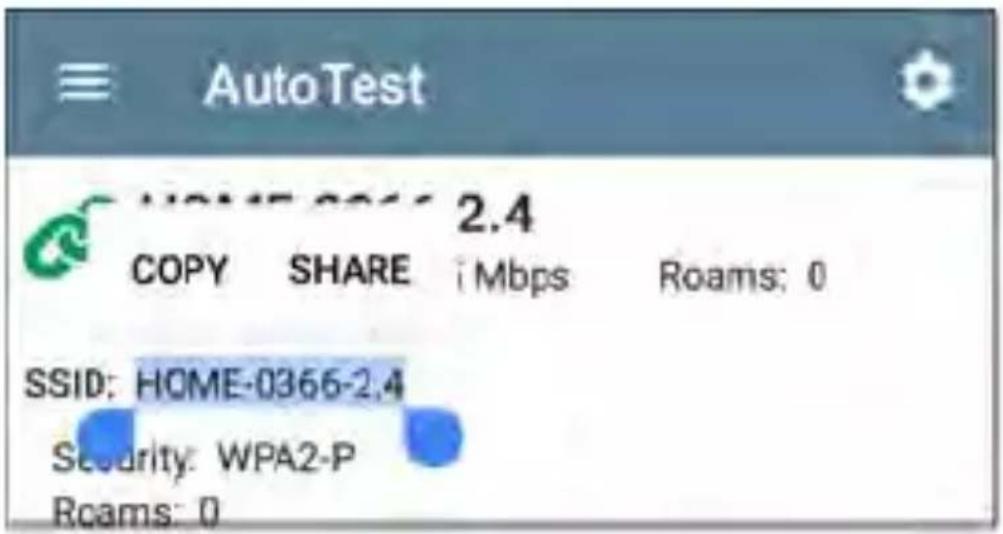
text_image
AutoTest HOME 0366 2.4 COPY SHARE i Mbps Roams: 0 SSID: HOME-0366-2.4 Security: WPA2-P Roams: 03. Touch SHARE.
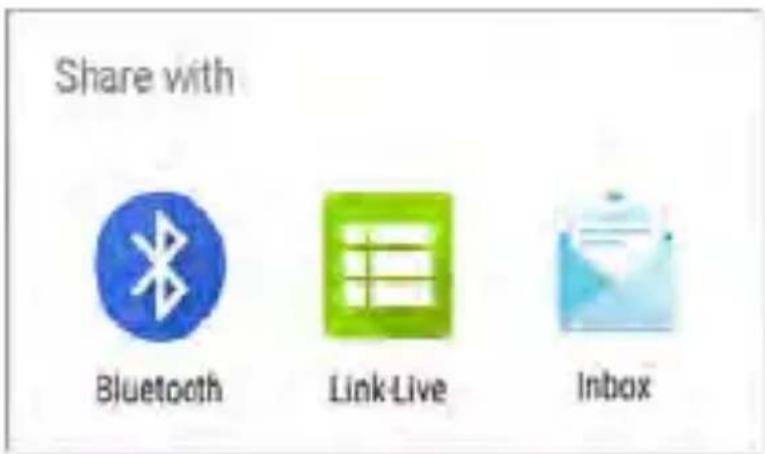
text_image
Share with Bluetooth Link-Live Inbox- Select the Link-Live icon to open the Link-Live sharing screen.
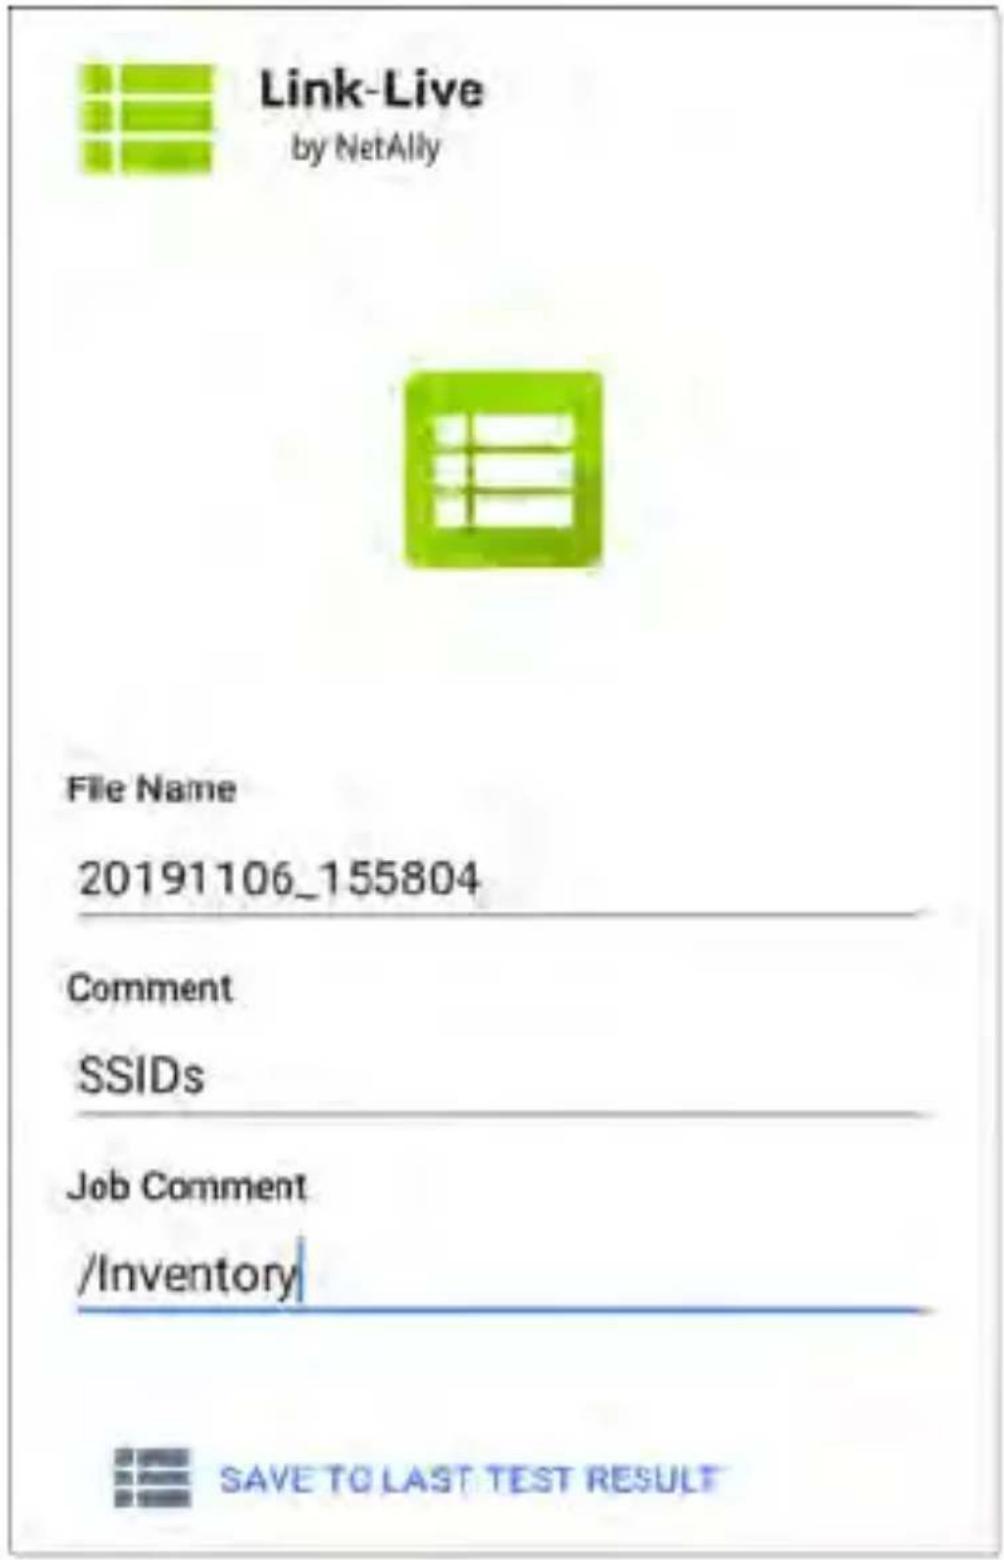
text_image
Link-Live by NetAlly File Name 20191106_155804 Comment SSIDs Job Comment /Inventory SAVE TO LAST TEST RESULT- Format any comments as needed, and then touch SAVE TO LAST TEST RESULT.

natural_image
Green square icon with a white curved arrow pointing right (no text or symbols)Cable Test App
LinkRunner 10G's Cable Test can help you determine cable length and fault status, verify wiremapping of patch and structured cabling, and locate cable connections using toning. The cable testing port is the RJ-45 port on the left side of the LinkRunner unit. Connect a cable to this port for testing and tracing with the tone function.
Cable Test Settings
The only setting that affects the Cable Test app is the Distance Unit setting, which designates Feet or Meters. This setting is contained in the General Settings menu.
- To access General Settings, touch the menu icon on the Cable Test app screen, and select General Settings.
text_image
Cable Test General Settings About-
Scroll to the bottom of the Settings list under the Preferences heading.
-
Tap the Distance Unit field, and select either Feet or Meters as needed, then touch OK.
Running Cable Test
Refer to LinkRunner 10G's Buttons and Ports as needed.
- With an open or unterminated cable connected to the RJ-45 cable test port (left side of the unit), you can measure length, identify shorts and splits, and locate opens.
- Using a cable terminated with a WireView Cable ID accessory, you can measure cable length and identify shorts, opens, split pairs, crossover cables, normal or negative pair polarity, and shielded cables.
- LinkRunner 10G cannot perform a cable test on a cable that is connected to a switch; however, you can still use the toning function to trace the cable to the connected port.
- Additionally, you cannot run a cable test or use the toning feature if the unit detects voltage on the connected cable. The lightning bolt icon on the Cable Test screen indicates detected voltage.
natural_image
Simple diagram showing a device with a blue horizontal bar and a green highlighted section, no text or symbols present.To start the cable test, tap START at the top right of the Cable Test app screen.
Open Cable TDR Testing
LinkRunner 10G can measure the length of a cable and detect some faults by measuring the electrical reflections of the cable using Time Domain Reflectometry (TDR). Connect an open cable (unterminated) into the RJ-45 port on the left side of the LinkRunner unit to measure its length and view any shorts, opens, or splits.
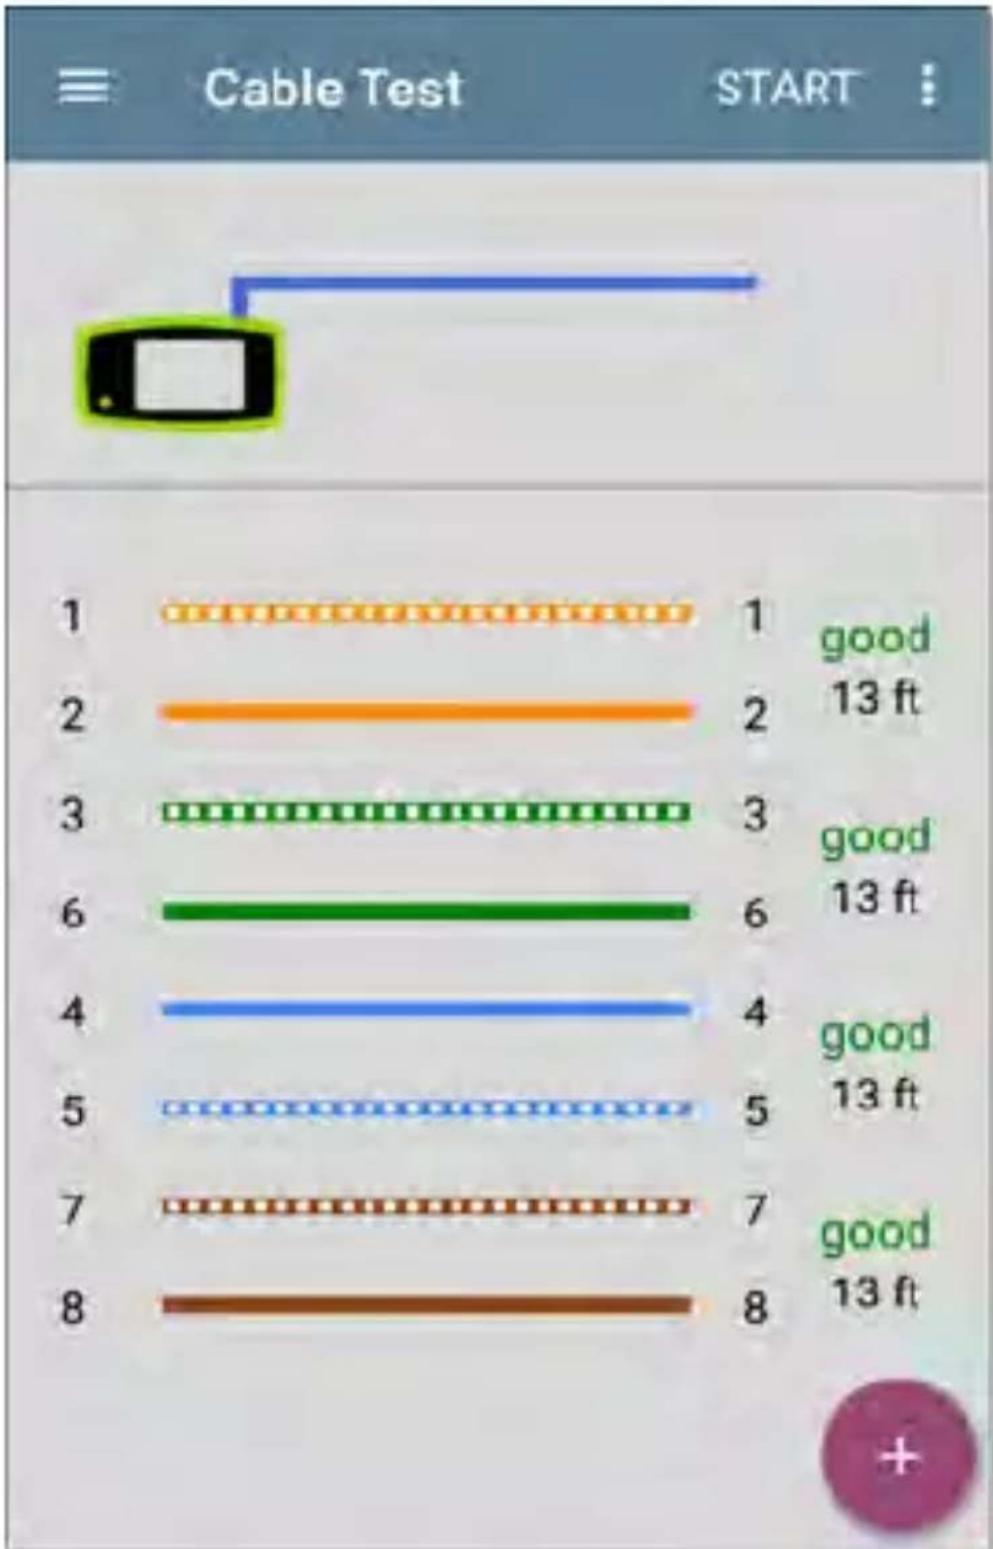
bar
| Category | Value | | -------- | ----- | | 1 | 13 ft | | 2 | | | 3 | | | 6 | 13 ft | | 4 | | | 5 | 13 ft | | 7 | | | 8 | 13 ft |When a cable has no detected faults, "good" is shown next to each pair above the length measurement. Cable tests that detect a "split" or "open" in the cable also display the corresponding words.
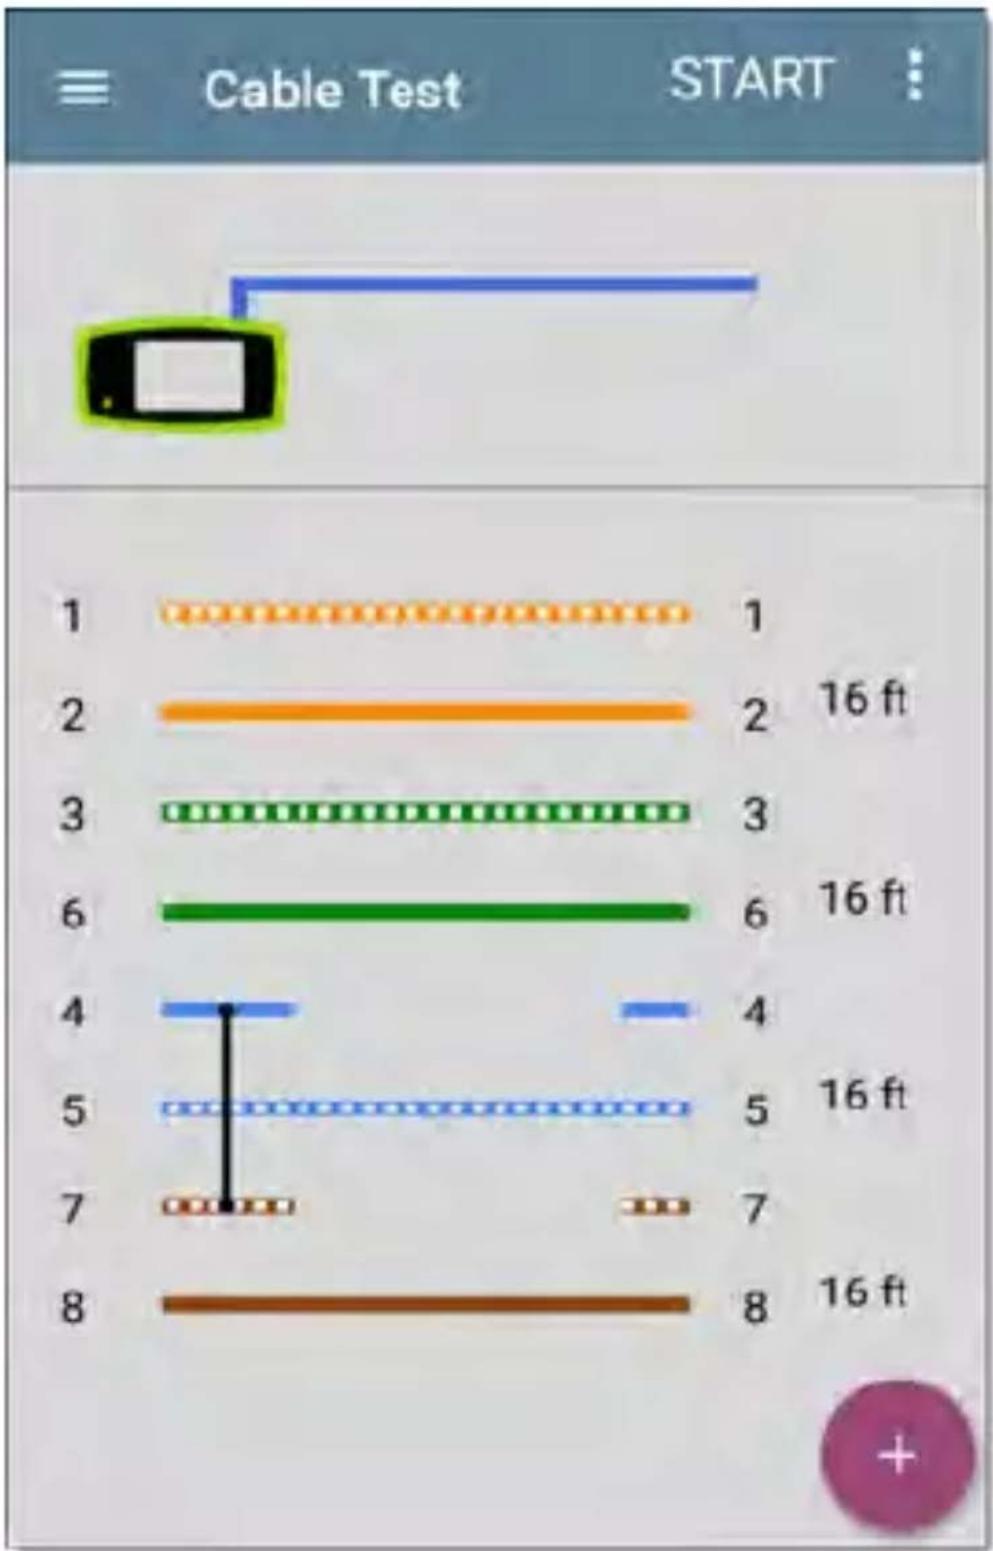
bar
| Category | Value | | -------- | --------- | | 1 | 16 ft | | 2 | 16 ft | | 3 | 16 ft | | 4 | 16 ft | | 5 | 16 ft | | 6 | 16 ft | | 7 | 16 ft | | 8 | 16 ft |This unterminated cable test image shows a shorted cable between pins 4, 5, and 7.
Terminated WireView Testing
Using a WireView accessory provides more detailed, per-wire results. A WireView #1 is included with your LinkRunner 10G. Additional WireViews 2-6 are available for purchase.
To run a terminated cable test, connect the left side RJ-45 port to a cable terminated with an external WireView Cable ID accessory.
The terminated cable test screen displays the number of the WireView attached, unless a cable fault prevents the LinkRunner from detecting the WireView.
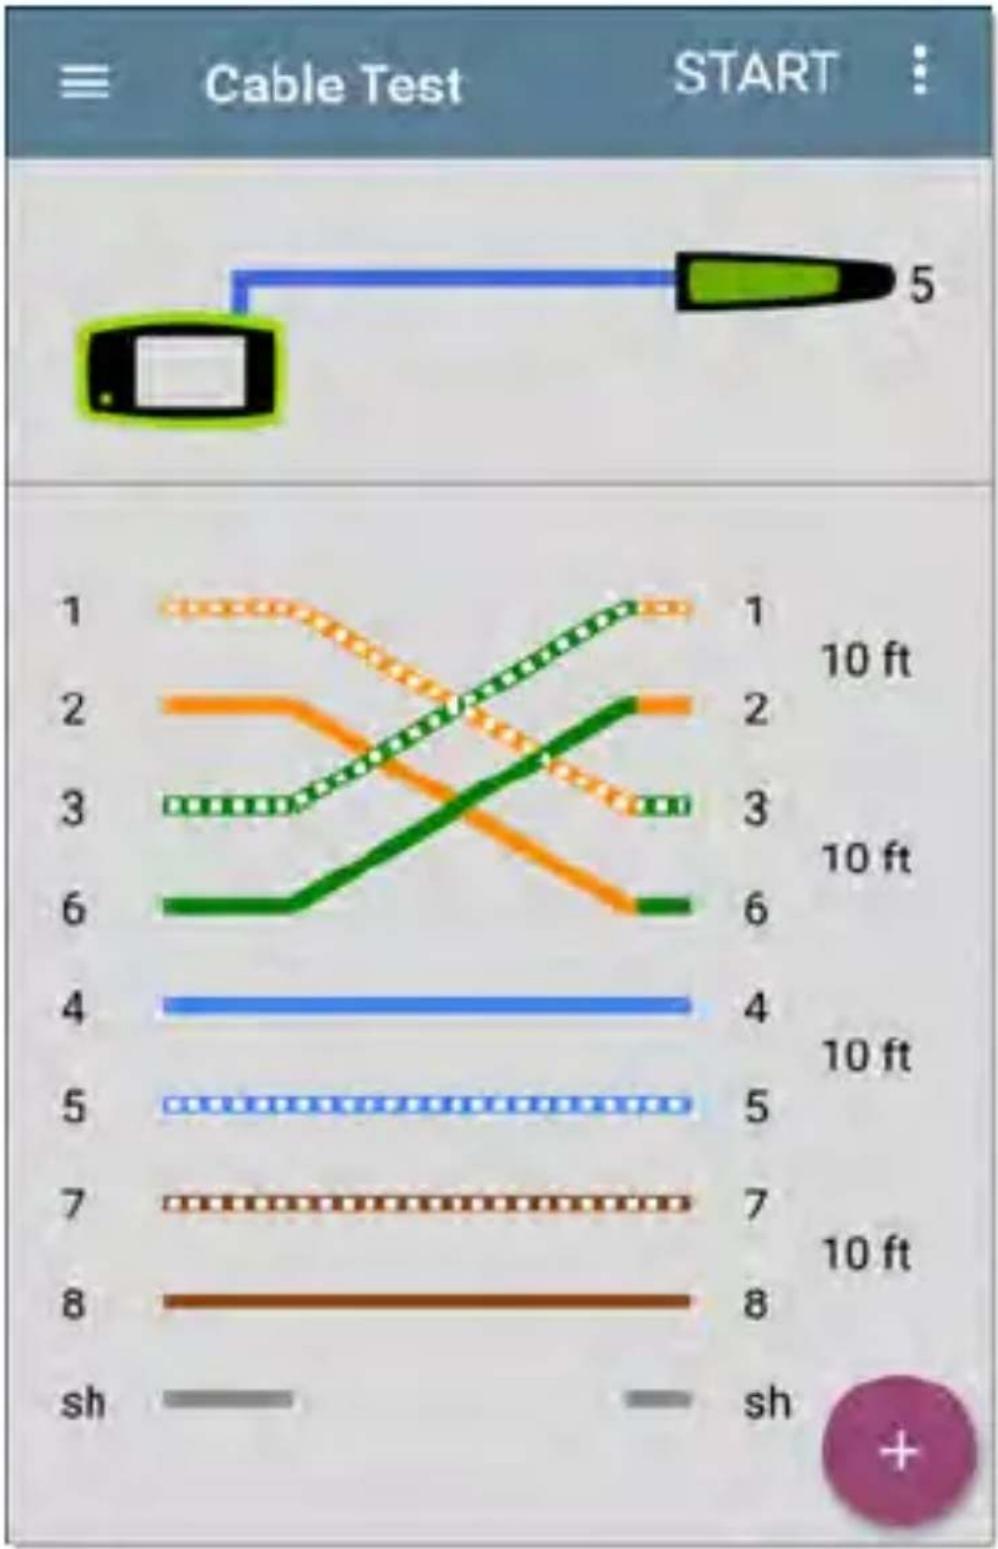
line
| Line | Time (ft) | |------|-----------| | 1 | 10 | | 2 | 10 | | 3 | 10 | | 4 | 10 | | 5 | 10 | | 6 | 10 | | 7 | 10 | | 8 | 10 | | sh | 10 |The image above indicates a crossover between pairs 1, 2 and 3, 6 and a WireView accessory number 5.
The last row of WireView results indicates whether the cable is shielded: an unbroken line between sh means a shielded cable is detected

text_image
sh shToning Function
You can also trace a cable using a Fluke Networks* IntelliTone™ Probe, or any analog probe, and the Tone function.
Connect a cable into the left side RJ-45 port, touch the FAB, and select the appropriate Tone option for your probe. The LinkRunner 10G emits the tone through the cable, and the probe detects it, allowing you to trace the wire or locate it in the switch closet.
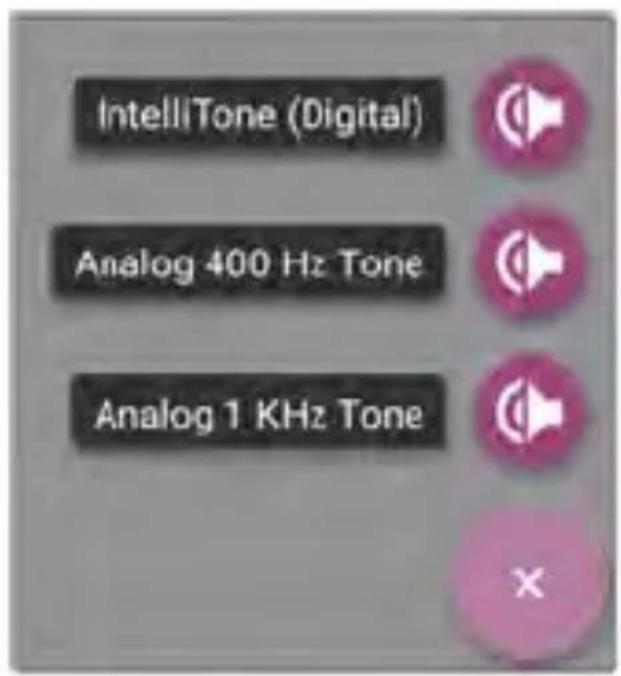
text_image
IntelliTone (Digital) Analog 400 Hz Tone Analog 1 KHz ToneUploading Cable Test Results to Link-Live
Touch the action overflow icon at the top right of the Cable Test screen, and select Upload to Link-Live to send the current Cable Test result to the Results page on Link-Live.com.
See the Link-Live chapter for more information.
Specifications and Compliance
Required compliance information is contained in this chapter.
Specifications
General
| Dimensions | 4.05 in x 7.67 in x 2.16 in (10.3 cm x 19.5 cm x 5.5 cm) |
| Weight | 1.677 lbs (0.76 kg) |
| Battery | Rechargeable lithium-ion battery pack (7.2 V, 6.4 Ah, 46 Wh) |
| Battery Life | Typical operating life is 3-4 hours (infinite on PoE). Typical charge tim is 3 hours. |
| Display | 5.0-inch color LCD withcapacitive touchscreen (720 x 1280 pixels) |
| Host Interfaces | RJ-45 Cable Test and Management PortUSB Type-A PortUSB Type-C On-the-Go Port |
| SD Card Port | Supports Micro SD card storage |
| Memory | Approximately 8 GB available for storing test results and user applications |
| Charging | USB Type-C 45-W adapter:AC Input Power 100-240 V, 50-60 HzDC Output Power 15 V (3 A) |
| Media Access | Copper: 10M/100M/1G/2.5G/5G/10GFiber SFP Adapters: 1G/10GBASE-X |
| Cable Test | Pair lengths, opens, shorts, splits,crossed, straight through, and WireView ID |
| Tone Generator | Digital tone: [455 KHz];Analog tones: [400 Hz, 1 KHz] |
| LEDs | 2 LEDs (Activity and Link Indicators) |
Environmental Specifications
| Operating Temperature | 32°F to 113°F (0°C to +45°C)NOTE: The battery will not charge if the internal temperature of the unit is above 113°F (45°C). |
| Operating relative humidity (% RH without condensation) | 90% (50°F to 95°F; 10°C to 35°C) 75% (95°F to 113°F; 35°C to 45°C) |
| Storage Temperature | -4°F to 140°F (-20°C to +60°C) |
| Shock and vibration | Meets the requirements of MIL PRF-28800F for Class 3 Equipment |
| Safety | IEC 61010-1:2010: Pollution degree 2 |
| Altitude | Operating: 4,000 m;Storage: 12,000 m |
Certifications and Compliance
CAUTION: Changes or modifications not expressly approved by the party responsible for compliance could void the user's authority to operate the equipment.
| CE | Conforms to relevant European Union c ectives. |
| Conforms to relevant Australian Safety and EMC standards. | |
| FC | Complies with47 CFR Part 15 require-ments of the U.S.Federal Com-munications Commission. |
| C US® | Listed by the Canadian Standards Asso-ciation. |
Industry Canada Class A emission compliance
This device is not capable of transmitting in 5600-5650 MHz. This restriction is for the protection of Environment Canada's weather radars operating in this band.
This device complies with part 15 of the FCC Rules. Operation is subject to the following two conditions: (1) This device may not cause harmful interference, and (2) this device must accept any interference received, including interference that may cause undesired operation.
| EMC | IEC 61326-1:2013: Basic Electromagnetic Environment; CISPR 11: Group 1, Class A |
Group 1: Equipment has intentionally generated and/or uses conductively-coupled radio frequency energy that is necessary for the internal function of the equipment itself.
Class A: Equipment is suitable for use in all establishments other than domestic and those directly connected to a low-voltage power supply network that supplies buildings used for domestic purposes. There may be potential difficulties in ensuring electromagnetic compatibility in other environments due to conducted and radiated disturbances.
Accessory Information: Adapter Model No.: FSP045-A1BR Input: AC 100-240 V, 50/60 Hz 1.2 A Output: DC 15 V, 3 A
Battery: 3250 mAh, 7.2 V 6.4 Ah