OTDR-1500 - Uncategorized Jonard Tools - Free user manual and instructions
Find the device manual for free OTDR-1500 Jonard Tools in PDF.
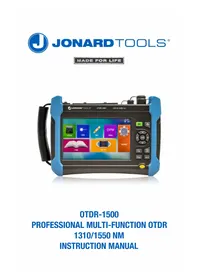


| Product Type | Optical Time Domain Reflectometer (OTDR) |
| Brand | Jonard Tools |
| Model | OTDR-1500 |
| Application | Fiber optic cable testing, fault location, and link loss measurement |
| Wavelengths | 1310 nm and 1550 nm |
| Dynamic Range | 32 dB at 1310 nm; 30 dB at 1550 nm |
| Distance Range | Up to 100 km |
| Event Dead Zone | ≤ 0.8 m |
| Attenuation Dead Zone | ≤ 4 m |
| Pulse Width | 10 ns to 10 μs (auto or manual) |
| Measurement Time | User-selectable averaging time (5 s to 60 s) |
| Display | 7-inch high-resolution color touchscreen |
| Interfaces | USB host/device, Ethernet, Micro SD card slot |
| Power Supply | Rechargeable Li-ion battery (11.1 V, 4400 mAh) |
| Battery Life | Up to 8 hours of continuous operation |
| Dimensions | 250 mm × 150 mm × 60 mm |
| Weight | 1.5 kg (including battery) |
| Operating Temperature | −10°C to +50°C |
| Storage Temperature | −20°C to +60°C |
| Safety Class | Class 1 laser product (eye-safe) |
| Maintenance | Annual calibration recommended |
| Cleaning | Use optical-grade cleaning tools and lint-free wipes |
| Accessories Included | Carrying case, AC charger, USB cable, SC/PC optical adapter, user manual |
| Spare Parts | Replaceable battery, AC charger, optical adapters |
| Repair and Service | Service via official Jonard authorized repair centers |
Frequently Asked Questions - OTDR-1500 Jonard Tools
User questions about OTDR-1500 Jonard Tools
0 question about this device. Answer the ones you know or ask your own.
Ask a new question about this device
Download the instructions for your Uncategorized in PDF format for free! Find your manual OTDR-1500 - Jonard Tools and take your electronic device back in hand. On this page are published all the documents necessary for the use of your device. OTDR-1500 by Jonard Tools.
USER MANUAL OTDR-1500 Jonard Tools
OTDR-1500 PROFESSIONAL MULTI-FUNCTION OTDR 1310/1550 NM INSTRUCTION MANUAL
SAFETY REQUIREMENTS
SOFTWARE DOWNLOAD
URL: https://jonard.com/OTDR-1500
WARNING
To avoid eye damage, DO NOT look directly at the optical interface nor the end of the optical fiber. To reduce risk of fire or electrical shock, do not use this device in thunderstorms or humid environments. Do not attempt to open the housing of this device. If repairs are needed, it must be repaired by the manufacturer.
ATTENTION
Battery: The charging voltage and current of the battery is 15V and 4A, between 5° C \~ 40° C. If ambient temperature exceeds this range, charging will terminate. The device should also be charged at least once every month to maintain battery performance. Use the included power supply (or another similar one) to prevent any damage to the battery.
Fiber End Face Cleaning: Before testing, clean the end face of the fiber optic cable using lint-free wipes and fiber optic cleaning fluid. We recommend using our TK-182 Fiber Optic Connector Cleaning kit to do so.
LCD Touchscreen: The display of this device is a 7 inch color LCD touchscreen. To maintain the integrity of the screen, use a lint-free wipe or soft fabric to wipe away any dirt or grime. If more serious cleaning is required, high grade isopropyl alcohol is recommended.
Do not disassemble any part of the device without permission.
Do not disassemble any parts of the device except those parts which are allowed to be replaced by the user as stated in this manual. Replacement parts and internal adjustment can only be carried out by Jonard Tools ® , or by its authorized maintenance personnel.
TABLE OF CONTENTS
Introduction 1
Contents 2
Warnings 3
Maintenance 5
OTDR Module 7
Optical Power Meter (OPM) Module 9
Optical Light Source (OLS) Module 10
How to Interpret Results 15
Main Menu & Fuction Overview 17
Application Method 18
OTDR Module Test Modes 20
Read File 26
Save File 27
FAQ's & Troubleshooting 28
Reasons for Failure of Curve Test & Analysis 29
Technical Features & Specifications 33
Appendix 35
INTRODUCTION
The OTDR-1500 Professional Multi-Function OTDR is a multifunctional test device designed for FTTx networks. It is primarily used to measure the length, transmission loss, joint loss and other physical properties of optical fiber, as well as locate event points or fault points in optical fiber lines.
The main functions and features of this optical time domain reflectometer are:
• 1.5m ultra-short event blind area, easy to test optical fiber cables.
- Minimum 2.5 cm sampling resolution for accurately locating event points.
- 32/30dB large dynamic range & 256k data sampling points, capable for long-distance multi-branch communication network testing.
- Bidirectional analysis and macro-bending analysis function.
- Built-in visual red light fault locator (VFL), optical power meter, and light source
• Single and multi-module integrated test function.
- Advanced anti-reflection LCD, ensuring clear and visible display interface in field environment.
• A variety of test modes, touch screen and shortcut key operation.
• Automatic fiber monitoring.
- Remote control.
• Bellcore GR196 and SR-4731 file formats are supported.
- OTDR optical output connector type can be changed at will, ensuring easy end face cleaning
CONTENTS
• OTDR Device (8 Gb Storage)
- Power Adapter
• FC/APC Adapter for OTDR Module
• SC/APC Adapter for OTDR Module
• LC/UPC Adapter for OPM & OLS Modules
- Instruction Manual
- Carrying Case
• Downloadable Software for OTDR Interface
WARNINGS
Power Supply
- External DC power supply must meet the following requirements: 14V \~ 20V and greater than 1.5A; polarity: center is positive. Using too high voltage will damage the device.
Internal Battery
- The internal battery is a dedicated lithium-ion battery. The use of other batteries will damage the device and endanger the user's personal safety.
- For safety reasons, do not dismantle the battery pack to avoid short circuiting. Do not slam the battery or put the battery into or close to the source of fire and strong heat, so as to avoid explosion.
- Please use the adapter provided by our company to power the device. Using other adapters may cause damage to the device.
Laser Safety
- The safety level of the laser used in this device is: CLASS1 LASER PRODUCT: 21 CFR 1040.10 or CLASS 3A LASER PRODUCT: IEC 60825-1:Ed.2:2001
- Although the output intensity of the laser used in this device is within the safe range, it may still damage your eyesight.
- Do not look directly at the optical output connector of the OTDR and do not look directly at the end of the optical fiber during testing.
- When the device's VFL function is on, do not look directly at the output port of the VFL light source or at the end of the optical fiber connected to the VFL output.
OTDR Operation
- Never connect live optical fiber to the test port of OTDR. Otherwise, it will lead to inaccurate measurement results and permanent damage to the device.
- Please ensure that all optical fibers tested by this device are not live.
ADDITIONAL PRECAUTIONS
Internal Battery
- In order to give full play to the performance of the battery, at the beginning of using the device, the internal battery should be used until the battery level is depleted. After, the battery should be charged to full.
- If you need to use the external power supply for a long time, please take out the internal battery and store it properly. Charging a battery for too long can reduce battery life and even cause battery damage.
- When the battery is stored for a long time (more than 6 months), the temperature range shall be -20°C 45°C . For short-term storage (storage time less than or equal to 6 months), the temperature range of the battery shall be -20°C 60°C .
- The charging temperature range of the battery in the device is 5° C \~ 40° C. When the ambient temperature is too high or too low, the charging will automatically terminate.
LCD Screen
- Do not use sharp objects to click on the LCD screen. Do not impact the LCD screen with excessive force; otherwise, the LCD screen will be damaged.
OTDR Operation
- The standard optical interface of this product is of FC/APC. When connecting the test fiber, please check whether the fiber connector type matches before connecting. Otherwise, the optical interface will be damaged, and the test curve cannot be normal.
- The optical output connector of the device has a precise and fragile ceramic positioning core inside. When the optical fiber is connected, please make sure that the optical fiber plug is inserted gently in parallel and tighten after aligning with the positioning pin.
- When using this device for measurement, it is necessary to keep the inside of the optical output connector of the instrument and the end face of the optical output connector of the device clean, to avoid contamination of the optical output connector by ointment and other pollutants. Otherwise, the error of the device measurement will be caused, and the device may be unable to test optical fiber in serious cases.
- For best results, point the other end of the test fiber to a non-reflective object during device testing.
OTDR Software Updates
- Make sure the microSD card format is FAT format; other formats may not be recognize by the system.
- Do not pull out the microSD card during the software upgrade of the OTDR, otherwise the system will not work normally.
- Regardless of the success or failure of the optical time domain reflectometer upgrade, please restart it, otherwise it may not work properly.
MAINTENANCE
- Please use the included carrying case when this device is transported to avoid damage.
- When the device is stored, the ambient temperature range should be -40°C 70°C (for the storage temperature range of the battery, please refer to the above internal battery description). Keep it ventilated and dry without direct sunlight. When the device is not in use for a long time, please take out the battery. Charge and discharge the battery once every 3 months.
- In order to extend the battery life, when the device is not used for a long time, the battery should be charged and discharged once every 3 months. Please discharge the battery thoroughly first, and then charge the battery again.
CALIBRATION
The validity of technical parameters is related to the operating environment of the device. The period of calibration can be extended or shortened according to the operation frequency of the device, the environment in which the device operates, and the maintenance of the instrument. Users should determine the appropriate calibration period based on actual needs.
Under normal use of the device, it is recommended to calibrate the optical time domain reflectometer annually. For specific matters, please contact Jonard's customer service department via email or telephone.
WARRANTY & REPAIR
Jonard Tools products are warranted to be free from defects in materials and workmanship for the normal life of the product. Different products have different warranty periods, listed above in our warranty policy. Jonard Tools warranty only covers the repair, replacement, or refund of a Jonard Tools product, it does not cover and nor shall Jonard Tools be liable for any special, indirect, incidental, or consequential damages or loss. At Jonard Tools discretion we will repair, replace, or refund the purchase price of any product found to be defective. The warranty does not apply to products that have been deemed by Jonard Tools to have been abused, misused, or altered in any way whether intentional or by accident.
Warranty Period for this device: 1 Year from date of purchase
DEVICE OVERVIEW


OTDR MODULE
The OTDR-1500 is equipped with additional functions such as an optical power meter, light source, and visual fault locator (VFL). To turn on the device, hold the power button for 5-10 seconds and release.
Select the main menu under the system menu, and the module selection interface shown below will appear:
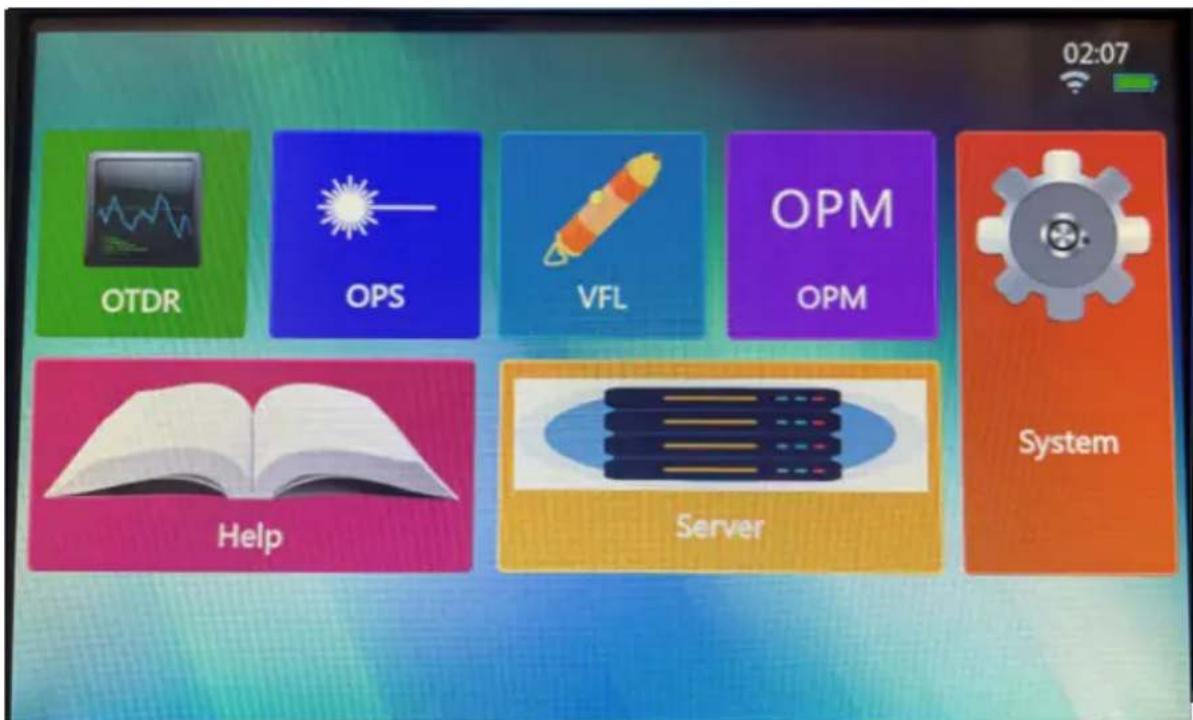
Click any of the six buttons of [OTDR], [OPM], [OLS], [VFL], [Server] and [Help] in the interface to enter the corresponding module.
Click the [System] button to enter the system setting interface and change the general and network settings, respectively.
General Settings include language settings, screen brightness settings, time settings, system information, & system upgrades, as shown below:

Network Settings include WIFI scanning and connection, which can be used with Android devices, as shown below:

OPTICAL POWER METER (OPM) MODULE
Click the [Optical power meter] button in to enter the operation interface of the power meter module, as shown below:

[Wave]: Change the test wavelength of the power meter.
[Zero]: Zero out the power meter.
[Reference]: Set the current test value to the reference value.
[Reset] : Reset the set reference value.
[Measure] : Start or stop the power meter test.
[Home] : Exit the power meter module and return to the main operation interface.
OPTICAL LIGHT SOURCE (OLS) MODULE
Click the [Optical light source] button in to enter the operation interface of the optical light source module, as shown below:

[Start/Stop]: Start or stop the light source.
[Wave]: Select the test wavelength of the light source.
[Mode]: Change the frequency of the light source.
[Home]: Exit the light source module and return to the main operation interface.
VISUAL VAULT LOCATOR (VFL) MODULE
Click the [VFL] button in to enter the operation interface of the visual fault locator module, as shown below:

[Start]: Start or stop the VFL module test.
[Mode]: Select the VFL operating mode.
[Home]: Exit the VFL module and return to the main operation interface.
OTDR OVERVIEW
Click the [OTDR] button in to enter the operation interface of the OTDR module.

- Displays the current system time, battery power and WiFi connection.
-
Test results display area. The test results are calculated based on the current marker position.
-
Average loss: the loss between marker A and B and the average loss of the optical fiber segment where the cursors A and B are located.
- Connection loss: four cursors will be displayed in the main interface of OTDR, and the connection loss of the connection point where marker A is displayed in the test results.
-
Reflection loss: the test result displayed in the main interface of OTDR is the reflection loss of the optical fiber reflection peak where markers A and B are.
-
Display small waveforms globally. Always display a global overview of the test curve waveform.
- Reference origin.
- Current active marker. The active marker is red, the position of the marker can be changed by pressing a button or clicking the touch screen, and the other marker is blue. The active marker can be set iteratively between the on-screen markers by pressing a key.
- The distance between the marker position and the reference point. The position between the two markers.
- Menus bar.
-
Test conditions column. Display the current test range, wavelength, pulse width, test mode and other test conditions.
-
The filename and saving time of the currently read file. If the current test curve is the one saved in the file read, the file name read and the time saved are shown here.
-
Color indication of current test curve. This icon table shows the line color of the test curve with the current sequence number.
-
The scale in the vertical direction.
-
The scale value in the horizontal direction.
IMPORTANT
- The distance of the current active marker and the distance of the event points in the event table are calculated from the reference origin. The distance displayed on the left of the reference origin is negative, while the distance displayed on the right is positive.
- When the device is manufactured, the default reference point is the test port of OTDR, that is, the test origin.
- If the reference origin is set, the device will automatically save, and the saved reference origin will be automatically called out after the next boot.
- The device is allowed to display four test curves at the same time, respectively represented by curves 1, 2, 3 and 4.
- The analysis, movement and calculation of the curve only focus on the current active curve.
- The line color of the current curve is the same as that of the icon on the button.
- The curve switch button in the menu bar allows you to switch between curves 1, 2, 3 and 4.
• Only curves with the same test range can be displayed simultaneously.
EVENT VIEWER INTERFACE
Click the [Analysis] button to analyze the current trajectory curve and display the event list. The diagram of the event list window is shown below:

Each item in the event list is explained as follows (take the distance unit km as an example):
1. Event type:
- indicates that this event point may be the starting point of the fiber.
- indicates that this event point is a descending event point.
- indicates that this event point is an ascending event point.
- indicates that this event point is a reflection event point.
-
indicates that this event point may be the end of the fiber.
-
No.: The number of the current event point.
-
Distance (km): The distance from the current event point to the reference origin.
-
Attenuation (dB/km): Average loss of the fiber before the current event point
-
Loss (dB): Connection loss measured at the current event point. *It indicates that the current measured connection loss is greater than the set connection loss threshold.
-
Reflection (dB): Reflection loss measured at the current event point. *It indicates that the current measured reflection loss is greater than the set reflection loss passing threshold.
-
Total (dB): Total loss of the fiber segment between the current event point and the reference point.
IMPORTANT
- During data analysis, there will be three kinds of threshold settings: loss analysis threshold, loss passing threshold (including the threshold of joint loss and reflection loss), and optical fiber terminal threshold.
- In the event list, only the event points whose joint loss is greater than the set loss analysis threshold will be displayed.
- The event points whose joint loss is less than the set loss analysis threshold will be ignored.
- A value marked with * indicates that the value is greater than the set loss passage threshold.
- If the calculated joint loss is greater than the set terminal threshold, this point is taken as the end of the fiber, and all subsequent event points will be ignored and will no longer be displayed.
HOW TO INTERPRET RESULTS
After selecting graphical analysis, click the [Style] button to perform graphical analysis of the current trajectory curve and display the graphical analysis interface. The schematic diagram of the graphical analysis window is shown below:

Click the [Style] button again, and the interface state will be switched, as shown below:

The meaning of each figure in the graphical analysis window is explained as follows:

Indicates that this event point may be the starting point of the fiber.

Indicates that this event point may be the end of the fiber.

The junction satisfies the passing condition.

The connection loss at the junction exceeds the threshold and the passing n is not met.

The connector meets the passing condition.

The connection loss or reflection loss at the connector exceeds the thresh-does not meet the passing condition.

There is a macro bend in the line.
MAIN MENU & FUNCTION OVERVIEW
![graph TD A["Average"] --> B["Controls OTDR to average progressively the loss curve of the test with the set average time"] C["Real-Time"] --> D["Controls OTDR to refresh test or stop test in real time"] E["Setup"] --> F["Enters the parameter setting sub-menu to realize OTDR test condition setting"]…](/content/2026/08/1631023/images/2fae32ee82a665651efbb617fdf8820cb17bd4a7d8f251431056de269ecce3a8.jpg)
In greater detail:
- [Average]: This button is used to control the progressive average using the average time set by the OTDR. When the test is finished, the content displayed on this button will automatically change on the display from [Stop] to [Average], and the OTDR will stop testing.
- [Real-time]: This button controls the OTDR to refresh or stop testing in real time. This is only available while testing in manual mode. While in manual test mode, click the button, and the content displayed on the button will change to [Stop]. At this time, OTDR will refresh the loss curve in real time. Click this button again, the content displayed on the button changes back to [Real-time], and the OTDR will stop the test.
- [Setting]: Enters the settings sub-menu to set the OTDR test parameters, including reference origin, optical cable specifications, and other settings.
- [Analysis]: Analyzes the current test curve and gives a list of events. If an event point is not found, a prompt will be given.
- [File]: Enters the file operation sub-menu. Here you can read, save, delete, and transfer files.
- [Curve 1]: Displays the curve selection window, where you can set the active curve by selecting it. For reference, Curve 1 is Green; Curve 2 is Yellow; Curve 3 is Orange; Curve 4 is Blue.
- [Main menu]: Returns to the main menu for module selection & system settings.
APPLICATION METHOD
Before testing the optical fiber, first set the OTDR to test mode and set the various test parameters. Click the [Setup] button, and then click on each parameter to set the test conditions. When done, click [Enter] to save the settings as shown below:

IMPORTANT
- Before starting the test, it is necessary to ensure that the test fiber does not contain any active signal and is not live; otherwise, it may cause permanent damage to the instrument.
- The OTDR module of this device has multiple output ports. While testing, please connect the test fiber to the correct test port to get the correct results.
INSTRUCTIONS
When the automatic test is selected, the fiber is automatically analyzed, and a list of events is given when the test stops.
After curve analysis, event points where the connection loss is greater than the loss analysis threshold will be marked. Event points where the connection loss is less than the loss analysis threshold are automatically ignored.
In the event list, connection loss and reflection loss greater than the set threshold will be marked with an asterisk (*).
When the connection loss of the event point is greater than the threshold value of the fiber break point, the event point is considered as the fiber break point. All events after this event point are ignored and not shown in the list.
Click the [Set] button, then click the [Link Definition] button to set the link thresholds, as shown below:

TESTING THE FIBER LINK
The operation steps are as follows:
- Select the test wavelength.
- Set test conditions such as test wavelength mode.
- Clean the end-face(s) of the fiber connectors to be tested.
- Connect the test fiber to the corresponding OTDR optical input port.
- Press the test key to obtain the waveform curve of the tested fiber.
- After testing:
- If [Auto Test] mode or [Auto Analysis after Sampling] is selected, the OTDR-1500 will automatically analyze the test curve, mark the event points according to the set loss analysis threshold, and give the event list.
- Otherwise, click the [Analysis] button in the main menu bar. The OTDR-1500 will analyze the test curve, mark the event points according to the set loss analysis threshold, and give the event list.
- After curve analysis is complete, test results can be viewed in the event list.
OTDR MODULE TEST MODES
The OTDR module has two test modes: Automatic Test and Manual Test modes.
1. Automatic Testing
When the OTDR test mode is set to Automatic Test:
After the test key is pressed, OTDR-1500 will automatically adjust the test conditions to test the connected fiber link. After the test is completed, curve analysis will be performed automatically, and the test curve and event list will be displayed in the main operation window.
2. Manual Testing
When the OTDR test mode is set to manual test:
After clicking the [Real-time] button in the main menu bar (at this time, the content on the [Real-time] menu button changes to [Stop]), the OTDR will conduct a real-time scanning test on the fiber link according to the set parameters. During this time, the test curve in the main operation window will be constantly refreshing.
When the OTDR test mode is set to manual test:
After pressing the test key or clicking the [Average] button in the main menu bar (at this time, the content on the [Average] menu button changes to [Stop]), and the OTDR will average the test results of the fiber link according to the set parameters. The test curves in the main operation window will be averaged continuously, until the average time displayed on the interface equals the set average time, in which the OTDR will stop testing.
In the automatic test mode, after testing, the device will analyze the test curve and give a list of events. In other test modes, the device can automatically analyze the test curve only when the [Post-test analysis] function is selected. Otherwise, you must click the [Analysis] button in the main menu bar to analyze the curve and then give a list of events.
TEST PARAMETERS OF THE OTDR MODULE
OTDR test parameters include wavelength, range, pulse width, average time, refractive index, and the fiber optic cable correction factor.
1. Wavelength:
Wavelength is used to set the test wavelength of OTDR. The OTDR module can be set to 1310 nm and/or 1550 nm wavelengths.
Multiple wavelengths are allowed to be selected simultaneously in average test and automatic test mode. To do so, click [Setup], then [Mea. Par.], check the 1310 and
1550 checkboxes, and click [Enter]. During the test, the device will test at each selected wavelength in turn until all the selected wavelengths have been tested.
2. Measuring range (km):
Measuring Range is used to set the curve range of the test. The range of the optical time domain reflectometer is divided into the following stages: 400m, 800m, 1.6km, 3.2km, 8km, 16km, 32km, 64km, 128km, 256km and 512km (the maximum optional range is related to the selected module).
IMPORTANT: The measuring range must be larger than the length of the fiber under test (preferably larger than twice the length of the fiber under test).
3. Pulse width (ns):
Pulse width is used to set the width of the laser pulse to be used during the test. Larger pulse widths should be used to test longer fiber. The signal-to-noise ratio of the test curve is better, the curve is smoother, but the resolution is not as good.
Smaller pulse width has a higher resolution, but the measurement distance is shorter, and the signal-to-noise ratio the test curve is not as good.
4. Average time:
Average time is used to set the maximum average time for average testing and automated testing. In both modes, the time values are 15, 30, 45, 60, 90, 120 and 180 seconds.
5. Refractive index:
The refractive index of an optical fiber cable can be obtained from the manufacturer of the cable. The refractive index should be set to that parameter, between 1.00000 \~ 2.00000.
6. Cable correction:
The fiber optic cable correction factor is the error between the change of fiber length and the length of the fiber after the fiber optic cable is considered. This parameter may be needed and is available from individual fiber optic cable manufacturers. Its value can be set to 0.80000 to 1.00000, and the default value is 1.00000.
7. Lock markers A and B:
When this option is selected, the distance between marker A and marker B is locked. When either marker is moved, the two markers move together, keeping the distance between them the same. If this is not selected, when one marker is moved, the other one remains in its original position.
8. High resolution test:
When this option is selected, the maximum number of sampling points of the instrument is increased to 256k, which enhances the resolution of events occurring within a short distance.
OTDR TEST RESULTS
OTDR test results can be selected as follows: average loss, connection loss and reflection loss. You can click the control arrows to switch between these test items.

1. Average loss
- Shows the loss, distance, and average loss of the optical fiber between markers A and B.
2. Connection loss
- Shows the connection loss of the fiber at marker A.
3. Reflection loss
- Shows the reflection loss of the optical fiber, the reflection peak where markers A and B are, and the distance between markers A and B.
IMPORTANT
- When testing the average loss, markers A and B must be set on the linear section of the curve, otherwise the calculated average loss will not be correct.
- When testing connection loss, four markers appear in order: marker a, marker A, marker B, and marker b. Set marker a and marker A on the linear
segment of the fiber curve, before the connection point. Marker A should be set near the join point, and marker B and marker b should be set on the linear segment of the fiber curve after the connection point.
- When testing the reflection loss, set marker A in front of the reflection peak to be tested and near the take-off point of the reflection peak. Set marker B on the top of the reflection peak to be tested.
EVENT ANALYSIS & PASSING THRESHOLD
On the OTDR test condition setting interface, you can set the event analysis and passing threshold.
1. Loss analysis threshold
- When analyzing the test curve data, if the calculated connection loss of the event point is greater than the loss analysis threshold, the event point will be marked with an asterisk. Otherwise, it will be automatically ignored.
2. Passing threshold of joint loss
- In the event list, when the calculated event point connection loss is greater than the set connection loss passing threshold, the connection loss value will be marked with “*”.
3. Reflection loss passing threshold
- In the event list, when the calculated reflection loss at the event point is greater than the set reflection loss passing threshold, the reflection loss value will be marked with “*”.
4. Fiber terminal threshold
- When the connection loss of the event point is greater than the threshold value of the fiber terminal, the event point is considered as the fiber terminal. All events after this event point are ignored and not shown in the list.
TWO-WAY ANALYSIS
To enter the bidirectional test mode, follow the below instructions:
-
Enter the Settings interface of the OTDR, check the [Bi-dir.] box, and hit Enter.
-
On the main interface, click on the [File] button, then Read the first curves in the file list that requires two-way analysis (Trace 1);
-
Click [Trace1] in the main menu bar, tick [Trace1] in the curve selection box, and click [OK];
-
Read another curve in the file list that requires two-way analysis, using the same steps above (Trace 2);
- Click the [Analysis] button to get the Two-way analysis results, as shown below.

MACRO BENDING ANALYSIS
- From the main interface of the OTDR module, select [Setup], then click [Link Def.] to enter the settings menu.
- Check the box next to "Bending" and then click [Enter] to return to the main menu.
- Select the first curve that requires macro bending analysis.
- Click [Curve] in the main menu bar, tick [Curve 2] in the curve selection box, and click [OK];
- Read another curve in the file list that requires macro bending analysis (curve 2);
- Click the Analysis button to get the macro bending analysis results.
5.8 ANALYSIS OF UNREAL PEAKS
To realize the unreal peak analysis function, the operation steps are as follows:
- Click [Unreal Peak Analysis] on the link definition setting interface, as shown in Figure 7-7, and click [OK].
- Read the curve in the file list that requires unreal peak analysis;
- Click the [Analysis] button to get the unreal peak analysis results, as shown in Figures 7-10 & 7-11.

Checking the analysis result before unreal peak analysis

Fig. 7-11 Checking the analysis result after unreal peak analysis
READ FILE
Click the [File] button in the main menu to enter the file submenu.
Click the [Read] button to enter the file reading operation window, as shown below:

- File Path: Memory, U Disk and SD card can be selected.
- File Format: El file or SOR file can be selected.
- File List: The list shows the curve files that have the file format (EI or SOR) stored under the current path.
- Curve Selection: Select the current curve to be displayed as the curve 1, 2, 3 or 4.
- Curve Preview Area: Display the test curve saved in the file selected by the current cursor bar via preview.
Select the file to be opened and click [OK] button to read and display the file.
SAVE FILE
Click the [Save] button in the [File] sub-menu to enter the file saving operation window, as shown below.

File saving operation window
- Saving File Path: Memory, U disk and SD card can be selected.
- File List: The list shows the curve files that conform to the file format stored (EI or SOR) under the current path.
- File name: A file name can be entered. If the edit box is empty, the default file name is the current time.
- Saving type: EI file or SOR file can be selected.
- New folder: Enter the folder name and click the [New Folder] button to create a new folder in the corresponding location.
Enter the file name, select the type of file to save, and click the [OK] button to save the file to the appropriate location.
FAQ'S & TROUBLESHOOTING
The following are the possible failures of the instrument and the solutions:
Table 8-1 Failures and troubleshooting
| FAQ CAUSE TROUBLESHOOTING | ||
| My device cannot be powered ON. | ON button not held long enough. | Hold the power button for 5 seconds to power on the device. |
| Battery is dead. | Connect it to an AC/DC adapter to power the device and charge the battery. | |
| Keys do not respond. | One or more buttons may be stuck. | Check the buttons to make sure none of them are stuck. If there is a stuck button, release it using your fingers or a small screwdriver if necessary. |
| The fiber length measured is inaccurate | a. Refractive index of Optical fiber is not set correctly. | a. Set the refractive index of the fiber to the index specified by the fiber manufacturer. |
| b. Cable correction factor is not set. | b. Set the cable correction factor to 1.0000 or the cable correction factor specified by cable manufacturer. | |
| The average loss of fiber measured is not accurate | a. The fiber length error measured is too large | a. Refer to the previous item to measure the fiber length accurately. |
| b. The front tail of the test curve is too long | b. After cleaning the connector of the fiber under test or adding a little matching fluid, retest the curve. | |
| There is no test waveform on the screen, only the front reflection peak, or the front reflection peak has a long tail. | The end face of the connector is dirty. | Wipe the end face of the fiber clean with 99% isopropyl or fiber cleaning fluid. |
| The end face of the device is dirty. | Remove the connected fiber and clean the fiber end face and device end face using 99$ isopropyl alcohol or fiber cleaning fluid. | |
| The ceramic core of the connector is cracked or broken | Replace the fiber connector with a new one. | |
| Fiber connector type mismatch | The end face type of the fiber connector being tested must match the end face type in the OTDR optical output connector. If these are mismatched, you will not get accurate results. | |
REASONS FOR FAILURE OF CURVE TEST & ANALYSIS
If the results are quite different from the expected result (or the expected result does not appear), it may be caused by one of the following reasons:
- The test curve of the fiber was not obtained.
If the test curve only has the front-end reflection peak, and there is no linear curve reflecting the characteristics of the fiber, please check:
- Whether the end-face type of the tested fiber is the same as the end-face type of the OTDR optical output port (APC).
- Whether the end-face of the fiber is contaminated with dirt, grime, or dust.
- Whether the optical output ferrule of the OTDR is cracked or damaged.
If the fiber link tested is very short (<100 m), the following test methods and conditions are recommended:
Settings
Test Mode: Average
Measuring Range: <800 m
Pulse Width: <80ns
Attenuation: 15dB or 20dB
Average Time: Depends on Attenuation Setting
NOTE: If 15dB attenuation is set, a better SNR test curve can be obtained, which improves the curve analysis. A smaller test blind area can be obtained by setting the attenuation to 20 dB, but the signal-to-noise ratio of the curve is relatively low, so a larger average time is needed to obtain a curve with a higher signal-to-noise ratio.
-
If a relatively serious trailing phenomenon is observed on the falling edge of the reflection peak at the near end of the test curve, please try the following:
-
Dip a cotton wool ball in an appropriate amount of 99% isopropyl, or another fiber cleaning fluid, to clean the end-face of the tested fiber and the optical output ferrule of the OTDR.
- Re-test the curve with a smaller pulse width. (note that the average test mode is selected and the average time is set).
-
Re-test the curve with a large attenuation at the current pulse width (note that the average test mode is selected and the average time is set).
-
If the event points in the test curve are too close together, or if an adjacent event point is found missing, please try the following:
-
Re-test the curve with a smaller pulse width (note that the average test is selected and the average time is set).
-
Please set a certain average time and use the average test method to improve the signal-to-noise ratio of the curve.
-
If the SNR (Signal-to-Noise Ratio) of the test curve is poor, the accuracy of the curve analysis will be affected. In this case, try the following:
-
In the automatic test or average test mode, increase the average time value appropriately.
-
Use a larger pulse width to retest after adjusting the settings to the appropriate test range under the average test mode.
-
If there is a big difference between the measured fiber length and the actual value, please check:
-
Whether the refractive index value and optical fiber correction coefficient value set are consistent with the nominal value of the fiber or optical fiber measured.
- If the refractive index is not consistent, the measured length of the fiber will be affected.
CONNECTING & USING WIFI
To connect to Wifi using the OTDR-1500, please follow the below steps:
- On the main interface, press the [Server] button on the screen.
- Make sure Port 8010 is entered and press the [Start] and [Hide] buttons.
- On the main interface again, press the [System] button.
- In the System Settings, click on the [Network Settings] tab.
- Click the slider next to "WIFI" to enable wifi, and click the [Scan] button.
NOTE: The scan may take a few seconds.
-
Once the scan is complete, select the OTDR-1500's network, "OW4...3F0".
-
Enter the Password, which is defaulted to "12345678", and press the [Con.] button when done.
NOTE: After entering the password, press the "close" button to return to the System Settings interface.
NOTE: After pressing the [Con.] button, the [Con.] button will be replaced with [Break], with an IP address shown next to it (10.10.18.104).
- In the Android app, enter the IP address, and press connect. Then, enter the network code, 8010, to connect your phone to the OTDR-1500.
- In the network settings of your phone, set the phone's wifi to the OT-DR-1500's network, "OW4G_B223F0", and open the OTDR-1500 app on your phone.
- Your phone is now paired with the OTDR-1500, and can be used to mirror the screen or transfer files.
EVENT POINT TYPES
The event points created by the OTDR are either reflective event points and non-reflective event points.
Reflective event points are usually caused by a fixed connector or a fractured surface at the end of the optical fiber, representing a peak. See example below for reference:

Non-reflective events typically include:
• Descending event point
- Ascending event point
• Non-reflective end of optical fiber


TECHNICAL FEATURES & SPECIFICATIONS
| Display Screen | 800×480, 7-inch TFT color LCD(standard distribution capacity touch screen) |
| Electrical Interface | USB port, Micro-USB port, SD card interface, and 10M/100MEthernet interface |
| Power Supply | AC/DC adapter: allowable range of input voltage: 100V ~ 242V (1.5A),allowable range of frequency: 50/60Hz; Output DC: 17V±3V (2A)Internal lithium battery: 11.1V, 6800mAh, 75.48WhBattery working hours: 8h |
| Environmental Requirements | Operating temperature: -10°C~50°C (Battery: 5°C~40°C)Storage temperature: -40°C~70°C (Battery: 5°C~40°C)Relative humidity: 5%~95%, no condensation |
| Overall Dimensions DxWxH: 252mm×180mm×55mm | |
| Weight 1.8±0.2kg (including the OTDR module and lithium battery) | |
| Interface Language English, French, German | |
OTDR MODULE SPECIFICATIONS
| Center wavelength (nm) 1310, 1550 | |
| Dynamic range (dB) 32 dB / 30 dB | |
| Measuring range (km) 0.4, 0.8, 1.6, 3.2, 8, 16, 32, 64, 128, 256, and 512 | |
| Pulse width (ns) | 3, 5, 10, 30, 80, 160, 320, 640, 1280, 5120, 10240, 20480 (single mode) |
| Refractive index setting range Adjust in the range of 1.00000 ~ 1.99999 | |
| Cable correction factor Adjust in the range of 0.80000 ~ 1.00000 | |
| Linearity 0.03dB/dB | |
| Loss resolution 0.001dB/dB | |
| Optical output connector SC/APC, FC/APC | |
VFL SPECIFICATIONS
| NAME CONTENTS | |
| Center wavelength (nm) 650nm±20nm | |
| Output power mW ≥2mW (typical) | |
| Operation mode CW, 1Hz and 2Hz | |
| Interface type TOSA |
POWER METER MODULE SPECIFICATIONS
| NAME CONTENTS | |
| Wavelength range 1200nm ~ 1650nm | |
| Power range -60dBm ~ 0dBm | |
| Uncertainty of calibration point power test | Better than 0.22dB(-25dBm, CW, 1310/1550nm) |
| Uncertainty ±5% (-25dBm, CW) | |
| Uncertainty of power measurement within the optical path | Better than ±1.5dB |
LIGHT SOURCE MODULE SPECIFICATIONS
| NAME CONTENTS | |
| Output wavelength 1310nm-1550nm | |
| Output power ≥-5dBm(23°C±2°C) | |
| Operation mode CW, 270Hz, 1kHz and 2kHz |
APPENDIX
Because the fiber core is very small, dust and other particles may get stuck to the optical output ports, which may cover part of the fiber core, leading to the subpar performance of the device. Dust and particles may also cause the end face of the output port ferrules to wear, which will reduce the accuracy and repeatability of the device. Cleaning the device periodically, as described below, will prevent those issues.
- The optical output ports must be kept clean, and the optical output ports should be cleaned regularly with anhydrous ethanol, 99% isopropyl alcohol, or fiber cleaning fluid.
- After the device is used, please cover the dust cap and keep it clean.
- The ferrule of the light source output port must be cleaned periodically. If the ceramic core in the ferrule is found to be cracked, replace the ferrule as soon as possible.
While cleaning, follow the below safety principles:
- Be sure to turn off the power supply when cleaning.
- Failure to follow the prescribed control, regulation, or operating procedures may result in dangerous radiation damage.
- When cleaning any optical interface, make sure the optical source is disabled.
- Do not look directly at any optical output port while the instrument is on to avoid eye damage.
- Please use optical fiber cleaners, optical fiber cleaning rods, or other similar tools to clean the optical output interface and connectors.
Steps to clean the optical output interface and connector:
- Ensure the power to the device is turned off.
- Unscrew the ferrule cap completely.
- Gently pull out the ferrule.
- Clean the end face of the optical output connector and the flange connector with a cotton wool ball dipped in an appropriate amount of anhydrous ethanol or fiber cleaning fluid.
- After cleaning, gently connect the ferrule to the optical output port, and then tighten the ferrule.

MADE FOR LIFE


- OTDR-1500 PROFESSIONAL MULTI-FUNCTION OTDR 1310/1550 NM INSTRUCTION MANUAL
- SAFETY REQUIREMENTS
- SOFTWARE DOWNLOAD
- WARNING
- ATTENTION
- TABLE OF CONTENTS
- INTRODUCTION
- CONTENTS
- WARNINGS
- MAINTENANCE
- OTDR MODULE
- OPTICAL POWER METER (OPM) MODULE
- OPTICAL LIGHT SOURCE (OLS) MODULE
- HOW TO INTERPRET RESULTS
- MAIN MENU & FUCTION OVERVIEW
- APPLICATION METHOD
- OTDR MODULE TEST MODES
- READ FILE
- SAVE FILE
- FAQ'S & TROUBLESHOOTING
- REASONS FOR FAILURE OF CURVE TEST & ANALYSIS
- TECHNICAL FEATURES & SPECIFICATIONS
- APPENDIX
- POWER SUPPLY
- INTERNAL BATTERY
- LASER SAFETY
- OTDR OPERATION
- ADDITIONAL PRECAUTIONS
- LCD SCREEN
- OTDR SOFTWARE UPDATES
- CALIBRATION
- WARRANTY & REPAIR
- DEVICE OVERVIEW
- VISUAL VAULT LOCATOR (VFL) MODULE
- OTDR OVERVIEW
- IMPORTANT
- EVENT VIEWER INTERFACE
- EVENT TYPE
- MAIN MENU & FUNCTION OVERVIEW
- INSTRUCTIONS
- TESTING THE FIBER LINK
- AUTOMATIC TESTING
- MANUAL TESTING
- TEST PARAMETERS OF THE OTDR MODULE
- WAVELENGTH
- MEASURING RANGE (KM)
- PULSE WIDTH (NS)
- AVERAGE TIME
- REFRACTIVE INDEX
- CABLE CORRECTION
- LOCK MARKERS A AND B
- HIGH RESOLUTION TEST
- OTDR TEST RESULTS
- AVERAGE LOSS
- CONNECTION LOSS
- REFLECTION LOSS
- EVENT ANALYSIS & PASSING THRESHOLD
- LOSS ANALYSIS THRESHOLD
- PASSING THRESHOLD OF JOINT LOSS
- REFLECTION LOSS PASSING THRESHOLD
- FIBER TERMINAL THRESHOLD
- TWO-WAY ANALYSIS
- MACRO BENDING ANALYSIS
- ANALYSIS OF UNREAL PEAKS
- SETTINGS
- CONNECTING & USING WIFI
- EVENT POINT TYPES
- OTDR MODULE SPECIFICATIONS
- VFL SPECIFICATIONS
- POWER METER MODULE SPECIFICATIONS
- LIGHT SOURCE MODULE SPECIFICATIONS
Brand : Jonard Tools
Model : OTDR-1500
Category : Uncategorized