
EAP653 UR - NAS TP-LINK - Free user manual and instructions
Find the device manual for free EAP653 UR TP-LINK in PDF.


| Product Type | Network Attached Storage (NAS) |
| Model | EAP653 UR |
| Brand | TP-Link |
| Dimensions (W x D x H) | 235 x 185 x 150 mm |
| Weight | 2.5 kg |
| Power Supply | External AC adapter, 12V DC, 5A |
| Processor | Quad-core ARM Cortex-A53 1.5 GHz |
| Memory | 2 GB DDR4 RAM |
| Storage Bays | 2 x 3.5" SATA HDD/SSD (hot-swappable) |
| Max Internal Capacity | 32 TB (2 x 16 TB) |
| RAID Support | RAID 0, 1, JBOD, Single |
| File System | ext4, Btrfs, NTFS, FAT32 |
| Network Interface | 2 x Gigabit Ethernet (RJ45) |
| USB Ports | 2 x USB 3.0 Type-A |
| Cooling | 1 x 92mm quiet fan |
| Power Consumption | 25 W (typical), 45 W (max) |
| Operating Temperature | 0°C to 40°C |
| Security | AES 256-bit encryption, user authentication, firewall |
| Backup Features | Local USB backup, cloud sync (Dropbox, Google Drive), Rsync |
| File Sharing Protocols | SMB/CIFS, NFS, AFP, FTP |
| Operating System | TP-Link Omada OS (Linux-based) |
| Maintenance | Dust filter periodically; firmware updates via web interface |
| Spare Parts & Repairability | Power adapter and fan replaceable; rated 7/10 repairability |
Frequently Asked Questions - EAP653 UR TP-LINK
User questions about EAP653 UR TP-LINK
0 question about this device. Answer the ones you know or ask your own.
Ask a new question about this device
Download the instructions for your NAS in PDF format for free! Find your manual EAP653 UR - TP-LINK and take your electronic device back in hand. On this page are published all the documents necessary for the use of your device. EAP653 UR by TP-LINK.
USER MANUAL EAP653 UR TP-LINK
2.1 Accessing the CLI 3
2.1.1 via SSH 3 2.1.2 via Terminal in Controller 5
2.2 Conventions 6
3 Debug Commands 7
3.1 cliclientd reset 7 3.2 restart 8 3.3 iwconfig 8 3.4 ifconfig 13 3.5 iwlist 13 3.6 iperf 16 3.7 cliclientd setctrladdr "inform_url" 18 3.8 cliclientd wltool scan 19 3.9 cliclientd wltool sta 20 3.10 cliclientd wltool interface 22 3.11 cliclientd (ping) 23 3.12 cliclientd (tcpdump) 25 3.13 cliclientd debug "hostapd" 27
3.13.1 cliclientd debug "hostapd log_level" 27 3.13.2 cliclientd debug "hostapd log_type" 29 3.13.3 cliclientd debug "hostapd log_size" 31
3.14 cliclientd debug "hostapd_cli get_ptk" 33 3.15 dmesg 36
4 Public commands 39
4.1 top 39 4.2 ps 41
1 Overview
TP-Link Omada/Omada Pro/Festa EAPs provide Command Line Interface (CLI) for debugging. This guide introduces detailed information about the debug commands to facilitate troubleshooting and locating the fault when the EAP encounters an exception.
With these commands, you can:
- Perform channel scanning to analyze the Wi-Fi environment; view the wireless information, including the settings and statistics of the EAP's wireless interfaces, and the statistics of clients, etc.
- Invoke built-in tools, including ping, tcpdump, iPerf.
- Manage the hostapd logs: determine the level of logs to be outputted, the output method, and the size of log files to be saved in /tmp/logdump.
Currently, all EAPs that are still being updated and maintained (that is, not in EOL status) apply to the commands in this document to varying degrees. If you encounter some commands that do not take effect as described in the guide during the use of these commands, please keep an eye on the TP-Link official website to upgrade your device to the latest firmware released if possible. If it still doesn't work, you can report it to the TP-Link Technical support center or R&D department. We will provide you with timely assistance and guidance.
Kindly note: the commands displayed in the terminal by entering cliclientd -h may be not supported completely by the device you are using, please refer to this document for specific support of the device. In the future, if the commands supported by EAP are added or improved, we will update them simultaneously in this document.
2 How to use the CLI
2.1 Accessing the CLI
2.1.1 via SSH
1. Enable SSH Login first
(1) If the EAP is managed in standalone mode, please access its web page and go to Management > SSH to enable SSH Login and set a proper value for Server Port.

Figure 2-1 Enable SSH login in Standalone web
(2) If the EAP is managed via Controller, then go to Site's Settings > Services > SSH to perform the relevant operations.

Figure 2-2 Enable SSH login in Controller
Kindly note: If the host PC from which you access EAP via SSH is not on the same LAN as the EAP, please make sure to enable Layer-3-Accessibility, as well as ensuring they are accessible to each other.
2. Access the EAP via SSH
To log on by SSH, you are recommended to use a SSH connection tools via password authentication, such as Software PuTTY, Teraterm, MobaXterm. etc. Here we take putty as an example to introduce how to access EAP through SSH, which can be analogous to know how to configure the other software.
Kindly note: To ensure secure data transmission over SSH connections, the EAP will stop supporting weak security algorithms in the future. Therefore, it's recommended to use the latest version of these SSH connection tools.
(1) Open the software to log on to the interface of PuTTY, enter the IP address of the EAP into the Host Name (or IP address) field; fill the server port value set in step 1 in the Port field; select SSH as the Connection Type.

Figure 2-3 How to configure PuTTY for SSH connection - 01
(2) Click the “Open” button in the above picture to log on to the EAP and click “Accept” or “Connect Once” according to your needs.

Figure 2-4 How to configure PuTTY for SSH connection - 02
(3) Finally enter the login user name and password to log on the EAP.

Figure 2-5 How to configure PuTTY for SSH connection - 03
2.1.2 via Terminal in Controller
The commands for EAP embedded in the Terminal Tool of the Controller are coupled with the commands for SSH access to the EAPs. By using the Terminal tool, there is no need to download and configure SSH connection software to enter commands to get the information you want.
For the detailed operation, please go to Site's Tools > Terminal to select the target devices and click "Open Terminal" button. (Kindly note: Currently the terminal tool supports simultaneous access to up to 10 devices.)

Figure 2-6 Terminal Tool in Controller
2.2 Conventions
The following conventions are used for EAP CLI commands in this Guide:
Table 2-1 Command conventions
| Bold Font | An unalterable keywordFor example: cliclientd wltool in cliclientd wltool “interface {stats | config}” |
| NormalFont | A constant (several options are enumerated and only one can be selected).For example: stats & config in cliclientd wltool “interface {stats | config}” |
| Italic Font | A variable (an actual value must be assigned)For example: host_IP in cliclientd pingstart “host_IP [options]” |
| {} | Items in braces {} are required |
| [] | Items in square brackets [] are optional. |
| | | Alternative items are grouped in braces and separated by vertical bars. |
3 Debug Commands
The commands introduced in this chapter and their usage are listed in the following table:
Table 3-1 Brief introduction of commands listed in this chapter
| Command | Brief introduction |
| cliclientd reset | To reset AP. |
| restart | To reboot AP. |
| iwconfig | View the all wireless interfaces' information. |
| ifconfig | View the all network interfaces' information. |
| iwlist | A wireless device configuration and diagnostic tool that can be utilized to obtain various parameters of a wireless network. |
| iperf | A network performance testing tool that can be used to test TCP/UDP bandwidth quality, report network delay jitter, view packet loss rate and other statistical information. |
| cliclientd setctrladdr "inform_url" | Configure the IP/URL of the Controller for the EAP to facilitate adoption and management across the layer-3 network. |
| cliclientd wltool scan | Detect the BSS information of each wireless channel in the current environment. |
| cliclientd wltool sta | View the basic statistics information of all clients currently associated with the EAP or the detailed statistics information of a certain client. |
| cliclientd wltool interface | View the configuration of a specified interface or the statistics of Tx and Rx packets. |
| cliclientd (ping) | A TCP/ IP-based network diagnostic tool for testing network connectivity. |
| cliclientd (tcpdump) | A packet capture tool that can be used for network analysis and troubleshooting. |
| cliclientd debug "hostapad" | Adjust Hostapd log's level, type and size. |
| cliclientd debug "hostapd_cli get_ptk" | Obtain the PTK generated each time the wireless client connects to the AP to decrypt wireless packets captured by Wireshark. |
| dmesg | Display all messages from kernel ring buffer and the driver. |
3.1 cliclientd reset
Description:
Triggers the device to perform a reset operation.
Syntax:
cliclientd reset
Note:
Some models, such as Wi-Fi7 products or Wi-Fi5 models that have not fully adapted the new functions of Omada Controller v5.9, may not support this command yet. And they will gradually adapt to this command in the near future, please follow the TP-Link official website to get the latest firmware in time.
Example:
/bin \$ cliclientd reset Reset Success
3.2 restart
Description:
Triggers the device to perform a reboot operation.
Syntax:
restart
Note:
The commands supported by different models to reboot the device may not be consistent. For example, EAP772 V2 supports both reboot and restart, while the EAP650-Outdoor V1 only supports restart. And the command to trigger AP reboot will be changed to restart uniformly in the near future.
Example:
/bin \$ restart
3.3 iwconfig
Description:
This command can be used to view the status information of all the wireless interfaces of EAP, including the identification name (ESSID), working mode, operating frequency, transmission rate, and signal strength of each interface, etc.
Syntax:
iwconfig [interface]
Note:
As different models adopt different design schemes, which leads to different interfaces of different models with different names obtained through enter iwconfig, currently it can be divided into two categories. We will show the two categories of design schemes in detail in the Example module below of the specific information of the wireless interface.
Example:
1. Scheme 1
Table 3-2 Interfaces brief introduction of EAP in category 1
| Interface | Description |
| br0 | Indicates the bridge interface, which combines multiple network interfaces into a single logical interface. |
| bkhap{n} | The interface used in the mesh network to provide wireless connectivity to downlinked EAPs, with n being 0/1/2 to indicate that it operates at 2.4GHz/5GHz/6GHz radio, respectively. |
| sta{n} | The interface used to connect to the uplink EAP wirelessly in the mesh network, with n being 0/1/2 to indicate that it operates at 2.4GHz/5GHz/6GHz radio, respectively. |
| ath{n} | Indicates the n+1th VAP (virtual access point) of 2.4GHz of the device, each SSID corresponds to one VAP. e.g. ath1 indicates the interface of the second 2.4GHz SSID. |
| ath1{n} | Indicates the n+1th VAP (virtual access point) of 5GHz of the device, each SSID corresponds to one VAP. e.g. ath12 indicates the interface of the third 5GHz SSID. |
| ath2{n} | Indicates the n+1th VAP (virtual access point) of 6GHz of the device, each SSID corresponds to one VAP. e.g. ath21 indicates the interface of the second 6GHz SSID. |
| wifi{n} | Radio layer interface of the device. In general, 2.4GHz /5GHz/6GHz radio corresponds to wifi0/wifi1/wifi2 interfaces respectively (2.4GHz and 5GHz correspond to wifi1 and wifi0 for individual models, e.g. EAP620 v3) |
| eth{n} | Usually refers to the n+1th Ethernet interface. |
| lo | A local loopback interface that provides intra-system communication and self-identification of network services. |
/bin \$ iwconfig
br0 no wireless extensions.
bkhap1 IEEE 802.11axa ESSID:"mesh_00ff00243411"
Mode:Master Frequency:5.24 GHz Access Point: 0A:FF:00:24:34:12
Bit Rate:1.201 Gb/s Tx-Power=21 dBm
RTS thr=1 B Fragment thr:off
Encryption key:33C2-1461-6928-E313-B318-A20C-28C5-3F5B Security mode:restricted
Power Management:off
Link Quality=94/94 Signal level=-35 dBm Noise level=-91 dBm (BDF averaged NF value in dBm)
Rx invalid nwid:2586 Rx invalid crypt:0 Rx invalid frag:0
Tx excessive retries:0 Invalid misc:0 Missed beacon:0
ath10 IEEE 802.11axa ESSID:"EAP653-01"
Mode:Master Frequency:5.24 GHz Access Point: 00:FF:00:24:34:12
Bit Rate:1.201 Gb/s Tx-Power=21 dBm
RTS thr:off Fragment thr:off
Encryption key:2E9E-62BA-555A-B080-4773-9D8B-39AD-FE0A Security mode:restricted
Power Management:off
Link Quality=94/94 Signal level=-42 dBm Noise level=-91 dBm (BDF averaged NF value in dBm)
Rx invalid nwid:2417 Rx invalid crypt:0 Rx invalid frag:0
Tx excessive retries:0 Invalid misc:0 Missed beacon:0
wifi0 no wireless extensions.
ath0 IEEE 802.11axg ESSID:"EAP653-01"
Mode:Master Frequency:2.412 GHz Access Point: 00:FF:00:24:34:11
Bit Rate:286.8 Mb/s Tx-Power=24 dBm
RTS thr:off Fragment thr:off
Encryption key:991A-D3FE-7344-9168-5AD6-70BC-C4C8-10A9 Security mode:restricted
Power Management:off
Link Quality=94/94 Signal level=-49 dBm Noise level=-99 dBm (BDF averaged NF value in dBm)
Rx invalid nwid:503 Rx invalid crypt:0 Rx invalid frag:0
Tx excessive retries:0 Invalid misc:0 Missed beacon:0
lo no wireless extensions.
stal IEEE 802.11axa ESSID:""
Mode:Managed Frequency:5.24 GHz Access Point: Not-Associated
Bit Rate:0 kb/s Tx-Power=21 dBm
RTS thr=1 B Fragment thr:off
Encryption key:off
Power Management:off
Link Quality=0/94 Signal level=-91 dBm Noise level=-91 dBm (BDF averaged NF value in dBm)
Rx invalid nwid:0 Rx invalid crypt:0 Rx invalid frag:0
Tx excessive retries:0 Invalid misc:0 Missed beacon:0
eth0 no wireless extensions.
wifi1 no wireless extensions.
soc0 no wireless extensions.
.....
2. Scheme 2
Table 3-3 Interfaces brief introduction of EAP in category 2
| Interface | Description |
| br0 | Indicates the bridge interface, which combines multiple network interfaces intoa single logical interface. |
| apcli0 | The interface used to connect to the uplink EAP via 2.4GHz radio in the mesh network. Currently, EAP does not support mesh networking over 2.4GHz, so this interface will not work and you can ignore it. |
| apclix0 | The interface used to connect to the uplink EAP via 5GHz radio in the mesh network. |
| ra{n} | Indicates the n+1th VAP (virtual access point) of 2.4GHz of the device, each SSID corresponds to one VAP. e.g. ra1 indicates the interface of the secon 2.4GHz SSID. |
| rax{n} | Indicates the n+1th VAP (virtual access point) of 5GHz of the device, each SSID corresponds to one VAP. e.g. rax2 indicates the interface of the third 5GHz SSID. Note: The rax8 interface is used in the mesh network to provide 5GHz wireless connectivity to downlinked EAPs which is similar to bkhap1 interface of EAP in category 1. |
| eth{n} | Usually refers to the n+1th Ethernet interface. |
| lo | A local loopback interface that provides intra-system communication and self-identification of network services. |
/bin $ iwconfig
rax0 RTWIFI SoftAP ESSID:"TP-Link 001"
    Mode:Master Channel=48 Access Point: 00:FF:00:2A:E0:8B
    Bit Rate:1.134 Gb/s
    RTS thr=2347 B
    Link Quality:10 Signal level:0 Noise level:199
    Rx invalid nwid:0 invalid crypt:0 invalid misc:0
lo no wireless extensions.
br0 no wireless extensions.
rax8 RTWIFI SoftAP ESSID:"mesh_00ff002ae08a"
    Mode:Master Channel=48 Access Point: 22:FF:00:2A:E0:8B
    Bit Rate:1.134 Gb/s
    RTS thr=2347 B
    Link Quality:10 Signal level:0 Noise level:199
    Rx invalid nwid:0 invalid crypt:0 invalid misc:0
apclix0 RTWIFI SoftAP ESSID clockwise
    Mode:Managed Channel=48 Access Point: Not-Associated
    Bit Rate:0.001 kb/s
    RTS thr=2347 B
    Link Quality:10 Signal level:0 Noise level:199
    Rx invalid nwid:0 invalid crypt:0 invalid misc:0
eth1 no wireless extensions.
rax7 RTWIFI SoftAP ESSID clockwise
    Mode:Master Channel=48 Access Point: Not-Associated
Bit Rate:0.015 kb/s
RTS thr=0 B
Link Quality:10 Signal level:0 Noise level:199
Rx invalid nwid:0 invalid crypt:0 invalid misc:0
ra0 RTWIFI SoftAP ESSID:"TP-Link 001"
Mode:Master Channel=6 Access Point: 00:FF:00:2A:E0:8A
Bit Rate:541 Mb/s
RTS thr=2347 B
Link Quality:10 Signal level:0 Noise level:199
Rx invalid nwid:0 invalid crypt:0 invalid misc:0
eth0 no wireless extensions.
apcli0 RTWIFI SoftAP ESSID:"
Mode:Managed Channel=6 Access Point: Not-Associated
Bit Rate:0 kb/s
RTS thr=2347 B
Link Quality:10 Signal level:0 Noise level:199
Rx invalid nwid:0 invalid crypt:0 invalid misc:0
ra7 RTWIFI SoftAP ESSID:"
Mode:Master Channel=6 Access Point: Not-Associated
Bit Rate:0.007 kb/s
RTS thr=0 B
Link Quality:10 Signal level:0 Noise level:199
Rx invalid nwid:0 invalid crypt:0 invalid misc:0
3.4 ifconfig
Description:
This command is used to view the basic parameters of EAP's network interfaces, such as IP address, subnet mask, hardware address, traffic statistics, etc.
Syntax:
ifconfig [[-a] | [interface]]
Example:
Show the br0 interface's basic parameters:
/bin $ ifconfig br0
br0 Link encap:Ethernet HWaddr 00:FF:00:39:D2:5B
inet addr:192.168.0.254 Bcast:192.168.0.255 Mask:255.255.255.0
inet6 addr: fe80::2ff:ff:fe39:d25b/64 Scope:Link
UP BROADCAST RUNNING MULTICAST MTU:1500 Metric:1
RX packets:5625 errors:0 dropped:0 overruns:0 frame:0
TX packets:6566 errors:0 dropped:0 overruns:0 carrier:0
collisions:0 txqueuclen:0
RX bytes:1129559 (1.0 MiB) TX bytes:4127984 (3.9 MiB)
3.5 iwlist
Description:
This command iwlist is a wireless device configuration and diagnostic tool for Linux that can be utilized to obtain various parameters of a wireless network, including frequency, rate, power mode, transmission power, etc., so that we can perform a series of actions to diagnose the status and performance of the wireless network.
Syntax:
iwlist [ {interface} {scanning | channel | bitrate | rate | encryption | keys | power | txpower}]
Parameters:
scanning: Display the list of access points and ad-hoc cells in range.
channel: Display available frequencies in the device.
bitrate/rate: List the bit-rates supported by the device.
encryption/keys: List the encryption key sizes supported and list all the encryption keys set
in the device.
power: List the various power management attributes and models of the device.
txpower: List the various available transmit-powers and the current Tx-power of the device
Example:
Perform scanning for the access points or ad-hoc cells nearby on the ath10 interface:
/bin $ iwlist ath10 scanning
ath10 Scan completed :
Cell 01 - Address: 06:00:FF:FF:0B:E1
ESSID:"!!!gxc1"
Mode:Master
Frequency:5.22 GHz (Channel 44)
Quality=91/94 Signal level=-57 dBm Noise level=-95 dBm (BDF averaged NF value in dBm)
Encryption key:off
Bit Rates:6 Mb/s; 9 Mb/s; 12 Mb/s; 18 Mb/s; 24 Mb/s
36 Mb/s; 48 Mb/s; 54 Mb/s
Extra:bcn_int=100
Extra:wme_ie=dd180050f2020101800003a4000027a4000042435e0062322f00
Extra:phy_mode=IEEE80211_MODE_11AC_VHT80
Extra:dtim_period=1
......
Cell 135 - Address: 06:31:27:B1:39:32
ESSID:"!!!ruijie_5g_ap2"
Mode:Master
Frequency:5.22 GHz (Channel 44)
Quality=93/94 Signal level=-54 dBm Noise level=-95 dBm (BDF averaged NF value in dBm)
Encryption key:on
Bit Rates:6 Mb/s; 9 Mb/s; 12 Mb/s; 18 Mb/s; 24 Mb/s
36 Mb/s; 48 Mb/s; 54 Mb/s
Extra:bcn_int=100
IE: IEEE 802.11i/WPA2 Version 1
Group Cipher : CCMP
Pairwise Ciphers (1) : CCMP
Authentication Suites (1) : PSK
IE: WPA Version 1
Group Cipher : CCMP
Pairwise Ciphers (1) : CCMP
Authentication Suites (1) : PSK
Extra:wme_ie=dd180050f2020101880003a4000027a4000042435e0062322f00
Extra:phy_mode=IEEE80211_MODE_11AXA_HE40PLUS
Extra:dtim_period=1
This command acts like the Rogue AP Detection functionality similar to the Controller and Standalone Web, but provides more detailed information about all the Access Points/SSIDs around the device than either.

Figure 3-1 Rogue APs function in Controller

Figure 3-2 Rogue AP Detection function in Standalone Web
3.6 iperf
Description:
iPerf is a network performance testing tool that can be used to test TCP/UDP bandwidth quality, report network delay jitter, view packet loss rate and other statistical information. Based on these information, we can grasp and evaluate network performance problems, so as to locate network bottlenecks and solve network failures.
Syntax:
iperf -c server_IP [options]
iperf -s
Note:
- The built-in iPerf version of EAP is iPerf2, the specific version varies from model to model, which can be viewed by executing iperf -v. For instance, iperf version 2.0.5 (08 Jul 2010) pthreads for EAP650-Outdoor v1, while 2.0.13 (21 Jan 2019) pthreads for EAP772v2.
/bin \$ iperf -v
iperf version 2.0.13 (21 Jan 2019) pthreads
- iPerf2 and iPerf3 are two different versions of network testing tools, which cannot be used in combination due to the differences in architecture, design and features. The different versions of iPerf2 maintain the same core functionality, the main difference is reflected in some of the new features, improvements and bug fixes, different versions of iPerf2 can theoretically be used in combination, in order to ensure the accuracy and validity of the test results, it is recommended that you try to use the same version of the iPerf tool.
- For more details about iPerf, run the command iperf -h to show the help information.
Example:
- Measuring the throughput between two APs.
To measure the throughput between the Root AP and Mesh AP can provide a reference for judging the quality of the mesh link. You can use one AP as the iPerf server and the other AP as the iPerf client.
In the iPerf server's side:
/bin \$ iperf -s
Server listening on TCP port 5001
TCP window size: 128 KByte (default)
| [4] local 192.168.0.10 port 5001 connected with 192.168.0.253 port 60456 | |||
| [8] local 192.168.0.10 port 5001 connected with 192.168.0.253 port 60472 | |||
| [6] local 192.168.0.10 port 5001 connected with 192.168.0.253 port 60466 | |||
| [5] local 192.168.0.10 port 5001 connected with 192.168.0.253 port 60454 | |||
| [9] local 192.168.0.10 port 5001 connected with 192.168.0.253 port 60478 | |||
| [ID] Interval | Transfer | Bandwidth | |
| [4] | 0.0-10.1 sec | 307 MBytes | 255 Mbits/sec |
| [6] | 0.0-10.1 sec | 320 MBytes | 266 Mbits/sec |
| [9] | 0.0-10.1 sec | 313 MBytes | 261 Mbits/sec |
| [8] | 0.0-10.1 sec | 325 MBytes | 269 Mbits/sec |
| [5] | 0.0-10.1 sec | 210 MBytes | 174 Mbits/sec |
| [SUM] | 0.0-10.1 sec | 1.44 GBytes | 1.22 Gbits/sec |
In the iPerf client's side:
Client connecting to 192.168.0.10, TCP port 5001
TCP window size: 238 KByte (default)
| [5] local 192.168.0.253 port 60466 connected with 192.168.0.10 port 5001 | |||
| [3] local 192.168.0.253 port 60456 connected with 192.168.0.10 port 5001 | |||
| [4] local 192.168.0.253 port 60454 connected with 192.168.0.10 port 5001 | |||
| [6] local 192.168.0.253 port 60472 connected with 192.168.0.10 port 5001 | |||
| [7] local 192.168.0.253 port 60478 connected with 192.168.0.10 port 5001 | |||
| [ID] Interval | Transfer | Bandwidth | |
| [3] | 0.0-10.0 sec | 307 MBytes | 257 Mbits/sec |
| [7] | 0.0-10.0 sec | 313 MBytes | 263 Mbits/sec |
| [5] | 0.0-10.0 sec | 320 MBytes | 267 Mbits/sec |
| [4] | 0.0-10.0 sec | 210 MBytes | 176 Mbits/sec |
| [6] | 0.0-10.0 sec | 325 MBytes | 272 Mbits/sec |
| [SUM] | 0.0-10.0 sec | 1.44 GBytes | 1.23 Gbits/sec |
2. Measuring the throughput between AP and the client
To measure the throughput between AP and a specific client, you can download and use the same version of iPerf tool on the client, which is available at https://iperf.fr/iperf-download.php.
3.7 cliclientd setctrladdr "inform_url"
Description:
Executing this command is equivalent to configuring an inform URL in the standalone web page of the device or using the Omada Discovery Utility to facilitate Layer-3 adoption and management when the Controller is not on the same LAN as the device.
Syntax:
cliclientd setctrladdr {IP_address | domain_name}
Note:
- the domain name for the controller cannot contain special characters (only "0-9/a-z/A-Z/." are supported), otherwise it will not work.
- This command is not currently supported to configure an inform URL of Cloud-Based Controller for an EAP to enable it to be discovered and managed by the Cloud-Based Controller.
Example:
The IP address of the EAP is 192.168.5.31/24, and the IP address of the controller is 192.168.100.102/24. To configure the controller's inform URL for EAP through the command cliclientd setctrladdr "192.168.100.102" so that it can actively discover the controller and be managed by it.
/bin $ cliclientd setctrladdr "192.168.100.102"
set url:192.168.100.102, discoverPort:0, managePort:0 success.
Then you can see in the EAP's standalone web page that Controller Inform URL field has been populated with the inform URL you entered in the above command, and that the controller has been able to discover the EAP in the pending state and successfully adopt it.

Figure 3-3 How to configure Inform URL in the standalone web
3.8 cliclientd wltool scan
Description:
This command is used to detect the BSS information of each wireless channel in the current environment. When the command cliclientd wltool scan is entered, an active scan will be performed on all allowed working channels, and the scanning results include the total number of BSS on each channel, the maximum RSSI and minimum RSSI of the BSS scanned on each channel, and the channel utilization in both Rx and Tx directions on each channel.
Example:

| 8 | 6 | -79 | -95 | 45 |
| 9 | 0 | -95 | -95 | 33 |
| 10 | 0 | -95 | -95 | 46 |
| 11 | 26 | -40 | -78 | 32 |
| 36 | 21 | -65 | -70 | 35 |
| 40 | 23 | -65 | -72 | 60 |
| 44 | 24 | -63 | -78 | 61 |
| 48 | 19 | -68 | -70 | 11 |
| 149 | 20 | -65 | -77 | 8 |
| 153 | 23 | -56 | -75 | 13 |
| 157 | 10 | -66 | -68 | 10 |
| 161 | 10 | -47 | -76 | 6 |
| 165 | 0 | -95 | -95 | 1 |
3.9 cliclientd wltool sta
Description:
This command is used to view the statistics information of all clients currently associated with the device, including data rate, signal strength, connection time and inactive time between the client and the device.
Use the command cliclientd wltool sta to show the basic statistics of all clients, and use cliclientd wltool "sta mac_address" to show the statistics information of a certain client.
Kindly note:
- Specify the MAC address of the client of which you want to show the detailed statistics, the MAC address should be entered in the format of xx-xx-xx-xx-xx-xx or xx:xx:xx:xx:xx:xx or xxxxxxxxxxxxxx, and it's not case sensitive.
- Compared to viewing client statistics in the Status > Client of the standalone web interface or in the Clients module of the Controller, it is more accurate and real-time to view client statistics through this CLI command.
Syntax:
cliclientd wltool sta
cliclientd wltool "sta mac_address"
Example:
- Show the basic statistics of all clients associated to the device:
| /bin $ cliclientd wltool sta | |
| ifname | channel | addr | | txrate | rxrate | rssi | connect-time | inactive-time |
| ath10 | 48 | fa-6b-f6-8a-87-58 | 6M | 1201M | -27 | 296s | 2s |
| ath11 | 48 | 60-45-2e-92-6d-55 | 137M | 816M | -41 | 192s | 1s |
| ath11 | 48 | 22-e3-e9-81-97-7e | 6M | 1201M | -45 | 28s | 0s |
| total 3 associated stations | |||||||
- Show the detailed statistics of the client whose MAC address is fa-6b-f6-8a-87-58:
/bin \$ cliclientd wltool "sta fa-6b-f6-8a-87-58"
station fa-6b-f6-8a-87-58 :
ifname:ath10
channel:48
rssi:-26dB
maxrssi:-18dB
minrssi:-32dB
connection time:361s
inactive time:1s
average tx rate:172(mbps)
average rx rate:1201(mbps)
last tx data pkt rate:172(mbps)
last rx data pkt rate:1201(mbps)
tx bytes:8443
tx packets:85
tx ucast packets:85
tx mcast packets:0
tx error packets:0
rx bytes:18962
rx packets:241
rx ucast packets:187
rx mcast packets:43
rx error packets:0
rx decrypt error:0
3.10 cliclientd wltool interface
Description:
This command is used to view the configuration of a specified interface (including the wireless mode, ESSID, whether to broadcast SSID, working channel and bandwidth, transmit power, beacon frame interval, and so on) and the statistics of Tx and Rx packets.
Syntax:
cliclientd wltool "interface {config | stats}"
Example:
- Show the configuration of this device's ath10 interface:
/bin $ cliclientd wltool "ath10 config"
ath10 configuration
Wireless Mode: IEEE 802.11axa
Opertion Mode: Master
ESSID: EAP653-01
Broadcast SSID: Enable
Channel: 161
Channel Width: 80MHz
Transmit Power: 22dBm
Beacon Interval: 100ms
DTIM Period: 1
RTS Threshold: 2347
- Show the statistics information of this device's ath10 interface:
/bin $ cliclientd wltool "ath10 stats"
ath10 statistic:
tx bytes:463534
tx packets:2116
tx error packets:1
tx discard packets:3352
rx bytes:43809
rx packets:541
rx error packets:21
rx discard packets:21
channel 161 util(Busy/RX/TX): 16/9/5
3.11 cliclientd (ping)
Description:
The command is used to invoke the Ping tool. Use the command cliclientd pingstart "{host_IP [options]}" to start the ping test. Use the command cliclientd pingstop to stop the ping test.
Syntax:
cliclientd pingstart "{host_IP [options]}"
cliclientd pingstop
Note:
- cliclientd pingstart can be replaced by xping, and cliclientd pingstop can be replaced by xping stop. That is, cliclientd pingstart "192.168.0.1 -w 10" is equivalent to xping "192.168.0.1 -w 10".
- For more about the ping tool, please run the command cliclientd pingstart -h or xping -h to show the help information.
- Always remember to perform cliclientd pingstop to stop it, otherwise the performance of the device may be affected.
Example:
Perform a ping test on the device with IP 192.168.0.253 and set the test to stop automatically after 5 seconds.
/bin $ cliclientd pingstart "192.168.0.253 -w 5"
/bin $ PING 192.168.0.253 (192.168.0.253): 56 data bytes
64 bytes from 192.168.0.253: seq=0 ttl=64 time=2.910 ms
64 bytes from 192.168.0.253: seq=1 ttl=64 time=2.418 ms
64 bytes from 192.168.0.253: seq=2 ttl=64 time=2.817 ms
64 bytes from 192.168.0.253: seq=3 ttl=64 time=2.654 ms
64 bytes from 192.168.0.253: seq=4 ttl=64 time=2.404 ms
--- 192.168.0.253 ping statistics ---
5 packets transmitted, 5 packets received, 0% packet loss
round-trip min/avg/max = 2.404/2.640/2.910 ms
For convenience, you can also perform a ping test by selecting an AP with connected state in Tools > Network Check of the Controller currently.

Figure 3-4 Network Check Tool in Controller
3.12 cliclientd (tcpdump)
Description:
These commands are used to invoke the tcpdump tool. Use the command cliclientd tcpdumpstart "options" to start capturing or filtering packets. Use the command cliclientd tcpdumpstop to stop the process.
Syntax:
cliclientd tcpdumpstart "{options}"
cliclientd tcpdumpstop
Note:
- The string cliclientd tcpdumpstart in this command can be replaced by the string xtcpdump, and cliclientd tcpdumpstop can also be replaced by xtcpdump stop.
- All standard tcpdump parameters are supported. For more about the tcpdump tool, please run the command cliclientd tcpdumpstart -h or xtcpdump -h to show the help information.
~ # cliclientd tcpdumpstart -h
~ # tcpdump version 4.2.1
libpcap version 1.1.1
Usage: tcpdump [-aAbdDefhHIKlLnNOpqRStuUvxX] [-B size] [-c count]
    [-C file_size] [-E algo:secret] [-F file] [-G seconds]
    [-i interface] [-M secret]
    [-r file] [-s snaplen] [-T type] [-w file]
    [-W filecount] [-y datalinktype] [-z command]
    [-Z user] [expression]
- Always remember to perform cliclientd tcpdumpstop and delete the file via rm file_name when you are done capturing packets, otherwise the performance of the device may be affected.
Example:
- To capture the DHCP interaction between the device and the DHCP server and show it in the terminal window, as follows for the DHCP renewal message:
/bin $clicklientd tcpdumpstart "-i br0 udp port 67 or port 68"
/bin $ tcpdump: verbose output suppressed, use -v or -vv for full protocol decode listening on br0, link-type EN10MB (Ethernet), capture size 65535 bytes
23:14:45.576526 IP 192.168.1.105.bootpc > 192.168.1.1.bootps: BOOTP/DHCP, Request from 00:ff:00:39:cf:f1 (oui Unknown), length 311
23:14:45.578654 IP 192.168.1.1.bootps > 192.168.1.105.bootpc: BOOTP/DHCP, Reply, length 300
23:15:17.606485 IP 192.168.1.105.bootpc > 192.168.1.1.bootps: BOOTP/DHCP, Request from 00:ff:00:39:cf:f1 (oui Unknown), length 311
23:15:17.608512 IP 192.168.1.1.bootps > 192.168.1.105.bootpc: BOOTP/DHCP, Reply, length 300

Figure 3-5 Packet Capture Tool in Controller
- To capture all packets flowing through the ath10 interface (wireless packets are not included) and output them to the specified file. Note: the file name must contain a complete path, and the path must be /tmp/logdump. For example, -w /tmp/logdump/file_name, not -w file_name, then you can use TFTP to export the file to your PC and open it with Wireshark. Please refer to 3.13.2 cliclientd debug "hostapd log_type" for how to use TFTP.
/bin $ cliclientd tcpdumpstart "-w /tmp/logdump/capture_test capture_test -i ath10"
tcpdump: WARNING: ath10: no IPv4 address assigned
tcpdump: listening on ath10, link-type EN10MB (Ethernet), capture size 65535 bytes
/bin \$ cliclientd tcpdumpstop
/bin $ ls -al /tmp/logdump
total 16
drwxrwxrwx    3 0    root    0    May 31    14:04 .
drwxr-xr-x    11 0    root    0    May 31    14:03 ..
-rw-r--r--    1 0    root    9985    May 31    14:05    capture_test
3.13 cliclientd debug "hostapd"
Hostapd (Host access point Daemon) is a daemon used to create and manage wireless network access points. Modifying the working channel, bandwidth, transmit power, MAC authentication, Radius authentication and other wireless-related parts are all handled by Hostapd. Hostapd's logs contain detailed information related to the operation of the wireless network, which is useful for diagnosing and solving network problems.
Note: After you get the desired Hostapd logs, please make sure to adjust the hostapd log_level/log_type/log_size to the default state to prevent them from affecting the device's performance.
3.13.1 cliclientd debug "hostapd log_level"
Description:
When the wireless part of the device is abnormal or bugs are found during the working process, we can adjust the log level of Hostapd to make the log content printed out more detailed, so as to quickly locate the cause of the issue.
Syntax:
cliclientd debug "hostapd log_level {error | warning | info | debug | msgdump} [0 | 1]"
cliclientd debug "hostapd log_level"
Parameters:
error | warning | info | debug | msgdump: Specify the level of Hostapd logs to be outputted. The log levels from high to low are error, warning, info, debug and msgdump, it's info by default. Logs that are not lower than the set level will be output. For instance, if the log level is set to info, all error, warning and info messages will be outputted.
0 | 1: Specify whether to output the log messages with the time stamp. It's 0 by default, indicating that the log messages will be outputted without the time stamp. If no value is specified here, the system will follow the previous settings.
Note:
- TP-Link's EAP products adopt two major types of design schemes, and currently only the models adopting Scheme 1 introduced in 3.3 iwconfig support this command.
- Use the command cliclientd debug "hostapd log_type" directly without any parameters to show the current settings.
Example:
- Show which levels of Hostapd logs are outputted currently.
/bin \$ cliclientd debug "hostapd log_level"
/bin \$ Selected interface 'ath11'
Current level: INFO
Timestamp: 0
- Set the log level of hostapd to info, the following are the relevant log messages of a client connecting and disconnecting from the device.
/bin \$ cliclientd debug "hostapd log_level info 1"
/bin \$ Selected interface 'ath11'
OK
......
01-01 00:55:34 ath10: STA dc:6a:e7:10:1a:05 IEEE 802.11: associated
01-01 00:55:34 ath10: AP-STA-CONNECTED dc:6a:e7:10:1a:05
01-01 00:56:00 ath10: STA dc:6a:e7:10:1a:05 IEEE 802.11: disassociated
01-01 00:56:00 ath10: AP-STA-DISCONNECTED dc:6a:e7:10:1a:05
- While if you set the log level of Hostapd to debug, the log messages when a client is connected and disconnected from the device are as follows, you can see more detailed relevant output.
/bin \$ cliclientd debug "hostapd log_level debug 1"
/bin \$ Selected interface 'ath11'
OK
......
01-01 00:59:05 Custom wireless event: 'Manage.auth 30'
01-01 00:59:05 atheros_raw_receive: subtype 0xb len 30
01-01 00:59:05 ath10: Event AUTH (11) received
01-01 00:59:05 New STA
01-01 00:59:05 ap_sta_add: register ap_handle_timer timeout for dc:6a:e7:10:1a:05 (300 seconds - ap_max_inactivity)
01-01 00:59:05 trans sta dc:6a:e7:10:1a:05 state:7 to 1
01-01 00:59:05 update sta dc:6a:e7:10:1a:05 state 1 at time: 1704041945366
01-01 00:59:05 atheros_sta_auth: addr=dc:6a:e7:10:1a:05 status_code=0
01-01 00:59:05 trans sta dc:6a:e7:10:1a:05 state:1 to 2
01-01 00:59:05 update sta dc:6a:e7:10:1a:05 state 2 at time: 1704041945367
01-01 00:59:05 Custom wireless event: 'Manage.assoc_req 167'
01-01 00:59:05 atheros_raw_receive: subtype 0x0 len 167
01-01 00:59:05 ath10: Event ASSOC (0) received
01-01 00:59:05 ath10: STA dc:6a:e7:10:1a:05 IEEE 802.11: associated
01-01 00:59:05 STA did not include WPS/RSN/WPA IE in (Re)AssocReq
01-01 00:59:05 trans dc:6a:e7:10:1a:05 acl's state:10 to 8
01-01 00:59:05 trans dc:6a:e7:10:1a:05 acl's state:8 to 10
01-01 00:59:05 atheros_sta_assoc: addr=dc:6a:e7:10:1a:05 status_code=0 reassoc 0
01-01 00:59:05 trans sta dc:6a:e7:10:1a:05 state:2 to 6
01-01 00:59:05 update sta dc:6a:e7:10:1a:05 state 6 at time: 1704041945373
01-01 00:59:05 ath10: AP-STA-CONNECTED dc:6a:e7:10:1a:05
01-01 00:59:05 IEEE 802.1X: Ignore STA - 802.1X not enabled or forced for WPS
01-01 00:59:05 ath10: hostapd_new_assoc_sta: reschedule ap_handle_timer timeout for dc:6a:e7:10:1a:05 (300 seconds - ap_max_inactivity)
01-01 00:59:20 Custom wireless event: 'STA-TRAFFIC-STATj'
01-01 00:59:20 DISASSOC_REASON19:0xf0003
01-01 00:59:20 ath10: Event DISASSOC (1) received
01-01 00:59:20 ath10: STA dc:6a:e7:10:1a:05 IEEE 802.11: disassociated
01-01 00:59:20 trans sta dc:6a:e7:10:1a:05 state:6 to 7
01-01 00:59:20 update sta dc:6a:e7:10:1a:05 state 7 at time: 1704041960623
01-01 00:59:20 ath10: AP-STA-DISCONNECTED dc:6a:e7:10:1a:05
01-01 00:59:20 ap_free_sta: cancel ap_handle_timer for dc:6a:e7:10:1a:05
3.13.2 cliclientd debug "hostapd log_type"
Description:
The command is used to configure how Hostapd logs are outputted.
Syntax:
cliclientd debug "hostapd log_type {file file_name | stdout} [0 | 1]"
cliclientd debug "hostapd log_type"
Parameters:
file file_name | stdout: Specify how Hostapd logs are outputted. It is stdout by default, the log messages will be displayed in the terminal windows opened with console port via the stdout (standard out) stream, not SSH for now. When set to file, the log messages will be outputted as a file named file_name, which is defined by yourself in the folder /tmp/logdump.
0 | 1: Specify whether to output the log messages with the time stamp. It is 0 by default, indicating that the log messages will be outputted without the time stamp. While if you set it to 1, the log messages will be outputted with the time stamp.
Note:
- Among the models that support cliclientd debug "hostapd log_level {error | warning | info | debug | msgdump} [0 | 1]" command, only 802.11AC (WiFi5) models support this command to configure how to output the Hostapd log messages, other models will also support this command in the future, please pay attention to the TP-Link official website to obtain the latest firmware. The Hostapd logs will be sent to the console port via stdout stream for the other models which don't support this command, and the log cannot be accessed in the current SSH connection which will be adapted in the future.
- Use the command cliclientd debug "hostapd log_type" directly without any parameters to show the current settings.
- When the size of hostapd log exceeds the pre-set log size, it will be packed into a zip file and named hostapd_logx_xxxx_xxxxx.tar.gz. A total of 10 zip files can be stored, and when the number exceeds 10, the newly generated zip file will overwrite the old one. These files will be erased after the device is rebooted or reset again.
Example:
- Configure the device to output the Hostapd logs into a file and the logs are required to be outputted with the time stamp via cliclientd debug "hostapd log_type hostapd_test 1", then enter ls -al /tmp/logdump to check the real-time log file and generated zip files.
/bin \$ cliclientd debug "hostapd log_type file hostapd_test 1" Selected interface 'bkhap1' log_file:[hostapd_test] , OK
/bin & ls -al /tmp/logdump total 288 drwxrwxrwx 3 0 root 0 May 31 09:30 . drwxr-xr-x 11 0 root 0 May 31 09:22 .. -rw-r--r-- 1 0 root 74621 May 31 09:30 hostapd_test drwxr-xr-x 2 0 root 0 Jan 1 1970 bk_scan_debug -rwxr-xr-x 1 0 root 12113 May 31 09:16 hostapd_log0_0531_091605.tar.gz -rwxr-xr-x 1 0 root 5598 May 31 09:17 hostapd_log1_0531_091739.tar.gz -rwxr-xr-x 1 0 root 3892 May 31 09:19 hostapd_log2_0531_091909.tar.gz -rwxr-xr-x 1 0 root 11949 May 31 09:20 hostapd_log3_0531_092027.tar.gz -rwxr-xr-x 1 0 root 9325 May 31 09:21 hostapd_log4_0531_092147.tar.gz -rwxr-xr-x 1 0 root 4059 May 31 09:23 hostapd_log5_0531_092323.tar.gz -rwxr-xr-x 1 0 root 4053 May 31 09:25 hostapd_log6_0531_092507.tar.gz -rwxr-xr-x 1 0 root 3996 May 31 09:26 hostapd_log7_0531_092648.tar.gz -rwxr-xr-x 1 0 root 4047 May 31 09:28 hostapd_log8_0531_092831.tar.gz -rwxr-xr-x 1 0 root 3866 May 31 09:30 hostapd_log9_0531_093003.tar.gz
- Show how the Hostapd log messages are outputted currently:
/bin \$ cliclientd debug "hostapd log_type"
/bin $ Selected interface 'bkhap1'
Current log type: file
Timestamp: 1
Addition:
You can also export the log file and generated zip files to a local host via TFTP for viewing.
For instance, you can do this if the product is working abnormally to provide them to the TP-Link R&D department.
There are many free Simple File Transfer Protocol (TFTP) servers on the Internet, which are able to perform the file transfer task, such as tfpd32/tfpd64 software, you can choose the appropriate TFTP server according to your actual needs. We are here to briefly describe how to export the target file to the local host via TFTP:
- Open the TFTP server at first.
- Change the current directory in SSH via the command cd /tmp/logdump.
- Enter tftp -pl file_name local_IP to export the file to the local host, file_name is the file's name you want to export, local_IP is the IP address of the PC where TFTP server is located. (Please make sure your PC's firewall does not isolate it),
Then you can find the exported file in the folder where the tftpd64 software is installed.
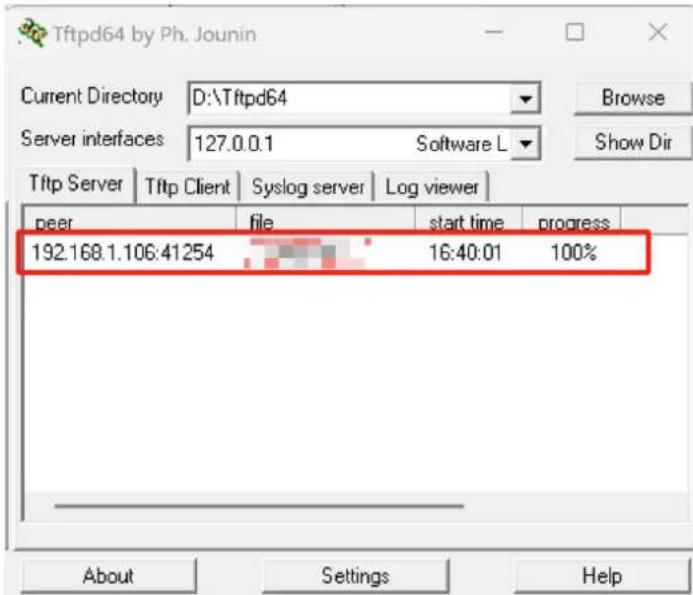
Figure 3-6 Display when the file is successfully transferred using Tftpd64
3.13.3 cliclientd debug "hostapd log_size"
Description:
The command is used to configure the size for Hostapd log files when the log type is set to "file". The system will automatically compress the log file and store it in /tmp/logdump every time the file reaches the specified size. Ten log files can be retained at most. After the file number reaches 10, the earliest one will be overridden.
Syntax:
cliclientd debug "hostapd log_size [size]"
cliclientd debug "hostapd log_size"
Parameters:
size: Specify the size for the Hostapd log files in bytes. Valid values are from 256KB to 10MB, and the new content will overwrite the old content, and the file size is 256 KB (262144 bytes) by default. Please convert values into bytes before running the command cliclientd debug "hostapd log_size [size]".
Note:
- Among the models that support cliclientd debug “hostapd log_level {error | warning | info | debug | msgdump} [0 | 1]” command, only 802.11AC (WiFi5) models support this command to configure the size for Hostapd log files, other models will also support this command in the future, please pay attention to the TP-Link official website to obtain the latest firmware.
- It is recommended that you change the file size back to 256 KB after debugging. Otherwise, the log files will occupy too much system memory and affect performance.
- Use the command cliclientd debug "hostapd log_size" directly without any parameters to show the current settings.
Examples:
- Show how the Hostapd log messages are outputted currently
/bin $ cliclientd debug "hostapd log_size"
/bin $ Selected interface 'ath11'
Current log size: 262144
- Show how the Hostapd log messages are outputted currently: Configure the size for Hostapd files as 1 MB(1048576 B):
/bin $ cliclientd debug "hostapd log_size 1048576"
/bin $ Selected interface 'ath11'
OK
3.14 cliclientd debug "hostapd_cli get_ptk"
Description:
This command is used to obtain the PTK of a specific wireless client when it is associated with EAP. PTK is used to encrypt the unicast packets communicated between the AP and wireless clients. PTK is unique for each client that the AP communicates with, and is different each time a client associates with the AP. Generally, we can enter wpa-pwd in Wireshark > Edit > Preferences > Protocols > IEEE 802.11 > Decryption keys for decryption. However, the Wireshark must be able to capture the complete association process between a client and an AP in this mode.
The command introduced in this chapter is not required to capture the complete association process of the wireless client. It is useful in scenarios where clients are prohibited from disconnecting from the Wi-Fi, such as when there are a lot of security devices in the network, or when the wireless network is down and some clients' wireless packets need to be captured for troubleshooting.
Syntax:
cliclientd debug "hostapd_cli get_ptk xx:xx:xx:xx:xx- i interface"
Note:
- The string xx:xx:xx:xx:xx:xx in this command refers to the mac address of the wireless client. The mac address format is case insensitive. " xx:xx:xx:xx:xx " can also be replaced with " xx-xx-xx-xx-xx-xx ".
- Currently, TP-Link's EAP products adopt two major types of design schemes, and currently only the models adopting Scheme 1 introduced in 3.3 iwconfig support this command, and some of these models may not have been adapted to it yet, please wait for firmware updates on the official website.
- Some wireless clients such as many Android phones use randomly generated MAC addresses when connecting to Wi-Fi instead of the client's real WLAN MAC address. Moreover, it is difficult for us to determine which wireless interface of the AP the client is connected to. We strongly recommend that customers use the command cliclientd wltool sta to obtain the MAC address and wireless interface at first, and then enter cliclientd debug "hostapd_cli get_ptk xx:xx:xx:xx:xx- i interface" get the PTK.
- The PTK in the client's association process is different each time, so please make sure that the captured packets and PTK are in the same association.
- The wireshark version must be at least v3.4.6.
- Currently, this command does not support WPA3 encryption (only WPA/WPA2-PSK, WPA/WPA2-Enterprise, and PPSK are supported.)
Example:
- Connect the wireless client to AP at first.
- Capture the wireless packets via Wireshark for a few time, please refer to How to Capture the Wireless Packets on MacBook | TP-Link to learn how to capture wireless packets. Of course, you can also search for other packet capture methods online.

- Obtain the WLAN MAC address and the wireless interface connected to the AP at first.

- Obtain the PTK generated by the client and AP during this connection.
/bin $ cliclientd debug "hostapd_cli get_ptk dc-6a-e7-10-1a-05 -i ath10"
f7bb0f4950ac59cc2a88c52b47a98d31
- In the Wireshark, go to Edit > Preferences > Protocols > IEEE 802.11 > Decryption keys to select tk as key type and enter the PTK obtained in step 4.


- Finally, you can see that the encrypted Qos Data packets have been decrypted.

3.15 dmesg
Description:
The default action is to read all messages from kernel ring buffer and the driver. These messages contain detailed information about the system boot process, such as memory initialization, device driver loading, filesystem mounts, etc. The output of dmesg is useful for diagnosing system problems, monitoring hardware status, and debugging software. For example, if you encounter problems during EAP startup, you can check the output of dmesg for possible error messages. For a more detailed description, please refer to the Linux manpage.
Syntax:
dmesg
Note:
The size of the file does not exceed 128KB for most models, and the new content will overwrite the old content.
Example:
- When the root AP in the mesh network modifies the working channel from channel 36 to channel 161, the dmesg printout of the mesh AP is shown in the figure below. You can clearly see that the output of dmesg records in detail the process of the mesh AP successfully completing the channel switching and re-associating to the root AP. Accordingly, if there are some abnormalities during the process, we can also clearly see the kernel or driver error messages, which can help quickly locate the cause of the problem.
/bin $ dmesg

[22900.339668] wlan: [0:I:ANY] ieee80211_mgmt_sta_send_csa_rx_nl_msg: valid=1 chan=161 width=80 sec=0 cfreq2=0
[22900.339668]

[22900.339884] wlan: [0:E:CMN_MLME] wlan_pdev_mlme_vdev_sm_csa_restart: Starting MVR for Pdev 0
[22900.351033] wlan: [0:W:ANY] ol_ath_vdev_beacon_template_update: Channel switch is ON - Ignore Template update
[22900.368195] wlan: [0:W:ANY] ol_ath_vdev_beacon_template_update: Channel switch is ON - Ignore Template update
[22900.442104] wlan: [0:I:ANY] icce80211_mgmt_sta_send_csa_rx_nl_msg: valid=1 chan=161 width=80 scc=0 cfreq2=0
[22900.749257] wlan: [0:I:ANY] ieee80211_mgmt_sta_send_csa_rx_nl_msg: valid=1 chan=161 width=80 sec=0 cfreq2=0
[22900.851667] wlan: [0:I:ANY] ieee80211_mgmt_sta_send_csa_rx_nl_msg: valid=1 chan=161 width=80 sec=0 cfreq2=0
[22901.160066] wlan: [0:I:ANY] icce80211_mgmt_sta_send_csa_rx_nl_msg: valid=1 chan=161 width=80 scc=0 cfreq2=0
[22901.331487] wlan: [0:I:MBSSIE] ol_ath_pdev_csa_status_event_handler: vdev_id: 0
[22901.331573] wlan: [0:I:MBSSIE] ol_ath_pdev_csa_status_event_handler: vdev_id: 1
[22901.337704] wlan: [0:I:MBSSIE] ol_ath_pdev_csa_status_event_handler: vdev_id: 4
[22901.345157] wlan: [0:E:CMN_MLME] wlan_pdev_mlme_vdev_sm_seamless_chan_change: Starting MVR Vdev 5 Pdev 0
[22901.352230] wlan: [0:E:CMN_MLME] mlme_multivdev_restart: Sending MVR for Pdev 0
[22901.361942] wlan: [0:E:CMN_MLME] mlme_vdev_multivdev_restart_fw_send_cb: (vdev-id:0) des chan(36)
[22901.368988] wlan: [0:I:CMN_MLME] phymode for mvr: 18
[22901.896306] wlan: [0:I:CMN_MLME] vdev[0] ieee chan:36 freq:5180
[22901.896454] wlan: [0:D::dfs] Skip CAC on NON-DFS chan
[22901.901598] wlan: [0:I:ANY] vdev[0]: Mgt Rate:6000(kbps)
[22901.906296] wlan: [0:I:ANY] ol_ath_vap_sct_param: Now supported BCAST RATE is 6000(kbps) rate code: 0x10000003
[22901.911560] wlan: [0:I:ANY] ol_ath_vap_set_param: Now supported MCAST RATE 6000(kbps), rate code: 0x10000003
[22901.921454] wlan: [0:I:CMN_MLME] vdev[1] ieee chan:36 freq:5180
[22901.931428] wlan: [0:D::dfs] Skip CAC on NON-DFS chan
[22901.937726] wlan: [0:I:ANY] vdev[1]: Mgt Rate:6000(kbps)
[22901.942200] wlan: [0:I:ANY] ol_ath_vap_set_param: Now supported BCAST RATE is 6000(kbps) rate code: 0x10000003
[22901.947584] wlan: [0:I:ANY] ol_ath_vap_set_param: Now supported MCAST RATE 6000(kbps), rate code: 0x10000003
[22901.957385] wlan: [0:I:CMN_MLME] vdev[4] ieee chan:36 freq:5180
[22901.967471] wlan: [0:D:dfs] Skip CAC on NON-DFS chan
[22908.175510] wlan: [0:I:ANY] ieee80211_assoc_state_run_event: ieee80211_assoc_state_run_event: vap: 5(0x913e0060) event: 13
[22908.185521] wlan: [0:I:ANY] ieee80211_connection_state_connected_event: vdev:5(0x913e0060) event: 5
[22908.185593] wlan: [0:I:ANY] wlan_candidate_list_free: SSID:mesh_00ff003b69b0 bssid:22:ff:00:3b:69:b1 score:4486
[22908.194923] br0: port 2(sta1) entered disabled state
[22908.199327] wlan: [0:I:ANY] ol_ath_update_stats_event_handler: ol_ath_update_stats_event_handler: pdev object (id: 255) is NULL
[22908.206264] wlan: [0:I:ANY] ol_ath_update_stats_event_handler: ol_ath_update_stats_event_handler: pdev object (id: 255) is NULL
[22908.216530] wlan: [0:I:ANY] ol_ath_update_stats_event_handler: ol_ath_update_stats_event_handler: pdev object (id: 255) is NULL
[22908.228254] wlan: [0:I:ANY] ol_ath_update_stats_event_handler: ol_ath_update_stats_event_handler: pdev object (id: 255) is NULL
[22908.240141] wlan: [0:I:ANY] ol_ath_update_stats_event_handler: ol_ath_update_stats_event_handler: pdev object (id: 255) is NULL
[22908.258655] wlan: [0:I:ANY] wlan_bss_node_freed_handler: wlan_bss_node_freed_handler for vap: 5 (0x913e0060)
[22908.265551] wlan: [0:I:ANY] ieee80211_connection_state_init_event: vdev:5(0x913e0060) event: 14
[22908.752191] wlan: [0:E:NSS] osif_nss_wifili_update_wds_activeinfo: [nss-wifili]: Could not set astenty active for hw_idx = 190 due to ast NULL
[22917.757174] wlan: [3137:I:ANY] wlan_cfg80211_get_wideband_support: Sending wideband support: 0
[22917.769730] wlan: [3137:I:ANY] wlan_cfg80211_connect: DES SSID SET=mesh_00ff003b69b0
[22917.774640] wlan: [3137:I:ANY] wlan_cfg80211_connect: DES BSSID SET=22:ff:00:3b:69:b1
[22917.782622] wlan: [3137:E:mlme] wlan_mlme_stop_sta_vdev: connection stop failed
[22917.805504] wlan: [0:I:ANY] ieee80211_connection_state_init_event: vdev:5(0x913e0060) event: 1
[22917.814352] wlan: [0:I:ANY] ieee80211_candidate_list_print: Num of entries: 1
[22917.822921] wlan: [0:I:ANY] ieee80211_candidate_list_print: SSID:mesh_00ff003b69b0 bssid:22:ff:00:3b:69:b1 score:4986
[22917.830103] wlan: [0:I:ANY] ieee80211_connection_state_init_event: AP list found, move to connecting state
[22917.840681] wlan: [0:I:ANY] ieee80211_connection_state_connecting_entry: vdev:5(0x913e0060) entry
[22917.850223] wlan: [0:I:ANY] wlan_candidate_list_get: Selected candidate is ssid:mesh_00ff003b69b0 bssid:22:ff:00:3b:69:b1
[22917.859294] wlan: [0:E:CMN_MLME] wlan_pdev_mlme_vdev_sm_scamless_chan_change: Starting MVR Vdev 4 Pdev 0
[22917.870204] wlan: [0:E:CMN_MLME] mlme_multivdev_restart: Sending MVR for Pdev 0
[22917.879715] wlan: [0:E:CMN_MLME] mlme_vdev_multivdev_restart_fw_send_cb: (vdev-id:0) des chan(161)
[22917.886740] wlan: [0:I:CMN_MLME] phymode for mvr: 18
[22918.425195] wlan: [0:I:CMN_MLME] vdev[0] ieee chan:161 freq:5805
[22918.425925] wlan: [0:I:ANY] vdev[0]: Mgt Rate:6000(kbps)
[22918.430317] wlan: [0:I:ANY] ol_ath_vap_set_param: Now supported BCAST RATE is 6000(kbps) rate code: 0x10000003
[22918.435628] wlan: [0:I:ANY] ol_ath_vap_set_param: Now supported MCAST RATE 6000(kbps), rate code: 0x10000003
[22918.445560] wlan: [0:I:CMN_MLME] vdev[1] ieee chan:161 freq:5805
[22918.456025] wlan: [0:I:ANY] vdev[1]: Mgt Rate:6000(kbps)
[22918.461405] wlan: [0:I:ANY] ol_ath_vap_set_param: Now supported BCAST RATE is 6000(kbps) rate code: 0x10000003
[22918.466716] wlan: [0:I:ANY] ol_ath_vap_set_param: Now supported MCAST RATE 6000(kbps), rate code: 0x10000003
[22918.476589] wlan: [0:I:CMN_MLME] vdev[4] ieee chan:161 freq:5805
[22918.905637] wlan: [0:I:ANY] wlan_bss_node_freed_handler: wlan_bss_node_freed_handler for vap: 5 (0x913e0060)
[22918.906155] wlan: [0:I:ANY] |NODE| vap-5(sta1):ieee80211_setup_node forcing sta to associate in 3D mode
[22918.914637] wlan: [0:I:ANY] wlan_bss_node_freed_handler; wlan_bss_node_freed_handler for vap; 5 (x913e-ee-ee-ee-ee-ee-ee-ee-ee-ee-ee-ee-ee-ee-ee-ee-ee-ee-ee-ee-ee-ee-ee-ee-ee-ee-ee-ee-ee-ee-ee-ee-ee-ee-ee-ee-ee-ee-ee-ee-ee-ee-ee-ee-ee-ee-ee-ee-ee-ee-ee-ees-
[22918.928619] wlan; [O:I:ANY] wlan_scan_update_channel_list:num_chan; 25
[22918.937149] wlan; [O:E:ANY] ol_get_rate_code; Rate code not found
[22918.943302] wlan; [O:I:ANY] ieee80211_connection_state_connecting_event; vdev::5(ox913e-ee-ee-ee-ee-ee-ee-ee-ee-ee-ee-ee-ee-ee-ee-ee-ee-ee-ee-ee-ee-ee-ee-ee-ee-ee-ee-ee-ee-ee-ee-ee-ee-ee-ee-ee
- If the device is currently working on fixed channel 161, when we configure its channel as Auto, it will perform auto-channel-select process, and then adjust the working channel to channel 157 on its own. The following is the detailed output of the command dmesg of the device performing the auto-channel-select process.
/bin \$ dmesg
[70364.413490] Set_AutoChannelSel_Proc: Alg = 3
[70364.418573] [AutoChSelBuildChannelListFor5G] ChListNum5G = 9
[70364.424331] AutoChSelScanStart: IsABand = 1, ChannelListNum = 8
[70364.430442] mt7915_apply_dpd_flatness_data: eeprom 0x62 bit 0 is 0, do runtime cal
[70364.430588] ExtEventBeaconLostHandler::FW EVENT (00:ff:00:3b:69:b1), Reason 0x10
[70364.430591] AP Beacon OFF!!!
[70364.431493] ExtEventBeaconLostHandler::FW EVENT (06:ff:00:3b:69:b1), Reason 0x10
[70364.431496] AP Beacon OFF!!!
[70364.431755] ExtEventBeaconLostHandler::FW EVENT (22:ff:00:3b:69:b1), Reason 0x10
[70364.431757] AP Beacon OFF!!!
[70364.469519] MtCmdChannelSwitch: ctrl_chl=36, ctrl_ch2=0, cent_ch=36 DBDCIdx=1, ChBand=1, BW=0, TXStream=2, RXStream=2, scan(1)
[70364.489425] MtCmdSetTxRxPath: ctrl_chl=36, ctrl_ch2=0, cent_ch=36, RxPath=3, BandIdx=1, ChBand=1, BW=0, TXStream=2, RXStream=3, scan(1)
[70364.632083] ExtEventBeaconLostHandler::FW EVENT (00:ff:00:3b:69:b1), Reason 0x10
[70364.639492] AP Beacon OFF!!!
[70364.642743] ExtEventBeaconLostHandler::FW EVENT (06:ff:00:3b:69:b1), Reason 0x10
[70364.650136] AP Beacon OFF!!!
[70364.653385] ExtEventBeaconLostHandler::FW EVENT (22:ff:00:3b:69:b1), Reason 0x10
[70364.660779] AP Beacon OFF!!!
[70364.701496] mt7915_apply_dpd_flatness_data: eeprom 0x62 bit 0 is 0, do runtime cal
[70364.709092] MtCmdChannelSwitch: ctrl_chl=40, ctrl_ch2=0, cent_ch=40 DBDCIdx=1, ChBand=1, BW=0, TXStream=2, RXStream=2, scan(1)
[70364.728966] MtCmdSetTxRxPath: ctrl_chl=40, ctrl_ch2=0, cent_ch=40, RxPath=3, BandIdx=1, ChBand=1, BW=0, TXStream=2, RXStream=3, scan(1)
[70364.941559] mt7915_apply_dpd_flatness_data: eeprom 0x62 bit 0 is 0, do runtime cal
[70364.949166] MtCmdChannelSwitch: ctrl_chl=44, ctrl_ch2=0, cent_ch=44 DBDCIdx=1, ChBand=1, BW=0, TXStream=2, RXStream=2, scan(1)
[70364.969051] MtCmdSetTxRxPath: ctrl_chl=44, ctrl_ch2=0, cent_ch=44, RxPath=3, BandIdx=1, ChBand=1, BW=0, TXStream=2, RXStream=3, scan(1)
[70365.181535] mt7915_apply_dpd_flatness_data: eeprom 0x62 bit 0 is 0, do runtime cal
[70365.189143] MtCmdChannelSwitch: ctrl_chl=48, ctrl_ch2=0, cent_ch=48 DBDCIdx=1, ChBand=1, BW=0, TXStream=2, RXStream=2, scan(1)
[70365.209011] MtCmdSetTxRxPath: ctrl_chl=48, ctrl_ch2=0, cent_ch=48, RxPath=3, BandIdx=1, ChBand=1, BW=0, TXStream=2, RXStream=3, scan(1)
[70365.421496] mt7915_apply_dpd_flatness_data: eeprom 0x62 bit 0 is 0, do runtime cal
[70365.429102] MtCmdChannelSwitch: ctrl_chl=149, ctrl_ch2=0, cent_ch=149 DBDCIdx=1, ChBand=1, BW=0, TXStream=2, RXStream=2, scan(1)
[70365.449164] MtCmdSetTxRxPath: ctrl_chl=149, ctrl_ch2=0, cent_ch=149, RxPath=3, BandIdx=1, ChBand=1, BW=0, TXStream=2, RXStream=3, scan(1)
[70365.661520] mt7915_apply_dpd_flatness_data: eeprom 0x62 bit 0 is 0, do runtime cal
[70365.669123] MtCmdChannelSwitch: ctrl_chl=153, ctrl_ch2=0, cent_ch=153 DBDCIdx=1, ChBand=1, BW=0, TXStream=2, RXStream=2, scan(1)
[70365.689152] MtCmdSetTxRxPath: ctrl_chl=153, ctrl_ch2=0, cent_ch=153, RxPath=3, BandIdx=1, ChBand=1, BW=0, TXStream=2, RXStream=3, scan(1)
[70365.901538] mt7915_apply_dpd_flatness_data: eeprom 0x62 bit 0 is 0, do runtime cal
[70365.909145] MtCmdChannelSwitch: ctrl_chl=157, ctrl_ch2=0, cent_ch=157 DBDCIdx=1, ChBand=1, BW=0, TXStream=2, RXStream=2, scan(1)
[70365.929178] MtCmdSetTxRxPath: ctrl_chl=157, ctrl_ch2=0, cent_ch=157, RxPath=3, BandIdx=1, ChBand=1, BW=0, TXStream=2, RXStream=3, scan(1)
[70366.141510] mt7915_apply_dpd_flatness_data: eeprom 0x62 bit 0 is 0, do runtime cal
[70366.149113] MtCmdChannelSwitch: ctrl_chl=161, ctrl_ch2=0, cent_ch=161 DBDCIdx=1, ChBand=1, BW=0, TXStream=2, RXStream=2, scan(1)
[70366.169141] MtCmdSetTxRxPath: ctrl_chl=161, ctrl_ch2=0, cent_ch=161, RxPath=3, BandIdx=1, ChBand=1, BW=0, TXStream=2, RXStream=3, scan(1)
[70366.381445] ================= Record
[70366.388867] Channel 36 : Busy Time = 1924, Skip Channel = FALSE,BwCap = TRUE
[70366.396287] Channel 40 : Busy Time = 1934,Skip Channel = FALSE,BwCap = TRUE
[70366.403696] Channel 44 : Busy Time = 3103,Skip Channel = FALSE,BwCap = TRUE
[70366.411103] Channel 48 : Busy Time = 4298,Skip Channel = FALSE,BwCap = TRUE
[70366.418497] Channel 149 : Busy Time = 1465,Skip Channel = FALSE,BwCap = TRUE
[70366.425903] Channel 153 : Busy Time = 1800,Skip Channel = FALSE,BwCap = TRUE
[70366.433312] Channel 157 : Busy Time = 429,Skip Channel = FALSE,BwCap = TRUE
[70366.440706] Channel 161 : Busy Time = 437,Skip Channel = FALSE,BwCap = TRUE
[70366.448107] ================= Record
[70366.455524] Rule 3 Channel Busy time value : Select Primary Channel 157
[70366.462149] Rule 3 Channel Busy time value : Min Channel Busy = 1800
[70366.468501] Rule 3 Channel Busy time value : BW = 80
4 Public commands
The commands described in this chapter are some of the common commands natively supported (not including the commands iwconfig/ifconfig/dmesg mentioned in the previous sections) by the Linux system. The specific commands supported can be obtained by typing help in the terminal, and a more detailed description of each command can be found in the manpage of Linux.
/bin \$ help
Built-in commands:
. : [ [[ alias bg break cd chdir command continue echo eval exec exit export false fg hash help jobs kill let local printf pwd read readonly return set shift source test times trap true type ulimit umask unalias unset wait
4.1 top
Description:
The top program provides a dynamic real-time view of a running system. It can display system summary information as well as a list of processes or threads currently being managed by the Linux kernel. For a more detailed description you can refer to the manpage of the Linux.
Syntax:
top
Note:
Although we can also click on the device in the Controller to go to Details > Overview in the right column to view the CPU and memory utilization as the picture below, due to the limitation of the refresh rate, it is more accurate to use the command top to view the CPU and memory utilization of the device in real time.

Figure 4-1 CPU and Memory Utilization displayed in Controller
Example:
| /bin $ topMem: 259816K used, 154840K free, 0K shrd, 1100K buff, 1804K cachedCPU: 0% usr 1% sys 0% nic 94% idle 0% io 1% irq 3% sirqLoad average: 1.32 1.31 1.09 2/151 31237 | ||||||
| PID | PPID USER | STAT | VSZ %VSZ %CPU COMMAND | |||
| 27704 | 6198 1 | R | 1240 | 0% | 2% top | |
| 417 | 2 0 | SW< | 0 | 0% | 1% [scheduler_threa] | |
| 2433 | 1 0 | S | 7552 | 2% | 0% /usr/bin/eap-cs | |
| 283 | 1 0 | S | 7288 | 2% | 0% /usr/bin/uclited | |
| 3137 | 1 0 | S | 5440 | 1% | 0% wpa_supplicant -g /var/run/wpa_supplic | |
| 556 | 1 0 | S | 5140 | 1% | 0% hostapd -g /var/run/hostapd/global -P | |
| 2414 | 1 0 | S | 4616 | 1% | 0% /usr/bin/httpd_portal | |
| 2417 | 1 0 | S | 4588 | 1% | 0% /usr/bin/cloud-brd -c /etc/cloud_conf | |
| 281 | 1 0 | S | 3224 | 1% | 0% /usr/bin/eap-mesh | |
| 318 | 1 0 | S | 3208 | 1% | 0% /usr/bin/tpsyslogd | |
| 2420 | 1 0 | S | 2792 | 1% | 0% /usr/bin/tdpd | |
| 274 | 1 0 | S | 1832 | 0% | 0% /usr/bin/radius | |
| 270 | 1 0 | S | 1636 | 0% | 0% /usr/bin/dhcp6c -fd br0 | |
| 10923 | 1 0 | S | 1496 | 0% | 0% nrd -d -C /tmp/nrd.conf | |
| 275 | 1 0 | S | 1400 | 0% | 0% /usr/bin/auth-time | |
| 375 | 1 0 | S | 1392 | 0% | 0% /usr/sbin/snmpd -L -c /tmp/snmp/snmpd. | |
| 307 | 1 0 | S | 1376 | 0% | 0% /usr/bin/client-state | |
| 272 | 1 0 | S | 1316 | 0% | 0% /usr/bin/msg-center | |
| 306 | 1 0 | S | 1264 | 0% | 0% /usr/bin/cliserverd | |
| 352 | 1 0 | S | 1240 | 0% | 0% syslogd -C -l 7 | |
4.2 ps
Description:
Entering ps can obtain the information about a selection of the active processes. For a more detailed description you can refer to the manpage of the Linux.
Syntax:
ps
Example:
/bin $ ps
PID USER COMMAND
10 init
20 [kthreadd]
30 [ksoftirqd/0]
50 [kworker/0:0H]
70 [rcu_preempt]
80 [rcu_sched]
90 [rcu_bh]
100 [migration/0]
......
10923 0 nrd -d -C /tmp/nrd.conf
24820 0 [kworker/u4:3]
29451 0 [kworker/u4:0]
31607 0 [kworker/u4:1]
32637 0 [kworker/u4:2]
32643 0 sleep 10
32655 1 ps
- OVERVIEW
- HOW TO USE THE CLI
- ACCESSING THE CLI
- VIA SSH
- ENABLE SSH LOGIN FIRST
- ACCESS THE EAP VIA SSH
- VIA TERMINAL IN CONTROLLER
- CONVENTIONS
- DEBUG COMMANDS
- CLICLIENTD RESET
- SYNTAX
- NOTE
- EXAMPLE
- RESTART
- DESCRIPTION
- IWCONFIG
- SCHEME
- IFCONFIG
- IWLIST
- PARAMETERS
- IPERF
- MEASURING THE THROUGHPUT BETWEEN AP AND THE CLIENT
- CLICLIENTD SETCTRLADDR "INFORM_URL
- CLICLIENTD WLTOOL SCAN
- CLICLIENTD WLTOOL STA
- KINDLY NOTE
- CLICLIENTD WLTOOL INTERFACE
- CLICLIENTD (PING)
- CLICLIENTD (TCPDUMP)
- CLICLIENTD DEBUG "HOSTAPD
- CLICLIENTD DEBUG "HOSTAPD LOG_LEVEL
- CLICLIENTD DEBUG "HOSTAPD LOG_TYPE
- ADDITION
- CLICLIENTD DEBUG "HOSTAPD LOG_SIZE
- EXAMPLES
- CLICLIENTD DEBUG "HOSTAPD_CLI GET_PTK
- DMESG
- PUBLIC COMMANDS
- TOP
- PS
Brand : TP-LINK
Model : EAP653 UR
Category : NAS