VS11 - Measurement PCE Instruments - Free user manual and instructions
Find the device manual for free VS11 PCE Instruments in PDF.

User questions about VS11 PCE Instruments
0 question about this device. Answer the ones you know or ask your own.
Ask a new question about this device
Download the instructions for your Measurement in PDF format for free! Find your manual VS11 - PCE Instruments and take your electronic device back in hand. On this page are published all the documents necessary for the use of your device. VS11 by PCE Instruments.
USER MANUAL VS11 PCE Instruments
Southpoint Business Park
Ensign way
Hampshire / Southampton
United Kingdom, SO31 4RF
From outside UK: +44
Tel: (0) 2380 98703 0
Fax: (0) 2380 98703 9
info@industrial-needs.com
www.pce-instruments.com/english
www.pce-instruments.com
Instruction Manual
Vibration Meter
Switch/Sensor
PCE-VS11
PCE-VS12

natural_image
Exterior view of a cylindrical electronic device with green accent band (no readable text or symbols)
natural_image
Metallic cylindrical mechanical component with threaded top and base, no visible text or symbolsInhaltsverzeichnis
1.Application....4
2. The Devices at a Glance......4
3. Connectors....5
3.1.Power Supply....5
3.2.Relay Output....5
3.3.USB Interface....6
5.Measuring in the Time Domain....9
6.Measuring in the Frequency Range (FFT)....11
7. Teach-in Function....12
8. Measuring Points on Rotating Machines....13
8.1.General....13
8.2.Attachment....13
8.3.Attachment Recommendations to ISO 10816-1....13
9.Vibration Monitoring with Standard Limits....14
10. Installing the PC Software....17
11.Integration of VS11/12 with other Software....18
12.Firmware Update....18
13.Technical Data....20
1. Application
The PCE-VS11/12 vibration switches are designed to monitor vibration amplitudes on rotating machines (see. Chapter 9). When a given amplitude is exceeded an alarm signal or automatic shutdown is triggered via the relay output. Similarly, the devices can be used as impact detectors, for example, to report collisions.
The PCE-VS11 and PCE-VS12 devices measure and monitor vibration in both the time and frequency domain, for this reason they can selectively monitor individual frequency band components.
The devices possess a piezoelectric precision accelerometer and micro-controller-based electronics. This ensures high reliability and reproducibility. The devices are configured via a USB interface and free software. Due to its wide range of settings PCE-VS11/12 can be adjusted to every application, from the measurement of low vibrations to the detection of high-frequency shock accelerations.
2. The Devices at a Glance
PCE-VS11:

text_image
cable gland locking screw for teach-in button status LEDs mounting studPCE-VS12:
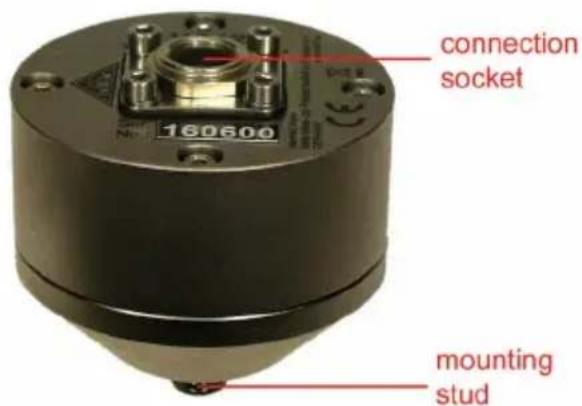
text_image
connection socket 160600 mounting stud3. Connectors
3.1. Power Supply
The PCE-VS11 vibration switch operates with DC voltage in monitoring mode, the terminals "+ U" (positive) and "0V" (negative/ground) must be connected inside the casing. The supply voltage range is 5 to 26 V. Power consumption is less than 100 mA.

natural_image
Close-up of a mechanical electronic component with green circuit board and metallic base (no visible text or symbols)Figure 1: Open PCE-VS11 with terminals for power supply / relay output and USB socket
During parameter setting the PCE-VS11 obtains its power via the USB cable.
The PCE-VS12 is powered by connecting a USB cable to the 8-pin socket. Alternatively, a DC voltage of 5 to 30 V can be connected at the terminals 4 (positive pole) and 7 (minus/ground) of the 8-pin socket (Figure 2).
The supply voltage connection is protected against false polarity.
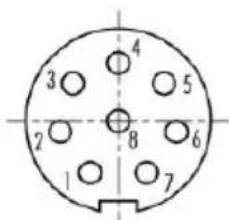
text_image
3 2 1 4 5 8 6 7Figure 2: Outside view of the PCE-VS12 socket with terminal numbers
3.2. Relay Output
The devices contain a PhotoMOS relay. The relay switching behavior can be programmed with the PCE-VS1x software (see. Chapter 4.2.6). The relay terminals are galvanically isolated from the rest of the circuit.
The PCE-VS11 relay output is connected via screw terminals inside the housing (Figure 1).
PCE-VS12 has relay terminals located at contacts 1 and 2 of the 8-pin socket (Figure 2). Metra offers connection cables for PCE-VS12 with an 8-pin connector for power supply and relay output.
Please note that the relay is only suitable for switching small loads (see. Chapter Technical Data). No overload protection is provided.
3.3. USB Interface
For setting parameters and measuring, the devices have a USB 2.0 interface in full-speed mode and CDC (Communication Device Class). PCE- VS11 is connected via a standard micro USB socket inside the casing (Figure 1). The PCE- VS12 USB port is located on the 8-pin socket (Figure 2). The contacts are assigned as follows:
Pin 6: +5 V
Pin 3: D+
Pin 5: D-
Pin 7: Weight
The PCE- VS12-USB cable is provided for connection to a PC.
When connecting the vibration switch to a PC via USB, the device is powered by the interface. In this case an additional power supply may not be used.
4. Parametrization
4.1. Device Identification
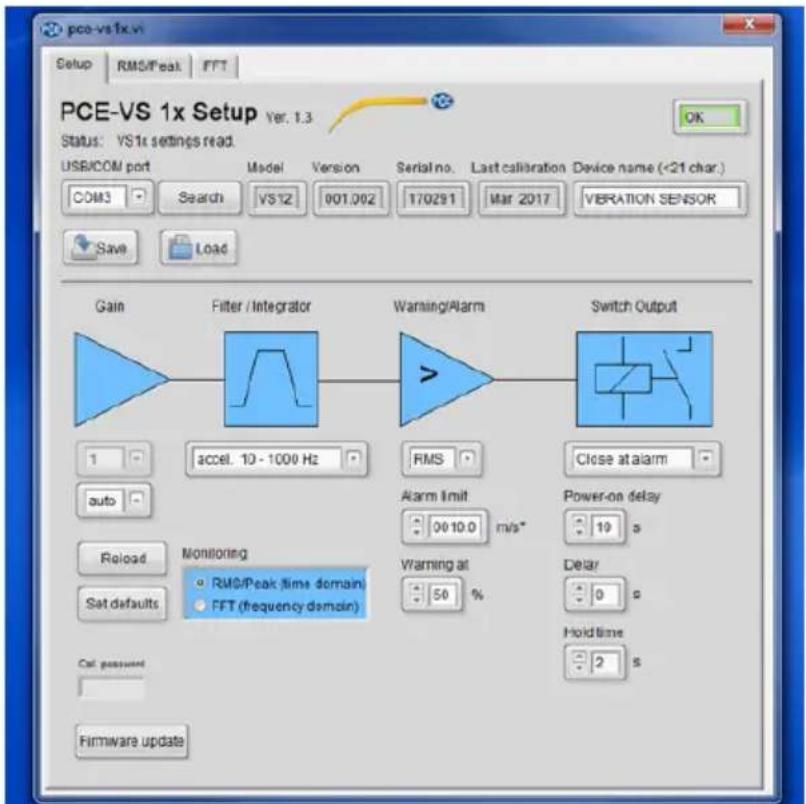
To setup PCE- VS11/12 open the LabView application vslx.vi. Notes on installation are provided in Chapter 10. The program opens in the setup view (Figure 3).
text_image
pce-vs1x.vi Setup RMS/Peak FFT PCE-VS 1x Setup Ver. 1.3 Status: VS 1x settings read. USB/COM port Model Version Serial No. Last calibration Device name (<21 char.) COM3 Search VSTZ 001.002 170251 Mar 2017 VITERATION SENSOR Save Load Gain Filter / Integrator Warning/Alarm Switch Output 1 accel. 10 - 1000 Hz RMS Close at alarm auto Alarm Imit Power-on delay 00 10.0 m/s* 19 s Reload Monitoring Warning at Delar Set defaults FFT (frequency domain) 50 % 0 s Call password Hold time Firmware updateFigure 3: Setup View
The PCE- VS11/12 runs in virtual COM port mode, i.e. the device is assigned a virtual USB serial port (COM port). The COM port number is assigned to the device by windows, but can be changed in the windows control panel if required.
The COM port number is displayed under "Setup" in the top left corner. If the PCE-VS11/12 was already connected when the program started, it will be automatically
recognized. Otherwise, you can start the search manually by clicking on "Search PCE-VS1x". The computer then searches from the entered COM port number and ends with COM50. You can also manually change the COM port. This may be useful if several PCE-VS11/12 are connected to the computer at the same time. The program works with COM port numbers 1 to 50.
On the top right you will see a status bar. If the green framed “OK” signal is shown the connection has been established. If the connection is interrupted the red framed “ERROR” signal will be shown.
4.2. Settings
4.2.1. General
The current settings are read as soon as the device is detected. In the line next to the COM port number you can see the type, version (3 digits for hardware and 3 digits for software), serial number and date of last calibration. This information cannot be edited. The device name can be overwritten and transferred to the device by pressing "Enter".
Press the “Save” button to save the settings as an XML file and “Load” to upload them into the program. The adjustable parameters are assigned to the function blocks “Gain”, “Filters/Integrators”, “Warning”/Alarm” and “Switch Output”.
All entries will immediately be transferred to PCE-VS11/12 and retained even after disconnecting the supply voltage.
4.2.2. Monitoring Mode
PCE-VS11/12 has two monitoring modes to choose from:
•Monitoring in the time domain with RMS and peak values (see Chapter 5)
• Monitoring in the frequency domain with frequency-band-dependent limit values (see Chapter 6)
Select the mode under “Monitoring”. The most recently selected mode and the corresponding limits will remain active after closing the program or interrupting the USB connection. The same applies to the teach-in function (see. Chapter 7).
4.2.3. Gain
The gain can be selected from values 1, 10 and 100 via the “Fix” menu. The “Auto” setting automatically selects the most appropriate gain range. In this case the gain menu is grayed-out.
Most monitoring tasks can be carried out using automatic gain (auto). It is advantageous because it achieves a better resolution when measuring low vibration amplitudes at higher gain levels. On the other hand unexpected high amplitudes do not cause overload.
There are, however, applications for which automatic gain selection is inappropriate, for example, at amplitudes that constantly fluctuate around a switching point or frequent single shocks.
4.2.4. Filters and Integrators
PCE-VS11/12 can monitor vibration acceleration or vibration velocity. A range of high and low pass filters are available for selection. The widest frequency range is 0.1 Hz to 10 kHz for acceleration, and 2 to 1000 Hz for velocity. The frequency range is adjusted via a drop-down menu. The three vibration velocity ranges can be found at the end of the menu. For information on customary frequency ranges in monitoring rotating machinery, see Chapter 9.
Setting the filters and integrators is only relevant when monitoring in the time domain (RMS and peak). In the FFT mode they are deactivated.
4.2.5. Warning and Alarm Limits
You can select the monitoring value from the “RMS/Peak” menu. RMS values are typically used for measuring vibration, and peak values for single impacts.
The alarm limit determines the switching threshold of the relay output. It is entered in m/s^2 for acceleration or mm/s for velocity. The permissible value range is 0.1 to 500.0.
The warning limit is entered as a percentage of the alarm value.
Values ranging from 10 to 99% are permissible. The warning limit can be used to indicate pre-alarm status via the LEDs before the alarm is triggered (see Chapter 4.3).
The “teach-in-factor” is an automatic measuring function for the alarm limit (see Chapter 7). It determines how far the alarm limit is set above the currently measured maximum value. The teach-in warning limit is always set at 50%.
It is only necessary to preset the monitoring variables and the alarm limit when measuring in the time domain (RMS and peak). In FFT mode the alarm limit is set in the FFT window (see Chapter 6).
4.2.6. Switching Output
The PCE-VS11/12 contains a PhotoMOS relay switch. The switching function can be specified in the options menu. The relay opens (n.c.) or closes (n.o.) in response to a warning or alarm signal.
The power-on delay is the delay between switching on the power and activation of the monitoring function. It helps prevent false alarm signals after switching on the device caused by the transient response of the signal processing.
The delay range is 0 to 99 seconds.
The power-on delay is the delay between the alarm threshold being exceeded and the relay switching. At zero the relay reacts immediately.
If a minimum time duration should apply to exceeding the alarm limit, a switching delay of up to 99 seconds can be entered.
The “Hold time” is the time when the amplitude falls below the alarm limit until the relay returns to normal status. This setting can be useful if a minimum alert duration is required. The range is from 0 to 9 seconds.
4.2.7. Factory Settings / Calibration
By clicking the “Set defaults” button all parameters are restored to factory settings (acceleration 2-1000 Hz, automatic gain, limit value 10 m/s^2 , pre-alarm to 50%, teach-in factor 2, relay close when alarm is triggered, switching delay 10 s, alarm delay 0 s, hold time 2 s).
The calibration password (“Cal. Password”) only needs to be entered by calibration labs.
4.3. LED Status Indicators
The PCE-VS11 signalizes the current status via four green/red LEDs. Whenever the device is ready for operation all LEDs light up. The LEDs have the following configuration:
4 x green: no warning / no alarm
2 x green/ 2 x red: warning limit exceeded
4 x red: alarm limit exceeded
The LEDs show the current vibration level in relation to the limit values.
They may differ from the current switching status of the relay if the switching delay or the hold time has not yet elapsed.
5. Measuring in the Time Domain
Besides vibration monitoring with switch output, the PCE-VS12 can be used in conjunction with PC software to record and display RMS and peak values with the selected filer and integrator settings.
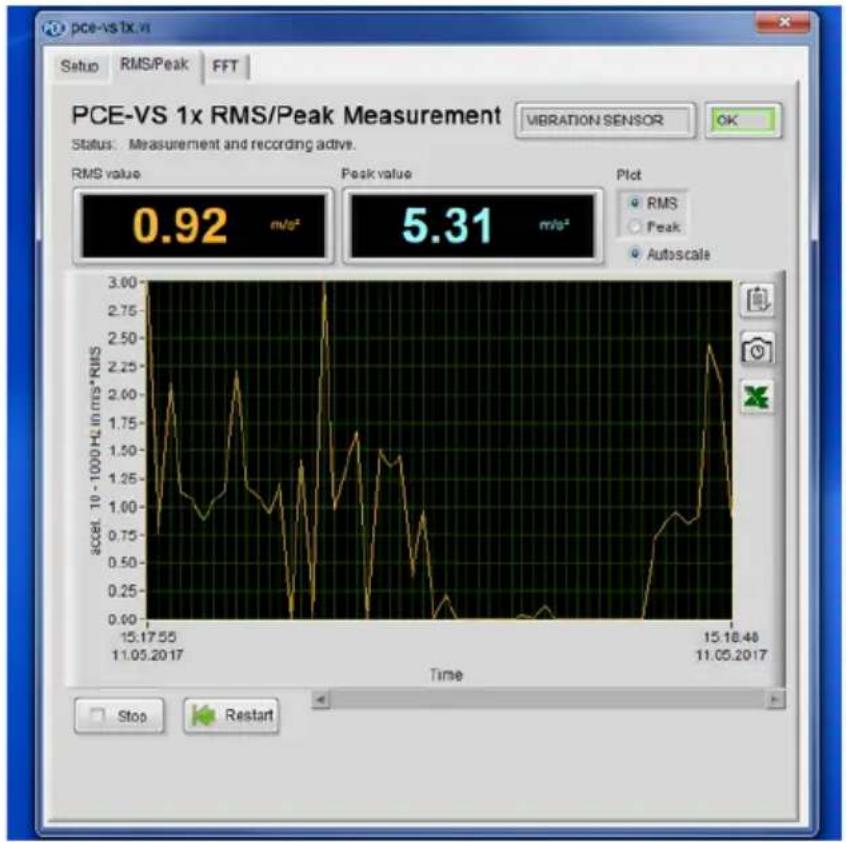
For this purpose switch to the tab “RMS/Peak”. The upper window contains the numerical display for RMS and peak. The time chart plots the course of the vibration quantity selected under “Plot” (Figure 4).
line
| Time | accel. 10^-1000HL in ms^2 | | ---------- | -------------------------- | | 15.17.55 | 0.92 | | 15.18.46 | 5.31 |Figure 4: RMS /Peak Measurement
The value axis label shows the vibration quantity and the selected filter. The time axis adjusts to the duration of the recording. By right-clicking in the chart area (Figure 5) you can automatically scale the chart (auto-scaling X/Y). Furthermore you can select the update mode (Figure 6).

text_image
Copy Data Description and Tip... Visible Items Clear Graph ✓ AutoScale X ✓ AutoScale Y Update mode Export
text_image
✓ AutoScale X ✓ AutoScale Y Update mode ExportFigure 6: Update Mode
Figure 5: Chart Menu
- Strip chart: data is displayed continuously from left to right. A strip chart is similar to a chart recorder (Y/t recorder).
- Scope chart: shows a signal (e.g. an impulse) periodically from left to right. Each new value is added to the right of the preceding one. When the graph reaches the right edge of the display area it is completely erased and redrawn from left to right. The display is similar to that of an oscilloscope.
- Sweep chart: is similar to a scope chart with the exception that the old data on the right side is separated by a vertical line from the new data on the left. When the plot reaches the right edge of the display area it is not deleted but continues to run. A sweep chart is similar to an ECG display.
The three update modes only effect the visible time interval of the chart. All data measured since opening the window, including the data which is not visible, is still accessible. To view the data use the scroll bar below the chart.
The three update modes only work if "Auto-scaling" has been deselected (Figure 5).
The chart axes can be manually rescaled by double-clicking on the numerical value of the axes label and overwriting the value.
Under "Export" you will find the following options:
• Copy chart data as value table to clipboard
• Copy chart graph to clipboard
- Open chart data in an Excel table (if Excel has been installed)
These export options can also be found as buttons next to the chart.
Press the "Stop" button if you wish to cancel the recording. The display will pause. By pressing "Restart" the chart is deleted and begins anew.
6. Measuring in the Frequency Range (FFT)
In addition to monitoring RMS and peak, PCE-PCF11 and VS12 enable limit value monitoring in the frequency range by means of frequency analysis (FFT). The vibration spectra can be viewed in conjunction with the PC software.
For this purpose switch to the tab "FFT". The window (Figure 7) displays the frequency spectrum of the acceleration peak value, selectable from 5 to 1000 Hz or 50 to 10000 Hz.

line
| Frequency (Hz) | m/s* (p=24) | | -------------- | ----------- | | 5 | 1 | | 100 | 4 | | 200 | 3 | | 300 | 4 | | 400 | 5 | | 500 | 4 | | 600 | 3 | | 700 | 2 | | 800 | 1 | | 900 | 1 | | 1000 | 1 |Figure 7: Frequency Analysis

text_image
Copy Data Description and Tip... Visible Items Clear Graph Create Annotation Delete All Annotations AutoScale X ✓ AutoScale Y Smooth Updates ✓ Ignore Time Stamp ✓ Ignore Attributes ExportFigure 8: Chart Menu
By right clicking on the chart area you can automatically scale the chart (auto scaling Y). Double-clicking on the scale label of the Y-axis allows you to manually rescale the axis by overwriting it.
Scaling the frequency axis (X) is unnecessary because it is fixed by the frequency range of the FFT (1/10 kHz). The Y-axis can be displayed by a linear or logarithmic scale.
To export the chart data the same options as in the time-domain measurements are available (see Section 9).
Input fields for 10 amplitudes and 10 frequencies are located under the chart menu. Here you can specify a limit line which is placed in the frequency spectrum and signals an alarm when the limit is exceeded. The limit line en-
ables you to selectively monitor spectral components. This may be advantageous in order to monitor a particular component from among a mix of vibration frequencies.
For the switching mode, warning limit and delay time the settings described in sections 4.2.5 and 4.2.6 apply.
In the row with 10 frequencies you can enter any desired value in the range of 1 Hz to 1000 or 10000 Hz (depending on the filter range selected). The only condition is that the frequencies ascend from left to right. The amplitude entered below the frequency in m/s ^2 is the limit of the next lower frequency up to this frequency. If you need less than 10 basic parameters you can also enter the maximum frequency of 1000 or 10000 Hz with the corresponding amplitude limit further to the left.
In this case the values to the right of the maximum frequency will be ignored.
The limit curve can be shown or hidden on the chart. The VS11/12 limit monitoring nevertheless always remains active.
7. Teach-in Function
The PCE-VS11 has a teach-in function for calibrating the alarm limit. A PC is not required for this function. To use the teach-in function the vibration switch has to be mounted onto the object to be measured, which should be in ready-to-monitor operating status.
To activate the teach-in function remove the screw cover labeled “teach-in” and briefly press the button underneath with a long, non-conductive object. When doing this be careful to avoid impacts on the casing.
According to the selected monitoring mode, the vibration switch will now determine the alarm threshold based on the available values.
This can take between 4 and 40 s, during which the LEDs remain unlit. Meanwhile the following processes will run in the vibration switch:
- With RMS and peak monitoring in the time domain the selected monitoring quantity with the set filter range is measured for a few seconds. The resulting RMS and peak values are multiplied by the teach-in factor (programmed under set-up) and saved as the alarm limit. The warning limit is set at 50% .
Before activating the teach-in function please select a suitable filter range.
- With FFT monitoring in the frequency domain the frequency spectrum up to 10kHz is measured and averaged for a few seconds and the results are recorded. Subsequently, the largest spectral line is determined. If this line is below 1kHz , the analysis will be repeated with a 1kHz band width. The frequency range will then be subdivided into ten equally wide intervals of 100 or 1000Hz . For each of these ranges the amplitude with the largest spectral line, is multiplied by the teach-in factor, and set as the limit. If the maximum lies on the margin of an interval, the next interval will also be set at this limit. The warning limit is also set at 50% .
In this way the alarm limit can be determined without knowledge of the actual acceleration and velocity. The teach-in factor determines the permissible tolerance.
Attention: Please do not touch the PCE-VS11 during the teach-in process.
8. Measuring Points on Rotating Machines
8.1. General
For monitoring the condition of a machine selecting suitable measuring points is decisive. Whenever possible trained personnel with experience in machine monitoring should be called upon.
It is generally advisable to measure machine vibrations as near as possible to their source. This helps keep measuring signal distortions, due to transferred components, to a minimum. Suitable measuring location points include rigid parts such as bearing housings and gearbox housings.
Measuring point locations unsuitable for measuring vibration are light or mechanically flexible machine parts, such as metal sheets or cladding.
8.2. Attachment
The PCE-VS11/12 devices have robust aluminum casing with an M8 thread pin for attachment. The devices should be attached by hand only. Please do not use tools.
8.3. Attachment Recommendations to ISO 10816-1
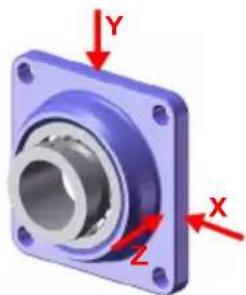
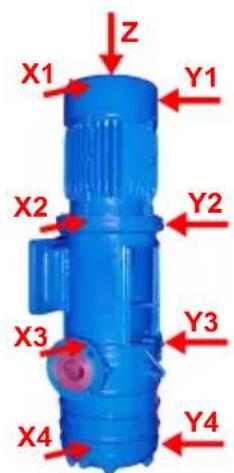
The ISO 10816-1 standard recommends bearing housings or their immediate surroundings as preferred measuring location points for measuring machine vibrations (Figures 9 to 12).
For the purpose of machine monitoring it is usually sufficient to take measurements in only one direction, either vertically or horizontally
On machines with horizontal shafts and rigid foundations the largest vibration amplitudes occur horizontally. On flexible foundations strong vertical components occur.
For the purpose of acceptance tests, measuring values should be recorded in all three directions (vertical, horizontal and axial) on all bearing locations at the center of the bearing.
The following illustrations are examples of suitable measuring location points.
ISO 13373-1 provides recommendations for measuring location points on various machine types.

natural_image
3D CAD model of a blue mechanical bearing housing with XYZ coordinate axes labeled (X, Y, Z) — no text or symbols beyond axis labelsFigure 9: Measuring Points on Vertical Bearings
natural_image
3D mechanical component with labeled X, Y, Z axes and mounting flange (no text or symbols beyond axis labels)Figure 10: Measuring Points on Flange Bearings

text_image
Y1 Z1 X1 Y2 Z2 X2Figure 11: Measuring Points on Electric Motors
text_image
Z X1 Y1 X2 Y2 X3 Y3 X4 Y4Figure 12: Measuring Points on Machines with Vertical Rotors
9. Vibration Monitoring with Standard Limits
Deriving statements about the condition of a machine from monitoring vibration limit values requires some experience. If no specific values from previous measurement results are available, in many cases you can refer to the ISO 10816 recommendations. In these sections of the standard the vibration severity zone limits for various machine types are defined. The guidelines can be used for an initial evaluation of a machines condition. The four zone boundaries characterize the machine in categories according to vibration severity:
A: New Condition
B: Good condition for unrestricted continuous operation
C: Poor condition – permits restricted operation only
D: Critical condition – danger of machine damage
In the annex of part 1 of the ISO standard (revised in 2009) general zone boundaries are provided for machines which are not dealt with separately in other parts of the standard.
| Veff10-1000 Hz | 45 mm/s | |||
| 28 mm/s | ||||
| 18 mm/s | ||||
| 14.7 mm/s | Zone C/D 4,5-14,7 mm/s | |||
| 11.2 mm/s | ||||
| 9.3 mm/s | Zone B/C 1,8-9,3 mm/s | |||
| 7.1 mm/s | ||||
| 4.5 mm/s | Zone A/B 0,71-4,5 mm/s | |||
| 2.8 mm/s | ||||
| 1.8 mm/s | ||||
| 1.12 mm/s | ||||
| 0.71 mm/s | ||||
| 0.45 mm/s | ||||
| 0.28 mm/s | ||||
| D Risk of machine damage | ||||
| C Restricted operation | ||||
| B Unrestricted long-term operation possible | ||||
| A Newly commissioned | ||||
Table 1: Typical Limit Values for Vibration Severity to ISO 10816-1
The ISO standard indicates that small machines such as electric motors with a power rating of up to 15 kW tend to lie around the lower zone boundaries, whereas large machines such as motors with flexible foundations lie around the upper zone limits.
In part 3 of ISO 10816-2:2009 you will find the zone boundaries for vibration severity on machines with a power rating of 15 kW bis 50 MW (2).
| Machine type | Large machines with 300 kW to 50 MW | Medium sized machines with 15 to 300 kW | |||
| Electric motors with a shaft height of above 315 mm | Electric motors with a shaft height between 160 and 315 mm | ||||
| Foundation flexible rigid flexible rigid | |||||
| V_eff 10–1000 Hz | >11 mm/s D D | D D | |||
| >7.1 mm/s C D | D D | ||||
| >4.5 mm/s B C | C D | ||||
| >3.5 mm/s B B | B C | ||||
| >2.8 mm/s A B | B C | ||||
| >2.3 mm/s A B | B B | ||||
| >1.4 mm/s A A | A B | ||||
| <1.4 mm/s A A | A A | ||||
| D Risk of machine damage | |||||
| C Restricted operation | |||||
| B Unrestricted long-term operation possible | |||||
| A Newly commissioned | |||||
Table 2: Classification of Vibration Severity to ISO 10816-3
Part 7 of ISO 10816 deals specifically with rotodynamic pumps (3).
| Category 1 | Category 2 | |||||
| Type | Pumps with high safety and reliability demands | Pumps for general and less critical use | ||||
| Power rating | < 200 kW | > 200 kW | < 200 kW | > 200 kW | ||
| /eff 10-1000 Hz | >7.6 mm/s | D | D | >9.5 mm/s | D | D |
| >6.5 mm/s | D | C | >8.5 mm/s | D | C | |
| >5.0 mm/s | C | C | >6.1 mm/s | C | C | |
| >4.0 mm/s | C | B | >5.1 mm/s | C | B | |
| >3.5 mm/s | B | B | >4.2 mm/s | B | B | |
| >2.5 mm/s | B | A | >3.2 mm/s | B | A | |
| < 2.5 mm/s | A | A | < 3.2 mm/s | A | A | |
| D Risk of damage to machine | ||||||
| C Restricted operation | ||||||
| 7 Lasting operation in permissible operating range without restrictions possible | ||||||
| A Newly commissioned pumps in preferred operating range | ||||||
Table 3: Classification of vibration severity on rotodynamic pumps to ISO 10816-7
10. Installing the PC Software
Next connect the PCE-VS11/12 to a USB port on your PC. With VS11 you will need to undo the four Allen screws and remove the lid. The connection is established via a micro USB cable. With VS12 a USB cable type VS12-USB is connected to the 8 pin socket.
If the device is being connected to a PC for the first time windows will request a device driver. The driver data file can be found on our website:
https://www.pce-instruments.com/english/download-win_4.htm
Unzip and save the enclosed files to a directory on your computer. When windows requests the location of the device driver, enter this directory. The device driver is digitally signed and runs in Windows XP, Vista, 7, 8 and 10.
The computer will install a virtual COM port which runs in CDC mode. The advantage of the virtual COM port is that the device can be controlled via easy-to-use ASCII commands.
Once you have installed the driver, PCE-VS11/12 will be identified by the system.
To assist you in setting parameters and measuring, the PC software VS1x is provided via the above link. Unzip the file vs1x.zip into a directory on your computer and then start setup.exe. The installation directories can be changed as required. The program is a LabView application and for this reason installs several components of the LabView Run-Time environment from National Instruments.
Once installed, the program (Figure 3) is located under Metra Radebeul in the start menu of your computer.
11. Integration of PCE-VS11/12 with other Software
The software provided by Metra is only one example of PC controlled parametrization and measuring with PCE-VS11/12. The software was designed with LabView 2014.
For integrating the devices into other software projects Metra will provide the ASCII instruction set and the LabView project data, upon request.
12. Firmware Update
In the case that new software (firmware) for your PCE-VS11/12 is available you can install it yourself. Please open the web address below to check the latest version:
https://www.pce-instruments.com/english/download-win_4.htm
The firmware is the same for all PCE-VS1x devices.
Connect the PCE-VS11/12 via a USB cable to the PC and check in the setup program the installed firmware version of your vibration switch (Figure 3). If the version number shown on the web page should be higher download the firmware file, unzip it and save it to a folder of your choice.
Install also from above web page the program "Firmware Updater".
Prepare the vibration switch for the update by clicking the button "Firmware update" in the setup program and confirm the warning. The old firmware will now be erased (Figure 13).
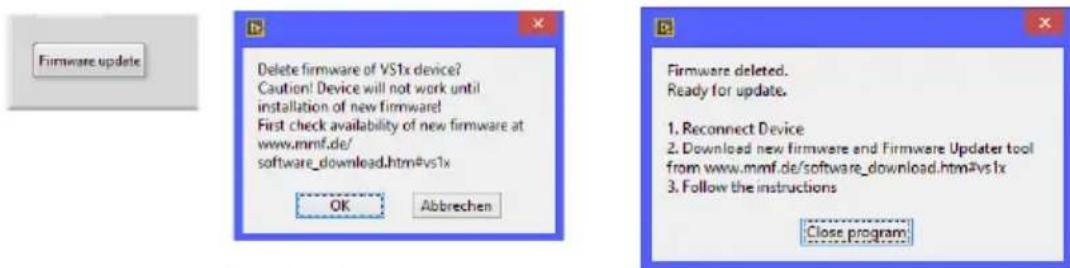
Figure 13: Preparation for firmware update
Start "Firmware Updater", choose the device type "PCE-VS1x" and select the virtual COM port used for USB connection.

text_image
MMF Firmware Updater Version 1.1 Load a VS1x - Firmware file and Send via COM3 into the VM31. About Firmware filesClick the “Load” button and enter the directory of the downloaded firmware file vs1x.hex. Then click “Send” to start the update process. The progress will be indicated by a bar graph. After a successful update the vibration switch will restart and “Firmware Updater” will be closed.
Please do not interrupt the update process. After update errors you can restart “Firmware Updater”.
13. Technical Data
| Sensor | Piezoelectric accelerometer, inbuilt |
| Monitoring Modes | Real RMS and PeakFrequency analysis |
| Measuring Ranges | |
| Acceleration | 0.01 -1000 m/s2 |
| Velocity | Frequency dependent |
| Acceleration Filters | 0.1-100; 0.1-200; 0.1-500; 0.1-1000; 0.1-2000; 0.1-5000; 0.1-10000; 2-100; 2-200; 2-500; 2-1000; 2-2000; 2-5000; 2-10000; 5-100; 5-200; 5-500: 5-1000; 5-2000; 5-5000; 5-10000; 10-100; 10-200; 10-500; 10-1000; 10-2000; 10-5000; 10-10000; 20-100; 20-200; 20-500; 20-1000; 20-2000; 20-5000; 20-10000; 50-200; 50-500; 50-1000; 50-2000; 50-5000; 50-10000; 100-500; 100-1000; 100-2000; 100-5000; 100-10000; 200-1000; 200-2000; 200-5000; 200-10000; 500-2000; 500-5000; 500-10000; 1000-5000; 1000-10000 Hz |
| Velocity Filters | 2-1000; 5-1000; 10-1000 Hz |
| Frequency Analysis | 360 line FFT; peak of accelerationFrequency ranges: 5-1000, 50-10000 HzUpdate rate: 1/s; Window type: Hann |
| Teach-in Function (VS11) | For teaching in the alarm threshold, via button inside casing |
| Relay Output | Via screw terminals inside the casing (PCE-VS11) or via 8 pin connector Binder 711 (PCE-VS12)PhotoMOS relay; SPST; 60 V / 0.5 A (AC/DC); isolated switch mode (n.o./n.c.) and hold time programmable |
| Alarm Delay | 0 - 99 s |
| Alarm Hold Time | 0 - 9 s |
| Status Indicators | 4 LEDs; green: OK; red/green: warning; red: Alarm |
| USB Interface | USB 2.0, full speed, CDC mode,PCE-VS11: via micro USB socket inside casingPCE-VS12: via 8-in socket Binder 711 with Cable VM2x-USB |
| Power Supply | 5 to 26 V DC (VS11) / < 100 mA or USB |
| Operating Temperature | -40 - 80 °C |
| Protection grade | IP67 |
| Dimensions, ∅ x h (without connectors) | 50 mm x 52 mm (PCE-VS11); 50 mm x 36 mm (PCE-VS12) |
| Weight | 160 g (PCE-VS11); 125 g (PCE-VS12) |