
EGM-PWML - Energy meter EnerGenie - Free user manual and instructions
Find the device manual for free EGM-PWML EnerGenie in PDF.

| Product Type | Energy Meter with Memory |
| Brand | EnerGenie |
| Model | EGM-PWML |
| Dimensions | 130 mm x 92 mm x 72 mm |
| Weight | 0.3 kg |
| Power Supply | Input: 220-240 V AC, 50-60 Hz; Max load: 10 A; Power consumption: max 1.2 W |
| Measurement Range | Up to 250 V AC, 10 A RMS, 2500 W, 22 MW per year |
| Accuracy | ±2% (within 50 W - 2500 W power range) |
| Memory | Internal FLASH memory: 128 KB; Stores up to 34 hours of data |
| Interface | USB 1.1 or 2.0 compatible |
| Operating Conditions | Temperature: +10°C to +40°C; Humidity: below 90% |
| Software Compatibility | Windows XP/2000/Vista/Windows 7; Power Manager software included |
| Main Functions | Measures voltage, current, power, energy, cost; Offline recording; Data analysis with charts; Event triggers |
| Package Contents | EGM-PWML unit, user manual, USB cable, CD with Power Manager software |
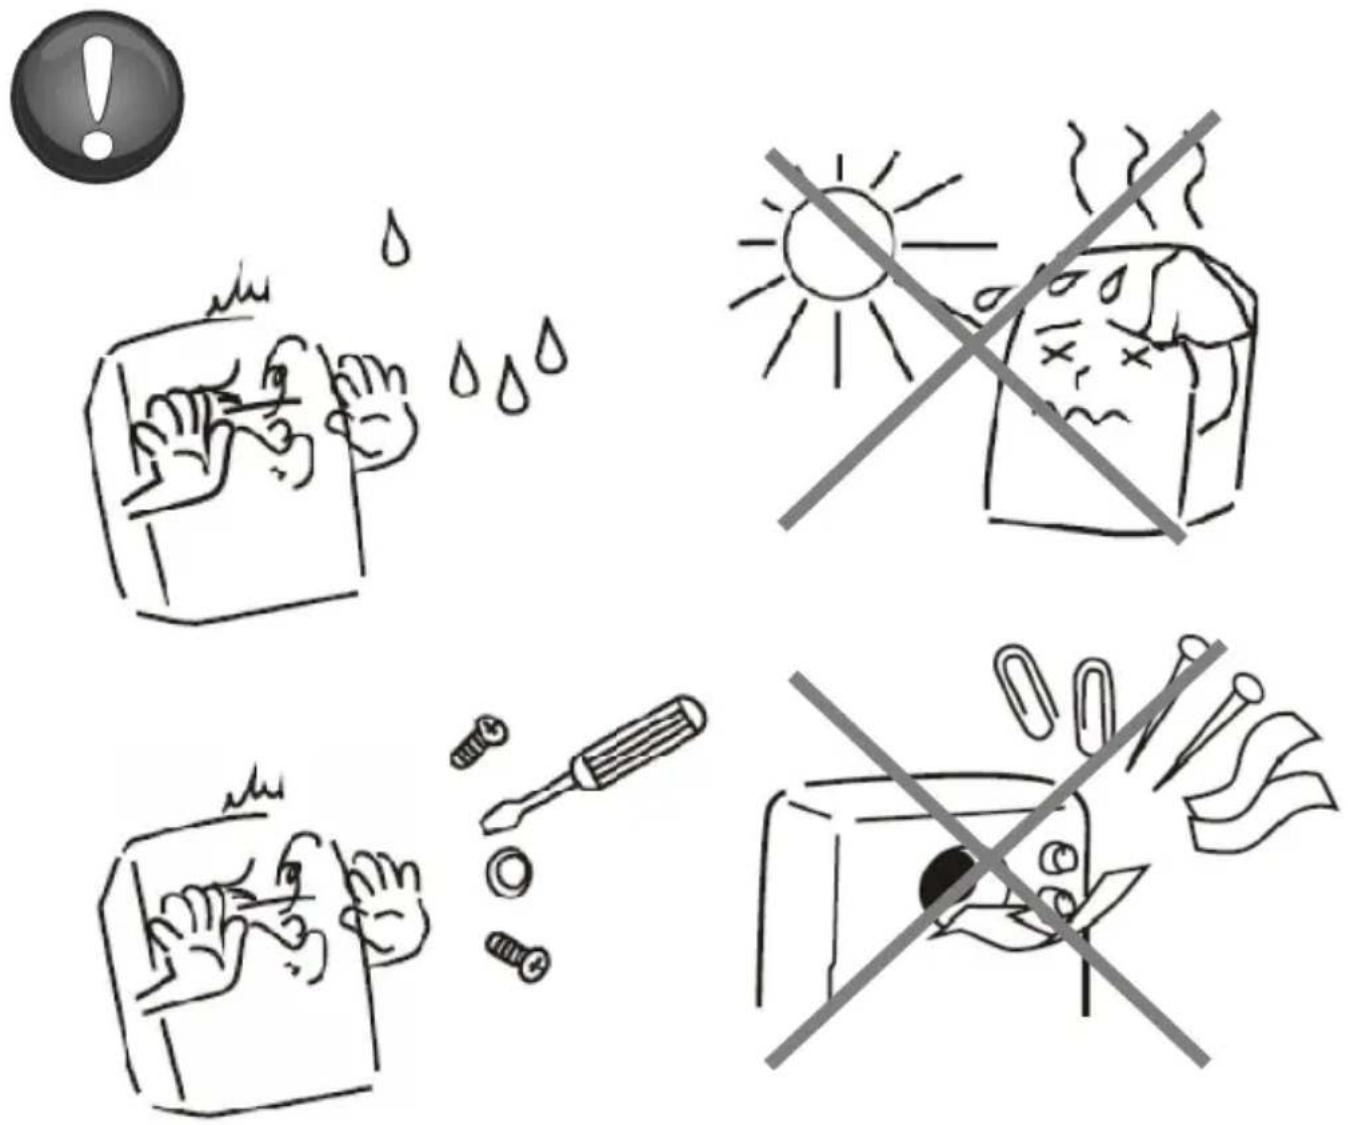
| Maintenance & Cleaning | Disconnect from PC; clean with dry, soft cloth; avoid moisture and liquids |
| Safety | Use only with standard European AC wall sockets (DIN 49440); do not expose to damp or wet places |
| Spare Parts & Repairability | No user-serviceable parts; contact manufacturer or qualified service for repairs |
| Certifications | CE compliant: EN55022, EN55024, EN61000-3-2, EN61000-3-3, EN60335, EN55014 |
Frequently Asked Questions - EGM-PWML EnerGenie
User questions about EGM-PWML EnerGenie
0 question about this device. Answer the ones you know or ask your own.
Ask a new question about this device
Download the instructions for your Energy meter in PDF format for free! Find your manual EGM-PWML - EnerGenie and take your electronic device back in hand. On this page are published all the documents necessary for the use of your device. EGM-PWML by EnerGenie.
USER MANUAL EGM-PWML EnerGenie
natural_image
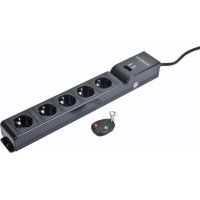
Black electronic device labeled 'Power Meter' with visible ports and a green logo (no text-heavy elements)EGM-PWML
ENERGY METER WITH MEMORY
USER MANUAL
HANDBUCH
HANDLEIDING
MANUEL DESCRIPTIF
Energy Meter with memory
Energiemessgerät
EnergieMeter
Features
- USB Energy Meter, creates exact insight in your energy consumption (voltage/current/power)
• No permanent computer connection required
• Stores 34 hours of energy consumption data in the internal memory - Power Meter software helps calculating the actual energy costs of your equipment
- Software provides basic power consumption readings (home use) and advanced readings (business/scientific use)
Specifications
• Input: 220-240 V AC 50-60 Hz
- Load max: 10 A
• Power consumption max: 1.2W
• USB 1.1 or 2.0 compatible interface
- Computer measurements: voltage and current measuring (RMS values), true power measuring, real energy consumed during a time period (kWh)
- Measurements range: up to 250 V AC, 10 A (RMS), 2500 W, 22 MW a year
• Measurements accuracy: ± 2% (within 50 W - 2500 W power range)
• FLASH memory: 128 KB
• Working conditions: (+ 10 to 40) C, below 90 % humidity
• Dimensions: 130 mm x 92 mm x 72 mm
- Net weight: 0.3 kg
1. Indicators and controls of the EGM-PWML
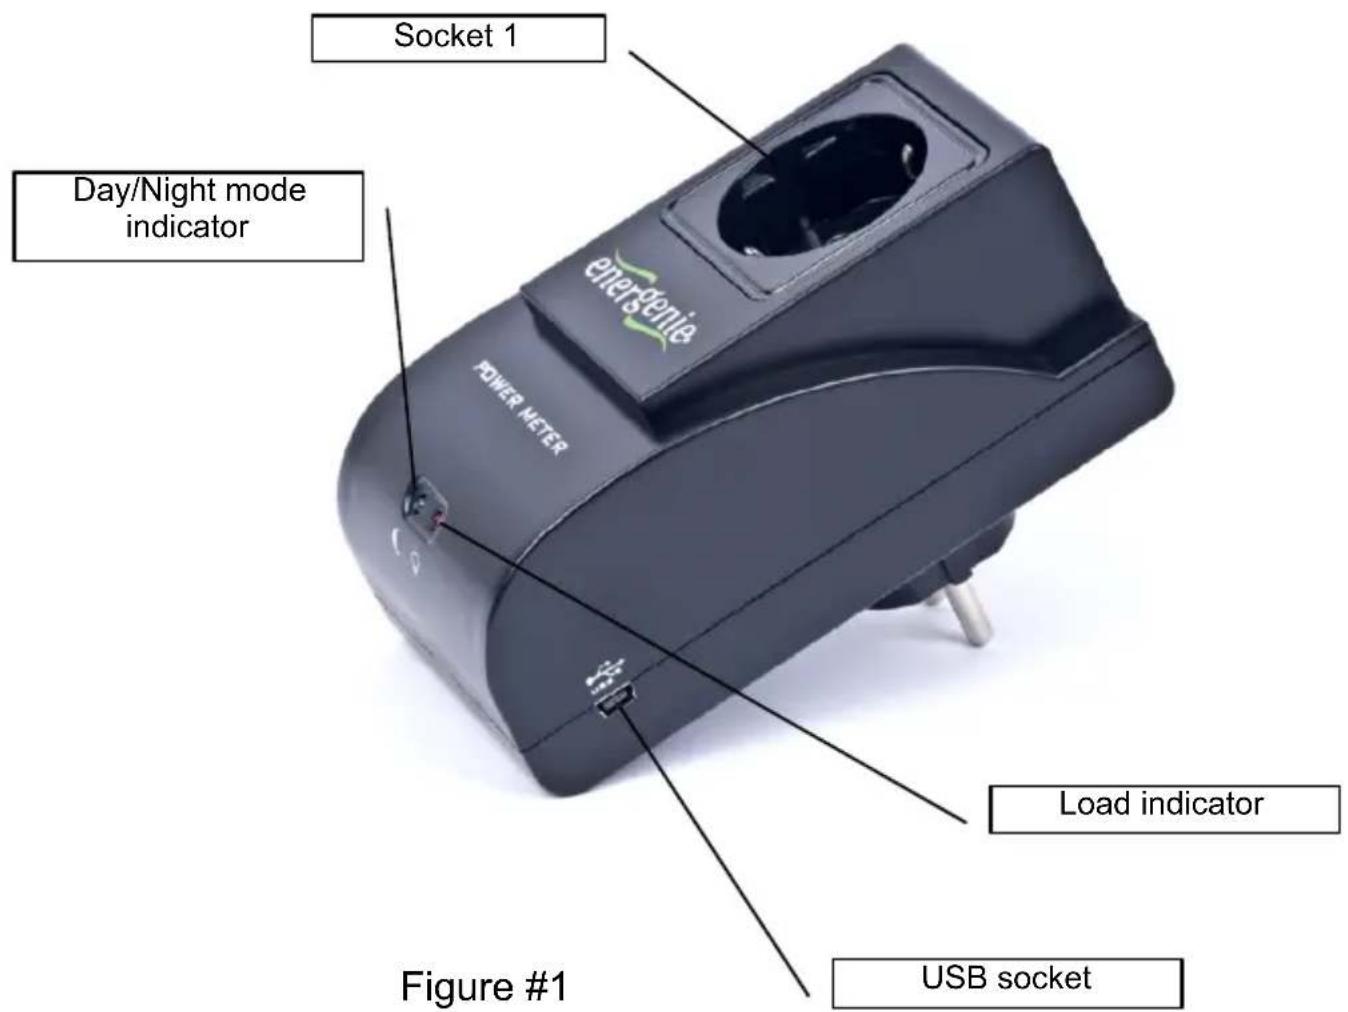
All brands and logos are registered trademarks of their respective owners
2. Hardware requirements
- A free USB port
• Windows XP/2000/Vista/Windows 7
3. Package contents
- EGM-PWML
- User manual
- USB cable
• CD with Power Manager software for Windows
4. Installation of EGM-PWML
To use EGM-PWML please follow next steps:
- Install the software.
- Connect the EGM-PWML to the PC with USB cable.
- It is strongly recommended to avoid damp or wet places for installation.
- EGM-PWML should be connected to the European AC wall socket of the standard DIN 49 440;
- It is possible to connect the EGM-PWMLL to the power source via other multi-plugs, surge protectors, voltage regulators or UPS.
5. Software installation
a. Insert CD with the software into the PC CD-ROM drive.
b. If for any reason the automatic setup does not work, then open CD-ROM drive in the "My computer" window and launch SETUP.EXE from the CD.
Follow instructions of the installation software.
6. Power Manager
Your EGM-PWML has an offline and an online working mode. It is “offline” whenever it is not connected to a PC, or when the PC is turned off. The device will come “online” automatically when it is connected to a PC with the Power Manager software running. In this mode the software keeps downloading the power readings from the EGM-PWML into a database. In offline mode, the EGM-PWML records the real power consumed and stores it into the internal memory. The internal memory capacity is enough for around 34 (thirty four) hours of continuous recording.
Records in EGM-PWML are downloaded and added into the database by Power Manger automatically every time, when EGM-PWML is recognized. When chart window is opened charts are rebuilt. After successful download the recordings into the database, recordings memory is cleared automatically.
energenie
EGM-PWML ENERGY METER WITH MEMORY
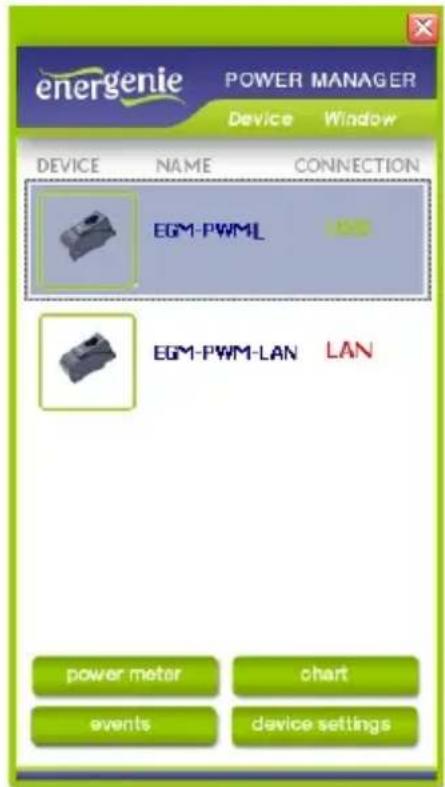
The data can then be viewed and analysed with the Power Manager software. The software shows different energy characteristics changing over time – including the money spent and the power consumption (kWh). When the software is started, the main power manager window will appear, which shows a list of all connected devices (see Figure #2 below).
Figure #2
All brands and logos are registered trademarks of their respective owners
Push the Device settings button (bottom right here) to set the device-specific options (see Figure #3 below)
Figure #3
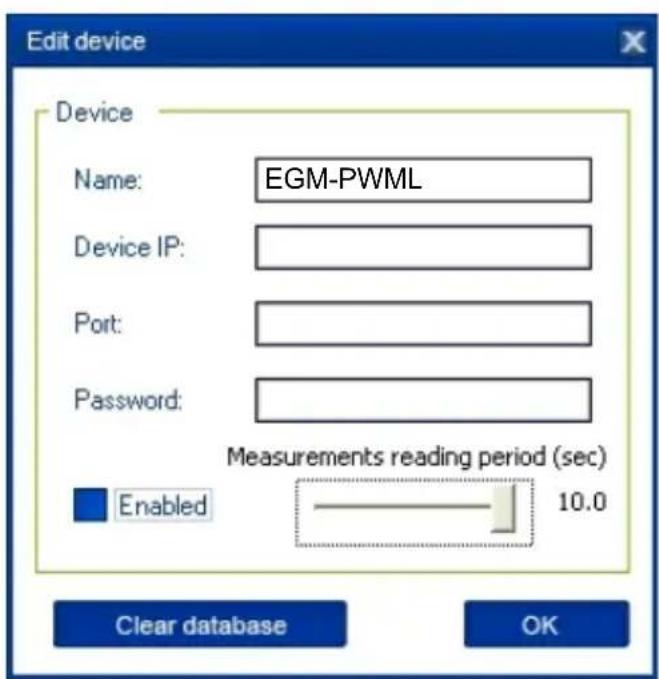
In the settings screen you are able to change the name of your device (in the Name field) and the data downloading frequency (in the Measurement reading period field) - from 2 to 10 seconds.
All brands and logos are registered trademarks of their respective owners
To delete all previous recorded data, just push the Clear database button.
Note: Device IP, Port and Enabled fields will be grey – these functions are only available on the LAN version of the EGM-PWM.
To open the Power Meter window, select your EGM-PWML device from the list (see Figure #2 above) and then click the Power meter button (see the chapter 7 below).
7. Power Meter
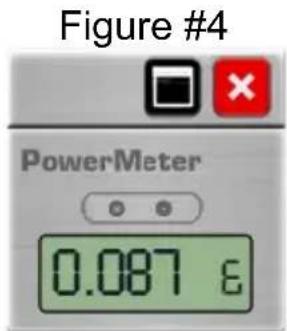
The Power Meter window can be opened in either a minimized or maximized mode. The minimized Power Meter window is shown in Figure #4 below. This window is useful for monitoring selected measured values. It displays:
• A single measured value (e.g. money spent)
Note: Click with the right mouse button over this field to choose a different measured value to display
- Two warning indicators. These indicators by default would show you when the voltage is beyond its limits (too high or too low)
Note: Read Chapter #9 below if you wish to customize these indicators
energenie
EGM-PWML ENERGY METER WITH MEMORY
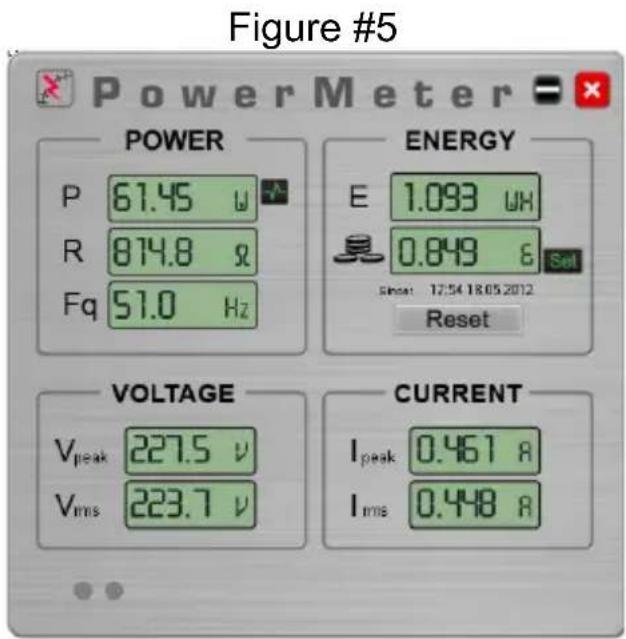
Push Maximize button in this window to open the full-size Power Meter window – see Figure #5 below.
All brands and logos are registered trademarks of their respective owners
This window displays all the measured values:
• Real power (P)
• Active impedance (R)
• Frequency of current (Fq)
• Energy consumed (E)
• The cost of energy consumed (money sign)
• RMS voltage (V rms)
- Peak voltage (V peak)
• RMS current (I rms)
- Peak current (I peak)
It is beyond the scope of this manual to explain the physical meaning of these values. For most consumers the energy and its cost are the most interesting.
The Energy (E) value shows the accumulated energy consumption (in watt-hours) since a certain date (the last time when Reset button was pressed). This date is shown below the Cost display. The Cost value is based on the amount of energy consumed and the energy costs. Push the Set button (near the Cost value) to specify the energy costs for your home or office situation—see Figure # 6 below.
By Pushing the Reset button both Energy and Cost counters will be reset to zero.
Figure #6
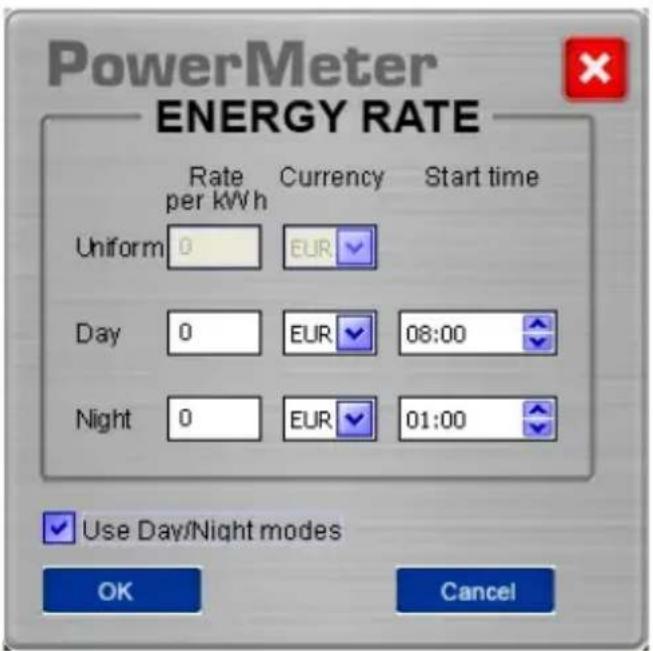
Choose the rate (per kWh) and currency. If you have different rates for peak hours and off-peak hours, just check the box Use Day/Night modes. You will then be able to enter the dual rates and the start/finish times for these modes.
8. Using the charts
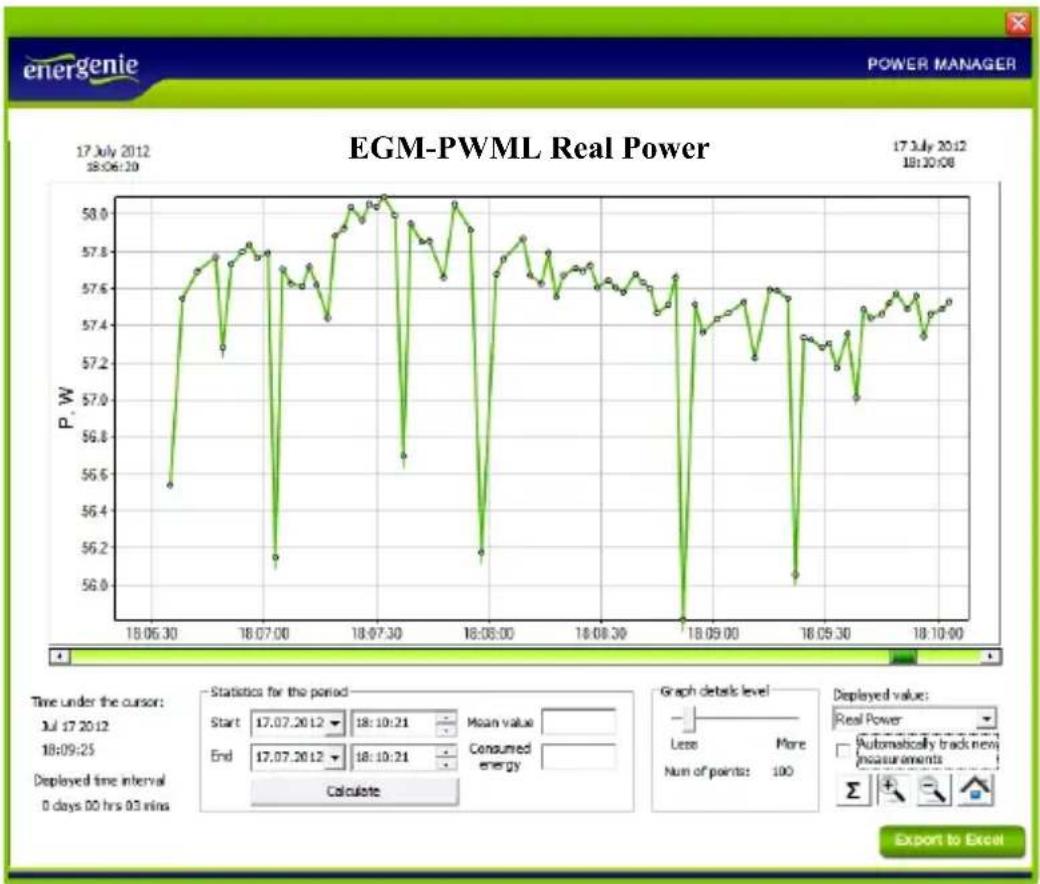
In the online mode the values of P, R, Fq, Irms, Vrms and Cost are continuously logged into the database. These readings can be used to build time charts. To display the charts just click on the desired value in the Main Power Meter window (see Figure #5 above) or push the Chart button in the Power Manager window (see Figure #2 above). This will open the Chart window as displayed in Figure #7 below.
Figure #7

line
| Time | Cost, money per hour | | ---------- | -------------------- | | 17.07.2012 | 0.14 | | 18:06:50 | 0.14 | | 17.07.2012 | 0.14 | | 18:09:48 | 0.14 | | 18:09:48 | 0.14 | | 18:09:48 | 0.14 | | 18:09:48 | 0.14 | | 18:09:48 | 0.14 | | 18:09:48 | 0.01 | | 18:09:48 | 0.01 | | 18:09:48 | 0.01 | | 18:09:48 | 0.01 | | 18:09:48 | 0.01 | | 18:09:48 | 0.01 | | 2/2/2012 | 0.14 | | 2/2/2012 | 0.14 | | 2/2/2012 | 0.14 | | 2/2/2012 | 0.14 | | 2/2/2012 | 0.14 | | 2/2/2012 | 0.14 | | 3/2/2012 | 0.14 | | 3/2/2012 | 0.14 | | 3/2/2012 | 0.14 | | 3/2/2012 | 0.14 | | 3/2/2012 | 0.14 | | 3/2/2O | 0.14 | | 3/2/2O | 0.14 | | 3/2/2O | 0.14 | | 3/2/2O | 0.14 | | 3/2/2O | 0.14 | | 3/2/2O | 0.14 | | 3/2/30 | 0.14 | | 3/2/30 | 0.14 | | 3/2/30 | 0.14 | | 3/2/30 | 0.14 | | 3/2/30 | 0.14 | | 3/2/30 | 0.14 | | 3/2O | 0.14 | | 3/2O | 0.14 | | 3/2O | 0.14 | | 3/2O | 0.14 | | 3/2O | 0.14 | | 3/2O | 0.14 | | 3/2O | 0.14 | | | 3/2O | 0.14 | | 3/2O | 0.14 | | 3/2O | 0.14 | | 3/2O | 0.14 | | 3/2O | 0.14 | | 3/2O | 0.14 | | 3/2O | 666 | | 3/2O | 666 | | 3/2O | 666 | | 3/2O | 666 | | 3/2O | 666 | | 3/2O | 666 | | 3/2O | 666 | | 3/2O | 666 | | | 3/2O | 666 | | 3/2O | 666 | | 3/2O | 666 | | 3/2O | 666 | | 3/2O | 666 | | 3/2O | 666 | | | 3/2O | 666 | | | 3/2O | 666 | | | 3/2O | 666 | | | 3/2O | 666 | | | 3/2O | 666 | | | 3/2O | 666 | | | 3/2O | 555 | | | 3/2O | 555 | | | 3/2O | 555 | | | 3/2O | 555 | | | 3/2O | 555 | | | 3/2O | 555 | | | 3/2O | 555 | | | 3/2O | - | | - | - | | - | - | | - | - | | - | - | | - | - | | - | - | | - | - | | - | - | | - | - | | - | - | | - | - | | - | - | | - | - | | - | - | | - |- | | - | - | | - | - | | - | - | | - | - | | - | - | | - | - | | - | - | | - | - | | - | - | | - | - | | - | - | | - | - | | - | - | | - | - |All brands and logos are registered trademarks of their respective owners
energenie
EGM-PWML ENERGY METER WITH MEMORY
The horizontal axis represents the date/time and the vertical axis represents the values of the chosen parameter.
Note: The scale of the vertical axis changes automatically once you browse or zoom the chart. The scale will be chosen in such a way that all the values within the displayed time period fit onto the screen.
Some extra tools are placed under the chart:
- From the Displayed value list box you can choose the value which you wish to display in the graph area...
- The displayed chart normally shows the average values of the chosen parameter. You can determine the data point density with the Graph details level slider. With this slider you actually change the number of points within the chosen time interval for the averaging. Fewer points mean less details and a smoother chart. More points mean more details and a more precise chart.
- The Sum tool is used to calculate energy statistics within a selected time period. Push the - button to activate this feature and then select a time period on the chart area by dragging and dropping with the left mouse button. Doing so you will select the period as shown on the Figure # 8 below. The chosen period will be selected on the chart and the start and finish values of the interval will be shown in the corresponding fields inside Statistics for the period box. The calculated average value will be shown in the Mean value field.
Note: you can also adjust the Start and Finish fields manually.
Tip: You can calculate the total energy consumption within a certain period pushing the Calculate button - see Figure #8 below
Figure #8
line
| Time | Power (P.W.) | | ---------- | ------------ | | 18:06:30 | 56.5 | | 18:07:00 | 57.8 | | 18:07:30 | 56.2 | | 18:08:00 | 57.9 | | 18:08:30 | 56.2 | | 18:09:00 | 57.4 | | 18:09:30 | 56.0 | | 18:10:00 | 57.5 |All brands and logos are registered trademarks of their respective owners
• The zooming tool allows changing the time scale of the chart. Push the zooming tool button and then click with the left mouse button to adjust the scale to the desired level
- When you select the home tool, the chart displays every record from the whole period where the selected parameter has any records in the database
- The Excel tool exports the average values of the selected period into an Excel file for further analysis or archiving – see Figure #9 below.
Figure #9
| A36 | fx | |||
| A | B | C | D | |
| 1 | TimeValue1 | TimeValue2 | TimeValue3 | TimeValue4 |
| 2 | 21.06.2012 11:11:33 | 21.06.2012 11:12:00 | 61,49197 | W |
| 3 | 21.06.2012 11:12:00 | 21.06.2012 11:12:10 | 61,44834 | W |
| 4 | 21.06.2012 11:12:10 | 21.06.2012 11:12:30 | 61,41078 | W |
| 5 | 21.06.2012 11:12:30 | 21.06.2012 11:12:50 | 61,39684 | W |
| 6 | ||||
All brands and logos are registered trademarks of their respective owners
9. Advanced features
The Power Manager software also allows you to define a number of user-defined events. Possible events are: Lighting up the indicators in the Power Meter window (see Chapter 7 above), or run a user-specified application. To set the parameters for such events (see Figure #10 below), just push the Events button in the Power Manager window (see Figure #2 above)
Figure #10
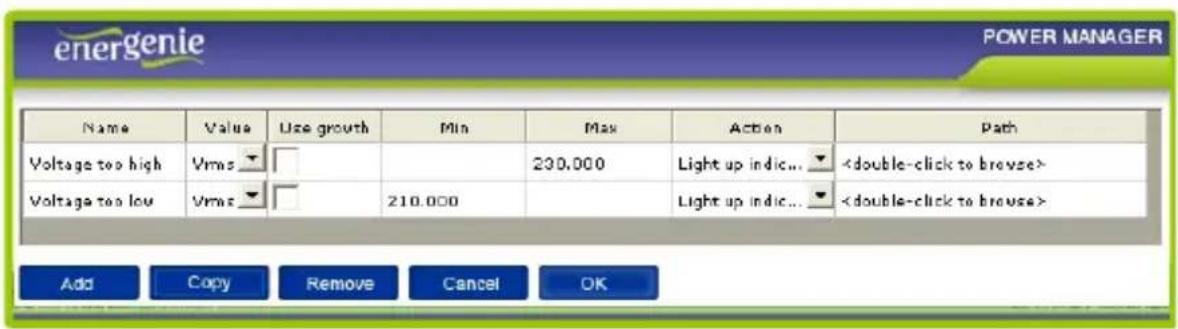
To define your event, first choose the parameter of your interest from the Value list box. If you wish the event to be triggered when the value of
All brands and logos are registered trademarks of their respective owners
energenie
EGM-PWML ENERGY METER WITH MEMORY
this parameter exceeds a certain maximum – fill in the Max field then. If you wish the event to be triggered when the value of this parameter drops below a certain minimum – fill in the Min field. Secondly you select the desired action from the Action list box. If you choose to execute a specific application or program, you can select the path to this application in the Path field. It is possible to give the event a practical name in the Name field.
Select the Use growth checkbox if you are interested in the difference between the current value of the parameter and its previous value, rather than in its absolute value.
Tip: Use growth checkbox might be particularly useful if you wish to do something whenever a certain device gets switched on or off.
energenie
EGM-PWML ENERGY METER WITH MEMORY
All brands and logos are registered trademarks of their respective owners
EC Declaration of Conformity
We hereby certify that the following product complies with all the relevant Safety Requirements of § 4 EMVG and of the Directives 2006/95/EC; 93/68/EEC and 2004/108/EC.
Applicant :
Gembird Europe BV
Wittevrouwen 56,
1358CD, Aimere, The Netherlands
Equipment :
Computer parts
Model Nos. :
EGM-PWML
Product description :
EGM-PWML Energy Meter with memory
European standards:
EN55022:2006; EN55024:1998+A1:2001+A2:2003; EN61000-3-2:2006;
EN61000-3-3:2008; EN60335:2002+A13:2008; EN55014:2006;
EN55014-2:1997+A2:2008
The following manufacturer/WITHIN Europe is responsible for this declaration:
Gembird Europe BV
Wittevrouwen 56, 1358CD, Almere, The Netherlands
Tel: +31-(0)36-5211588. Fax: +31-(0)36-5347835
Director
The Netherlands / Dec. 6, 2010
Place and Date

Authorized signature
Waste disposal:

Do not deposit this equipment with the household waste. Improper disposal can harm both the environment and human health. For Information about waste collection facilities for used electrical and electronic devices, please contact your city council or an authorized company for the disposal of electrical and electronic equipment.
Brand : EnerGenie
Model : EGM-PWML
Category : Energy meter