XMap 8 - Uncategorized GARMIN - Free user manual and instructions
Find the device manual for free XMap 8 GARMIN in PDF.

| Product Type | GPS Mapping Device |
| Brand | Garmin |
| Model | XMap 8 |
| Dimensions | 8.1 x 15.2 x 3.3 cm (3.2 x 6.0 x 1.3 in) |
| Weight | 290 g (10.2 oz) |
| Display | 5-inch color touchscreen, 480 x 800 pixels |
| Memory | 8 GB internal, microSD slot (up to 32 GB) |
| Battery | Rechargeable lithium-ion, up to 16 hours (typical use) |
| Water Rating | IPX7 (submersible up to 1 m for 30 min) |
| Satellite Systems | GPS, GLONASS, Galileo |
| Maps | Preloaded TopoActive maps with routable roads and trails |
| Navigation | Turn-by-turn directions, route planning, track recording |
| Connectivity | USB, Bluetooth, Wi-Fi (for map updates) |
| Sensor | 3-axis compass, barometric altimeter, accelerometer |
| Maintenance | Clean with soft dry cloth; avoid harsh chemicals |
| Safety | Use only as a navigational aid; always carry a backup map |
| Repair | Non-user-replaceable battery; contact Garmin support for service |
| Included Accessories | USB cable, carabiner clip, quick start manual |
Frequently Asked Questions - XMap 8 GARMIN
User questions about XMap 8 GARMIN
0 question about this device. Answer the ones you know or ask your own.
Ask a new question about this device
Download the instructions for your Uncategorized in PDF format for free! Find your manual XMap 8 - GARMIN and take your electronic device back in hand. On this page are published all the documents necessary for the use of your device. XMap 8 by GARMIN.
USER MANUAL XMap 8 GARMIN
WARNING: Messaging, tracking and SOS functions require an active Iridium satellite subscription. Always test your device before you go.
This manual is provided as a convenience.
GARMIN IS NOT RESPONSIBLE FOR THE ACCURACY OF THIS MANUAL AND DISCLAIMS ANY LIABILITY ARISING FROM THE RELIANCE THEREON.
Table of Contents
Getting Started....1
Welcome to XMap 1
What's New in XMap 2
How do I? 3
Helpful Tips....4
Frequently Asked Questions....7
Chart of Supported Coordinate Formats.... 12
Migrating Data to the New DeLorme Docs Locations 14
Basic Functions.... 15
About the Interface 20
Map Legend 24
Map Legend.... 24
Using the Toolbar.... 28
Showing/Hiding Toolbar Options.... 28
Reordering the Toolbar Options 28
To Create New Projects.... 28
To Open a Project 29
To Migrate a Project 29
To Save a Project 29
To Print 30
To Print the Map Screen 30
To Open the Map Library 30
To Use the Map Navigation Tool 30
To Grab and Pan the Map 30
To Use the GIS Tools 30
To Create a Route 32
To Start/Stop Your GPS Connection 33
To Exchange Information with a Handheld GPS.... 33
To Measure Distance.... 33
To Get Information About a Location.... 33
To Create a Profile.... 34
To Choose Options 35
Customizing the Map and Tab Display 36
Customizing the Interface.... 36
Displaying Basic Map Features 36
Customizing the Map Feature Preferences.... 39
Table of Contents
Changing the Map Colors.... 40
Changing the Map Magnification Level 40
Changing How POIs Display on the Map.... 41
Setting Units of Measure Preferences 42
Resizing the Map and Tab Areas 44
Viewing Two Maps at the Same Time 45
Showing or Hiding Tabs.... 46
Importing/Exporting Tab Manager Preferences 47
Reordering the Tabs 48
Using Keyboard Shortcuts 49
Selecting a Keyboard Shortcut Scheme 49
Creating a New Custom Scheme.... 49
Assigning Keyboard Shortcuts in a Custom Scheme.... 49
Customizing a DeLorme Scheme 51
Renaming a Custom Scheme 51
Deleting a Custom Scheme.... 52
Importing a Custom Scheme.... 52
Exporting a Custom Scheme 52
Searching For Commands.... 53
Viewing All of the Shortcut Keys for a Scheme.... 53
Using Projects/Map Data 55
Map Data Overview 55
Migrating Data to the New DeLorme Docs Locations 55
Managing Data 56
Managing Projects 59
Using Transfer Files 62
Changing the Properties of Your Data.... 66
Working With GIS 75
GIS Overview 75
Handling Disconnected or Deleted Layers.... 76
GIS Options....76
Using Layers in a Subscription.... 78
Redlining 80
Stationing 82
Bulk Importing and Exporting 83
Managing Layers in Your Workspace 90
Classifying, Symbolizing, and Labeling a Layer 117
Attributes-Datasheet View 131
XMap User Guide
Attributes-Design View....138
Forms....150
Query 156
Reordering Layers 162
Printing 165
Printing a Map 165
Printing a Route and Directions 166
Printing a Profile 167
Adding Text or Graphics to Your Map 168
Aligning Text and Graphic Items on Your Map....170
Snapping Text and Graphic Items on Your Map....171
Layering Multiple Text and Graphic Items on a Printed Map 172
Changing the Background Color of a Printed Map 172
Manually Assembling a Multi-page Map....173
Finding a Location on the Map....177
Find Overview....177
Find Options....177
Performing a Basic Search....178
Performing an Advanced Search....179
Performing a POI Search 182
Finding Points Near Your Current Location....183
Tutorial: Find Points of Interest on a Route 184
Finding a Symbol by its Name....187
Tips on Viewing Search Results 187
Keywords for Category Searches 188
MapTags: Converting, Moving, Hiding, and Deleting ....191
Using Address Book Contacts....193
Searching for Address Book Contacts 193
Importing Existing Address Book Information 193
Manually Entering Address Book Information....194
Centering the Map on an Address Book Contact 194
Editing a Contact In Your Address Book....195
Manually Moving a Contact on the Map....195
Relocating Address Book Contacts 196
Showing/Hiding Address Book Contacts on the Map....196
Deleting a Contact In Your Address Book....197
Deleting Your Entire Address Book....197
Exporting Your Address Book 197
Using the Draw Tools....199
Draw Overview 199
Viewing Hidden Draw Tools....203
Draw File Management....204
Using Draw Objects....217
Routable Roads, Trails, Tracks, Lines, Arcs, and Splines....223
Circles, Rectangles, and Polygons....229
Waypoints, Symbols, MapNotes, Text Labels, and Images....231
Custom Symbols....234
Registering Images 246
ImageReg Overview 246
Creating Data for a Registered Image 246
Opening and Closing Existing WorkFiles....246
Registering an Image....247
Modifying Existing WorkFiles 249
Deleting an Existing WorkFile....249
Hints for Placing Points 250
Profiling Linear Objects 252
Creating a Profile 252
Viewing the Profile Elevation Graphs 253
Statistical Data 255
Manually Setting Minimum and Maximum Elevation....257
Clearing a Profile....258
User Profile Data 258
Viewing Your Map in 3-D....261
Viewing a 3-D Map 261
Flying Over a 3-D Map ....262
Tutorial: Fly in 3-D....263
Setting Your 3-D Map Preferences ....266
Routing 267
Creating a Route....267
Adding and Inserting Stops and Vias....268
Changing the Routing Method 271
Changing the Properties of a Stop Along Your Route....271
Viewing Route Directions....272
Tutorial: Create a Route....272
Avoiding a Specified Area When Routing....274
Tutorial: Create Route Avoids ......274
XMap User Guide
Saving Route Directions as Text 278
Setting Your Routing Preferences....278
Editing a Route 279
Editing Roads 280
Labeling a Route Point with a MapNote 281
Moving Route MapNotes....281
Displaying and Centering Routes on the Map 282
Saving a Route 282
Deleting a Route 283
Importing Routes 283
Converting a Route to a GPS Log 283
Using GPS....285
GPS Overview....285
GPS Options/Initializing GPS....285
Tracking a Route with GPS 288
Getting Back on Track When Off Course 289
Panning the Map Automatically While GPS Tracking 289
Playing Back a Log File....290
Previewing a GPS Log File....291
Viewing File Details for a GPS Log....291
Monitoring Your GPS Status....292
Monitoring GPS Satellite Information....293
Viewing Sun and Moon Information....294
About GPS 294
Using Voice Navigation and Speech Recognition ....296
Voice Overview 296
Voice Options 296
Activating and Monitoring Speech Recognition 297
Training the Speech Recognition Engine 297
Voice Commands 299
Speech Recognition Tips....301
Changing Voice Output 303
Voice Preferences....303
Voice Prompts 304
Using DeLorme PN-Series GPS Devices 306
PN-Series GPS Overview 306
Creating Map Packages ....306
Syncing Maps and Data....311
Table of Contents
Using Third-party GPS Devices....325
Sending Route Information....325
Sending Tracks....326
Sending Waypoints....326
Receiving a Route 327
Receiving a Track 328
Receiving Waypoints....328
Using NetLink 330
NetLink Overview 330
Tutorial: Add Maps and Imagery....331
Using the XMap API Command Window 335
XMap API Command Window 335
API Commands and Parameters ....336
Legal Information 340
DeLorme XMap GIS Single-User License Agreement 340
Important Notices 343
Apache License, Version 2.0 ....350
Index 355
Getting Started
Welcome to XMap
For more information about XMap, visit our website at www.xmap.com.
XMap GIS Enterprise, XMap GIS Editor, and XMap Professional provide a three-tiered GIS solution for efficiently creating, importing, editing, classifying, querying, and sharing your GIS data in an enterprise environment. XMap is equally suited as a standalone GIS software solution or as a supplement component to your existing GIS infrastructure.
In addition to GIS, XMap includes powerful routing and in-vehicle navigation tools; advanced GPS support for field tracking and navigation; interoperability with Earthmate PN-Series GPS devices for field data collection and exchange of map data, waypoints, and tracks; 3-D terrain modeling with simulated fly-over functionality; advanced printing tools; and much more.
XMap GIS Enterprise
The upper tier of the XMap suite is designed to meet the specific needs of enterprise GIS managers who need to efficiently manage and deploy GIS data throughout a company.
XMap GIS Enterprise also includes all of the features in XMap GIS Editor. Create and distribute GPS data collection forms to XMap Editor and XMap Professional users and PN-Series GPS owners.
- Quickly sync layers—increased sync speed for large databases.
- Establish database permissions for Windows security groups.
- Ensure data integrity with check-out/check-in tools.
- Share data across the enterprise with database synchronization tools.
- Use the API Command Window to perform basic mapping functions from a third-party application.
- Automate the import and export of standard spatial data files with the bulk importer/exporter.
• Supports Microsoft® SQL Server® 2008R2 and 2012. - XMap GIS Enterprise in conjunction with multiple copies of XMap Professional provides a complete field force GIS data collection system.
XMap GIS Editor
XMap GIS Editor is a perfect choice for small GIS departments or for a company or organization that is considering the development of a GIS to increase productivity. XMap GIS Editor also includes all the features in XMap Professional.
- Create forms in databases synchronized from an XMap Enterprise database.
• Create zero and negative polygon buffers. - Export KML files.
- Geocode by State Plane and UTM coordinate systems.
- Cut individual GIS layers to a PN-Series GPS device for field work.
- Search for GIS objects using enhanced real-time proximity search for GIS objects using GPS Radar on the Find tab.
XMap User Guide
- Import and work with a variety of GIS file formats including, ESRI .shp and .e00; MapInfo .mif and .tab; AutoCAD .dwg and .dxf; and more.
- Geocode your existing data in .mdb, .xls, and other formats to create GIS layers.
- Create and edit points, lines, and polygons with freehand draw tools or with precise coordinate geometry input tools.
- Access advanced classification, annotation, buffer, and geospatial query tools.
- Create your own raster data layers with multi-point image registration.
XMap Professional
XMap Professional is ideally suited for field crews and mobile professionals. By offering access to GIS data that has been processed using the GIS Editor or GIS Enterprise editions of XMap, it provides an affordable alternative to a full-fledged GIS for use on the road and in the field.
XMap Professional offers essential and fundamental mapping functions that include data visualization, access to aerial and satellite imagery, address-to-address routing, annotation tools, document linking, advanced printing, GPS support, and more. In addition, you can view and print GIS maps created using XMap GIS Editor and XMap GIS Enterprise.
- Collect and edit data using forms synchronized from an XMap Enterprise database.
- Optimize response time with the latest in-vehicle, voice-controlled navigation tools.
• Perform country-wide searches of address locations and points of interest. - Easily redline data corrections to Enterprise GIS data and efficiently share these edits with your GIS administrator.
• View your data in stunning 3-D with the latest terrain modeling technology. - Import ESRI shapefiles into the GIS tab and apply symbolization.
What's New in XMap
XMap continues to facilitate GPS data collection for mobile field workers across all industries with tools that create and work with data collection forms.
- Now supports syncing to multiple databases. Use as many subscription files as desired to sync with more than one database.
-
One-step selection of GIS Layer for use on the PN. Right click on a layer in the Handheld Export tab to automatically select all of the grids containing the layer.
-
New Database Manager for Enterprise users allows for quick selection of groups and/or individual users for subscriptions and allows multi-select for both users and layers.
- Improved Project File Management. Updated base maps can now be used to correct older project files. Missing layers can be corrected without having to start with a new project file.
- Installation has been updated for both software and data. Future software updates can be easily patched verses having to reinstall the whole application. Data installations is also optimized for larger institutions. The same technology Microsoft uses for their patches can now be used to install DeLorme large base maps (call DeLorme for instructions).
- New SQL technology. SQL LocalDB replaces the need to install SQL Server Express on field worker laptops easing installation and reducing help ticket calls.
- New Team Tracking tab. When used with DeLorme's inReach devices multiple users can be tracked in real time. Receive SOS, No Motion and No Communication alerts. Supports geofencing based on GIS objects. Get an alert when user enters or leaves a designated area.
- Updated Administrator Guide for custom installations along with configuration options for XMap. Contact DeLorme for a copy of the guide.
How do I?
Click a question to open the related Help topic. See also, Frequently Asked Questions.
Controlling the Map
How do I pan the map?
How do I zoom the map in and out?
How do I change the map view to show the left map view, right map view, or both?
Display Preferences
How do I change the map colors?
Draw Tools
How do I add a road or trail to my map?
Searching for a Location
How do I search for a location?
GIS
How do I import a layer into a database?
How do I manage the layers in my workspace?
What is a workspace?
How do I classify a layer?
How do I create a query?
How do I use XMap Forms?
GPS
XMap User Guide
How do I start tracking with my GPS device?
See also, Routing
Handheld Export
How do I use my mapping application with my PN-Series GPS?
Map Data
What is a project?
How do I add or remove base data?
How do I add data and imagery?
How do I set data as routing data?
Routing
How do I create a route?
How do I track a route with my GPS receiver?
How can I automatically recalculate my route when I'm off course?
How can I avoid a specific area when routing?
Printing
How do I print a map?
Profile
How do I view a profile of a route I've created?
-
Center the route you want to profile on the map.
-
Click the Profile tab.
-
Select a route on the map to generate its profile. When the object is selected, it is highlighted and the Profile graph displays in the Profile dialog area.
3-D
How do I generate a 3-D map?
How can I expand my 3-D map to fit the entire screen?
Helpful Tips
These tips may help you use the features in your DeLorme mapping program. The Did You Know? pop-up tutorials provide hints while you are working in the application.
Tips
- To disable a specific pop-up tutorial, select the Don't Show Again check box before you close it.
- To disable all pop-up tutorials, click the Help button on the toolbar and click Shut Off All Pop-up Tutorials.
- To enable all pop-tutorials after you have shut off one or more, click the Help button on the toolbar and click Reset All Pop-up Tutorials.
Control Panel
| If you want to... Use this tip... | |
| Zoom the map out/in quickly | Drag the map cursor in an up-left direction to zoom the map out or drag it in a down-right direction to zoom the map in. |
| Pan the map quickly | • Position your cursor on the edge of the map; it becomes a white hand that you can use to drag the map to the new location.• With your cursor anywhere on the map, press the CTRL key on your keyboard—the cursor becomes a white hand. Hold down your left mouse button to drag the map to a new location. |
| Update the coordinate format that displays in the Control Panel | Update your measurement preferences at any time using the Display tab in the Options dialog box. |
| View the last map center | Press the middle button in the Compass Rose in the Control Panel to center the map on the previous map view. This button performs an undo function for the last pan or zoom (up to 256 times). |
Draw
| If you want to... Use this tip... | |
| Create a route using a road or trail you have added to the map with the Draw tab | When drawing a routable road/trail, click each existing road it crosses to ensure that you can route on the new road/trail. When you open a track you've imported from your GPS device, join the imported line with existing lines by right-clicking each intersection and selecting Manage Draw/ Join. |
Find
| If you want to... Use this tip... | |
| Modify a Find search result | Right-click a result item in the Find tab to add it as a MapNote, insert it as a stop in your route, copy the information to your clipboard, and so on. |
| Find a custom point of interest (such as a Chinese restaurant) when performing a GPS radar search in Find | You can use the Custom option to find other categories besides those listed, or to find multiple categories at once. |
GPS
| If you want to... Use this | tip... |
| View a GPS log on the map | Use the Draw tab to import a GPS log file and view it as a line object on the map. |
Handheld Export
| If you want to... Use this tip... | |
| Modify the export area in Handheld Export | When you click Preview, the default export area for the location you selected displays on the map as shaded rectangles. Click Select to confirm the area. To edit the area, click the Select/ Edit tool and then click the map to add or remove rectangles to/from the export area. |
Info
| If you want to... Use this tip... | |
| Quickly view information for a location on the map. | Hover your cursor over objects on the map to see information (such as road names, city/town, details about draw objects, etc.) in the status line that appears at the bottom of the map, just above the tab area. |
Map Data
| If you want to... Use this | tip... |
| Learn how to add route and/or draw layers to your project | Add existing route and/or draw files to your project by clicking the Add button and selecting the Draw File or Route File option. |
Measurement Tool
| If you want to... Use this tip... | |
| Measure the area/perimeter of a location on the map | Use the Measure tool on the toolbar to draw a polygon on the map and determine its area and perimeter. Just click point-by-point to draw the polygon on the map and then double-click to close the polygon. The area and perimeter display in the center of the polygon. |
| If you want to... Use this tip... | |
| Stop a page in a multi-page map from printing | If you do not want to print all the pages in a multi-page map, on the Layout graphic, click each page you do not want to print. |
Route
| If you want to... Use this tip... | |
| Reorder inserted stops | Reorder your inserted route stops using the Advanced features in the Route tab. |
| Create a route quickly | For quick route creation, right-click the map and select one of the Create Route options or use the Route buttons onthe toolbar. |
| Reorder the columns in the Route Directions list | Click theDirectionslist column headers to change the column order. |
| Determine the difference between adding and inserting stops and vias | Added stops/vias are placed in the order you add them to the route. Inserted stops/vias are placed in the order you would approach them between the Start and Finish points of the route. |
| View information about your second turn | Click theShow Turnsbutton when GPS tracking to view information about the following turn. |
Tab Area
| If you want to... Use this tip... | |
| Adjust the size of the tab area | Adjust the size of the tab area by dragging the top or right side of the tab area. |
| Show, hide, or reorder tabs | Use the Tab Manager option in the Help menu to show, hide, or reorder tabs. |
| Import or export a tab configuration file | Use the Tab Manager option in the Help menu to import or export a tab configuration file |
Voice
| If you want to... Use this tip... | |
| Create new speech recognition profiles | You can create a new speech recognition profile for each of your working environments (noisy, quiet) and users (your spouse or child) by clicking the Speech settings in the Windows Control Panel. |
| Learn how to make the microphone more sensitive to your commands in noisy environments | If there is background noise while you are speaking, it may be helpful to precede all of your voice commands with a special phrase (like Simon Says). See the Voice Settings tab of the Options dialog box. |
Frequently Asked Questions
These questions are asked most frequently by our customers.
• Why doesn't map data display in all projects?
The procedure for adding data to XMap varies; it depends on if you want to add the data to the current project or if you want to add it to all projects. If you added the data to only the current project and you want to view it in all projects, you must add the data as base data in the application.
Use the steps below to add a map dataset as base data.
-
Click the Map Data tab.
-
Click Data and then click Base Data.
The Base Data Locations dialog box opens listing each of the data sources on your system. - Click Add, select the hard drive location where you saved your data from the Browse for Folder dialog box, and click OK.
The OK button is enabled when you select a folder containing a file that contains the properties of the map data being added. - Click Done.
• What map data is included with XMap?
XMap includes a worldwide reference base map dataset that includes major roads, cities, boundaries, and geographic features, which is visible between data zoom levels 1 and 6. For more detailed map features or aerial imagery, you can purchase a variety of base map datasets from DeLorme or integrate your own data using XMap's import and data adding tools. Note that most of the maps used by DeLorme to convey the capabilities of the software are created using an optional DeLorme base map dataset and/or data or imagery from third-party sources.
• How do I add non-DeLorme imagery to my map?
Use the Map Data tab to add imagery in MrSID and GeoTIFF format to your map.
- Click the Map Data tab.
- Click Data and then click Add.
The Add Data to Maps dialog box opens. - Browse to the file you want to add, select it, and then click Add.
The imagery is added to the current project.
Note Imagery will not display unless projection information is specified in the file.
• How do I import files from an earlier version of XMap into this version?
Use the Map Data tab to import projects, routes, and draw files from many other DeLorme mapping programs. For information about migrating data to XMap, see Migrating Data to the New DeLorme Docs Location.
To Open A Project
- Click the Map Data tab.
- Click File and then click Open.
- Select the project you want to view and then click Open.
- Click OK.
To Open a Route
- Click the Map Data tab.
- Click Data and then click Add.
The Add Data to Maps dialog box opens. - Browse to the file you want, select it, and then click Add.
The route is added to the current project.
To Open a Draw File
- Click the Map Data tab.
-
Click Data and then click Add.
The Add Data to Maps dialog box opens. -
Browse to the file you want, select it, and then click Add. The draw file is added to the current project.
• What is my server name?
XMap uses Microsoft SQL Server as its DeLorme OpenSpace database engine. Your server name varies, depending on if you are connecting to or creating a DeLorme database in Microsoft SQL Server 2005 Express/Microsoft SQL Server 2008 or a Microsoft Enterprise SQL Server at your company.
•
- To establish a local connection to SQL Server 2005 Express or SQL Server 2008, use
- To establish a connection to a Microsoft Enterprise Microsoft SQL Server, use
• Why doesn't my Workspace display any layers?
If there are no layers in your Workspace, you may have accidentally removed them. To retrieve the layers, click the GIS tab, click the Workspace subtab (if it is not currently selected), click the Layers button, and then click Manage. Select the Source Database you want to pull layers from, highlight the Layers in the Database, and then click the move or move all button to move the layers into your workspace.
If the database where your layers are present is not listed in the Source Database drop-down list, you can connect to it by selecting the Other... option. If you have not yet created a database, you can do so by selecting the New ... option in the Target Database drop-down list in the Create Layer and Import Wizard dialogs.
• Where do I find the map settings and other Options settings?
Click the Options button on the toolbar to modify GPS, voice, GIS, map feature, display, handheld, and keyboard shortcut, and 3-D preferences. For more information, see To Open the Options Dialog Box.
- Upgraders only: What happens to my projects when I upgrade?
In previous versions of XMap, your projects, draw files, route files, log files, and other DeLorme files were stored by default in the DeLorme Docs folder on the root of your computer's C drive unless you specified a different directory during installation.
In XMap 6 and later versions, the DeLorme Docs folder for all files except NetLink downloads is located in the Documents folder under your user name. For NetLink downloads, the Downloads folder is located in the DeLorme Docs folder under Public Documents.
For information about migrating data to XMap, see Migrating Data to the New DeLorme Docs Location.
- Upgraders only: Why doesn't XMap overwrite the older version?
XMap 5 and later versions do not overwrite older versions of XMap, such as XMap 4.5 or earlier. This allows you to view both versions on the same computer.
- Upgraders only: Should I uninstall my previous version before installing the new version?
You are not required to uninstall XMap 4.5 or earlier versions before installing XMap 8.
• Can I see imagery and data from Topo USA or Street Atlas USA within XMap?
Yes. The location of the Downloads folder changed beginning with XMap 6. If you stored your data in the DeLorme Docs Downloads folder in XMap 5 or earlier, it will automatically migrate to the new location. If you stored it in a different location, you can use the Map Data tab to browse to the location and add it.
For information about migrating data to XMap, see Migrating Data to the New DeLorme Docs Location.
• How do I get data updates or fix the roads on my map?
If you find there is a local road that is missing, you can add it to the current draw layer using the Routable Roads Draw tool. For more information, see Drawing Routable Roads or Trails on the Map.
To report a correction to us:
•
- Click the NetLink tab.
- Click the Support subtab.
- Click the Submit Correction link.
- Use the Customer Revisions Wizard to submit the change.
• How do I initialize my GPS receiver?
Each time you use your GPS receiver, you initialize it, which means you set your starting position on the map by obtaining the initial coordinates of your location. This can be done automatically or manually.
For more information, see GPS Options/Initializing GPS.
• What's the difference between a stop and a via?
When routing, you have the option of adding or inserting stops or vias in the route. A stop is a location in the middle of a route where you want to stop and then proceed from. A via is a road on the map that you want to specifically use when routing.
For example, if you create a route between Portland, Maine, and Yarmouth, Maine, without any stops or vias, the route directions will tell you to take 1-295. However, if you want to take US Route 1 instead, you can place vias in the route on US Route 1 to force the route to go by way of US Route 1. If you plan on stopping in Falmouth Foreside for lunch, you will want your route directions to reflect that stop. When you add a stop, the route can be recalculated to include the stop in the middle of your route.
The map below shows the area between Portland, Maine, and Yarmouth, Maine, with two vias and one stop.
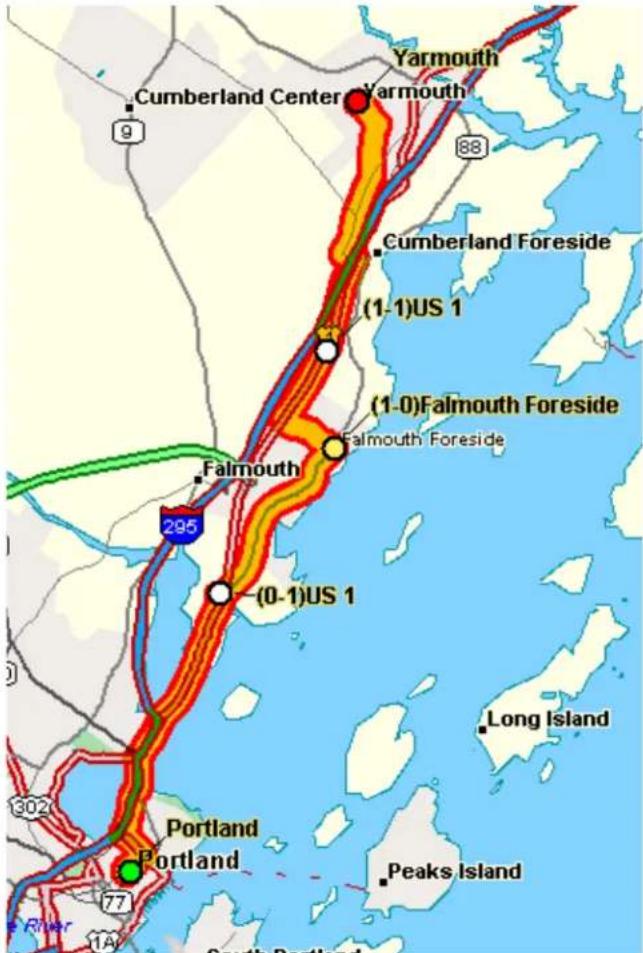
text_image
Cumberland Center Yarmouth 88 Cumberland Foreside (1-1)US 1 (1-0)Falmouth Foreside Falmouth 295 (0-1)US 1 Long Island Portland Portland Peaks Island River South Portland• What's the difference between adding and inserting a stop or via?
The Insert Stop/Via function arranges stops/vias geographically in the route. The Add Stop/Via function adds stops/vias in the order you add them to the route.
• Why did my route fail to calculate?
Your route will fail to calculate if you create a route:
•
- With a route start, stop, via, or finish point in an area that you have designated as a Route Avoid.
• That includes route points outside the United States, Mexico, or Canada.
- On an island without roads. In this case, XMap will look for the nearest road to that island to place the route point. If the nearest road is not routable (for example, it is the only road on the island and/or the island does not have ferry access), you will get an error message saying "Route failed to calculate."
• Why do X marks display on the map when I calculate a route?
- When you place a route point in a location that isn't on a street, XMap finds the closest street to that location, marks the space between the point you clicked and the street with X marks, and starts the route at the street.
- If you perform a Find for an address that is on a walkway and place a route point on it, XMap finds the closest street to that location, marks the space between the point you clicked and the street with X marks, and starts the route at the street.
• Why are the tab area and control panel so narrow?
XMap was designed to accommodate resolutions of 1024 x 768 or higher. If you are using a very high resolution (such as 1920 x 1200), the tab area and control panel in XMap may appear to be very narrow. You can modify the size of the map and tab area or use the Windows Control Panel to adjust your display settings.
• What's the best way to measure the distance of a road or trail?
The best way to determine the distance of a particular road or trail, is to create a route. You can create a route using right-click functionality, the toolbar, or the Route tab. For more information, see Creating a Route.
The best way to determine the distance of a particular road or trail, is to create a route. You can create a route using right-click functionality, the toolbar, or the Route tab. For more information, see Creating a Route.
The best way to determine the distance of a particular road or trail is to create a route. You can create a route using right-click functionality, the toolbar, or the Route tab. For more information, see Creating a Route.
• What's the best way to measure a large area on the map?
The best way to measure a large area on the map is with the area tools in the Draw tab, such as the polygon tool. When you draw an area object on the map, the area displays next to the object on the map. If you click off of the object, you can view the area again by clicking the Select tool in the Draw tab and then clicking the area object on the map. For more information about drawing area objects, see Drawing a Circle, Rectangle, or Polygon on the Map.
• What's the best way to measure a short distance on the map?
The best way to measure a short distance that is not made up of a road/trail on the
map is to use the Measure tool on the toolbar. The measure tool allows you to measure linear distance and area on the map based on the units chosen in the Display tab of the Options dialog box. For instructions on how to use the measure tool, see Measuring Distance and Area.
• Why won't 3-D billboards display?
If you receive a message saying that 3-D billboards cannot be displayed, ensure that you have a 32 MB video card with the latest drivers and that it supports DirectX and transparencies. For more information, see the DeLorme Forums.
Chart of Supported Coordinate Formats
These are the supported search formats. Sample coordinates are for Yarmouth, Maine.
Tip Examples of search formats are listed in the Advanced search drop-down text boxes along with a history of your most current search criteria.
| Coordinate Format | QuickSearch Advanced Search | ||
| Latitude/Longitude | N 43 48 30, W70 9 52 | N 43 48 30 | W70 9 52 |
| N 43 48.4910, W 070 09.8440 | N 43 48.4910 W | 070 09.8440 | |
| N434829.4600, W0700950.6400 | N434829.4600 | W0700950.6400 | |
| N43-48-30, W70-9-52 | N43-48-30 | W70-9-52 | |
| N 43:48:29.46, W 70:9:50.64 | N 43:48:29.46 | W 70:9:50.64 | |
| 4348, -7009 | 4348 | -7009 | |
| 4348N, 7009W | 4348N | 7009W | |
| N4348, W7009 | N4348 | W7009 | |
| 4348n, 7009w 4348n 7009w | |||
| n4348, w7009 | n4348 | w7009 | |
| 4348 N, 7009 W | 4348 N | 7009 W | |
| N 4348, W 7009 | N 4348 | W 7009 | |
| 4348 n, 7009 w | 4348 n | 7009 w | |
| n 4348 w 7009 | n 4348 | w 7009 | |
| 434829, -700950 | 434829 | -700950 | |
| 4348.491, -7009.844 | 4348.491 | -7009.844 | |
| 4348.491, -7009.844 | 4348.491 | -7009.844 | |
| 434829.46, -700950.64 | 434829.46 | -700950.64 | |
| 43.80818333, -70.16406667 | 43.80818333 | -70.16406667 | |
| 43 48.4910 N, 70 09 50.64 W | 43 48.4910 N 70 09 50.64 W | ||
| 43 48.4910 n, 70 09 50.64 w | 43 48.4910 n | 70 09 50.64 w | |
| N 43 48.4910, W 70 09 50.64 | N 43 48.4910 70 09 50.64 W | ||
| 434829.46 N, 700950.64 W | 434829.46 N | 700950.64 W | |
| 43, -70 | 43 | -70 | |
| MGRS/USNG 19TDJ 06354 5118719TDJ0635451187(NAD27)*19TDJ0635510919TDJ06451119TDJ0651 | Same as QuickSearch | ||
| UTM/UPS | 19T 0406311E 4850964N | Zone 19TEasting 0406311ENorthing 4850964N | |
| 19T 0406311 4850964 | Zone 19TEasting 0406311Northing 4850964 | ||
| 19T / 0406311 / 4850964 | Zone 19TEasting 0406311Northing 4850964 | ||
| SPCS | ME-W 0500490 0355150 | Zone ME-WEasting 0500490Northing 0355150 | |
* Use this example for USNG with non-standard datum.
Migrating Data to the New DeLorme Docs Locations
In versions of XMap prior to XMap 6 and in other DeLorme products, your projects, draw files, route files, log files, imagery, and other DeLorme files were stored by default in the DeLorme Docs folder on the root of your computer's C drive unless you specified a different directory during installation.
For XMap 6 and newer versions:
- The DeLorme Docs folder for all files except NetLink downloads is located in the Documents folder under your user name.
- The DeLorme Docs folder for NetLink downloads is located in the DeLorme Docs folder under Public Documents. This allows all users on the computer to access NetLink downloads.
What is Migration?
The migration process does not move your files—it copies them to the new locations. When you are sure your files are working correctly in the new locations, you can delete them from the old locations as long as you are not using them for another DeLorme program. For example, if you have an imagery file you use in Topo USA or XMap (5.x or earlier), keep both files.
Because all new information you add to a project will be saved to the new file location—even if you open it from the old location, we strongly recommend that you migrate your files. If you do not, you could have project data in two DeLorme Docs locations; your project will work correctly, but your data will not all be in the same location.
Project Migration
When you migrate a project, all associated files (routes, draw layers, and connections to GIS layers in a database) are moved with it.
To Manually Migrate a Project
Use the following steps to migrate a project at any time.
- Click the arrow next to the Open button Migrate Project.

on the toolbar and then click
OR
Click the Map Data tab, click File, and then click Migrate Project.
The Migrate Project dialog box opens.
-
Browse to the project you want to migrate, click the project, and then click Migrate.
-
The Migration Completed dialog box opens. Go to step 5. OR
If a file with the same name already exists in the new DeLorme Docs location, the Confirm Link to Existing File dialog box opens. Go to step 4.
- Click Link to replace the project link to the existing file in the new location and then go to step 5. OR
Click Link All to replace any project links to existing files in the new location and then go to step 5.
OR
Click Save Copy to maintain the project link to the current file and save it with a different name. OR
Click Cancel to stop the migration process and roll back any file migration that has occurred up to this point.
- In the Migration Completed dialog box, click Open to open the migrated project or Close to close the dialog box and return to your last active project.
Note If there is a problem with the migration, a message will notify you of any corrective action you need to take.
Basic Functions
Zooming In and Out
You can use the drag and zoom feature, zoom tools, or the data zoom level(Data zoom level is the relationship between what you see in a map view and how it exists in reality. It is the amount of geographic data displayed on a computer monitor. The data zoom level is similar to the traditional fractional relationship expressed on paper maps. For example, 1:24,000, 1:100,000, 1:500,000, and so on.) to quickly change the zoom level of the map view.
Notes
- Increase the data zoom level number to show a smaller geographic area at greater detail.
- Decrease the data zoom level number to show a larger geographic area at lesser detail.
- If you view both the right (primary) and left (secondary) maps at different data zoom levels, a box (or lines, depending on the current data zoom level) displays on the map that is zoomed out the furthest. The box/lines indicate the area that is in
view on the other map. You can disable this feature by clearing the Show Ref check box at the top of the secondary map window.
- If you view the right and left maps at the same data zoom level but they are not equally represented on the screen (50/50), a box (or lines) displays on the map that is covering the most screen area. The box/lines indicate the area that is in view on the other map.
To Drag and Zoom In
Use the following steps to zoom in either the right or left map.
- Click and hold down the left mouse button as you drag the mouse in a down-right direction on the map to encompass the area you want to display. A view box displays on the screen and changes dimension as you move the mouse. A label displays the data zoom level at the current map center.
- Once you reach the map area or data zoom level you want to display, release the mouse button. The area you selected fills the map window, the map re-centers, and the map view adjusts to show the appropriate level of detail.
Tip To move the view box to another location, press the SHIFT key at any time.
To Drag and Zoom Out
Use the following steps to zoom in either the right or left map.
- Click and hold down the left mouse button as you drag the mouse in an up-left direction on the map. A staircase with a small circle displays on the screen.
- Continue dragging the mouse in an up-left direction. The small circle moves up the steps, one step per data zoom level. A label displays the data zoom level to the bottom-right of the staircase.
- Once you reach the data zoom level you want to display, release the mouse button. The map view adjusts to display the appropriate level of detail. The map center is retained on your screen.
To Zoom In/ Out Using the Zoom Tools
There are two sets of zoom tools. The zoom tools for the right map are located in the Control Panel. The zoom tools for the left map are located at the top of the left map view.
| Right Map Controls | 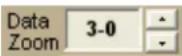 | Click the up arrow to zoom out one minor data zoom level at a time. Click the down arrow to zoom in one minor data zoom level at a time. | |
 | Click theZoom In 1tool to increase the detail number to the next full level. | ||
 | Click theZoom Out 1tool to decrease the detail number to the next full level. | ||
 | Click theZoom Out 3tool to decrease the detail number by three full levels. | ||
| Left Map Controls | 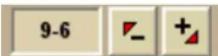 | Click the plus button to increase the detail number to the next full level.Click the minus button to decrease the detail number to the next full level.The data zoom level of the left map displays in the text area to the left of the buttons. | |
Tips
- Press ALT+ PAGE UP on your keyboard to zoom out to the next full data zoom level. Press ALT+ PAGE DOWN on your keyboard to zoom in to the next full data zoom level.
- Use the mouse wheel to zoom the map in and out. Rotate the mouse wheel to zoom in by individual data zoom level steps or hold the SHIFT key while rotating the mouse wheel to zoom to the next full data zoom level.
Panning/ Centering the Map
Use any of the following methods to pan (move) or center the map.
- Click anywhere on the map. The point you click becomes the new map center.
• Double-click a layer name in the GIS workspace.
- When you point near the map edge, a white hand displays. Drag the hand to move the map in that direction.
- With your cursor anywhere on the map, press the CTRL key on your keyboard—the cursor becomes a white hand. Hold down your left mouse button to drag the map to a new location.
- Click the Map Panning button 📋 on the toolbar to drag/pan the 2-D or 3-D map in any direction.
- Click anywhere on the overview map. The point you click becomes the new map center. This allows you to traverse greater distances with each mouse click than you can within the main map.
- Point anywhere on the black view box in the overview map window. When the pointer becomes a drag the view box to the new location.
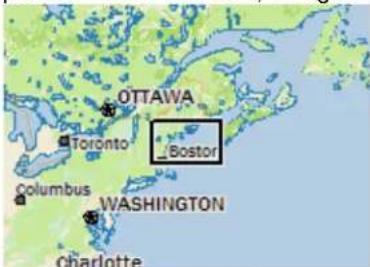
text_image
OTTAWA Toronto Boston Columbus WASHINGTON Charlotte• Use the search features on the Find tab to center the map on a particular location
- Assign shortcut keys to pan the map up, down, left, or right in small increments.
Copying Your Map to the Clipboard
Click the Copy to Clipboard button 📄 on the Print tab to copy your map to the clipboard. You can then paste it into another program.
You can also right-click anywhere on the map and click Copy Map to Clipboard.
Saving a Map as a Bitmap or JPEG Image
You can save the current map view as a bitmap (.bmp) or JPEG (.jpg) image in all page layout formats: Single, 2 x 2, and 3 x 3. If you select a multi-page format, all the active
pages are saved as individual bitmaps or JPEGs. The file name is the specified file name with an incremental page number at the end.
See Printing a Map for information about printing a map without saving it as a file.
To Save a Map as a Bitmap or JPEG
Use the following steps to save a map as an image.
- Locate the area on the map that you want to save as an image.
-
Click the Print tab and then click the Map subtab (if it is not already selected).
-
Under Map, select Left, Right, or Both.
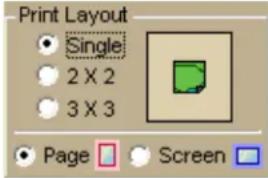
-
Under Print Layout, select Page(the map print area is based on the paper size specified in the Setup options) or Screen(the map print area is based on the screen size).
The print area for a Page map displays as a red box and the print area for a Screen map displays as a blue box on the overview map.
- If you selected Page in step 4, the following options are available.
- Under Print Layout, select a layout option (Single, 2 x 2, or 3 x 3). The print area displays on both the Map and the Overview Map. In the example below, 2 x 2 is selected. This means the print area encompasses four standard pages at whatever paper size you specified in the Setup options. You can assemble a multipage map into a large map.
text_image
Print Layout Single 2 X 2 3 X 3 Page Screen- If you selected 2 x 2 or 3 x 3 and do not want to save all the pages in the multipage map on the map layout graphic, click each page you do not want to save. The page appears dimmed or gray. In the example below, page 4 will not print.

- Verify this is the location and photo zoom you want to save. If not, pan the map to the location and zoom to the level you want.
Note Changing the photo zoom enlarges/reduces the map features and changes the map area that you save as an image. If you increase the photo zoom level, map text, lines, symbols, etc. are larger and your map area is reduced. If you decrease the photo zoom level, map text, lines, symbols, etc. are smaller and your map area is enlarged. The reduction/enlargement percentages for your photo zoom level display under the Photo Zoom dropdown list.
- If you want to use other tabs and functions but not lose your current print area, print photo zoom, or other settings, select the Lock Print Center check box. This locks the print area and changes the tab label to red.
- Add text or graphics to your map.
- Select the Print Preview check box to zoom the map and view the entire area that will be saved as a bitmap image. Clear the check box to return to your previous data zoom level.
- Click the Save button

The Save 2D Map Image dialog box opens.
- Type the file name in the File Name text box, select to save the file as a .bmp or .jpg from the Save as Type drop-down list, select the DPI (dots per inch) value (optional), and click Save.
Measuring Distance and Area
Use the Measure tool 📄 on the toolbar to measure linear distance and area on the map based on the units chosen in the Display tab of the Options dialog box.
The snap function snaps (attaches) the point of a measurement line to a point on a road or another measurement object. This ensures a more accurate measurement of distance or area. To measure area, you must completely enclose the area by snapping your finish point to your starting point.
Notes
- The Measure tool is the best way to measure short distances on the map. If you want to measure the distance of a road, try creating a route. If you want to measure a large area on the map, use the area object tools in the Draw tab.
- To disable the auto-snap function, hold down the ALT key on your keyboard while using the Measure tool.
- Measure objects (lines and areas) are saved with the current project. When you create a new project, the measure objects do not display. If you want the same measure objects on your new project, you must recreate them.
- To view information about a measurement line, right-click it and click Info. The measurement information is automatically displayed in the Info tab.
To Measure Distance or Area
Use the following steps to measure linear distance or area on the map.
-
Verify you have the correct units of measure selected in the Display tab of the Options dialog box. For more information, see Setting Units of Measure Preferences.
-
On the toolbar, click the Measure tool. The pointer changes to
-
Click point-by-point to draw a measurement line on the map. A text box displays next to your pointer indicating the total distance of the measurement taken. Note When you pass over a point in a road, measurement line, or measurement area to which you can snap, a yellow circle ⚙ defines the snap point. Click to snap the point of the measure line to the road or measurement object's point coordinate.
-
To end a measurement line, double-click the last point of the measurement line. OR
Click the last point of your measure line or area and then click the Measure tool on the toolbar.
The measure line is a two-pixel wide yellow line and the total length of the line is displayed in a label at each endpoint of the line.
- To end a measure area, hover over the starting point until the yellow snap circle ⚙️ displays, and then double-click the last point to the starting point. The closure area is transparently shaded, and the area and perimeter measurements display.
Searching Tips
XMap User Guide
When you use the Quick Search subtab on the Find tab or the Route tab to search for a location, you must enter the information in a specific format.
Tips
- Use punctuation as in the examples in the table below.
- Do not use periods.
- Search with the minimum amount of information to increase the number of results. For example, if you are searching for a road, and you are not sure of the spelling, type in part of the name and then scroll through the list of results until you find a match.
This table shows formats for search types.
| For this type of search... Use this format... Example | ||
| Address | Street address, City, State | 100 Baxter Blvd, Portland, ME |
| Street address, ZIP Code | 100 Congress St, 04101 | |
| Street address, City, State, ZIP Code | 100 Congress St, Portland, ME 04101 | |
| City | City, State | Atlanta, Georgia |
| ZIP/Postal Code | Within the U.S.: ####### (5-digit ZIP Codes only)Within Canada: #### (6-digit Postal Codes only) | 04096J8E756 |
| Minor Point of Interest | POI name, City, State | Subway, Columbus, OH |
| Major Point of Interest or Landmark | POI/landmark name Mount Rushmore | |
| POI/landmark name, State Space Needle, WA | ||
| Latitude/Longitude See Chart | of Supported of Supported Coordinate Formats | |
For more information about the Find tab, see the Help topics under Finding a Location on the Map.
About the Interface
Tab Area
You can access most of the application's functions from the tab area at the bottom of the screen. To access Help for a specific tab, click the Help button ⚙ on the tab. You can also reorder the tabs, show or hide individual tabs or show or hide the tab panel.
- Map Data
• GIS - Find
- Info
-
NetLink
-
ImageReg
- Draw
- Profile
• 3-D - Route
• GPS - Voice
- Handheld Export
Control Panel
The Control Panel, located to the right of the map view, displays information pertinent to the current map view and map cursor position. It also includes zoom and map pan buttons. You can customize your interface to show or hide the Control Panel.
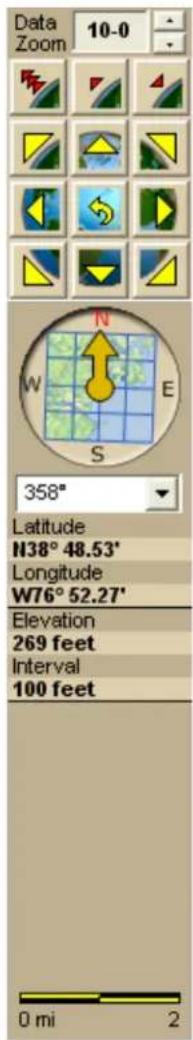
text_image
Data Zoom 10-0 358° Latitude N38° 48.53' Longitude W76° 52.27' Elevation 269 feet Interval 100 feet 0 mi 2Data Zoom Level—The current data zoom level of the map view; ranges between 0-0 (maximum zoom out) and 20-0 (maximum zoom in).
Zoom Tools—Buttons that quickly zoom out three levels, out one level, or in one level. For more information, see Zooming In and Out.
Compass Rose—A group of nine buttons on a globe. The outer buttons have yellow arrows; click one of the arrow buttons to pan the map in that direction. Click the middle button to center the map on the previous map view. This button performs an undo function for the last pan or zoom (up to 256 times).
Map Rotation Tool—The arrow in the graphic indicates True North in relation to the rotated map. Use the Map Rotation Tool to rotate the map in any direction. You can rotate the map by clicking or dragging the square map graphic in the direction you want or by selecting/typing the degree of map rotation from the drop-down list.
Map Coordinates—Coordinates for the current map cursor position display based on the units of measurement preferences chosen in the Display tab of the Options dialog box.
Elevation and Interval—Display in the measurement chosen in the Display tab of the Options dialog box. The data zoom level affects interval display.
Scale Bar—Indicates the distance one scale bar unit equals in the measurement chosen under in the Display tab of the Options dialog box.
Overview Map
XMap User Guide
The overview map is a small map in the lower-right corner of the screen that offers a wide-angle view of your current map view area. It is approximately three data zoom-levels out from the current map view.
Tips
- Click anywhere on the overview map and that point becomes the new map center. This allows you to travel greater distances with each mouse click than you can within the larger, current map view. - Use the black view box in the overview map window to pan the map. Point anywhere on the view box. When the pointer becomes a drag the view box to the new location.
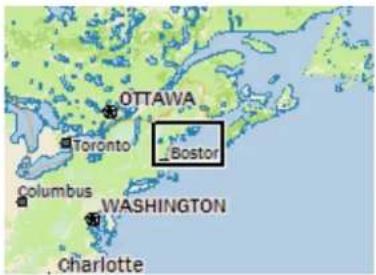
text_image
OTTAWA Toronto Boston Columbus WASHINGTON CharlotteToolbar
Use the toolbar to perform many functions in the application without navigating through the tab area.
Tips
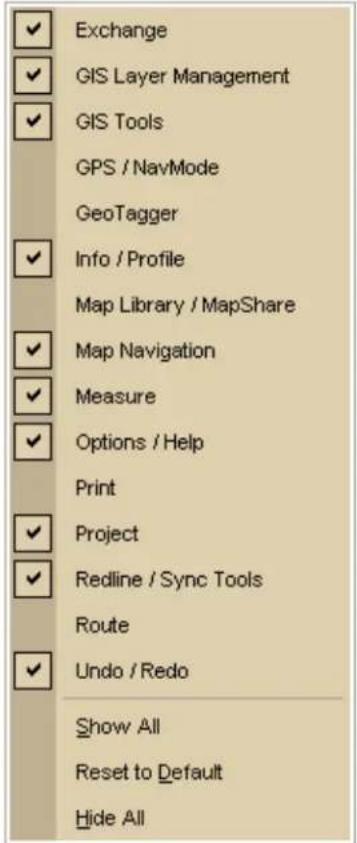
- Not all of the toolbar features are activated by default. To modify which toolbar items you want to view, right-click the toolbar. Toolbar options with selected check box next to them are currently displayed on the toolbar. Click the item to activate or inactivate it on the toolbar.
- In addition to customizing which toolbar features are displayed, you can also reposition the toolbar segments horizontally or vertically. Just drag the vertical dotted bar that separates each segment to the new location (left, right, up, or down). You cannot move a toolbar segment above the top-most line on the toolbar, customize toolbar groups, or remove toolbar groups from the toolbar.
Exchange
- Exchange GIS layers, draw layers, maps, routes, waypoints, or tracks with an Earthmate PN-Series GPS device.
- Export and import GIS points to and from an Earthmate PN-Series GPS device.
See the Help topics under Using Handheld Devices for more information.
GIS Layer Management
See To Use the GIS Tools.
GIS Tools
See To Use the GIS Tools.
GPS
- Start or stop your GPS connection (also available on the GPS tab).
Info/ Profile
- Get information about a location on the map. You can also right-click a location on the map and click Info.
- Profile a linear object on the map. You can also select the Profile tab, right-click the linear object on the map and then click Profile.
Map Library
- Open the NetLink tab to download or purchase data and imagery.
Map Navigation
- Recenter the map and zoom it in and out.
• Grab and pan the map in any direction.
Measure
- Measure linear distance and area on the map based on the units chosen in the Display tab of the Options dialog box.
Options/ Help
- Open the Options dialog box to set GIS, GPS, display, map feature, voice navigation, 3-D, search, and keyboard shortcut preferences.
- Open the Help menu to access the XMap Help topics, Map Legend, and more.
- Print your current map screen. See the Print tab for more printing options.
- Quick print with the current Print tab settings.
Project
- Create, save, and/or open projects. You can also access these options on the Map Data tab.
Redline/ Synchronization Tools
Available when an active subscription exists.
See To Use the GIS Tools.
Route
- Set route start, finish, and stop, and via points and calculate a route. You can also access these options from the Route tab.
Undo/ Redo
- Undo/redo your last GIS edit and measure tool actions.
Map Legend
Map Legend
The features that display on the map may display differently depending on which map colors you chose on the Display tab of the Options dialog box. The tables below show the symbolization of each feature, by map color.
Notes
• Not all features are available at all zoom levels.
• Not all features are available in all datasets.
- High-contrast Color features display the same as Street Color features (except for land, which displays as black).
routable Trail Features
| Topo Colors | Street Colors | Description |
| --- | Major Trail (National Scenic, National Historic, etc.) | |
| -- | 4-wheel Drive Trail | |
| --- | Trail/Walkway/Foot Trail |
Important Some trails may cross private property. Contact the applicable trail department to ensure you have the appropriate permissions before following a major trail. For contact information, see Recreational Contacts.
Routable Road Features
| Ferry Passenger | |
| Ferry Vehicle | |
Interstate Highway (can also include this symbol:  | |
| Limited Access Road | |
| Local Road | |
| Major Connector, Forest Road | |
| Minor Connector | |
| Non Limited Access Interstate | |
| Primary State Route | |
| State Route (can also include this symbol: [703Z] | |
| Toll Road | |
U.S./National Route (can also include this symbol:  | |
| Unclassified Road | |
| Unimproved Road |
Land Cover
| Topo Colors | Street Colors | Description |
| n/a Bare | Rock or Sand | |
| Bureau of Land Management Land | ||
| Bureau of Mine Reclamation Land | ||
| n/a Forest, evergreen | ||
| n/a Forest, mixed | ||
| Ice or Snowfield | ||
| Indian Reservation (at data zoom level 11) | ||
| Indian Reservation (at data zoom level 2 thru 10-7) | ||
| Intermittent Water | ||
| Land | ||
| Military Area (at data zoom level 11) | ||
| Military Area (at data zoom level 2 thru 10-7) | ||
| n/a Mine or Quarry | ||
| Parks | ||
| River/Stream | ||
| n/a | Transitional Area, Lava, Salt Flats, or Mixed Barren | |
| Water | ||
| n/a Wetlands | ||
Point Features
| Topo Colors | Street Colors | Description |
| Amusements | ||
| Airport (private) | ||
| Airport (commercial public) | ||
| Airport (general aviation public) | ||
| Business (Amusement, Recreation, Specialty or Dept. Store) | ||
| Camping (at data zoom level 14) | ||
| Camping (at data zoom level 11 thru 13) | ||
| CEM | CEM | CemeteryEducational Facility |
| □ | □ | Exit, with services (at data zoom levels 10 thru 11-7) |
| □ | □ | Exit, without services (at data zoom levels 10 thru 11-7) |
| □ | □ | Exit, food (at data zoom levels 12 thru 17) |
| □ | □ | Exit, gas (at data zoom levels 12 thru 17) |
| □ | □ | Exit, lodging (at data zoom levels 12 thru 17) |
| □ | □ | Exit, other (at data zoom levels 12 thru 17) |
| Fast Food | ||
| Gas | ||
| Hospital | ||
| Lodging | ||
| ◆ | ◆ | Metropolitan City |
| National Capital (data zoom level 7 thru 10) | ||
| National Capital (data zoom levels 2 thru 6) | ||
| • | • | Point of Interest (smaller black square) |
| • | • | Population Center |
| Public Service | ||
| □ | □ | Religious (buildings) |
| Rest Area with Facilities (at data zoom levels 10 thru 11) | ||
| Rest Area with Facilities (at data zoom level 12) | ||
| π | π | Rest Area without Facilities (at data zoom levels 10 thru 11) |
| Rest Area without Facilities (at data zoom level 12) | ||
| Restaurants (general) | ||
| Restaurants (specialty) | ||
| ◆ | ◆ | Small City |
| State Capital | ||
| ⊕ | ⊕ | Unique Natural Feature (at data zoom level 8) |
Line Features
| Topo Colors | Street Colors | Description |
| County Boundary | ||
| Dam | ||
| Game Management District | ||
| International Boundary | ||
| Park Boundary | ||
| Pipeline | ||
| Power Line | ||
| +++ | Railroad (Abandoned) | |
| ++ | Railroad | |
| Runway | ||
| State Boundary |
DeLorme Atlas and Gazetteer Symbols
| Symbol | Description |
| Developed Boat Ramp (at data zoom levels 11 and 12) | |
| Developed Boat Ramp (at data zoom level 13) | |
| Freshwater Fishing (at data zoom levels 11 and 12) | |
| Freshwater Fishing (at data zoom level 13) | |
| Hunting (at data zoom levels 11 and 12) | |
| Hunting (at data zoom level 13) | |
| Saltwater Fishing (at data zoom levels 11 and 12) | |
| Saltwater Fishing (at data zoom level 13) | |
| Undeveloped Boat Ramp (at data zoom levels 11 and 12) | |
| Undeveloped Boat Ramp (at data zoom level 13) |
Using the Toolbar
Showing/ Hiding Toolbar Options
You can customize the toolbar to show the options you use most. You can also activate toolbar options that are not turned on by default or hide or show the entire toolbar. Some toolbar options are grouped—for these, you can show or hide the group of buttons.
To Modify the Toolbar
- Right-click the toolbar.
Toolbar options with a selected check box next to them are displayed on the toolbar.
- Click an item to activate or inactivate it in the toolbar.
text_image
Exchange GIS Layer Management GIS Tools GPS / NavMode GeoTagger Info / Profile Map Library / MapShare Map Navigation Measure Options / Help Print Project Redline / Sync Tools Route Undo / Redo Show All Reset to Default Hide AllReordering the Toolbar Options
To reposition the toolbar groups horizontally or vertically, just drag the dotted vertical bar that separates each group to the new location (left, right, up, or down).

To Create New Projects

To create a new project, click the New button on the toolbar. If you made changes to the open project, the Save Changes dialog box opens to ask you if you want to save your changes.
For more information, see Creating and Deleting Projects.
To Open a Project
To open an existing project:

- Click the Open button
on the toolbar.
OR
Click the arrow next to the Open button, and then click Open Project. If you made changes to a project that is already open, the Save Changes dialog box opens. Note Projects have .xmp extensions and are saved by default in C:...\DeLorme Docs\Projects. The Open File dialog box opens.
- Select the project you want to view and click Open.
Note If the project has not been migrated to the new DeLorme Docs location, you will be prompted to migrate it. Click Migrate to create a copy of the file in the new DeLorme Docs location. Click No to cancel. For more information about migrating projects, see Migrating Data to the New DeLorme Docs Location.
For more options for opening files, see
To Migrate a Project
To migrate an existing project from C:\DeLorme Docs\Projects to C:...\DeLorme Docs\Projects:
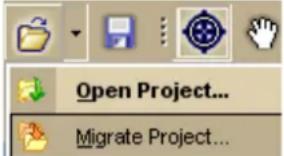
- Click the arrow next to the Open button, and then click Migrate Project.
text_image
Open Project... Migrate Project...The Migrate Project dialog box opens.
- Browse to the project you want to migrate and click Migrate. After the migration is complete, a confirmation message appears.
- Click Open to open the project or Close to close the message.
For more information about migrating projects, see Migrating Data to the New DeLorme Docs Location.
To Save a Project
To save the project that is currently open:

- Click the Save button
on the toolbar.
The Save File dialog box opens.
XMap User Guide
- Browse to the location where you want to save the project.
If you want to rename the project, type a new name in the File Name text box. - Click Save.
To Print
To print a map using the current settings in the Print tab, click the Print button on the toolbar.
The Print button is hidden by default; to show it, right-click the toolbar to open the menu and click Print.
For more information, see Printing a Map.
To Print the Map Screen
To print the current view as it displays on the screen, click the Print Screen button on the toolbar.
The Print Screen button is hidden by default; to show it, right-click the toolbar to open the menu and click Print Screen.
To Open the Map Library
To open the Map Library subtab on the NetLink tab, click the Map Library button.

To Use the Map Navigation Tool
Click the Navigation tool on the toolbar to enable Navigation mode.

- To zoom in, click the map, hold down the left mouse button, and drag down and right. (2-D maps only)
- To zoom out, click the map, hold down the left mouse button, and drag up and left. (2-D maps only)
• To re-center the map, click the map where you want to center it.
To Grab and Pan the Map
To drag and pan the 2-D or 3-D map in any direction, click the Map Panning button on the toolbar.

Tip With your cursor anywhere on the map, press the CTRL key on your keyboard—the cursor becomes a white hand. Hold down your left mouse button to drag the map to a new location.
To Use the GIS Tools
There are many GIS tools available on the toolbar, including tools that allow you to edit geometries, create redline layers, perform COGO editing, and more.
GIS Layer Management
- Import Layers menu — Import a layer (add, append, or replace) into a database from a file.
- Manage Layers — Use the Manage Layers dialog box to add and remove layers from your workspace, delete layers from the source database, or remove a database reference.
- Forms menu — Create, manage, and open forms. See the related Help topics for more information about the options that are available for your version of XMap.
GIS Tools
- Active Layer — Use the Active Layer drop-down list to select a layer from your workspace as the active layer.
- Selection — Highlight geometries on the map without the risk of accidental editing.
- Edit —Move or change the size of a geometry.*
- Edit Points —Edit points in a polygon/line layer.*
- Edge Matching =10^-1 — Match shape points in a polygon/line to those in another polygon/line.*
- Rotate — Rotate a geometry.*
- Draw Geometries (☐, ☐, or ☐ depending on the active layer type) — Add points, lines, or polygons to a layer.*
- COGO — Place a polygon/line/point by coordinates, angle/distance measurements, or bearing/distance measurements.*
- Classification (☐, ☐, or ☐ depending on the active layer type) — Modify the classification for a selected geometry.
- Commit Changes — Save all of the changes you have made to the active layer.*
* These tools are available only in XMap Editor and XMap Enterprise.
Redlining/ Synchronization Tools
These tools appear in the toolbar when an active subscription exists.
• Redlining —Mark up a GIS layer.
- Synchronizing —Refresh subscription layers, send redline layers to the source database, and send edits to the database.


XMap User Guide
- Add Synchronized Layers — Add all of the layers that are in the active subscription to your workspace.
- Revert — Discard changes made to a layer before synchronizing the active layer with the database on the Enterprise database server.
Undo/ Redo
- Undo and Redo — Use these tools to undo/redo your last action as long as the action is not committed. The Undo button may not be available for XMap Professional users as most actions are automatically committed.
To Create a Route
To set route points using the toolbar:
- Type the location where you want to start your route in the Start text box (next to the green Start button).
OR
Click the green Start button and then click the location on the map where you want to start your route.
OR
Select an address book entry, a previous location, or your current GPS position from the Start drop-down list.
- Type the location where you want to end your route in the Finish text box (next to the red Finish button).
OR
Click the red Finish button and then click the location on the map where you want to end your route.
OR
Select an address book entry or your current GPS position from the Finish dropdown list.
- Optional. If you want to add a stop or via to your route, click the Stop button
or the Via button 📄 and then click the location on the map where you want to add or insert the stop or via. Repeat this step for each stop or via you want to add to your route.
Note If the Add option is selected in the Route tab, stops and vias are added in the order they are added to the route. If the Insert option is selected in the Route tab, stops and vias are added in the order they are approached in the route. For more information, see Adding and Inserting Stops and Vias.
- Click the Calculate button

Important If you have only the left map window open, the route Start, Finish, and Stop buttons on the toolbar and on the Route tab are grayed out. To activate the options, use the map resize tool to expose the right map window.
Note To use the current GPS location in a route, you must connect your device to your computer and click the GPS button on the toolbar or on the GPS tab.
Tip Once a route is calculated, you can use the subtabs in the Route tab to view route directions, edit a route, and more. Click the Directions subtab to view the route directions, the Advanced subtab to display the advanced routing options, or click Back on Track to add your current GPS position as a stop to the current route.
To Start/ Stop Your GPS Connection
The GPS button on the toolbar lets you start your GPS connection if the device is not active or stop the connection if it is active.
To start or stop your GPS connection, click the GPS button on the toolbar. The GPS tab area opens so you can monitor your GPS status.
To Exchange Information with a Handheld GPS
Use the Exchange button 📋 on the toolbar (also on the GPS and Handheld Export tabs) to exchange objects such as maps (Earthmate PN-Series GPS only), waypoints, tracks, and routes with a handheld device.
You can also use the Send GIS Layer button and Import GIS Layer button to export and import GIS point layers, including forms, between XMap and your device.
For more information on exchanging information, see Help topics listed under Using DeLorme PN-Series GPS Devices or Exchanging Information with a Third-Party GPS Device.
To Measure Distance
Use the following steps to measure linear distances and perimeter/area on the map. For more information, see Measuring Distance and Area.
-
Click the Measure tool on the toolbar.
-
Click point-by-point to draw a measurement line on the map. A text box displays next to your pointer indicating the total distance of the measurement taken. Note When you pass over a point in a road, measurement line, or measurement area to which you can snap, a yellow circle ◎ defines the snap point. Click to snap the point of the measure line to the road or measurement object's point coordinate. Press and hold the ALT key on your keyboard to disable snapping.
-
To end a measurement line, double-click the last point of the measurement line. The measure line displays as a two-pixel wide yellow line and the total length of the line displays in a label at each endpoint of the line.
-
To end a measure area, hover over the starting point until the yellow snap circle displays and then double-click the last point to the starting point. The perimeter measurements display.
To Get Information About a Location

Use the Information button 📋 on the toolbar to click a point, symbol, feature, measurement line, track, or area on the map to identify it and view detailed information about it.
The Information button is hidden by default; to show it, right-click the toolbar to open the menu and click Information.
Use the following steps to get information about a particular map feature.
- Click the Information button.
- Click the map feature you want information for, such as a road, town, measurement line, waypoint, track, draw symbol, or point of interest.
The Info tab opens and displays a list of information categories.
Note Descriptive information may include a name or feature type, length/area, ZIP/Postal Code, town name, county name, state/province, coordinates, and Standard Industrial Classification categories. - Click the plus sign next to each of the information categories to expand the category to view more detailed information. OR
Right-click in the information box and click Expand All to expand all of the information categories. Right-click in the information box again and click Collapse All to minimize all of the information categories.
-
Optional. Repeat steps 1–3 to get information about another location.
-
Optional. Right-click in the information box and click Print to print your map feature information.
Notes
- You can also get information about a location using the right-click option. Just right-click the location and click Info.
- The status bar (located above the tab area) displays draw object type, draw file information, point of interest name (if applicable), street name/address, highway, city, state/province, and ZIP/Postal Code information for the map location that your cursor is positioned on.
- Some map features (such as campgrounds, national scenic/historic trail information centers, and state parks) display with a blue outline at higher data zoom levels. The blue outline indicates that the feature has a hyperlink to its website. To open the hyperlink, right-click the feature and then click Open Hyperlink OR click the URL in the Info tab.
To Create a Profile
To create a profile:
-
Center your 2-D map on the area with the linear object you want to profile. OR
Center the route you want to profile on the map. -
Click the Profile button 📋 on the toolbar.

- Move your pointer over the map. The pointer changes from ⏻ to ⏱ when it passes over an object that you can profile.


- Select a linear object or route on the map to generate its profile.
When the object is selected, it is highlighted and the Profile graph displays in the Profile tab area.
Note Move your pointer along the elevation profile in the Profile graph. The intersection of the vertical and horizontal blue lines travels along the top of the terrain profile. These lines indicate the height and distance of the particular location. A small crosshair follows along the corresponding object on the map.
You can also right-click a linear object or route on the map and click Profile. For more information about profiles, see the Help topics under Profiling Linear Objects.
To Choose Options

on the toolbar. Use
To open the Options dialog box, click the Options button the Options dialog box to set preferences for program opt
The Options dialog has the following tabs:
• GIS
• GPS
- Voice
• Find (GPS Radar)
- Map Features (Basic and Custom)
- Display
- Keyboard Shortcuts
• 3-D
An Options button that opens the Options dialog box is also available on the 3-D, Find>GPS Radar, and GPS tabs.
To open the Options menu, click the arrow next to the Options button toolbar. The following menu options are available:
on the
- Options—Opens the Options dialog box.
- Tab Manager—Opens the Tab Manager dialog box where you can show or hide individual tabs and reorder tabs.
- Netbook Mode—Allows you to turn the Netbook Mode on or off. If the mode is turned on, the check box next to it is selected. Click Netbook Mode to turn it on or off. For more information, see Using Small-screen Devices.
You can also customize your interface:
- Show Tab Area Panel—Allows you to show or hide all the tabs. If Show All Tabs is turned on, the check box next to it is selected. Click Show Tab Area Panel to show or hide the tab area.
- Show Control Panel—Allows you to show or hide the Control Panel. If Show Control Panel is turned on, the check box next to it is selected. Click Show Control Panel to show or hide it.
Customizing the Map and Tab Display
Customizing the Interface
You can customize the interface for your application by hiding the tab panel area and the Control Panel.
To Customize the Interface
-
Click the arrow next to the Options button Options on the toolbar.
-
To turn on an option when it is not selected, click it to select the check box. OR
To turn off an option when it is selected, click it to clear the check box.
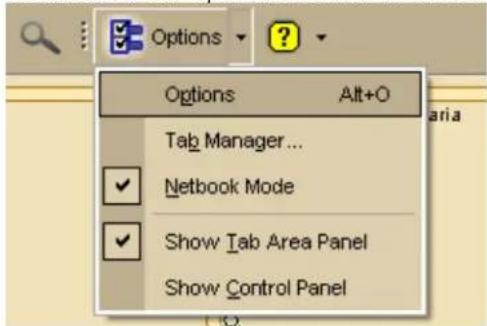
text_image
Options Alt+O Tab Manager... ✓ Netbook Mode ✓ Show Tab Area Panel Show Control Panel- Use Tab Manager to show or hide individual tabs or reorder tabs.
• Use Show Tab Area Panel to show or hide the entire tab area.
• Use Show Control Panel to show or hide the Control Panel. - Use Netbook Mode to turn the optimized small-screen device view on or off. For more information, see Using Small-screen Devices.
Notes
- You can also use keyboard shortcuts to customize the interface.
- Your settings are saved until you change them.
- Click Options in the menu to open the Options dialog box.
Displaying Basic Map Features
You can show or hide basic map features on your map.
You can also customize map features and customize the interface.
Notes
- If you cannot make changes to the basic preference check boxes, verify the Use Custom Map Features check box is not selected.
- Click Use Defaults to change the map feature settings to the default preferences.
• The options available depend on the datasets you are using. - The map features available are based on the Map Colors option you are using.
To Select Basic Map Feature Preferences
Use the following steps to change the basic map feature preferences. Changes made to the map view display almost immediately after selection.
- Click the Options button 📋 on the toolbar.
OR
Click the arrow next to the Options toolbar button to open the menu. Then, click Options to open the dialog box.
-
Click the Map Features tab.
-
Select the check box next to the map features you want to display on the map. OR
Clear the check box next to the map features you want to hide on the map.
- Shaded Relief
Shaded relief becomes visible at data zoom level 6-0 or greater. It simulates the effect of sun shining on terrain features and casting shadows, providing greater depth perception of the image. Lighter shades of gray indicate gentle terrain and darker shades indicate steep terrain. Using shaded relief may slow down the draw time of the map screen as you pan.
- Contours
Contour lines are available at data zoom level 6-0 or greater. Contour lines show the elevation of the land in feet or meters. The closer the contour lines, the greater the slope. The distance between the lines is the contour interval, which is indicated in the Control Panel (distance units are controlled in the Options dialog box).
- Land Cover
Land cover colors are available at all data zoom levels. Colors indicate vegetation and land cover areas on the map such as rock and sand, forests, transitional areas, and wetlands.
- Grids
The Grids option can be used to identify coordinate points on the map. Grid lines automatically adjust for the data zoom level of your map.
- Parks or Reserves
Parks and Reserves are available at data zoom level 7-0 or greater and include areas such as parks, preserves, recreational area and public forests.
• Publicly Managed Lands
Publicly Managed Lands are only available when the Bureau of Land Management (BLM) dataset is downloaded and installed. The feature includes areas such as lands managed through the Bureau of Land Management and displays at all data zoom levels.
• Game Management Districts
Wildlife Management Units are only available when the Wildlife Management Units (WMU) dataset is downloaded and installed. The feature includes areas of managed wildlife and game and displays at data zoom level 6-0 or greater.
• USGS Quadrangle Coverage
The USGS 7.5 minute quadrangle coverage is indicated by red lines. These display at data zoom level 8-0 or greater. Quadrangle names display at data zoom level 9-0 and higher. To view quad info such as Orig Date and Quad Order ID number (needed when purchasing quads), right-click a point within
the quad and then click Info. An information box displays in the lower-right corner of the screen.
• 3DTQ Region Coverage
Displays the DeLorme 3DTQ product CD volume label, which covers each map area at data zoom level 10-0 or greater.
- Map Center Crosshair
The map center crosshair indicates the map center at any data zoom level.
- Exits
View exits on primary limited access roads, interstates, and toll roads. Available at data zoom level 10-0 or greater.
- One Ways
One ways display as bright green triangles on roads, pointing toward the direction of travel (most noticeable in large cities). They are available at data zoom level 13-0 or greater.
- Places (Minor)
View smaller towns, suburbs, locales, and natural features. Zoom levels vary.
- Roads (Minor)
View secondary roads, local and rural routes, trails, and railroads. Zoom levels vary.
- Points of Interest
- Major—View many different points of interest, including recreational areas, public safety, rest areas, and more.
- Minor—View general points of interest including educational, technology, government, and religious buildings/locations.
- Business (Major)—View many different travel-related points of interest including hospitals, camping, restaurants, and more.
- Business (Minor)—View general points of interest including small shops and food stores, laundromats, and golfing.
- ZIP-Postal Codes
ZIP/Postal Code boundaries display at data zoom level 8-0 and greater, with ZIP/Postal Code labels displaying at data zoom level 10-0 and greater.
- Town Borders
- View town borders at data zoom level 10-0 and greater for the following states:
| Arkansas | Louisiana | Mississippi | North | Vermont |
| Connecticut | Maine | Missouri | Carolina | Virginia |
| Illinois | Maryland | Nebraska | North | Washington |
| Indiana | Massachusetts | New | Dakota | DC |
| Iowa | Michigan | Hampshire | Ohio | West |
| Kansas | Minnesota | New Jersey New York | Pennsylvania Rhode Island South Dakota | Virginia Wisconsin |
- County Borders View shaded outlines of U.S. counties at data zoom levels 7-0 or greater.
- International Labels View country labels at data zoom levels 0-0 through 4-0.
-
Urban Area Color Displays a shaded map area in populated regions at data zoom levels 5-0.
-
Click OK to commit the change and exit the Options dialog box.
OR
Click Apply to commit the change and keep working in the Options dialog box.
Customizing the Map Feature Preferences
You can change the display of a wide variety of map features so you can customize your map to meet your specific needs. You can even customize which POIs display.
To Set Custom Map Features
This is an advanced feature that lets you create a specific, custom set of map features for your map display from hundreds of options. Note that changes are not visible until you click the Done button.
- Click the Options button ☑ Options on the toolbar.
OR
Click the arrow next to the Options toolbar button to open the menu. Then, click Options to open the dialog box.
-
Click the Map Features tab.
-
Select the Use Custom Map Features check box and then click Customize Features to display the custom options.
Note Custom map feature selections override selections in the basic features list.
- To quickly search for a particular type of feature, type the name of the item in the Search text box.
A list of matching keywords displays and corresponding feature types are listed in the Search Results window. Results for the number of keywords and types found also display.
A selected check box indicates the feature displays on the map.
- Select/clear the individual feature check box to show or hide that feature.
- Click the small None button to the right of the Search Results window to show none of the features listed.
- Click the small All button to the right of the Search Results window to display all of the features listed.
- Click Only to display only those features listed in the Search Results window.
-
Click Exclude to display all features except those listed in the Search Results window.
-
To use the map feature tree to select which POIs display on the map, click the plus signs to expand the individual branches. A selected check box indicates the feature type displays on the map.
Note Some branches expand further than others. Selecting/clearing a check box at a certain branch of the tree shows/hides all the items below that level.
- Select/clear the individual map feature check box to show or hide that feature.
- Click All to select all map features in the program.
- Click None to select none of the types in the program.
Note A small number of features cannot be turned off. They are part of the base map display and cannot be changed. This is why certain levels on the tree remain unavailable (appear dimmed or gray).
- Click OK to accept the change and exit the Options dialog box.
OR
Click Apply to accept the change and keep working in the Options dialog box.
Notes
- When you save the current project, the following feature preferences are saved in reference to map features:
- Major map features preferences
- Individual custom feature preferences
When you create a new project, the current map settings are used. Click Use Defaults to return to the default settings.
Changing the Map Colors
When you use a laptop computer while traveling, it can be difficult to see the map display on your screen. This can be especially true at night or on a bright sunny day. Changing your default map colors to high-contrast map colors can make your map display easier to see.
To Change the Map Colors
Use the following steps to change the map display.
- Click the Options button
OR
Click the arrow next to the Options toolbar button to open the menu. Then, click Options to open the dialog box.
- Click the Display tab.
- From the Map Colors drop-down list, select High-Contrast Colors to make the map display darker for improved in-vehicle visibility, Street Colors to emphasize streets and highways on the map, or Topo Colors to emphasize contours, parks and public lands, land cover, and so on.
- Click OK to accept the change and exit the Options dialog box.
OR
Click Apply to accept the change and keep working in the Options dialog box.
Changing the Map Magnification Level
If you want to change the size of the map image, but not change the degree of geographic detail on the map, use the magnification settings in the Options dialog box.
To Change the Map Magnification
Use the following steps to change the map magnification.
- Click the Options button
OR
Click the arrow next to the Options toolbar button to open the menu. Then, click Options to open the dialog box.
-
Click the Display tab.
-
Select a magnification percentage (50%, 75%, 100%, 125%, 150%, 175%, or 200%) from the Magnification drop-down list. Note Although the size of the image changes, the degree of geographic detail does not.
-
Click OK to accept the change and exit the Options dialog box.
OR
Click Apply to accept the change and keep working in the Options dialog box.
Changing How POIs Display on the Map
You can change the data zoom level at which large POI symbols display on the map.
To Change the Data Zoom Level for Large POI Symbols
Use the following steps to change the data zoom level at which large POI symbols are displayed on the map.
- Click the Options button
OR
Click the arrow next to the Options toolbar button to open the menu. Then, click Options to open the dialog box.
-
Click the Display tab.
-
Select the data zoom level from the Large Symbols At drop-down list.
-
Click OK to accept the change and exit the Options dialog box. OR
Click Apply to accept the change and keep working in the Options dialog box.
Notes
• The appearance of a POI many change at different data zoom levels.
- The number of points of interest that displays is dependent on the basic map features you selected on the Map Features tab in the Options dialog box. For more information, see Displaying Basic Map Features.
This table shows the actions that may happen if you display major and minor POIs.
| If you view large symbols at data zoom level... | You will see the following information at data zoom level 13-0 | You will see the following information at data zoom level 14-0 | You will see the following information at data zoom level 15-0 | You will see the following information at data zoom level 16-0 | You will see the following information at data zoom level 17-0 |
| 14 names and small square symbols | name of the POI and the large symbol | name of the POI and the large symbol | name of the POI and the large symbol | name of the POI and the large symbol | |
| 15 small | squares only | name of the POI and a small square symbol | name of the POI and the large symbol | name of the POI and the large symbol | name of the POI and the large symbol |
| 16 N/A small square | symbols only | name of the POI and a small square symbol | name of the POI and the large symbol | name of the POI and the large symbol | |
| 17, 18, 19, or 20 | N/A small square | symbols and some names of POIs | name of the POI and a small square symbol | name of the POI and a small square symbol | name of the POI and the large symbol |
Setting Units of Measure Preferences
You can change the units of measure used to represent how coordinate formats, distance, datum, and bearing listings display. Changing these preferences affects how units of measure display in several areas of the program: such as on the map and in the Control Panel.
As you change your unit of measure preferences, a description of each choice displays in the information box (in the center of the Options dialog box) immediately after you select it.
To Change the Coordinate Preferences
Changing the coordinate preferences affects the:
• Coordinates display on the Control Panel.
- Coordinate MapNotes.
- Grid label display, if Grids are selected in Map Features.
• Any other place where coordinates display or print.
Use the following steps to change how coordinate measurement units display.
- Click the Options button
OR
Click the arrow next to the Options toolbar button to open the menu. Then, click Options to open the dialog box.
-
Click the Display tab.
-
Select the coordinate display format from the Coordinates drop-down list.
-
Degrees
- Degrees, Minutes
- Deg, Min, Sec
• UTM/UPS (Universal Transverse Mercator/Universal Polar Stereographic)
• MGRS (Military Grid Reference System)
• USNG (United States National Grid)
- SPCS (State Plane Coordinate System) Note When you select SPCS, an additional drop-down box displays for Zone. Select the zone from the list.
- Select the datum from the Datum drop-down list.
• WGS84 (World Geodetic System of 1984)
- NAD27 (North American Datum of 1927), which also includes OOH (Old Hawaiian) Datum when in Hawaii
• NAD83 (North American Datum of 1983)
- Click OK to commit the change and exit the Options dialog box.
OR
Click Apply to commit the change and keep working in the Options dialog box.
Notes
- UTM/UPS and MGRS coordinate systems are best used with NAD27 datum. 95% of the USGS quads containing UTM grid lines uses the NAD27 datum, which is helpful if you are comparing a map generated from your mapping application to a USGS map.
- If the USNG coordinate system is not matched with NAD83 datum, a warning message displays (unless you selected the Do Not Show This Message Again option).
- If the UTM/UPS or MGRS coordinate system is mismatched to WGS84 datum, a warning message displays (unless you selected the Do Not Show This Message Again option).
- The State Plane Coordinate System originally used NAD27 datum and was measured in statute miles. Some states have updated their systems to WGS84 datum and/or kilometers. If you are working with a site map, verify the datum, distance measures, and zone used and match them in your application.
To Change the Distance Preferences
Distance preferences affect how distance and areas display throughout the program. Use the following steps to change the measurement units for distance and area.
- Click the Options button
on the toolbar and then click Options.
- Click the Display tab.
- Select the measurement from the Measurements drop-down list.
• Statute Miles (statute feet are used for small distances)
- Kilometers (meters are used for small distances)
• Nautical Miles/Feet (statute feet are used for small distances)
• Nautical Miles/Meters (meters are used for small distances)
- Click OK to commit the change and exit the Options dialog box. OR
Click Apply to commit the change and keep working in the Options dialog box.
To Change the Bearing Preferences
Bearing listings are created as the result of creating route directions in the Route tab or from an Advanced (Distance From) search in the Find tab. Bearing refers to the compass direction of a given object measured clockwise in degrees (for example, 30°) or nearest compass point (for example, NNE) and indicated from True North or Magnetic North.
Notes:
XMap User Guide
- Magnetic declination is the difference in degrees between True North and Magnetic North at a specific location.
• The bearing setting does not affect map appearance.
Use the following steps to change the bearing.
- Click the Options button 📋 on the toolbar and then click Options.
- Click the Display tab.
-
Select the bearing from the Bearing drop-down list.
-
True North—The direction to the north pole. This is the default setting.
-
Magnetic North—The direction that a compass needle points.
-
Click OK to commit the change and exit the Options dialog box.
OR
Click Apply to commit the change and keep working in the Options dialog box.
Resizing the Map and Tab Areas
You can horizontally and vertically resize the primary (right) map, secondary (left) map, tab area, and overview map with the map and tab area resize tools.
Notes
- The tab and overview map window size does not change when you choose another tab.
- Some tab areas that provide search results automatically resize depending on the number of results.
• You can also hide the tab area panel.
To Resize the Map and Tab Area Using the Drag Method
Use the drag method to horizontally or vertically resize these areas.
- Point to the frame area between the tab and overview map windows. The pointer
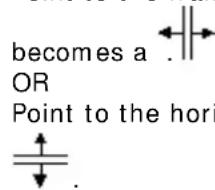
text_image
becomes a . OR Point to the hori ↓.- Drag to resize.
- To cancel the resize while dragging, press the ESC key on your keyboard. The size just prior to this resize is restored.
To Resize the Map Area Using the Resize Tools
The map resize tool runs perpendicular to the tab area. If the secondary and primary maps are both displaying, the resize tool is the bar that separates them. When the bar is moved all the way to the left of the map, only the primary map displays. When the bar is moved all the way to the right of the map, only the secondary map displays.
There are several methods you can use to resize the map area:
- Drag the bar left to expose the area of the primary map you want to see.
-
Drag the bar right to expose the area of the secondary map you want to see.
-
Click the right arrow on the resize tool once to move the secondary map 1/4 of the screen width. You can repeat this step until the primary map is no longer visible.
- Click the left arrow on the resize tool once to move the primary map 1/4 of the screen width. You can repeat this step until the secondary map is no longer visible.
- Double-click the bar above the right arrow to show only the secondary map.
- Double-click the bar below the left arrow to show only the primary map.
- Double-click the bar between the right and left arrows to display an equal percentage of both the secondary and primary maps.
To Resize the Tab and Map Area Using the Resize Tools
There are two tab area resize tools. The horizontal resize tool is located above the tab area and lets you adjust the height of the tab area. The vertical resize tool is located between the tab area and the overview map lets you resize the width of the tab area.
Using the Horizontal Resize Tool
- Drag the horizontal bar up/down to expose the tab area you want to see.
- Click the up arrow on the horizontal resize tool once to incrementally increase the tab height. You can repeat this step until the top of the tab area is flush with the bottom of the compass rose in the control panel.
- Click the down arrow on the horizontal resize tool once to incrementally decrease the tab height. You can repeat this step until only the tab names display.
- Double-click the bar to the right of the up arrow to expand the tab height to its maximum percentage (if the tab height is at the default mode or higher).
Note If the tab area is below the default mode, double-click the bar to return the tab height to its default percentage. - Double-click the bar to the left of the down arrow to decrease the tab height to its minimum percentage (if the tab height is at the default mode).
Note If the tab area is above the default mode, double-click the bar to return the tab height to its default percentage. - Double-click the bar between the up and down arrows to return the tab height to its default view.
Using the Vertical Resize Tool
- Drag the vertical bar left to expose the area of the overview map you want to see.
- Drag the vertical bar right to expose the tab area you want to see.
- Click the right arrow on the vertical resize tool once to incrementally increase the tab width. You can repeat this stop until the overview map is no longer exposed.
- Click the left arrow on the vertical resize tool once to incrementally increase the width of the overview map. You can repeat this step until the tab area is no longer exposed.
- Double-click the bar above the right arrow to show only the tab area.
- Double-click the bar below the left arrow to show only the overview map.
- Double-click the bar between the right and left arrows to return the tab and overview maps to their default views.
Viewing Two Maps at the Same Time
The split-window lets you view two maps at the same time.
The maps interact as follows:
- If you are viewing both the right and left maps at different data zoom levels, a box (or lines, depending on the current data zoom level) displays on the map that is zoomed out the furthest. The box/lines indicate the area that is in view on the opposite map.
- If you are viewing the right and left maps at the same data zoom level but they are not equally represented on the screen (50/50), a box (or lines) displays on the map that is covering the larger amount of screen area. The box/lines indicate the area that is in view on the opposite map.
- Both windows are centered on the same coordinate position. Panning or rotating in one map causes the same action on both maps.
- The left map window has its own zoom level controls. You can change the zoom level of the left map without affecting the zoom level in the right map window. However, after you adjust the zoom level in the left map window, the zoom tools on the Control Panel incrementally adjust the map. For example, if the left map is at zoom level 6-0 and the right map at zoom level 8-0, and you click the Zoom Out 1 tool, the left map displays at zoom level 5-0 and the right map at 7-0.
- The overview map in the tab area is always associated with the right map window.
- Other tab functionality may be affected by use of the split-screen function, as follows:
- Draw—The line and polygon draw tools work in either map window. The Select tool highlights the same draw object on both maps and you can then manipulate both objects at the same time. Draw files are created for both windows in the same project.
- Route—You can create routes only in the right window; routes display in both windows.
- GPS—You can log with GPS in the right map window; log playback displays in both windows.
■ 3-D—The 3-D map always displays in the left map window.
Showing or Hiding Tabs
The Tab Manager feature allows you to customize your program by showing or hiding individual tabs. You can access Tab Manager:
- During installation
• After installation using the Tab Manager option in the Options menu
• From the Start menu
Notes
- If you use Tab Manager while the program is open, you must exit and restart the program to view the tab changes.
• To show or hide the entire tab area panel, click the arrow next to the Options
button Options on the toolbar. If the tab area is showing and you want to hide it, click Show Tab Area Panel to clear the check box next to it. If the tab area is hidden and you want to show it, click Show Tab Area Panel to select the check box.
To Show Individual Tabs
Use the following steps to show tabs using Tab Manager.
- Open XMap, click the arrow next to the Options button and select Tab Manager from the menu.
OR
on the toolbar,
From the Start menu, point to Programs> DeLorme>XMap...> Tools, and then click Tab Manager.
- Select the check box next to each tab you want to display in the program.
Note Click Default to show all the tabs in the program in the default order. - Click OK.
- Exit XMap.
- Open XMap.
To Hide Individual Tabs
Hiding tabs may significantly increase the startup speed of XMap.
Use the following steps to hide tabs using Tab Manager.
- Open XMap, click the arrow next to the Options button and select Tab Manager from the menu.
OR
on the toolbar,
From the Start menu, point to Programs> DeLorme>XMap...> Tools, and then click Tab Manager.
- Clear the check box next to each tab you want to hide in the program.
OR
Click Minimum. Only the required tabs will display in the program.
Note Find, Map Data, Info, GIS, and NetLink are required tabs and cannot be hidden.
- Click OK.
- Exit XMap.
- Open XMap.
Importing/ Exporting Tab Manager Preferences
Tab Manager includes a feature that allows you to share your custom tab manager preferences with other XMap users.
To Import Tab Manager Preferences
Use the following steps to import another user's Tab Manager preferences.
- If your application is open, click the arrow next to the Options button on the toolbar and click Tab Manager.
OR
From the Start menu, point to Programs > DeLorme > XMap... > Tools and then click Tab Manager.
- Click File and then click Import.
The Import Tab Configuration dialog box opens.
- Browse to the location of the configuration (preferences) file, select it, and then click Open.
Tab Manager displays with the preferences saved in the imported configuration file.

Options ▼
- Click OK to close Tab Manager.
- Exit your application.
- Open your application.
To Export Tab Manager Preferences
Use the following steps to export your Tab Manager preferences as a configuration file.
- If your application is open, click the arrow next to the Options button on the toolbar and click Tab Manager.
OR
From the Start menu, point to Programs > DeLorme > XMap... > Tools, and then click Tab Manager.
-
Click File and then click Export. The Export Tab Configuration dialog box opens.
-
Type a name for the configuration (preferences) file in the File Name text box and then click Save. Configuration files are saved by default in C:...\DeLorme Docs\Configuration.
-
Click OK to close Tab Manager.
Reordering the Tabs
Use the Tab Manager feature to customize your program by reordering tabs. You can access Tab Manager:
- During installation
• After installation using the Tab Manager option in the Options menu
• From your computer's Start menu
Note If you use Tab Manager to make changes while the program is open, you must exit and restart the program to view the tab changes.
To Reorder the Tabs
Use the following steps to reorder the tabs with Tab Manager.
- Open XMap, click the arrow next to the Options button and click Tab Manager.XMap...
-
Click the tab you want to reorder to highlight it.
-
Click the up arrow ↗ or the down arrow ↓ to move the tab to the new position.
- Repeat steps 2 and 3 for each tab you want to reorder.
- Optional. Click Default to cancel the reordering process and use the default tab order (showing all available tabs).
- Click OK.
- Exit XMap.
- Open XMap.
Using Keyboard Shortcuts
Selecting a Keyboard Shortcut Scheme
Your application comes with the following DeLorme keyboard shortcut schemes:
- 3-D Navigation
- Desktop Mapping
• In-vehicle Navigation
You cannot edit DeLorme schemes, but you can create custom schemes that you can edit. You can create as many additional custom schemes as you need.
To Select a Keyboard Shortcut Scheme
Use the following steps to select a keyboard shortcut scheme.
- Click the Options button
on the toolbar.
OR Click the arrow next to the Options toolbar button to open the menu. Then, click Options to open the dialog box.
- Click the Keyboard Shortcuts tab.
- Select a scheme from the Scheme drop-down list.
- Click Apply to activate the selected scheme.
Creating a New Custom Scheme
You can create a custom keyboard shortcut scheme for different program uses.
To Create a Custom Scheme
Use the following steps to create a custom scheme.
- Click the Options button
on the toolbar.
OR Click the arrow next to the Options toolbar button to open the menu. Then, click Options to open the dialog box.
- Click the Keyboard Shortcuts tab.
- Click File and then click New. The Scheme drop-down list is completed with Custom Scheme# (where # indicates the incremental number for the number of custom scheme files you have created). Note If you want to rename the new scheme file, click File, click Rename, and then type a new name in the Scheme text box. Press the ENTER key on your keyboard when finished. The new name displays.
- Assign keyboard shortcuts for the commands that are listed.
Assigning Keyboard Shortcuts in a Custom Scheme
There are three DeLorme keyboard shortcut schemes that you cannot edit; however, you can create a custom scheme that you can edit with Keyboard Shortcuts tab in the Options dialog box.
To Assign Keyboard Shortcuts in a Custom Scheme
Use the following steps to edit a custom scheme.
- Click the Options button
on the toolbar.
OR
Click the arrow next to the Options toolbar button to open the menu. Then, click Options to open the dialog box.
-
Click the Keyboard Shortcuts tab.
-
Select a custom scheme from the Scheme drop-down list.
Note You cannot edit DeLorme schemes.
-
Select the List option.
-
From the Commands drop-down list, select the command grouping to which you want to assign shortcuts. If you want assign shortcuts to several groupings, select All Commands.
-
Click to select the command to which you want to assign a shortcut.
-
Click inside the Customize Shortcut text box.
-
Press the shortcut key combination on your keyboard that you want to assign for that command.
-
Click Assign. The shortcut for that command changes to the combination you assigned and displays as "pending."
-
Repeat the steps for each command you want to assign.
-
Click Apply to save the changes.
OR
Click OK to save the changes and close the Options dialog box.
OR
Click Cancel to cancel your pending changes and close the Options dialog box.
Notes
• To sort the command list view, click a heading (Group, Command, or Shortcut).
• You cannot change the following keyboard shortcut combinations:
○ ALT+ F4 (Close Window)
o F1 (Help)
○ ALT+F1 (Help Menu)
○ SHIFT+F10 (Context Menu)
○ CTRL+ C (Copy)
○ CTRL+ V (Paste)
○ CTRL+ X (Cut)
○ CTRL+ Y (Redo)
○ CTRL+Z (Undo)
o ALT+ M (Set Focus on Map)
- You cannot use the following keys when assigning shortcuts:
- Windows Key
- Application Key
- Print Screen
- Scroll Lock
- Sleep
○ Pause/Break
○ Enter
- Caps Lock
o Num Lock
- Spacebar
o Insert
- Backspace
o Multi-media Keys
- You cannot assign a letter or number on its own. For example, you cannot assign a keyboard shortcut with the number 3; you must use a modifier (such as CTRL or ALT) with letters and numbers.
Customizing a DeLorme Scheme
You cannot edit DeLorme schemes; however, you can create a copy of a DeLorme scheme that you can modify to fit your needs.
To Customize a DeLorme Scheme
Use the following steps to customize a DeLorme scheme.
- Click the Options button OR
on the toolbar.
Click the arrow next to the Options toolbar button to open the menu. Then, click Options to open the dialog box.
- Click the Keyboard Shortcuts tab.
- Select the DeLorme scheme you want to copy from the Scheme drop-down list.
- Click File and then click Copy.
The active scheme changes to Copy of Desktop Mapping#, Copy of In-vehicle Navigation#, Copy of 3-D Navigation#, etc. (depending on the DeLorme scheme you chose to copy).
- Assign keyboard shortcuts for the copied scheme.
- Optional. Rename the scheme.
Renaming a Custom Scheme
Custom schemes can be renamed to whatever name you choose. You cannot rename DeLorme schemes.
To Rename a Custom Scheme
Use the following steps to rename a custom scheme.
- Click the Options button OR
on the toolbar.
Click the arrow next to the Options toolbar button to open the menu. Then, click Options to open the dialog box.
- Click the Keyboard Shortcuts tab.
- Select the custom scheme you want to rename from the Scheme drop-down list.
- Click File and then click Rename.
The Scheme text box becomes active.
XMap User Guide
- Type the name in the Scheme text box.
- Click Apply. The new name displays.
OR
Press the ENTER key on your keyboard. The new name displays.
OR
Press the ESC key on your keyboard to keep the old name.
Deleting a Custom Scheme
Once you have created a custom scheme, you can delete it at any time. You cannot delete DeLorme schemes.
To Delete a Custom Scheme
Use the following steps to delete a custom keyboard shortcut scheme.
- Click the Options button
OR
Click the arrow next to the Options toolbar button to open the menu. Then, click Options to open the dialog box.
- Click the Keyboard Shortcuts tab.
- Select the custom scheme you want to delete from the Scheme drop-down list.
- Click File and then click Delete.
- Click Yes when asked if you are sure you want to delete the scheme.
Importing a Custom Scheme
You can share their keyboard shortcut schemes with other DeLorme users.
To Import a Custom Scheme
Use the following steps to import a custom scheme.
- Click the Options button
OR
Click the arrow next to the Options toolbar button to open the menu. Then, click Options to open the dialog box.
-
Click the Keyboard Shortcuts tab.
-
Click File and then click Import.
The Import Scheme File dialog box opens.
- Browse to the location where you saved the .keyscheme file, select it, and then click Open.
The imported file is now your active scheme.
Exporting a Custom Scheme
You can share their keyboard shortcut schemes with other DeLorme users.
To Export a Custom Scheme
Use the following steps to export a custom scheme.
- Click the Options button
OR
Click the arrow next to the Options toolbar button to open the menu. Then, click Options to open the dialog box.
-
Click the Keyboard Shortcuts tab.
-
Select the scheme you want to export from the Scheme drop-down list.
-
Click File and then click Export.
The Export Scheme File dialog box opens.
- Type a name in the File Name text box, browse to the location where you want to save the .keyscheme file, and then click Save.
Searching For Commands
The Keyboard Shortcuts tab in the Options dialog box has a Search feature that lets you search for a specific command or command group.
Note You can sort the command list view at any time by clicking the heading you want to sort by (Group, Command, or Shortcut).
To Search For a Command or Command Group
Use the following steps to search for a command or command group.
- Click the Options button
OR
Click the arrow next to the Options toolbar button to open the menu. Then, click Options to open the dialog box.
-
Click the Keyboard Shortcuts tab.
-
Select the Search option.
-
In the Commands text box, begin typing the name of the command or command group you are searching for. As you type, the list box under the Commands text box displays word matches.
Viewing All of the Shortcut Keys for a Scheme
The Reference Card option in the Keyboard Shortcuts tab lets you view a complete list of all of the scheme's shortcut keys.
To View a List of Shortcut Keys
Use the following steps to view a list of shortcut keys for a scheme.
- Click the Options button
OR
Click the arrow next to the Options toolbar button to open the menu. Then, click Options to open the dialog box.
-
Click the Keyboard Shortcuts tab.
-
Select the scheme that contains the shortcut keys you want to view from the Scheme drop-down list.
-
Optional. To sort the list view, click the heading you want to sort by (Group, Command, or Shortcut).
-
Click Reference Card.
The list displays in your default Web browser and is sorted by the same column you selected in step 3.
- Optional. Print the list from your Web browser.
Print a reference card from your web browser
- Use the Print Preview functionality in your web browser to see if the list will display as you want it to. If you do not like the way the list looks in the preview (for example, the list prints without grid lines in the table or does not print in color), change the advanced print settings in your Web browser.
- If you want to remove the header and footer text from the printout, from the File menu, select Page Setup. Remove the text and the header and footer text boxes and then click OK.
- Changes made to the browser's advanced print settings and page setup affect the printing of all web pages.
Using Projects/ Map Data
Map Data Overview
XMap lets you save all of the work that you have done as a single project file so you can open it again later. You can create different map views and save each in a different project.
What is a Project?
A project includes the current GIS workspace, map center coordinates, the current data zoom level, the current magnification, rotation, preferences, and links to routes or draw layers you have added to it.
As you create routes, draw, and GIS layers, they are added to the currently selected project. Projects are saved by default in C:...\DeLorme Docs\Projects.
Each associated file is saved in its respective folder in the DeLorme Docs directory. For example, a draw layer is saved in C:...\DeLorme Docs\Draw.
Can I Reuse Draw Layers and Routes in Other Projects?
After you create routes or add your own roads, you may not want to do all of the work again in another project. You can share routes and draw layers between projects using the Add button on the Map Data tab.
Can I Send Routes or Draw Layers to Another XMap User?
You can package projects, including their routes and draw layers, into one transfer file for convenience. The transfer file facilitates e-mailing, copying project information to other computers, and copying projects between DeLorme programs.
Migrating Data to the New DeLorme Docs Locations
In versions of XMap prior to XMap 6 and in other DeLorme products, your projects, draw files, route files, log files, imagery, and other DeLorme files were stored by default in the DeLorme Docs folder on the root of your computer's C drive unless you specified a different directory during installation.
For XMap 6 and newer versions:
- The DeLorme Docs folder for all files except NetLink downloads is located in the Documents folder under your user name.
- The DeLorme Docs folder for NetLink downloads is located in the DeLorme Docs folder under Public Documents. This allows all users on the computer to access NetLink downloads.
What is Migration?
The migration process does not move your files—it copies them to the new locations. When you are sure your files are working correctly in the new locations, you can delete them from the old locations as long as you are not using them for another DeLorme program. For example, if you have an imagery file you use in Topo USA or XMap (5.x or earlier), keep both files.
Because all new information you add to a project will be saved to the new file location—even if you open it from the old location, we strongly recommend that you migrate your files. If you do not, you could have project data in two DeLorme Docs locations; your project will work correctly, but your data will not all be in the same location.
Project Migration
When you migrate a project, all associated files (routes, draw layers, and connections to GIS layers in a database) are moved with it.
To Manually Migrate a Project
Use the following steps to migrate a project at any time.
- Click the arrow next to the Open button Migrate Project.

on the toolbar and then click
OR
Click the Map Data tab, click File, and then click Migrate Project.
The Migrate Project dialog box opens.
-
Browse to the project you want to migrate, click the project, and then click Migrate.
-
The Migration Completed dialog box opens. Go to step 5. OR
If a file with the same name already exists in the new DeLorme Docs location, the Confirm Link to Existing File dialog box opens. Go to step 4.
- Click Link to replace the project link to the existing file in the new location and then go to step 5. OR
Click Link All to replace any project links to existing files in the new location and then go to step 5.
OR
Click Save Copy to maintain the project link to the current file and save it with a different name. OR
Click Cancel to stop the migration process and roll back any file migration that has occurred up to this point.
- In the Migration Completed dialog box, click Open to open the migrated project or Close to close the dialog box and return to your last active project.
Note If there is a problem with the migration, a message will notify you of any corrective action you need to take.
Managing Data
Adding Data and Imagery to XMap
XMap is compatible with a variety of DeLorme datasets and imagery formats. You may have some of these datasets installed on your hard drive, or you may access the data on a DVD. Whether the data is on a DVD or saved on your hard drive, you can choose to add the data to current and future projects or only the current project.
Notes
- When adding third-party imagery formats, such as MrSID (.sid) and GeoTIFF (.tif), a DeLorme .adc file is automatically created in the directory where the data resides. This file is a connection between the original data and the DeLorme application.
- When you add MrSID or GeoTIFF to future projects, you can select the .adc file to automatically add the data. If you select the .sid or .tif extension, an .adc file with the same name is created and you are prompted to overwrite the file name if it exists.
Adding Data to Current and Future Projects
Data that is in current and future projects is considered "base data." If your data is saved on your hard drive, you must update the Base Data settings in the Map Data tab to include that data in your current and future projects.
Note If you are accessing data from a DVD, your data is added to every project you create while the DVD is in the DVD drive and it is not necessary for you to follow the steps below.
Use the following steps to add data to current and future projects.
- Click the Map Data tab.
- Create a new or open an existing project.
-
Click Data and then click Base Data.
The Data Locations dialog box opens listing each of the data sources on your system. -
Click Add, select the hard drive location where your saved your data from the Browse for Folder dialog box, and click OK. The OK button is enabled when you select a folder containing a file that contains the .adc file of the map data being added.
Note Your hard drive location may already be listed in the Data Location dialog box, but the check box for that location might not be selected. Ensure all of the data locations you want to display in your current and future projects have selected check boxes.
- Click Done.
Adding Data to the Current Project
You can choose to add data to only the current project if the data is saved on your hard drive. Any data on a DVD in your DVD drive displays in your projects as long as the DVD is in the drive.
Use the following steps to add data to the current project.
- Click the Map Data tab.
-
If the project you want to add data to is not displaying, open the project.
Note To verify the project you want is displaying, check the title bar. The project name displays directly after the product name. -
Click Data and then click Add.
The Add Data to Maps dialog box opens. -
Browse to the folder where the file you want to add is located and click the file to select it.
-
Select the map you want to add the file to (primary, secondary, or both) from the Add To drop-down list.
-
Click Add. The file is added to the current project under the selected map.
Note If you add a file to a project and later update the file, the file is updated in every project you have added to.
- Save your project. Projects have .xmp extensions and are saved by default in C:...\DeLorme Docs\Projects.
Notes
- For information about migrating data to XMap, see Migrating Data to the New DeLorme Docs Location.
- Select the check box next to a file to display it. Clear the check box to hide it.
- Use the Move to Primary Map and Move to Secondary Map buttons to move datasets from one map to the other.
- For information about migrating data to XMap, see Migrating Data to the New DeLorme Docs Location. - Select the check box next to a file to display it. Clear the check box to hide it. - Use the Move to Primary Map and Move to Secondary Map buttons to move datasets from one map to the other.
Adding/Removing Base Data
Use the Base Data function in the Map Data tab to modify the default map data source(s) for your current and future projects.
To Add Base Data
Use the following steps to add base data to your current and future projects.
- Click the Map Data tab.
- Create a new or open an existing project.
- Click Data and then click Base Data.
The Data Locations dialog box opens and lists each of the data sources on your system. - Select the check box next to the data source you want to use as a data source for your current and future projects.
AND/OR
Click Add, select a data folder from the Browse for Folder dialog box, and click OK. - Click Done.
To Remove Base Data
Use the following steps to remove base data from your current and future projects.
- Click the Map Data tab.
- Create a new or open an existing project.
- Click Data and then click Base Data.
The Data Locations dialog box opens and lists each of the data sources on your system. - Click to select the data source you want to remove from your current and future projects. Click Remove. Click OK when the confirmation message displays. The base data is removed from the list.
OR
Clear the check box next to the base data you want to remove. The base data is kept in the list, but is removed from the current and future projects. - Click Done.
Setting Data as Routing Data
The first dataset added to your project is the default routing dataset; however, not all datasets support road and direct routing. If you are using more than one dataset in XMap, you can determine which dataset to use for routing.
To Set Data to be Used as Routing Data
Use the following steps to assign a dataset for routing.
-
Click the Map Data tab.
In the Primary Map window, the dataset that is currently set to be used for routing displays the routing icon to the left of the dataset name. -
Under Primary Map, highlight the dataset you want to assign as your routing dataset.
-
Click Data and then click Set as Routing Data.
The routing data is updated and the routing icon 🎨 displays next to the dataset highlighted in step 2.
OR
Right-click the selected dataset and click Set as Routing Data.
The routing data is updated and the routing icon 📄 displays next to the dataset highlighted in step 2.
Viewing Data from NetLink
When you use NetLink to download imagery and data, the dataset is automatically listed as base data. Downloaded imagery is saved by default in saved in C:...\DeLorme Docs\Downloads. If you purchased a DVD, you can add your imagery and data to your current and future projects by adding it as base data.
Note Not all data displays at all data zoom levels.
To View Imagery
Use the following steps to view imagery.
- Click the Map Data tab.
- Under Primary Map and/or Secondary Map (depending on the map window you want to use to view the dataset), click the plus sign next to the dataset.
- Double-click the file name.
The imagery displays on the map(s).
ADP Data
If you have an ADP (Aerial Data Packet) dataset from a previous version of a DeLorme application, you still have access to it.
To Designate Which ADP Layer Displays on the Map
Once the dataset is listed in the Map Data tab, you can designate which layer you want to display on the map. For example, an ADP dataset may consist of DOQQ data and Sat 10 data. If you select both of these, the last check box you select is the data that displays on the map.
Use the following steps to designate which data layer to display on the map.
- Click the Map Data tab.
- Under Primary Map and/or Secondary Map (depending on the map window you want to use to view the dataset), click the plus sign next to ADP Dataset. Each of your ADP datasets display.
- Click the plus sign next to the ADP location.
The contents of the dataset display. - If the check box next to the data layer you want to display on the map is selected, clear the check box and then select it again. The data layer displays on the map. OR
If the check box next to the data layer you want to display is cleared, select the check box. The data layer displays on the map.
Managing Projects
Creating and Deleting Projects
You can create different data configurations and save them in separate projects.
To Create a New Project
When you create a new project, all of the data selected as your base data is available in the new project. For more information, see Adding/Removing Base Data.
Use the following steps to create a new project.
- Click the Map Data tab.
- Click File and then click New.
A new untitled project opens, using the last map view as the default view. Untitled # displays in the title bar after the product name.
OR
To name the file and save it, click File and then click Save As. Type the name in the File Name text box and then click Save.
Note Projects have .xmp extensions and are saved by default in C:...\DeLorme Docs\Projects.
To Delete a Project
Use the following steps to delete a project.
- On your computer, browse to the location of the project you want to delete.
Note Projects have .xmp extensions and are saved by default in C:...\DeLorme Docs\Projects. Projects created in XMap 5.x or earlier are stored in the DeLorme Docs folder on the root of your C drive. For more information, see Migrating Data to the New DeLorme Docs Location.
- Select the file from the file list and then click the Delete button on the toolbar or press the DELETE key on your keyboard.
OR
Right-click the file in the file list and click Delete.
Tip You can open a project to verify it is the one you want to delete. For more information, see Opening a Project.
Opening a Project
You can open projects created in all versions of XMap.
To Open a Project
Use the following steps to open a project.
- Open a project from the toolbar.
OR
Click the Map Data tab, click File, and then click Open.
The Open File dialog box opens.
Note If you made changes to a project that is already open, the Save Changes dialog box opens. Note Projects have .xmp extensions and are saved by default in C:...\DeLorme Docs\Projects.
- Click the project and then click Open.
The last saved map view for that project displays.
OR
Double-click the project. The last saved map view for that project displays.
Note If the project has not been migrated to the new DeLorme Docs location, you will be prompted to migrate it. Click Migrate to create a copy of the file in the new DeLorme Docs location. Click No to cancel. For more information about migrating projects, see Migrating Data to the New DeLorme Docs Location.
Saving a Project
Use the Map Data tab to save each of your projects quickly and easily using one of the following methods:
- Click File and then click Save or click the Save button

- If you have not saved the project before, the Save File dialog box opens. Type a file name in the File Name text box and click Save.
If you have saved the project before, the Save dialog box opens. All of the changes made to the current project display as a check list. Select the check box next to each change you want to save and clear the check box next to each change you do not want to save. Click Yes to save the selected changes,
click No to save the file without the changes, or click Cancel to cancel the saving process.
- Click File and then click Save As.
The Save File dialog box opens. Type a file name in the File Name text box and click Save.
You can also click the Save button 📄 on the toolbar.
Adding/ Removing Files in a Project
As you create new GIS layers, routes, draw layers, and so on, or need to add more datasets to the Map Data tab, they are added to the current project.
To Add Files to a Project
Use the following steps to add specific files to a particular project.
-
Click the Map Data tab.
-
If the project you want to add files to is not displaying, open the project.
The contents of the current project display in the primary map window on the right side of the dialog area.
Note To verify the correct project is displaying, check the title bar. The project name displays directly after the product name.
- To add a new route or draw file, click Data, click New, and then click Draw File or Route File.
A new draw or route file is added to your project.
OR
To add an existing route, draw, .adc, .dcf, .tif, .sid, .txt, or .dds file:
a. Click Data and then click Add.
The Add Data to Maps dialog box opens.
b. Browse to the folder where the file you want to add is located and click to select it.
c. Select the map you want to add the file to (primary, secondary, or both) from the Add To drop-down list.Notes
- .adc, .txt, .tif, and .sid files are the only files you can add to both the primary and secondary maps.
- .sid and .tiff/.tif files must contain spatial reference information to add them. If they do not, an error message displays and you must use a third-party application to specify the spatial reference information.
d. Click Add.
The file is added to the current project under the selected map.
Note If you add a file to a project and then edit and save it later, the file is updated in every project you have added it to. This does not apply to raster property settings for .sid and .tiff/.tif data.
- Save the project. Projects have .xmp extensions and are saved by default in
C:...\DeLorme Docs\Projects.
To Remove Files in a Project
Use the following steps to add or delete specific files in a particular project.
-
Click the Map Data tab.
-
If the project you want to remove files from is not displaying, open the project.
The contents of the current project display in the primary map window on the right side of the dialog area.
Note To verify the correct project is displaying, check the title bar. The project name displays directly after the product name.
- To remove a file, select that file from the project list on the Map Data tab and then
click the Remove button
Note This does not delete the file; it removes it from the selected project.
- Save the project. Projects have .xmp extensions and are saved by default in C:...\DeLorme Docs\Projects.
Notes
- Projects created in XMap 5.x or earlier are stored in the DeLorme Docs folder on the root of your C drive. For more information, see Migrating Data to the New DeLorme Docs Location.
- Select the check box next to a file to display it. Clear the check box to hide it.
- Use the Move to Primary Map and Move to Secondary Map buttons to move datasets from one map to the other.
Renaming a Project
Projects are untitled when you first add them to XMap. When you save the map, you can accept the default name or give it a specific name. When you have many different projects and are trying to locate a specific map view, you may find it more helpful to rename the project.
To Rename a Project
Use the following steps to rename a project.
- Click the Map Data tab.
-
If the project you want to add/delete files for is not displaying, open the project. The contents of the current project display in the Primary Map window on the right side of the dialog area.
Note To verify the correct project is displaying, check the title bar. The project name displays directly after the product name. -
Click File and then click Save As.
The Save File dialog box opens.
- Type the name in the text box and then click Save.
You now have two files; one with the original name and one with the new name.
Using Transfer Files
Using Transfer Files Overview
This section describes how to create, import, and e-mail a transfer file. You can package projects, including their routes, draw layers, and other contents, into one transfer file for convenience. The transfer file facilitates e-mailing, copying project information to other computers, and copying projects between DeLorme programs. Transfer files do not include map data or GIS data.
Creating Transfer Files
A project and its contents can be packaged into a single file, called a transfer file, to facilitate e-mailing or copying.
You can create a transfer file with or without hyperlinked file attachments. When you create a transfer file with hyperlinked files, you have the option of saving the common directory structure of the hyperlinked files. Saving the directory structure of common files can be
helpful when you are sharing and updating transfer files. Transfer files do not include map data or GIS data.
To Create a Transfer File
Use the following steps to create a transfer file.
- Click the Map Data tab.
- Open the project you want to create as a transfer file.
- Click File, click Transfer, and then click Create.
The Create Transfer File dialog box opens. - In the File Name text box, type the file name.
Transfer files have .dmt extensions and are saved by default in C:...\DeLorme Docs\Projects. - Click Create.
Your file is created and saved in the specified location.
To Maintain the Directory Structure When Creating a Transfer File with Hyperlinked Files
When you create a transfer file containing hyperlinked files, you can select to maintain part of the directory structure for files with at least a common drive location.
Use the following steps to create a transfer file with hyperlinked files.
- Click the Map Data tab.
- Open the project you want to create as a transfer file.
- Click File, click Transfer, and then click Create. The following dialog box opens.
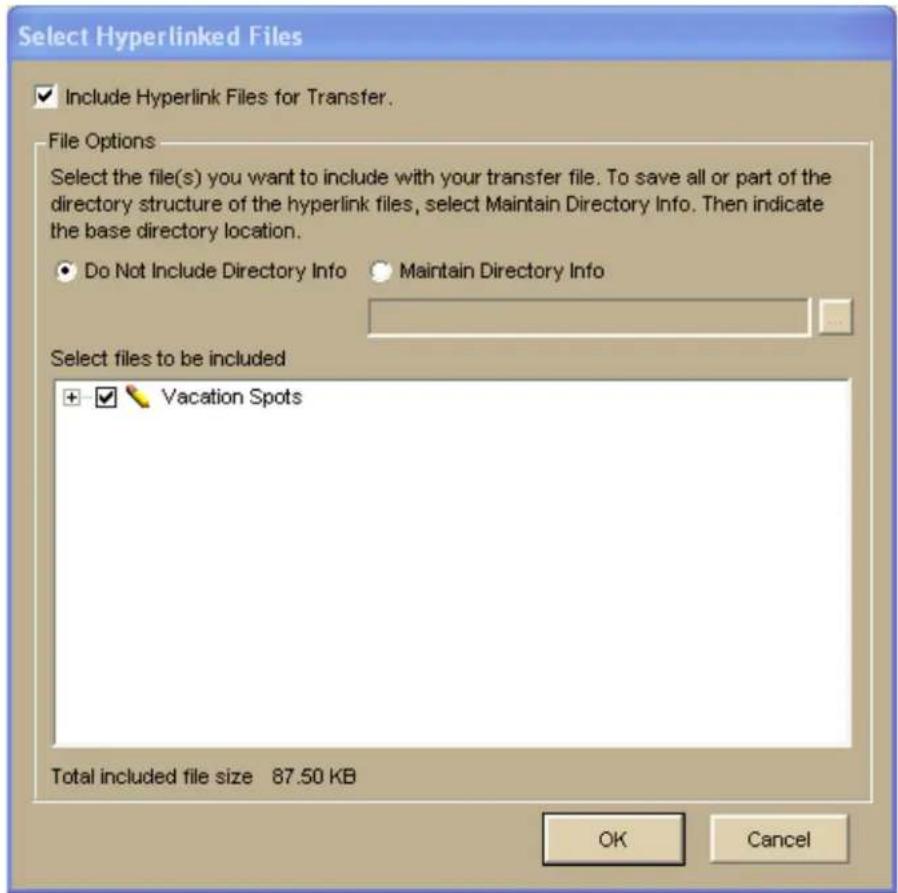
text_image
Select Hyperlinked Files ✓ Include Hyperlink Files for Transfer. File Options Select the file(s) you want to include with your transfer file. To save all or part of the directory structure of the hyperlink files, select Maintain Directory Info. Then indicate the base directory location. ● Do Not Include Directory Info ● Maintain Directory Info Select files to be included + ✓ Vacation Spots Total included file size 87.50 KB OK Cancel- Verify the Include Hyperlink Files for Transfer check box is selected.
If you do not want to include hyperlink files in your transfer file, clear this check box and go to step 8. - Under File Options, select Maintain Directory Info to save the directory structure of the hyperlinked files.
If you do not want to include the directory information for the hyperlinked files in the transfer file, select Do Not Include Directory Info and go to step 7. - Type the common base directory location of the hyperlinked files (up to the folder location that you want to maintain) in the text box.
OR
Click the Browse button and browse to the common base directory location. - Under Select Files to Be Included, clear the check box next to each file you do not want to include in your transfer file.
- Click OK.
The Create Transfer File dialog box opens. - In the File Name text box, type the file name.
Transfer files have .dmt extensions and are saved by default in C:...\DeLorme Docs\Projects. - Click Create.
Your file is created and saved in the specified location. The default location for imported transfer file attachments is C:...\DeLorme Docs\Transfer Files.
Importing Transfer Files
You can package a project and its contents into a single file, called a transfer file, to facilitate e-mailing or copying. You can also import transfer files, allowing you to share your projects with other DeLorme users.
You can import a transfer file with or without attached hyperlink files. When you create a transfer file with hyperlinked files, you can choose to maintain the directory information of common files. By doing this, the recipient of the transfer file can keep a similar directory structure as the creator. This is helpful when a transfer file is shared and updated between users. Transfer files do not include map data or GIS data.
To Import a Transfer File
Use the following steps to import a transfer file, including transfer files that have been e-mailed to you by other DeLorme users.
- Click the Map Data tab.
- Click File, click Transfer, and then click Import.
The Import Transfer File dialog box opens. The default location is C:...\DeLorme Docs\Projects. Browse to another location to change it. Transfer files have .dmt extensions. - Click a file to select it.
The name displays in the File Name text box. - Click Import to finish the import process.
The imported project opens and displays in the map view.
To Import a Transfer File with Hyperlinked Files
Use the following steps to import a transfer file that includes hyperlinked file attachments.
- Click the Map Data tab.
- Click File, click Transfer, and then click Import.
The Import Transfer File dialog box opens. The C:...\DeLorme Docs\Projects directory displays by default. Browse to another location to change it. Transfer files have .dmt extensions. - Click a file to select it. The name displays in the File Name text box.
- Click Import. The Browse for Folder dialog box opens.
- Select the folder where you want to save the hyperlinked files. The default location is C:...\DeLorme Docs\Transfer Files. Transfer files have .dmt extensions.
- Click OK.
The imported project opens in the map view.
E-mailing a Transfer File
You can package a project and its contents into a single file, called a transfer file, to facilitate e-mailing or copying. Transfer files do not include map data or GIS data.
To E-mail a Transfer File
This procedure creates an attachment file but does not permanently save a file to C:...\DeLorme Docs\Projects.
Use the following steps to e-mail a transfer file.
- Click the Map Data tab.
-
Open the project you want to e-mail as a transfer file.
-
Click File, click Transfer, and then click E-mail.
A transfer file is created and your computer's default operating system e-mail program opens with the transfer file included as an attachment.
- Complete the e-mail in accordance with your e-mail program.
Changing the Properties of Your Data
Changing the Properties in Your Data Overview
You can adjust the properties of some data categories to accommodate your needs. For example, you can adjust the shaded relief properties to account for the sun shining in a different direction, have contours display at varying densities at particular zoom levels, etc.
Each dataset contains its own sub-categories of data (raster, vector, contours, etc.).
Because of this, not all of the property information in this section of the Help will pertain to every dataset.
Note It is important to remember that any changes made to the dataset properties are permanent only when saved in a project.
Changing Imagery Display
When you use the Map Data tab to add imagery files, such as GeoTIFF, imagery, and ImageReg data, or data and imagery downloads from NetLink, to a map—by default, the image appears on top of any DeLorme vector base map by default. However, you can customize the layering sequence so that selected vector map features (roads, contours, etc.) appear on top of the image. Any added imagery files are listed in the Map Data tree view under the appropriate series.
To Change the Properties of an Imagery File
Use the following steps to change the properties of an imagery file.
-
Click the Map Data tab.
-
Under Secondary Map or Primary Map, click the plus sign next to the imagery series you want to modify.
-
Click the plus sign next to the specific imagery file you want to modify. The types of imagery in the file display.
-
Right-click the imagery file and click Properties. The Raster Properties dialog box opens.
-
Optional. For MrSID and some types of GeoTIFF data, you may be able to select a color to display as transparent (for example, black). To do so, select the Transparent Color check box, select a color, and click OK. Note that doing so makes the default transparent color (bright pink) show around the imagery. OR
If you do not want to select a color to display as transparent, click Next.
-
Type the minimum and maximum data zoom range for your custom raster properties in the text boxes.
-
Select the raster data position for that data zoom range from the drop-down list. Note The raster data position you select includes all of the options above it in the list.
-
Click Add Change to update your data positioning selections to the map. You must perform this step to apply any change.
-
Click Next.
-
Drag the gray tab markers to the minimum and maximum data zoom levels at which you want to see the imagery file on the map.
-
Click Next.
- Select the check box next to each connection usage you want to include with your raster properties.
- Click Finish.
Changing Point Properties
Use the Properties option on the Map Data tab to change the properties of various map features such as rasters, vectors, shaded relief, contours, points, etc.
Note You must use the Map Features tab of the Options dialog box to set the options for viewing any changes made to the point properties on the map. See Displaying Basic Map Features for information on showing/hiding points of interest.
To Change Point Properties
Use the following steps to change the properties of point data.
- Click the Map Data tab.
- Under Secondary Map or Primary Map, click the plus sign next to the dataset for which you want to modify the properties.
- Click the plus sign next to the sub-data category.
-
Highlight Map Points, click Data, and then click Properties.
The Point Properties dialog box opens.
OR
Right-click Map Points and click Properties.
The Point Properties dialog box opens. -
Under Set Data Zoom Range For Display, drag the gray tab markers to the minimum and maximum level you want.
The minimum and maximum zoom range displays above the Set Zoom Range For Display area.
Note The Show URLs check box is enabled if your dataset supports showing points as hyperlinks on the map.
-
Click Next.
-
Review the dataset information and click Next, if applicable.
-
Select the check box next to each connection usage you want to include with your point properties.
-
Click Finish.
The Point Properties for that dataset are modified and are visible on the map.
Note The point property changes are made only in the current project. You must save your project to retain the property changes.
Changing Vector Properties
Use the Properties option on the Map Data tab to change the properties of various map features such as rasters, vectors, shaded relief, contours, points, etc.
Note You must select to show land thoroughfares in the Display tab of the Options dialog box to view any changes made to the vector properties on the map. See Customizing the Map Features Preferences for information on showing/hiding land thoroughfares.
To Change Vector Properties
Use the following steps to change the properties of vector data.
- Click the Map Data tab.
-
Under Secondary Map or Primary Map, click the plus sign next to the dataset for which you want to modify the properties.
-
Click the plus sign next to the sub-data category.
- Highlight Vectors, click Data, and then click Properties.
The Vector Properties dialog box opens.
OR
Right-click Vectors and click Properties.
The Vector Properties dialog box opens.
- Under Set Data Zoom Range For Display, drag the gray tab markers to the minimum and maximum level you want.
The minimum and maximum zoom range displays above the Set Zoom Range For Display area. - Click Next.
- Select the check box next to each connection usage you want to include with your vector properties.
- Review the dataset information and click Next, if applicable.
- Click Finish.
The vector properties for that dataset are modified and are visible on the map.
Note The vector property changes are made only in the current project. You must save your project to retain the property changes.
Changing the Contour Properties
Use the Properties option in the Map Data tab to change the properties of various map features such as rasters, vectors, shaded relief, contours, points, DEM properties, etc.
Notes
- You must select to show contours in the Map Features tab of the Options dialog box to view any changes made to the contour properties on the map. See Displaying Basic Map Features for information on showing/hiding contours.
- XMap remembers the last customized contour values. For example, if you customize your contour settings and then change the settings to the default, the next time you try to customize your contour settings the last saved customized values display.
To Change the Contour Properties
Use the following steps to change the properties of contours.
- Click the Map Data tab.
- Under Secondary Map or Primary Map, click the plus sign next to the dataset for which you want to modify the properties.
- Click the plus sign next to the sub-data category.
- Right-click Contours and click Properties.
The Contour Properties dialog box opens (for Contours).
-
Select a contour option (Default, High Density, Low Density, or Custom) from the drop-down list.
-
Default—Uses the default values for displaying contours and labels.
- High Density—Approximately doubles the default values for displaying contours and labels.
- Low Density—Approximately halves the default values for displaying contours and labels.
- Custom—Allows you to customize how contours and labels display on the map.
- For Contours, select the data zoom level at which you want labels to begin to display.
- Click Next.
- If you selected Default, High Density, or Low Density in step 5, go to step 9. OR
If you selected Custom in step 5, you can customize the contour display by choosing the distance (in feet or meters) between contours and how many minor (unlabeled) contour lines for every major (labeled) contour line.
- For a given range of data zoom levels, type the distance (in feet or meters) between contour lines for those data zoom levels.
- Type the number of minor lines for each major line. For example, type 0 to label every contour line or type 2 to label every third contour line.
Note Labels display only on major lines beginning at the zoom level that you specified step 6.
- Click Add/ Change to update the contour rules list. OR
Click Reset to reset the settings to what displayed when you first launched the dialog box. OR
Click Use Defaults to use the default values to display contours and labels.
-
Click Next.
-
Under Set Data Zoom Range For Display, drag the gray tab marker to the minimum and maximum level you want.
The minimum and maximum zoom range displays above the Set Zoom Range For Display area.
- Click Next.
- Select the check box next to each connection usage you want to include with your point properties.
- Click Finish.
The Contour Properties for that dataset are modified and are visible on the map.
Notes
- The contour property changes are only made in the current project. You must save your project to retain the property changes.
- Selecting Custom changes the Interval section in the Control Panel to read, "Custom."
Changing Coordinate Grid Properties
Use the Properties option on the Map Data tab to change the properties of various map features, such as coordinate grids, rasters, vectors, shaded relief, contours, points, and so on.
You must select to show grids in the Display tab of the Options dialog box to view any changes made to the coordinate grid properties on the map. See Displaying Basic Map Features for information on showing/hiding grids.
To Change Coordinate Grid Properties
Use the following steps to change the properties of coordinate grids.
- Click the Map Data tab.
-
Under Secondary Map or Primary Map, click the plus sign next to the dataset for which you want to modify the properties.
-
Click the plus sign next to the sub-data category.
- Highlight Grid Lines, click Data, and then click Properties.
The Coordinate Grid Properties dialog box opens.
OR
Right-click Grid Lines and click Properties.
The Coordinate Grid Properties dialog box opens.
- Under Set Data Zoom Range For Display, drag the gray tab markers to the minimum and maximum level you want.
The minimum and maximum zoom range displays above the Set Zoom Range For Display area. - Click Next.
- Select the check box next to each connection usage you want to include with your coordinate grid properties.
- Click Finish.
The Coordinate Grid Properties for that dataset are modified and are visible on the map.
Note The coordinate grid property changes are made only in the current project.
You must save your project to retain the property changes.
Changing USGS Quad Line Connection Properties
Use the Properties option on the Map Data tab to change the properties of various map features such as USGS quad line connections, rasters, vectors, shaded relief, contours, points, etc.
Note You must select to show USGS quadrangle coverage in the Display tab of the Options dialog box to view any changes made to the USGS quad line connection properties on the map. See Displaying Basic Map Features for information on showing/hiding USGS quadrangle coverage.
To Change USGS Quad Line Connection Properties
Use the following steps to change the properties of USGS quad line connections.
- Click the Map Data tab.
- Under Secondary Map or Primary Map, click the plus sign next to the dataset for which you want to modify the properties.
- Click the plus sign next to the sub-data category.
- Highlight USGS Quad Lines, click Data, and then click Properties.
The USGS Quad Line Connection Properties dialog box opens.
OR
Right-click USGS Quad Lines and click Properties.
The USGS Quad Line Connection Properties dialog box opens.
- Under Set Data Zoom Range For Display, drag the gray tab markers to the minimum and maximum level you want.
The minimum and maximum zoom range displays above the Set Zoom Range For Display area.
- Click Next.
- Select the check box next to each connection usage you want to include with your USGS quad line connection properties.
- Click Finish.
The USGS quad line connection properties for that dataset are modified and are visible on the map.
Note The USGS quad line connection property changes are only made in the current project. You must save your project to retain the property changes.
Changing Draw Connection Properties
Use the Properties option on the Map Data tab to change the properties of various map features, such as draw objects, rasters, vectors, shaded relief, contours, points, and so on.
To Change Draw Connection Properties
Use the following steps to change the properties of draw objects.
- Click the Map Data tab.
- Under Secondary Map or Primary Map, click the plus sign next to the draw file for which you want to modify the properties.
- Right-click the draw file and click Properties. The Draw Connection Properties dialog box opens.
-
Under Set Data Zoom Range For Display, drag the gray tab markers to the minimum and maximum level you want. The minimum and maximum zoom range displays above the Set Zoom Range For Display area.
-
Click Next.
-
Select the check box next to each connection usage you want to include with your draw connection properties.
-
Click Finish. The Draw Connection Properties are modified and are visible on the map. Note The draw connection property changes are made only in the current project. You must save your project to retain the property changes.
Changing the Raster Properties
Use the Properties option on the Map Data tab to change the properties of various map features such as rasters, vectors, shaded relief, contours, points, DEM properties, etc.
Note You must select to show images in the Display tab of the Options dialog box to view any changes made to the raster properties on the map. See Customizing the Map Features Preferences for information on showing/hiding images.
To Change Raster Properties
Use the following steps to change the raster properties.
- Click the Map Data tab.
- Under Secondary Map or Primary Map, click the plus sign next to the dataset for which you want to modify the properties.
- Click the plus sign next to the sub-data category.
- Right-click Quad Rasters and click Properties. The Raster Properties dialog box opens.
-
Under Set Data Zoom Range For Display, drag the gray tab marker to the minimum and maximum level you want. The minimum and maximum data zoom range displays above the Set Data Zoom Range For Display area.
-
Click Next.
-
Type the minimum and maximum data zoom range for your custom raster properties in the text boxes.
-
Select the raster data positions from the drop-down list for that data zoom range. Note The raster data position you select also includes all of the options above it in the list.
- Continue to enter data zoom ranges and choose a position for each range.
- Click Add Change to update your data positioning selections to the map. Note You must perform this step to apply any change.
- Optional. Click Use Default to use the default zoom range and data positioning options.
- Click Next.
- Review the dataset information and click Next, if applicable.
- Select the check box next to each connection usage you want to include with your raster properties.
- Click Finish. The Raster Properties for that dataset are modified and are visible on the map. Note The raster property changes are only made in the current project. You must save your project to retain the property changes.
Changing the Shaded Relief Properties
Use the Properties option on the Map Data tab to change the properties of various map features such as rasters, vectors, shaded relief, contours, points, etc.
Note You must select to show shaded relief in the Display tab of the Options dialog box to view any changes made to the shaded relief properties on the map. See Displaying Basic Map Features for information on showing/hiding shaded relief.
To Change the Shaded Relief Properties
Use the following steps to change the properties of shaded relief.
- Click the Map Data tab.
-
Under Secondary Map or Primary Map, click the plus sign next to the dataset for which you want to modify the properties.
-
Click the plus sign next to the sub-data category.
-
Right-click Shaded Relief and click Properties. The Digital Elevation Model (DEM) Properties dialog box opens (for Shaded Relief).
-
Select the direction from which you want the sun to shine for displaying the shaded relief from the Sun Bearing drop-down list.
-
Select how many degrees you want the sun to be above the horizon from the Sun Inclination drop-down list.
-
Under Brightness Range, drag the gray tab markers to the minimum and maximum levels you want.
-
Optional. Click Reset if you have previously changed your shaded relief properties and want to return to the settings which were in effect before you opened the Properties dialog.
-
Optional. Click Use Defaults to change to the product defaults.
-
Click Next.
-
Under Set Data Zoom Range For Display, drag the gray tab markers to the desired minimum and maximum levels. The minimum and maximum zoom range displays above the Set Zoom Range For Display area.
-
Click Next.
-
Select the check box next to each connection usage you want to include with your shaded relief properties.
- Click Finish.
The Shaded Relief Properties for that dataset are modified and are visible on the map.
Note The shaded relief property changes are made only in the current project. You must save your project to retain the property changes.
Changing the Radio Coverage Ellipses Properties
Use the Properties option on the Map Data tab to change the properties of various map features such as radio ellipses, rasters, vectors, shaded relief, contours, points, etc.
To Change the Radio Coverage Ellipses Properties
Use the following steps to change the properties of radio coverage ellipses.
- Click the Map Data tab.
- Under Secondary Map or Primary Map, click the plus sign next to the dataset for which you want to modify the properties.
- Click the plus sign next to the sub-data category.
- Highlight Radio Coverage Ellipses, click Data, and then click Properties.
The Ellipse Connection Properties dialog box opens.
OR
Right-click Radio Coverage Ellipses and click Properties.
The Ellipse Connection Properties dialog box opens.
- Under Set Data Zoom Range For Display, drag the gray tab markers to the minimum and maximum level you want.
- Click Next.
- Select the check box next to each connection usage you want to include with your properties.
- Click Finish.
The Radio Coverage Ellipse Connection Properties for that dataset are modified and are visible on the map.
Note The radio coverage ellipse property changes are made only in the current project. You must save your project to retain the property changes.
Changing the Elevation Properties
Use the Properties option on the Map Data tab to change the properties of various map features such as elevations, rasters, vectors, shaded relief, contours, points, DEM properties, etc.
To Change the Elevation Properties
Use the following steps to change the properties of elevation.
- Click the Map Data tab.
- Under Secondary Map or Primary Map, click the plus sign next to the dataset for which you want to modify the properties.
- Click the plus sign next to the sub-data category.
- Right-click Elevation and click Properties.
The Digital Elevation Model (DEM) Properties dialog box opens (for Elevation).
- Select a priority (1-100) from the Priority scroll list.
Note When the program has more than one elevation connection, the connection with the highest priority takes precedence in areas where there is coincident data.
XMap User Guide
- Select the data zoom level at which you want elevations to begin to display.
- Click Next.
- Under Connection Usages, select or clear the appropriate check boxes to show or hide elevation data.
- Click Finish.
The Elevation Properties for that dataset are modified and are visible on the map. Note The elevation property changes are made only in the current project. You must save your project to retain the property changes.
Working With GIS
GIS Overview

The topics that are in the Working with GIS Help section cover functionality that is included in XMap Professional, XMap GIS Editor, and XMap GIS Enterprise. Check the important note at the top of each topic to see if it pertains to your version of XMap.
With the GIS tab, you can view and analyze the data in your ESRI files (.shp, .e00), MapInfo (.mif, .tab), AutoCAD (.dxf, .dwf, dwg), Geocode Type files (.asc, .csv, .dbf, .txt, .tab, .mdb, .xls), Draw files (.an1), or DeLorme OpenSpace transfer files (.openspace) on the map. Once the data is imported as a layer, you can choose to classify, symbolize, and label the data in the layers to your specifications. You can also:
- Create a database on a network server to share data among group members.
- Create attribute queries using the fields in your layer.
- Embed documents and link URLs to attribute records.
• Use XMap Forms to easily collect data.
• Create spatial queries between layers. - Add fields to your layer.
- Create a new layer—a new empty layer or a new layer based on an existing layer, query results, or map selections.
- Send GIS layers to an Earthmate® PN-Series GPS device.
- Create default option settings for layers and queries.
• And much more!
The GIS tab has five subtabs:
| Subtab Name | Description |
| Workspace | The Workspace subtab is the primary area for using the GIS tab. You can use the tools in the Workspace subtab to manage and analyze layers in your databases as well as manage the databases themselves. See also, Handling Disconnected or Deleted Layers. |
| Attributes | The Attributes subtab has two different views, the Datasheet View and the Design View. The Datasheet View displays the fields that are selected to be "visible" in the Design View and lets you edit the attribute values. The Design View lets you edit properties of the fields, view field metadata, create fields, and import and link additional fields to your layer. |
| Query | The Query subtab lets you create custom attribute and spatial queries to perform analysis on your layers. You can also rename, save, copy, delete, and symbolize custom queries in the selected layer. |
| Layering | The Layering subtab lets you move the layers in your workspace above, below, or equal to other layers and/or the standard DeLorme data layers. Moving a layer up in the list helps to ensure the layer will be visible on the map. |
| Registration | The Registration tab appears when you import a CAD layer that has no spatial reference to the Earth’s surface. The tab functions the same as the ImageReg tab by allowing you to place control points between the unregistered layer (in the left map) and the corresponding location on the ground (in the right map). |
Note If a shared layer in a single database is being manipulated by more than one user at the same time, any analysis of that layer may produce unpredictable results.
Handling Disconnected or Deleted Layers
When a layer is disconnected or deleted, a red exclamation point (disconnected) or a red X (deleted) displays next to the layer name in the Workspace.
This happens if the database the layer was connected to has been moved or deleted or if the local source is unavailable. For example, if the database is on a laptop computer that is turned off, the connection will be broken.
| Layer | Database | Server |
| Dave Track Final | Schema_4... | OLD-SF |
| Dave Track_Edit | Schema_4... | OLD-SF |
| Hapsworth Airfield Paragliding | Schema_4... | OLD-SF |
You can try to refresh the connection, establish a new connection, or remove the disconnected or deleted layer from the Workspace.
- To refresh the connection for all layers, click the Layers button and click Refresh All Layers.
OR
To refresh the connection for specific layers; highlight the layers, right-click the highlighted area, and click Refresh Selected Layers. - To reconnect all layers to the original database or to connect them to a new database, click the Layers button and click Reconnect. The Connect Layers dialog box opens.
OR
To reconnect/connect specific layers, highlight the layers, right-click the highlighted area, and click Reconnect. The Connect Layers dialog box opens.
• To remove the active layer, click the Layers button and click Remove.
OR
To remove specific layers, highlight the layers, right-click the highlighted area, and click Remove.
GIS Options
GIS Layer Options
You can customize the default settings for managing GIS layers.
To Set GIS Layer Options
Use the following steps to create default settings for GIS layers.
1. Click the Options button
on the toolbar.
OR
Click the arrow next to the Options toolbar button to open the menu. Then, click Options to open the dialog box.
-
Click the GIS tab, and then click the Layers subtab.
-
Set the following options:
- Add imported layers to Workspace—Select this check box to automatically add imported layers to the Workspace subtab.
- Show imported layers on map—If you selected the above check box, select this check box to show layers on the map after they are imported to the Workspace subtab.
- Zoom to full layer extent—Select this check box to automatically zoom the map to show the full extent of hte layer after import.
- Show layers added from Manage Layers on map—Select this check box to show layers on the map when you add them using the Manage Layers dialog box.
- Zoom map when centering on points—Use the drop-down list to select the zoom level to use when you double-click a point geometry to center it on the map in the Attributes subtab Datasheet View.
- Default List method—Use the drop-down list to select the default setting for the List filter on the Attributes subtab for layers added to the Workspace. You can manually change the filter after a layer is added to Workspace. Options are Map Region (default), All, and Toolbar Select.
- Refresh attribute records for Map Region filter—Select this check box to automatically refresh the Attributes subtab Datasheet View when the map extent changes and Map Region is selected in the Show drop-down list. The Map Region filter hides all attribute records whose map bounding region (MBR) is not currently within the map window.
- Switch the List method to Toolbar Select—Select this check box to automatically switch the method used by the List filter to Toolbar Select when you are selecting an object that is not in the current list.
- Large layer definition (# of geometries)—Type the minimum number of geometries a layer must include to define it as a large layer. When a layer includes at least that number of geometries, XMap will handle the layer differently to improve processing speed. For example, the map will not zoom to the location of the geometries and the count function for query results is suppressed. The default number of geometries for a large layer is 50,000.
- Geometry selection color—Click the button to open the Color dialog box and click the color for selection highlights on the map. Select geometries with the

Selection Tool in the toolbar or by selecting records on the Attributes subtab in datasheet view.
- Limit geometries from database to—If you want to limit the number of geometries that the database is allowed to return, type the number in the box. The database will return up to that number and then return no more results. A zero in the box indicates that there is no limit.
- Edit off-screen objects-Select this check box to allow editing or deleting of objects that are partially off the screen.
- Drag objects with the Edit tool-Select this check box to allow the use of the Edit tool to drag objects.
GIS Query Options
Use the Query subtab on the GIS tab in the Options dialog box to create default settings for managing queries.
Note Changes to query options apply only to the queries you create after you make the changes.
To Set GIS Query Options
Use the following steps to create default settings for GIS queries.
- Click the Options button
on the toolbar.
OR
Click the arrow next to the Options toolbar button to open the menu. Then, click Options to open the dialog box.
-
Click the GIS tab, and then click the Queries subtab.
-
Set the following options:
-
Zoom map to query results—Select this check box to zoom the map to show the results of a query.
- Count results when running query—Select this check box to show a count of the results in the Query Results area on the Query subtab when you run a query.
- Attribute effect—Use the drop-down list to select the default attribute effect of a new query for any layer. Options are Highlight, Filter, and None.
- Map effect—Use the drop-down list to control the default map effect of a new query for any layer. Options are Highlight, Filter, and None.
Using Layers in a Subscription
Opening a Subscription File

This Help topic describes features that are available in XMap Professional, XMap GIS Editor, and XMap GIS Enterprise.
Once a database administrator sends you a subscription file, you must open it in XMap to activate the subscription. A subscription to an Enterprise database allows you to synchronize your local copy of the layers with the Enterprise database on the server. You can edit a layer and then synchronize your edits with the Enterprise database. You can also use the redlining feature to make edits to the layer in a draw file.
To Open a Subscription File
Use the following steps to open a subscription file.
- Double-click the file either within an e-mail or after you save it to your computer. If XMap is not already open, it opens automatically.
- When prompted, restart XMap.

-
Click the Synchronize button on the toolbar. A progress bar indicates the synchronization percentage complete.
-
Click OK to acknowledge the synchronization completed. The layers in the subscription are added to the workspace on the GIS tab.
-
To view a layer on the map, click the GIS tab, click the Workspace subtab, and then select the check box next to the layer in the workspace.
OR
To center the layer on the map, double-click the layer in the workspace.
Note Only one subscription file can be active at a time.
Editing a Layer in a Subscription

This Help topic describes features that are available in XMap Professional, XMap GIS Editor, and XMap GIS Enterprise.
You can edit a layer you are subscribed to and then synchronize the edits with the Enterprise database on the server.
Editing a Layer in a Subscription
- Open a subscription file.
OR
If you are using a subscription file you are already subscribed to, click the

Synchronize button on the toolbar to refresh the layers.
- Use the GIS editing tools to make edits to the layer. If the layer includes a form, depending on the form permissions and your user permissions, you can use the form to view or edit existing layer geometries or add new geometries.
Notes
- If you edit an object that has been deleted from the Enterprise database since you last synchronized, it will be restored to the database when you synchronize again.
• If you decide that you do not want to synchronize your edits with the Enterprise
database, click the Revert button on the toolbar to discard the edits. The layer will synchronize with the Enterprise database but not include the edits.
- To view the history of changes made against each geometry in a layer, click the Ext Sets button and then click Show Extended Sets; a secondary table opens below the primary table and displays the changes.
Refreshing the Layers in a Subscription

This Help topic describes features that are available in XMap Professional, XMap GIS Editor, and XMap GIS Enterprise.
To ensure the layers that were part of your subscription are the most recent files available,
click the Synchronize button on the toolbar. The layers are refreshed with the latest version from the source database.
Adding Subscription Layers to Your Workspace

This Help topic describes features that are available in XMap Professional, XMap GIS Editor, and XMap GIS Enterprise.
Click the Add Synchronized Layers tool

on the toolbar for a quick and easy way to cription to your workspace. The tool is active
only when at least one layer in the active subscription has been removed from the workspace.
Redlining
Creating Redline Edits

This Help topic describes features that are available in XMap Professional, XMap GIS Editor, and XMap GIS Enterprise.
Redlining refers to the process of adding MapNotes/symbols or drawing shapes to "mark up" GIS layers without actually editing the layers themselves. Redlines utilize the draw capabilities of the Draw tab and are saved in a draw layer that is created when redlining begins.
Redline draw layers have connections with a special type of GIS layer (called Redline Layer) on an Enterprise database that the user has a subscription to. After redlines are made on the map, they will be synchronized with the redline GIS layer during the subscription synchronization process. The layers are stored as attribute records within the redline GIS layer, with the draw file imbedded in a column with a document link that opens the draw file when clicked.
To Create Redline Edits
Use the following steps to create redline edits.
- View a layer that is part of a subscription.
-
Click the Redline tool on the toolbar. The Redline toolbox opens.
-
If you want to place a symbol on the map, click the Symbol tool [icon], select the symbol set that contains the symbol you want from the Set drop-down list, and then select the symbol from the Style drop-down list. Then, click the location on the map where you want to place the symbol. OR
If you want to draw a line on the map, click the Line tool 📋, select the line color and line style, and then draw the line at the map location. OR
If you want to draw freehand on the map, click the Scribble tool , select the scribble color and style, and then draw the scribble at the map location. OR
If you want to place a MapNote on the map, click the MapNote tool, select the font color and size, and then click the location on the map where you want to place the MapNote. OR
If you want to draw a polygon on the map, click the Polygon tool, select the polygon fill color and fill style, and then draw the polygon at the map location.
- Click the Close button in the upper-right corner of the Redline toolbox to close the toolbox.
Note You can access the full range of draw options for each symbol type in the Redline toolbox by selecting the same option in the Draw tab.
Sending Redline Edits to the Enterprise Database

This Help topic describes features that are available in XMap Professional, XMap GIS Editor, and XMap GIS Enterprise.
Once you create redline edits in the GIS layers included in a subscription, you can send those edits to the Enterprise database on the server by clicking the Synchronize button

on the toolbar. This also refreshes the layers that were part of your subscription and retrieves the most recent changes.
Viewing Redline Edits

This Help topic describes features that are available in XMap Professional, XMap GIS Editor, and XMap GIS Enterprise.
After users synchronize their redline layers with the redline GIS layer in the Enterprise database, those users with permissions to view the redline GIS layer can review all of the redlines.
- Add the redline GIS layer to your workspace.
-
Once the redline layer is in your workspace, select the check box next to the layer in the Workspace view.
Outlined boxes display on the map (red indicates incomplete redline edits and blue indicates completed redline edits), depicting the map bounding rectangles for each redline record. -
Click the Attributes subtab and click the Datasheet View button 📄. The attributes of the layer display. Each record in the redline layer has the user's name, date, and a copy of the original redline file (.an1).
-
To view a specific redline draw layer: Click its hyperlink in the Redline Layer column. A message asks if you want to save or open the file. OR Hover your cursor in the specific cell in the Redline Layer column. A floating arrow displays. Click the arrow and then select Open. A message asks if you want to save or open the file.
-
Click Save to save the file to your hard drive (ensure that the Open in XMap check box is selected).
The draw layer is added to your project and displays on the map. OR
Click Open to open the file from its current location (ensure that the Open in XMap check box is selected).
The draw layer is added to your project and displays on the map.
- Use the notes and annotations in the draw layer to make the appropriate edits to the corresponding GIS layers to which the user was subscribed.
XMap User Guide
Stationing
Stationing

This Help topic describes features that are available in XMap GIS Editor and XMap GIS Enterprise.
Stationing is a linear referencing method that calculates numeric values along a line based on user-defined From and To values. These values are entered into Fr_Station and To_Station attribute fields for a line in a GIS layer, which are automatically assigned by XMap to the start and end points of the line.
Stationing is commonly used in the pipeline industry to locate station values (numeric point locations) along pipelines. For example, field personnel may be given work orders of sections of pipeline to inspect or repair. These locations may be referenced by their station values or a range of values along the pipeline. Using a GIS line layer of the pipeline that has the station values present, the field worker is able to locate the exact point of the station along the line and navigate to it.
Although stationing has its roots in the pipeline industry, it is a convenient method of referencing data to a location for any type of linear data.
XMap Professional users can view stationing fields created in XMap Editor or Enterprise.
To Add Stationing Attributes to a Layer
Use the following steps to add stationing attributes to a layer.
- Click the GIS tab.
- Click the Workspace subtab if it is not selected.
- View an existing line layer, create a new line layer, or import a line layer.
-
Highlight the layer to which you want to add stationing points.
-
Click the Attributes subtab.
-
If it is not already in Design View mode, click the Design View button

-
Add fields "Fr_Station" and "To_Station" to the line layer. From the Data Type drop-down list, select any numeric type: Integer, Big Integer, Byte, Double, Float, or Small Integer.
-
Click the Datasheet View button.
-
Type numeric values in the Fr_Station and To_Station records for the layer. The Fr_Station value is automatically assigned to the start point of the line, and the To_Station is automatically assigned to the end point of the line. The station value for every location along the line is calculated based on the start and end point values.
To View Stationing Attributes
Hover over a line on the map that includes stationing data. Stationing values display in the Info bar at the bottom of the map.
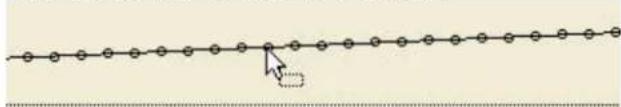
natural_image
Simple line diagram with dots and a cursor arrow, no text or symbols presentStation: 139.15, Fairview, Kansas, 66425
Bulk Importing and Exporting
Bulk Importing

This Help topic describes features that are available in XMap GIS Editor and XMap GIS Enterprise.
XMap includes a command prompt utility that allows you to import multiple files (from potentially different locations) into a database at one time through user-created batch files (.bat or .cmd). You can also import entire directories of files using the wildcard capability of command prompt. Import individual files either through manual entry of the import commands or by referencing user created .ini files on the command line. You can use the XMap Bulk Importer to import all file types that can be imported with the XMap Import Wizard, except for non-spatial types that require geocoding.
You can import files with the bulk importer through four different mechanisms:
- Enter import parameters directly into the command line
- Create a .ini file that specifies the import parameters, then reference this .ini file in the command line
- Create a .bat or .cmd batch file that specifies the import parameters for multiple files, then run this batch file directly in the command line
- Use a wild card entry to import all files of a like type in the same directory. This option imports only files of the type that is specified by the wild card and that contain spatial reference information.
Note For more information on importing parameters, see Bulk Importing Parameters.
To Import Files Using the Command Line
All import command lines of this type begin with xmapimport in the command line. All parameters are separated by a single space and parsed with -- on the command line.
- From the Start menu, point to Programs>DeLorme>XMap>Tools, and then click the XMap Bulk Importer-Exporter option.
- Type the following in the command line: xmapimport --target-server= server name --target-db= database name --source-file= file path [--datum= datum of the file (e.g., NAD83) --coordinate-system= the coordinate system of the file (e.g., SPCS) --spcs-zone= me-w --spcs-units= surveyfeet] only needed when spatial reference information is not specified in the file.
Notes
- The coordinate information varies depending on the type of coordinate system you specify (for example, if you select SPCS, you must also specify the SPCS zone and units).
-
If the server was created on your local machine, type
\xmap7. If you are connecting to an external server, see your Database Administrator to obtain the server name information. -
Press the ENTER key on your keyboard. A confirmation message displays after the file is imported; the message includes the file name, number of geometries, and the time it took for the file to import.
-
Add the layer to your workspace.
To Import Files Creating an .ini File
This option works on a single file or wild card basis using the parameters described in previous sections. You can create the initialization file (.ini) using a text editor such as Notepad or Wordpad. All parameters are separated by a return in the .ini file. The name and path of the .ini file are referenced in the command line.
- Open your preferred text editing program, such as Wordpad or Notepad.
- Type the following parameters in the text document:
target-server= server name
target-db=database name
source-file= file path
datum = the datum of the file
coordinate-system= the coordinate system of the file
Note The coordinate information varies depending on the type of coordinate system you specify (for example, if you select SPCS, you will also need to specify the SPCS zone and units).
- Save the text document with an .ini extension (rather than a .txt extension).
- From the Start menu, point to Programs>DeLorme>XMap>Tools, and then click the XMap Bulk Importer-Exporter option.
- Type the following parameters in the command line: xmapimport the path to the .ini file you created in steps 1-3.
- Press the ENTER key on your keyboard.
A confirmation message displays after the file is imported; the message includes the file name, number of geometries, and the time it took for the file to import (in days, hours, minutes, and seconds).
- Add the layer to your workspace.
To Import Files Creating a Batch File
This option allows you to automate several iterations of import with a user-created batch file. You can create batch files with a text editor such as Notepad or Wordpad. Each line of the batch file pertains to a single import command line and contains the same parameters as would be specified with manual entry in the command line. You can import multiple file types located in different folders into different OpenSpace databases using the automated method.
- Open your preferred text editing program, such as Wordpad or Notepad.
- Type the following parameters in the text document (text in red reflect the user's information):
xmapimport --target-server= server name --target-db= database name --source-
file=file path --datum=datum --coordinate-system=coordinate system --spcs-
zone=specify --spcs-units=surveyfeet
Note Ensure that the text is contained within a single line and there are no character returns.
- Save the text document with a .bat or .cmd extension (rather than a .txt extension).
- From the Start menu, point to Programs>DeLorme>XMap>Tools, and then click the XMap Bulk Importer-Exporter option.
- Type the path for the .bat/.cmd file you created in steps 1-3 in the command line (for example, c:\test_batch.bat).
- Press the ENTER key on your keyboard.
A confirmation message displays after the file is imported (the message includes the
file name, number of geometries, and the time it took for the file(s) to import (in days, hours, minutes, and seconds).
- Add the layer(s) to your workspace.
To Import Files with a Wild Card
This option allows you to import all files of the same type located within the same directory. These files must contain the same spatial reference information. This type of import is useful for importing entire directories of files in a quick and automated process. A wild card has an asterisk, a period, and then the extension abbreviation (for example, *.shp). Type an asterisk to indicate any number of characters. Type a question mark to indicate any single character or nothing.
- From the Start menu, point to Programs>DeLorme>XMap>Tools, and then click the XMap Bulk Importer-Exporter option.
- Type the following parameters in the command line (text in red reflects the user's information):
xmapimport --target-server=server name --target-db=database name --source-file=file path (e.g., *.shp)
Note Ensure that the text is contained within a single line and there are no character returns.
- Press the ENTER key on your keyboard.
A confirmation message displays after the file is imported; the message includes the file name, number of geometries, and the time it took for the file(s) to import (in days, hours, minutes, and seconds).
- Add the layer(s) to your workspace.
Bulk Importing Parameters

This Help topic describes features that are available in XMap GIS Editor and XMap GIS Enterprise.
Type xmapimport on the command line and then press the ENTER key on your keyboard to display a list of instructions and general required import parameters (parameters vary based on the type of files being imported).
Notes
- File names with embedded spaces should be in quotes (for example, "Yarmouth Parcels.shp").
- If the server was created on your local machine, type
\xmap7. If you are connecting to an external server, see your Database Administrator to obtain the server name information.
Viewing the Supported File Types and Required Parameters
Type xmapimport --list-supported-files in the command line and then press the ENTER key on your keyboard to see a list of supported file types.
File Types That Contain Spatial Reference Information
Supported spatial file types that contain spatial reference information include:
- ArcInfo Interchange files (.e00)*
• AutoCAD Data Exchange file (.dxf or .dwf)*
XMap User Guide
• AutoCAD Draw file (.dwg)*
- DeLorme Draw files (.an1)
- DeLorme OpenSpace files (.openspace)
- ESRI Shapefiles (.shp)*
• MapInfo Table files (.tab)*
- MapInfo Exchange files (.mif)*
* These files often contain intrinsic spatial reference information, but this is not always the case. When they do not, additional parameters will need to be supplied in the command line to enable import. If these parameters are not specified, you will receive the following notice when trying to import: "The spatial data source does not offer spatial hints and none were specified on the command line."
Required parameters for this file type:
xmapimport
--target-server=SQL Server name
--target-db=OpenSpace DB name
--source-file=file and path
Optional parameters include:
--layer-name= name of the layer to be created
--replace-layer= name of the layer to be replaced
--append-layer= name of the layer to append to
--replace-all=replace database layers with source layers when both name and type match
Additional parameters required when spatial reference information is not included.
File Types That Do Not Contain Spatial Reference Information
Supported spatial file types that do not contain spatial reference information include:
- ESRI Shapefiles (.shp) that do not have an accompanying Projection file (.prj)
• All file types marked with * above
Required parameters for this file type:
xmapimport
--target-server=SQL Server
--target-db=OpenSpace DB
--source-file=file and path
--datum = datum * *
--coordinate-system=coordinate system**
If the coordinate system is UTM, you must specify two additional parameters in the command line:
--utm-zone-number=zone-number***
--utm-band-letter=band letter***
If the coordinate system is SPCS, you must specify two additional parameters in the command line:
--spcs-zone=zone* *
--spcs-units=units***
** obtain valid options for these parameters by running a separate command in the command prompt.
*** valid options for these parameters are listed in the instructions that display when running xmapimport in the command line.
Optional Parameters include:
--layer-name=name of the layer to be created
--replace-layer= name of the layer to be replaced
--append-layer=name of the layer to append to
--replace-all=replace database layers with source layers when both name and type match
Viewing a List of Supported Coordinate Systems
Type xmapimport --list-coordinate-systems to see a list of supported coordinate systems. All files are converted to the Latitude/Longitude coordinate system with the World Geodetic System datum during import.
Note that the list of supported coordinate systems is for spatial file types that do not contain spatial reference information. For spatial file types that do contain spatial reference information, the XMap Import Command Prompt is able to convert from a much larger library of coordinate systems.
Viewing a List of Supported Datums
Type xmapimport --list-datums to see a list of supported datums.
Note that the list of supported coordinate systems is for spatial file types that do not contain spatial reference information. For spatial file types that do contain spatial reference information, the XMap Import Command Prompt is able to convert from a much larger library of coordinate systems.
Viewing a List of State Plane Zones
Type xmapimport --list-spcs-zones to see a list of the state plane coordinate system zones.
Bulk Exporting

This Help topic describes features that are available in XMap GIS Editor and XMap GIS Enterprise.
XMap includes a utility that allows you to export one layer at a time (from potentially different OpenSpace databases) to one of the supported file formats at one time through user-created batch files (.bat or .cmd). You can also export individual layers, either through manual entry of the export commands or with referencing user created .ini files on the command line. You can use the XMap Bulk Importer-Exporter to export all file types supported in the Export dialog box.
You can export files with the bulk exporter in three different ways:
- Enter export parameters directly into the command line
- Creating a .ini file that specifies the export parameters, then reference this .ini file in the command line
XMap User Guide
- Creating a .bat or .cmd batch file that specifies the export parameters for multiple files, then run this batch file directly in the command line
All exported OpenSpace layers require you to specify at least four parameters in the command line following the xmapexport command.
The required exporting parameters include (text in red reflect the user's information):
- source-server= the SQL server where the database for exporting resides
Note If the server was created on your local machine, type\xmap7. If you are connecting to an external server, see your Database Administrator to obtain the server name information. - source-db= the OpenSpace database the layers are being exported from
- output-file= the file format and extension for the exported layers
- source-layer= the name of the OpenSpace layer being exported OR source-layerid= the identification number of the layer in the openspace database
Optional exporting parameters include (text in red reflect the user's information):
- query=name of the query being referenced OR queryid=identification number of the query in the database being referenced
- attributes=the name of attribute field to include in the exported layer Note If this parameter is left blank, all attribute fields in the layer will be exported. Also, not all attribute field data types that are supported in XMap are supported in the exported file formats.
To Export Files Using the Command Line
All export command lines of this type begin with xmapexport in the command line. All parameters are separated by a single space and parsed with -- on the command line.
-
From the Start menu, point to Programs>DeLorme>XMap>Tools, and then click the XMap Bulk Importer-Exporter option.
-
Type the parameters into the command line. An example of the format would be: xmapexport --source-server=username\xmap7 --source-db=database_test --output-file-file=C:\gisdata\states.shp --source-layer=states
-
Press the ENTER key on your keyboard. A confirmation message displays after the file is exported; the message includes the file name, number of geometries, and the time it took for the file to export (in days, hours, minutes, and seconds).
Note To send the results of a command to a logfile, type'>path\filename.log 2>1' at the end of the command. Results and errors will be sent to the logfile and will not appear in the command line. If no path is specified, the logfile will be created in the default target directory.
To Export Files Creating an .ini File
This option works on a single file basis using the parameters described in previous sections. You can create the initialization file (.ini) with a text editor such as Notepad or Wordpad. All parameters are separated by a return in the .ini file. The name and path of the .ini file are referenced in the command line.
-
Open your preferred text editing program, such as Wordpad or Notepad.
-
Type the following export parameters in the text document:
- source-server= the SQL server where the database for exporting resides
- source-db= the OpenSpace database from which the layers are being exported
- output-file= the file format and extension for the exported layers
- source layer=the name of the OpenSpace layer being exported OR sourcelayerid=the identification number of the layer in the OpenSpace database
The following parameters are optional:
- query= name of the query being referenced OR
queryid= identification number of the query in the database being referenced -
attributes= the name of the attribute field to include in the exported layer Note If this parameter is left blank, all attribute fields in the layer will be exported.
-
Save the text document with an .ini extension (rather than a .txt extension).
- From the Start menu, point to Programs>DeLorme>XMap>Tools, and then click the XMap Bulk Importer-Exporter option.
- Type the following parameters in the command line: xmapexport=-the path to the .ini file you created in steps 1-3.
- Press the ENTER key on your keyboard.
A confirmation message displays after the file is exported; the message includes the file name, number of geometries, and the time it took for the file to export (in days, hours, minutes, and seconds).
To Export Files Creating a Batch File
This option allows you to automate several iterations of export with a user-created batch file. You can create batch files with a text editor such as Notepad or Wordpad. Each line of the batch file pertains to a single export command line and contains the same parameters as would be specified with manual entry in the command line. Multiple layers located in different OpenSpace databases can be exported into different file formats and directories using this method.
- Open your preferred text editing program, such as Wordpad or Notepad.
- Type the export parameters in the text document.
Note Ensure that the text is contained within a single line and there are no character returns. - Save the text document with a .bat or .cmd extension (rather than a .txt extension).
- From the Start menu, point to Programs>DeLorme>XMap>Tools, and then click the XMap Bulk Importer-Exporter option.
- Type the path for the .bat/.cmd file you created in steps 1-3 in the command line (for example, c:\test_batch.bat).
- Press the ENTER key on your keyboard.
A confirmation message displays after the file is exported; the message includes the file name, number of geometries, and the time it took for the file(s) to export (in days, hours, minutes, and seconds).
To send the results of a command to a logfile, type'>path\filename.log 2>1' at the end of the command. Results and errors will be sent to the logfile and will not appear in the command line. If no path is specified, the logfile will be created in the default target directory.
Bulk Exporting Parameters

This Help topic describes features that are available in XMap GIS Editor and XMap GIS Enterprise.
Type xmapexport on the command line and then press the ENTER key on your keyboard to display a list of instructions and general required export parameters; parameters vary based on the type of files you are exporting.
All OpenSpace layers that you export require you to specify at least four parameters in the command line following the xmapexport command.
The required exporting parameters include (text in red reflect the user's information):
- source-server= the SQL server where the database for exporting resides
- source-db= the OpenSpace database the layers are being exported from
- output-file= the file format and extension for the exported layers
- layer= the name of the OpenSpace layer being exported OR layerid= the identification number of the layer in the OpenSpace database
Optional exporting parameters include (text in red reflect the user's information):
- filter= name of the query being referenced OR
filterid=identification number of the query in the database being referenced - attributes= the name of the attribute column to include in the exported layer Note If this parameter is left blank, all attribute columns will be exported.
- relax-polygon=yes|no (When no (default value,) polygons may be restructured when exporting a shapefile to ensure they conform to the shapefile standard; if the restructuring fails, the polygon is excluded. When yes, all polygons are exported without being restructured.
To send the results of a command to a logfile, type'>path\filename.log 2>1' at the end of the command. Results and errors will be sent to the logfile and will not appear in the command line. If no path is specified, the logfile will be created in the default target directory.
Managing Layers in Your Workspace
Workspace Overview

Some of the features that are introduced in this topic are not included in XMap Professional.
The Workspace subtab is the primary area for using the GIS tab. You can use the Workspace subtab to manage and analyze layers in your databases, as well as manage the databases themselves.
What is a Layer?
A layer consists of geometries (points, lines, or polygons) that have corresponding attribute records and contain information that describes the properties of the geometries. In the GIS
tab, a layer is considered to be the contents of an imported file that you can view and analyze on the map.
What is a Workspace?
A workspace is the area where you import layers to a database and visualize the data on the map. Within this area is a table that displays in the center of the Workspace subtab. To modify which columns display in the workspace, right-click the bar at the top of the table to see all of the available columns (column names with a selected check box are currently displaying in the table). You can also sort the table by a particular column by clicking the column you want to sort by, change the order of the workspace columns by dragging a column to the desired location, or resize the width of the columns by dragging the line that separates the column names to a different position.
Your workspace is saved in your current project. Each time you create a new project, the workspace is reset; resetting a workspace does not delete layers.
Managing the Layers in a Database
Use the Layers button in the Workspace subtab to make changes to the local workspace, such as:
• Create a new layer to add to a database
- Import a layer into a database
- Delete a layer from a database
- Add a layer from a database to your workspace
- Remove a layer from your workspace
- Export a layer as a Shapefile, text file, or DeLorme OpenSpace Transfer File
- Refresh all layers in the workspace (from the database)
- Rename a layer in a database
• Copy a layer from one database to another
Modifying How Your Layers Display on the Map
Once you highlight a layer in your workspace, you can use the Tools button (or right-click menu) to modify how the layer displays on the map. Use the Tools button to:
- Classify your layer according to the attributes (properties) of the layer
- Symbolize your layer so that you have complete control of how the layer displays on the map
- Label your layer by using a formula based on the attributes in the layer
- Modify the display properties of a layer
• View a legend of the visual characteristics of a layer
• Create a buffer around geometries in a layer - Open the Options dialog box to modify the default layer settings
Importing a Layer into a Database

Not all of the import types listed in this Help topic are available in XMap Professional.
You can import ESRI (.shp, .e00), MapInfo (.mif, .tab), AutoCAD (.dxf, .dwf, .dwg), Geocode Types (.asc, .csv, .dbf, .txt, .mdb, .xls. .tab), DeLorme draw files (.an1), and DeLorme OpenSpace Transfer Files (.openspace) into a database that you can then query,
classify, symbolize, and label. The import process depends on the type of file you are importing (if the file contains spatial reference information, if it is a geocode file type, etc.). You can import a new layer, import a layer to append to an existing layer, or import a layer to replace an existing layer.
To Import a Layer from a File
Use the following steps to import a layer from a file.
- Click the GIS tab.
- Click the Workspace subtab if it is not selected.
- Click the Layers button, point to Import, and then click New Layer, Append Layer, or Replace Layer.
The Import Layer wizard opens.
OR

Click the Import Layers tool on the toolbar, and then click Import - New Layer, Import - Append Layer, or Import - Replace Layer.
-
If you are an XMap GIS Enterprise user, under Source, select File.
-
Under Data File, click the Browse button and browse to the file location you want to import. Once you find the file, double-click it or select it and then click Open.
The Layer text box is automatically completed with the default layer name (the file name portion of the file location or the name within the file) once you select the file you want to import. The file information, such as file name, location, file geometries, attribute fields, and coordinate boundaries, displays in the information area.
Notes
- To rename layers once the file is imported, right-click the layer in Workspace, click Rename, and then type a new name for the layer. Layer names need not be unique in the database.
-
If the layer you are importing contains many layers, select the layer you want to import from the Layer drop-down list. You can import only one layer at a time.
-
Optional. For a new layer, type a new name for the layer in the Name text box.
- From the Database drop-down list, select the database that you want to add the layer to. You can also select Other to attach a different database. If you are importing a new layer, you can select New if you want to create a new database.
- If you are appending or replacing a layer, select the destination layer from the Layer drop-down list.
- Click Next.
- If you are importing a layer that contains spatial reference information (coordinates, datum, and projection), a progress bar displays and the import process is complete. OR If you are importing a layer that does not contain spatial reference information and is not a Geocode File Type (.asc, .csv, .dbf, .txt, .mdb, .xls, .tab), go to the next step. OR If you are importing a Geocode File Type...
a. Verify how the data displays under Geocode Fields. If it does not display correctly, under Data Delimiter Type, select the option that separates your data into the appropriate columns. If your first row is not a header row, clear the First Row is Header check box.
b. Under Geocode Fields, click the header for each column and select the appropriate field option from the drop-down list.
c. Under Geocode By, select how you want to locate your field information (Street Address, ZIP Code, or Coordinates).
Note The available Geocode By options are based on which fields are assigned to the columns in step b.
d. Click Next. If you selected Street Address or ZIP Code as the Geocode By option in step c, the import process is complete. If you selected the Coordinates option in step c, click Next and go to the next step.
OR
If you are importing a layer that contains a relative coordinate system...
a. Select a transform from the Solution drop-down list. For more information about transforms, see Registering an Image). If you select Bilinear or Linear Conformal, you must also provide rotation and distance unit information.
b. Click the Select tool and place one point on the image and a corresponding point on the map.
OR
If you do not know the rotation or units of the imported file, click the Select tool and place two pairs of points on the image and the map. XMap automatically calculates the rotation and scale automatically when you place two pairs of points.
Notes
- If you want to delete a pair of points you have placed, highlight the point information in the Point list and click the delete button ✗.
- You cannot pan or zoom the map when the Select tool is enabled.
- When you place a point on the image, the coordinates for that point display in the ImageX and ImageY columns of the Point list; the coordinates are based on the coordinates in the imported image file. When you place a point on the map, the coordinates for that point display in the Latitude and Longitude columns.
- The X and Y values for the image update as your cursor moves over the image. Move your cursor over the image to view the X and Y coordinates for a point in the image for the image at a given point. You should be able to tell what the coordinate format of the image is by viewing the X and Y coordinates.
a. Optional. Use the Magnify drop-down list in the upper-left corner of the Image Window to magnify the image in the Image Window and zoom in on the map in the Map Window until the image and map are approximately the same viewing resolution.
Note Use the Magnify function and zoom in on the map to place more accurate points and more accurately register.
b. Optional. Click the Rotate Left tool to rotate the image left.
OR
Click the Rotate Right tool to rotate the image right.
c. Optional. If you want to change the color of the background of the image, select a color from the Background drop-down list.
d. Click Done.
The image and map are linked and display at the same scale.
Note Click Cancel at any time to cancel the import process.
- Under Datum Selection, select a coordinate format from the Coordinate drop-down list and then select the datum that applies to your imported file (WGS84, NAD83, or NAD27) from the Datum drop-down list.
| If you selected this coordinate system... | Perform this action... |
| Degrees (Lat/Lon) | Go to the next step. |
| UTM/UPS | Under UTM Parameters, enter the zone number and band letter in the boxes. |
| SPCS | Under SPCS Parameters, select the applicable zone and units from the drop-down lists. |
Note If you select a coordinate format that does not match the data in the file you are importing, the information area under Converted Boundaries displays, "Invalid Boundary Coordinates."
12. Click Finish.
Append and Replace Examples
This topics provides additional information about appending and replacing imported files. Go to Replace Examples.
Append
This import method is used to append, or merge, a new layer to an existing GIS layer. The new layer must be of the same geometry type as the existing layer, and attribute columns must have an exact name match in order to append to each other.
In addition, like-named attributes in the incoming layer must be of the same type family in order to append. The importer will be as tolerant as possible within a type family, allowing data to convert or widen. For example, a 100-character string column in the source layer will widen to match a 200-character string in the target layer, and vice versa.
The following list shows which attributes are compatible, and the direction of compatibility:
Boolean -> Byte -> Small Interger -> Interger -> Big Integer
String <-> URLs
String -> Memo
Float -> Double
Datetime
Document
Currency
Memo
Notes
- By definition, any attribute is automatically compatible with itself, and its precision, if applicable, can widen or narrow.
-
The master attribute and changes tables of the target layer are not emptied. The incoming data is written to the primary attributes table. The changes table has an entry written to it for each geometry that is added to the target layer.
-
Geocoded point layers can be appended only if all their attribute columns match AND the source layer is geocoded by the same procedure as the target layer (Address & Address, Zip Code & Zip Code, Lat/Lon & Lat Lon).
- Layers that are left unregistered during the import process and have not had any registration applied to them after import can only have other unregistered layers appended to them. This is possible for .dxf, .dwf, and .dwg files that have no spatial reference to the earth surface. However, once registration is applied to a layer, it cannot have other unregistered layers appended to it.
Append Example
Below are two examples of how an append operation would affect the primary attribute table. Any attribute columns present in the import but absent in the target layer will be added. Any columns absent in the import but present in the target layer will be left in place. All unpopulated records are given NULL values. The spatial effect of Append is the same as a copy/paste operation; abutting or overlapping geometries are not joined.
Example 1
SOURCE LAYER
| ID Name Type | |
| 1 Rt 1 Pavement | |
| 2 Deering Ave Pavement | |
| 3 Higgins Rd Dirt |
TARGET LAYER
| ID Name Type | |
| 4 Rt 46 Pavement | |
| 5 DeLorme Drive Pavement | |
| 6 Merrill Lane Dirt |
RESULT
| ID | Name Type | |
| 1 | Rt 1 Pavement | |
| 2 | Deering Ave Pavement | |
| 3 | Higgins Rd Dirt | |
| 4 | Rt 46 Pavement | |
| 5 | Delorme Drive Pavement | |
| 6 | Merrill Lane Dirt |
Example 2
SOURCE LAYER
| ID Name Type | |
| 1 Rt 1 Pavement | |
| 2 Deering Ave Pavement | |
| 3 Higgins Rd Dirt |
TARGET LAYER
| DFCC | FOO BAR | |
| 1566 1 | 1 | |
| 34 1 | ||
| 34 1 |
RESULT
| ID | Name | Type | DFCC | FOO | BAR |
| 1 | Rt 1 | Pavement | |||
| 2 | Deering Ave | Pavement | |||
| 3 | Higgins Rd | Dirt | |||
| 1566 | 1 | 1 | |||
| 34 | 1 | 1 | |||
| 34 | 1 | 1 |
OpenSpace Considerations
When appending OpenSpace layers, the following rules apply:
1) If the source layer has a column with a formula that differs from the formula of the same column in the target layer, the target layer's formula overwrites the source's layer's formula and is automatically applied to the entire layer.
2) Classifications are preserved in both the target layer and source layer. The target layer's active and default classifications are adopted in the resulting layer.
3) If the source layer and target layer have identically named Extended Attribute Sets that contain different attributes and join rules, the attribute sets are automatically unlinked from the source layer when appending occurs. The target layer maintains the link for its Extended Attribute Sets.
4) If the source layer has a different label structure than the target layer, the target layer's formula is adopted and automatically applied to the entire layer.
Replace
This import method is used to replace, or overwrite, an existing GIS layer with a new layer. The new layer must be of the same geometry type as the existing layer, and attribute columns must have an exact name match in order to append to each other.
In addition, like-named attributes in the incoming layer must be of the same type family in order to append. The importer will be as tolerant as possible within a type family, allowing
data to convert or widen. For example, a 100-character string column in the source layer will widen to match a 200-character string in the target layer, and vice versa.
The following list shows which attributes are compatible, and the direction of compatibility:
Boolean -> Byte -> Small Interger -> Interger -> Big Integer
String <-> URLs
String -> Memo
Float -> Double
Datetime
Document
Currency
Memo
Notes
- The master attribute and changes tables of the target layer are emptied. The extended attributes tables are not emptied, but they must be manually rejoined after the import process is completed. The changes table has an entry written to it indicating a replace operation occurred to ensure OpenSpace Synchronization still operates. The changes table has an entry written to it for each geometry that is added to the target layer.
- By definition, any attribute is automatically compatible with itself, and its precision, if applicable, can widen or narrow.
- The same conditions that exist for Append for Geocoded point layers and unregistered .dxf, etc layers also exist for Replace.
Replace Examples
Below are two examples of how a replace operation would affect the primary attribute table. Any attribute columns present in the import but absent in the target layer will be added. Unpopulated records are given NULL values. Any columns absent in the import but present in the target layer will be left in place, the data will be erased and populated with NULL values. The spatial effect of Replace is the same as deleting all geometries in the target layer and pasting in all geometries from the source layer.
Example 1
SOURCE LAYER
| ID | Name Type | |
| 1 | Rt 1 Pavement | |
| 2 | Deering Ave Pavement | |
| 3 | Higgins Rd Dirt |
TARGET LAYER
| ID | Name Type | |
| 4 | Rt 46 Pavement | |
| 5 | DeLorme Drive Pavement | |
| 6 | Merrill Lane Dirt |
RESULT
| ID Name Type | |
| 1 Rt 1 Pavement | |
| 2 Deering Ave Pavement | |
| 3 Higgins Rd Dirt |
Example 2
SOURCE LAYER
| ID | Name Type | |
| 1 | Rt 1 Pavement | |
| 2 | Deering Ave Pavement | |
| 3 | Higgins Rd Dirt |
TARGET LAYER
| DFCC | FOO BAR | |
| 1566 1 | 1 | |
| 34 1 | ||
| 34 1 |
RESULT
| ID | Name | Type | DFCC | FOO | BAR |
| 1 | Rt 1 | Pavement | |||
| 2 | Deering Ave | Pavement | |||
| 3 | Higgins Rd | Dirt |
OpenSpace Considerations
When appending OpenSpace layers, the following rules apply:
1) If the source layer has a column with a formula that differs from the formula of the same column in the target layer, the target layer's formula overwrites the source's layer's formula and is automatically applied to the entire layer.
2) Classifications are preserved in both the target layer and source layer. The target layer's active and default classifications are adopted in the resulting layer.
3) If the source layer and target layer have identically named Extended Attribute Sets that contain different attributes and join rules, the attribute sets are automatically unlinked from the target layer when replace occurs. The source layer maintains the link for its Extended Attribute Sets, and the new result layer adopts it.
4) If the source layer has a different label structure than the target layer, the target layer's formula is adopted and automatically applied to the entire layer.
3) If the source layer and target layer have identically named Extended Attribute Sets that contain different attributes and join rules, the attribute sets are automatically unlinked from the target layer when replace occurs. The source layer maintains the link for its Extended Attribute Sets, and the new result layer adopts it.
Creating a New Layer

This Help topic describes features that are available in XMap GIS Editor and XMap GIS Enterprise.
You can create new layers by:
- Creating an empty layer
- Duplicating a layer
- Creating a layer from geometry selections on the map
- Creating a layer from query results
To Create an Empty Layer
Use the following steps to create an empty layer.
- Click the GIS tab.
- Click the Workspace subtab if it is not selected.
- Click the Layers button, point to Create, and then click Empty Layer. The Create Empty Layer dialog box opens.
- Select the layer type: Point, Line, or Polygon.
- From the Shape drop-down list, select the shape for the layer type.
- In the Name text box, type a name for the layer.
- From the Target Database drop-down list, select the database where you want to store the new layer. If the database is not listed, select Other from the drop-down list and attach the existing database. If you want to create a new database, select New.
- Click OK.
To Duplicate a Layer
This option is available only for the selected layer in the workspace.
Use the following steps to duplicate a layer.
- Click the GIS tab.
- Click the Workspace subtab if it is not selected.
- In the Workspace table, click the layer that you want to duplicate.
- Click the Layers button, point to Create, and then click Copy Layer. The Create Copy of Layer dialog box opens.
- From the Source Layer drop-down list, select the layer you want to copy. The layer you selected in step 3 displays in the Layer Name text box. To change the layer name, type a new name in the box.
- From the Target Database drop-down list, select the database where you want to store the new layer. If the database is not listed, select Other from the drop-down list and attach the existing database. If you want to create a new database, select New.
- Click OK.
To Create a New Layer From Current Geometry Selections
This option is activated when geometries in the selected layer in the workspace have been selected with a GIS tool or within the Attributes Datasheet View. Only one layer can have active selections at a time.
Use the following steps to create a new layer from current geometry selections.
- Click the GIS tab.
- Click the Workspace subtab if it is not selected.
- Click the Layers button, point to Create, and then click Layer from Selection. The Create Layer from Selection dialog box opens.
-
To change the layer name, type a new name in the Name text box.
-
From the Target Database drop-down list, select the database where you want to store the new layer. If the database is not listed, select Other from the drop-down list and attach the existing database. If you want to create a new database, select New.
-
Click OK.
To Create a New Layer From Query Results
This option is available only when there is an active query for the selected layer in the workspace.
Use the following steps to create a new layer using query results.
- Click the GIS tab.
- Click the Workspace subtab if it is not selected.
- Click the Layers button, point to Create, and then click Layer from Query Results.
The Create Layer from Query Results dialog box opens. The name of the active query displays in the Active Query text box and the number of query results display. Note To change the active query, click Cancel to exit the Layer from Query Results dialog, click the Query subtab, and select the query you want to make active from the Query drop-down list. To proceed, repeat steps 2–4.
-
To change the layer name, type a new name in the Name text box.
-
From the Target Database drop-down list, select the database where you want to store the new layer. If the database is not listed, select Other from the drop-down list and attach the existing database. If you want to create a new database, select New.
-
Click OK.
Viewing Layer Information in the Workspace

This Help topic describes features that are available in XMap Professional, XMap GIS Editor, and XMap GIS Enterprise.
The Workspace subtab displays all of the GIS layers in your project; you can view the following information:
- The layer name (right-click and then click Rename to edit; double-click to center the map on the layer)
• The layer ID (LayerID)
• The database in which the layer is stored
• The server on which the database resides
• The date on which the layer was last updated
• The date on which the layer was created
• The Z-level (display order) of the layer
- The map on which the layer displays; primary, secondary, or both (double-click to edit)
• The layer type (point, line, or polygon)
- The minimum data zoom level at which that layer displays on the map (double-click to edit)
- The maximum data zoom level at which the layer displays on the map (double-click to edit)
- The geometry shape (spherical, planar, topological (line layers only), geocode, unregistered, or redline)
- The database version used for the layer (408 represents an XMap 7/XMap 8 database; 401 represents an XMap 6 database; 400 represents an XMap 5 database)
• The user's role for the database
• The number of geometries in the layer
- The active classification for the layer (double-click to edit the classification)—available only when a classification has been created for the layer
If any of the columns do not display, right-click the table heading in the Workspace subtab and click the column name you want to view. To show/hide a column from the table, right-click the table heading and click the column name you want to show/hide. You can also right-click the table heading and click Show All Columns to view all of the available columns.
Note To sort columns, click the column header, drag it to the new position, and drop it. The sort order is saved in your project file.
Adding and Removing Layers In Your Workspace

This Help topic describes features that are available in XMap Professional, XMap GIS Editor, and XMap GIS Enterprise.
You can use the Manage Layers function to change the set of layers currently listed in your workspace. Click the Remove Database Connection button in the Manage Layers dialog box to deactivate the selected source database.
To Add a Layer to Your Workspace
Use the following steps to add a layer to your workspace. If you want added layers to automatically display on the map once they are added, select the Show layers added from Manage Layers on map check box on the GIS > Layer tab in the Options dialog box.
- Click the GIS tab.
- Click the Workspace subtab if it is not selected.
- Click the Layers button, and then click Manage. The Manage Layers dialog box opens. OR

Click the Manage Layers button on the toolbar.
The Manage Layers dialog box opens.
-
From the Source Database drop-down list, select the database that contains the layer(s) you want to add to your workspace or select Other to attach a new database to add layers to.
The available layers for that database display under Layers in the Database. -
Under Layers in the Database, click the layer that you want to add to your workspace and then click the Add button.
The layer displays in the Layers in the Workspace list. OR
Under Layers in the Database, double-click the layer that you want to add to your workspace.
The layer displays in the Layers in the Workspace list.
Note You can also click the Add All button >> to add all of the layers in the database to your workspace.
- Click OK.
To Remove a Layer From Your Workspace
This process removes the layer from the workspace, but does not remove it from the database. For information on removing a layer from a database, see Deleting a Layer. Use the following steps to remove a layer from your workspace.
- Click the GIS tab.
- Click the Workspace subtab if it is not selected.
- Click the Layers button, and then click Manage.
The Manage Layers dialog box opens. OR

Click the Manage Layers button on the toolbar. The Manage Layers dialog box opens.
-
From the Source Database drop-down list, select the database that contains the workspace you want to remove or select Other to attach a new database you want to modify.
The available layers for that database display under Layers in the Database and the layers in the workspace display under Layers in the Workspace. -
Under Layers in the Workspace, click the layer in the workspace that you want to remove and then click the Remove button.
The layer displays in the Layers in the Database list. OR
Under Layers in the Workspace, double-click the layer in the workspace that you want to remove.
The layer displays in the Layers in the Database list.
Note You can also click the Remove All button to remove all of the layers in the workspace.
- Click OK.
Note You can also remove a layer from the database by highlighting the layer(s) in the workspace table, clicking the Layers button, and then clicking Remove. Or, just right-click the highlighted layers that you want to remove and click Remove.
Viewing a Layer on the Map

This Help topic describes features that are available in XMap Professional, XMap GIS Editor, and XMap GIS Enterprise.
You can view several layers on the map at once.
To View a Layer on the Map
Use the following steps to view a single layer or multiple layers on the map.
- Click the GIS tab.
- Click the Workspace subtab if it is not selected.
- Optional. Add layers to your workspace.
-
To view a layer on the map, ensure the check box next to each layer you want to display is selected.
OR
To view multiple layers on the map, hold the CTRL key on your keyboard while you click each of the layers you want to display. Then, click the Layers button and click the Check Selected option. -
To determine which map (primary, secondary, or both) in which to view the layer, double-click the Map column for the layer you want to view. Then, select Both, Primary, or Secondary.
Note If you want to hide multiple layers on the map, hold the CTRL key on your keyboard while you click each of the layers you want to hide, or hold the SHIFT. Then, click the Layers button and click the Clear Selected option.
Viewing a Legend for all Visible Layers

This Help topic describes features that are available in XMap Professional, XMap GIS Editor, and XMap GIS Enterprise.
Use the Legend feature to view a legend for all of the visible layers in your workspace. The legend title is the name of the layer's active classification, which is set to match the layer name by default. Use the Symbolize dialog box to modify the Legend Class labels.
To View the Legend
Use the following steps to view the legend for all visible layers.
- Click the GIS tab.
- Click the Workspace tab if it is not selected.
- Select the check box next to each layer you want to make visible in the legend. Note To select multiple layers, hold the CTRL or SHIFT keys on your keyboard while you click each of the layers you want to include in the legend. Then, click the Layers button and click Check Selected.
-
Click Tools and then click Legend to view the legend information. OR
Right-click the layer(s) for which you want to view legend information and click Legend. -
Click the Close button ✗ in the upper-right corner of the legend to close the Legend window.
Deleting a Layer

This Help topic describes features that are available in XMap Professional, XMap GIS Editor, and XMap GIS Enterprise.
When you delete a layer, it is permanently removed from the database.
To Delete a Layer
Use the following steps to delete a layer in a database.
- Click the GIS tab.
-
Click the Workspace subtab if it is not selected.
-
In the table, click the layer you want to delete. To select multiple layers for deletion, hold the CTRL or SHIFT keys on your keyboard while you click each layer you want to delete.
-
Right-click the layer(s) in the list and click Delete. A confirmation message displays. OR Click the Layers button and then click Delete. A confirmation message displays.
-
Click Yes to delete the layer(s) from the database.
Note You can also delete layers from a database using the Manage Layers dialog box. Click
the Manage Layers tool 📄 on the toolbar; under Layers in the Database, click the layers you want to delete; and then click the Delete button ✗.
Exporting a Layer

This Help topic describes features that are available in XMap GIS Editor and XMap GIS Enterprise.
Once you edit your layer, you may want to export the layer to another program. DeLorme OpenSpace transfer files contain all of your GIS data, including classification, symbolization, attributes, query information, etc. (shapefiles do not). If you have an active query against the layer you are exporting, you can choose to export the results of the query only. You can also control which attribute fields are exported by turning them on/off in the Attributes Design View.
Note Not all attribute field data types are supported in all of the export file types (for example, .shp, .txt).
Supported File Types
• AutoCAD Data Exchange file (.dxf)
• AutoCAD Draw file (.dwg)
• DeLorme XMap Transfer file (.openspace)
- ESRI Shapefile (.shp)
- GPX file (.gpx)
- OGC KML file (.kml)
• Text files (.txt) - point layers
To Export a Layer
Use the following steps to export a layer.
- Click the GIS tab.
- Click the Workspace subtab if it is not selected.
- Highlight the layer you want to export in the workspace table.
- Edit the layer as needed, by changing the attributes, classifying, symbolizing, querying, etc.
- Click the Layers button and then click Export.
The Export Layer dialog box opens.
- Browse to the location where you want to save the exported file, type the file name in the File Name text box, and, from the Save as Type drop-down list, select the file type.
Note If you choose .shp as the type, a .prj file that stores all of the project information for the layer is created.
- If you want to export only the active query results, select the Export Results of Active Query check box.
- Click Save.
Previewing a Layer in Handheld Export

This Help topic describes features that are available in XMap Professional, XMap GIS Editor, and XMap GIS Enterprise.
You can preview a layer you want to export to an Earthmate PN-Series GPS device in the Handheld Export tab.
To Preview a Layer in the Handheld Export Tab
Use the following steps to preview a layer for export.
- Click the GIS tab.
- Click the Workspace subtab if it is not selected.
- Click the layer to preview.
- Click Tools and then click Preview in Handheld OR right-click the layer in the workspace table and click Preview in Handheld.
The Handheld Export tab opens and map area for the layer is highlighted.
You can create a map package to send GIS layers to your device; see Adding GIS Layers to a Map Package for more information.
From the Tools menu or the toolbar, you can also export or import a point layer to a PN-Series device.
Refreshing Your Database Connection

This Help topic describes features that are available in XMap Professional, XMap GIS Editor, and XMap GIS Enterprise.
XMap has a Refresh View option that refreshes the data connections for each selected layer in the workspace, getting the latest updates from the server. This is especially helpful when multiple users are accessing the same layers in a database.
To Refresh Your Database Connection
Use the following steps to refresh your database connections and get the latest update from the server.
- Click the GIS tab.
- Click the Workspace subtab if it is not selected.
- Click the Layers button and then click Refresh View.
OR
Right-click in the workspace table and click Refresh View.
Modifying the Properties of a Layer

This Help topic describes features that are available in XMap Professional, XMap GIS Editor, and XMap GIS Enterprise.
Use the Layer Properties dialog box to modify a layer's name, minimum and maximum data zoom levels, geometry shape, layering level and more.
To Modify the Properties of a Layer
Use the following steps to modify the properties of a layer.
- Click the GIS tab.
- Click the Workspace subtab if it is not selected.
- Click the layer for which you want to view/modify the properties.
-
Right-click the selected layer and then click Properties.
The Layer Properties dialog box opens.
OR
Click the Tools button and then click Properties.
The Layer Properties dialog box opens. -
To change the layer's name, type a new name in the Layer Name text box.
Tip You can also change a layer's name in the workspace table by clicking the layer name twice. Be sure to click the layer name twice instead of double-clicking; double-clicking centers the map on the layer and does not activate the layer name cell for editing.
- To change the geometry shape of the layer, select an option from the Geometry Shape drop-down list.
- Planar (default)
This geometry shape is best for medium or large-scale mapping and is a simpler, and subsequently faster when performing spatial analysis, way of storing spatial data. It does not take the curvature of the earth into account, so line and polygon geometries that span long distances do not appear curved on the map.
- Spherical
This geometry shape is best for large-scale mapping and is more complex than Planar. As a result, spatial analysis operations may take more time. It does take the curvature of the earth into account, so line and polygon geometries that span long distances appear curved on the map.
Note Changing a layer to or from the Spherical Geometry type may lock up the database while you perform the operation.
• Unregistered (.dxf, .dwg, and .dwf layers only)
This geometry shape is used for imported layers (dxf, .dwg, .dwf) that have no spatial reference on the Earth. Until these layers are registered with the
Register tool, you cannot perform spatial analysis. Once registration is completed for a layer, it is automatically assigned the Planar type.
- Geocode (geocoded layers only)
This geometry shape is used for geocoded point layers and has special attribute properties. When you edit the attributes of a geometry by which the layer was geocoded, the spatial location of that geometry is repositioned accordingly.
• Redline (redline layers only)
This geometry shape is used for the GIS Redline layer automatically produced in Enterprise databases. GIS Redline layers are special layers that are the repositories of all redlines produced by the redlining/sync process as part of an Enterprise database subscription. The Redline geometry shape is stored as a Planar type.
If the layer is a point layer, Planar is the only Geometry Shape option available unless the point layer was geocoded and then the option is Geocode Points. If the layer is a polygon layer, the Geometry Shape options are Planar and Spherical. If the layer is a line layer, the Geometry Shape options are Planar and Spherical. If the layer is a redline layer, Redline is the only Geometry Shape available.
Note The Geometry Shape option is disabled when there are uncommitted edits against the layer.
-
To change the minimum and maximum zoom levels at which the layers display on the map, select the zoom levels from the Min. Zoom Level and Max. Zoom Level drop-down lists.
-
To change on which map the layer is viewed (primary, secondary, or both), select the option from the Map drop-down list.
-
To change the layering level, click inside the Layering Level text box and edit the value. For more information, see Reordering Layers.
-
If you want to show labels related to the layer, select the Labels check box.
-
Click OK.
Creating a Buffer Around a Geometry

This Help topic describes features that are available in XMap GIS Editor and XMap GIS Enterprise.
Use the Buffer feature in XMap to create a buffer around a geometry based on a specific distance. This tool is helpful in GIS spatial analysis when proximity issues are of concern, such as site planning or risk assessment.
To Create a Buffer
Use the following steps to create a buffer around a geometry.
- Click the GIS tab.
-
Click the Workspace subtab if it is not selected.
-
Click Tools and then click Buffer. The Buffer Layer dialog box opens.
-
From the Source Layer drop-down list, select the layer for which you want to create a buffer (the list displays only layers in the workspace).
-
Select the Source Geometries option:
- All-Build buffers around all geometries in the source layer.
- Selected–Build buffers around selected geometries in the source layer. Make selections with the GIS tools on the toolbar or select attribute records within the Attributes subtab.
Note This option is grayed out when there are no selections in the source layer.
- Query Results—Build buffers around geometries in the source layer that are contained within the results of the active query.
Note This option is grayed out when there is no active query in the source layer.
-
Under Output Location, select New Layer or Existing Layer.
-
If you selected the New Layer option in step 5, type the name of the new layer in the Layer Name text box. Then, select the database for the new layer from the Target Database drop-down list or select Other to attach a new database.
OR
If you selected the Existing Layer option in step 5, from the Layer Name drop-down list, select an existing polygon layer in your workspace.
-
Type the buffer distance in the Distance text box. For point and line layers, this number must be greater than zero. For polygon layers, the number can be positive, negative, or zero.
-
Select the distance measurement (feet, meters, miles, kilometers, nautical miles) from the drop-down list.
-
Select the Merge Overlapping Buffer Regions check box if you want to convert buffer polygons that overlap each other into one continuous polygon.
OR
Clear the Merge Overlapping Buffer Regions check box if you want to retain the individual buffer polygons even when the buffers overlap.
- Click OK.
Adding Geometries to a Layer

This Help topic describes features that are available in XMap GIS Editor and XMap GIS Enterprise.
Use the toolbar to edit existing GIS data or build GIS data in an empty/existing layer.
To Add Geometries to a Layer
Use the following steps to add geometries (points, lines, or polygons) to a layer.
-
From the Active Layer drop-down list on the toolbar, select the layer you want to edit.
-
To add points to a point layer, click the Draw Point tool on the toolbar and then click the location on the map where you want to place the points.
OR
To add lines to a line layer, click the Draw Line tool on the toolbar and then click the map to designate the start and end points of each line segment you want to add, or drag the cursor to create a freehand line. To finish the line, double-click the last point of the line.
If the layer to which you are adding lines to is a topological line layer, the start and end nodes are annotated with the following symbols:

Used for a start or end node of a line that has connections with three or more nodes (for example, a four-way intersection). The number on the symbol indicates the number of connections at that node.

Used for a start or end node of a line that has connections with two other nodes (for example, a three-way intersection).

Used for a start or end node of a line that has connections with one other node (for example, a two-way intersection).

Used for the start or end node of a line that has no connections with other nodes (for example, a dead end).

A node and a shape point are coincident.
OR

To add polygons to a polygon layer, click the Draw Polygon tool on the toolbar and then click the map to enter each point of the polygon. To finish the polygon, double-click the last point of the polygon.
Notes
• To return to the default map mode, click the Navigation tool on the toolbar.
- While adding polygon or line geometries, you can disable snapping by holding the ALT key on your keyboard. To enable the measurement information box, which can display on the map when adding geometries, hold the SHIFT key while you draw.
- To undo your last action, click the Undo button on the toolbar. To redo your last action, click the Redo button.
- To save all of the changes you make to a layer, click the Manual Commit Mode tool. If you do not want to be prompted to save your changes each time you switch the Active Layer or when you work outside of the tab, click the down arrow next to
the commit changes tool and select the Automatic Commit Mode tool to automatically commit your changes.
Editing Points in a Polygon/ Line Layer

This Help topic describes features that are available in XMap GIS Editor and XMap GIS Enterprise.
Use the Edit Points button 📄 on the toolbar to edit existing GIS data or build GIS data in an empty/existing layer.
To Edit Points in a Polygon/ Line Layer
Use the following steps to edit shape points in a polygon/line layer.
- From the Active Layer drop-down list on the toolbar, select the polygon/line layer you want to edit.

- Click the Edit Points tool 📄 on the toolbar and select a geometry. The shape points in the geometry display as white squares outlined in black. If you edit a line or polygon layer, the start and end nodes are annotated with the following symbols:

Used when the edited shape point is being snapped to the start node of a polygon geometry or the end node of a line geometry.

Used when the edited shape point is being snapped to the shape point of another geometry.

Used when the edited shape point is being snapped to the edge of another geometry when there are no shape points.
If you edit a topological line layer, the start and end nodes of the lines in the layer are annotated with the following symbols:

Used for a start or end node of a line that has connections with three or more nodes (for example, a four-way intersection). The number on the symbol indicates the number of connections at that node.

Used for a start or end node of a line that has connections with two other nodes (for example, a three-way intersection).

Used for a start or end node of a line that has connections with one other node (for example, a two-way intersection).

Used for the start or end node of a line that has no connections with other nodes (for example, a dead end).

A node and a shape point are coincident.
-
Move your cursor over the shape point you want to edit.
-
Drag the point you want to edit to the new position.
To Delete Points in a Polygon/ Line Layer
- From the Active Layer drop-down list on the toolbar, select the polygon/line layer you want to edit.

-
Click the Edit Points tool on the toolbar and select a geometry. The shape points in the geometry display as white squares outlined in black.
-
Click each shape point or drag and select multiple shape points. The selected points have pink highlighted lined around them.
-
Press the DELETE key on your keyboard or right-click the selection and click Delete Point.
Notes

- When you click the Edit Points tool on the toolbar, the default map mode, which provides several right-click features when you click the map, is disabled on the map area (primary, secondary, or both) where the layer is displayed. To return to
the default map mode, click the Navigation tool

on the toolbar.
- To undo your last action, click the Undo button on the toolbar. To redo your last action, click the Redo button.
- To save all of the changes you make to a layer, click the Manual Commit Mode tool. If you do not want to be prompted to save your changes each time you switch the Active Layer or when you work outside of the tab, click the down arrow next to
the commit changes tool and select the Automatic Commit Mode tool to automatically commit your changes.
- Many right-click options are available when editing topological lines, including:
- Deleting points
- Joining/splitting lines
- Breaking the selected node—breaks the selected node from the nodes it is connected to but keeps the other nodes connected
- Breaking multiple nodes—breaks all nodes away from each other at the selected point of connection
- Extending a line
- Deleting an object
Matching Edges for Polygons/ Lines

This Help topic describes features that are available in XMap GIS Editor and XMap GIS Enterprise.
Use the Edge Matching tool on the toolbar to match shape points in a polygon/line to those in another polygon/line.
To Match Edges
Use the following steps to match the edges of a polygon or line to another polygon or line by matching two anchor points on one object with two anchor points on another object.
- From the Active Layer drop-down list on the toolbar, select the layer you want to edit.
- Click the Edge Matching tool on the toolbar.
- Move your cursor over the object (polygon or line) on the map. A box displays around each object as you hover over it—and click the object you want to edit. Shape points (small white squares) indicate the edges of the object.
- Click the first point you want for an anchor point. A pink box appears around each anchor point once it is selected.
- Click the second anchor point.
- Click the object you want to match to select it.
- Click the point on the second object to create an anchor point to match with the first anchor point on the first object.
If you need to reverse the anchor point selection order on the first object, right-click it and click Switch Anchor Points.
XMap User Guide
- Move the cursor over the point on the second object that you want to match with the second anchor point on the first object. The edge that will be matched is highlighted blue. If you create a self-intersecting shape, the edge is highlighted pink.
- Click the second anchor point on the second object. The edges on the two objects are matched.
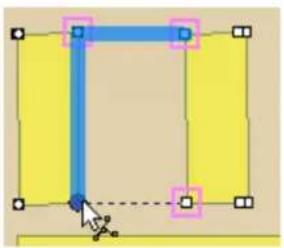
natural_image
Pure geometric diagram with colored rectangles and a cursor pointer, no text or symbols presentHovering over second anchor point on second object (step 8)
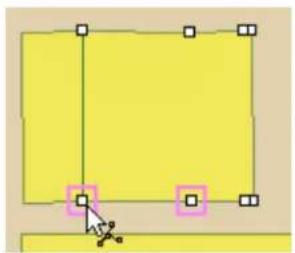
natural_image
Simple geometric diagram with a yellow rectangle and selection handles, no text or symbols presentMatching second anchor point (step 9)
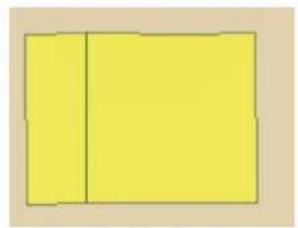
natural_image
Simple geometric shape with two yellow rectangles and a vertical line dividing it (no text or symbols)Two polygons with matched edges
Notes
• To return to the default map mode, click the Navigation tool on the toolbar.
- To undo your last action, click the Undo button on the toolbar. To redo your last action, click the Redo button.
- To save all of the changes you make to a layer, click the Manual Commit Mode tool. If you do not want to be prompted to save your changes each time you switch the Active Layer or when you work outside of the tab, click the down arrow next to
the commit changes tool and select the Automatic Commit Mode tool to automatically commit your changes.
Moving or Changing the Scale of a Geometry

This Help topic describes features that are available in XMap GIS Editor and XMap GIS Enterprise.
Use the Edit tool on the toolbar to edit existing GIS data or build GIS data in an empty/existing layer.
To Move a Geometry
Use the following steps to move a geometry.
- From the Active Layer drop-down list on the toolbar, select the layer you want to edit.
-
Click the Edit tool on the toolbar.
-
Move your cursor over the geometry (a gray box displays over each object as you hover it) and click the object you want to edit. Small white squares indicate the edges and corners of the object.
Note To move multiple geometries, drag your cursor to encompass all of the geometries you want to move. Then, position your cursor over one of the geometries and move it in the direction you want to move all geometries.
- Drag the object to the new location.
To Change the Scale of a Geometry
Use the following steps to change the scale of a geometry.
- From the Active Layer drop-down list on the toolbar, select the layer you want to edit.

-
Click the Edit tool on the toolbar.
-
Move your cursor over the geometry (a gray box displays over each object as you hover it) and click the object you want to edit. Small white squares indicate the edges and corners of the object.
-
Drag any of the small white squares to achieve the size and proportion you want.
Notes
- To return to the default map mode, click the Navigation tool on the toolbar.
- To undo your last action, click the Undo button on the toolbar. To redo your last action, click the Redo button.
- To save all of the changes you make to a layer, click the Manual Commit Mode tool. If you do not want to be prompted to save your changes each time you switch the Active Layer or when you work outside of the tab, click the down arrow next to
the commit changes tool and select the Automatic Commit Mode tool to automatically commit your changes. - Hold the SHIFT key on your keyboard to add/remove an object to/from a multi-selection.
Rotating a Geometry

This Help topic describes features that are available in XMap GIS Editor and XMap GIS Enterprise.
Use the Rotate tool on the toolbar to edit existing GIS data or build GIS data in an empty/existing layer.
To Rotate a Geometry
Use the following steps to rotate a geometry.
- From the Active Layer drop-down list on the toolbar, select the layer you want to edit.

- Click the Rotate tool on the toolbar.
- Click the geometry on the map that you want to rotate.
- Position your cursor over one of the green circles and drag the object until it has reached the new position.
Note Geometries are rotated based on the geographic center point of the object, which may produce confusing results.
Notes
• To return to the default map mode, click the Navigation tool on the toolbar.
- To undo your last action, click the Undo button on the toolbar. To redo your last action, click the Redo button.
- To save all of the changes you make to a layer, click the Manual Commit Mode tool. If you do not want to be prompted to save your changes each time you switch the Active Layer or when you work outside of the tab, click the down arrow next to
the commit changes tool and select the Automatic Commit Mode tool to automatically commit your changes.
• The rotate tool is not available for topological line layers.

Deleting a Geometry

This Help topic describes features that are available in XMap GIS Editor and XMap GIS Enterprise.
Use the Edit tool on the toolbar to delete geometries on the map.
To Delete a Geometry
Use the following steps to delete a geometry.
- From the Active Layer drop-down list on the toolbar, select the layer you want to edit.
- Click the Edit tool on the toolbar
- On the map, click the geometry you want to delete.
- Right-click the geometry and click Delete Object. OR
Press the DELETE key on your keyboard.
Notes
- To return to the default map mode, click the Navigation tool on the toolbar.
• To undo your last action, click the Undo button on the toolbar. To redo your last
action, click the Redo button

• To save all of the changes you make to a layer, click the Manual Commit Mode tool

If you do not want to be prompted to save your changes each time you switch the Active Layer or when you work outside of the tab, click the down arrow next to
the commit changes tool and select the Automatic Commit Mode tool to automatically commit your changes.

Making COGO Edits

This Help topic describes features that are available in XMap GIS Editor and XMap GIS Enterprise.
COGO editing (coordinate geometry editing) is used for precision data creation or editing. Points, lines, or polygons can be built, edited, or centered by coordinates, angle/distance measurements, or bearing/distance measurements.
COGO editing is useful when you know the exact location of points or the shape points of the line or polygon geometries you would like to create or edit. It is also helpful when you know the exact location of the points, lines, or polygons on which you want to center.
To Make COGO Edits
Use the following steps to use the COGO dialog box.
-
Select the layer you want to edit from the Active Layer drop-down list on the toolbar.
-
Click the COGO tool

The COGO Editing dialog box opens.
- If you want to place your point/line/polygon by coordinate, click the Coordinates tab. The information that is required in this tab varies depending on the coordinate system chosen in the Display settings in the Options dialog box.
OR
If you want to place your point/line/polygon by angle and distance measurements, click the Angle tab. The angle information is based on the angle from the last point that was placed. The distance information is the distance from the last point that was placed.
OR
If you want to place your point/line/polygon by bearing and distance measurements, click the Bearing tab. The bearing information is not related to the last point, rather fixed angular measurements.
- Select the Pan to Points check box if you want the map to center on each COGO placement you make in the next step.
OR
Clear the Pan to Points check box if you do not want the map to center on the COGO points.
- For point layers, type the coordinates/angle/bearing of the point in the applicable text boxes and then click Apply. Repeat this step for each point that you want to place.
OR
For line layers, type the coordinates/angle/bearing for the first point in the line in the applicable text boxes and then click Apply. Repeat this step for each line segment that you want to place.
OR
For polygon layers, type the coordinates/angle/bearing of a corner of the polygon in the applicable text boxes and then click Apply. Repeat this step for each corner of the polygon that you want to place.
-
Click Finish to close the COGO point/line/polygon.
-
Click the Close button ✗ in the upper-right corner of the COGO Editing dialog box to close the dialog box.
Note
You can also center single/multiple geometries with the COGO tool.
-
From the Active Layer drop-down list on the toolbar, select the layer you want to edit.
-
Click the Edit tool 🧑️ on the toolbar and then, on the map, click the geometry (or geometries) that you want to center.
-
Click the COGO tool on the toolbar. The COGO Editing dialog box opens.
-
Adjust the coordinates/angle/bearing values to center the geometries at that location.
Copying/ Cutting and Pasting Geometries

This Help topic describes features that are available in XMap GIS Editor and XMap GIS Enterprise.
You can copy/cut and paste geometries in a layer or between layers.
To Copy/ Cut and Paste Geometries
Use the following steps to copy/cut and paste geometries in a layer or between layers.
-
From the Active Layer drop-down list on the toolbar, select the layer that includes the geometry (or geometries) you want to copy.
-
Click the Edit tool on the toolbar
-
On the map, right-click the geometry that you want to copy/cut.
-
To copy the geometry, click Copy. OR To cut the geometry from the layer, click Cut. Note To select multiple geometries to copy at the same time, press the SHIFT key on your keyboard while you click each geometry.
-
To paste the geometry in the current layer, right-click the location on the map where you want to paste the geometry and click Paste. OR
To paste the geometry in a different layer, ensure the layer is in your workspace (and selected to be shown on the map) and then select a different layer from the Active Layer drop-down list on the toolbar. Right-click the map and click Paste.
The geometry is placed in the same location where it was in the original layer. To move the geometry to a different location, see Moving or Changing the Scale of a Geometry.
Classifying, Symbolizing, and Labeling a Layer
Classifying
Classifying a Layer

This Help topic describes features that are available in XMap GIS Editor and XMap GIS Enterprise.
You can classify a layer based on one of the following three options:
- Unique Value—When you classify a layer in a database with a unique value, each attribute with fewer than 100 values displays differently on the map.
- Range–When you classify a layer with a range, the data in the layer can be grouped, given color (or size) characteristics, and labeled so that it can be visually analyzed.
- Single Value—When you classify a layer in a database with a single value, you make all the records look the same on the map. For example, they all have the same fill color on the map.
Classifying a Layer with a Unique Value

This Help topic describes features that are available in XMap GIS Editor and XMap GIS Enterprise.
When you classify a layer in a database with a unique value, each attribute with fewer than 100 values that you classified is put into its own class and displays differently on the map.
If you classify a layer with a unique value on a float/double column, undesirable results may occur due to precision limitations. Try classifying the layer with a range instead.
If you are classifying a layer for use with a PN-compatible form, see the PN-Compatible Forms Help topic for more information.
To Classify a Layer with a Unique Value
Use the following steps to classify a layer with a unique value.
- Click the GIS tab.
- Click the Workspace subtab if it is not selected.
- Click the layer you want to classify.
-
Click the Tools button and then click Classify.
The Classify Layer dialog box opens. OR
Right-click the layer and click Classify. The Classify Layer dialog box opens. -
To edit/view an existing classification for the selected layer, select it from the Classification drop-down list. OR
To create a new classification for the selected layer, click the Manage button and then click New.
- From the Type drop-down list, select Unique Value.
- From the Field drop-down list, select the field in your layer that you want to classify. Note for small layers Only fields containing fewer than 100 unique values display in the Field drop-down list. The options in the Field list are based on the visible attributes in the Design View of the Attributes subtab. When you select Unique Value as the classification method, all visible numbers and strings are available in the Field drop-down list.
- If you selected a numeric field in step 7, select the field by which you want to divide the field in step 6 from the Normalize By drop-down list.
Note When you select a field to normalize by, classes are created based on the ratio of data in the first field to the second field for each attribute record.
- If you selected a numeric field in step 7, select the decimal place to which you want to round your value from the Round At drop-down list.
- From the Vary By drop-down list, select how you want to vary your value.
Note The Custom option allows you to customize classifications that do not follow a set scheme or pattern. If you change the symbolization of a class in an existing classification, the Vary By option automatically changes to Custom and any new classes that you add to the classification are assigned the default symbology for that layer's geometry type; for example, green in color.
-
If you selected Fill Color in step 10, select a color scheme from the Scheme dropdown list.
-
Sequential—Displays a color that progresses from low to high (or high to low) in color value.
- Qualitative–Displays colors that vary in color hue to represent different legend classes.
- Diverging—Puts equal emphasis on mid-range critical values and extremes at both ends of the data range.
Then, select a color pattern from the Pattern drop-down list.

- Optional. Click the Reverse Order button to reverse the style for how your classes are varied.

- Optional. To edit an existing classification, click the Recalculate button to recalculate the classification.

-
Optional. To add a class to your classification, click the Add Class button Double-click in the Value and/or Legend Label fields to edit the values.
-
Optional. To remove a class from your classification, click the Remove Class button

- Click OK.
Note Once you create a unique value classification, you can use the classification menu on the toolbar to edit the classification of a selection on the map. The classification tool on the toolbar is available only for active layers with a unique value classification and only after you click either the edit points tool, the edit tool, or the draw tool and select a geometry.
Classifying a Layer with a Range

This Help topic describes features that are available in XMap GIS Editor and XMap GIS Enterprise.
When you classify a layer with a range, the data in the layer is clustered into classes based on a statistical algorithm and each class is varied by color or size) characteristics.
The Classification drop-down list in the Classify Layer dialog box displays all classifications created for a layer.
To Classify a Layer with a Range
Use the following steps to classify a layer with a range.
- Click the GIS tab.
- Click the Workspace subtab if it is not selected.
- Click the layer you want to classify.
-
Click the Tools button and then click Classify.
The Classify Layer dialog box opens. OR
Right-click the layer and click Classify.
The Classify Layer dialog box opens. -
To edit/view an existing classification for the selected layer, select it from the Classification drop-down list.
OR To create a new classification for the selected layer, click the Manage button and then click New.
-
From the Type drop-down list, select Range.
-
From the Field drop-down list, Select the field in your layer that you want to classify. Note The options in the Field list are based on the visible layers in the Design View of the Attributes subtab. When Range is selected as the classification method, all visible numeric fields are available in the Field drop-down list.
-
From the Normalize By drop-down list, select the field by which you want to divide the field in step 7.
Note When you select a field to normalize by, classes are created based on the ratio of data in the first field to the second field for each attribute record.
-
From the Method drop-down list, select the method you want to use.
-
Equal Interval–Divides the range of attribute values into equal sized sub-ranges.
- Natural Break–Identifies breakpoints among groups using the Jenk's Optimization statistical formula and finds groupings and patterns inherent in the data.
- Quantile–Divides the range of attribute values so that each group contains the same number of records in the classification field.
- Standard Deviation–Measures the difference between a single record and the average of all of the records in the layer.
- Maximum Break–Identifies large gaps between groups and finds groupings and patterns inherent in the data.
- Custom—Lets you manually update the classification boundaries of any of the other methods.
Note Minimum and maximum range values cannot overlap.
- If you selected Standard Deviation in step 9, from the Classes drop-down list, select the number of standard deviations you want to use.
OR
If you did not select Standard Deviation in step 9, in the Classes text box, type how many classes you want to set in the range method.
-
From the Round At drop-down list, select the decimal place to which you want to round your range.
-
From the Vary By drop-down list, select how you want to vary your ranges (options vary based on layer type).
Note The Custom option is used for classifications that do not follow a set scheme or pattern and are customized by the user. If you change the symbolization of a class in an existing classification, the Vary By option will change to Custom automatically and any new classes that are added to the classification will be assigned the default symbols for that layer's geometry type (for example, green in color).
- If you selected a color option in step 12, from the Scheme drop-down list, select a color scheme.
- Qualitative–Displays colors that vary in color hue to represent different legend classes.
- Sequential–Displays a color that progresses from low to high (or high to low) in color value.
- Diverging—Puts equal emphasis on mid-range critical values and extremes at both ends of the data range.
Then, select a color pattern from the Pattern drop-down list.

-
Optional. Click the Reverse Order button to reverse the style for how your ranges are varied. For example, if you selected to vary your range by color and the color represents the lowest value as the lightest color and the highest value as the darkest color, you can click the reverse button to have the darkest color represent the lowest value and the lightest color represent the highest value (or vice versa).
-
Optional. If you are editing an existing classification, click the Recalculate button

to recalculate the row counts for each class.

-
Optional. To add a class to your classification, click the Add Class button Double-click in the Min, Max, Legend Label fields to edit the values.
-
Optional. To remove a class from your classification, click the Remove Class button

- Click OK.
The classification is saved for future use. To view it again, select it from the Classification drop-down list.
Classifying a Layer with a Single Value

This Help topic describes features that are available in XMap GIS Editor and XMap GIS Enterprise.
When you classify a layer in a database with a single value, all of the records are in the same class and look the same on the map. For example, they all have the same fill color on the map. By default, single-value classifications are automatically assigned to all layers. If you are classifying a layer for use with a PN-compatible form, see the PN-Compatible Forms Help topic for more information.
To Classify a Layer with a Single Value
Use the following steps to classify a layer with a single value.
- Click the GIS tab.
- Click the Workspace subtab if it is not selected.
- Click the layer you want to classify.
-
Click the Tools button and then click Classify. The Classify Layer dialog box opens.
OR Right-click the layer and click Classify. The Classify Layer dialog box opens. -
To edit/view an existing classification for the selected layer, select it from the Classification drop-down list.
OR To create a new classification for the selected layer, click the Manage button and then click New.
-
Select Single Value from the Type drop-down list.
-
Click OK.
Saving a Classification to a Template File

This Help topic describes features that are available in XMap GIS Editor and XMap GIS Enterprise.
Use the Save as Template feature in the Classify Layer dialog box to save the parameters of a selected classification into a template that you can apply to another layer. The Save as Template feature is useful only when the layer to which you are applying the template has the same attribute fields (name and data type) as those used in the original template. If the layer does not have the same attribute fields as those used in the template, an error will appear when applying the template to the layer.
To Save a Classification to a Template File
Use the following steps to save a classification as a template.
- Click the GIS tab.
- Click the Workspace subtab if it is not selected.
-
Click the layer that contains the classification that you want to save as a template.
-
Click the Tools button and then click Classify.
The Classify Layer dialog box opens.
OR
Right-click the layer and click Classify.
The Classify Layer dialog box opens.
-
From the Classification drop-down list, select the classification you want to save as a template.
-
Click the Manage button and then click Save as Template.
The Save Template dialog box opens.
- Browse to the location where you want to save the template, name the template, and click Save.
Note Classification templates have .xmc extensions.
- Click OK.
Creating a Classification From a Template File

This Help topic describes features that are available in XMap GIS Editor and XMap GIS Enterprise.
Use the Load Template feature in the Classify Layer dialog box to attach a classification template to classification. The layer to which you are applying the template must have the same attribute fields (name and data type) as those used in the original template. If the layer does not have the same attribute fields as those used in the template, an error will appear when you apply the template to the layer.
To Apply a Template to a Classification
Use the following steps to attach a template to a classification.
- Click the GIS tab.
- Click the Workspace subtab if it is not selected.
- Click the layer that you want to classify.
-
Click the Tools button and then click Classify.
The Classify Layer dialog box opens.
OR
Right-click the layer and click Classify.
The Classify Layer dialog box opens. -
Click the Manage button and then click Load Template.
The Open Template dialog box opens. -
Browse to the location where the template was saved and click Open.
Note Classification templates have .xmc extensions.
-
Optional. Recalculate or classify the layer based on the settings in the template.
-
Click OK.
Copying a Classification

This Help topic describes features that are available in XMap GIS Editor and XMap GIS Enterprise.
You can copy an existing classification if you want to make minor adjustments to it without overwriting the classification. Copied classifications are created as new, independent classifications.
To Copy a Classification
Use the following steps to create a copy of an existing classification.
- Click the GIS tab.
- Click the Workspace subtab if it is not selected.
- Click the layer that contains the classification that you want to copy.
-
Click the Tools button and then click Classify.
The Classify Layer dialog box opens.
OR
Right-click the layer and click Classify.
The Classify Layer dialog box opens. -
From the Classification drop-down list, select the classification you want to copy.
-
Click the Manage button and then click Copy.
-
The original classification is retained and the new classification is named "Copy of
." -
Click OK.
Renaming a Classification

This Help topic describes features that are available in XMap GIS Editor and XMap GIS Enterprise.
Classifications names are based on the field name by default. You can change the default classification name using the Rename feature in the Classify Layer dialog box. The classification is used in the print legend.
To Rename a Classification
Use the following steps to rename a classification.
- Click the GIS tab.
- Click the Workspace subtab if it is not selected.
- Click the layer that contains the classification that you want to rename.
- Click the Tools button and then click Classify.
The Classify Layer dialog box opens.
OR
Right-click the layer and click Classify.
The Classify Layer dialog box opens. - From the Classification drop-down list, select the classification you want to rename.
- Click the Manage button and then click Rename.
The Classification text box opens for editing. - Edit the classification name and then press the ENTER key on your keyboard.
- Click OK to close the Classify Layer dialog box.
Deleting a Classification

This Help topic describes features that are available in XMap GIS Editor and XMap GIS Enterprise.
Because all completed classifications are retained, you may want to delete an existing classification that you no longer need.
To Delete a Classification
Use the following steps to delete an existing classification.
- Click the GIS tab.
- Click the Workspace subtab if it is not selected.
- Click the layer that contains the classification that you want to delete.
- Click the Tools button and then click Classify.
The Classify Layer dialog box opens.
OR
Right-click the layer and click Classify.
The Classify Layer dialog box opens. - From the Classification drop-down list, select the classification you want to delete.
- Click the Manage button and then click Delete.
- Click OK.
Symbolizing and Labeling
Symbolizing and Labeling Overview
You can symbolize your layer so that you can control of how the layer displays on the map. The symbolize options vary based on the type of layer—point, polygon, or line—you are modifying. With the Symbolize Layer dialog box, you can make line changes, color changes, symbol changes, and font changes (for labels).
Tip Click the icon next to the layer name to quickly open the Symbolize Layer dialog box.
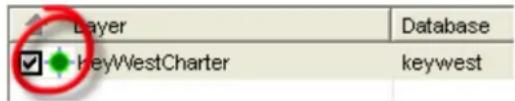
text_image
Layer ✓ KeyWestCharter Database keywestAdobe® Acrobat® PDF files of the lines and symbols are available by clicking a link below. Line Styles PDF
Symbol Styles PDF
Symbolizing a Line Layer
Use the Symbolize Layer dialog box to customize the layer's visual properties or select to show/hide certain elements or classes of the layer produced by a classification. If you change the visual property of a class produced from a classification, the Vary By scheme is automatically set to Custom in the Classify Layer dialog box.
To Change the Color/ Outline/ Label Properties of a Line Layer
Use the following steps to change the color/outline/label properties of a feature in a line layer.
- Click the GIS tab.
- Click the Workspace subtab if it is not selected.
- Click the layer you want to symbolize.
- To open the Symbolize Layer dialog box:
Click the layer icon next to the layer name.
OR
Click the Tools button and then click Symbolize.
The Symbolize Layer dialog box opens.
OR
Right-click the layer and click Symbolize.
OR
XMap GIS Editor and Enterprise only Right-click a line on the map and click Symbolize.
Under Symbolization, each row in the table displays each of the classes in the layer.
Each column in the table indicates:
| This Column... | Displays... |
| Field name/Feature | The minimum and maximum (or unique) values of each class. |
| Sample The current visual property for each class. | |
| Legend Label The current label for each class. The Null Class indicates any object for which the attribute value falls out of the classification. The Highlight Features label lets you visually identify which records have been queried. | |
The field you chose while classifying the layer displays each of the features for that layer. Each of the features are selected by default to show on the map.
-
Click the feature for which you want to change the properties.
-
To change the opacity of the color of your feature... from the Opacity drop-down list, select Opaque (0% transparent), Transparent (100% transparent), Blended (50% transparent), or XOR (combination of the source and background pixels—most useful when records with the same symbolization overlap).
- To change the line color of your feature... click the Color button and select a standard or custom line color. Then, select a line width from the Width drop-down list and a line style from the Style drop-down list.
- To change the outline color of your feature... click the Outline Color button and select a standard line color or create a custom line color. Then, select how wide you want your outline to display from the Width drop-down list and an outline style from the Style drop-down list. Note An outline is placed underneath a line. Therefore, if the outline is thinner than the line, the outline may not be visible. To ensure an outline will be visible, make sure the outline is at least 1 pixel greater than the line. Tip If you outline a line, you can make it look like a highway.
-
To change the properties of your label... ensure the Show Label check box is selected and then:
-
Select a different font from the Font drop-down list.
- To change the font style, click the Bold button B, Italic button I, or Underline button U. You can also click More Styles for additional font style options.
Tip Select the Outline option under More Styles to outline the text with white, making the text easier to read on the map.
- To change the font color, click the Font Color button and select a standard font color or create a custom font color.
• To change the font size, select a size from the Size drop-down list.
• To hide the label on the map, clear the Show Label check box.
Tip Once you modify the font properties of labels, the text may appear cluttered on the map. If this is the case, ensure the Declutter Text check box is selected to remove some of the text on the map.
- Repeat the steps for each layer feature you want to symbolize.
- Click OK.
Notes
• You can also show/hide a feature on the map.
To show a feature that is currently disabled, select the feature and then select the Show Feature check box under Line Feature.
OR
To hide a feature, select the feature and then clear the Show Feature check box under Line Feature. The feature displays as "Disabled" in the Symbolization dialog box. To hide multiple features, press the CTRL key on your keyboard while you click the features you want to hide and then clear the Show Feature check box. To hide a block of features, press the SHIFT key on your keyboard while you click the first and last records in the block.
- To select multiple features, press the CTRL key on your keyboard while you select each feature. To select a block of features, press the SHIFT key on your keyboard while you select the first and last records in the block. To select all features, press CTRL+A.
Symbolizing a Point Layer
You can use the Symbolize Layer dialog box to modify the symbols, modify the text properties, and show/hide certain features in a layer.
If you are symbolizing a layer for use with a PN-compatible form, see the PN-Compatible Forms Help topic for more information.
To Change the Symbolization of a Point Layer
Use the following steps to change the symbolization of a point layer.
- Click the GIS tab.
- Click the Workspace subtab if it is not selected.
- Select (highlight) the layer you want to symbolize.
- To open the Symbolize Layer dialog box:
Click the layer icon next to the layer name.
OR
Click the Tools button and then click Symbolize.
The Symbolize Layer dialog box opens.
OR
Right-click the layer and click Symbolize.
OR
XMap GIS Editor and Enterprise only Right-click a point on the map and click Symbolize.
Under Symbolization, each row in the table displays each of the classes in the layer. Each column in the table indicates:
| This Column... Displays... | |
| Field name/Feature | The minimum and maximum (or unique) values of each class. |
| Sample | The current visual property for each class. |
| Legend Label The current label for each class. The Null Class indicates any object whose attribute value falls out of the classification. The Highlight Features label lets you visually identify which records have been queried. | |
The field you chose while classifying the layer displays each of the features for that layer. Each of the features are selected by default to show on the map.
- Click the feature for which you want to change the properties.
• To change the opacity of the color of your feature...
from the Opacity drop-down list, select Opaque (0% transparent),
Transparent (100% transparent), Blended (50% transparent), or XOR
(combination of the source and background pixels—most useful when records with the same symbolization overlap).
• To change the type of symbol you want to display...
select a symbol set from the Set drop-down list and then use the symbol list below the Set drop-down list to select a new symbol.
Note To add a new symbol set, click the Add button and then use the dialog box to add a new symbol set. The symbol set must contain .dim or .bmp symbols (.bmp symbols do not scale well).
• To change the color of your stock symbol...
click the Color button and select a standard fill color or create a custom fill color.
• To change the size of your stock symbol...
select a size from the Size drop-down list.
• To change the properties of your label...
ensure the Show Label check box is selected and then:
- Select a different font from the Font drop-down list.
- To change the font style, click the Bold button B, Italic button I, or Underline button U. You can also click More Styles for additional font style options.
Tip Select the Outline option under More Styles to outline the text with white, making the text easier to read on the map.
- To change the font color, click the Font Color button and select a standard font color or create a custom font color.
• To change the font size, select a size from the Size drop-down list.
• To hide the label on the map, clear the Show Label check box.
Tip Once you modify the font properties of labels, the text may appear cluttered on the map. If this is the case, ensure the Declutter Text check box is selected to remove some of the text on the map.
-
Repeat the steps for each layer feature you want to symbolize.
-
Click OK.
Notes
- You can also show/hide a feature on the map.
To show a feature that is currently disabled, select the feature and then select the Show Feature check box under Line Feature.
OR
To hide a feature, select the feature and then clear the Show Feature check box under Line Feature. The feature displays as "Disabled" in the Symbolization dialog box. To hide multiple features, press the CTRL key on your keyboard while you click the features you want to hide and then clear the Show Feature check box. To hide a block of features, press the SHIFT key on your keyboard while you click the first and last records in the block.
- To select multiple features, press the CTRL key on your keyboard while you select each feature. To select a block of features, press the SHIFT key on your keyboard while you select the first and last records in the block. To select all features, press CTRL+A.
Symbolizing a Polygon Layer
Use the Symbolize Layer dialog box to modify the layer's color, text, and outline properties or select to show/hide certain features.
To Change the Color/ Outline/ Label Properties of a Polygon Layer
Use the following steps to change the color/outline/label properties of a feature in a polygon layer.
- Click the GIS tab.
- Click the Workspace subtab if it is not selected.
-
Select (highlight) the layer you want to symbolize.
-
To open the Symbolize Layer dialog box:
Click the layer icon next to the layer name.
OR
Click the Tools button and then click Symbolize.
The Symbolize Layer dialog box opens.
OR
Right-click the layer and click Symbolize.
OR
XMap GIS Editor and Enterprise only Right-click a polygon on the map and click Symbolize.
Under Symbolization, each row in the table displays each of the classes in the layer.
Each column in the table indicates:
| This Column... Displays... | |
| Field name/Feature | The minimum and maximum (or unique) values of each class. |
| Sample The current visual property for each class. | |
| Legend Label The current label for each class. The Null Class indicates any object whose attribute value falls out of the classification. The Highlight Features label lets you visually identify which records have been queried. | |
The field you chose while classifying the layer displays each of the features for that layer. Each of the features are selected to be shown on the map by default.
- Click the feature for which you want to change the properties.
• To change the opacity of the color of your feature...
from the Opacity drop-down list, select Opaque (0% transparent),
Transparent (100% transparent), Blended (50% transparent), or XOR
(combination of the source and background pixels—most useful when records with the same symbolization overlap).
Tip The Blended option is very useful for viewing polygons and map data. Type your drop-down text here.
• To change the fill color of your feature...
ensure the Show Fill check box is selected, click the Fill Color button, and select a standard fill color or create a custom fill color. To change the fill style for your feature using one of the many hatch-fill options, click the Fill Style drop-down list and select a style.
OR
To hide the fill color on the map, clear the Show Fill check box.
• To change the outline color of your feature...
ensure the Show Outline check box is selected, click the Outline Color button next to Outline under Polygon Features, and select a standard line color or create a custom line color. Then, select how wide you want your outline to display from the Width drop-down list.
OR
To hide the outline color on the map, clear the Show Outline check box.
• To change the properties of your label...
ensure the Show Label check box is selected and then:
- Select a different font from the Font drop-down list.
- To change the font style, click the Bold button B, Italic button I, or Underline button U. You can also click More Styles for additional font style options.
- To change the font color, click the Font Color button and select a standard line color or create a custom line color.
• To change the font size, select a size from the Size drop-down list.
• To hide the label on the map, clear the Show Label check box.
Tip Once you modify the font properties of labels, the text may appear cluttered on the map. If this is the case, ensure the Declutter Text check box is selected to remove some of the text on the map.
- Repeat the steps for each layer feature that you want to symbolize.
- Click OK.
Notes
- You can also show/hide a feature on the map.
To show a feature that is currently disabled, select the feature and then select the Show Feature check box under Line Feature.
OR
To hide a feature, select the feature and then clear the Show Feature check box under Line Feature. The feature displays as "Disabled" in the Symbolization dialog box. To hide multiple features, press the CTRL key on your keyboard while you click the features you want to hide and then clear the Show Feature check box. To hide a block of features, press the SHIFT key on your keyboard while you click the first and last records in the block.
- To select multiple features, press the CTRL key on your keyboard while you select each feature. To select a block of features, press the SHIFT key on your keyboard while you select the first and last records in the block. To select all features, press CTRL+A.
Adding a Symbol Set to the List of Available Symbol Sets
When you symbolize a point layer, you can identify the points with a variety of stock symbols. However, you can also use the Add button in the point layer Symbolize dialog box to add a different symbol set to the list of available symbol sets.
To Add a Symbol Set
Use the following steps to add a symbol set to the list of available symbol sets.
- Click the Add button in the Symbolize Layer (for a point layer) dialog box. The Add Symbols dialog box opens.
- Under Add New Symbol Set, click Browse.
- Browse to the location where your .dim symbol set file is located, select the file, and then click Open.
- Click Add to List.
The symbol set displays under Existing Symbol Sets.
Note Select the new symbol set in the Existing Symbol Sets list to preview the symbols it contains.
- Click OK to return to the Symbolize Layer dialog box.
Deleting a Symbol Set from the List of Available Symbol Sets
Use the following steps to delete a symbol set from the list of available symbol sets.
- Click the Add button in the Symbolize Layer (for a point layer) dialog box. The Add Symbols dialog box opens.
- Under Existing Symbol Sets, click to highlight the symbol set you want to remove.
- Click Delete From List.
-
Click Yes to confirm the deletion.
-
Click OK to return to the Symbolize Layer dialog box.
Labeling a Layer
You can use the attribute information in your layer to label the features on the map using the Set Label dialog box.
Note To view labels created using these steps, the Show Label check box on the Symbolize Layer dialog box must be selected. Labels have a 1000-character limit.
To Label a Layer
Use the following steps to label a layer.
- Click the GIS tab.
- Click the Workspace subtab if it is not selected.
- Select (highlight) the layer you want to label.
-
Click the Tools button and then click Label.
The Label Layer dialog box opens.
OR
Right-click the layer and click Label.
The Label Layer dialog box opens. -
Type any text you want to display in the label in the Label Formula text box.
-
Optional. Under Label Columns, select a column header from the file to add as a
label. Then, click the right arrow button to move the header to the label area. Repeat this step for each column header you want to include in the label. As you add headers to the label area, the Label Formula updates and shows an example of what the label will look like.
Note You can click Clear to clear the selections you made in steps 5 and 6.
- Optional. To reorder how the label displays, select the column under Selected
Columns you want to move and then click the up arrow ↑ to move the column near/at the beginning of the label or click the down arrow ↓ to move the column near/at the end of the label.
- Click OK.
Tips
- Once you have modified the font properties of labels, the text may appear cluttered on the map. If this is the case, ensure the Declutter Text check box is selected in the Symbolize Layer dialog box.
- To create a multi-line label, type \n between the segments of the label that you want to separate in the Label Formula text box.
Attributes-Datasheet View
Editing the Attributes of a Layer

This Help topic describes features that are available in XMap GIS Editor and XMap GIS Enterprise.
XMap Professional users can edit embedded documents.
Use the Attributes subtab to view and/or edit the attributes of a layer. The columns that display in the Datasheet View of the Attributes subtab are field headings that were selected to be "visible" in the Design View of the Attributes subtab. You can make some headings invisible by clearing the appropriate check boxes in the Design View.
To Edit the Attributes of a Layer
Use the following steps to edit the attributes of a layer.
-
Click the GIS tab.
-
Click the Attributes subtab and click the Datasheet View button

- From the Layer drop-down list, select the layer to edit.
- To view all of the attributes for the selected layer regardless of what is currently displaying on the map, select All from the List drop-down list. OR
To view only the attributes in the current map rectangle, select Map Region from the List drop-down list.
OR
To view only attribute information for geometries you click on the map, select Toolbar Select from the List drop-down list.
- Optional. From the Query drop-down list, select a query against which to run the layer.
Note This option is unavailable when there have been no queries made against the layer.
- To change a value in the layer, double-click inside the cell you want to modify, type your edits in the appropriate cell, and then press the ENTER key on your keyboard.
Notes
- You cannot edit the area, length, perimeter, or other XMap-generated fields because they are maintained by XMap. These fields are automatically updated when a geometry is edited.
- When editing dates, ensure the date is between 1/1/1753 and 12/31/9999. If you have a date that is outside of these parameters, change your date value to a string value in the source database.
- Geocoded point layers have special properties that may significantly alter the layer when edited.
- You can embed documents in or link URLs to attributes, if the attribute type allows.
Tips
- To edit multiple records, press the SHIFT key on the keyboard to select the records. Then, hold the ALT key on the keyboard while you double-click within the row you want to edit. Make the change and then press ENTER. Click Yes when asked if you are sure you want to apply the edit to all of the selections.
- Click a heading in the Datasheet View to sort the contents of the layer by that heading. You cannot sort document fields.
• To change the size of a column in the Datasheet View, drag the bar to the right of
the heading name to the new column size.
- To view the history of changes made against each geometry in a layer, click the Ext Sets button and then click Show Extended Sets; a secondary table opens below the primary table and displays the changes.
- Use the arrow keys or the TAB key to move through the cells in the table.
- Press the ESC key on your keyboard to cancel the editing process.
Embedding a Document in an Attribute

This Help topic describes features that are available in XMap Professional, XMap GIS Editor and XMap GIS Enterprise.
Once you have created a document field using the Attributes Design view, you can upload it to embed it in the record. For more information about how to manage embedded documents, see Working with Embedded Documents.
Note The maximum size allowed for an embedded document is 50 MB.
To Embed a Document from the Attribute Table in Datasheet View
Use the following steps to link a document to an attribute from the attribute table. The layer must contain a document field created in XMap Enterprise or XMap Editor before a document can be embedded.

- Click the GIS tab.
- Click the Attributes subtab and click the Datasheet View button
- From the Layer drop-down list, select the layer that contains the attribute.
- Find the column in the table for the document field. Then, find attribute in which you want to embed a document and hover over the cell under the document column. An arrow displays.
- Click the arrow and then click Upload.
- From the Upload File dialog box, browse to the file that you want to embed and then click Open.
A hyperlink to that document displays in the Attribute table. The document is embedded in the source database.
To Embed a Document from the Map
You can link a document to an attribute from the map. You must create a document field in the layer before you embed a document.
- Right-click a GIS object (geometry) on the map, point to Documents, point to Upload, and then click the option you want to use; you can upload a document or replace a document that you previously uploaded. If there are multiple documents or multiple objects on the map where you click, then all of the options available are displayed.
- From the Upload File dialog box, browse to the file that you want to embed and then click Open.
A hyperlink to that document displays. The document is embedded in the source database.
To Embed a Document from a Form
When a form contains a document field (created from a layer with a document field), you can upload a document when you have the proper form permissions.
- Open the form and select the geometry or geometries for which you want to upload a document.
- Click Upload next to the document field on the form and browse to the document's location on your computer. The document displays in the form and a hyperlink to that document displays in the Attributes table. The document is embedded in the source database.
Working with Embedded Documents

This Help topic describes features that are available in XMap GIS Editor and XMap GIS Enterprise.
XMap Professional users can view and edit embedded documents.
Embedded documents give you the ability to store images, rich text documents, spreadsheets and other files in a record of your GIS layer. You can view, edit, or replace embedded documents from the Attributes tab, from a form, or right on the map.
- You must create a document field in Attributes-Design View before you can embed a document.
- The embedded documents menu displays the options available for each document. The options that are available depend on the type of document and user permissions.
The menu options are:
- View—Opens the document for viewing in the document's editor but does not allow editing. You can also view the document by clicking the document link in the table. More...
- You can open and close multiple views of a document without affecting the database.
- Viewing is faster than using the Edit option and is guaranteed to protect your database from accidental changes.
- Run-For certain file
types (bat, com, cpl, exe, js, jse, lnk, msc, msi, msp, pif, reg, scr, sct, shb, shs, url, vb, v be, vbs, wsc, wsf, wsh), the Run option is available instead of the View option. It opens the file.
- Edit—Opens the document for editing in the document's editor. The document is updated in the database when you close the document editor. See Tips for more information.
- Open in XMap–Opens a compatible file within XMap.
- Save As-Save the document as a file external to your XMap database.
- Upload—Upload a new document or replace an existing document. See Tips for more information.
- Delete-Delete the document from the GIS object (geometry).
Tips
- If you encounter a problem with a file you are editing, use the editor's Save As option to get a current copy of the document from the database and then use the Upload option to replace the document with a new
version.
- If there is no editor on your computer for a type of document, you can use Upload to store a file in the database and Save As to copy the document from the database back to your hard drive.
- You can open the embedded documents menu from the Attributes subtab, from the map, or with a form:
- Attributes-Datasheet View – Hover over a cell in a document column until you see an arrow. Click the arrow to open the menu.
- On the map–Right-click a GIS object (geometry) that contains at least one document column. If that object contains a document, a Documents option is available in the menu. If there are multiple documents or multiple objects on the map where you click, then all of the options available for the action you select are displayed.
- With a form—When a form includes an embedded document, the form creator sets permissions that allow viewing the document within the form; editing a document from the form; deleting the document; or uploading a new document to replace the one in the form. Changes made from a form are made to the layer, just as if you were working with the document from the Attributes tab or the map. See Forms Overview for more information about Forms and Forms requirements.
- Edit, Upload, and Delete actions are added to your Undo history until you commit
your changes. You can use the Undo and Redo buttons in the toolbar to reverse your changes until you commit them.
- Once a document is in the database, there is no connection to the version on your computer's hard drive. If you move or change the file on your hard drive it does not affect the version in the database. and vice versa.
- Embedded documents become shared information in the database. For example, if a document where information is logged is embedded, each user who edits the document updates the database.
- Embedded documents are included when you synchronize a database.
Viewing the Attributes of a Geometry on the Map

This Help topic describes features that are available in XMap Professional, XMap GIS Editor, and XMap GIS Enterprise.
To view the attributes of a geometry that is in the active layer on the map, right-click the location on the map and then click Show Attributes. You can also select the geometry with
one of the GIS tools, such as the Selection tool. The attribute information for that geometry is highlighted in the Datasheet View of the Attributes subtab and is also highlighted on the map.
Viewing Redline Edits

This Help topic describes features that are available in XMap Professional, XMap GIS Editor, and XMap GIS Enterprise.
After users synchronize their redline layers with the redline GIS layer in the Enterprise database, those users with permissions to view the redline GIS layer can review all of the redlines.
- Add the redline GIS layer to your workspace.
- Once the redline layer is in your workspace, select the check box next to the layer in the Workspace view.
Outlined boxes display on the map (red indicates incomplete redline edits and blue indicates completed redline edits), depicting the map bounding rectangles for each redline record. - Click the Attributes subtab and click the Datasheet View button
The attributes of the layer display. Each record in the redline layer has the user's name, date, and a copy of the original redline file (.an1). - To view a specific redline draw layer:
Click its hyperlink in the Redline Layer column.
A message asks if you want to save or open the file.
OR
Hover your cursor in the specific cell in the Redline Layer column.
A floating arrow displays. Click the arrow and then select Open.
A message asks if you want to save or open the file. - Click Save to save the file to your hard drive (ensure that the Open in XMap check box is selected).
The draw layer is added to your project and displays on the map.
OR
Click Open to open the file from its current location (ensure that the Open in XMap check box is selected).
The draw layer is added to your project and displays on the map. - Use the notes and annotations in the draw layer to make the appropriate edits to the corresponding GIS layers to which the user was subscribed.

Searching for Attributes

This Help topic describes features that are available in XMap Professional, XMap GIS Editor, and XMap GIS Enterprise.
Use the Attribute Search feature in the Attributes subtab to quickly search for particular attributes within a layer. Once the search is complete, the results are saved as a query and display in the Query drop-down list as Attribute Search.
Note Attribute Searches filter the attribute table in the Datasheet View to only show the results of the search; the geometries are not highlighted or filtered on the map.
To Search for Attributes
Use the following steps to use the Attribute Search dialog box.
-
Click the GIS tab.
-
Click the Attributes subtab and click the Datasheet View button

-
From the Layer drop-down list, select the layer from which to search the attributes.
-
Click the Attribute Search button

The Attribute Search dialog box opens. The name of the layer you selected displays in the Name text box.
- From the Attribute drop-down list, select the Attribute field for which you want to search.
- Type the specific attributes for which you want to search in the Values text box. Separate multiple values with a comma or a comma and a space (for example; portland, me OR portland, me).
Note If you copy a column of attributes or multiple attributes from an application such as Microsoft® Excel and paste them into the Values text box, they are automatically comma delimited.
- Optional. To restrict the search to the visible map on your desktop, select the Restrict Search to Map Region check box.
- Click Apply.
The Datasheet View table is filtered and shows only the results of the search.
Note To view all of the attributes of the layer, select Cancel Query from the Query drop-down list.
- Click Close.
Using Right-Click Options in the Datasheet View

This Help topic describes features that are available in XMap Professional, XMap GIS Editor, and XMap GIS Enterprise.
Several right-click options are available in the Datasheet View when you right-click inside the attributes table.
Tip To select multiple records individually, press and hold the CTRL key and click each record. To select a block of records, press and hold the SHIFT key and click the first and last record.
| If you click this right-click option... | Then the following will result... |
| Zoom to Selection | The map zooms to display all of the selected records. |
| Reverse Selection | All of the selected records become unselected and unselected records become selected. |
| Delete Selection (CTRL+ Del) | Deletes the selected record or records. Before the deletion is committed, you can use the Undo button in the toolbar to reverse it. You must commit the change to finalize the deletion. |
| Clear Selection Clears the selection. | |
| Select All All of the records in the Attributes subtab are selected in the attributes table and on the map. | |
| Copy to Clipboard | Each selected record in the attributes table is copied and can be pasted into another program. |
| Place Point* | When selected for a record, the corresponding point geometry is selected with the Edit Tool, and the cursor changes to the Edit tool. Click the map to move the point from its previous location to the clicked location. |
| Geocode Selection* | When selected, the selected records are re-geocoded (placed on the map according to the attributes they were geocoded by). This option is relevant when a user removes their map data (Streets or Topo) after geocoding a layer during import, and they edit the attributes of the geometry that were used in geocoding. |
| Zoom to Query Results** | The map zooms to display all of the geometries that satisfy the query results. |
| Zoom to Record The | map centers on the selected record. |
| Refresh | The attributes table refreshes (updates) to include any changes that were made. |
* These right-click options display only for geocoded point layers.
** This right-click option displays only when there is an active query.
Attributes-Design View
Showing/ Hiding Attributes in a Layer

This Help topic describes features that are available in XMap GIS Editor and XMap GIS Enterprise.
Use the Attributes Datasheet View to view and/or edit the attributes of a layer. The column headings that display in the Datasheet View of the Attributes subtab are attribute fields that are selected to be visible in the Design View of the Attributes subtab. To not show a heading, clear the appropriate check box in the Visible column in Design View.
To Show/ Hide Attributes in a Layer
Use the following steps to show/hide attributes in a layer.
- Click the GIS tab.
- Click the Workspace subtab.
-
Click the layer for which you want to show/hide attributes.
-
Click the Attributes subtab and click the Design View button The following table describes the columns in the Design View.

| Column Name Description | |
| Attribute Set | The name of the attribute set that to which the field belongs. |
| Source Name | Displays the original field name that is stored in the database. |
| Field Name | Displays any associated field labels for the heading.To edit a cell, click it, make the change, and press the ENTER key on your keyboard.You cannot edit field names in bold text. |
| Visible Selected check boxes indicate that the fields display as headings in the Datasheet View of the Attributes subtab, the Classification dialog box, and the layer export results. | |
| Data Type | The data type for the field. Includes the character limit if the data type is String. |
| Description The field | description.To edit a cell, click it, make the change, and press the ENTER key on your keyboard. You cannot edit XMap-managed fields. |
- From the Attribute Sets drop-down list, select a dataset. Select All Sets to view attributes for all of the datasets or select a particular set to view the attributes contained in that dataset. Your selection determines which attributes display in the Datasheet View and Design View.
- To show an attribute in a layer, select the check box under Visible in the row. OR
To hide an attribute in a layer, clear the check box under Visible in the row.
Tip Right-click the table and click Check All to select all check boxes or Clear All to clear all check boxes.
- Click Options and then click Save.
Note To undo a previous change before you save, click Options and then click Reset to return the table to the previously saved view.
Adding/ Editing a Field in a Layer

This Help topic describes features that are available in XMap GIS Editor and XMap GIS Enterprise.
You can add fields to a layer in Design View. Once you add a field, you can edit it. You can add several data types, including documents and URLs.
To Add a Field to a Layer
Use the following steps to add a field to a layer.
- Click the GIS tab.
- Click the Workspace subtab.
-
Highlight the layer to which you want to add a field.
-
Click the Attributes subtab and click the Design View button

- To add a field to the layer, click Options and then click the type of field you want to add.
- Add Simple Field
- Type a name for the field in the Field Name box. This will be used as the column heading.
- Select a data type from the Data Type drop-down list.
- If you selected String, Unicode String, Memo, Unicode Memo, or URL, in the String Size text box, type the maximum number of characters allowed.
- Click OK.
- Add Formula Field
-
Type a name for the field in the Field Name box. This will be used as the column heading.
-
Select a data type from the Data Type drop-down list.
- If you selected String, Unicode String, Memo, Unicode Memo, or URL, in the String Size text box, type the maximum number of characters allowed.
- From the Fields drop-down list, select a field type to filter the field list or select All fields to view all available fields.
- To add a field to the Formula box (above the Fields/Functions area), double-click it in the list.
-
From the Functions drop-down list, select a category to filter the function or click All categories to view all available functions.
-
Click OK.
- Add Constrained Field
- Type a name for the field in the Field Name box. This will be used as the column heading.
-
Select a data type from the Data Type drop-down list.
-
If you select String, Unicode String, Memo, Unicode Memo, or URL, in the String Size text box, type the maximum number of characters allowed.
-
If you select Double(15) or Float(6), in the Precision text box type the number of digits to which the field should be rounded.
-
If the data type supports constraints:
1.
a. Select the type of constraint from the Constraint Type dropdown list.
b. Define the constraint. (May be left blank.) The options vary depending on the data type.
Range constraint-Type the maximum and minimum values in the boxes.
String length constraint-Type the maximum and minimum values in the boxes.
Value constraint-Type a value in the Enter Values box and click Add.
You can enter up to 20 values. To move a value in the list, click it and use the up and down arrows.
You can paste values from your computer's clipboard.
To delete a value, click it and then select Delete.
-
To set an initial value for the field, type it in the Initial Value box. For a document, to set a default initial document, click the Browse button and browse to the document's location. The initial value affects only new geometries that you add and not existing geometries in the layer.
-
Click OK.
To Edit a Field in a Layer
Use the following steps to edit fields that were added to a layer.
-
Click the GIS tab.
-
Click the Workspace tab.
-
Highlight the layer that contains the field you want to edit.
-
Click the Attributes subtab and click the Design View button

- Click the row for the field you want to edit to highlight it, and then right-click and select Edit Field.
The Edit Constrained Field dialog opens for simple or constrained fields. The Edit Formula Field dialog opens for formula fields.
- Make the changes (see step 5 in the To Add a Field to a Layer section above).
Deleting a Field from a Layer

This Help topic describes features that are available in XMap GIS Editor and XMap GIS Enterprise.
Use the Delete Field feature to delete custom fields you have added to your layer or to delete default fields that came with your imported layer. When you delete a field from a layer, it is permanently deleted from the database (including all involved elements such as labels, dependent formulas, classifications, etc.).
To Delete a Field from a Layer
Use the following steps to delete a field from a layer.
-
Click the GIS tab.
-
Click the Workspace subtab if it is not selected.
-
Click the layer from which you want to delete a field.
-
Click the Attributes subtab and click the Design View button

- Click the Options button and then click Delete Field.
A confirmation message displays.
OR
Right-click the field you want to delete and then click Delete Field.
A confirmation message displays.
- Click OK to permanently delete the field from the database.
OR
Click Cancel if you do not want to delete the field from the database.
Function and Operator Descriptions

This Help topic describes features that are available in XMap GIS Editor and XMap GIS Enterprise.
The following definitions describe some of the terms used in the function descriptions table below.
Data_type-One of integer, float, string or datetime. String may have an optional length specification: string(integer). For example, string(40).
Date_expression-An expression yielding a datetime result.
Datepart—A special specifier used in date functions. Jump to the bottom of this topic for a list of datepart specifiers.
Expression—The result of combining several functions or operators.
Field—The name of a field in the table, enclosed in brackets. For example:
[Population2000]. A field has an associated data type in the table.
Logical_expression—An expression yielding either TRUE or FALSE.
Float_expression-An expression yielding a float result.
Integer_expression-An expression yielding an integer result.
Numeric_expression-An expression yielding a numeric result, either integer or float.
String_expression-An expression yielding a string result.
| Function Basic Function Syntax Description | ||
| AND logical_expression AND logical_expression | Returns TRUE if both of two logical expressions are TRUE, and FALSE otherwise. The result type is logical_expression. | |
| AVG | AVG(field) | Returns the average of a field's values. The result type is the same as the data type of field. |
| CAST CAST(expression AS data_type) | Transforms an expression of one data type into another data type. The result type is as specified by data_type. | |
| CEILING CEILING(numeric_expression) | Returns the smallest integer greater than or equal to a number. The result type is integer_expression. | |
| CHARINDEX CHARINDEX(string_expression, string_expression [, integer_expression]) | Returns the index to the beginning of the first string expression in second string. An optional starting location may be specified. The result type is integer_expression. | |
| CONTAINS CONTAINS(string_expression, string_expression) | Return TRUE if the first string contains an instance of the second string, and FALSE otherwise. The result type is logical_expression. | |
| COUNT | COUNT | Return the number of rows in table. The result type is integer_expression. |
| DATEADD DATEADD(datepart, numeric_expression, date_expression) | Returns a new datetime value based on adding an interval to the specified date, in units specified by datepart. The result type is date_expression. | |
| DATEDIFF DATEDIFF(datepart, date_expression, date_expression) | Returns the interval between two datetime values, in units specified by datepart. The result type is integer_expression. | |
| DATENAME DATENAME(datepart, date_expression) | Returns a string representing the specified datepart of the specified date. | |
| The result type is string_expression. | ||
| DATEPART DATEPART (datepart, date_expression) | Returns an integer representing the specified datepart of the specified date. The result type is integer_expression. | |
| DAY | DAY (date_expression) | Returns an integer representing the day datepart of the specified date. The result type is integer_expression. |
| EQUALS expression EQUALS expression | Returns TRUE if the two expressions are equal and FALSE otherwise. 'EQUALS' is synonymous with the '=' operator. The result type is logical_expression. | |
| FLOOR FLOOR( numeric_expression ) | Returns the largest integer less than or equal to a number. The result type is integer_expression. | |
| GETDATE | GETDATE() | Returns the current date/time as a datetime value. The result type is date_expression. |
| IF IF( logical_expression , value_if_true , value_if_false ) | Returns one value if a condition you specify evaluates to TRUE and another if it evaluates to FALSE. The result type is derived from value_if_true and value_if_false, which must either be both string or both numeric. If numeric, then if either of the values is float, then the return type is float_expression, and otherwise it is integer_expression; if string, then the result type is string_expression. | |
| IS [NOT] EMPTY | field IS [ NOT ] EMPTY Returns | TRUE if the string field field is empty and FALSE otherwise. NOT may be use to reverse the sense of the test. The result type is logical_expression. |
| IS [NOT] NULL | field IS [ NOT ] NULL | Returns TRUE if field is NULL and FALSE otherwise. NOT may be use to reverse the sense of the test. The result type is logical_expression. |
| LEN | LEN( string_expression ) | Returns the length of a string. The result type is integer_expression. |
| LEFT LEFT( string_expression , number_of_characters ) | Return the leftmost number_of_characters characters of a string, where number_of_characters is of type integer_expression. The result type is string_expression. | |
| LTRIM | LTRIM( string_expression ) | Return a string with spaces removed from its left end. The result type is string_expression. |
| LOWER | LOWER( string_expression ) | Returns a string with its letters converted to lowercase. The result type is string_expression. |
| MAX | MAX( field ) | Return the maximum value of a field. The result type is the same as the data type of field. |
| MID SUBSTRING | (string_expression , start , length ) | Return the length characters of a string beginning at start. start and length are both of type integer_expression. MID is synonymous with the SUBSTRING function. The result type is string_expression. |
| MIN | MIN( field ) | Return the minimum value of a field. The result type is the same as the data type of field. |
| MONTH | MONTH( date_expression ) | Returns an integer representing the month datepart of the specified date. The result type is integer_expression. |
| OR logical_expression OR logical_expression | Returns TRUE if either of two logical expressions are TRUE, and FALSE otherwise. The result type is logical_expression. | |
| POWER POWER | ( numeric_expression , power ) | Raise a number to a power. power must be of type integer_expression . The result type is float_expression. |
| PREFIX PREFIX | (string_expression , string_expression ) | Return TRUE if the first string begins with the second string, and FALSE otherwise. The result type is logical_expression. |
| REPLACE REPLACE | (string_expression , string_expression , string_expression ) | Returns the string generated by replacing all occurrences of the second string expression in the first string expression with the third string expression. The result type is string_expression. |
| RIGHT RIGHT | (string_expression , number_of_characters ) | Return the rightmost number_of_characters characters of a string. number_of_characters must be of type integer_expression. The result type is string_expression. |
| RTRIM | RTRIM( string_expression ) | Return a string with spaces removed from its right end. The result type is string_expression. |
| ROUND ROUND | ( numeric_expression , number_of_digits ) | Round number to number_of_digits decimal places to the right of the decimal point (negative values ofnumber_of_digits are to the left of the decimal point). number_of_digits must be of type integer_expression. The result type is float_expression. |
| SQRT | SQRT( numeric_expression ) | Returns the square root of a number. The result type is float_expression. |
| STUFF STUFF( | string_expression , start , length , string_expression ) | Return the string formed by replacing the length characters of the first string beginning at start with the second string. length and start must be of type integer_expression. The result type is string_expression. |
| STR STR( numeric_expression , length , decimal ) | Returns a string of length characters representing numeric_expression to decimal places. | |
| SUBSTRING SUBSTRING( | string_expression , start , length ) | Return the length characters of a string beginning at start. SUBSTRING is synonymous with the MID function. length and start must be of type integer_expression. The result type is string_expression. |
| SUFFIX SUFFIX( | string_expression , string_expression ) | Return TRUE if the first string ends with the second string, and FALSE otherwise. The result type is logical_expression. |
| SUM | SUM( field ) | Return the sum of the values of a numeric field. The result type is the same as the data type of field. |
| UPPER | UPPER( string_expression ) | Returns a string with its letters converted to uppercase. The result type is string_expression. |
| YEAR | YEAR( date_expression ) | Returns an integer representing the year datepart of the specified date. The result type is integer_expression. |
| + numeric_expression + numeric_expression | Returns the result of adding one number to another. If either of the expressions is floating point, then the result type is floating point; otherwise the result type is integer. | |
| - numeric_expression - numeric_expression | Returns the result of subtracting one number from another. If either of the expressions is floating point, then the result type is floating point; otherwise the result type is integer. | |
| * | numeric_expression * numeric_expression | Returns the result of multiplying one number by another. If either of the expressions is floating point, then theresult type is floating point; otherwise the result type is integer. |
| / numeric_expression /numeric_expression | Returns the result of dividing one number by another. If either of the expressions is floating point, then the result type is floating point; otherwise the result type is integer. | |
| % numeric_expression %integer_expression | Returns the remainder of dividing one number by an integer. If the first expression is floating point, then the result type is floating point; otherwise the result type is integer. | |
| & string_expression &string_expression | Returns the concatenation of two strings. The result type is a string. | |
| = | expression = expression | Returns TRUE if the two expressions are equal and FALSE otherwise. '=' is synonymous with the EQUALS operator. The result type is logical_expression. |
| <> | expression <> expression | Returns TRUE if the two expressions are not equal and FALSE otherwise. The result type is logical_expression. |
| <= | expression <= expression | Returns TRUE if the first expression is less than or equal to the second expression, and FALSE otherwise. The result type is logical_expression. |
| < | expression < expression | Returns TRUE if the first expression is less than the second expression, and FALSE otherwise. The result type is logical_expression. |
| > | expression > expression | Returns TRUE if the first expression is greater than the second expression, and FALSE otherwise. The result type is logical_expression. |
| >= | expression >= expression | Returns TRUE if the first expression is greater than or equal to the second expression, and FALSE otherwise. The result type is logical_expression. |
Datepart Specifiers
Dates are made up of dateparts: hours, minutes, seconds, years, months, days, and so on. For example, the month datepart of the date July 4, 1776 is 7. The day part is 4, and the year part is 1776. In a field creation formula, datepart specifiers are used as parameters to date functions (e.g. YEAR(), DATEDIFF(), etc.).
D: A datepart representing the day part of a date. 'DD' is a synonym for 'D'.
DW: A datepart representing day of the week for a date.
DY: A datepart representing the day of the year for a date. 'Y' is a synonym for 'DY'.
HH: A datepart representing the hour part of a date.
M: A datepart representing the month part of a date. 'MM' is a synonym for 'M'.
MI : A datepart representing the minutes part of a date. 'N' is a synonym for 'MI'.
MS: A datepart representing the milliseconds part of a date.
Q: A datepart representing quarters. 'QQ' is a synonym for 'Q'.
S: A datepart representing the seconds part of a date. 'SS' is a synonym for 'S'.
WK: A datepart representing the week part of a date. 'WW' is a synonym for 'WK'.
YY: A datepart representing the year part of a date. 'YYYY' is a synonym for 'YY'.
Importing a Set to Link to an Attribute

This Help topic describes features that are available in XMap GIS Editor and XMap GIS Enterprise.
Each layer contains a set of attributes relative to that layer; you can import an additional attribute set relative to that layer. Once you import the attribute set, you can link it to the layer's attributes to view additional information about the layer.
To Import a Set to Link to an Attribute
Use the following steps to import a set to link to an attribute.
- Click the GIS tab.
- Click the Workspace subtab if it is not selected.
-
Select a layer from the workspace list.
-
Click the Attributes subtab and click the Design View button

-
Click Options.
-
Click Manage Sets and then click Import.
The Append Attributes dialog box opens.
OR Click Import. The Append Attributes dialog box opens.
-
Click the browse button to locate the file you want to import (supported file types include: .xls, .dbf, .sds, .txt, .csv, .tab, .asc, .mdb, .mdw, .mda).
The name of the set displays in the Set Name text box and descriptive text displays in the Set Statistics area. The Set Name text box is editable. -
If you are importing a file other than a text file, select the table/spreadsheet you want to append from the list.
-
Click Next.
-
If the file you are importing is a text file, select whether it is a tab delimited, comma delimited, or other delimited text file. If you want to use the first row as the header, select the Use First Row as Header check box.
-
Click Finish.
- To link the attributes to another set, click Link. The Link Attribute Sets dialog box opens. For more information, see Linking a Set to an Attribute.
Note To unlink an attribute set, select it in the list and click Unlink.
Note If your imported set includes date information, ensure the dates are between 1/1/1753 and 12/31/9999. If you have a date that is outside of these parameters, change your date value to a string value in the source database.
Linking a Set to an Attribute

This Help topic describes features that are available in XMap GIS Editor and XMap GIS Enterprise.
Once you import an attribute set using the option in the Design View of the Attributes subtab, you can link that attribute set to view more specific attribute information for your layer.
Notes
- XMap supports one-to-one (A one-to-one attribute set is used to add editable properties to a layer. Any time there is a single row in the first set (left side of dialog box) and a single row in the additional set (right side of dialog box) with the same linking value, a connection is formed. This is where the name "one-to-one" comes from, since there is one attribute in a set that is linked to one attribute in another set. An example is parcel layer with an assessor's dataset attached to as a one-to-one link.) and many-to-one (A many-to-one dataset is used to add reference data to a layer. There will be multiple rows in the first set (left side of dialog box) that correspond with a single row in the additional set (right side of dialog). As a result of this duplication of right side values, the data is read only and meant solely for reference. An example is a counties layer that links to state-based reference information. There will be multiple counties linked to a single state.) linking. Many-to-one linking requires an XMap 7/ XMap 8-compatible database.
- Once you link an attribute set to a layer, you can unlink it by clicking the Options button, clicking Manage Sets, selecting the attribute set, and then clicking Unlink.
To Link a Set to an Attribute
Use the following steps to link a set to an attribute.
- Click the GIS tab.
- Click the Workspace subtab if it is not selected.
-
Select a layer from the workspace list.
-
Click the Attributes subtab and click the Design View button

-
Click Options.
-
Click Link. The Link Attribute Sets dialog box opens. OR Click Manage Sets and then click Link. The Link Attribute Sets dialog box opens.
-
Under Layer Attribution, select the existing layer or previously imported attribute set you want to link to the imported file from the Set drop-down list. Then, select the attribute in the attribute set that has an identical field in the imported file from the Attribute drop-down list
-
Under Additional Attribution, select the attribute set that contains the attribute selected in step 8 from the Set drop-down list. Then, select the attribute you want to link from the Attribute drop-down list. If you do not choose a compatible attribute type, you will be warned.
-
Under Linkage Type, select One-to-One or Many-to-One.
-
The results display in the link table. The table below describes the tabs in the link table. To copy results displayed in the table to your computer's clipboard, click Copy.
| Tab Name Description | |
| Results | Displays all of the records that were successfully linked. |
| Unmatched in<Layer Attribution Set> | Displays all unmatched records in the Layer Attribution Set. Unmatched records can be edited so that they can be successfully linked. |
| Unmatched in<Additional Attribution Set> | Displays all unmatched records in the Additional Attribution Set. |
| Duplicates in<Layer Attribution Set> | Displays any duplicate records from the Layer Attribution Set. Duplicate records can be edited so that they can be successfully linked. |
| Duplicates in<Additional Attribution Set> | Displays any duplicate records from the Additional Attribution Set. |
- Click OK.
Selecting a Geometry to be Read Only

This Help topic describes features that are available in XMap GIS Editor and XMap GIS Enterprise.
You can use the Design View in the Attributes subtab to save existing geometries to be read only, ensuring that the geometry will not be edited. Read-only geometries display in the Attributes table with a yellow padlock next to them.
To Make a Geometry Read Only
Use the following steps to set a geometry to be read only.
- Click the GIS tab.
- Click the Workspace subtab if it is not selected.
-
Select the layer that includes the geometry you want to modify as read only from the workspace list.
-
Click the Attributes subtab and click the Design View button

-
In the table, select the Visible check box for the Source Name ReadOnly.
-
Click the Datasheet View button

The attributes of the layer display and the new ReadOnly column displays.
- To select an individual geometry, click to select it in the Attributes table. Double-click in the ReadOnly cell and select True from the drop-down list. Then, press the ENTER key on your keyboard.
OR To select multiple geometries:
a. Hold the CTRL key on your keyboard while you click each geometry you want to make read only, or hold the SHIFT key to select a block of geometries.
b. Hold the ALT key on your keyboard and double-click in one of the geometries' ReadOnly cells.
XMap User Guide
c. Select True from the drop-down list.
d. Press the ENTER key on your keyboard.
e. At the confirmation message, click Yes to confirm that you want to apply the edit to the entire selection.
Using Right-Click Options in Design View

This Help topic describes features that are available in XMap Professional, XMap GIS Editor, and XMap GIS Enterprise.
Several right-click options are available in the Design View when you right-click inside the attributes table. The available options depend on the type of field you right-click.
Right-click a row in the table and then:
- Click Check All to select the Visible check box for all attribute records.
- Click Clear All to clear the Visible check box for all attribute records.
- Click Edit Field to open a dialog box where you can edit the attribute field.
- Click Recalculate Formula to update the formula calculation.
- Click Delete Field to delete the attribute field.
Forms
Forms Overview

This Help topic describes features that are available in XMap Professional, XMap GIS Editor, and XMap GIS Enterprise.
A database created with XMap GIS Enterprise is required to use XMap Forms in XMap Professional. XMap Editor can create forms locally but cannot share them with other XMap users. The functions available in a form depend on the permissions set by the database and by the form itself.
What is XMap Forms?
Use XMap Forms with XMap to create electronic forms that make it easy to automate field data collection with a PN-Series GPS or laptop and to simplify viewing and editing GIS objects on your desktop alongside your map. When you synchronize the edited layers with an Enterprise database, it updates the database attributes. You can even embed documents, such as text files, images, spreadsheets, and more within a form.
XMap Forms are associated with a layer and display attribute fields chosen by the administrator when the form is created. The administrator can create multiple forms for a GIS layer. Authorized users with access to a layer can open forms to view them and those with the proper permissions can edit a form. XMap Editor and XMap Enterprise users can create and manage forms (see chart below).
To use XMap Forms with XMap Professional, an administrator is required to own one license of XMap 8 GIS Enterprise, which includes the form builder and enables database synchronization across the network.
(Note: See chart below on Form Rights to understand when an XMap product can create and access forms)
Types of Forms
There are three types of forms:
- XMap-only—These forms are based on the attributes selected by the form creator. Some attribute types are not available for forms.
- PN-compatible—These forms are for use with GIS point layers on Earthmate PN-Series GPS devices and support only certain attribute types. For example, document attributes cannot be displayed on a PN-Series GPS device. For more information about forms for PN-Series GPS devices, see PN-Compatible Forms.
- Custom-To create a custom form, you can create and export an XMap-only form to your computer, edit it using your own HTML/JavaScript tools, and then import it into XMap.
Multiple Forms in a Layer
You can create multiple forms for a layer and tailor each of them to meet different user needs.
• Create forms that contain different attribute subsets.
- Create one form for viewing, one for editing, and one for adding geometries (GIS objects).
- Create forms with different permissions by making specific attributes read only.
Suggested Uses for XMap Forms
- Use in the field or office to set up regulatory compliance reporting and data collection.
- Combine with XMap pipeline stationing functionality to set up more productive field navigation and data collection.
- Attach images and other files to forms.
• Develop your own completely new approach to data collection.
Form Rights (Create/ Access)
| (localDB)^1 | Local Server (non-Enterprise DB) ^2 | Local Server (Enterprise DB) ^3 | Remote Server (non-Enterprise DB) | Remote Server (Enterprise DB) ^3 | |
| XMap Professional | No/ Sync only | No/ Sync only | No/ Sync only | No/ No No | Sync only |
| XMap Editor | Yes/ Yes | Yes/ Yes | Yes/ Yes | No/ No | Yes/ Yes |
| XMap Enterprise | Yes/ Yes | Yes/ Yes | Yes/ Yes | No/ No | Yes/ Yes |
(Note: ^1 Cannot share layers stored on a localDB, ^2 Forms cannot be shared over the network, ^3 Forms can be shared over the network)
PN-Compatible Forms
Supported Attributes for PN-Series Compatible Forms
XMap User Guide
Only the following field types are supported for use in PN-Series compatible forms.
- BigInteger
- Boolean
- DateTime
- Double
- Float
- Integer
- String
- Memo
- Unicode
- UnicodeMemo
Classification and Symbolization
To make full use of the symbol set that is available on a PN-Series GPS, classify and symbolize the GIS point layer using the Earthmate PN-Series symbol set.
• You can use a single value or unique value classification.
- You must symbolize the null value for a unique value classification. Symbolization is not required for a single value classification.
- Each PN-compatible form allows only one classification. If multiple classifications exist, you can select the one you want to use when you create the form.
Symbols
You must use Earthmate PN-Series symbol set for symbolization when using a PN-compatible form.
Important Do not use the following geocache symbols or the objects will be sorted to the Geocaches Page on the device.

natural_image
Collection of colorful emoji icons including smiling, sad, folder, and speech bubbles (no text or symbols)Linking
PN-compatible forms support only one-to-one linking.
Creating or Modifying a Form

This Help topic describes features that are available in XMap GIS Editor and XMap GIS Enterprise.
The functions available in a form depend on the permissions set by the database and Forms administrator.
You can create forms to use within a GIS layer in XMap and on PN-Series GPS devices. You can also modify forms as your organization's needs change. For more information about XMap Forms, see the Forms Overview.
To Create a Form
Use the following steps to create a form.
- To open the Create New Form dialog box, do one of the following:
- Click the GIS tab and ensure the Workspace tab is selected.
- Click Tools, point to Forms, and click Create. OR
- Right-click a layer in the workspace table, point to Forms, and click Create.

- In the toolbar, click the Forms menu button and click Create Forms.
- From the Choose Layer drop-down list, select the layer to which you are adding the form. Forms are associated with a layer. You cannot move a form from one layer to another.
- Type a name for the form in the Form Name box. For clarity, give each form a unique name within the layer. The form name appears in the title bar of the form when it is opened.
- From the Form Type drop-down list, select the type of form. Only the form types you can use with the layer are available in the list.
- XMap-only
These forms are based on the layer attributes you select.
- PN-compatible
These forms are for use with GIS point layers on Earthmate PN-Series GPS devices and support only certain attribute types. For example, document attributes cannot be displayed on a PN-Series GPS device.
If the layer is not classified and symbolized, the default red pushpin is used as the symbol on the device and it cannot be edited on the form. To choose symbols, use the Earthmate PN-Series symbol set. Do NOT use the geocaching symbols in that set to symbolize your layer. If you do, they will be sorted to the Geocaches Page on the device and the form will not work properly.
For more information about forms for PN-Series GPS devices, see PN-Compatible Forms.
For more information about sending forms to a PN-Series GPS, see Sending GIS Points and Forms.
- Custom
To create a custom form, you must first create and export an XMap-only form to a folder on your computer (the form is comprised of HTML and JavaScript files), edit the files using your own tools, and then zip the files and import them to use as a custom form. Custom forms cannot be used on a PN-Series GPS device. For help with custom forms, visit www.xmap.com/forms.
- Under Form Operations, select the actions the form allows the user to make. The available options depend on the layer type (For point layers, all three options are available. For polygon and line layers the Add option is not available.) and the form type. You can lock specific fields so they are view only (see step 10).
• View Data—The form user can only view the form.
- Edit Data—The form user can view and edit attributes for a selected geometry (GIS object).
- Add Data—The form user can use the form to add new geometries, as well as view and edit data.
- Allow Deletions—A button is added to the form; the user can delete the selected geometries from the layer. Use caution when enabling this feature. PN-compatible forms do not allow deletions.
- In the Form Description box, type a description for the form. This appears at the top of the form (HTML is allowed).
- Under Attributes in Layer, select the attributes from the layer that you want to add to the form. Note that if the fields in the attributes have constraints, it will affect what data appears on the form.
- Click the single arrow button (>) to move selected attributes to the Attributes in Form list. If you want to send all the attributes, you can click the double arrow button (>>) without selecting individual items.
Note To remove items from the Attributes in Form list, reverse this process.
- To lock an attribute field so that it cannot be edited in the form, click the check box next to it in the Attributes in Form list. A red lock icon appears next to the attribute. You can select multiple items to lock at the same time.
- To view the form immediately after you create it, select the Open form after editing check box. This is not available for PN-compatible forms.
- Click Create. (Note If you are modifying a form, click OK.) OR
If you are going to create a custom form, click Export.
OR
Click Cancel to exit the dialog.
To Modify a Form
Use the following steps to modify a form.
- To open the Manage Forms dialog box, do one of the following:
- Click the GIS tab and ensure the Workspace tab is selected.
- Click Tools, point to Forms, and click Manage. OR
- Right-click a layer in the workspace table, point to Forms, and click Manage.

- In the toolbar, click the Forms menu button and click Manage Forms.
- From the Layer drop-down list, select the layer with the form you want to modify or select All Layers.
- Select the form you want to update and click Modify. The Forms Designer dialog box opens. This provides the same options as the Create New Form dialog, except you cannot change the layer.
- Follow the steps in To Create a Form above to modify the form.
Opening a Form

This Help topic describes features that are available in XMap Professional, XMap GIS Editor, and XMap GIS Enterprise.
The functions available in a form depend on the permissions set by the database and Forms administrator.
Within XMap, you can use forms to change the attributes for one or more geometries. For more information about opening PN-compatible forms on a device, see Sending GIS Points and Forms.
Notes
- XMap designates some attributes as read only—a black lock icon 🔒 appears next to these fields on the form.
- For items the form creator had designated as read only, a red lock icon 🔒 appears next to the item.
• The title and description for a form are established when the form is created. - You can use the Undo and Redo buttons in the toolbar to reverse your changes until you commit them.
- For more information about XMap Forms, see the Forms Overview.
To Open a Form
Use the following steps to open a form.
- To open a form, do one of the following:
- Click the GIS tab and ensure the Workspace tab is selected.
- Click Tools, point to Forms, and click Open.
- Right-click a layer in the workspace table, point to Forms, and click Open.

- In the toolbar, click the Forms menu button and click Open Form.
- Assign a keyboard shortcut to the Open GIS Form command in the DeLorme scheme.
Note In the toolbar, Tools, and right-click menus, a list of the most recently used forms for the current project displays below the main options. Click a form to open it without using the Open Form dialog and skip to step 4.
- From the Layer drop-down list, select the layer with the form you want to open or select All Layers.
- Select the form in the list and then click Open.
-
With the form open, you can select the geometries (GIS objects) you want to view or edit in the form on the map or in the attributes table in the workspace. If you select multiple geometries, the values which are common to all of the selected geometries populate the form. This feature is useful for setting the same value for multiple objects.
-
On the map—Click the Selection tool on the toolbar and then click one geometry on the map or sweep select multiple geometries.
-
In the Attributes subtab—Select the geometry or geometries in the attributes table.
-
Depending on the form permissions, you can:
-
View information, including embedded documents. If you click a document link, the document is opened in view only mode.
- Edit information, including embedded documents.
- Change a point geometry's location
Click the button for the method you want to use to move the point:
- GPS—Ensure you have a GPS device connected to your computer and you have a 2-D or better GPS fix. The geometry moves to the current GPS location.
- Manual–Click the new location on the map.
- Map Center-Moves the geometry to the map center.
- Delete geometries
To delete the selected geometries, click the Delete button.
- Add new geometries
- Once you have finished using the form, click Close or close the dialog.
Managing Forms

This Help topic describes features that are available in XMap GIS Editor and XMap GIS Enterprise.
Use the Manage Forms dialog to view your existing forms, copy forms, and modify forms; it is available only when you have forms in the active layer. For more information about XMap Forms, see the Forms Overview.
To Manage Forms
Use the following steps to modify a form.
- To open the Manage Forms dialog box, do one of the following:
- Click the GIS tab and ensure the Workspace tab is selected.
- Click Tools, point to Forms, and click Manage. OR
- Right-click a layer in the workspace table, point to Forms, and click Manage.
- In the toolbar, click the Forms menu button Forms.

and click Manage
- You can do the following:
• View details about the form
Click the form in the list. Its details appear in the area below the form list.
- Open a form
Select a form or forms and then click Open.
- Modify a form
- Create a copy of a form
Select the form you want to copy and click Create Copy. The Forms Designer dialog box opens. You can modify the new form or just click OK to create an exact copy. If you do not rename the form, it is named "Copy of