
DES-6300 - Network switch D-LINK - Free user manual and instructions
Find the device manual for free DES-6300 D-LINK in PDF.


| Product Type | Managed Layer 2 Gigabit Ethernet Switch |
| Model | DES-6300 |
| Brand | D-Link |
| Ports | 24 x 10/100/1000 Mbps RJ-45, 4 x Gigabit SFP (Combo) |
| Switching Capacity | 48 Gbps |
| Forwarding Rate | 35.7 Mpps (64-byte packets) |
| MAC Address Table | 8K entries |
| VLAN Support | 802.1Q VLAN (up to 4K VLAN groups) |
| Management | Web GUI, SNMP v1/v2c/v3, CLI (Telnet/SSH), RMON |
| Dimensions (W x D x H) | 440 x 200 x 44 mm (19-inch rackmount) |
| Weight | 3.2 kg |
| Power Supply | Internal 100-240V AC, 50/60 Hz, 30W max |
| Features | IGMP snooping, STP/RSTP, QoS (802.1p), Link Aggregation (802.3ad), Port Mirroring |
| Cooling | 2 x fans |
| Operating Temperature | 0°C to 45°C |
| Storage Temperature | -10°C to 70°C |
| Humidity | 10% to 90% non-condensing |
| Safety Certifications | CE, FCC Class A, RoHS |
| Warranty | Limited lifetime warranty |
| Maintenance | Clean with dry cloth; avoid liquids; ensure ventilation |
| Spare Parts / Repairability | Power supply unit and fans replaceable; contact D-Link support |
Frequently Asked Questions - DES-6300 D-LINK
User questions about DES-6300 D-LINK
0 question about this device. Answer the ones you know or ask your own.
Ask a new question about this device
Download the instructions for your Network switch in PDF format for free! Find your manual DES-6300 - D-LINK and take your electronic device back in hand. On this page are published all the documents necessary for the use of your device. DES-6300 by D-LINK.
USER MANUAL DES-6300 D-LINK
First Edition (September 2002)
6DES6300..01
Printed In Taiwan

RECYCLABLE
Contents subject to change without prior notice.
All trademarks belong to their respective proprietors.
Copyright Statement
No part of this publication may be reproduced in any form or by any means or used to make any derivative such as translation, transformation, or adaptation without permission from the manufacturer, as stipulated by the United States Copyright Act of 1976.
FCC Warning
This equipment has been tested and found to comply with the limits for a Class A digital device, pursuant to Part 15 of the FCC Rules. These limits are designed to provide reasonable protection against harmful interference when the equipment is operated in a commercial environment. This equipment generates, uses, and can radiate radio frequency energy and, if not installed and used in accordance with this user's guide, may cause harmful interference to radio communications. Operation of this equipment in a residential area is likely to cause harmful interference in which case the user will be required to correct the interference at his own expense.
This device complies with part 15 of the FCC Rules. Operation is subject to the following two conditions: (1) This device may not cause harmful interference, and (2) this device must accept any interference received, including interference that may cause undesired operation.
CE Mark Warning
This is a Class A product. In a domestic environment, this product may cause radio interference in which case the user may be required to take adequate measures.
Warnung!
Overview of this User's Guide....v
Introduction 6
Fast Ethernet Technology 6
Gigabit Ethernet Technology....6
Switching Technology 7
Features 7
Chassis 7
Switch Modules....8
Unpacking and Setup.... 11
Unpacking....11
Setup....11
Desktop or Shelf Installation.... 11
Rack Installation 12
Installing Modules 12
Connecting a Terminal.... 14
Power on....14
Power Failure....14
Identifying External Components 15
Front Panel....15
Side Panels 15
Optional Plug-in Modules 16
DES-6303 10BASE-T/100BASE-TX Module 16
DES-6304 100BASE-FX (MT-RJ) Module.... 16
DES-6305 100BASE-FX (SC) Gigabit Module 17
DES-6306 1000BASE-SX (SC) Gigabit Module 17
DES-6307 1000BASE-LX (SC) Gigabit Module 18
DES-6308 1000BASE-T (RJ-45) Module.... 18
DES-6309 GBIC Module....19
Power Supply Modules 19
LED Indicators 19
Connecting The Switch....21
Switch to End Node 21
Switch to Hub or Switch 21
10BASE-T Device 21
100BASE-TX Device 22
1000BASE-T Device 22
100BASE-FX Device 22
1000BASE-SX Device 22
1000BASE-LX Device 22
Cable Lengths....22
Switch Management Concepts....24
IP Addresses and SNMP Community Names ...... 24
Traps 24
MIBs....25
Packet Forwarding....25
Aging Time 26
Filtering Database 26
Spanning Tree Algorithm 26
STA Operation Levels 27
User-Changeable STA Parameters 27
Illustration of STA 28
Port Trunking 29
VLANs & Broadcast Domains....30
MAC-based Broadcast Domains 30
802.1Q VLANs....31
Port-based VLANs 34
Broadcast Storms 34
Segmenting Broadcast Domains 34
Eliminating Broadcast Storms.... 34
Using ConfigMaster 36
Installation 37
General System Requirements.... 37
Installing ConfigMaster 37
Troubleshooting 43
Starting ConfigMaster 45
Error Log....46
Using ConfigMaster Windows 48
Setting ConfigMaster Options....50
The Front Panel Display 57
ConfigMaster Shortcuts....61
Using Tables 62
Working With Configuration Files 64
Managing the Device....68
Device Global Parameters....69
Device Features....71
Configuring VLANs 71
Working With VLANs....72
Configuring Ports 80
Port Properties 80
Port Mirroring 86
Storm Control 87
Configuring GVRP and Trunking....89
GVRP 89
Trunk....94
Configuring Bridging....100
Operating Parameters 100
Unicast 101
Spanning Tree....104
Rapid Spanning Tree 113
Configuring Routing 120
IP 120
IPM 156
IPX....174
Configuring Security Options.... 194
Community Table.... 194
Configuring Quality of Service.... 196
Global Parameters.... 196
Profile Table 197
Working With Statistics 210
Element Statistics 210
Interface Statistics 215
Port Statistics....217
Working With Services 229
Device Tuning 229
Event Log 233
Refresh 234
Polling Configuration.... 234
Community Change 235
Ping 235
Refresh Device Software 237
Technical Specifications 239
Sample Configuration File 241
Index....243
ABOUT THIS GUIDE
This User's Guide tells you how to install your Modular Layer 3 Ethernet Switch, how to connect it to your Ethernet network, and how to set its configuration using either the built-in console interface or Web-based management.
Conventions
References in this manual to the DES-6300 are frequently written simply as “Switch” or “Switches” where the text applies to both models. Model numbers are normally used only to differentiate between specific Switches where necessary.
Unless differentiated by model number, all information applies to both models.
Overview of this User's Guide
◆ Chapter 1, “Introduction.” Describes the Switch and its features.
◆ Chapter 2, “Unpacking and Setup.” Helps you get started with the basic installation of the Switch.
◆ Chapter 3, “Identifying External Components.” Describes the front panel, side panels, optional plug-in modules, and LED indicators of the Switch.
◆ Chapter 4, “Connecting the Switch.” Tells how you can connect the Switch to your Ethernet network as well as providing an informational cable length table.
◆ Chapter 5, “Switch Management Concepts.” Talks about how to manage the Switch.
◆ Chapter 6, “Using ConfigMaster.” Tells how to use the built-in configuration software to change, set, and monitor Switch performance and security.
◆ Appendix A, “Technical Specifications.” Lists the technical specifications of the Switch.
◆ Appendix B, “RJ-45 Pin Specifications.” Shows the details and pin assignments for the RJ-45 receptacle/connector.
◆ Appendix C, “Sample Configuration File.”
1
INTRODUCTION
This section describes the features of the Switch, as well as giving some background information about Ethernet/Fast Ethernet, Gigabit Ethernet, and switching technology.
Fast Ethernet Technology
The growing importance of LANs and the increasing complexity of desktop computing applications are fueling the need for high performance networks. A number of high-speed LAN technologies are proposed to provide greater bandwidth and improve client/server response times. Among them, Fast Ethernet, or 100BASE-T, provides a non-disruptive, smooth evolution from the current 10BASE-T technology. The dominating market position virtually guarantees cost effective and high performance Fast Ethernet solutions in the years to come.
100Mbps Fast Ethernet is a standard specified by the IEEE 802.3 LAN committee. It is an extension of the 10Mbps Ethernet standard with the ability to transmit and receive data at 100Mbps, while maintaining the Carrier Sense Multiple Access with Collision Detection (CSMA/CD) Ethernet protocol.
Gigabit Ethernet Technology
Gigabit Ethernet is an extension of IEEE 802.3 Ethernet utilizing the same packet structure, format, and support for CSMA/CD protocol, full duplex, flow control, and management objects, but with a tenfold increase in theoretical throughput over 100Mbps Fast Ethernet and a one hundred-fold increase over 10Mbps Ethernet. Since it is compatible with all 10Mbps and 100Mbps Ethernet environments, Gigabit Ethernet provides a straightforward upgrade without wasting a company's existing investment in hardware, software, and trained personnel.
The increased speed and extra bandwidth offered by Gigabit Ethernet is essential to coping with the network bottlenecks that frequently develop as computers and their busses get faster and more users use applications that generate more traffic. Upgrading key components, such as your backbone and servers to Gigabit Ethernet can greatly improve network response times as well as significantly speed up the traffic between your subnets.
Gigabit Ethernet enables fast optical fiber connections to support video conferencing, complex imaging, and similar data-intensive applications. Likewise, since data transfers occur 10 times faster than Fast Ethernet, servers outfitted with Gigabit Ethernet NIC's are able to perform 10 times the number of operations in the same amount of time.
In addition, the phenomenal bandwidth delivered by Gigabit Ethernet is the most cost-effective method to take advantage of today and tomorrow's rapidly improving switching and routing internetworking technologies. And with expected advances in the coming years in silicon technology and digital signal processing that will enable Gigabit Ethernet to eventually operate over unshielded twisted-pair (UTP) cabling, outfitting your network with a powerful 1000Mbps-capable backbone/server connection creates a flexible foundation for the next generation of network technology products.
Switching Technology
Another key development pushing the limits of Ethernet technology is in the field of switching technology. A switch bridges Ethernet packets at the MAC address level of the Ethernet protocol transmitting among connected Ethernet, Fast Ethernet, or Gigabit Ethernet LAN segments.
Switching is a cost-effective way of increasing the total network capacity available to users on a local area network. A switch increases capacity and decreases network loading by making it possible for a local area network to be divided into different segments which don't compete with each other for network transmission capacity, giving a decreased load on each.
The switch acts as a high-speed selective bridge between the individual segments. Traffic that needs to go from one segment to another (from one port to another) is automatically forwarded by the switch, without interfering with any other segments (ports). This allows the total network capacity to be multiplied, while still maintaining the same network cabling and adapter cards.
For Fast Ethernet or Gigabit Ethernet networks, a switch is an effective way of eliminating problems of chaining hubs beyond the “two-repeater limit.” A switch can be used to split parts of the network into different collision domains, for example, making it possible to expand your Fast Ethernet network beyond the 205 meter network diameter limit for 100BASE-TX networks. Switches supporting both traditional 10Mbps Ethernet and 100Mbps Fast Ethernet are also ideal for bridging between existing 10Mbps networks and new 100Mbps networks.
Switching LAN technology is a marked improvement over the previous generation of network bridges, which were characterized by higher latencies. Routers have also been used to segment local area networks, but the cost of a router and the setup and maintenance required make routers relatively impractical. Today's switches are an ideal solution to most kinds of local area network congestion problems.
Features
The DES-6300 is a high performance modular switch platform that allows a customized array of Layer 2 and Layer 3 functions to be easily installed and managed in a single device. The Switch is ideal for expanding enterprise networks and environments where traffic volume and needs fluctuate.
Switch features include:
Chassis
The chassis is the main unit that modules and power supplies are installed into. A CPU module and a power supply module come preinstalled in the chassis.
Chassis features include:
◆ Six slots for installing networking modules (plus one slot reserved for the CPU)
◆ Two slots for installing redundant power supply modules
◆ 31.99 Gigabit/sec. (Gbps) backplane switching fabric
◆ Hot-swappable design for power supply modules
◆ Networking modules warm-swappable (except CPU module)
◆ Ears and screws for rack mounting
Switch Modules
The plug-in modules available for the switch are optional except for the CPU module. These modules are described below:
CPU Module
A single CPU module must be present and must be installed in first (uppermost) slot.
Layer 2 support includes:
♦ Layer 2 switching based on MAC address & VLAN ID
♦ Store and Forward packet switching
♦ Broadcast Storm rate filtering
◆ Supports static filtering (based on MAC address)
◆ Supports IEEE 802.1Q VLAN (Static VLAN)
♦ Proprietary simplified Port-based VLANs
♦ IEEE 802.1d Spanning Tree support
◆ Address table: 64K MAC address per switch
◆ 96 Static VLAN Entries (in IEEE 802.1Q VLANs mode)
◆ Supports 802.1p priority queuing (2 priority queues)
♦ Port Aggregation (Port-Trunking) Capability
♦ Port Mirroring
♦ IGMP snooping
◆ Head Of Line (HOL) Blocking Prevention
◆ RS-232 port for out-of-band management and system configuration
♦ Telnet Remote Configuration
◆ TFTP software upgrades, settings file and switch log uploads
♦ NMS (Net Management System)
♦ CLI (Command Line Interface)
◆ SNMP Agents:
MIB-II (RFC 1213)
RMON MIB (RFC 1757)
Bridge MIB (RFC 1493)
Supports four RMON (1, 2, 3, 9) groups
♦ Port Security
♦ BootP support
Layer 3 support includes:
◆ Support for DHCP Client
◆ Support RIP1 and RIP2 routing protocol
◆ Support OSFP routing protocol
◆ Support IGMP, IP Multicast packet filtering, support QoS (Quality of Service)
◆ Support Multicast Routing protocol: DVMRP, PIM DM
◆ Support Layer 3 Access Control List, (ACL)
Optional Modules:
DES-6303 10BASE-T/100BASE-TX Module
♦ Sixteen 10BASE-T/100BASE-TX ports
◆ Fully compliant with IEEE 802.3 10BASE-T, IEEE 802.3u 100BASE-TX
◆ All 10/100Mbps ports support NWay auto-negotiation
◆ Back pressure Flow Control support for half-duplex mode
- IEEE 802.3x-compliant Flow Control support for full duplex
DES-6304 100BASE-FX (MT-RJ) Module
◆ Twelve 100BASE-FX (MT-RJ) Fast Ethernet ports
◆ Fully compliant with IEEE 802.3u 100BASE-FX
- IEEE 802.3x compliant Flow Control support for full duplex
DES-6305 100BASE-FX (SC) Module
♦ Eight 100BASE-FX (SC) Fast Ethernet ports
◆ Connects to a 100BASE-FX device at full duplex.
◆ Fully compliant with IEEE 802.3u 100BASE-FX
◆ Supports Full-duplex operation only
♦ IEEE 802.3x-compliant Flow Control support
DES-6306 1000BASE-SX (SC) Module
◆ Two 1000BASE-SX (SC) Gigabit Ethernet ports
♦ Fully compliant with IEEE 802.3z
♦ Support full-duplex operation only
- IEEE 802.3x-compliant Flow Control support
DES-6307 1000BASE-LX (SC) Module
◆ Two 1000BASE-LX (SC) Gigabit Ethernet ports
◆ Fully compliant with IEEE 802.3z
◆ Support full-duplex operation only
♦ IEEE 802.3x-compliant Flow Control support
DES-6308 1000BASE-T (RJ-45) Module
◆ Two 1000BASE-T Gigabit Ethernet ports
◆ Connects to 1000BASE-T devices only at full duplex and auto-negotiating 10/100/1000 Mbps ports
◆ Fully compliant with IEEE 802.3ab
◆ Fully compliant with IEEE 802.1Q/P
◆ Back pressure Flow Control support for half-duplex mode
- IEEE 802.3x compliant Flow Control support for full duplex
DES-6309 GBIC Module
◆ Two GBIC Ethernet ports
♦ Fully compliant with IEEE 802.3z
♦ Support full-duplex operation only
♦ IEEE 802.3x-compliant Flow Control support
Power Supply Modules
♦ Dual power modules design
◆ Current sharing design
◆ Full redundant feature design to ensure continuous operation
◆ If one power module fails, the other will take over all current supply automatically
♦ Hot-swappable/Hot-pluggable
♦ Power management functions enabled
♦ Revolving handle design
◆ Input: 90 \~ 264 VAC, 47 \~ 63Hz
◆ Output: 3.3V 80A maximum, 12V 2A maximum
2
UNPACKING AND SETUP
This chapter provides unpacking and setup information for the Switch.
Unpacking
Open the shipping carton of the Switch and carefully unpack its contents. The carton should contain the following items:
♦ One switch chassis
♦ One management module (pre-installed in uppermost slot)
♦ One power supply module (pre-installed)
♦ One mounting kit: four mounting brackets and screws
♦ Four rubber feet with adhesive backing
♦ One AC power cord
♦ One console cable
♦ One printed copy of the Quickstart Guide
♦ One CD-ROM containing this User's Guide
If any item is found missing or damaged, please contact your local reseller for replacement.
Setup
The setup of the Switch can be performed using the following steps:
◆ The surface must support at least 5 kg.
◆ The power outlet should be within 1.82 meters (6 feet) of the device.
- Visually inspect the power cord and see that it is secured fully to the AC power connector.
♦ Make sure that there is proper heat dissipation from and adequate ventilation around the Switch. Do not place heavy objects on the Switch.
Desktop or Shelf Installation
When installing the Switch on a desktop or shelf, the rubber feet included with the device must be first attached. Attach these cushioning feet on the bottom at each corner of the device. Allow enough ventilation space between the device and the objects around it.

Figure 2-1. Switch installed on a Desktop or Shelf
Rack Installation
The Switch can be mounted in an EIA standard size, 19-inch rack, which can be placed in a wiring closet with other equipment. To install, attach the mounting brackets on the Switch's front panel (one on each side) and secure them with the screws provided.

Figure 2-2. Attaching the mounting brackets to the Switch
Then, use the screws provided with the equipment rack to mount the Switch in the rack.
Installing Modules
The DES-6300 supports up to 6 modules that can be installed into the module bays. Networking modules are warm-swappable, meaning they can be added and removed while power to the switch is
ON. After warm-swapping a networking module, the switch will automatically be rebooted. Make sure to use the Save Changes command to save the current configuration to NV-RAM before warm-swapping modules. The CPU module, however, is NOT hot-swappable. Removing or inserting the CPU module while the power is on may cause irreparable damage to the module and/or to the Switch itself. Further, make sure you have unplugged the power cord from the removable power supply module before inserting or removing it from the Switch.
CAUTION: Due to the high energy present in this system, extreme caution should be exercised whenever adding or removing system components. No element of this system may be installed or removed except by an authorized technician.

Figure 2-3. Removing a Blank Slot Cover
Modules can be installed into any free slot, except the CPU module. The CPU module must be installed in the uppermost (top) slot. To install a module, simply remove a blank slot cover and slide the module along the guide rails until it snaps firmly in place.

Figure 2-4. Installing a Module
Connecting a Terminal
The DES-6300 can perform basic switching functions without special configuration, but to use the Switch's advanced features you must first configure the unit through a terminal (a VT-100 serial data terminal or a computer running a VT-100 emulator). The connection is made through the Switch's Diagnostic RS-232 port, which is configured at the factory as follows:
| ◆ | B | a | u | d | R | a | t | e | : | |
| ◆ | D | a | t | a | B | i | t | s | : | |
| ◆ | P | a | r | i | t | y | : | |||
| ◆ | S | t | o | p | B | i | t | s | : | |
| ◆ | Flow | Control: | none | |||||||
The RS-232 port has a nine-socket D-shell connector with IBM-type DCE wiring, and can be connected to the terminal using an off-the-shelf RS-232 cable with the proper connectors for the terminal and the DES-6300.
Power on
Power up the DES-6300 as follows:
◆ Make sure the power module is properly installed in the device.
♦ Plug the device end of the supplied power cord firmly into the power inlet on the DES-6300's front panel of the redundant power supply.
◆ Plug the outlet end of the power cord firmly into a suitable AC outlet.
♦ Observe the DES-6300's LED indicators to make sure the Switch is operating correctly.
The DES-6300's LED indicators operate as follows during a normal power-up:
◆ All indicators blink momentarily to indicate a system reset.
◆ The Power indicator flashes for about 20 seconds while the switch prepares its run-time software and performs a self-test.
◆ The Power indicator begins shining steadily, and the remaining indicators begin reflecting port and system status.
Power Failure
As a precaution, the Switch should be unplugged in case of an impending power failure. When power is resumed, plug the Switch back in.
3
IDENTIFYING EXTERNAL COMPONENTS
This chapter describes the front panel, side panels, optional plug-in modules, and LED indicators of the Switch.
Front Panel
The front panel of the Switch consists nine slide-in module slots for networking modules, two slide-in module slots for power supply modules, an RS-232 communication port, and LED indicators.
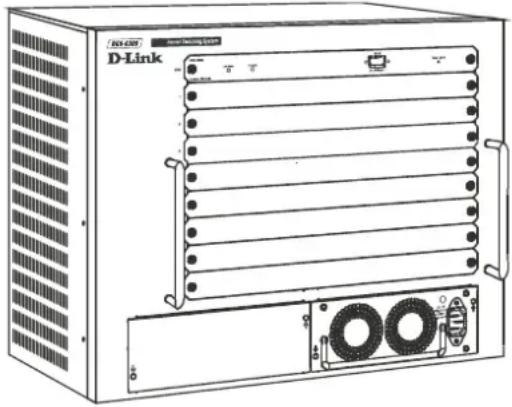
Figure 3-1. Front panel view of the Switch
The front panel features:
◆ Comprehensive LED indicators display the conditions of the Switch and status of the network. A description of these LED indicators follows (see LED Indicators).
◆ An RS-232 DCE console port is used to diagnose the Switch via a connection to a terminal (or PC) and Local Console Management.
♦ Seven slide-in module slots installing networking modules and the CPU module.
- Two slide-in module slots for installing power supply modules.
Side Panels
The left side panel of the Switch contains four system fans. The right side panel contains heat vents.
The system fans are used to dissipate heat. The sides of the system also provide heat vents to serve the same purpose. Do not block these openings, and leave adequate space at the rear and sides of the Switch for proper ventilation. Be reminded that without proper heat dissipation and air circulation, system components might overheat, which could lead to system failure.
Optional Plug-in Modules
The DES-6300 Modular Ethernet Switch is able to accommodate a range of plug-in modules in order to increase functionality and performance.
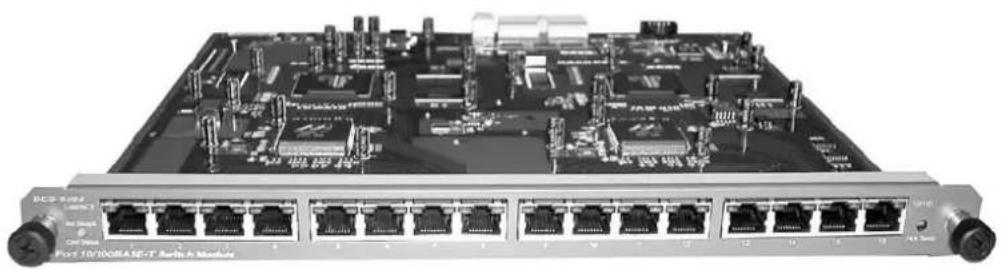
DES-6303 10BASE-T/100BASE-TX Module
natural_image
Front view of a network switch module with multiple Ethernet ports and circuit board (no visible text or labels)Figure 3-2. Sixteen-port, 10/100BASE-TX module
♦ Sixteen-port, front-panel module
◆ Connects to 10BASE-T and 100BASE-TX devices at full- or half-duplex
◆ Supports Category 3, 4, 5 or better UTP or STP connections of up to 100 meters each
DES-6304 100BASE-FX (MT-RJ) Module

natural_image
Front view of a network switch module with multiple Ethernet ports and circuit board (no visible text or labels)Figure 3-3. Twelve-port, 100BASE-FX (MT-RJ) module
♦ Twelve-port, front-panel module
◆ Connects to 100BASE-FX devices at full- or half-duplex
◆ Twelve 100BASE-FX (MT-RJ) Fast Ethernet ports
◆ Fully compliant with IEEE 802.3u 100BASE-FX
- IEEE 802.3x compliant Flow Control support for full duplex
DES-6305 100BASE-FX (SC) Gigabit Module

natural_image
Front view of a network switch module with visible circuit board and ports (no text or symbols on main body)Figure 3-4. Eight-port, 100BASE-FX (SC) module
♦ Eight-port, front panel module
◆ Connects to a 100BASE-FX device at full duplex
♦ Eight 100BASE-FX (SC) ports
◆ Fully compliant with IEEE 802.3u
◆ Supports full-duplex operation only
- IEEE 802.3x-compliant Flow Control support
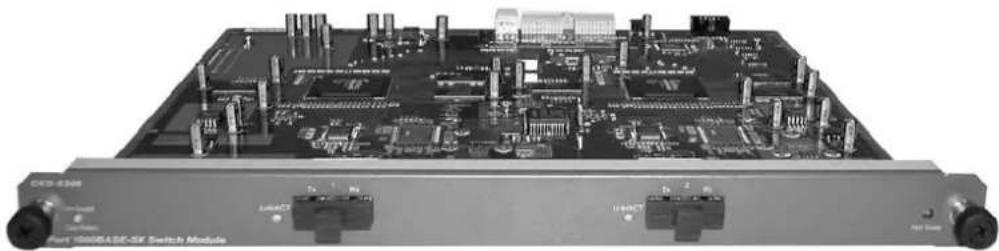
DES-6306 1000BASE-SX (SC) Gigabit Module
natural_image
Front view of a USB flash drive module with circuit board and ports (no visible text or symbols)Figure 3-5. Two-port, 1000BASE-SX gigabit module
◆ Two-port, front-panel module
◆ Connects to 1000BASE-SX devices at full duplex
◆ Two 1000BASE-SX (SC) Gigabit Ethernet ports
◆ Fully compliant with IEEE 802.3z
♦ Support full-duplex operation only
- IEEE 802.3x-compliant Flow Control support
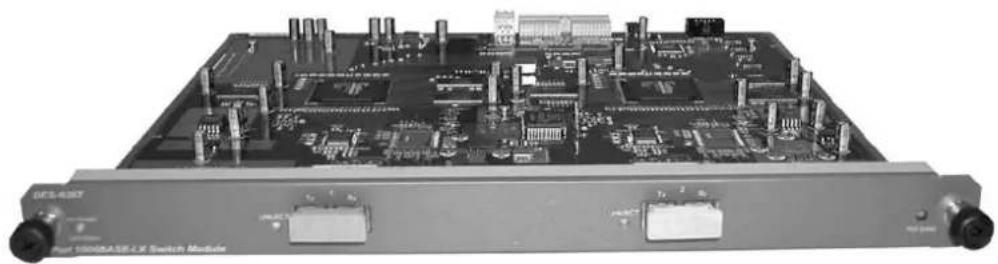
DES-6307 1000BASE-LX (SC) Gigabit Module
natural_image
Front view of a 100BASE-LX Switch Module with circuit board and ports (no visible text or symbols)Figure 3-6. Two-port, 1000BASE-LX gigabit module
◆ Two-port, front-panel module
◆ Connects to 1000BASE-LX devices at full duplex
◆ Two 1000BASE-LX (SC) Gigabit Ethernet ports
◆ Fully compliant with IEEE 802.3z
◆ Supports full-duplex operation only
♦ IEEE 802.3x-compliant Flow Control support
DES-6308 1000BASE-T (RJ-45) Module

natural_image
Front view of a network switch module with circuit board and ports (no visible text or symbols)Figure 3-7. Two-port, 1000BASE-T (RJ-45) module
◆ Two-port, front-panel module
◆ Connects to 1000BASE-T devices only at full duplex and auto-negotiating
◆ Two auto-sensing 10/100/1000 Mbps ports
◆ Fully compliant with IEEE 802.3ab
◆ Fully compliant with IEEE 802.1Q/P
◆ Back pressure Flow Control support for half-duplex mode
- IEEE 802.3x compliant Flow Control support for full duplex
DES-6309 GBIC Module

natural_image
Front view of a DES-430N microcontroller with visible circuit board and ports (no readable text or symbols)Figure 3-8. Two-port GBIC Module
◆ Two-port, front-panel module
◆ Connects to GBIC devices at full duplex
◆ Two GBIC Ethernet ports
◆ Fully compliant with IEEE 802.3z
◆ Supports full-duplex operation only
♦ IEEE 802.3x-compliant Flow Control support
Power Supply Modules
◆ Dual power modules design with current sharing design
◆ Full redundant feature design to ensure continuous operation—if one power module fails, the other will take over all current supply automatically
◆ Hot-swappable/Hot-pluggable capability
◆ Power management functions
◆ Input: 90 \~ 264 VAC, 47 \~ 63Hz
◆ Output: 3.3V 80A maximum, 12V 2A maximum
LED Indicators
The LED indicators of the Switch include CPU Status and Power OK. The following shows the LED indicators for the Switch along with an explanation of each indicator.

Figure 3-9. CPU Front Panel LED Indicators
◆ CPU Status – This center indicator on the front panel displays the current status of the switch. The LED will blink while the Power-On Self-Test (POST) is running during startup. It will light a steady green after the POST test to indicate the switch is powered on and operating properly. It will light amber when an error occurs during startup and the switch is therefore not functioning.
Power OK - This indicator lights green when the CPU module of the switch is receiving power and functioning properly.
4
CONNECTING THE SWITCH
This chapter describes how to connect the Switch to your Ethernet network as well as providing an informational cable length table.
Switch to End Node
End nodes include PCs outfitted with a Network Interface Card (NIC) and most routers. For twisted-pair (copper) connections, the RJ-45 UTP ports on NICs and most routers are MDI-II. When using a normal straight-through cable, an MDI-II port must connect to an MDI-X port.
An end node can be connected to the Switch via a two-pair Category 3, 4, 5 UTP/STP straight cable (be sure to use Category 5 UTP or STP cabling for 100BASE-TX Fast Ethernet connections). The end node should be connected to any of the sixteen ports (1x - 16x) on the 10BASE-T/100BASE-TX module. The LED indicators for the port the end node is connected to are lit according to the capabilities of the NIC. If LED indicators are not illuminated after making a proper connection, check the PC's LAN card, the cable, switch conditions, and connections.
The following LED indicator states are possible for an end node to switch connection:
- The 100M indicator comes ON for a 100 Mbps and stays OFF for 10 Mbps.
- The Link/Act indicator lights up upon hooking up a PC that is powered on.
Switch to Hub or Switch
These connections can be accomplished in a number of ways. For twisted-pair (copper) connections, the most important consideration is that when using a normal, straight-through cable, the connection should be made between a normal crossed port (Port 1x, 2x, etc.) and an Uplink (MDI-II) port. If you are using a crossover cable, the connection can be made from a normal crossed port to another crossed port.
◆ A 10BASE-T hub or switch can be connected to the Switch via a two-pair Category 3, 4 or 5 UTP/STP straight cable.
◆ A 100BASE-TX hub or switch can be connected to the Switch via a four-pair Category 5 UTP/STP straight cable.
If the other switch or hub contains an unused Uplink port, we suggest connecting the other device's Uplink (MDI-II) port to any of the switch's (MDI-X) ports (1x - 16x 100BASE-TX ports).
If the other device does not have an unused Uplink port, make the connection with a crossover cable from any of the twisted-pair ports on the switch to any normal twisted-pair port on the hub.
10BASE-T Device
For a 10BASE-T device, the Switch's LED indicators should display the following:
◆ 100M speed indicator is OFF.
◆ Link/Act indicator is ON.
100BASE-TX Device
For a 100BASE-TX device, the Switch's LED indicators should display the following:
◆ 100M speed indicator is ON.
◆ Link/Act indicator is ON.
1000BASE-T Device
For a 1000BASE-T device, the Switch's LED indicators should display the following:
◆ Link/Act indicator is ON.
100BASE-FX Device
For a 100BASE-FX device, the Switch's LED indicators should display the following:
◆ Link/Act indicator is ON.
1000BASE-SX Device
For a 1000BASE-SX device, the Switch's LED indicators should display the following:
◆ Link/Act indicator is ON.
1000BASE-LX Device
For a 1000BASE-LX device, the Switch's LED indicators should display the following:
◆ Link/Act indicator is ON.
Cable Lengths
| Standard | Media Type | MHz/km Rating | Maximum Distance |
| 1000BASE-SX | 50/125μm Multimode Fiber | 400 500 Meters | |
| 50/125μm Multimode Fiber | 500 550 Meters | ||
| 62.5/125μm Multimode Fiber | 160 | 220 Meters | |
| 62.5/125μm Multimode Fiber | 200 | 275 Meters | |
| 1000BASE-LX | 50/125μm Multimode Fiber | 400 500 Meters | |
| 50/125μm Multimode Fiber | 500 550 Meters | ||
| 62.5/125μm Multimode Fiber | 500 | 550 Meters | |
| 10μ Single-mode Fiber | 5000 Meters | ||
| 1000BASE-T | Category 5e UTP Cable (1000Mbps) | 100 Meters | |
| 100BASE-FX | 50/125μm Multimode Fiber (half-duplex operation) | 400 Meters |
| 50/125μm Multimode Fiber(full-duplex operation) | 2000 | Meters | ||
| 62.5/125μm Multimode Fiber(half-duplex operation) | 400 | Meters | ||
| 52.5/125μm Multimode Fiber(full-duplex operation) | 2000 | Meters | ||
| 100BASE-TX | Category 5 UTP Cable(100Mbps) | 100 | Meters | |
| 10BASE-T | Category 3 UTP Cable(10Mbps) | 100 | Meters |
Table 4-1. Cable Lengths
5
SWITCH MANAGEMENT CONCEPTS
This chapter discusses many of the features used to manage the switch, and explains many concepts and important points regarding these features. Configuring the Switch to implement these concepts is discussed in detail in the next chapters.
IP Addresses and SNMP Community Names
Each Switch has its own IP Address, which is used for communication with an SNMP network manager or other TCP/IP application (for example BOOTP, TFTP, etc.). You must provide the switch with an IP Address to meet the specification of your networking address scheme.
In addition, you can also set an IP Address for a gateway router. This becomes necessary when the network management station is located on a different IP network as the Switch, making it necessary for management packets to go through a router to reach the network manager, and vice-versa.
For security, you can set in the Switch a list of IP Addresses of the network managers that you allow to manage the Switch. You can also change the default Community Name in the Switch and set access rights of these Community Names.
Traps
Traps are messages that alert you of events that occur on the Switch. The events can be as serious as a reboot (someone accidentally turned OFF the Switch), or less serious like a port status change. The Switch generates traps and sends them to the network manager (trap managers). The following lists the types of events that can take place on the Switch.
◇ System resets
Errors
◇ Status changes
◇ Topology changes
◇ Operation
You can also specify which network managers may receive traps from the Switch by setting a list of IP Addresses of the authorized network managers.
Trap managers are special users of the network who are given certain rights and access in overseeing the maintenance of the network. Trap managers will receive traps sent from the Switch; they must immediately take certain actions to avoid future failure or breakdown of the network.
The following are trap types a trap manager will receive:
- Cold Start – This trap signifies that the Switch has been powered up and initialized such that software settings are reconfigured and hardware systems are rebooted. A cold start is different from a factory reset.
- Authentication Failure – This trap signifies that someone has tried to logon to the switch using an invalid SNMP community name. The switch automatically stores the source IP address of the unauthorized user.
- Link Change Event – This trap is sent whenever the link of a port changes from link up to link down or from link down to link up.
- Power Fan1 Failure – This trap is sent whenever one of the two fans on a redundant power supply module fails.
- Power Fan2 Failure – This trap is sent whenever one of the two fans on a redundant power supply module fails.
♦ End TFTP – This trap is sent when TFTP service ends.
♦ Abort TFTP – This trap is sent when TFTP service aborts.
♦ Start TFTP – This trap is sent when TFTP service starts.
♦ VLAN Dynamic Port Added – This trap is sent when a VLAN dynamic port is added.
♦ VLAN Dynamic Port Removed – This trap is sent when a VLAN dynamic port is removed.
MIBs
Management information and counters are stored in the Switch in the Management Information Base (MIB). The Switch uses the standard MIB-II Management Information Base module. Consequently, values for MIB objects can be retrieved from any SNMP-based network manager software. In addition to the standard MIB-II, the Switch also supports its own proprietary enterprise MIB as an extended Management Information Base. These MIBs may also be retrieved by specifying the MIB's Object-Identity (OID) at the network manager. MIB values can be either read-only or read-write.
Read-only MIBs variables can be either constants that are programmed into the Switch, or variables that change while the Switch is in operation. Examples of read-only constants are the number of ports and types of ports. Examples of read-only variables are the statistics counters such as the number of errors that have occurred, or how many kilobytes of data have been received and forwarded through a port.
Read-write MIBs are variables usually related to user-customized configurations. Examples of these are the Switch's IP Address, Spanning Tree Algorithm parameters, and port status.
If you use a third-party vendors' SNMP software to manage the Switch, a diskette listing the Switch's propriety enterprise MIBs can be obtained by request. If your software provides functions to browse or modify MIBs, you can also get the MIB values and change them (if the MIBs' attributes permit the write operation). This process however can be quite involved, since you must know the MIB OIDs and retrieve them one by one.
Packet Forwarding
The Switch learns the network configuration and uses this information to forward packets. This reduces the traffic congestion on the network, because packets, instead of being transmitted to all segments, are transmitted to the destination only. Example: if Port 1 receives a packet destined for a station on Port 2, the Switch transmits that packet through Port 2 only, and transmits nothing through the other ports.
Aging Time
The Aging Time is a parameter that affects the auto-learn process of the Switch in terms of the network configuration. Dynamic Entries, which make up the auto-learned-node address, are aged out of the address table according to the Aging Time that you set.
The Aging Time can be from 10 seconds to 9999 seconds. A very long Aging Time can result with the out-of-date Dynamic Entries that may cause incorrect packet filtering/forwarding decisions.
On the other hand, if the Aging Time is too short, many entries may be aged out soon, resulting in a high percentage of received packets whose source addresses cannot be found in the address table, in which case the Switch will broadcast the packet to all ports, negating many of the benefits of having a switch.
Filtering Database
A switch uses a filtering database to segment the network and control communications between segments. It also filters packets off the network for intrusion control (MAC Address filtering).
For port filtering, each port on the switch is a unique collision domain and the switch filters (discards) packets whose destination lies on the same port as where it originated. This keeps local packets from disrupting communications on other parts of the network.
For intrusion control, whenever a switch encounters a packet originating from or destined to a MAC address defined by the user, the switch will discard the packet.
Filtering includes:
Dynamic filtering – Automatic learning and aging of MAC addresses and their location on the network. Filtering occurs to keep local traffic confined to its segment.
MAC address filtering – The manual entry of specific MAC addresses to be filtered from the network.
Filtering done by the Spanning Tree Protocol – Able to filter packets based on topology, making sure that signal loops don't occur.
Filtering done for VLAN integrity – Packets from a member of a VLAN (VLAN 2, for example) destined for a device on another VLAN (VLAN 3) will be filtered.
Spanning Tree Algorithm
The Spanning Tree Algorithm (STA) in the Switch allows you to create alternative paths (with multiple switches or other types of bridges) in your network. These backup paths are idle until the Switch determines that a problem has developed in the primary paths. When a primary path is lost, the switch providing the alternative path will automatically go into service with no operator intervention. This automatic network reconfiguration provides maximum uptime to network users. The concept of the Spanning Tree Algorithm is a complicated and complex subject and must be fully researched and understood. Please read the following before making any changes.
Network loop detection and prevention – With STA, there will be only one path between any two LANs. If there is more than one path, forwarded packets will loop indefinitely. STA detects any looped path and selects the path with the lowest path cost as the active path, while blocking the other path and using it as the backup path.
Automatic topology re-configuration - When the path for which there is a backup path fails, the backup path will be automatically activated, and STA will automatically re-configure the network topology.
STA Operation Levels
STA operates on two levels: the bridge level and the port level. On the bridge level, STA calculates the Bridge Identifier for each Switch, then sets the Root Bridge and the Designated Bridges. On the port level, STA sets the Root Port and Designated Ports. Details are as follows:
On the Bridge Level
Root Bridge – The switch with the lowest Bridge Identifier is the Root Bridge. Naturally, you will want the Root Bridge to be the best switch among the switches in the loop to ensure the highest network performance and reliability.
Bridge Identifier - This is the combination of the Bridge Priority (a parameter that you can set) and the MAC address of the switch. Example: 4 00 80 c8 00 01 00, where 4 is the Bridge Priority. A lower Bridge Identifier results in a higher priority for the switch, and thus increases it probably of being selected as the Root Bridge.
Designated Bridge – From each LAN segment, the attached Bridge that has the lowest Root Path Cost to the Root Bridge is the Designated Bridge. It forwards data packets for that LAN segment. In cases where all Switches have the same Root Path Cost, the switch with the lowest Bridge Identifier becomes the Designated Bridge.
Root Path Cost - The Root Path Cost of a switch is the sum of the Path Cost of the Root Port and the Root Path Costs of all the switches that the packet goes through. The Root Path Cost of the Root Bridge is zero.
Bridge Priority - This is a parameter that users can set. The smaller the number you set, the higher the Bridge Priority is. The higher the Bridge Priority, the better the chance the Switch will be selected as the Root Bridge.
On the Port Level
Root Port - Each switch has a Root Port. This is the port that has the lowest Path Cost to the Root Bridge. In case there are several such ports, then the one with the lowest Port Identifier is the Root Port.
Designated Port - This is the port on each Designated Bridge that is attached to the LAN segment for which the switch is the Designated Bridge.
Port Priority - The smaller this number, the higher the Port Priority is. With higher Port Priority, the higher the probability that the port will be selected as the Root Port.
Path Cost - This is a changeable parameter and may be modified according to the STA specification. The 1000Mbps segment has an assigned Path Cost of 4, the 100Mbps segment has an assigned Path Cost of 19, and each 10Mbps segment has an assigned Path Cost of 100, based on the STA specifications.
User-Changeable STA Parameters
The factory default setting should cover the majority of installations. However, it is advisable to keep the default settings as set at the factory, unless it is absolutely necessary. The user changeable parameters in the Switch are as follows:
Bridge Priority - A Bridge Priority can be from 0 to 65535. 0 is equal to the highest Bridge Priority.
Bridge Hello Time - The Hello Time can be from 1 to 10 seconds. This is the interval between two transmissions of BPDU packets sent by the Root Bridge to tell all other Switches that it is indeed the Root Bridge. If you set a Hello Time for your Switch, and it is not the Root Bridge, the set Hello Time will be used if and when your Switch becomes the Root Bridge.
Note: The Hello Time cannot be longer than the Max. Age. Otherwise, a configuration error will occur.
Bridge Max. Age – The Max. Age can be from 6 to 40 seconds. At the end of the Max. Age, if a BPDU has still not been received from the Root Bridge, your Switch will start sending its own BPDU to all other Switches for permission to become the Root Bridge. If it turns out that your Switch has the lowest Bridge Identifier, it will become the Root Bridge.
Bridge Forward Delay - The Forward Delay can be from 4 to 30 seconds. This is the time any port on the Switch spends in the listening state while moving from the blocking state to the forwarding state.
Observe the following formulas when you set the above parameters:
$$ \text { Max. Age } \leq 2 x (\text { Forward Delay } - 1 \text { second }) $$
$$ \text { Max. Age } \geq 2 x (\text { Hello Time } + 1 \text { second }) $$
Port Priority - A Port Priority can be from 0 to 255. The lower the number, the greater the probability the port will be chosen as the Root Port.
Illustration of STA
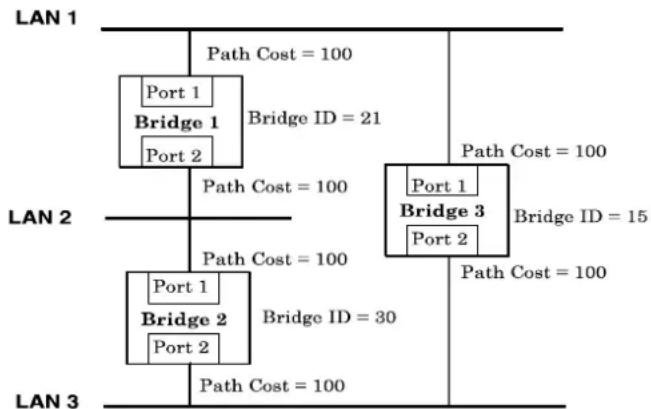
A simple illustration of three Bridges (or the Switch) connected in a loop is depicted in Figure 5-1. In this example, you can anticipate some major network problems if the STA assistance is not applied. For instance, if Bridge 1 broadcasts a packet to Bridge 2, Bridge 2 will broadcast it to Bridge 3, and Bridge 3 will broadcast it to Bridge 1 and so on. The broadcast packet will be passed indefinitely in a loop, causing a serious network failure.
To alleviate network loop problems, STA can be applied as shown in Figure 5-2. In this example, STA breaks the loop by blocking the connection between Bridge 1 and 2. The decision to block a particular connection is based on the STA calculation of the most current Bridge and Port settings. Now, if Bridge 1 broadcasts a packet to Bridge 3, then Bridge 3 will broadcast it to Bridge 2 and the broadcast will end there.
STA setup can be somewhat complex. Therefore, you are advised to keep the default factory settings and STA will automatically assign root bridges/ports and block loop connections. However, if you need to customize the STA parameters, refer to Table 5-1.
flowchart
graph TD
    A["LAN 1"] --> B["Port 1"]
    B --> C["Bridge 1"]
    C --> D["Port 2"]
    D --> E["Path Cost = 100"]
    F["LAN 2"] --> G["Port 1"]
    G --> H["Bridge 2"]
    H --> I["Port 2"]
    I --> J["Path Cost = 100"]
    K["LAN 3"] --> L["Port 1"]
    L --> M["Bridge 3"]
    M --> N["Port 2"]
    N --> O["Path Cost = 100"]
    C --> P["Bridge ID = 21"]
    M --> Q["Bridge ID = 15"]
    style A fill:#f9f,stroke:#333
    style F fill:#f9f,stroke:#333
    style K fill:#f9f,stroke:#333
Figure 5-1. Before Applying the STA Rules

flowchart
graph TD
    subgraph LAN 1
        A["Port 1"] --> B["Bridge 1"]
        B --> C["Port 2"]
        D["Root Port"] --> E["Designated Port"]
    end
    subgraph LAN 2
        F["Port 1"] --> G["Bridge 2"]
        G --> H["Port 2"]
        I["Block Path"] --> J["Designated Port"]
        K["Root Path Cost = 0"] --> L["Bridge ID = 15"]
        M["Root Path Cost = 100"] --> N["Bridge ID = 30"]
    end
    subgraph LAN 3
        O["Port 1"] --> P["Bridge 3"]
        Q["Port 2"] --> R["Designated Port"]
    end
Figure 5-2. After Applying the STA Rules
| STA parameters Settings Effects Comment | |||
| Bridge Priority | lower the #, higher the priority | Increases chance of becoming the Root Bridge | Avoid, if the switch is used in workgroup level of a large network |
| Hello Time | 1 - 10 sec. | No effect, if not Root Bridge | Never set greater than Max. Age Time |
| Max. Age Time | 6 - 40 sec. | Compete for Root Bridge, if BPDU is not received | Avoid low number for unnecessary reset of Root Bridge |
| Forward Delay | 4 - 30 sec. | High # delays the change in state | Max. Age ≤ 2 x (Forward Delay - 1) Max. Age ≥ 2 x (Hello Time + 1) |
| Port Level STA parameters | |||
| Enable/Disable | Enable/Disable | Enable or disable this LAN segment | Disable a port for security or problem isolation |
| Port Priority | lower the #, higher the priority | Increases chance of become Root Port | |
Table 5-1. User-selective STA parameters
Port Trunking
Port trunking is used to combine a number of ports together to make a single high-bandwidth data pipeline. The participating parts are called members of a trunk group, with one port designated as the anchor of the group. Since all members of the trunk group must be configured to operate in the same manner, all settings changes made to the anchor port are applied to all members of the trunk group. Thus, when configuring the ports in a trunk group, you only need to configure the anchor port.
The Switch supports up to 16 trunk groups. Each module on the switch supports up to two trunk groups except gigabit modules, which support a single trunk group. The Switch treats all ports in a trunk group as a single port. As such, trunk ports will not be blocked by Spanning Tree.
Data transmitted to a specific host (destination address) will always be transmitted over the same port in a trunk group. This allows packets in a data stream to arrive in the same order they were sent. A trunk connection can be made with any other switch that maintains host-to-host data streams over a
single trunk port. Switches that use a load-balancing scheme that sends the packets of a host-to-host data stream over multiple trunk ports cannot have a trunk connection with the Switch.
VLANs & Broadcast Domains
VLANs are a collection of users or switch ports grouped together in a secure, autonomous broadcast and multicast domain. The main purpose of setting up VLANs on a network is to limit the range and effects of broadcast packets, which can develop into broadcast storms and seriously impair network performance.
Three types of VLANs and broadcast domains are implemented on the switch: 802.1Q VLANs, port-based VLANs, and MAC-based broadcast domains. Only one of the three types can be active on the switch at any given time, however. Thus, you will need to choose the type of VLAN or broadcast domain you wish to setup on your network and configure the switch accordingly. MAC-based broadcast domains and port-based VLANs are limited to the switch and devices directly connected to it, while 802.1Q VLANs support IEEE 802.1Q tagging, which enables them to span the entire network (assuming all switches on the network are IEEE 802.1Q-compliant).
All VLANs allow a network to be segmented in order to reduce the size of broadcast domains. All broadcast, multicast, and unknown packets entering the switch on a particular VLAN or broadcast domain will only be forwarded to the stations (MAC-based) or ports (802.1Q and Port-based) that are members of that VLAN or broadcast domain. 802.1Q VLANs can also be setup to limit unicast packets to members of a particular VLAN, thus providing a degree of security to your network.
Another benefit of 802.1Q and port-based VLANs is that you can change the network topology without physically moving stations or changing cable connections. Stations can be 'moved' to another VLAN and thus communicate with members and share resources on the new VLAN, simply by changing the port VLAN settings from one VLAN (the sales VLAN, for example) to another VLAN (the marketing VLAN). This allows VLANs to accommodate network moves, changes and additions with the utmost flexibility. MAC-based broadcast domains, on the other hand, allow a station to be physically moved yet still belong to the same broadcast domain without having to change configuration settings.
The untagging feature of IEEE 802.1Q VLANs allows VLANs to work with legacy switches and NICs that don't recognize VLAN tags in packet headers. The tagging feature allows VLANs to span multiple 802.1Q-compliant switches through a single physical connection and allows Spanning Tree to be enabled on all ports and work normally.
MAC-based Broadcast Domains
The Switch supports up to 12 MAC-based broadcast domains, which are by their nature, limited to the switch itself and the devices connected directly to it.
Since MAC addresses are hard-wired into a station's network interface card (NIC), MAC-based broadcast domains enable network managers to move a station to a different physical location on the network and have that station automatically retain its broadcast domain membership. This provides the network with a high degree of flexibility since even notebook PC's can plug into any available port on a network and communicate with the same people and use the same resources that have been allocated to the broadcast domain in which it is a member.
Since MAC-based broadcast domains do not restrict the transmission of known unicast frames to other broadcast domains, they can only be used to define limited broadcast domains. As such, they are best implemented on networks where stations are frequently moving, for example where people using notebook PCs are constantly plugging into different parts of the network.
Setting up MAC-based broadcast domains is a relatively straight-forward process. Simply create the broadcast domain by assigning it a name (description) and add MAC addresses for the stations that will be members.
802.1Q VLANs
The Switch supports up to 2048 802.1Q VLANs. 802.1Q VLANs limit traffic that flows into and out of switch ports. Thus, all devices connected to a port are members of the VLAN(s) the port belongs to, whether there is a single computer directly connected to a switch, or an entire department.
On 802.1Q VLANs, NICs do not need to be able to identify 802.1Q tags in packet headers. NICs send and receive normal Ethernet packets. If the packet's destination lies on the same segment, communications take place using normal Ethernet protocols. Even though this is always the case, when the destination for a packet lies on another Switch port, VLAN considerations come into play to decide if the packet gets dropped by the Switch or delivered.
There are two key components to understanding 802.1Q VLANs; Port VLAN ID numbers (PVIDs) and VLAN ID numbers (VIDs). Both variables are assigned to a switch port, but there are important differences between them. A user can only assign one PVID to each switch port. The PVID defines which VLAN a packet belongs to when packets need to be forwarded to another switch port or somewhere else on the network. On the other hand, a user can define a port as a member of multiple VLANs (VIDs), allowing the segment connected to it to receive packets from many VLANs on the network. These two variables control a port's ability to transmit and receive VLAN traffic, and the difference between them provides network segmentation, while still allowing resources to be shared across more than one VLAN.
802.1Q VLAN Segmentation
The following example is helpful in explaining how 802.1Q VLAN segmentation works. Take a packet that is transmitted by a machine on Port 1 that is a member of VLAN 2 and has the Port VLAN ID number 2 (PVID=2). If the destination lies on another port (found through a normal forwarding table lookup), the Switch then looks to see if the other port (Port 10) is a member of VLAN 2 (and can therefore receive VLAN 2 packets). If port 10 is not a member of VLAN 2, then the packet will be dropped by the Switch and will not reach its destination. If Port 10 is a member of VLAN 2, the packet will go through. This selective forwarding feature based on VLAN criteria is how VLANs segment networks. The key point being that Port 1 will only transmit on VLAN 2, because it's Port VLAN ID number is 2 (PVID=2).
Sharing Resources Across 802.1Q VLANs
Network resources such as printers and servers however, can be shared across 802.1Q VLANs. This is achieved by setting up overlapping VLANs as shown in the diagram below.

flowchart
graph TD
    A["DES-5003"] -->|VLAN 1| B["Workstations"]
    A -->|VLAN 2| C["Server Network"]
    A -->|VLAN 3| D["Workstations Graphics"]
    B -->|PVIDs = 1| E["Computer"]
    C -->|PVID = 3| F["Computer"]
    D -->|PVIDs = 2| G["Computer"]
Figure 5-3. Example of typical VLAN configuration
In the above example, there are three different 802.1Q VLANs and each port can transmit packets on one of them according to their Port VLAN ID (PVID). However, a port can receive packets on all VLANs (VID) that it belongs to. The assignments are as follows:
| Port PVID | |
| Port 1 1 | |
| Port 4 1 | |
| Port 13 2 | |
| Port 16 2 | |
| Port 9 3 | |
| Ports VID | |
| 1,4,9 | 1 |
| 9,13,16 | 2 |
| 1,4,9,13, 16 | 3 |
Table 5-2. VLAN assignments for Figure 5-4
The server attached to Port 9 is shared by VLAN 1 and VLAN 2 because Port 9 is a member of both VLANs (it is listed as a member of VID 1 and 2). Since it can receive packets from both VLANs, all ports can successfully send packets to it. Ports 1 and 4 send these packets on VLAN 1 (their PVID=1), and Ports 13 and 16 send these packets on VLAN 2 (PVID=2). The third VLAN (PVID=3) is used by the server to transmit files that had been requested on VLAN 1 or 2 back to the computers. All computers that use the server will receive transmissions from it since they are all located on ports which are members of VLAN 3 (VID=3).
802.1Q VLANs Spanning Multiple Switches
802.1Q VLANs can span multiple switches as well as your entire network. Two considerations to keep in mind while building VLANs of this sort are whether the switches are IEEE 802.1Q-compliant and whether VLAN packets should be tagged or untagged.
Definitions of relevant terms are as follows:
Tagging – The act of putting 802.1Q VLAN information into the header of a packet. Tagging ports will put the VID number, priority, and other VLAN information into all packets that flow into and out it. If a packet has previously been tagged, the port will not alter the packet, thus keeping the VLAN information intact. Tagging is used to send packets from one 802.1Q-compliant device to another.
- Untagging – The act of stripping 802.1Q VLAN information out of the packet header. Untagging ports will take all VLAN information out of all packets that flow into and out of a port. If the packet doesn't have a VLAN tag, the port will not alter the packet, thus keeping the packet free of VLAN information. Untagging is used to send packets from an 802.1Q-compliant switch to a non-compliant device.
- Ingress port – A port on a switch where packets are flowing into the switch. If an ingress port has the Ingress Filter enabled, the switch will examine each packet to determine whether or not it is a VLAN member and then take one of two actions: if the port is not a member of a VLAN, the packet will be dropped; if the port is a member of a VLAN, then the packet will be forwarded. Otherwise, if the Ingress Filter is disabled, then the switch will process any packet received at this port in its normal fashion.
Egress port - A port on a switch where packets are flowing out of the switch, either to another switch or to an end station, and tagging decisions must be made. If an egress port is connected to an 802.1Q-compliant device, tagging should be enabled so the other device can take VLAN data into account when making forwarding decisions (this allows VLANs to span multiple switches). If an egress connection is to a non-compliant switch or end-station, tags should be stripped so the (now normal Ethernet) packet can be read by the receiving device.
VLANs Over 802.1Q-compliant Switches
When switches maintaining the same VLANs are 802.1Q-compliant, it is possible to use tagging. Tagging puts 802.1Q VLAN information into each packet header, enabling other 802.1Q-compliant switches that receive the packet to know how to treat it. Upon receiving a tagged packet, an 802.1Q-compliant switch can use the information in the packet header to maintain the integrity of VLANs, carry out priority forwarding, etc.
Data transmissions between 802.1Q-compliant switches take place as shown below.

Figure 5-4. Data transmissions between 802.1Q-compliant switches
In the above example, step 4 is the key element. Because the packet has 802.1Q VLAN data encoded in its header, the ingress port can make VLAN-based decisions about its delivery: whether server #2 is attached to a port that is a member of VLAN 2 and thus, should the packet be delivered; the queuing priority to give to the packet, etc. It can also perform these functions for VLAN 1 packets as well, and, in fact, for any tagged packet it receives regardless of the VLAN number.
If the ingress port in step 4 were connected to a non-802.1Q-compliant device and was thus receiving untagged packets, it would tag its own PVID onto the packet and use this information to make forwarding decisions. As a result, the packets coming from the non-compliant device would automatically be placed on the ingress ports VLAN and could only communicate with other ports that are members of this VLAN.
Port-based VLANs
In port-based VLANs, broadcast, multicast and unknown packets will be limited to within the VLAN. Thus, port-based VLANs effectively segment your network into broadcast domains. Furthermore, ports can only belong to a single VLAN.
Because port-based VLANs are uncomplicated and fairly rigid in their implementation, they are best used for network administrators who wish to quickly and easily set up VLANs in order to limit the effect of broadcast packets on their network.
For the most secure implementation, make sure that end stations are directly connected to the switch. Attaching a hub, switch or other repeater to a port causes all stations attached to the repeater to become members of the Port-based VLAN.
To setup port-based VLANs, simply select one of 24 VLAN ID numbers, name the VLAN and specify which ports will be members. All other ports will automatically be forbidden membership, even dynamically as a port can belong to only one VLAN.
Broadcast Storms
Broadcast storms are a common problem on today's networks. Basically, they consist of broadcast packets that flood and/or are looped on a network causing noticeable performance degradation and, in extreme cases, network failure. Broadcast storms can be caused by network loops, malfunctioning NICs, bad cable connections, and applications or protocols that generate broadcast traffic, among others.
In effect, broadcast storms can originate from any number of sources, and once they are started, they can be self-perpetuating, and can even multiply the number of broadcast packets on the network over time. In the best case, network utilization will be high and bandwidth limited until the hop counts for all broadcast packets have expired, whereupon the packets will be discarded and the network will return to normal. In the worst case, they will multiply, eventually using up all the network bandwidth (although network applications will usually crash long before this happens), and cause a network meltdown.
Broadcast storms have long been a concern for network administrators with routers traditionally being used to prevent their occurrence, and if that failed, to at least limit their scope. However, with the advent of VLANs, switches are now able to limit broadcast domains better and cheaper than routers. Also, many switches, including the DES-6300 series, have broadcast sensors and filters built into each port to further control broadcast storms.
Segmenting Broadcast Domains
VLANs can be used to segment broadcast domains. They do this by forwarding packets only to ports in the same VLAN. Thus, broadcast packets will only be forwarded to ports that are members of the same VLAN. Other parts of the network are effectively shielded. As a result, the smaller the broadcast domain, the less effect a broadcast storm will have. Because VLANs are implemented at each switch port, they can be quite effective in limiting the scope of broadcast storms.
Eliminating Broadcast Storms
SNMP agents can be programmed to monitor the number of broadcast packets on switch ports and act on the data. When the number of broadcast packets on a given port rise past an assigned threshold, an action can be triggered. When enabled, the usual action is to block the port to broadcast frames, which discards all broadcast frames arriving at the port from the attached segment. Not only does this isolate the broadcast domain, but it actually starts removing broadcast packets from the affected segment. When the number of broadcast packets falls to an acceptable level (below a falling threshold), the SNMP agent can remove the blocking condition, returning the port to its normal operational state.
In the DES-6300 switch, the default rising threshold is met when more than 500 broadcast packets per second are being detected on a specified port. Once the rising threshold is surpassed for a duration of more than 5 seconds, it will trigger the broadcast storm rising action configured by the user. The default falling threshold is met if there are less than 250 broadcast packets per second. It is triggered once the duration is at least 30 seconds. The actions can easily be defined by using a normal SNMP management program or through the console interface.
6
USING CONFIGMASTER
ConfigMaster is an intricate SNMP-based network management system that operates as an applet and as an application. ConfigMaster configures, monitors, and troubleshoots networking devices both locally at the management console, or remotely using a standard Web browser. ConfigMaster provides real-time graphs from a wide selection of MIB variables that help monitor device performance.
ConfigMaster is accessed through a Graphic User Interface (GUI) that displays the actual device front panel. The panel indicators, such as the LEDs, are mirrored to the front panel display and are viewed by the network manager.
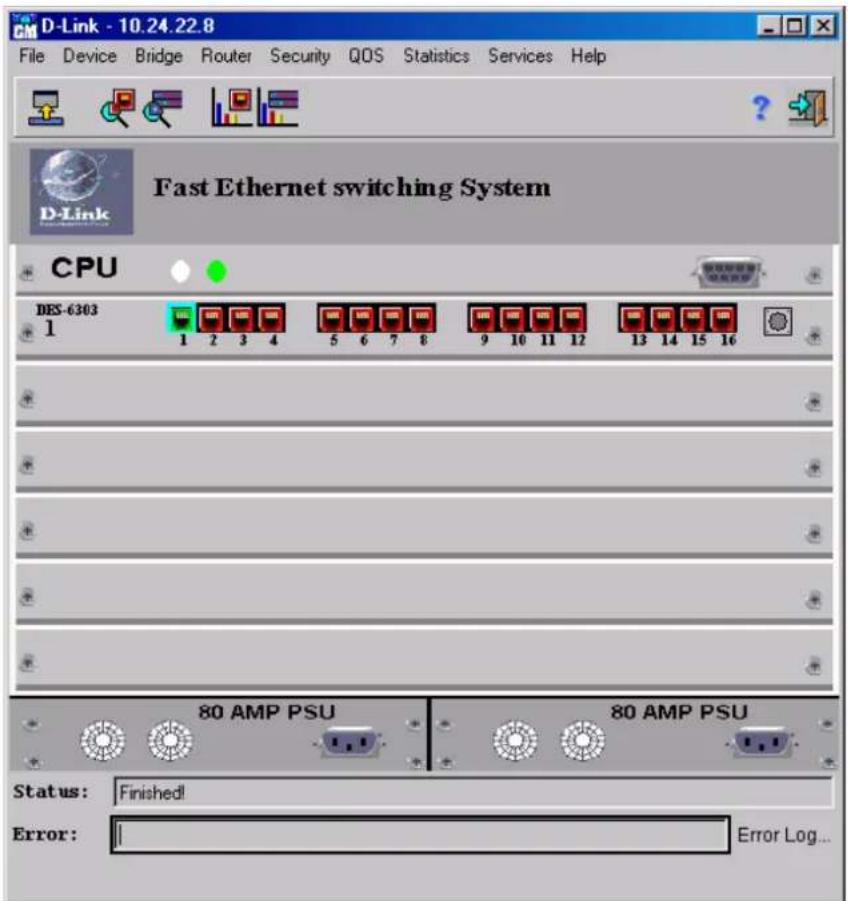
The main window displayed above is used for managing ConfigMaster. It also contains general information about other ConfigMaster windows and buttons, and describes how to add optional features to devices.
Installation
General System Requirements
To effectively operate ConfigMaster, the system requires that hardware and software meet system requirements.
Hardware Requirements
The hardware requirements are as follows:
♦ Pentium-based Machine.
◆ 32MB RAM (64MB RAM or more is recommended).
◆ 50 MB Hard Disk Space.
◆ CD-ROM Drive.
◆ 800x600 (minimum recommended) Screen Resolution.
◆ Windows NT 4.0, Windows 95, Windows 98, Windows ME, or Windows 2000 (Service Pack).
Software Requirements
The software requirements are as follows:
♦ Netscape Communicator Version 4.5 or above.
or
◆ Microsoft Internet Explorer Version 5.0 or above.
◆ Java Virtual Machine supporting Java version 1.1.7 and above.
In addition, ConfigMaster runs with:
♦ Sun JVM (JRE).
The DES-6300 has been verified to run with Microsoft's JVM (Wjview) and Sun's JVM (jREw). In case of JRE, we recommend not to use version 1.1.7A because of a known bug. If you decide to use SUN's JVM, it is included on the CD-ROM- "Util\Tools\jre117Bi-win32.exe".
If you don't have a JVM, you can download one of the following:
Sun's JVM (JRE) - http://java.sun.com/products/jdk/1.1/jre/index.html
Microsoft JVM (Jview) (comes with Microsoft Internet Explorer version 4.01 or above) – http://www.microsoft.com/windows/ie/download
To download just the Java Virtual Machine from Microsoft download the latest Microsoft VM from http://www.microsoft.com/java/vm/dl_vm40.htm
Note for Windows 2000 users only:
The Microsoft VM is included with the Windows 2000 operating system and can only be updated with a Windows 2000 hotfix or service pack release. A description of the Windows 2000 Windows File Protection (WFP) feature can be found in Microsoft Knowledge Base (KB) article number Q222193.
Installing ConfigMaster
To install ConfigMaster:
- The opening ConfigMaster Authentication key window is:
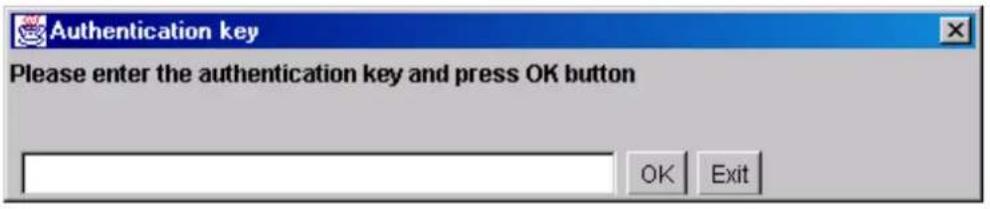
Figure 6-1. Authentication key window
- Enter the authentication key and press OK The ConfigMaster Setup window opens:

Figure 6-2. ConfigMaster Setup window
- Check the Accept checkbox and press opens: Next >. The Selecting the Installation Directory window

Figure 6-3. Selecting the Installation Directory window
- Enter the installation path and directory where you want to install ConfigMaster and press Next >. If the directory entered does not exist, the system automatically creates it. The default installation directory is c:/program files/. The Selecting the Internet Browser window opens:

Figure 6-4. Selecting the Internet Browser window
- Enter the Internet browser path and press Next >. The Setting the Java Interpreter window opens:

Figure 6-5. Selecting the Java Interpreter window
- Enter the Java Interpreter absolute path. The default location appears in the textbox. Enter the path of the file:
◆ Sun Java Interpreter—jrew.exe.
or
◆ Microsoft Java Interpreter—wjview.exe for Microsoft Internet Explorer.
- Press Next > . The Device List window opens:
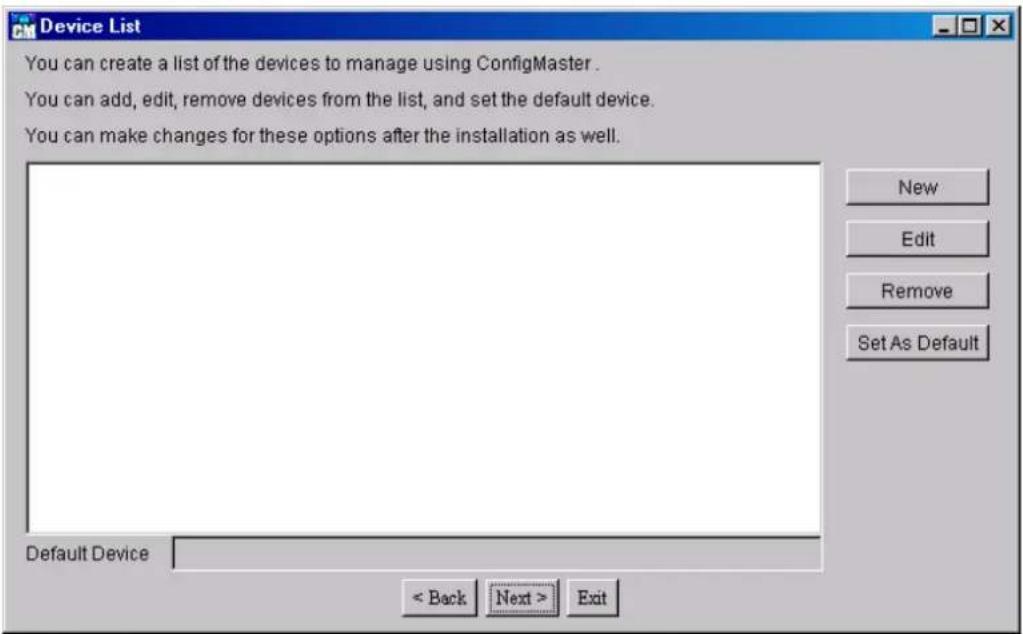
Figure 6-6. Device List window
- If required, create a list of devices (name and IP addresses) to facilitate device connection when running ConfigMaster. A default device can be set as the selected device.
Note: The Device List can be edited though the ConfigMaster menu. The Device List is edited though Options->Configuration->Device List.
- Press Next > . The Create Desktop and "Start Menu" Shortcut window opens:

Figure 6-7. Create Desktop and "Start Menu" Shortcut window
- Specify a name for the ConfigMaster Desktop shortcut and for the Start Menu shortcuts folder. If a shortcut is not required, uncheck the Create shortcuts checkbox.
- After checking the summary of the information, click Next >. To make corrections, click < Back The Installation Summary window opens:
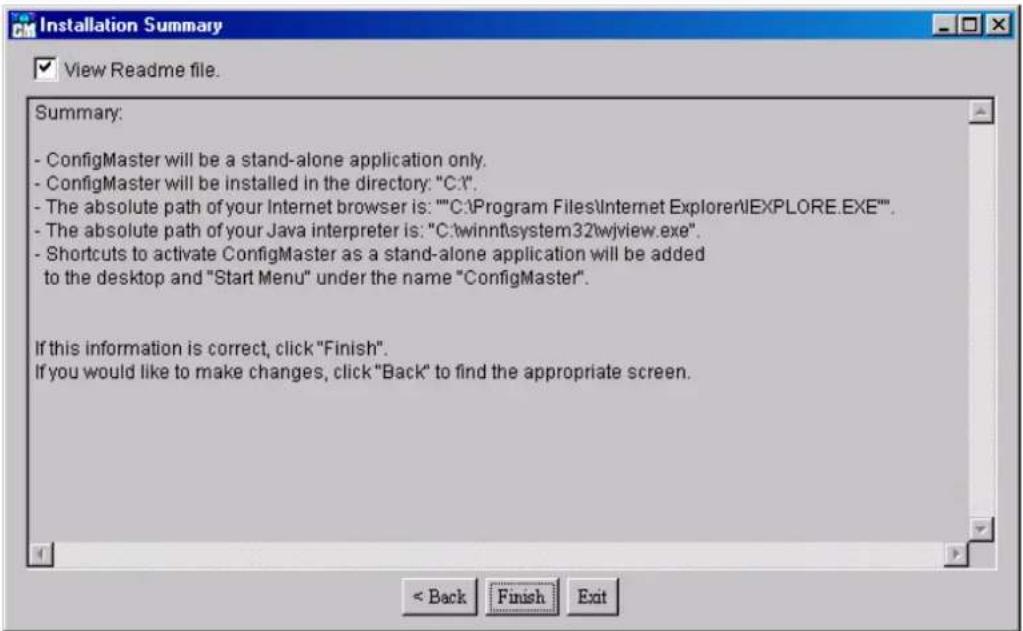
Figure 6-8. Installation Summary window
- Check the summary and if all the information is correct click Finish. If the information is incorrect, click < Back until the desired window displays. Modify the information and click Next > until the Installation Summary window opens.
- Click Finish. The installation process begins. When the installation process ends the ConfigMaster README File window opens:

Figure 6-9. ConfigMaster README file window
- Click OK. The Finished Installation window opens:

Figure 6-10. Finished Installation window
During installation, a script file called ConfigMaster.bat is created in the
Uninstalling ConfigMaster
Uninstall removes ConfigMaster and all of its components, including the configuration directory and its contents.
Note: Duplicate important files saved in the installation directory before uninstalling ConfigMaster.
To uninstall ConfigMaster:
- Select Start > Programs > D-Link Corporation (or the folder chosen as the default folder while installing ConfigMaster).
- Click Uninstall. The ConfigMaster files are removed from your computer.
Reinstalling ConfigMaster
To re-install ConfigMaster:
◆ Install the new software version without uninstalling the current version, unless the current version is older than version 6.4.
◆ For versions older than 6.4, ConfigMaster must first be uninstalled.
The installation procedure provides the existing program defaults and device lists. Files saved in the installation directory, such as the configuration files, are not erased from the disk.
Troubleshooting
ConfigMaster provides troubleshooting answers for the following issues that may arise when installing ConfigMaster:
♦ Very Slow Directory Discovery.
◆ Poor Web Performance With Windows 95.
♦ Cannot View Tables When Using A Browser.
◆ Local Intranet Use.
◆ ConfigMaster.bat Does Not Activate ConfigMaster.
Very Slow Directory Discovery
When clicking Browse to browse for a directory, the program detects all the drives defined on the system. If there is a slow network connection to any of these drives, it takes a few seconds until the browse window displays.
Poor Web Performance With Windows 95
Poor Web performance of ConfigMaster on Windows 95 may be caused by a problem in the Windows 95 winsock. There is a Microsoft patch to rectify the problem. This patch is on the ConfigMaster CD
Tools\W95ws2setup.exe. The patch can be downloaded from the Microsoft site: http://www.microsoft.com/windows/downloads/contents/Updates/W95Sockets2. Read the Tools\winsock2License.txt file before using this patch.
Cannot View Tables When Using A Browser
There are some compatibility problems between Microsoft and Sun JVMs (Java Virtual Machines). There could be a problem using one JVM as a client (Sun Netscape Browser or HotJava and Microsoft Internet Explorer), and the other as a server (Sun Jrew and Microsoft Wjview).
To avoid compatibility problems, ensure that the same propriety JVM is used for both client and server (i.e., Netscape or Hot Java browsers as clients and Sun JRE as a server, or, Microsoft Internet Explorer as a client and Wjview as a server).
Local Intranet Use
If the system uses a Web browser to access a local Intranet Web server, and there is a Proxy server installed for communication with the Internet, the Proxy server must be disabled when connecting to the Web server running ConfigMaster.
To disable the Proxy server:
- Configure the Proxy server not to pass out the Web server IP address (after configuring, reboot the client before connecting the Web server).
- Disable the Proxy client (WSP Client) in the Control Panel.
- Configure the browser to bypass the Proxy server when connecting the Web server IP address.
To configure the Internet Proxy with a Web server ID:
- Select Start > Settings > Control Panel. The Control Panel window opens.
- Click Internet Options. The Internet Options window opens.
- Click the Connections tab. The Connections tab opens.
- Click LAN Settings...
- In the Proxy server panel, select the two checkboxes and click Advanced to open the Proxy Settings window.
- In the Exceptions panel, enter the Web server IP address.
- Click OK
- Click OK in the Internet Options window.
ConfigMaster.bat Does Not Activate ConfigMaster
If running ConfigMaster.bat does not activate ConfigMaster and displays an error message regarding an invalid path, check if the command interpreter is 32-bit (MS-DOS Prompt or Command Prompt).
This error occurs if a 16-bit command interpreter, which does not support long filenames, runs the batch file.
Running the BER/ASCII Converter Without Running ConfigMaster
The BER/ASCII converter can run using the following batch file:/
The syntax is:
convert.bat
Where:
Starting ConfigMaster
To start the ConfigMaster application:
◆ Click on the desktop. or
♦ Select Start > Programs > D-Link Corporation > ConfigMaster. The ConfigMaster Main window opens:
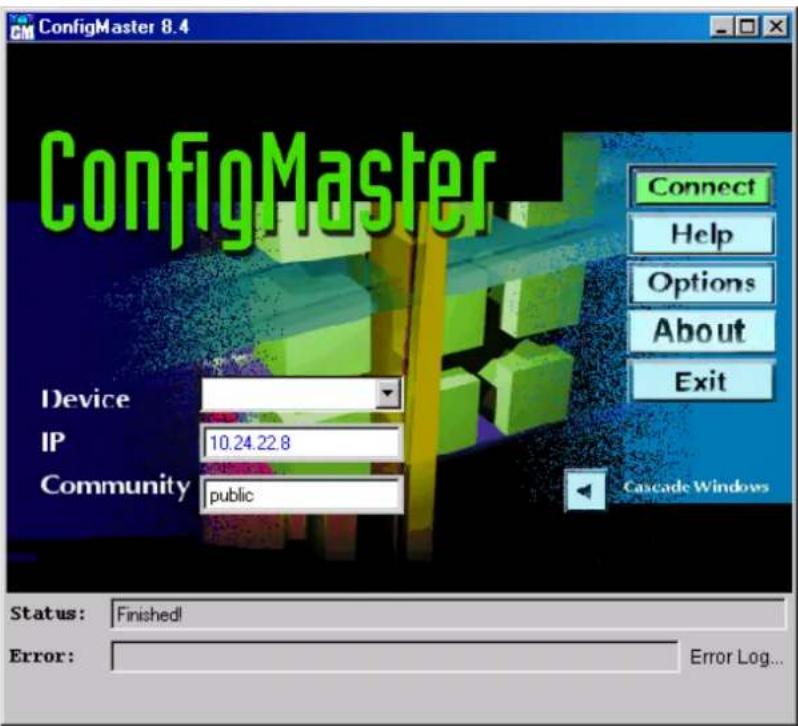
Figure 6-11. ConfigMaster main window
The ConfigMaster Main window displays the following information:
◆ Device – The user-defined names of frequently used devices, which appear in a drop-down list. The Device list can be added to and edited.
◆ IP – Indicates the device's IP address. IP addresses can be selected from the drop-list.
◆ Community – Displays a community name defined for the selected device.
◆ Connect – Click Connect to open the selected device front panel display.
◆ Help – Click Help to access ConfigMaster's on-line Help.
- Options – Click Options to set ConfigMaster options before starting the front panel display applet.
◆ About - Click About to see the date of the current software version.
◆ Cascade Windows – Click Cascade Windows to arrange all open windows in a cascade (except for the secondary windows such as Edit and Insert dialog boxes, confirmation messages, etc.).
- Error Log – Click Error Log... to display the ConfigMaster Error Log. The messages of this log are generally describe problems encountered while starting up the applet, for example, wrong IP addresses, unknown device names, unsuccessful calls to the server, etc.
Error Log
The Error Log contains information regarding errors that may have occurred while connecting to devices.
◆ To display the Error Log window, click Error Log... The following Error Log window opens:

Figure 6-12. Error Log window
There are three main connection errors:
◆ Device Error – Indicates that a connection was attempted to a non-existent device.
♦ Unknown Device – Indicates that a connection was attempted to a device that the system does not recognize.
♦ Version Unknown – Indicates that a connection was attempted with an obsolete version of the device.
Device Error
If a connection attempt is to a non-existing device, the following Device Error message is displayed prompting reconnection. The device IP address should be checked and re-entered.

Figure 6-13. Device Error window
To edit the IP address or Community:
◆ In the IP field, enter the correct IP address and click √.
To re-enter the IP address or Community:
- Click ✗. The fields are cleared.
- Re-enter the IP address and Community and click
To return to the Main Window:
◆ Close the Device Error window.
Unknown Device
The Unknown Device window is displayed when a connection is attempted to a device not supported by the system.
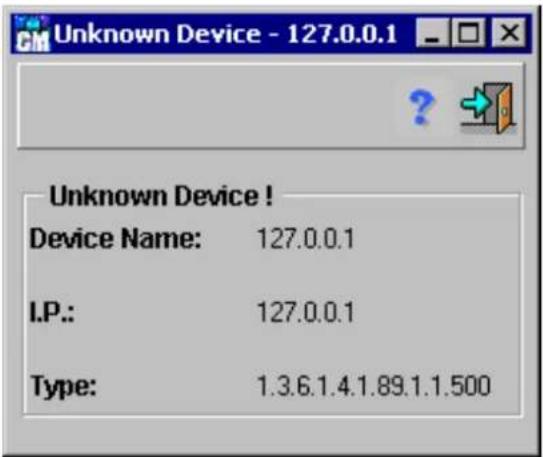
Figure 6-14. Unknown Device window
To re-enter the IP address:
- Close the Unknown Device window. The ConfigMaster Main window opens.
- Re-enter the IP address and click Connect.
Version Unknown
The Unknown Version window is displayed when a connection is attempted to an obsolete version of the device.

Figure 6-15. Unknown Version window
The following fields display:
- Current Version – Indicates the current version of ConfigMaster that is currently running.
- Supported Versions – Indicates the ConfigMaster versions supported
◆ Device Name – Identifies the user-defined device name.
♦ IP - Identifies the IP address.
♦ Type – Identifies the device type.
Using ConfigMaster Windows
ConfigMaster's GUI is windows based with a standardized screen layout. The following figure illustrates a typical screen layout.

Figure 6-16. Typical ConfigMaster window
The screen is divided into the following sections:
◆ Menu Bar.
♦ Toolbar.
♦ Error Log.
♦ Error Bar.
◆ Status Bar.
Menu Bar
Most windows opened directly from the front panel display contain a menu with various options. The most widely used options are:
♦ Refresh – Polls the device and shows new information.
♦ Set – Sends and updates new configurations to the device.
♦ Insert – Inserts a new row into a table.
- Edit – Allows information in a dialog box or table to be edited.
♦ Delete – Deletes information from a table.
◆ Close – Closes a dialog box or table.
Toolbar
ConfigMaster windows have toolbars for quick access to ConfigMaster options. Each window contains only those toolbar icons that are relevant to that window. The table below describes standard Toolbar icons used in the application.
ConfigMaster Toolbar Icons
| Icon | Function Relevant | Shortcut |
 | Polls the device and show current information. Ctrl+R | |
 | Sends new data from a window to the device and update the device. | Ctrl+S |
 | Opens a dialog box for inserting a table row.Remember to click √ to save modifications in the table. | Ctrl+L |
 | Opens a dialog box for editing table data.Remember to click √ to save modifications in the table. | Ctrl+E |
 | Deletes the selected table rows. Ctrl+D | |
 | Prints the current screen. Ctrl+P | |
 | Generates a graph. | |
 | Opens a previously stored graph configuration. | |
 | Undoes all changes since the last time was clicked. | |
 | Exits from the current screen and/or application | |
 | Sends table modifications or additions made in an Insert or Edit dialog box to the table. | Ctrl+U |
 | Cancels changes in an Insert or Edit window. | |
| [64CE] | Erases the data from the entire table. | |
 | Saves a trap to file in the Traps Table. | |
| Accesses the Statistics window. |
Table 6-1. ConfigMaster Toolbar Icons
Error Bar
Displays an explanation of an SNMP action that could not be carried out or that failed for any reason.
Status Bar
Indicates the last SNMP action status. The most common status bar messages are the following:
- Sending Data – Displayed when the device is reading or writing.
- Data Arriving – Displayed when the device is getting SNMP data.
♦ Finished – Displayed when a set or get action has been completed. - Sending Window Request! – Displayed when the device is searching for a window or table.
Setting ConfigMaster Options
The NMS options can be set before starting the applet. The method of accessing the General Options window is as follows: On the main window, click the Options button (or click Ctrl+O).
The General Options window opens:
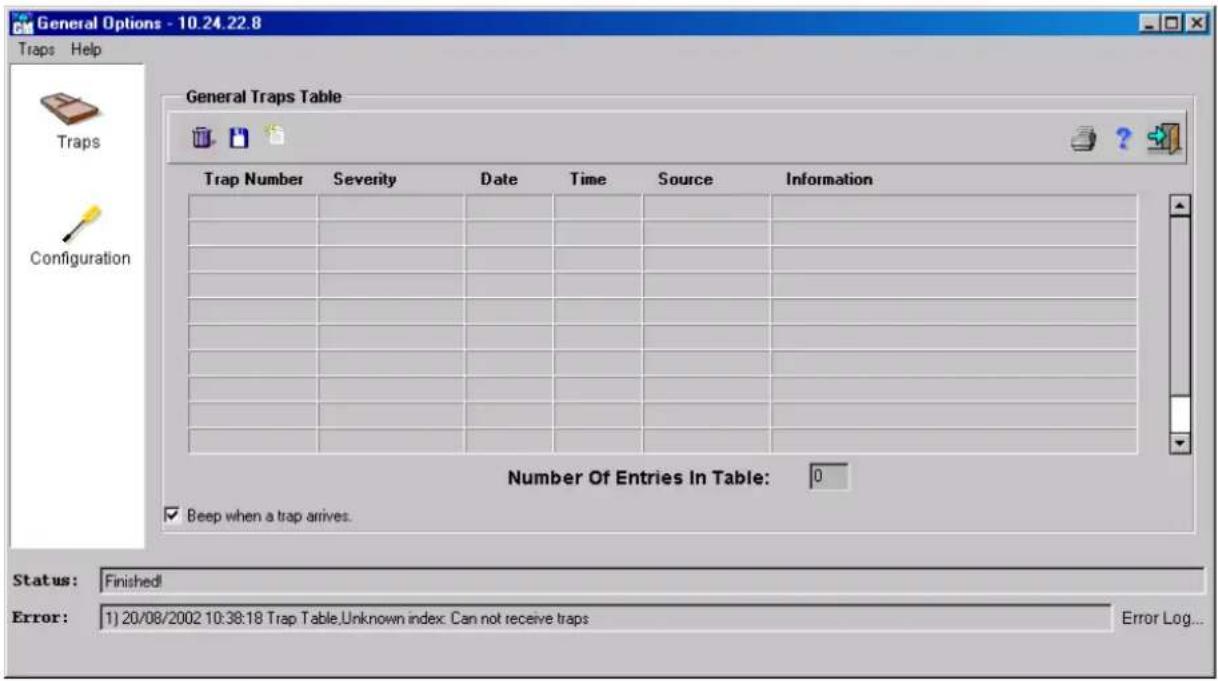
Figure 6-17. General Options window
The General Options window is divided into two panes, the left pane contains the screen functions, and the right pane contains corresponding function screen. The left pane always remains constant. Clicking on the function icons in the left pane toggles the right pane. In the General Options window left-hand pane, the following two icons are displayed:

Traps

Configuration
The General Options window displays the General Traps Table by default. Tables displaying system signal traps.
Displays the General Options - Configuration dialog box in the right pane. Used for modifying system configuration options.
Viewing the General Traps Table
With ConfigMaster, SNMP network events, or traps, can be viewed.
To view the General Traps Table:
◆ Click the icon in the left pane.
The General Traps Table is displayed in the right pane:

Figure 6-18. General Traps Table
The General Traps Table displays the following information:
- Trap Number - A consecutive number given to each event to make information retrieval more efficient.
- Severity – The event level, which can be one of the following: Informational, Warning, Error, or Fatal.
♦ Date and Time – When the trap occurred.
- Source – The device IP address sending the trap.
Information – An event description. For example, Link Up.
To view a device front panel display from the trap source:
◆ Double-click a trap in the General Traps Table to open the device front panel display that sent the trap.
To set an alarm when receiving traps:
- Click the "Beep when a trap arrived" checkbox to hear the beep every time a new trap arrives.
The General Traps Table has the following icons on the toolbar:
| Icon | Function |
| Delete General Traps Table entries. | |
| Save the General Traps Table. The Status bar displays the file path to which the trap has been saved:/Nms/Configuration/traps.dat. |
Configuring Trap Parameters
To configure the number of traps displayed in the General Traps Table and how many traps stored in a file:
◆ From the General Options window Menu Bar click 📄, then select Traps Configuration. The Saved traps window opens:

Figure 6-19. Saved traps window
The following parameters are displayed in the Saved traps window:
♦ Maximal number of traps to display – How many traps are displayed in the General Traps Table. By default, 500 traps can be displayed.
- Maximal number of traps to keep in file – How many traps to store in a file. The default value is 5000, i.e. 5000 traps are stored by the system in the file called autotraps.dat.
The maximal number of traps to keep on file must be greater than the maximal number of traps to display. For example, with maximal number of traps to display set to 100 and maximal number of traps to keep in file set to 300. If 150 new traps arrive, the most recent 100 traps are displayed in the Traps Table and the rest of the new traps (50 traps arrived earlier than the 100 traps displayed in the Table) are stored in the autotraps.dat file.
Enter the two parameters and click √. The configuration is saved and the General Traps Table opens.
General Options Configuration
In the left pane click / to display the General Options - Configuration window:
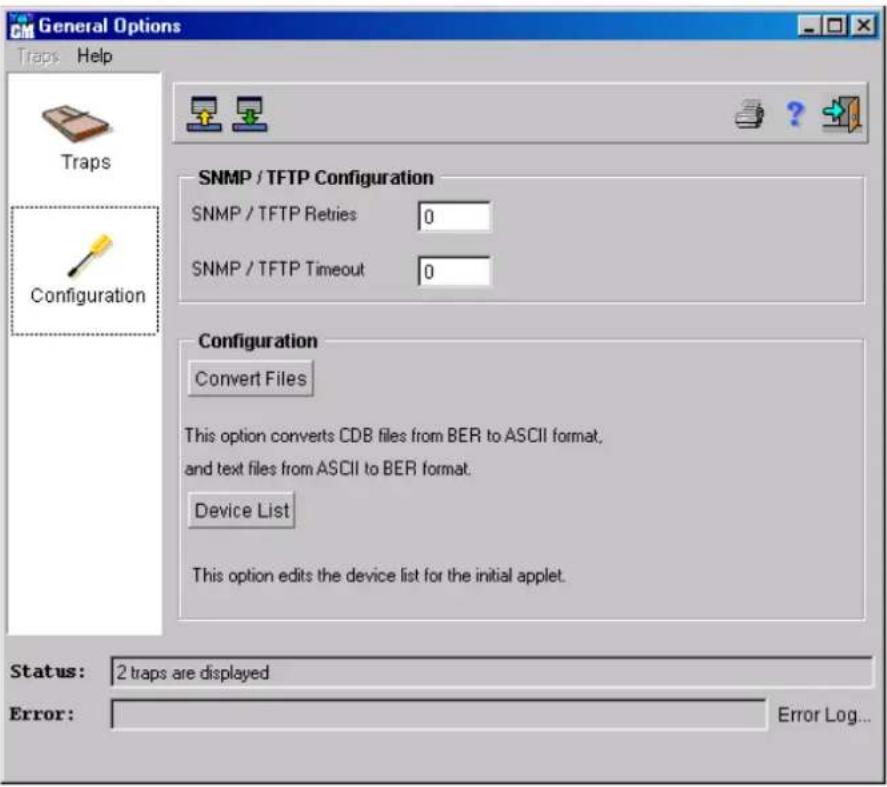
Figure 6-20. General Options - Configuration window
There are two configuration options:
◆ SNMP/TFTP Configuration.
◆ Configuration.
SNMP/TFTP Configuration
In the SNMP/TFTP Configuration area of the General Options - Configuration window, configure the options for sending requests to accommodate for different traffic loads.
To configure the SNMP/TFTP:
- In the SNMP/TFTP Retries field, enter the number of times that the device tries to reach the server.
- In the SNMP/TFTP Timeout field, enter the number of seconds the device waits for a response from the server before the request is timed out. After every new try, the number of seconds is doubled.
For example, if 3 is entered in the SNMP/TFTP Retries field and 1 in the SNMP/TFTP Timeout field, the device sends a request and wait for one second. If there is no response from the server after one second, the device tries again, waiting for two seconds. The third try lasts up to four seconds.
This doubling technique provides servers with more opportunities to respond to requests. ConfigMaster systems operating in traffic-heavy networks waits longer before timing out requests (i.e., make the SNMP/TFTP Timeout value large).
To reset the fields to the stored configuration on the system, click
◆ Click 📋. The options are entered into the system.
Configuration
The General Options widow allows for files conversions and editing both file and device configuration, and includes the following options:
♦ Converting Files.
♦ Editing the Device List.
Converting Files
Edit the Configuration File:
- In the General Options - Configuration window, click Convert Files to translate the configuration file from BER format to ASCII format.
- Edit the configuration file and then translate the file from ASCII format to BER format. The Configuration File - Conversion window opens:

Figure 6-21. Configuration File – Conversion window
- Enter the BER formatted file and target ASCII formatted file in the fields provided.
- Select the conversion direction BER to ASCII and click Edit ASCII File. The file is converted from BER to ASCII format.
- Edit the ASCII file.
- Select the conversion direction BER to ASCII and click Edit ASCII File. The file is converted back to BER format.
Note: The Edit Configuration File option can be also accessed via the front panel display Menu Bar command File >Configuration File >Edit Configuration File.
In addition to editing the Device List, the Device List can be used for:
Adding New entry to Device List – Adds new devices to the device list. Making a Device the Default – Provides information for defining a device as the default device on the device list.
♦ Modifying a Device – Provides information for modifying the device list.
Deleting a Device – Provides information for deleting a device from the device list.
Editing the Device List
Adding user-defined device names as default to the ConfigMaster Main window Device list, allows the display of a device front panel display by selecting its name from the Device list (without entering its IP address), and clicking Enter. In the General Options - Configuration window, click Edit Device List to manage the device list. The following Edit the Device List window opens:
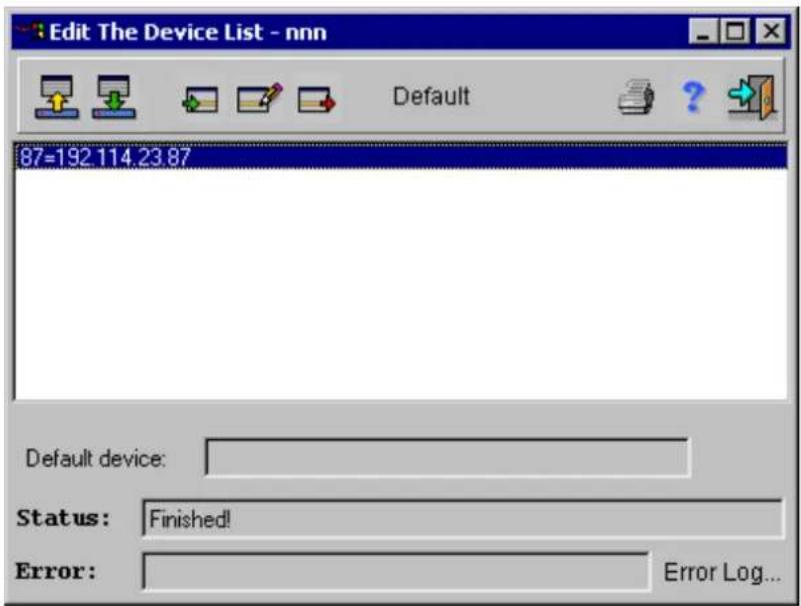
Figure 6-22. Edit the Device List window
Adding New entry to Device List
To add a new entry to the Device list:
- Click 📋. The Insert a Device dialog box opens:

Figure 6-23. Insert a Device dialog box
- Enter new device name and the IP address in the Insert a Device dialog box.
- Click √. In the Edit Device List window, the new device name appears.
Making a Device the Default
A default device can be defined.
To make a device the default:
- Double-click a device name, or select a device name and click Default.
- Click ↓. The selected device is set as the default device.
Modify a Device
The devices on the device list can be modified.
To Modify a device:
- Select the device.
- Click ☐ to modify the names already configured for the network devices.
- Click ↓. The selected device is modified.
Deleting a Device
Devices can be deleted from the device list.
To delete device:
- Select the device.
- Click ▶. The device is removed from the list.
The Front Panel Display
The front panel display GUI is a graphic image illustrating the device combined with the user interface. Labels in the front panel display represent the various interfaces of units and are color-coded for easy identification. All ConfigMaster options are accessed through the front panel display. It provides a device zoomed image. The front panel display has access to all options for controlling the device.
Opening the Front Panel Display
To open the front panel display:
- From the ConfigMaster Main window, enter the device IP Address in the IP field, or select the device name in the device field.
- Click the Connect button. The selected device front panel display opens.
Note: If a device error, unknown device or version unknown error occurs when attempting to start the applet, an error message is displayed requesting reconnection. For further information, refer to Error Log.

Figure 6-24. Front Panel Display
Front Panel Display Toolbar
The front panel display toolbar includes the following icons:
Front Panel Display Toolbar Icons
| Icon | Function Relevant | Shortcuts |
| Refreshes the front panel display Ctrl+R | ||
| Accesses the Port Properties window Ctrl+T | ||
| Accesses the Global Parameters window | Ctrl+G | |
| Views Port Statistics for the selected port | Ctrl+P | |
| Views Element Statistics | ||
| Accesses the on-line Help F1 | ||
| Exits the front panel display Ctrl+X |
Table 6-1. Front Panel Display Toolbar Icons
Understanding Front Panel Display Colors
Around each port on the front panel display is a colored border. These borders indicate the device port status. The following table describes the various status indications.
Front Panel Display Interface Color-Code
| Label Color | Explanation |
| Green Interface | up |
| Red Interface | down |
| Blue | Port selected |
Table 6-2. Front Panel Display Interface Color-Code
Understanding the Front Panel Display LEDs
The front panel displays LEDs as they appear on the device front panel. The LEDs are color-coded with the same configuration as the front panel.
Each card has its own set of LEDs. The LEDs on the host card indicate the device LED indication mode. The LEDs on the other cards indicate the card individual port status.
Front Panel Display Mode LEDs
On the Host card are eight mode LEDs. Each LED represents a device function mode. The mode selection determines what function is indicated by the LEDs on the individual cards. The selection is made by physically clicking the Mode Selector button. The mode selected is applied to all the LEDs on the device, for example, if "Rx" is selected, wherever a port is receiving a signal, the port corresponding LED indicates this status.
Device Front Panel Display Power LEDs
On the Host front panel there are two power supply LEDs. The LED indicates the device power supply status.
The top LED indicates if the device is powered by the power supply 1. The bottom LED indicates that the unit is power by the power supply 2. The following table describes the color code representing the power supply status.
Color Codes for Power Supply LEDs
| Color | Status |
| LED on | The power is being supply. |
| LED off | A fault has been detected in the power supply. |
Table 6-3. Color Codes for Power Supply LEDs
Front Panel Display Card LEDs
On all cards installed, there is a corresponding LED for each configured port. Based on the mode selected on the host panel, the LED indicates the port status.
Color Codes for the Status LED
| Function Indication and Status Giga Indications and Status | ||
| Link/act LED On—Link is upLED On and blinking—Link is up | LED On—Link is upLED On and blinking—Link is up | |
| and activeLED Off—Link is down | and activeLED Off—Link is down | |
| 10/100 | LED On—100TxLED Off—10BaseT | LED On—1000 Mbps |
| Coll LED On—Collision occurs N/A | ||
| B.P. (Back Clickure) | LED On—Receive buffer threshold number is exceeded | N/A |
| Act LED On—Activity in the link LED On—Activity in the link | ||
| FD (Full Duplex) | LED On—Full DuplexLED Off—Half Duplex | LED On—Full DuplexLED Off—Half Duplex |
| Tx LED On—Link | is transmittingtraffic | LED On—Link is transmittingtraffic |
| Rx LED On—Link | is receiving traffic LED On—Link is receiving traffic | |
Table 6-4. Color Codes for the Status LED
View Port Status
To view a specific port status:
- Click a port to select it. Selected ports are highlighted in blue.
- Right-click a port to open a context-sensitive menu. There are two menu selections:
◆ Refresh Port – The port status is refreshed
♦ Port Properties – Displays the port configuration
- Double-click a port.
or
Click Ctrl+T
or
Click the 📄 to open the Port Properties window for other configuration options.
- Select a port and click Ctrl+P to open the Port Statistics window for other configuration options.
Refreshing the Front Panel Display
To view the current device and interface status, the front panel display can be refreshed.
To refresh the front panel display:
- Click Ctrl+R
or
Click

or
Select Services > Refresh Device Version. The Check Version for window opens:
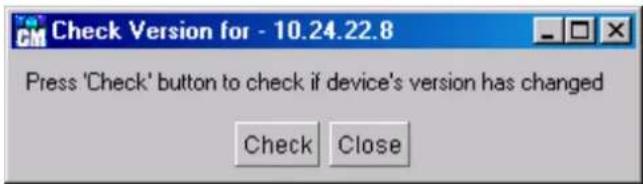
Figure 6-25. Check Version for window
- Click Check. The device is polled for current device and its interfaces.
ConfigMaster Shortcuts
ConfigMaster has a set of shortcuts for quick access to the main ConfigMaster options. The following table describes the shortcuts and functions used in the ConfigMaster screens.
Note: The plus sign (+) is used in the table to show that two keys should be clicked simultaneously, or two actions should be performed at the same time
ConfigMaster Shortcuts
| Shortcut | Function |
| ConfigMaster Main Window | |
| F1 Accesses the on-line help. | |
| Ctrl + O Accesses the General Options - Traps Table. | |
| Enter Opens the selected device | front panel display. |
| Ctrl + right click inside the IP field; Or Ctrl + D | Accesses the Edit Device List window. |
| Front panel display | |
| F1 Accesses the on-line help. | |
| Ctrl + X Exits the front panel display. | |
| Ctrl + R Refreshes the front panel display. | |
| Ctrl + G Accesses the Global Parameters window | |
| Ctrl + T; Or double click the port | Accesses the Port Properties window |
| Select a port and click Ctrl + P | Accesses the Port Statistics window. |
| Windows | |
| Ctrl + S Sends the data from the window to the device. | |
| Ctrl + R Refreshes the front panel display showing the current device and its interfaces status. | |
| Ctrl + L; Or double click an empty row | Accesses the Insert dialog box. |
| Ctrl + D Deletes a table row. | |
| Ctrl + E; Or double click the row to edit | Accesses the Edit Dialog box |
| Ctrl + X Exits the window. | |
| Right click the table row and choose Undo | Undoes the last action performed in the selected table row. |
| F1 Accesses the on-line help. | |
| Insert/Edit Dialog Boxes | |
| Ctrl + U Sends the table modifications made in the Insert/Edit dialog box to the table. | |
| Escape Closes the dialog box | and return to the table |
| Tables | |
| Drag the mouse across the table rows | Selects multiple table rowsNote: This option is not available for FACS, VLAN and Global Forwarding tables. |
| Edit Device List Window | |
| Double click the device name within the table row | Sets the device name as default |
| Enter (in the Insert a Device dialog box) | Adds a new device name to the Device list in the Edit Device List window (This shortcut is used instead of clicking √.) |
| Traps Table | |
| Double click the trap within the table row | Opens the Device front panel display that sent the trap |
Table 7-5. ConfigMaster Shortcuts
Using Tables
Within ConfigMaster there are tables for configuring devices. The tables are opened though the various operational screens. Section includes the following:
♦ Editing Table Rows.
♦ Inserting Table Rows.
♦ Deleting Table Rows.
♦ Erasing Tables.
Editing Table Rows
Certain ConfigMaster tables allow editing. If editing is not allowed, the toolbar icon does not appear.
To edit an existing table row:
- Select the table row
2. Click

or
Double-click the selected row.
or
Click Ctrl+E.
The Edit dialog box opens.
- Edit the parameters. Parameters that cannot be edited will not appear or are disabled.
Note: To cancel changes, click

4. Click

or
Click Ctrl+U. The Edit dialog box closes and the row appears yellow in the table.
Note: To undo changes, click 📋. This option affects only those changes that have been made since was clicked.
◆ To upload the modifications to the device, click ↓.
Inserting Table Rows
Certain ConfigMaster tables allow new rows. If adding a row is not allowed, the toolbar icon does not appear.
To add a new table row:
1. Click

or
Double-click an empty row in the table.
or
Click Ctrl+L. The Insert dialog box opens.
- Enter the parameter values. Parameters that are set automatically do not appear.
Note: To cancel changes, click

3. Click

or
Click Ctrl+U. The Insert dialog box closes and the row appears yellow in the table.
Note: To undo changes, click


◆ To send the changes from the table to the device, click ↓.
Deleting Table Rows
Certain ConfigMaster tables allow row deletion. If deleting a row is not allowed, the toolbar icon does not appear.
To delete a table row:
-
Select a table row. To select multiple rows, drag the mouse across the table rows. This option is not available for FACS, VLAN and Global Forwarding tables.
-
Click

or
Click Ctrl+D. The row is deleted.
Note: To undo changes, click 📋. This option affects only those changes that have been made since was clicked.
- To send the changes from the table to the device, click 📋.
Erasing Tables
Certain ConfigMaster tables allow the entire table to be erased. If a table cannot be erased ☐ does not appear.
To erase an entire table:
◆ Click 📋. All table rows are erased.
Working With Configuration Files
For security reasons, the configuration files are saved on the ConfigMaster computer in the following directory: ConfigMaster/Nms/Configuration.
To save (or backup) the configuration files in this directory:
◆ File access must be permitted. Files are sent by either FTP or copied into the configuration file directory.
◆ The configuration file is managed through the front panel display File menu. The Configuration File menu has the following menu options:
♦ Send Configuration To Device.
♦ Get Configuration From Device.
♦ Configuration File - Conversion.
Send Configuration To Device
To download the configuration file backup copy to the device:
- Select File > Configuration File > Send Configuration to Device. The Send Configuration to Device window opens:
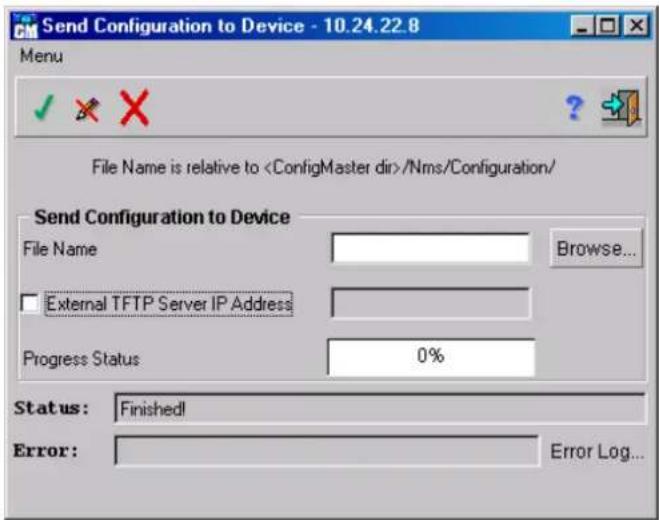
Figure 6-26. Send Configuration to Device window
- In the File Name field, enter the configuration file name to send to the device, or press Browse... to locate the configuration file name.
- If the configuration file is saved on the external TFTP server, check the "External TFTP Server IP Address" check box and enter the external TFTP server IP address.
- Click √. The procedure begins. The procedure progress is illustrated by the Progress Status incremental bar. When the incremental bar indicates that the procedure is completed, a Reset window prompt opens.
- Click Reset to reset the device. The device is reset.
Get Configuration From Device
To maintain a copy of the device configuration file, the device configuration is saved on the server.
To save (or backup) the modified configuration files:
- Select File > Configuration File > Get Configuration from Device. The Get Configuration from Device window opens:

Figure 6-27. Get Configuration from Device window
- In the File Name field, enter the device configuration file, or click Browse... to locate the device configuration file name.
- If the default TFTP server provided with the device is not required, check the "External TFTP Server IP Address" checkbox and enter the external TFTP server IP address. To use the default TFTP server, clear the "External TFTP Server IP Address" checkbox.
- Click √. The file saving procedure begins. The configuration file is retrieved from the server. The procedure progress is illustrated by the Progress Status incremental bar. When the incremental bar indicates that the procedure is completed, the file is retrieved.
Configuration File - Conversion
The Configuration File - Conversion screen is used to translate the configuration file from BER to ASCII format, edit the configuration file and then translate the file back from ASCII to BER format.
Note: Using the Configuration File - Edit button on the Configuration File - Conversion window to edit the configuration file in ASCII should be done only by authorized personnel familiar with the format, otherwise the procedure may result in configuration download errors.
Update Device Software
D-Link Corporation may release updated software versions of the device software. Software files reside on the web server computer and are downloaded from the ConfigMaster\Nms Iraquration directory.
Note: If download is not successful, the current device software version does not change. If download is successful, new software is not implemented until the device is reset.
To update the configuration device software:
- Select File > Update Device Software. The Update Device Software window opens:
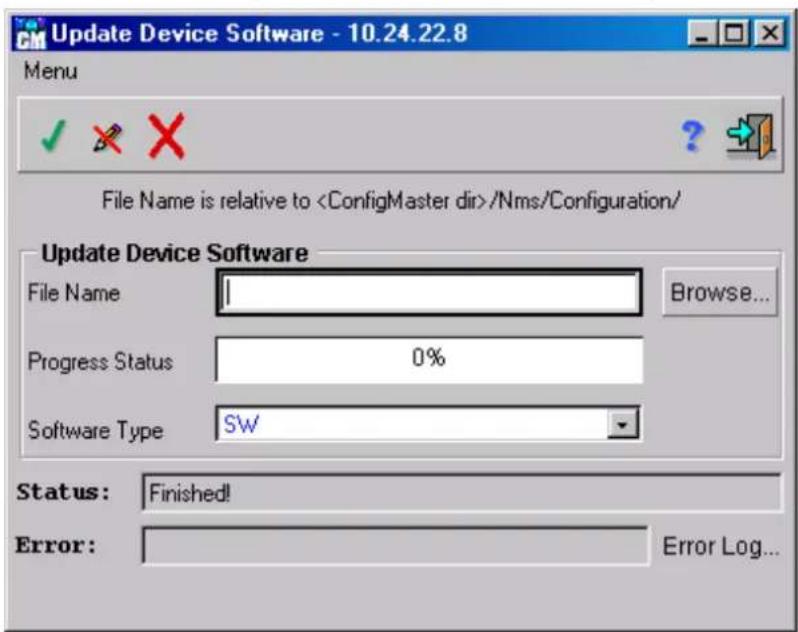
Figure 6-28. Update Device Software window
- In the File Name field, enter the Web server directory software file
or
Click Browse... to manually locate the software file.
- Select one of the following software types for updating:
◆ SW.
◆ Features.
♦ CLI.
- Click √. The update procedure begins. The update progress is illustrated by the Progress Status incremental bar. The software update takes a few minutes. When the update is complete, the following Confirm reset window opens:

Figure 6-29. Confirm reset window
- Click Reset to reset the device. The Resetting window opens:
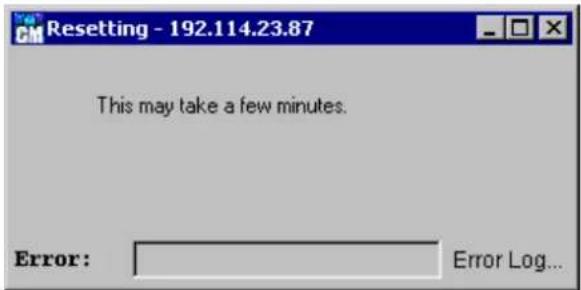
Figure 6-30. Resetting window
The device is reset and the following Reset complete window prompt opens:

Figure 6-31. Reset complete window
- Click 0.K.
Exit
To end the current front panel display session:
- Select File > Exit. The front panel display is closed and the ConfigMaster Main window opens.
Managing the Device
Reset Device implements changes made to the device.
To reset a device:
- Select Device > Reset Device. The Confirm Reset window opens:

Figure 6-32. Confirm reset window
- Click Reset to reset the device. The Resetting window opens:

Figure 6-33. Resetting window
The device is reset and the following Reset complete window opens:

Figure 6-34. Reset complete window
- Click 0.K.
Device Global Parameters
The Global Parameters command is to set the device System Identification, Time and Software Version commands.
Note: The Global Parameters window can be also accessed by clicking 📄 on the front panel display toolbar, or pressing Ctrl+G.
To display the Global Parameters screen:
♦ Select Device > Global Parameters. The Global Parameters window opens. The Global Parameters window has the following three tabs:
Identification - Defines a general description, user-defined name, location, and contact person for a device.
◇ Time – Defines the System Up Time, System Time, and System Date for a device.
Version - Defines the software and hardware software versions running on a device.
The default screen is the Identification tab. The following figure illustrates the Global Parameters window Identification tab:

Figure 6-35. Global Parameters – Identification tab
The Identification tab displays the following fields:
◆ Description – Device General description.
◆ Name – User assigned device name that appears on all system windows Title Bars.
♦ Location – Device geographic location.
- Contact Person – The persons responsible for the device.
To edit an Identification tab field:
- Edit any field except the Description field.
- Click ☐. When the Status field displays "Finished!", the fields are confirmed as modified.
The following figure illustrates the Global Parameters window Time tab:

Figure 6-36. Global Parameters – Time tab
The Time tab displays the following fields:
- System Up Time – Time elapsed since the last reset.
- System Time – Current user-defined device time (HH.MM.SS).
- System Date – Current user-defined device date (DD.MM.YY).
To edit a Time tab field:
- Edit the System Time or System Date field, conforming to the date format as described above. The System up Time field cannot be modified.
- Click ☐. When the Status field displays "Finished!", the fields are confirmed as modified.
The following figure illustrates the Global Parameters window Version tab:

Figure 6-37. Global Parameters – Version tab
The Version tab displays the following fields:
- SW Software Version – Software version currently running on the device.
- HW Software Version – Hardware Software version currently operating with the device.
Device Features
The Device Features window is a read-only window. It displays a list of features supported by the device's software version.
To display the Device Features screen:
♦ Select Device > Device Features. The Device Features window opens:
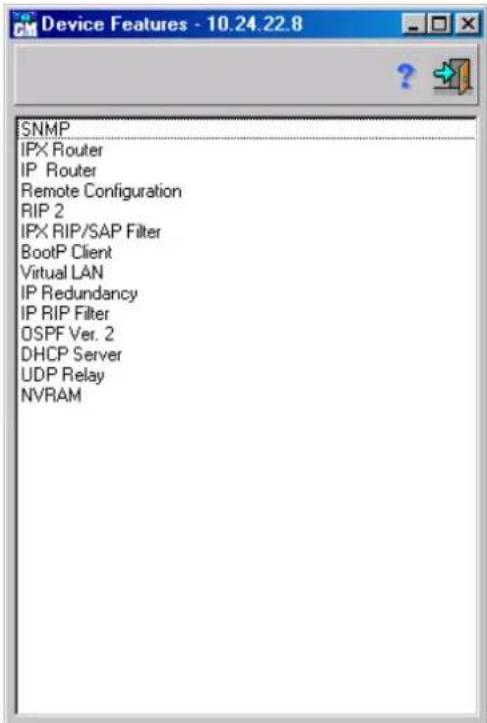
Figure 6-38. Device Features window
Configuring VLANs
VLANs are logical subgroups with a Local Area Network (LAN) created via software rather than defining a hardware solution. VLANs combine user stations and network devices into a single unit regardless of the physical LAN segment to which they are attached. VLANs allow network traffic to flow more efficiently within subgroups. VLANs managed through software reduce the amount of time network changes, additions, and moves are implemented.
VLANs have no minimum number of ports, and can be created per unit, per device, per stack, or any other logical connection combination, as VLANs are software based and not defined by physical attributes.
VLANs function at a layer 2. Since VLANs isolate traffic within the VLAN, a layer 3 router working a protocol level is needed to allows traffic flow between VLANs. Layer 3 routers identify segments and coordinate with VLANs. VLANs are broadcast and multicast domain. Broadcast and multicast traffic is transmitted only in the VLAN in which the traffic is generated. The default VLANs are:
◆ IP VLAN.
♦ IPX Raw VLAN.
♦ IPX ET (ETH II) VLAN.
♦ IPX LLC VLAN.
♦ IPX SNAP VLAN.
Note: IP and IPX VLANs are automatically assigned a MAC address.
◆ SNA, AppleTalk, NetBios.
- Other VLANs – The "Other" VLAN is a "super-VLAN" that includes all protocols for which VLANs have not been defined. However, super-VLAN does not include IP or IPX. "Other" can be used to quickly configure the device as a full bridge.
The VLAN menu has the following menu options:
♦ VLAN Parameters.
♦ VLAN Table Per Port
or
♦ VLAN Table Per Port and Protocol.
ConfigMaster supports and automatically recognizes if the device is running VLAN per port or VLAN per port and protocol.
Working With VLANs
This section provides and explanation for configuring and working with VLANs, and provides the following sections:
♦ VLAN Parameters.
♦ VLAN Table Per Port
♦ VLAN Table Per Port and Protocol.
VLAN Parameters
To display the device VLAN Parameters window:
♦ Select Device > VLAN Parameters. The Virtual LAN Parameters window opens:

Figure 6-39. Virtual LAN Parameters window
The following VLAN parameters are displayed:
♦ VLAN Supported Type – Indicates the type of VLAN currently supported.
♦ VLAN Supported Type After Reset – Indicates the type of VLAN supported after the device is reset. The possible values are:
Per Port - Indicates the type of VLAN supported after the device is reset is per port based.
Per Protocol and Port – Indicates the type of VLAN supported after the device is reset is per protocol and per protocol based.
To edit the VLAN Parameters:
Click 📄. When the Status field displays "Finished!", the fields are confirmed as modified.
VLAN Table Per Port
The following window describes VLAN Table per port:
To display the VLAN Table window:
(Make sure Per Port is selected under "VLAN supported type after reset" on the Virtual LAN Parameters window (Device > VLAN > VLAN Parameters)).
♦ Select Device > VLAN > VLAN Table. The VLAN Table opens:

Figure 6-40. VLAN Table
The VLAN Table displays the following fields:
◆ IF Num – Identifies the VLAN interface number, automatically assigned by the management station.
◆ Name – Identifies the user-defined name of the VLAN.
♦ Priority – Specifies the priority of the VLAN. The possible values are:
♦ MAC Address – Permanent VLAN MAC address, automatically assigned by the device. This parameter applies to IP and IPX VLANs only, and is dependent on the VLAN address type.
♦ VLAN Address Type – If default the VLAN gets the device MAC address. If reserved the VLAN is assigned a unique MAC address based on the order of which it was configured (0-4096 reserved MAC addresses). The address types to select from are as follows:
◇ Default – The default address.
◇ Reserve - User-defined address.
♦ Tag - VLAN Tag ID. The possible values are 0-7.
To add new VLANs:
-
Display the VLAN Table.
-
In the VLAN Table, click ▶. The VLAN Table Insert window opens:
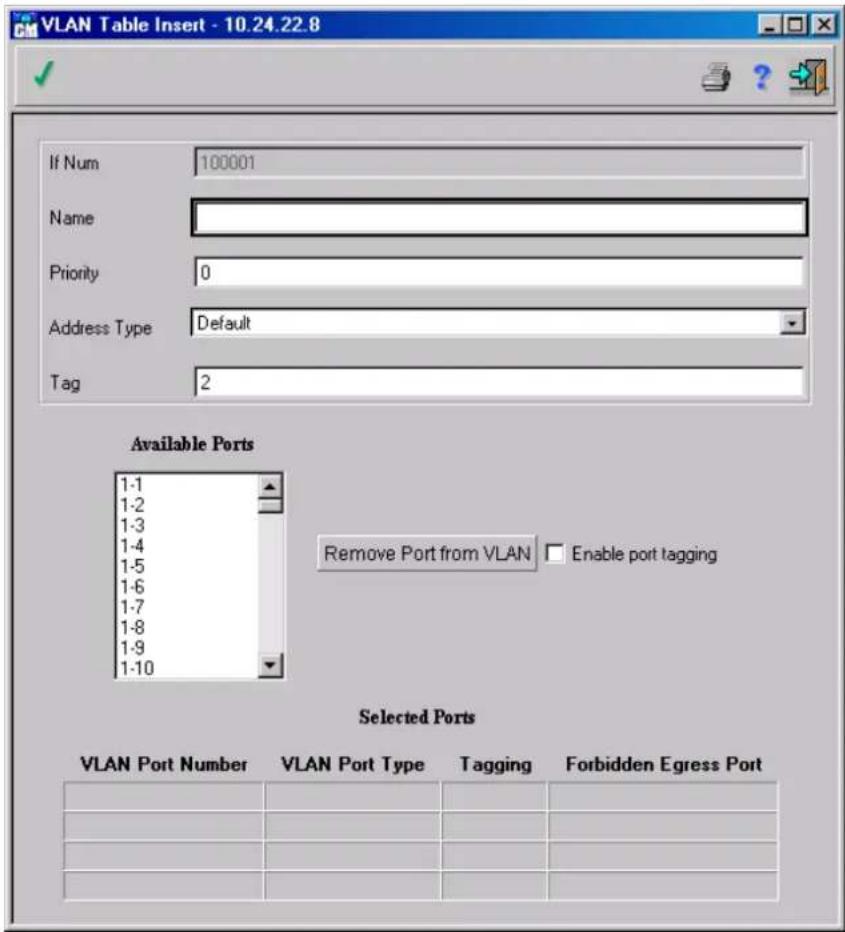
Figure 6-41. VLAN Table Insert window
-
Complete the fields.
-
Select a device port from the list displayed above the Selected Port Table. The selected port is added to the table where the following parameters are displayed:
♦ VLAN Port Number – The selected port interface number.
♦ VLAN Port Type – Either static or dynamic.
♦ Tagging – Identifies the VLAN to which the frame belongs. To enable port tagging check the Enable port tagging checkbox.
◆ Forbidden Egress Ports – Indicates ports that are forbidden to be included in the Egress Ports List for this VLAN.
-
Click to apply the new data.
-
Close the VLAN Table Insert window.
To delete ports from the Port Table:
- Display the VLAN Table window.
- In the VLAN Table window, click 📋. The VLAN Table Insert window opens.
- Highlight the port numbers of the ports you want to delete in the Port Table.
- Click Remove Port from VLAN. The ports are highlighted and the port numbers appear in the Available Ports list.
To edit Existing VLANs:
- Display the VLAN Table.
- Select an entry in the table.
- Click ☐. The VLAN Table Edit window opens. The window is identical to the VLAN Table Insert window.
- Edit the required fields.
- Click to apply the new data.
- Close the VLAN Table Edit window.
To delete Existing VLANs:
- Display the VLAN Table.
- Select an entry in the table.
- Click ▶. The entry is deleted.
- Click ↓ to update the device
VLAN Table Per Port and Protocol
To display the VLAN Table window:
(Make sure Per Protocol and Port is selected under “VLAN supported type after reset” on the Virtual LAN Parameters window (Device > VLAN > VLAN Parameters)).
♦ Select Device > VLAN > VLAN Table. The VLAN Table opens:

Figure 6-42. VLAN Table window
The VLAN Table window displays the following fields:
◆ IF Num – The VLAN interface number, automatically assigned by the management station.
♦ Protocol Type – Indicates the type of protocol used. The possible value is Predefined Protocol. The type of predefined protocol used in defined in the Protocol field.
♦ Protocol – Specifies the VLAN protocol type. The possible values are:
◇ IP
◇ IPX Raw
◇ IPX ET
◇ IPX LLC
◇ IPX SNAP
◇ Dec Net
◇ Net Bios
◇ SNA
◇ Other
◆ Name – Indicates the user-defined VLAN name.
♦ Priority – Indicates the value of the priority tag. The possible value is 0-7.
♦ MAC Address – Permanent VLAN MAC address, automatically assigned by the device. This parameter applies to IP and IPX VLANs only, and is dependent on the VLAN address type.
- Address Type – Indicates the MAC address type being used. The possible values are:
◇ Default – The VLAN receives the device MAC address.
Reserved – The VLAN is assigned a unique MAC address based on the order of which it was configured (0-4096 reserved MAC addresses).
- Tag – Indicates if the VLAN tag is used to identify to which VLAN a packet belongs.
To add new VLANs for VLANs per Port and Protocol:
- Display the VLAN Table window.
- In the VLAN Table window, click 📋. The VLAN Table Insert window opens:
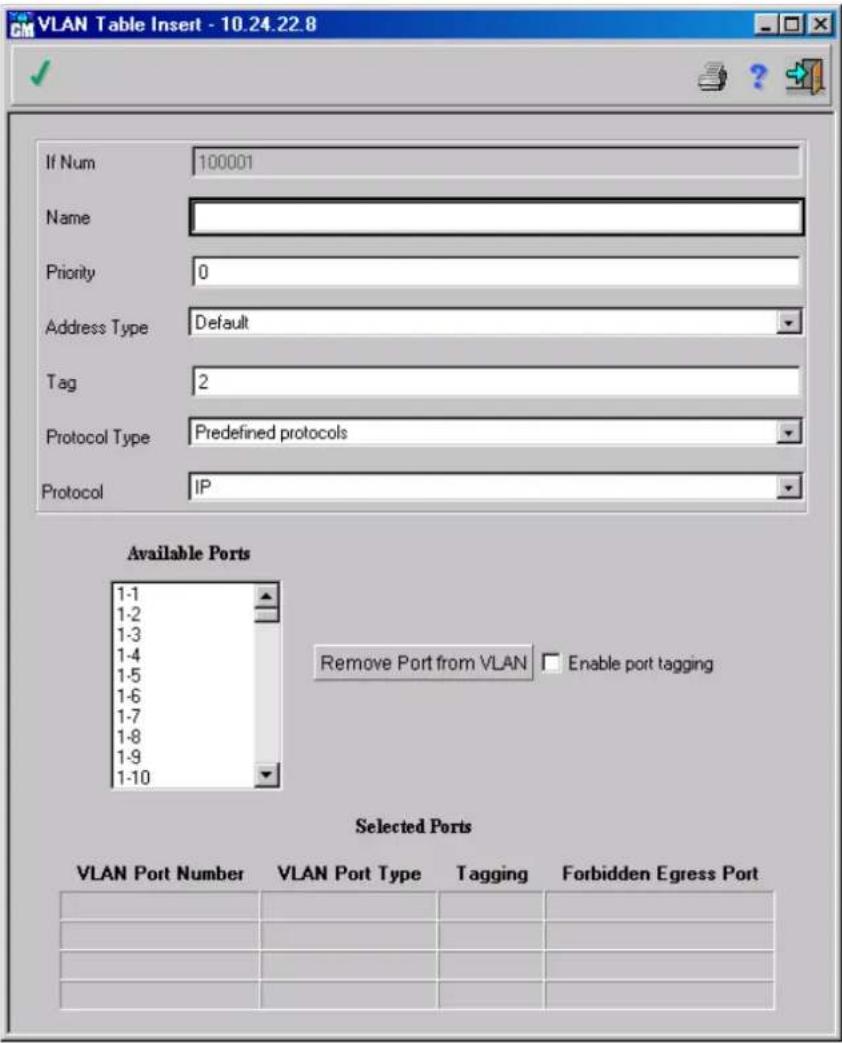
Figure 6-43. VLAN Table Insert window
- Complete the fields. The fields are the same as the VLAN Table as described above.
- Double-click a port in the Port List. The port number appears in the Device Table, but no longer displays in the Available Ports List. When the port is removed from the VLAN the port redisplays in the Available Port List. The Selected Ports list displays the following fields:
♦ VLAN Port Number – Indicates the port index number attached to the VLAN.
♦ VLAN Port Type – Indicates if the port is static or active.
♦ Tagging – Identifies the VLAN to which the frame belongs. To enable port tagging check the Enable port tagging checkbox.
♦ Forbidden Egress Port – Indicates ports that are forbidden to be included in the Egress Ports List for this VLAN.
-
Click to apply the new data.
-
Close the VLAN Table Insert window.
To delete ports from the Port Table:
- Display the VLAN Table window.
- In the VLAN Table window, click 📋. The VLAN Table Insert window opens.
- Highlight the port numbers of the ports you want to delete in the Port Table.
- Click Remove Port from VLAN. The ports are highlighted and the port numbers appear in the Available Ports list.
To edit existing VLANs:
- Display the VLAN Table.
- Select an entry in the table.
- Edit the required fields.
- Click to apply the new data.
-
Close the VLAN Table Edit window.
-
Click ☐. The VLAN Table Edit window opens. The window is identical to the VLAN Table Insert window.
To delete existing VLANs:
- Display the VLAN Table.
- Select an entry in the table.
- Click ▶. The entry is deleted.
- Click ↓ to update the device.
Ethernet User-Defined Protocols
The Ethernet User-Defined VLAN window contains information regarding protocol names and the type of VLAN Ethernet.
To display the Ethernet User Defines VLAN window:
♦ Select Device > VLAN > Ethernet user defined protocols. The Ethernet user defined vlans window opens:

Figure 6-44. Ethernet user defined vlans window
The Ethernet user defined vlans window displays the following fields:
♦ Protocol name— The user-defined protocol name.
♦ VLAN Ethernet Type—The user-defined VLAN Ethernet type.
To add a new Ethernet user-defined VLAN:
- Display the Ethernet user defined vlans window.
- Click . The Ethernet user defined vlans Insert window opens:

Figure 6-45. Ethernet user defined vlans Insert window
- Complete fields with the required information.
- Click to apply the new data.
- Close the Ethernet User-defined VLAN Insert window.
To edit an existing Ethernet user-defined VLAN:
- Display the Ethernet User-defined VLANs window.
-
Select a VLAN from the table.
-
Click 📋. The Ethernet User-defined VLANs Edit window opens. The window is identical to the VLAN Table Insert window.
- Edit the required fields.
- Click to update the device.
- Close the VLAN Table Edit window.
To delete an Ethernet user-defined VLAN:
- Display the Ethernet User-defined VLANs window.
- Select an entry in the table.
- Click ▶. The entry is deleted.
- Click ↓ to update the device.
Configuring Ports
Port Properties
Use the Port Properties window to define parameters for the port selected in the front panel display or from the Select Port Number field in the Port Properties window.
Note: The Port Properties window can also be accessed by clicking 📋 on the front panel display toolbar, or by right-clicking the selected port, or by pressing Ctrl+T.
To display the Port Properties screen:
♦ Select Device > Port > Port Properties. The Port Properties window opens. The Port Properties window has the following five tabs:
◇ Main - Defines the general port settings including MAC address, port type, port description, speed, administration status, port status, and full or half duplex modes.
◇ Other – Defines the back-pressure and flow control modes.
◇ VLAN - Defines the VLAN settings on a port.
◇ IP – Displays the IP addresses and network masks for a selected port.
◇ IPX – Displays the network addresses and network masks for a port
The default opening screen is the Main tab. The following paragraphs illustrate and describe each screen tab.
The following figure illustrates the Port Parameters window Main tab.

Figure 6-46. Port Properties – Main tab
The Main tab displays the following fields:
♦ MAC Address – The interface Media Access Control (MAC) address.
Note: Each router is assigned a unique MAC address by the system.
-
Max Capacity – The maximum capacity of the current port connection.
♦ Connector Type – The type of interface.
♦ Port Descriptor – Brief interface description, for example Ethernet. -
Speed Admin Mode – The possible LAN rate for the selected interface. The rate is selected from the field-configured options. For LAN interfaces only. (Auto-negotiation mode should be disabled).
♦ Port Speed (bps) – The synchronized port speed in bps. - Admin. Status – Controls the traffic from the selected port. By default, this parameter is set to Enable. The options are as follows:
On - Select this option to permit the traffic through the port.
◇ Off – Select this option to stop the traffic.
♦ Port Status – Indicates if the interface is operational (Up), non-operational (Down), or engaged in a test procedure so it does not carry traffic (Testing).
♦ Duplex Admin Mode – Specifies the conversation type for the interface. The options are as follows:
Full - The interface supports transmission between the device and the client in both directions simultaneously.
◇ Half – The interface supports transmission between the device and the client in only one direction at a time.
♦ Duplex Operation Mode – The port synchronization mode.
♦ Assign Physical Address – To assign a physical address. The options are as follows:
◇ Select Default to use the default address.
◇ Reserve to assign a unique address (up to 264 unique addresses), in incrementing order.
♦ Autonegotiation Mode – This mode setting determines whether the Switch will automatically negotiate for the fastest possible connection. The options are as follows:
- Enable – Select this option to enable the optimal connection speed.
◇ Disable – Select this option to disable this feature.
To edit a Port Properties Main tab field:
- Display the Port Properties Main tab.
♦ Edit one of the following fields:
◇ Speed Admin Mode.
◇ Port Speed (bps).
◇ Admin Status.
◇ Duplex Admin Mode.
◇ Duplex Operation Mode.
◇ Assign Physical Address.
- Click ☐. When the Status field displays "Finished!", the fields are confirmed as modified.
The following figure illustrates the Port Parameters window Other tab:

Figure 6-47. Port Properties – Other tab
The Other tab displays the following fields:
- Back Pressure Mode – Disabled by default. By enabling back-pressure, the device signals the accompanying partner device to hold onto the traffic, whenever a certain speed is reached.
◆ Flow Control Mode – To control packet transmissions. The options are as follows:
On - Activates the flow control mechanism. The accompanying device behavior has no affect on the feature.
◇ Off – Disables the feature. Off is the default setting.
AutoNegotiation - The port sends the device flow control packets (as long as it is supported by the other device).
- EnabledRx – The port allows packets to be received only.
- EnabledTx – The port allows packets to be transmitted only.
- Open Flow Control Method – This read-only field displays whether this feature is currently enabled or not.
Note: When modifying Flow Control and Back Pressure, The HOL setting is automatically changed:
◆ Flow Control set to ON – HOL automatically resets to OFF
◆ Back Pressure set to Enable – HOL automatically resets to OFF
Note: If a configured port goes down due to either an Administrative or physical link, the HOL resets to ON even if the Flow Control on port was configured to ON.)
To edit an Other tab field:
- Display the Port Properties Main tab.
- Edit the required field.
- Click 📄. When the Status field displays "Finished!", the fields are confirmed as modified.
The following figure illustrates the Port Parameters window VLAN tab:
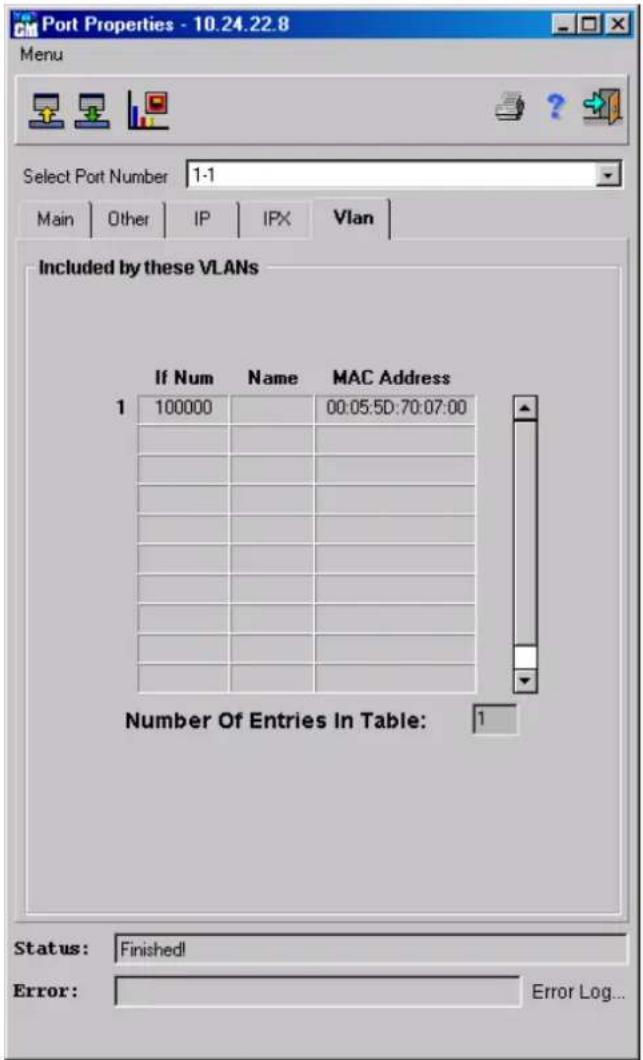
Figure 6-48. Port Properties – VLAN tab
The VLAN tab displays the following fields:
- If Number/Name/MAC Address – The number/name/MAC address of VLANs in which the selected port is included.
The following figure illustrates the Port Parameters IP tab:

Figure 6-49. Port Properties – IP tab
The IP tab displays the following address information defined for the selected port:
♦ IP address – Displays the IP address of port.
◆ Network Mask – Displays the network masked used to mask parts of the IP address.
The following figure illustrates the Port Parameters window IPX tab:

Figure 6-50. Port Properties – IPX tab
The IPX tab displays the following address information defined for the selected port:
◆ Network Address – Displays the network address on which the port is located.
♦ Layer II Protocol – Displays the Layer II protocol type enabled on the port.
Port Mirroring
Port Mirroring allows you to copy traffic from one port to another port. To display the Port Mirroring window:
♦ Select Device > Port > Port Mirroring. The Port Mirroring window opens:

Figure 6-51. Port Mirroring window
The Port Mirroring window displays the following fields:
- Mirrored Port - Defines the port number from which all outgoing and incoming traffic is copied. The possible values are:
◇ Disabled – Disables port mirroring.
- Port List - A list of port numbers. Select the port from the drop-down list. If selected, traffic is mirrored from that port only.
◆ Copy Port – Defines the port number to which all outgoing and incoming traffic is mirrored. A copy port cannot mirror itself, be a member of a VLAN, or be configured with interface. The possible values are:
◇ Disabled – Disables port mirroring.
- Port List – A list of port numbers. Select the port from the drop-down list. If selected traffic is mirrored to that port only.
Note: Port mirroring may cause network congestion. This may result in the dropping of packets that are being mirrored to the copy port due to lack of network resources.
To enable port mirroring on a device:
- Display the Port Mirroring window.
- Complete the fields. The fields are the same as the Port Mirroring window as described above.
- Click 📋. When the Status field displays "Finished!", Port Mirroring is enabled on the device.
Storm Control
Use the Storm Control Parameters window to display parameters for storm control.
To display the Storm Control Parameters window:
♦ Select Device > Port > Storm Control > Storm Ctrl Parameters. The Storm Control Parameters window opens:

Figure 6-52. Storm Control Parameters window
Use the Storm Control Table window to display the whole table as well as to edit individual entries.
To display the Storm Control Table window:
♦ Select Device > Port > Storm Control > Storm Ctrl Table. The Storm Control Table window opens:
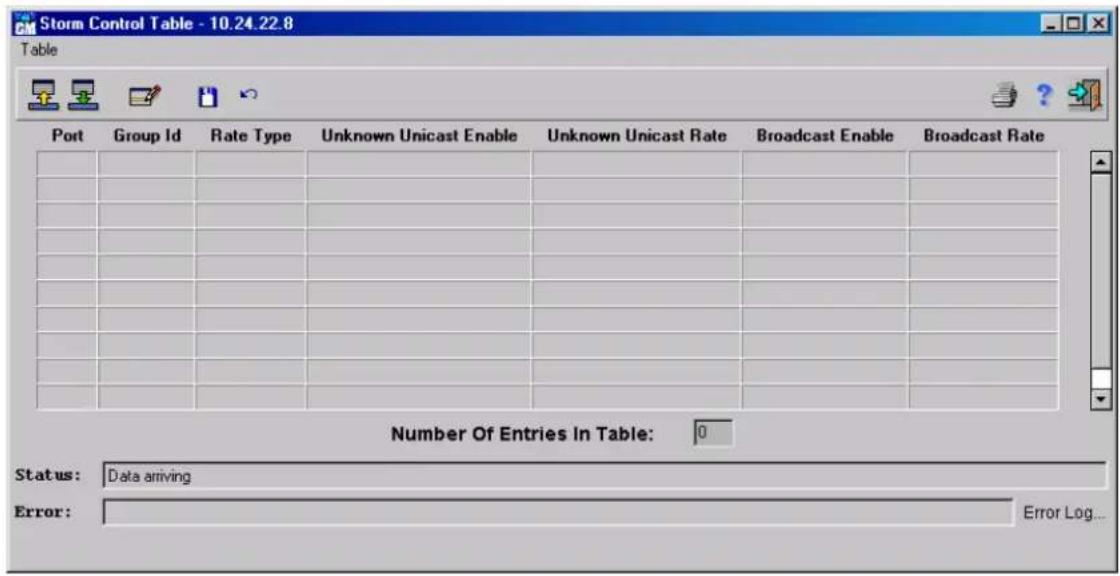
Figure 6-53. Storm Control Table window
To edit an existing Storm Control entry:
- Display the Storm Control Table window.
- Select an entry from the table.
- Click ☐. The Storm Control Table Edit window opens:

Figure 6-54. Storm Control Table Edit window
-
Edit the required fields.
-
Click √ and close the Storm Control Table Edit window.
-
Click to update the device.
Configuring GVRP and Trunking
GVRP
Generic Attribute Registration Protocol (GARP) protocol is a general-purpose protocol that registers any network connectivity or membership-style information. GARP defines a set of devices interested in a given network attribute, such as VLAN or multicast address.
GARP VLAN Registration Protocol (GVRP) protocol is specifically provided for automatic distribution of VLAN membership information among VLAN-aware bridges. GVRP allows VLAN-aware bridges to automatically learn VLANs to bridge ports mapping, without having to individually configure each bridge, and to register VLAN membership.
To minimize the memory requirements when running the GVRP protocol, two proprietary tuning variables have been added to the standard variables:
◆ Maximum number of GVRP VLANs - Displays the number of GV participate in GVRP operation.
◆ Maximum number of GVRP VLANs after Reset – Sets another value of GVRP VLANs. Maximum number of GVRP VLANs after Reset is used for tuning. This value becomes valid after reset only.
The maximum number of GVRP VLANs includes all the VLANs participating in GVRP operation regardless if they are static or dynamic.
The following should be considered when specifying the maximum number of VLANs participating in GVRP by setting the Maximum number of GVRP VLANs after Reset value:
◆ The default maximum number of GVRP VLANs is equal to 0 because of the memory restrictions.
◆ The maximum number of VLANs (managed through Max VLANs MIB variable) limits the maximum number of GVRP VLANs.
- To ensure the correct operation of the GVRP protocol, users are advised to set the maximum number of GVRP VLANs equal to a value that significantly exceeds the sum of:
◇ The number of all static VLANs both currently configured and expected to be configured.
The number of all dynamic VLANs participating in GVRP both currently configured (initial number of dynamic GVRP VLANs is 0) and expected to be configured.
Increasing the value of maximum number of GVRP VLANs to value beyond the sums, allows users to run GVRP, and not reset the device to receive a larger amount of GVRP VLANs. For example, if 3 VLANs exist and another two VLANs are expected to be configured as a result of VLAN static or dynamic registration, set the maximum number of GVRP VLANs after reset to 10.
Note: To enable GVRP, ensure that the amount of maximum amount of VLANs is less than 4000. For more information, see the Device Tuning section later in this manual.
To configure the GVRP feature:
- Enable GVRP on a device.
- Enable GVRP per port to participate in GVRP.
- Specify the maximum number of GVRP VLANs after reset.
- Reset the device to receive the new maximum number of GVRP VLANs set.
To increase the number of Maximum GVRP VLANs and to reconfigure the GVRP protocol:
- Specify a new value of the maximum number of GVRP VLANs after reset.
- Reset the device.
- Check that the new value is displayed in the Max GVRP VLANs field.
For more information about configuring the Maximum number of GVRP VLANs and Maximum number of GVRP VLANs after Reset fields, see the Device Tuning section later in this manual.
Consideration Concerning STP And GVRP Operation
The circulation of GARP/GVRP registration information follows through the Bridged LANs active topology and it is assumed that the STP protocol is established and maintained.
Note: When operating in the STP per device mode with the Must belong to VLAN parameter set to True, STP reacts to GVRP enabled on a port as if a VLAN was created on this port
Note: When operating in the STP per VLAN mode, every port that GVRP is enabled on is included into a specifically reserved VLAN. This VLAN is established to ensure the GVRP proper operation.
GVRP Parameters
The GVRP Parameters window contains information about GVRP and whether GVRP is enabled on specific ports. The GVRP Parameters window contains two tabs:
♦ Device Parameters – Indicates if GVRP is currently enabled on a device.
- Ports Parameters – Displays information about the individual ports and whether or not GVRP is enabled on specific ports.
To display the GVRP Parameters window:
Select Device > GARP > GVRP > Parameters. The GVRP Parameters window opens. The GVRP Parameters window has two tabs:
◆ Device Parameters – Displays the options enabling or disabling the GVRP on a device.
♦ Port Parameters – Displays the status of GVRP on individual ports.
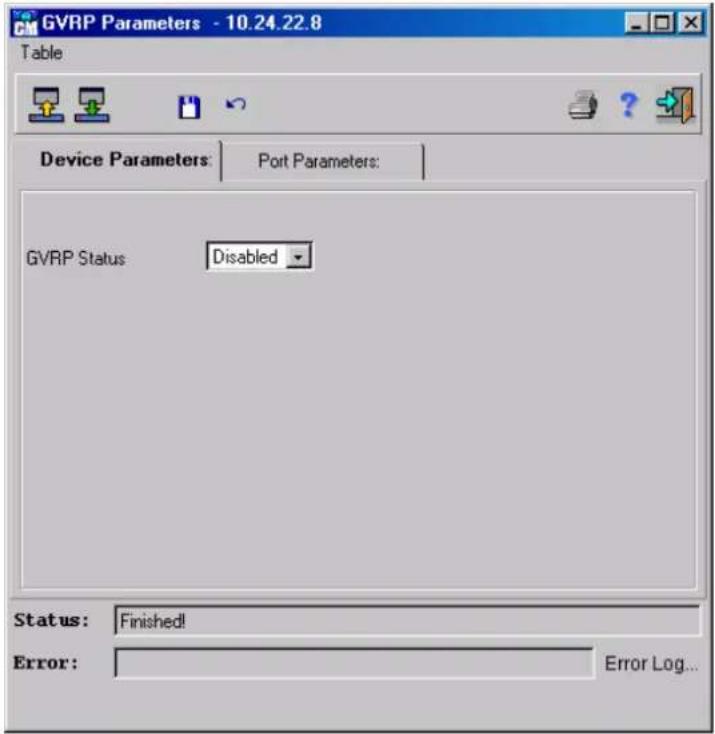
Figure 6-55. GVRP Parameters – Device Parameters tab
The GVRP Parameter - Device Parameters tab displays the following parameters:
♦ GVRP Status – Indicates if GVRP is enabled on a device, except for specific ports for which GVRP is disabled. If the GVRP status is disabled on all ports, GVRP packets are discarded.
To enable a GVRP on a device:
- Display the GVRP Parameters window.
- Right-click on GVRP Status and select Enabled.
- Click to update the device. When the Status field displays "Finished!", the GVRP is enabled.
The GVRP Parameters - Port Parameters tab displays the following parameters:

Figure 6-56. GVRP Parameters – Port Parameters tab
- If Num – Indicates the port number.
♦ Port GVRP Status – Indicates if GVRP is enabled on a port.
GVRP Timers Control
The GVRP Timers Control window contains information about timers for every bridged port.
Note: When modifying the default timer values, the Leave value must be greater than three times the Join value and the Leave All value must be greater than the Leave value:
Leave Time >= 3 x Join Time
♦ Leave All Time > Leave Time
To display the GVRP Timers Control window:
♦ Select Device > GARP > GVRP > Timers Control. The Timers Control window opens:

Figure 6-57. GVRP Port Timers Control window
The GVRP Timers Control window displays the following parameters:
- If Num – Indicates the port number for which GVRP is enabled.
♦ Join Time – Indicates the time in milliseconds that PDUs are transmitted.
Leave Time – Indicates the time lapse in milliseconds that the device waits before leaving its GVRP state. The Leave Time is activated by a Leave All Time message sent/received, and cancelled by the Join message received.
Leave All Time – Used to confirm the port within the VLAN. The time in milliseconds between messages sent.
To Edit a Timer Control:
- Display the GVRP Port Timers Control window.
- Select an entry in the GVRP Port Timers Control table.
- Click 📋. The GVRP Port Timers Edit window opens:

Figure 6-58. GVRP Port Timers Edit window
-
Edit the fields. The fields are the same as the GVRP Timers Control window as described above.
-
Click √. The GVRP Port Timers Edit window closes.
- Click ☐. When the Status field displays "Finished!", the timer control settings are saved to the device.
Note: The necessity to modify the default timer values arises when the number of VLANs participating in GVRP operation approaches approximately 200 VLANs. A network administrator is advised to increase the default values of Leave and Leave All timers.
GVRP Information
The GVRP Information window contains information about failed registrations and MAC address of GVRP messages received on individual ports.
To display the GVRP Information window:
♦ Select Device > GARP > GVRP > Information. The GVRP Information window opens:

Figure 6-59. GVRP Information window
The GVRP Information window displays the following parameters:
♦ If Num – Indicates the active port number.
- Failed Registrations – The total number of failed GVRP registrations on this port.
- Last PDU Origin – The source MAC Address of the last GVRP message received on this port.
Trunk
Trunking (Link Aggregation) optimizes port usage by linking a group of ports together to form a single trunk (aggregated groups). Trunking multiplies the bandwidth between the devices, increases port flexibility, and provides link redundancy.
Trunk Parameters
The Trunking Parameters window displays information about the number of trunks on a device, the number of ports included in a trunk, and the MIB software version currently running.
To display the Trunk Parameters window:
♦ Select Device > Trunk > Parameters, the Trunk Parameters window opens:

Figure 6-60. Trunk Parameters window
The Trunk Parameters window displays the following fields:
♦ Aggregate Num. of Trunks – Indicates the number of trunks supported by the device.
♦ Aggregate Max Ports In Trunks – Indicates the maximum number of ports that can make up a trunk.
♦ MIB Software version – Indicates the MIB Software version currently running.
Trunk Table
The Trunk Table contains information specific to trunks including the ports that make up the trunks. The Trunk Table allows network managers to assign ports to trunks. In order to assign a trunk a port, the port must comply with the following requirements:
A Layer 3 interface is not configured on the port.
◆ A VLAN is not configured on the port.
◆ A port is not assigned to a different trunk.
◆ An available MAC address exists which can be assigned to a port.
◆ Auto-negotiation mode is not configured on the port.
◆ The port is in full-duplex mode.
◆ All ports must operate at the same rate.
◆ All ports must have the same ingress filtering and tagged modes.
◆ All ports must have the same back pressure and flow control modes.
◆ All ports must have the same priority.
◆ All ports must have the same transceiver type.
To display the Trunk Port Table:
♦ Select Device > Trunk > Trunk Table, the Trunk Table opens:

Figure 6-61. Trunk Table window
The Trunk Table window displays the following fields:
♦ Index – Indicates the trunk ifIndex.
♦ Trunk MAC Address – Indicates the MAC Address of the Trunk.
Note: The device's MAC address displays by default, unless a MAC address is reserved for a trunk.
♦ Aggregate – Indicates if the trunk currently contains ports. The possible values are:
◇ True – The trunk contains ports.
◇ False – The trunk does not contain ports.
- Ports Included – Identifies the ports that are part of the trunk.
To Add or Edit the Aggregated Port List Port field:
- Display the Trunk Table.
-
Select an entry in the Trunk Table.
-
Click ☐. The Trunk Table window opens.
or
Double-click an entry in the Trunk Table, the Trunk Table- Edit window opens:

Figure 6-62. Trunk Table- Edit window
- Edit the ports list using → to move ports between the All Ports and Forbidden Port lists. The MAC address type can also be modified. The possible values are:
Reserved – The Trunk is assigned a unique MAC address based on the order of which it was configured (0-4096 reserved MAC addresses).
◆ Default – The Trunk receives the device MAC address.
-
Click √. The Trunk Table- Edit window closes.
-
Click ☐. When the Status field displays "Finished!", the ports that have been associated with a trunk are saved to the device.
Trunking Port Table
The Trunking Port Table displays information regarding about the individual ports that make up trunks.
To display the Trunking Port Table:
♦ Select Device > Trunk > Ports Table, the Trunking Port Table opens:

Figure 6- 63. Trunking Port Table window
The Trunking Port Table window displays the following fields:
♦ Index – Identifies the individual port number.
- Port MAC Address – Identifies the MAC address of the port that contains the trunk.
- Actor Admin Key – Indicates the key value of the port. Key values are assigned to ports to signify that ports can be trunked together. For example, all ports with a key value of 5 can be trunked together, while all ports with a key value of 8 can form a different trunk. A value of 0 deletes an existing port from a trunk. A port with an unassigned key value can be aggregated to a trunk.
- Attached Agg ID – Identifies the trunk ifIndex to which the port is attached.
♦ Aggregated – Indicates if the port is trunked. The possible values are:
◇ True – Indicates that the port is part of a trunk.
◇ False – Indicates that the port is not part of a trunk.
Trunk Balance Table
The Trunk Balance Table displays information about the criterions for balancing the corresponding trunk indexes.
To display the Trunk Balance Table:
♦ Select Device > Trunk > Trunk Balance Table, the Trunk Balance Table opens:

Figure 6- 64. Trunk Balance Table window
The Trunk Balance Table window displays the following fields:
♦ Index – Identifies the trunk number.
♦ Forward Type – Balances the trunk in either 1 of 2 modes. The possible values are:
◇ Bridging
◇ Routing
♦ Layer – Specifies the Balance Layer that the trunk used for the specified Forward Type, the possible values are:
◇ 2 – Indicates that layer 2 is being used as the balance layer.
◇ 3 – Indicates that layer 3 is being used as the balance layer.
◇ 4 – Indicates that layer 4 is being used as the balance layer.
♦ Used Addresses – Specifies the network layer addresses used for balancing unicast frames. The possible values are:
NotApplied - Indicates that a network layer address is not used for balancing unicast frames.
◇ DstAddr - Indicates that the destination address is used for balancing unicast frames.
◇ ScrAddr – Indicates that the source address is used for balancing unicast frames.
◇ DstadnSrcAdd - Indicates that both the source and destination addresses are used for balancing unicast frames.
◇ VlanID – Indicates that theVLAN ID is used for balancing unicast frames.
◇ EthType – Indicates that the ethernet type is used for balancing unicast frames.
♦ Broadcast Type – Specifies the criterion used for balancing L2 broadcast and unknown frames. The possible values are:
◇ Common – A link allocated for broadcast and unknown frames is used for also for unicast frames.
◇ Dedicated - A link allocated for broadcast and unknown frames is not used for unicast frames.
Configuring Bridging
This section describes the Bridge menu and its options, including unicast and multicast routing, spanning tree and rapid spanning tree settings, MAC multicast routing, and traffic control.
Once a VLAN is defined, bridging is performed within the VLAN. For example if a DECnet VLAN is defined on ports 1 and 2, DECnet packets into port 1 are bridged to port 2 and DECnet packets into port 2 are bridged to port 1.
Operating Parameters
The Operating Parameters window allows you to define general parameters for bridging.
To display the Bridge Operating Parameters window:
♦ Select Bridge > Operating Parameters. The Bridge Operating Parameters window opens:

Figure 6- 65. Bridge Operating Parameters window
The Bridge Operating Parameters window displays the following fields:
◆ Bridge Address – The device MAC address.
◆ Bridge Type – Types of bridging the device can perform. This is a read only field, whose value is Transparent Only.
- Forwarding Table Aging Time – The user-defined number of seconds the learned entries remain in the Forwarding Table. The counter is reset each time the entry is used. After this time, entries are deleted from the table. There is a minimum 10-second period.
To edit the Forwarding Table Aging Time field:
- Display the Bridge Operating Parameters window.
- Edit the Forwarding Table Aging Time field.
- Click ☐. When the Status field displays "Finished!", the fields are confirmed as modified.
Unicast
Unicast is a method of sending one packet to one destination, for example between a workstation and a server. The Unicast menu has the following options:
◆ Unicast Global Forwarding Table.
♦ Unicast Forward Table Size.
Unicast Global Forwarding Table
The Unicast Forwarding Table contains information about MAC Addresses that belong to a specific VLAN.
To display the Unicast Global Forwarding Table:
♦ Select Bridge > Unicast > Unicast Global Forwarding Table. The Unicast Global Forwarding Table opens:
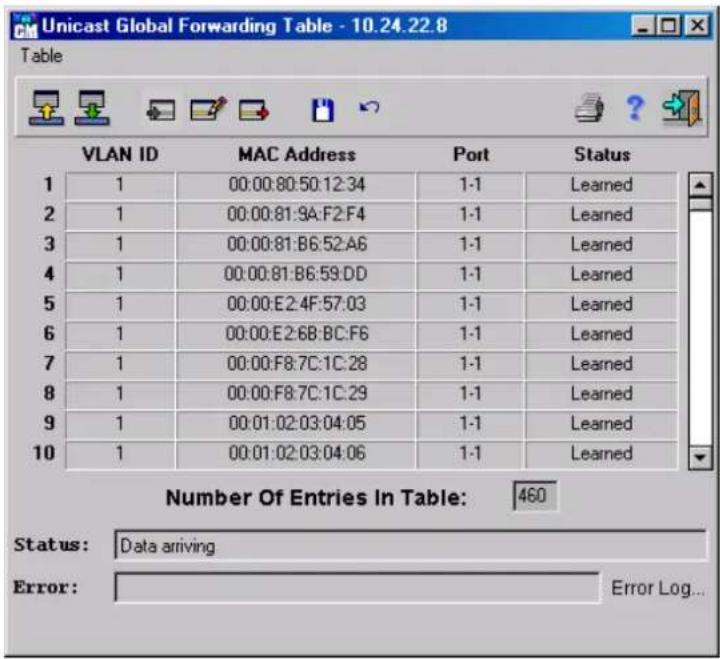
Figure 6- 66. Unicast Global Forwarding Table window
The Unicast Global Forwarding Table displays the following fields:
♦ VLAN ID – Identifies the VLAN to which the MAC Address applies.
♦ MAC Address – Identifies the Group MAC address of a frame to which the filtering information applies.
- Port – Identifies the specific port through which the MAC Address was learned.
- Status – Indicates the port status. The possible values are:
Learned – The entry was automatically learned.
◇ Self – The entry is a port on the device.
◇ Mgmt – The entry is a static node manually entered using the button.
◇ Other – Node status cannot be described by one of the above.
To add a new entry in the Unicast Global Forwarding Table:
- Display the Unicast Global Forwarding Table.
- Double-click an empty row in the Unicast Global Forwarding Table.


Figure 6-67. Global Forwarding Table Insert window
- Complete the fields. The fields are the same as those for Unicast Global Forwarding as described above.
- Click √. The Global Forwarding Table Insert window closes.
- Click 📋 to update the device. When the Status field displays "Finished!", the entry is saved to the device.
To edit an entry in the Global Forwarding Table:
- Display the Global Forwarding Table.
- Double-click an entry in the Global Forwarding Table.

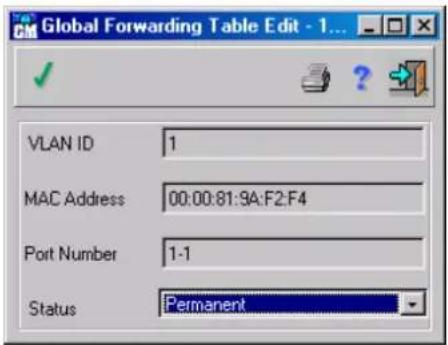
Figure 6-68. Global Forwarding Table Edit window
- Edit the fields. The fields are the same as those for Unicast Global Forwarding as described above.
- Click √. The Global Forwarding Table Edit window closes.
- Click 📋. When the Status field displays "Finished!", the profile is saved to the device.
To delete an entry in the Global Forwarding Table:
- Display the Global Forwarding Table.
- Select an entry in the Global Forwarding Table.
- Click ➤. The entry is deleted from Global Forwarding Table.
- Click ☐ to update the device. When the Status field displays "Finished!", the entry is deleted from the device.
Unicast Forward Table Size
The Unicast Forward Table Size contains information about VLANs and their entries.
To display the Unicast Forward Table Size Window:
♦ Select Bridge > Unicast > Unicast Global Forwarding Table Size. The Unicast Forward Table Size window opens:

Figure 6- 69. Unicast Forward Table Size window
The Unicast Forward Table Size window displays the following fields:
♦ VLAN ID – Indicates the VLAN on which the Unicast mode is enabled.
♦ No. of Entries – Indicates the amount VLAN entries.
Spanning Tree
The Spanning Tree Protocol (STP) provides tree topography for any arrangement of bridges. STP provides one path between end stations on a network, eliminating loops. STP is implemented either:
♦ STP per Device.
♦ Spanning Tree per VLAN.
ConfigMaster supports and automatically recognizes if the device is running STP per device or STP per VLAN.
Note: When changing the STP setting from STP per Device to STP per VLAN or visa versa, the device must be reset. ConfigMaster must be closed and reopened for the change to be viewed.
STP per Device
The following windows apply to STP per device. STP can be implemented on a per device basis.
Parameters
The Spanning Tree Parameters window allows you to set the parameters for the Spanning Tree per device.
To display the Spanning Tree Parameters window:
♦ Select Bridge > Spanning Tree > Parameters. The Spanning Tree Parameters window opens:

Figure 6-70. Spanning Tree Parameters window General Parameters tab
The Spanning Tree Parameters window displays the following fields:
♦ General Parameters – Defines general information about the Spanning Tree Mode on a device or VLAN, including the protocol specification, and if a port must belong to a VLAN. parameters can be modified.
◆ Bridge Setup Parameter – Identifies the root bridge's parameters.
- Root Parameters – Contains information regarding the root. These fields are grayed out and cannot be modified. The fields appearing in this tab are grayed out.
♦ STP Setup Parameters – Contains information regarding the STP Setup. These fields are grayed out and cannot be modified.
The General Parameters tab displays the following fields:
♦ Global STP Status – Indicates the STP status. The possible values are:
◇ Enabled - STP is enabled.
◇ Disabled - STP is disabled.
♦ STP Type – Indicates if the STP mode is per device or per VLAN.
♦ STP Type After Reset – Indicates the STP setting after the device is reset. The device must be reset for the change to be implemented. The possible values are:
◇ Per Device – Indicates that the STP mode is per device.
◇ Per VLAN – Indicates that the STP mode is per VLAN.
Note: STP per VLAN isn't supported in the present software release.
♦ Protocol Specification – Indicates the protocol type. This field is a read only.
♦ Must belong to VLAN – Indicates if ports must belong to a defined VLAN. The possible values are:
◇ True – Indicates that ports must belong to a defined VLAN to be in the STP mode.
False - Indicates that each port of a device is in STP mode, whether or not a VLAN was defined.
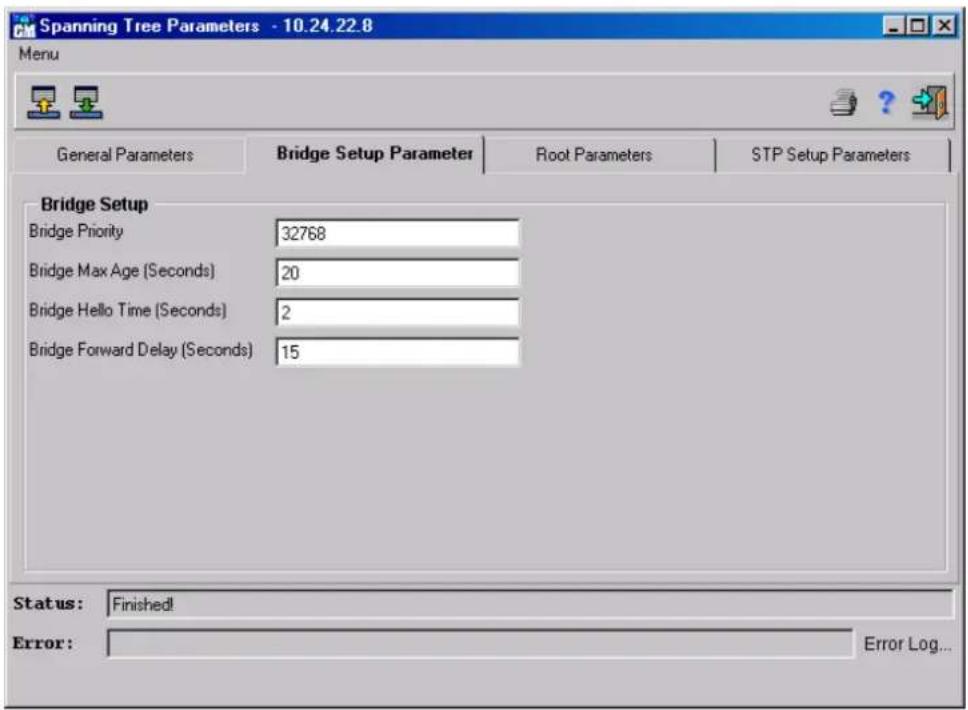
Figure 6-71. Spanning Tree Parameters window Bridge Setup Parameter tab
The Bridge Setup Parameter tab displays the following fields:
◆ Bridge Priority – Identifies the bridge priority and is part of the bridge identifier. The bridge identifier is 8 octets long, and the two most significant octets indicate the bridge priority. The bridge with the lowest value is the root.
- Bridge Max Age (Seconds) – Indicates the amount of time a bridge waits before implementing a topological change. The possible values are 6-40 seconds. The default is 20 seconds. This parameter is configured on all the bridges participating in the STP, but only the one belonging to the elected Root Bridge is used. It is strongly recommended to use: Max age ≥ Hello time x 2 + 1.0s.
◆ Bridge Hello Time (Seconds) – Indicates the amount of time a root bridge waits between configuration messages. The possible values are 1-10 seconds. The default is 2 seconds. Lengthening the Bridge Hello Time lowers the overhead time of the Spanning Tree Protocol (STP).
◆ Bridge Forwarding Delay (Seconds) – Indicates the amount of time a bridge remains in a listening and learning state before forwarding packets. The possible values are 4-30 seconds. Bridge Forward Delay is also used when a topology change is detected. Bridge Forward Delay ensures that Bridges use a consistent value for the Forward Delay Timer when changing the Port State to forwarding. The default is 15 seconds.

Figure 6-72. Spanning Tree Parameters window Root Parameters tab
The Root Parameters tab displays the following fields:
♦ STP MIB Version – Indicates the MIB version currently in use.
◆ Bridge Priority – Indicates the bridge's priority within the Spanning Tree. The bridge with the lowest value has the highest priority, and is the root.
◆ Bridge Address – Specifies the MAC address of the bridge.
♦ Designated Root Priority – Indicates the root's priority.
♦ Designated Root Address – Specifies the root's MAC address.
♦ Root Path Cost – The cost of the path from this bridge to the root.
- Root Port – Indicates the port number that offers the lowest cost path from this bridge to the Root Bridge. It is significant when the Bridge is not the Root. The default is zero.
♦ Topology Change Time – Indicates the amount of time that has passed since the last topological change.
♦ Topology Changes Count – Indicates the total amount of topographic changes in since the bridge was initialized or reset. The time is displayed in an hour-minute-second format, for example, 5 hours 10 minutes and 4 seconds.

Figure 6-73. Spanning Tree Parameters window STP Setup Parameters tab
The STP Setup Parameters tab displays the following fields:
♦ MAX Age (Seconds) – Indicates the amount of time in seconds that the bridge waits before discarding learned information. Identifies the timeout value used by all Bridges. This ensures that each Bridge has a consistent value against which to test the age of stored configuration information.
- Hello Time (Seconds) – Indicates the amount of time a bridge waits between CMs.
- Hold Time (Seconds) – Indicates the amount of time between the relaying of configuration messages through a port. The default value is 1 second.
♦ Forward Delay (Seconds) – Indicates the amount of time that a port remains in the listening and learning state before forwarding the traffic. This value is also used, when a topology change has been detected and is underway, to age all dynamic entries in the Forwarding Database. Forward Delay ensures that each Bridge uses a consistent value for the Forward Delay Timer when changing the State of a Port to the Forwarding State.
Note: Forward Delay (Sec) in contrast to Bridge Forward Delay (Sec) is the value currently in use. Bridge Forward Delay (Sec), Bridge Max Age (Sec), and Bridge Hello Time (Sec) are the values that this bridge and all others use when the bridge becomes the root.
Spanning Tree Port Table
The Spanning Tree Port Table allows network managers to edit the port states and parameters for the STP managed ports, and displays the port's current status.
To display the Spanning Tree Port Table:
♦ Select Bridge > Spanning Tree > Spanning Tree Port Table. The Spanning Tree Port Table opens:
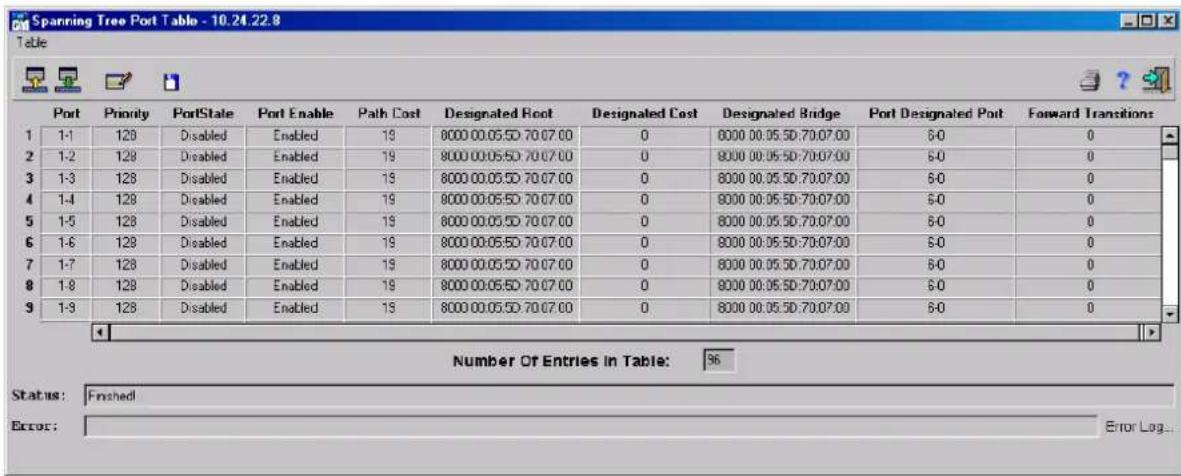
Figure 6-74. Spanning Tree Port Table window
The Spanning Tree Port Table displays the following fields:
♦ Port – Indicates the port number to which the STP applies.
- Priority – Indicates the priority value of the port. The Priority value can be used to influence the choice of port when a bridge has two ports connected in a loop.
- PortState – Indicates the current STP state of a port. If enabled Port State determines what forwarding action is taken on traffic. If the bridge discovers a malfunctioning port, the port is placed in the Broken State. The possible values are:
- Disabled - STP is currently disabled on the port. The port forwards traffic while learning MAC addresses.
◇ Blocking – The port is currently blocked and cannot be used to forward traffic or learn MAC addresses. - Listening – The port is currently in the listening mode. The port cannot forward traffic nor can it learn MAC addresses.
Learning – The port is currently in the learning mode. The port cannot forward traffic however it can learn new MAC addresses. -
Forwarding - The port is currently in the forwarding mode. The port can forward traffic and learn new MAC addresses.
◇ Broken - The port is currently malfunctioning and cannot be used for forwarding traffic. -
Port Enable – Indicates if the STP is enabled on the port. If the port is disabled, the PortState is forwarding.
- Path Cost – The amount this port contributes to the Root Path Cost. The Path Cost can be adjustable to a higher or lower value, and can be used to forward traffic towards or away from a path being rerouted.
♦ Designated Root – The Designated Bridge transmits a unique Bridge Identifier as the root in the CMs.
♦ Designated Cost – The Designated Port path cost of network segments connected to this port. This value is compared to the Root Path Cost field in received CMs.
♦ Designated Bridge – Identifies which bridge is the designated bridge for the port.
♦ Port Designated Port – Identifies the port on the designated bridge.
- Forward Transitions – Indicates the number of times the port has gone from a learning state to a forwarding state.
To edit an entry in the Spanning Tree Port Table:
- Display the Spanning Tree Port Table.
- Double-click an entry in the Spanning Tree Port Table.
or
Click . The Spanning Tree Port Table - Edit window opens:
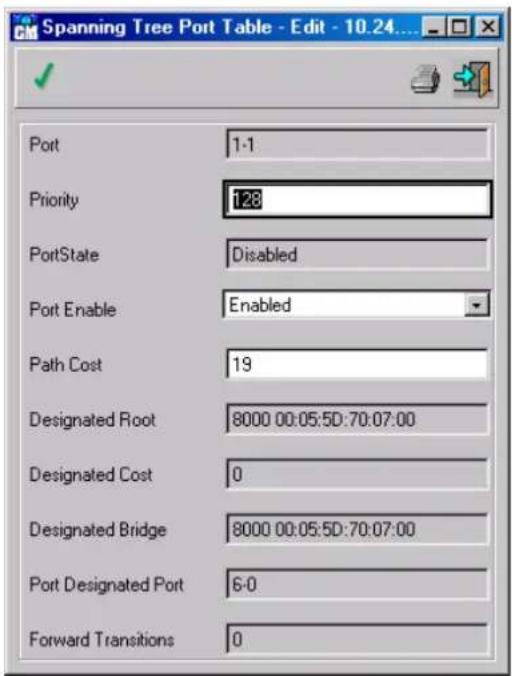
Figure 6-75. Spanning Tree Port Table- Edit window
- Edit the fields. The fields are the same as the Spanning Tree Port Table as described above.
- Click √. The Spanning Tree Port Table - Edit window closes.
- Click ☐. When the Status field displays "Finished!", the entry is saved to the device.
STP per VLAN
The following window applies to STP per device. STP can be implemented on a per VLAN basis.
Note: STP per VLAN isn't supported in the present software release.
Spanning Tree Parameters
The Spanning Tree Parameters window allows you to set the parameters for the Spanning Tree Mode.
To display the Spanning Tree Parameters window:
♦ Select Bridge > Spanning Tree > Parameters. The Spanning Tree Parameters window opens:

Figure 6-76. Spanning Tree Parameters window General Parameters tab
The General Parameters tab displays the following fields:
♦ Global STP Status – Indicates the STP status. The possible values are:
◇ Enable - STP is enabled.
◇ Disable - STP is disabled.
♦ STP Type – Indicates if the STP mode is per device or per VLAN.
♦ STP Type After Reset – Indicates the STP setting after the device is reset. The possible values are:
- Per Device – Indicates that the STP mode is per device.
◇ Per VLAN – Indicates that the STP mode is per VLAN.

Figure 6-77. Spanning Tree Parameters window Bridge Setup Parameter tab
The Bridge Setup Parameter tab displays the following fields:
◆ Bridge Priority – Indicates the bridge’s priority within the Spanning Tree. The bridge with the lowest value has the highest priority, and is the root.
◆ Bridge Max Age (Seconds) – Indicates the amount of time a bridge waits before implementing a topological change. The possible values are 6-40 seconds. The default is 20 seconds. This parameter is configured on all the bridges participating in the STP but only the one belonging to the elected Root Bridge is used. It is strongly recommended to use:
$$ \text { Max age } \geq \text { Hello time } \times 2 + 1. 0 \mathrm{s}. $$
◆ Bridge Hello Time (Seconds) – Indicates the amount of time a root bridge waits between configuration messages. The possible values are 1-10 seconds. The default is 2 seconds. Lengthening the Bridge Hello Time lowers the overhead time of the Spanning Tree Protocol (STP).
◆ Bridge Forward Delay (Seconds) – Indicates the amount of time a bridge remains in a listening and learning state before forwarding packets. The possible values are 4-30 seconds. Bridge Forward Delay is also used when a topology change is detected. Bridge Forward Delay ensures that Bridges use a consistent value for the Forward Delay Timer when changing the State of a Port to the forwarding state. The default is 15 seconds.
Spanning Tree Extended Port Table
The Spanning Tree Extended Port Table displays various types of damp and BPDU information.
To display the Spanning Tree Extended Port Table:
♦ Select Bridge > Spanning Tree > Spanning Tree Extended Port Table. The Spanning Tree Extended Port Table opens:

Figure 6-78. Spanning Tree Extended Port Table window
The Spanning Tree Extended Port Table displays the following fields:
♦ Damp Enable – Indicates Damp Enable status.
♦ Damp Stable – Indicates Damp Stable status.
◆ Filter BPDU – Indicates whether Bridge Protocol Data Units are being filtered by the switch.
♦ BPDU Sent – The number of Bridge Protocol Data Units sent from the port.
♦ BPDU Received – The number of Bridge Protocol Data Units received on the port.
Rapid Spanning Tree
Rapid STP provides a faster re-configuration of network paths than regular STP. Bridges make their forwarding assessments on both STP and Rapid STP paths.
The Rapid Spanning Tree menu option has the following menu options:
◆ Ports Table.
♦ Force Version Table.
Rapid STP Port Table
The Rapid STP Port Table contains information about the STP state on ports and VLANs.
To display the Rapid STP Port Table:
♦ Select Bridge > Rapid Spanning Tree > Ports Table. The Rapid STP Port Table opens:

Figure 6-79. Rapid STP Port Table window
The Rapid STP Port Table displays the following fields:
♦ VLAN – Identifies the VLAN to which the port belongs and STP is enabled.
♦ Port – Identifies the port number for which STP is currently enabled.
- Status – Indicates if the port is an edge port. The default is false.
Note: Rapid STP is recommended for edge ports in the topology. This eliminates loops that may be created through these ports.
To edit an entry in the Rapid STP Port Table:
- Display the Rapid STP Port Table.
- Double-click an entry in the Rapid STP Port Table.
or
Click . The Rapid STP Port Table - Edit window opens:

Figure 6-80. Rapid STP Port Table – Edit window
- Edit the fields. The fields are the same as the Rapid STP Port Table as described above.
-
Click √. The Rapid STP Port Table - Edit window closes.
-
Click 📋. When the Status field displays "Finished!", the entry is saved to the device.
Rapid STP Force Version Table
The Rapid STP Force Version Table contains information specific to Rapid STP.
To display the Rapid STP Force Version Table:
♦ Select Bridge > Rapid Spanning Tree > Force Version Table. The Rapid STP Force Version Table opens:

Figure 6-81. Rapid STP Force Version Table window
The Rapid STP Force Version Table displays the following:
♦ VLAN – The VLAN number to which the VLAN belongs.
◆ State – Specifies if the bridge is currently using:
Normal RSTP - Rapid STP Bridge Protocol Data Units (BPDU) are transmitted unless a legacy system is detected by a port.
◇ STP Compatibility – Indicates the rapid transition of alternate ports to root ports. Rapid STP transmits the configuration BPDUs and the Topology Change Notification (TCN) BPDUs only. Rapid STP BPDUs are discarded.
To edit an entry in the Rapid STP Force Version Table:
- Display the Rapid STP Force Version Table.
- Double-click an entry in the Rapid STP Force Version Table.
or
Click . The RStp Force Version Table - Edit window opens:

Figure 6-82. RStp Force Version Table – Edit window
- Edit the fields. The fields are the same as the Rapid STP Force Version Table as described above.
- Click √. The RStp Force Version Table - Edit window closes.
- Click ☐. When the Status field displays "Finished!", the entry is saved to the device.
Traffic Control
Traffic control allows users to map network traffic to priority queues, which determine the forwarding of network traffic. Priority values are assigned per port, and the settings are assigned per queue.
The Traffic Control menu option has the following menu options:
♦ Port Priority Table.
♦ Traffic Class Table.
♦ Priority Groups Table.
Traffic Control Port Priority Table
To display the Traffic Control Port Priority Table:
♦ Select Bridge > Traffic Control > Port Priority Table. The Port Priority Table opens:

Figure 6-83. Port Priority Table window
The Traffic Control Port Priority Table displays the following fields:
♦ Port – Identifies the port on the device.
◆ Default Priority – Indicates the default user priority assigned to the ingress port. Ports may have a priority value of 0-7. The default value is 0. Packets are assigned the default port priority if they are not tagged. Tagged packets are forwarded with their tagged priority.
◆ Number of Traffic Classes – The number of traffic classes to which received packets can be mapped. Priorities are mapped as follows:
Priorities 2-1 - Mapped to traffic class 0. Traffic class 0 is the lowest priority for forwarding packets.
◇ Priorities 0-3 – Mapped to traffic class 1.
◇ Priorities 4-5 – Mapped to traffic class 2.
Priorities 6-7 - Mapped to traffic class 3. Traffic class 3 is the highest priority for forwarding packets.
To edit an Traffic Control Port Priority Table entry:
- Display the Port Priority Table.
- Double-click an entry in the Port Priority Table.
or
Click

The Port Priority Table - Edit window opens:

Figure 6-84. Port Priority Table – Edit window
- Edit the fields. The fields are the same as the Port Priority Table as described above.
- Click √. The Port Priority Table - Edit window closes.
- Click 📋. When the Status field displays "Finished!", the entry is saved to the device.
Traffic Class Table
The Traffic Class Table allows network managers to map packet priorities to traffic classes within a group. Traffic class groups can only be configured on the same Hertz. Priorities can be mapped to four traffic classes.
To display the Traffic Class Table:
♦ Select Bridge > Traffic Control > Traffic Class Table. The Traffic Class Table opens:

Figure 6-85. Traffic Class Table window
The Traffic Class Table displays the following fields:
♦ Port – Indicates the port number.
- Port Group – Indicates the group to which a port belongs. All ports in a group must be mapped to the same priority and traffic class.
♦ PO – Indicates the traffic class value to which priority 0 is mapped.
◆ P1 – Indicates the traffic class value to which priority 1 is mapped.
♦ P2 – Indicates the traffic class value to which priority 2 is mapped.
♦ P3 – Indicates the traffic class value to which priority 3 is mapped.
◆ P4 – Indicates the traffic class value to which priority 4 is mapped.
◆ P5 – Indicates the traffic class value to which priority 5 is mapped.
♦ P6 – Indicates the traffic class value to which priority 6 is mapped.
♦ P7 – Indicates the traffic class value to which priority 7 is mapped.
To edit the Traffic Class Table:
- Display the Traffic Class Table.
- Double-click an entry in the Traffic Class Table.
or
Click . The Traffic Class Table- Edit window opens:

Figure 6-86. Traffic Class Table Edit window
- Edit the fields. The fields are the same as the Traffic Class Table as described above.
- Click √. The Traffic Class Table Edit window closes.
- Click ☐. When the Status field displays "Finished!", the entry is saved to the device.
Priority Group Table
The Priority Groups Table contains information about a port's priority group.
To display the Priority Groups Table:
♦ Select Bridge > Traffic Control > Priority Groups Table.
The Priority Groups Table opens:

Figure 6-87. Priority Groups Table window
The Priority Groups Table displays the following fields:
♦ Port – Indicates the port number.
♦ Priority Group – Indicates the group to which a port belongs.
Configuring Routing
This section describes the Router menu and its options, including routing settings for IP, IPM, and IPX routing
IP
For a device to perform IP routing, an IP Interface is configured. The IP interface consist of two parts:
♦ IP Address – The IP Address is defined for a physical port or VLAN.
♦ IP Network Mask – The IP Network Mask is determined by the network setup.
A device performs IP routing between all defined IP interfaces. The IP menu option has the following menu options:
♦ Operating Parameters
◆ Interface Parameters
♦ RIP
♦ OSPF II
♦ Routing Table
♦ ARP Table
♦ IP Redundancy
DHCP
♦ UDP Relay
◆ TCP General Parameters
◆ TCP Connections Table
Operating Parameters
The Operating Parameters window contains information about how the IP Router operates.
To display the IP Operating Parameters window:
♦ Select Router > IP > Operating Parameters. The IP Router Operating Parameters window opens:

Figure 6-88. IP Router Operating Parameters window
The IP Router Operating Parameter window displays the following fields:
♦ IP Redundancy Admin Status – If enabled, this device serves as a backup if the current main device fails.
♦ Inactive ARP Time Out – Seconds passed between ARP requests about an entry in the ARP table. After this period, the entry is deleted from the table.
♦ ARP Proxy – If enabled, the device responds to ARP requests for located nodes. If disabled the device responds with its own MAC address.
◆ ICMP Error Messages – If enabled the device generates ICMP error messages.
To edit IP Router operating parameter fields:
- Display the IP Router Operating Parameters window.
- Edit the fields as required.
- Click ☐. When the Status field displays "Finished!", the fields are confirmed as modified.
Interface Parameters
The Interface Parameters window displays specific details for each interface including IP addresses, network masks, port index number, broadcast types and if the ARP server is enabled.
To display a device IP Router Interfaces:
♦ Select Router > IP > Interface Parameters. The IP Router Interface Parameters window opens:

Figure 6-89. IP Router Interface Parameters window
The IP Router Interface Parameters window displays the following details for all a device IP interfaces:
♦ IP Address – Interface IP address.
◆ Network Mask – Associated subnet mask.
- If Num – Interface number. If the interface is a VLAN, the included interfaces are listed in the Interface Number box in the IP Router Interface Parameters Insert window.
◆ Fwd Broadcast – Indicates if the device forwards incoming broadcasts to this interface.
♦ Broadcast Type – Fills the host ID in the broadcast address with ones or zeros.
To add new a device IP interface:
- Display the IP Router Interface Parameters window.
- Click to add an IP interface. The IP Router Interface Parameters Insert window opens:

Figure 6-90. IP Router Interface Parameters Insert window
-
Enter the IP Address and Network Mask as determined by the network setup.
-
Select an interface number from the Interface Number list. This list contains all physical interfaces and all IP VLANs. If a required physical interface combination is not listed, use the VLAN Table to define the desired combination.
-
Click √ to confirm the new IP Interface.
-
Repeat steps 2-5 for all new IP interfaces.
To edit a a device IP interface:
-
Display the IP Router Interface Parameters window.
-
Select an entry and click 📋. The IP Router Interface Parameters Edit window opens:

Figure 6-91. IP Router Interface Parameters Edit window
The IP Router Interface Parameters Edit window contains the following buttons that define additional parameters:
◆ ICMP Parameters – Defines the ICMP parameters for IP interface.
♦ RIP Parameters – Defines the RIP parameters for IP interface.
♦ OSPF Parameters – Defines the OSPF parameters for IP interface
- Edit the fields required, except the IP Address field.
- Press the ICMP Parameters button and complete the ICMP Interface Parameters window fields.
- Press the RIP Parameters button and complete the RIP Interface Table Edit window fields.
- Press the OSPF Parameters button and complete the OSPF Interface table fields.
- Click √ to confirm the new IP Interface.
- Close the IP Router Interface Parameters Edit window.
To delete a a device IP interface:
- Display the IP Router Interface Parameters window.
-
Select an entry in the table.
-
Click .The IP Address is deleted.
-
Click 📋 to update the device.
To display the ICMP Interface Parameters window:
-
Display the IP Router Interface Parameters Edit window.
-
Press the ICMP Parameters button. The ICMP Interface Parameters window opens:
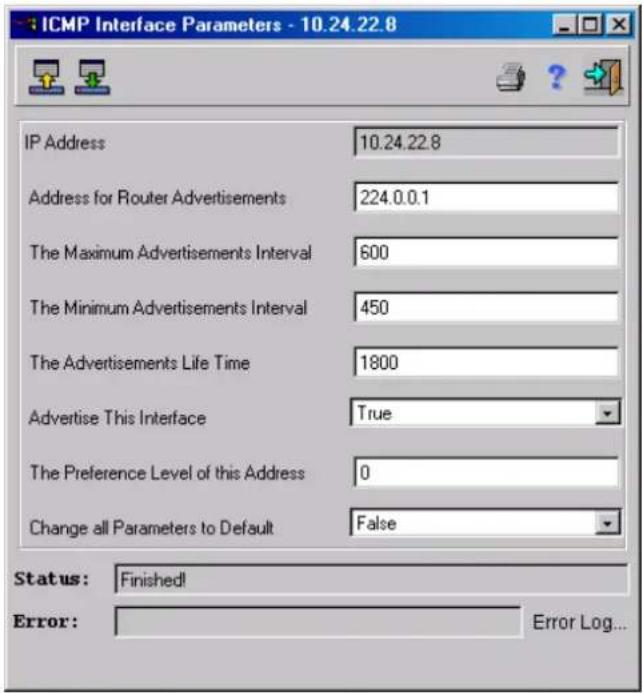
Figure 6-92. ICMP Interface Parameters window
The ICMP Interface Parameters window displays the following fields:
♦ IP Address – Interface IP address.
- Address for Router Advertisements - IP destination address for multicast Router Advertisements sent from the interface. Possible values are the all-systems multicast address, 224.0.0.1, or the limited-broadcast address, 255.255.255.255.
- The Maximum Advertisements Interval – Maximum time in seconds between multicast Router Advertisements from the interface. Possible values are between the minimum interval defined below and 1800 seconds.
- The Minimum Advertisements Interval - Minimum time in seconds between sending unsolicited multicast Router Advertisements from the interface. Possible values are between 3 seconds and the maximum interval defined above. Default value is 0.75 of the Maximum Interval.
- The Advertisements Lifetime – Maximum time in seconds the advertised addresses are considered valid. Must be no less than a Maximum Interval defined above, and no greater than 9000 seconds. Default value is 0.3 of the Maximum Interval.
♦ Advertise This Interface – Whether the address is advertised.
- The Preference Level of this Address – Preference address as a default router Default address, relative to other router addresses on the same Subnet.
- Change all Parameters to Default – Resets all parameters in this window to their default values.
To edit ICMP Interface Parameters fields:
- Display the ICMP Interface Parameters window.
- Edit any field except the IP Address field.
- Click ☐. When the Status field displays "Finished!", the fields are confirmed as modified.
To display the RIP Interface Table Edit window:
- Display the IP Router Interface Parameters Edit window.
- Press the RIP Parameters button. The RIP Interface Table Edit window opens:

Figure 6-93. RIP Interface Table Edit window
The RIP Interface Table Edit window displays the following fields:
♦ IP Address – The IP address of the current interface.
♦ Outgoing RIP – The type of RIP being sent.
◇ RIP version 1 - Sending RIP updates compliant with RFC 1058.
◇ RIP version 2 – Multicasting RIP-2 updates.
Do Not Send - No RIP updates are sent.
- Incoming RIP – The type of RIP being received.
◇ RIP version 1 - Accepting RIP 1.
◇ RIP version 2 - Accepting RIP 2.
Do Not Receive - No RIP updates are accepted.
♦ Default Route Metric – Metric for the default route entry in RIP updates originated on this interface. Zero indicates that no default route should be originated.
- Auto Send – When this parameter is enabled, the device advertises RIP messages with only the default metric. This allows some stations to learn the default router address. If the device detects another RIP message, Auto Send is disabled. Enable this to minimize network traffic when the device is the only router on the network.
◆ Virtual Distance – Virtual number of hops assigned to the interface. This enables RIP routing algorithm fine-tuning.
◆ Status – The status of the RIP in the router.
To edit RIP Parameters window fields:
- Display the RIP Interface Table (Select Router > IP > RIP > Interface Parameters).
- Select an entry in the table.
- Click 📋. The RIP Interface Table Edit window opens:

Figure 6-94. RIP Interface Table Edit window
The RIP Interface Table Edit window fields are described above.
- Edit the selected table entry fields and click √. The RIP Interface Table opens.
- Click 📋. When the Status field displays "Finished!", the fields are confirmed as modified.
To display the OSPF Interface Table Edit window:
OSPF is supported from software version 3.03 and up.
- Display the IP Router Interface Parameters Edit window.
- Press the OSPF Parameters button. The OSPF Interface Table Edit window opens:

Figure 6-95. OSPF Interface Table Edit window
The OSPF Interface Table Edit window displays the following fields:
♦ IP Address – The IP address of this OSPF interface.
♦ Area ID – The IP address of the area.
♦ If Type – The interface type, such as Broadcast.
- Admin. Status – The administrative status of the OSPF in the router. Enabled means that the OSPF process is active on at least one interface. Disabled means the process is not active on any interface.
- Priority – The priority of this interface. The value 0 means that this router is not eligible to become the designated router on the current network. If more than one router has the same priority, the router ID is used.
- Hello Interval (sec) – The amount of seconds between Hello packets. All routers attached to a common network must have the same Hello Interval.
Time Before Declare Router Dead (sec) – The number of seconds a router's Hello packets have not been detected, before the router's neighbors declare the router to be down. The value must be multiple of the Hello Interval value. All routers attached to a common network must have a value specified for this parameter.
- If State – The OSPF interface state:
◇ Down - The OSPF interface is down.
◇ Loopback – The OSPF interface is in the Loopback state.
◇ Waiting – The OSPF interface is currently waiting.
◇ Point to Point – The OSPF interface is in the point-to-point state.
◇ Designated Router – The OSPF interface is the designated router.
◇ Backup Designated Router – The OSPF interface is the backup designated router.
- Other Designated Router – Other routers are the designated and backup routers.
♦ Designated Router – The IP address of the designated router.
◆ Backup Desig. Router – The IP address of the backup designated router.
◆ Interface Authentication Key – The interface authentication key.
♦ Authentication Type – The interface authentication type. The options are None or Password.
♦ Metric Value – The metric for this type of service on the interface.
To edit OSPF Parameter fields:
- Display the OSPF Interface Table.
- Select an entry in the table.
- Click . The OSPF Interface Table Edit window opens.
- Edit the selected table entry fields and click √. The OSPF Interface Table opens.
- Click 📄. When the Status field displays "Finished!", the fields are confirmed as modified.
RIP
The RIP menu has the following menu options:
- Parameters.
◆ Interface Parameters.
♦ RIP Filter.
Parameters
To display RIP Parameters:
♦ Select Router > IP > RIP > Parameters. The RIP Parameters window opens:

Figure 6-96. RIP Parameters window
The RIP Parameters window displays the following:
◆ Administrative Status – The RIP administrative status in the router. Enabled means the RIP process is active on at least one interface. Disabled means the process is not active on any interfaces
♦ Leak OSPF Routes - Controls redistribution of routes from OSPF to RIP. When this parameter is enabled, all routes learned via OSPF are advertised into RIP.
♦ Leak Static Routes – Controls redistribution of routes from static routes to RIP. When this parameter is enabled, all static routes learned via static are advertised into RIP.
To edit RIP Parameter fields:
- Display the RIP Parameters window.
-
Edit fields to Enable or Disable.
-
Click ☐. When the Status field displays "Finished!", the fields are confirmed as modified.
RIP Interface Parameters
To display the RIP Interface Table:
♦ Select Router > IP > RIP > Interface Parameters. The RIP Interface Table opens:

Figure 6-97. RIP Interface Table window
The RIP Interface Table displays the following fields:
♦ IP Address – Current IP address interfaces.
♦ Outgoing RIP – The type of RIP being sent.
◇ RIP Software version 1 - Sending RIP updates compliant with RFC 1058.
◇ RIP Software version 2 – Multicasting RIP2 updates.
Do Not Send - No RIP updates are sent.
- Incoming RIP – The type of RIP being received.
◇ RIP Software version 1 - Accepting RIP1.
◇ RIP Software version 2 - Accepting RIP2.
♦ Do Not Receive – No RIP updates are accepted.
- Status – The RIP status in the router is either valid or invalid.
To edit RIP Interface Table fields:
- Display the RIP Interface Table.
- Select an entry in the table.
- Click . The RIP Interface Table Edit window opens:

Figure 6-98. RIP Interface Table Edit window
The RIP Interface Table Edit window display the following fields:
♦ Default Route Metric – Metric for the default route entry in RIP updates originated on this interface. Zero indicates that no default route is originated.
- Auto Send - When this parameter is enabled, this device advertises RIP messages in the default metric only. This allows some stations to learn the default router address. If the device detects another RIP message, Auto Send is disabled. Enable this parameter to minimize network traffic when the device is the only router on the network.
◆ Virtual Distance – Virtual number of hops assigned to the interface. This fine-tunes the RIP routing algorithm.
-
Edit the required fields. The IP Address field cannot be modified.
-
Click √.
- Close the RIP Interface Table Edit window. The RIP Interface Table opens.
- Click ☐. When the Status field displays "Finished!", the fields are confirmed as modified.
RIP Filters
IP RIP filtering is a device feature that improves aggregate routing performance. Defining IP RIP filters reduces the RIP table size to the relevant IP subnets, allowing for a faster table lookup and relearning memory for other purposes. RIP filters are supported from software version 3.03 and up.
To display the RIP filters:
♦ Select Router > IP > RIP > RIP Filters. The IP RIP Filter window opens:

Figure 6-99. IP RIP Filter window
The IP RIP Filter window displays the following fields:
♦ IP Address – The Interface IP address.
◆ Interface Number – The pre-assigned Interface number.
There are two added filters:
♦ IP RIP Global Filter – Defines the parameters for IP RIP Global Filters including the type, network address, bits matched, and filter actions.
♦ IP Interface RIP Filter – Defines the parameters for IP Interface RIP Filters including the type, validity, network address, bits matched, and filter actions.
To display IP RIP Global Filter Table:
- Display the IP RIP Filter window.
- Click Global Filter. The IP RIP Global Filter Table opens:

Figure 6-100. IP RIP Global Filter Table window
The IP RIP Global Filter Table displays the following fields:
- Type – The filters type is for input or output transmissions.
◆ Network Address – The selected interface IP address
◆ Number of Match Bits – The number of bits to match the network IP address. A value less than 32 represents a wildcard.
◆ Filter Action – This parameter is used to fine-tune other filters. For example set a filter to block all RIPS messages with net address 192.114 and set another filter entry to permit all RIP messages with the network 192.114.25. All RIP messages with the network 192.114 that do not end in 25 are blocked.
Permit – Whether the indicated packets should be forwarded.
◇ Deny – Whether the indicated packets should be blocked.
To add a global RIP filter:
-
Display the IP RIP Global Filter Table.
-
Click 📋. The IP RIP Filter Global Insert window opens:
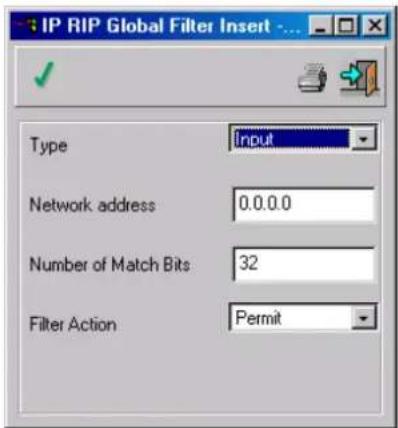
Figure 6-101. IP RIP Global Filter Insert window
- Complete the fields.
- Click √.
- Close the RIP Global Filter Insert window. The IP RIP Global Filter Table opens.
- Click 📄. When the Status field displays "Finished!", the fields are confirmed as modified.
To edit a global RIP filter:
- Display the IP RIP Global Filter Table.
- Select an entry in the table.
- Click . The RIP Global Filter Edit window opens:

Figure 6-102. RIP Global Filter Edit window
The RIP Global Filter Edit window is identical to the RIP Global Filter Insert window.
- Modify the required fields.
- Click √
- Close the RIP Global Filter Edit window. The IP RIP Global Filter Table opens.
- Click ☐. When the Status field displays "Finished!", the fields are confirmed as modified.
To delete a global RIP filter:
- Display the IP RIP Global Filter Table.
-
Select an entry in the table.
-
Click . The entry is deleted.
-
Click 📋. When the Status field displays "Finished!", the fields are confirmed as modified.
To display IP Interface RIP Filter Table:
-
Display the IP Interface RIP Filter Table.
-
Select a filter in the table.
-
Click Interface Filter. The IP Interface RIP Filter Table opens:

Figure 6-103. IP Interface RIP Filter Table window
The IP Interface RIP Filter Table displays the following fields:
- Type – The filter is for input or output.
◆ Status – The filter is valid or not.
◆ Network Address – The IP address network - Number of Match Bits – The number of bits to match the network IP address. A value less than 32 represents a wildcard.
◆ Filter Action – This parameter is used to fine-tune other filters. For example set a filter to block all RIP messages with net address 192.114 and set another filter entry to permit all RIP messages with the network 192.114.25. All RIP messages with the network 192.114 that do not end in 25 are blocked.
Permit – Whether the indicated packets should be forwarded.
◇ Deny – Whether the indicated packets should be blocked.
To add a RIP interface filter:
-
Display the IP Interface RIP Filter Table.
-
Click 📋. The IP Interface RIP Filter Table Insert window opens:

Figure 6-104. IP Interface RIP Filter Table Insert window
- Complete the fields.
- Click √.
- Close the IP Interface Filter RIP Table Insert window. The IP Interface RIP Filter Table opens.
- Click ☐. When the Status field displays "Finished!", the fields are confirmed as modified.
To edit a RIP interface filter:
- Display the IP Interface RIP Filter Table.
- Select an entry in the table.
- Click 📋. The IP Interface Filter RIP Table Edit window opens. The RIP Global Filter Edit is identical to the IP Interface RIP Filter Table Insert window.
- Modify the required fields.
- Click √.
- Close the IP Interface Filter RIP Table Edit window. The IP Interface RIP Filter Table opens.
- Click ☐. When the Status field displays "Finished!", the fields are confirmed as modified.
To delete a RIP interface filter:
- Display the IP Interface RIP Filter Table.
- Select an entry in the table.
- Click . The filter is deleted.
- Click ☐. When the Status field displays "Finished!", the fields are confirmed as modified.
OSPF II
The OSPF II menus has the following menu options:
◆ Parameters
◆ Interface Parameters
◆ Area Table
♦ Link State Database
◆ External Link State Database
♦ Neighbors Table
Parameters
To display OSPF parameters:
♦ Select Router > IP > OSPF II> Parameters. The OSPF Parameters window opens:

Figure 6-105. OSPF Parameters window
The OSPF Parameters window displays the following fields:
◆ Administrative Status – The OSPF administrative status in the router. The field options are the following:
- Enable – The OSPF process is active on at least one interface.
◇ Disable – The process is not active on any interface.
◆ Router ID – The router ID number. To ensure uniqueness the router ID must be equal to one of the router IP addresses. By default, the router ID takes the IP Interface Address. Reset the device to allow changes in the router ID to take effect.
◆ Number of External LSAs – The number of external Link-State Advertisements in the link-state database.
- External LS Checksum Sum - The sum of LS checksums of external LS advertisements contained in the LS database. Use this sum to determine if there has been a change in a router LS database, and to compare the LS database of two routers.
♦ Leak RIP Routes - Controls the route redistribution from RIP into OSPF. When this parameter is enabled, all routes inserted into the IP routing table via SNMP are advertised into OSPF as external routes.
♦ Leak Static Routes – Controls route redistribution from static routes to RIP. When this parameter is enabled, all static routes learned via static are advertised into RIP.
♦ Leak External Direct Routes – Controls direct route redistribution that is external to OSPF into OSPF. If this parameter is enabled all external routes are advertised into OSPF as external routes.
To edit OSPF parameters:
- Display the OSPF Parameters window.
- Modify the required fields.
- Click ☐. When the Status field displays "Finished!", the fields are confirmed as modified.
OSPF Interface Parameters
To display the OSPF Interface Table:
♦ Select Router > IP > OSPF II > Interface Parameters. The OSPF Interface Table opens:

Figure 6-106. OSPF Interface Table window
The OSPF Interface Table displays the following fields:
♦ IP Address – The OSPF interface IP address.
♦ Area ID – The area IP address.
- If Type – The interface type, such as Broadcast.
- If State – The OSPF interface states are the following:
◇ Down - The OSPF interface is down.
◇ Loopback – The OSPF interface is in a Loopback state.
◇ Waiting – The OSPF interface is currently waiting.
◇ Point to Point – The OSPF interface is in a point to point state.
◇ Designated Router – The OSPF interface is the designated router.
◇ Backup Designated Router – The OSPF interface is the backup designated router.
- Other Designated Router – Other routers are the designated and backup routers.
♦ Designated Router – The designated router IP address.
◆ Backup Desig. Router – The backup designated router IP address.
To edit the OSPF Interface Table:
-
Display the OSPF Interface Table.
-
Select an entry in the table.
-
Click . The OSPF Interface Table Edit window opens:
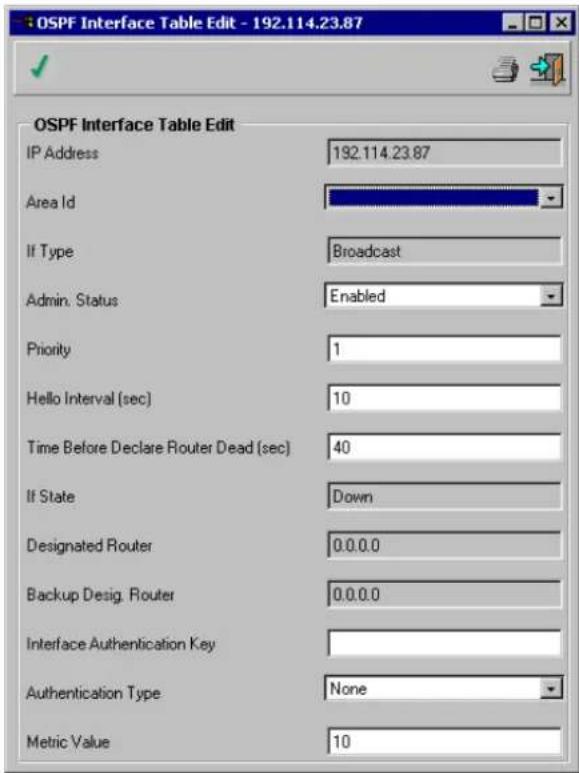
Figure 6-107. OSPF Interface Table Edit window
The OSPF Interface table Edit displays the following additional parameters:
- Admin Status – The OSPF administrative status in the router. Enabled means that the OSPF process is active on at least one interface. Disabled means the process is not active on any interface.
- Priority – The priority of this interface. The value 0 means that this router is not eligible to become the designated router on the current network. If more than one router has the same priority, the router ID is used.
- Hello Interval (sec) – The amount of seconds between Hello packets. All routers attached to a common network must have the same Hello Interval.
Time Before Declare Router Dead (sec) – The number of seconds a router Hello packet has not been detected, before the router neighbors declare the router to be down. The value must be a multiple of the Hello Interval value. All routers attached to a common network must have a value specified for this parameter.
◆ Interface Authentication Key – The interface authentication key.
◆ Authentication Type – The interface authentication type. For example, a password could be used for authentication.
♦ Metric Value – The metric for this type of service on the interface.
-
Edit the required fields. The IP Address field cannot be modified.
-
Click . √
-
Close the OSPF Interface Table Edit window. The OSPF Interface Table opens.
-
Click ☐. When the Status field displays "Finished!" the fields are confirmed as modified.
Area Table
Note: A device configured to support OSPF does not support virtual links.
A device supports up to 120 IP interfaces and up to 362 neighbors on one Area. OSPF supports leaks to RIP1 and RIP2.
To display the OSPF Area Table:
◆ Select IP > OSPF II > Area Table. The OSPF Area Table opens:
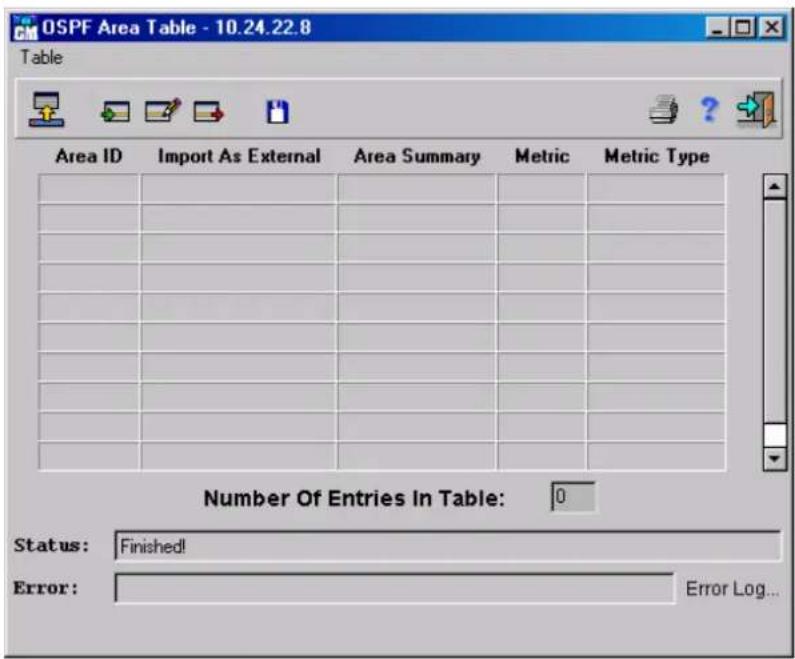
Figure 6-108. OSPF Area Table window
The OSPF Area Table displays the following parameters:
♦ Area ID - The area IP address.
- Import as External – The area support for importing as external link state advertisement.
- Area Summary – Controls the import of summary LSAs into stub areas. This variable has no effect on other areas.
No Area Summary – The router neither originates nor distributes summary LSAs into the stub area. It relies on its default route.
◇ Send Area Summary – The router both summarizes and distributes summary LSAs.
♦ Metric – The metric for this type of service on the interface.
♦ Metric Type – The metric protocol type.
To add an OSPF area:
- Display the OSPF Area Table.
- Click 📋. The OSPF Area Table Insert window opens:
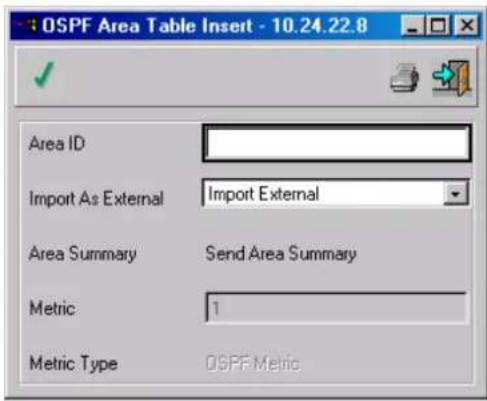
Figure 6-109. OSPF Area Table Insert window
- Complete the fields.
- Click √.
- Close the OSPF Area Table Insert window. The OSPF Area Table opens.
- Click 📄. When the Status field displays "Finished!", the fields are confirmed as modified.
To edit an OSPF Area Table entry:
- Display the OSPF Area Table.
- Select an in the table.
- Click 📋. The OSPF Area Table Edit window opens. The OSPF Area Table Edit is identical to the OSPF Area Table Insert window.
- Edit the required fields. The Area ID field cannot be edited.
- Click √
- Close the OSPF Area Table Edit window. The OSPF Area Table opens.
- Click 📄. When the Status field displays "Finished!", the fields are confirmed as modified.
To delete an OSPF Table entry:
- Display the OSPF Area Table Edit window.
- Select an entry in the table.
- Click . The area is deleted.
- Click ☐. When the Status field displays "Finished!", the fields are confirmed as modified.
Link State Database
This is a read-only command. The database cannot be modified.
To display the Link State Database:
♦ Select Router > IP > OSPF II > Link State Database. The Link State Database window opens:

Figure 6-110. OSPF Link State Database window
The Link State Database window displays the following parameters:
♦ Area ID - The link IP address.
- Link Type – Each link state advertisement has a specific format. The link is a Router Link, Network Link, External Link, Summary Link or Stub Link.
- Link ID - Identifies the routing domain piece described by the advertisement. It is either a router ID or an IP address.
◆ Router ID – Identifies the originating router in the autonomous system.
◆ Sequence Number – The number for the link. This parameter is used to detect old and duplicate links state advertisements. The larger the sequence number the more recent the advertisement.
♦ Age – The link age state advertisement in seconds.
- Checksum – This parameter is a checksum of the advertisement complete contents, excluding the Age value.
External Link State Database
To display the OSPF External Link State Database Table:
♦ Select Router > IP > OSPF II > External Link State Database. The OSPF External Link State Database Table opens:

Figure 6-111. OSPF External Link State Database Table window
The OSPF External Link State Database Table displays the following parameters:
- Link Type – Each link state advertisement has a specific format. The link is a Router Link, Network Link, External Link, Summary Link or Stub Link.
- Link ID - Identifies the routing domain piece described by the advertisement. It is either a router ID or an IP address.
♦ Orig. Router ID – Identifies the originating router in the autonomous system.
♦ OSPF Sequence Number – The number for the link. This parameter is used to detect old and duplicate links state advertisements. The larger the sequence number the more recent the advertisement. - Link State Age – The link state advertisement age, in seconds.
- Checksum – The complete advertisement contents checksum, excluding the Age.
- Link State Advertisement - The link state advertisement, containing the header and contents.
Neighbors Table
To display the OSPF Neighbors Table:
♦ Select Router > IP > OSPF II > Neighbors Table. The OSPF Neighbors Table opens:

Figure 6-112. OSPF Neighbors Table window
The OSPF Neighbors Table displays the following parameters:
♦ IP Address – The neighbor interface IP address.
◆ Network Mask – The neighbor network address interface.
To display a selected OSPF neighbor list:
- Display the OSPF Neighbors Table.
- Select a row in the OSPF Neighbors Table and click the Show Neighbor List button. The read-only OSPF Neighbors Table Interface window opens:

Figure 6-113. OSPF Neighbors Table Interface window
The OSPF Neighbors Table Interface displays the following parameters:
♦ Neighbor's Address – The neighbor IP address.
◆ Router ID – A unique neighboring router identifier in the autonomous system.
- Priority – The priority of this neighbor. A priority of 0 means that this neighbor is not eligible to become the designated router on this network.
♦ Neighbor State – The relationship with neighbor state. The possible values are:
◇ Down
◇ Attempt
◇ Ini
◇ Two Way
Exchange Start
Exchange
◇ Loading
◇ Full.
Routing Table
To display the IP Routing Table:
♦ Select Router > IP > Routing Table. The IP Routing Table opens:

Figure 6-114. IP Routing Table window
The IP Routing Table displays the following parameters:
♦ Dest IP Address – The destination IP address of this router.
◆ Network Mask – The destination network mask of this route.
♦ Next Hop – Address of the next system in this route, central to the interface.
◆ Interface Number – The central interface Index through which the next hop of this route is reached.
◆ Route Type – How remote routing is handled.
♦ Metric – Number of hops to the destination network.
♦ Protocol – Through which protocol the route is known.
To add an IP Routing entry:
-
Display the IP Routing Table.
-
Click . The IP Routing Table Insert window opens:

Figure 6-115. IP Routing Table Insert window
- Complete the fields.
- Click
- Close the IP Routing Table Insert window. The IP Routing Table opens.
- Click √. When the Status field displays "Finished!", the fields are confirmed as modified.
To edit an IP Routing entry:
- Display the IP Routing Table.
- Select an entry in the table.
- Click . The IP Routing Table Edit window opens:
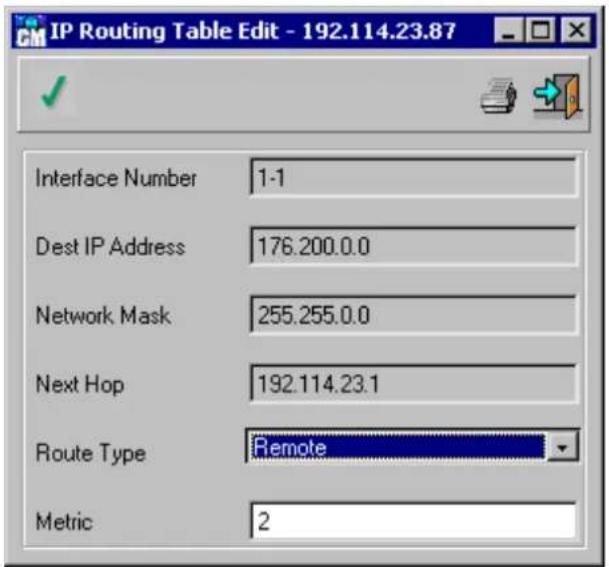
Figure 6-116. IP Routing Table Edit window
- Edit the required fields.
Note: The Edit command is available for remote routers only.
-
Click
-
Close the IP Routing Table Edit window. The IP Routing Table opens.
-
Click √. When the Status field displays "Finished!", the fields are confirmed as modified.
To delete an IP Routing entry:
-
Display the IP Routing Table.
-
Select an entry in the table.
-
Click . The entry is deleted.
-
Click √. When the Status field displays "Finished!", the fields are confirmed as modified.
ARP Table
To display the Global ARP Table:
♦ Select Router > IP > ARP table. The Global ARP Table opens:

Figure 6-117. Global ARP Table window
The Global ARP Table displays the following parameters:
◆ Interface – The interface number on which the station resides.
♦ IP Address – The station IP address.
♦ MAC Address – The station MAC address.
♦ Class – Entry type:
Dynamic - The entry is learned from the ARP protocol. If the entry is not active for a predetermined time, the node is deleted from the table.
Static - The entry is configured by the network management station and is permanent.
To add a Global ARP Table entry:
-
Display the Global ARP Table.
-
Click . The Global ARP Table Insert window opens:

Figure 6-118. Global ARP Table Insert window
- Complete the fields.
- Click
- Close the Global ARP Table Insert window. The Global ARP Table opens.
- Click √. When the Status field displays "Finished!", the fields are confirmed as modified.
To edit a Global ARP Table entry:
- Display the Global ARP Table.
- Select an entry in the table.
- Click . The Global ARP Table Edit window opens:

Figure 6-119. Global ARP Table Edit window
- Edit the required fields.
- Click
- Close the Global ARP Table Edit window. The Global ARP Table opens.
- Click √. When the Status field displays "Finished!", the fields are confirmed as modified.
To delete a Global ARP Table entry:
- Display the Global ARP Table.
-
Select an entry in the table.
-
Click . The entry is deleted.
-
Click √. When the Status field displays "Finished!", the fields are confirmed as modified.
IP Redundancy
To display the IP Redundancy Table:
♦ Select Router > IP > IP Redundancy. The IP Redundancy Table opens:
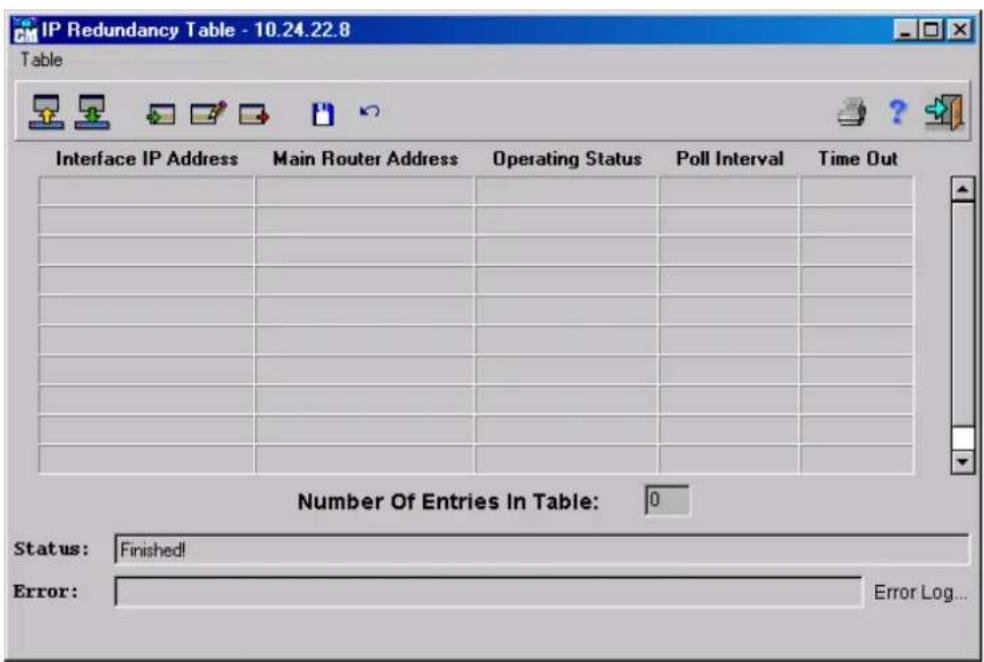
Figure 6-120. IP Redundancy Table window
The IP Redundancy Table displays the following parameters:
◆ Interface IP Address – The IP address on which the redundancy feature is running.
- Main Router Address – The router IP address that the device is backing up.
♦ Operating Status – The entry status:
Active - The backup router is active on this interface.
◇ Inactive – The backup router is not active on this interface.
♦ Poll Interval – This router-polling interval, in seconds. If the interval is 0 then the router is not polled.
- Time Out – The interval in seconds during which the router must signal. If the router does not signal within this interval it is considered non-operational. If Time Out is equal to 0, the device ignores the row.
To add an IP Redundancy Table entry:
- Display the IP Redundancy Table.
- Click 📋. The IP Redundancy Table Insert window opens:

Figure 6-121. IP Redundancy Table Insert window
- Complete the fields.
- Click
- Close the IP Redundancy Table Insert window. The IP Redundancy Table opens.
- Click √. When the Status field displays "Finished!", the fields are confirmed as modified.
To edit an IP Redundancy Table entry:
- Display the IP Redundancy Table.
- Select an entry in the table.
- Click , and edit the fields.
- Click
- Close the IP Redundancy Table Edit window. The IP Redundancy Table opens.
- Click √. When the Status field displays "Finished!", the fields are confirmed as modified.
To delete an IP Redundancy Table entry:
- Display the IP Redundancy Table.
- Select an entry in the table.
- Click . The entry is deleted.
- Click ☐. When the Status field displays "Finished!", the fields are confirmed as modified.
DHCP
The central DHCP server acts as a relay for DHCP and BootP requests originating from remote IP subnets.
DHCP Relays Table
To display the DHCP Relays Table:
♦ Select Router > IP > DHCP > DHCP Relays Table. The DHCP Relays Table window opens:

Figure 6-122. DHCP Relays Table window
The DHCP Relays Table window displays the following parameters:
♦ Next Server Address – The DHCP server IP address. The device acts as a DHCP relay if this parameter is not equal to 0.0.0.0.
- Threshold - DHCP requests are relayed only if their SEC field is greater or equal to the threshold value, in order to allow local DHCP servers to answer first.
To add a DHCP Relays Table entry:
- Display the DHCP Relays Table window.
- Click . The rsDHCP Multiple Relays Entry - Insert window opens:

Figure 6-123. rsDHCP Multiple Relays Entry – Insert window
- Complete the fields.
- Click
- Close the rsDHCP Multiple Relays Entry - Insert window. The DHCP Relays Table opens.
- When the Status field displays "Finished!", the fields are confirmed as modified.
To edit a DHCP Relays Table entry:
-
Display the DHCP Relays Table window.
-
Select an entry in the table.
- Click . The rsDHCP Multiple Relays Entry - Edit window opens:

Figure 6-124. rsDHCP Multiple Relays Entry - Edit window
- Edit the required fields.
- Click √.
- Close the rsDHCP Multiple Relays Entry - Edit window. The DHCP Relays Table opens.
- When the Status field displays "Finished!", the fields are confirmed as modified.
To delete a DHCP Relay Table entry:
- Display the DHCP Relays Table.
- Select an entry in the table.
- Click . The entry is deleted.
UDP Relay
A device supports UDP Relay to allow UDP packets to reach other networks. This feature enables browsing from NT workstations to NT-servers on different networks.
To display the UDP Relay Table:
♦ Select Router > IP > UDP Relay. The UDP Relay Table opens:
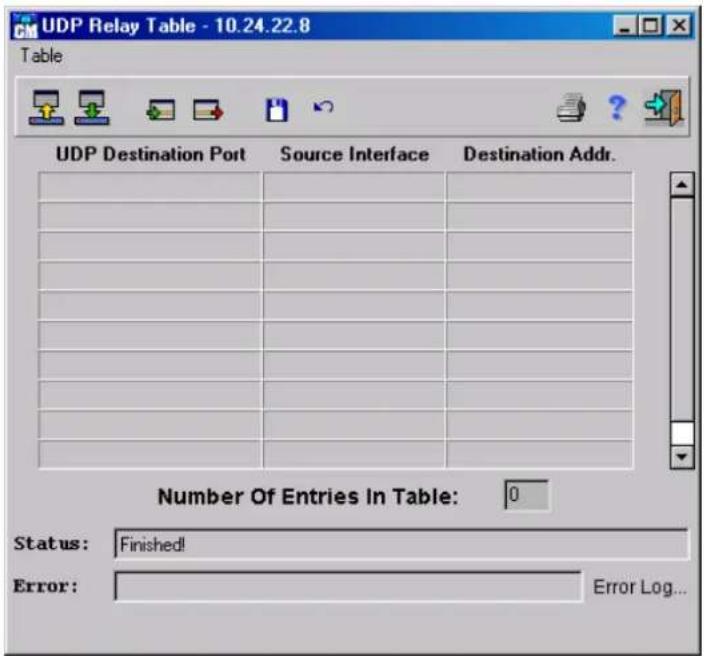
Figure 6-125. UDP Relay Table window
The UDP Relay Table displays the following parameters:
◆ UDP Destination Port – The destination UDP port ID number of UDP packets to be relayed. The following table lists UDP Port allocations.
Note: UDP Ports 137 and 138 are the most commonly used.
UDP Ports
| UDP Port # Acronym Application | ||
| 7 | ECHO | Echo |
| 11 | USERS | Active Users |
| 13 | DAYTIME | Daytime |
| 15 | NETSTAT | Netstat |
| 17 QUOTE Quote Of The Day | ||
| 19 | CHARGEN | Character Generator |
| 37 | TIME | Time |
| 42 NAMESERVER | Host Name Server | |
| 43 | NICNAME | Who Is |
| 53 DOMAIN | Domain Name Server | |
| 67 BOOTPS | Bootstrap Protocol Server | |
| 68 | BOOTPC | Bootstrap Protocol Client |
| 69 TFTP | Trivial File Transfer | |
| 111 | SUNRPC | Sun Microsystems Rpc |
| 123 | NTP | Network time |
| 137 | NetBiosNameService | NT Server to Station Connections |
| 138 | NetBiosDatagramService | NT Server to Station Connections |
| 139 NetBios SessionService NT Server to Station Connections | ||
| 161 SNMP Simple Network Management | ||
| 162 SNMP Simple Network Management Traps | ||
| 513 Unix Rwho Daemon | ||
| 514 | Syslog | System Log |
| 525 | Timed | Time Daemon |
Table 6-6. UDP Ports
- Source Interface - The input IP interface that relays UDP packets. If this field is 255.255.255.255, UDP packets from all interfaces are relayed. The following address ranges are invalid:
◇ 0.0.0.0 to 0.255.255.255
◇ 127.0.0.0 to 127.255.255.255
♦ Destination Addr. – The IP interface that receives UDP frame relays. If this field is 0.0.0.0, UDP packets are discarded. If this field is 255.255.255.255, UDP packets are flooded to all IP interfaces.
An example of UDP Relay table use: To relay all UDP packets to interface 7.7.7.7 arriving at UDP port 138, while discarding those packets which come from the Source IP Addresses 1.1.1.1 and 2.2.2.2, type in these table entries:
| Port | Source | Destination |
| 138 | 1.1.1.1 | 0.0.0.0 |
| 138 | 2.2.2.2 | 0.0.0.0 |
| 138 | 255.255.255.255 | 7.7.7.7 |
To add a UDP Relay Table entry:
-
Display the UDP Relay Table.
-
Click . The UDP Relay Table Insert window opens:

Figure 6-126. UDP Relay Table - Insert window
-
Complete the fields.
-
Click √.
-
Close the UDP Relay Table Insert window. The UDP Relay Table opens.
-
Click √. When the Status field displays "Finished!", the fields are confirmed as modified.
To delete a UDP Relay Table entry:
- Display the UDP Relay Table.
- Select an entry in the table.
- Click . The entry is deleted.
- Click √. When the Status field displays "Finished!", the fields are confirmed as modified.
TCP General Parameters
The TCP General Parameters window displays information about how TCP is implemented on the device.
To display the TCP General Parameters:
♦ Select Router > IP > TCP General Parameters. The TCP Parameters window opens:
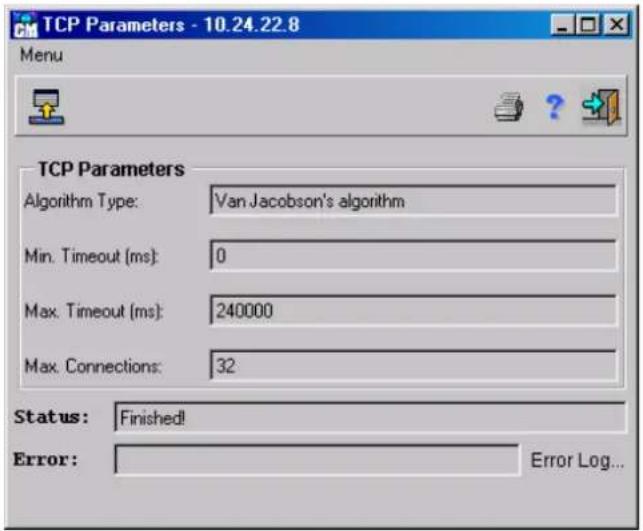
Figure 6-127. TCP Parameters window
The TCP Parameters window displays the following parameters:
♦ Algorithm Type – The Algorithm used to determine the timeout value used for re-transmitting unacknowledged octets.
Min. Timeout (ms) - The minimum value permitted by a TCP implementation for the retransmission timeout, measured in milliseconds.
- Max. Timeout (ms) – The maximum value permitted by a TCP implementation for the retransmission timeout, measured in milliseconds.
- Max. Connections – The limit on the total number of TCP connections the entity can support. In entities where the maximum number of connections is dynamic, this object contains the value -1.
TCP Connections Table
To display the TCP Connections Table:
♦ Select Router > IP > TCP Connection Table. The TCP Connections Table opens:

Figure 6-128. TCP Connections Table window
The TCP Connections Table window displays the following parameters:
- Local Address – Indicates the local IP address for this TCP connection. IF the connection in the Listen state, the value 0.0.0.0 is used. The device accepts connections for any IP interface associated with the node.
- Local Port – Indicates the local port number for this TCP connection.
◆ Remote Address – Indicates the remote IP address for this TCP connection.
◆ Remote Port – The remote port number for this TCP connection. - Connection State – Indicates the status of this TCP connection. The only value set by a management station is DeleteTCB (TCP Control Block). This is done by deleting the specific entry using the management system.
To delete a TCP Connection Table entry:
- Display the TCP Parameters window.
- Select an entry in the table.
- Click ▶. The entry is deleted.
- Click √. When the Status field displays "Finished!", the fields are confirmed as modified.
IPM
Multicast routing occurs when IP routers determine how to forward multicast IP packets, either from a specific multicast group to a source or from a nonspecific source to a multicast group.
The IPM menu option has the following menu options:
♦ Operating Parameters
IGMP
◆ Filter
◆ PIM
♦ IPM Routing
IPM Operating Parameters
The IPM Operating Parameters window enables IPM Routing on a device.
To display the IPM Operating Parameters window:
♦ Select Router > IPM > Operating Parameters. The IPM Operating parameters window opens:
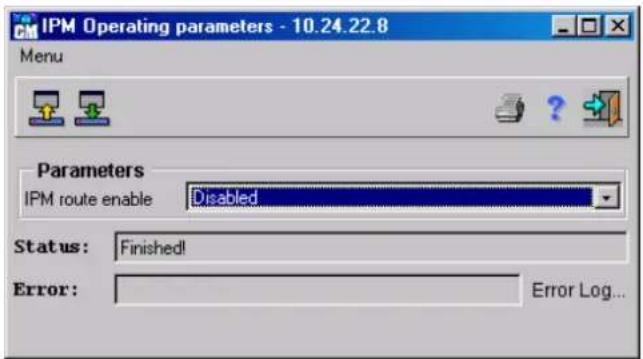
Figure 6-129. IPM Operating parameters window
The IPM Operating parameters window displays the following field:
♦ IPM routing enable – Enables IPM routing on a device. Disabled is the default.
To enable IPM routing on a device:
- Display the IPM Operating Parameters window.
-
Set the IPM Routing status to Enabled.
-
Click √ to update the device. When the Status field displays "Finished!", IPM Routing is enabled on the device.
IGMP
The Internet Group Management Protocol (IGMP) establishes host memberships within a multicast group. IGMP allows devices to notify routers that they can receive multicast packets addressed to specific multicast groups.
Note: Ports belonging to a VLAN without IGMP membership are not forwarded multicast traffic.
The IGMP menu has the following menus options:
◆ Parameters
◆ Interface Table
◆ Cache Table
IGMP Operating Parameters
The IGMP Operating Parameters window displays information regarding IGMP MIB software version.
To display the IGMP Operating Parameters window:
♦ Select Router > IPM > IGMP > Parameters. The IGMP Parameters window opens:

Figure 6-130. IGMP Parameters window
The IGMP Parameters window displays the following field:
♦ IGMP Mib Version – Indicates the MIB software version.
IGMP Interface Table
The IGMP Interface Table contains IGMP information for which IGMP is currently enabled.
To display the IGMP Interface Table:
♦ Select Router > IPM > IGMP > Interface Table. The IGMP Interface Table opens:
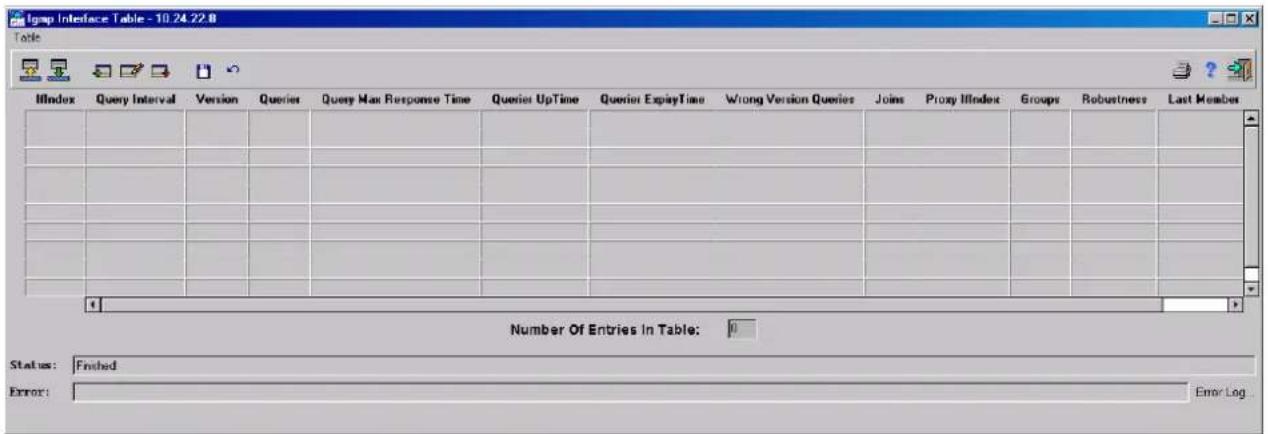
Figure 6-131. IGMP Interface Table window
The IGMP Interface Table displays the following fields:
- IfIndex – Identifies the port number for which IGMP is enabled.
◆ Query Interval – Indicates the amount of time in seconds that querier messages are transmitted. Network managers can adjust the amount of IGMP messages sent on sub-networks by adjusting the value of the Query Interval. The larger value, the less often IGMP messages are sent. The default value is 125 seconds.
♦ Version – Indicates the current software version of IGMP. The default software version is 2.
Note: All routers on a LAN must be configured to the same IGMP software version.
♦ Querier – Indicates the IGMP Querier on the IP subnet. The multicast router with the lowest IP address is the multicast querier.
◆ Query Max Response Time – Indicates the maximum response time for advertising IGMP queries. Query Max Response time adjusts the amount of traffic on a per sub-network basis. Varying the response time effects the burstiness of network traffic. The higher the value the longer period of time passes between host responses. The default value is 10 seconds.
Note: The Query Max Response Time must be less than the Query Interval.
♦ Querier UpTime – Indicates the amount of time in ticks since the querier was last changed.
♦ Querier Expiry Time – Indicates the amount of time in ticks before the Querier Present timer expires. If the local system is the Querier the value is 0.
- Wrong Version Queries – Indicates the amount of queries received with the IGMP software version that do not match the IGMP interface's software version. If queries are received with a different software version the Wrong Software version Queries indicates a configuration error.
- Joins – Indicates the number of times a group membership has been added to the IGMP Cache Table.
- Proxy ifIndex – Indicates that IGMP is performed by proxy. IGMP Host Membership reports are sent to the device. A value of 0 indicates that IGMP proxying is not being performed. The default is 0.
◆ Groups – The current number of entries for this port in the IGMP Cache Table.
♦ Robustness – Tunes packet loss on a subnet. The robustness is increased to avoid packet loss on a subnet. Possible values are 1-255. The default value is 0.
- Last Member Query Interval – Modifies the leave latency of the network. A reduced value reduces the amount of time needed to detect the loss of the last group member. The possible values are 0-255. The default value is 10.
To add an IGMP Interface entry:
-
Display the IGMP Interface Table.
-
Click . The IGMP Interface Table - Insert window opens:
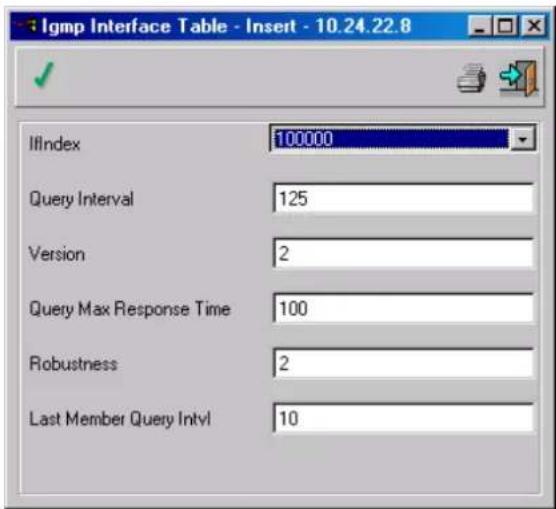
Figure 6-132. IGMP Interface Table - Insert window
-
Complete the fields. The fields are the same as the IGMP Interface Table as described above.
-
Click √. The IGMP Interface Table - Insert window closes.
-
Click √ to update the device. When the Status field displays "Finished!" the IGMP information is saved to the device.
Note: An IGMP Interface entry can be added for an IP Address only.
To edit an IGMP Interface entry:
- Display the IGMP Interface Table.
- Select an entry in the IGMP Interface Table and click 📋. The IGMP Interface Table - Edit window opens.
or
Double-click a row in the IGMP Interface Table. The IGMP Interface Table-Edit window opens:

Figure 6-133. IGMP Interface Table - Edit window
- Edit the fields. The fields are the same as the IGMP Interface Table as described above.
- Click √. The IGMP Interface Table - Edit window closes.
- Click √. When the Status field displays "Finished!", the IGMP information is saved to the device.
To delete an entry in the IGMP Interface Table:
- Display the IGMP Interface Table.
- Select an entry in the table.
- Click . The entry is deleted from the IGMP Interface Table.
- Click √ to update the device. When the Status field displays "Finished!", the entry is deleted from the device.
IGMP Cache Table
The IGMP Cache Table contains information regarding each IP Multicast group whose members are part of an interface on a physical port.
To display the Cache Table:
♦ Select Router > IPM > IGMP > Cache Table. The IGMP Cache Table opens:

Figure 6-134. IGMP Cache Table window
The IGMP Cache Table displays the following fields:
◆ Cache Address – Specifies the IP Multicast Group address to which the port is a member.
- IfIndex – Indicates the VLAN or port number.
◆ Cache Self – Indicates if the local system is a member of an IP Multicast Group address. If the entry is learned from a VLAN, the field specifies a physical port. If not the field entry is 0.
- Last Reporter – Identifies the last member to join the IP Multicast group. If no member has entered the IP Multicast group the value is 0.0.0.0.
♦ UpTime – Indicates in ticks the amount of time that has passed since the entry was created.
♦ ExpiryTime – Indicates the amount of time in ticks before the entry is aged out.
- Status – Indicates the status of the entry. The possible values are:
◇ Active
◇ Destructed
◆ Version1 HostTimer – Indicates the amount of time before the router assumes that there are no longer IGMP members on a subnet. If no IGMP group members are reported the Software version1 Host timer is reset.
Filter
The Filter menu has the following menus options:
♦ IGMP Filter Enable
♦ IGMP Filter Table
IGMP Filter Enable
The IGMP Filter Enable window allows you to enable or disable the IGMP filter.
To display the IGMP Filter Enable window:
♦ Select Router > IPM > Filter > IGMP Filter Enable. The IGMP Filter Enable opens:
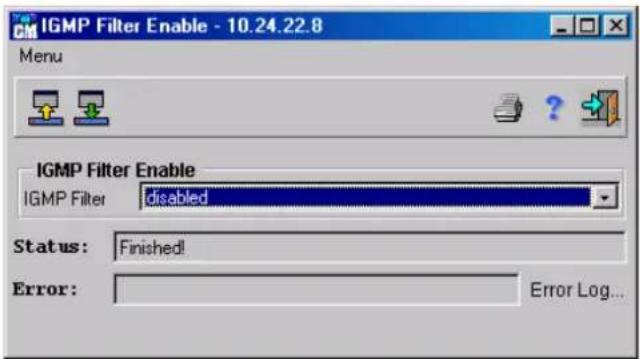
Figure 6-135. IGMP Filter Enable window
The IGMP Filter Enable window displays the following field:
♦ IGMP Filter – Enables IGMP filtering on a device. Disabled is the default.
To enable IGMP filtering on a device:
- Display the IGMP Filter Enable window.
- Set the IGMP filtering status to Enabled.
- Click √ to update the device. When the Status field displays "Finished!", IGMP filtering is enabled on the device.
IGMP Filter Table
The IGMP Filter Table contains IGMP filter information for which IGMP is currently enabled.
To display the IGMP Filter Table:
♦ Select Router > IPM > Filter > IGMP Filter Table. The IGMP Filter Table opens:
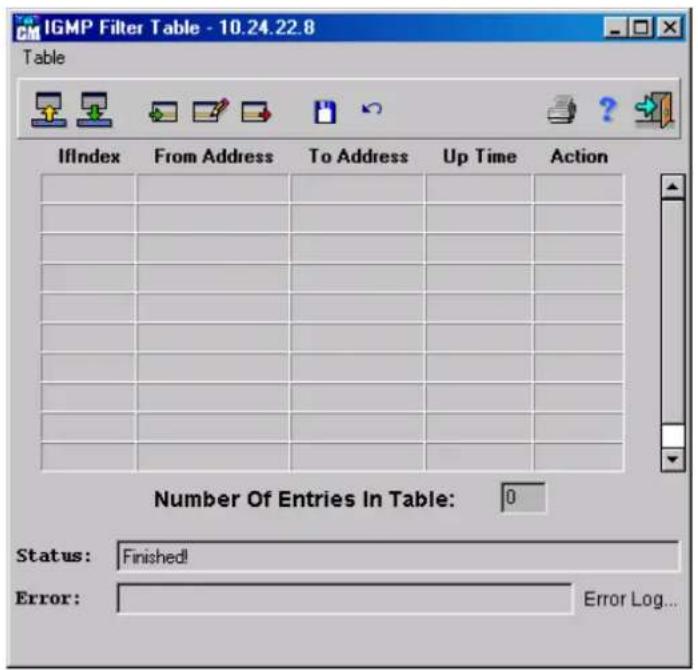
Figure 6-136. IGMP Filter Table window
The IGMP Filter Table displays the following fields:
- IfIndex – Identifies the port number for which the IGMP filter is enabled.
- From Address – Indicates the IP address being filtered from.
- To Address – Indicates the IP address being filtered to.
♦ Up Time – Indicates in ticks the amount of time that has passed since the entry was created.
Action - This parameter is used to fine-tune the IGMP filter.
Permit - Whether the indicated packets should be forwarded.
◇ Deny – Whether the indicated packets should be blocked.
To add an IGMP Filter entry:
-
Display the IGMP Filter Table.
-
Click . The IGMP Filter Entry - Insert window opens:

Figure 6-137. IGMP Filter Entry - Insert window
-
Complete the fields. The fields are the same as the IGMP Filter Table as described above.
-
Click √. The IGMP Filter Entry - Insert window closes.
-
Click √ to update the device. When the Status field displays "Finished!" the IGMP information is saved to the device.
To edit an IGMP Filter entry:
- Display the IGMP Filter Table.
- Select an entry in the IGMP Filter Table and click 📋. The IGMP Filter Entry - Edit window opens.
or
Double-click a row in the IGMP Filter Table. The IGMP Filter Entry - Edit window opens:
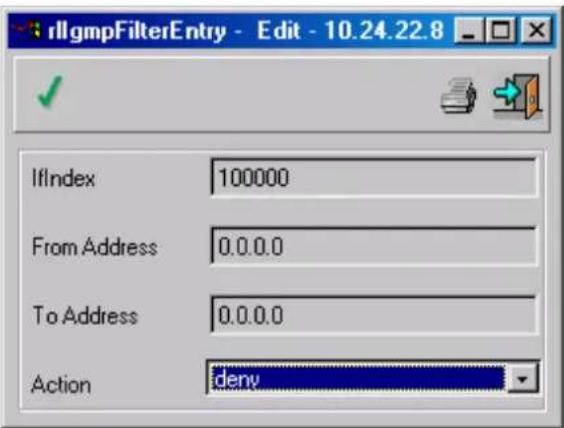
Figure 6-138. IGMP Filter Entry - Edit window
- Edit the fields. The fields are the same as the IGMP Filter Table as described above.
- Click √. The IGMP Filter Entry - Edit window closes.
- Click √. When the Status field displays "Finished!", the IGMP filter information is saved to the device.
To delete an entry in the IGMP Filter Table:
- Display the IGMP Filter Table.
- Select an entry in the table.
- Click . The entry is deleted from the IGMP Filter Table.
- Click √ to update the device. When the Status field displays "Finished!", the entry is deleted from the device.
PIM
Multicast routers use Protocol Independent Multicast (PIM) to determine which other multicast routers should receive multicast packets. Protocol Independent Multicast-Dense Mode (PIM-DM) is used when there is a large population of receivers in a network. PIM-DM builds routing and forwarding tables on-the-fly. PIM-DM uses unicast routing information to provide routing table information and adapt to topological changes
The PIM menu has the following menus options:
◆ Parameters
◆ Interface Table
♦ Neighbor Table
Route Table
◆ Route Next Hop
Parameters
The PIM Parameters window provides information regarding the PIM MIB software version currently being used for multicast routing.
To display the PIM Parameters window:
♦ Select Router > IPM > PIM > Parameters, the PIM Parameters window opens:
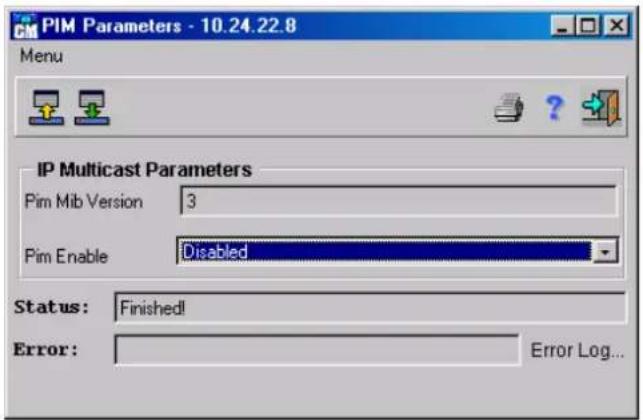
Figure 6-139. PIM Parameters window
The PIM Parameters window displays the following fields:
♦ PIM MIB Version – Identifies the PIM MIB software version currently being used for multicast routing.
♦ PIM Enable – Indicates whether PIM is enabled or disabled.
PIM Interface Table
The PIM Interface Table contains an entry for each of the router's PIM ports. The PIM Interface Table lists the IPM multicast group members on specific ports.
To display the PIM Interface Table:
♦ Select Router > IPM > PIM > Interface Table, the PIM Interface Table window opens:

Figure 6-140. PIM Interface Table window
The PIM Interface Table displays the following fields:
- IfIndex – Specifies the PIM port number.
◆ Interface Address – Indicates the IP address of the PIM port.
◆ Interface Mask – Masks all or part of the IP address of PIM ports.
♦ Designated Router – Identifies the designated router on each multi-access router. The designator router polls the LAN to determine group membership. The router with the highest IP address is the designated router. If the designated router times out, a new designated router is elected from the alternate PIM routers. Designated routers are only needed for multi-access networks and not point-to-point links. Point-to-point links show a value of 0.0.0.0.
- Hello Interval – Indicates in seconds the amount of time ports send hello messages. PIM-DM routers keep track of neighboring interfaces based on received hello messages. Neighbor information is deleted if there it is not refreshed before expiration. The default time is 30 seconds.
♦ JoinPrune Intervals – Indicates the intervals at which Join/Prune messages are sent to the PIM router. The PIM router assumes that all downstream routers can receive multicast packets, flooding the network with multicast packets. If specific network areas do not have multicast group members, PIM-DM prunes off the forwarding branch by establishing a Prune state. The Prune state contains the source and multicast group address, and contains a timer. When the timer expires the network branch goes into a forwarding state. The default is 210 seconds.
To add an PIM Interface Table entry:
-
Display the PIM Interface Table.
-
Click PIM Interface Table - Insert window opens:

Figure 6-141. PIM Interface Table – Insert window
-
Complete the fields. The fields are the same as the PIM Interface Table as described above.
-
Click √. The PIM Interface Table - Insert window closes.
-
Click √ to update the device. When the Status field displays "Finished!" the IGMP information is saved to the device.
To edit an PIM Interface Table entry:
Display the PIM Interface Table.
- Select an entry in the PIM Interface Table and click

- The PIM Interface Table - Edit window opens.
or
Double-click a row in the PIM Interface Table. The PIM Interface Table - Edit window opens:
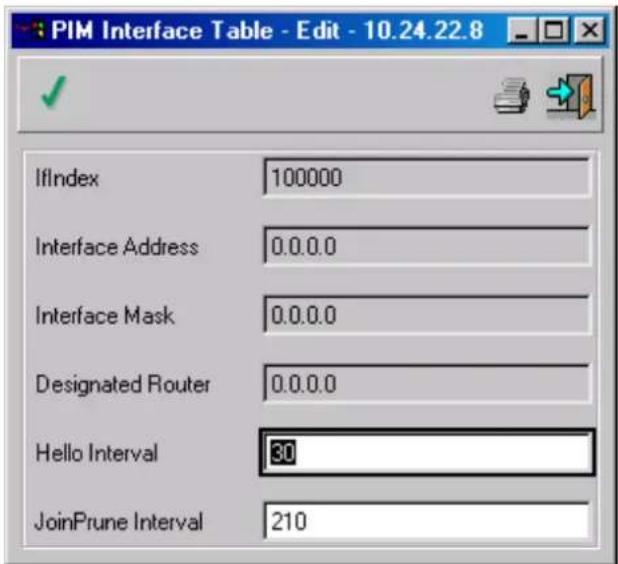
Figure 6-142. PIM Interface Table - Edit window
- Edit the fields. The fields are the same as the PIM Interface Table as described above.
- Click √. The PIM Interface Table - Edit window closes.
- Click √. When the Status field displays "Finished!", the PIM information is saved to the device.
To delete an entry in the PIM Interface Table:
- Display the PIM Interface Table.
- Select an entry in the table.
- Click □. The entry is deleted from the PIM Interface Table.
- Click √ to update the device. When the Status field displays "Finished!", the entry is deleted from the device.
PIM Neighbor Table
The PIM Neighbor Table contains information regarding each of a router's PIM neighbors.
To display the PIM Neighbor Table:
♦ Select Router > IPM > PIM > Neighbor Table, the PIM Neighbor Table window opens:
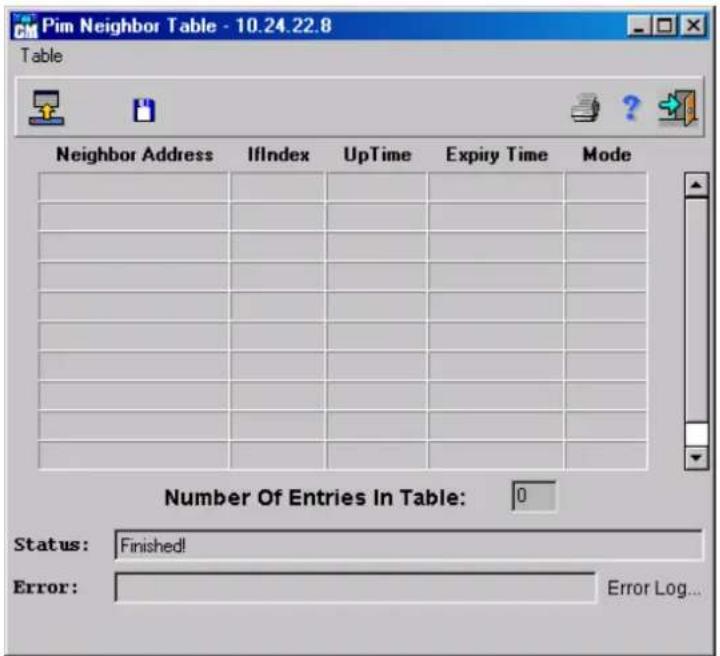
Figure 6-143. PIM Neighbor Table window
The PIM Neighbor Table displays the following fields:
♦ Neighbor Address – Specifies the IP address of the PIM neighbor.
- IfIndex – Indicates the Port Number.
♦ UpTime – Indicates the time lapse since the PIM neighbor became the neighbor to the local router.
♦ Expiry Time – Indicates time in ticks before the PIM neighbor is aged out.
◆ Mode – Indicates the active PIM mode of the neighbor device. The possible value for this release is:
◇ PIM-DM – The neighbor is currently operating in PIM-DM mode.
PIM Route Table
Multicast routing information is gathered and stored by PIM in the PIM Route Table. The PIM Route Table contains one row for each port in a PIM mode. Each routing entry contains information about the source and multicast group, and incoming and outgoing interfaces.
To display PIM Route Table:
♦ Select Router > IPM > PIM > Route Table, the PIM Route Table opens:

Figure 6-144. PIM IPM Route Table window
The PIM IPM Route Table displays the following fields:
◆ Group - Specifies the IP address of the multicast group. The range is 244.0.0.0-239.255.255.255.
- Source – Specifies the source IP address from where the multicast packets are being sent.
- Source Mask – Mask all or part of the source IP address.
- Upstream Assert Timer – Indicates the time before the router reverts from its upstream router to its RPF neighbor. When a multicast packet is received, the router sends an assert packet on a subnet indicating what metrics were used to reach the packet's source address. The router with the best metrics becomes the forwarding router. All other upstream routes are pruned. The downstream routers also compare if the RPF with the forwarding router. This ensures that the downstream routers send their prunes and grafts to the correct neighbor. The forwarding router sends an assert message to notify the other routers that it is the forwarding router. Downstream routers select the upstream router with the smallest metrics as their RPF neighbor. If two routers have the same metrics, the router with the highest IP address is chosen. When the assert timer expires, the downstream may switch from the forwarding router to a RPF neighbor. A value of 0 indicates that the assert has not changed the upstream neighbor to a RPF neighbor.
- AssertMetric - Specifies the metrics advertised by the forwarding router. A value of 0 indicates that no assert was received.
- Assert MetricPref - Indicates the preference advertised by the forwarding router on the upstream interface. Asset MetricPref is used when upstream routers are running different Unicast protocols. A value of 0 indicates that no assert is in effect.
- Assert RPT Bit – Indicates the value of the RPT bit advertised by the forwarding router
- Flags – Specifies the PIM-specific flags pertaining to the multicast state entry.
PIM IPM Route Next Hop
The PIM IPM Route Next Hop window contains the next-hops information of IP multicast packets. The PIM IPM Route Next Hop contains an entry for each outgoing interface listed in the multicast routing table running PIM, and whose state is pruned.
To display the PIM IPM Route Next Hop table:
♦ Select Router > IPM > PIM > Route Next Hop, the PIM IPM Route Next Hop window opens:

Figure 6-145. PIM IPM Route Next Hop window
The PIM IPM Route Next Hop window displays the following fields:
◆ Group – Specifies the IP address of the next-hop multicast group.
- Source – Specifies the source IP address of the multicast packet.
- Source Mask – Masks all or part of the source IP address.
- IfIndex – Identifies the outgoing port.
♦ Next Hop Address – The IP address of the next-hop.
♦ Prune Reason – Indicates the reason the downstream interface was pruned. The possible values are:
Prune - Indicates that the downstream interface was pruned in response to a prune message.
◇ Assert - Indicates that the downstream interface was pruned due to PIM assert processing.
IPM Routing
The IPM Routing menu has the following menus options:
◆ Route Table
◆ Route Next Hop Table
IPM Routing Table
The IPM Routing Table contain multicast routing information of IP packets sent from a specific source to IP multicast groups known to the IPM router.
To display the IPM Routing Table:
♦ Select Router > IPM > IPM Routing > Route Table. The IPM Route Table opens:

Figure 6-146. IPM Route Table window
The IPM Route Table displays the following fields:
◆ Group – Identifies the IP address of the multicast group.
- Source – Identifies the source IP address of the device to which the multicast information applies.
- Source Mask – Masks all or parts of the source IP address.
♦ Upstream Neighbor - Specifies the IP address of the next upstream device from which packets to the IP address are received. The value 0.0.0.0 indicates that the value is unknown.
In IfIndex - Indicates the port number to which multicast packets being sent are received. The value 0 indicates that incoming packets can be received on multiple interfaces.
♦ Up Time – Indicates the time lapse since the router learned the multicast information.
♦ Expiry Time – Indicates the time in ticks before the entry expires. A value of 0 indicates that the entry has not expired.
♦ Protocol – Identifies the type of protocol used to learn the multicast information. The possible values are:
- Other – Indicates that none of the below listed protocols are used to learn multicast forwarding information.
Local – Indicates that a manually configured protocol was used to learn the multicast information.
Netmgmt - Indicates that the Network Management Protocol was used to learn the multicast information.
◇ DVMRP – Indicates that the Distance Vector Multicast Routing Protocol was used to learn the multicast information.
◇ MOSPF – Indicates that Multicast extended OSPF was used to learn the multicast information.
◇ PIMSparseDense – Indicates that Protocol Independent Multicast was used to learn the multicast information.
◇ CBT – Indicates that CBT was used to learn the multicast information.
◇ PIM-SM – Indicates that Protocol Independent Multicast-Sparce Mode was used to learned the multicast information.
◇ PIM-DM - Indicates that Protocol Independent Multicast-Dense Mode was used to learned the multicast information.
IGMP - Indicates that the Internet Group Multicast Protocol was used to learn the multicast information.
BGMP - Indicates that the Border Gateway Multicast Protocol was used to learn this entry's multicast information.
MSDP – Indicates that the Multicast Source Discovery Protocol was used to learn the multicast information.
- Routing Mechanism – Identifies the routing mechanism used to find the next upstream or parent interface which provided the multicast information. The possible values are:
- Other – Indicates that none of the below listed protocols are used to find the next upstream or parent interface of the multicast information.
◇ Local – Indicates that a manually configured protocol was used to find the next upstream or parent interface of the multicast information.
Netmgmt - Indicates that the Network Management Protocol was used to find the next upstream or parent interface of the multicast information. This route is static.
◇ ICMP – Indicates that the Internet Control Message Protocol was used to find the next upstream or parent interface for the multicast information.
◇ RIP – Indicates that the Routing Information Protocol was used to find the next upstream or parent interface of the multicast information. - OSPF – Indicates that the Open First Path First Protocol was used to find the next upstream or parent interface of the multicast information.
◇ BGP - Indicates that the Border Gateway Protocol was used to find the next upstream or parent interface of the multicast information. -
DVRMP – Indicates that the Internet Control Message Protocol was used to find the next upstream or parent interface of the multicast information.
-
Route Address – Identifies the IP address used to find the upstream or parent interface of the multicast information.
- Route Mask – Masks all or part of the IP addresses used to find the upstream or parent interface of the multicast information.
- Route Type – Indicates if the route was a unicast or multicast route. The possible values are:
◇ Unicast – Indicates that the route was placed in the multicast routing information base (RIB) either instead of or in addition to unicast RIB by a local configuration, for example when running PIM over RIP.
◇ Multicast – Indicates that the route was explicitly added to the multicast RIB by the routing protocol.
IPM Route Next Hop
The IPM Route Next Hop window contains information regarding the next-hop for forwarding multicast packets on outgoing interfaces. Each entry in the IPM Route Next Hop table refers to the next-hop of a specific source to a specific multicast group address.
To display the IPM Route Next Hop table:
♦ Select Router > IPM > IPM Routing > Route Next Hop Table. The IPM Route Next Hop table opens:

Figure 6-147. IPM Route Next Hop window
The IPM Route Next Hop window displays the following fields:
◆ Group – Identifies the IP multicast group from which the multicast packet is being forwarded.
- Source – Identifies the source IP address of the multicast packet being forwarded.
- Source Mask – Masks all or part of the source IP address.
- IfIndex – Identifies the port number of the next-hop.
♦ Next Hop Address – Indicates the IP addresses of the next-hop. This may be identical to the Group value. However, some ports may have multiple next-hop addresses from a single outgoing interface.
◆ State – Indicates if the port and next-hop are being used to forward multicast packets. The possible values are:
Pruned - The port and next hop are not being used to forward multicast packets
- Forwarding – The port and the next hop are currently being used to forward multicast packets.
♦ Up Time – Indicates the time lapse since the router learned the multicast information.
♦ Expiry Time – Indicates the time in ticks before the entry expires. A value of 0 indicates that the entry is not expired. However, if the Hop Status is Pruned, the value indicates the amount of time remaining before the port and next hop revert to Forwarding.
♦ Protocol – Identifies the routing protocol used to find the next hop. The possible values are:
- Other – Indicates that none of the below listed protocols are used to find the next upstream or parent interface for the next-hop.
◇ Local - Indicates that at manually configured protocol was used to find the next upstream or parent interface for the next-hop.
Netmgmt - Indicates that the Network Management Protocol was used to find the next upstream or parent interface for the next-hop. This route is static.
ICMP - Indicates that the Internet Control Message Protocol was used to find the next upstream or parent interface for the next-hop.
◇ RIP - Indicates that the Routing Information Protocol was used to find the next upstream or parent interface for the next-hop.
- OSPF - Indicates that the Open First Path First Protocol was used to find the next upstream or parent interface for the next-hop.
◇ BGP - Indicates that the Border Gateway Protocol was used to find the next upstream or parent interface for the next-hop.
- DVRMP – Indicates that the Internet Control Message Protocol was used to find the next upstream or parent interface for the next-hop.
IPX
The IPX menu has the following menu options:
◆ Interface Parameters
◆ RIP/SAP Filter
♦ Routing Table
♦ SAP Table
Interface Parameters
To display the IPX Router Interface Parameters window:
♦ Select Router > IPX > Interface Parameters. The IPX Router Interface Parameters window opens:

Figure 6-148. IPX Router Interface Parameters window
The IPX Router Interface Parameters window displays the following parameters:
♦ Circuit Number – IPX circuit number.
◆ Interface Number – The IF Index used by this circuit.
◆ Network Address – IPX network address of this circuit.
- Time To Network – Time to net value associated with this interface, in 1/18ths of a second.
♦ Layer II Protocol – Encapsulation method associated with this interface. If the Interface Number refers to a VLAN, this must be the same encapsulation as used by the VLAN.
- NetBios – NetBios type 20 broadcast packets are forwarded to this interface.
◆ Admin Status – Indicates whether this circuit entry is valid, or Sleeping (currently inactive).
To add an IPX Router Interface entry:
- Display the IPX Router Interface Parameters window.
- Click 📋. The IPX Router Interface Parameters Insert window opens:

Figure 6-149. IPX Router Interface Parameters Insert window
- Complete the fields.
- Click √.
- Close the IPX Router Interface Parameters Insert window. The IPX Router Interface Parameters window opens.
- Click √. When the Status field displays "Finished!", the fields are confirmed as modified.
To edit an IPX Router Interface entry:
- Display the IPX Router Interface Parameters window.
- Select an entry in the table.
- Click ☐. The IPX Router Interface Parameters Edit window opens:

Figure 6-150. IPX Router Interface Parameters Edit window
- Click the RIP Parameters button to modify IPX RIP parameters. The IPX RIP Parameters window opens:

Figure 6-151. IPX RIP Parameters window
The IPX RIP Parameters window displays the following parameters:
◆ Update Interval – RIP periodic update interval, in seconds. Set to 0 to disable periodic messages. When set to 0, all entries learned on this interface are not aged out.
- Age Multiplier – Holding multiplier for information received in RIP periodic updates. This value multiplied by the update interval defines how many seconds RIP information remeins without being refreshed. Set to 0 to prevent the entries learned on this interface from being aged out.
- Status – Whether the RIP interface is active. OFF is inactive but not deleted.
Note: The Update Interval multiplied by the Age Multiplier must be less than 2 million.
-
Complete the IPX RIP Parameters window fields if required.
-
Click √. Close the IPX RIP Parameters window. The IPX Router Interface Parameters Edit window opens.
-
Click the SAP Parameters button to modify IPX SAP parameters. The IPX SAP Parameters window opens:
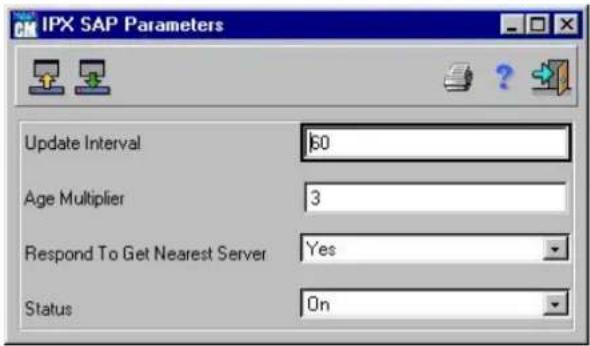
Figure 6-152. IPX SAP Parameters window
The IPX SAP Parameters window displays the following parameters:
◆ Update Interval – SAP periodic update interval, in seconds. Set to 0 to disable periodic messages. When set to 0, all entries learned on this interface are not aged out.
♦ Age Multiplier – Holding multiplier for information received in SAP periodic updates. This value multiplied by the update interval defines how many seconds SAP information remains without being refreshed. Set to 0 to prevent the entries learned on this interface from being aged out.
- Respond to Get Nearest Server – Defines whether the device responds to SAP “get nearest server” requests received on this circuit.
- Status – Defines whether the SAP interface is active. OFF is inactive but not deleted.
Note: The Update Interval multiplied by the Age Multiplier must be less than 2 million.
- Complete the IPX SAP Parameters window fields if required.
- Click. Close the IPX SAP Parameters window. The IPX Router Interface Parameters Edit window is displayed.
-
Edit the fields.
-
Click √.
-
Close the IPX Router Interface Parameters Edit window. The IPX Router Interface Parameters window opens.
- Click √. When the Status field displays "Finished!", the fields are confirmed as modified.
To delete an IPX Router Interface entry:
- Display the IPX Router Interface Parameters window.
- Select an entry in the table.
- Click ▶. The entry is deleted.
- Click √. When the Status field displays "Finished!", the fields are confirmed as modified.
RIP/SAP Filter
The IPX RIP / SAP Filter table is used to display both global and circuit (IPX interface-specific) filters, for both RIP and SAP. Circuit filters take precedence over global filters. To display the IPX RIP / SAP Filter table:
♦ Select Router > IPX > RIP / SAP Filter. The IPX RIP / SAP Filter window opens:

Figure 6-153. IPX RIP/SAP Filter window
The IPX RIP/SAP Filter window contains the following buttons that allow you to define additional parameters:
♦ RIP Global Filter – Defines the type of traffic that the filter applies to, the network addresses the filter affects, network masks, and taken on a packet.
♦ RIP Circuit Filter – Defines the type of traffic that the filter applies to, the network addresses the filter affects, network masks, and taken on a packet.
♦ SAP Global Filter – Defines the type of traffic that the filter applies to, the network addresses the filter affects, network masks, the service type, and action taken on a packet.
♦ SAP Circuit Filter – Defines the type of traffic that the filter applies to, the network addresses the filter affects, network masks, the service type, and action taken on a packet.
Press the RIP Global Filter button and complete the RIP Global Filter table fields.
Press the RIP Circuit Filter button and complete the RIP Global Circuit Fields window fields.
Press the SAP Global Filter button and complete the SAP Global Filter table fields.
Press the SAP Circuit Filter button and complete the SAP Global Circuit Fields window fields.
To display the RIP Global Filter Table:
- Display the IPX RIP/SAP Filter window.
- Press the RIP Global Filter button. The RIP Global Filter Table opens:

Figure 6-154. RIP Global Filter Table window
The RIP Global Filter Table displays the following parameters:
- Type - Defines whether the current filter entry works on traffic coming into or out of the device.
◆ Network Address – Type in the network pattern the filter entry is to affect. The network pattern works in conjunction with the network mask to define the filter entry.
◆ Network Mask - Type in the letters F, 8, C, E, and 0 as many times as desired to indicate which network pattern part is important. The mask must be continuous 00000000 means all addresses, fffffff means one address (no address range). A combination of fs and Os indicates a specific range. This combination must have f on the left side, 0 on the right side, and a single F, 8, C, or E, or 0 between them.
For example, if the network pattern is set to 12345678, the network mask can be set to ffff0000. This indicates that only the first four network pattern numbers are checked, and the remaining numbers are irrelevant. In this example, only RIP messages with the numbers 1234 as their first four digits are affected.
Action - Defines whether the indicated packets are forwarded (permit) or blocked (denied) when the current filter entry conditions are met. The parameter is used to fine-tune other filter entries.
For example, set a filter entry to block all RIP messages with a network pattern starting with 123, and set another filter entry to permit all RIP messages with a network pattern starting with 1234. As a result, all RIP messages with a network pattern starting with 123 that do not have 4 as the fourth digit are blocked.
The default is forward, but the default can be set by creating a general filter entry with the network mask 00000000, and setting it to permit or deny.
To add a RIP Global filter:
-
Display the RIP Global Filter Table.
-
Click √. The RIP Global Filter Insert window opens:

Figure 6-155. RIP Global Filter Insert window
- Complete the fields.
- Click √.
- Close the RIP Global Filter Insert window. The RIP Global Filter Table opens.
- Click √. When the Status field displays "Finished!", the fields are confirmed as modified.
To edit a RIP Global filter:
- Display the RIP Global Filter Table.
- Select an entry in the table.
- Click . The RIP Global Filter Edit window opens:
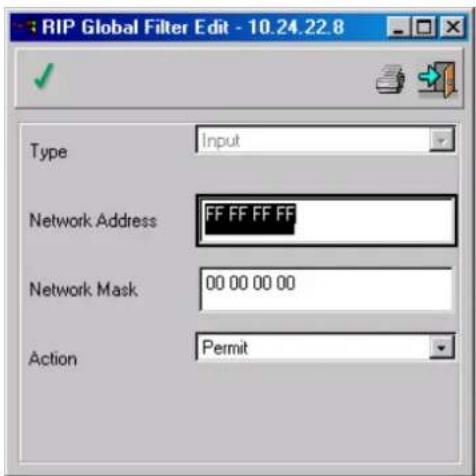
Figure 6-156. RIP Global Filter Edit window
- Complete the fields.
- Click √.
- Close the RIP Global Filter Edit window. The RIP Global Filter Table opens.
- Click √. When the Status field displays "Finished!", the fields are confirmed as modified.
To delete a RIP Global filter:
-
Display the RIP Global Filter Table.
-
Select an entry in the table.
-
Click . The entry is deleted.
-
Click √. When the Status field displays "Finished!", the fields are confirmed as modified.
To display the RIP Circuit Filter Table:
-
Display the IPX RIP/SAP Filter window.
-
Press the RIP Circuit Filter button. The RIP Circuit Filter Table opens:
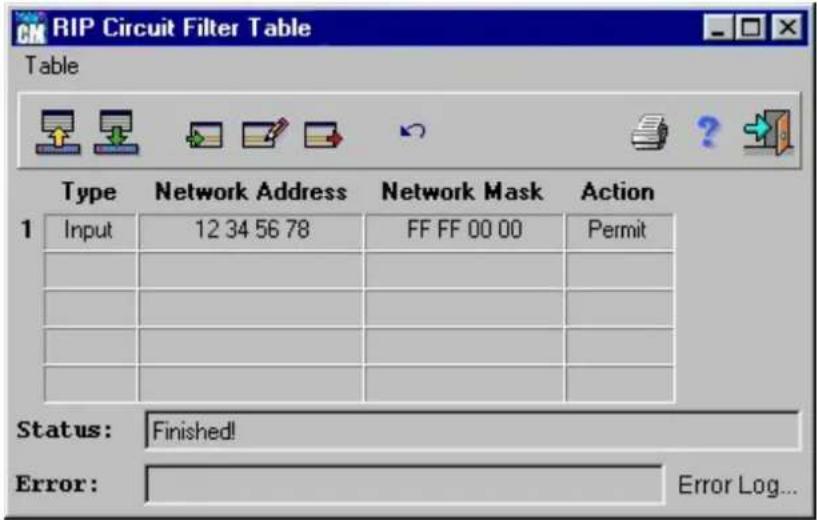
Figure 6-157. RIP Circuit Filter Table window
The RIP Circuit Filter Table displays the following parameters:
- Type – Defines whether the current filter entry works on traffic coming into or out of the device.
◆ Network Address – The network pattern to affect the filter entry. The network pattern works in conjunction with the network mask to define the filter entry.
◆ Network Mask – Type in the letters F, 8, C, E, and 0 as many times as desired to indicate which part of the network pattern is important. The mask must be continuous from left to right. 00000000 means all addresses, fffffff means one address (no address range). A combination of f 0 indicates a specific range. This combination must have f on the left side, 0 on the right side, and a single F, 8, C, or E, or 0 between them.
For example, if the network pattern is set to 12345678, set the network mask to ffff0000 to indicate that only the first four numbers of the network pattern are checked, and the remaining numbers are irrelevant. In this example, only RIP messages with the numbers 1234 as their first four digits are affected.
Action - Defines whether the indicated packets are forwarded (permit) or blocked (denied) when the current filter entry conditions are met. This parameter can be used to fine-tune other filter entries. For example, a filter entry can be set to block all RIP messages with a network pattern starting with 123, and set another filter entry to permit all RIP messages with a network pattern starting with 1234. As a result, all RIP messages with a network pattern starting with 123 that do not have 4 as the fourth digit are blocked.
To add a RIP Circuit filter:
-
Display the RIP Circuit Filter Table.
-
Click . The RIP Circuit Filter Insert window opens:
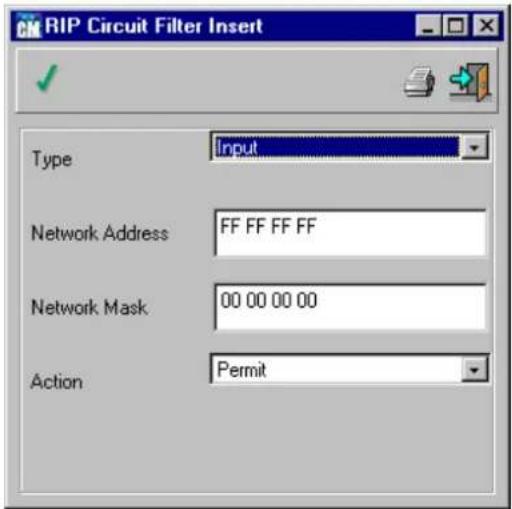
Figure 6-158. RIP Circuit Filter Insert window
- Complete the fields.
- Click √.
- Close the RIP Circuit Filter Insert window. The RIP Circuit Filter Table opens.
- Click √. When the Status field displays "Finished!", the fields are confirmed as modified.
To edit a RIP Circuit filter:
- Display the RIP Circuit Filter Table.
- Select an entry in the table.
- Click . The RIP Circuit Filter Edit window opens:

Figure 6-159. RIP Circuit Filter Edit window
-
Complete the fields.
-
Click . √
-
Close the RIP Circuit Filter Edit window. The RIP Circuit Filter Table opens.
-
Click √. When the Status field displays "Finished!", the fields are confirmed as modified.
To delete a RIP Circuit filter:
-
Display the RIP Circuit Filter Table.
-
Select an entry in the table.
-
Click . The filter is deleted.
-
Click √. When the Status field displays "Finished!", the fields are confirmed as modified.
To display the SAP Global Filters:
-
Display the IPX RIP/SAP Filter window.
-
Press the SAP Global Filter button. The SAP Global Filter Table opens:
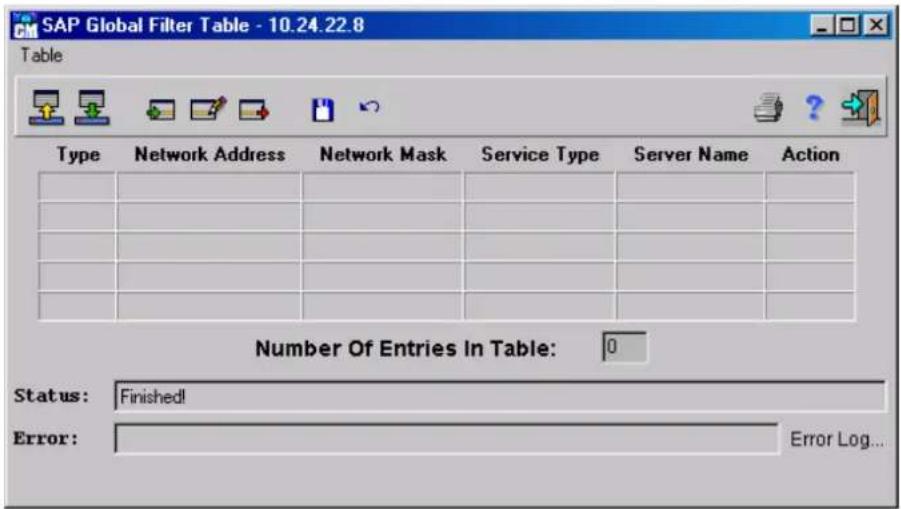
Figure 6-160. SAP Global Filter Table window
The SAP Global Filter Table displays the following parameters:
- Type - Defines whether the current filter entry works on traffic coming into or out of the device.
◆ Network Address – Type in the network pattern to affect the filter entry. The network pattern works in conjunction with the network mask to define the filter entry.
◆ Network Mask – Type in the letters F, 8, C, E, and 0 as many times as desired to indicate which part of the network pattern is important. The mask must be continuous from left to right. 00000000 means all addresses, fffffff means one address (no address range). A combination of f 0 indicates a specific range. This combination must have f on the left side, 0 on the right side, and a single F, 8, C, or E, or 0 between them.
For example, if the network pattern is set to 12345678, the network mask can be set to ffff0000 to indicate that only the first four numbers of the network pattern are only checked, and the remaining numbers are irrelevant. In this example, only SAP messages with the numbers 1234 as their first four digits are affected.
◆ Service Type – Type in the type of server (in hex) the filter entry affects, such as file server or print server. Value 0xFFFF applies for all types of service and is the default.
◆ Service Name – Type in the server name the filter entry affects. An asterisk (*) at the end of the name as a wildcard designates any number of characters.
For example, * indicates any server name, and sh* indicates any server name starting with sh. The name may be up to 47 characters.
Action - Defines whether the indicated packets are to be forwarded (permit) or blocked (denied) when the current filter entry conditions are met. This parameter is used to fine-tune other filter entries.
For example, a filter entry can be set to block all SAP messages with a network pattern starting with 123, and set another filter entry to permit all SAP messages with a network pattern starting with 1234. all SAP messages with a network pattern starting with 123 that do not have 4 as the fourth digit are blocked.
The default is forward, but the default can be set by creating a general filter entry with the network mask 00000000, and setting it to permit or deny.
To add a SAP Global filter:
-
Display the SAP Global Filter Table.
-
Click . The SAP Global Filter Insert window opens:
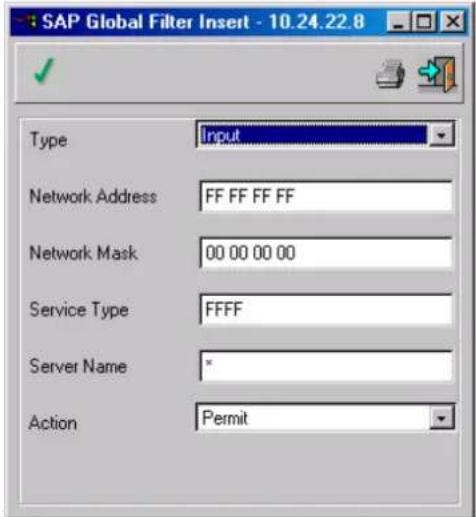
Figure 6-161. SAP Global Filter Insert window
-
Complete the fields.
-
Click √
-
Close the SAP Global Filter Insert window. The SAP Global Filter Table opens.
-
Click √. When the Status field displays "Finished!", the fields are confirmed as modified.
To edit a SAP Global filter:
-
Display the SAP Global Filter Table.
-
Select an entry in the table.
-
Click . The SAP Global Filter Edit window opens:

Figure 6-162. SAP Global Filter Edit window
- Edit the fields.
- Click √
- Close the SAP Global Filter Edit window. The SAP Global Filter Table opens.
- Click √. When the Status field displays "Finished!", the fields are confirmed as modified.
To delete a SAP Global filter:
- Display the SAP Global Filter Table.
- Select an entry in the table.
- Click . The filter is deleted.
- Click √. When the Status field displays "Finished!", the fields are confirmed as modified.
To display the SAP Circuit Filters:
- Display the IPX RIP/SAP Filter window.
- Press the SAP Circuit Filter button. The SAP Circuit Filter Table opens:

Figure 6-163. SAP Circuit Filter Table window
The SAP Circuit Filter Table displays the following parameters:
- Type – Defines whether the current filter entry works on traffic coming into or out of the device.
- Network Address – The network pattern the filter entry affects. The network pattern works in conjunction with the network mask to define the filter entry.
♦ Network Mask – Type in the letters F, 8, C, E, and 0 as many times as desired to indicate which part of the network pattern is important. The mask must be continuous from left to right. 00000000 means all addresses, fffffff means one address (no address range). A combination of f 0 indicates a specific range. This combination must have f on the left side, 0 on the right side, and a single F, 8, C, or E, or 0 between them.
For example, if the network pattern is set to 12345678, set the network mask to ffff0000 to indicate that only the first four numbers of the network pattern are checked, and the remaining numbers are irrelevant. In this example, only RIP messages with the numbers 1234 as their first four digits are affected.
◆ Service Type – Type in the type of server (in hex) the filter entry affects, such as file server or print server. Value 0xFFFF applies for all types of service and is the default.
◆ Service Name – Type in the server name the filter entry affects. An asterisk (*) at the end of the name as a wildcard, designating any number of characters.
For example, * indicates any server name, and sh* indicates any server name starting with sh. The name may be up to 47 characters.
Action – Defines whether the indicated packets are to be forwarded (permit) or blocked (denied) when the current filter entry conditions are met. This parameter can be used to fine-tune other filter entries. For example, a filter entry can be set to block all SAP messages with a network pattern starting with 123, and set another filter entry to permit all SAP messages with a network pattern starting with 1234. As a result, all SAP messages with a network pattern starting with 123 that do not have 4 as the fourth digit are blocked.
The default is forward, but the default can be set by creating a general filter entry with the network mask 00000000, and setting it to permit or deny.
To add a SAP Circuit filter:
-
Display the SAP Circuit Filter Table.
-
Click . The SAP Circuit Filter Insert window opens:
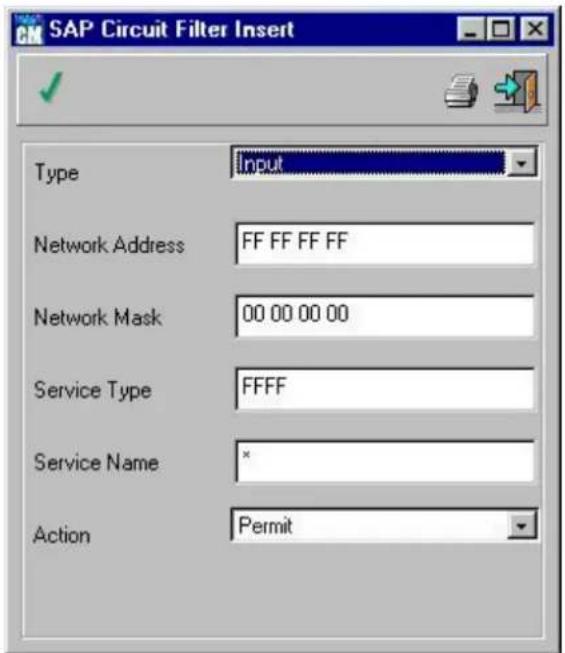
Figure 6-164. SAP Circuit Filter Insert window
- Complete the fields. For the field Service Name - Select either ASCII or Hex
- Click √.
- Close the SAP Circuit Filter Insert window. The SAP Circuit Filter Table opens.
- Click √. When the Status field displays Finished!, the fields are confirmed as modified.
To edit a SAP Circuit filter:
- Display the SAP Circuit Filter Table.
- Select an entry in the table.
- Click . The SAP Global Filter Edit window opens:

Figure 6-165. SAP Circuit Filter Edit window
- Edit the fields.
- Click √.
- Close the SAP Global Filter Edit window. The SAP Global Filter Table opens.
- Click √. When the Status field displays "Finished!", the fields are confirmed as modified.
To delete a SAP Circuit filter:
- Display the SAP Circuit Filter Table.
- Select an entry in the table.
- Click . The filter is deleted.
- Click √. When the Status field displays "Finished!", the fields are confirmed as modified.
IPX Routing Table
The IPX Routing Table contains the best route for each destination network that can be reached by the selected IPX router.
To display the IPX Routing Table:
♦ Select Router > IPX > Routing Table. The IPX Routing Table opens:

Figure 6-166. IPX Routing Table window
The IPX Routing Table displays the following parameters:
♦ Destination Network – Destination IPX network numbers in ascending order.
♦ Circuit – The circuit number used to reach the next-hop.
♦ Dest Protocol – The routing protocol from which knowledge of this destination was obtained:
◇ Static - User-defined entry (SNMP).
◇ Local – The entry derived from an IPX interface definition.
◇ RIP – The entry learned from the RIP protocol.
- Ticks to Net – Time estimate required for the propagation of a packet sent along the route described by this table entry to the destination network. This estimate is given in ticks (there are 18.21 ticks in a second), and does not include delays introduced by buffers used for temporary storage of packets in routers.
♦ Hops to Net – Describes this table entry number of hops on the route to the destination network. Entries with more than 15 hops are removed from the table. - Forwarding Router Address – IPX node address (12 hexadecimal digits) of the next IPX router in the route to the destination network, described by this table entry. If the destination network is one of the network segments directly connected to this IPX router, this field is all zeroes.
◆ Next-hop NetNum – Next-hop IPX network number. - Status – Defines whether the RIP interface is active. OFF is inactive but not deleted.
To add an IPX Routing Table entry:
-
Display the IPX Routing Table.
-
Click . The IPX Routing Table Insert window opens:

Figure 6-167. IPX Routing Table Insert window
An IPX circuit is linked to the Destination network.
To select an IPX circuit, on the IPX Routing Table Insert window click the Select Circuit button. The Select Circuit window opens:

Figure 6-168. Select Circuit window
The Select Circuit window displays the following parameters:
♦ Circuit Number – The IPX circuit number.
◆ Network Address – The IPX circuit network address.
-
Select an entry in the table.
-
Click √.
- Close the Select Circuit window. IPX Routing Table Insert window opens.
- Complete the fields.
- Click √.
- Close the IPX Routing Table Insert window. The IPX Routing Table opens.
- Click √. When the Status field displays "Finished!", the fields are confirmed as modified.
To edit an IPX Routing Table entry:
- Display the IPX Routing Table.
- Select an entry in the table.
- Click 📋. The IPX Routing Table Edit window opens:
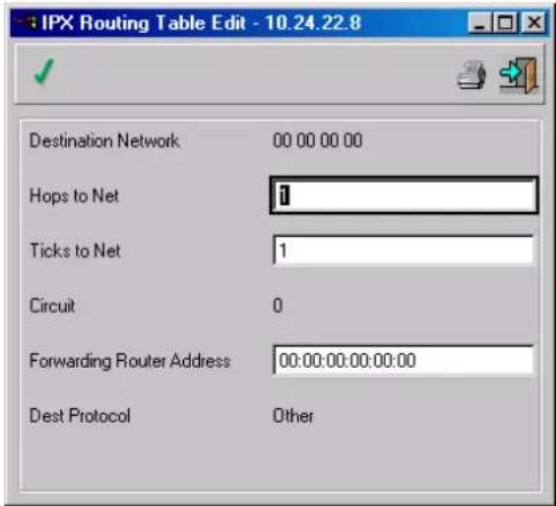
Figure 6-169. IPX Routing Table Edit window
- Complete the fields.
- Click √
- Close the IPX Routing Table Edit window. The IPX Routing Table opens.
- Click √. When the Status field displays "Finished!", the fields are confirmed as modified.
To delete an IPX Routing Table entry:
- Display the IPX Routing Table.
- Select an entry in the table.
- Click ▶. The entry is deleted.
- Click √. When the Status field displays "Finished!", the fields are confirmed as modified.
IPX SAP Table
The SAP table contains information on each server located on a destination network that can be reached by the selected IPX router.
To display the SAP Table:
♦ Select Router > IPX > SAP Table. The IPX SAP Table opens:

Figure 6-170. IPX SAP Table window
The IPX SAP Table displays the following parameters:
◆ Server Name – Server type and server name to identify a server. The name can include up to 47 characters.
◆ Network – Network portion (eight hexadecimal digits) from the IPX server address.
◆ Server Address – Node portion 12 hexadecimal digits) from the IPX server address.
♦ Socket – Socket portion up to four hexadecimal digits) from the IPX server address.
◆ Server Type – Type of service (assigned by Novell) provided by the server.
♦ Hops to Server – Number of hops on the route to the server, as determined by the IPX SAP routing algorithm.
♦ Protocol Type – The information source protocol.
◇ Static – User-defined entry (SNMP)
◇ SAP - SAP protocol.
- Status – Defines whether the SAP interface is active. OFF is inactive but not deleted.
To add an IPX SAP Table entry:
-
Display the IPX SAP Table.
-
Click . The IPX Routing Table Insert window opens:

Figure 6-171. SAP Table Insert window
- Complete the fields.
- Click √.
- Close the IPX SAP Table Insert window. The IPX SAP Table opens.
- Click √. When the Status field displays "Finished!", the fields are confirmed as modified.
To edit an IPX SAP Table entry:
- Display the IPX SAP Table.
- Select an entry in the table.
- Click ☐. The IPX SAP Table Edit window opens:

Figure 6-172. IPX SAP Table Edit window
- Complete the fields.
-
Click √.
-
Close the IPX SAP Table Edit window. The IPX SAP Table opens.
-
Click √. When the Status field displays "Finished!", the fields are confirmed as modified.
To delete an IPX SAP Table entry:
-
Display the IPX SAP Table.
-
Select an entry in the table.
-
Click . The entry is deleted.
-
Click √. When the Status field displays "Finished!", the fields are confirmed as modified.
Configuring Security Options
This chapter describes the Security menu and its options, including access setting for device management.
Community Table
To enter the Community Table, Super access is required.
To display the Community Table:
♦ Select Security > Community Table. The Community Table opens:

Figure 6-173. Community Table window
The Community Table displays the following parameters:
◆ Management Address – Management station IP address.
◆ Community String – Management station community name. This parameter operates as a password for gaining various access rights: for each device various communities with different names and access rights can be created.
◆ Community Access – Defines whether the management station access is Read Only or Read Write. Choose Super Community to set the name used to access the Community Table. The possible values are:
◇ Read Only
◇ Read Write
◇ Super
- Send Traps – Whether the management station receives traps from the device (Enable) or not (Disable).
Note: To change the community, Super Community access is required.
To add a Community Table entry:
- Display the Community Table.
- Click . The Community Table Insert window opens:

Figure 6-174. Community Table Insert window
- Complete the fields.
- Click .
- Close the Community Table Insert window. The Community Table opens.
- Click √. When the Status field displays "Finished!", the fields are confirmed as modified.
To edit a Community Table entry:
- Display the Community Table.
- Select an entry in the table.
- Click . The Community Table Edit window opens:
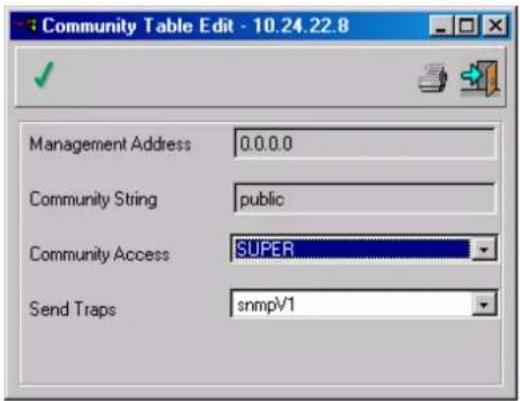
Figure 6-175. Community Table Edit window
- Complete the fields.
- Click
- Close the Community Table Edit window. The Community Table opens.
- Click √. When the Status field displays "Finished!", the fields are confirmed as modified.
To delete a Community Table entry:
- Display the Community Table.
- Select an entry in the table.
- Click ▶. The entry is deleted.
- Click √. When the Status field displays "Finished!", the fields are confirmed as modified.
Configuring Quality of Service
This section describes the QoS menu and its options, including policies and creating, editing, and deleting rules, IP classification fields, and policy profiles.
Quality of Service (QoS) allows network managers to improve the flow of network traffic based on policies. Policies are comprised of profiles, classification fields, and rules.
The QoS menu has the following menu options:
♦ Global Parameters
◆ Profile Table
♦ Routed IP
Global Parameters
Note: To enable QoS, ensure that the auto-negotiation is disabled and that the output port is in full duplex mode.
The QOS Global Parameters window allows you to enable or disable a policy on a device. Policies are sets of profiles and rules that allow you to manage network traffic.
To display the QOS Global Parameters window:
♦ Select QOS > Global Parameters. The QOS Global Parameters window opens:

Figure 6-176. QOS Global Parameters window
The QOS Global Parameters window displays the following parameters:
♦ Policy Enabled – If enabled, this policy is enabled on the device.
To enable a policy on a device:
- Display the QOS Global Parameters window.
- Set the policy status to enabled.
- Click 📋 to update the device. When the Status field displays "Finished!", the policy is enabled on the device.
Profile Table
Profiles determine the actions taken on a packet entering a device according to their bandwidth definitions.
To display the Profile Table:
♦ Select QoS > Profile Table. The QOS Profile Table opens:

Figure 6-177. QOS Profile Table window
The QOS Profile Table displays the following parameters:
◆ Description – The user-defined description of the profile.
◆ Profile Type – The type of forwarding service to be applied to packets. The possible values are:
-
BandwidthGuarantee - Defines the bandwidth size for packets being forwarded. Packets must meet the bandwidth requirements to be forwarded. Packets exceeding the defined bandwidth size are dropped.
◇ minbandwidthGuarantee - Defines the minimum bandwidth size for packets being forwarded. Packets beyond the defined bandwidth size receive a best-effort forwarding priority.
◇ minDelay - Forwards packets with a priority of real time forwarding. Packets exceeding the assigned amount of bandwidth are dropped.
◇ minDelayPerSession - Defines the amount of bandwidth per session for a real time forwarding priority. Sessions exceeding the defined amount of sessions are dropped. -
Rate (kbps) > 440 – The rate in kilobits/seconds assigned to a profile for forwarding a packet. The values are 0-12 Gbps depending on the output port.
♦ Max Session – Max Session is only relevant to the minDelayPerSession profile type. Indicates the maximum number of sessions that can occur for a profile instance.
♦ New VPT – The VPT (VLAN Priority Tag). The possible values are 0-7. Zero is the default. The higher the Vpt tag value the higher the forwarding priority.
♦ New ToS – Type of Service. Enables you to override the ToS value. The possible values are 0-3. - Burst Size (bytes) – The amount of bytes that can be forwarded back-to-back faster than normal speed. If the value is 0, the device uses a predefined value. The default size is 0. If the burst size value is 0, the value for minDelayPerSession and minDelay is 1,536 bytes. MinbandwidthGuarantee and BandwidthGuarantee are forwarded with a value of 3x 1,536 bytes.
To add a new profile:
- Display the QOS Profile Table.
- Double-click an empty row in the QOS Profile Table.
or
Click . The Insert Profile window opens. The Insert Profile window has two tabs:
- Main tab – Displays the main options for assigning profiles including the profiles description, type, rate, maximum sessions, and new Vpt. The default tab is the Main tab.
◆ Advanced tab – Displays advanced options for assigning profiles including new ToS and burst size.

Figure 6-178. Insert Profile window - Main tab
- Complete the fields. The fields are the same as the Profile Table as described above.
- Click √. The Insert Profile window closes.
- Click to update the device. When the Status field displays "Finished!" the profile is saved to the device.
or
Select the Advanced tab. The Advanced tab opens:
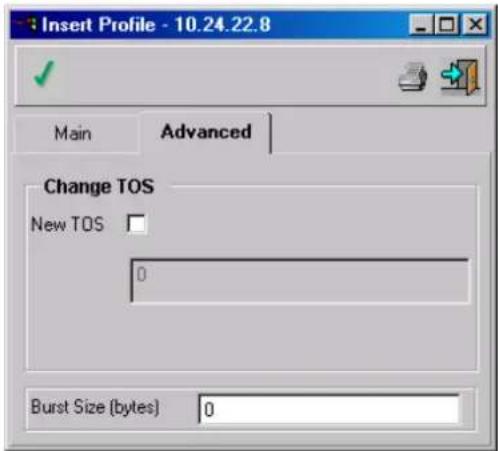
Figure 6-179. Insert Profile window - Advanced tab
- Complete the fields. The fields are the same as the Profile Table as described above.
- Click √. The Insert Profile window closes.
- Click 📋. When the Status field displays "Finished!", the profile is saved to the device.
To edit a profile:
- Display the Profile Table.
- Select an entry in the Profile Table and click 📋. The Edit Profile window opens.
or
Double-click a row in the Profile Table. The Edit Profile window opens:

Figure 6-180. Edit Profile window - Main tab
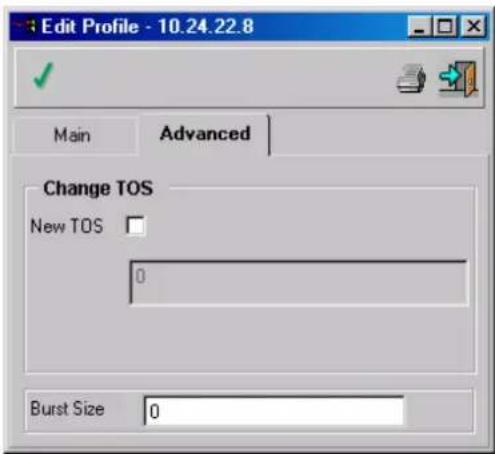
Figure 6-181. Edit Profile window - Advanced tab
- Edit the fields. The fields are the same as the Profile Table as described above.
- Click √ . The Edit Profile window closes.
- Click 📋. When the Status field displays "Finished!", the profile is saved to the device.
To delete a profile:
- Display the Profile Table.
- Select an entry in the table.
- Click . The entry is deleted from the Profile Table.
- Click 📋 to update the device. When the Status field displays "Finished!", the profile is deleted from the device.
Note: Profiles attached to a rule cannot be deleted.
Routed IP
The Routed IP menu has the following menu options:
♦ Routed IP Classification Fields
♦ Routed IP Rules Table
IP Classification Fields
IP Classification Fields window allows you to define the fields used to classify network traffic.
To display the IP Classification Fields window:
♦ Select QoS > Routed IP > Routed IP Classification Fields. The IP Classification Fields window opens:

Figure 6-182. IP Classification Fields window
The IP Classification Fields window displays the following parameters:
♦ ToS - Type of Service. Enables (checked) classification by the ToS tagging for forwarding packets.
♦ Protocol – Enables (checked) classification of packets by their type of protocol.
- Source IP Bit Mask (0-32) – Used to mask all or part of the source IP address. If selected, QoS matches packets arriving from the indicated source IP address, within the limits of the source IP mask. The values are 0-32.
♦ Destination IP Bit Mask (0-32) – Used to mask all or part of the destination IP address. If selected, QoS matches packets being sent to the indicated destination IP address, within the limits of the destination IP mask. The values are 0-32.
- Source Port Protocol – Enables (checked) the classification of arriving packets by their source port protocol type.
♦ Destination Port Protocol – Enables (checked) the classification of arriving packets by their destination port protocol type
- Input Ports – Enables (checked) the classification of arriving packets by the physical input port.
To Define the IP Classification Fields
- Display the IP Classification Fields window.
-
Complete the fields. The fields are the same as the IP Classification Fields described above.
-
Click 📄 to update the device. When the Status field displays "Finished!", the IP Classification Fields are saved to the device.
IP Rules Table
The IP Rules Table allows you to define the filters that determine which network traffic is managed. The IP Rules Table contains two types of filters:
◆ Filters that determine how packets are matched to a rule. For example, the Protocol, ToS, Source Port, Destination Port, Input Ports, and Output Ports fields.
◆ Filters that determine what forwarding action is taken on packets. For example, the Condition and Actions fields.
Note: The fields that appear in the IP Rules Table reflect the IP Classification Fields that were selected.
Note: Rules cannot be added to the IP Rules Table if the IP Classification Fields have not been defined.
To display the IP Rules Table:
♦ Select QoS > IP > IP Rules Table. The IP Rules Table opens:

Figure 6-183. IP Rules Table window
The IP Rules Table contains fields that reflect the type of IP Classification Fields selected and additional parameters for forwarding packets:
◆ Description – The user-defined description of the rule.
♦ ToS – Type of Service. Indicates the predefined ToS used to classify packets. If selected, the rule applies to packets matching the ToS type. The possible values are 0-3. The default value is disabled.
- Protocol – The protocol type. Indicates the type of predefined protocols used to classify packets. If selected, the rule applies to packets of this indicated protocol. The possible values are TCP or UDP.
- Source IP - The source IP address of packets being matched to the rule. If selected, QoS matches the rule to packets arriving from the indicated source IP address.
- Source IP Mask – Used to mask all or part of the source IP address. If selected, QoS looks for and matches the rule to packets being sent from the indicated source IP address, within the limits of the Source IP Mask. The Source IP Mask must not exceed the limits set in the IP Classification fields.
♦ Destination IP – The destination address of packets being matched to the rule. If selected, QoS looks for and applies the rule to packets being sent to the indicated IP address.
♦ Destination IP Mask – Used to mask all or part of the destination IP address. If selected, QoS looks for and matches the rule to packets being sent to the indicated destination IP address, within the limits of the destination IP mask. The Destination IP Mask must not exceed the limits set in the IP Classification fields.
- Source Port – Indicates if and which source port should be used when matching the rule to packets.
♦ Destination Port – Indicates if and which destination port should be used when matching the rule to packets.
- Condition – Specifies whether the packets' value should be different from the rules' value. The possible values are:
- Bigger – Looks for a higher value than the exact data. Indicates that the parameter values of a packet should be larger than the parameter values of the rule.
- Smaller – Looks for a lower value than the exact data. Indicates that the parameter values of a packet should be smaller than the parameter values of the rule.
-
Equal - Looks for the exact data. Indicates that all of the parameter values of a packet should match all of the parameter values of the rule.
Not Equal - Looks for non-matching data. Indicates that none of the parameter values of a packet should match the parameter values of the rule. All values must be different. -
Input Port – Indicates to which ports this rule applies. Packets arriving from the defined port are forwarded according to the rule definition.
Action – The action to be taken on packets when matched to the rule. The possible values are:
◇ Block - Drops packets.
◇ Block and Trap – Drops packets and notifies the CPU that packets were dropped.
Permit – Forwards packets. If the action is permit, then the output ports to which this rule applies can be selected. This is the default value.
- Profile Pointer – Indicates which profile is attached to the rule. This field is only active if the forwarding action of the packet is permit. The default value is 0. Zero is illegal if the action is permit.
- Output Ports – Indicates to which ports this rule applies. This field is only active if the forwarding condition of the packet is permit. The default value is all ports.
- Error Description – Indicates if the rule is valid. The error description can be one of the following:
The bandwidth specified exceeds the available specified bandwidth on the output ports - Indicates that the amount of the bandwidth specified exceeds the available amount of bandwidth as defined for the profile matching the rule.
◇ The QoS lock failed – Indicates that the rule cannot be applied to a packet. The possible reasons are:
◆ Auto-negotiation is enabled.
◆ The port is not in full duplex mode.
- Status – Indicates rule’s status. The rule status can be one of the following:
◇ Active – The rule is legal and currently active.
◇ Not in Service – The rule is currently not active.
Not Ready – Indicates that some of the output ports do not meet the bandwidth allocation prerequisites or QoS locking prerequisites. Auto-negotiation should be disabled and the output port should be in full duplex mode.
Note: The first rule matching a packet is applied, therefore, the order of the rules in the IP Rules Table is important.
To add a new rule in IP Rules Table:
- Display the IP Rules Table.
- Double-click an empty row in the IP Rules Table.
or
Click. The IP Rules Insert window opens. The IP Insert Rules window has the following tabs:
- General – Displays the general options for assigning rule value including the user-defined description, error description and if the rule is currently active.
♦ Classification – Displays the IP Classification Fields for assigning rule value including the ToS, protocol types, source and destination IP addresses, source and destination IP address masks, source and destination ports, and conditions. - Input Ports – Displays a list of input ports to choose from for assigning rule value.
Action – Displays the action options for assigning rule value, including a list of the optional output ports if the action is permit. - Profiles – Displays the profiles to attach to a rule if the action value is permit. The Profiles tab is grayed out if the action is block or block and trap. The Profiles tab displays the same fields as the Profile Table. For a list of the fields in the Profile Table.

Figure 6-184. IP Rules - Insert window General tab
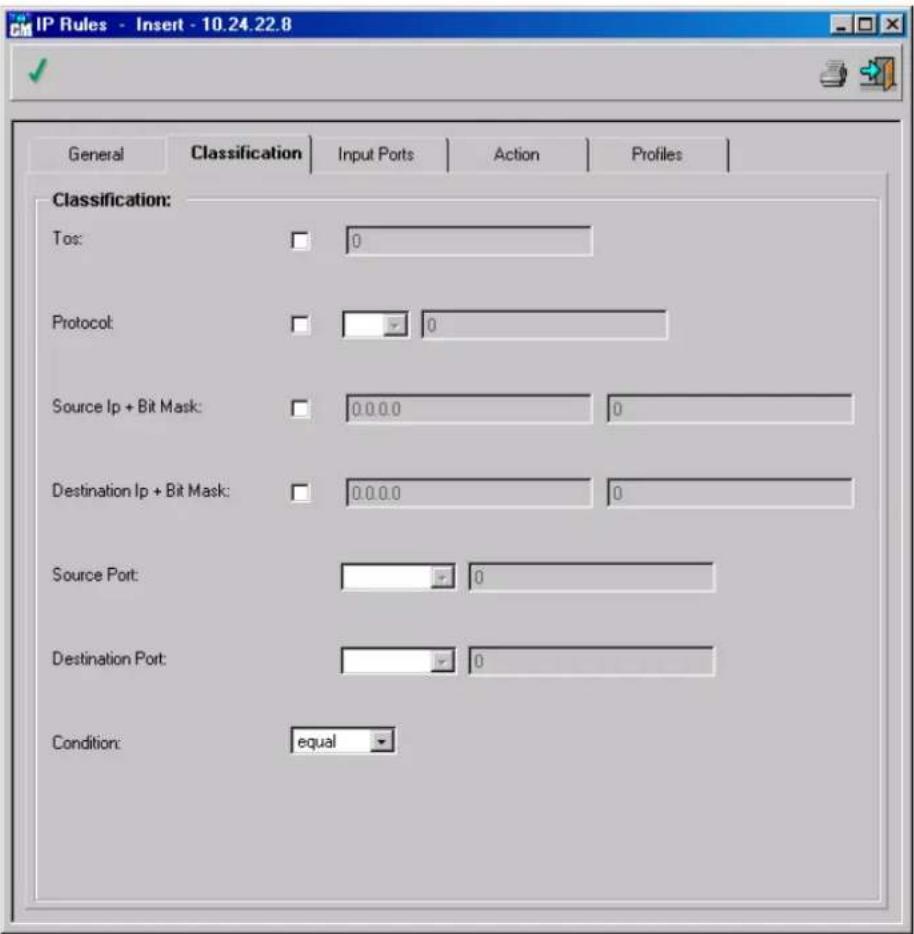
Figure 6-185. IP Rules - Insert window Classification tab
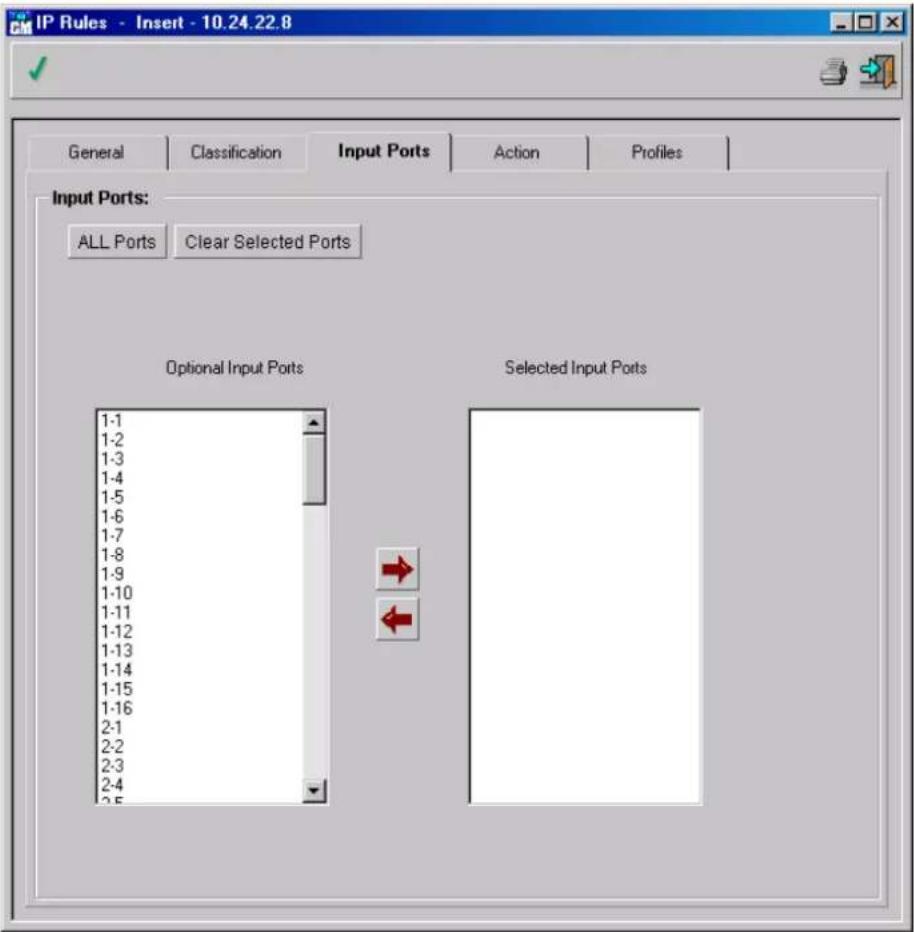
Figure 6-186. IP Rules - Insert window Input Ports tab

Figure 6-187. IP Rules - Insert window Action tab

Figure 6-188. IP Rules - Insert window Profiles tab
- Complete the fields. The fields are the same as the IP Rules Table as described above, except for the Profiles tab.
- Click √. The IP Rules Insert window closes.
- Click to update the device. When the Status field displays "Finished!", the rule is saved to the policy. If the rules could not be set to the device, one of two errors may occur:
◇ The bandwidth specified exceeds the available specified bandwidth on the output port.
◇ The QoS lock failed.
To edit a rule:
- Display the IP Rules Table.
- Select an entry in the IP Rules Table and click 📄. The IP Rules Table - Insert window opens. or
Double-click a row in the IP Rules Table. The IP Rules Table - Insert window opens.
- Edit the fields. The fields are the same as the IP Rules Table as described above, except for the Profiles tab.
-
Click √ . The IP Rules Insert window closes.
-
Click ↓ to update the device. When the Status field displays "Finished!", the rule is saved to the device.
To delete a rule:
- Display the IP Rules Table.
- Select an entry in the table.
- Click ▶. The entry is deleted.
- Click 📋 to update the device. When the Status field displays "Finished!", the rule is deleted from the policy.
Working With Statistics
Devices supporting DECnet allow individual DECnet circuit counters to be graphed, and to reset those counters.
The BadPackets SNMP counter of certain devices is automatically monitored, and by default, provides information when an unusually high concentration of error packets occur. The relevant parameters are called the Threshold Parameters. The Threshold Parameters can be modified or disabled.
The Statistics menu has the following menu options:
♦ Element Statistics
◆ Interface Statistics
♦ Port Statistics
♦ History
♦ Alarm Table
♦ Statistics Table
♦ Traps Table
◆ Log Table
Element Statistics
Element Statistics describes the device as a complete unit. The display is real-time.
To display Element Statistics:
- Select Statistics > Element Statistics, or click 📄, or press Ctrlr+P. The Element Statistics window opens:
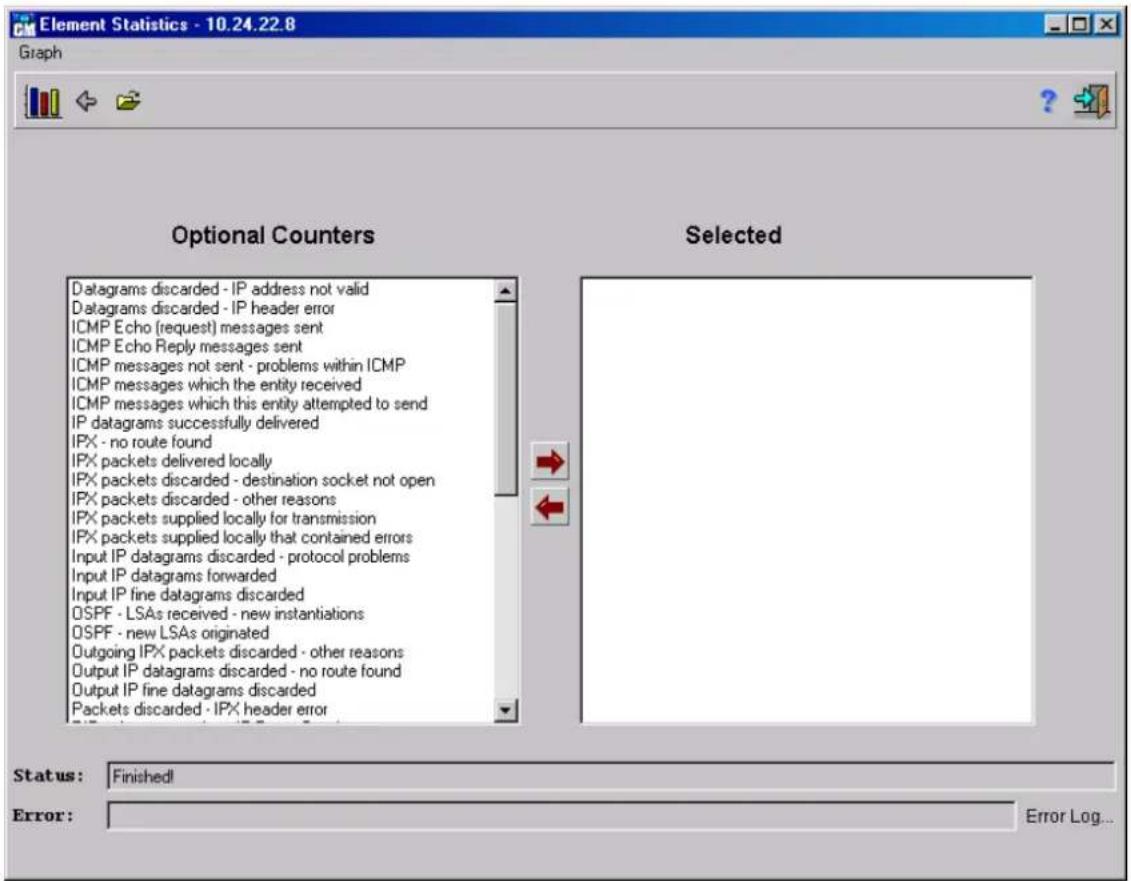
Figure 6-189. Element Statistics window
- Select the MIB required variables by one of the following methods:
Double-click on the variable in the Optional Counters box. The variable is moved to the Selected box.
or
◇ Select the variable in the Optional Counters box and click the variable is moved to the Selected box.
To remove a selected variables use one of the following methods:
-
Double-click on the variable in the selected box.
-
Select the variable Selected box and click
To save a graph configuration use one of the following methods:
- Click 📋. The configuration file can be edited with a standard editor
To load a previously saved graph configuration use one of the following methods:
- Click Graph, then click Load configuration from file. An Open File window opens:

Figure 6-190. Open File window
- Select the file.
- Click √. The graph opens:

bar
Element Statistics graph - 10.24.22.8 | TIME | Value | | :--- | :--- | | 17:16:19 | 35 | | 17:16:24 | 32 | | 17:16:29 | 48 | | 17:16:34 | 52 | | 17:16:39 | 38 |Figure 6-191. Element Statistics Graph window
The display is comprised of the following areas:
◆ Menu Bar
♦ Tool Bar
♦ Graph
♦ Legend
◆ Display Configuration
♦ Graph Controls
◆ Display Controls
♦ Alarm Definitions
♦ Other Controls
Menu Bar
The Menu Bar has two commands:
◆ File – Has the following menu options:
◇ Save Configuration – Saves the current statistic configuration.
◇ Close - Closes the graph window.
◆ View – Has the following menu options:
◇ Show/Hide Control Panel – Hides the Display and Graph controls.
◇ Help
Tool Bar
The Tool Bar has the following icons:

Hides the Display and Graph controls.

Saves the current statistic configuration.
Graph
The graph is real-time with constant updates according to the Sample Time. The results shift as the new data is mapped on the graph. The Sample Time is displayed in the Graph Control area.
Legend
A list displaying the MIBs in the graph and their automatically assigned color-codes. Check/clear the Show Legend checkbox to display or hide the graph legend.
Display Configuration
The graph in the display area can be manipulated into different configurations.
Graph Controls
This area describes the parameters used in generating the data for display in the graphs. They include the following:
♦ Graph Type – Choose from various graphs types for data analysis. The available graph types are; bar, area, stacking area, plot, scatter-plot, stacking-bar and pie.
- Data Buffer Size – How many polling sessions will remain in memory for viewed by scrolling. Range is 5 to 100.
◆ Monitor Size – How many polling sessions are displayed without scrolling. Range is 1 to 100.
- Sample Time – How often the device or interface is polled (time interval, in seconds, between polling sessions). Range is 3 to 3600 seconds.
◆ Presentation Units – How often the histogram is updated.
If the Presentation Units value is set to Sample Time, the graph is updated at the polling rate specified in the Sample Time field.
If the Presentation Units is set to a value different from the Sample Time value, the histogram is updated at the Presentation Units rate displaying the estimated polling results. The graph is also updated with the true data at the Sample Time rate.
Set the Presentation Units to a value lower than the Sample Time in traffic-heavy systems (where too frequent system polling is not recommended).
For example: if the Sample Time is set to 10 seconds and the Presentation Units to second, the graph is refreshed every second with extrapolated data and every 10 seconds with true data.
Display Controls
This area controls what is displayed on the screen.
Alarm Definitions
Displays the variable alarm characteristics.
Other Controls
Other controls include the following:
To display graph data from earlier time periods available in the buffer:
Press Ctrl and Shift while dragging the mouse on the graph to the right. The graph temporarily stops moving and is dragged back to an earlier period within the same session.
To return to current data
Press Ctrl and Shift while dragging the mouse to the left.
To Zoom into a particular graph area:
Press Shift while dragging the mouse. When the mouse button is released, the selected area is expanded. Click the Reset Display button to return to normal viewing.
To rotate the graph
Press Ctrl while dragging the mouse.
To display actual variable values:
Click on a graph element. A label with the following information opens:
◇ Variable name.
◇ Variable current value.
To Hide the Control Panel:
Click the Control Panel button to hide the control panel or display it beneath the graph.
Interface Statistics
There are two types of interface statistics:
♦ IP Statistics
♦ IPX Statistics
IP Statistics
To display IP Interface Statistics:
- Select Statistics > Interface Statistics > IP Statistics. The IP Statistics Interface Selection Table opens:

Figure 6-192. IP Statistics Interface Selection Table window
- Select an entry and click. The IP Statistics window opens:

Figure 6-193. IP Statistics window
- Select the MIB required variables by one of the following methods:
Double-click on the variable in the Optional Counters box. The variable is moved to the Selected box.
or
Select the variable in the Optional Counters box and click →. The variable is moved to the Selected box.
- Click . The graph opens.
IPX Statistics
To display IPX Interface Statistics:
- Select Statistics > Interface Statistics > IPX Statistics. The IPX Statistics Interface Selection Table opens:

Figure 6-194. IPX Statistics Interfaces Selection Table window
- Select an entry and click. The Element Statistics window opens.
- Select the MIB required variables by one of the following methods:
Double-click on the variable in the Optional Counters box. The variable is moved to the Selected box.
or
Select the variable in the Optional Counters box and click →. The variable is moved to the Selected box.
- Click . The graph opens.
Port Statistics
Displays a selected port or interface statistics.
To display Port Statistics:
- Select a port by clicking on it. The port color changes to blue.
- On the menu bar click Statistics,
or
Select Statistics > Port Statistics. The IP Statistics Interface Selection Table opens:

Figure 6-195. Port Statistics window
- Select the MIB required variables by one of the following methods:
Double-click on the variable in the Optional Counters box. The variable is moved to the Selected box.
or
Select the variable in the Optional Counters box and click →. The variable is moved to the Selected box.
- Click . The graph opens.
History
The History menu contains information about network statistics, and has the following menu options:
♦ History Control Table
♦ Ether History Table
History Control Table
The History Control Table contains information about samples of data taken from ports. For example, the samples may include interface definitions or polling periods.
To display the History Control Table:
♦ Select Statistics > History > History Control Table. The History Control Table opens:

Figure 6-196. History Control Table window
The History Control Table displays the following fields:
♦ Index – Specifies the History Control Table entry.
- Port Number – Specifies the port number from which the sample was taken.
- Buckets Requested – Indicates the number of times samplings are requested from the port. The default value is 50.
- Buckets Granted – Indicates the number of times samplings were requested from a port and the number of times the results were saved.
- Interval – Indicates in seconds the time that samplings are taken from the ports. The possible values are 1-3600 seconds. The default is 1800 seconds (30 minutes).
To add an History Control Table entry:
- Display the History Control Table.
- Select an entry in the table.
- Click . The History Control Table - Insert window opens:

Figure 6-197. History Control Table - Insert window
-
Complete the fields. The fields are the same as the History Control Table as described above.
-
Click √ . The History Control Table Edit window closes.
To edit an History Control Table entry:
- Display the History Control Table.
- Select an entry in the table.
- Click . The History Control Table Edit window opens:
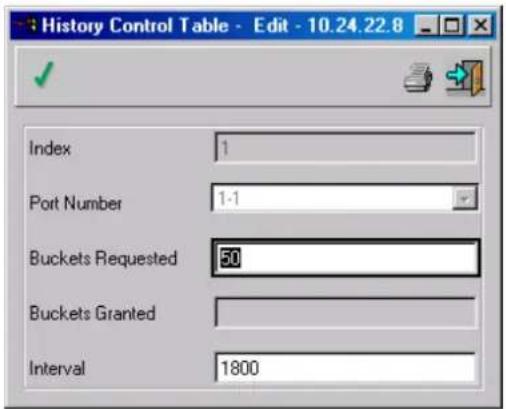
Figure 6-198. History Control Table - Edit window
- The History Control Table - Edit window parameters are described above.
- Complete the fields.
- Click √.
- Close the History Control Table - Edit window. The History Control Table opens.
- Click √. When the Status field displays "Finished!", the fields are confirmed as modified.
To delete an History Control Table entry:
-
Display the History Control Table.
-
Select an entry in the table.
-
Click ▶. The entry is deleted.
-
Click √. When the Status field displays "Finished!", the fields are confirmed as modified.
Ether History Table
The Ether History Table contains statistical network samplings. Each table entry represents a single sample. Samples reflect all packets on the local network segment.
To display the Ether History Table:
♦ Select Statistics > History > Ether History Table. The Ether History Table opens:
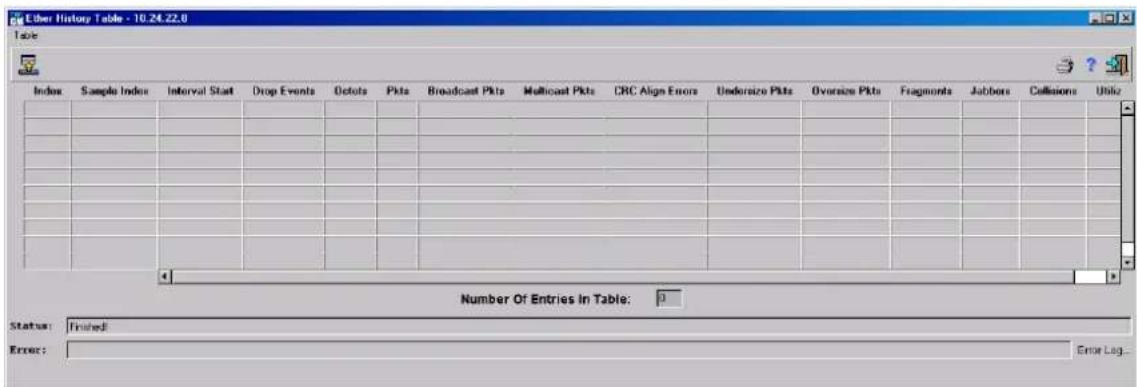
Figure 6-199. Ether History Table window
The Ether History Table displays the following fields:
♦ Index – Specifies the History Control Table entry from which the sample was taken.
- Sample Index – Indicates the specific sample the information in the table reflects.
- Interval Start – Indicates the time at which the sample was taken. The Interval start time is represented in an hour, minute, and second format, for example, 5 hours, 26 minutes, and 2 seconds.
- Drop Events – Indicates the number of dropped packets due to lack of network resources during the sampling interval. This may not represent the exact number dropped packets, but rather the number of times dropped packets were detected.
♦ Octets – Indicates the number of data octets, including bad packets, received on the network.
♦ Pkts – Indicates the number of packets received during the sampling interval.
♦ Broadcast Packets – Indicates the number of good broadcast packets received during the sampling interval.
♦ Multicast Packets – Indicates the number of good multicast packets received during the sampling interval.
♦ CRC Align Errors – Indicates the number of packets received during the sampling session with a length 64-1,518 octets. However, the packets has a bad Frame Check Sequence (FCS) with an integral number of octets or a bad FCS with a non-integral number.
- Undersize Packets – Indicates the number of packets received less than 64 octets long during the sampling session.
♦ Oversize Packets – Indicates the number of packets received more than 1,518 octets long during the sampling session.
- Fragments – Indicates the number of packets received less than 64 octets long and had a FCS during the sampling session.
♦ Jabbers – Indicates the number of packets received more than 1,518 octets long and had a FCS during the sampling session. - Collisions – Estimates the total number of packet collision that occurred during the sampling session. Collisions are detected when repeater ports detect two or more stations transmit simultaneously.
◆ Utilization – Estimates the main physical layer network usage on an interface during the session sampling. The value is reflected hundreds of percent.
Alarm Table
Displays a list of all alarm entries, created using the Element Statistics or the Port Statistics.
To generate Alarms based on the traffic handled by the device, the alarm is first set in the graph window.
To set an Alarm:
- Display the Element Statistics Graph window.
- In the Alarm Definition area click New. The New Alarm screen opens:

Figure 6-200. New Alarm window
The New Alarm window displays the following parameters:
- Alarm Interval – The value used is Time (in seconds). The default is the value specified in the graph Sample Time parameter. Modifications are done by changing the Sample Time parameters. Sample Time settings are as follows:
◇ Delta - Counter is reset.
◇ Absolute – ROS monitors the counter for the defined interval.
♦ Alarm Variable – The selected MIB variable.
◆ Sample Time – There are two Sample Time settings:
◇ Delta – The counter is reset at the times defined by the interval. This is the default.
◇ Absolute – The counter is not reset until the counter is overflowed. If the counter overflows, the threshold is set according to the aggregated counter results.
♦ Startup Alarm – The trigger that activates the alarm generation. The trigger can be a Rising alarm, Falling alarm, or a combination of both Rising and Falling. Rising is defined by crossing the threshold from low value threshold to a higher value threshold.
♦ Rising Threshold – The rising counter value that triggers the Rising Threshold alarm.
♦ Falling Threshold – The falling counter value that triggers the Falling Threshold alarm.
Note: The Rising and Falling threshold are graphically presented on top of the graph bars. Each monitored variable is designated a color.
♦ Rising and Falling Events – The mechanism in which the alarms will be reported. Either LOGed or TRAPed or combination of both. When LOG is selected, there is no saving mechanism either in the device or in the management system. However, if the device is not being reset, it remains in the device LOG table. If TRAP is selected, a TRAP via SNMP is generated and reported via the TRAPs general mechanism. The TRAP can be saved using the same mechanism (refer to Trap Monitor).
- Complete the fields.
- Click √.
- Close the New Alarm window. The Element Statistics Graph window opens.
To display the Alarm Table:
♦ Select Statistics > Alarm Table. The Alarm Table opens:

Figure 6-201. Alarm Table window
To edit an Alarm Table entry:
- Display the Alarm Table.
- Select an entry in the table.
- Click √. The Alarm Edit window opens:

Figure 6-202. Alarm Edit window
- The Alarm Edit window parameters are described above.
- Complete the fields.
- Click √.
- Close the Alarm Edit window. The Alarm Table opens.
- Click √. When the Status field displays "Finished!", the fields are confirmed as modified.
To delete an Alarm Table entry:
- Display the Alarm Table.
- Select an entry in the table.
- Click . The entry is deleted.
- Click √. When the Status field displays "Finished!", the fields are confirmed as modified.
Statistics Table
The Statistics Table consists of list of 17 RMON counters on selected ports.
To display the Statistics Table:
♦ Select Statistics > Statistics Table. The Statistics Table opens:

Figure 6-203. Statistics Table window
To add a Statistics Table entry:
-
Display the Statistics Table.
-
Click The Insert Statistics window opens:
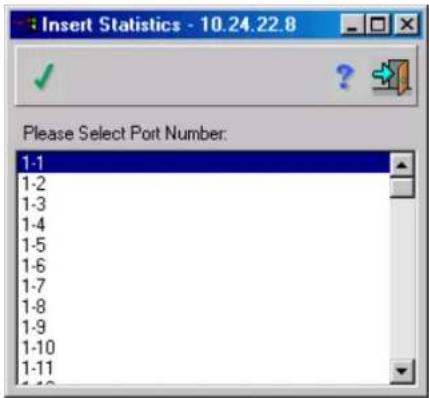
Figure 6-204. Insert Statistics window
-
Select a Port from the list displayed in the Insert Statistics window.
-
Click
-
Close the Alarm Table Edit window. The Alarm Table opens.
-
Click √. When the Status field displays "Finished!", the fields are confirmed as modified.
To delete a Statistics Table entry:
-
Display the Statistics Table.
-
Select an entry in the table.
-
Click . The entry is deleted.
-
Click . When the Status field displays "Finished!", the fields are confirmed as modified.
Traps Table
The General Traps Table contains information about traps, their severity, when they occurred, and the source.
To display the General Traps Table:
♦ Select Statistics > Traps Table. The General Traps Table opens:

Figure 6-205. General Options - General Traps Table window
The General Options window is divided into two panes, the left pane contains the screen functions, and the right pane contains corresponding function screen. The left pane always remains constant. Clicking on the function icons in the left pane toggles the right pane. In the General Options window left-hand pane, the following two icons are displayed:

Traps
The General Options window displays the General Traps Table by default. Tables displaying system signal traps.
Traps

Configuration
Displays the General Options - Configuration dialog box in the right pane. Used for modifying system configuration options.
The General Traps Table window displays the following information:
- Trap Number – A consecutive number given to each event to make information retrieval more efficient.
- Severity – The event level, which can be one of the following:
◇ Informational
◇ Warning
Error
◇ Fatal
◆ Date – Date the trap occurred.
◆ Time – Time the trap occurred.
- Source – The device IP address sending the trap.
- Information – An event description. For example, Link Up.
The Traps Table window has the following icons on the toolbar.
Traps Table Icons on the Toolbar
| Icon | Function |
| Delete Traps Table entries. | |
| Save the Traps Table. The Status bar displays the file path to which the trap has been saved:/Nms/Configuration/traps.dat. | |
| Show Trap files. |
To view the General Traps Table:
- There are two methods of displaying the General Options window is as follows:
◆ From the Main window click Options.
◆ On the Menu Bar, click Statistics. On the Statistics menu, click Traps Table. The General Options window opens. The default tab is General Traps Table.
- If the Configuration tab is open, click the traps icon in the left pane.
The General Traps Table opens in the right panel.
To view the Trap Files:
◆ On the General Options - General Traps Table window click. The Saved traps window opens:

Figure 6-206. Saved traps window
The columns displayed in the Saved traps window are the same as displayed in the General Options - Traps Table.
There are two types of Saved traps tables:
◆ Autotrap File
◆ Trap File
To view the device front panel from the trap source:
Double-click a trap in the Traps Table to open the device front panel view that sent the trap.
To set an alarm when receiving traps:
Click the "Beep when a trap arrived" checkbox to hear the beep every time a new trap arrives.
Configuring Trap Parameters
To configure the number of traps displayed in the Traps Table and how many traps stored in a file:
◆ From the General Options window Menu Bar, click Traps and then select Traps Configuration. The following Traps Configuration window opens:

Figure 6-207. Traps Configuration window
The following parameters are displayed in the Traps Configuration window:
♦ Maximal number of traps to display – How many traps are displayed in the Traps Table. By default, 500 traps can be displayed.
- Maximal number of traps to keep in file – How many traps to store in a file. The default value is 5000, i.e. 5000 traps are stored by the system in the file called autotraps.dat.
The maximal number of traps to keep on file must be greater than the maximal number of traps to display. For example, with maximal number of traps to display set to 100 and maximal number of traps to keep in file is set to more than 100.
If 150 new traps arrive, the most recent 100 traps are displayed in the Traps Table and the rest of the new traps (50 traps) are stored in the autotraps.dat file.
Enter the two parameters and press. The configuration is saved and the Traps Table opens.
Log Table
The Statistics log table consists of entries generated by a device when triggering events. Those events are triggered once the traffic crosses a threshold, by either Falling or Rising actions, set to LOG or LOG and TRAP.
This table is read only, therefore only the logged entries can be viewed. The logged entries are cleared once the device is reset. To save these entries, use the TRAPS function.
To generate the Statistics Log Table:
♦ Select Statistics > Log Table. The Statistics log table opens:

Figure 6-208. Statistics log table window
Working With Services
The Services command has the following menu options:
♦ Device Tuning
◆ Event Log
◆ Refresh
♦ Polling Configuration
◆ Community Change
♦ Ping
◆ Refresh Device Version
Device Tuning
Device Tuning is used to determine the maximum amount of entries allowed in the various tables listed. The changes are implemented only after reset.
To display the Device Tuning window:
♦ Select Services > Device Tuning. The Device Tuning window is displayed. There are four tabs on the Device Tuning Window.
♦ General – Defines the maximum number of entries for the Bridge Forwarding table, RMON Log table, and the Error Report table.
◆ IP – Defines the maximum number of entries for RIPs, ARP Forwarding table, FFT table, DHCP connections, and the FFT upper and lower limits.
♦ IPX – Defines the maximum number of entries for RIP, SAP, and FFT upper and lower limits.
♦ IPM – Defines the maximum number of entries for FFT, PIM, and IGMP entries both before and after the device is reset.
To display the Device Tuning window General tab:
♦ Select Services > Device Tuning. The Device Tuning window opens. The default screen is the General tab.
The General tab displays the following columns:
- Current Value – The current maximum number of entries.
- After Reset – The future (after reset) maximum number of entries. By entering a value in the After Reset column, memory is allocated to the field table.
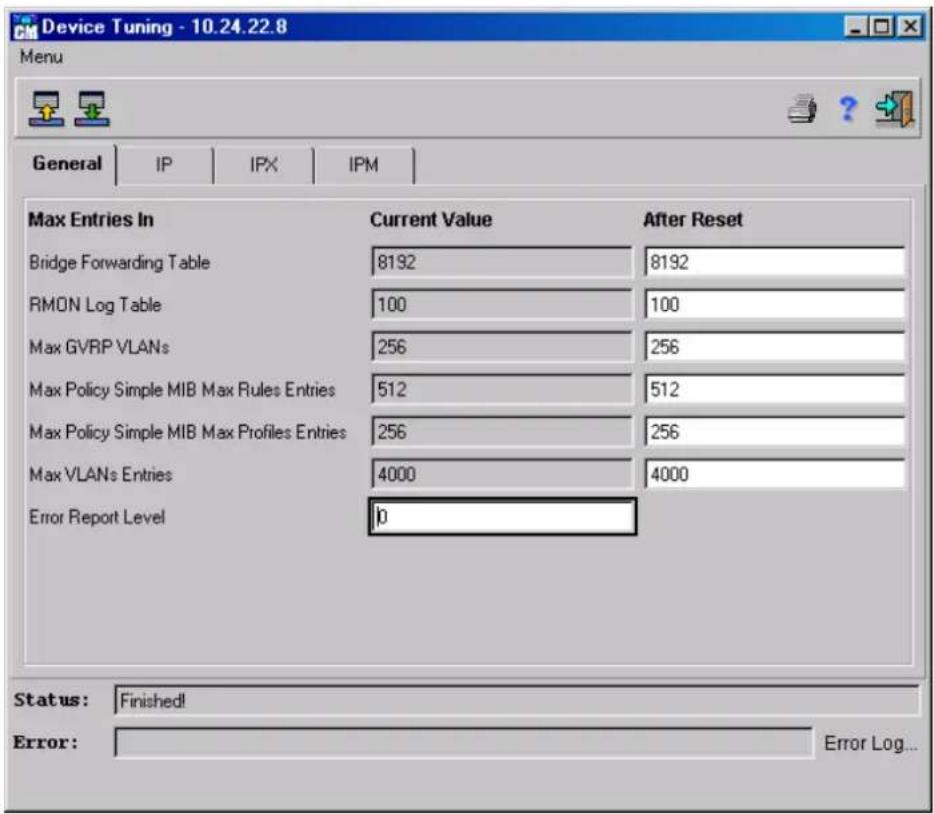
Figure 6-209. Device Tuning window General tab
The Device Tuning window General tab displays the following parameters:
◆ Bridge Forwarding Table – Maximum number of entries (MAC addresses) possible for this table.
♦ RMON Log Table – The number of log entries the device keeps in the table before overwriting the first entry. It is kept until the device is reset.
♦ Max GVRP VLANS - Indicates the maximum number of VLANs that can currently participate in GVRP.
Note: If the maximum number of VLANs is decreased, the number should still be greater than the number of MAX GVRP VLANs.
♦ MAX Policy Simple MIB Max Rules Entries – Indicates the maximum number of policy entries.
♦ MAX Policy Simple MIB Max Profile Entries – Indicates the maximum number of profile entries.
- Max VLANs Entries – Indicates the maximum number of VLANs entries.
- Error Report Level – (0 to 255) Determines the amount of errors sent to the terminal. 0 sends the least amount of errors and 255 sends the most.
To display the Device Tuning window IP tab:
- Display the Device Tuning window's General tab.
- Select the IP tab. The IP tab opens:

Figure 6-210. Device Tuning window IP tab
The IP tab displays the following parameters:
♦ IP RIP table – Maximum number of routing table entries allowed for this table.
♦ ARP Forwarding table – Maximum number of entries allowed for this table.
♦ Max IP FFT Entries – Maximum number of IP Fast Forwarding table entries allowed.
- Max IP System Entries – Maximum number of IP entries that can be entered into the system.
♦ IP FFT Upper Limit (percents) – Maximum percentage of entries that the device can hold in FFT without overflowing.
♦ IP FFT Lower Limit (percents) – Minimum percentage of entries in which the device would stop the overflowing process.
To display the Device Tuning window IPX tab:
- Display the General tab.
- Select the IPX tab. The IPX tab opens:

Figure 6-211. Device Tuning window IPX tab
The IPX tab displays the following parameters:
♦ IPX RIP Table – Maximum number of routing table entries allowed for this table.
♦ IPX SAP Table – Maximum number of server entries allowed.
♦ Max IPX FFT Entries – Maximum number of IPX Fast Forwarding table entries allowed.
♦ Max IPX System FFT Entries – Maximum number of IPX entries that can be entered into the system.
♦ IPX FFT Upper Limit (percents) – Maximum percentage of entries the device can hold in FFT whiteout flowing.
♦ IPX FFT Lower Limit (percents) – Minimum percentage in which the device would stop the overflowing process.
To display the Device Tuning window IPM tab:
- Display the General tab.
- Select the IPM tab. The IPM tab opens:

Figure 6-212. Device Tuning window IPM tab
The IPM tab displays the following parameters:
♦ Max IPM FFT Entries – Maximum number of Fast Forwarding Table entries allowed both currently and after reset.
♦ Max PIM Neighbor Entries - Maximum number of PIM Neighbor entries allowed both currently and after reset.
♦ Max PIM Route Entries – Maximum number of PIM Route entries allowed both currently and after reset.
♦ Max PIM Interface Entries – Maximum number of PIM Interface entries allowed both currently and after reset.
- Max IGMP Cache Entries – Maximum number of IGMP Cache entries allowed both currently and after reset.
Event Log
The Event Log window records all device internal errors, including the date and time of occurrence, and a brief error description.
To display the Event Log:
♦ Select Services > Event Log. The Event Log window opens:
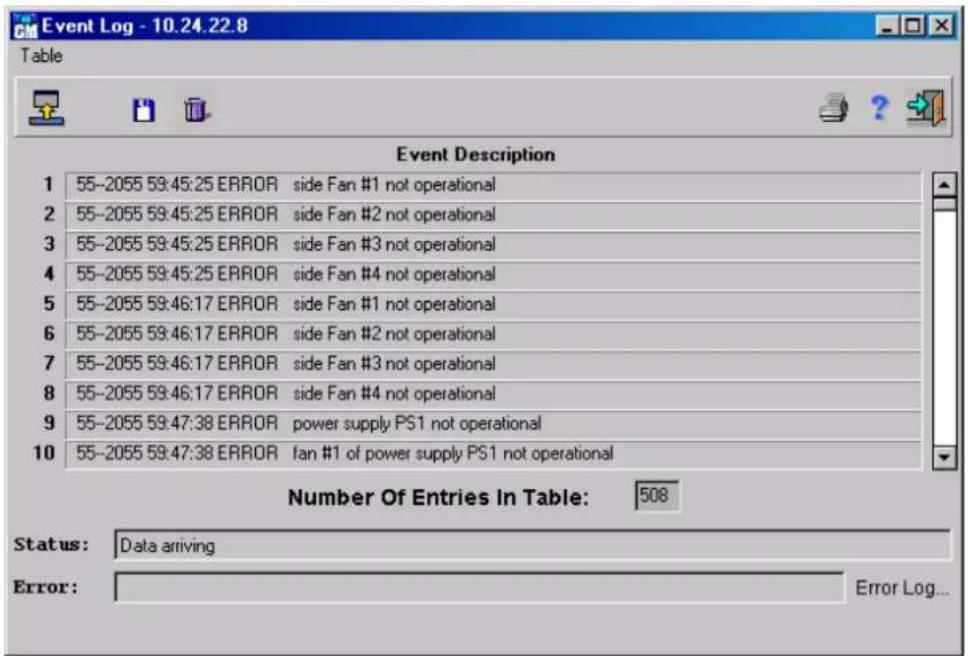
Figure 6-213. Event Log window
Refresh
To refresh the front panel view:
♦ Select Services > Refresh.
or
♦ Press Ctrl+R.
or
Click . The front panel view is refreshed.
Polling Configuration
Use this window to define how often (in milliseconds) the device is polled via SNMP protocol.
To define the SNMP polling frequency:
- Select Services > Polling Configuration. The Polling Configuration window opens:
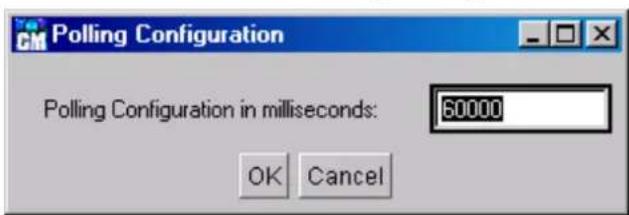
Figure 6-214. Polling Configuration window
- Enter the required polling configuration.
- Press OK.
Community Change
The system administrator manages access rights (read and write, read only, etc.) by making communities in the device, in the Community table. When the community name is changed, the access rights are changed.
To change a device community name:
- Select Services > Community Change. The Community Change window opens:

Figure 6-215. Community Change window
- Type in the new community name.
Note: Type in the new community name exactly as it appears in the system administrator Community Table or the station with Super access. Any incorrect community name is accepted by the Community Change window, but access to read or write data is unavailable.
- Click √. The status bar displays the message: "Community was changed!". The system has the appearance of exiting and re-starting.
Ping
The Ping Table displays a list of addresses of devices that were pinged by the system.
To display the device Ping Table:
♦ Select Services > Ping. The Ping Table opens:
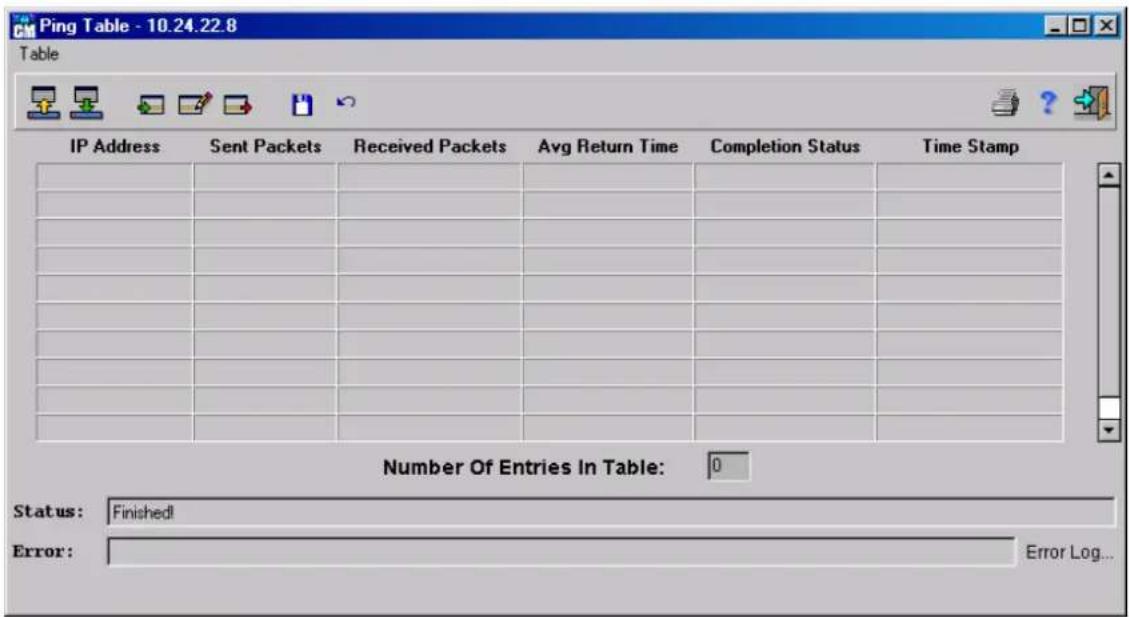
Figure 6-216. Ping Table window
The Ping Table displays the following parameters:
♦ IP Address – The device address pinged.
♦ Sent Packets – The number of packets sent to the device.
- Received Packets – The number of packets received from the device.
♦ Avg Return Time – The average amount of time it took for data to return from the device.
♦ Completion Status – The ping operation status, such as OK for a successful ping, or Timeout for a ping operation that resulted in a timeout.
◆ Time Stamp – Indicates the time and date the ping operation was requested or changed.
To add an entry in the Ping Table:
-
Display the Ping Table.
-
Click . The Ping Table Insert window opens:
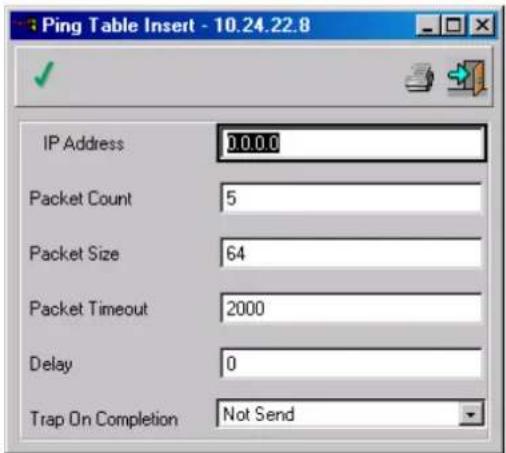
Figure 6-217. Ping Table Insert window
The Ping Table Insert window displays the following parameters:
♦ IP Address – The device address to be pinged.
♦ Packet Count – The number of packets delivered in the ping operation.
◆ Packet Size – The size of each packet delivered to the device.
◆ Packet Timeout – The amount of time the system waits until it stops sending the packet.
◆ Delay – The amount of time the system waits between the last packet it sent, and the next packet to be sent in the sequence.
- Trap on Completion – Whether or not to send traps to the management station after ping is completed.
-
Complete the fields.
-
Click √
-
Close the Ping Table Insert window. The Ping Table opens.
-
Click √. When the Status field displays "Finished!", the fields are confirmed as modified.
To edit a line in the Ping Table:
-
Display the Ping Table.
-
Select an entry in the table.
-
Click . The Ping Table Edit window opens:

Figure 6-218. Ping Table Edit window
- Complete the fields as required.
- Click √.
- Close the Ping Table Edit window. The Ping Table opens.
- Click √. When the Status field displays "Finished!", the fields are confirmed as modified.
To delete edit a line in the Ping Table:
- Display the Ping Table.
- Select an entry in the table.
- Click . The entry is deleted.
- Click √. When the Status field displays "Finished!", the fields are confirmed as modified.
Refresh Device Software
This command is used to verify that the device front panel view is updated according to the current software version.
To refresh the device:
- Select Services > Refresh Device Version. The Check Version for window opens:
Figure 6-219. Check Version for window
If a later device software version is installed since the last time the system was initiated, the system closes the current front panel view and all open windows, and re-opens a refreshed front panel view.
TECHNICAL SPECIFICATIONS
| General | |
| Standards | IEEE 802.3 10BASE-T EthernetIEEE 802.3u 100BASE-TX Fast EthernetIEEE 802.3z 1000BASE-SX/LX Gigabit EthernetIEEE 802.1ab 1000BASE-T Gigabit EthernetIEEE 802.1P/QIEEE 802.3xRFC 1123, RFC 2236RFC 1493, RFC 951RFC 2131, RFC 1058RFC 1723, RFC 1389RFC 1253, RFC 1583RFC 2178, RFC 1850RFC 1112, RFC 2236 |
| Management | MIB II, RMON, SNMP |
| Protocol | CSMA/CD |
| Data Transfer Rate | Half-duplex Full-Duplex |
| Ethernet | 10 Mbps 20 Mbps |
| Fast Ethernet: | 100 Mbps 200 Mbps |
| Gigabit Ethernet: | n/a 2000 Mbps |
| Topology | Star |
| Network Cables | 2-pair Category 3/4/5 UTP (max. 100 m) |
| 10BASE-T: | EIA/TIA-568 100-ohm STP (max. 100 m) |
| 100BASE-TX: | 2-pair Category 5 UTP (max. 100 m) |
| 1000BASE-T | EIA/TIA-568 100-ohm STP (max. 100 m) |
| 2-pair Category 5 UTP (max. 100 m) | |
| EIA/TIA-568 100-ohm STP (max. 100 m) | |
| Physical and Environmental | |
| AC Input | 90 to 264 VAC, 47-63 Hz (auto-adjusting internal power supply) |
| AC Output | 3.3V, 80A |
| DC Fans | Two built-in 60 x 60 mm fans per power supply unit |
| Temperature | Operating: 0° to 40°C (32° to 104°F)Storage: -25° to 55°C (-13° to 131°F) |
| Relative Humidity | Operating: 5% to 95% (non-condensing)Storage: 0% to 95% (non-condensing) |
| Dimensions | H: 35.6 cm (14.01 in.)W: 44.0 cm (17.32 in.)D: 29.4 cm (11.57 in.) |
| Weight | 12.68 kg (case + power + DES-6301 + DES-6302 w/ bracket)power 2.25 kgempty slot bracket 110gDES-6303 0.98 kgDES-6304 1.03 kgDES-6305 1.02 kgDES-6306 0.98 kgDES-6307 0.98 kgDES-6308 0.98 kgDES-6309 (w/ GBIC Fiber Transceiver) 1.05 kg |
| EMI | FCC Class A, CE Class A, VCCI Class A, BSMI Class A, C-Tick Class A |
| Safety | UL/CUL, TUV, CE |
B
SAMPLE CONFIGURATION FILE
This appendix provides a sample configuration file that can be used with the Update Firmware and Configuration Files screen in the console program.
The configuration file is a simple text file that you create. It has two functions: to point to the location of a file on a TFTP server, and to set the IP address, subnet mask and default gateway for the Switch. The file being uploaded can be either new runtime switching software, or a switch settings file that was previously saved on the TFTP server using the Save Settings to TFTP Server screen on the System Utilities menu. The IP address settings defined in the configuration file will override all other IP settings, even those defined in the settings file being uploaded. This enables the settings from one switch to be uploaded to another switch without their IP settings being the same (and thus coming into conflict).
Commands:
- Code_type - This command tells the Switch the type of file you wish to upload to the Switch. Possible Code_types are PROM, RUNTIME, or CONFIG. This should always be the first setting.
- PROM - PROM update file.
- RUNTIME – Switching software update file.
-
CONFIG – Image file of switch settings created by the settings backup procedure.
-
Image_file - This command tells the switch the complete path and filename for the file to be loaded into the switch. For example, "e:\6300\6300prom.tfp". Make sure double-quotes are used as in the example file below.
- Ip_addr - This is the IP address that will be assigned to the switch. This command is included for downloading a configuration settings file to another switch. The IP address defined in this file will override the IP address in the configuration settings file, thus the switch you are downloading to can have a different IP address than the one that created the configuration settings file. An example of an IP address is: 10.12.19.102.
Subnet_mask - This is the subnet mask that will be assigned to the switch. An example of a subnet mask is: 255.128.0.0.
Default_gateway - This is the default gateway IP that will be assigned to the switch. An example of a default Gateway IP is: 10.254.254.253. -
- Remark. When placed as the first character on a line, the entire line will be ignored by the switch. This allows items to be labeled, or unused commands to remain in the file so that the syntax will not be forgotten.
Notes about the Configuration File:
This configuration file can only contain 4 settings: Code_type, Ip_addr, Subnet_mask and Default_gateway.
Each command can only appear once in the configuration file.
If both the Firmware Update and Use Config File options are enabled, the Firmware Update command will take precedence and only the firmware file will be uploaded to the switch.
The Config image file, which contains all configuration settings and was created by the switch is prefixed with the version number of the runtime software to help with file management.
<h1 id="sample-config-file">Sample Config File</h1>
Code_type=PROM
Image_file="e:\6300\6300prom.tfp"
<h1 id="specify-ip-address">specify IP address</h1>
Ip_addr = 10.12.19.102
<h1 id="specify-subnet-mask">specify subnet mask</h1>
Subnet_mask = 255.128.0.0
<h1 id="specify-default-gateway">specify default gateway</h1>
Default_gateway = 10.254.254.253
INDEX
100BASE-TX networks....7
100Mbps Fast Ethernet 6
AC power cord....11
Accessory pack ....11
Aging Time very long .... 26 very short .... 26
Aging Time, definition of ....26
Aging Time, range of....26
Alleviating network loop problems .....28
ASCII format 44, 66
Attaching the mounting brackets ......See Rack Installation
Automatic learning ......26
Automatic topology re-configuration Spanning Tree Algorithm.... 26
Autotraps.dat....53, 228
BadPackets SNMP....210
BER format....44, 66
Bridge 100
Rapid Spanning Tree.... 113
Spanning Tree 104
Unicast 101
Bridge Level, STA Operation Level Bridge Identifier....27
Bridge Priority.... 27
Designated Bridge.... 27
Root Bridge.... 27
Root Path Cost 27
Bridge Operating Parameters....100
Bridge Priority 29
Cascade Windows....45
Community 45
ConfigMaster Introduction ......36
ConfigMaster.bat....43
Configuration File Name 65
Configuration File TFTP Server Address......65
Connect Button 45
Connecting The Switch....21
Converting files from BER to ASCII .....44, 66
Copy Port 87
CSMA/CD Ethernet protocol ....6
DECNet....210
Delete Device....57
Deleting Table rows....63
Desktop or Shelf Installation ....11
Device....45
Port Mirroring....86
Device Error....46
Device Global Parameters ....69
Device Port Properties 80, 87
Device set as default 57
Device Software Refresh 237
Device Tuning - General tab....230
Device Tuning - IP tab....231
Device Tuning - IPM tab 232
Device Tuning - IPX tab....231
Dynamic filtering ......26
Edit Device List 56
Editing Table rows....62
Egress port 32
Element Statistics....210
Erasing Tables 64
Error Bar 50
Error Log 46
Fast Ethernet Technology 6
File-Configuration File 64
Filtering Database....26
Forward Delay 29
Front Panel....15
Global Parameters
Contact Person....69
Hardware Software version 70
Identification....69
Name....69
Software version 70
Time....70
Global Parameters
Location 69
GUI 36,48
GVRP Information 94
GVRP Parameters ....90
GVRP Timers Control 92
Hardware requirements....37
heat dissipation 11
Hello Time....29
Hub to Switch, connecting the....21
Identifying External Components....15–20
IGMP 157
Cache Table....160
Interface Table 158
Operating Parameters....157
Illustration of STA....28
Ingress port 32
Inserting Table rows 63
Installation requirements ....37
IP Addresses and SNMP Community Names ..24
IP ARP table 146
IP DHCP 150
IP DHCP Parameters ....150
IP Interface Parameters..121, 128, 129, 130, 136, 137, 140, 141, 142, 144, 146, 149, 150
Address 122
Broadcast Type 122
Forward Broadcast 122
ICMP Parameters 123, 124
If Number.... 122
Network Mask.... 122
OSPF Parameters 123, 126
RIP Parameters.... 123, 125
IP Operating Parameters....121
IP OSPF Area table....139
IP OSPF II....135
IP OSPF Link State Database ....140
IP Parameters
ARP Proxy 121
ICMP error messages 121
Inactive ARP Time Out.... 121
Redundancy Admin Status.... 121
IP RIP Filter....130
IP RIP Global Filter 131
IP RIP Interface Filter....134
IP Statistics ......215
IP TCP Connection table 155
IP TCP General Parameters....155
IP UDP Relay table....152
IPM
PIM 164
PIM Parameters.... 164
Routing Parameters 157
Routing Table 170
IP-OSPF Interface Parameters....137
IPX RIP Circuit Filter....181
IPX RIP Global Filter 178
IPX Routing table 188
IPX SAP Circuit Filter....185
IPX SAP Global Filter 183
IPX SAP table....191
IPX Statistics 217
Join Time 93
Leave All Time 93
Leave Time 93
LED Indicators....19
Legend 214
Lower Bridge Identifier 27
MAC-based VLANs ....30
Main Window 45
Main Window options ....45
Management Information Base (MIB) ......25
Max. Age Time 29
Menu Bar 49
MIB's Object-Identity (OID)......25
Mirrored Port 87
Modify Device information ....57
Network loop detection and prevention Spanning Tree Algorithm ....26
On-line Help 45
Options Configuration ....53
OSPF Interface Parameters table Edit .....138
Overview of this User's Guide ......v
Packet Forwarding....25
Parameters
Bridge Type 100
Software Type....67
System Date....70
System Time 70
Ping table 235
Polling Configuration 234
Port Context menu ....60
Port Level, STA Operation Level
Designated Port....27
Path Cost....27
Port Priority ......27
Root Bridge....27
Port Priority 29
Port Statistics 217
Port Trunking....29
Port-based VLANs....31
Power Failure....14
Power LEDs....59
QoS 196
Rack Installation 12
Rapid Spanning Tree 113
Rapid STP Port Table....113
RSTP Force Software version Table ......115
Read-only MIBs, Definition of....25
Read-write MIBs, Definition of....25
Reset Device 68
Router 120
Router IP....120
Router IPX....174
Routers....7
Running the BER/ASCII converter without Running ConfigMaster ....44
Security Community table ....194
Segments, Network....7
Services....229
Services Community Change ....235
Services Device Tuning....229
Services Event Log 233
Setting Options 50
Setup 11
Sharing Resources Across VLANs......31
Shortcuts 61
SNMP/TFTP Configuration....54
SNMP/TFTP Retries Field ....54
SNMP/TFTP Timout Field 54
Software requirements ....37
Spanning Tree
Spanning Tree Parameters.... 104, 110
Spanning Tree Port Table 108
Spanning Tree Algorithm (STA) 26
STA Operation Levels 27
On the Bridge Level.... 27
Standard MIB-II....25
Statistics....210
Statistics Alarm table....222
Statistics Graph....212
Statistics Graph - Alarm Definitions ......215
Statistics Graph - Display Configuration......214
Statistics Graph - Display Controls .....215
Statistics Graph - Graph Area....214
Statistics Graph - Graph Controls......214
Statistics Graph - Legend....214
Statistics Graph - Menu Bar ......213
Statistics Graph - Other Controls......215
Statistics Graph - Tool Bar 214
Statistics Interface Statistics ......215
Statistics Log table....228
Statistics table 224
Status Bar....50
Switch Management Concepts ......24
Switch to 10 Base-T hub, connecting the .....21
Switch to 100Base-TX hub, connecting the .....22
Switching Technology 7
Tables....62
Tagging 32
Third-party vendors' SNMP software .....25
Toolbar Icons 49
Trap Configuration 52, 228
Trap Date and Time 52, 226
Trap Information....52, 226
Trap Number....52, 226
Trap Severity 52, 226
Trap Source....52, 226
Trap Type
Authentication Failure 25
Cold Start....24
Link Change Event 25
Traps 24
Traps displayed....53, 228
Traps stored ....53, 228
Traps Table 51
Traps, definition of ....24
Troubleshooting....43
Cannot View Tables When Using A Browser .....44
ConfigMaster.bat does not activate ConfigMaster......44
Disabling a Proxy Server ....44
Local Internet Use....44
Poor Web Performance With Windows 95....43
Very Slow Directory Discovery....43
Unicast ....101
Global Forwarding ....101
Unicast Forward Table....103
Uninstalling ConfigMaster 43
Unknown Device Error....47
Unpacking....11
Unpacking and Setup....11–14
Untagging 32
User-Changeblel Parameters
Bridge Forward Delay 28
Bridge Hello Time 27
Bridge Max Age 28
Bridge Priority 27
Port Priority 28
User-Changeblel Parameters ......27
ventilation 11
Version Check 60
Version Unknown Error 47
VLAN 30
VLAN Port Based....74, 75, 78
VLAN Protocol Based....78
VLAN Segmentation ....31
VLANs Spanning Multiple Switches ......32
Zoom View 36
Zoom View color-codes 58
Zoom View LEDs....59
Zoom View Open 57
Zoom View Refresh....234
Zoom View Refreshing....60
Australia D-Link Australasia
Unit 16, 390 Eastern Valley Way, Roseville, NSW 2069 Australia
TEL: 61-2-9417-7100 FAX: 61-2-9417-1077 TOLL FREE (Australia): 1800-177100
TOLL FREE (New Zealand): 0800-900900
URL: www.dlink.com.au E-MAIL: support@dlink.com.au & info@dlink.com.au
Level 1, 434 St. Kilda Road, Melbourne, Victoria 3004 Australia
TEL: 61-3-9281-3232 FAX: 61-3-9281-3229 MOBILE: 0412-660-064
Canada D-Link Canada
2180 Winston Park Drive, Oakville, Ontario, L6H 5W1 Canada
TEL: 1-905-829-5033 FAX: 1-905-829-5095 BBS: 1-965-279-8732
TOLL FREE: 1-800-354-6522 URL: www.dlink.ca
FTP: ftp.dlinknet.com E-MAIL: techsup@dlink.ca
Chile D-Link South America
Isidora Goyeechea 2934 of 702, Las Condes, Santiago, Chile, S. A.
TEL: 56-2-232-3185 FAX: 56-2-232-0923 URL: www.dlink.cl
E-MAIL: ccasassu@dlink.cl & tsilva@dlink.cl
China D-Link China
2F, Sigma Building, 49 Zhichun Road, Haidan District, 100080 Beijing, China
TEL: 86-10-88097777 FAX: 86-10-88096789 URL: www.dlink.com.cn
E-MAIL: liweii@digitalchina.com.cn
Denmark D-Link Denmark
Naverland 2, DK-2600 Glostrup, Copenhagen, Denmark
TEL: 45-43-969040 FAX:45-43-424347 URL: www.dlink.dk E-MAIL: info@dlink.dk
Egypt D-Link Middle East
7 Assem Ebn Sabet Street, Heliopolis, Cairo, Egypt
TEL: 20-2-635-6176 FAX: 20-2-635-6192 URL: www.dlink-me.com
E-MAIL: support@dlink-me.com & fateen@dlink-me.com
Finland D-Link Finland
Thlli-ja Pakkahuone
TEL: 358-9-622-91660 FAX: 358-9-622-91661 URL: www.dlink-fi.com
France D-Link France
Italy D-Link Mediterraneo Srl/D-Link Italia
Via Nino Bonnet n. 6/b, 20154, Milano, Italy
TEL: 39-02-2900-0676 FAX: 39-02-2900-1723 URL: www.dlink.it E-MAIL: info@dlink.it
Japan D-Link Japan
10F, 8-8-15 Nishi-Gotanda, Shinagawa-ku, Tokyo 141, Japan
TEL: 81-3-5434-9678 FAX: 81-3-5434-9868 URL: www.d-link.co.jp
E-MAIL: kida@d-link.co.jp
Netherlands D-Link Benelux
Fellenoord 1305611 ZB, Eindhoven, the Netherlands
TEL: 31-40-2668713 FAX: 31-40-2668666 URL: www.d-link-benelux.nl
Norway D-Link Norway
Waldemar Thranesgt. 77, 0175 Oslo, Norway
TEL: 47-22-991890 FAX: 47-22-207039
Russia D-Link Russia
Michurinski Prospekt 49, 117607 Moscow, Russia
TEL: 7-095-737-3389 & 7-095-737-3492 FAX: 7-095-737-3390 URL: www.dlink.ru
E-MAIL: vl@dlink.ru
Singapore D-Link International
1 International Business Park, #03-12 The Synergy, Singapore 609917
TEL: 65-774-6233 FAX: 65-774-6322 E-MAIL: info@dlink.com.sg
URL: www.dlink-intl.com
South Africa D-Link South Africa
102 - 106 Witchhazel Avenue, Einstein Park 2, Block B, Highveld Technopark,
Centurion, South Africa
TEL: 27 (0) 12-665-2165 FAX: 27 (0) 12-665-2186 URL: www.d-link.co.za
E-MAIL: attie@d-link.co.za
Spain D-Link Iberia
C/Sabino De Arana, 56 Bajos, 08028 Barcelona, Spain
TEL: 34 93 4090770 FAX: 34 93 4910795 URL: www.dlinkiberia.es
E-MAIL: info@dlinkiberia.es
Sweden D-Link Sweden
P. O. Box 15036, S-167 15 Bromma, Sweden
TEL: 46-(0) 8-564-61900 FAX: 46-(0) 8-564-61901 E-MAIL: info@dlink.se
URL: www.dlink.se
Taiwan D-Link Taiwan
2F, No. 119 Pao-Chung Rd, Hsin-Tien, Taipei, Taiwan
TEL: 886-2-2910-2626 FAX: 886-2-2910-1515 URL: www.dlinktw.com.tw
E-MAIL: dssqa@tsc.dlinktw.com.tw
Turkey D-Link Middle East
Deniz Bilgisayar, Buyukdere Cad. Naci Kasim Sk., No. 5 Mecidiyekoy, Istanbul, Turkey
TEL: 90-212-213-3400 FAX: 90-212-213-3420 E-MAIL: smorovati@dlink-me.com
U.A.E. D-Link Middle East
CHS Aptec (Dubai), P.O. Box 33550 Dubai U.A.E.
TEL: 971-4-366-885 FAX: 971-4-355-941 E-MAIL: Wxavier@dlink-me.com
U.K. D-Link Europe
4th Floor, Merit House, Edgware Road, Colindale, London NW9 5AB United Kingdom
TEL: 44 (0) 20-8731-5555 FAX: 44 (0) 20-8731-5511 BBS: 44 (0) 181-235-5511
URL: www.dlink.co.uk E-MAIL: info@dlink.co.uk
U.S.A. D-Link U.S.A.
53 Discovery Drive, Irvine, CA 92618, USA
TEL: 1-949-788-0805 FAX: 1-949-753-7033 BBS: 1-949-455-1779 & 1-949-455-9616
INFO: 1-800-326-1688 URL: www.dlink.com
E-MAIL: tech@dlink.com & support@dlink.com
Registration Card
Print, type or use block letters.
Your name: Mr./Ms
Organization:
Dept.
Your title at organization:
Telephone:
Fax:
Organization's full address:
Country:
Date of purchase (Month/Day/Year):
| Product Model | Product Serial No. | * Product installed in type of computer (e.g., Compaq 486) | * Product installed in computer serial No. |
(* Applies to adapters only)
Product was purchased from:
Reseller's name:
Telephone:
Fax:
Reseller's full address:
Answers to the following questions help us to support your product:
- Where and how will the product primarily be used?
□Home □Office □Travel □Company Business □Home Business □Personal Use
- How many employees work at installation site?
□1 employee □2-9 □10-49 □50-99 □100-499 □500-999 □1000 or more
- What network protocol(s) does your organization use?
□XNS/IPX □TCP/IP □DECnet □Others
- What network operating system(s) does your organization use?
□D-Link LANsmart □Novell NetWare □NetWare Lite □SCO Unix/Xenix □PC NFS □3Com 3+Open
□Banyan Vines □DECnet Pathwork □Windows NT □Windows NTAS □Windows '95
□Others
- What network management program does your organization use?
□D-View □HP OpenView/Windows □HP OpenView/Unix □SunNet Manager □Novell NMS
□NetView 6000 □Others
- What network medium/media does your organization use?
□Fiber-optics □Thick coax Ethernet □Thin coax Ethernet □10BASE-T UTP/STP
□100BASE-TX □100BASE-T4 □100VGAnyLAN □Others
- What applications are used on your network?
□Desktop publishing □Spreadsheet □Word processing □CAD/CAM
□Database management □Accounting □Others
- What category best describes your company?
□Aerospace □Engineering □Education □Finance □Hospital □Legal □Insurance/Real Estate □Manufacturing
□Retail/Chainstore/Wholesale □Government □Transportation/Utilities/Communication □VAR
□System house/company □Other
- Would you recommend your D-Link product to a friend?
□Yes □No □Don't know yet
- Your comments on this product?


D-Link®
Filename: DES-6300 User's Guide final 4.1.doc
Directory: C:\Documents and Settings\Michael Lee\Desktop\DES-6300 User's Guide.final
Template: C:\Documents and Settings\Michael Lee\Application Data\Microsoft\Templates\Normal.dot
Title:
Subject:
Author: CT Snow
Keywords:
Comments:
Creation Date: 2002/9/26 PM 08:42
Change Number: 2
Last Saved On: 2002/9/26 PM 08:42
Last Saved By: Michael Lee
Total Editing Time: 8 Minutes
Last Printed On: 2002/9/26 PM 08:44
As of Last Complete Printing
Number of Pages: 252
Number of Words: 49,472 (approx.)
Number of Characters: 281,991 (approx.)


- Copyright Statement
- FCC Warning
- CE Mark Warning
- Warnung!
- Introduction 6
- Unpacking and Setup.... 11
- Identifying External Components 15
- Connecting The Switch....21
- Switch Management Concepts....24
- ABOUT THIS GUIDE
- Conventions
- Overview of this User's Guide
- INTRODUCTION
- Fast Ethernet Technology
- Gigabit Ethernet Technology
- Switching Technology
- Features
- Chassis
- Switch Modules
- CPU Module
- Layer 2 support includes:
- Layer 3 support includes:
- Optional Modules:
- DES-6303 10BASE-T/100BASE-TX Module
- DES-6304 100BASE-FX (MT-RJ) Module
- DES-6305 100BASE-FX (SC) Module
- DES-6306 1000BASE-SX (SC) Module
- DES-6307 1000BASE-LX (SC) Module
- DES-6308 1000BASE-T (RJ-45) Module
- DES-6309 GBIC Module
- Power Supply Modules
- 2
- UNPACKING AND SETUP
- Unpacking
- Setup
- Desktop or Shelf Installation
- Rack Installation
- Installing Modules
- Connecting a Terminal
- Power on
- Power Failure
- 3
- IDENTIFYING EXTERNAL COMPONENTS
- Front Panel
- Side Panels
- Optional Plug-in Modules
- DES-6305 100BASE-FX (SC) Gigabit Module
- DES-6306 1000BASE-SX (SC) Gigabit Module
- DES-6307 1000BASE-LX (SC) Gigabit Module
- LED Indicators
- 4
- CONNECTING THE SWITCH
- Switch to End Node
- Switch to Hub or Switch
- 10BASE-T Device
- 100BASE-TX Device
- 1000BASE-T Device
- 100BASE-FX Device
- 1000BASE-SX Device
- 1000BASE-LX Device
- 5
- SWITCH MANAGEMENT CONCEPTS
- IP Addresses and SNMP Community Names
- Traps
- MIBs
- Packet Forwarding
- Aging Time
- Filtering Database
- Spanning Tree Algorithm
- STA Operation Levels
- On the Bridge Level
- On the Port Level
- User-Changeable STA Parameters
- Illustration of STA
- Port Trunking
- VLANs & Broadcast Domains
- MAC-based Broadcast Domains
- 802.1Q VLANs
- 802.1Q VLAN Segmentation
- Sharing Resources Across 802.1Q VLANs
- 802.1Q VLANs Spanning Multiple Switches
- VLANs Over 802.1Q-compliant Switches
- Port-based VLANs
- Broadcast Storms
- Segmenting Broadcast Domains
- Eliminating Broadcast Storms
- 6
- USING CONFIGMASTER
- Installation
- General System Requirements
- Hardware Requirements
- Software Requirements
- or
- Note for Windows 2000 users only:
- Installing ConfigMaster
- To install ConfigMaster:
- Uninstalling ConfigMaster
- To uninstall ConfigMaster:
- Reinstalling ConfigMaster
- To re-install ConfigMaster:
- Troubleshooting
- Very Slow Directory Discovery
- Poor Web Performance With Windows 95
- Cannot View Tables When Using A Browser
- Local Intranet Use
- To disable the Proxy server:
- To configure the Internet Proxy with a Web server ID:
- ConfigMaster.bat Does Not Activate ConfigMaster
- Running the BER/ASCII Converter Without Running ConfigMaster
- Starting ConfigMaster
- To start the ConfigMaster application:
- Error Log
- Device Error
- Unknown Device
- Version Unknown
- Using ConfigMaster Windows
- Menu Bar
- Toolbar
- Error Bar
- Status Bar
- Setting ConfigMaster Options
- Viewing the General Traps Table
- To view the General Traps Table:
- Configuring Trap Parameters
- General Options Configuration
- SNMP/TFTP Configuration
- To configure the SNMP/TFTP:
- Configuration
- Converting Files
- Edit the Configuration File:
- Editing the Device List
- Adding New entry to Device List
- Making a Device the Default
- Modify a Device
- To Modify a device:
- Deleting a Device
- To delete device:
- The Front Panel Display
- Opening the Front Panel Display
- To open the front panel display:
- Front Panel Display Toolbar
- Understanding Front Panel Display Colors
- Understanding the Front Panel Display LEDs
- Front Panel Display Mode LEDs
- Device Front Panel Display Power LEDs
- Front Panel Display Card LEDs
- View Port Status
- To view a specific port status:
- Refreshing the Front Panel Display
- To refresh the front panel display:
- ConfigMaster Shortcuts
- Using Tables
- Editing Table Rows
- To edit an existing table row:
- Click
- Click
- Inserting Table Rows
- To add a new table row:
- Click
- Click
- Deleting Table Rows
- To delete a table row:
- Erasing Tables
- To erase an entire table:
- Working With Configuration Files
- To save (or backup) the configuration files in this directory:
- Send Configuration To Device
- Get Configuration From Device
- To save (or backup) the modified configuration files:
- Configuration File - Conversion
- Update Device Software
- To update the configuration device software:
- Exit
- Managing the Device
- To reset a device:
- Device Global Parameters
- To display the Global Parameters screen:
- To edit an Identification tab field:
- To edit a Time tab field:
- Device Features
- To display the Device Features screen:
- Configuring VLANs
- Working With VLANs
- VLAN Parameters
- To display the device VLAN Parameters window:
- To edit the VLAN Parameters:
- VLAN Table Per Port
- To display the VLAN Table window:
- To add new VLANs:
- To delete ports from the Port Table:
- To edit Existing VLANs:
- To delete Existing VLANs:
- VLAN Table Per Port and Protocol
- Ethernet User-Defined Protocols
- To display the Ethernet User Defines VLAN window:
- To add a new Ethernet user-defined VLAN:
- To edit an existing Ethernet user-defined VLAN:
- To delete an Ethernet user-defined VLAN:
- Configuring Ports
- Port Properties
- To display the Port Properties screen:
- To edit a Port Properties Main tab field:
- To edit an Other tab field:
- Port Mirroring
- To enable port mirroring on a device:
- Storm Control
- To display the Storm Control Parameters window:
- To display the Storm Control Table window:
- To edit an existing Storm Control entry:
- Configuring GVRP and Trunking
- GVRP
- To configure the GVRP feature:
- To increase the number of Maximum GVRP VLANs and to reconfigure the GVRP protocol:
- Consideration Concerning STP And GVRP Operation
- GVRP Parameters
- To display the GVRP Parameters window:
- To enable a GVRP on a device:
- GVRP Timers Control
- To Edit a Timer Control:
- GVRP Information
- To display the GVRP Information window:
- Trunk
- Trunk Parameters
- To display the Trunk Parameters window:
- Trunk Table
- To display the Trunk Port Table:
- To Add or Edit the Aggregated Port List Port field:
- Trunking Port Table
- To display the Trunking Port Table:
- Trunk Balance Table
- To display the Trunk Balance Table:
- Configuring Bridging
- Operating Parameters
- To display the Bridge Operating Parameters window:
- To edit the Forwarding Table Aging Time field:
- Unicast
- Unicast Global Forwarding Table
- To display the Unicast Global Forwarding Table:
- To add a new entry in the Unicast Global Forwarding Table:
- To edit an entry in the Global Forwarding Table:
- To delete an entry in the Global Forwarding Table:
- Unicast Forward Table Size
- To display the Unicast Forward Table Size Window:
- Spanning Tree
- STP per Device
- Parameters
- To display the Spanning Tree Parameters window:
- Spanning Tree Port Table
- To display the Spanning Tree Port Table:
- To edit an entry in the Spanning Tree Port Table:
- STP per VLAN
- Spanning Tree Parameters
- Spanning Tree Extended Port Table
- To display the Spanning Tree Extended Port Table:
- Rapid Spanning Tree
- Rapid STP Port Table
- To edit an entry in the Rapid STP Port Table:
- Rapid STP Force Version Table
- To display the Rapid STP Force Version Table:
- To edit an entry in the Rapid STP Force Version Table:
- Traffic Control
- Traffic Control Port Priority Table
- To edit an Traffic Control Port Priority Table entry:
- Traffic Class Table
- To display the Traffic Class Table:
- To edit the Traffic Class Table:
- Priority Group Table
- Configuring Routing
- IP
- To display the IP Operating Parameters window:
- To edit IP Router operating parameter fields:
- Interface Parameters
- To display a device IP Router Interfaces:
- To add new a device IP interface:
- To edit a a device IP interface:
- To delete a a device IP interface:
- To display the ICMP Interface Parameters window:
- To edit ICMP Interface Parameters fields:
- To display the RIP Interface Table Edit window:
- To edit RIP Parameters window fields:
- To display the OSPF Interface Table Edit window:
- To edit OSPF Parameter fields:
- RIP
- To display RIP Parameters:
- To edit RIP Parameter fields:
- RIP Interface Parameters
- To display the RIP Interface Table:
- To edit RIP Interface Table fields:
- RIP Filters
- To display the RIP filters:
- To display IP RIP Global Filter Table:
- To add a global RIP filter:
- To edit a global RIP filter:
- To delete a global RIP filter:
- To display IP Interface RIP Filter Table:
- To add a RIP interface filter:
- To edit a RIP interface filter:
- To delete a RIP interface filter:
- OSPF II
- To display OSPF parameters:
- To edit OSPF parameters:
- OSPF Interface Parameters
- To display the OSPF Interface Table:
- To edit the OSPF Interface Table:
- Area Table
- To display the OSPF Area Table:
- To add an OSPF area:
- To edit an OSPF Area Table entry:
- To delete an OSPF Table entry:
- Link State Database
- To display the Link State Database:
- External Link State Database
- Neighbors Table
- To display a selected OSPF neighbor list:
- Routing Table
- To add an IP Routing entry:
- To edit an IP Routing entry:
- To delete an IP Routing entry:
- ARP Table
- To add a Global ARP Table entry:
- To edit a Global ARP Table entry:
- To delete a Global ARP Table entry:
- IP Redundancy
- To display the IP Redundancy Table:
- To add an IP Redundancy Table entry:
- To edit an IP Redundancy Table entry:
- To delete an IP Redundancy Table entry:
- DHCP
- DHCP Relays Table
- To display the DHCP Relays Table:
- To add a DHCP Relays Table entry:
- To edit a DHCP Relays Table entry:
- To delete a DHCP Relay Table entry:
- UDP Relay
- To display the UDP Relay Table:
- Table 6-6. UDP Ports
- To add a UDP Relay Table entry:
- To delete a UDP Relay Table entry:
- TCP General Parameters
- To display the TCP General Parameters:
- TCP Connections Table
- To display the TCP Connections Table:
- To delete a TCP Connection Table entry:
- IPM
- IPM Operating Parameters
- To display the IPM Operating Parameters window:
- To enable IPM routing on a device:
- IGMP
- IGMP Operating Parameters
- To display the IGMP Operating Parameters window:
- IGMP Interface Table
- To display the IGMP Interface Table:
- To add an IGMP Interface entry:
- To edit an IGMP Interface entry:
- To delete an entry in the IGMP Interface Table:
- IGMP Cache Table
- To display the Cache Table:
- Filter
- IGMP Filter Enable
- To display the IGMP Filter Enable window:
- To enable IGMP filtering on a device:
- IGMP Filter Table
- To display the IGMP Filter Table:
- To add an IGMP Filter entry:
- To edit an IGMP Filter entry:
- To delete an entry in the IGMP Filter Table:
- PIM
- To display the PIM Parameters window:
- PIM Interface Table
- To display the PIM Interface Table:
- To add an PIM Interface Table entry:
- To edit an PIM Interface Table entry:
- To delete an entry in the PIM Interface Table:
- PIM Neighbor Table
- To display the PIM Neighbor Table:
- PIM Route Table
- To display PIM Route Table:
- PIM IPM Route Next Hop
- IPM Routing
- IPM Routing Table
- To display the IPM Routing Table:
- IPM Route Next Hop
- To display the IPM Route Next Hop table:
- IPX
- To add an IPX Router Interface entry:
- To edit an IPX Router Interface entry:
- To delete an IPX Router Interface entry:
- RIP/SAP Filter
- To display the RIP Global Filter Table:
- To add a RIP Global filter:
- To edit a RIP Global filter:
- To delete a RIP Global filter:
- To display the RIP Circuit Filter Table:
- To add a RIP Circuit filter:
- To edit a RIP Circuit filter:
- To delete a RIP Circuit filter:
- To display the SAP Global Filters:
- To add a SAP Global filter:
- To edit a SAP Global filter:
- To delete a SAP Global filter:
- To display the SAP Circuit Filters:
- To add a SAP Circuit filter:
- To edit a SAP Circuit filter:
- To delete a SAP Circuit filter:
- IPX Routing Table
- To display the IPX Routing Table:
- To add an IPX Routing Table entry:
- To edit an IPX Routing Table entry:
- To delete an IPX Routing Table entry:
- IPX SAP Table
- To display the SAP Table:
- To add an IPX SAP Table entry:
- To edit an IPX SAP Table entry:
- To delete an IPX SAP Table entry:
- Configuring Security Options
- Community Table
- To display the Community Table:
- To add a Community Table entry:
- To edit a Community Table entry:
- To delete a Community Table entry:
- Configuring Quality of Service
- Global Parameters
- To display the QOS Global Parameters window:
- To enable a policy on a device:
- Profile Table
- To display the Profile Table:
- To add a new profile:
- To edit a profile:
- To delete a profile:
- Routed IP
- IP Classification Fields
- To display the IP Classification Fields window:
- To Define the IP Classification Fields
- IP Rules Table
- To display the IP Rules Table:
- To add a new rule in IP Rules Table:
- To edit a rule:
- To delete a rule:
- Working With Statistics
- Element Statistics
- To display Element Statistics:
- Tool Bar
- Graph
- Legend
- Display Configuration
- Graph Controls
- Display Controls
- Alarm Definitions
- Other Controls
- Interface Statistics
- IP Statistics
- IPX Statistics
- To display IPX Interface Statistics:
- Port Statistics
- History
- History Control Table
- To display the History Control Table:
- To add an History Control Table entry:
- To edit an History Control Table entry:
- To delete an History Control Table entry:
- Ether History Table
- To display the Ether History Table:
- Alarm Table
- To set an Alarm:
- To display the Alarm Table:
- To edit an Alarm Table entry:
- To delete an Alarm Table entry:
- Statistics Table
- To display the Statistics Table:
- To add a Statistics Table entry:
- To delete a Statistics Table entry:
- Traps Table
- To view the Trap Files:
- To set an alarm when receiving traps:
- Log Table
- To generate the Statistics Log Table:
- Working With Services
- Device Tuning
- To display the Device Tuning window:
- To display the Device Tuning window IP tab:
- To display the Device Tuning window IPX tab:
- To display the Device Tuning window IPM tab:
- Event Log
- To display the Event Log:
- Refresh
- Polling Configuration
- Community Change
- To change a device community name:
- Ping
- To add an entry in the Ping Table:
- To edit a line in the Ping Table:
- To delete edit a line in the Ping Table:
- Refresh Device Software
- To refresh the device:
- TECHNICAL SPECIFICATIONS
- B
- SAMPLE CONFIGURATION FILE
- Commands:
- - Remark. When placed as the first character on a line, the entire line will be ignored by the switch. This allows items to be labeled, or unused commands to remain in the file so that the syntax will not be forgotten.
- Notes about the Configuration File:
- INDEX
- Trap Type
- User-Changeblel Parameters
- Australia D-Link Australasia
- Canada D-Link Canada
- Chile D-Link South America
- China D-Link China
- Denmark D-Link Denmark
- Egypt D-Link Middle East
- Finland D-Link Finland
- France D-Link France
- Italy D-Link Mediterraneo Srl/D-Link Italia
- Japan D-Link Japan
- Netherlands D-Link Benelux
- Norway D-Link Norway
- Russia D-Link Russia
- Singapore D-Link International
- South Africa D-Link South Africa
- Spain D-Link Iberia
- Sweden D-Link Sweden
- Taiwan D-Link Taiwan
- Turkey D-Link Middle East
- U.A.E. D-Link Middle East
- U.K. D-Link Europe
- U.S.A. D-Link U.S.A.
- Registration Card
- Product was purchased from:
- Answers to the following questions help us to support your product:
- D-Link®
Brand : D-LINK
Model : DES-6300
Category : Network switch