M2211 - Microphone NTi Audio - Free user manual and instructions
Find the device manual for free M2211 NTi Audio in PDF.

| Product Type | Measurement Microphone |
| Brand | NTi Audio |
| Model | M2211 |
| Dimensions (Diameter x Length) | Approx. 13.2 mm x 160 mm |
| Weight | Approx. 50 g (without cable) |
| Power Supply | Phantom power 48 V (IEC 61938) |
| Frequency Response | 20 Hz to 20 kHz ±1 dB |
| Sensitivity | 50 mV/Pa @ 1 kHz |
| Equivalent Noise Level | ≤ 30 dB(A) |
| Maximum SPL | 140 dB SPL (1% THD @ 1 kHz) |
| Output Connector | XLR-3M balanced |
| Main Applications | Acoustic measurements, room analysis, sound level calibration |
| Maintenance | Clean with soft dry cloth; avoid moisture; store in dry case |
| Safety Precautions | Do not drop or expose to extreme temperatures; use only with phantom power |
| Spare Parts & Reparability | Exchangeable capsules; refer to certified service center for repairs |
| General Information | Prepolarized condenser microphone; durable metal housing |
Frequently Asked Questions - M2211 NTi Audio
User questions about M2211 NTi Audio
0 question about this device. Answer the ones you know or ask your own.
Ask a new question about this device
Download the instructions for your Microphone in PDF format for free! Find your manual M2211 - NTi Audio and take your electronic device back in hand. On this page are published all the documents necessary for the use of your device. M2211 by NTi Audio.
USER MANUAL M2211 NTi Audio
natural_image
Line drawing of a medical or diagnostic device with labeled 'AUDIO' and 'OPERATING MANUAL' (no other text or symbols)XL2
OPERATING MANUAL
HANDHELD AUDIO AND
ACOUSTIC ANALYZER
Contact NTi Audio at
Headquarter 423 239 6060 info@nti-audio.com
Americas +1 503 684 7050 americas@nti-audio.com
China +86 512 6802 0075 china@nti-audio.com
Czech +420 2209 99992 czech@nti-audio.com
Germany +49 201 6470 1900 de@nti-audio.com
Japan +81 3 3634 6110 japan@nti-audio.com
South Korea +82 2 6404 4978 korea@nti-audio.com
United Kingdom +44 1438 870632 uk@nti-audio.com
www.nti-audio.com


NTi Audio AG
Im alten Riet 102, 9494 Schaan
Liechtenstein, Europe
is an ISO 9001:2015 certified company.
Firmware V4.33
Version 4.33.00 / Feb 20
All information subject to change without notice.
© All rights reserved.
® Minirator is a registered trademark of NTi Audio.
TM XL2, XL2-TA, EXEL, M2230, M2230-WP, M2211, M2215, M4261 and MA220 are trademarks of NTi Audio.
Made in Switzerland

Table of Contents

Table of Contents
-
Introduction ....5
-
Overview 7
Operation 9
The Screen Display 11
- Getting Started ....14
Power Supply 14
Attaching the Hand Strap.... 17
Unfolding the Stand 18
Connecting the XL2 18
Switching the XL2 On and Off....20
Select Measurement Function 20
Calibration prior Measurement....21
- Sound Level Meter 22
Overview 26
Sound Level Meter - Getting Started....34
RTA Measurement - Getting Started ....39
Reporting 43
Wav-File Recording....46
Events (optional) 49
Limits 56
Correction Value KSET....58
Locked Run Mode....62
- Acoustic Analyzer 64
FFT Analysis + Tolerance....64
Reverberation Time RT60....74
Polarity 86
Delay Time....90
1/12 Octave + Tolerance (optional)....96
Noise Curves (optional) 108
Speech Intelligibility STIPA (optional) 118
- Audio Analyzer 135
RMS / THD+N 135
Oscilloscope 138
- Vibration Meter....139
VibMeter / Spectrum 139
Overview 141
FFT Analysis + Tolerance.... 145
Oscilloscope 149
1/12 Octave + Tolerance (optional).... 150
-
Calibration 154
-
Profiles 161
-
Spectral Limits Option (Capture + Tolerances) .....168
-
System Settings....181

Table of Contents
Settings 181
Vibration 184
Scheduler....185
Options 187
Information 188
-
Data Management ..... 189
Record Voice Notes 195
Recall Measurements 201
Append Measurements 203 -
XL2 Projector PRO Software....208
-
XL2 Data Explorer (optional) 210
-
Building Acoustics (optional) 212
-
Room Acoustics (optional) 214
-
Sound Power (optional)......216
-
Unattended Noise Monitoring 218
-
Time Synchronization....222
-
Remote Measurement 226
-
Microphones 228
-
Further Information 232
My NTi Audio 232
Tips and Troubleshooting....233
Firmware Update 235
Options 236
Warranty Conditions 256
Service and Repairs 256
Calibration Certificate 257
Declaration of Conformity 259
-
Technical Data XL2 260
-
Technical Data Microphones .....270
-
Technical Data PreAmplifier....280
Appendix 281
Appendix 1: Standard - Optional Features .....281
Appendix 2: Factory Default Profiles .....285
Appendix 3: Description Sound Levels ....290
Appendix 4: Common Sound Levels .....295
Appendix 5: Vibration Meter Functions.... 301
Details IEC 61672 & IEC 61260 ....302
General Information 304
Class 1 Sound Calibrator ....307
Level Linearity....308
Level Linearity of Octaveband-Spectrum 310
Level Linearity of Third-Octaveband-Spectrum...... 311
Self-generated Noise with Microphone 312
Frequency Response Corrections at 250 - 20000 Hz 314
Frequency Weighting 317
Directional Response (dB) 318
Information for Calibration 322
Introduction

1. Introduction
Thank you for purchasing the XL2 Audio and Acoustic Analyzer. The XL2 Analyzer forms the unique combination of a state-of-the-art Sound Level Meter, a comprehensive Acoustic Analyzer as well as a powerful Audio Analyzer. The wide range of functionalities is tailored for:
Evacuation Systems•
- Speech Intelligibility
Electroacoustic Installations • - Installed Sound AV Installations
- Cinemas
Noise Measurement•
- Unattended Noise Monitoring
- Environmental Noise
- Occupational Health
- Vehicle Noise
- Sound Power
-
Noise Curves
-
Live Sound
- Sound Level Monitoring
- Front of House
- PA Rental
- Broadcast
Room & Building Acoustics•
- Room Acoustics
- Building Acoustics
- RT60 Reverberation Time
Industrial Quality Control
Condition Monitoring
How to Read this Manual
The XL2 push buttons are displayed as icons

☐, ☑, ☑. A detailed description of the push buttons is listed in the chapter [Overview - Operation].
Menu items displayed on the XL2 page screens are shown in this user manual by a bold font, e.g., SLMeter, Parameter, ...

Introduction
Product Configurations
The following items are included with the respective model:
| XL2 without Micro-phone: | XL2 Analyzer•Test Signal CD•USB cable•Li-Po battery•Hand strap•Operating manual• |
| XL2 + M2230: | XL2 Analyzer•M2230 Measurement Microphone•consisting of- Microphone PreAmplifier MA220- Microphone Capsule MC230 or MC230A50 mm Windscreen•Microphone-holder MH01 •with Adapter 5/8" - 3/8"Individual Frequency Response Chart•Test Signal CD•Li-Po battery•USB cable•Hand strap•Operating manual• |
| XL2 +M2211: | XL2 Analyzer•M2211 Measurement Microphone•consisting of- Microphone PreAmplifier MA220- Microphone Capsule for M221133 mm Windscreen•• Microphone-holder with Adapter 5/8" - 3/8"Test Signal CD•Li-Po battery•USB cable•Hand strap•Operating manual• |
| XL2 +M4261: | XL2 Analyzer•M4261 Measurement Microphone•33 mm Windscreen•• Microphone-holder with Adapter 5/8" - 3/8"Test Signal CD•Li-Po battery•USB cable•Hand strap•Operating manual• |
Overview

2. Overview
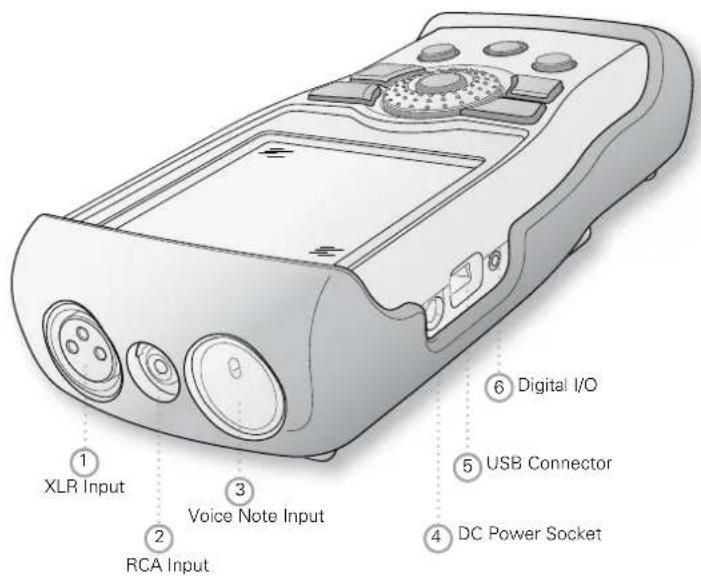
XL2 interfaces:

Overview
① XLR Signal Input
Either a balanced audio signal, an NTi Audio measurement microphone or the microphone pre-amplifier MA220 plug directly into the XLR input. The Automated Sensor Detection (ASD) technology reads the electronic data sheet of any connected NTi Audio device after the 48 V microphone phantom power is activated.
② RCA Input
Unbalanced audio signal input.
③ Voice Note Input
Internal microphone for recording voice notes and measuring polarity and delay time. For polarity measurements, an external microphone may also be used.
④ DC Power Socket
Socket for mains power adapter. Further details in the chapter Power Supply in this manual.
⑤ USB Connector
Mini-B USB connection, for accessing the SD Card.
⑥ Digital I/O
Programmable digital inputs/outputs.
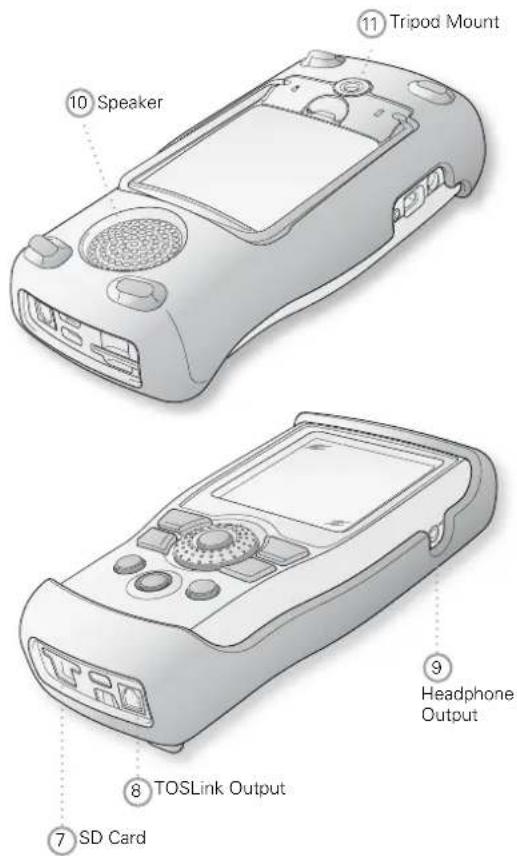
⑦ SD Card
For storing data, screenshots, voice notes, wav-files.
⑧ TOSLink Output
24 bit linear PCM audio signal output. For future use; not active at this time.
⑨ Headphone Output
The XLR/RCA input signals are routed to the headphone connector (3.5 mm Minijack; mono monitor wired to both channels of stereo jack). Connecting headphones mutes the internal speaker. To connect the headphone output directly to a line input, a load impedance < 8 kOhm is required for proper operation. This can be achieved by inserting a 1 kOhm resistance between tip and ground of the output jack.
10 Speaker
The XLR/RCA input signals are routed to the speaker. Press the speaker button 🔒 to toggle the speaker on/off. Press and hold the speaker button to access the volume control. Set the speaker level with the rotary wheel Ⓞ.
⑪ Tripod Mount
Mechanical mount for attaching the XL2 to a tripod or microphone stand.
Operation
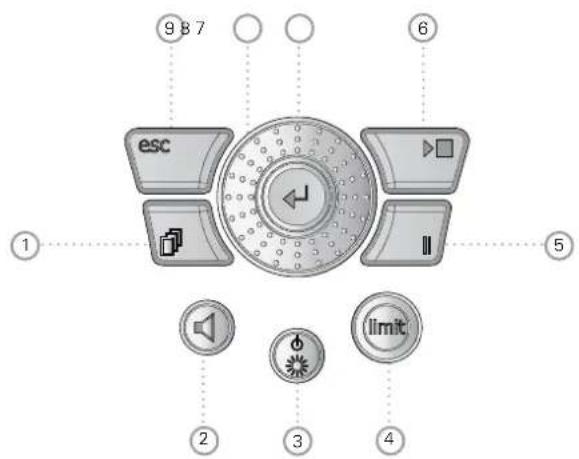
① Page Control
Switches among various screens depending on the menu function selected.
Overview

② Volume of Speaker and Headphone Output
- Press the button ⏻briefly to enable or disable the speaker.
The speaker is activated and the speaker or headphone icon appears in the upper menu bar.
Press and hold the speaker button 🔑.
A pop-up window for volume is displayed.

Overview
- Hold the speaker button ⬇ down and adjust the level of the speaker and headphone outputs with the rotary wheel Ⓞ. Digital gain control prevents gain increases beyond a level that will cause signal clipping. The maximum gain setting depends on the connected input signal.
-
The headphone output provides a linear output signal using the SLMeter function over a measurement range of 57 dB. The minimum Z-weighted sound pressure level at reference sensitivity is:
-
M2230: 58 dB
- M2211: 64 dB
- M4261: 66 dB
③ Power & Backlight
The power button ⏻ switches the instrument on. The XL2 is immediately ready for operation. Holding down the power button ⏻ for one second switches the XL2 off. Additionally, a brief press of the power button ⏻ toggles the backlight during operation.
④ Limit limit
- SLMeter: The limit button lights up green, yellow or red according to the settings in the Limit page. Press the limit button to access the Limit page. For more details visit the chapter Sound Level Meter: Limits.
FFT + Tol: • The limit button lights up green for results within tolerance and red for out-of-tolerance results.
Polarity: • The limit button lights up green at positive polarity and red at negative polarity.
1/12 Oct + Tol: • The limit button lights up green for results within tolerance and red for out of tolerance results.
⑤ Pause II
Pauses the current measurement. Press the pause button ☐ or the start/stop button ☑ continue the measurement. The data logging is continued in the function SLMeter/RTA during the pause period and listed in the log file.
⑥ Start/Stop
Starts and stops a measurement.
⑦ Enter
Confirms a selection.
8 Rotary Wheel
Selects the required measurement function or the individual measurement parameter.
⑨ ESC esc
Terminates an entry, returns to the top menu level or closes an open window.
The Screen Display
The XL2 displays the actual sound levels also in case of no measurement has been started. Any displayed averaged level refers to the previous measurement period. The XL2 shows four lines in case of no previous measurement period is applicable.
Display Contrast Setting
Hold down escape ⚠️ and turn the rotary wheel ⚠️ until the desired contrast is reached.
Updating of display
Numeric values•
Updated every 500ms independent of the measurement function. The maximum time span between the end of the measurement period and the first test result display is 500ms.
Graphs and spectra•
Updated every 50ms
The display is updated continuously during measurement.

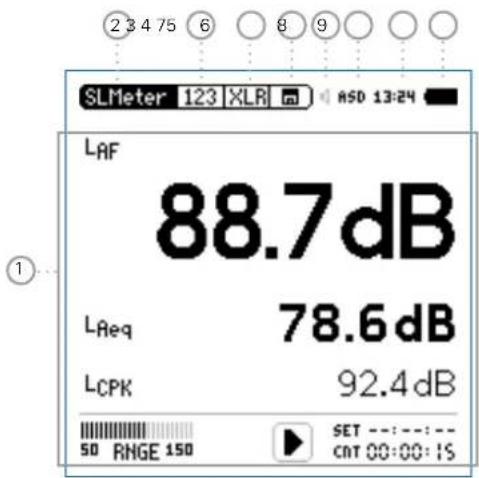
Overview
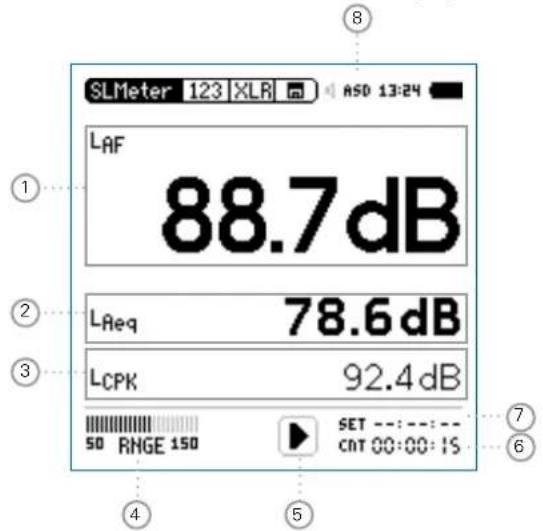
① Measurement Results
Individual level measurement results.
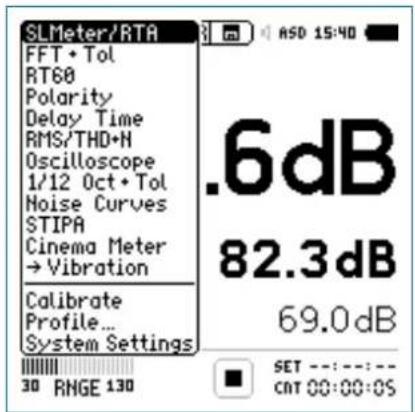
② Main Menu
SLMeter/RTA SPL & RTA Measurement
FFT + Tol FFT Analysis with optional Tolerance Management
RT60 Reverberation Time RT60
Polarity Polarity
Delay Time Delay Time
RMS/THD+N RMS Level and Distortion
Oscilloscope Scope
1/12 Oct + Tol Spectral Analysis with Tolerance Management (optional)
Noise Curves Noise Curves
STIPA Speech Intelligibility (optional)
Cinema Meter Calibration and verification of cinema loudspeaker systems (optional)
Calibrate Calibration Menu for microphone
Profile ... Store and load measurement profiles
System System Settings
③ Page Selector
Toggles between available measurement and result pages within the same function menu. Alternatively use the page button
④ Input Selector
Select XLR or RCA input connectors as the source.
⑤ Memory Menu
The memory menu is used for data storage management. One of the following symbols flashes before or after starting the measurement:
9-8-7 Time in seconds until instrument is settled and measurement will start.
RUN Indicates the ongoing measurement.
LOG Indicates the ongoing measurement with data logging.
AUD Indicates the ongoing measurement with data logging and audio recording.
Evt Indicates an ongoing triggered-event recording.
Overview

After a completed measurement, the memory symbol ☐ indicates a non-saved measurement report. Your measurement needs to be stored manually. For more details visit the chapter Data Management.
⑥ Speaker/Headphone
Indication of enabled rear speaker or headphone output.
⑦ Phantom Power Supply
48V The XL2 provides 48 V phantom power supply to the connection microphone or sensor.
ASD An NTi Audio measurement microphone with automated sensor detection ASD is connected. The XL2 reads the electronic data sheet of the microphone and switches the 48V phantom power automatically on
48V Phantom power is switched off.
⑧ Real-Time Clock
The real-time clock is set in the System menu.
⑨ Battery Symbol
The battery symbol indicates the battery status as follows:
Using rechargeable Li-Po battery:

Level indication 100% (U > 4.0 Volt). (Battery charges when mains adaptor connected)

Level indication: 75%: U = 3.9 - 4.0 Volt 50%: U = 3.8 - 3.9 Volt 25%: U = 3.7 - 3.8 Volt

Level indication 0% (U < 3.7 Volt). The battery is almost empty and must be recharged.

The battery is being recharged by the mains power adapter.

The XL2 is connected via USB to a computer. The battery charge level decreases slowly during XL2 usage.
Using standard AA batteries:
No level indication as long as U > 4.5 Volt.

Level indication 0% (U < 4.5 Volt). The batteries are almost empty and should be replaced.
Using mains or supply:
No indication of battery status.

Getting Started
3. Getting Started
Power Supply
The XL2 offers flexible power management options and can be operated either by
Replaceable, rechargeable lithium-polymer (Li-Po) battery • (included with the XL2 Analyzer)
4x AA-batteries•
Mains Power Adapter•
The new battery is charged to approximately 50% and should be fully charged before use with:
Battery Charger (optional) Charging Time: approx. 3 hours NTi Audio #: 600 000 332
Mains Power Adapter (optional) Charging Time: approx. 6 hours Leave the battery inside and switch off the XL2 Running the XL2 during charging prolongs the charging time. NTi Audio #: 600 000 333
USB Power from PC Charging Time: approx. 6 hours Switch off the XL2 ⚙ for charging. The charging power is equal or less than the power consumption.
Operation using Mains Power Supply
You can also operate the XL2 with the optional NTi Audio Mains Power Adapter. During such operation it is recommended to leave the batteries inside the instrument.

Mains Power Adapter
Electrically-isolated, linear DC power supply
- A decreased THD+N performance will occur with unbalanced input signals when using switching-type power supplies (approx. 3 dB).
- Non-NTi Audio power supplies may have further negative effects on measurements.
- Damage caused by using an inappropriate external DC supply is not covered by warranty.

DC Power supply specifications
• Voltage: 7.5 - 20.0 Volt
• Power: minimum 6 Watt
- Connector type: 2.1 x 5.5 x 9.5 mm
- Polarity: + - ● - - .
Getting Started

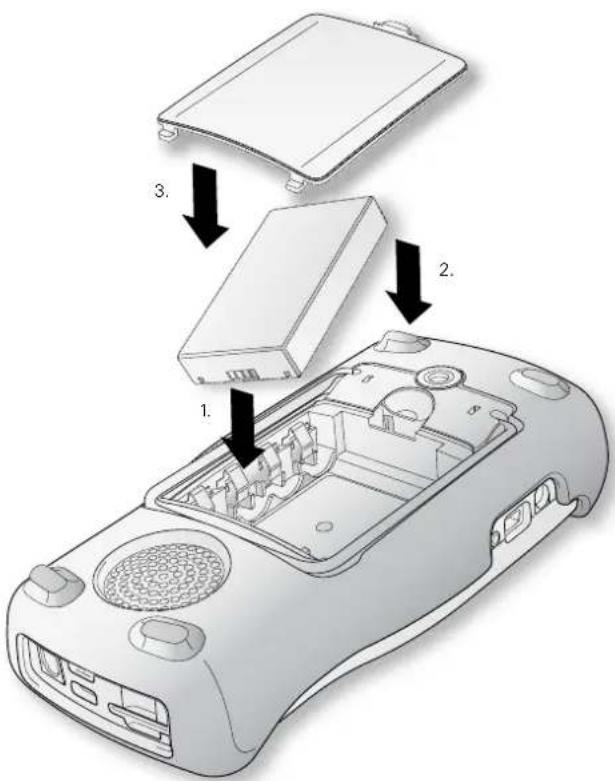
Rechargeable Li-Po Battery
Open the battery cover at the rear of the instrument.
Insert the rechargeable battery with the contacts edge first.
Close the battery cover.

Switch off the XL2 ^3 for faster recharging by mains power adapter or USB connection.

Caution
Switch the XL2 off prior opening the battery • cover in order to prevent any electronic discharges.
Avoid short-circuits.
Operate and charge the battery between 0°C and 45°C (32°F - 113°F).
Do not heat the battery above 60^ C.
Do not place the battery in or near fire.
- Do not solder directly on to the battery.
- Do not disassemble the battery.
- Do not insert the battery in reverse polarity.
- Remove the battery for applications with a connected mains power adapter over multiple weeks.

Getting Started
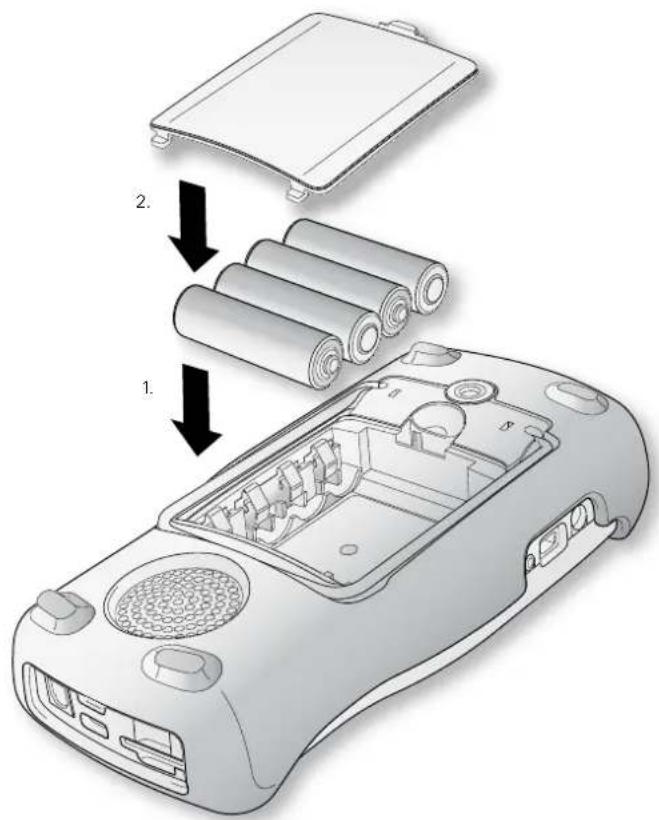
AA-Batteries
Alternatively, the XL2 can be powered by AA type batteries
Open the battery cover.
Insert 4 fully-charged AA batteries, observing correct polarity of the +/- indications in the battery compartment.

The polarity alternates with successive batteries.
Close the battery cover.
| Switch the XL2 off prior opening the battery• cover in order to prevent any electronic dis-charges.Use only similar batteries from the same • manufacturer.Replace discharged batteries with new ones.• Do not mix used and new batteries.•During operation, the battery temperature may increase noticeably. This is not a defect.Remove all batteries if the XL2 is not to be used over a long period of time. |
Getting Started

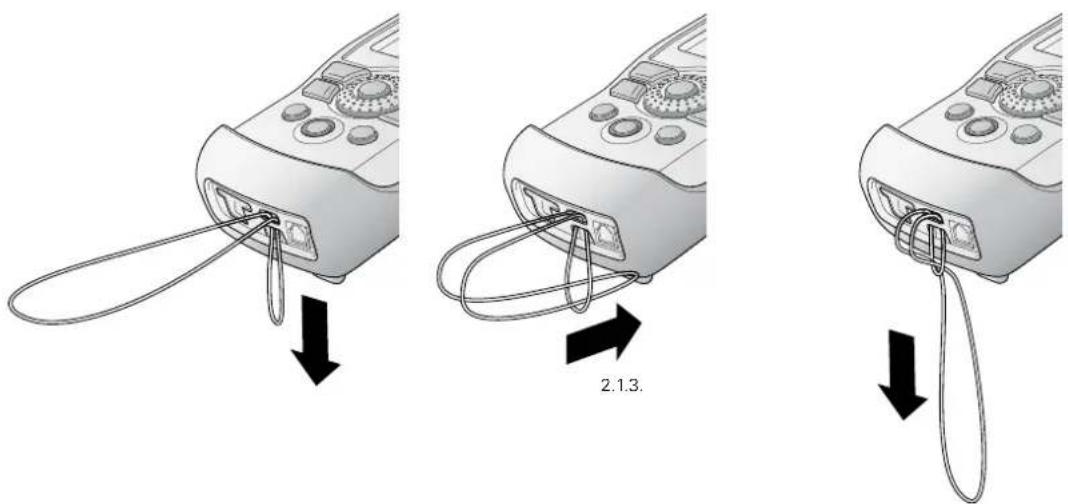
Attaching the Hand Strap
To avoid accidentally dropping the XL2, a hand strap is supplied with the instrument.
Pull the loop of the hand strap through the opening. Pull the other end of the hand strap through the loop. Pull the hand strap tight.

Getting Started
Unfolding the Stand
A convenient table stand is attached to the rear of the instrument.
Unfold the stand and rest the XL2 on a flat surface.
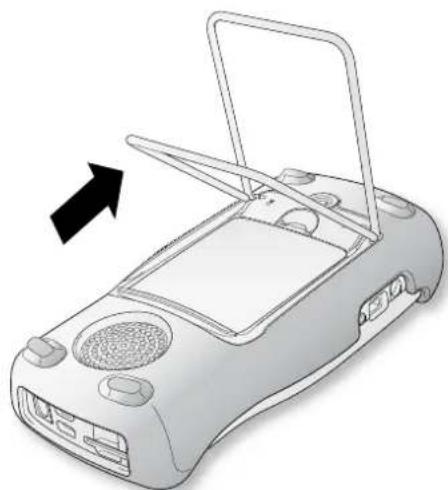
natural_image
Illustration of a portable electronic device with a black arrow pointing to the top panel (no text or symbols present)Connecting the XL2
Acoustic Measurements
Connect an NTi Audio measurement microphone to the XLR input connector of the XL2.
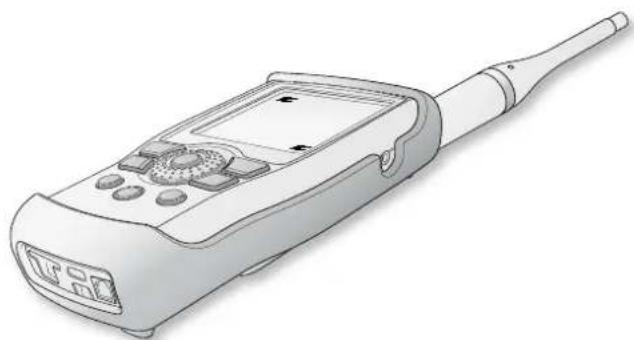
natural_image
Illustration of a handheld electronic device with a screen and antenna (no text or symbols visible)Getting Started

Audio Measurements: XLR Connection
Connect the source to the XL2 with an XLR cable.
Select the XLR input in the menu.
Audio Measurements: RCA Connection
Connect the source to the XL2 with an RCA (cinch) cable.
Select the RCA input in the menu.
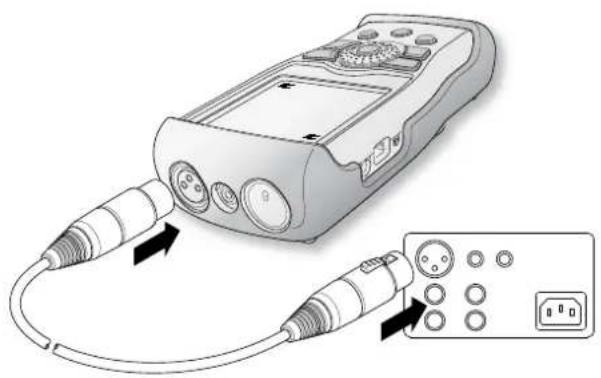
natural_image
Illustration of a handheld electronic device connected to a control panel with ports and buttons (no text or symbols present)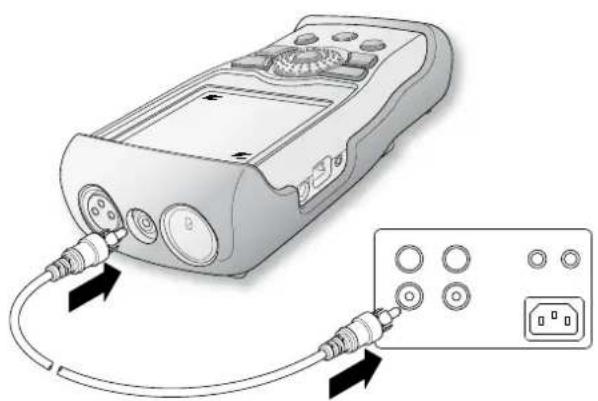
natural_image
Illustration of a handheld electronic device connected to an external power outlet (no text or symbols visible)
Getting Started
Switching the XL2 On and Off
Switching On the XL2
Press power ⚙ to switch on the XL2.
There is a brief sound of relays and the display illuminates.
Switching Off the XL2
Press power ⚙ and hold it down for one second to switch off the XL2.
Select Measurement Function
Navigate with the rotary wheel ⏻ to the main menu bar. Confirm with enter ⏻ to select the measurement function.
The main menu window opens
Main menu with enabled options
Scroll up/down with the rotary wheel to select the required function and confirm with enter
The measurement function is selected.
Getting Started

Setting the Parameters with the Rotary Wheel
Turn the rotary wheel ⚙ to navigate within the display screen.

The selected parameter is highlighted with a black backsults. round.
Confirm with enter 🔒.

The parameter display flashes and/or available parameters or settings are shown.
Turn the rotary wheel ⏻ to set the parameter or toggle with enter ⏻ through the settings.
Confirm with enter 🔍.

Now the parameter is set.
Calibration prior Measurement
We recommend the daily calibration of the XL2 Analyzer with the Sound Calibrator. This ensures accurate measurement re-
For more details see chapter [Calibration].

Sound Level Meter
4. Sound Level Meter
The XL2 provides, together with the measurement microphone, a precise sound level meter for monitoring live sound events and/or environmental noise.
The Type Approval Option upgrades the instrument to the XL2-TA, the sound level meter dedicated to certified measurements. The XL2 with the M2230 microphone forms a type approved sound level meter offering class 1 performance according IEC61672 (see chapter[Options and Accessories])
For example, Actual, Lmin, Lmax, Leq with frequency weighting A, C and Z and time weighting F and S can be measured at the same time. All measurement results are simultaneously available. You may log all acquired level information, including real-time information, onto the removable SD Card. To complete the documentation of the measured sound pressure levels, the XL2 offers wav-file recording, as well as the facility to add voice notes for each measurement. The XL2 measures correction values between the loudest point of the live event and the actual measurement positions in accordance with DIN 15905-5 and V-NISSG. In parallel with the wide band parameters, the XL2 measures the real-time spectrum either in 1/1 or 1/3 octave-band resolution. The RTA perfectly suits tasks such as optimization of sound systems
Extended Acoustic Pack (optional)
The Extended Acoustic Pack offers the following additional features for sound-level and acoustic measurements:
SLMeter/RTA function•
- Recording of linear wav-files (24 bit, 48 kHz)
- Percentiles for wide band and spectrum with flexible setting from 0.1% to 99.9%
- Sound Exposure Level LAE
- 100 ms logging
- RTA logging of Lmin and Lmax
- Event-triggered audio and data recording
- Time weighting: Impulse (Lxl, Lxleq with x = A, C, Z)
- True peak level in 1/1 and 1/3 octave resolution
- Clock-impulse maximum level (TaktMax) and values as specified in DIN 45645-1
- Impulsiveness detection in accordance with BS4142:2014 and NordTest ACOU 112
FFT function•
- High-resolution Zoom-FFT with selectable frequency ranges and resolution up to 0.4 Hz in the range of 5 Hz to 20 kHz
RT60 function•
- Reverberation time RT60 in 1/3 octave resolution
Sound Level Meter

The sound level meter offers different pages:
Page Selection using the Page Button
- Press page 📋 to toggle between the 123 SLMeter page and the RTA page.
Page Selection using the Rotary Wheel
- Select the page 123 SLMeter with the rotary wheel Ⓞ. Confirm with enter ⏻.
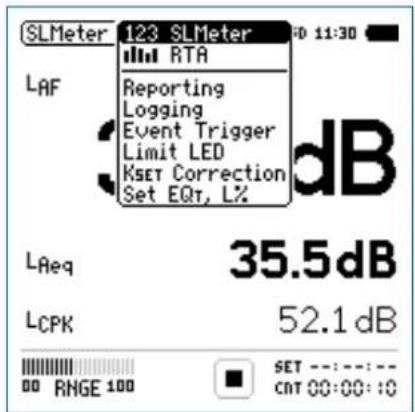
Menu with enabled options

You have selected the individual sound level meter page.
123 SLMeter: Sound Level Meter
Displays the selected broadband sound level results. You can change the font size of the result. Depending on the font size chosen, the XL2 shows 3 or 5 results simultaneously. Individual frequency weighting, time weighting, actual, minimum, maximum and correction values can be chosen for each displayed result.
RTA: Real-Time Spectrum
Displays the 1/3 or 1/1 octave spectrum of the selected sound level within the audio band. Additionally the wide band result is shown graphically by a bar.
Reporting: Report Setting
Here you set which sound pressure levels shall be stored in a .txt file after the completed measurement. Choose between:
ALL Stores all sound pressure levels.
Selected Stores up to 10 different individually-defined sound pressure levels.
For details refer to the chapter[Reporting].

Sound Level Meter
Logging: Setup of Data Logging
The XL2 features a powerful sound level meter data logger, which allows you to record all required sound level values during the measurement. In the logging page you set which sound pressure levels shall be logged over time. For details refer to the chapter Logging. Choose between:
ALL Logs all sound pressure levels.
Selected Logs up to 10 different individually-defined sound pressure levels.
Event Trigger: Event Setting (optional)
The event function is available with the optional Extended Acoustic Pack. The XL2 event feature offers the following functionalities:
Automated event triggered at noise levels above/below a preset value including setting markers for specific noise categories. Application example: Recording the noise level for LAF > 80 dB.
Event triggered by external key press of the XL2 Input Key-pad. You can utilize four keys (1-4) to categorize any noise of interest or noise to be later excluded in the post-processing. A typical application is categorizing any annoying industrial noise by persons living in the neighborhood.
Limit LED: Limit Setting
Here you set the function of the limit LED, thereby highlighting any sound level that exceeds the pre-set limits in orange or red color. Further, external peripherals are controlled by the optional Serial I/O Interface based on the sound level, such as displaying sound levels on a large external red-orange-green lamp. For details refer to the chapter Limits.
KSET Correction: Setup of Correction Values
This page provides a wizard to measure correction values, which could be helpful for compliant sound level monitoring of live events. It measures the correction values between the actual measurement position and the loudest position accessible by the audience. The XL2 displays and logs the selected sound pressure levels including the correction values, allowing the sound engineer to monitor the sound level at the loudest position in the audience. The measurement meets the requirements of the standards DIN15905-5 and V-NISSG. For details refer to chapter [Correction Value].
Sound Level Meter

Set EQt, L%: Selection of measured levels
This page allows setting the following levels:
Moving Time-average Sound Level•
Gliding Leq with selectable time window from one second to one hour. Four individual levels can be configured. This level is also called "running Leq,T" or "sliding Leq,T".
Percentile Sound Level•
- Allows the individual configuration of seven statistic levels from 0.1% to 99.9% (optional with Extended Acoustic Pack).
- Broadband Source for the calculation of the level statistics can be chosen from a set of different levels with either a frequency weighting A, C or Z. The time weightings F, S and the moving time-averaged sound level for one second are supported.

Sound Level Meter
Overview
Numeric Result Page
The numeric result page 123 SLMeter displays the selected broadband sound level results. You can change the font size of the result. Depending on the font size chosen, the XL2 shows three or five results simultaneously. Individual frequency weighting, time weighting, actual, minimum, maximum and correction values can be chosen for each displayed result.
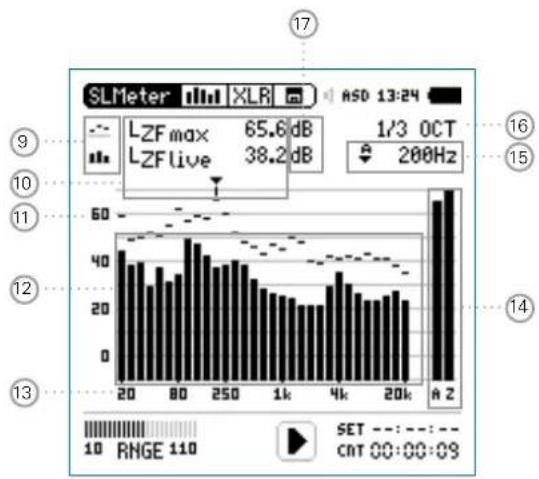
Real-Time Analyzer Page
The real-time analyzer page RTA measures and displays the 1/3 or 1/1 octave spectrum from 6.3 Hz to 20 kHz including wideband results. The real-time spectrum RTA is measured in parallel with the A and Z-weighted wideband levels.
bar
| Range | Frequency | |---|---| | 20-40 | 60 | | 40-60 | 55 | | 60-80 | 50 | | 80-100 | 45 | | 100-120 | 40 | | 120-140 | 35 | | 140-160 | 30 | | 160-180 | 25 | | 180-200 | 20 | | 200-220 | 15 | | 220-240 | 10 | | 240-260 | 5 | | 260-280 | 3 | | 280-300 | 2 | | 300-320 | 1 | | 320-340 | 1 | | 340-360 | 1 | | 360-380 | 1 | | 380-400 | 1 | | 400-420 | 1 | | 420-440 | 1 | | 440-460 | 1 | | 460-480 | 1 | | 480-500 | 1 | | 500-520 | 1 | | 520-540 | 1 | | 540-560 | 1 | | 560-580 | 1 | | 580-600 | 1 | | 600-620 | 1 | | 620-640 | 1 | | 640-660 | 1 | | 660-680 | 1 | | 680-700 | 1 | | 700-720 | 1 | | 720-740 | 1 | | 740-760 | 1 | | 760-780 | 1 | | 780-800 | 1 | | 800-820 | 1 | | 820-840 | 1 | | 840-860 | 1 | | 860-880 | 1 | | 880-900 | 1 | | 900-920 | 1 | | 920-940 | 1 | | 940-960 | 1 | | 960-980 | 1 | | 980-1000 | 1 | | RZ | A Z SET: - : - : - : - : - : - : - : - : - : - : - : - : - : - : - : - : - : - : - : - : - : - : - : - : - : - : - : - : - : - : - : - : - : - : - : - : - : - : - : - : - : - : - : - : - : - : - : - : - : - : - .NET: RNGE: IIO. CNT: QG: QG: QG: QG: QG: QG: QG: QG: QG: QG: QG: QG: QG: QG: QG: QG: QG: QG: QG: QG: QG: QG: QG: QG: QG: QG: QG: QG: QG: QG: QG: QG: QG: QGSound Level Meter

① Sound Level Result 1
All sound levels are measured and logged simultaneously. You select which sound levels should be displayed.
Change Parameter
Turn the rotary wheel ⏻ to select the parameter Lxx. Press enter ⏻ to open the selection menu and choose the wideband sound pressure level to be displayed. Turn the rotary wheel ⏻ to select the required test result parameters and confirm with enter ⏻.
Change Font Size
Turn the rotary wheel ⏻ to select the actual test result. Press enter ⏻ 1x, 2x or 3x to set the font size to small, medium or large.
The XL2 shows 3 sound levels on the display if a large font is chosen, otherwise it shows 5 sound levels.
② Sound Level Result 2 & 3
Follow the setting instructions for sound level result 1.
③ Sound Level Result 4 & 5
To display sound level results 4 & 5, choose a smaller font for all results. Follow the setting instructions for sound level result 1.
④ Input Range
The XL2 Analyzer provides three input ranges to accommodate the wide range of input signals. The individual ranges are based on the microphone sensitivity setting in the calibration menu of the XL2. For example at a sensitivity S=20mV/Pa the input ranges are
Low: 10 - 110 dBSPL•
Mid: 30 - 130 dBSPL•
High: 50 - 150 dBSPL•
Select the lowest possible input range according to the maximum level expected during the measurement; e.g., if the sound pressure will always be below 110 dBSPL, then select the lowest input range 10 - 110 dBSPL.
⑤ Run Indication
The run indication shows the measurement status running, paused or stopped. Various measurement settings are locked during ongoing measurements, such as changing the input ranging or the preset measurement time.

Sound Level Meter
⑥ Actual Measurement Time
Counts actual measurement time in hrs:min:sec. Supports time modes: continuous, single and (synchronized) repeat.
CNT Timer Mode Continuous
(applicable for standard measurements)
All values are recorded and monitored continuously after starting a measurement with start ▶■.
The actual measurement time is shown.
Timer Mode Single
Automatically stops the measurement after the pre-set measurement time.
Set the required measurement time.
Start the measurement ↗■.
The actual measurement time counts back to zero and the measurement ends.
All measurement results may be recalled.
Timer Mode Repeat
Provides automated repeated measurements with user-defined, preset measurement time cycles.
Set the required measurement time.
Press start
The actual measurement time counts back to zero. When the preset measurement time has elapsed, the measurement time and the measurement results are reset and a new measurement is started. All measurement results of the previous cycle are reset.
Press stop ➤ to complete the measurement.
Sound Level Meter


Timer Mode Repeat Synchronized
Provides automated repeated measurements synchronized to the XL2 real-time clock. Press start ▶■ to begin the measurement. In order to align the selected preset measurement time with the real-time clock, the XL2 shortens the first cycle to match the real-time clock synchronization. All following measurement cycles are synchronized to the real-time clock.
For example, the cycle time setting is 30 minutes and the measurement starts at 7.50 a.m. -> the first test cycle measures from 7.50 - 8.00 a.m. Thereafter a new test cycle starts automatically for 30 minutes. The 30-minute cycles repeat until the measurement is stopped.
The measurements in the synchronized repeat timer mode start exactly on the half or full hour in accordance with DIN 15905.

Preset Measurement Time
Adjustment of preset measurement time for single and repeat timer setting.
⑧ Phantom Power Supply
48V The XL2 provides 48 V phantom power supply to the connection microphone or sensor.
ASD An NTi Audio measurement microphone with automated sensor detection ASD is connected. The XL2 reads the electronic data sheet of the microphone and switches the 48V phantom power automatically on
48V Phantom power is switched off.
⑨ Result Symbols / Capture
This field offers two functions:
Symbols for measurement results 15
Upper RTA parameter displayed as line.
- Lower RTA parameter displayed as bargraph.

Sound Level Meter
- Capture
One of the displayed RTA readings may be captured. Any measurement data can then be compared with this captured reference live on the XL2 Analyzer. For example, compare the RTA spectrum of the left and right speakers.
- Select the parameter to be captured.
Confirm with enter ⏻, to capture the reading. - Select the upper RTA parameter ⑮ and choose Capt.
Confirm with enter 🔒.

The lower RTA reading can be compared with the previously-captured reference data.
10 Measurement Result
Actual level result of the indicated frequency band. The cursor readout displays the center frequency and the level of the band pointed to by the arrow.
Upper parameter displayed as line.
11. Lower parameter displayed as bargraph.
⑪ Y-Scale setting
Select the Y-Axis with the rotary wheel ⏻ and confirm with enter ⏻.
- Select the zoom factor between 20, 10, 5, 2.5 dB/div and confirm with enter ⏻.
Scroll up and down with the rotary wheel Ⓞ to select the Y-axis range.
Confirm with enter 📂.
⑫ RTA Measurement Result
Real-time analyzer results in 1/1 octave or 1/3 octave band resolution. Adjust the resolution at 17.
13 X-Scale setting
Toggles X-scale range between
20 Hz - 20 kHz RTA levels including wide band results
6.3 Hz - 8 kHz RTA levels including wide band results
6.3 Hz - 20 kHz RTA levels
- Select the X-Axis with the rotary wheel ⏻ and confirm with enter ⏻.
- Toggle with the rotary wheel ○ between the ranges. Confirm with enter 🔒.
Sound Level Meter

14 Broadband Results
Actual sound level.
The broadband sound pressure level Leq, Lmin, Lmax and Live are displayed here. The Live level is displayed with time weighting Fast.
A A-w eighted broadband sound pressure level
Z Broadband sound pressure level without any frequency weighting
15 Readout Frequency
You may select any frequency to read out individual levels. The selected frequency is indicated by the cursor arrow.
Choose between the following settings:

The cursor follows automatically the highest level, e.g. tracing feedback frequencies at live sound. Select the frequency with the rotary wheel. Press enter.
- You may readout any individual frequency.
- Return to auto frequency with enter ⏻.
The cursor returns to the frequency with highest level bar.

The cursor readout may be set manually to any frequency band or wide band level. The readout remains at the selected frequency.
Select the frequency with the rotary wheel ⚙. Press enter ⏻. Select the frequency of interest.♦ Confirm with enter ⏻.

The cursor readout ⑪ displays the measurement results of the selected frequency band.
16 Setting of Test Result Resolution
Set the RTA result display to 1/1 octave or 1/3 octave band resolution as follows:
Turn the rotary wheel Ⓤ to select the parameter ⑰. Press enter ⏻ to toggle between 1/1 OCT and 1/3 OCT and set this parameter.

Sound Level Meter
17 Measurement Unit
Select the measurement unit as follows:
dB Sound level in dBSPL
This measurement unit is permanently selected when an NTi Audio measurement microphone with electronic data sheet is connected.
dBu Input level in dBu
dBV Input level in dBV
V Input level in Volt
The measured sound pressure level is just above the residual noise of the connected NTi Audio measurement microphone. This reduces the measurement accuracy -> choose another microphone designed for low level measurements.
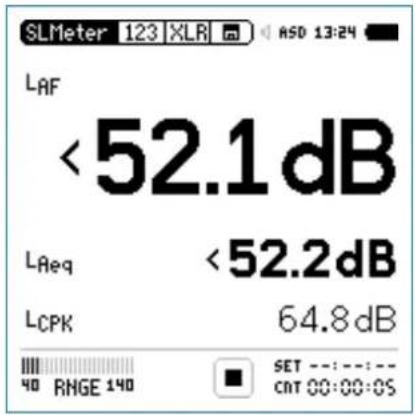
LOW - Indication
The low indicator for an individual level “<” is displayed when: The low condition is registered in the log and report files in the The measured sound pressure level is below the selected • column "Low(eq/peak)" individually for all frequency weight-linear measurement range. In this case the results shownings, the RMS and the peak levels. are most likely higher than the actual sound pressure level -> choose the next lower measurement range.
Sound Level Meter

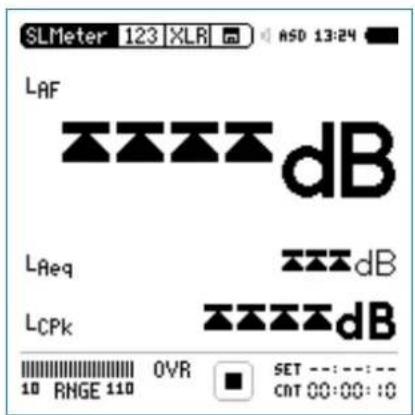
Overload Indication
In case the measurement result exceeds the preset measurement range, then limit arrows indicate this overload condition. The arrows are displayed for as long as the overload exists, and at least for a minimum of 1 second. Furthermore, such an overload condition triggers the OVR indication in the bottom line, which remains displayed for the complete measurement period. These overload indications are reset at the start of a new measurement. All overload conditions are registered in the log and report files.
Possible causes for exceeding measurement ranges are
- The measured sound pressure level exceeds the pre-set measurement range during the measurement period. Once this happens, the OVR indication remains displayed for the complete measurement period -> select the next higher measurement range or reduce the input signal level as applicable.
The input level is near the maximum level of the connected • NTi Audio measurement microphone.
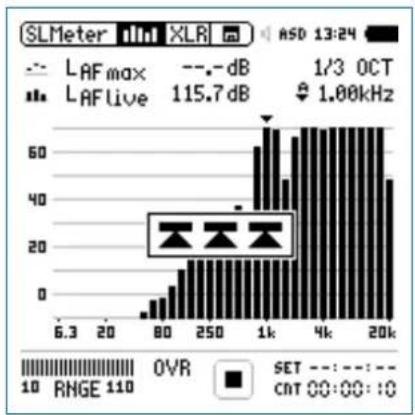
bar
SLMeter mini XLR ASD 13:24 | X-axis | Frequency (dB) | | :--- | :--- | | 6.3 | 0 | | 20 | 0 | | 80 | 5 | | 250 | 15 | | 1k | 60 | | 4k | 70 | | 20k | 50 | | Metric | Value | | :--- | :--- | | LAF max | - dB | | LAF live | 115.7 dB | | SET | - - - - - - - - - - - - - - - - - - - - - - - - - - - - - - - - - - - - - - - - - - - - - - - - - - - - - - - - - - - - - - - - - - - - - - - - - - - - - - - - - - - - - - - | Value | dB | | :--- | :--- | | 1/3 OCT | 1.00kHz | | RMGE 110 | 110 | OUTR SET: 00:00:10
Sound Level Meter
Sound Level Meter - Getting Started
Test Preparations
Connect the measurement microphone to the XL2. Switch on the XL2
The XL2 reads the electronic data sheet of any connected NTi Audio ASD microphone and switches the 48V phantom power automatically.
The 48V phantom power indication in the upper menu bar changes to ASD. The XL2 is ready for acoustic measurements.
Position the XL2 at the measurement location using a micro- phone stand or a tripod.
- Select the SLMeter function in the measurement menu and toggle with page 🔒 to the numeric result page 123

All wideband and RTA levels are measured and logged simultaneously. You select which sound levels should be displayed.
Select Displayed Test Result
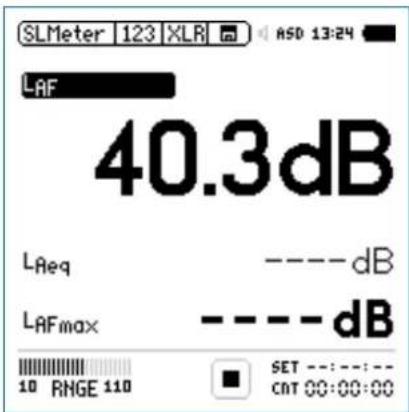
This example describes the setting of the commonly-used actual sound pressure level L_AF (level L, frequency weighting A, time weighting F).
Select the first parameter setting with the rotary wheel ⚙. Confirm with enter ⏻.
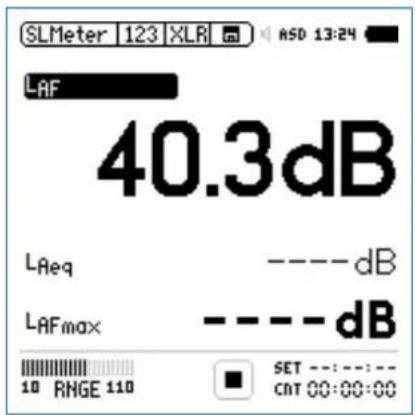

Press start ▶■ to measure and display the sound levels results indicated with ----.
Sound Level Meter

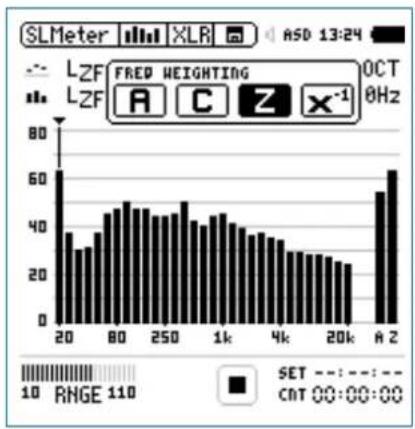
Select Frequency Weighting
The pop-up window FREQWEIGHTING appears.
Select the frequency weighting • A.
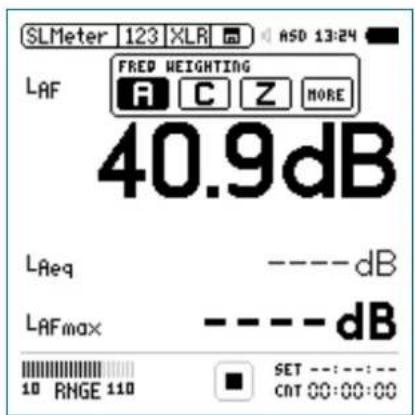
Installation of the Extended Acoustic Option adds more items to the pop-up window
Confirm with enter ⏻.
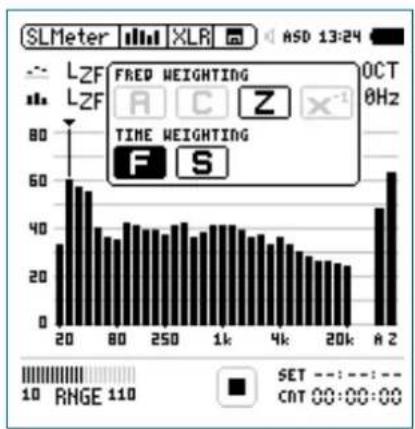
Select Time Weighting
The pop-up window extends with TIMEWEIGHTING.
Select the required time weighting; e.g. •F (=Fast).
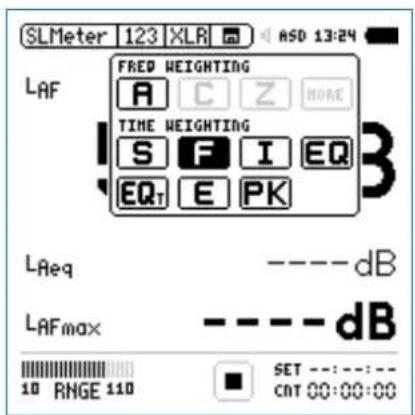
Confirm with enter ⏻.

Sound Level Meter
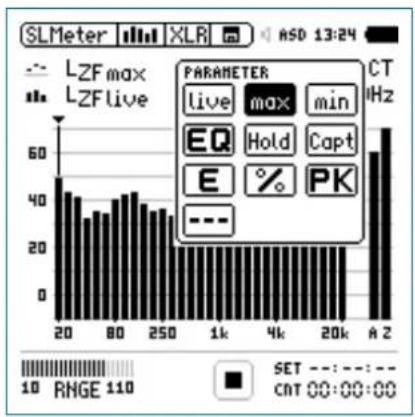
Select Parameter
The pop-up window extends with PARAMETER settings.
Select the parameter • live.
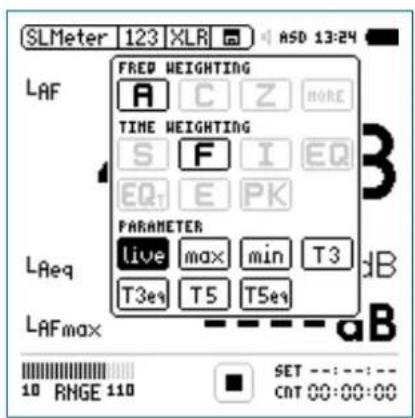
Confirm with enter 🔒.
Select Correction Value
The pop-up window extends with CORRECTION settings.
Select the parameter • off.
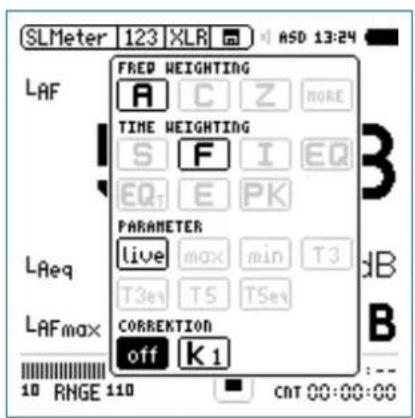
Confirm with enter 🔒.
The pop-up window closes and the measured sound pressure level L_AF is displayed.
Sound Level Meter

Select further Sound Levels
Select Input Range
Select the lowest possible input range based on the maxi-mum level expected during the measurement. Wrong input ranges are indicated by a "<" in front of the measurement value or a flashing OVR message in the lower menu bar. - Select the input range RNGE and press enter ⏻. Turn the rotary wheel ⏻ to set the applicable input range and confirm with enter ⏻.

The numeric result page and the real-time analyzer page use the same input range.
Select further sound pressure levels as described above; e.g., L_Aeq and L_AFmax

Sound Level Meter
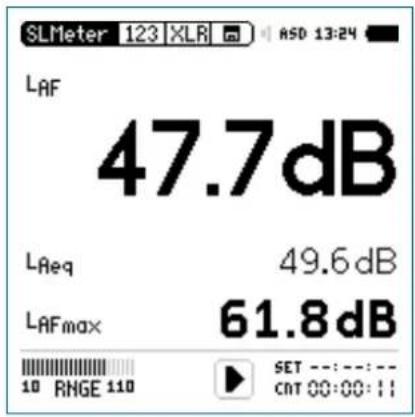
Start Measurement
The XL2 is ready to measure the sound levels L_AF , L_Aeq and L_AFmax :
Press start ▶.

The run indication switches to running. The integrated sound pressure level over time L_Aeq and the maximum level in the measurement period L_AFmax are displayed. The parameter RUN, LOG (logging is enabled) or AUD (audio recording is configured) flashes in the memory menu.
Stop Measurement and Data Saving
Press stop

The XL2 stores the broadband sound pressure levels and the real-time analyzer results simultaneously.
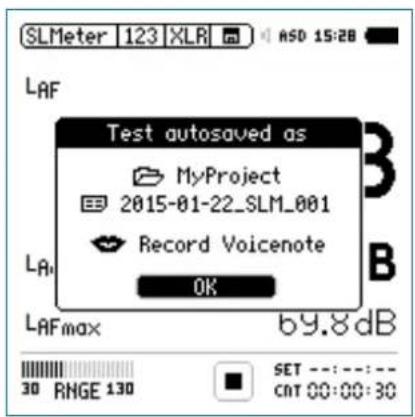
Press enter ⬤ to confirm. The measurement data is stored on the SD Card in ASCII format.

The sound pressure level measurement is completed.
Sound Level Meter

Data Post-Processing
The XL2 stores all data and audio onto the SD card for direct transfer to a computer. Audio data is stored as .wav files. Data reports and log files are stored in plain text format, which can be opened with any text editor (Notepad, Wordpad, etc.). The data is tab-delimited, so dropping the .txt file into a spreadsheet application will conveniently show the results in columns.
Furthermore a series of free MS Excel application templates provide a convenient way to view the measurement results of specific tasks and create simple reports. They are available as free download for all registered XL2 customers on the support website at https://my.nti-audio.com. (Enable all macros when opening the document.)
For the most comprehensive analysis of logged noise monitoring data, use the XL2 Data Explorer software. The data import into the software is enabled by the Data Explorer Option, which needs to be installed in the XL2 Sound Level Meter. More details in chapter[XL2 Data Explorer].
RTA Measurement - Getting Started
Test Preparations
The XL2 reads the electronic data sheet of any connected ASD microphones provided by NTi Audio and switches the 48V phantom power automatically on as follows:
Connect the measurement microphone to the XL2. Switch on the XL2 🔊.
The 48V phantom power indication in the upper menu bar changes to ASD. The XL2 is ready for acoustic measurements.
Position the XL2 at the measurement location using a micro- phone stand or tripod.
- Select the SLMeter function in the measurement menu and toggle with page 📋 to the real-time analyzer (RTA) page 📁

All wideband and RTA levels are measured and logged simultaneously. You select the sound levels to be displayed.

Sound Level Meter
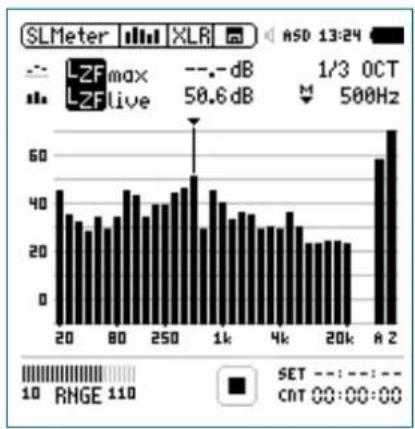
RTA Configuration
The XL2 displays two different sound pressure levels at the same time. You configure which test results to display; e.g., L_ZFmax and L_ZFlive .
Ensure no other measurement is going on. The run indication should display the stop symbol ■.
- Select the LZF value with the rotary wheel ◯.
Confirm with enter 📄.
Select RTA Frequency Weighting
The pop-up window FREQWEIGHTING appears.
Select the frequency weighting • Z.
bar
| X-axis Value | Frequency | |---|---| | 20 | 65 | | 80 | 45 | | 250 | 50 | | 1k | 45 | | 4k | 35 | | 20k | 25 | | A | 65 | Legend: SET = -10, RNGE = 110, CAT 00:00:00; FRED WEIGHTING OCT 0HzConfirm with enter 🔍.

Press start ▶■ to measure and display the sound levels results indicated with ----.
Sound Level Meter

Select RTA Time Weighting
The pop-up window extends with TIMEWEIGHTING. Select the required time weighting; e.g., •F (=Fast).
bar
| X-axis (GHz) | Frequency | |---|---| | 20 | 30 | | 80 | 60 | | 250 | 40 | | 1k | 40 | | 4k | 35 | | 20k | 25 | | A 2 | 65 | ASD 13:24 FRED WEIGHTING LZF LZF TIME WEIGHTING F S SET RNGE 110 CAT 00:00:00Confirm with enter 📄.
Select Upper/Lower RTA Parameter
- Select the parameter shown to the right of the upper LZF value with the rotary wheel ☐; e.g. max. Press enter 🔒.
The pop-up window PARAMETER appears.
Select the parameter • max.
bar
| Parameter | Live | Max | Min | | :--- | :--- | :--- | :--- | | EQ | 10 | 10 | 10 | | Hold | 10 | 10 | 10 | | Capt | 10 | 10 | 10 | | E | 10 | 10 | 10 | | PK | 10 | 10 | 10 | | --- | --- | --- | --- | | SET | --- | --- | --- | | RNGE | 10 | 10 | 10 | | CT | 00:00:00 | 00:00:00 | 00:00:00 | | XLR | 13:24 | 13:24 | 13:24 | | ASD | 13:24 | 13:24 | 13:24 | | LTZmax | 50 | 50 | 50 | | LTZLive | 40 | 40 | 40 | | CT / kHz | 60 | 60 | 60 | | HZ | 60 | 60 | 60 | | A Z | 60 | 60 | 60 | The chart displays a vertical bar chart with two sets of bars (black for each set) representing different measurement conditions or categories. The x-axis is labeled with values such as '20', '80', '250', etc., while the y-axis represents frequency or count. The legend indicates that black bars represent the same set value. The chart is saved as a PNG file named 'SLMeter'.Confirm with enter ⏻.
Follow the same instruction and select the lower RTA pa-• parameter live.

Sound Level Meter
Select Input Range
Select the lowest possible input range according to the maximum level expected during the measurement. Wrong input ranges are indicated by a < in front of the measurement value or a flashing OVR message in the lower menu bar.
- Select the input range RNGE and press enter ⏻. Turn the rotary wheel ⏻ to set the applicable input range and confirm with enter ⏻.

The numeric result page and the real-time analyzer page use the same input range.
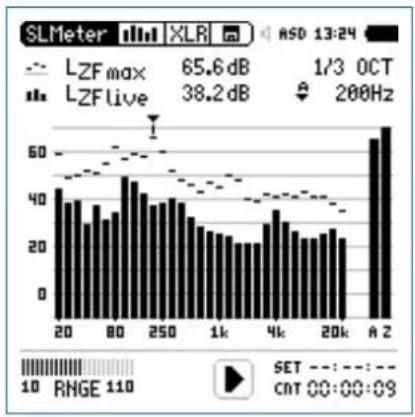
Start RTA Measurement
The XL2 is ready to display the measured sound pressure • levels L_ZFmax and L_ZFlive . Press start ▶■.
The run indication switches to running 1. The actual sound level LZFlive and the maximum level LAFmax are displayed. The parameter RUN, LOG (logging is enabled) or AUD (audio recording is configured) flashes in the memory menu.
bar
| X-axis (dB) | Frequency (dB) | |---|---| | 20 | 45 | | 30 | 40 | | 40 | 38 | | 50 | 35 | | 60 | 32 | | 70 | 30 | | 80 | 35 | | 90 | 40 | | 100 | 45 | | 110 | 42 | | 120 | 40 | | 130 | 38 | | 140 | 35 | | 150 | 32 | | 160 | 30 | | 170 | 28 | | 180 | 25 | | 190 | 22 | | 200 | 20 | | 210 | 25 | | 220 | 30 | | 230 | 35 | | 240 | 40 | | 250 | 45 | | 260 | 42 | | 270 | 40 | | 280 | 38 | | 290 | 35 | | 300 | 32 | | 310 | 30 | | 320 | 28 | | 330 | 25 | | 340 | 22 | | 350 | 20 | | 360 | 25 | | 370 | 30 | | 380 | 35 | | 390 | 40 | | 400 | 45 | | 410 | 42 | | 420 | 40 | | 430 | 38 | | 440 | 35 | | 450 | 32 | | 460 | 30 | | 470 | 28 | | 480 | 25 | | 490 | 22 | | 500 | 20 | | 510 | 25 | | 520 | 30 | | 530 | 35 | | 540 | 40 | | 550 | 45 | | 560 | 50 | | 570 | 55 | | 580 | 60 | | 590 | 65 | | 600 | 70 | | 610 | 75 | | 620 | 80 | | 630 | 85 | | 640 | 90 | | 650 | 95 | | 660 | 100 | | 670 | 110 | | 680 | 120 | | 690 | 130 | | 700 | 140 | | 710 | 150 | | 720 | 160 | | 730 | 170 | | 740 | 180 | | 750 | 190 | | 760 | 200 | | 770 | 210 | | 780 | 220 | | 790 | 230 | | 800 | 240 | | 810 | 250 | | 820 | 260 | | 830 | 270 | | 840 | 280 | | 850 | 290 | | 860 | 300 | | 870 | 310 | | 880 | 320 | | 890 | 330 | | 900 | 340 | | 910 | 350 | | 920 | 360 | | 930 | 370 | | 940 | 380 | | 950 | 390 | | 960 | 400 | | 970 | 410 | | 980 | 420 | | 990 | 430 | | A Z | Peak at ~65 dB (LZF max) / RNGE = -11.5 dB (LZF live) / SET: -1.5 (-1.5) / CNT: -1.5 @-1.5 @-1.5 @-1.5 @-1.5 @-1.5 @-1.5 @-1.5 @-1.5 @-1.5 @-1.5 @-1.5 @-1.5 @-1.5 @-1.5 @-1.5 @-1.5 @-1.5 @-1.5 @-1.5 @-1.5 @ -1.5 @-1.5 @-1.5 @-1.5 @-1.5 @-1.5 @-1.5 @-1.5 @-1.5 @-1.5 @-1.5 @-1.5 @-1.5 @-1.5 @-1.5 @-1.5 @-1.5 @-1.5 @-1.5 @-1.5@ -1.5@ -1.5@ -1.5@ -1.5@ -1.5@ -1.5@ -1.5@ -1.5@ -1.5@ -1.5@ -1.5@ -1.5@ -1.5@ -1.5@ -1.5@ -1.5@ -1.5@ -1.5@ -1.5@ -1.5@ < -1.5@ -1.5@ -1.5@ -1.5@ -1.5@ -1.5@ -1.5@ -1.5@ -1.5@ -1.5@ -1.5@ -1.5@ -1.5@ -1.5@ -1.5@ -1.5@ -1.5@ -1.5@ -1.5@ -1.5#Sound Level Meter

Stop the Measurement and Data Saving
Press stop

The XL2 stores the broadband sound pressure levels and the real-time analyzer results simultaneously.
Press enter 🔒 to confirm. The measurement data is stored on the SD Card in ASCII format.

The RTA measurement is completed.
Reporting
A report saves the conducted measurements onto the installed SD Card. The XL2 Supports setting the individual levels to be stored in the report after the measurement is completed.
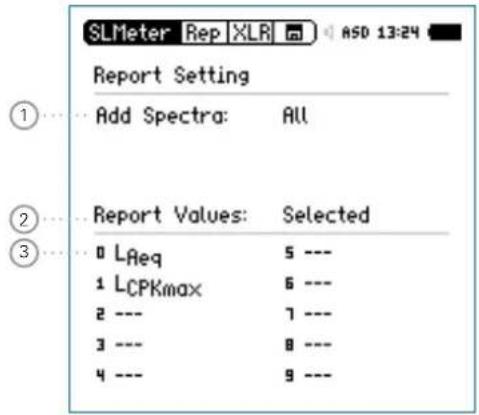
① Add Spectra
No No RT
A measurement reporting.
Leq The RTA Leq level is stored in the report.

Sound Level Meter
Leq, Lmax, The RTA Leq, Lmin, Lmax levels are stored in the report.
All All RTA levels are stored in the report.
② Report Values
Choose between the following result reporting:
ALL Records all available sound pressure levels without correction values.
Selected Records a subset of up to 10 different levels, including correction values if you require.
- Select Report Values with the rotary wheel Ⓞ. Press enter ⏻ to toggle between All or Selected.
③ Selected Report Values
By setting • Selected at2 up to 10 individual report values can be chosen. Select the first value Lxx with the rotary wheel ○ and press enter ⊕
The pop-up window for level selection appears.
- Select the reporting level with the rotary wheel ⏻ and confirm with enter ⏻.
Logging
The XL2 features a powerful sound level meter data logger, which allows you to record all required sound level values during the selected period of time. All results are logged onto the SD Card. The measurement results can be loaded to a PC for documentation and visualization. The LOG menu offers the detailed setup of the log report.
Sound Level Meter

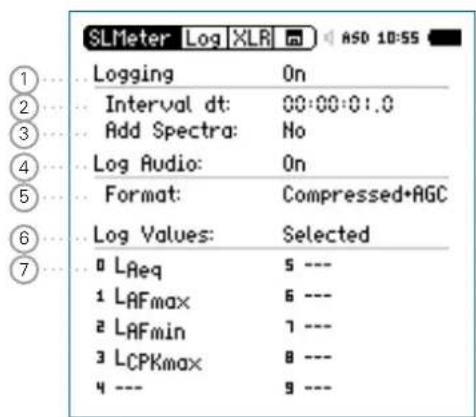
① Logging
Select Logging with the rotary wheel ⏻ and press enter ⏻ to enable the automated logging of test results.
On The XL2 logs measurement data every interval dt ②.
Off No Logging
② Interval t
Adjust the logging interval. The optional Extended Acoustic Pack offers the additional 100 ms logging.
③ Add Spectra
Set the RTA logging for each logging interval here.
No No RTA spectrum is logged.
Leq The Leq spectrum is logged.
Leq, Lmax, The Leq, Lmax and Lmin spectrum is logged simulatenuously (requires optional Extended Acoustic Pack).
④ Log Audio
The XL2 logs audio data as a wav-file. Choose among the following settings:
Off Audio logging is of f
On Audio logging is activate from measurement start to stop.
Events Only Audio logging of triggered events only.
For more details read the chapters [Wav-File Recording] and [Events].
⑤ Format
Choose among the following audio recording settings:
Compressed Compressed audio logging
Compressed+AGC Compressed audio logging with automated gain control
24Bit_48kHz Linear audio logging in 24 bit, 48 kHz resolution (optional with Extended Acoustic Pack)

Sound Level Meter
⑥ Log Value Setting
Choose between the following settings:
ALL Logs all available sound pressure levels without correction values.
Selected Logs a subset of up to 10 different sound pressure levels, including correction values if you require.
Select • Log Values with the rotary wheel.
Press enter ⏻ to toggle between All and Selected.
⑦ Selected Log Values
By setting Selected at 5 up to 10 individual log values can be chosen.
- Select the first value Lxx with the rotary wheel ⏻ and press enter ⏻.

The pop-up window for level selection appears.
- Select the logging level with the rotary wheel and confirm with enter ⏻.
At 100ms Logging is the log value selection limited to five different parameters.
Wav-File Recording
The XL2 records a wav-file of the measured input signal and stores it on the SD Card. The available formats are:
- Compressed (default, using ADPCM compression). A new wav-file is started automatically after 12 hours of recording (typical maximum wav-file size = 512 MByte)
- Compressed+AGC, compressed with automated gain control. The gain control increases the level of low-level signals, so that the wav-file is well-leveled during playback on the PC.
- 24Bit_48kHz, linear wav-file logging in 24 bit, 48kHz resolution with the optional Extended Acoustic Pack. A new wav-file is started automatically after 1 hour of recording (typical maximum wav-file size = 512 MByte)

Broadcast Wave Format BWF
The XL2 stores scaling factor, serial number, date, time and time zone within the wav-file (according to EBU TECH 3285). This information is available through professional audio/video tools typically used in broadcast.
Sound Level Meter

Sample name of wav-file:
MyTest_SLM_000_Audio_FS133.0dB(PK)_00.wav
① MyTest
File name defined by user.
② SLM
Measurement function.
③ 000
Automatically incrementing file number.
④ Audio_FS133.0dB(PK)
Audio file with full scale peak level. In case of a Compressed + AGC recording, the file name reads "AGC"; this file contains corrected level information only.
⑤ 00
For wav-file recording over longer periods, the XL2 splits the audio data into individual wav-files with about 500 MB (compressed audio: 12 hours; linear: 1 hour), keeping the file size small for easier handling on the PC. The number ^5 increments for each successive wav-file.
The advantage of wav-file recordings is to identify and document sound sources after the measurement. For example, at a live event an excessive peak level may have been measured and logged. Actually, this peak level was caused by people shouting nearby the measurement microphone, and not by the audio system being monitored. The recorded wav-file assists in verifying this and the test results can then be post-processed.

Pausing Measurement
If any ongoing measurement is paused the XL2 continues the recording of wav-files during the paused period. The logged data and audio data can be synchronized using the stored real-time information.
Events
The wav-files are stored in a folder, named, for example, 2011-11-30_SLM_000_AudioEvent_0001-0200. The actual wav-files are named for example, as xxxx_FS133.0dB(PK).wav (xxxx = incrementing number)

Sound Level Meter
Another example is environmental noise monitoring: Listening to the recorded wav-file after the measurement may help to determine the predominant sound source. The XL2 Analyzer preserves the original absolute test signal level in the recorded wav-file.

Select the lowest possible input range according to the maximum level expected during the measurement; e.g., If the sound pressure will always be below 110 dBSPL, select the lowest input range 10 - 110 dBSPL.
The XL2 Analyzer provides three input ranges to accommodate the wide range of input signals. The dynamic range of the recorded wav-file is set according to the selected input range. For example, at a microphone sensitivity of S=20 mV/Pa, the full scale peak level is:
| Range Name Range Level Full scale peak level | ||
| Low 10 - 110 dBSPL 117.8 dBSPL | ||
| Mid 30 - 130 dBSPL 135.9 dBSPL | ||
| High | 50 - 150 dBSPL | 159.9 dBSPL |
Sound Level Meter

Events (optional)
The event function is available with the XL2 Extended Acoustic Pack Option. The XL2 Analyzer may be configured to record wav-files and additional noise levels only when triggered, instead of the complete measurement duration.
Advantages
Reduces the data volume acquired, thereby
Simplifying data post-processing
Saving memory for long-term measurement applications.
Events
Events are triggered either automatically by sound levels above/below a preset value or manually by external key press using the XL2 Input Keypad.

Data Logging
The XL2 Analyzer logs the data specified in the LOG setting for the complete measurement duration into a log file. The markers and triggered events results are added to the same log file. The XL2 Input Keypad is available as an accessory. Please see chapter Options and Accessories for details.
Recommendation
With the large storage capacity of the XL2, NTi Audio recommends logging at a 1 second or faster interval. This allows the accurate collection of event data; one event will be stored within a logged interval. If results for reporting are required at longer intervals, e.g. one hour, the XL2 Data Explorer software is recommended. It easily combines logged data into longer audit intervals. An additional advantage of a faster logging interval is that only an entire logged interval can be excluded from the average. This is useful when a qualified noise consultant judges that a sound is not caused by the object under test or is not a normal sound for a measurement location.
Functions
The XL2 event feature offers the following functionalities:
Automated event triggered at noise levels above/below a preset value including setting markers for specific noise categories. Application example: Recording the noise level for LAF > 80 dB.
Event triggered by external key press of the XL2 Input Key-• pad. You can utilize four keys (1-4) to categorize any noise of interest or noise to be later excluded in the post-processing.
A typical application is categorizing any annoying industrial noise by persons living in the neighborhood.

Sound Level Meter
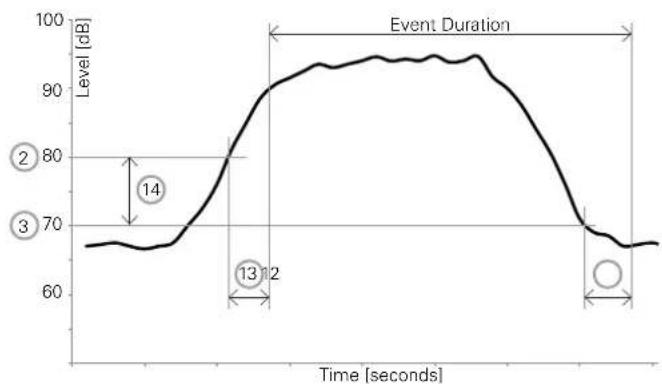
Trigger Events: on level above/below
line
| Event Duration | Level [dB] | | -------------- | ---------- | | 14 | 70 | | 13 | 80 | | 2 | 95 |Features:
The levels L_Aeq , L_Zeq and L_CPeak are recorded for the event duration.
Audio data is recorded for the triggered event duration only, thus simplifying data post-processing and saving memory space for long-term measurements.
Setting markers by external key press of the XL2 Input Key-• pad.
![SLMeter Evt XLR ASD 12:21 Trigger Events: on level above... Start [dB]: 80.0 for 02s Stop [dB]: 80.0 -10 for 03s Level = LAF Log Audio: Events Only Format: Compressed Record whole event Status: Stopped Curr Level = 64.5dB MONITOR Event count: 0000 Lvl1234](/content/2026/05/1054178/images/9118239584ff609560f6db26c940b781aaff2c2126c590b261ce55dddb50b64e.jpg)
Sound Level Meter

① Trigger Events
Choose from the following settings:
Off No event triggering
on level above Events are triggered at noise levels above the preset value ② for the start duration ⑬.
on level Events are triggered at noise levels below the below preset value ② for the start duration ⑬.
on ext. Events are triggered by external key press. key press
② Start [dB]
Set the level at which the triggered event is started.
Start Duration 13
The event start is triggered when the noise level is higher (or lower) than the preset value and continues for the preset duration.
③ Stop [dB]
Set the level at which the triggered event is stopped.
on level Stop level = Start level ② - Hysteresis ⑭ above
on level Stop level = Start level ② + Hysteresis ⑭ below
Stop Duration 12
The event stop is triggered when the noise level is lower (or higher) than the preset value and continues for the preset duration.
Hysteresis 14
Set the hysteresis to an appropriate value to prevent rapid switching on and off as the level drifts around the Start level.
④ Level Selection
Define the level type to be monitored.

Sound Level Meter
⑤ Log Audio
The XL2 logs audio data as a wav-file. Choose from the following settings:
Off Audio logging is of f
On Audio logging is activated from measurement start to stop.
Events Only Audio logging of triggered events only.
For more details read the chapter Wav-File Recording.
⑥ Format
Choose from the following audio recording formats:
Compressed Compressed audio logging
Compressed+AGC Compressed audio logging with Automated Gain Control (AGC)
24Bit_48kHz Linear audio logging in 24 bit, 48 kHz resolution. (Required for post-processing on the PC with Extended Acoustic Pack)
⑦ Audio Logging Period
If Log Audio ⑤ is set to Events Only, then the duration for the audio recording may be further specified:
Recording whole event
Records a wav-file for the whole triggered event duration.
Stop recording after
Records a wav-file for the specified period after the event start is triggered.
⑧ Status Information
Displays current trigger status:
- Waiting for trigger
- Armed (during start duration 13)
• Audio + data recording - Completing log cycle
⑨ Actual Level
Measurement result of the defined level ④.
⑩ Event Counter
Counts the number of triggered events that have occurred during the ongoing measurement.
Sound Level Meter

⑪ Trigger and Marker Monitor
Answers the question: What caused the triggered event?
Lvl Event automatically triggered by level.
1 Event triggered or marker added by pressing key 1 of the XL2 Input Keypad.
2 Event triggered or marker added by pressing key 2 of the XL2 Input Keypad.
3 Event triggered or marker added by pressing key 3 of the XL2 Input Keypad.
4 Event triggered or marker added by pressing key 4 of the XL2 Input Keypad.
⑫ Stop Duration See ③.
⑬ Start Duration See ②.
⑭ Hysteresis See ③.
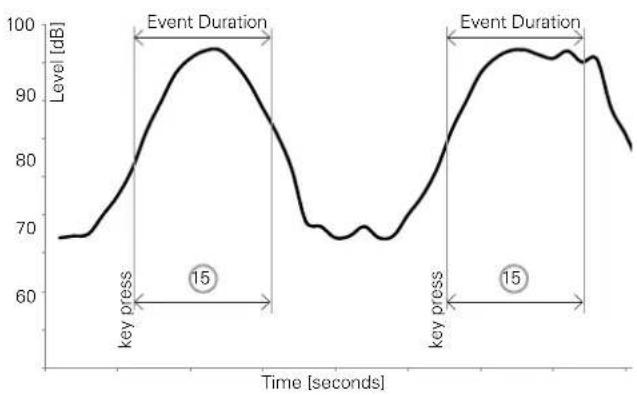
Trigger Events: on external key press
Trigger Events by pressing a button on the external input keypad with automated or manual stop of the event.
line
| Time [seconds] | Level [dB] | | -------------- | ---------- | | 0 | 68 | | 15 | 98 | | 20 | 70 | | 30 | 95 | | 40 | 97 | | 50 | 96 | | 60 | 82 |Features:
The levels L_Aeq , L_Zeq and L_CPeak are recorded for the event duration.
Audio data may be recorded for the user-defined event duration ^15 after the key press.
Retrigger with every repeated key press within the event • duration.

Sound Level Meter
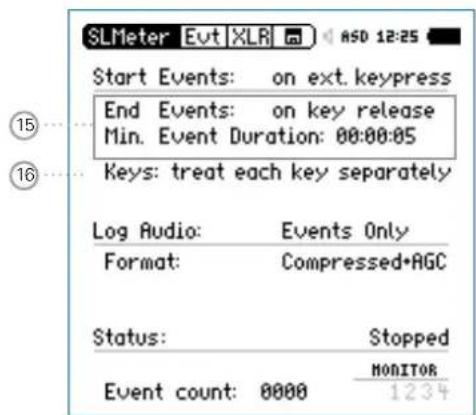
15 Event Stop Mode and Event Duration
on key release The event is recorded as long as the button of the input keypad is kept pressed; the Event period is at least Min. Event Duration long.
on ext. key-press The event is stopped by pressing a button on the external input keypad; the Event period is at most Max. Event Duration long.
16 Button Functionality of Input Keypad
treat each key separately All four buttons operate individually. For example pressing the button 2 will be recorded as button 2 in the measurement report. This allows you to distinguish different acoustic noise sources.
treat all keys as All four buttons operate in parallel and key 1 any button press will be recorded as button 1 in the measurement report.
Sound Level Meter

How to Setup the XL2 for Triggered Event Measurements
- Select the logging page, set Logging On, Interval dt: 00:00:01 and choose the required log values.
Setup the event page. For example, the screenshot below starts the event recording after L_AF exceeds 80 dB for 2 seconds and stops after L_AF is lower than 70 dB for 3 seconds.
![SLMeter Evt XLR ASO 12:21 Trigger Events: on level above... Start [dB]: 80.0 for 02s Stop [dB]: 80.0 - 10 for 03s Level = LAF Log Audio: Events Only Format: Compressed Record whole event Status: Stopped Curr Level = 64.5dB MONITOR Event count: 0000 Lvl1234](/content/2026/05/1054178/images/4c7e53bcdebed2bd4e64d4525da5f5867b8adb98e9b69b0c11601fe3ff5bc3ec.jpg)

Logging Enabled
Triggered-event recording requires the activation of sound level logging. Using the default Interval dt: 1 second is recommended.
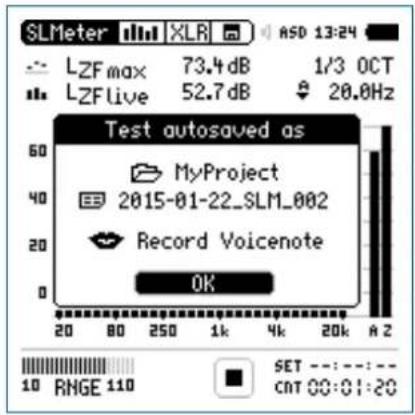
Auto Save
If Log Audio ⑤ is set to Events Only, then the XL2 sets per default Naming+Saving: auto in the memory menu. This ensures that the recorded triggered event data is stored on the SD Card.
For convenience, in case more than 20 triggered events have been recorded, the Autosave -> Delete function is disabled, as deleting such multiple wav-files on the XL2 is time-consuming.
Wav-files
All triggered-event wav-files are stored in an individual folder. For details see chapter: Logging.
Select the memory menu and create a new folder. This folder will then be displayed in the memory menu. All log data and event wav-files are stored in this folder.

The XL2 is ready for the triggered event measurement.

Sound Level Meter
Limits
The limit page offers two functions:
Setup of limit LED function; enabling the XL2 to highlight any sound levels that exceed the pre-set limit in orange or red color. The default color is green.
Limit parameter setup for external connected accessories, such as the Digital I/O Adapter PCB, the Limit Light or the Stack Light. These accessories connect to the digital I/O interface of the XL2.
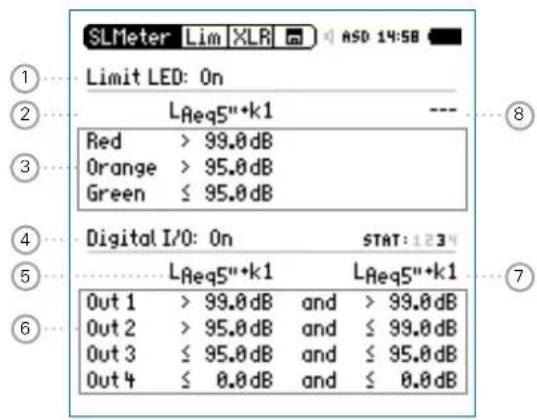
① Limit LED On/Off
Select Limit LED with the rotary wheel ⏻ and press enter ⏻ to enable/disable the limit function.
② LED - Level 1
Select one sound level for the limit LED indication Select the sound level field with the rotary wheel Press enter ⏻ and select the sound level for the limit LED indication.
③ Selected Level Values
To set the level values for the limit LED Ⓜ, Select the Red or Orange sound level with the rotary wheel ⏻ and press enter ⏻ - Set the level value with the rotary wheel ⏻ and confirm with enter ⏻.
④ Digital I/O On/Off
Select Digital I/O with the rotary wheel ⏻ and press enter ⏻ to enable/disable the operation of externally connected accessories.
Sound Level Meter

⑤ I/O - Level 1
Setup of the level type 1, which is used to trigger externally connected accessories.
Select the level field with the rotary wheel
Press enter ⏻ and select the level for the control of the external accessory.
⑥ Selected Sound Level Values
To set the level values for the control of the externally connected accessory.
Select the Out 1, Out 2, Out 3 or Out 4 • level with the rotary wheel ○ and press enter ⚙ The Limit Light and the Stack Light use Out 1 for red, Out 2 for yellow and Out 3 for green light.
Set the level value with the rotary wheel ⏻ and confirm with enter ⏻.
⑦ I/O - Level 2
Follow the setting for I/O - Level 1. The I/O level 1 may be combined with I/O level 2 using and/or combinations, providing indications in level ranges. Alternatively, other levels can be selected for the control of the externally connected accessories.
⑧ LED - Level 2
Follow the setting for LED - Level 1.

I/O Limits with Triggered Events
If triggered-event recording is enabled, the digital output 4 (OUT4) is utilized as confirmation feedback to the XL2 Input Keypad, thus the setting is disabled.

Sound Level Meter
Correction Value KSET
The correction value page offers a measurement wizard for live event monitoring, applicable in case the measurement location differs from the loudest position in the live event area.
Measurement Position
The goal at live event monitoring is to measure the sound level at the loudest position accessible by the audience. Setting up any sound level measurement at this loudest location is typically not practical, thus an alternative measurement position is chosen. The recommended measurement position in order to minimize the influence that audience noise has on the measurement:
Mount the measurement microphone in front of the main • speakers
Position the XL2 Analyzer at front of house (FOH)•
Connect the XL2 Analyzer and measurement microphone • using a professional audio cable

Positioning the measurement microphone at front of house (FOH) may result in audience noise interfering with the measurement results. The audience noise will be further amplified by the measured k-values.
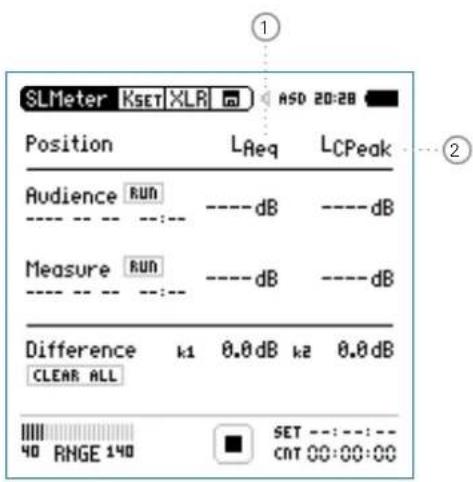
① Correction k1
The correction k1 is based on the LAeq.
② Correction k2
Select the level type for correction k2.
LCpeak for Germany DIN15905-5; correction is based on LCpeak measurement
LCeq correction is based on LCeq measurement
Sound Level Meter

Level Difference
Prior to the start of the live event, the level difference between the loudest and the measurement position is measured. The XL2 Analyzer calculates the level difference automatically based on the individual sound level measurements at both locations. This level difference is included in the sound level reading during the live event, and the XL2 thereby displays and records the sound pressure level of the loudest point.
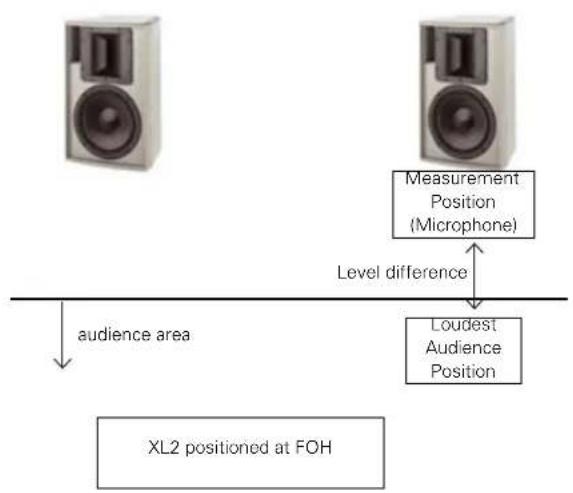
flowchart
graph TD
    A["Measurement Position (Microphone)"] -->|Level difference| B["Loudest Audience Position"]
    C["audience area"] --> D["XL2 positioned at FOH"]
How to Measure the Correction Value
Play a pink noise signal at the typical sound pressure level of • the live event. (signal source Minirator, NTi Audio Test CD) Select the correction page ⚠SET.
Search the audience area for the location with the highest sound pressure level and position the XL2 Analyzer.
Turn the rotary wheel ⚙ to select the parameter RUN next to Audience and press enter ⏻.
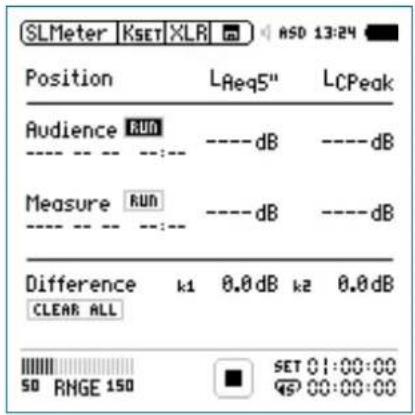
The XL2 measures the sound level at the loudest position for 5 seconds. The timer counts down to zero.

Sound Level Meter
Wait until the measurement is completed.
Position the XL2 at the measurement position.
Turn the rotary wheel Ⓧ to select the parameter RUN next to Measure and press enter ⏻.
Wait until the measurement is completed.
The correction values k1 and k2 are calculated and displayed • including date and time.
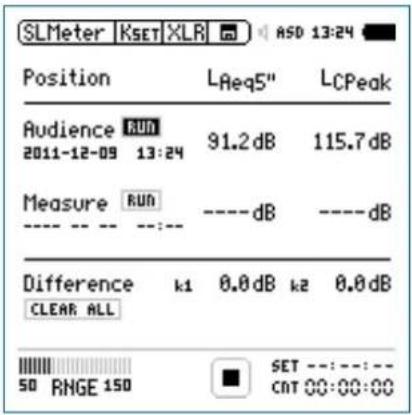
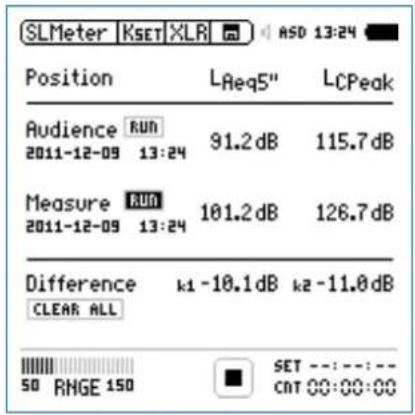

The XL2 measures the sound level at the measurement position for 5 seconds. The timer counts down to zero.
Sound Level Meter

Manual Setting of Correction Values
You may fine-tune the correction values k1 and k2 manually. Such fine-tuning adds the remark "Manually Adjusted" in the log file.
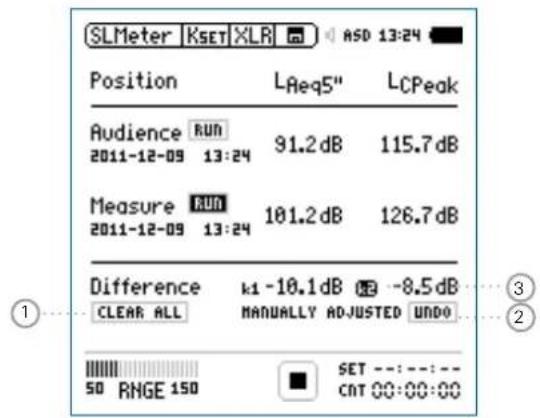
Turn the rotary wheel ⚙ to select the correction value ③ and press enter ⏻.

The selected correction value starts flashing.
Set the correction value with the rotary wheel

The note "Manually Adjusted" is displayed a2
To undo the manual setting turn the rotary wheel to select the parameter UNDO at ②. Confirm with enter

Reset Correction Values
You may clear all correction values back to zero by pressing the Clear All ① and confirm with enter ⏻.
Display k1 and k2 during Measurement
The correction values k1 and k2 can be displayed in the numeric result page during the ongoing sound level measurement instead of any other sound levels.
Correction Values in Profiles
The correction values k1 and k2 can optionally be stored within profiles. Loading the profile, sets the stored correction values.

Sound Level Meter
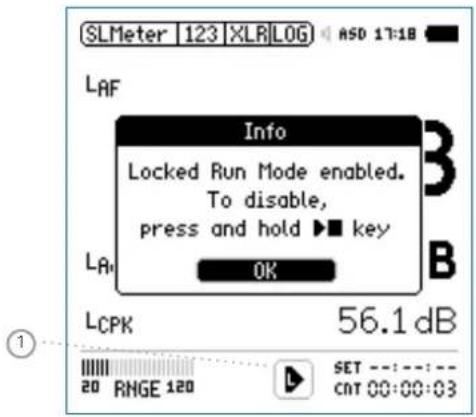
Locked Run Mode
The Locked Run Mode simplifies sound level monitoring. You just need to power up the XL2 and the measurement starts automatically. The measurement continues until you switch off the instrument using the power button ⏻. The measurement data is stored by default.
Start Locked Run Mode
Set the required parameters in the sound level meter for your noise monitoring application.
Press and hold the start/stop button ▶ for 3 seconds.

The Locked Run Mode is now activated. The Run Indicator ① displays L. The Info window is displayed at the same time.
Switch off the instrument.

The measurement is stopped and the data is saved.
Switch on the instrument.

The sound level measurement starts automatically and continues as long as the device is powered on.
The page button 📋 allows toggling between the sound level meter and real time analyzer window. All other buttons are deactivated during Locked Run Mode.
End Locked Run Mode
- Press and hold the start/stop button ▶■ for 3 seconds during the ongoing measurement.

The measurement is stopped and the Locked Run Mode deactivated.
Sound Level Meter


FFT Analysis + Tolerance
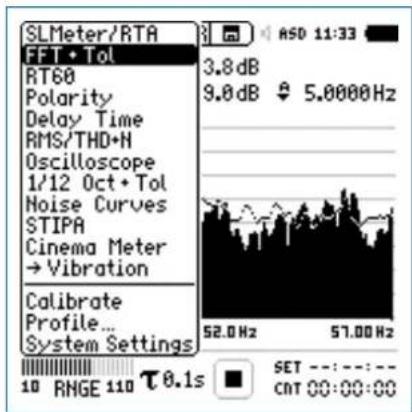
5. Acoustic Analyzer
Besides the comprehensive sound level meter functions, the XL2 Audio and Acoustic Analyzer offers the following acoustic measurement functions:
FFT Analysis with optional tolerance function•
Reverberation Time RT60•
Polarity•
Delay time•
1/12 Octave + Tolerance Analysis (optional)
Noise Curves (optional)
Speech intelligibility STIPA (optional) •
FFT Analysis + Tolerance
The FFT measurement is the ideal tool for visualization of comb filters and narrow band effects. It allows a detailed frequency response investigation of audio and acoustic systems. The XL2 includes an extremely fast, real-time FFT. Optional features are
- High-resolution Zoom-FFT up to 0.4 Hz steps in the frequency range 5 Hz - 20 kHz provided with optional Extended Acoustic Pack or the Spectral Limits Option
- Capture and tolerance function provided with Spectral Limits Option; thus the main menu function reads FFT + Tol.
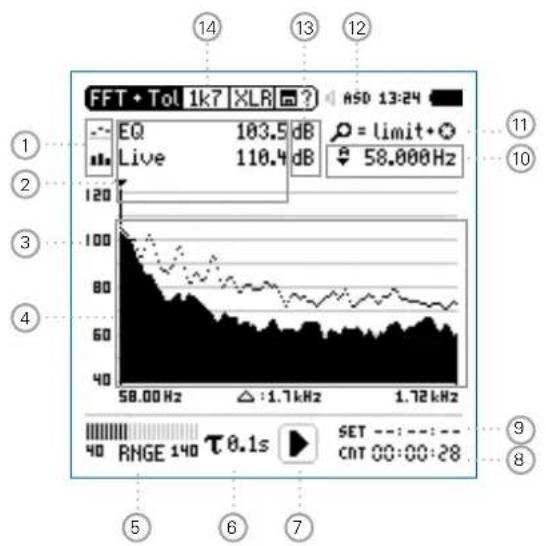
FFT Analysis + Tolerance

① Result Symbols / Capture & Start Tolerance Mode
This field offers two functions:
Symbols for measurement results 2
Upper result displayed as line.
- Lower result displayed as bargraph.
Capture & Start Tolerance Mode•
The displayed readings may be captured as reference reading C1 to C8 for
Comparing measurement results against captured traces with relative or absolute curve display.
Creating tolerance masks based on captured reference curves for passed / failed measurements.
Capture EQ Capt ures the upper parameter
Capture Live Captures the lower parameter

FFT Analysis + Tolerance
Manage captures
Allows to rename captures, clear recorded captures, save captures to the SD Card for export from the XL2 or load captures from the SD Card for import to the XL2.
Start tolerance mode
Starts the tolerance mode for passed/failed measurements comparing the actual measurement results against a tolerance band.
② Measurement Result
Actual level result of the indicated frequency band. The cursor readout displays the center frequency and the level of the band indicated by the arrow.
Upper parameter displayed as line.
- Lower parameter displayed as bargraph.
③ Y-Scale setting
Select the Y-Axis with the rotary wheel and confirm with enter ⏻.
- Select the zoom factor between 20, 10, 5, 2.5 dB/div and confirm with enter ⏻.
Scroll up and down with the rotary wheel Ⓞ to select the Y-axis range.
Confirm with enter 📂.
④ Measurement Result
Displays the actual and averaged measurement results.
⑤ Input Range
The XL2 Analyzer provides three input ranges to accommodate the wide range of input signals. The individual ranges are based on the microphone sensitivity setting in the calibration menu of the XL2. For example at a sensitivity S=20mV/Pa the input ranges are
Lower range: 10 - 110 dBSPL•
Middle range: 30 - 130 dBSPL•
Upper range: 50 - 150 dBSPL
Select the lowest possible input range according to the maximum level expected during the measurement; e.g., if the sound pressure will be always below 110 dBSPL, then select the lowest input range 10 - 110 dBSPL.
FFT Analysis + Tolerance

⑥ Time Weighting
Offers selectable time weighting of 0.1, 0.2, 0.5, 1.0 second as well FAST (125 ms) and SLOW (1 second). Applications:
Short Time High resolution in time with minimum Weighting averaging
Long Time Weighting Low resolution in time with longer averaging
⑦ Run Indication
The run indication shows the measurement status running, paused or stopped. Various measurement settings are locked during ongoing measurements, such as changing the input ranging or the preset measurement time.
For passed/failed measurements with the Spectral Limits option the run indication may display A for a preset automated level trigger.
⑧ Actual Measurement Time
Counts actual measurement time in hrs:min:sec. Supports setting of time modes: continuous and single.
CNT Timer Mode Continuous
(applicable for standard measurements)
All values are recorded and monitored continuously after starting a measurement with start ▶■ The actual measurement time is shown.
Timer Mode Single
Automatically stops the measurement after the pre-set measurement time.
Set the required measurement time.
Start the measurement
⑨ Preset Measurement Time
Adjustment of preset measurement time for single timer setting.

FFT Analysis + Tolerance
⑩ Readout Frequency
You may select any frequency to read out individual levels. The selected frequency is indicated by the cursor arrow. Choose between the following settings:

The cursor follows automatically the highest level, e.g. tracing feedback frequencies at live sound. Select the frequency with the rotary wheel. Press enter. You may readout any individual frequency. Return to auto frequency with enter.

The cursor returns to the frequency with highest level bar.

The cursor readout may be set manually to any frequency. The readout remains at the selected frequency. Select the frequency with the rotary wheel ⏻. Press enter ⏻. Select the frequency of interest. Confirm with enter ⏻.

The cursor readout ② displays the measurement results of the selected frequency band.
⑪ Zoom Mode
(optional, applicable with the Extended Acoustic Pack or the Spectral Limits Option)
- Select the readout frequency 10 and press enter
- The zoom mode is displayed above the flashing arrow.
- Select the zoom-in frequency with the rotary wheel ◯.
- Press limit ⓝ and zoom the linear frequency scale in or out with the rotary wheel Ⓞ.
- Release limit ⏻ and scroll the linear frequency scale left or right with the rotary wheel Ⓞ.
12 Phantom Power Supply
48V
The XL2 provides 48 V phantom power supply to the connection microphone or sensor.
ASD
An NTi Audio measurement microphone with automated sensor detection ASD is connected. The XL2 reads the electronic data sheet of the microphone and switches the 48V phantom power automatically on
48V
Phantom power is switched off.
FFT Analysis + Tolerance

13 Measurement Unit
Select the measurement unit as follows:
dB Sound level in dBSPL
This measurement unit is permanently selected upon connecting a NTi Audio measurement microphone with electronic data sheet.
dBu Input level in dBu
dBV Input level in dBV
V Input level in Volt
⑭ Page Selector X-Scale and Parameter Setting
20k Shows FFT result of the frequency band range. 484.38 Hz - 20.453 kHz in a resolution of 140.62 Hz with 143 bins shown on the display.
1k7 Shows FFT result of the frequency band range. 58 Hz - 1.722 kHz in a resolution of 11.72 Hz with 143 bins shown on the display.
200 Shows FFT result of the frequency band range. 7 Hz - 215.01 Hz in a resolution of 1.46 Hz with 143 bins shown on the display.
Usr User Range (applicable with optional Extended Acoustic Pack or Spectral Limits Option) 5 Hz - 20 kHz in zoom mode with a minimum resolution of 0.366 Hz and 143 bins displayed.
Set Selection for FFT Windowing:
Hann• : Default for acoustic measurements
- Dolph-Chebyshev: for analyzing small signals (e.g. harmonics) close to a dominant signal.
The page button 📋 switches these display modes.

FFT Analysis + Tolerance
FFT Analysis - Getting Started
Test Preparations
Connect the measurement microphone to the XL2. Switch on the XL2

The 48V phantom power indication in the upper menu bar changes to ASD. The XL2 is ready for acoustic measurements.
Position the XL2 at the measurement location using a micro-• phone stand or tripod.
Configuration
The XL2 displays two different sound pressure levels at the same time. You configure to display either the levels Live, Max, Min, EQ or captured results.
Select the upper result parameter with the rotary wheel 🔒.
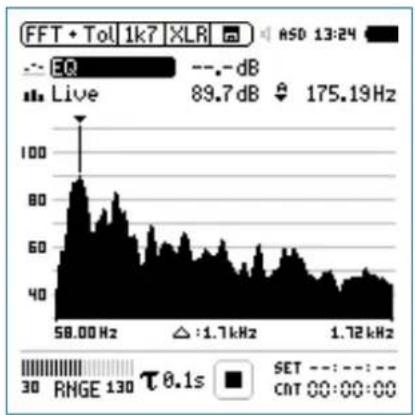
line
| Frequency | Value | | --------- | ----- | | 58.00 Hz | 89.7 dB | | 1.72 kHz | 175.19 Hz |Confirm with enter 🔒.
FFT Analysis + Tolerance

Select Upper/Lower Reading
The pop-up window Select reading appears.
- Select the integrated averaged reading EQ. All available selections are Z-weighted (= no weighting).
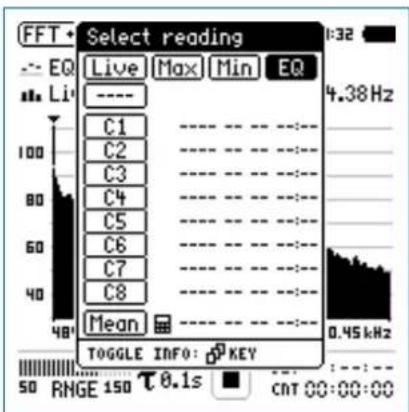
Confirm with enter 📂.
The pop-up window Select reading mode appears.
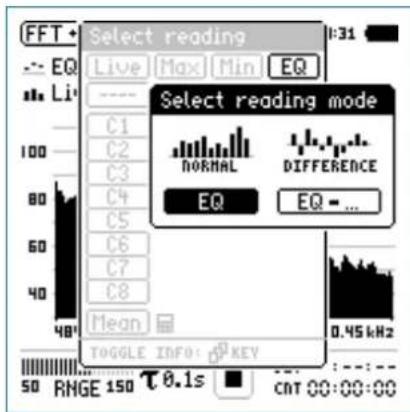
- Select EQ for normal absolute display of measurements. Follow the same instruction and select the lower FFT reading Live.

Press start measure and display the sound levels results indicated with ----.

FFT Analysis + Tolerance
Select Input Range
Select the lowest possible input range according to the maximum level expected during the measurement.
- Select the input range RNGE and press enter ⏻. Turn the rotary wheel ⏻ to set the applicable input range and confirm with enter ⏻.
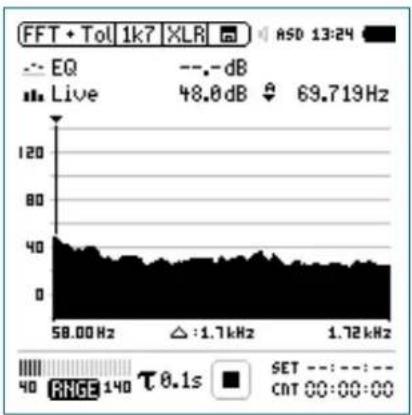
line
| Frequency | Value | | --------- | --------- | | 58.00 Hz | 48.0 dB | | 1.72 kHz | 69.719 Hz |Start Measurement
The XL2 measures the selected sound pressure lev-•els Live and EQ. All available sound levels are Z-weighted (= no weighting).
Press start
The run indication switches to running ▶. The actual sound level Live and the averaged level EQ are displayed. The parameter RUN flashes in the memory menu.
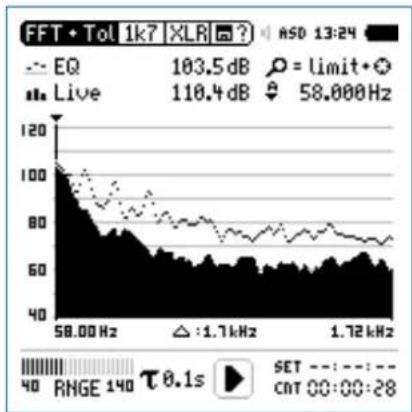
line
| Frequency | Value | | --------- | --------- | | 58.00 Hz | 103.5 dB | | 1.72 kHz | 58.000 Hz |FFT Analysis + Tolerance

Stop Measurement and Data Saving
Press stop

The XL2 stores the measurement data automatically.
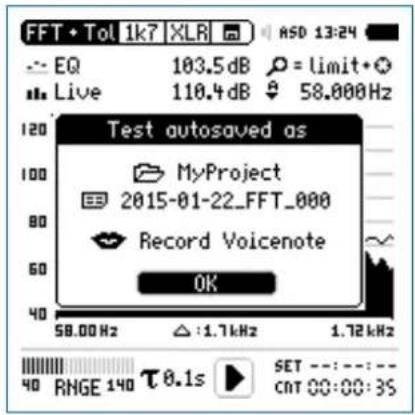
Press enter 🔒 to confirm. The measurement data is stored on the SD Card in ASCII format.

The measurement is completed.
Audio Recording
The XL2 Analyzer may record a linear audio file (48 kHz, 24 Bit) of the measurement period together with the FFT data. Just load a txt-file named "fftaudio.txt" in the root directory of the XL2. This requires the installed option Extend Acoustic Pack.
Capture References and Create Tolerances
The Spectral Limits Option extends the function range of the XL2 with trace capturing, relative curve display and comprehensive tolerance handling for the FFT Analysis and the high resolution 1/12 Oct + Tol spectral analysis.
Features:
Captures multiple traces in the internal memory
- Comparing measurement results against captured traces with relative or absolute curve display
• Comprehensive tolerance handling - Creating tolerance masks based on captured reference curves for passed / failed measurements
- Export and import of tolerance and capture files
• True peak level in 1/1 and 1/3 octave resolution - High-resolution Zoom-FFT up to 0.4 Hz steps in the frequency range 5 Hz - 20 kHz
Read the detailed description in the separate chapter Capture + Tolerance.

Reverberation Time RT60
Reverberation Time RT60
The XL2 measures the energy decay from 63 Hz to 8 kHz using the Schroeder method in 1/1 octave resolution. The optional Extended Acoustic Pack enables 1/3 octave band resolution from 50 Hz to 10 kHz. Use either an impulse source (e.g., a starter pistol) or an interrupted pink noise as the test signal.
What is Reverberation Time RT60?
Reverberation time RT60 is the time required for the sound pressure level to decrease by 60 dB after the sound stimulus signal is stopped. For simple practical measurements the applicable standard ISO 3382 and ASTM E2235 specifies the following two measurement methods:
T20•
- The measurement requires just a small dynamic measurement range of 35 dB above the ambient noise level for each frequency band.
- RT60 (T20) = 3 x decay time of 20 dB
T30•
- The measurement requires a dynamic measurement range of \~45 dB above the ambient noise level for each frequency band.
- RT60 (T30) = 2 x decay time of 30 dB
In detail, the RT60 is based on a linear least-squares regression of the measured decay curve. If the overall RT60 is short (e.g. < 0.3 seconds) the room acoustic is referred to as being "dead"; for example, a heavily furnished room with thick carpets, curtains and upholstered furniture may have such an acoustic character. If the overall RT60 is long (say more than 2 seconds) the room acoustic is referred to as being "live" and echoic; for example, a large empty room with painted plaster walls and a tiled floor may have such an acoustic character.
![Level [dB] 0 dB -5 dB 20 dB level range to obtain the reverbera- tion time -25 dB Time distance to noise floor -35 dB](/content/2026/05/1054178/images/8bcea9637c8c71d89fedaa66aa280705c1bfb29a81980042e0d1c646d6d303f2.jpg)
RT60 Measurement with T20 method
Reverberation Time RT60

RT60 Run Test Page Run
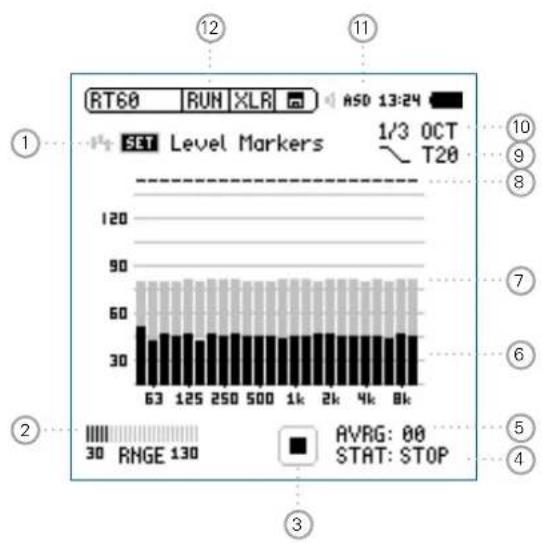
bar
| Level Marker | Value | | :--- | :--- | | 63 | 50 | | 125 | 50 | | 250 | 50 | | 500 | 50 | | 1k | 50 | | 2k | 50 | | 4k | 50 | | 8k | 50 | AVRG: 00 STAT: STOPRT60 Result Page Res
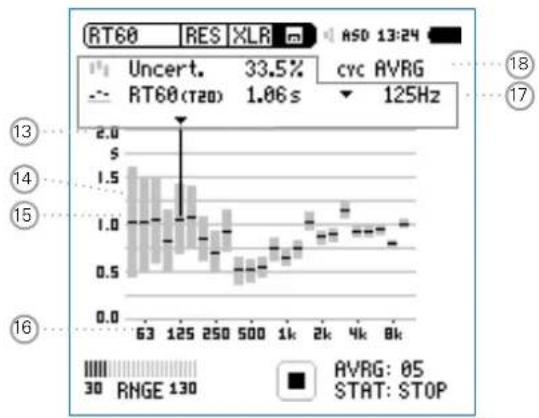
bar
| Time | Price | |------|-------| | 63 | 1.5 | | 125 | 1.4 | | 250 | 1.0 | | 500 | 0.7 | | 1k | 0.9 | | 2k | 1.1 | | 4k | 1.2 | | 8k | 1.3 |
Reverberation Time RT60
RT60 Cycle Result Page Res
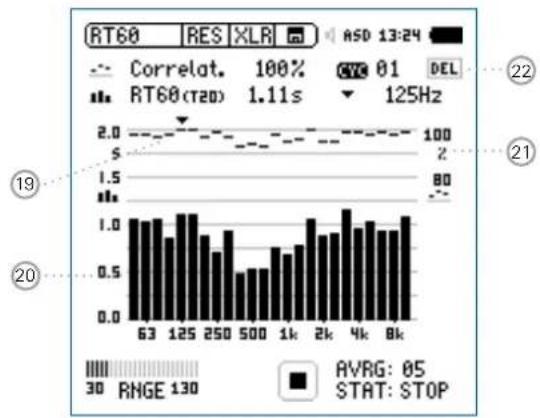
bar
| Time (s) | Value | | :--- | :--- | | 63 | 1.0 | | 125 | 1.1 | | 250 | 0.9 | | 500 | 0.7 | | 1k | 0.8 | | 2k | 1.0 | | 4k | 1.2 | | 8k | 1.1 |① Set Level Markers
Prior to conducting a reverberation time measurement, the environmental noise is measured, and the required energy level of the test signal is determined.
Select • SET and press enter to measure the actual environmental noise.
The required level markers appear in grey color.
② Input Range
Select between the lower, mid and upper input range. The exact ranges depend on the microphone sensitivity setting in the calibration menu of the XL2.
③ Run Indication
This icon displays the running and stop status of the reverberation time measurement. It is controlled by start/stop
Reverberation Time RT60

④ Measurement Status STAT
Displays the actual measurement status. Start and stop the reverberation time measurement with start/stop ▶ The following status information is displayed:
ARMED Measurement is waiting for the test signal to exceed at least one measurement trigger marker, then the measurement is triggered automatically.
NOISE A sound stimulus signal above the trigger marker is being received.
DECAY Decay is being measured.
PAUSE The measurement has been paused by pressing pause □.
STOP No RT60 measurement is presently being performed.
⑤ Average AVRG
Counts the measurement cycles. When using an interrupted noise test signal, a minimum of 3 sequential cycles is recommended.
⑥ Actual Real-Time Spectrum
The black bars indicate the actual signal, including background noise. While setting up the reverberation time measurement you should increase the test signal level until the black bars exceed the grey bars completely and the status ④ displays NOISE.
⑦ Level Marker
The grey bars indicate the signal level required for effective reverberation time measurements in each octave band. The marker has a length of 35 dB, and can be set by
- Selecting SET ① with the rotary wheel
- Press enter ⬤ to measure the environmental noise in the silent room.
⑧ Band Status
Indicates a successful reverberation time measurement above each octave band with a tick √.
⑨ Measurement Method
Select between the measurement methods T20 and T30. T20 requires just a small dynamic measurement range of \~35 dB above the ambient noise level for each frequency band. T30 requires a dynamic measurement range of \~45 dB.

Reverberation Time RT60
⑩ Measurement Resolution
Reverberation time measurement selectable in 1/3 octave or 1/1 octave band resolution. The optional Extended Acoustic Pack enables 1/3 octave band resolution from 50 Hz to 10 kHz.
⑪ Phantom Power Supply
48V The XL2 provides 48 V phantom power supply to the connection microphone or sensor.
ASD An NTi Audio measurement microphone with automated sensor detection ASD is connected. The XL2 reads the electronic data sheet of the microphone and switches the 48V phantom power automatically on
48V Phantom power is switched off.
⑫ Page Selector RT60
Select between the RT60 run test page and the result page. The page button ⏻ toggles between these displays.

RT60 run test page

RT60 result page. Toggle with the measurement result selection 18 among
AVRG RT60 result page showing average of all cycles and uncertainty factor
CYC xx RT60 result page for each cycle
Last RT60 result page for last cycle
⑭ Y-Axis Reverberation Time
Reverberation time in seconds. The scaling is automatically adjusted.
Reverberation Time RT60

⑭ Uncertainty Factor
The uncertainty factor is displayed in the RT60 average result page. It indicates the uncertainty of the averaged measurement results, reduces as more cycles are measured, and depends on the measured reverberation time and the bandwidth of the individual frequency band; lower bands show a higher uncertainty factor. The number of measurement cycles is displayed at ⑤.
15 Overall Reverberation Time Test Result
Readout of reverberation time and uncertainty factor.

Uncertainty factor. For more details see 14.

Reverberation time measurement results.
16 X-Axis
RT60 Octave Bands 63Hz - 8 kHz
⑰ Cursor Readout
Select the individual frequency band and read out the following numeric measurement results Uncertainty factor in % or correlation in %.• Reverberation time RT60 (T20), of the selected frequency band, in seconds (s).
18 Measurement Result Selection
The RT60 measurement function allows consecutive measurements within one test sequence. An averaged test result of all measurements is automatically calculated.
Select CYC and scroll with the rotary wheel ○ through the individual test result cycles showing
Last Last Test Result
Displays the result of last measurement cycle.
xx Single Test Cycle Results
The individual single test results are marked with CYC xx, where xx is an incriminating number. You may delete individual test results. The averaged reverberation time result uses only the remaining valid measurements. To delete results in a cycle,
Select • DEL with the rotary wheel
Confirm with enter 📋.
AVRG Averaged Test Result
The averaged test results of all cycles are calculated and displayed.

Reverberation Time RT60
19 Correlation Factor in %
The correlation factor is 100% for perfectly linear sound pressure level decay after the sound source has ceased. The natural deviation from this linearity results in lower correlation values. The correlation factor is typically 80 - 100%.
20 Cycle Reverberation Time Test Result
Readout of cycle reverberation time and correlation factor 19 when selection 18 is CYC xx or Last.

Correlation Factor. Scale is on the right Y-axis. For more details see 19.

Reverberation time measurement result of individual displayed cycle. Scale is on the left Y-axis.
21 Y-Axis Correlation Factor
The right Y-axis shows the correlation factor in %. The correlation factor Y-axis is displayed when test result selection ^18 is CYC xx or Last.
22 Delete Cycle Results
Individual cycle results may be deleted, thereby excluding them from the calculation of the AVRG result.

Test Signals
Use either an interrupted pink noise or an impulse source as the test signal.
Interrupted pink noise •
Precision measurements require an omni-directional speaker with identical radiation characteristic in all directions. Various interrupted pink noise test signals with different on/off times are offered on the NTi Audio Test CD (included with the XL2) or the Minirator signal generator. A minimum of three measurement cycles shall be performed. The XL2 averages these readings automatically.
Impulse •
The trigger signal is an impulse source, such as a starter pistol, starter clap or bursting balloon. Individual measurements, or test sequences with repeated trigger signals, can be carried out.
Reverberation Time RT60

RT60 Measurement - Getting Started
Test Signal: Pink Noise
Play a pink noise signal through an omnidirectional speaker in the room under test. The sound source should be played for a long enough time period to ensure that a balance between injected and absorbed acoustic energy has been reached. For example the sound reflections should be given enough time to reach all reflective surfaces in the room. As a rule of thumb, ensure that the pink noise is played for at least the time period of the estimated RT60 test result. If in doubt, play the Minirator MR-PRO or the Test Signal CD as sound source for at least 5 seconds for each cycle. Each time the source signal stops, the XL2 recognizes this interruption, triggers, measures the decay time and calculates the reverberation time automatically. A minimum of three measurement cycles shall be performed.
Test Signal: Impulse
Fire an impulse sound source in the room under test, e.g. use a starter pistol, starter clap or bursting balloon. The XL2 measures the decay time and calculates the reverberation time automatically.
Test Preparations
The XL2 reads the electronic data sheet of any connected ASD microphones provided by NTi Audio and switches the 48V phantom power automatically on as follows:
Connect the measurement microphone to the XL2. Switch on the XL2
The 48V phantom power indication in the upper menu bar changes to ASD. The XL2 is ready for acoustic measurements.
Position the XL2 at the measurement location using a micro-• phone stand or tripod.
- Select the RT60 function in the measurement menu and toggle with page 📋 to the run page RUN.
- Prepare the environment for the measurement. For example mute all sound sources to establish silence.

Reverberation Time RT60
Set Level Markers
- Select the parameter SET with the rotary wheel ⏻ and press enter ⏻.
The environmental noise is measured and the grey level markers are set.
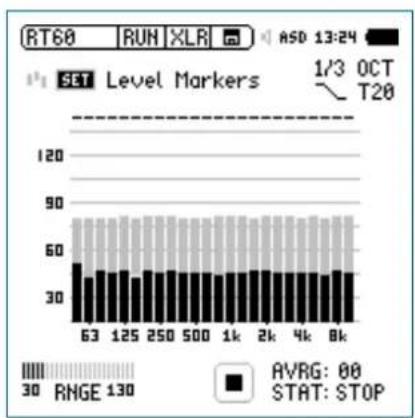
bar
| Category | Value | |---|---| | SET Level Markers | 63 | | SET Level Markers | 125 | | SET Level Markers | 250 | | SET Level Markers | 500 | | SET Level Markers | 1k | | SET Level Markers | 2k | | SET Level Markers | 4k | | SET Level Markers | 8k | | AVG: 00 STAT: STOP RVGE: 00 RNGE: 130Get Ready for the Reverberation Time Measurement
Protect the ears against high sound pressure levels, as the test signals might be very loud.
Setting the pink noise level:
Start the pink noise test signal with the appropriate on/off time according to the room. Use an initial low level.
Increase the test signal level until all level markers for the minimum test signal level are passed. Use an equalizer to push individual band levels.
Switch off the interrupted pink noise signal after you have finished setting the pink noise level.
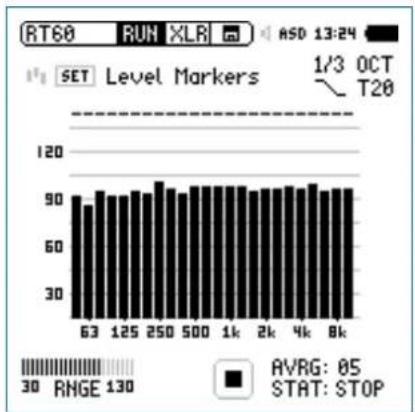
bar
| Time | Value | | :--- | :--- | | 63 | 90 | | 125 | 92 | | 250 | 94 | | 500 | 95 | | 1k | 96 | | 2k | 95 | | 4k | 97 | | 8k | 96 |Reverberation Time RT60

Start the Measurement
- Press start ▶. The status indication switches to ARMED.
Enable the test signal; e.g., switch on the interrupted pink noise signal or fire a starter pistol.
The black bars have to exceed the grey bars completely.
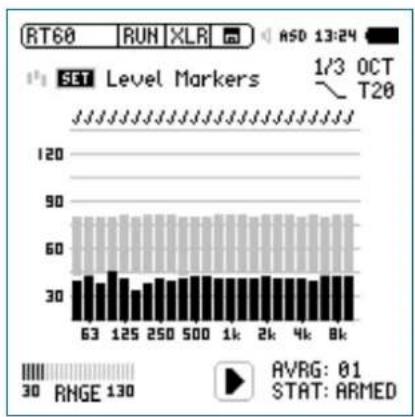
bar
| Position | Level Marker | |---|---| | 63 | 30 | | 125 | 40 | | 250 | 35 | | 500 | 38 | | 1k | 37 | | 2k | 36 | | 4k | 35 | | 8k | 34 | RVG: 01 STAT: ARMEDContinue the Measurement
Using pink noise:
The interrupted pink noise test signal continues with the pre-set on/off time. The XL2 automatically triggers at each cycle. Complete a minimum of three test cycles to accurately calculate the uncertainty factor. Perform more cycles to increase the measurement accuracy (= smaller uncertainty factor).
Using an impulse source:
A single impulse at one measurement location is sufficient. No further measurements are required to increase the statistical measurement accuracy.

Confirmation marks indicating successful measurements, are displayed above each band.

Reverberation Time RT60
Stop the Measurement and Read Out the Result
Press stop
If applicable, switch off the pink noise test signal.
Select the result page • RES with page.

The average reverberation time for each frequency band is displayed in seconds and the measurement uncertainty in %.
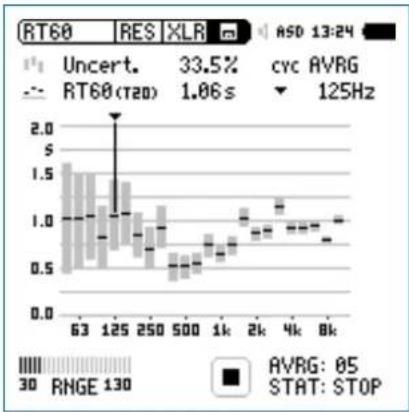
bar
| Frequency | RT60 (tau) | Uncert. (%) | |---|---|---| | 63 | 1.5 | 33.5 | | 125 | 1.4 | 33.5 | | 250 | 1.2 | 33.5 | | 500 | 0.8 | 33.5 | | 1k | 0.9 | 33.5 | | 2k | 1.0 | 33.5 | | 4k | 1.1 | 33.5 | | 8k | 1.0 | 33.5 | RVG: 05 STAT: STOPRead Out the Individual Cycle Result
- If multiple cycles have been recorded, then select CYC with the rotary wheel Ⓞ, press enter Ⓗ and select the individual cycle result with the rotary wheel Ⓞ

Within each cycle, the reverberation time for each frequency band is displayed in seconds and the correlation factor in %.
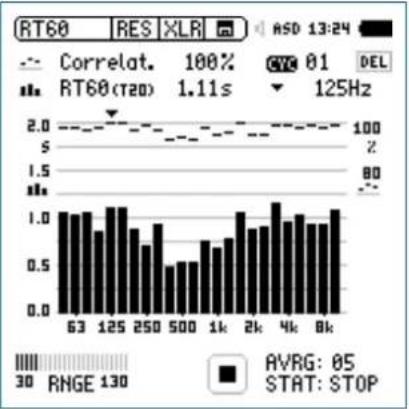
bar_line
| X-axis | RT60 (rad) | Correlation (%) | CYC 01 | DEL | |---|---|---|---|---| | 63 | 1.0 | 100 | 100 | 100 | | 125 | 1.1 | 98 | 98 | 98 | | 250 | 0.7 | 95 | 95 | 95 | | 500 | 0.5 | 92 | 92 | 92 | | 1k | 0.6 | 90 | 90 | 90 | | 2k | 0.8 | 88 | 88 | 88 | | 4k | 1.2 | 85 | 85 | 85 | | 8k | 1.1 | 83 | 83 | 83 | RVG: 05 STAT: STOP
The RT60 reverberation time measurement is completed.
Reverberation Time RT60

Measurements with multiple source and microphone positions
Room resonances may be applicable at individual measurement positions. Thus perform RT60 measurements at further positions within the room and average all readings.
Overload Indication
In case the measurement result exceeds the preset measurement range, then limit arrows indicate this overload condition.
Possible causes for exceeding measurement ranges are
- The measured sound pressure level exceeds the pre-set measurement range -> select the next higher measurement range or reduce the input signal level as applicable.
The input level is near the maximum level of the connected • NTi Audio measurement microphone.
In case the level cannot be reduced (e.g. using a gun as signal source) then the overload condition can be skipped by storing a text-file with the filename "RT60allowOVLD.txt" on the XL2 main directory.
Error Indications
Various error indications are displayed for unsuccessful RT60 measurements. Corrupt cycles can be deleted individually. These results are then excluded from the average calculations.
LOW LEVL•
This is the abbreviation of "low test signal level" during the measurement. Increase the test signal level until the black level markers exceed the grey level markers in every frequency band. Also, ensure that the level falls below the grey level markers, otherwise use a RT60 test signal with longer on/off times.
T>18S •
The measured reverberation time exceeds the time limit of 18 seconds. This is commonly caused by either an incorrect analyzer range setting or environmental noise. In the first case, choose another range setting. In the second case, ensure that the environmental noise remains constant during the measurement, and/or SET the level markers again while the environmental noise is high.

Polarity
Polarity
Polarity measurement is important in matching the left and right speakers for a good stereo sound image. The polarity function measures the polarity of cables, single speakers and speaker cabinets. For testing, use the polarity signal provided on the NTi Audio Test CD or the Minirator test signal generator.
The polarity of individual speakers or speaker cabinets might change with the frequency. For example, the mid-range speaker polarity may differ from the woofer polarity within the same speaker cabinet. Therefore the polarity detailed result page of the XL2 displays the measured polarity of the individual octave bands from 125 Hz to 8 kHz. This allows in-depth verification of the polarity - frequency relationship.

Polarity is a simple test within the very complex science of signal phasing. Drivers, speakers and crossovers all cause phase shifts of the audio signal.
The polarity of various speakers within the same cabinet may differ by design!
Polarity testing is useful for checking the cor-rect wiring of similar speaker systems.
Positive/Negative Result Page
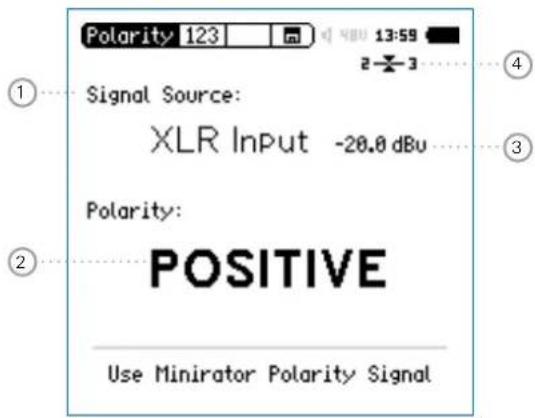
Detailed Result Page
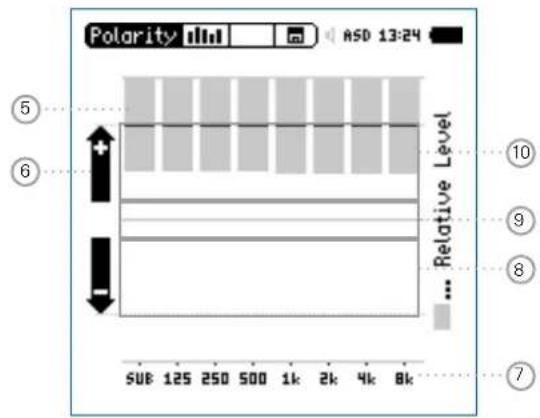
Polarity result for Minirator connected directly to XL2 Analyzer
Polarity

① Input Selection
Select the signal source as follows:
- Select Signal Source with the rotary wheel Ⓞ. Press enter 🔒 to select either
Voice Use the internal voice note microphone of the Note XL2 for polarity measurements. This selection Mic disables the rear speaker.
XLR Input Measure the acoustic polarity with a measurement microphone. Alternatively, measure the polarity of an electrical signal connected with an XLR audio cable.
RCA Measure the polarity of an electrical signal connected with an RCA audio cable.
② Polarity Test Result
Displays either POSITIVE, NEGATIVE or ??? (=undefined). For further visual indication, the limit button 🟢 illuminates green for POSITIVE and red for NEGATIVE polarity.
③ Level RMS
Measures the absolute level of the input signal. The unit's dBu, dBV and V are selectable.

Polarity
④ Balance Indicator
Indication of the audio signal balance between pin 2 and 3 on the XLR input for input signals > -34 dBu.

The input signal is balanced.

The signal is unbalanced. The level of pin 2 is higher than pin 3.

The signal is unbalanced. The level of pin 3 is higher than pin 2.
⑤ Relative Level Indicator
The grey area shows the measured signal energy within the individual frequency bands. The bands with the biggest energy have the most effect on the actual displayed POSITIVE / NEGATIVE polarity result.
⑥ Polarity Indication
+ Polarity of frequency band is positive. The polarity result is in the upper display area; the + area.
- Polarity of frequency band is negative. The polarity result is in the lower display area; the - area.
⑦ X-Axis
Seven octave bands with center frequencies from 125 Hz to 8 kHz. SUB displays the polarity of Sub-woofers; frequency range < 100 Hz.
⑧ Negative Polarity Area
Measurement results area with negative polarity (-). The black line in the middle of relative level indicator ^5 displays the measured polarity of the individual frequency band. The dashed line indicates the lower limit of the measurement result area.
⑨ Uncertain Polarity Area ???
Polarity results for frequency bands in this area are uncertain. Therefore the polarity result ??? is displayed.
10 Positive Polarity Area
Measurement results area with positive polarity (+). The black line in the middle of relative level indicator 5 displays the measured polarity of the individual frequency band. The dashed line indicates the upper limit of the measurement result area.
Polarity

Polarity Measurement - Getting Started
For acoustic polarity measurement you can use the internal voice note microphone, or an external measurement microphone, plugged into the XLR input. The polarity result for left and right speaker cabinets should match for a good stereo sound image.
Feed the speaker cabinet with the polarity test signal of the • Minirator.
Adjust the test level (at Minirator or amplifier) until the test signal is clearly heard.
Enable the polarity test signal at the left speaker cabinet; • mute the right speaker cabinet.
- To activate the internal microphone, select Signal Source with the rotary wheel ⏻ and choose Voice Note Mic with enter ⏻.
Measure the polarity of the left speaker cabinet and save the • screenshot in the memory menu ☐.
Enable the polarity test signal at the right speaker cabinet; • mute the left speaker cabinet.
Measure the polarity of the right speaker cabinet.
Compare the polarity test result of both speaker cabinets.

The polarity measurement is completed.
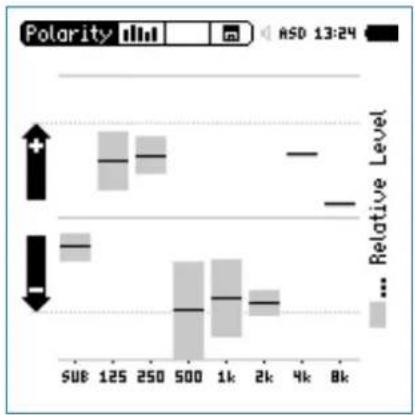
bar
| Category | Value | |---|---| | 500 | + | | 125 | | | 250 | | | 500 | - | | 1k | | | 2k | | | 4k | | | 8k | ... Relative Level |
The sample result shows the polarity as: Sub-woofer: Low energy, no sub installed
- Woofer: Positive
• Mid-range: Negative - Tweeter: Positive (with small levels)
The major part of the signal energy is measured in the mid-range frequency bands. Therefore the overall displayed polarity is NEGATIVE.

Delay Time
Delay Time
The delay time measurement function is suitable for accurate configuration of delay line setups, by optimizing the directionality of the signal source. The XL2 measures the delay time between the reference signal and the acoustic signal from the speaker. The acoustic delay settings are displayed, allowing you to easily set the measured delay time into the delay device in the rack. The NTi Audio delay time test signal is provided either by the Minirator MR-PRO, MR2 or the Test CD included with the XL2.
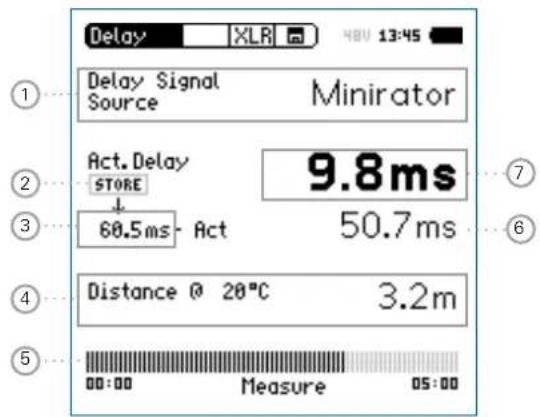
① Delay Signal Source
Select the signal source for the delay measurement:
CD Player Using the supplied NTi Audio Test CD; this setting implies the synchronization time bar is set to 100 seconds = 1 min. 40 sec.; after 100 seconds the XL2 has to be synchronized to the delay test signal again.
Minirator The Minirator MR-PRO and MR2 provides a more reliable test signal source than a CD player. Therefore the XL2 offers an extended time range without synchronization. Only after 300 seconds (5 minutes) does the XL2 have to be synchronized to the delay test signal again.
② Store Button
Press the store button to record the actual delay ⑦ of the reference speaker.
③ Reference Delay Time
Individually-stored delay time of reference speaker.
Delay Time

④ Calculated Distance
Distance from measurement position to speaker in meters or feet, based on the defined temperature in °C or °F
⑤ Synchronization Time Bar
The automated synchronization allows delay time measurements without any connected electrical reference signal for 100 seconds using the NTi Audio Test CD or 300 seconds using the Minirator, MR2 or MR-PRO. It displays the time remaining until the next required synchronization.
⑥ Calculated Delay Time: Store - Actual
Calculated difference between delay time of speaker A and speaker B as shown on the next page. The automated difference calculation simplifies the verification of delay line arrangements, such as those used in larger halls or auditoriums.
⑦ Actual Delay
Actual measured delay time referring to the electrical reference signal.

Delay Test utilizes VoiceNote Microphone
The XL2 uses the internal VoiceNote microphone to measure the acoustic delay. Do not connect any measurement microphone to the XL2 for the delay time measurement.

Rear Speaker
The rear speaker on the XL2 is disabled during delay measurements, thereby avoiding measurement failures. The headphone output is active.

Delay Time
Delay Measurement - Getting Started
The delay time measurement is conducted between the synchronized electrical input signal and the acoustic signal measured by the built-in voice note microphone. In this example, the delay between speakers A and B in the illustrated auditorium is measured.
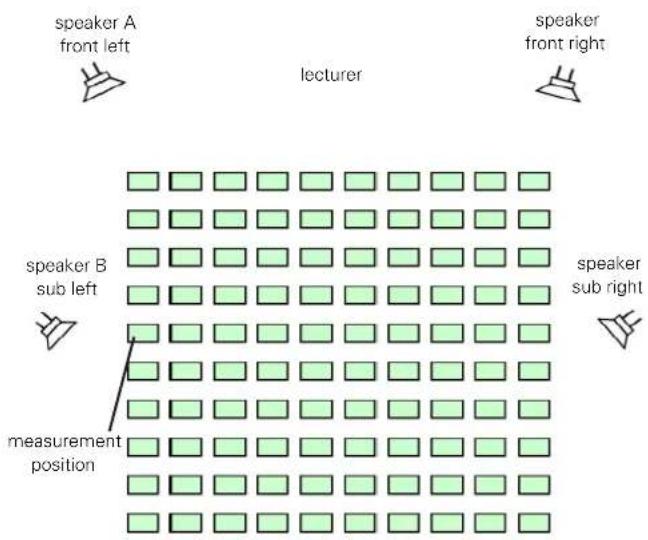
Test Preparations
Prepare the delay test signal; use either the
NTi Audio Test CD•
NTi Audio Minirator for analog systems •
NTi Audio Digirator for digital or Dolby/DTS systems
Start the delay test signal.
Connect the generated delay test signal with an audio cable to the RCA or XLR input of the XL2, e.g. take the reference signal from an auxiliary channel of a mixing console.
Select XLR or RCA input in the upper XL2 menu
Set the actual environment temperature, to ensure that the distance is displayed correctly later.
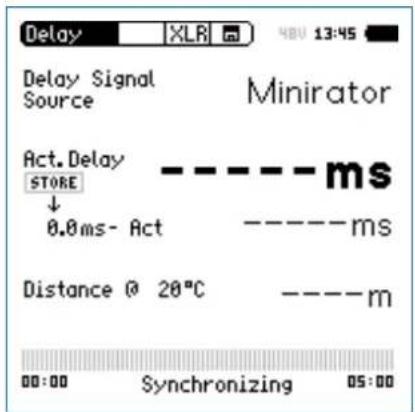
Delay Time

Wait until the XL2 synchronizes to the incoming delay test signal, then the synchronization time bar fills up.
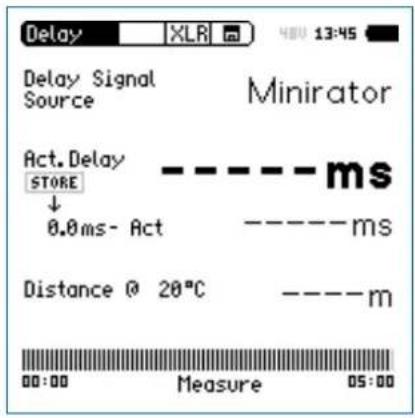
Disconnect the audio cable, with the synchronizing signal, • from the XL2, allowing you to move around freely for the delay measurement. When selecting Minirator as the delay signal source, the XL2 has to be synchronized to the signal source again after 5 minutes. When selecting CD Player as the delay signal source, the XL2 has to be synchronized to the signal source every 100 seconds.
Measure Reference Speaker A
Start the delay test signal at speaker A, mute speaker B. Position yourself with the XL2 at the measurement position next to speaker B sub left as indicated above. This is the worst-case position in the auditorium with regard to acoustic delay in the sound field. The XL2 uses the VoiceNote microphone for the delay test; do not connect any measurement microphone.
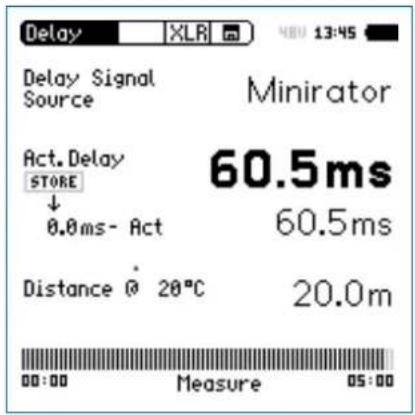
The XL2 measures the delay time of speaker A in reference to the electrical input signal in milliseconds.

Delay Time
Store Reference
- Select the displayed 0.0 ms below Act. Delay with the rotary wheel ⏻ and press enter ⏻
The reference result of speaker A is stored for the difference calculation of delay A - B.
Stop the delay test signal at speaker A.
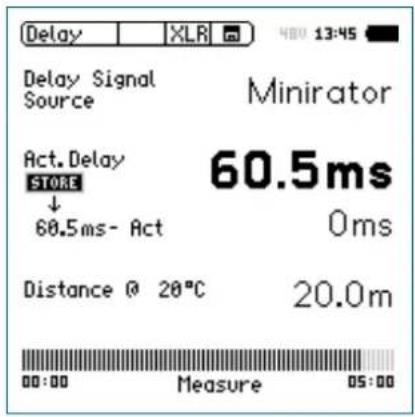
Measure Sub Speaker B
Start the delay test signal at speaker B. Mute speaker A. Position yourself with the XL2 at the shown measurement position. The XL2 uses the VoiceNote microphone for the delay test; do not connect any measurement microphone.
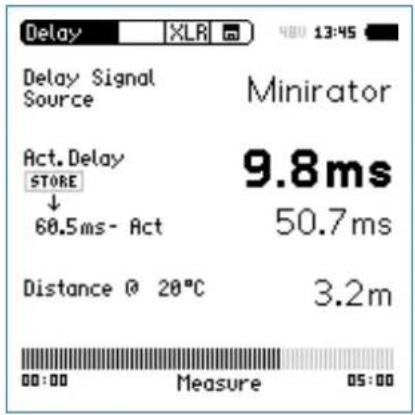
The XL2 measures the delay time of speaker B in reference to the electrical input signal in milliseconds.
Delay Time

Automated Difference Calculation
- The delay time difference between speaker A and B is automatically calculated and shown below the Act. Delay result.

The delay time is measured.
| Delay Test utilizes VoiceNote MicrophoneThe XL2 uses the internal VoiceNote microphone to measure the acoustic delay. Do no connect any measurement microphone to the XL2 for the delay time measurement. | |
| Measurement PositionDo not position the XL2 too close to reflecting surfaces, such as walls or floors. The reflections are likely to prevent accurate measurements. |

Result Interpretation
The resulting time in milliseconds shows the time difference of the sound signal from speaker A and B arriving at the measurement position. Speaker B has to be delayed by the displayed difference result.
To optimize directionality, add a further 5 ms to the calculated difference. The main signal from speaker A then arrives at the measurement position first. The acoustic signal from sub speaker B arrives 5 ms later. This improves the subjective directionality perception of the listeners.
Distance in meter/feet
The distance results in meter/feet are displayed below for easy verification of the test results accuracy. The readings are based on 330 m/s sound speed at 0°C / 32°F.

1/12 Octave + Tolerance
1/12 Octave + Tolerance (optional)
The Spectral Limits Option extends the XL2 function range with an RTA analyzer with spectral resolutions from 1/1 octave down to 1/12th octave. Trace capturing, relative curve display and comprehensive tolerance handling are supported in the FFT Analysis and the high resolution 1/12 Oct + Tol spectral analysis.
Features
High resolution RTA function "1/12 Oct + Tol" with select-able 1/1, 1/3, 1/6 and 1/12 octave spectral resolution Capturing of multiple readings into the internal memory Comparing measurement results against captures with relative or absolute curve display
- Comprehensive tolerance handling with tolerance masks based on captures for passed/failed measurements
Export and import of tolerance and capture files
• Frequency band listening at rear speaker
Applications
- PA-rental: Verifying the frequency response of returned speakers and microphones against reference records ensuring they are back in stock in good working condition.
Industrial quality testing: Passed/Failed test in the production • line or during service of any audible quality criteria, such as with motors, machines, vacuum cleaners, ...
•Cinema: Comparing frequency responses against an ideal response curve according to the X-Curve requirements.
Tolerance Handling
The XL2 Analyzer compares spectral measurements against a tolerance band and visualizes exceptions in every frequency band. The passed/failed condition is further visualized by the limit button and forwarded to the I/O interface of the instrument in order to drive an external alarm device such the accessory SPL Stack Light.
Tolerance curves can either be imported from txt-files or directly derived from captured measurements. The XL2 calculates tolerance bands based on
- Single captured results
- Manually generated txt-files on the PC
• Mean average of multiple captures - Min/Max curves of multiple captures
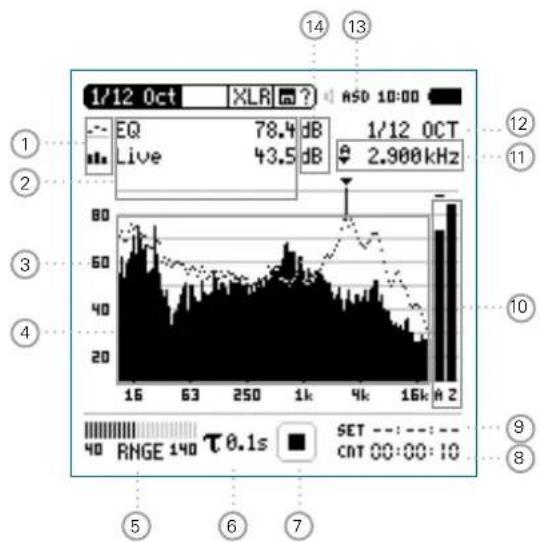
bar_line
| Time (s) | Price (dB) | Volume | |----------|------------|--------| | 16 | 78.4 | 43.5 | | 63 | 78.4 | 43.5 | | 250 | 78.4 | 43.5 | | 1k | 78.4 | 43.5 | | 4k | 78.4 | 43.5 | | 16k | 78.4 | 43.5 | | 2 | 78.4 | 43.5 |1/12 Octave + Tolerance

① Result Symbols / Capture & Start Tolerance Mode
This field offers two functions:
Symbols for measurement results 2
Upper parameter displayed as line.
- Lower parameter displayed as bargraph.
Capture & Start Tolerance Mode•
The displayed spectral readings may be captured in C1 - C8 for
- Comparing measurement results against captures with relative or absolute curve display.
Creating tolerance masks based on captures for • passed / failed measurements.
Capture EQ Capt ures the upper parameter
Capture Live Captures the lower parameter
Manage
captures
Allows to rename captures, clear recorded captures, save captures to the SD Card for export or load captures from the SD Card for import to the XL2.

1/12 Octave + Tolerance
Start tolerance mode
Starts the tolerance mode for passed/failed measurements comparing the actual measurement results against a tolerance band.
② Measurement Result
Actual level result of the indicated frequency band. The cursor readout displays the center frequency and the level of the band indicated by the arrow.
Upper parameter displayed as line.
"Lower parameter displayed as bargraph.
③ Y-Scale setting
Select the Y-Axis with the rotary wheel and confirm with enter ⏻.
- Select the zoom factor between 20, 10, 5, 2.5 dB/div and confirm with enter ⏻.
Scroll up and down with the rotary wheel to select the Y-axis range.
Confirm with enter 📋.
④ Spectral Measurement Result
Spectral results in 1/1, 1/3, 1/6 or 1/12 octave band resolution. Adjust the resolution at ^12 .
⑤ Input Range
The XL2 Analyzer provides three input ranges to accommodate the wide range of input signals. The individual ranges are based on the microphone sensitivity setting in the calibration menu of the XL2. For example at a sensitivity S=20mV/Pa the input ranges are
• Lower range: 10 - 110 dBSPL
• Middle range: 30 - 130 dBSPL
• Upper range: 50 - 150 dBSPL
Select the lowest possible input range according to the maximum level expected during the measurement; e.g., if the sound pressure will be always below 110 dBSPL, then select the lowest input range 10 - 110 dBSPL.
⑥ Time Weighting
Offers selectable time weighting of 0.1, 0.2, 0.5, 1.0 second as well FAST (125 ms) and SLOW (1 second). Applications:
Short Time Weighting High resolution in time with minimum averaging
Long Time Weighting Low resolution in time with longer averaging
1/12 Octave + Tolerance

⑦ Run Indication
The run indication shows the measurement status running, paused or stopped. Various measurement settings are locked during ongoing measurements, such as changing the input ranging or the preset measurement time.
For passed/failed measurements with the Spectral Limits option the run indication may display A for a preset automated level trigger.
⑧ Actual Measurement Time
Counts actual measurement time in hrs:min:sec. Supports setting of time modes: continuous and single.
CNT Timer Mode Continuous
(applicable for standard measurements)
All values are recorded and monitored continuously after starting a measurement with start ▶■.
The actual measurement time is shown.
Timer Mode Single
Automatically stops the measurement after the pre-set measurement time.
Set the required measurement time.
Start the measurement
⑨ Preset Measurement Time
Adjustment of preset measurement time for single timer setting.
10 Broadband Results
User-selectable display of broadband results:
Broadband A A-weighted level
Broadband C C-weighted level
Broadband Z without any frequency weighting
- none
Sum of
Sum of displayed frequency bands (only
bands
available when #HideUnusedBands is

1/12 Octave + Tolerance
⑪ Readout Frequency
You may select any frequency to read out individual levels. The selected frequency is indicated by the cursor arrow.
Choose between the following settings:

The cursor automatically follows the highest level, e.g. tracing live performance feedback frequencies Select the frequency with the rotary wheel ⚙️. Press enter ⚙️. You may read out any individual frequency. Return to auto frequency with enter ⚙️.

The cursor returns to the frequency with highest level bar.

The cursor readout may be set manually to any frequency band or wideband level. The readout remains at the selected frequency. Select the frequency with the rotary wheel ⚙. Press enter ⏻. Select the frequency of interest. Confirm with enter ⏻.

The cursor readout ② displays the measurement results of the selected frequency band.
⑫ Setting of Test Result Resolution
Set the spectral result display to 1/1, 1/3, 1/6 or 1/12 octave band resolution as follows:
- Turn the rotary wheel ⏻ to select the parameter 12. Press enter ⏻ to open the selection window.
- Turn the rotary wheel ⏻ to select 1/1 OCT, 1/3 OCT, 1/6 OCT or 1/12 OCT Press enter ⏻ to confirm.
13 Phantom Power Supply
48V
The XL2 provides 48 V phantom power supply to the microphone or sensor.
ASD
An NTi Audio measurement microphone with automated sensor detection ASD is connected. The XL2 reads the electronic data sheet of the microphone and switches the 48V phantom power automatically on.
48V
Phantom power is switched off.
1/12 Octave + Tolerance

⑭ Measurement Unit
Select the measurement unit as follows:
dB Sound level in dBSPL
This measurement unit is permanently selected while an NTi Audio measurement microphone with electronic data sheet is connected.
dBu Input level in dBu
dBV Input level in dBV
V Input level in Volt
Band Listening
The selected frequency band of the input signal is audible on the rear speaker or at the head-phone output.
Press and hold the speaker button • down. The pop-up window Volume is displayed. Keep the speaker button • pressed and press enter at the same time.
The band listening is activated.

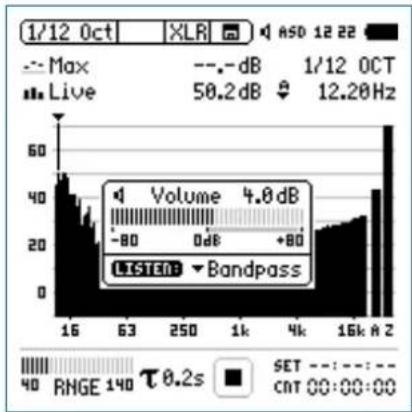
bar
| Category | Value | |---|---| | Max | 50.2 dB | | -dB | 4.0 dB | | -80 dB | 0 dB | | +80 dB | 12.20 Hz | | LISTEN | Bandpass | | RHGE 140 τ 0.2s | SET: 00:00:00
1/12 Octave + Tolerance
1/12 Octave - Getting Started
Test Preparations
The XL2 reads the electronic data sheet of any connected ASD microphones provided by NTi Audio and switches the 48V phantom power on automatically as follows:
Connect the measurement microphone to the XL2. Switch on the XL2
The 48V phantom power indication in the upper menu bar changes to ASD. The XL2 is ready for acoustic measurements.
Position the XL2 at the measurement location using a micro- phone stand or tripod.
- Select the 1/12 Oct + Tol function in the measurement menu.

The displayed wideband and spectral levels are measured and stored simultaneously.
Configuration
The XL2 displays two different sound pressure levels at the same time. You configure to display either the levels Live, Max, Min, EQ, EQ1", EQ4" or captured results.
- Select the upper result parameter with the rotary wheel
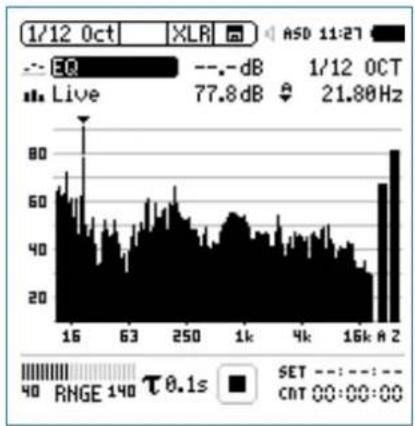
bar
| Time | Value | |------|-------| | 1/12 Oct | 77.8 dB | | 1/12 OCT | 21.80 Hz | | 16k A 2 | 80 dB |- Confirm with enter ⏻.
Select Upper/Lower Reading

The pop-up window Select reading appears.
- Select the time-averaged sound level EQ. All available selections are Z-weighted (= no weighting).
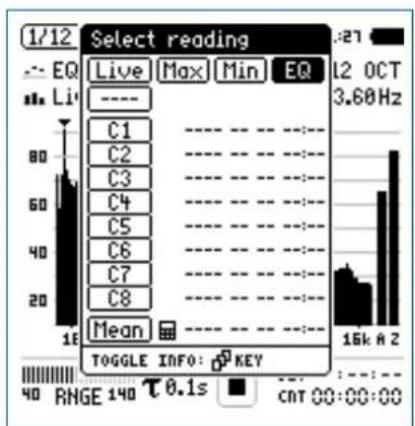
bar
| Category | Value | | -------- | ----- | | Live | 1/12 | | Max | 1/12 | | Min | 1/12 | | EQ | 1/12 | | 1/2 Oct | 3.60Hz | | 15kΩ | 2 | | 0.1s | 0 | | CAT | 0 |Confirm with enter 📄.

The pop-up window Select reading mode appears.
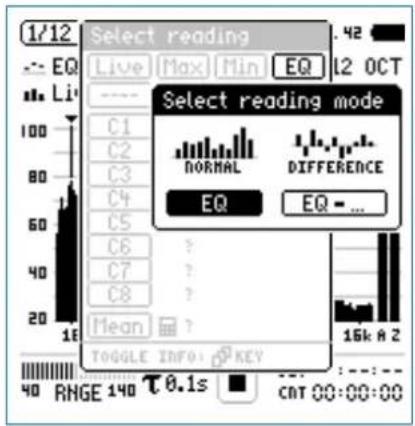
- Select EQ for normal absolute display of measurements. Follow the same instruction and select the lower spectral reading Live.

Press start measure and display the sound levels results indicated with ----.

1/12 Octave + Tolerance
Select Input Range
Select the lowest possible input range according to the maximum level expected during the measurement.
- Select the input range RNGE and press enter ⏻.
Turn the rotary wheel Ⓧ to set the applicable input range and confirm with enter ⏻.
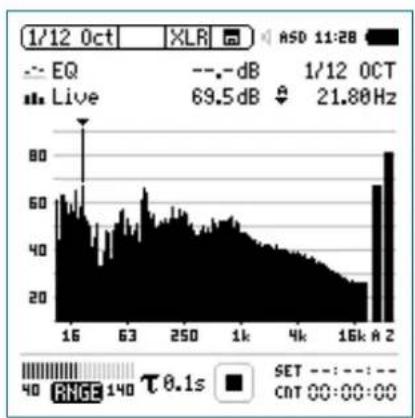
bar
| Time | Value | | :--- | :--- | | 16 | 60 | | 63 | 55 | | 250 | 50 | | 1k | 45 | | 4k | 40 | | 16k | 35 | | A 2 | 80 | ASD 11:28 EQ - - dB 1/12 OCT Live 69.5dB ↓ 21.80Hz RHGE 140 τ 0.1s SET CNT 00:00:00Start Measurement
The XL2 measures the selected sound pressure lev-•els Live and EQ. All available sound levels are Z-weighted (= no weighting).
Press start
The run indication switches to running ▶. The actual sound level Live and the averaged level EQ are displayed. The parameter RUN flashes in the memory menu.
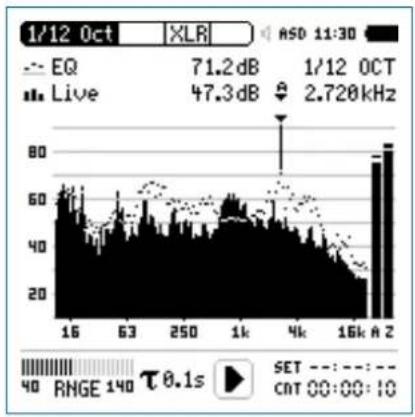
bar
| Time | Value | | :--- | :--- | | 1/12 Oct | 71.2 dB | | 1/12 OCT | 47.3 dB | | 16k A 2 | 80 | | 16k A 2 | 60 | | 63 | 50 | | 250 | 40 | | 1k | 30 | | 4k | 20 | | 16k | 10 | The chart displays a bar graph with labels for 'EQ' and 'Live', and indicates a frequency of 2.720 kHz.1/12 Octave + Tolerance

Stop Measurement and Data Saving
Press stop
The XL2 stores the measurement data automatically.
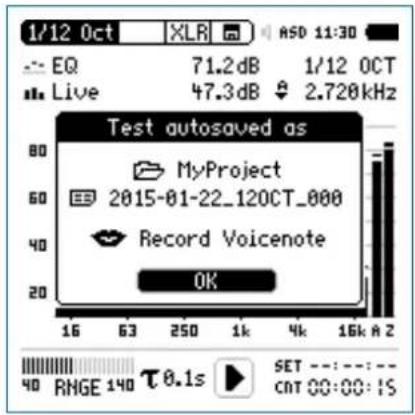
Press enter 🔒 to confirm. The measurement data is stored on the SD Card in ASCII format.
The measurement is completed.
Audio Recording
The XL2 Analyzer may record a linear audio file (48 kHz, 24 Bit) of the measurement period together with the spectral data. Just load a txt-file named "12audio.txt" in the root directory of the XL2. This requires the installed option Extend Acoustic Pack.
Capture References and Create Tolerances
The Spectral Limits Option extends the function range of the XL2 with trace capturing, relative curve display and comprehensive tolerance handling for the FFT Analysis and the high resolution 1/12 Oct + Tol spectral analysis.
Features:
Capturing of multiple readings into the internal memory •
- Comparing measurement results against captures with relative or absolute curve display
• Comprehensive tolerance handling - Creating tolerance masks based on captures for passed / failed measurements
- Export and import of tolerance and capture files
• True peak level in 1/1 and 1/3 octave resolution - High-resolution Zoom-FFT up to 0.4 Hz steps in the frequency range 5 Hz - 20 kHz
Read the detailed description in the separate chapter Spectral Limits Option (Capture + Tolerances).

1/12 Octave + Tolerance
1/12 Octave - Fast Frequency Response Measurement
The XL2 provides fast and accurate frequency response measurement within one second using pink noise. For this purpose, the Minirator MR-PRO generates the test signal "Fast Pink Noise" tailored to this application.
Test Signal
The test signal "Fast Pink Noise" is not "random"; it contains an absolutely flat spectrum within the cycle time. The frequency resolution of the test signal is limited to 1 / cycle time; therefore you can choose between two different test signals:
| Minirator MR-PRO Test Signal | XL2 Frequency Resolution | XL2 Measurement Duration |
| File -> Signals -> Fastpnk1 | 1/1 Octave 1/3 Octave | 1 second |
| File -> Signals -> Fastpnk4 | 1/6 Octave 1/12 Octave | 4 seconds |
Measurement in 1/3 Octave Resolution
- Select the test signal Fastpnk1 on the Minirator MR-PRO. Connect the MR-PRO to the input of the device under test.
• Take the XL2 and select the function 1/12Oct. Select the one-third octave band frequency resolution. - Select the measurement parameter EQ, the mode "Single" and set the measurement duration to one second.
- For higher frequency resolutions use the test signal Fast-pnk4 and a measurement duration of four seconds.
- Start the measurement
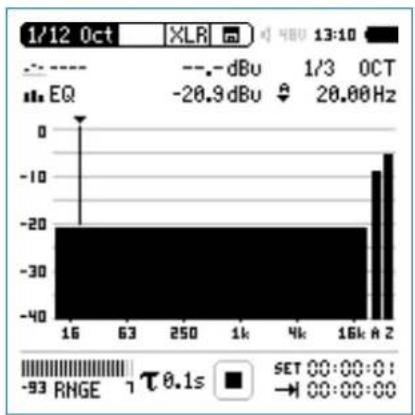
bar
| Frequency | EQ | | :--- | :--- | | 16k | -20.9 dBu | | 63k | -20.9 dBu | | 250k | -20.9 dBu | | 1k | -20.9 dBu | | 4k | -20.9 dBu | | 16kA | -10 dBu | | 16kA | -5 dBu | | 16k | -2 dBu | | 16k | -1 dBu | | 16k | -5 dBu | | 16k | -2 dBu | | 16k | -1 dBu | | 16k | -5 dBu | | 16k | -2 dBu | | 16k | -1 dBu | | 16k | -5 dBu | | 16k | -2 dBu | | 16k | -1 dBu | | 16kA | -5 dBu | | 16kA | -2 dBu | | 16kA | -1 dBu | | 16kA | -5 dBu | | 16kA | -2 dBu | | 16kA | -1 dBu | | 16kA | -5 dBu | | 16kA | -2 dBu | | 16kA | -1 dBu | | 16kA | -5 dBu | | 16kA | -2dBu | | 16kA | -1dBu | | 16kA | -5dBu | | 16kA | -2dBu | | 16kA | -1dBu | | 16kA | -5dBu | | 16kA | -2dBu | | 16kA | -1dBu | | 16kA | -5dBu | | 16kA | -2dBu | | 16kA | -1dBu | | Note: The frequency values are estimated based on the given code. The text 'SET' and 'RNGE' are not explicitly provided in the image.You have successfully completed the measurement.
Optimize the Frequency Response
The fast frequency response measurement with the test signal "Fast Pink Noise" saves time in optimizing the frequency response of audio devices or speakers. During your settings on the equalizer, you will receive a precise result on the XL2 screen within one second.
- Select the test signal Fastpnk1 on the Minirator MR-PRO. Connect the MR-PRO to the input of the device under test.
• Take the XL2 and select the function 1/12Oct. - Select the measurement parameter EQ1", the mode "Single" and set the measurement duration to one second. Adjust the settings on the equalizer.
The XL2 displays the actual frequency response within a second.
Test Signal „Fast Pink Noise“ Advantage
Frequency response measurements often use the standard Pink Noise in combination with a 1/n octave analysis. Because of the randomness, longer averaging times are necessary to get accurate results. Too short averaging times result in "noise" in the result, as shown here:

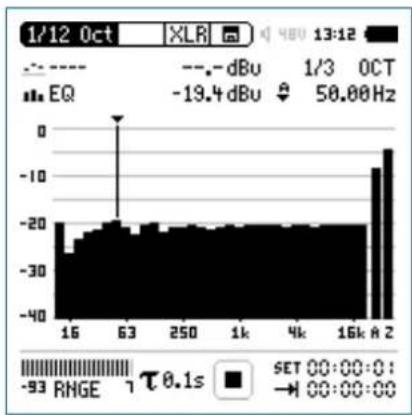
bar
| Frequency (Hz) | Value | |---|---| | 16 | -25 | | 63 | -20 | | 250 | -20 | | 1k | -20 | | 4k | -20 | | 16k | -20 | | A | -10 | | 2 | -5 | 13:12 1/3 OCT EQ SET 00:00:0: → 00:00:00 -93 RINGE τ 0.1sIn comparison, the test signal "Fast Pink Noise" enables a precise measurement result within one or four seconds.

Noise Curves
Noise Curves (optional)
The Spectral Limits Option extends the XL2 with the Noise Curves measurement function. A noise curve may be used to characterize room noise or other environments. Various standardized international noise curves are the most widely used means for evaluating background sound in buildings, and other facilities such as transit facilities, as well as in other indoor outdoor spaces. Residual noise in buildings may be generated from both environmental sources (e.g. outside traffic) and systemic sources (e.g. heating, ventilating, and air-conditioning (HVAC) systems; or other machinery in use). It is also frequently necessary to measure residual noise curves prior to expected changes in advance of construction or prior to other expected environmental noise changes.
Noise Rating NR
(in accordance with ISO/R 1996-1971)
Noise rating (NR) is a graphical method for assigning a single number rating to a noise spectrum. It can be used to specify the maximum acceptable level in each octave band of a frequency spectrum, or to assess the acceptability of a noise spectrum for a particular application. The method was originally proposed for use in assessing environmental noise, but it is now used frequently for describing noise from mechanical ventilation systems in buildings. To make a rating, the measured noise spectrum is superimposed on a family of NR contours; the NR of the spectrum corresponds to the value of the first NR contour that is entirely above the spectrum.
Noise Criteria NC
(in accordance with ANSI S12.2-2008 and -1995)
The NC rating of a spectrum is designated as the value of the lowest NC curve above the measured octave-band spectrum. The designating number for any NC curve is, approximately, its Speech Interference Level (SIL): the average of the levels in the 500, 1000, 2000 and 4000 Hz octave bands. SIL is a simple metric, which measures the effects of noise on speech intelligibility. The XL2 Analyzer includes the tangency method adaptation in accordance with the standard.
Room Noise Criteria RNC
(in accordance with ANSI S12.2-2008)
The RNC method is used to determine noise ratings when the noise from HVAC systems at low frequencies is high, and which is also suspected of containing sizeable fluctuations or surging.
Noise Curves

It essentially represents a rumble criterion. The RNC curves also provide a procedure that reduces the result essentially back to the NC curves when systems are well designed and acoustically well-behaved. Following the RNC specification, the XL2 measures the octave-band sound pressure level every 100 ms, followed by processing to determine the applicable room noise criterion (RNC) curve. The minimum measurement time is 20 seconds.
Preferred Noise Criteria PNC (in accordance with ASA 1971)
PNC curves represent a more stringent method based on an extension of the basic Noise Criteria system. They have been used in the past to judge the acceptability of ventilation and other background broadband noise. PNC curves are less often used than Noise Criteria curves because they are more stringent at lower frequencies than the Noise Criteria curves, but also because the latest (2008) version of Noise Criteria curves also includes an extended frequency range somewhat mitigating the original reasons for PNC.
Room Criteria RC (in accordance with ANSI S12.2-1995)
The RC criterion curves are a system for use in the design of heating, ventilating, and air-conditioning (HVAC) systems in office buildings, dwelling units, etc., where the desired mid-frequency levels are in the range of 25 to 50 dB. Each RC criterion curve bears a rating number equal to the level at 1000 Hz.
Spectrum classification Neutral spectrum (N): The levels at 500 Hz and below do not exceed the RC curve corresponding to a sound level spectrum by more than 5 dB; and the spectrum levels in Band 1000 Hz and higher do not exceed the corresponding RC curve by more than 3 dB. Rumble (R): Excessive noise in low-frequency band The level in one or more of the octave bands at and below 500 Hz exceeds the RC curve corresponding to a spectrum by more than 5 dB. Hiss (H): Excessive noise in high-frequency bands The level in one or more of the octave bands at and above 1000 Hz exceeds the RC curve corresponding to a spectrum by more than 3 dB. Vibration and rattle (RV): The level in one or more of the octave bands from 16 Hz through 63 Hz exceeds the criterion for moderately noticeable rattle.

Noise Curves
Noise Curves Result Page
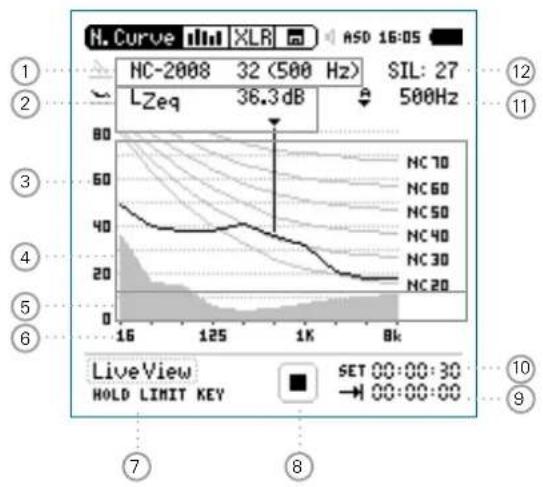
line
| Time | LZeq (dB) | |------|-----------| | 16 | 40 | | 125 | 36.3 | | 1K | 36.3 | | 8K | 36.3 |RNC Information Page
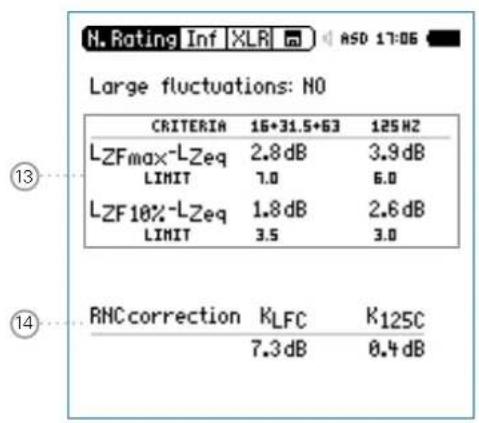
The standards list the noise criteria in 5 dB steps. The XL2 measures the noise criteria in detailed 1 dB steps, which are calculated by linear interpolation between the standardized 5 dB levels.
The RNC information page is available when viewing Noise Criteria and Room Noise Criteria results, in accordance with ANSI S12.2-2008. It reports any large fluctuations or surging at low frequencies, e.g. caused by fans.
Noise Curves

① Noise Curve
Selection of the noise curve type and measurement result.
Noise Curve Types
Noise Rating NR•
Noise Criteria NC (2008) and (1995)•
Room Noise Criteria RNC•
Room Criteria RC (1995)•
Preferred Noise Criteria PNC (1971)•
Measurement Result
The noise rating of a spectrum is designated as the value of the highest curve "touched" by the measured octave-band spectrum. The octave band in which this "touching" occurs is noted along with the curve designation.
② Measurement Result
Actual level result of the indicated frequency band. The cursor readout displays the center frequency and the level of the band pointed to by the arrow. With the cursor in automatic mode, the arrow points to the frequency band with the highest noise rating as shown in ①.
③ Y-Scale setting
Auto-Scroll •
Zoom:
-Select the Y-Axis with the rotary wheel ⏻ and confirm with enter ⏻.
- Select the zoom factor between 10, 5, 2.5 dB/div and confirm with enter ⏻.
④ Noise Measurement Result
Real-time spectrum in 1/1 octave band resolution.
⑤ Noise Floor
The grey area shows the noise floor of the connected NTi Audio measurement microphone (provided by the electronic data sheet) in combination with the XL2 Analyzer.
⑥ X-Scale
X-Scale from 16 Hz to 8 kHz.

Noise Curves
⑦ Live View
Select theLiveView with the rotary wheel to get an overview of the current noise level. Alternatively press the limit button.
The XL2 measures the noise curve after pressing the start button ▶This will provide the noise rating measurement in accordance with all standards.
⑧ Run Indication
The run indication shows the measurement status running, paused or stopped. Various measurement settings are locked during ongoing measurements, such as the preset measurement time.
⑨ Actual Measurement Time
Counts actual measurement time in hrs:min:sec. Supports time modes: continuous and single.
CNT Timer Mode Continuous
(applicable for standard measurements)
All values are recorded and monitored continuously after starting a measurement with start ▶■ The actual measurement time is shown.
Timer Mode Single
Automatically stops the measurement after the pre-set measurement time.
Set the required measurement time.
Start the measurement
The actual measurement time counts back to zero and the measurement ends.
10 Preset Measurement Time
Adjustment of preset measurement time for the timer mode single.
Noise Curves

⑪ Readout Frequency
You may select any frequency to read out individual levels. The selected frequency is indicated by the cursor arrow.
Choose between the following settings:

The cursor follows automatically the frequency band with the highest noise rating.
Select the frequency with the rotary wheel ⚙️. Press enter ⏻.
You may read out any individual frequency.
Return to auto frequency with enter 📋.
The cursor returns to the frequency with highest noise rating.

The cursor readout may be set manually to any frequency band or wide band level. The readout remains at the selected frequency.
Select the frequency with the rotary wheel ⚙️. Press enter ⏻.
Select the frequency of interest. Confirm with enter 🔒.
The cursor readout ② displays the measurement results of the selected frequency band.
⑫ SIL Measurement Result
The speech interference level (SIL) result is shown for noise curve types NC-2008 and NC-1995 ①. It is calculated by averaging the octave-band sound pressure levels at 500 Hz, 1000 Hz, 2000 Hz and 4000 Hz. If the measured spectrum in any octave band does not exceed any of the octave bands of that NC(SIL) curve, the spectrum is designated NC(SIL). If one or more octave-band levels exceed the NC(SIL) curve, then the NC curve number may differ to the SIL value, as the NC rating for that spectrum must be determined using the tangency method.
13 Large Fluctuations
This reports any large fluctuations at low frequencies for the Room Noise Criteria RNC in accordance with ANSI S12.2-2008. If one or more displayed measurement results exceed the limits, then large fluctuations exist. Concluding the LEQ levels in the octave frequency bands below 300 Hz are automatically "penalized" at the RNC measurement.
14 Correction Values
The noise curve type RNC uses these correction values based on the measured fluctuation results to determine the RNC curve result.

Noise Curves
Recommendations
| Type of Room - Space Type | Recommended NC and RNC Curve | Equivalent Sound Level | RC curve |
| Concert halls 15-18 -- | |||
| Small auditoriums 25-30 35-39 - | |||
| Large auditoriums 20-25 30-35 - | |||
| Broadcast studios 15-25 16-35 - | |||
| Drama theaters 20-25 30-35 - | |||
| Private residences 25-40 35-48 25-30(N) | |||
| Schools 25-35 35-40 25-40 (N) | |||
| Hotels 25-50 35-57 25-45 (N) | |||
| Offices 25-40 35-48 25-35 (N) |
| Type of Room - Space Type | Recommended NC and RNC Curve | Equivalent Sound Level | RC curve |
| Conference rooms 25-35 35-44 25-35 (N) | |||
| Hospitals and clinics | 25-45 35-52 25-40 (N) | ||
| Movie theaters | 30-40 39-48 - | ||
| Churches | 30-35 39-44 25-35 (N) | ||
| Courtrooms | 30-35 39-44 25-35 (N) | ||
| Libraries 30-35 44-48 30-40 (N) | |||
| Restaurants | 40-45 48-52 - | ||
| Light maintenance shop | 45-55 52-62 - | ||
| Shops and garages | 50-60 57-67 - | ||
Noise Curves

Noise Curves - Getting Started
Test Preparations
The XL2 reads the electronic data sheet of any connected ASD microphones provided by NTi Audio and switches the 48V phantom power automatically on as follows:
Connect the measurement microphone to the XL2. Switch on the XL2
The 48V phantom power indication in the upper menu bar changes to ASD. The XL2 is ready for acoustic measurements.
- Select the Noise Curves function in the measurement menu.

The microphone should be moved slowly to positions around the entire space at locations that are near the average normal standing or seated height of human ears. The recommended period is 20 seconds or longer.
Configuration
- Select the noise curve type with the rotary wheel.
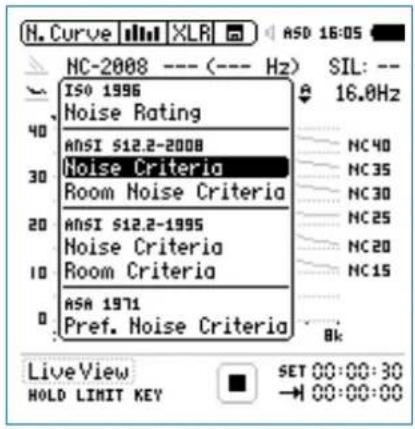
- Confirm with enter ⏻.

The XL2 measures all noise curve types at the same time, thus you can change the selection also after the measurement.

Noise Curves
Start Measurement
Press start
The run indication switches to running. The actual noise level LZeq of the selected octave band is displayed. The parameter RUN flashes in the memory menu. The Y-axis adjusts automatically according the measurement result.
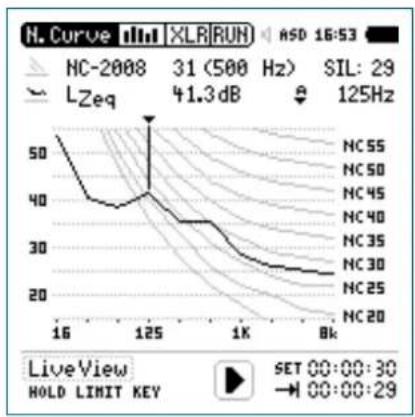
line
| Frequency | Value | | --------- | ----- | | 16 | 50 | | 125 | 41.3 | | 1K | 30 | | 8K | 20 |Stop Measurement and Data Saving
Press stop
The XL2 stores the measurement data automatically.
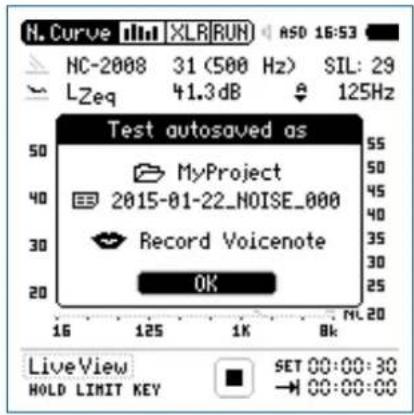
Press enter 🔒 to confirm. The measurement data is stored on the SD Card in ASCII format.
The measurement is completed.
Noise Curves


STIPA
Speech Intelligibility STIPA (optional)
The STIPA analyzer option allows reliable measurement of the speech transmission index (STI) within 15 seconds. Besides the single value STI or CIS (= common intelligibility scale) test result, a detailed view of the modulation indices and individual band level results is provided. The STIPA analyzer meets the latest standard edition 4.0 IEC 60268-16, released in 2011. The XL2 also supports noise corrections, automated averaging of measurements and the older standard editions 2.0 and 3.0.
The intelligibility of speech depends on:
Signal-to-noise ratio•
Psychoacoustic masking effects•
Sound pressure level
Ambient noise level•
• Reverberation time RT60
- Reflections
- Frequency response
- Distortion
The speech intelligibility measurement function STIPA is an option for the XL2 Audio and Acoustic Analyzer. Ask your local representative for purchasing details.
Signal Source
Choose the applicable STIPA test signal source:
NTi Audio
The NTi Audio TalkBox simulates a person talking at a precise acoustic level, enabling the measurement of the complete signal chain including the microphone.
- Place the NTi Audio TalkBox in front of the microphone at the typical position of the talking persons head.
- Select Track 1 for the STIPA test signal.
- Select Output Mode to Speaker; you should hear the STIPA test signal.
Minirator
MR-PRO
The Minirator MR-PRO is used for electrical signal injection into public address systems that commonly use alarm messages from a hard drive (systems without a microphone).
CD Player
The NTi Audio CD "STIPA V1.1", included in the package, can be used with a professional CD player. For details see the chapter STI Measurement Hints.
The standard STIPA signal is based on random noise limited to the bands contained in a male speech spectrum.
STIPA

STIPA Numeric Result Page
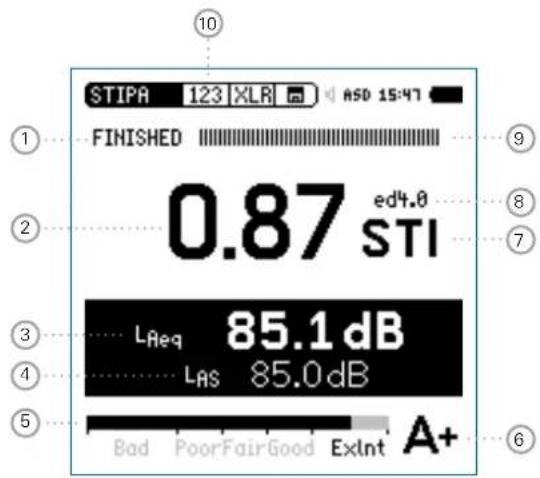

Use only the original NTi Audio test signal for speech intelligibility measurements with the XL2. Other signals may not seamlessly loop, thus causing wrong measurement results!
STIPA Table Result Page
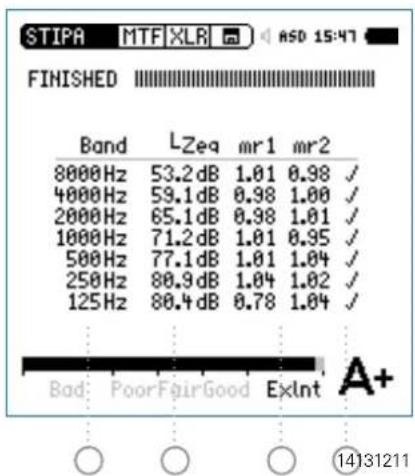

STIPA
STIPA Averaging
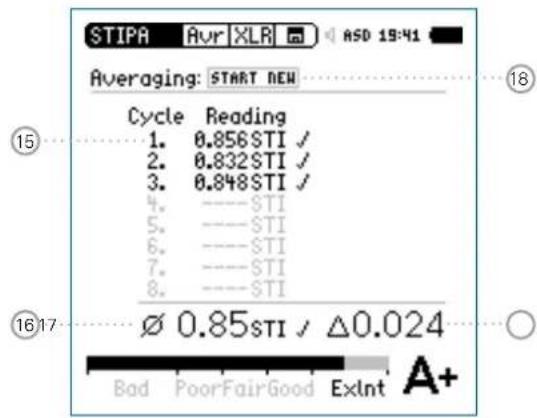
STIPA Ambient Noise Correction
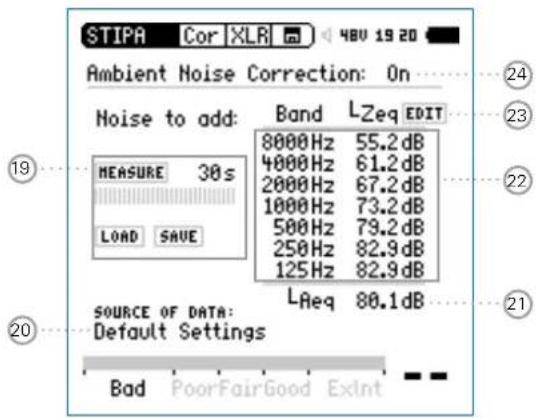
① Run Indication This icon displays the run status of the measurement.
STIPA

② Measurement Result
Single value speech transmission index result.
Repeatability of measurement result:
Since a dedicated noise test signal is used, the result may deviate by a of maximum 0.03 STI (=Max-Min) at the same measurement position.
③ Sound Level LAeq
Shows the time-averaged sound level of the 15 seconds measurement cycle time.
④ Sound Level LAS
Actual sound pressure level.
⑤ Analog Test Result Bargraph
Bargraph display and interpretation of the speech intelligibility measurement result
ExInt 0.75 - 1.00 STI
Good 0.60 - 0.75 STI•
Fair 0.45 - 0.60 STI•
Poor 0.30 - 0.45 STI•
Bad 0.00 - 0.30 STI•
⑥ Qualification Scale
The STI value is shown as a letter representing the qualification scale below. Listed are also examples of typical application environments.
| Band | STI Range | Examples of typical uses |
| A+ | >0.76 | recording studios |
| A | 0.72 - 0.76 | theatres, speech auditoria, parliaments, courts |
| B | 0.68 - 0.72 | theatres, speech auditoria, parliaments, courts |
| C | 0.64 - 0.68 | teleconference, theatres |
| D | 0.60 - 0.64 | class rooms, concert halls |
| E | 0.56 - 0.60 | concert halls, modern churches |
| F | 0.52 - 0.56 | PA in shopping malls, public offices, cathedrals |
| G | 0.48 - 0.52 | PA in shopping malls, public offices |
| H | 0.44 - 0.48 | PA in difficult acoustic environments |
| I | 0.40 - 0.44 | PA in very difficult spaces |
| J | 0.36 - 0.40 | not suitable for PA systems |
| U | < 0.36 | not suitable for PA systems |

STIPA
⑦ Measurement Unit
The speech intelligibility result is displayed in STI (Speech Transmission Index) or CIS (Common Intelligibility Scale), whereby CIS is calculated as CIS = 1 + log STI.
⑧ Edition of Standard IEC60268-16
ed4.0 actual edition released in 2011 with continuous level dependent auditory masking function ed3.0 old edition released in 2003 with stepped level dependent auditory masking function ed2.0 old edition released in 1998 with fixed masking function
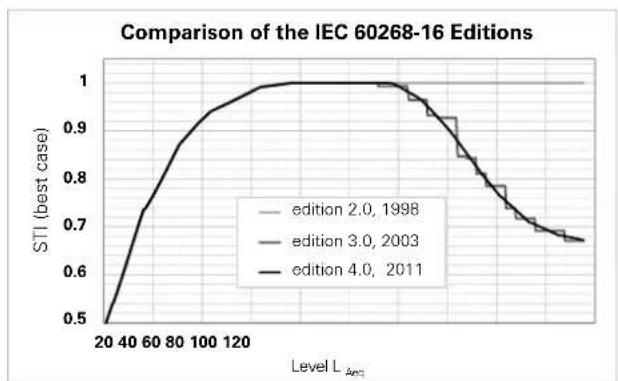
line
| Level L_Acc | STI (best case) - edition 2.0, 1998 | STI (best case) - edition 3.0, 2003 | STI (best case) - edition 4.0, 2011 | | ----------- | ------------------------------------ | ------------------------------------ | ------------------------------------ | | 20 | 0.5 | 0.5 | 0.5 | | 40 | 0.7 | 0.7 | 0.7 | | 60 | 0.8 | 0.8 | 0.8 | | 80 | 0.9 | 0.9 | 0.9 | | 100 | 0.95 | 0.95 | 0.95 | | 120 | 1.0 | 1.0 | 1.0 | | 140 | 1.0 | 1.0 | 1.0 | | 160 | 1.0 | 1.0 | 1.0 | | 180 | 1.0 | 1.0 | 1.0 | | 200 | 1.0 | 1.0 | 1.0 | | 220 | 1.0 | 1.0 | 1.0 | | 240 | 1.0 | 1.0 | 1.0 | | 260 | 1.0 | 1.0 | 1.0 | | 280 | 1.0 | 1.0 | 1.0 | | 300 | 1.0 | 1.0 | 1.0 | | 320 | 1.0 | 1.0 | 1.0 | | 340 | 1.0 | 1.0 | 1.0 | | 360 | 1.0 | 1.0 | 1.0 | | 380 | 1.0 | 1.0 | 1.0 | | 400 | 1.0 | 1.0 | 1.0 | | 420 | 1.0 | 1.0 | 1.0 | | 440 | 1.0 | 1.0 | 1.0 | | 460 | 1.0 | 1.0 | 1.0 | | 480 | 1.0 | 1.0 | 1.0 | | 500 | 1.0 | 1.0 | 1.0 | | 520 | 1.0 | 1.0 | 1.0 | | 540 | 1.0 | 1.0 | 1.0 | | 560 | 1.0 | 1.0 | 1.0 | | 580 | 1.0 | 1.0 | 1.0 | | 600 | 1.0 | 1.0 | 1.0 | | 620 | 1.0 | 1.0 | 1.0 | | 640 | 1.0 | 1.0 | 1.0 | | 660 | 1.0 | 1.0 | 1.0 | | 680 | 1.0 | 1.0 | 1.0 | | 700 | 1.0 | 1.0 | 1.0 | | 720 | 1.0 | 1.0 | 1.0 | | 740 | 1.0 | 1.0 | 1.0 | | 760 | 1.0 | 1.0 | 1.0 | | 780 | 1.0 | 1.0 | 1.0 | | 800 | 1.0 | 1.0 | 1.0 | | 820 | 1.0 | 1.0 | 1.0 | | 840 | 1.0 | 1.0 | 1.0 | | 860 | 1.0 | 1.0 | 1.0 | | 880 | 1.0 | 1.0 | 1.0 | | 900 | 1.0 | 1.0 | 1.0 | | 920 | 1.0 | 1.0 | 1.0 | | 940 | 1.0 | 1.0 | 1.0 | | 960 | 1.0 | 1.0 | 1.0 | | 980 | 1.0 | 1.0 | 1.0 | | 100 | 1.5 | 1.5 | 1.5 | | Peak | - | - | - | | Peak L_Acc | - | - | - | | Peak Value | - | - | - | | Peak Value | - | - | - | | Peak Value | - | - | - | | Peak Value | - | - | - | | Peak Value | - | - | - | | Peak Value | - | - | - | | Peak Value | - | - | - | | Peak Value | | Peak Value | - | - | - | | Peak Value | | Peak Value | | Peak Value | | Peak Value | | Peak Value | | Peak Value | | Peak Value | | Peak Value | | Peak Value | | Peak Value | | Peak Value | | Peak Value | | Peak Value | | Peak Value | | Peak Value | | Peak Value | | Peak Value | | Peak Value | | Peak Value | | Peak Value | | Peak Value | | Peak Value | | Peak Value | | Peak Value | | Peak Value | | Peak Value | | Peak Value | | Peak Value | | Peak Value | | Peak Value | | Peak Value | | Peak Value | | Peak Value | | Peak Value | | Peak Value | | Peak Value | | Peak Value | | Peak Value | | Peak Value | | Peak Value | | Peak Value | | Peak Value | | Peak Value | | Peak Value | | Peak Value | | Peak Value | | Peak Value | | Peak Value | | Peak Value | | Peak Value | | Peak Value | | Peak Value | | Peak Value | | Peak Value | | Peak Value | | Peak Value | | Peak Value | | Peak Value | | Peak Value | | Peak Value | | Peak Value * Max| | Level L_Acc* * STI (best case) * STI (best case) * STI (best case) * STI (best case) * STI (best case) * STI (best case) * STI (best case) * STI (best case) * STI (best case) * STI (best case) * STI (best case) * STI (best case) * STI (best case) * STI (best case) * STI (best case) * STI( best case) * STI( best case) * STI( best case) * STI( best case) * STI( best case) * STI( best case) * STI( best case) * STI( best case) * STI( best case) * STI( best case) * STI( best case) * STI( best case) * STI( best case) * The values are estimated based on the chart title and are not explicitly provided in the code text for the chart title and axis labels.⑨ Progress Bar
Measurement status indication; a single speech intelligibility measurement takes 15 seconds. The actual measurement time and measurement status are indicated here.
10 Page Selector
Select between these pages:

Speech intelligibility measurement result

Table result page with modulation ratio and sound levels for each octave band

On-site averaging of results.

Ambient Noise Correction
The page button Ⓞ toggles between the 123 - Tab - Avr screens. These pages show the speech intelligibility measurement results. The page Cor offers setting the noise spectra prior the STI measurement.
11 Octave Bands
Frequencies 125 Hz - 8 kHz in 1/1 octave band resolution.
⑫ Sound Pressure Level L_eq
Individual time-averaged octave band level L_eq .
STIPA

13 STIPA Modulation Ratio mr1, mr2
For good speech intelligibility it is mandatory that the integrity of the transmitted voice signal modulations are preserved. Therefore STIPA is based on measuring the MTF (Modulation Transfer Function). This function quantifies the degree to which the voice modulations are preserved in individual octave bands. The STIPA method determines the MTF by analyzing the seven frequency bands. Each band is modulated with two frequencies, resulting in the modulation ratio mr1 and mr2. All indexes together combined with psycho-acoustic models provide the single-value speech intelligibility result.
14 Error Detection
The built in error detection helps identifying faulty measurements caused by the amount of impulsive ambient noise. Such noise influences the accuracy of any speech intelligibility measurement. The error detection checks the following:
Invalid modulation indices in individual octave bands (mr1 • or mr2 > 1.3)
Changes in ambient noise or any impulsive noise dur- ing the measurement (by comparing the first half of the measurement period with the second half)
15 Cycle Reading
The standard IEC 60268-16 recommends measuring the speech intelligibility two or three times at each measurement position. This reduces potential measurement errors. The individual cycle readings are listed here.
⑯ STI-Average
Calculated average of the recorded cycle results.
17 Difference
Difference (Max - Min) of the of the recorded cycle results.
18 Start next Cycle Measurement
Start the next cycle measurement at the same measurement position here.
19 Ambient Noise Measure / Load / Save
Measure here the actual ambient noise during an adjustable measurement time. You may save this record and reload the data set for any later speech intelligibility measurement.

STIPA
20 Source of Data
Informs about the source of the ambient noise data. The choices are:
Default Settings•
Edited manually•
Measured• Date Time
This information is documented in the measurement report.
21 LAeq of Ambient Noise
This LAeq is calculated based on the octave band levels; you may manually set this level in accordance with the typical noise level as specified for your application.
22 Spectral Level of Ambient Noise
Adjustable octave band level from 125 Hz to 8 kHz.
23 Activation of manual Octave Band Level Setting
Select EDIT with the rotary wheel to adjust the individual octave band levels.
24 Activation of Ambient Noise Correction
On Ambient noise correction is activ e
Off Ambient noise correction is deactivated
Question Mark ? at individual Octave Bands
Individual octave bands are marked with ? in case of a Missing test signal level•
Invalid modulation indices (mr1 or mr2 > 1.3) •
- Changes in ambient noise or any impulsive noise during the measurement
Flashing Question Marks ???? at ②
The measurement result flashes in combination with the question marks ??? in case of a
- Question Mark ? at one or multiple octave bands. See the STIPA Table Result Page on the XL2 for details.
- Changes in ambient noise or any impulsive noise during the measurement

In case the question marks ??? are flashing, then the measurement is faulty. Verify possible causes and repeat the measurement.
For details see the chapter [STI Measurement Hints].
STIPA

STI Measurement - Getting Started
Test Preparations
The XL2 reads the electronic data sheet of the connected NTi Audio measurement microphone and switches the 48V phantom power automatically on as follows:
Connect the measurement microphone to the XL2.
Switch on the XL2

The 48V phantom power indication in the upper menu bar changes to ASD. The XL2 is ready for acoustic measurements.
Position the XL2 at the measurement location using a micro-• phone stand or tripod.
- Select the STIPA measurement function in the measurement menu.
- Prepare the environment for the measurement. For example mute all sound sources to establish silence.

No impulsive noise shall occur during the speech intelligibility measurement as well no speaking or other noise sources should be allowed near the measurement microphone.
Start STIPA Test Signal
Select the STIPA signal source according your application requirements.
- Switch on the STIPA test signal at the signal source.
- Set the acoustic sound pressure level of the PA system to simulate the typical announcement level; e.g. L_AS = 85 dB.
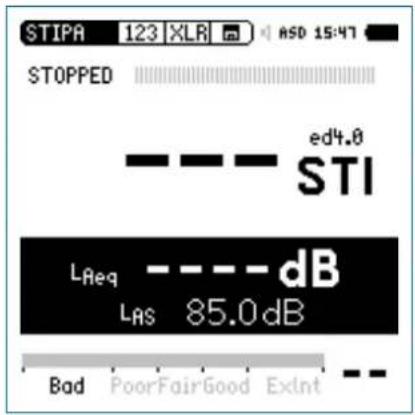

STIPA
Start Measurement
Press start
The progress bar switches to RUNNING. The test result tendency is shown on the bargraph, marked with Bad, Poor, Fair, Good and ExInt.
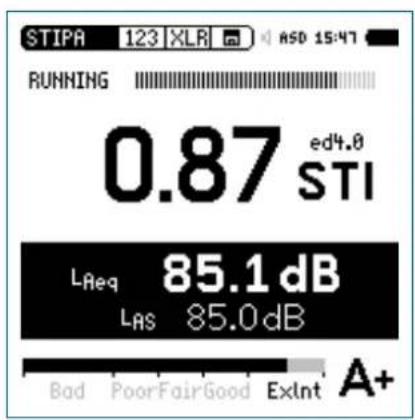
Stop Measurement and Data Saving
After the period of 15 seconds the speech intelligibility measurement finishes automatically. The progress bar indications switches to FINISHED and the final test result is displayed. The measurement result is stored automatically.
Switch off the STIPA test signal.
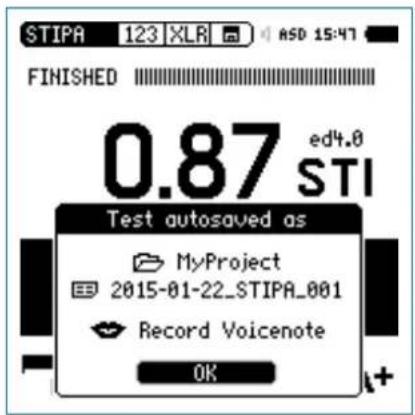
Press enter ⬤ to confirm. The measurement data is stored on the SD Card in ASCII format.
The measurement is completed.
STIPA

Averaging of STI Results
The standard IEC 60268-16 recommends averaging two or three subsequent results taken at the same measurement location.
The German Standard VDE 0833-4 requires performing minimum three subsequent measurements for one measurement position in case of STI < 0.63.
The XL2 Analyzer offers automated averaging of two up to eight speech intelligibility results based on these standard requirements.
Start Averaging
Select the averaging page • Avr.
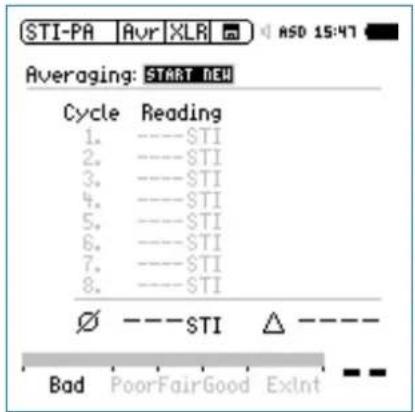
- Turn the rotary wheel ⏻ to select the parameter START NEW and press enter ⏻.
The first measurement starts automatically. It is labeled Cyc 1.

STIPA
Add Cycles
- Press enter ⏻ to confirm Add Cycle.
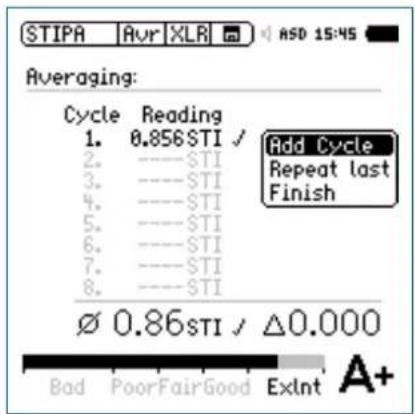
Repeat the measurement at the same position as required.

The XL2 performs further measurements and adds them to the list.
Finish
Choose • Finish to end the averaging.
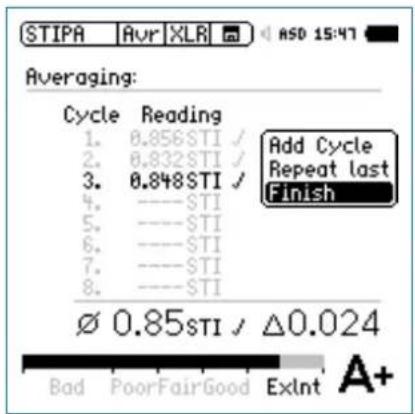

The speech intelligibility average and the deviation is displayed for documentation.
STIPA

Display of STIPA Numeric Result Page
The symbol indicates that the averaged STI value is displayed.
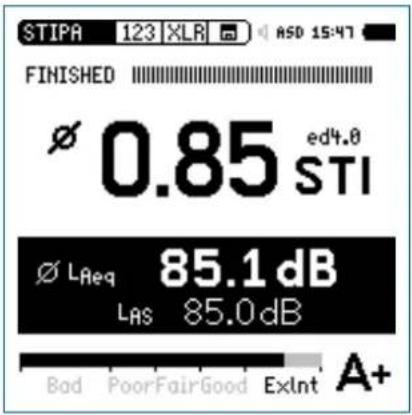
Ambient Noise Correction
Measuring the speech intelligibility index under realistic environmental conditions is often not feasible; e.g., playing the test signal in a railway station at emergency levels during peak hours will irritate passengers. Additionally, at rush-hour the characteristics of ambient noise might be highly impulsive, while a pre-requisite for accurate speech intelligibility measurements is a negligible impulsivity in the ambient noise. Under such circumstances the speech intelligibility measurement should be shifted to a more suitable time of the day; e.g. night time.
Measurement Sequence
First measure the ambient noise•
Secondly measure the speech intelligibility•

This sequence simplifies the measurement as follows: The XL2 immediately displays the speech intelligibility result with ambient noise correction. This result provides a guideline if repeated measurements at the same location with averaging is required. For details see the chapter [STIPA Measurement Hints].

STIPA
Enable Ambient Noise Correction
Select the correction page • Cor.
Turn the rotary wheel ⚙ to select the parameter Ambient
Noise Correction and press enter ⏻.
The correction enables and the XL2 displays this screen:
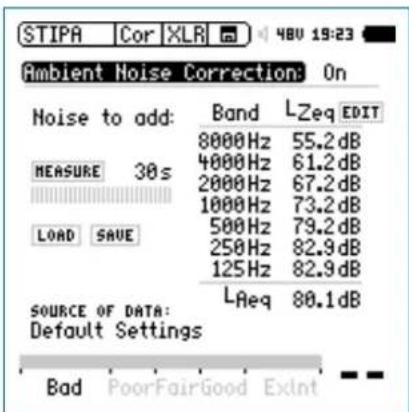

You may adjust the ambient noise band levels and the LAeq.
Commissioning New PA-Systems
New announcement systems are commissioned e.g. at public areas prior the grand opening. Thus the actual ambient noise caused by the public is not available yet during the speech intelligibility measurement. Here you may simulate the real-life condition with ambient noise data enabled by one of the following modes:
Utilize a reference noise file, which might be applicable for the actual project
- Measure the ambient noise at another similar project and store this as reference noise file.
- Random the actual project select the parameter the rotary wheel ⏻ and press enter ⏻
Select the reference noise file, which shall be utilized as - ambient noise correction for your speech intelligibility measurements.
-Select the parameter Edit or the LAeq level with the rotary wheel ⏻ and press enter ⏻
-Turn the rotary wheel to adjust the noise level.
-Press enter ⏻ to continue the setting.
Skip the next step "Measure Ambient Noise" and go to "STI Measurement".
STIPA

Measure Ambient Noise
Position the microphone at the STIPA measurement point.
- Select Measure (without any test signal presence).

The XL2 measures the ambient noise and displays the LEQ octave band result.
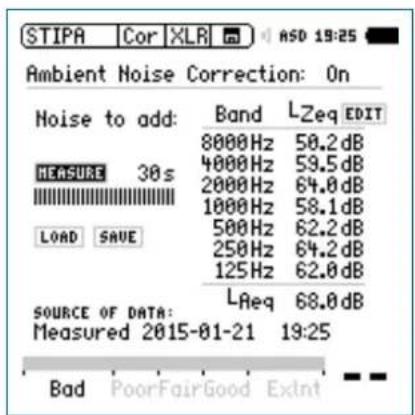
STI Measurement
Select the STIPA result page • 123.
Perform the speech intelligibility measurement.
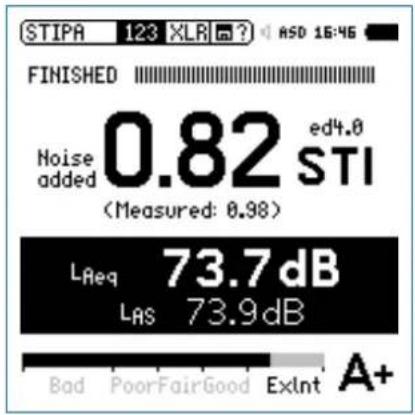

You may edit the noise data.

The XL2 displays the corrected speech intelligibility result in large font. The actual measured result is listed below in smaller font.

STIPA
Data Post-Processing
In the case when no ambient noise correction has been carried out on-site with the XL2 Analyzer, you may post-process your measurement data on the PC. The NTi Audio STI Reporting Tool combines the speech intelligibility measurement taken with quiet conditions and the actual ambient noise caused by the public, e.g. during day-time. This emulates the speech intelligibility expected during real-life conditions.
STI Reporting Tool
The STI Reporting Tool creates measurement reports according to the IEC 60268-16 and VDE0833 standards. Import the data directly from your XL2 including the ambient noise measurements. The corresponding speech intelligibility STI or CIS values are shown.
The STI Reporting Tool is free to download on the XL2 Support website https://my.nti-audio.com for all registered users. (Enable all macros when opening the document.)
System Requirements:
PC running Windows OS•
Excel 2010 - 2016•
STI Measurement Hints
Hints: Ambient Noise
The ambient noise has to be sufficiently static during the measurement. A signal-noise ratio of 15 dB or higher is recommended to achieve best speech intelligibility. Impulsive ambient noise during the measurement, such as speech, causes severe measurement errors. The STIPA result is usually too high.
Fluctuating noise is detected by measuring the direct STI in • the absence of the test signal. Carry out these measurements at least at a representative set of locations. If the STI is too high (e.g. STI > 0,2), the measurement results are likely to be erroneous. In this case the speech intelligibility measurement should be carried out without the presence of noise. Utilize the ambient noise correction for such instances.
At locations with varying conditions (e.g., some public areas with few people and other areas with crowds) the worst-case speech intelligibility should be measured. Consult the local regulations (e.g. the NFPA code in the U.S.) for directives concerning measurement locations and number of required measurements under which circumstances.
STIPA

Hints: German Standard VDE 0833-4 Requirements
STI > 0.63 One single measurement is sufficient.
STI < 0.63 Perform three subsequent measurements at this measurement position.
If the maximum result deviation of these three measurements is > 0.03 then a further three measurements shall be performed.
If the maximum result deviation of these measurements is > 0.05 then the cause of this instability shall be evaluated and removed.
The arithmetic average of the performed three or six measurements has to be reported.
Utilize the STIPA Reporting Tool for the documentation of your measurements according the standard.
An STI > 0.63 implies that the speech intelligibility is higher than 0.5 with a confidence level of 95%.
Hints: CD-Player
Only high-quality CD-Players should be used to reproduce the STIPA test signal as only limited time-shifts (+/- 20 ppm) ensure reliable test results. Pitch control and shock protection should be disabled. We recommend that only professional CD-Players be used. You can verify the time shift of the CD-Player using a 1 kHz test signal:
- Insert the NTi Audio Test CD into the CD-Player and start track 1, which is the 1 kHz test signal.
- Connect the XL2 directly to the audio output of the CD-Player and measure the signal frequency in RMS/THD+N mode. The displayed frequency should be in the range from 0.99998 kHz to 1.00002 kHz
STIPA test signals from other test system manufacturers • may sound similar but are not compatible. Only the NTi Audio STIPA test signal CD V1.1 or higher should be used in combination with the XL2.

STIPA
Hints: Measurement
Select measurement positions as stipulated by local regulations. As a guideline, typically position the microphone at 1 - 1.2 meters above ground in sitting areas or 1.5 - 1.8 meters in standing areas. Also, directly in front of the speakers or very close to a wall are examples of positions that are not typical.
The person taking the measurements should be out of the acoustic field, so as not to affect the measurement results. For this purpose the measurement microphone can be mounted on a microphone stand and connected with the ASD Cable to the XL2.
Low speech intelligibility readings can be caused by
- Excessive sound reverberation, echoes or reflections
- Poor speaker directivity or speaker coverage
- Speaker level setting incorrect; e.g. low signal-to-noise ratio.
6. Audio Analyzer
The XL2 offers a comprehensive audio analyzer. Broadband or wideband measurements are offered by the measurement functions RMS/THD+N and Oscilloscope.
The following measurement functions offer detailed analysis of the audio spectrum in Volt, dBu and dBV:
SLMeter/RTA•
FFT•
1/12 Oct+Tol• (optional)
Just change the measurement unit according your requirements. See the individual chapters for more details.

- If an NTi Audio measurement microphone with electronic data sheet is connected, the XL2 will automatically activate the unit dBSPL (dB) for sound level measurements. A decreased THD+N performance will occur with unbalanced input signals when using switching-type power supplies (approx. 3 dB). Remove such a mains adapter for critical applications.
RMS /THD+N
The XL2 Audio and Acoustic Analyzer measures the parameters Level RMS, THD+N and frequency simultaneously.
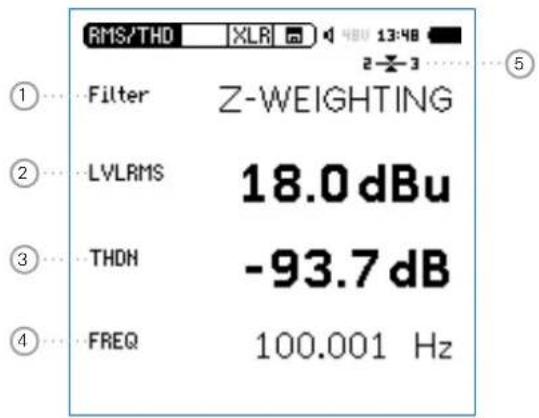

Audio Analyzer
① Filter
Z-Weighting Frequency Z-weighting with flat frequency response from 20 Hz to 22 kHz. Default measurement setting.
A-Weighting Frequency A-weighting according IEC 61672 for low noise levels.
C-Weighting Frequency C-weighting according IEC 61672 for high noise levels.
HP-100Hz Highpass 100 Hz, -200 dB/dec., maximally flat magnitude filter, e.g. -60 dB @ 50 Hz
HP-400Hz Highpass 400 Hz, -120 dB/dec., maximally flat magnitude filter, attenuates 50/60Hz components of test signal
HP-19k Highpass 19 kHz; e.g., to measure a 20 kHz pilot tone level of a public address system without disturbing the public.
22.4-22.4k Bandpass filter 22.4 Hz - 22.4 kHz (IEC 468-4)
② Level RMS
Measures the absolute level of the input signal. The unit's dBu, dBV, Volt V, dBSPL, Watt W and dBm are selectable. The Watt and dBm measurement result is calculated based on a user-defined Load.
③ THD+N
Measures the total harmonic distortion and noise of the input signal. The distortion measurement, expressed in dB, linear or in %, is conducted within the bandwidth 10 Hz - 20 kHz. This value is calculated as follows:
THD+N = (Distortion+Noise) / (Signal + Distortion+Noise)
④ Frequency in Hz
The XL2 automatically extracts and measures the frequency of the fundamental signal. The XL2 frequency counter technology even reads the frequency correctly for heavily distorted signals.
Audio Analyzer

⑤ Balance Indicator
Indication of the audio signal balance between pin 2 and 3 on the XLR input for input signals > -34 dBu.

The input signal is balanced.

The signal is unbalanced. The level at pin 2 is higher than at pin 3.

The signal is unbalanced. The level at pin 3 is higher than at pin 2.
PreNotch Listening
The input signal is audible at the rear speaker or headphone output.
Press and hold down the speaker button 🔑.
The pop-up window volume is displayed.

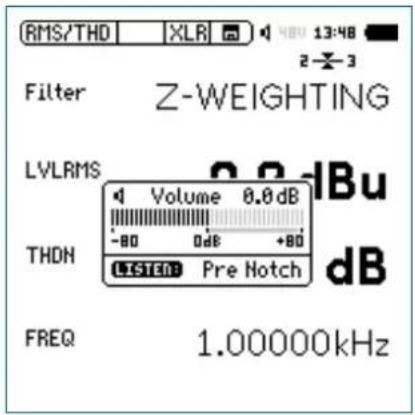

Audio Analyzer

PostNotch Listening
The main frequency component is filtered out by a notch filter, leaving only the remaining signal audible.
Press the speaker button ⏻ to display the volume window.
Additionally press enter
The post notch listening with auto-gain function is activated. The maximum gain setting is 0 dB.
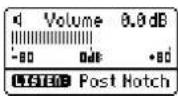
e.g. using a 100 Hz sine test signal connected to the XL2 input, with the 100 Hz main frequency filtered by the notch filter, the complete frequency spectrum is available at the speaker or headphone output. This feature allows you to listen to the actual distortion signal. You therefore hear a noise from the speaker even without any connected inputs signal!
Oscilloscope
The scope function visualizes the waveform of the electrical input signal. It automatically triggers to the fundamental frequency and selects the scaling of the X-axis (time) and Y-axis (level) accordingly. The fundamental, or most dominant, frequency of the input signals is displayed above the scope screen.
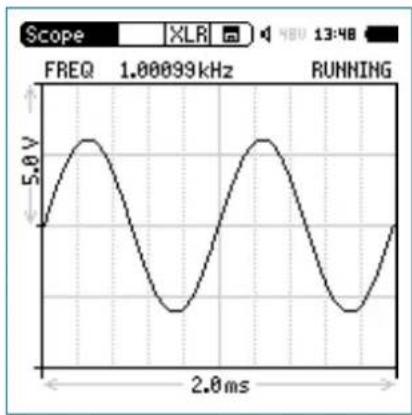
line
| Time (ms) | Voltage (V) | | --------- | ----------- | | 0 | 0 | | 1 | 5.0 | | 2 | 0 | | 3 | -5.0 | | 4 | 0 | | 5 | 5.0 | | 6 | 0 | | 7 | -5.0 | | 8 | 0 | | 9 | 5.0 | | 10 | 0 | | 11 | -5.0 | | 12 | 0 | | 13 | 5.0 | | 14 | 0 | | 15 | -5.0 | | 16 | 0 | | 17 | 5.0 | | 18 | 0 | | 19 | -5.0 | | 20 | 0 | | 21 | 5.0 | | 22 | 0 | | 23 | -5.0 | | 24 | 0 | | 25 | 5.0 | | 26 | 0 | | 27 | -5.0 | | 28 | 0 | | 29 | 5.0 | | 30 | 0 | | 31 | -5.0 | | 32 | 0 | | 33 | 5.0 | | 34 | 0 | | 35 | -5.0 | | 36 | 0 | | 37 | 5.0 | | 38 | 0 | | 39 | -5.0 | | 40 | 0 | | 41 | 5.0 | | 42 | 0 | | 43 | -5.0 | | 44 | 0 | | 45 | 5.0 | | 46 | 0 | | 47 | -5.0 | | 48 | 0 | | 49 | 5.0 | | 50 | 0 | | 51 | -5.0 | | 52 | 0 | | 53 | 5.0 | | 54 | 0 | | 55 | -5.0 | | 56 | 0 | | 57 | 5.0 | | 58 | 0 | | 59 | -5.0 | | 60 | 0 | | 61 | 5.0 | | 62 | 0 | | 63 | -5.0 | | 64 | 0 | | 65 | 5.0 | | 66 | 0 | | 67 | -5.0 | | 68 | 0 | | 69 | 5.0 | | 70 | 0 | | 71 | -5.0 | | 72 | 0 | | 73 | 5.0 | | 74 | 0 | | 75 | -5.0 | | 76 | 0 | | 77 | 5.0 | | 78 | 0 | | 79 | -5.0 | | 80 | 0 | | 81 | 5.0 | | 82 | 0 | | 83 | -5.0 | | 84 | 0 | | 85 | 5.0 | | 86 | 0 | | 87 | -5.0 | | 88 | 0 | | 89 | 5.0 | | 90 | 0 | | 91 | -5.0 | | 92 | 0 | | 93 | 5.0 | | 94 | 0 | | 95 | -5.0 | | 96 | 0 | | 97 | 5.0 | | 98 | 0 | | 99 | -5.0 | | Note: The actual values may vary due to the random nature of the data generation.
The scope scaling is fixed.
7. Vibration Meter
The Vibration Option turns the XL2 Audio and Acoustic Analyzer into a professional vibration meter with broadband measurements and spectral analysis in 1/3 or octave resolution. The XL2 Vibration Meter determines vibration acceleration, velocity and deflection with standard-compliant weighting filters in the frequency range from 0.8 Hz to 2.5 kHz. Detailed recording of measurement data and audio files allow for comprehensive evaluation and reporting. In addition, the XL2 Vibration Meter comes standard with an FFT analysis and an oscilloscope function. Selectable FFT frequency ranges from 1 Hz to 1.69 kHz allow a detailed examination of the measured vibrations.
The Spectral Limits Option adds functions to the Vibration Meter including a zoom FFT up to 20 kHz and a 1/12 octave band analysis from 0.73 Hz to 1.36 kHz. Also, it adds the ability to record reference spectra and set tolerances for pass / fail quality control measurements. The Remote Measurement Option allows the real-time acquisition of measurement data directly into a computer application via the USB interface. A documented command set is available.
VibMeter / Spectrum
The vibration meter offers different pages:
Page Selection using the Page Button
- Press page 📋 to toggle between the 123 VibMeter page and the CPB page.
Page Selection using the Rotary Wheel
- Select the page 123 VibMeter with the rotary wheel ⚙️. Confirm with enter ⏻.
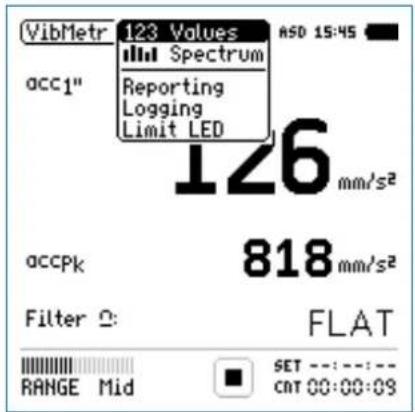
Page Selection

Vibration Meter
123 Values: Vibration Meter
Displays the selected broadband vibration level results. You can change the font size of the result. Depending on the font size chosen, the XL2 shows 2 up to 4 results simultaneously. The display of the actual or maximum level can be selected with the applicable frequency weighting. The peak levels PK or P-P are real peak levels.
Spectrum: Constant Percentage Bandwidth CPB
Displays the 1/3 or 1/1 octave spectrum of the selected RMS vibration level. Additionally the wide band result B is shown graphically by a bar.
Reporting: Report Setting
Here you set which vibration levels shall be stored in a .txt file after the completed measurement. Choose between:
ALL Stores all vibration levels.
Selected Stores up to 10 different individually-defined vibration levels.
For details refer to the chapter[Reporting].
Logging: Setup of Data Logging
The XL2 features a powerful vibration level meter data logger, which allows you to record all required vibration level values during the measurement. In the logging page you set which vibration levels shall be logged over time. For details refer to the chapter [Logging]. Choose between:
ALL Logs all vibration levels.
Selected Logs up to 10 different individually-defined vibration levels.
Limit LED: Limit Setting
Here you set the function of the limit LED ^[1] thereby highlighting any vibration level that exceeds the pre-set limits in orange or red color. Further, external peripherals are controlled by the optional Serial I/O Interface based on the vibration level, such as displaying vibration levels on a large external red-orange-green lamp. For details refer to the chapter ^[2] limits.
Vibration Meter

Overview
Numeric Result Page
The numeric result page 123 Values displays the selected broadband vibration level results. You can change the font size of the result. Depending on the font size chosen, the XL2 shows 2 up to 4 results simultaneously. The display of the actual or maximum level can be selected with the applicable frequency weighting.
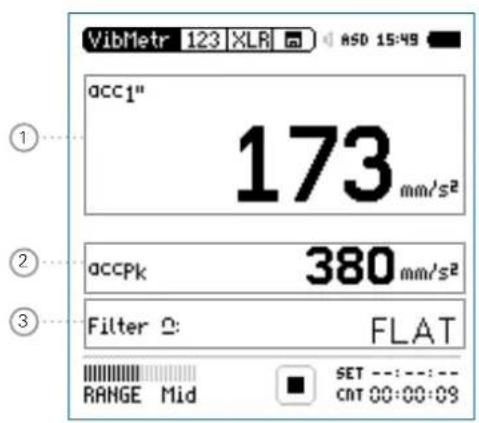
Constant Percentage Bandwidth Analyzer Page
The real-time analyzer page spectrum measures and displays the 1/3 or 1/1 octave spectrum in the selected frequency range including the wideband result.
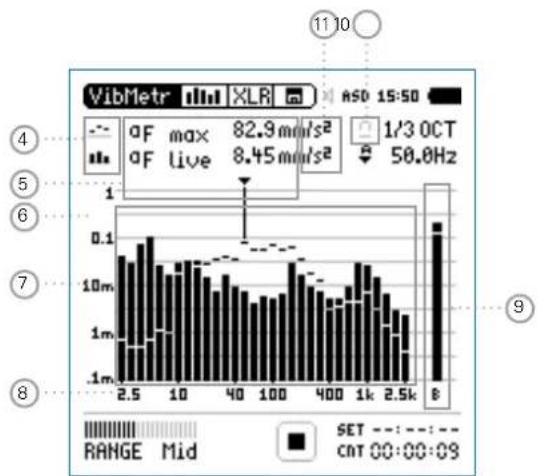
bar
| Frequency | Value | | :--- | :--- | | 2.5 | 0.1 | | 10 | 0.1 | | 40 | 0.1 | | 100 | 0.1 | | 400 | 0.1 | | 1k | 0.1 | | 2.5k | 0.1 | The chart displays a frequency spectrum with labeled peaks at 2.5k, 10, and 40, and a secondary peak at 100. The inset table provides a time parameter (aF max, aF live) and a frequency value (1/3 OCT, 50.0 Hz). The color bar indicates 'Blue' to 'Red'. The chart is labeled with numbers 4, 5, 6, 7, 8, and 9. Below the chart is a 'RANGE Mid' tab with 'SET' and 'CNT' indicators.
Vibration Meter
① Vibration Level Result 1
All vibration levels are measured and logged simultaneously. You select which vibration levels should be displayed.
Change Parameter
Turn the rotary wheel ⏻ to select the parameter Lxx. Press enter ⏻ to open the selection menu and choose the wideband vibration level to be displayed.
Turn the rotary wheel ⚙ to select the required test result parameters and confirm with enter ⏻.
Change Font Size
Turn the rotary wheel Ⓞ to select the actual test result. Press enter ⏻ 1x, 2x or 3x to set the font size to small, medium or large.
The XL2 shows 2 vibration levels on the display if a large font is chosen, otherwise it shows 4 vibration levels.
② Vibration Level Result 2
Follow the setting instructions for vibration level result 1.
③ Filter
Select one of the following frequency filters:
FLAT no filter applied
1-80Hz Filter 1 - 80 Hz with decay rate of 12 dB / octave in accordance with DIN 45669-1
1-315Hz Filter 1 - 315 Hz with decay rate of 12 dB / octave in accordance with DIN 45669-1
10-1000Hz Filter 10 - 1000 Hz with decay rate of 18 dB / octave in accordance with ISO 2954
④ Result Symbols / Capture
This field offers two functions:
Symbols for measurement results 15
Upper parameter displayed as line.
- Lower parameter displayed as bargraph.
Vibration Meter

Capture•
One of the displayed frequency band readings may be captured. Any measurement data can then be compared with this captured reference live on the XL2 Analyzer.
Select the parameter to be captured• .
Confirm with enter ⏻, to capture the reading.
Select the upper parameter 15 and choose Capt.
Confirm with enter ↻.

The lower reading can be compared with the previously-captured reference data.
⑤ Measurement Result
Actual level result of the indicated frequency band. The cursor readout displays the center frequency and the level of the band pointed to by the arrow.

Upper parameter displayed as line.

Lower parameter displayed as bargraph.
⑥ Y-Scale setting
Select the Y-Axis with the rotary wheel and confirm with enter ⏻.
- Select the zoom factor between 20, 10, 5, 2.5 dB/div and confirm with enter ⏻.
- Scroll up and down with the rotary wheel to select the Y-axis range.
Confirm with enter
⑦ Measurement Result
Real-time analyzer results in 1/1 octave or 1/3 octave band resolution. Adjust the resolution at 17.
⑧ X-Scale setting
Third-octave band resolution
2.5 Hz - 2.5 kHz CPB levels including wide band result
0.8 Hz - 1.0 kHz CPB levels including wide band result
0.8 Hz - 2.5 kHz CPB levels

Vibration Meter
Octave band resolution
4 Hz - 2.0 kHz frequency band levels including wide band result
1 Hz - 0.5 kHz frequency band levels including wide band result
1 Hz - 2.0 kHz frequency band levels
Select the X-Axis with the rotary wheel • ○ and confirm with enter ⊕.
Toggle with the rotary wheel ⏻ between the ranges. Confirm with enter ⏻.
⑪ Measurement Unit
Select the measurement unit as follows:
Acceleration a m/s2•
g• in/s2• dB•
Velocity v
• m/s • in/s dB•
• m • in dB•
Displacement d
Select metric or imperial units in the System Settings.
⑨ Broadband Results
Displays broadband level B.
10 Filter
Select the preset frequency filter here, which is already used on the broadband page.
FFT Analysis + Tolerance
The XL2 Vibration Meter includes a fast real-time FFT.
The following features are available upon installing the Spectral Limits Option in the XL2 Analyzer:
High-resolution Zoom-FFT up to 0.4 Hz steps in the frequency range 1 Hz - 20 kHz
Capture and tolerance function provided with Spectral Limits • Option; thus the main menu function reads FFT + Tol.
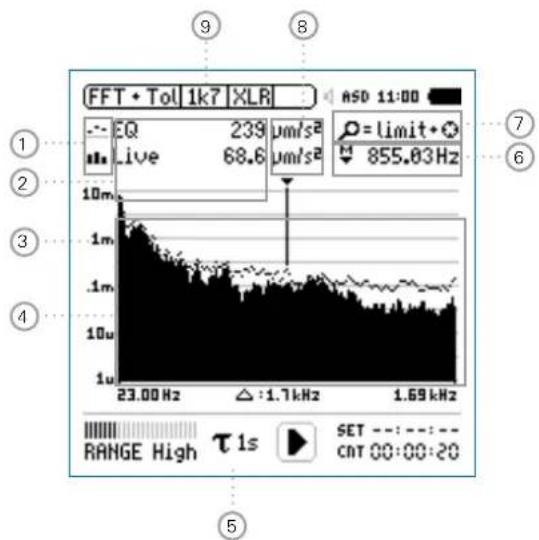
line
| Frequency (Hz) | Intensity (µm/s²) | | -------------- | ----------------- | | 23.00 | 239 | | 1.7 | 68.6 | | 1.69 | 855.03 |
Vibration Meter
① Result Symbols / Capture & Start Tolerance Mode
This field offers two functions:
Symbols for measurement results 2
Upper result displayed as line.
1b Lower result displayed as bargraph.
Capture & Start Tolerance Mode•
The displayed readings may be captured as reference reading C1 to C8 for
Comparing measurement results against captured traces with relative or absolute curve display.
Creating tolerance masks based on captured reference curves for passed / failed measurements.
Capture EQ Capt ures the upper parameter
Capture Live Captures the lower parameter
Manage captures
Allows to rename captures, clear recorded captures, save captures to the SD Card for export from the XL2 or load captures from the SD Card for import to the XL2.
Start tolerance mode
Starts the tolerance mode for passed/failed measurements comparing the actual measurement results against a tolerance band.
② Measurement Result
Actual level result of the indicated frequency band. The cursor readout displays the center frequency and the level of the band indicated by the arrow.
Upper parameter displayed as line.
11. Lower parameter displayed as bargraph.
Vibration Meter

③ Y-Scale setting
Select the Y-Axis with the rotary wheel ⏻ and confirm with enter ⏻.
- Select the zoom factor between 20, 10, 5, 2.5 dB/div and confirm with enter ⏻.
Scroll up and down with the rotary wheel Ⓞ to select the Y-axis range.
Confirm with enter ⏻.
④ Measurement Result
Displays the actual and averaged measurement results.
⑤ Time Weighting
Offers selectable time weighting of 0.1, 0.2, 0.5, 1.0 seconds as well FAST (125 ms) and SLOW (1 second).
Applications:
Short Time High resolution in time with minimum Weighting averaging
Long Time Weighting Low resolution in time with longer averaging
⑥ Readout Frequency
You may select any frequency to read out individual levels. The selected frequency is indicated by the cursor arrow. Choose between the following settings:

The cursor follows automatically the highest level, e.g. tracing the dominant frequency of a rotating part.
Select the frequency with the rotary wheel ⚙.
- Press enter
- You may readout any individual frequency.
- Return to auto frequency with enter
The cursor returns to the frequency with highest level bar.

The cursor readout may be set manually to any frequency. The readout remains at the selected frequency.
Select the frequency with the rotary wheel
- Press enter
- Select the frequency of interest.
Confirm with enter 📋.
The cursor readout ② displays the measurement results of the selected frequency band.

Vibration Meter
⑦ Zoom Mode
(optional, applicable with the Spectral Limits Option)
Select the readout frequency ⑩ and press enter
The zoom mode is displayed above the flashing arrow.
Select the zoom-in frequency with the rotary wheel Ⓞ.
Press limit ⓝ and zoom the linear frequency scale in or out with the rotary wheel Ⓞ.
Release limit ⚙️ and scroll the linear frequency scale left or right with the rotary wheel Ⓞ.
⑧ Measurement Unit
Select the measurement unit as follows:
Acceleration a m/s2•
g
in/s2•
dBa
Velocity v m/s•
- in/s
dBv
Displacement d
• m
• in
• dBd
Select metric or imperial units in the System Settings.
The Spectral Limits Option extends the function with captures and tolerances. All tolerances are specified as acceleration.
Vibration Meter

⑨ Page Selector X-Scale and Parameter Setting
1k7 Shows FFT result of the frequency band range. 23 Hz - 1.687 kHz in a resolution of 11.72 Hz with 143 bins shown on the display.
400 Shows FFT result of the frequency band range. 5 Hz - 421.02 Hz in a resolution of 2.92 Hz with 143 bins shown on the display.
100 Shows FFT result of the frequency band range. 1 Hz - 105.00 Hz in a resolution of 0.73 Hz with 143 bins shown on the display.
Usr User Range (applicable with optional Extended Acoustic Pack or Spectral Limits Option) 1 Hz - 20 kHz in zoom mode with a minimum resolution of 0.366 Hz and 143 bins displayed.
Set Selection for FFT Windowing: Hann• : Default setting Dolph-Chebyshev• : for analyzing small signals (e.g. harmonics) close to a dominant signal.
The page button 📋 switches these display modes.
Oscilloscope
The scope function visualizes the waveform of the electrical input signal. It automatically triggers to the fundamental frequency and selects the scaling of the X-axis (time) and Y-axis (level) accordingly. The fundamental, or most dominant, frequency of the input signals is displayed above the scope screen.
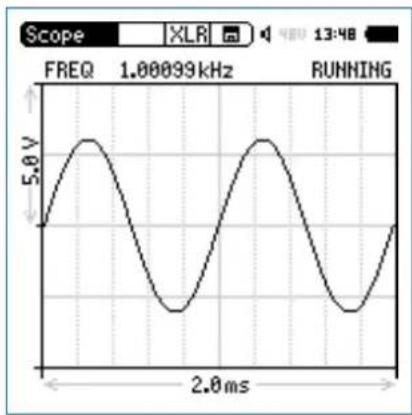
line
| Time (ms) | Voltage (V) | | --------- | ----------- | | 0 | 0 | | 1 | 5.0 | | 2 | 0 | | 3 | -5.0 | | 4 | 0 | | 5 | 5.0 | | 6 | 0 | | 7 | -5.0 | | 8 | 0 | | 9 | 5.0 | | 10 | 0 | | 11 | -5.0 | | 12 | 0 | | 13 | 5.0 | | 14 | 0 | | 15 | -5.0 | | 16 | 0 | | 17 | 5.0 | | 18 | 0 | | 19 | -5.0 | | 20 | 0 | | 21 | 5.0 | | 22 | 0 | | 23 | -5.0 | | 24 | 0 | | 25 | 5.0 | | 26 | 0 | | 27 | -5.0 | | 28 | 0 | | 29 | 5.0 | | 30 | 0 | | 31 | -5.0 | | 32 | 0 | | 33 | 5.0 | | 34 | 0 | | 35 | -5.0 | | 36 | 0 | | 37 | 5.0 | | 38 | 0 | | 39 | -5.0 | | 40 | 0 | | 41 | 5.0 | | 42 | 0 | | 43 | -5.0 | | 44 | 0 | | 45 | 5.0 | | 46 | 0 | | 47 | -5.0 | | 48 | 0 | | 49 | 5.0 | | 50 | 0 | | 51 | -5.0 | | 52 | 0 | | 53 | 5.0 | | 54 | 0 | | 55 | -5.0 | | 56 | 0 | | 57 | 5.0 | | 58 | 0 | | 59 | -5.0 | | 60 | 0 | | 61 | 5.0 | | 62 | 0 | | 63 | -5.0 | | 64 | 0 | | 65 | 5.0 | | 66 | 0 | | 67 | -5.0 | | 68 | 0 | | 69 | 5.0 | | 70 | 0 | | 71 | -5.0 | | 72 | 0 | | 73 | 5.0 | | 74 | 0 | | 75 | -5.0 | | 76 | 0 | | 77 | 5.0 | | 78 | 0 | | 79 | -5.0 | | 80 | 0 | | 81 | 5.0 | | 82 | 0 | | 83 | -5.0 | | 84 | 0 | | 85 | 5.0 | | 86 | 0 | | 87 | -5.0 | | 88 | 0 | | 89 | 5.0 | | 90 | 0 | | 91 | -5.0 | | 92 | 0 | | 93 | 5.0 | | 94 | 0 | | 95 | -5.0 | | 96 | 0 | | 97 | 5.0 | | 98 | 0 | | 99 | -5.0 | | Note: The actual values may vary due to the random nature of the data generation.
The scope scaling is fixed.

Vibration Meter
1/12 Octave + Tolerance (optional)
The Spectral Limits Option extends the function range of the XL2 with trace capturing, relative curve display and comprehensive tolerance handling for the FFT Analysis and the high resolution 1/12 Oct + Tol spectral analysis.
Features:
Capturing of multiple readings into the internal memory •
Comparing measurement results against captures with relative or absolute curve display
Comprehensive tolerance handling •
Creating tolerance masks based on captures for passed /• failed measurements
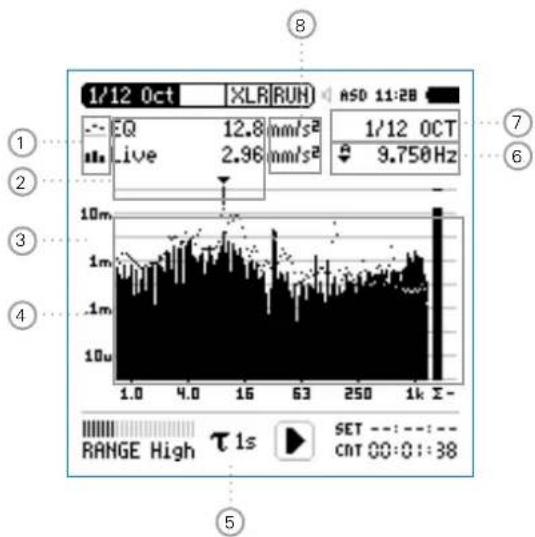
bar_line
| Metric | Value | |--------|-------| | EQ | 12.8 mm/s² | | Live | 2.96 mm/s² | | 1/12 OCT | 9.750 Hz | | Range High | τ1s SET: -:-:-:-: -:-: -:-: -38 CNT Q0:0::38Vibration Meter

① Result Symbols / Capture & Start Tolerance Mode
This field offers two functions:
Symbols for measurement results ●2
Upper result displayed as line.
Lower result displayed as bargraph.
Capture & Start Tolerance Mode•
The displayed readings may be captured as reference reading C1 to C8 for
Comparing measurement results against captured traces with relative or absolute curve display.
Creating tolerance masks based on captured reference curves for passed / failed measurements.
Capture EQ Capt ures the upper parameter
Capture Live Captures the lower parameter
Manage captures
Allows to rename captures, clear recorded captures, save captures to the SD Card for export from the XL2 or load captures from the SD Card for import to the XL2.
Start tolerance mode
Starts the tolerance mode for passed/failed measurements comparing the actual measurement results against a tolerance band.
② Measurement Result
Actual level result of the indicated frequency band. The cursor readout displays the center frequency and the level of the band indicated by the arrow.
Upper parameter displayed as line.
11. Lower parameter displayed as bargraph.

Vibration Meter
③ Y-Scale setting
Select the Y-Axis with the rotary wheel ⏻ and confirm with enter ⏻.
- Select the zoom factor between 20, 10, 5, 2.5 dB/div and confirm with enter ⏻.
Scroll up and down with the rotary wheel Ⓞ to select the Y-axis range.
Confirm with enter 🔒.
4 Measurement Result
Displays the actual and averaged measurement results.
⑤ Time Weighting
Offers selectable time weighting of 0.1, 0.2, 0.5, 1.0 seconds as well FAST (125 ms) and SLOW (1 second).
Applications:
Short Time High resolution in time with minimum Weighting averaging
Long Time Weighting Low resolution in time with longer averaging
⑥ Readout Frequency
You may select any frequency to read out individual levels. The selected frequency is indicated by the cursor arrow. Choose between the following settings:

The cursor follows automatically the highest level, e.g. tracing the dominant frequency of a rotating part.
Select the frequency with the rotary wheel ⚙.
- Press enter
- You may readout any individual frequency.
- Return to auto frequency with enter
The cursor returns to the frequency with highest level bar.

The cursor readout may be set manually to any frequency. The readout remains at the selected frequency.
Select the frequency with the rotary wheel
- Press enter
- Select the frequency of interest.
Confirm with enter 📋.
The cursor readout ② displays the measurement results of the selected frequency band.
Vibration Meter

⑦ Setting of Test Result Resolution
Set the spectral result display to 1/1, 1/3, 1/6 or 1/12 octave band resolution as follows:
Turn the rotary wheel ⏻ to select the parameter ⑫. Press enter ⏻ to open the selection window.
- Turn the rotary wheel to select 1/1 OCT, 1/3 OCT, 1/6 OCT or 1/12 OCT
Press enter 🔒 to confirm.
⑧ Measurement Unit
Select the measurement unit as follows:
Acceleration a m/s2•
g• in/s2• dBa•
Velocity · m/s
• in/s dBv•
Displacement d
• m • in • dBd
Select metric or imperial units in the System Settings.
The Spectral Limits Option extends the function with captures and tolerances. All tolerances are specified as acceleration.

Calibration
8. Calibration
The XL2 Audio and Acoustic Analyzer meets or exceeds the specifications listed in the chapter [Technical Data].
Instrument Calibration
In order to maintain the high accuracy, annual calibration of the XL2 Analyzer and the measurement microphone is recommended. The calibration service verifies the complete product specifications, differences to the last calibration and measures the frequency response of the measurement microphone. To enquire about calibration service, follow the RMA guide lines at www.nti-audio.com.
Microphone Sensitivity
NTi Audio's ASD measurement microphones and the microphone pre-amplifier MA220 include an electronic data sheet. The Automated Sensor Detection (ASD) of the XL2 recognizes the sensitivity and calibration data of the connected microphone. The electronic data sheet, including the microphone sensitivity, is displayed in the menu Calibrte.
Environmental Conditions
The sound level meter and calibrator should be exposed to the same environmental conditions prior any calibration for the following recommended periods:
10 minutes after a temperature change of 10^ C.
- 15 seconds after the static air pressure has changed by 5kPa .
10 minutes after a humidity change of 30% without condensation.
The described calibration method and correction data apply for the following environmental conditions:
Temperature: -10 °C to +50 °C •
Static air pressure: 65 kPa to 108 kPa
• Humidity: 25 % to 90 % r.H.
without dew from -10 °C to +39 °C
Ambient Noise
Please make sure that, during the calibration with 114 dB, the ambient noise level is lower than 89 dB.
Calibration

Calibration Menu with connected Measurement Microphone
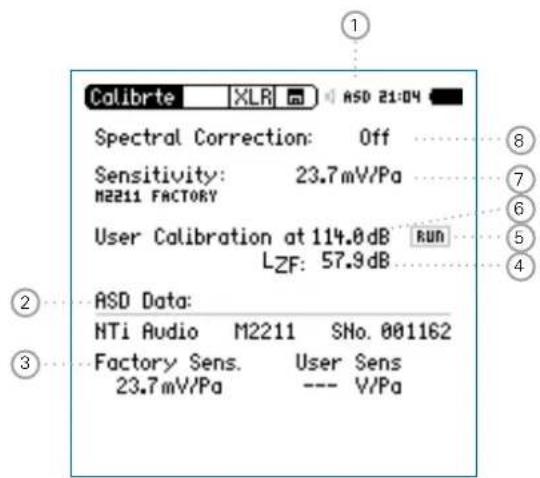
Calibration Menu without any connected Sensor
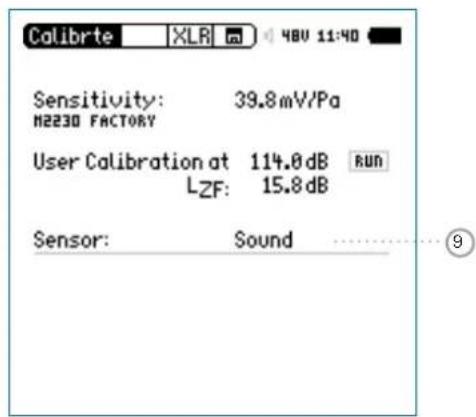

Calibration
Calibration Menu with connected ICP Adapter ASD and Accelerometer
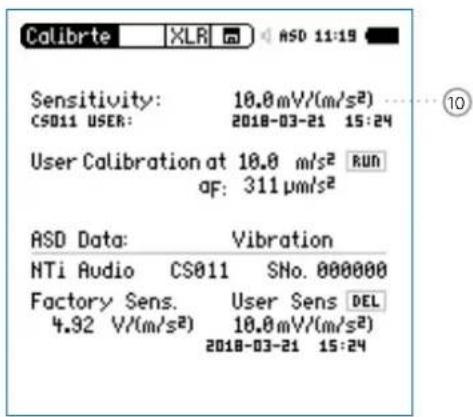
① Phantom Power Supply
48V The XL2 provides 48 V phantom power supply to the connection microphone or sensor.
ASD An NTi Audio measurement microphone with automated sensor detection ASD is connected. The XL2 reads the electronic data sheet of the microphone and switches the 48V phantom power automatically on
48V Phantom power is switched off.
② Electronic Data Sheet of Measurement Microphone
Read out data from the connected microphone.
③ Factory Sensitivity
Factory sensitivity of the connected sensor.
④ Level Type
LZF Default setting.
LHP100F Suppressing any low frequency noise, for example wind during outdoor calibrations.
Calibration

⑤ Start Field Calibration
Select RUN and press enter to start the sensitivity setting using an external calibrator.
⑥ Level of External Calibrator
The reference calibration level is 114 dB. The XL2 Supports a level setting between 0 dB and 200 dB.
⑦ Sensitivity
Applicable microphone sensitivity in the range from 1 V/Pa to 9.99 V/Pa. The sensor detection of the XL2 reads the sensitivity automatically from the electronic datasheet of the connected NTi Audio microphone or preamplifier.
⑧ Spectral Correction
Select one of the spectral corrections as applicable.
Off No spectral correction.
Community (horizontal) Activates the spectral correction for horizontal noise incidents using the outdoor measurement microphone M2230-WP. The correction data is listed in chapter [Technical Data].
Aircraft (vertical) No spectral correction. The M2230-WP complies with the class 1 specifications at vertical noise incidents.
M22xx Diffuse field correction for the measurement DF microphone types M2230, M2215, M2211.
M42xx Diffuse field correction for M2230 measurement microphone M4261.
⑨ Selection Sound Level Meter / Vibration Meter
Sound Sound Le vel Meter
The accelerometer sensitivity is provided in the range of 1 V/(m/s2) - 10.0 V/(m/s2) or • 10 V/g - 100 V/g•
- Select Sensitivity ⑦ with the rotary wheel
- Press enter ⏻ and adjust the sensitivity with the rotary wheel Ⓞ.
- Confirm with enter ⏻.
Field Calibration - With External Sound Calibrator
Field-sensitivity setting for measurement microphones with an external calibrator.
Turn the rotary wheel ⚙ to select the parameter User Calibration ⑥ and press enter ⏻.
Set the calibration level according to the calibrator used.
Generate the specific reference signal with the calibrator • onto the microphone.
Turn the rotary wheel ● to select the parameter RUN ⑤ and press enter ⏻.
- The pop-up window Calibration: Calibration running ... appears and changes to Calibration: Successfully finished! for a successfully completed calibration.
Field Calibration - Manual Sensitivity Setting
In case no external calibration device is available, set the sensitivity of non-NTi Audio sensors manually according to the product specifications as follows:

Field Sensitivity
The XL2 writes the field-sensitivity setting onto the electronic data sheet of the connected NTi Audio measurement microphone, microphone preamplifier or ASD Adapter. All subsequent measurements automatically utilize this field-sensitivity.
In case the measured sensitivity deviates ±1.5 dB for a class 1 microphone and ±3 dB for a class 2 microphone to the nominal microphone sensitivity, then the XL2 displays the following message: Measured sensitivity to far (xxdB) from factory settings. Check calibration level and microphone!
In doubts kindly contact NTi Audio with the details.
Calibration

Free-field Correction
The following free-field correction shall be applied using the NTi Audio Class 1 Sound Calibrator M2230, M2211, M2215: -0.1 dB•
The following correction shall be applied using the NTi Audio Class 1 Sound Calibrator with 1/4" adapter ADP 1/4-P M4260: +0.1 dB• M4261: +0.2 dB•
The NTi Audio microphones are free-field equalized measurement microphone. Thus they already compensates the increased level by the presence of the microphone body in the free-field. Pressure conditions apply during the calibration. Therefore, the level in front of the 1/2" microphone diaphragm differs by -0.08 dB with reference ambient conditions.
M2230 with 50 mm Wind Screen •
The correction value is +0.12 dB and the XL2 has to be set to a calibration level of 114.0 dB (=114-0.08+0.12).
M2230 with 90 mm Wind Screen •
The correction value is +0.19 dB and the calibration level on the XL2 has to be set to 114.1 dB (=114-0.08+0.19).
M2230 with WP30 Wind Screen 90 mm
The correction value is +0.19 dB and the calibration level on the XL2 has to be set to 114.1 dB (=114-0.08+0.19).
Example - Field Calibration
Configuration•
- XL2 + M2230 Measurement Microphone
- NTi Audio Class 1 Sound Calibrator @ 114.0 dB
- The level 1 at User Calibration shall be set to 113.9 dB (=114.0 - 0.1).
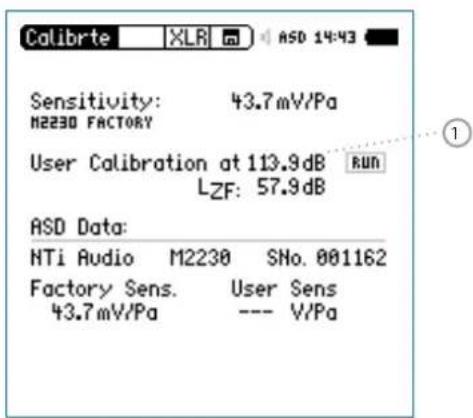
- Select the parameter RUN and press enter ⏻.
The field calibration is completed.

Calibration
Applying Correction Values @ M2230
The goal is to measure the sound pressure without the influence of the microphone in the air. However, the presence of the microphone body in the free-field environment affects already the sound pressure level at high frequencies. The measurement microphone acts at high frequencies like a reflector. The sound pressure increases in front of the microphone capsule membrane. For example, the sound pressure level is 114.0 dB in the free field prior installing the microphone. Now the measurement microphone is placed into the free field. The pressure in front of the capsule is increased by 0.1 dB at 1 kHz. However, since the sound without microphone influence shall be determined, the free-field equalization of the M2230 compensates this effect. The XL2 Sound Level Meter reads the accurate measured value of 114.0 dB and not 114.1 dB.
If the Class 1 Sound Calibrator is placed on the M2230 measurement microphone, then the pressure conditions applies to the microphone capsule. The pressure in the volume of the calibrator matches the pressure on the membrane surface of the microphone. Now the free-field equalization and the pressure conditions for the calibration have to be taken into account. Thus, the XL2 has to be adjusted to a calibration level of 113.9 dB when using the M2230. This applies for calibrations at reference ambient conditions and an accurate calibrator output level at the reference sound pressure level.
Profiles

9. Profiles
Profiles are templates of measurement setups. You may define which profile is loaded at startup, so that the measurements are carried out always with the same setup and instrument settings.
A remarkable advantage of the XL2 is the flexible user interface. The measurement screens may be personalized and only a limited subset of the comprehensive functionality enabled to create simplified operator interfaces. Advanced users may access all menus, settings and store their preferred measurement configurations. For simplicity the XL2 Audio and Acoustic Analyzer offers fixed operator interfaces with specific pre-defined settings. The XL2 can boot up with exactly the required measurement parameters according to the pre-defined instrument configurations. This ensures accurate measurements are achieved in both advanced and basic usage environments.
Profiles - Getting Started
Activate Profile Selection at Startup
Select • Show profile list in the System menu.
Press enter Ⓧ to activate Yes. This will show the profile list at startup.
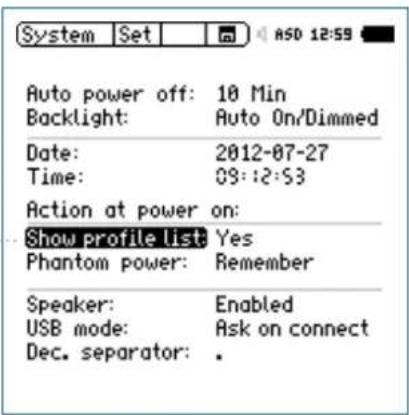
The profile list is shown next time you power up the XL2.

Profiles
Preset Measurement Function
Start the XL2 Analyzer in • Full mode.
Select the typically-used measurement function and adjust • the measurement parameters according to the requirements.
For example, measuring the sound levels L_AF , L_Aeq and L_AFmax for 10 seconds:
Store MyProfile
- Select Profile in the main menu and press enter
The profile menu opens.
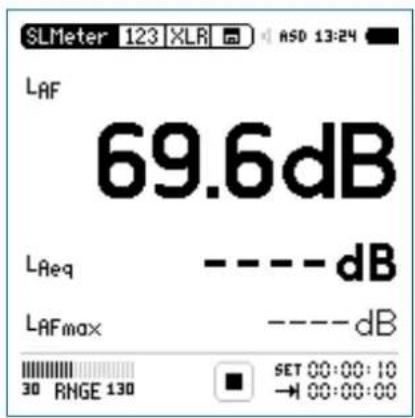
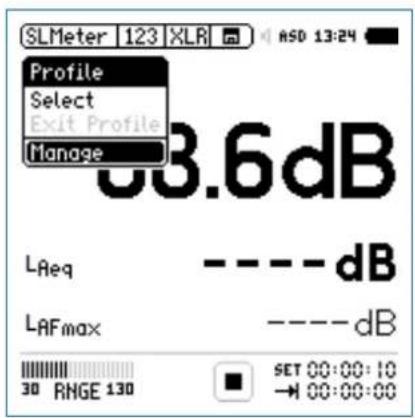
Profiles

Select • Manage and press enter.
The Manage Profile menu opens.
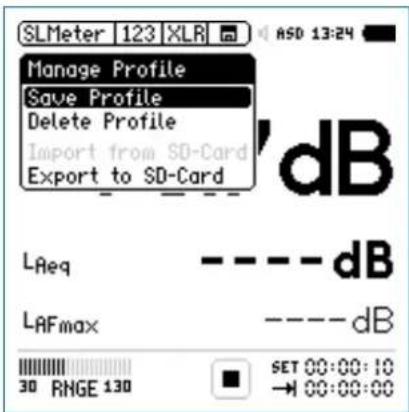
Select • Save Profile and press enter.
The Save Profile menu opens.
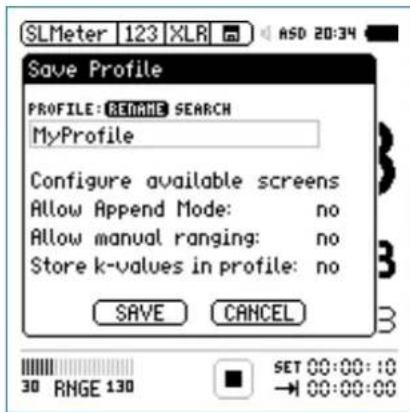
 | Each stored profile includes all settings of a measurement functions and pages. Only the following details are not stored: Calibration settings• System settings• Temperature unit• Phantom power on/off• |
Select • Rename and press enter.
- Set the profile name to MyProfile. The maximum name length is 20 characters.

Profiles
- Select Configure available screens and press enter ⏻.
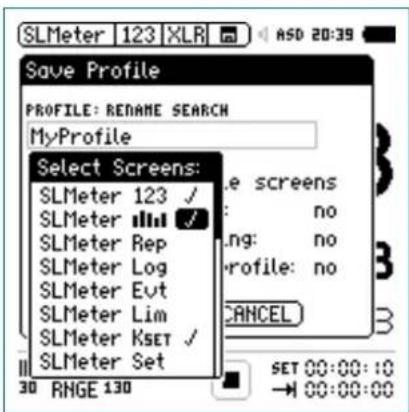
Select additional available pages/measurement functions for the profile; e.g. RTA
- Press escape esc to return to the Save Profile screen.
- Set Append mode available: yes in order to have the append data feature available in the memory menu. You may enable manual measurement range setting within your profile. Select Allow manual ranging: yes.
- The correction values defined in KSET may be part of the profile for selectable profiles with different corrections. Select • Save and press enter.
Select Profile at Startup
- Switch on the XL2
The profile selection is shown on the display.
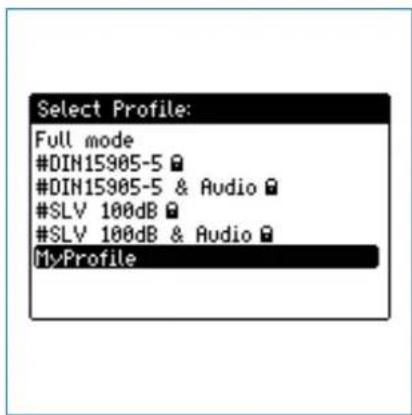
- Select the profile MyProfile and press enter
The XL2 starts up with the pre-configured settings for sound level monitoring.
Profiles

Select Profile during Operation
- Select Profile in the main menu and press enter
The profile menu opens.
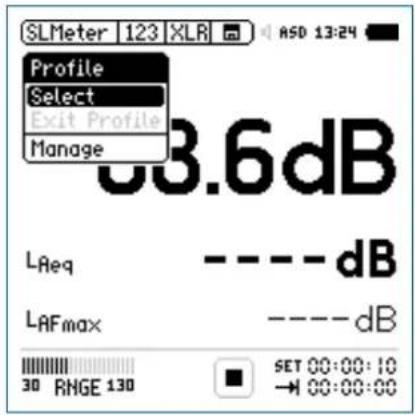
- Choose Select and load the required profile.
Run Measurement
The profile name is displayed when a measurement function is highlighted. The main menu offers only the measurement functions enabled by the profile, plus the calibration and profile menu.
Press start
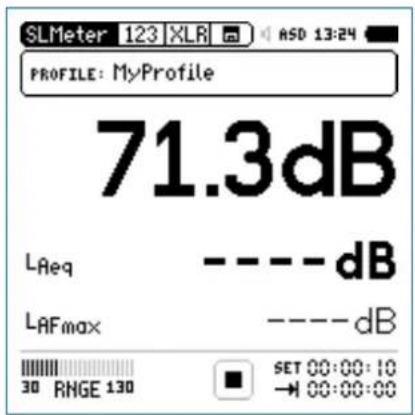
Wait 10 seconds until the measurement is finished.
To return to the full mode either switch off the XL2 📍 again or select EXIT Profile in the main menu.

Profiles
Export MyProfile to PC
If you have two or more XL2 Audio and Acoustic Analyzers, you may like to transfer the same profiles to the other instruments.
- Select Profile in the main menu and press enter ⏻. Select - Manage and press enter ⏻.
- Select Export to SD-Card and press enter ⏻.
The XL2 generates a folder on the SD Card called "Profiles". All available profiles are exported into this folder.
Connect the XL2 to the PC.
- Copy/paste the profile called MyProfile to the PC.
Import MyProfile from PC
Connect another XL2 to the PC and generate a folder called • "Profiles" on the SD Card.
- Copy the profile called MyProfile into the folder "Profiles".
- Start up the XL2, select Profile in the main menu and press enter ⏻.
Select • Manage and press enter. - Select Import from SD-Card and press enter ⏻.
MyProfile is available on the other XL2 Analyzer.

If the profile is exported from an XL2 Analyzer with activated options to another XL2 Analyzer without options, then these options have to be hidden prior to storing the profile for export:
- In the exporting XL2 system menu, select the individual option and toggle with enter ⏻ to Hidden.
- Store the profile in the XL2 Analyzer.
Profiles

The XL2 can store up to 20 individual profiles in the internal system memory and offers three different profile types:
| Types Description | |
| Factory default profiles | The XL2 includes factory default profiles, which are marked with “#” in the beginning of the file name. Sample filename: #DIN15905-5.prfsThe factory default profiles are a free download for all registered XL2 customers on the support website at https://my.nti-audio.com. For details see the chapterMyNTIAudp.For detailed settings of factory default profiles please see the Appendix 2 in this manual. |
| User profiles | User profiles are profiles generated by you on the XL2 Analyzer.Sample filename: MyProfile.prfl |
| Secured profiles | Secured profiles are locked user profiles with overwrite protection indicated by the file name ending in "xxx.prfs". This file name cannot be overwritten.Sample filename: MyProfile.prfsHow to generate secured profilesExport the profiles to SD Card according to the procedure in the chapterProfile-Getting Started.Connect the XL2 to the PC.Select the user profile in the folder "Profile". Manually change the ending of the user profile from "xxx.prfl" to "xxx.prfs" Disconnect the XL2 from the PC.Import the profiles from the SD CardPower off/onthe XL2 AnalyzerThe secured profile is displayed with a lock-symbol in the profile selection window on startup of the XL2. |

Capture + Tolerances
10. Spectral Limits Option (Capture + Tolerances)
The Spectral Limits Option extends the function range of the XL2 with trace capturing, relative curve display and comprehensive tolerance handling for the FFT Analysis and the high resolution 1/12 Oct + Tol spectral analysis.
Features:
Capturing of multiple readings into the internal memory •
Comparing measurement results against captures with relative or absolute curve display
Comprehensive tolerance handling •
Creating tolerance masks based on captures for passed / • failed measurements
Capture the EQ Measurement Results
Select the Capture & Start Tolerance Mode symbol for capturing the measurement result.
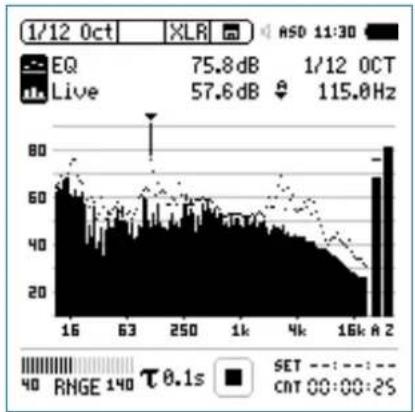
bar_line
| Time | Value | |------|-------| | 1/12 Oct | 75.8 dB | | 1/12 OCT | 57.6 dB | | 1/12 OCT | 115.0 Hz |Confirm with enter 🔍.
Capture + Tolerances


A pop-up window appears.
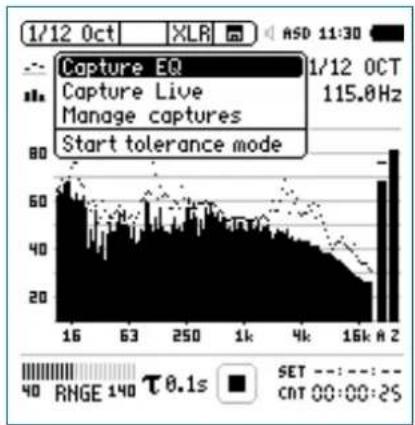
bar
| Time (s) | Value | | -------- | ----- | | 16 | 80 | | 63 | 60 | | 250 | 40 | | 1k | 20 | | 4k | 10 | | 16k | 5 | | 16k A 2 | 80 |Select • Capture EQ. Confirm with enter 🔒.

The pop-up window ... and store it to appears.
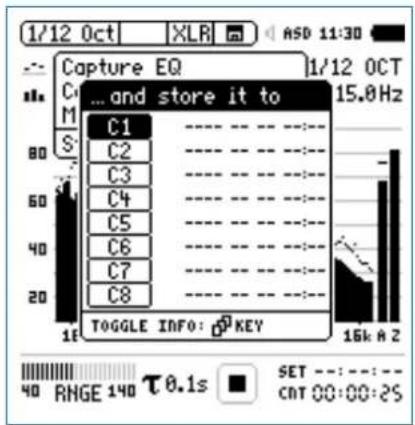
bar
| Category | Value | |---|---| | C1 | 15.0Hz | | C2 | 15.0Hz | | C3 | 15.0Hz | | C4 | 15.0Hz | | C5 | 15.0Hz | | C6 | 15.0Hz | | C7 | 15.0Hz | | C8 | 15.0Hz |Select • C1.
Confirm with enter Ⓧ and set the capture name in the displayed letter selection box e.g. to Ref.

The capture has been stored in the internal XL2 memory.

Capture + Tolerances
Edit Capture Manually
Select the Capture & Start Tolerance Mode symbol.
Confirm with enter 🔒.
Select • Manage captures.
Confirm with enter 🔒.
Select • Save to SD card.
The pop-up window Save captures appears.
- Select the capture to be exported, e.g. C1.
The pop-up window Save capture C1 to appears.
Confirm with • Save.
The XL2 generates the file MyCapture.txt in a new folder called Captures.
- Edit the sound level data in the capture file. All frequency data has to remain the same.
- Load the new capture file with Manage captures back into the internal XL2 memory.
See the difference between Live Level and Capture
- Blank the upper parameter by setting ----.
- Select the lower parameter with the rotary wheel Ⓞ. Confirm with enter ⏻.
- Select Live and confirm with enter ⏻.
The pop-up window Select reading mode appears.
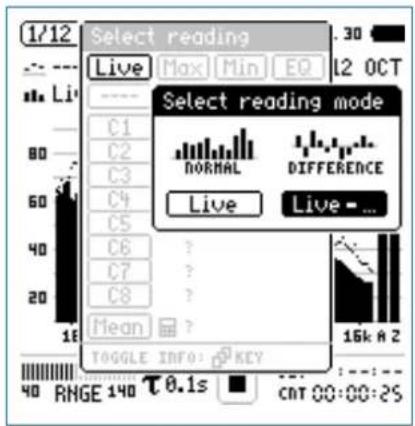
- Select Live - for displaying the relative difference. Confirm with enter ⏻.
- Select Ref and confirm with enter
- Set the Y-axis accordingly to show the zero-line.
Capture + Tolerances

The relative difference between the Live level and the captured reference is displayed.
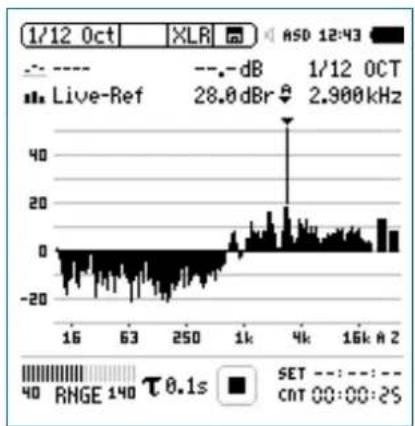
bar
| Time | Value | |------|-------| | 16 | -20 | | 63 | -10 | | 250 | 0 | | 1k | 10 | | 4k | 20 | | 16k | 15 | | 2 | 10 || All levels differences (relative levels) are displayed in the unit dBr. |
Manual Editing of Capture Data
Kindly observe the following rules while manually editing capture data:
The spectral level data is Z-weighted, thus the sum of all bands has to equal the Z-weighted broadband level.
The A and C-weighted broadband levels are calculated ob- serving the corresponding correction factors.
Enter -999 if nothing shall be deducted at certain broadband levels or frequency bands.
| %----EDIT ONLY LEVELS HERE!---- |
| #A-weighted broadband level32.74 |
| #C-weighted broadband level-999 |
| #Z-weighted broadband level33.17 |
| #ColumnsFrequencyLevel#Spectrum16-99931.5-99963-99912510.525020.550025.7100028.6200025.5 |

Capture + Tolerances
Start Tolerance Mode for Passed/Failed Measurements
Select the Capture & Start Tolerance Mode symbol with the rotary wheel Ⓞ.

A pop-up window appears.
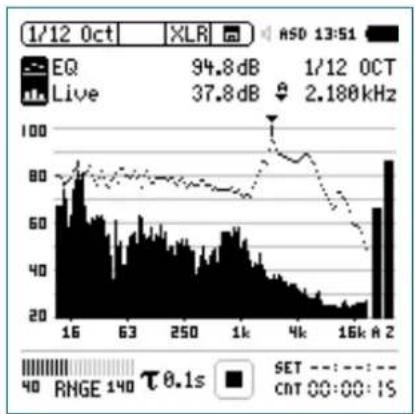
bar_line
| Time | Value | |------|-------| | 1/12 0CT | 94.8 dB | | 1/12 0CT Live | 37.8 dB | | 1/12 0CT | 2.180 kHz |Confirm with enter 🔍.
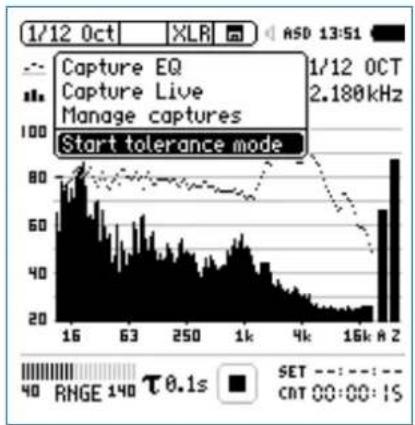
bar_line
| Time | Value | |--------|-------| | 1/12 Oct | 80 | | 63 | 60 | | 250 | 40 | | 1k | 20 | | 4k | 10 | | 16k A | 70 |Select • Start tolerance mode. Confirm with enter 🔒.
Capture + Tolerances

The pop-up window Make tolerance from appears.
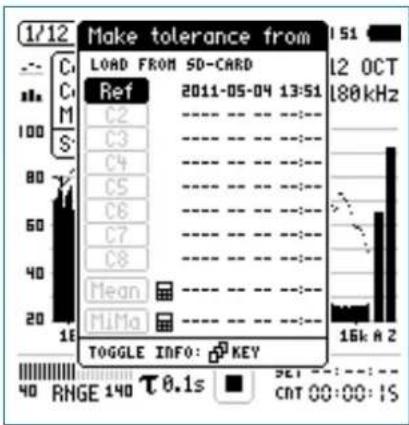
- Select Ref to load the earlier captured reference spectrum. Confirm with enter 🔍.

You may press the page button to toggle between the date and spectral resolution data of the capture.
Passed Result
The tolerance mode is active for passed/failed measurements.
The passed/failed condition is further visualized by the bicolor "limit" button and forwarded to the I/O interface of the instrument in order to drive an external alarm device such as the accessory SPL Stack Light.
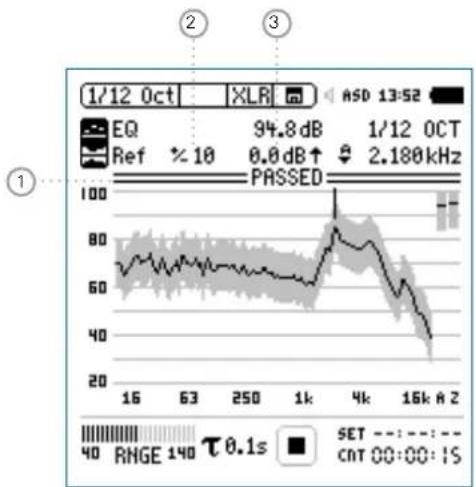
line
| Date | Value | | ---------- | ----- | | 1/12 Oct | 94.8 dB | | 1/12 OCT | 2.180 kHz | | Reference | 10 | | Ref | 10 | | Percentage | 10 | | Frequency | 2.180 kHz | | Range | 40 | | Time Label | 0.1s |
Capture + Tolerances
① PASSED / FAILED Result
PASSED The actual measurement result is within the tolerance band.

The actual measurement result is outside of the tolerance band. Exceptions are visualized in any out-of-tolerance frequency band.
② Tolerance Bandwidth
Adjusts the tolerance bandwidth based on the captured reference spectrum in dB.
③ Level Offset
Provides a level offset in dB to shift the tolerance band up or down.
Failed Result
The XL2 Analyzer compares spectral measurements against a tolerance band and visualizes exceptions ① in every frequency band.
1
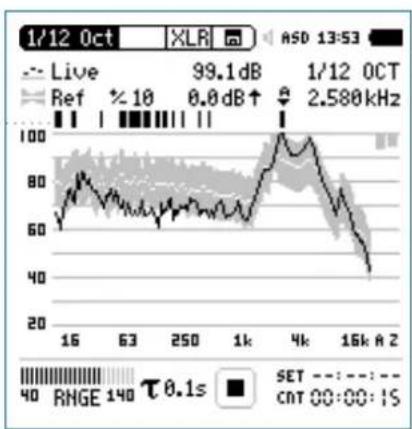
line
| Time | Value | |------|-------| | 1/12 Oct | 99.1 dB | | 1/12 OCT | 2.580 kHz | | Reference | 10 | | Target | 0.0 dB | | Range (approx) | 40 to 100 |Select another Tolerance File
- Select the tolerance Ref with the rotary wheel
Confirm with enter ⏻.
Select the new tolerance file from the SD Card or the internal • XL2 memory.
Capture + Tolerances

Tolerance Menu
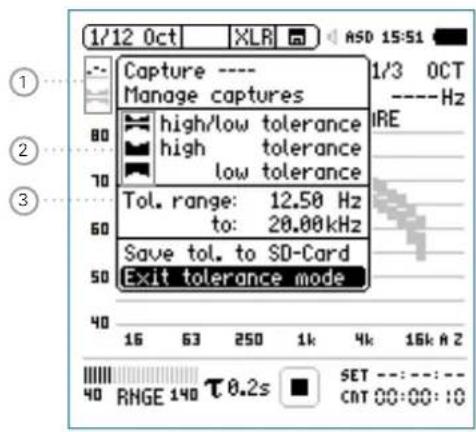
① Capture & Start Tolerance
Opens capture and tolerance menu.
② Tolerance Type
Select between high/low, high or low tolerance band based on the reference data set.
③ Frequency Range
Setting of start and stop frequency of the tolerance band.
Advanced Start Functions
You may start the passed/failed measurement in one of the following ways:
Press the XL2 start button ↗
Activate the automated level trigger in the tolerance file.
Activate the digital input 1 via the external I/O interface; e.g. a foot switch or a PLC control.
Digital I/O Interface
Result Passed: Output 1
Result Failed: Output 3
Start Measurement: Input 1
Tolerance Management
Tolerance curves can either be imported from txt-files or directly derived from captured measurements. The XL2 calculates tolerance bands based on
Single captured results•
txt-files generated manually on a PC•
• Mean average of multiple captures
- Min/Max curves of multiple captures

Capture + Tolerances
Create Tolerance Files Manually on PC
Capture a spectrum on the XL2 Analyzer.
Enter the tolerance mode and generate a tolerance band for • the capture.
Select the Capture & Start Tolerance Mode symbol.
Confirm with enter 📂.
- Select Save tol. to SD Card to export the capture tolerance file. This file includes the reference capture and the tolerance data. The XL2 generates a txt-file in the folder "Tolerances".
Open the capture tolerance file with a text editor or MS Ex-cel.
Edit the tolerance data according to your requirements. • Change only the Min, Ideal and Max column values. You may delete rows, but do not change the frequency column values. Any rows where frequency column values have been changed will be discarded by the XL2.
- Store your individual tolerance file as a txt-file in the XL2 folder "Tolerances".
Start the XL2 tolerance mode and load the new tolerance file • from the SD Card.

- All entries in the customized tolerance file need to be tab-separated.
- The individual tolerance file entries may be in any order; no sequential order required.
- Tolerance file templates and standardized tolerance files are a free download for all registered XL2 customers on the support website at https://my.nti-audio.com. For details see the chapter [My Nti Audio] in this manual.
Capture + Tolerances

Band-limited Measurement Range
Alternatively to the settings on the XL2, the tolerance may also be limited to a range of frequency bands or a number of individual frequencies on a computer.
Open the tolerance file on the computer.
Delete all not required frequency bands.
Set • #Hide UnusedBands to True.
Save the file changes.
Load the updated tolerance file in the XL2.
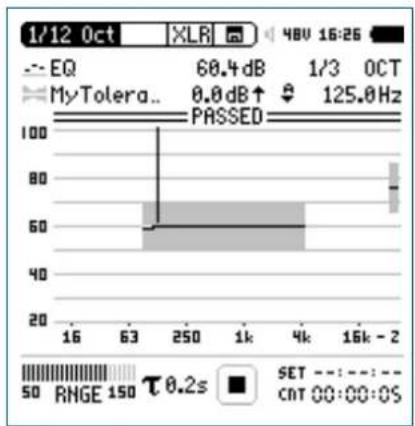
bar
| Parameter | Value | | :--- | :--- | | EQ | 60.4 dB | | MyTolera.. | 0.0 dB ↑ | | 1/3 OCT | 125.0 Hz | | PASED | | | SET | | RMGE | 150 | | τ 0.2s | | | CAT 00:00:0S | |The XL2 shows selectable broadband values with A, C or Z-weighting on the right hand side of the spectrum.
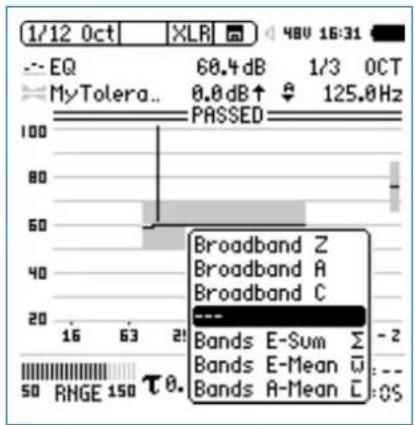
bar
| Band | Value | | :--- | :--- | | Broadband Z | 68.4 dB | | Broadband A | 1/3 OCT | | Broadband C | 125.0 Hz | | Bands E-Sum | - | | Bands E-Mean | - | | Bands A-Mean | - | | RNGE 150 | θ. | | 16 | 63 | | 21 | 50 | | 50 | 150 | | 100 | 100 |Alternatively select the following averaged or summed levels:
Bands E-Sum• : Sum of displayed frequency bands
Bands E-Mean• : Energy-averaged level of displayed frequency bands, e.g. the bands 80 dB and 70 dB produce 77.4 dB.
- Bands A-Mean: Arithmetically-averaged level of displayed frequency bands, e.g. the bands 80 dB and 70 dB produce 75 dB.

Capture + Tolerances
Unit
dBr
Mode
HighLow
Columns
FrequencyMinIdealMax
| #ATolerances | ||
| UNDEF80unde | f | 90 |
| #ZTolerances | ||
| UNDEF80unde | f | 90 |
BandTolerances
| 2010unde | f | 80 |
| 100070unde | f | 80 |
| 100073unde | f | 77 |
| 400073unde | f | 77 |
| 400070unde | f | 80 |
| 2000070unde | f | 80 |
LevelOffset
0
HideUnusedBands
false
nAllowedViolations
0
Unit dBr (relative), fixed setting
Mode Describes tolerance type; the XL2 allows setting of the tolerance type independently of the tolerance file.
HighLow Utilizes upper and lower tolerance based on ideal reference.
High Utilizes only upper tolerance based on ideal reference.
Low Utilizes only lower tolerance based on ideal reference.
Columns Column headings for further tolerance data separated into columns:
Frequency / Min / Ideal / Max
ATolerances Defines the tolerance band for the A-weighted wideband level (not mandatory).
CTolerances Defines the tolerance band for the C-weighted wideband level (not mandatory).
Capture + Tolerances

ZTolerances Defines the tolerance band for the Z-weighted wideband level (not mandatory).
BandSum Defines the tolerance band for the
Tolerances sum of displayed frequency bands (not mandatory).
Band
Tolerances Defines the tolerance band for the individual • frequencies. The ideal parameter can be set as “undef”. • The same frequency value on two successive rows defines a tolerance step, e.g.:
| Frequency Min Ideal Max | ||
| 100 70 75 80 | ||
| 500 70 75 80 | ||
| 500 75 80 90 | ||
| 1000 | 75 80 90 | |
LevelOffset All levels in the tolerance file are relative levels dBr. Thus the level offset provides the relation between the relative level and actual sound pressure level. (not mandatory)
The XL2 allows setting of the level offset independently of the tolerance file.
Hide Defines the way measurement results are UnusedBands shown.
True Measurement results of frequency bands without any specified tolerance are not displayed. The total level of all shown bands (sum of bands) is available as a broadband result.
False The measurement result of all frequency bands are shown.
nAllowed Allows a PASSED result with a maximum violations number of n failed frequency bands (not mandatory)

Capture + Tolerances
FreqScale Spacing Defines the frequency scale spacing in the X-axis for the tolerance data. (not mandatory)
lin Tolerance data displayed with linear frequency spacing, e.g. used in the FFT function. (default setting)
log Tolerance data displayed with logarithmic frequency spacing e.g. used in the 1/12 Oct + Tol function.
AutoStart Enables auto start function. (not mandatory)
True Auto start is active. The run indication displays A. The measurement starts automatically after the trigger level is reached. Alternatively the measurement may start manually by pressing start ▶■.
False No auto start function. (default setting)
AutoStartTrig Sets the sound level in dBZ for an automated gerLevel level trigger; the passed/failed measurement starts as soon as the set level e.g. 95 dB is reached or exceeded. The actual input level can be monitored at the input range bar. (mandatory if #AutoStart is True)
AutoStartSet-Defines the settling time, after the auto start tlingTime trigger level is exceeded, until the start of the measurement; the time is set in 100 millisecond steps e.g. setting 0.5 equals a settling time of 0.5 seconds. If the input level drops below the auto start trigger level during this period, no measurement is carried out. (not mandatory)
MeasTime Defines the measurement time in 100 millisecond steps; e.g. setting 1.5 equals a measurement period of 1.5 seconds. (not mandatory)
FailDeadTime Defines the delay for a failed condition in seconds; for example the XL2 triggers "failed" if the measurement result is beyond the tolerance limits for e.g. 60 seconds. This feature supports condition monitoring applications. (not mandatory)
System Settings

11. System Settings
The various system settings of the instrument can be adjusted as follows: Turn the rotary wheel to navigate to the main menu ① and select System. Confirm with enter ⏻.
Settings
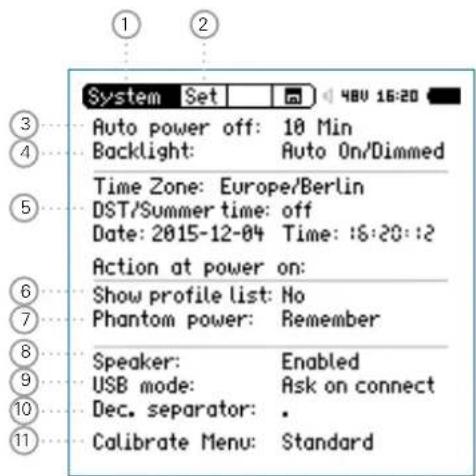
Page Selector
② Toggles with the page button ☐ between
Set System setting
Vib Vibration (applicable only upon installing the Vibration option and selecting the vibration menu)
Sch Scheduler
Opt Options
Inf System information
③ Auto power off
If no button has been pressed for the defined time period, then the instrument switches off. The auto power off mode is disabled when a measurement is running or when an external mains power supply is used.
- Select Auto power off with the rotary wheel Confirm with enter Set the auto power off time with the rotary wheel Confirm with enter

System Settings
④ Backlight
Toggle the backlight with the power/backlight button. The backlight offers three different conditions:
On• Dimmed• Off•
Auto On/Off T he backlight switches off if no key is pressed for 2 minutes.
Auto The backlight dims if no key is pressed On/Dimmed for 2 minutes.
Manual The backlight can be toggled between On, Dimmed and Off.
Navigate the cursor to the backlight function. Toggle with enter ⏻ to set this parameter.

Dimming the backlight reduces the power consumption.
⑤ Date and Time Setting
The XL2 includes a real-time clock. All measurements are logged with a date and time stamp.
Time Zone Select your time zone
DST/ Summer time Activate this for daylight saving
Date Date in yyyy:mm:dd
Time Time in hh:mm:ss
Set the real-time clock as follows:
- Select the Date function ⑤ with the rotary wheel
- Confirm with enter ↻.
- Set the date with the rotary wheel
- Confirm each setting with enter ↻.
- Follow the same procedure for Time.
You have set the real-time clock.
System Settings

⑥ Show Profile List
You may configure the XL2 to start up with individual preset application profiles. For example, sound level monitoring in accordance with DIN 15905 or V-NISSG.
Yes T he instrument starts up with default application profiles. Further details about the application profiles are in the chapter Profiles.
No The instrument starts up in the last configuration without any application profiles.
⑦ Phantom Power
You can select if the phantom power should be activated or disabled when the XL2 is powered up.
Off The
phantom power is switched off when the XL2 is powered up; e.g. when it is common to measure lines.
Remember The XL2 remembers the setting prior to the last shutdown. (= default setting)
⑧ Speaker
Enables/disables the rear speaker. For example, it is recommended that the rear speaker be disabled for all acoustic measurements. This prevents measuring the audio feedback sound loop generated through the rear speaker.
⑨ USB Mode
This defines how the PC recognizes the connected XL2:
Ask on Select either the Mass storage or COM port connect mode after connecting the XL2 to the PC.
Mass storage The PC recognizes the XL2 as a mass storage device automatically, allowing you to download XL2 measurement reports.
COM The PC recognizes the XL2 as a COM port automatically for application of the XL2 Projector PRO and the Remote Measurement Option.

System Settings
10 Decimal Separator
Set the decimal separator to match the generated measurement reports to the PC settings. This simplifies data post-processing on the PC.
Navigate to the • Dec. Separator function with the rotary wheel ○.
- Toggle between “ . ” and “ , ” with enter ⏻ to set this parameter.
The decimal separator is set.
⑪ Calibration Menu Setting
Setting of the calibration menu.
Standard The default calibration menu is displayed.
Show The calibration menu is extended by the selection of the spectral correction for the outdoor measurement microphone M2230-WP
Vibration
This page is available upon switching to the vibration menu, which requires an installed Vibration-Option. Vibration is selected in the calibration menu.
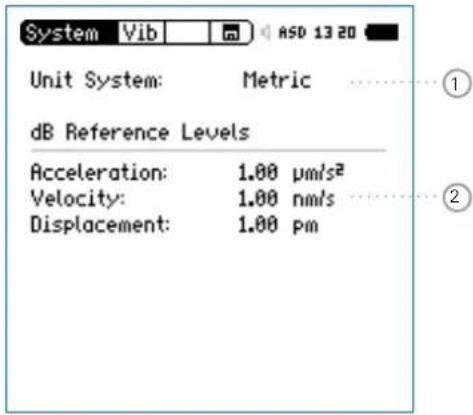
① Selection Metrical-Imperial Units Units selection
② dB Reference Definition of the reference parameters for dB results
Scheduler
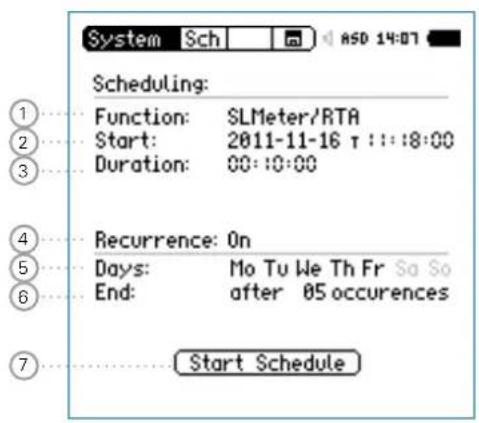
System Settings

The XL2 Analyzer offers automated scheduled measurements without any human interaction. You may schedule a measurement for one or multiple days or ever.
XL2 Actions after pressing Start Schedule
Selects the preset measurement function.
Standby until start time•
Starts measurement at start time
Stops measurement after the preset measurement duration•
Stores measurement data to SD Card (no reconfirmation required)
Stops schedule or standby until next start time.
Supported measurement functions:
SLMeter/RTA•
FFT + Tol•
RT60•
1/12 Oct + Tol•
• STIPA

System Settings
① Function
Select the measurement functions for the scheduled measurements.
② Start Date and Time
Set the date for the scheduled measurement(s):
Select • Start with the rotary wheel.
Confirm with enter 📋.
Set the date with the rotary wheel 🔒.
Confirm each setting with enter 📋.
Set the time for the scheduled measurement:
- Select the T symbol to the right of the date.
Confirm with enter ⏻.
Set the time with the rotary wheel Ⓞ.
Confirm each setting with enter ⏻.
③ Scheduled Duration
Set the scheduled duration of the measurement(s). The actual settings of the selected measurement function apply.
④ Recurrence
Off Schedules a single measurement.
On Schedules a measurement sequence with the same start and end time for the selected days.
⑤ Days
Select the week days for the recurrence
⑥ End
Set the number of occurrences of the scheduled measurement. Each week day is one occurrence. Select between 1 to 99 occurrences or an endless schedule (= never).
⑦ Start Schedule
Starts the scheduled measurement(s).
The Scheduler active window is displayed.
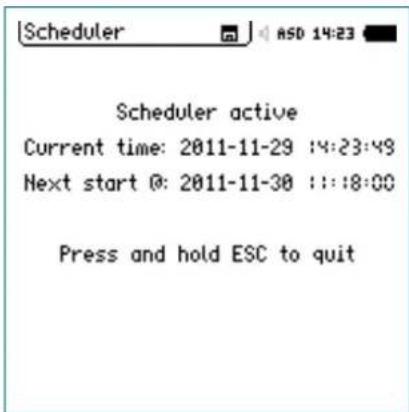
System Settings

Scheduling - Getting Started
After starting the scheduled measurement, the XL2 waits for the next scheduled start date and time. The instrument buttons are disabled.
Power Supply
It is recommended that the instrument remains powered on until the next start time, using the accessory mains power adapter. If the XL2 is powered off and on again during this time, then the XL2 Analyzer restarts in the Scheduler function and continues the countdown. This applies also for any interruption of mains power supply.
Stopping the Scheduler
Press and hold the start/stop button ▶■ to stop the scheduler prior to the start of the measurement or as an interrupt of any ongoing scheduled measurement.
Operation with PC
Starting the schedule switches the USB interface automatically into the COM port mode for remote measurement applications or using the XL2 Projector PRO software.
Options
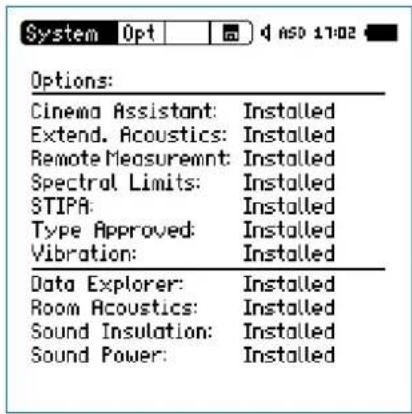
Displays the options installed on the XL2.
Every installed option may be temporarily Hidden to generate a profile for other XL2s without this option installed.
Select the installed option.
Toggle with enter ⏻ to set this parameter.

System Settings
Information
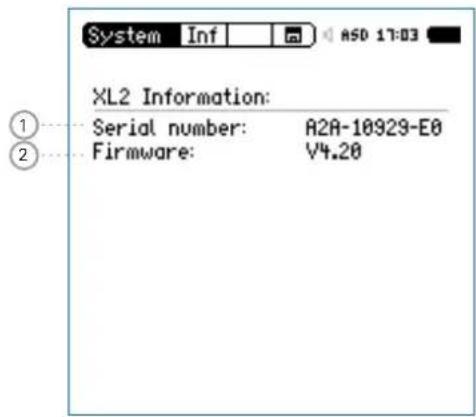
① Serial Number
Displays the instrument's serial number.
② Firmware
Displays of the firmware version number (to update the firmware to the latest version see the chapter Firmware Update of XL).
Data Management

12. Data Management
The XL2 stores all acquired measurement data including real-time information onto the removable SD Card. Additionally, wav-files might be recorded and individual voice notes added for a complete documentation of the measurement.
Carry out a sound level measurement.
Select the memory menu 🔒 in the upper menu bar.
Press enter 🔒. The memory menu opens.
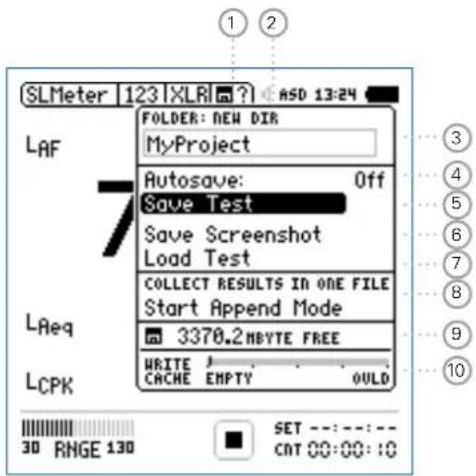
① Create New Project Folder
Add a new folder with an individual project name. The maximum length of the project name is 16 characters. A fast way for creating new folder names is
Select an existing folder name with • DIR
- Select NEW
- Rename the folder and confirm with start ▶■ thereby creating a new folder name.
② Select Project Folder
An overview of all existing project folders is shown. Select a folder to store the results of the measurements.
③ Project Folder Name
All measurements are stored in this project folder.
④ Autosave
Setting of auto or manual data file naming and saving
On
The results are named and stored automatically in the selected project folder.
Off
A question mark appears in the upper menu bar ☐ at the end of the measurement. You can choose to individually name and store each single measurement.

Data Management
Assisted A pop up menu appears after each measurement. You may select to keep or delete the stored measurement records.
⑤ Save Test
Stores the measurement in the selected project folder.
6 Save Screenshot
Stores the XL2 screen in the selected project folder.
⑦ Load Test
Loads back previously-stored result data from the SD Card for detailed examination on the instrument screen.
⑧ Append Mode
The append mode stores one or more results into the same data file, simplifying data analysis and handling on the PC.
Application example:
When measuring the acoustic spectrum at various locations within the same venue, the append mode allows you to store all the measurement results into one single data file.
⑨ Free Memory
Displays the remaining available memory on the SD Card.
The XL2 prevents a memory overflow. SD Cards are not designed for a 100% memory usage; the XL2 keeps at least 2% or 50 MB empty.
The XL2 deactivates the audio recording 50 MB before this limit is reached and reports this on the display.
In the case where only 2% or 50 MB remains, the XL2 deactivates the data logging and reports this on the dis-• play. disables Save Test and Autosave•
- saves the report at the end of the current measurement.
Data Management

⑩ Write Cache (available with Extended Acoustic Pack)
A low Write Cache level indicates that the SD Card is performing well. The optional Extended Acoustic Pack with simultaneous 100ms logging and linear wav-file recording results in high data volumes being written to the SD Card. Some non-original SD Cards may overload (OVLD), causing the loss of some measurement data. Verify the Write Cache of your SD Card during your measurements. Use only original SD Cards. We recommend SD Cards from the manufacturers SanDisk and Transcend.

Original SD Cards ensure that all measurement data and audio wav-files are stored in good order on the SD Card. Non-original SD Cards may lead to low performance or errors.
Order information: see chapter[Accessories].

In case the SD Card is full, you can insert the original spare SD Card into the XL2 and continue with the measurements. The XL2 generates the projects and system folders automatically.
Memory Structure of SD Card
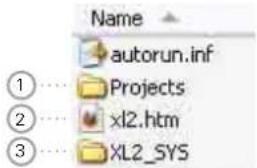
① Projects
The folder Projects contains subfolders with the stored measurement results. The default subfolder name is "MyProject". You can create further individual subfolders.
② XL2.htm
This file opens the XL2 instrument status page, with Serial Number, Firmware and Installed Options.
The page also provides links for online Firmware updates• Activation of Options•
③ XL2\_SYS
The XL2 system folder contains a file with serial number, firmware version and installed options - DO NOT EDIT THIS FILE.

Data Management
Measurement Data - Getting Started
Enable Data Logging
- Select the Log page in the sound level meter function and set the logging parameters; e.g., as follows:
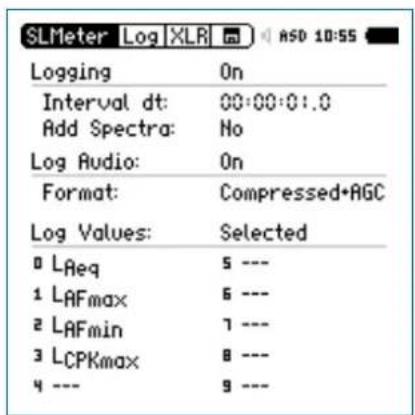
Select Parameters for Measurement Report
- Select the Rep page in the sound level meter function and set the parameters as follows:
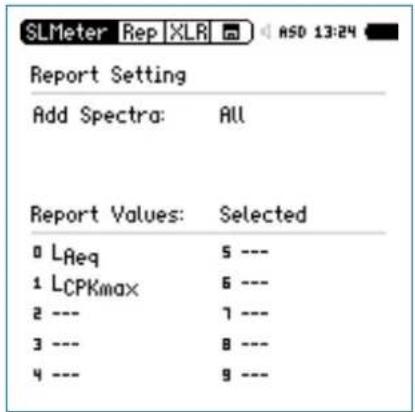

The data logging is enabled. The sound pressure level will be logged each second while the measurement is running.
Data Management

Complete the Measurement
Press page 📄 to return to the numeric result page.
Press start ▶The sound level measurement is now running.
Press stop ➤ to complete the sound level measurement.
The measurement data is stored automatically using the factory settings. In the memory menu ☐ „Autosave: Assisted” is activated.
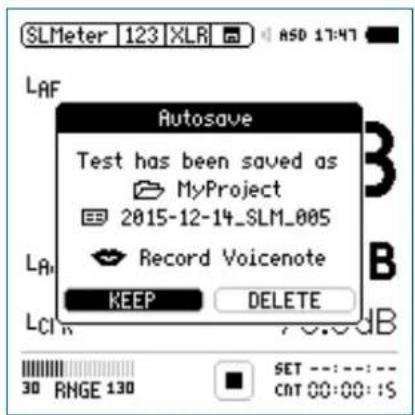
In the case when the instrument is used with the setting •
Autosave: Off, a question mark appears after the completed measurement ☐?
Now you may store the measurement data manually.
Select the memory menu 📄 with the rotary wheel ⏻ and confirm with enter ⏻.
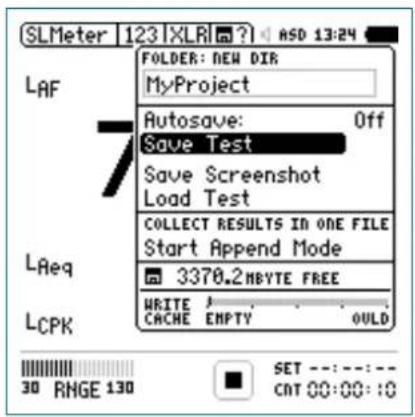
- Press enter ⏻ to confirm Save Test.
The pop-up window Save Test appears.

Data Management
Select File Name
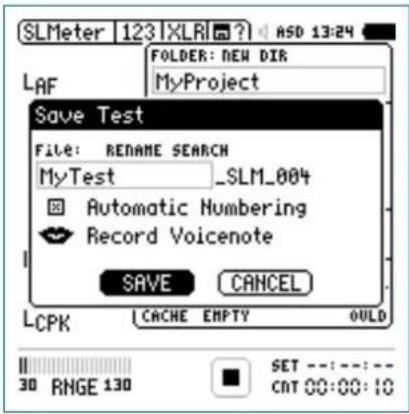
Name the first part of the file name. The maximum length of the first part is 12 characters. The next part “_SLM_001” is defined by the XL2 to avoid overwriting of existing measurements, whereby “SLM” is the appendix for the measurement function and “001” is an automatically-incrementing number.

Predefined Save Names
Generate a text file with user defined save names, such as "Room1", "Room2", ..., and store it as "savenames.txt" in the root directory of the XL2. Just use names with letters or numbers - special characters are nort supported.
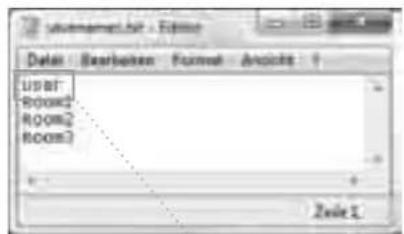
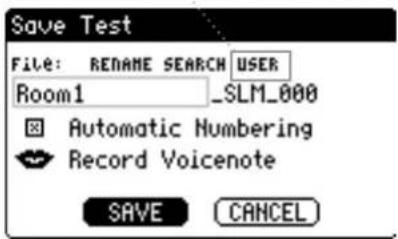
The XL2 displays the first line of the txt-file in the Save Test selection menu at manual data saving.
Data Management

Record Voice Notes
With the internal voice note microphone, record a Voicenote to save with the test to remind yourself at a later stage where and/or under which conditions the measurement was done.
Select• Record Voicenote and press enter.
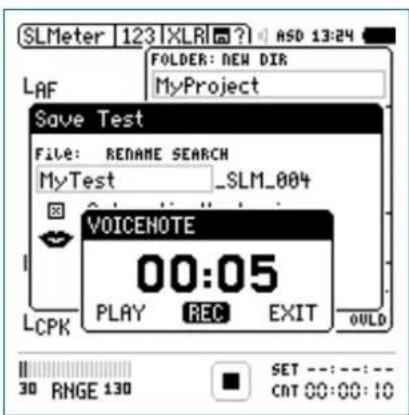
Select• REC and press enter.
Record the voice note and press enter ⏻ to finish.

The voice note has been recorded.
Save Measurement Data
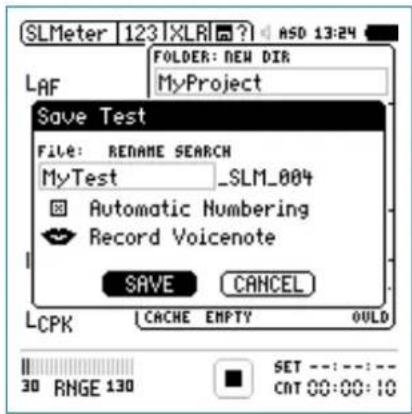
Select• SAVE and confirm with enter.

The measurement data including test configurations and all log files are stored on the SD Card.

Overwrite File
Disabling Automatic Numbering allows results to be overwritten with new results.

Data Management
Save Screenshot
Select the memory menu ☐ with the rotary wheel and confirm with enter ⏻.

The memory menu opens.
Select • Save Screenshot and press enter.
- Select the file name and confirm SAVE with enter ↻.
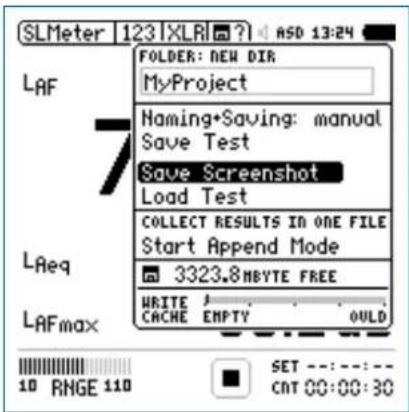

The screenshot is saved to the SD Card.
Measurement Data Logging:
If the battery runs out while you are measuring with logging and/or repeated-reporting enabled, the XL2 creates the folder RESTORE_AFTER_POWERFAIL and stores the measurement data up until the switch-off time. The next time you switch on the XL2, the following window informs you that this data exists. Click OK:

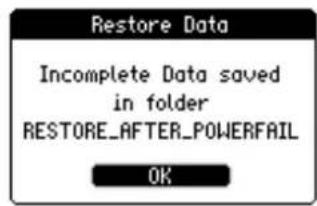
Initializing
There may be invalid data at the end of the file, which you can delete manually to create a valid report.
View Project Folder on the PC
Connect the XL2 with the USB cable to the PC.

The pop-up window USB Mode appears.
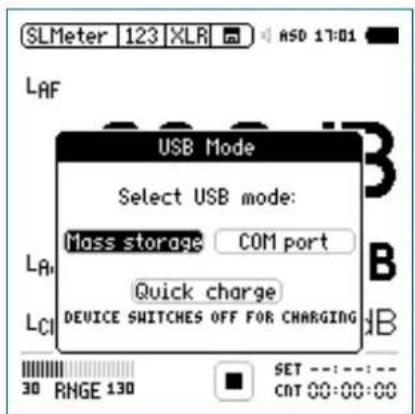
- Select Mass Storage and confirm with enter ⏻.
Data Management


The PC recognizes the XL2 as a mass storage device. The following SD Card content is shown:
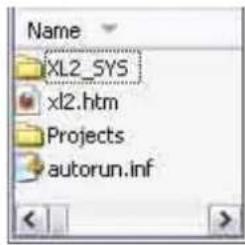
Open the folder "Projects" and the subfolder "MyProject".

All stored measurement data files are shown.
| If the XL2 is started with USB connection to PC, then the COM port mode is automatically activated for remote measurement or the XL2 Projector PRO software. Therefore, if you want to access the data in the SD Card, then first start the XL2 and thereafter connect the USB cable to the PC. |

Data Management
Overview of Measurement Data Files
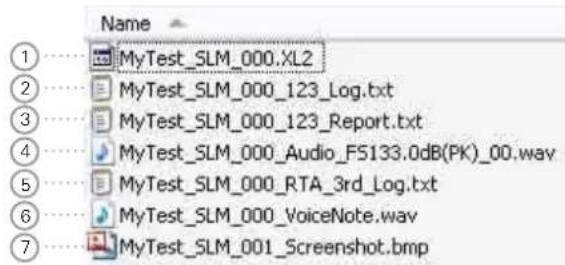
① Test System File
System file for use by XL2 only. It contains the measurement data and test configuration of the last measurement cycle for later reload and view of measurement results in the XL2.
② Sound Level Log File
The XL2 logs sound levels in pre-defined log time intervals. For more details please see the chapter Sound Level Me-fer_Cogging.
③ Measurement Report File
Final report after the completed measurement. For more details please see the chapter Sound Level Meter: Reporting.
④ Wav-File
The wav-file is the recorded audio file. The index "FS133.0dB(PK)" in file name represents the full scale peak level of the recorded wav-file. For more details please see the chapter Sound Level Meter: Wave-File Recording.
⑤ RTA Log File
The XL2 logs the detailed real-time analyzer spectra in predefined time intervals. For more details please see chapter Sound Level Meter: Logging.
⑥ Voice Note
A voice annotation can be recorded for each stored measurement or screenshot. For more details please see the chapter Data Management Voice Notes.
⑦ Screenshot
The log data file may become very big during long-term measurement applications. As soon the file size reaches 2 GB during the ongoing measurement, the file is saved with the index 1 and a new data file created with index 2.
XL2 Data Explorer Software combines all these data files together seamlessly.
Transfer Measurement Data to PC
Drag and drop the required data files to the PC.

Card Reader
Alternatively the SD Card can be inserted into a card reader. This offers a faster data transfer from the SD Card to the PC.
Additional Data Files using Repeat Mode
For sound level measurements with timer mode Repeat or Repeat Synchronized the following additional data files are generated:
MyTest_SLM_000_123_Report_Rep.txt
MyTest_SLM_000_RTA_Report_Rep.txt
Common xxx_Report.txt files contain the measurement data of the last measurement cycle.
The xxx_Report_Rep.txt file contains the results of all measurement cycles in the Repeat or Repeat Synchronized mode.
Microsoft Excel
The generated .txt files are best viewed on the PC using "Open with" -> Microsoft Excel.

Data Management
Log File Format
File name: e.g. MyTest_SLM_000_123_Log.txt
XL2 Broadband Logging
MyProjects\MyTest_SLM_000_123_Log.txt
# Hardware Configuration
Device Info: XL2, SNo. A2A-02673-D1, FW2.20
Mic Type: NTi Audio M4260, S/N: 1486, User calibrated 2011-04-05 13:56
Mic Sensitivity: 27.3 mV/Pa
# Measurement Setup
Timer mode: continuous
Timer set: --:-:-
Log-Interval: 00:00:01
k1: 0.0 dB
k2: 0.0 dB
kset Date: k-Values not measured
Range: 30 - 130 dB
# Time
Start: 201 1-05-15, 17:44:06
End: 2011-05-15, 17:44:16
# Broadband LOG Results
| Date | Time | Timer | LAeq_d | LAeq | LAFmax_dt | LCPKmax_dt | |
| [YYYY-MM-DD] | [hh.mm.ss] | [hh.mm.ss] | [dB] | [dB] | [dB] | [dB] | |
| 15.11.2010 | 17:44:07 | 00:00:01 | 97.0 | 97.0 | 102.4 | 119.0 | |
| 15.11.2010 | 17:44:08 | 00:00:02 | 85.8 | 94.3 | 91.9 | 105.7 | |
| 15.11.2010 | 17:44:09 | 00:00:03 | 73.8 | 92.5 | 85.2 | 102.4 | |
| 15.11.2010 | 17:44:10 | 00:00:04 | 79.0 | 91.4 | 85.3 | 103.9 | |
| 15.11.2010 | 17:44:11 | 00:00:05 | 72.6 | 90.4 | 75.9 | 94.8 | |
| 15.11.2010 | 17:44:12 | 00:00:06 | 67.3 | 89.6 | 71.4 | 87.3 | |
| 15.11.2010 | 17:44:13 | 00:00:07 | 91.2 | 89.9 | 95.3 | 112.3 | |
| 15.11.2010 | 17:44:14 | 00:00:08 | 92.7 | 90.4 | 97.1 | 113.2 | |
| 15.11.2010 | 17:44:15 | 00:00:09 | 79.3 | 89.9 | 81.6 | 97.9 | |

Level LAeq\_dt "delta t"
Level within the logging interval. e.g. If the logging interval is 1 second, then LAeq_dt is the time-averaged level of each second.
Report File Format
File name: e.g. MyTest_SLM_000_123_Report.txt
XL2 Sound Level Meter Broadband Reporting
MyProjects\MyTest_SLM_000_123_Report.txt
# Hardware Configuration
Device Info: XL2, SNo. A2A-02673-D1, FW2.20 Mic Type: NTi Audio M4260, S/N: 1486, User calibrated 2010-11-05 13:56 Mic Sensitivity: 27.3 mV/Pa
# Measurement Setup
Append mode: OFF
Timer mode: continuous
Timer set: --:--:--
k1: 0.0 dB
k2: 0.0 dB
kset Date: k-Values not measured
Range: 30 - 130 dB
# Broadband Results
Stop
| Date | Time | Date | Time | LAeq | LCPKmax |
| [YYYY-MM-DD] | [hh:mm:ss] | [YYYY-MM-DD] | [hh:mm:ss] | [dB] | [dB] |
| 15.11.2010 | 17:44:06 | 15.11.2010 | 17:44:16 | 89.3 | 119.0 |
Data Post-Processing
A Microsoft Excel form generating an automated sound level measurement report and chart is available as a free download for all registered XL2 customers on the support website at https://my.nti-audio.com. (Enable all macros when opening the document.)
Data Management

XL2 File Validator
A check sum is written to the file at the end of every measurement report. The XL2 Analyzer calculates the check sum automatically based on the data content of the file. Using the XL2 File Validator PC-software, the contents of a data file may be verified at any time. e.g. authorities can verify if the XL2 report file is original or the data has been manually modified.
The software "XL2 File Validator" is available for download for all registered XL2 customers at https://my.nti-audio.com.
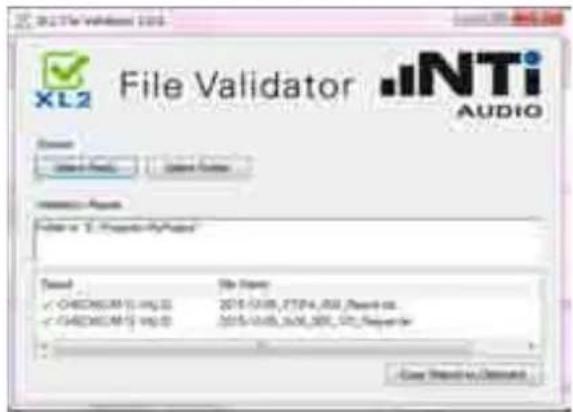
Recall Measurements
The straight-forward but powerful Load Test and Save Test functions serve the dual purpose of conveniently retrieving standard test setups for repeat testing and also of saving stored result data for later recall and examination on screen.
The following measurement functions support the recall function:
SLMeter, sound level meter
FFT Analysis•
RT60, reverberation time•
1/12 Octave Band Analysis
Noise Curves•
STIPA, speech intelligibility measurement

Data Management
Load Test
Select the memory menu ☐ with the rotary wheel and confirm with enter ⏻.

The memory menu opens.
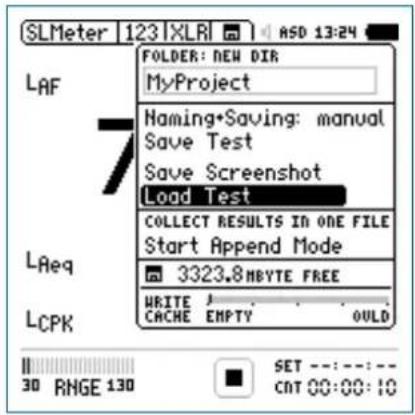
Select File Name
Select • Load Test and confirm with ent

The pop-up window Load Test appears.
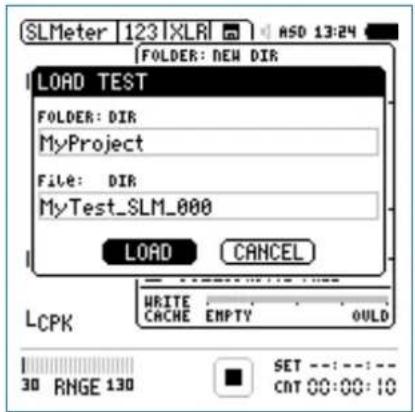
Select the project folder and stored data file name with DIR.
Select • LOAD, confirm with enter.
Data Management

View Measurement Data
The previously stored measurement data is displayed.
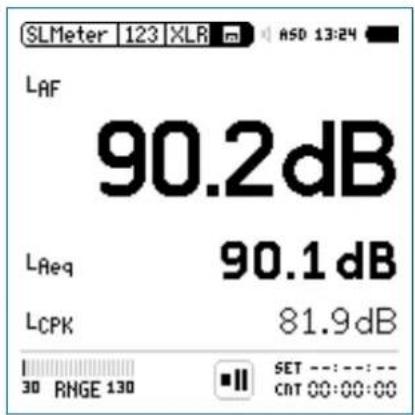
1
Append Measurements
The append mode stores the results of several individual measurements into the same data file, thus simplifying measurement result analysis and data handling on the PC.
The following measurement functions support the append mode:
SLMeter, sound level meter•
STIPA, speech intelligibility measurement
Application example:
The sound level L_Aeq shall be measured at various locations in the same venue hall using a pink noise test signal. The append mode allows to store all individual measurement results into one single data file.

The run indication ① shows the pause symbol. You may continue with the measurements directly, e.g., choose the measurement function, setup parameters and press start ▶■.

Backup the stored measurement data from the XL2 to the PC daily. This prevents any data loss if data has been deleted from the SD Card by mistake.

Data Management
Start the Append Mode
- Select SLMeter and preselect the sound level L_Aeq . Select the memory menu with the rotary wheel and confirm with enter.
The memory menu opens.
- Select Start Append Mode and confirm with enter ⏻.
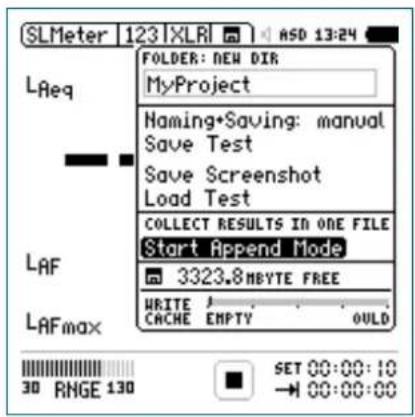
The Start Append Mode window opens.
Select Filename
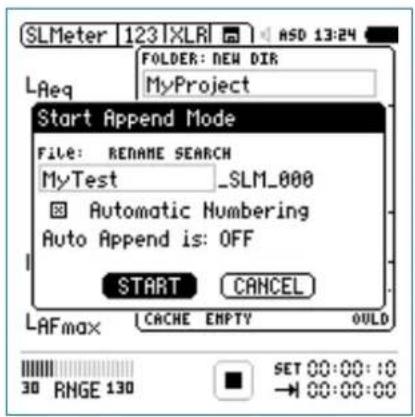
Name the first part of the file name. The maximum length of the first part is 12 characters. The next part “_SLM_001” is defined by the XL2 to avoid overwriting of existing measurements, whereby “SLM” is the appendix for the measurement function and “001” is an automatically-incrementing number.
- Select START and confirm with enter ⏻.
The append mode is available.
Data Management

Take Measurement Results
Measure the sound level • Aeq on the first position.
Select the memory menu and • Append Data.
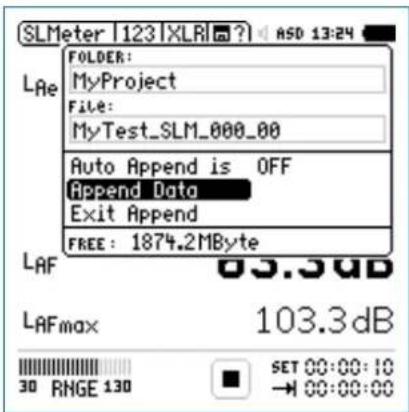
| In append mode, the XL2 does not store:Log files•Wav-files•Repeated report files generated in timer •mode repeat and repeat synchronized. |
Store Measurement Results
The pop-up window Append Data appears.
Select the location ID and measurement ID, thus each measurement result is stored with an individual description for later documentation.
- Select Append with the rotary wheel ⏻ and confirm with enter ⏻.
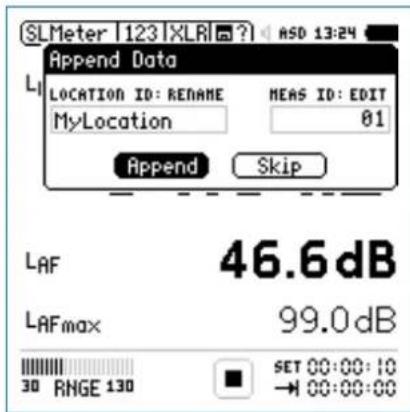
The measurement data is stored on the SD Card.

Data Management
Append Further Measurement Results
Move to the next location in the room, carry out the measurement and follow the described append data procedure.
Exit Append Mode
Open the memory menu
- Select Exit Append after adding the last measurement.
| Auto AppendAlternatively the XL2 can append measurement data to the same report file automatically.Start the Append mode and set • Auto Appes is ON in the memory menu or in the pop-up window Start Append Mode.Skip Append DataIf you select SKIP in the Append Data window, then no measurement data is appended to the report file. |
Append After Power Up
You can continue to add measurement results into the same data file at any time later.
Store the measurements in the append mode and switch the • XL2 off and on again ⏻.
The pop-up window Continue append appears.
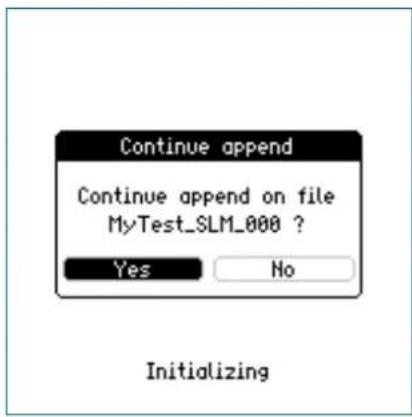
- Select Yes and continue adding measurement results to the same report file in the append mode.
Data Management

Recall Previous Measurements for Append
Any previously stored measurement with the remark for append can be recalled and further test records appended.
Select • Load Test and press enter
Select the project folder and stored data file name.
Select • LOAD confirm with enter.
The pop-up window Load for Append appears.
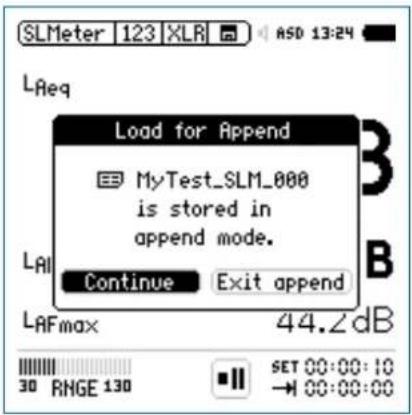
- Select Continue and add further measurements to the same report file in the append mode.

XL2 Projector PRO
13. XL2 Projector PRO Software
The Projector PRO displays the XL2 screen in real-time via USB on the connected Windows or Mac computer. The software toolbar enables control of the XL2 with the mouse and keyboard. The background color turns from green to red synchronized with the XL2 limit button color Ⓜ according to the user-defined limits.
The "XL View" and the "Sound Level Predictor" display extend the XL2 Projector PRO for live sound monitoring applications.
The "XL View" window presents sound levels in large size • on the connected computer screen. Users may select to view one, two or three sound pressure levels. Exceeding levels are presented with a pre-warning amber or alarming red color.
The "Sound Level Predictor" visualizes the level history of the current measurement interval and indicates the headroom for the actual measurement period or the next few minutes. Green bars confirm that the present level is well below limits. Red bars are a call to action to reduce the sound level at the mixing desk. This allows the FOH engineer to optimize dynamic passages of the band for maximum audience satisfaction while still remaining within the legal limits.
Additionally the Projector PRO software offers the ability to retrieve measurement data from the XL2 without interruption to the measurement process. The entire file system of the XL2 is available while the XL2 is measuring.
The "XL View" and the "Sound Level Predictor" require that the Projector PRO Option or the Remote Measurement Option be installed on the XL2.
Projector PRO software is a free download for all registered XL2 customers on the support website https://my.nti-audio.com.
Installation Instructions
Register your XL2 and download the software from the support page at https://my.nti-audio.com.
Unzip the file "XL2 Projector PRO Setup Vxx.zip" on your computer.
Start the software installation and follow the instructions • including driver installation.
Start the XL2 Projector PRO software.
Start the XL2 Analyzer and connect it to the computer.
XL2 Projector PRO


The pop-up window USB Mode appears.
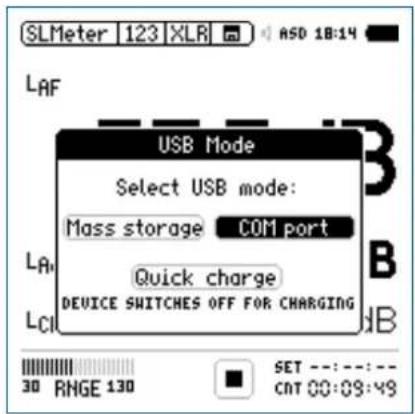
Select • COM port on the XL2.
Microsoft Windows may recognize the new hardware au- tomatically and start the hardware installation assistant. If prompted, select "No connection to Windows Update" and continue with the installation.
Complete the installation.
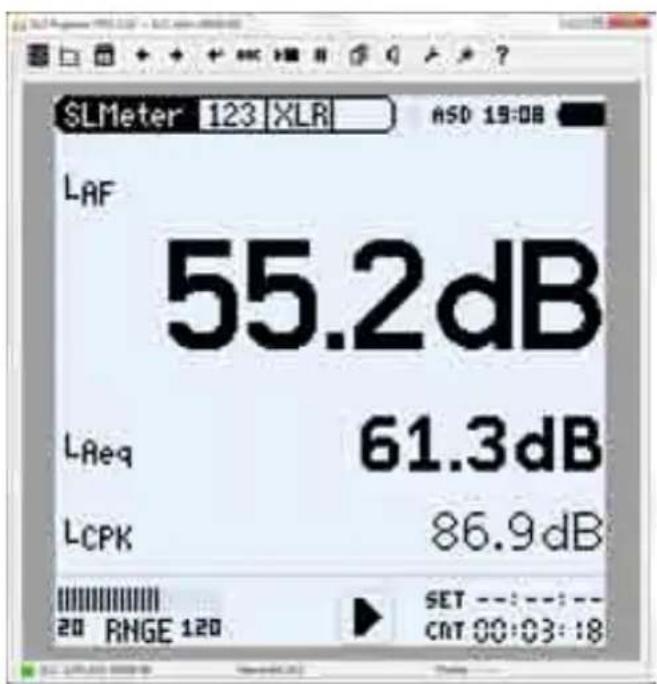
For more details and features see the XL2 Projector PRO user manual at ? in the menu.

XL2 Projector PRO displays the instrument screen in real-time.

XL2 Data Explorer
14. XL2 Data Explorer (optional)
Data Explorer is a PC-based software application with a powerful data processor for easy and fast analysis of sound level measurement data. It is dedicated to acoustic consultants and noise measurement professionals. XL2 Data Explorer provides a convenient way to view, analyze and manage data and quickly create customized reports.
Features of the XL2 Data Explorer software:
Data visualization•
Fast zoom and pan•
Audio playback synchronized to graph•
Markers with on-the-fly calculations•
Automated tonal and impulsive marker generation•
Percentile levels Ln and Rating level Lr calculation•
Customized Reporting•
Download the XL2 Data Explorer software from the XL2 Support Page https://my.nti-audio.com.
XL2 Data Explorer Option
The Data Explorer Option enables the import of logged sound level data into the Data Explorer software, a PC-based software application with a powerful data processor for easy and fast analysis of noise monitoring data.
Data Explorer 365
An annual subscription service for a XL2 Sound Level Meter is offered alternatively to the permanently installed option.
Supported operating systems
Windows XP SP3•
• Windows Vista SP1 or later
- Windows 7, 8, 10
XL2 Data Explorer

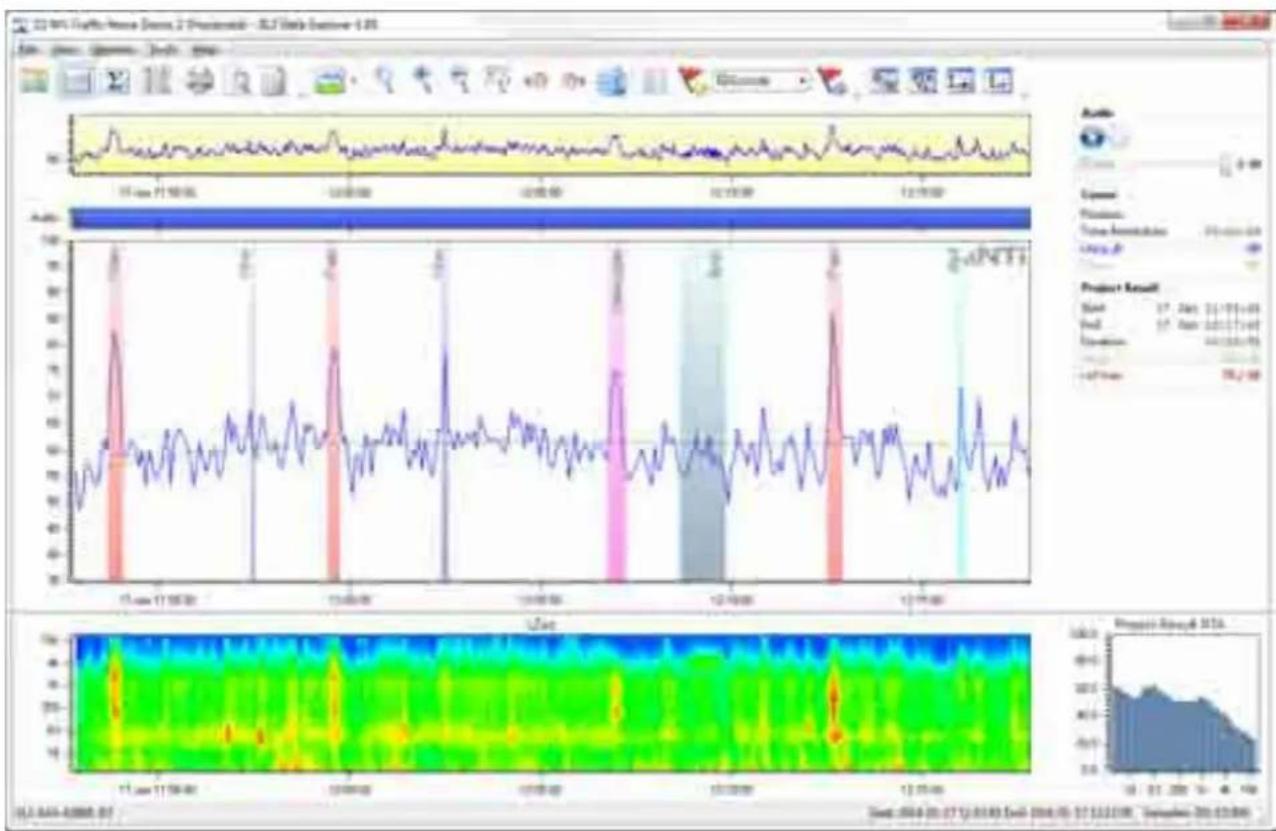
line
| Date | Value | | ---------- | ----- | | 11-Jan-17 | 0 | | 12-Feb-01 | 0 | | 12-Mar-01 | 0 | | 12-May-01 | 0 | | 12-Jun-01 | 0 | | 12-Jul-01 | 0 | | 12-Aug-01 | 0 | | 12-Sep-01 | 0 | | 13-Oct-01 | 0 | | 13-Nov-01 | 0 | | 13-Dec-01 | 0 | | 13-Jan-02 | 0 | | 13-Feb-02 | 0 | | 13-Mar-02 | 0 | | 13-Apr-02 | 0 | | 13-May-02 | 0 | | 13-Jun-02 | 0 | | 13-Jul-02 | 0 | | 13-Aug-02 | 0 | | 13-Sep-02 | 0 | | 13-Oct-02 | 0 | | 13-Nov-02 | 0 | | 13-Dec-02 | 0 | | 13-Jan-03 | 0 | | 13-Feb-03 | 0 | | 13-Mar-03 | 0 | | 13-Apr-03 | 0 | | 13-May-03 | 0 | | 13-Jun-03 | 0 | | 13-Jul-03 | 0 | | 13-Aug-03 | 0 | | 13-Sep-03 | 0 | | 13-Oct-03 | 0 | | 13-Nov-03 | 0 | | 13-Dec-03 | 0 | | 13-Jan-04 | 0 | | 13-Feb-04 | 0 | | 13-Mar-04 | 0 | | 13-Apr-04 | 0 | | 13-May-04 | 0 | | 13-Jun-04 | 0 | | 13-Jul-04 | 0 | | 13-Aug-04 | 0 | | 13-Sep-04 | 0 | | 13-Oct-04 | 0 | | 13-Nov-04 | 0 | | 13-Dec-04 | 0 | | 13-Jan-05 | 0 | | 13-Feb-05 | 0 | | 13-Mar-05 | 0 | | 13-Apr-05 | 0 | | 13-May-05 | 0 | | 13-Jun-05 | 0 | | 13-Jul-05 | 0 | | 13-Aug-05 | 0 | | 13-Sep-05 | 0 | | 13-Oct-05 | 0 | | 13-Nov-05 | 0 | | 13-Dec-05 | 0 | | 13-Jan-06 | 0 | | 13-Feb-06 | 0 | | 13-Mar-06 | 0 | | 13-Apr-06 | 0 | | 13-May-06 | 0 | | 13-Jun-06 | 0 | | 13-Jul-06 | 0 | | 13-Aug-06 | 0 | | 13-Sep-06 | 0 | | 13-Oct-06 | 0 | | 13-Nov-06 | 0 | | 13-Dec-06 | 0 | | 13-Jan-07 | 0 | | 13-Feb-07 | 0 | | 13-Mar-07 | 0 | | 13-Apr-07 | 0 | | 13-May-07 | 0 | | 13-Jun-07 | 0 | | 13-Jul-07 | 0 | | 13-Aug-07 | 0 | | 13-Sep-07 | 0 | | 13-Oct-07 | 0 | | 13-Nov-07 | 0 | | 13-Dec-07 | 0 | | 13-Jan-08 | 0 | | 13-Feb-08 | 0 | | 13-Mar-08 | 0 | | 13-Apr-08 | 0 | | 13-May-08 | 0 | | 13-Jun-08 | 0 | | 13-Jul-08 | 0 | | 13-Aug-08 | 0 | | 13-Sep-08 | 0 | | 13-Oct-08 | 0 | | 13-Nov-08 | 0 | | 13-Dec-08 | 0 | | 13-Jan-09 | 0 | | | |
Building Acoustics
15. Building Acoustics (optional)
The Sound Insulation Reporter software is a PC-based software application that provides all the standard reports for Airborne and Impact sound insulation measurements. Designed for acoustic consultants, this comprehensive tool uses data gathered by the XL2 Sound Level Meter, and quickly returns graphical analysis of all measurement positions.
Additionally the software offers the ability to acquire real-time data; two or more XL2 Sound Level Meters, may be controlled directly by the software. This allows simultaneous wireless measurement in both the sending and receiving room onsite; saving time. To enable this real-time acquisition of data, the Sound Insulation Reporter software requires that the connected XL2s also have an activated Remote Measurement Option installed.
Features:
Airborne Sound Insulation•
Impact Sound Insulation•
Facade Sound Insulation•
Customized Reporting•
Standards ISO 16283, ISO 140, ISO 717, ISO 10140, DIN 4109,
Document E, ASTM E336, ASTM E413, ASTM E1007, ASTM
E989, ASTM E966, ASTM E1332, GB/T 19889, SIA 181
The Sound Insulation Option enables the import of XL2 measurement data into the XL2 Sound Insulation Reporter software.
XL2 Sound Insulation Option
The Sound Insulation Option enables the import of measurement data into the Sound Insulation Reporter software. The Sound Insulation Option is permanently installed in the XL2.
Sound Insulation Reporter 365
An annual subscription service for a XL2 Sound Level Meter is offered alternatively to the permanently installed option.
Supported operating systems
• Windows Vista SP1 or later
- Windows 7, 8.x, 10
Requirements
The measurement of the RT60 reverberation time in 1/3 octave band resolution requires the optional Extended Acoustic Pack installed on the XL2 Sound Level Meter.
Download the software from the XL2 Support Page at https://my.nti-audio.com.
Building Acoustics

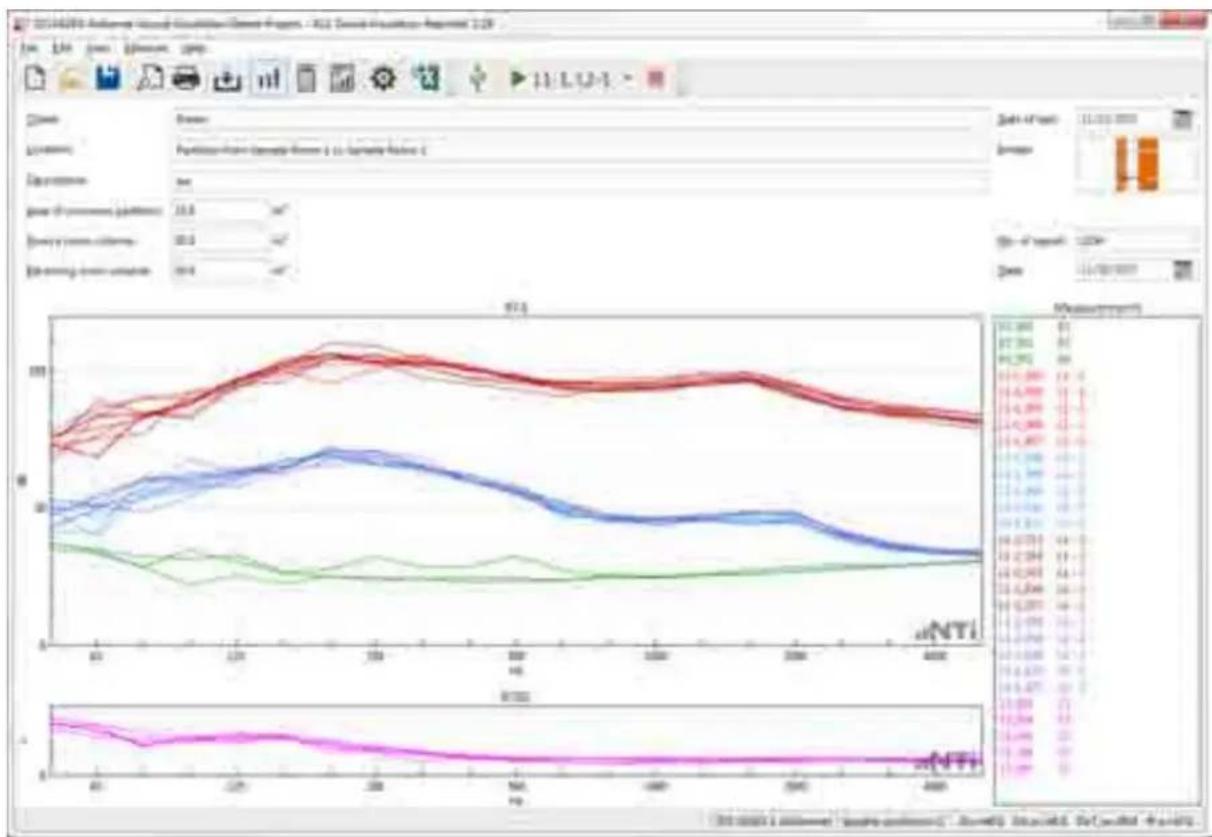
line
| Time | Red Line | Blue Line | Green Line | Pink Line | |------|----------|-----------|------------|-----------| | 0 | 50 | 20 | 15 | 10 | | 125 | 75 | 30 | 20 | 15 | | 250 | 100 | 40 | 25 | 20 | | 375 | 95 | 35 | 22 | 18 | | 500 | 90 | 30 | 20 | 15 | | 625 | 85 | 25 | 18 | 12 | | 750 | 80 | 20 | 15 | 10 | | 875 | 75 | 15 | 12 | 8 | | 1000 | 70 | 10 | 10 | 5 | | 1125 | 65 | 8 | 8 | 3 | | 1250 | 60 | 5 | 5 | 2 | | 1375 | 55 | 3 | 3 | 1 | | 1500 | 50 | 2 | 2 | 1 | | 1625 | 45 | 1 | 1 | 1 | | 1750 | 40 | 1 | 1 | 1 | | 1875 | 35 | 1 | 1 | 1 | | 2000 | 30 | 1 | 1 | 1 | | 2125 | 25 | 1 | 1 | 1 | | 2250 | 20 | 1 | 1 | 1 | | 2375 | 15 | 1 | 1 | 1 | | 2500 | 10 | 1 | 1 | 1 | | 2625 | 8 | 1 | 1 | 1 | | 2750 | 5 | 1 | 1 | 1 | | 2875 | 3 | 1 | 1 | 1 | | 3000 | 2 | 1 | 1 | 1 | | 3125 | 1 | 1 | 1 | 1 | | 3250 | 1 | 1 | 1 | 1 | | Note: The data provided in the code is a sample of the original data from the 'Gains Progn' array. The values for the 'Gains Progn' array are estimated based on the given parameters. There is no label for the data series. The values for the 'Gains Progn' array are estimated based on the given parameters. The data series includes the 'Value' column for each data point. The 'Error' column is not included in the plot area.
Room Acoustics
16. Room Acoustics (optional)
The Room Acoustics Reporter is a PC software for automatically generating reverberation time measurement reports and analyzing the RTA frequency response spectrum. The software supports acousticians and experts in the visualization and detailed evaluation of measurement data recorded with the XL2 Sound Level Meter.
Features:
Reverberation time RT60 according to ISO 3382 or •
DIN 18041
Import of absorption coefficients•
Comparison before / after acoustic measurements
RTA frequency response spectrum according to the •
IEC 60260 standard
Standard-compliant Reporting•
The Room Acoustics Option enables the import of measurement data into the Room Acoustics Reporter software.
XL2 Room Acoustics Option
The Room Acoustics Option enables the import of measurement data into the Room Acoustics Reporter software. The Sound Insulation Option is permanently installed in the XL2.
Room Acoustics Reporter 365
An annual subscription service for a XL2 Sound Level Meter is offered alternatively to the permanently installed option.
Supported operating systems
Windows Vista SP1 or later
Windows 7, 8.x, 10•
Requirements
The measurement of the RT60 reverberation time in 1/3 octave band resolution requires the optional Extended Acoustic Pack installed on the XL2 Sound Level Meter.
Download the software from the XL2 Support Page at https://my.nti-audio.com.
Room Acoustics

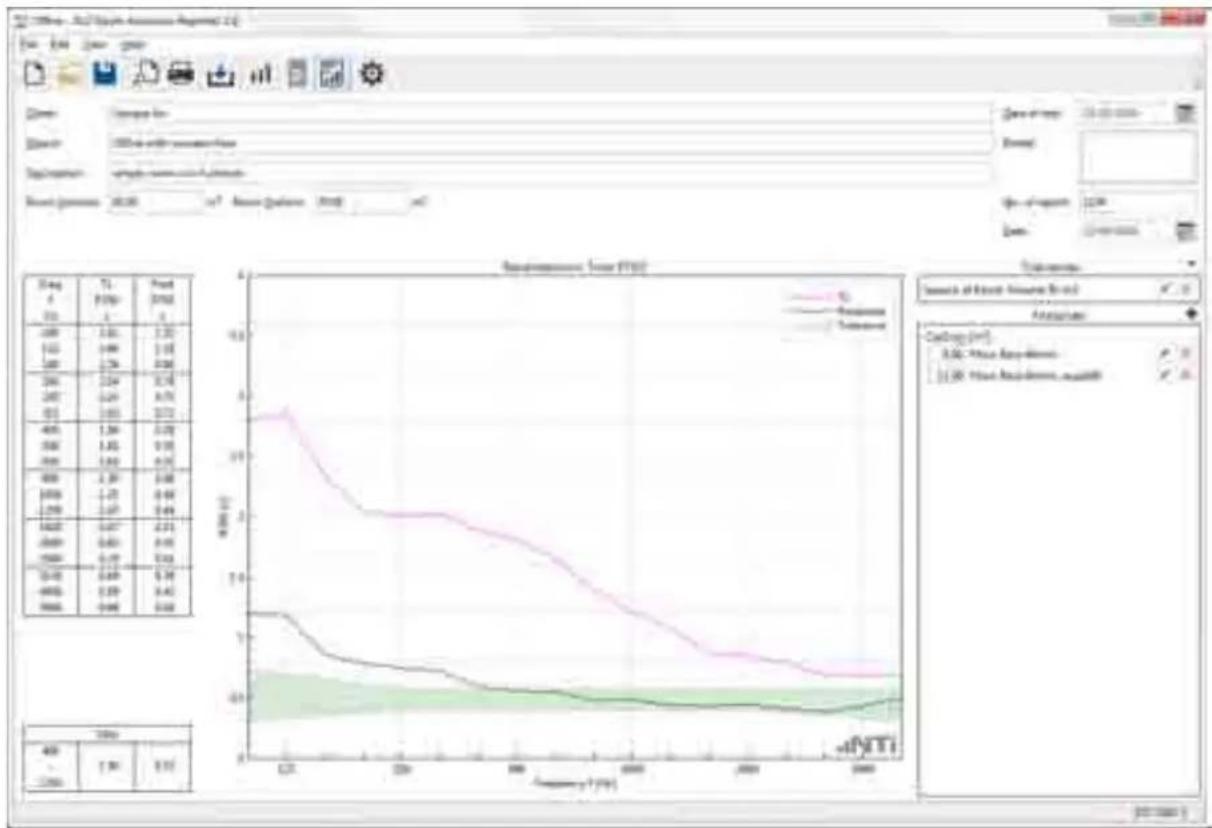
line
| Year | Reimbursement (Year FY10) | |------|---------------------------| | 1 | 3.5 | | 2 | 3.0 | | 3 | 2.5 | | 4 | 2.0 | | 5 | 1.5 | | 6 | 1.0 | | 7 | 0.5 | | 8 | 0.0 | | 9 | -0.5 | | 10 | -1.0 | | 11 | -1.5 | | 12 | -2.0 | | 13 | -2.5 | | 14 | -3.0 | | 15 | -3.5 | | 16 | -4.0 | | 17 | -4.5 | | 18 | -5.0 | | 19 | -5.5 | | 20 | -6.0 | | 21 | -6.5 | | 22 | -7.0 | | 23 | -7.5 | | 24 | -8.0 | | 25 | -8.5 | | 26 | -9.0 | | 27 | -9.5 | | 28 | -10.0 | | 29 | -10.5 | | 30 | -11.0 | | 31 | -11.5 | | 32 | -12.0 | | 33 | -12.5 | | 34 | -13.0 | | 35 | -13.5 | | 36 | -14.0 | | 37 | -14.5 | | 38 | -15.0 | | 39 | -15.5 | | 40 | -16.0 | | 41 | -16.5 | | 42 | -17.0 | | 43 | -17.5 | | 44 | -18.0 | | 45 | -18.5 | | 46 | -19.0 | | 47 | -19.5 | | 48 | -20.0 | | 49 | -20.5 | | 50 | -21.0 | | 51 | -21.5 | | 52 | -22.0 | | 53 | -22.5 | | 54 | -23.0 | | 55 | -23.5 | | 56 | -24.0 | | 57 | -24.5 | | 58 | -25.0 | | 59 | -25.5 | | 60 | -26.0 | | 61 | -26.5 | | 62 | -27.0 | | 63 | -27.5 | | 64 | -28.0 | | 65 | -28.5 | | 66 | -29.0 | | 67 | -29.5 | | 68 | -30.0 | | 69 | -30.5 | | 70 | -31.0 | | 71 | -31.5 | | 72 | -32.0 | | 73 | -32.5 | | 74 | -33.0 | | 75 | -33.5 | | 76 | -34.0 | | 77 | -34.5 | | 78 | -35.0 | | 79 | -35.5 | | 80 | -36.0 | | 81 | -36.5 | | 82 | -37.0 | | 83 | -37.5 | | 84 | -38.0 | | 85 | -38.5 | | 86 | -39.0 | | 87 | -39.5 | | 88 | -40.0 | | 89 | -40.5 | | 90 | -41.0 | | 91 | -41.5 | | 92 | -42.0 | | 93 | -42.5 | | 94 | -43.0 | | 95 | -43.5 | | 96 | -44.0 | | 97 | -44.5 | | 98 | -45.0 | | 99 | -45.5 | | 100 | -46.0 |
Sound Power
17. Sound Power (optional)
Sound Power Reporter is a PC-based software application that provides all the standard reports for sound power measurements in accordance with ISO 3744 and ANSI-ASA S12.54.
Designed for industrial professionals, this comprehensive tool uses data gathered by the XL2 Sound Level Meter, and quickly returns graphical analysis of all measurement positions.
Features of the Sound Power Reporter software:
Visualization of all measurement•
Customized Reporting•
Standards ISO 3741, ISO 3744, ISO 3746, ANSI-ASA S12.51, •
ANSI-ASA S12.54, ANSI-ASA S12.56
Download the software from the XL2 Support Page at https://my.nti-audio.com.
XL2 Sound Power Option
The Sound Power Option enables the import of measurement data into the Sound Power Reporter software. The Sound Power Option is permanently installed in the XL2.
Sound Power Reporter 365
An annual subscription service for a XL2 Sound Level Meter is offered alternatively to the permanently installed option.
Supported operating systems
Windows Vista SP1 or later•
Windows 7, 8.x, 10•
Requirements
The measurement of the RT60 reverberation time in 1/3 octave band resolution requires the optional Extended Acoustic Pack installed on the XL2 Sound Level Meter.
Sound Power

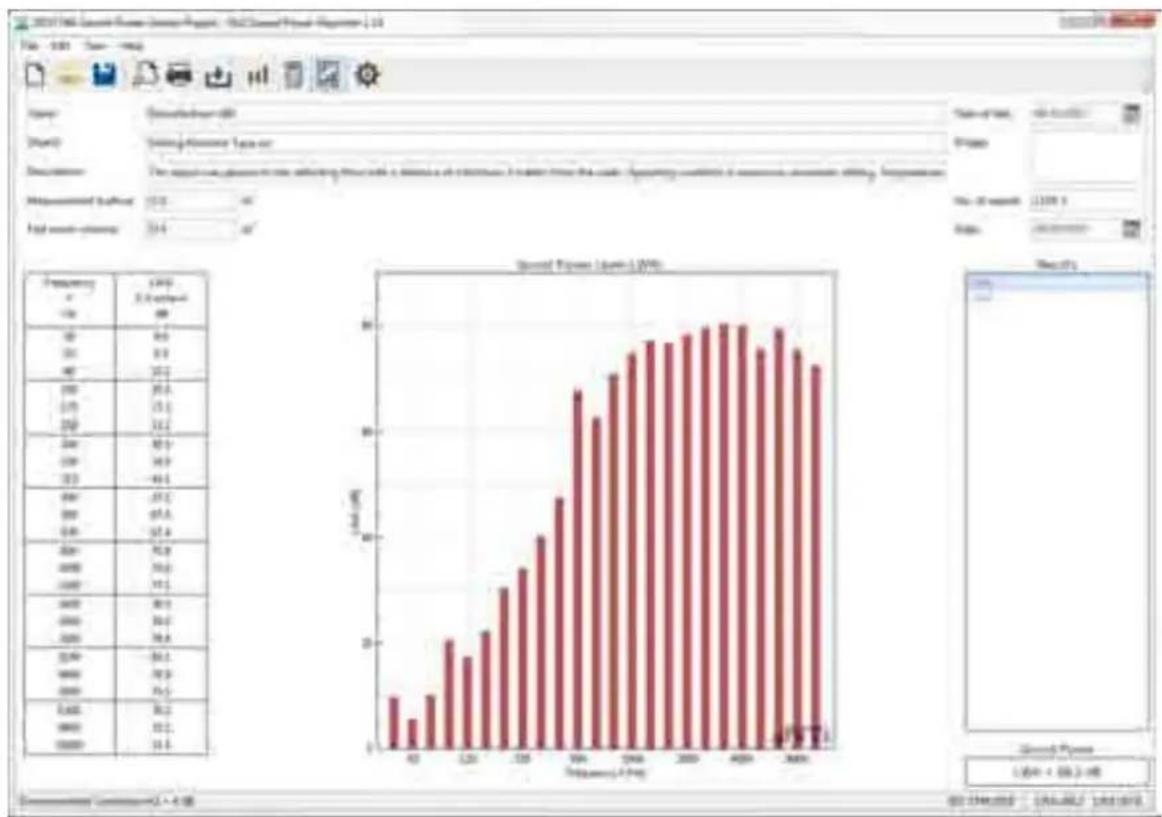
bar
| Frequency | Value | |---|---| | 1 | 0.5 | | 2 | 1.2 | | 3 | 2.1 | | 4 | 3.0 | | 5 | 4.1 | | 6 | 5.2 | | 7 | 6.3 | | 8 | 7.4 | | 9 | 8.5 | | 10 | 9.6 | | 11 | 10.7 | | 12 | 11.8 | | 13 | 12.9 | | 14 | 14.0 | | 15 | 15.1 | | 16 | 16.2 | | 17 | 17.3 | | 18 | 18.4 | | 19 | 19.5 | | 20 | 20.6 | | 21 | 21.7 | | 22 | 22.8 | | 23 | 23.9 | | 24 | 25.0 | | 25 | 26.1 | | 26 | 27.2 | | 27 | 28.3 | | 28 | 29.4 | | 29 | 30.5 | | 30 | 31.6 | | 31 | 32.7 | | 32 | 33.8 | | 33 | 34.9 | | 34 | 36.0 | | 35 | 37.1 | | 36 | 38.2 | | 37 | 39.3 | | 38 | 40.4 | | 39 | 41.5 | | 40 | 42.6 | | 41 | 43.7 | | 42 | 44.8 | | 43 | 45.9 | | 44 | 47.0 | | 45 | 48.1 | | 46 | 49.2 | | 47 | 50.3 | | 48 | 51.4 | | 49 | 52.5 | | 50 | 53.6 | | 51 | 54.7 | | 52 | 55.8 | | 53 | 56.9 | | 54 | 58.0 | | 55 | 59.1 | | 56 | 60.2 | | 57 | 61.3 | | 58 | 62.4 | | 59 | 63.5 | | 60 | 64.6 | | 61 | 65.7 | | 62 | 66.8 | | 63 | 67.9 | | 64 | 69.0 | | 65 | 70.1 | | 66 | 71.2 | | 67 | 72.3 | | 68 | 73.4 | | 69 | 74.5 | | 70 | 75.6 | | 71 | 76.7 | | 72 | 77.8 | | 73 | 78.9 | | 74 | 80.0 | | 75 | 81.1 | | 76 | 82.2 | | 77 | 83.3 | | 78 | 84.4 | | 79 | 85.5 | | 80 | 86.6 | | 81 | 87.7 | | 82 | 88.8 | | 83 | 89.9 | | 84 | 90.0 | | Note: The values in the table represent the percentage of the total value for each category (e.g., 'Number of samples' or 'Number of samples' in this case). The data is presented in a long format with a few rows and columns specified in the code.
NoiseScout
18. Unattended Noise Monitoring
NoiseScout provides a comprehensive but easy-to-use 24/7 noise monitoring solution. Noise levels are recorded on-site by the XL2 Sound Level Meter and are available for remote monitoring and download. NoiseScout is aimed at both short term noise assessments and long term monitoring applications. It offers the freedom to start and stop the remote noise monitoring from your office or mobile device providing total flexibility in meeting your project requirements.
Noise Monitoring in "Managed Mode"
During acquisition, audio recordings of the loudest periods and automated email alerts allow noise issues to be addressed before a non-compliance condition arises. NoiseScout displays the noise levels measured by the XL2 Sound Level Meter live in your web browser. The measurement data recorded out in the field is presented online in charts and dashboards. Multiple noise level meters can be monitored simultaneously within the map view, thus providing localized geographic visualization for all noise levels at a glance. Identified users can access all their projects, control their monitors or create basic view modes, allowing stakeholders to oversee their noise level data.
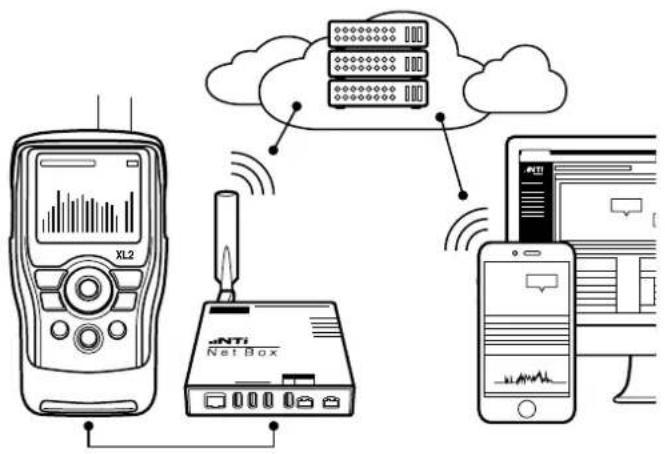
flowchart
graph TD
    A["XL2"] --> B["Net Box"]
    B --> C["Cloud"]
    C --> D["Mobile Device"]
    style A fill:#f9f,stroke:#333
    style B fill:#ccf,stroke:#333
    style C fill:#cfc,stroke:#333
    style D fill:#fcc,stroke:#333
Managed Unattended Noise Monitoring
Noise Monitoring in "Gateway Mode"
Direct access to the XL2 Sound Level Meter is available from around the world. An internet connection allows SFTP (Secure File Transfer Protocol) and remote access to the XL2. All data files can then be retrieved from the remote XL2 Sound Level Meter even during an ongoing measurement. Also, the spectral data and audio files can be directly downloaded from the remote XL2.
The remote access allows full control of the XL2 Sound Level Meter. All remote measurement commands available on the XL2 are supported. For example, the current measurement data may be captured in real time into a computer application, e.g. C#, MS Excel or LabView. You may program a customized measurement application for remote sound level monitoring, audio analysis or automated measurement tasks.
NoiseScout operates also in a local network (intranet) without internet connection.
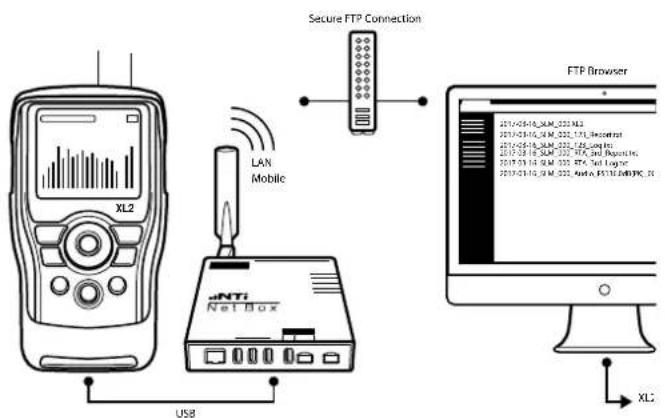
flowchart
graph TD
    A["XL2 Device"] -->|USB| B["Net Box"]
    B --> C["Secure FTP Connection"]
    C --> D["FTP Browser"]
    D --> E["XLC"]
Remote Access to XL2 Sound Level Meter

NoiseScout
How to connect?
The NetBox can be connected to the internet via LAN/Ethernet or Mobile Data (i.e. cellular network as e.g. GSM, UMTS, 3G). The LAN connection from the NetBox to the network is established automatically. Setup is required for the mobile connection.
Insert SIM card (not provided) into the NetBox• Connect the NetBox to the XL2 Sound Level Meter.• Select ●1 and confirm with enter ⏻.
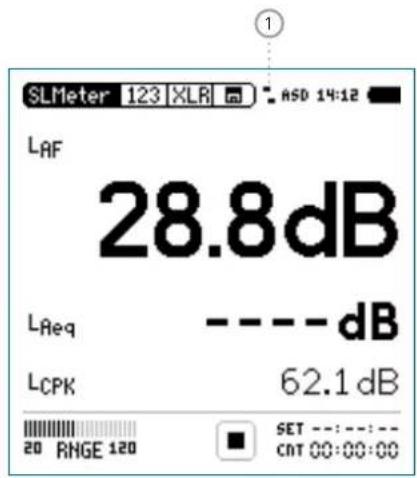
① Network Status Indication
It replaces the speaker symbol in the top menu.
: No network connection
Network connection established
√ Confirmation check mark indicates successful on-going NoiseScout communication
Select • Settings and confirm with enter ↻.
![[Location 1] ASD 14:13 Status No connection IP: ---.---.--- Internet: Waiting.. Server : Waiting.. Close Settings..](/content/2026/05/1054178/images/68cfe2a8ceb985082ec11e95fdf3846946cb71107d3eec3ede540d0fa98ad3c7.jpg)
NoiseScout

- Select Mobile Data and confirm with enter ⏻; the minimum requirement is entering the APN of your provider.
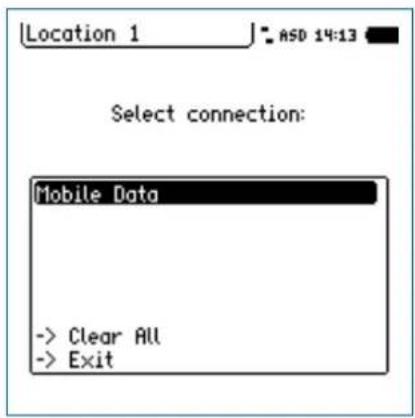
- Set the connection parameters and select Exit.
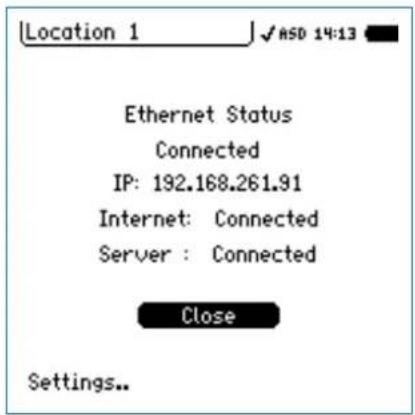
Confirm • Close.
The XL2 is connected to the network.

Time Synchronization
19. Time Synchronization
The XL2 Analyzer may synchronize the start time precisely with the GPS signal. The measurement start matches the GPS time with an accuracy of +/- 0.7 ms (+/- 32 samples @ 48 kHz).
This requires
a txt-file named "gpssync.txt" stored on the SD card• a specially adapted GPS Receiver, NTi Audio # 600 000 357•
Concept
The measurement start follows these concept:
Relative Time•
The GPS Receiver generates a square signal with a frequency of 0.1 Hz. The rising edge is exactly synchronized to full 10 seconds. In other words, the positive edge of the signal indicates the following: 00 - 10 - 20 - 30 - 40 - 50.
The square wave signal is available at the RCA input of the XL2 Analyzer. The instrument architecture offers two channels, so it can simultaneously process the microphone signal on the XLR input and the time signal on the RCA input.
Thanks to the GPS signal, the XL2 may precisely start every 10 seconds.
Absolute time•
The XL2 receives the absolute time from the connected NetBox, which synchronizes to the NTP service. The XL2 time is synced every 60 seconds. The communication between XL2 and NetBox causes an uncertainty in the timing in the two-digit milliseconds range.
The combination of the relative and absolute timing allows the XL2 to start the measurement accurately. The GPS time signal does not have to be permanently present on the XL2 during the measurement, which accommodates the operation in case of unfavorable GPS reception. It is important that the time signal was detected by the XL2 at least once before the start of the measurement, the XL2 then retains this time information with an accuracy of typically 0.5 ms per hour.

After repositioning the GPS receiver, the system takes about an hour to initialize for the first time.
After rebooting the XL2, or after changing the measurement function, the XL2 needs to syn- chronize with GPS time again.
Time Synchronization

XL2 User Interface
The clock delimiter signals the state of GPS time detection.
16.20
GPS time signal is synchronized with GPS (locked).
16:20
GPS receiver connected, but time signal not synced with GPS (unlock).
16:20
GPS time signal not found, receiver is not connected or XL2 not configured for GPS.
When starting a GPS time-synchronous measurement you observe the following characteristics:
1 SET ---:---:--- CnT 00:00:03
After starting the measurement, the start counter in the button will remain at 1 for up to 10 seconds.
Exactly 4 seconds before a full 10 second time jump, the button changes and the measured values and the timer value of the previous measurement are reset.
SET ---:---:--- CMT 00:00:02
The measurement begins exactly at the 10-second jump.
Start without GPS
If the XL2 has not received a valid GPS information until the start time, the internal XL2 time will be used as time. The XL2 time is set by the NetBox.
If the NetBox has connection to the network before the start time, then the time of NetBox is precisely synchronized via NTP. The start is precise to about 10 ms. If the NetBox could not yet be provided with an exact time by NTP at the start, then the NetBox time deviation is approx. 20 ppm since the last synchronization (this corresponds to one error per day of 24 hours * 3600 * 20 / 1e6 = 1.7 sec.
As soon as the XL2 receives a valid time information via GPS, the time deviation is logged in the log file.

Time Synchronization
Minutes of deviation
The deviation of the time currently used for the measurement from the GPS time is recorded by the XL2 in the log file (123_Log.txt).
| Add_To_Time[ms] | GPS Status[] |
| 0.0 2.0 |
Meaning of the column "GPS Status":
0.0 No GPS signal detected at the RCA input
1.0 GPS signal detected but signaled UNLOCKED
2.0 GPS signal LOCKED (OK)
The deviation Add_To_Time can only be determined currently if the GPS status = 2 (locked). Otherwise, the last known error is used for the current log line. The Add_To_Time column indicates “-.-” in case that there was no GPS time recognized since the start of the device.
Example
The PPS signal is recorded with the XL2. For this, the input of the XL2 from XLR to RCA can be set. The positive edge of the recording should always be exactly to multiples of 10 seconds, but in this case at 00:35:00,005:

natural_image
Blank white image with no visible text, symbols, or discernible subject_123_log.txt:
2017-10-05 09:49:58 00:34:58 -5.00 2.0 —/—
2017-10-05 09:49:59 00:34:59 -5.00 2.0 —/—
2017-10-05 09:50:00 00:35:00 -5.00 2.0 —/—
2017-10-05 09:50:01 00:35:01 -5.00 2.0 —/—
2017-10-05 09:50:02 00:35:02 -5.00 2.0 —/—
In the log file, a correction value Add_to_Time of -5ms is recorded for this time position, so the corrected position of the pulse is: 00:35:00,005 + (-5ms) = 00:35:00.
The state of the time synchronization can be seen in detail on the NoiseScout Gateway website.
Time Synchronization

Connection Diagram
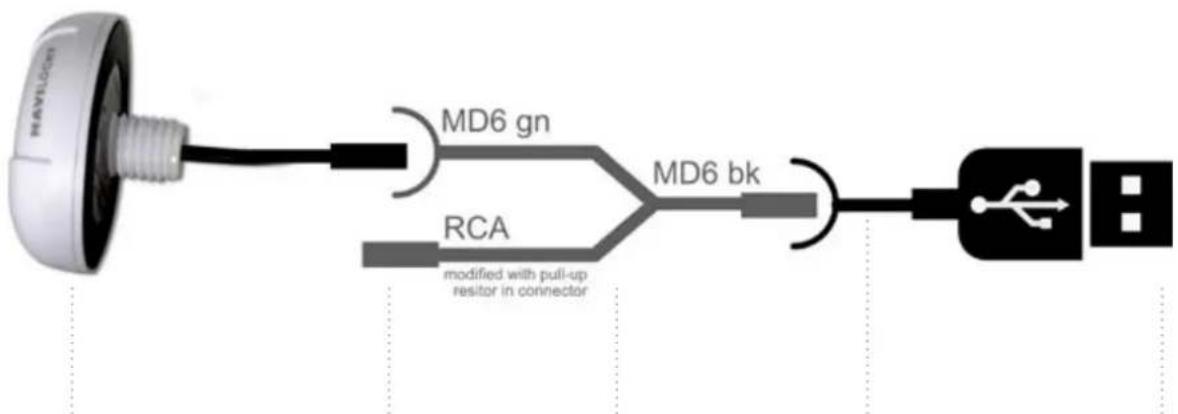
flowchart
graph LR
    A["NAVILOG"] --> B["MD6 gn"]
    B --> C["MD6 bk"]
    C --> D["USB"]
    E["RCA"] --> F["modified with pull-up resistor in connector"]
GPS Receiver Adapter Cable MD6/RCAconnects to XL2-TA Adapter Cable MD6/USB connects to NetBox - USB 1

Remote Measurement
20. Remote Measurement
The Remote Measurement option allows the real-time acquisition of XL2 measurement data directly into a computer application via USB. The option adds a real-time acquisition facility to the Sound Insulation Reporter software.
Alternatively you can write your own unique measurement applications for sound level monitoring or automated measurements, e.g. with MS Excel or LabView. A documented command set for data retrieval via USB is available. The following XL2 measurement functions are supported:
Sound level meter and spectrum analyzer SLMeter/RTA•
High resolution RTA function 1/12 Oct + Tol
The functionality of the Projector PRO option is included.
The commands are send in ASCII format through the virtual COM port to the XL2 Analyzer.
Example Command Set
INIT START
MEAS:INIT
MEAS:SLM:123? LAF
Result returned to PC: 53.8 dB, OK
For more details you may download the dedicated Remote Measurement Reference Manual.
Order information:
Remote Measurement Option
NTi Audio #: 600 000 375
Remote Measurement

Auto Start
The XL2 with serial number ending "E0" or higher may power on automatically upon after a power loss (e.g. mains power disconnected or battery pack empty) the power is available again. Best the instrument is operated by mains power without the internal battery pack installed. This auto start functionality is enabled by copying a txt-file with the file name "AutoOn.txt" onto the SD Card. This allows to remotely control the XL2 as soon as power supply is available at the instrument.

Microphones
21. Microphones
NTi Audio Microphone Overview
| M2230 M2230-WPOutdoorMicrophone | M2211 M2215 | M4261 MA220 | PreAmplifier | ||
 |  | 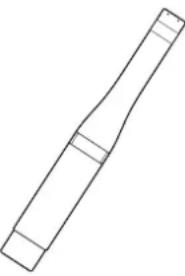 | 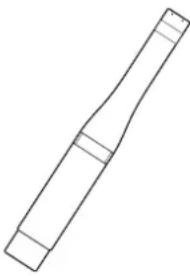 | 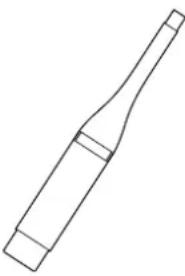 |  |
| Certified Class 1 measurement microphone in accordance with IEC 61672, metal diaphragm | Outdoor measurement microphone, class 1 in accordance with IEC 61672, metal diaphragm | General purpose measurement microphone class 1 frequency response, metal diaphragm | Measurement microphone for high sound levels (up to 153 dB), class 1 frequency response, metal diaphragm | Cost-effective class 2 measurement microphone for general sound level testing and service of audio-acoustic installations | Microphone preamplifier compatible with 1/2" pre-polarized capsules |
Microphones

| M2230 M2230-WPOutdoorMicrophone | M2211 M2215 M4261 MA220 | PreAmplifier | |||
| consists of MA220 PreAmpli- fier and MC230 or MC230A capsule | consists of M2230 Microphone and WP30 Weather Protection | consists of MA220 PreAmplifier and M2211 capsule | consists of MA220 PreAmplifier and M2215 capsule | with permanently- installed capsule | - |
The plug-on measurement microphones combined with the XL2 Analyzer create a powerful sound level meter and a professional acoustic analyzer. The microphones are 48 VDC phantom-powered and include an electronic data sheet.
Integrated Preamplifier
The microphone body contains a preamplifier that requires 48 VDC phantom power supply for operation. The microphones combine high dynamic range and wide frequency range with low noise. They can also be connected to the XL2 Audio and Acoustic Analyzer using an ASD Cable for measurements at remote locations or for reduction of acoustic reflections.
Electronic Data Sheet
The microphones include an electronic data sheet. The Automated Sensor Detection (ASD) of the XL2 Analyzer reads this data, i.e. the microphone model and calibration data. This promotes faster setup and ensures accurate measurements.
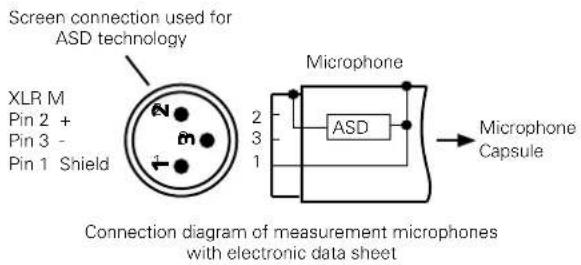

Microphones
Microphone plugs directly into the XL2
The XL2 automatically reads the electronic data sheet of the connected microphone as follows:
Connect the measurement microphone to the XL2. Switch on the XL2.

The XL2 reads the electronic data sheet of the connected microphone during a brief initialization process prior to the first measurement.
Microphone Connection via the ASD Cable
The NTi Audio measurement microphones can be connected to the XL2 Analyzer using an ASD Cable for measurements at remote locations or for reducing acoustic reflections. The electronic data sheet is transmitted via the XLR connector's housing. Do not touch this during the brief initialization period to ensure the complete data sheet is recognized by the XL2. The automated sensor detection does not disturb any measurements. You may join 5 or 10 meter ASD Cables together in series. The ASD technology supports accurate data communication up to a combined cable length of 20 meters (= 65 feet).
Microphone Connection via a professional Audio Cable
For distances longer than 20 meter (= 65 feet) use a high-quality, low-capacitance standard professional audio cable. The microphone sensitivity has to be entered manually into the XL2 Analyzer.
Alternatively connect the microphone first directly to the Analyzer. The XL2 reads the sensitivity and remembers this value. Afterwards connect the audio cable.

Use the microphone for the intended • purpose only.
Protect the microphone from contamination • by always using the supplied windscreen.
Never use the microphone in a damp or wet environment.
Do not jar or drop the microphone.
Do not remove the microphone protective grid.
- Do not touch the microphone membrane.
- Remove the black dust cap of the 1/2" measurement microphones prior to use.
Microphones

Outdoor Microphone M2230-WP
The M2230-WP is a weather-protected microphone solution for the XL2 Sound Level Meter allowing acquisition of environmental noise data in outdoor applications. The corrosion-free polymer housing, wind screen, water-repellent membrane and bird spike provide excellent protection from rain, wind, dust and perching birds. The frequency response of the M2230-WP fulfills the class 1 requirements of IEC 61672 and ANSI S1.4 for vertical sound incidence. Frequency compensation is employed in the associated XL2 Sound Level Meter for compliance with horizontal sound incidence. The M2230-WP consists of an M2230 measurement microphone enclosed in a WP30 weather protection kit.

Do not use the M2230-WP in a horizontal position. Raindrops may reach and damage the M2230 measurement microphone.
The outdoor windscreen is recommended to be replaced annually. The "WP30 Windscreen Replacement" includes two spare windscreens, NTi Audio # 600 040 061.
The water-repellent membrane in the top section is mounted with two O-Rings. Inspect these O-Rings and the membrane annually for proper seating and good condition. Do not touch the water-repellent membrane.

Always activate the frequency correction • filter in the XL2 when measuring a horizontal sound incidence (sound source from the side) with the M2230-WP. The filter ensures that the measurements accuracy meets the class 1 requirements of IEC 61672 and ANSI S1.4.
Deactivate the filter only if you are measuring a vertical sound incidence (sound source from above e.g. airplane noise).
Alternatively the Measurement Microphone M2211 or M2215 can be fitted into the Weather Protection WP30. These microphones have to be pushed further into the upper body by 3 mm. The top part of the capsule has to be 13 mm above the upper body housing of the WP30. This is required because the M2211 and M2215 capsule is 3 mm shorter than the default M2230 microphone capsule.

Further Information
22. Further Information
My NTi Audio
Register your instruments at My NTi Audio and benefit from the following possibilities:
Free updates for your instruments•
Activation of optional product functions •
Premium access to downloads•
Receive application and product news •
Faster worldwide support •
Tracing support in case of loss or theft•
Calibration support
How to Register
Open the web page "https://my.nti-audio.com".
You are prompted to login or create your My NTi Audio account.
The web page "My NTi Audio Products" opens.
Select the product type and enter the serial number.
- Confirm with "Register".
- Now your product is listed in the table "My Products".
Congratulations, your NTi Audio product is registered.
Further Information

Tips and Troubleshooting
Overview
Resetting to Factory Default
XL2 Starts Up with Limited Functions
Can I use another SD Card?
Formatting the SD Card•
SD Card Errors•
Error messages on display•
Stored Data or Wav-files not available on SD Card
Resetting to Factory Default
If the XL2 Audio and Acoustic Analyzer reacts unexpectedly, a reset to the factory settings might solve the problem.
Switch off the XL2
Hold down escape •esc and simultaneously operate On/Off

The XL2 starts up and the reset confirmation is displayed.
XL2 Starts Up with Limited Functions
The XL2 has been operated the last time in one of the simplified application profiles and the system settings have been changed as follows: Select Profile from Yes to No.
- Follow the above resetting to factory default.

The XL2 will start up with full functionality.
Can I use another SD Card?
Yes, you can use any alternative SD Card, such as offered in the chapter. Further Information: Accessories.
Switch off the XL2
- Insert the SD Card into the XL2 Analyzer.
- Switch on the XL2 ⏻.

The XL2 writes the data structure automatically to the inserted SD Card.
Formatting the SD Card
In case you need to format the SD Card, then we recommend doing so utilizing the software SDFormatter. This software ensures the best performance of your SD Card. SDFormatter is a free download at www.sdcard.org/downloads.

Further Information
SD Card Errors
The XL2 Audio and Acoustic Analyzer writes measurement data automatically onto the SD Card during ongoing measurements, thus a functioning SD Card has to be inserted at all times.
Error Messages Actions to do
Missing SD-Card Insert the SD Card.
SD-Card is not FAT formatted Format the SD Card on the PC. Follow the instructions at Formatting the SC Card in this chapter.
SD-Card is full The memory of the SD Card is full. Download all data to the PC and empty the SD Card.
Other Error Messages on Display
In case any other error message is shown on the XL2 display, follow "Resetting to Factory Default" in this chapter. The XL2 should then be available for operation. If such errors occur frequently, then kindly report the full error message back to NTi Audio for resolution. Thank you.
Stored Data or Wav-files not available on SD Card
The file system might be corrupted.
On the PC, right-click on the "NTi Audio XL2" drive, select •
"Properties" and click "Check Now" as shown below.
Thereafter all stored data should be available again.
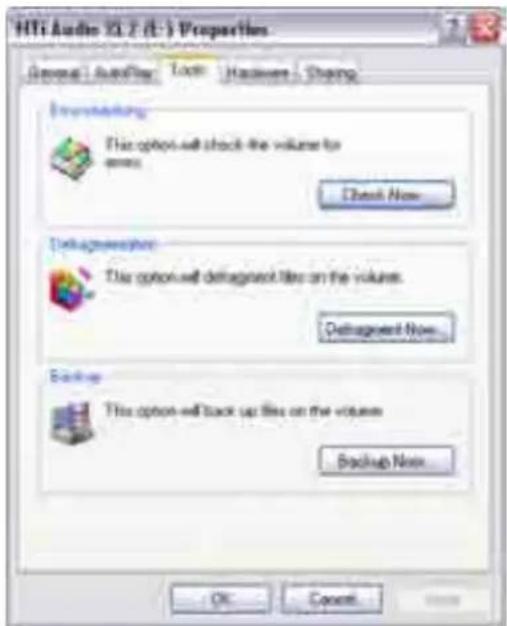
Further Information

Firmware Update
You will find information about the installed firmware version in the systems settings of the instrument. The firmware revision history is listed on the XL2 Support Page https://my.nti-audio.com.
Updating the firmware on the XL2 is executed by placing the XL2Vxxx.xx file in the root directory of the XL2. When started, the XL2 automatically completes the firmware update.
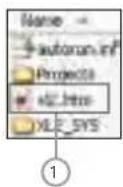

XL2.htm
This file opens the XL2 instrument status page, for online Firmware updates•
Activation of options•
Firmware update with XL2 in hand, PC online:
Start the XL2 and connect it to the PC.
The XL2 displays the pop-up window USB Mode.
Select Mass storage. The PC thus recognizes the XL2 as a • mass storage device.
Double-click the file XL2.htm ●1. The web screen "XL2 Instrument Status" opens.
- Select "Look for FW Updates." The web screen "XL2 Support Page" opens.
- Compare the firmware version to the latest version available.
- If an update is required, download and save the firmware file XL2Vxxx.xx into the XL2 root directory (the root directory shows the folders "Projects", XL2_SYS", the file "xl2.htm" and others).
- Remove the USB cable and power up the XL2
- Watch the display and wait until the update is finished.
- All settings are back to factory default. Adjust the display and reporting settings according your requirements.
No PC available
If you have no web access at all, please contact the local NTi Audio partner.

Further Information
Options
The System menu shows the installed options on the XL2. The following options extend the measurement functions of the XL2:
Extended Acoustic Pack NTi Audio #: 600 000 339
The Extended Acoustic Pack offers the following additional features for sound level- and acoustic measurements.
SLMeter/RTA function•
- Recording of linear wav-files (24 bit, 48 kHz)
- Percentiles for wide band and spectrum with flexible setting from 0.1% to 99.9%
- Sound Exposure Level LAE
- 100 ms logging
- RTA logging of Lmin and Lmax
- Event-triggered audio and data recording
- Time weighting: Impulse (Lxl, Lxleq with x= A, C, Z)
- True peak level in 1/1 and 1/3 octave resolution
- Clock-impulse maximum level (TaktMax) and values as specified in DIN 45645-1
- Impulsiveness detection in accordance with BS4142:2014 and NordTest ACOU 112
FFT function•
- High-resolution Zoom-FFT with selectable frequency ranges and resolution up to 0.4 Hz in the range of 5 Hz to 20 kHz
- Recording of linear wav-files (24 bit, 48 kHz) RT60 function•
- Reverberation time RT60 in 1/3 octave resolution 1/12 octave Spectral Analyzer•
- Recording of linear wav-files (24 bit, 48 kHz)
Projector PRO Option
NTi Audio #: 600 000 439
The Projector PRO option enables the following two additional functions to the Projector PRO software:
"XL View" for large screen dB level display
"Sound Level Predictor" that indicates the headroom for the next few minutes during live sound mixing
Further Information

Speech Intelligibility STIPA
NTi Audio #: 600 000 338
The XL2 Analyzer measures the speech intelligibility according to the latest revision of standard IEC 60268-16:2011 (edition 4) and older editions. It includes ambient noise correction and automated averaging of measurements. The XL2 displays the measurement results as STI or as CIS results, accompanied by the individual levels and modulation indices of the seven octave bands.
The measurement results are acquired from the dedicated STIPA test signal source:
NTi Audio TalkBox, acoustic signal generator required for audio systems with voice microphones, thus measuring the complete signal chain Minirator MR-PRO, test signal generator required for audio systems with line inputs STIPA Test CD (included)
Remote Measurement Option
NTi Audio #: 600 000 375
The Remote Measurement option allows the real-time acquisition of XL2 measurement data directly into a computer application via USB. The option adds a real-time acquisition facility to the Sound Insulation Reporter software.
Alternatively you can write your own unique measurement applications for sound level monitoring or automated measurements, e.g. with MS Excel or LabView. A documented command set for data retrieval via USB is available. The following XL2 measurement functions are supported:
• Vibration Meter VibMeter
- FFT Analyzer + Tol
• RT60 reverberation time
• Audio analyzer RMS/THD+N
• High resolution RTA function 1/12 Oct + Tol
• Sound level meter and spectrum analyzer SLMeter/RTA
The Remote Measurement Option includes the functionality available in the Projector PRO option.

Further Information
Spectral Limits Option
NTi Audio #: 600 000 376
The Spectral Limits Option extends the XL2 function range in both, the sound and vibration mode. It adds noise curves, trace capturing, relative curve display and comprehensive tolerance handling for the FFT Analysis and high resolution spectral analysis up to 1/12th octave. The vibration mode is enabled upon installing the vibration option.
FFT and 1/12 octave Analyzer•
- Capturing of multiple readings into the internal memory
- Comparing measurement results against captures with relative or absolute curve display
- Comprehensive tolerance handling with tolerance masks based on captures for passed/failed measurements
- High resolution spectral analyzer 1/12 Oct + Tol
- Selectable 1/1, 1/3, 1/6 and 1/12 octave resolution
- Frequency band listening at rear speaker
- Sound Mode: 11.5 Hz to 21.8 kHz
- Vibration mode: 0.73 Hz to 1.36 kHz
1/12 octave Spectral Analyzer•
FFT Analyzer•
High-resolution Zoom-FFT with selectable frequency ranges and resolution up to 0.4 Hz in the range of
- Sound mode: 5 Hz to 20 kHz
- Vibration mode: 1 Hz to 20 kHz
Sound Level Meter•
True peak level in 1/1 and 1/3 octave resolution (disabled with type approved firmware)
Noise Curves•
In accordance with ANSI S12.2-2008, -1995 and ISO 1996
Further Information

Type Approval Option
NTi Audio #: 600 000 377
The Type Approval Option upgrades the instrument to the XL2-TA, the sound level meter dedicated to certified measurements. The XL2-TA with the M2230 microphone forms a type approved sound level meter offering class 1 performance in accordance with IEC61672, IEC61260 and ANSI S1.4.
The Type Approval Option includes
XL2-TA Firmware V4.21 (approved Firmware)
Sticker XL2-TA•
XL2-TA Manual (available online at www.nti-audio.com/XL2)
How do I get my XL2-TA ready for accreditation?
Install the Type Approval Option on the XL2 and apply the XL2-TA sticker on top of the XL2 label on the display.
- Download the dedicated firmware for accreditation to your XL2 from the XL2 Support Page at https://my.nti-audio.com.
- After the firmware installation, the XL2-TA starts with a pop-up window "XL2 Type Approved SLM/RTA". The sound level meter function SLM/RTA may be accredited now.
The type approved firmware deactivates the X-Curve in the SLM function and the unit SPL in the RMS/THD+N function.
XL2 Vibration Option
NTi Audio #: 600 000 436
The Vibration Option turns the XL2 Analyzer into a professional vibration meter with broadband measurements and spectral analysis in 1/3 or octave resolution. The XL2 Vibration Meter determines vibration acceleration, velocity and deflection with standard-compliant weighting filters in the frequency range from 0.8 Hz to 2.5 kHz. Detailed recording of measurement data and audio files allow for comprehensive evaluation and reporting. In addition, the XL2 Vibration Meter comes standard with an FFT analysis and an oscilloscope function. Selectable FFT frequency ranges from 1 Hz to 1.69 kHz allow a detailed examination of the measured vibrations.
The Spectral Limits Option adds functions to the Vibration Meter including a zoom FFT up to 20 kHz and a 1/12 octave band analysis from 0.73 Hz to 1.36 kHz. Also, it adds the ability to record reference spectra and set tolerances for pass / fail quality control measurements. The Remote Measurement Option allows the real-time acquisition of measurement data directly into a computer application via the USB interface. A documented command set is available.
The Vibration Option is supported by the XL2 with firmware V4.11 or higher.

Further Information
Cinema Meter Option
NTi Audio #: 600 000 379
The Cinema Meter Option forms the dedicated solution for efficient calibration and repetitive verification of cinema loudspeaker systems according to the SMPTE ST 202:2010, SMPTE RP 200:2012 and ISO 2969:2015 standards. An interactive assistant guides the user through dedicated measurement procedures.
![[Cinema Meter STEP 00] ASD 13:31 Select a task to start! 1. Create new cinema 2. Calibrate cinema 3. Verify cinema 4. Lock into Verify Mode 5. View verification results 6. Exit](/content/2026/05/1054178/images/3ae17067bea5b45f5d4400717c671d1452bbe699eb77a81a9285891777bd55bb.jpg)
Create new cinema•
Generates measurement templates according the cinema size with dedicated X-curve selection.
Calibrate cinema•
Calibration menu for reference data recording of each channel as well as headroom tests and averaging measurement results of different microphone positions
Verify Cinema•
Verification menu for periodical cinema measurements and comparison against the reference data
- Lock into Verify Mode
Locks the XL2 Analyzer in the Verify Cinema mode. After powering off the instruments starts up directly in the Verify Mode again. The user may unlock the instrument anytime.
• View verification results
Displays measurement deviations of periodical measurement against reference data.
- Exit
Returns back to other XL2 measurement functions.
The Cinema Meter Option includes the Spectral Limits Option. In case you have the Spectral Limits Options already installed, then just go for the Cinema Assistant Option, NTi Audio #: 600 000 378, which will provide you the Cinema Meter functionality in cooperation with the previous installed Spectral Limits Option.
Further Information

XL2 Data Explorer Option
NTi Audio #: 600 000 430
The Data Explorer Option enables the import of logged sound level data into the XL2 Data Explorer software, a PC-based software application with a powerful data processor for easy and fast analysis of noise monitoring data.
Visualize, analyze and control millions of data points with this tool that is dedicated to acoustic consultants and noise measurement professionals. It provides a convenient way to view and manage your data and quickly create customized reports.
Features of the XL2 Data Explorer software:
Data visualization•
Fast zoom and pan•
Audio playback synchronized to graph•
Markers with on-the-fly calculations•
Automated tonal and impulsive marker generation•
Percentile levels Ln and Rating level Lr calculation
Customized Reporting
Data Explorer 365
NTi Audio #: 600 000 431
Annual subscription service for one XL2 Sound Level Meter.
XL2 Sound Insulation Option
NTi Audio #: 600 000 432
The Sound Insulation Option enables the import of measurement data into the Sound Insulation Reporter software.
Sound Insulation Reporter is a PC-based software application that provides all the standard reports for Airborne, Impact and Facade sound insulation measurements. Designed for acoustic consultants, this comprehensive tool uses data gathered by the XL2 Sound Level Meter, and quickly returns graphical analysis of all measurement positions.
Features of the Sound Insulation Reporter software:
Airborne, Impact and Facade Sound Insulation
Visualization of all measurement data•
Customized Reporting•
- Standards ISO 16283, ISO 140, ISO 717, ISO 10140, DIN 4109, Document E, ASTM E336, ASTM E413, ASTM E1007, ASTM E989, ASTM E966, ASTM E1332, GB/T 19889, SIA 181
Sound Insulation Reporter 365
NTi Audio #: 600 000 433
Annual subscription service for one XL2 Sound Level Meter.

Further Information
XL2 Room Acoustics Option
NTi Audio #: 600 000 440
The Room Acoustics Option enables the import of measurement data into the Room Acoustics Reporter software.
The Room Acoustics Reporter is a PC software for automatically generating reverberation time measurement reports and analyzing the RTA frequency response spectrum. The software supports acousticians and experts in the visualization and detailed evaluation of measurement data recorded with the XL2 Sound Level Meter.
Features:
Reverberation time RT60 according to ISO 3382 or • DIN 18041
Import of absorption coefficients•
Comparison before / after acoustic measurements • RTA frequency response spectrum according to the • IEC 60260 standard
Standard-compliant Reporting
Room Acoustics Reporter 365
NTi Audio #: 600 000 441
Annual subscription service for one XL2 Sound Level Meter.
XL2 Sound Power Option
NTi Audio #: 600 000 434
The Sound Power Option enables the import of measurement data into the Sound Power Reporter software.
Sound Power Reporter is a PC-based software application that provides all the standard reports for sound power measurements. Designed for industrial professionals, this comprehensive tool uses data gathered by the XL2 Sound Level Meter, and quickly returns graphical analysis of all measurement positions.
Features of the Sound Power Reporter software:
Visualization of all measurement•
Customized Reporting
Standards ISO 3741, ISO 3744, ISO 3746, ANSI-ASA S12.51, •
S12.54, S12.56
Sound Power Reporter 365
NTi Audio #: 600 000 435
Annual subscription service for one XL2 Sound Level Meter.
Further Information

Installation of Options
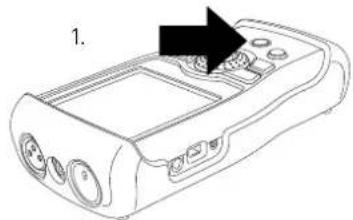
natural_image
Line drawing of a handheld electronic device with ports and a control panel (no text or symbols)Power On XL2
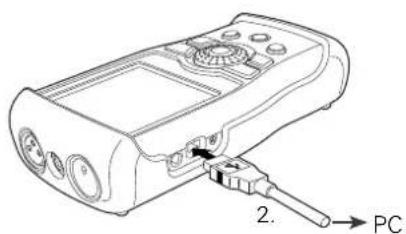
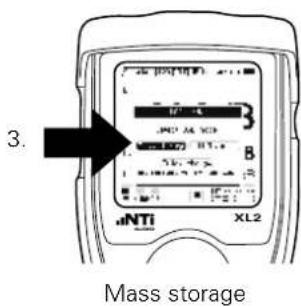
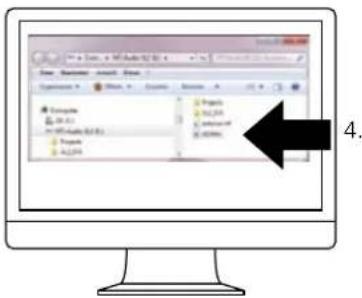
Open XL2-TA.htm
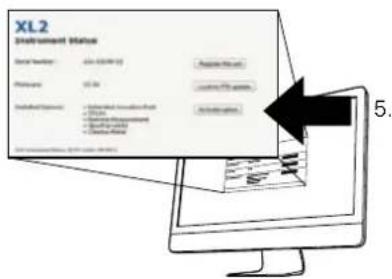
Activate option
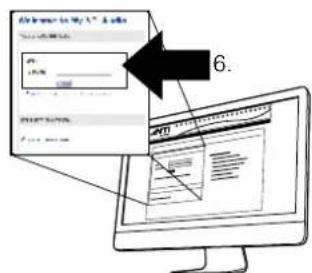
Login
(https://my.nti-audio.com)

Further Information
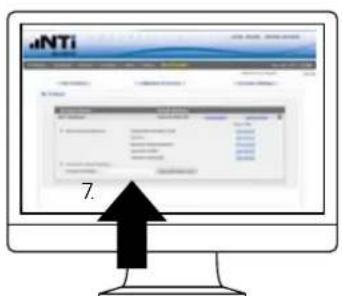
Insert License number
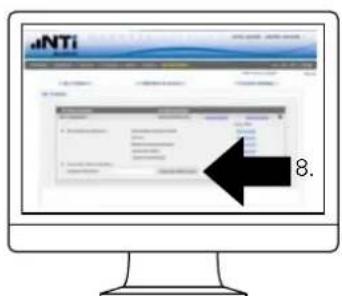
Get Activation Key
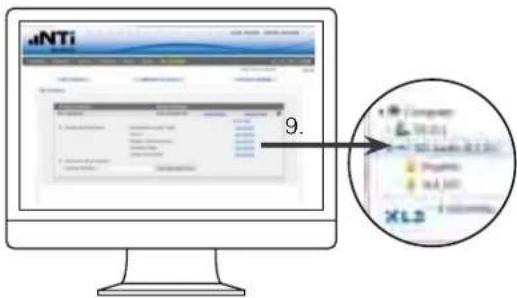
Download activation file and copy to XL2 (xx_0xxxx.txt)
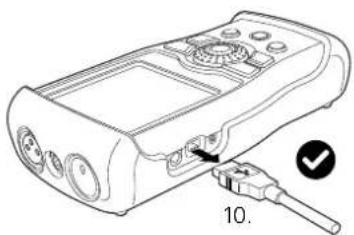
Further Information

Accessories
 | Manufacturer Calibration CertificateThe calibration certificate lists the individual product data with serial number. The calibration and adjustment procedures follow the documentation and traceability requirements of the EN ISO / IEC 17025 standard. Annual re-calibration of the instrument is recommended ensuring accurate measurements.NTi Audio # 600 000 018 |
 | Ever-ready PouchThe Ever-ready Pouch protects the XL2 during transport and operation. With its convenient belt-clip, the XL2 can be kept close-by for those tasks requiring both hands. The Ever-ready Pouch allows operation of the XL2 while fitted in the pouch.NTi Audio #: 600 000 335 |
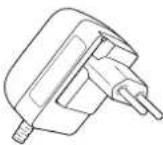 | Mains Power AdapterMains Power Adapter the XL2 Audio and Acoustic Analyzer with removable plug types. The Mains Power Adapter suits the typical power sockets in Australia, China, Europe, Japan, US and UK.NTi Audio #: 600 000 333 |
 | Spare Li-Po BatteryRechargeable spare battery for portable measurements at any time.NTi Audio #: 600 000 337 |
 | ICP Adapter ASDThe ICP Adapter connects to the XL2 and generates ICP power supply for accelerometers and other custom sensors. The adapter offers an electronic data sheet, which stores the sensitivity and individual serial number of the connected sensor.NTi Audio #: 600 010 223ICP is a registered trademark of PCB Piezotronics. |

Further Information
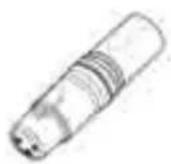 | XLR Adapter ASDXLR male/female Adapter with electronic data sheet for automated sensor detection (ASD) of other sensors.NTi Audio #: 600 000 383 |
 | Exel System CaseThis compact system case provides the professional transport protection for work in the field. It offers space for the handheld instruments, cables and connectors.NTi Audio #: 600 000 334 |
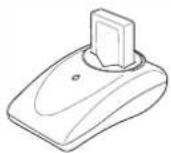 | Battery ChargerThe Battery Charger efficiently recharges the spare battery whilst you are using your XL2 Audio and Acoustic Analyzer. One spare Li-Po battery is included with the battery charger.NTi Audio #: 600 000 332 |
 | XL2 Mounting AdapterThis mechanical adapter piece mounts the XL2 on a microphone stand. Adapters for 3/8" or 5/8" stands are included.NTi Audio #: 600 000 372 |
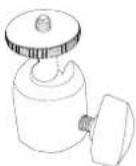 | Ball Head MountThis flexible universal joint mounts the XL2 on a 1/4" or 3/8" stand. It provides the facility to mount the XL2 at any angle.NTi Audio #: 600 000 387A 5/8" stand requires additionally the Mounting Adapter, # 600 000 372. |
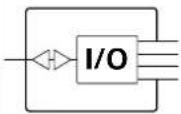 | Digital I/O Adapter PCBThe Digital I/O Adapter serves to control external peripheral devices, such as indicating sound levels that exceed limits on a big external red-orange-green lamp. It connects to the digital I/O interface.NTi Audio #: 600 000 380 |
Further Information


XL2 Input Keypad
The XL2 Input Keypad offers four marker keys to trigger an event recording or categorize any noise during measurements. Requires the optional Extended Acoustic Pack.
NTi Audio #: 600 000 384

ASD Cable
The ASD Cable allows for extended connections of the NTi Audio measurement microphones. It supports the transfer of the electronic data sheet from the microphone to the XL2 Analyzer.
NTi Audio #:
5 meter (16 foot): 600 000 336•
10 meter (32 foot): 600 000 364•
20 meter (64 foot): 600 000 365•
The ASD technology for the electronic data sheet transfer is applicable for a cable length of up to 20 meters (64 feet).
STARQUAD cable
with low capacitive load
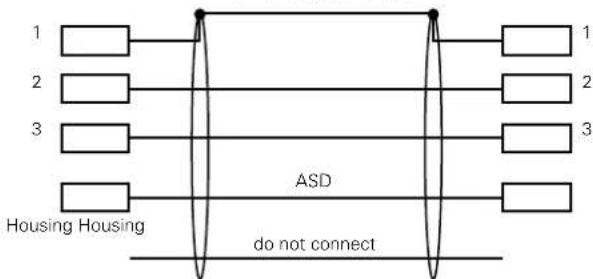
flowchart
graph TD
    A["1"] --> B["ASD"]
    C["2"] --> B
    D["3"] --> B
    E["Housing Housing"] --> B
    B --> F["1"]
    B --> G["2"]
    B --> H["3"]
    B --> I["..."]
    style B fill:#f9f,stroke:#333,stroke-width:2px
    note right of B "ASD do not connect"
Capacity between ASD line to shield total < 2.7nF

Further Information
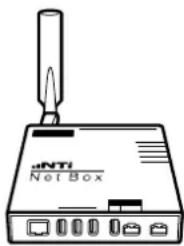
natural_image
Line drawing of a network device labeled 'aNTi Net Box' with a probe inserted (no text or symbols on the device itself)NetBox
The NetBox connects the XL2 Sound Level Meter to the internet for unattended noise monitoring. It transfers the measurement data to the fully-managed NoiseScout Web Portal in real time or provides a secure internet FTP access to the instrument. The supported communication interfaces are 3G and LAN.
NTi Audio #:
NetBox (LAN): 600 000 450•
NetBox with 3G Modem and LAN • 600 000 458
NoiseScout 365 •
(subscription service for one year) or Data Credits
- 30 Days: 600 000 490
- 100 Days: 600 000 491
- 366 Days: 600 000 492
- 1096 Days: 600 000 493
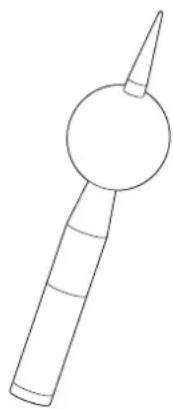
natural_image
Simple line drawing of a stylized object resembling a megaphone or tool (no text or symbols)WP30 Weather Protection for M2230
Protect your M2230 microphone from wind, rain and perching birds with this professional outdoor microphone protection kit. Ideal for semi-permanent, unsupervised outdoor installations.
Features
Class 1 in accordance with IEC 61672 • and ANSI S1.4
Compliant for 0° and 90° • sound incidence
• Non-corrosive material
• 3/8" Tripod Mount
NTi Audio # 600 040 060
Further Information

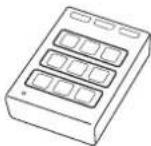
Limit Light
The XL2 Audio and Acoustic Analyzer in combination with this Limit Light offers a turnkey solution for live sound monitoring. The sound level limits are set in the XL2. The Limit Light provides a pre-warning with an orange light and indicates that levels have been exceeded with a red light.
NTi Audio #: 600 000 600
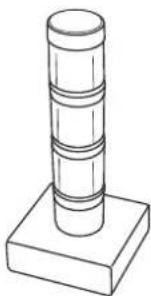
natural_image
Simple line drawing of a cylindrical object mounted on a square base (no text or symbols)Stack Light
The XL2 Audio and Acoustic Analyzer in combination with this Stack Light provides a turnkey solution for noise level monitoring or passed / failed measurements where a prominent visual indication is required. The Stack Light connects directly to the XL2 Analyzer and shows the actual measurement result with three different colors; green, orange and red.
NTi Audio #: 600 000 610

Class 1 Sound Calibrator
The battery-operated Class 1 Sound Calibrator is classified for the calibration of class 1 measurement microphones, sound level meters and other acoustic measurement equipment. This precision microphone calibrator delivers 94 or 114 dB at a frequency of 1 kHz.
NTi Audio #: 600 000 388
The optional 1/4" adapter ADP-1/4-P is required to fit 1/4" measurement microphones.
NTi Audio #: 600 000 391
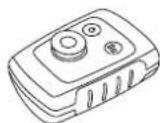
Class 2 Sound Calibrator
The battery-operated Class 2 Sound Calibrator is classified for the calibration of class 2 measurement microphones, sound level meters and other acoustic measurement equipment. This microphone calibrator delivers 114 dB at a frequency of 1 kHz.
NTi Audio #: 600 000 394

Further Information
Weatherproof Enclosure for Noise Monitoring Terminal
The weatherproof enclosure is the tailored fixed installation solution for unattended noise monitoring. The enclosure is IP66 rated, highly secure and constructed of strong, hard-wearing reinforced fiberglass.
NTi Audio #: 600 000 480

Shroud MXA01
The Shroud reduces the acoustic reflections from the XL2 housing back to the microphone capsule for precision class 1 measurements. It supports the XL2 in combination with the 1/2" measurement microphones M2230, M2211 and M2215. The Shroud is included within the Type Approval Option.
NTi Audio #: 600 040 110

Basic Outdoor Case
The Basic Outdoor Case is a simple and efficient solution for outdoor noise monitoring. Powered either by an external mains supply or a small, high-capacity battery pack, the case is more than adequate for a number of days of monitoring. The robust and lightweight design protects the XL2 and accessories from a wide range of inclement weather conditions.
NTi Audio #:
IP43 rating: 600 000 471•
IP63 rating: 600 000 473•
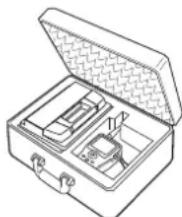
natural_image
Line drawing of a toolbox open with internal compartments (no text or symbols)Heavy Duty Outdoor Case
The heavy duty outdoor case is a professional solution for short- and medium term unattended noise monitoring. The case provides comprehensive protection against dust, water and impacts. Internal dimensions provide ample space for battery packs to power the XL2 Sound Level Meter.
NTi Audio #:
IP43 rating: 600 000 476•
IP65 rating: 600 000 477•
Further Information

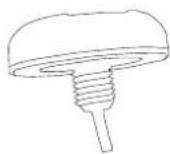
GPS Receiver (customized)
The specially adapted GNSS receiver comes with a built-in active antenna in a white housing. It connects to the XL2 Sound Level Meter and the NetBox. Typical applications are to synchronize the start time of one or multiple XL2s precisely with the GPS signal (+/- 0.7 ms) or presenting the precise instrument position in NoiseScout Gateway mode for unattended noise and vibration monitoring. The GNSS receiver supports Galileo, GPS and other systems. NTi Audio #: 600 000 357
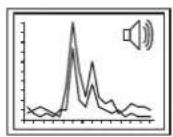
Data Explorer Software
Data Explorer is a PC-based software application with a powerful data processor for easy and fast analysis of sound level measurement data. The data import requires that the Data Explorer Option be installed on the XL2. Download the software at https://my.nti-audio.com.
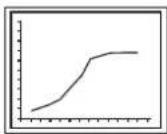
Sound Insulation Reporter Software
Sound Insulation Reporter is a PC-based software application that provides all the standard reports for Airborne and Impact sound insulation measurements. The Sound Insulation Option enables the import of measurement data into the Sound Insulation Reporter software. Download the software at https://my.nti-audio.com.
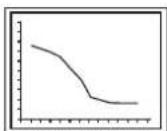
Room Acoustics Reporter Software
The Room Acoustics Reporter is a PC software for automatically generating reverberation time measurement reports and analyzing the RTA frequency response spectrum. The Room Acoustics Option enables the import of measurement data into the Room Acoustics Reporter software. Download the software at https://my.nti-audio.com.

Further Information
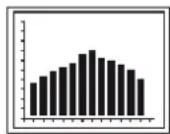
Sound Power Reporter Software
Sound Power Reporter is a PC-based software application that provides all the standard reports for sound power measurements. The Sound Power Option enables the import of measurement data into the Sound Power Reporter software. Download the software at https://my.nti-audio.com.
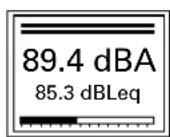
XL2 Projector PRO Software
The Projector PRO software displays the XL2 screen in real-time on your PC when connected by USB. The Projector PRO option enables the "XL View" and "Sound Level Predictor" for live sound monitoring. Free download from the XL2 Support Page at https://my.nti-audio.com.

1/2" Windscreen 90 mm
for M2211, M2215 and M2230 measurement microphone NTi Audio #: 600 040 109

WP30 Windscreen 90 mm
The replacement package contains two spare windscreens for the outdoor measurement microphone M2230-WP or WP30. The outdoor windscreen is recommended to be replaced annually. NTi Audio #: 600 040 061

8 GB SD Card (default)
1x included with XL2 NTi Audio #: 600 000 374
Further Information


SD Card 32 GB
Every 32 GB SD Card is individually tested.
The XL2 requires an SD card that can continuously and simultaneously store many data streams. Unfortunately many cards available on the market are known to interrupt the read/write process for periods of more than 10 seconds. This leads to data loss in the XL2. These interruptions can occur regardless of the speed rating of the card. Even cards of the same type and from the same vendor behave differently depending on the production date. Therefore, to ensure the integrity of the XL2 data recording, NTi Audio verifies every single card over a period of several days before the card is sent to our customer. Requires XL2 Firmware V4.10 or higher.
Requires XL2 Firmware V4.10 or higher.
NTi Audio #: 600 000 386
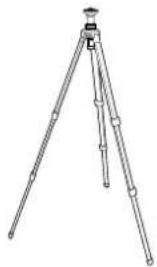
natural_image
Line drawing of a tripod-mounted surveying instrument with no visible text or symbolsLightweight Tripod
Retractable, lightweight tripod with 1/4" ball head and 3/8" mounting thread. The flexible ball head mounts the XL2 Analyzer at any angle. The tripod is suitable for all measurement microphones, the outdoor microphone M2230-WP and the TalkBox.
NTi Audio #: 600 000 397
Minirator MR-PRO
The MR-PRO is an extremely powerful analog audio generator designed for the professional engineer. It generates the following analog audio signals:
Sine Waveforms, freely selectable frequencies and levels up to +18 dBu
Sweep Signals, any frequency interval • up to 1/12 octave
White Noise, Pink Noise •
Polarity Test Signal •
Delay Test Signal •
- Uploaded wav-files (*.wav)
NTi Audio #: 600 000 310

Further Information
NTi Audio TalkBox
The NTi Audio TalkBox greatly simplifies the acoustic feed of the STIPA intelligibility test source signal into closed sound reinforcement systems. It presents the standardized voice-like acoustic signal emission simulating a human talker in accordance with IEC 60268-16, combined with a certified speech intelligibility signal at standardized levels. NTi Audio #: 600 000 085

Tracer Battery Adapter Cable
The Tracer Battery Adapter Cable connects the Tracer battery pack to a NetBox or an XL2 Analyzer. It ensures that the connected instruments start up properly if the battery has been completely discharged. NTi Audio #: 600 000 478
Further Information


Further Information
Warranty Conditions
International warranty
NTi Audio guarantees the function of its products and the individual components for a period of one year from the date the product needs to be returned for service, kindly follow the of sale. During this period, defective products will either be service guidelines at www.nti-audio.com/service. repaired free of charge or replaced.
Service and Repairs
If your product is not functioning correctly or is damaged, please contact the local NTi Audio partner for assistance. If
Limitations
These guarantee provisions do not cover damage caused by accidents, transportation, incorrect use, carelessness, non-original accessories, the loss of parts, operation with non-specified input voltages, adapter types or incorrectly inserted batteries. NTi Audio accepts no responsibility for subsequent damage of any kind. The warranty will be voided by carrying out repairs or services by third parties who are not part of an approved NTi Audio Service Centre.
Statutory Rights
Consumers may have legal (statutory) rights under applicable national laws relating to the sale of consumer products. This warranty does not affect your statutory rights. You may assert any legal rights you have at your sole discretion.
| Damage through shocks and moistureThe protective shock jacket shields the instrument against reasonable impacts that could occur in normal use.Do not intentionally subject the instrument to extreme stress!Please do not drop the instrument!•Damage caused by dropping or impact is not covered by warranty.Do not use the instrument in damp environ-ments! The instrument can be permanently damaged if exposed to moisture. |
Further Information

Calibration Certificate
Your NTi Audio instrument has been tested during manufacture and conforms to the specifications listed in "Technical Data".
The XL2 combination with the appropriate measurement microphone forms a precise class 1 or class 2 sound level meter in accordance with the standards and configurations listed in "Technical Data".
You may order a manufacturer calibration certificate of your new instrument at the local NTi Audio partner either with or any time after the purchase of the instrument. The certificate lists the individual instrument data with serial number recorded prior to the shipment.
NTi Audio recommends annual calibration of the products starting one year after the purchase. The calibration provides documented and traceable measurement accuracy and confirms that your NTi Audio product meets or exceeds the published specifications. The calibration and adjustment procedures follow the documentation and traceability requirements of the EN ISO / IEC 17025 standard.
For calibrations kindly follow the service guidelines at www.nti-audio.com/service.

Further Information
Sample Calibration Certificate

Manufacturer Calibration Certificate
The following instrument has been tested and calibrated to the manufacturer specifications. The calibration is traceable in accordance with ISO/IEC 17025 covering all instrument functions.
• Device Type: XL2 Audio and Acoustic Analyzer
• Serial Number: A2A-11667-E0
- Date of Calibration:
• Certificate Number
• Results: PASSED
25 July 2016
42576-A2A-11667-E0
(for detailed report see next page)
Tested by: M. Frick
Signature:
Stemp:

Calibration of: XI2 Audio and Acoustic Analyzer Serial Number: A2A-11567-50 Date: 25 July 2016
• Measurement Date on Receipt: In tolerance
• Detailed Calibration Test Results:
| reference before actual unit | ECU error | XL2 tolerance | celibration uncertainty* | ||||
| RMS Level @ 1kHz, XLF Input | 0.1 | 0.100 | 0.100 | V | ±0.1% | ±0.5% | ±0.10% |
| 1 | 0.930 | 1.000 | V | ±0.1% | ±0.5% | ±0.00% | |
| 10 | 0.987 | 9.989 | V | -0.1% | ±0.5% | ±0.00% | |
| Flatness, XLR Input1 | 20 Hz | 1 | 0.997 | 0.996 | V | -0.4% | ±1.1% | ±0.05% |
| 20 kHz | 1 | 1.004 | 1.004 | V | 0.4% | ±1.1% | ±0.09% |
| Frequency | 1000 | 1005.00 | 999.99 | Hz | ±0.003% | ±0.003% | ±0.01% | |
| Residual Noise | x1A | <2 uV | <2 uV | <2 uV | +0.50% |
THC IN 0 dB, 1 kHz, XLF Input -98.5 -98.9 dB typ -100 dB =0.50%
• Test Conditions:
Temperature Relative Humidity:
28.2 ℃
51.7%
• Calibration Equipment Used:
- Agilent Multimeter, Tyc 34101A, Serial No. MY 5300 4607 Last calibration: 17.08.2016, Next calibration: 17.08.2017 Calculated by ELCAL to the national standards maintained at Swiss Federal Office of Metrology. SCS 502
- FX100 Audio Analyzer, Serial No. 10408 Last Calibration: 04.05.2016, Next Calibration: 04.05.2017 Manufacturer calibration based on Agilent: 34410, Serial No. MY47014254, Last Calibration: 03.05.2016, Next Calibration: 03.06.2017 which is calibrated by ELCAL to national standards maintained at Swiss Federal Office of Metrology, SCS 002
The specified tolerance 170.1 扣率 15 = 17.1%
- The reported expected uncertainty is based on a standard uncertainty multiple by a coverage factor i-2 , providing a level of confidence of approximately 90%. The uncertainty evaluation has been carried out in accordance with the regulations of the GUM.
Declaration of Conformity
CE / FCC Compliance Statement
C ∈
We, the manufacturer NTi Audio AG, Im alten Riet 102, 9494 Schaan, Liechtenstein, do hereby declare that the XL2 Analyzer, the measurement microphones M2230, M2211, M2215, M4261, the preamplifier MA220 and accessories, comply with the following standards or other standard documents:
EMC: 2014/30/EU•
Harmonized standards: EN 61326-1•
Explosive atmospheres (ATEX): 2014/34/EU
Directive 2011/65/EC on the restriction of the use of certain hazardous substances in electrical and electronic equipment (RoHS).
Directive 2012/19/EU on waste electrical and electronic equipment (WEEE).
This declaration will become invalid if modifications to the instrument are carried out without the written approval of NTi Audio.
Date: 25. July 2019
M. Rechen
Position: COO
Information for Disposal and Recycling

Dispose of the instrument in accordance with the legal environmental regulations in the country.
Regulations for the EU and other European countries with corresponding laws
The instrument must not be disposed of in the household garbage. At the end of its service life, bring the instrument to a collecting point for electrical recycling in accordance with the local legal regulations.
Other countries outside the EU
Contact the respective authorities for the valid environmental regulations in the country.

Specifications
23. Technical Data XL2
All specifications are according to the IEC61672 standard. Other standards are listed the corresponding specifications.
| Sound Level Meter | |
| Certified Product Configurations Class 1 | XL2-TA, M2230 microphone and Shroud MXA01 • form an integrating sound level meter with type approval in accordance with class 1 requirements of IEC 61672 and ANSI S1.4 |
| Product Configurations Class 1 | XL2 with M2230 microphone • Class 1 in accordance with IEC 61672 and ANSI S1.4XL2 with M2211, M2215 microphone • Class 1 frequency response in accordance with IEC 61672 and ANSI S1.4These specifications apply for operation with the microphone attached using the Shroud MXA01 or the microphone detached using the ASD cable. This prevents possible acoustic reflections from the XL2 housing and ensures a high measurement accuracy in accordance with the standards IEC 61672 and ANSI S1.4. |
| Product Configurations Class 2 | XL2 with M4261 microphone • Class 2 in accordance with IEC 61672 and ANSI S1.4 |
| Conforms with Standards | IEC 61672:2013, IEC 61672:2003, •IEC 61260:2014, IEC 61260:2003,IEC 60651, IEC 60804SMPTE ST 202:2010, ISO 2969:2015 •China: GB/T 3785:2010, GB/T 3241, GB 3096-2008, •GB 50526, GB-T 4959Germany: DIN 15905-5, DIN 45657:2014, DIN •45657:2005, DIN 45645-2, optional: DIN 45645-1Japan: JIS C1509-1:2005, JIS C 1513 class 1, •JIS C 1514 class 0Switzerland: V-NISSG •UK: BS 4142:2014, BS 5969, BS 6698• US: ANSI S1.4:2014, ANSI S1.43, ANSI S1.11:2014International IEC standards are adopted as European standards and the letters IEC are replaced by EN.XL2 conforms to these EN standards. |
| Weighting | • Frequency weighting: A, C, Z (simultaneous)Time weighting: Fast, Slow, optional: Impulse (simultaneous) |
| Level Details | • Measurement bandwidth (-3dB): 4.4 Hz - 23.0 kHzlevel resolution: 0.1 dBInternal noise: 1.3 μV A-Weighted |
Specifications

| Audio Recording | Default •Recording of compressed wav-files »(ADPCM - 4 bit, 24 kHz)a new wav-file starts every 12 hours »(max. wav-file size 512 MB)Bandwidth: 2.0 Hz - 10.2 kHz »Optional: Extended Acoustic Pack •Recording of linear wav-files (24 bit, 48 kHz) »a new wav-file starts every 1 hours »(max. wav-file size 512 MB)Bandwidth: 2.0 Hz - 23.6 kHz »Optional: NoiseScout - Managed Mode •Recording of compressed wav-files »(4 bit, 12 kHz)Bandwidth: 2.0 Hz - 5.1 kHz »requires activated "NoiseScout 365" or »“Data Day Credits”• Audio files include meta data (scaling, time, ...) in Broadcast Wave Format BWF according to EBU TECH 3285 |
| MeasurementRanges withdifferentmicrophones | XL2+M2230: 17 dB(A) - 137 dBXL2+M2215: 25 dB(A) - 153 dBXL2+M2211: 21 dB(A) - 144 dBXL2+M4261: 27 dB(A) - 146 dB@ typical microphone sensitivity |
| Linear MeasurementRange acc.IEC61672 /ANSI S1.4 | XL2+M2230: 24 dB(A) - 137 dB27 dB(C) - 137 dBXL2+M2215: 33 dB(A) - 153 dBXL2+M2211: 29 dB(A) - 144 dBXL2+M4261: 33 dB(A) - 146 dB@ typical microphone sensitivity |
| Stabilization Time | < 10 seconds |
| Integration Time | Minimum: 1 secondMaximum: 100 hours minus 1 second |
| Display Measurement Ranges | Three level ranges depending on the microphone sensitivity with manual setting. For example:M2230 @ sensitivity = 42 mV/PaLOW, lower level range: 0 - 100 dBSPL MID, mid-level range: 20 - 120 dBSPL »HIGH, upper level range: 40 - 140 dBSPL »M2215 @ sensitivity = 8 mV/PaLOW, lower level range: 20 - 120 dBSPL MID, mid-level range: 40 - 140 dBSPL »HIGH, upper level range: 60 - 160 dBSPL »M2211 @ sensitivity = 20 mV/PaLOW, lower level range: 10 - 110 dBSPL MID, mid-level range: 30 - 130 dBSPL »HIGH, upper level range: 50 - 150 dBSPL »M4261 @ sensitivity = 16 mV/PaLOW, lower level range: 10 - 110 dBSPL MID, mid-level range: 30 - 130 dBSPL »HIGH, upper level range: 50 - 150 dBSPL » |

Specifications
| Residual noise in [dB] @ S = 42 mV/Pa of XL2 without measurement microphone | Frequency weighting A • | ||
| Level range L | eq | Lpeak | |
| LOW 4 17 | |||
| MID 18 31 | |||
| HIGH 43 55 | |||
| Frequency weighting C • | |||
| Level range L | eq | Lpeak | |
| LOW 3 16 | |||
| MID 17 30 | |||
| HIGH 41 55 | |||
| Frequency weighting Z • | |||
| Level range L | eq | Lpeak | |
| LOW 7 20 | |||
| MID 21 34 | |||
| HIGH 46 58 | |||
Frequency weighting A •
| Level range L | eq | Lpeak |
| LOW 3 16 | ||
| MID 17 30 | ||
| HIGH 41 55 |
| Level range L | eq | Lpeak |
| LOW 7 20 | ||
| MID 21 34 | ||
| HIGH 46 58 |
| Measure-ments | SPL actual, Lmin, Lmax, Lpeak, Leq •●Gliding LAeq and LCeq with selectable time window from one second to one hour(=running Lxeq or sliding Lxeq with x= A or C)All measurement results simultaneously available●Correction value measurement wizard based on LAeq, LCeq and LCpeak●Noise exposure level LEX with post-processing●Logging all data or subsets in selectable intervals●Recording of voice notes●Monitoring of sound levels that exceed limits●Digital I/O interface for external peripherals control |
| Real-Time Analyzer RTA | Conforms with class 1 of IEC 61260:2014 and ANSI S1.11-20141/1 octave band display: 8 Hz - 16 kHzsub ranges 8 Hz - 4 kHz or 31.5 Hz - 16 kHzdisplayed with A/Z broadband levels at one glance1/3 octave band display: 6.3 Hz - 20 kHzsub ranges 6.3 Hz - 8 kHz or 20 Hz - 20 kHzdisplayed with A/Z broadband levels at a glancelevel resolution: 0.1 dBMeasurement Units: Volt, dBu, dBV and dBSPLBand pass filters (base 10) conform with class 1 of IEC 61260:2014 and ANSI S1.11-2014» 1/1 octave spectrum: > 16 Hz band» 1/3 octave spectrum: > 16 Hz bandWide band levels simultaneouslyfrequency weighting: X-Curve @ 500 seats in accordance with SMPTE ST 202:2010 and ISO 2969:2015●Capturing of a single reading into the internal memory for comparative measurements●eq logging |
Specifications

| Remote Measurement (optional) | Querying measurement data online via the USB interface of the following functions:Sound level meter and spectrum analyzer •SLMeter/RTAFFT analyzer •RT60 reverberation time •Audio analyzer RMS/THD+N •High resolution spectral analyzer 1/12 Oct + Tol • |
| Data Explorer (optional) | Enables the import of measurement data into the •XL2 Data Explorer softwarePowerful data processor for easy and fast analysis of sound level measurement data on PC |
| Sound Insulation (optional) | Enables the import of RTA and RT60 measure- •ment data in 1/3 octave band resolution into the XL2 Sound Insulation Reporter softwareSoftware provides all tools for fast data analysis •and standardized reporting of airborne, impact and facade sound insulation measurements on PCStandards ISO 16283, ISO 140, ISO 717, ISO •10140, DIN 4109, Document E, ASTM E336, ASTM E413, ASTM E1007, ASTM E989, ASTM E966, ASTM E1332, GB/T 19889, SIA 181 |
| Sound Power (optional) | Enables the import of RTA and RT60 measure- •ment data in 1/1 and 1/3 octave band resolution into the XL2 Sound Power Reporter softwareSoftware provides all the standard reports for •sound power measurements• Standards ISO 3741, ISO 3744, ISO 3746, ANSI-ASA S12.51, S12.54, S12.56 |
| Functions of Extended Acoustic Pack (optional) | SLMeter/RTA function» Recording of linear wav-files (24 bit, 48 kHz)a new wav-file starts every 1 hour (max. wav-file size 512 MB)Percentiles for wide band, 1/1 and 1/3 octave spectrum- Flexible setting from 0.1% to 99.9%- Sampling: every 1.3 ms- Wide band: in 0.1 dB wide classes, based on sampling Lxy (x= A, C or Z, y= F, S or EQ")1/1 and 1/3 octave spectrum: in 1.0 dB wide-classes, based on Lxy (x= A, C or Z, y= F or S)- Dynamic range: 140 dBSound Exposure Level LAE» 100ms logging» RTA logging of Lmin and Lmax» Event-triggered audio and data recording» Time weighting: Impulse (Lxl, Lxleq with x= A, C, Z)» True peak level in 1/1 and 1/3 octave resolution» Clock-Impulse Maximum Level (TaktMax) and values as specified in DIN 45645-1» Impulsiveness detection in accordance with BS4142:2014 and NordTest ACOU 112 FFT function •High-resolution Zoom-FFT with selectable frequency ranges and resolution up to 0.4 Hz in the range of 5 Hz to 20 kHz» Recording of linear wav-files (24 bit, 48 kHz)RT60 function» Reverberation time RT60 in 1/3 octave resolution▼12 octave Spectral Analyzer» Recording of linear wav-files (24 bit, 48 kHz) |

Specifications
| Functions of Spectral LimitsOption (optional) | SLMeter/RTA function •True peak level in 1/1 and 1/3 octave resolution » FFT function •High-resolution Zoom-FFT with selectable fre-» quency ranges and resolution up to 0.4 HzSound mode: 5 Hz to 20 kHz »Vibration mode: 1 Hz to 20 kHz »1/12 octave function •High resolution RTA function “1/12 Oct + Tol” » Selectable 1/1, 1/3, 1/6 and 1/12 octave spectral » resolutionFrequency band listening at rear speaker »Sound Mode: 11.5 Hz to 21.8 kHz »Vibration mode: 0.73 Hz to 1.36 kHz•FT and 1/12 octave functionCapturing of multiple readings into the internal memoryComparing measurement results against captures with relative or absolute curve display Comprehensive tolerance handling with tolerance masks based on captures for passed/failed measurementsExport and import of tolerance and capture filesNoise CurvesNoise Rating NR according to ISO/R 1996-1971Noise Criteria NCin accordance with ANSI S12.2-2008 and -1995Room Noise Criteria RNCin accordance with ANSI S12.2-2008Room Criteria RCin accordance with ANSI S12.2-1995Preferred Noise Criteriain accordance with ASA 1971 |
| Acoustic Analyzer | |
| FFT Analysis | Real-time FFT with actual level, L_eq , L_min , L_max level resolution: 0.1 dBFrequency Band Ranges: 7 Hz - 215 Hz, •58 Hz - 1.72 kHz, 484 Hz - 20.5 kHz with 143 frequency bins shown on displayMeasurement Units: Volt, dBu, dBV and dBSPLOptional: High-resolution Zoom-FFT with selectable frequency ranges and resolution up to 0.4 Hz in the range of 5 Hz to 20 kHzOptional: Capture and tolerance function with multiple readings for comparative measurements and passed/failed analysis |
| ReverberationTime RT60 | Conforms with ISO 3382 and ASTM E2235 /1 octave bands results from 63 Hz - 8 kHz, based on T20 and T30Optional: 1/3 octave bands results from •50 Hz - 10 kHz, based on T20 and T30Range: 10 ms - 30 secondsMinimum RT60 (typical) 100 Hz: 0.3 second \# 00 - 200 Hz: 0.2 second 200 Hz: 0.1 secondMeasurement based Schroeder-methodTest signal: Impulse source or interrupted pink •noise generated by the MR-PRO, MR2 or the included NTi Audio Test CD |
Specifications

| Polarity Checks | polarity of speakers and line signals •Positive/Negative detection of wideband and •individual 1/1 octave bands through internal microphone or XLR/RCA connectorTest signal: NTi Audio polarity test signal gener- •ated by the MR-PRO, MR2 or the included NTi Audio Test CD |
| Delay Time | Propagation delay between electrical reference •signal and acoustic signal using the internal microphoneRange: 0 ms - 1 second (0 m - 344 m) •Resolution: 0.1 ms •Test signal: NTi Audio delay test signal generated •by the MR-PRO, MR2 or the included NTi Audio Test CD |
| Noise Curves | Noise Rating NR according to ISO/R 1996-1971 •Noise Criteria NC •in accordance with ANSI S12.2-2008 and -1995Room Noise Criteria RNC •in accordance with ANSI S12.2-2008Room Criteria RCin accordance with ANSI S12.2-1995Preferred Noise Criteriain accordance with ASA 1971Application range of measurement microphones:» M2230: down to NC15»M2211: down to NC15» M4261: down to NC25 |
| 1/12 Octave Analysis (optional) | Actual level, Lmin, Lmax, Leq, Leq1", Leq4" Selectable 1/1, 1/3, 1/6 and 1/12 octave spectral resolutionMeasurement Units: Volt, dBu, dBV and dBSPLBand pass filters (base 10)Capturing of multiple readings into the internal • memoryComparing measurement results against captures with relative or absolute curve displayComprehensive tolerance handlingCreating tolerance masks based on captures for passed/failed measurements |
| Cinema Meter (optional) | Measurements in 1/3 octave resolution in accordance with SMPTE ST 202:2010 and SMPTE RP 200:2012An interactive assistant guides the user through dedicated measurement procedures. |
| STIPA Speech Intelligibility (optional) | Single value STI and CIS test result in accordance with IEC 60268-16, ISO 7240-16, ISO 7240-19, DIN VDE 0828-1, DIN VDE 0833-4, BS 5839-8, NFPA 72Ambient noise correctionAutomated averaging of measurementsModulation indices and individual band level results with error indicatorTest signal: NTi Audio STIPA signal generated by the MR-PRO, NTi Audio TalkBox or the STIPA Test CD |

Specifications
| Audio Analyzer | |
| Conforms with Standards | IEC 61672, IEC 60651, IEC 60804 • DIN EN 60065, VDE 0860, IEC 468-4 • |
| Level RMS True | RMS detection in V, dBu, dBV, dBSPL • Power measurement in Watt W or dBm • with flexible load setting from 1.0 to 9999 Ohm Range XLR/RCA input: 2 μV - 25 V (-112 dBu to • +30 dBu) Accuracy: ± 0.5 % @ 1 kHz, • Flatness: ± 0.1 dB @ 12 Hz to 21.3 kHz • Bandwidth (-3 dB): 5 Hz to 23.6 kHz • Resolution: 3 digits (dB scale), 5 digits (linear scale) or 6 digits (x1 scale) |
| Real-Time Analyzer RTA | Following measurement functions offer audio spectrum in Volt, dBu and dBV Sound Level Meter • FFT /12 Octave (optional) |
| Frequency | Range: 9 Hz to 21.3 kHz Resolution: 6 digits Accuracy: < ± 0.003% |
| THD+N(Total Harmonic Distortion + Noise) | Range: -100 dB to 0 dB (0.001% to 100%) Minimum level: > -90 dBu Fundamental frequency range: 10 Hz to 21.3 kHz Measurement bandwidth: 2 Hz to 23.6 kHz Resolution: 3 digits (dB scale) or 4 digits (linear scale) Residual THD+N @ XLR/RCA input: < 2 μV |
| Scope | Auto ranging, auto scaling |
| Filter | Frequency weighting: A, C, ZHighpass 100Hz, 400 Hz, 19 kHz,Bandpass 22.4 Hz - 22.4 kHz in accordance with IEC468-4 |
| Remote Measurement (optional) | Querying measurement data online via the USB interface of the following functions:Sound level meter and spectrum analyzerSLMeter/RTAFFT analyzerRT60 reverberation timeAudio analyzer RMS/THD+NHigh resolution spectral analyzer 1/12 Oct + Tol |
| Calibration | |
| Free-field Correction | NTi Audio Class 1 Sound Calibrator» M2230: -0.1 dB» M2211: -0.1 dB» M2215: -0.1 dBNTi Audio Class 1 Sound Calibrator with • 1/4” Calibration Adapter, type ADP 1/4-P» M4260: +0.1 dB» M4261: +0.2 dB |
| Wind Screen Correction | 50 mm Wind Screen: +0,12 dB90 mm Wind Screen: +0,19 dBWP30 Wind Screen 90 mm: +0,19 dB |
| Calibration | • Recommended calibration interval: one yearMicrophone calibration with external calibrator supportedOptional calibration certificate for new instruments available |
Specifications

| Vibration Meter | |
| Channels 1 (Single-channel) • | |
| Parameters Real time measurement inAcceleration: m/s2, g, in/s2, dB »Velocity: m/s, in/s, dB »Displacement: m, in, dB »Peak particle velocity PPV: mm/s, in/s » | |
| VibMeter Broadband level •Frequency range: 0.8 Hz - 2.5 kHzSpectral •1/1 octave band display: 1 Hz - 2.0 kHz »sub ranges 1 Hz - 500 Hz or 4 Hz - 2 kHz1/3 octave band display: 0.8 Hz - 2.5 kHz »sub ranges 0.8 Hz - 1.0 kHz, 2.5 Hz - 2.5 kHzBroadband level measured with bandwidth (-3dB): 0.7 Hz - 23.6 kHzDisplay according to DIN 45669-1:2010Unweighted velocity v(t)Maximum absolute velocity IvmaxAveraging duration TinMeasurement duration Tin | |
| Filter | Flat (no filter)Bandwidth (-3dB): 0.7 Hz - 23.6 kHz• 10 - 1000 Hz according to ISO 2954 with decay rate = 18 dB / octave• - 80 Hz, 1 - 315 Hz acc. to DIN 45669-1:2010 with decay rate = 12 dB / octave |
| AudioRecording inVibMeter | DefaultRecording of compressed wav-files(ADPCM - 4 bit, 24 kHz)a new wav-file starts every 12 hours(max. wav-file size 512 MB)Bandwidth: 2.0 Hz - 10.2 kHzOptional: Extended Acoustic PackRecording of linear wav-files (24 bit, 48 kHz)a new wav-file starts every 1 hours(max. wav-file size 512 MB)Bandwidth: 2.0 Hz - 23.6 kHz |
| FFT | Frequency range: 1 Hz - 1.69 kHzOptional: High-resolution Zoom-FFT with selectable frequency ranges and resolution up to 0.4 Hz in the range of 1 Hz to 20 kHz |
| 1/12 Oct | Actual level, Lmin, Lmax, Leq, Leq1,"Leq4"Selectable 1/1, 1/3, 1/6 and 1/12 octave spectral resolutionMeasurement UnitsAcceleration: m/s2, g, in/s2, dB »Velocity: m/s, in/s, dB »Displacement: m, in, dB »Band pass filters (base 10)Optional: Frequency range: 0.73 Hz - 1.36 kHz |
| Maximum InputLevel | 353 m/s2, 36 g @ 20 mV/(m/s2)with ICP Adapter ASD |
| Residual Noise(typical) withICP AdapterASD | 7 μV @ 0.7 Hz ... 23.0 kHz 14 μV @ 1 Hz ... 315 Hz 14 μV @ 1 Hz ... 80 Hz |

Specifications
| Reference-measurement range | Mid |
| Input / Output Interfaces | |
| Audio Inputs XLR balanced •Input impedance = 200 kOhm »Phantom power: +48 VDC switchable with maxi- » mum 10 mA supply current in accordance with IEC 61938Automated sensor detection for NTi Audio's ASD measurement microphones and pre-amplifier MA220RCA unbalanced with input impedance >30 kOhm •Built-in condenser microphone for polarity testing, delay measurements and voice note recording | |
| Audio Outputs | Built-in speaker •Headphone connector.5 mm Minijackmono monitor wired to both channels of stereo »jackLinear output signal over a measurement range » of 57 dB in SLMeter measurement function |
| USB Inter-face | USB mini connector for data transfer to PC, XL2 Projector PRO and/or charging of Li-Po battery |
| Digital I/O Connection interface to accessoriesXL2 Input Keypad •Limit Light •Stack LightDigital I/O Adapter PCB | |
| TOSLink | 24 bit linear PCM audio signal output (prepared for later firmware extension) |
Specifications

| Memory SD Card included (8 GByte), removable, storing measurement data in ASCII format, screen shots, voice notes and wav-filesData logging every second offers following noise monitoring periods:Logging default noise levels: > 2 years •Additional logging of 1/3 octave data: > 6 month •Additional•compressed audio recording: > 1 weeklinear audio recording: > 15 hours »Optional 32 GB SD Cards are available for longer monitoring requirements; requires XL2 Firmware V4.10 or higher. | |
| Power Supply | Rechargeable Li-Po battery includedType 3.7 V / 2260 mAhTypical battery lifetime > 4 hoursRange: 3.3 - 4.5 VDCVolume energy density = 339 Wh/LDry cell batteries type AA, 4 x 1.5 V •Typical battery lifetime > 4 hoursRange: 3.7 - 6.0 VDCLinear external power supply 9 VDCRange: 7.5 - 20.0 VDC @ minimum 6 WattCharges Li-Po battery during operation »USB-Power Supply •for short term operation < 1 day »•charging power is equal or less than power consumption |
| Power Supply | External battery pack22 Ah battery pack: 4 days44 Ah battery pack: 8 days |
| General | |
| Clock | DefaultReal-time clock with lithium backup batteryDrift < 1.7 seconds per 24 hoursSpecial XL2 edition, NTi Audio # 600 000 356VCXTO clockDrift < 0.04 seconds per 24 hours |
| Mechanics | Tripod or microphone stand mount 1/4"Wire stand mounted on rear sideDisplay: 160 x 160 pixels grey scale with LED back lightDimensions (L x W x H)480 mm x 90 mm x 45 mm7.1" x 3.5" x 1.8"Weight: 480 g (1 lb) including built-in Li-Po battery |
| Temperature | -10 °C to +50 °C (14° to 122°F) |
| Humidity | 5% to 90% RH, non-condensing |
| Susceptibility to radio frequencies | Classification Group X |
| Electromagnetic Compatibility | CE compliant:EN 61326-1 Class B, EN 55011 class BEN 61000-4-2 to -6 & -11 |
| Protection Rating | IP51 |
| ATEX | For applications in explosive atmospheres within zone 2 in accordance with IEC 60079Conforms to 2014/34/EU269 |

Specifications
- Technical Data Microphones
| M2230 M2230-WP | M2211 M2215 | M4261 | |||
| Outdoor Microphone (M2230+WP30) | High SPL | ||||
| Classification with XL2 according to IEC 61672, ANSI S1.4 | Class 1 Certified | Class 1 Certified | Frequency Response Class 1 | Class 2 | |
| Consisting of PreAmplifier | MA220 + MC230 or MC230A Capsule | PreAmplifier MA220 + MC230 or MC230A Capsule + WP30 | PreAmplifier MA220 + M2211 Capsule | PreAmplifier MA220 + M2215 Capsule | M4261 microphone with permanently installed capsule |
| Microphone Type Omnidirectional, pre-polarized condenser, free field microphone | |||||
| Capsule / Transducer 1/2" detachable with 60UNS2 thread, type WS2F according IEC 61094-4 | 1/4" permanently installed | ||||
| PreAmplifier Type MA220 - | |||||
| Flatness tolerance bands typical | ±1 dB @ 5 Hz - 20 Hz ±1 dB @ >20 Hz - 4 kHz ±1.5 dB @ >4 kHz - 10 kHz ±2 dB @ >10 kHz - 16 kHz ±3 dB @ >16 kHz - 20 kHz | +1/-4.5 dB @ 5 Hz - 20 Hz ±1.5 dB @ >20 Hz - 4 kHz ±3 dB @ >4 kHz - 10 kHz ±4.5 dB @ >10 kHz - 16 kHz ±5 dB @ >16 kHz - 20 kHz | |||
| Actual Frequency Response | freely available as Excel-data, register microphone at My NTi Audio and contact info@nti-audio.com | ||||
| Frequency Range 5 Hz - 20 kHz | |||||
| Residual Noise Floor typical | 16 dB(A) | 21 dB(A) | 25 dB(A) | 27 dB(A) | |
| Maximum SPL @ THD 3%, 1 kHz, S_typical | 137 dBSPL | 144 dBSPL | 153 dBSPL | 142 dBSPL | |
Specifications

| M2230 M2230-WP | M2211 M2215 | M4261 | |||
| Outdoor Microphone (M2230+WP30) | High SPL | ||||
| Sensitivity typical @ 1 kHz -27.5 | dBV/Pa ±2 dB(42 mV/Pa) | -34 dBV/Pa ±3 dB(20 mV/Pa) | -42 dBV/Pa ±3 dB(8 mV/Pa) | -36 dBV/Pa ±3 dB(16 mV/Pa) | |
| Temperature Coefficient < -0.01 | dB / °C < ±0.015 dB / °C < ±0.02 dB / °C | ||||
| Temperature Range -10°C to +50°C | (14°F to 122°F) | 0°C to +40°C(32°F to 104°F) | |||
| Pressure Coefficient -0.005 dB / kPa | -0.02 dB / kPa | -0.04 dB / kPa | |||
| Influence of Humidity(non-condensing) | < ±0.05 dB < ±0.4 dB | ||||
| Humidity 5% to 90% RH, non-condensing | |||||
| Long Term Stability > 250 years / dB | - | ||||
| Power Supply | 48 VDC phantom power | ||||
| Current Consumption | 2.3 mA typical | 1.7 mA typical | |||
| Electronic Data Sheet | NTi Audio ASD in accordance with IEEE P1451.4 V1.0, Class 2, Template 27 | ||||
| Output Impedance | 100 Ohm balanced | ||||
| Connector | Balanced 3-pole XLR | ||||
| Diameter Dimensions | 20.5 mm (0.8") | 36 mm (1.4") | 20.5 mm (0.8") | ||
| Length Dimensions | 154 mm (6.1") | 378 mm (14.9") | 150 mm (5.9") | ||
| Weight | 100 g, 3.53 oz | 430 g, 15.17 oz | 100 g, 3.53 oz | 83 g, 2.93 oz | |
| Environmental Protection | IP51 | IP54 in vertical position | IP51 | ||
| NTi Audio # | 600 040 050 | 600 040 055 | 600 040 022 | 600 040 045 | 600 040 070 |
Typical Frequency Response of Measurement Microphones
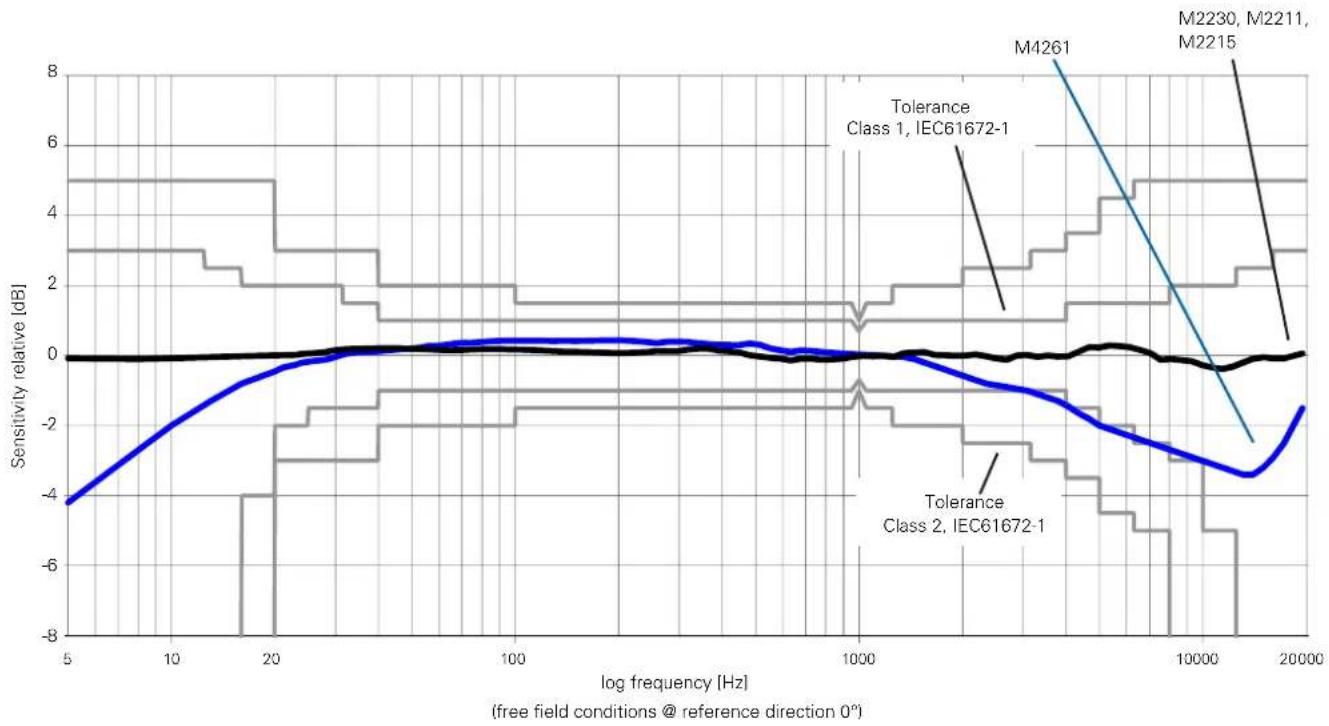
line
| log frequency [Hz] | Sensitivity relative [dB] | | ------------------ | ------------------------- | | 5 | -4.5 | | 10 | -2.0 | | 20 | -0.5 | | 100 | 0.0 | | 1000 | 0.0 | | 10000 | -3.0 | | 20000 | -1.5 |Specifications

| Linear Measurement Range acc. IEC61672 / ANSI S1.4 (typ. microphone sensitivity) | XL2 + M2230: 24 dB(A) - 137 dB | |
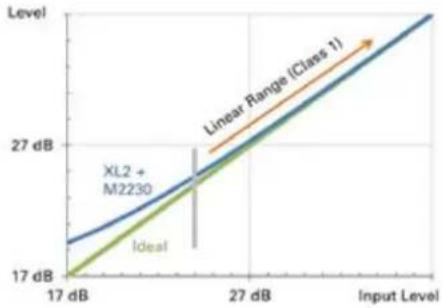 | ||
| XL2 + M2211: 29 dB(A) - 144 dB XL2 + M4261: 33 dB(A) - 146 dB | ||
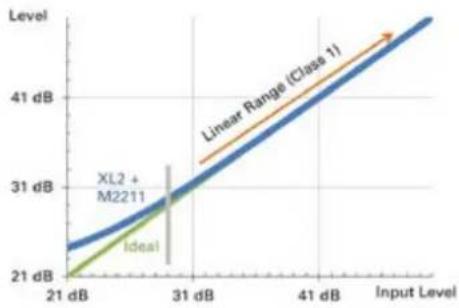 | 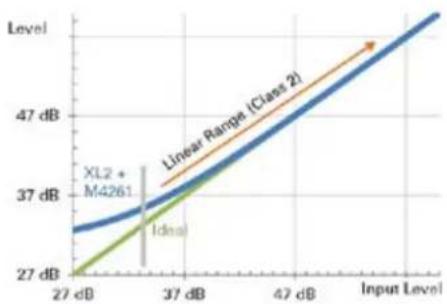 | |

Specifications
Free Field - Pressure Correction Factors
If a measurement microphone is held in a free-field environ-The following corrections apply with the B&K4226 calibrator:
ment, then the measurement microphone acts at high frequencies like a reflector. The sound pressure increases in front of the microphone capsule membrane. M2230, M2211 and M2215 are free-field equalized measurement microphones, they compensate for the increased pressure internally.
The calibrator no longer offers free-field conditions. Therefore, the free-field equalization of the microphone must be compensated. This needs to be considered prior the calibration. The correction value needs to be added to the pressure response of the microphone.
Example:
During the calibration, the XL2 measures the sound level in • the calibrator. If the B&K4226 calibrator is used and it is set to 16 kHz, then the XL2+M2230 reads just 86.7 dBA.
The free-field sound level is calculated by summing the XL2 measurement value and the correction value (86.7 dB + 7.3 dB = 94.0 dB).
| Nominal Frequency [Hz] | M2230 Measurement Microphone [dB] | M2211 Measurement Microphone [dB] | M2215 Measurement Microphone [dB] | Measurement Uncertainty U [dB] |
| 31.5 | 0.0 | 0.0 | 0.0 | 0.3 |
| 63 | 0.0 | 0.0 | 0.0 | 0.3 |
| 125 | 0.0 | 0.0 | 0.0 | 0.3 |
| 250 | 0.0 | 0.0 | 0.0 | 0.3 |
| 500 | 0.0 | 0.1 | 0.0 | 0.3 |
| 1000 | 0.0 | 0.1 | 0.0 | 0.3 |
| 2000 | 0.3 | 0.6 | 0.2 | 0.3 |
| 4000 | 0.7 | 1.7 | 1.2 | 0.3 |
| 8000 | 2.6 | 4.2 | 3.9 | 0.4 |
| 12500 | 6.0 | 7.3 | 6.7 | 0.7 |
| 16000 | 7.3 | 9.2 | 9.0 | 0.8 |
Correction values for other calibrators for M2230:
| Type | Correction Value | Calibration Frequency | Calibration Level |
| NTi Audio CAL200 0.1 kHz 114 dB | |||
| B&K 4231 0.2 kHz 114 dB | |||
| Norsonic Nor-1251 | 0.2 kHz 114 dB |
Specifications

Actuator Correction
The following freefield 0^ incidence corrections apply for calibration using an actuator:
| Nominal Frequency [Hz] | 1/2" Microphone M2230 (protection grid actuator) [dB] | 1/2" Microphone M2230 (B&K UA033, Gras RA0014) [dB] |
| <400 0.0 | ||
| 400 | -0.2 | |
| 500 | 0.0 | |
| 630 | -0.2 | |
| 800 | 0.0 | |
| 1000 | 0.0 | |
| 1250 | -0.1 | |
| 1600 | 0.2 | |
| 2000 | 0.2 | |
| 2500 | 0.3 | |
| 3150 | 0.8 | |
| 4000 | 1.0 | |
| 5000 | 1.6 | |
| 6300 | 2.4 | |
| 8000 | 3.6 | |
| 10000 | 4.8 | |
| 12500 | 6.5 | |
| 16000 | 9.3 | |
| 20000 | 11.7 |

Specifications
Specifications

Diffuse Field Correction Factors
A diffuse sound field is characterized by the sound arriving at the receiver from all directions with more or less equal probability. The M2230, M2211, M2215 and M4261 are free-field equalized measurement microphones. The default frequency response refers to a 0^ sound incidence. The diffuse-field frequency response is calculated by averaging the directional characteristics; this results in a reduction at the high frequencies. The individual third-octave band correction values for diffuse-field conditions are documented in the following table. The directional response of the M2230 is described in the appendix.
Example:
The sound pressure level in a diffuse sound field shall be determined. The display of the XL2 with the M2230 reads 80.0 dBA for the 20 kHz third-octave band.
- The diffuse sound level is now calculated from the sum of the XL2 measurement value and the correction value (80.0 dB + 8.7 dB = 88.7 dB).

This correction is not necessary using a diffuse field equalized measurement microphone.
| Nominal Frequency [Hz] | 1/2" Microphone M2230, M2211, M2215 [dB] | 1/4" Microphone M4261 [dB] |
| <63 | 0.0 | 0.0 |
| 63 | 0.0 | 0.0 |
| 80 | 0.0 | 0.0 |
| 100 | 0.0 | 0.0 |
| 125 | 0.0 | 0.0 |
| 160 | 0.0 | 0.0 |
| 200 | 0.0 | 0.0 |
| 250 | 0.1 | 0.0 |
| 315 | 0.1 | 0.0 |
| 400 | 0.1 | 0.0 |
| 500 | 0.1 | 0.1 |
| 630 | 0.1 | 0.1 |
| 800 | 0.2 | 0.1 |
| 1000 | 0.2 | 0.1 |
| 1250 | 0.3 | 0.1 |
| 1600 | 0.4 | 0.1 |
| 2000 | 0.5 | 0.1 |
| 2500 | 0.6 | 0.2 |
| 3150 | 0.8 | 0.2 |
| 4000 | 1.1 | 0.3 |
| 5000 | 1.4 | 0.5 |
| 6300 | 1.9 | 0.7 |
| 8000 | 2.5 | 1.0 |
| 10000 | 3.4 | 1.4 |
| 12500 | 4.6 | 1.9 |
| 16000 | 6.4 | 2.5 |
| 20000 | 8.7 | 3.2 |
M2230 Frequency Response for Free Field, Diffuse Field and Pressure
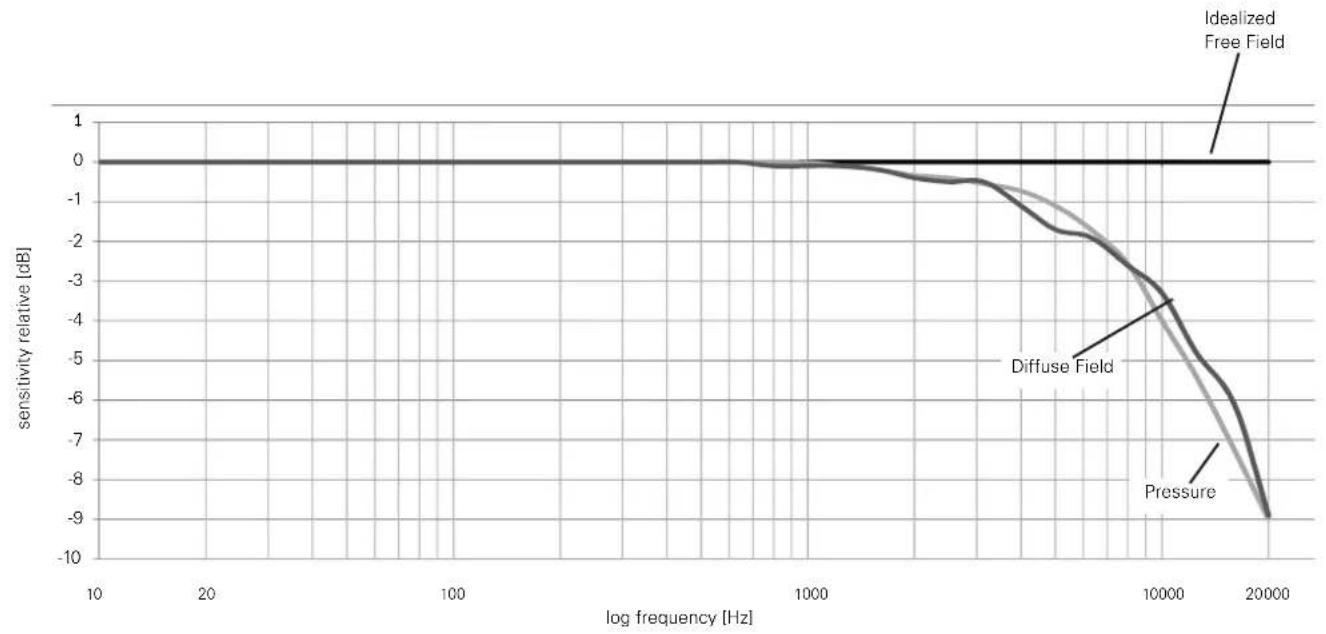
line
| log frequency [Hz] | Idealized Free Field | Diffuse Field | Pressure | | ------------------ | -------------------- | ------------- | -------- | | 10 | 0.0 | 0.0 | 0.0 | | 20 | 0.0 | 0.0 | 0.0 | | 100 | 0.0 | 0.0 | 0.0 | | 1000 | 0.0 | -0.5 | -0.5 | | 10000 | 0.0 | -3.5 | -4.5 | | 20000 | 0.0 | -9.0 | -9.0 |Specifications

Spectral Correction for horizontal Sound Incidents using the Outdoor Microphone
The outdoor microphone M2230-WP fulfills Class 1 requirements of IEC 61672 and ANSI S1.4 for vertical sound incidence. For compliance with horizontal sound incidence a spectral correction is employed in the associated XL2 Sound Level Meter.
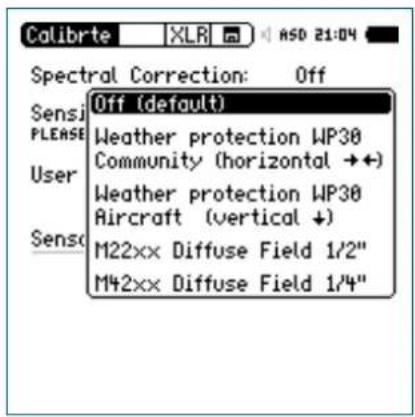
Select Calibrate Menu: Show Spec Correction in the System Settings. This will enable the spectral correction field in the Calibration menu.
| Nominal Frequency [Hz] | Spectral Correction for horizontal Sound Incidents with Firmware V4.20 or higher [dB] | |
| 1/3 Octave 1/1 Octave | ||
| <800 0.0 0.0 | ||
| 800 | 0.0 | 0.0 |
| 1000 | 0.0 | |
| 1250 | 0.1 | |
| 1600 | 0.1 | 0.4 |
| 2000 | 0.3 | |
| 2500 | 0.7 | |
| 3150 | 1.3 | 2.1 |
| 4000 | 2.0 | |
| 5000 | 2.6 | |
| 6300 | 2.7 | 3.3 |
| 8000 | 3.2 | |
| 10000 | 3.7 | |
| 12500 | 4.3 | 5.9 |
| 16000 | 6.1 | |
| 20000 | 6.4 | |

Specifications
25. Technical Data PreAmplifier
| MA220 PreAmplifier | |
| Microphone PreAmplifier Compatible with 1/2" microphone capsules type WS2F in accordance with IEC61094-4 | |
| Frequency Range 4 Hz - 100 kHz | |
| Residual Noise Floor typical | 1.6 μV(A) at C_in 18pF ≦ 12 dBA @ 20 mV/Pa |
| Frequency Response Flatness ±0.2 dB | |
| Phase Linearity < 1° @ 20 Hz - 20 kHz | |
| Maximum Output Voltage | 21 Vpp ≦ 7.4 Vrms ≦ 145 dBSPL @ 20 mV/Pa, THD 3%, 1 kHz |
| Electronic Data Sheet Containing user calibration dataDefault factory sensitivity = 4.9 V/Pa •Read/write by XL2 Audio and Acoustic Analyzer •NTi Audio ASD in accordance with IEEE P1451.4 V1.0, Class 2, Template 27 • | |
| Impedance Input: 20 GOhm // 0.26 pF, Output: 100 Ohm balanced | |
| Power Supply | 48 VDC phantom power, 2.3 mA typical |
| Attenuation | < 0.17 dB (Rphantom 2x 6.8 kOhm) |
| Connector | Balanced 3-pole XLR |
| Thread for Capsule | 60 UNS2 |
| Weight | 90 g, 3.17 oz |
| Dimensions | Length 142.5 mm (5.6"), diameter 20.5 mm (0.8") |
| Temperature Range | -10°C to +50°C (14°F to 122°F) |
| Humidity | 5% to 90% RH, non-condensing |
| NTi Audio # | 600 040 040 |
The product specifications may vary based on the mounted microphone capsule type.
Appendix

Appendix
Appendix 1: Standard - Optional Features
| Standard Features Optional | ||
| Sound Level Meter Frequency Weighting |  | - |
| Sound Level Meter Time weighting |    | Extended Acoustic Pack:•ImpulseSound Exposure LevelPercentile Sound Pressure Levels for wide band, 1/1 and 1/3 octave spectrum with flexible setting from 0.1% to 99.9%. |
| Sound Level Meter Correction |  | - |

Appendix
| Standard Features Optional | ||
| Sound Level Meter Parameter | Live max min Prev | Extended Acoustic Pack: •Clock-Impulse Maximum Level (Taktmaximalpegel) in accordance with DIN 45645-1:T3 T3eq T5 T5eqCalculated levels in accordance with DIN 45645-1:LAFT5eq-LAeqLAIeq-LAeqLCeq-LAeqImpulsiveness in accordance with BS4142:2014 and NordTest ACOU 112ImpPenaltyImpPen_max |
| Sound Level Meter RTA Spectrum Analyzer | supported Extended Acoustic Pack or Spectral Limits Option:•True peak level PK | |
Appendix

| Standard Features Optional | ||
| Sound Level MeterAudio Recording | Recording of wav-files •(ADPCM compression)Voice note recording• | Extended Acoustic Pack: •Recording of wav-files (24 bit, 48 kHz) |
| Sound Level MeterTriggered Event Recording | - | Extended Acoustic Pack: [Evt] |
| Sound Level MeterLogging | supported 100 ms logging• | RTA logging of Lmin and Lmax• |
| FFT AnalysisMeasurement Range |  | Extended Acoustic Pack or Spectral Limits Option:• |
| FFT + TolCapture and Tolerance | • Spectral Limits: | Capture and Tolerance functionality |
| RT60 | Octave band resolution | • Extended Acoustic Pack:1/3 octave band results |
| 1/12 Oct + Tol• Spectral Limits: | 1/12 Oct + TolCapture and Tolerance functionality |

Appendix
| Standard Features Optional | ||
| Noise Curves - Spectral Limits Option• | ||
| STIPA - STIPA Option with STIPA functionality • | ||
| Cinema Meter - Cinema Meter Option• | ||
| Querying measurement data online via the USB interface | - Remote Measurement Option supportingSound level meter and spectrum analyzer SLMeter/RTA•FFT analyzer•RT60 reverberation time•Audio analyzer RMS/THD+N•High resolution spectral analyzer 1/12 Oct + Tol• |
Appendix

Appendix 2: Factory Default Profiles
You may start up the XL2 with individual preset application profiles.
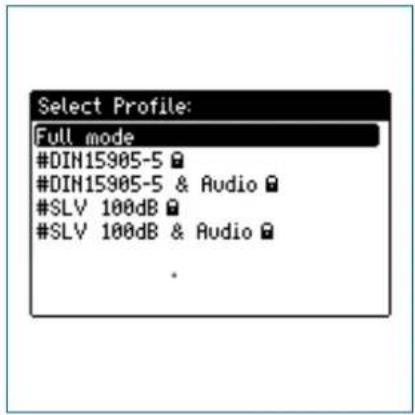
The profile Full mode is the default configuration with all available measurement functions enabled.

Appendix
DIN15905-5 / DIN15905-5 & Audio
(Sound Level Monitoring in accordance with DIN15905-5)
The following limits apply at all areas accessible by the visitors during the measurement period of 30 minutes:
Maximum averaged level = 99 dB •
The XL2 displays this maximum level with the measurement result L_Aeq+k1 .
Maximum peak level L_peak = 135 dB
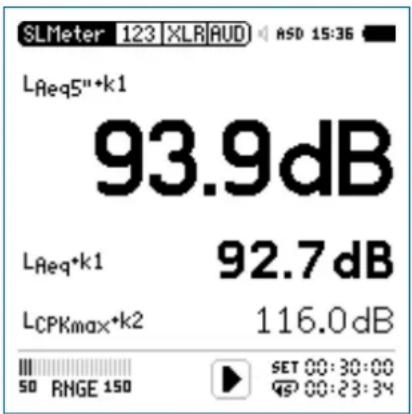
These levels are shown in the numeric result page:
L_Aeq5''+k1 Time-averaged sound pressure level L Aeq with correction value k1 and a moving time window of 5 seconds.
L_Aeq+k1 Time-averaged sound pressure level L with correction value k1.
L_Cpeak+k2 C-weighted peak level L Cpeak with correction value k2.
The following sound levels are displayed in the real-time analyzer page:
LZFhold3 For tracing of feedback frequencies. The peak hold time is set to 3 seconds.
L_ZFlive Actual real-time spectra.
Appendix

How to Measure
Select the page • SET with the rotary wheel
Measure the correction values k1 and k2 as described in the
chapter Sound Level Meter. Correction Value KSE.
Press the start button
- The icon LOG flashes during the ongoing measurement. In the case where the profile #DIN15905-5 & Audio has been selected the icon AUD flashes, indicating the additional audio wav-file logging.
During the measurement you can monitor the actual sound level L_Aeq5''+k1 in order to remain below the permitted limits; alternatively you may monitor the spectrum analyzer for tracing possible feedback frequencies.
Press stop ➤ to finish the measurement.

In accordance with DIN15905-5, all sound levels are measured, displayed and logged to the SD Card automatically. The settings are locked, which ensures that the correct parameters are measured.
The profile #DIN15905-5 & Audio includes the recording of Compressed+AGC wav-files.
Limits
This profile is configured with the following limits, which trigger the lights on the limit button and external Digital I/O Adapter.
This facilitates a quick response to sound levels that exceed these limits.
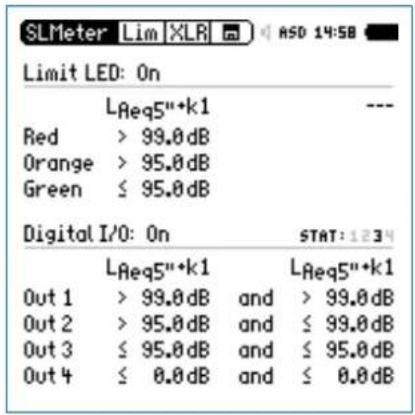
Measurement Results
You may import the log files into a report generator software based on MS Excel, providing automatically-completed live event reports with noise level charts. The report generator software is a free download on the support website at https://my.nti-audio.com for all registered XL2 customers.

Appendix
V-NISSG 100dB / V-NISSG 100dB&Audio
(Sound Level Monitoring in accordance with V-NISSG)
The following limits apply at all areas accessible by the visitors during the moving measurement period window of 60 minutes during the live event:
Maximum averaged level•
The XL2 displays this maximum level with the measurement result LAeq60'+k1.
| Type of live event | Max. level Requirements |
| 3 100 dB | - Sound level recording- Results to store for 30 days- Level warning to visitors- Hearing protection distributed- Chill out zone < 85 dB(A) |
| 2 96 dB | - Sound level monitoring- Level warning to visitors- Hearing protection distributed |
| 1 93 dB | - Sound level monitoring |
Maximum peak level L_AFmax = 125 dB
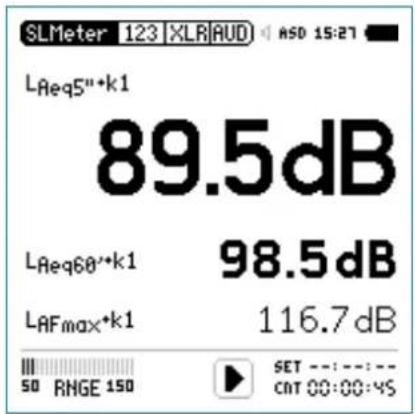
These levels are shown in the numeric result page:
L_Aeq5''+k1 Time-averaged sound pressure level L Aeq with correction value k1 and a moving time window of 5 seconds.
L_Aeq60 +k1 Time-averaged sound pressure level L Aeq with correction value k1 and a moving time window of 60 minutes.
L_AFmax+k1 Maximum sound pressure level L AFmax with correction value k1.
Appendix

The following sound levels are displayed in the real-time analyzer page:
LZFhold3
For tracing of feedback frequencies. The peak hold time is set to 3 seconds.
LZFlive
Actual real-time spectra.

In accordance with V-NISSG, all sound levels are measured, displayed and logged to SD Card automatically. The settings are locked, which ensures that the correct parameters are measured.
The profile #V-NISSG 100dB&Audio includes the recording of Compressed+AGC wav-files.
How to Measure
Select the page KSET with the rotary wheel ○.
Measure the correction value k1 as described in the chapter •
Sound Level Meter: Correction Value KeJ. (k2 is not required for V-NISSG)
Press the start button
- The icon LOG flashes during the ongoing measurement. In the case where the profile #V-NISSG 100dB&Audio has been selected the icon AUD flashes, indicating the additional audio wav-file logging.
During the measurement you can monitor the actual sound level L_Aeq5''+k1 in order to remain below the permitted limits; alternatively you may monitor the spectrum analyzer for tracing possible feedback frequencies.
Press stop ●■ to finish the measurement.

Appendix
Limits
This profile is configured with the following limits, which trigger the lights on the limit button and external Digital I/O Adapter. This facilitates a quick response to sound levels that exceed these limits.
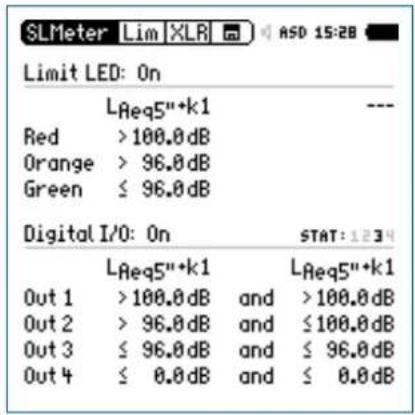
Measurement Results
You may import the log files into a report generator software based on MS Excel, providing automatically-completed live event reports with noise level charts. The report generator software is a free download on the support website at https://my.nti-audio.com for all registered XL2 customers.
Appendix 3: Description Sound Levels

A-Frequency Weighting Filter in accordance with IEC 61672
Applicable for most common sound pressure level measurements, compensating for human hearing perception at lower sound pressure levels.

C-Frequency Weighting Filter in accordance with IEC 61672
Applicable for very high sound pressure levels, compensating for human hearing perception at high sound pressure levels; typically used for measurement of peak values, e.g. LCpeak

Capture
This selection offers the reference curve, which has been previously stored with Capture in the spectrum analyzer of the SLMeter function.
Application example:
Comparing the performance of the left and right • speakers in a live event sound setup.
Appendix


Sound Exposure Level
The sound exposure level LAE characterizes the totalenergy content of a signal and corresponds to the LAeq normalized to one second. The sound exposure level is measured for example to compare noise events with different time durations. The LAE reports the amount of noise from an event such as an individual aircraft fly-over. An earlier used level name is SEL.
$$ \mathrm{LAE} = \mathrm{LAeq} + 1 0 \times \log (\text { time in seconds }) $$

Time-Average Sound Level or
Equivalent Continuous Sound Level in accordance with IEC 61672

Moving Time-Average Sound Level or Moving Equivalent Continuous Sound Level
With selectable time window from one second up to one hour, four individual levels can be configured. The moving time-average sound level is an Leq based on a moving time window. This level is also called "running Leq,T", "gliding Leq,T" or "sliding Leq,T".
The measurement result is updated every second for the first 60 seconds. Afterwards the update rate is every five seconds. This is an example:
10h 00min 00sec St art of XL2 measurement
10h 00min 05sec Leq5" = Leq of the 5 seconds
10h 00min 06sec Leq5" = Leq of the time window from 10h 00min 01sec to 10h 00min 06sec
10h 00min 07sec Leq5" = Leq of the time window from 10h 00min 02sec to 10h 00min 07sec

Appendix
Application example:
Display the moving Leq over 5 seconds in accordance with DIN15905
Measure the moving Leq over 60 minutes in accordance with V-NISSG

Fast Time Weighting
Time constant t = 125 ms; the time weighting is an exponential function of time, which defines how changes of the instantaneous sound pressure level are averaged for useful sound pressure level results. The measurement results are shown accurately for sound sources with a minimum length of 0.5 seconds. The decay rate is 34.7 dB/s. Fast time weighting is typically used for common sound level measurements.

Holding Maximum Level
For tracing of feedback frequencies in the RTA page. The hold time can be set to 3, 5 or 10 seconds.

Impulse Time Weighting
Time constant attack t = 35 ms; time constant decay t = 1500 ms; the time weighting is an exponential function of time, which defines how changes of the instantaneous sound pressure level are averaged for useful sound pressure level results. The measurement results are shown accurately for sound sources with a minimum length of 0.1 seconds. Impulse time weighting is used for impulsive sound sources.

Impulse Penalty ImpPenalty
Impulsive penalty in accordance with BS4142:2014 and NordTest ACOU 112. The LAF is sampled with a time interval of 12 ms. The penalty is calculated as follows:
Penalty KI= 1.8 * (Prominence P - 5) for P > 5 P=3*lg(onset rate[dBs]) + 2*lg(level difference[dB])
The Prominence P is designed to give a maximum around 15; concluding the maximum impulse penalty is 18 dB.
Appendix


Correction Value k1
The correction value k1 is based on an LAeq measurement. It is measured or manually set in the page KSET of the sound level meter function.

Correction Value k2
The correction value k2 is based on either LCeq or LCpeak measurement. It is measured or manually set in the page KSET of the sound level meter function.

Parameter live
Actual current sound pressure level.

Parameter max
Maximum sound level of the measurement cycle.

Parameter min
Minimum sound level of the measurement cycle.

Correction Value off
No correction value, default setting.

Peak Level
Application example:
Measure LCpeak in accordance with DIN15905
The RTA spectrum analyzer measures the true peak level with the optional Extended Acoustic Pack. The peak hold time can be set to 0, 1 or 5 seconds.

Percentile Sound Level - Level Statistics
The statistical distribution of sound pressure levels is commonly used for environmental noise analysis, such as road traffic or community noise assessments. For example L_AFxx% is the noise level exceeded during xx% of the measurement period; e.g., LAF90% is the noise level exceeded during 90% of the measurement period.
Please see the specifications at chapter[Technical Data XL2: Functions of Extended Acoustic Pack [optional] in this manual.

Previous Level
Applicable for timer mode Repeat or Repeat Synchronized; displays the selected sound pressure level of the last measurement cycle.

Appendix

Slow Time Weighting
Time constant t = 1 second; the time-weighting is an exponential function of time, which defines how changes of the instantaneous sound pressure level are averaged for useful sound level results. The decay rate is 4.3 dB/s.

Parameter T3
Clock-Impulse Maximum Level (Taktmaximalpegel) LAFT3 in accordance with DIN 45645-1. Maximum sound pressure level measured with frequency weighting A and time weighting F within a time interval of 3 seconds.

Parameter T3eq
Time-average Clock-Impulse Maximum Level (Taktmaximalpegel) LAFT3eq in accordance with DIN 45645-1.

Parameter T5
Clock-Impulse Maximum Level (Taktmaximalpegel) LAFT5 in accordance with DIN 45645-1. Maximum sound pressure level measured with frequency weighting A and time weighting F within a time interval of 5 seconds.

Parameter T5eq
Time-average Clock-Impulse Maximum Level (Taktmaximalpegel) LAFT5eq in accordance with DIN 45645-1.

Inverted X-Curve
In the film and recording industry an X curve is also known as a wide-range curve, e.g., used for cinema installations conforming to SMPTE ST 202:2010 or ISO 2969:2015 @ 500 seats.

Z-frequency weighting in accordance with IEC 61672 (= flat frequency response, no filter)
Overall sound pressure level, all sound signal components are included; required for special applications.
Appendix

Appendix 4: Common Sound Levels
| Display Application Setting | ||
| L_AE | Sound Exposure LevelThe sound exposure level L_AE characterizes the totalenergy content of a signal and corresponds to the LAeq normalized to one second. The sound exposure level is measured for example to compare noise events with different time durations. The L_AE reports the amount of noise from an event such as an individual aircraft fly-over. An earlier used level name is SEL. L_AE = L_Aeq + 10 × (time in seconds) |  |
| L_Aeq | Time-Average Sound Level orEquivalent Continuous Sound LevelAveraged sound level over time with A frequency weighting. |  |
| L_Aeq dt | Level LAeq_dt "delta t" in reportLevel of the preset logging interval in the LOG-menu; e.g. Logging interval = 1 second, then LAeq_dt is the time averaged level of the past 1 second. | |

Appendix
| L_Aeq + k1 Time-Average Sound Level with Correction ValueThe actual measurement position often differs to the loudest position of the live event. Thus the correction value k1 is the correction value of L_Aeq between the loudest position and the actual measurement position, measured using pink noise. The correction value k1 is measured or manually set in the page KSET of the sound level meter function. | [IMAGE] |
| L_Aeqxx Moving Time-Average Sound LevelMeasurement of the moving sound level over time Leq with A-weighting frequency and F-weighting time responses; the parameter xx is user-defined from one second up to one hour. This level is also called “running Leq,T”, “gliding Leq,T” or “sliding Leq,T”.Four individual levels can be configured, e.g.5 seconds for live sound monitoring•10 minutes (in accordance with the French standard)•15 minutes (in accordance with the British standard)•60 minutes (in accordance with V-NISSG)• | [IMAGE] |
Appendix

| L_Aeq60' +k1 Moving Time-Average Sound Level with Correction Value k1The actual measurement position often differs to the loudest position of the live event. Thus the correction value k1 is the correction value of L_Aeq60'M between the loudest position and the actual measurement position, measured using pink noise. The correction value k1 is measured or manually set in the page KSET of the sound level meter function.Application: Measurements in accordance with V-NISSG |  |
| L_AF Actual Sound Pressure LevelSPL with A frequency weighting and F time weighting, compensating for human hearing perception at lower sound pressure levels; applicable at levels lower than 100 dB. |  |
| L_AFmax Maximum Sound Pressure LevelMeasures the maximum environmental noise level during the measurement period. |  |
| L_AFmax dt Maximum Sound Pressure Level “delta t” in reportMaximum level of the preset logging interval in the LOG-menu, e.g. 1 second. | |
| L_AFmin Minimum Sound Pressure LevelMeasures the minimum environmental noise level during the measurement period. |  |

Appendix
| L_AFmin dt Minimum Sound Pressure Level “delta t” in reportMinimum level of the preset logging interval in the LOG-menu, e.g. 1 second. | |
| L_AFxx% Percentile Sound LevelThe statistical distribution of sound pressure levels is commonly used for environmental noise analysis, such as road traffic or community noise assessments. For example A_Fxx% is the noise level exceeded during xx% of the measurement period; e.g., L_AF90% is the noise level exceeded during 90% of the measurement period.Please see the specifications at chapter[Technical Data XL2: Functions of Extended Acoustic Pack (optional)] in this manual. |  |
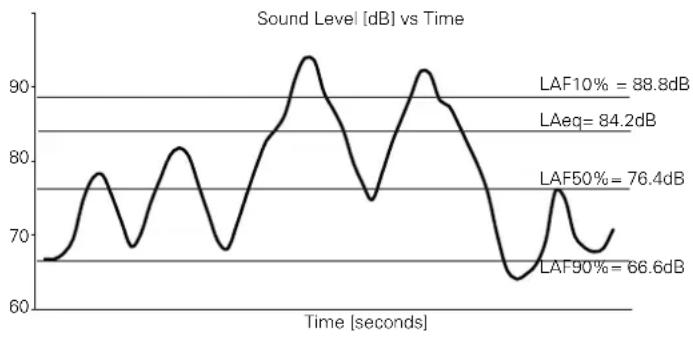 | |
Appendix

| L_Ceq | Time-Average Sound Level orEquivalent Continuous Sound LevelAveraged sound level over time with C frequency weighting. |  |
| L_Cpeak | Peak Sound Pressure LevelSound pressure level with C frequency weighting and peak time weighting. Measures the peak level. High peak levels can damage the human hearing. |  |
| L_Cpeak max | Maximum Peak Sound Pressure LevelMaximum sound pressure level with C frequency weighting and peak time weighting. Measures the peak level. High peak levels can damage the human hearing. |  |
| L_Cpeak max dt | Maximum Peak Sound Pressure Level „delta t” in reportMaximum peak sound pressure level with C frequency weighting of the preset logging interval in the LOG-menu, e.g. 1 second. | |
| L_Cpeak+ k2 Peak | Sound Pressure Level with Correction ValueThe actual measurement position often differs to the loudest position of the live event. Thus the correction value k2 is the correction value of L_Cpeak between the loudest position and the actual measurement position, measured using pink noise. The correction value k2 is measured or manually set in the page KSET of the sound level meter function. |  |

Appendix
| L_EX | Noise Exposure Level LEXThe Noise at Work Directive 2003/10/EC lays down minimum requirements for the protection of workers from risks to their health and safety arising or likely to arise from exposure to noise and in particular the risk to hearing.Steady noise L_EX,8h = L_Aeq : (applies to L_AS , deviation < 5 dB) L_Aeq measured over a short time equals L_EX,8h ; the following formula applies for a measurement period < 8 hours: L_EX,8h = L_Aeq + 10 × (T/8 hours) Steady noise with stepped level variations:Measure L_Aeq at the different levels and enter the data with the corresponding exposure time in the NTi Audio noise exposure level post-processing form; the L_EX,8h will be calculated and displayed.Varying noise levels:• L_EX,8h = L_Aeq measured for 8 hoursThe exposure limit values and respective actions are: | [IMAGE] | |||
| L_EX,8h | L_Cpeak | Action | |||
| Lower limit value | 80 dB(A) 135 | dB The em | ployer shall make individual hearing protectors available to workers | ||
| Upper limit value | 85 dB(A) 137 | dB Hearing | protectors shall be used | ||
| Exposure limit 87 | dB(A) 140 dB | The attenu | ation characteristics of the hearing protectors worn must adequately reduce the levels below this limit | ||
Appendix

Appendix 5: Vibration Meter Functions

Acceleration a
in units m/s2, g, in/s2, dB

Velocity v
in units m/s, in/s, dB

Displacement
in units m, in, dB

RMS level
Measurement result is based on RMS

Peak level
Measurement result is based on peak level

Peak-peak Level
Measurement result is based on peak-peak level

Moving Time-Average Level or
Moving Equivalent Continuous Level
with selectable time window 1, 2, 4 or 8 seconds.
2000 dt 07.18

Clock-Impulse Maximum Level
(Taktmaximalpegel)
Maximum velocity during a periodic 30 seconds interval with time weighting F in accordance with DIN 4150-2.
Peak Particle Velocity PPV
Ground or blast vibration amplitude is often measured as particle velocity or the speed at which a particle vibrates. This is quantified as peak particle velocity PPV in the units [mm/s] or [in/s].
Select the level type vel Pk on the XL2 to measure the actual PPV and vel Pkmax for the maximum PPV during the measurement period.

Appendix
Details IEC 61672 & IEC 61260
The XL2-TA Analyzer, with the M2230 measurement microphone, fully complies with the standards IEC 61672:2013, IEC 61672:2003, IEC 61260:2014 and IEC 61260:2003 as an integrating class 1 Sound Level Meter with A, C, Z frequency weighting and fast/slow time weighting. The impulse time weighting is optionally available with the Extended Acoustic Package.
The type approval applies to the sound level meter in accordance with IEC 61672 and the Octave/Third-Octave measurement in accordance with IEC 61260. Attention should be given to the following recommendations on the environment and the configuration.
Environment
Persons and objects that are located in the sound field during the measurement have an absorbing, reflecting or shielding impact on the sound field and may therefore compromise the measurement result. Consequently, such objects should be removed from the sound field where appropriate. The measurement microphone should be mounted on a tripod. The operator should remain as far away as possible behind the microphone during the measurement.
Configuration "Microphone Detached"
XL2-TA Sound Level Meter •
- Hardware version: D2 and E0
- Firmware version 4.21
M2230 Measurement Microphone, consisting of
- Microphone Preamplifier MA220
- Microphone Capsule MC230 or MC230A
ASD Cable, 5 meter or 10 meter or 20 meter
Class 1 Sound Calibrator CAL200 • Optional •
- Optional: Extended Acoustic Pack
- NTi Audio Mains Power Adapter Exel Line
- NTi Audio Microphone Clamp MH01
- NTi Audio Windscreen, 50 mm
- NTi Audio Windscreen, 90 mm
- XL2 Input Keypad
With the microphone connected by the ASD Cable, the analyzer can be held in your hand during the measurement. This offers the convenience of watching the measurement values as they occur.
Appendix

Configuration "Microphone Attached"
XL2-TA Sound Level Meter •
- Hardware version: D2 and E0
- Firmware version 4.21
- Shroud MXA01
M2230 Measurement Microphone, consisting of
- Microphone Preamplifier MA220
- Microphone Capsule MC230 or MC230A
Class 1 Sound Calibrator CAL200•
Optional•
- Optional: Extended Acoustic Pack
- NTi Audio Mains Power Adapter Exel Line
- NTi Audio Windscreen, 50 mm
- NTi Audio Windscreen, 90 mm
- XL2 Input Keypad
Configuration "Outdoor Microphone Detached"
XL2-TA Sound Level Meter •
- Hardware version: D2 and E0
- Firmware version 4.21
- Shroud MXA01
M2230 Measurement Microphone, consisting of
- Microphone Preamplifier MA220
- Microphone Capsule MC230 or MC230A
Weather Protection WP30 with bird spike BS01•
ASD Cable, 5 meter or 10 meter or 20 meter
Class 1 Sound Calibrator CAL200•
Optional•
- Optional: Extended Acoustic Pack
- NTi Audio Mains Power Adapter Exel Line
- XL2 Input Keypad
- Dry Adapter MTG TA202 with Housing Extension WP30-X

There are no correction values required for these configurations.

There are no correction values required for the configuration "Outdoor Microphone Detached" at vertical noise incidents.
- Activate the corresponding correction in the Calibration menu for "Outdoor Microphone Detached" at horizontal noise incidents.

Appendix
General Information
Reference Sound Pressure Level
The reference sound pressure level is 114 dBSPL relative to 20 Pa.
Reference Level Range
The reference level range is MID, 20 - 120 dBSPL
Reference Orientation
The microphone reference point is located in the middle of the microphone membrane. The 0^ reference orientation and the orientation of the membrane's surface normal is identical.
Verified Frequency Range
20 Hz to 20 kHz
Greatest Peak-To-Peak Voltage at the Electric Input
(Refer IEC61672-1 paragraphs 5.1.16, 9.3.i)
The highest sound pressure level at the M2230 microphone with a sensitivity of S = 42 mV/Pa is 143.5 dB.
Initial Time Interval after Power On (IEC61672-1, 5.1.18)
The XL2-TA Sound Level Meter and M2230 microphone meet the given specifications for the electro-acoustical response after an initial time interval of no more than one minute following switching on the power. This assumes that the devices have been allowed to reach equilibrium with the prevailing ambient environment before switching on the power.
Insertion of Electrical Signals
(Refer IEC61672-1 paragraphs 5.1.15, 9.3g)
The capsule replacement NTI-K65-15 can be used to insert electrical signals to the preamplifier MA220. The device provides at one side a contact that corresponds to the center contact of the replaced microphone capsule, at the other side a BNC-plug for the electrical signals. The impedance at the output of the device is 15 pF with a maximum deviation of ± 1 pF. The electrical noise floor is measured by shorting the contacts of the BNC plug. Before the NTI-K65-15 can be mounted to the preamplifier MA220, the microphone capsule must first be detached. The nominal sensitivity S of the capsule is S = 42 mV/Pa. Measurements with the NTI-K65-15 therefore require that the sensitivity in the calibration menu is manually adjusted to S = 42 mV/Pa.
The maximum electrical input voltage is 36 Vpp. The attenuation between the device and the XLR input of the XL2-TA is 0.78 dB at a reference frequency of 1 kHz. A 1 kHz signal with 459 mVrms level is required at the input of the device, to substitute the signal of a microphone capsule with the sensitivity 42 mV/Pa at a reference level of 114 dBSPL.
Appendix

Output (Refer IEC61672-1 paragraphs 5.16.1, 9.2.5p)
The instrument provides no electrical analog or digital outputs for measurements.
Typical Time Interval Needed to Stabilize after Changes in Environmental Conditions (IEC61672-1, 6.1.2, 9.3I)
Recommended time interval for stabilizing the sound level meter after changes in environmental conditions, prior to performing any measurements:
| Change in the environmental condition Time Interval | ||
| Temperature ±5 | °C 15 minutes | |
| Temperature ±20 | °C 30 minutes | |
| Air pressure ±5 | kPa 15 seconds | |
| Humidity ±30% | 15 minutes | |
The time intervals apply, for instance, after moving from a cold into a warm room, and assume that combinations of air temperature and relative humidity do not yield a dew point greater than +39 °C or less than -15 °C.
No Limit on Operational Environment
(Refer IEC61672-1 paragraphs 6.3.2, 9.2.7a)
There are no restrictions in place for parts or components, which would limit the operational environment.
Exposure to Electrostatic Discharges
(Refer IEC61672-1 paragraphs 6.5.2, 9.2.7b)
Heavy electrostatic discharges directly to the instrument's connector or keyboard may interrupt the operation. The XL2-TA either switches off or freezes at the last valid measurement value. In such a case re-start the instrument. If the data logging had been active prior the interrupt, the log file may contain a gap. However, the acquired results can be identified correctly as each one is saved together with its own individual time stamp.
Exposure to AC Power and Radio Frequency Fields
(Refer IEC61672-1 paragraphs 6.6.1, 9.2.7c)
The sound level meter complies with the requirements of the standard IEC61672-1:2003 regarding immunity against high frequency fields or mains power fields from 50 to 60 Hz.

Appendix
Impact of Electromagnetic Fields
If the device is exposed to electromagnetic fields of 10 V/m, the measurement of sound levels below 74 dB is not specified. If the electromagnetic fields exceed 10 V/m, the exposed instrument is not specified in any level range.
Susceptibility to AC Power and Radio Frequency Fields
(Refer IEC61672-1 paragraphs 6.6.3, 9.3o)
The device has the greatest susceptibility to AC power frequency fields, if the direction of the magnetic field is the same as the orientation of the microphone axis.
The device has the greatest susceptibility to radio frequency fields, if the surface normal of the display and the direction of the incoming radio frequency field are parallel to each other.
Measuring Low-Level Sound Fields
(Refer IEC61672-1 paragraphs 5.6.5, 9.2.5d)
If the sound level is very low, the measurement result is affected by the noise floor of the sound level meter. The specified configuration complies with class 1 within the given linear measuring range.
Influence of the ASD Cable
(Refer IEC61672-1 paragraphs 7.1, 9.2.6b)
i-The ASD Cable serves as connection cable between the XL2-TA sound level meter and the microphone in the detached configuration. There are no correction values required for this configuration.
Influence of Mechanical Vibrations
Mechanical vibrations with 1 m/s acceleration perpendicular to the membrane of the microphone, will raise the lower limit of the linear operating range to 71 dB (A-weighted) for the frequencies 31.5 Hz, 63 Hz, 125 Hz, 250 Hz, 500 Hz, 630 Hz, 800 Hz and 1000 Hz.
Mechanical vibrations with 1 m/8 acceleration parallel to the membrane of the microphone, will raise the lower limit of the linear operating range to 68 dB (A-weighted) for the frequencies 31,5 Hz, 63 Hz, 125 Hz, 250 Hz, 500 Hz, 630 Hz, 800 Hz and 1000 Hz.
Modes of Operation and Accessories
The greatest susceptibility to radio frequency fields is independent of operation mode or connected accessories.
Appendix

Class 1 Sound Calibrator
(Refer IEC61672-1 paragraphs 5.2.1, 5.2.7, 9.3d)
If an obligatory calibration is required for the sound level meter, in accordance with the type approval, then the Class 1 Sound Calibrator CAL200 should be used.
Technical Details
Type: Larson Davis CAL200•
Level correction: -0.1 dB
Calibration frequency: 1 kHz (= reference frequency)
Calibration level: 114 dB (= reference sound pressure level)
Details for Calibration
The calibration has to be executed according to the instructions given in chapter "Calibration". Ensure that the calibrator is set to 114 dB.
Add the free-field correction values to the reference sound pressure level, and enter the result into the XL2-TA under "Calibration Level".

Appendix
Level Linearity
(Refer IEC61672-1 paragraphs 5.5.3, 5.5.9, 9.2.2e, 9.3e, 9.3f). All values refer to Sref = 42 mV/Pa*. The starting levels for the level linearity tests are listed in the following tables:
Level range: Low
| [dB] | Frequency | |||||||
| L_AT^* | L_CT^* | L_ZT^* | L_AeqT^* | |||||
| 31,5 Hz | from to starting | 24 94 | from 88 starting | 27 105 94 | from to starting | 30 108 94 | from to starting | 24 68 starting |
| 1 kHz | from to starting | 24 10 94 | from 80 starting | 27 108 94 | from to starting | 30 108 94 | from to starting | 24 10 94 |
| 4 kHz | from to starting | 24 10 94 | from 80 starting | 27 108 94 | from to starting | 30 108 94 | from to starting | 24 10 94 |
| 8 kHz | from to starting | 24 10 94 | from 80 starting | 27 108 94 | from to starting | 30 108 94 | from to starting | 24 10 94 |
| 12,5 kHz | from to starting | 24 10 94 | from to starting | 27 108 94 | from to starting | 30 108 94 | from to starting | 24 10 94 |
Level range: Mid
| [dB] | Frequency | |||||||
| L_AT^* | L_CT^* | L_ZT^* | L_AeqT^* | L_AE^* (t_int=10s) | L_Cpeak^* | |||
| 31,5Hz | from to starting | 31 114 | from 86 starting | 32 123 114 | from to starting | 33 126 114 | from 86 starting | 41 96 124 |
| 1 kHz | from to starting | 31 126 114 | from 126 to starting | 32 126 114 | from to starting | 35 126 114 | from 126 to starting | 41 136 124 |
| 4 kHz | from to starting | 31 127 114 | from 127 to starting | 32 125 114 | from to starting | 35 126 114 | from 127 to starting | 41 137 124 |
| 8 kHz | from to starting | 31 127 114 | from 127 to starting | 32 123 114 | from to starting | 35 126 114 | from 127 to starting | 41 135 124 |
| 12,5kHz | from to starting | 31 127 114 | from 127 to starting | 32 120 114 | from 126 114 | 35 126 114 | from 127 to starting | 41 132 124 |
* If the sensitivity Sx deviates from the given data, a correction value of 20(Sref/Sx) has to be added. Example: Sx = 45 mV/Pa -> correction value = 20(42/45) = -0.6 dB
Appendix

Level range: High
| [dB] | Frequency | |||||||
| L_AT^* | L_CT^* | L_ZT^* | L_AeqT^* | L_AE^* (t_int=10s) | L_Cpeak^* | |||
| 31,5Hz | from to starting | 5398114 | from 5113114 | from to starting | 5613114 | from to starting | 5398114 | from 63108124 |
| 1 kHz | from to starting | 5313114 | from 5113114 | from to starting | 5613114 | from to starting | 5313114 | from 63140124 |
| 4 kHz | from to starting | 5313114 | from 5113114 | from to starting | 5613114 | from to starting | 5313114 | from 63148124 |
| 8 kHz | from to starting | 5313114 | from 5113114 | from to starting | 5613114 | from to starting | 5313114 | from 63146124 |
| 12,5kHz | from to starting | 5313114 | from 5113114 | from to starting | 5613114 | from to starting | 5313114 | from 63143124 |
Sound pressure levels, which continuously exceed the specified linear measurement range and overload the microphone preamplifier, may cause in extreme cases a displayed level below the actual sound pressure level.

Appendix
Level Linearity of Octaveband-Spectrum
in accordance with IEC 61260.
All values refer to Sref = 42 mV/Pa*.
| Nominal Frequency Hz | Level Range | ||
| LOW MID HIGH | |||
| 20 24-106 dB | 24-125 dB | 40-134 dB | |
| 31.5 24-106 dB | 24-125 dB | 40-134 dB | |
| 63 24-106 dB | 24-125 dB | 40-134 dB | |
| 125 24-106 dB | 24-125 dB | 40-134 dB | |
| 250 24-106 dB | 24-125 dB | 40-134 dB | |
| 500 24-106 dB | 24-125 dB | 40-134 dB | |
| 1000 24-106 dB | 24-125 dB | 40-134 dB | |
| 2000 24-106 dB | 24-125 dB | 40-134 dB | |
| 4000 24-106 dB | 24-125 dB | 48-134 dB | |
| 8000 24-106 dB | 24-125 dB | 48-134 dB | |
| 16000 24-106 dB | 24-125 dB | 48-134 dB | |
The sampling rate of the filters is 48 kHz.
* If the sensitivity Sx deviates from the given data, a correction value of 20*log(Sref/Sx) has to be added.
Example: Sx = 45 mV/Pa -> correction value = 20*log(42/45) = -0.6 dB
Appendix

Level Linearity of Third-Octaveband-Spectrum
in accordance with IEC 61260.
All values refer to Sref = 42 mV/Pa*.
| Nominal Frequency Hz | Level Range | ||
| LOW MID HIGH | |||
| 20 24-106 dB | 24-125 dB | 40-134 dB | |
| 25 | 24-106 dB | 24-125 dB | 40-134 dB |
| 31.5 | 24-106 dB | 24-125 dB | 40-134 dB |
| 40 | 24-106 dB | 24-125 dB | 40-134 dB |
| 50 | 24-106 dB | 24-125 dB | 40-134 dB |
| 63 | 24-106 dB | 24-125 dB | 40-134 dB |
| 80 | 24-106 dB | 24-125 dB | 40-134 dB |
| 100 | 24-106 dB | 24-125 dB | 40-134 dB |
| 125 | 24-106 dB | 24-125 dB | 40-134 dB |
| 160 | 24-106 dB | 24-125 dB | 40-134 dB |
| 200 | 24-106 dB | 24-125 dB | 40-134 dB |
| 250 | 24-106 dB | 24-125 dB | 40-134 dB |
| 315 | 24-106 dB | 24-125 dB | 40-134 dB |
| 400 | 24-106 dB | 24-125 dB | 40-134 dB |
| 500 | 24-106 dB | 24-125 dB | 40-134 dB |
| 630 | 24-106 dB | 24-125 dB | 40-134 dB |
| 800 | 24-106 dB | 24-125 dB | 40-134 dB |
| 1000 | 24-106 dB | 24-125 dB | 40-134 dB |
| 1250 | 24-106 dB | 24-125 dB | 40-134 dB |
* If the sensitivity Sx deviates from the given data, a correction value of 20*log(Sref/Sx) has to be added.
Example: Sx = 45 mV/Pa -> correction value = 20*log(42/45) = -0.6 dB
| Nominal Frequency Hz | Level Range | ||
| LOW MID HIGH | |||
| 1600 | 24-106 dB | 24-125 dB | 40-134 dB |
| 2000 | 24-106 dB | 24-125 dB | 40-134 dB |
| 2500 | 24-106 dB | 24-125 dB | 40-134 dB |
| 3150 | 24-106 dB | 24-125 dB | 40-134 dB |
| 4000 | 24-106 dB | 24-125 dB | 40-134 dB |
| 5000 | 24-106 dB | 24-125 dB | 46-134 dB |
| 6300 | 24-106 dB | 24-125 dB | 46-134 dB |
| 8000 | 24-106 dB | 24-125 dB | 46-134 dB |
| 10000 | 24-106 dB | 24-125 dB | 46-134 dB |
| 12500 | 24-106 dB | 24-125 dB | 46-134 dB |
| 16000 | 24-106 dB | 24-125 dB | 46-134 dB |
| 20000 | 24-106 dB | 24-125 dB | 46-134 dB |
The sampling rate of the filters is 48 kHz.

Appendix
Self-generated Noise with Microphone
(Refer IEC61672-1 paragraphs 5.6.1 to 5.6.4, 9.2.5o)
Self-generated noise with electrical input device @ S = 42 mV/Pa
| Frequency-weighting | Level range [dB] | ||
| low mid high | |||
| Z 22 23 46 | |||
| A 11 19 43 | |||
| C 14 18 42 | |||
Self-generated noise with M2230 microphone @ S = 42 mV/Pa
| Frequency-weighting | Level range [dB] | ||
| low mid high | |||
| Z | 23 25 46 | ||
| A | 17 21 43 | ||
| C | 20 22 42 | ||
The averaging time is 30 seconds for all measurements.
Appendix


Appendix
Frequency Response Corrections at 250 - 20000 Hz
(Refer IEC61672-1 paragraphs 5.2.4, 5.2.5, 5.2.6 und 9.2.4d)
Corrections below 250 Hz are 0.0 dB. No corrections apply for the typical effects of reflections from the case of the sound level meter and diffraction of sound around the microphone.
The listed uncertainty applies for all here listed measurements and corrections. Its calculated for a level of confidence of 95% with a coverage factor k=2. It represents the maximum permitted expanded uncertainty in accordance with IEC 62585.
| Nominal Frequency | Actual Frequency | 0° Free-field Frequency Response | 0° Free-field Correction | Impact of 50 mm Wind Screen | 0° Free-field Correction with Wind Screen | Impact of 90 mm Wind Screen | Measurement Uncertainty |
| Hz Hz dB dB dB dB dB | |||||||
| 250 251.19 | 0.0 0.0 0.0 0.0 | 0 0,0 0.20 | |||||
| 315 316.23 | -0.1 | 0.1 0.0 0.1 0,0 0.20 | |||||
| 400 | 398.11 0.0 | 0.0 0.0 0.0 0,1 0.20 | |||||
| 500 | 501.19 0.0 | 0.0 0.0 0.0 0,1 0.20 | |||||
| 630 | 630.96 | 0.1 | -0.1 | 0.0 | -0.1 | 0,1 | 0.20 |
| 800 | 794.33 0.0 | 0.0 0.0 0.0 0,2 0.20 | |||||
| 1000 | 1000.00 0.0 | 0.0 0.0 0.0 0,2 0.20 | |||||
| 1060 | 1059.25 0.0 | 0.0 0.0 0.0 0,2 0.20 | |||||
| 1120 | 1122.02 0.0 | 0.0 0.1 | -0.1 | 0,2 0.20 | |||
| 1180 | 1188.50 | 0.1 | -0.1 | 0.1 | -0.2 | 0,2 | 0.20 |
| 1250 | 1258.93 | 0.1 | -0.1 | 0.1 | -0.2 | 0,2 | 0.20 |
| 1320 | 1333.52 | 0.1 | -0.1 | 0.1 | -0.2 | 0,2 | 0.20 |
| 1400 | 1412.54 | 0.1 | -0.1 | 0.1 | -0.2 | 0,2 | 0.20 |
Appendix

| Nominal Frequency | Actual Frequency | 0° Free-field Frequency Response | 0° Free-field Correction | Impact of 50 mm Wind Screen | 0° Free-field Correction with Wind Screen | Impact of 90 mm Wind Screen | Measurement Uncertainty |
| 1500 149 | 6.24 0.1 -0.1 0.1 | -0.2 0,3 0.20 | |||||
| 1600 158 | 4.89 0.0 0.0 0.1 | -0.2 0,3 0.20 | |||||
| 1700 167 | 8.80 0.0 0.0 0.1 | -0.1 0,3 0.20 | |||||
| 1800 177 | 8.28 -0.1 0.1 0.1 | -0.1 0,3 0.20 | |||||
| 1900 188 | 3.65 -0.1 0.1 0.2 | -0.1 0,3 0.20 | |||||
| 2000 199 | 5.26 -0.2 0.2 0.2 | 0.0 0,3 0.20 | |||||
| 2120 211 | 3.49 0.0 0.0 0.2 | -0.2 0,3 0.20 | |||||
| 2240 223 | 8.72 0.3 -0.3 0.2 | -0.5 0,3 0.20 | |||||
| 2360 237 | 1.37 0.1 -0.1 0.3 | -0.3 0,3 0.20 | |||||
| 2500 | 2511.89 0.0 | 0.0 0.3 -0.3 0,2 0.20 | |||||
| 2650 266 | 0.73 -0.2 0.2 0.3 | -0.1 0,1 0.20 | |||||
| 2800 281 | 8.38 -0.2 0.2 0.3 | -0.2 0,1 0.20 | |||||
| 3000 298 | 5.38 0.2 -0.2 0.4 | -0.6 0,0 0.20 | |||||
| 3150 316 | 2.28 0.3 -0.3 0.4 | -0.7 | -0,1 | 0.20 | |||
| 3350 334 | 9.65 0.4 -0.4 0.4 | -0.8 | -0,2 | 0.20 | |||
| 3550 354 | 8.13 -0.1 0.1 0.5 | -0.4 | -0,2 | 0.20 | |||
| 3750 375 | 8.37 -0.3 0.3 0.5 | -0.2 | -0,2 | 0.20 | |||
| 4000 398 | 1.07 -0.1 0.1 0.5 | -0.5 | -0,2 | 0.20 | |||
| 4250 421 | 6.97 0.2 -0.2 0.6 | -0.8 | -0,1 | 0.30 | |||
| 4500 446 | 6.84 0.3 -0.3 0.6 | -0.8 | -0,1 | 0.30 | |||
| 4750 473 | 1.51 -0.2 0.2 0.6 | -0.3 | -0,1 | 0.30 | |||
| 5000 | 5011.87 | -0.4 | 0.4 | 0.6 | -0.2 | -0,1 | 0.30 |
| 5300 530 | 8.84 0.3 -0.3 0.5 | -0.9 | -0,2 | 0.30 |

Appendix
| Nominal Frequency | Actual Frequency | 0° Free-field Frequency Response | 0° Free-field Correction | Impact of 50 mm Wind Screen | 0° Free-field Correction with Wind Screen | Impact of 90 mm Wind Screen | Measurement Uncertainty |
| 5600 5623 | 3.41 0.3 -0.3 0.5 | -0.8 -0,3 0.30 | |||||
| 6000 5956 | 6.62 -0.4 0.4 0.4 | 0.0 -0,4 0.30 | |||||
| 6300 6309 | 9.57 -0.1 0.1 0.3 | -0.3 -0,4 0.30 | |||||
| 6700 6683 | 4.44 0.4 -0.4 0.3 | -0.7 -0,4 0.30 | |||||
| 7100 7079 | 9.46 -0.6 0.6 0.2 | 0.4 -0,3 0.30 | |||||
| 7500 7498 | 9.94 0.1 -0.1 0.1 | -0.3 -0,3 0.30 | |||||
| 8000 7948 | 8.28 0.1 -0.1 0.1 | -0.2 -0,3 0.30 | |||||
| 8500 8413 | 9.95 -0.6 0.6 0.1 | 0.5 -0,4 0.45 | |||||
| 9000 8912 | 5.51 0.4 -0.4 0.1 | -0.5 -0,5 0.45 | |||||
| 9500 9440 | 6.61 -0.7 0.7 0.1 | 0.6 -0,6 0.45 | |||||
| 10000 | 10000.00 0.2 | -0.2 0.1 -0.3 -0,5 0.45 | |||||
| 10600 | 10592.54 | -0.1 0.1 0.1 0.0 -0,6 0.45 | |||||
| 11200 | 11220.18 | -0.3 0.3 0.1 0.2 -0,7 0.45 | |||||
| 11800 | 11885.02 -0.3 | 0.3 0.0 0.3 -0,8 0.45 | |||||
| 12500 | 12589.25 -0.2 | 0.2 -0.2 0.3 -0,8 0.45 | |||||
| 13200 | 13335.21 -0.4 | 0.4 -0.3 0.7 -0,9 0.45 | |||||
| 14000 | 14125.38 | -0.5 | 0.5 | -0.5 | 1.0 | -0,9 | 0.45 |
| 15000 | 14962.36 | -0.5 | 0.5 | -0.6 | 1.1 | -1,1 | 0.45 |
| 16000 | 15848.93 | -0.1 0.1 -0.6 0.8 -1,1 0.45 | |||||
| 17000 | 16788.04 | -0.6 | 0.6 | -0.6 | 1.2 | -1,2 | 0.45 |
| 18000 | 17782.79 | -0.7 | 0.7 | -0.6 | 1.3 | -1,5 | 0.45 |
| 19000 | 18836.49 | -1.1 | 1.1 | -0.7 | 1.8 | -1,7 | 0.45 |
| 20000 | 19952.62 | -1.5 | 1.5 | -0.9 | 2.4 | -1,5 | 0.45 |
Appendix

Frequency Weighting
| Nominal Frequency Hz | Frequency Weighting dB | ||
| A C Z | |||
| 10 -70.4 | -14.3 0.0 | ||
| 12.5 | -63.4 | -11.2 | 0.0 |
| 16 | -56.7 | -8.5 | 0.0 |
| 20 | -50.5 | -6.2 | 0.0 |
| 25 | -44.7 | -4.4 | 0.0 |
| 31.5 | -39.4 | -3.0 | 0.0 |
| 40 | -34.6 | -2.0 | 0.0 |
| 50 | -30.2 | -1.3 | 0.0 |
| 63 | -26.2 | -0.8 | 0.0 |
| 80 | -22.5 | -0.5 | 0.0 |
| 100 | -19.1 | -0.3 | 0.0 |
| 125 | -16.1 | -0.2 | 0.0 |
| 160 | -13.4 | -0.1 | 0.0 |
| 200 | -10.9 | 0.0 | 0.0 |
| 250 | -8.6 | 0.0 | 0.0 |
| 315 | -6.6 | 0.0 | 0.0 |
| 400 | -4.8 | 0.0 | 0.0 |
| 500 | -3.2 | 0.0 | 0.0 |
| 630 | -1.9 | 0.0 | 0.0 |
| 800 | -0.8 | 0.0 | 0.0 |
| 1000 | 0 | 0 | 0 |
| 1250 | +0.6 | 0.0 | 0.0 |
| 1600 | +1.0 | -0.1 | 0.0 |
| 2000 | +1.2 | -0.2 | 0.0 |
| 2500 | +1.3 | -0.3 | 0.0 |
| Nominal Frequency Hz | Frequency Weighting dB | ||
| A C Z | |||
| 3150 | +1.2 | -0.5 | 0.0 |
| 4000 | +1.0 | -0.8 | 0.0 |
| 5000 | +0.5 | -1.3 | 0.0 |
| 6300 | -0.1 | -2.0 | 0.0 |
| 8000 | -1.1 | -3.0 | 0.0 |
| 10000 | -2.5 | -4.4 | 0.0 |
| 12500 | -4.3 | -6.2 | 0.0 |
| 16000 | -6.6 | -8.5 | 0.0 |
| 20000 | -9.3 | -11.2 | 0.0 |

Appendix
Directional Response (dB)
Based on the sound-incidence angle. (Refer IEC61672-1 paragraphs 5.3.1, 5.3.2 and 9.2.2b)
| Nominal Frequency [Hz] | Actual Frequency [Hz] | Angle in Degrees | |||||||||||||||||||
| 0 5 | 10 | 15 20 | 25 30 | 35 | 40 45 | 50 55 | 60 | 65 70 | 75 80 | 85 | |||||||||||
| 250 25 | 1.19 -0.00 | 0.00 | 0.00 | -0.00 | 0.00 | -0.00 | 0.00 | 0.00 | 0.00 | 0.00 | 0.00 | 0.00 | 0.00 | 0.00 | 0.00 | ||||||
| 315 | 316.23 | -0.00 | 0.01 | 0.01 | 0.01 | -0.00 | 0.02 | -0.01 | 0.01 | 0.01 | 0.01 | 0.01 | 0.01 | -0.01 | 0.01 | -0.01 | 0.00 | 0.01 | -0.01 | 0.00 | 0.01 |
| 400 | 398.11 | 0.00 | 0.01 | 0.01 | 0.01 | -0.00 | 0.02 | -0.02 | -0.01 | 0.00 | 0.00 | 0.00 | -0.01 | 0.01 | -0.02 | -0.01 | 0.00 | -0.02 | 0.00 | 0.00 | 0.00 |
| 500 | 501.19 | -0.00 | -0.02 | -0.02 | -0.01 | -0.00 | -0.02 | -0.02 | -0.01 | -0.03 | -0.04 | -0.04 | -0.04 | -0.05 | -0.05 | -0.02 | -0.04 | -0.04 | -0.04 | -0.04 | -0.04 |
| 630 | 630.96 | -0.00 | -0.09 | -0.11 | -0.06 | -0.04 | 0.00 | 0.01 | -0.05 | -0.05 | -0.06 | -0.11 | -0.11 | -0.13 | -0.08 | -0.07 | -0.10 | -0.11 | -0.13 | -0.13 | -0.13 |
| 800 | 794.33 | -0.00 | -0.00 | -0.01 | -0.02 | 0.00 | -0.00 | 0.02 | 0.00 | 0.00 | 0.00 | -0.03 | 0.00 | -0.01 | 0.01 | 0.02 | -0.01 | -0.03 | -0.04 | -0.04 | -0.04 |
| 1000 | 1000.00 | -0.00 | 0.03 | 0.00 | -0.02 | 0.03 | -0.02 | 0.00 | -0.01 | 0.00 | -0.01 | -0.01 | 0.03 | 0.00 | -0.01 | 0.04 | 0.01 | 0.02 | 0.03 | 0.03 | 0.03 |
| 1060 | 1059.25 | -0.00 | 0.03 | 0.01 | -0.02 | 0.02 | -0.03 | -0.01 | -0.03 | -0.03 | -0.03 | -0.04 | 0.00 | -0.02 | -0.02 | 0.02 | -0.01 | 0.00 | 0.02 | 0.02 | 0.02 |
| 1120 | 1122.02 | -0.00 | 0.02 | 0.01 | -0.02 | 0.00 | -0.04 | -0.02 | -0.05 | -0.06 | -0.06 | -0.06 | -0.05 | -0.06 | -0.05 | -0.01 | -0.03 | -0.02 | -0.01 | -0.02 | -0.01 |
| 1180 | 1188.50 | 0.00 | 0.01 | 0.01 | -0.03 | -0.02 | -0.05 | -0.04 | -0.08 | -0.09 | -0.08 | -0.10 | -0.10 | -0.12 | -0.11 | -0.07 | -0.07 | -0.06 | -0.06 | -0.06 | -0.06 |
| 1250 | 1258.93 | 0.00 | -0.01 | -0.02 | -0.06 | -0.05 | -0.09 | -0.07 | -0.14 | -0.14 | -0.15 | -0.16 | -0.17 | -0.21 | -0.20 | -0.16 | -0.16 | -0.13 | -0.14 | -0.13 | -0.14 |
| 1320 | 1333.52 | -0.00 | -0.02 | -0.05 | -0.09 | -0.07 | -0.12 | -0.10 | -0.18 | -0.17 | -0.21 | -0.23 | -0.24 | -0.29 | -0.27 | -0.26 | -0.26 | -0.24 | -0.22 | -0.24 | -0.22 |
| 1400 | 1412.54 | 0.00 | -0.01 | -0.04 | -0.07 | -0.04 | -0.09 | -0.07 | -0.13 | -0.12 | -0.18 | -0.21 | -0.24 | -0.29 | -0.27 | -0.29 | -0.28 | -0.31 | -0.26 | -0.31 | -0.26 |
| 1500 | 1496.24 | -0.00 | 0.02 | 0.00 | -0.01 | 0.00 | -0.03 | -0.02 | -0.06 | -0.06 | -0.11 | -0.14 | -0.18 | -0.23 | -0.26 | -0.27 | -0.27 | -0.32 | -0.27 | -0.32 | -0.27 |
| 1600 | 1584.89 | -0.00 | 0.03 | 0.02 | 0.00 | 0.02 | -0.00 | 0.01 | -0.01 | -0.02 | -0.06 | -0.09 | -0.12 | -0.17 | -0.23 | -0.26 | -0.28 | -0.30 | -0.29 | -0.30 | -0.29 |
| 1700 | 1678.80 | -0.00 | 0.02 | 0.01 | 0.00 | 0.04 | 0.01 | 0.05 | 0.04 | 0.05 | 0.03 | 0.00 | -0.03 | -0.07 | -0.12 | -0.17 | -0.26 | -0.25 | -0.26 | -0.25 | -0.26 |
| 1800 | 1778.28 | -0.00 | 0.02 | 0.00 | 0.01 | 0.04 | 0.02 | 0.04 | 0.04 | 0.06 | 0.07 | 0.09 | 0.06 | 0.00 | -0.05 | -0.06 | -0.18 | -0.22 | -0.22 | -0.22 | -0.22 |
| 1900 | 1883.65 | -0.00 | 0.00 | -0.02 | -0.01 | 0.01 | 0.01 | 0.04 | 0.03 | 0.05 | 0.05 | 0.09 | 0.13 | 0.08 | 0.02 | 0.00 | -0.08 | -0.17 | -0.23 | -0.23 | -0.23 |
| 2000 | 1995.26 | -0.00 | 0.01 | -0.02 | -0.03 | -0.03 | -0.05 | -0.05 | -0.08 | -0.04 | 0.00 | -0.02 | 0.06 | 0.04 | 0.07 | -0.01 | -0.08 | -0.12 | -0.25 | -0.25 | -0.25 |
| 2120 | 2113.49 | -0.00 | 0.02 | -0.01 | -0.05 | -0.05 | -0.10 | -0.13 | -0.18 | -0.22 | -0.18 | -0.19 | -0.10 | -0.14 | -0.06 | -0.01 | -0.17 | -0.19 | -0.27 | -0.27 | -0.27 |
| 2240 | 2238.72 | 0.00 | 0.02 | -0.01 | -0.06 | -0.08 | -0.16 | -0.21 | -0.25 | -0.31 | -0.36 | -0.44 | -0.37 | -0.34 | -0.32 | -0.26 | -0.26 | -0.33 | -0.39 | -0.39 | -0.39 |
| 2360 | 2371.37 | -0.00 | 0.02 | 0.00 | -0.03 | -0.03 | -0.10 | -0.13 | -0.22 | -0.30 | -0.39 | -0.46 | -0.51 | -0.56 | -0.47 | -0.42 | -0.40 | -0.33 | -0.47 | -0.47 | -0.47 |
| 2500 | 2511.89 | -0.00 | 0.01 | -0.00 | -0.03 | -0.03 | -0.08 | -0.08 | -0.11 | -0.16 | -0.29 | -0.44 | -0.48 | -0.58 | -0.64 | -0.52 | -0.50 | -0.45 | -0.41 | -0.41 | -0.41 |
| 2650 | 2660.73 | 0.00 | 0.00 | -0.01 | -0.05 | -0.02 | -0.03 | -0.01 | -0.01 | -0.06 | -0.09 | -0.21 | -0.34 | -0.49 | -0.55 | -0.62 | -0.54 | -0.48 | -0.42 | -0.42 | -0.42 |
| 2800 | 2818.38 | 0.00 | 0.01 | -0.01 | -0.03 | -0.03 | -0.09 | -0.10 | -0.08 | -0.07 | -0.09 | -0.16 | -0.18 | -0.36 | -0.51 | -0.58 | -0.70 | -0.57 | -0.55 | -0.55 | -0.55 |
| 3000 | 2985.38 | -0.00 | 0.00 | -0.03 | -0.09 | -0.12 | -0.19 | -0.20 | -0.25 | -0.31 | -0.31 | -0.30 | -0.34 | -0.43 | -0.52 | -0.70 | -0.79 | -0.84 | -0.73 | -0.73 | -0.73 |
| 3150 | 3162.28 | -0.00 | 0.01 | -0.00 | -0.06 | -0.06 | -0.13 | -0.18 | -0.30 | -0.36 | -0.42 | -0.49 | -0.47 | -0.51 | -0.62 | -0.70 | -0.92 | -0.95 | -0.97 | -0.97 | -0.97 |
| 3350 | 3349.65 | -0.00 | 0.01 | 0.01 | 0.00 | -0.01 | -0.06 | -0.09 | -0.15 | -0.23 | -0.37 | -0.46 | -0.46 | -0.55 | -0.55 | -0.67 | -0.82 | -1.05 | -1.01 | -1.01 | -1.01 |
Appendix

| Nominal Frequency [Hz] | Actual Frequency [Hz] | Angle in Degrees | ||||||||||||||||||
| 0 5 1 | 0 15 20 | 25 30 35 | 40 45 5 | 50 55 60 | 65 70 7 | 5 80 85 | ||||||||||||||
| 3550 3 | 548.13 -0.00 | 0.02 0 | 02 0.01 | 0.00 -0. | 03 0.01 | 0.00 -0. | 07 -0.18 | -0.29 -0 | 40 -0.47 | -0.50 | -0.48 -0.6 | -0.84 | -1.08 | |||||||
| 3750 3 | 758.37 -0.00 | 0.01 -0 | 01 -0.07 | -0.08 | -0.12 -0.09 | -0.09 | -0.10 -0 | 11 -0.22 | -0.35 | -0.49 -0.6 | -0.54 | -0.60 | -0.78 | -0.98 | ||||||
| 4000 3 | 981.07 -0.00 | 0.01 -0 | 02 -0.10 | -0.16 | 0.24 -0.30 | -0.36 | -0.39 -0 | 35 -0.38 | -0.41 | -0.62 | -0.76 | -0.86 | -0.83 | -0.87 | -1.11 | |||||
| 4250 4 | 216.97 -0.00 | -0.00 -0 | -0.02 -0.07 | -0.09 | -0.18 -0 | -0.50 -0 | -0.50 -0 | -0.54 -0.60 | -0.52 | -0.64 -0.7 | -0.79 | -1.10 | -1 | 01 -1.0 | ||||||
| 4500 4 | 466.84 -0.00 | 0.02 -0 | 01 -0.03 | -0.02 | -0.06 -0.07 | -0.18 | -0.27 -0 | 42 -0.57 | -0.58 | -0.56 | -0.6 | -0.77 | -1.00 | -1 | 12 -1.05 | |||||
| 4750 | 4731.51 | -0.00 0.01 | -0.02 -0.08 | -0.10 | -0.17 -0.1 | 4 -0.18 | -0.19 -0 | 32 -0.47 | -0.66 | -0.70 | -0.71 | -0.73 | -0.94 | -1 | 16 -1.18 | |||||
| 5000 | 5011.87 | -0.00 | 0.00 | -0.05 | -0.14 | -0.20 | -0.35 | -0.44 | -0.54 | -0.53 | -0.60 | -0.63 | -0.82 | -1.01 | -1.12 | -1.09 | -1.15 | -1.41 | -1.62 | |
| 5300 | 5308.84 | 0.00 | 0.02 | -0.01 | -0.07 | -0.10 | -0.26 | -0.39 | -0.58 | -0.71 | -0.85 | -0.87 | -0.90 | -1.07 | -1.30 | -1.40 | -1.36 | -1.43 | -1.76 | |
| 5600 5 | 623.41 -0.00 | 0.02 -0 | -0.01 -0.04 | -0.04 | -0.10 -0.15 | -0.29 | -0.45 -0 | 71 -0.88 | -0.94 | -1.01 | -1.16 | -1.39 | -1.51 | -1.44 | -1.54 | |||||
| 6000 | 5956.62 | -0.00 | 0.00 | -0.03 | -0.12 | -0.17 | -0.24 | -0.27 | -0.32 | -0.38 | -0.57 | -0.80 | -1.03 | -1.20 | -1.26 | -1.41 | -1.71 | -1.77 | -1.69 | |
| 6300 | 6309.57 | 0.00 | 0.00 | -0.05 | -0.13 | -0.20 | -0.36 | -0.45 | -0.52 | -0.59 | -0.67 | -0.82 | -1.11 | -1.40 | -1.52 | -1.56 | -1.83 | -2.15 | -2.05 | |
| 6700 | 6683.44 | -0.00 | 0.01 | -0.03 | -0.09 | -0.14 | -0.30 | -0.46 | -0.67 | -0.84 | -0.88 | -0.94 | -1.05 | -1.41 | -1.78 | -1.85 | -1.87 | -2.17 | -2.47 | |
| 7100 7 | 709.46 -0.00 | 0.00 -0.05 | -0.12 | -0.15 | -0.22 -0.25 | -0.37 | -0.56 -0 | 90 -1.12 | -1.09 -1 | 17 -1.52 | -1.96 | -2.03 | -2.38 | |||||||
| 7500 | 7498.94 | -0.00 | 0.00 | -0.09 | -0.21 | -0.33 | -0.58 | -0.71 | -0.82 | -0.84 | -0.96 | -1.31 | -1.66 | -1.82 | -1.81 | -2.11 | -2.57 | -2.58 | -2.68 | |
| 8000 | 7943.28 | -0.00 | 0.00 | -0.03 | -0.09 | -0.15 | -0.30 | -0.50 | -0.77 | -1.08 | -1.26 | -1.30 | -1.46 | -1.91 | -2.16 | -2.21 | -2.55 | -2.90 | -3.00 | |
| 8500 | 8413.95 | 0.00 | -0.01 | -0.08 | -0.18 | -0.25 | -0.37 | -0.44 | -0.54 | -0.71 | -1.11 | -1.52 | -1.63 | -1.75 | -2.09 | -2.41 | -2.56 | -2.89 | -3.30 | |
| 9000 | 8912.51 | 0.00 | -0.00 | -0.08 | -0.20 | -0.32 | -0.61 | -0.82 | -1.10 | -1.22 | -1.31 | -1.56 | -2.04 | -2.42 | -2.47 | -2.78 | -3.18 | -3.29 | -3.76 | |
| 9500 | 9440.61 | -0.00 | -0.01 | -0.12 | -0.23 | -0.26 | -0.41 | -0.46 | -0.68 | -0.98 | -1.38 | -1.66 | -1.71 | -2.12 | -2.67 | -2.78 | -3.08 | -3.45 | -3.66 | |
| 10000 | 10000.00 | -0.00 | 0.01 | -0.01 | -0.08 | -0.16 | -0.49 | -0.80 | -1.13 | -1.32 | -1.44 | -1.72 | -2.25 | -2.57 | -2.74 | -3.30 | -3.49 | -3.95 | -4.12 | |
| 10600 | 10592.50 | -0.00 | -0.02 | -0.18 | -0.44 | -0.68 | -0.93 | -0.95 | -1.09 | -1.43 | -1.89 | -2.22 | -2.35 | -2.88 | -3.31 | -3.50 | -4.13 | -4.36 | -4.64 | |
| 11200 | 11220.20 | 0.00 | -0.02 | -0.08 | -0.13 | -0.05 | -0.15 | -0.48 | -1.00 | -1.21 | -1.38 | -1.78 | -2.32 | -2.55 | -3.01 | -3.50 | -3.73 | -4.36 | -4.54 | |
| 11800 | 11885.00 | -0.00 | 0.02 | 0.01 | -0.05 | -0.28 | -0.82 | -1.17 | -1.21 | -1.45 | -2.04 | -2.28 | -2.65 | -3.25 | -3.53 | -4.03 | -4.56 | -5.04 | -5.54 | |
| 12500 | 12589.30 | -0.00 | -0.03 | -0.23 | -0.54 | -0.87 | -1.05 | -0.98 | -1.31 | -1.90 | -2.08 | -2.56 | -3.15 | -3.36 | -3.98 | -4.44 | -4.86 | -5.42 | -5.75 | |
| 13200 | 13335.20 | 0.00 | -0.02 | -0.13 | -0.24 | -0.27 | -0.44 | -0.77 | -1.35 | -1.48 | -1.92 | -2.49 | -2.74 | -3.46 | -3.76 | -4.40 | -4.85 | -5.54 | -5.99 | |
| 14000 | 14125.40 | -0.00 | 0.00 | -0.08 | -0.20 | -0.42 | -0.85 | -1.20 | -1.47 | -1.81 | -2.35 | -2.64 | -3.39 | -3.63 | -4.44 | -4.84 | -5.51 | -6.06 | -6.53 | |
| 15000 | 14962.40 | -0.00 | -0.01 -0.11 | -0.29 | -0.54 -0.92 | -1.15 | -1.59 -2.04 | -2.32 | -3.03 -3 | 42 -4.20 | -4.53 -5.20 | -5.80 | -6.52 | -6.78 | ||||||
| 16000 | 15848.90 | 0.00 | -0.03 | -0.13 | -0.37 | -0.71 | -1.08 | -1.25 | -1.79 | -2.16 | -2.70 | -3.27 | -3.73 | -4.49 | -5.07 | -5.65 | -6.31 | -7.11 | -7.72 | |
| 17000 | 16788.00 | 0.00 | 0.00 | -0.14 | -0.36 | -0.63 | -0.97 | -1.30 | -1.94 | -2.24 | -2.92 | -3.39 | -4.12 | -4.75 | -5.44 | -6.07 | -6.66 | -7.59 | -8.07 | |
| 18000 | 17782.80 | 0.00 | -0.05 | -0.25 | -0.48 | -0.71 | -1.06 | -1.54 | -2.14 | -2.40 | -3.27 | -3.67 | -4.52 | -5.26 | -5.88 | -6.58 | -7.38 | -8.19 | -8.93 | |
| 19000 | 18836.50 | -0.00 | -0.03 | -0.25 | -0.54 | -0.75 | -1.13 | -1.71 | -2.25 | -2.67 | -3.51 | -4.10 | -4.84 | -5.69 | -6.48 | -7.12 | -7.94 | -8.95 | -9.48 | |
| 20000 | 19952.60 | -0.00 | -0.04 | -0.25 | -0.55 | -0.85 | -1.28 | -1.80 | -2.42 | -2.97 | -3.70 | -4.54 | -5.21 | -6.21 | -7.04 | -7.80 | -8.59 | -9.59 | -10.28 | |

Appendix
| Nominal Frequency [Hz] | Actual Frequency [Hz] | Angle in Degrees | ||||||||||||||||||
| 90 | 95 | 100 | 105 | 110 | 115 | 120 | 125 | 130 | 135 | 140 | 145 | 150 | 155 | 160 | 165 | 170 | 175 | 180 | ||
| 250 25 | 1.19 0.00 0 | 0.00 0.00 | 0.00 0.00 | 0.00 0.00 | 0.00 0.00 | 0.00 0.00 | 0.00 0.00 | 0.00 0.00 | 0.00 0.00 | 0.00 0.00 | 0.00 0.00 | 0.00 0.10 | 0.00 0.00 | 0.00 | ||||||
| 315 31 | 6.23 0.01 0 | 0.01 -0.01 | 0.00 0.01 | 0.01 -0.01 | 0.00 0.00 | 0.00 0.01 | 0.00 0.01 | 0.01 0.00 | 0.02 0.00 | 0.02 0.00 | 0.00 0.00 | -0.01 | -0.03 | -0.03 | ||||||
| 400 | 398.11 | 0.00 | -0.01 | -0.03 | -0.02 | 0.00 | -0.04 | -0.01 | -0.02 | 0.00 | -0.01 | 0.01 | 0.03 | 0.00 | -0.01 | 0.02 | 0.02 | 0.01 | 0.00 | -0.01 |
| 500 | 501.19 | -0.06 | -0.05 | -0.09 | -0.08 | -0.04 | -0.09 | -0.05 | -0.07 | -0.03 | -0.05 | -0.03 | 0.00 | -0.03 | -0.04 | 0.00 | -0.01 | -0.01 | -0.01 | -0.04 |
| 630 | 630.96 | -0.13 | -0.06 | -0.17 | -0.10 | -0.08 | -0.17 | -0.14 | -0.12 | -0.08 | -0.09 | -0.05 | -0.08 | -0.10 | -0.11 | -0.09 | -0.12 | -0.13 | -0.09 | -0.22 |
| 800 | 794.33 | -0.04 | -0.04 | -0.08 | -0.08 | -0.09 | -0.09 | -0.07 | -0.09 | -0.05 | -0.05 | -0.03 | -0.04 | -0.07 | -0.06 | -0.05 | -0.03 | -0.03 | 0.00 | -0.06 |
| 1000 | 1000.00 | 0.03 | -0.02 | -0.06 | -0.09 | -0.06 | -0.09 | -0.06 | -0.10 | -0.09 | -0.10 | -0.07 | -0.04 | -0.04 | -0.06 | -0.01 | 0.00 | 0.02 | 0.04 | 0.00 |
| 1060 | 1059.25 | 0.03 | 0.00 | -0.06 | -0.09 | -0.07 | -0.10 | -0.08 | -0.12 | -0.10 | -0.12 | -0.09 | -0.06 | -0.07 | -0.10 | -0.05 | -0.06 | -0.04 | -0.02 | -0.08 |
| 1120 | 1122.02 | 0.01 | 0.01 | -0.06 | -0.09 | -0.10 | -0.12 | -0.10 | -0.14 | -0.12 | -0.14 | -0.11 | -0.08 | -0.09 | -0.11 | -0.06 | -0.06 | -0.04 | -0.03 | -0.06 |
| 1180 | 1188.50 | -0.05 | -0.02 | -0.07 | -0.11 | -0.13 | -0.15 | -0.13 | -0.17 | -0.15 | -0.17 | -0.15 | -0.11 | -0.12 | -0.13 | -0.07 | -0.06 | -0.03 | -0.02 | -0.01 |
| 1250 | 1258.93 | -0.14 | -0.11 | -0.14 | -0.15 | -0.19 | -0.23 | -0.20 | -0.23 | -0.21 | -0.24 | -0.23 | -0.20 | -0.21 | -0.22 | -0.19 | -0.18 | -0.13 | -0.13 | -0.11 |
| 1320 | 1333.52 | -0.20 | -0.21 | -0.23 | -0.20 | -0.23 | -0.31 | -0.28 | -0.31 | -0.28 | -0.32 | -0.30 | -0.28 | -0.29 | -0.29 | -0.29 | -0.27 | -0.22 | -0.22 | -0.22 |
| 1400 | 1412.54 | -0.21 | -0.24 | -0.27 | -0.23 | -0.23 | -0.31 | -0.29 | -0.33 | -0.30 | -0.36 | -0.32 | -0.29 | -0.28 | -0.27 | -0.26 | -0.21 | -0.15 | -0.13 | -0.16 |
| 1500 | 1496.24 | -0.22 | -0.22 | -0.25 | -0.23 | -0.22 | -0.27 | -0.28 | -0.33 | -0.30 | -0.35 | -0.32 | -0.27 | -0.28 | -0.29 | -0.28 | -0.23 | -0.18 | -0.15 | -0.19 |
| 1600 | 1584.89 | -0.26 | -0.23 | -0.23 | -0.23 | -0.23 | -0.24 | -0.27 | -0.32 | -0.29 | -0.34 | -0.31 | -0.24 | -0.26 | -0.27 | -0.25 | -0.21 | -0.18 | -0.16 | -0.19 |
| 1700 | 1678.80 | -0.27 | -0.22 | -0.18 | -0.20 | -0.19 | -0.19 | -0.21 | -0.27 | -0.25 | -0.31 | -0.28 | -0.22 | -0.21 | -0.22 | -0.18 | -0.11 | -0.06 | -0.03 | -0.06 |
| 1800 | 1778.28 | -0.23 | -0.22 | -0.16 | -0.15 | -0.16 | -0.15 | -0.15 | -0.23 | -0.21 | -0.26 | -0.26 | -0.21 | -0.17 | -0.21 | -0.21 | -0.18 | -0.11 | -0.07 | -0.09 |
| 1900 | 1883.65 | -0.19 | -0.22 | -0.20 | -0.12 | -0.12 | -0.15 | -0.10 | -0.19 | -0.18 | -0.21 | -0.24 | -0.19 | -0.11 | -0.12 | -0.09 | -0.04 | -0.05 | -0.07 | -0.10 |
| 2000 | 1995.26 | -0.25 | -0.23 | -0.29 | -0.17 | -0.12 | -0.23 | -0.13 | -0.18 | -0.24 | -0.21 | -0.29 | -0.24 | -0.18 | -0.19 | -0.20 | -0.18 | -0.09 | -0.04 | 0.01 |
| 2120 | 2113.49 | -0.42 | -0.38 | -0.40 | -0.37 | -0.23 | -0.33 | -0.26 | -0.25 | -0.39 | -0.35 | -0.38 | -0.36 | -0.29 | -0.26 | -0.25 | -0.18 | -0.11 | -0.04 | -0.06 |
| 2240 | 2238.72 | -0.48 | -0.63 | -0.54 | -0.60 | -0.48 | -0.45 | -0.47 | -0.43 | -0.53 | -0.55 | -0.55 | -0.59 | -0.48 | -0.50 | -0.52 | -0.49 | -0.42 | -0.29 | -0.33 |
| 2360 | 2371.37 | -0.51 | -0.65 | -0.73 | -0.67 | -0.68 | -0.53 | -0.55 | -0.56 | -0.56 | -0.67 | -0.64 | -0.67 | -0.60 | -0.55 | -0.52 | -0.50 | -0.39 | -0.29 | -0.31 |
| 2500 | 2511.89 | -0.55 | -0.58 | -0.77 | -0.73 | -0.74 | -0.64 | -0.57 | -0.63 | -0.59 | -0.72 | -0.69 | -0.72 | -0.65 | -0.59 | -0.58 | -0.59 | -0.50 | -0.41 | -0.42 |
| 2650 | 2660.73 | -0.43 | -0.55 | -0.65 | -0.76 | -0.67 | -0.65 | -0.53 | -0.59 | -0.55 | -0.72 | -0.66 | -0.71 | -0.65 | -0.60 | -0.56 | -0.56 | -0.45 | -0.29 | -0.27 |
| 2800 | 2818.38 | -0.46 | -0.55 | -0.65 | -0.75 | -0.71 | -0.72 | -0.55 | -0.61 | -0.59 | -0.72 | -0.72 | -0.76 | -0.74 | -0.60 | -0.53 | -0.54 | -0.43 | -0.31 | -0.32 |
| 3000 | 2985.38 | -0.71 | -0.70 | -0.83 | -0.90 | -0.97 | -0.88 | -0.75 | -0.72 | -0.76 | -0.81 | -0.96 | -0.92 | -1.00 | -0.83 | -0.76 | -0.82 | -0.75 | -0.60 | -0.60 |
| 3150 | 3162.28 | -0.84 | -0.85 | -0.88 | -1.10 | -1.15 | -1.10 | -1.01 | -0.79 | -0.88 | -0.85 | -1.12 | -1.02 | -1.20 | -1.06 | -0.95 | -1.02 | -0.93 | -0.75 | -0.69 |
| 3350 | 3349.65 | -1.00 | -0.80 | -0.90 | -1.05 | -1.16 | -1.29 | -1.03 | -0.91 | -0.87 | -0.87 | -1.07 | -1.04 | -1.20 | -1.11 | -0.95 | -0.99 | -0.91 | -0.71 | -0.65 |
| 3550 | 3548.13 | -0.97 | -0.92 | -0.78 | -0.80 | -1.12 | -1.20 | -1.09 | -0.99 | -0.78 | -0.84 | -0.91 | -0.99 | -1.10 | -1.07 | -0.81 | -0.84 | -0.81 | -0.62 | -0.57 |
| 3750 | 3758.37 | -1.25 | -1.10 | -0.88 | -0.94 | -0.98 | -1.24 | -1.31 | -1.10 | -0.86 | -0.93 | -0.92 | -1.11 | -1.13 | -1.16 | -0.87 | -0.85 | -0.86 | -0.68 | -0.66 |
| 4000 3981.07 -1.33 | -1.47 -1.39 -1.47 | |||||||||||||||||||
Appendix

| Nominal Frequency [Hz] | Actual Frequency [Hz] | Angle in Degrees | |||||||||||||||||||
| 90 | 95 | 100 | 105 | 110 | 115 | 120 | 125 | 130 | 135 | 140 | 145 | 150 | 155 | 160 | 165 | 170 | 175 | 180 | |||
| 5000 | 5011.87 | -1.54 | -1.54 | -1.97 | -2.36 | -2.08 | -1.67 | -1.68 | -2.07 | -2.18 | -1.95 | -1.68 | -1.64 | -2.04 | -2.00 | -1.93 | -1.63 | -1.64 | -1.37 | -1.24 | |
| 5300 | 5308.84 | -1.97 | -1.84 | -1.95 | -2.45 | -2.54 | -2.13 | -1.97 | -2.36 | -2.54 | -2.17 | -1.83 | -1.93 | -2.27 | -2.18 | -2.22 | -1.86 | -1.93 | -1.71 | -1.57 | |
| 5600 | 5623.41 | -1.90 | -1.97 | -1.84 | -2.19 | -2.63 | -2.35 | -1.91 | -2.14 | -2.42 | -2.20 | -1.96 | -2.06 | -2.26 | -2.20 | -2.25 | -1.83 | -1.86 | -1.63 | -1.50 | |
| 6000 | 5956.62 | -1.98 | -2.40 | -2.27 | -2.24 | -2.80 | -2.94 | -2.34 | -2.24 | -2.58 | -2.60 | -2.33 | -2.27 | -2.25 | -2.50 | -2.48 | -2.11 | -2.03 | -1.76 | -1.57 | |
| 6300 | 6309.57 | -1.97 | -2.41 | -2.66 | -2.33 | -2.52 | -3.10 | -2.82 | -2.54 | -2.81 | -2.94 | -2.57 | -2.33 | -2.46 | -2.86 | -2.80 | -2.41 | -2.36 | -2.16 | -1.95 | |
| 6700 | 6683.44 | -2.28 | -2.33 | -2.93 | -3.03 | -2.93 | -3.43 | -3.27 | -2.75 | -2.94 | -3.25 | -2.84 | -2.45 | -2.69 | -3.26 | -3.09 | -2.84 | -2.68 | -2.44 | -2.21 | |
| 7100 | 7079.46 | -2.70 | -2.53 | -2.80 | -3.16 | -2.90 | -3.24 | -3.69 | -3.21 | -3.11 | -3.53 | -3.16 | -2.69 | -2.90 | -3.27 | -3.15 | -2.90 | -2.66 | -2.49 | -2.22 | |
| 7500 | 7498.94 | -3.25 | -3.15 | -3.03 | -3.66 | -3.59 | -3.61 | -4.21 | -3.73 | -3.25 | -3.83 | -3.91 | -3.34 | -3.41 | -3.62 | -3.67 | -3.40 | -3.14 | -3.03 | -2.78 | |
| 8000 | 7943.28 | -3.29 | -3.52 | -3.42 | -3.57 | -4.16 | -3.83 | -4.18 | -4.54 | -3.75 | -3.90 | -4.18 | -3.68 | -3.61 | -3.79 | -4.03 | -3.74 | -3.41 | -3.38 | -3.11 | |
| 8500 | 8413.95 | -3.34 | -3.64 | -3.82 | -3.66 | -4.19 | -4.16 | -4.40 | -4.77 | -4.11 | -4.11 | -4.63 | -4.00 | -3.65 | -3.89 | -4.28 | -4.03 | -3.57 | -3.59 | -3.25 | |
| 9000 | 8912.51 | -4.04 | -4.17 | -4.41 | -4.47 | -4.43 | -5.18 | -4.56 | -5.53 | -5.13 | -4.45 | -5.00 | -4.78 | -4.29 | -4.50 | -4.97 | -4.73 | -4.11 | -4.21 | -3.86 | |
| 9500 9440.61 -4 | 08 -4.32 | 4.57 | 4.55 -4 | 70 -5.00 | -5.17 | -5.01 -5.59 | -4.88 | -5.00 | -4.98 | -4.43 | -4.61 | -5.29 | -5.01 -4.21 | -4.25 | -3.94 | ||||||
| 10000 | 10000.00 | -4.41 | -4.95 | -5.13 | -5.26 | -5.09 | -5.64 | -5.74 | -5.67 | -6.17 | -5.59 | -5.62 | -5.57 | -4.81 | -5.16 | -5.96 | -5.78 | -4.92 | -4.99 | -4.66 | |
| 10600 | 10592.50 | -4.84 | -5.66 | -5.73 | -5.89 | -5.99 | -5.85 | -6.61 | -6.17 | -6.86 | -6.35 | -6.05 | -6.69 | -5.69 | -5.79 | -6.38 | -6.32 | -5.56 | -5.62 | -5.33 | |
| 11200 | 11220.20 | -5.08 | -5.29 | -5.96 | -5.82 | -6.22 | -5.98 | -6.40 | -6.63 | -6.54 | -6.77 | -6.08 | -6.38 | -6.07 | -5.74 | -6.19 | -6.46 | -5.65 | -5.71 | -5.42 | |
| 11800 | 11885.00 | -5.81 | -6.22 | -6.60 | -6.69 | -6.84 | -7.06 | -7.08 | -7.77 | -7.39 | -7.95 | -6.88 | -7.35 | -6.86 | -6.32 | -6.89 | -7.28 | -6.63 | -6.49 | -6.22 | |
| 12500 | 12589.30 | -6.24 | -6.68 | -7.02 | -7.57 | -7.29 | -7.66 | -7.45 | -8.08 | -7.93 | -8.49 | -8.13 | -7.96 | -7.81 | -6.96 | -7.43 | -8.07 | -7.42 | -7.11 | -6.92 | |
| 13200 | 13335.20 | -6.47 | -6.80 | -7.26 | -7.56 | -7.63 | -8.13 | -8.10 | -8.29 | -8.45 | -8.48 | -8.34 | -7.99 | -8.30 | -7.15 | -7.48 | -8.50 | -7.89 | -7.43 | -7.36 | |
| 14000 | 14125.40 | -7.09 | -7.62 | -7.91 | -8.27 | -8.65 | -8.89 | -9.22 | -8.90 | -9.58 | -9.60 | -9.77 | -8.84 | -9.40 | -7.94 | -8.18 | -9.45 | -8.78 | -8.17 | -8.20 | |
| 15000 | 14962.40 | -7.77 | -8.15 | -8.31 | -8.80 | -9.13 | -9.52 | -9.70 | -9.36 | -9.89 | -9.60 | -9.91 | -8.94 | -9.53 | -8.95 | -8.85 | -10.27 | -9.43 | -8.58 | -8.69 | |
| 16000 | 15848.90 | -8.14 | -8.57 | -9.46 | -9.82 | -9.82 | -10.40 | -10.67 | -10.30 | -10.88 | -11.05 | -11.53 | -10.63 | -10.30 | -9.99 | -9.98 | -11.23 | -10.39 | -9.57 | -9.70 | |
| 17000 | 16788.00 | -9.03 | -9.53 | -9.85 | -10.29 | -10.41 | -11.12 | -11.48 | -11.22 | -11.33 | -11.86 | -11.73 | -11.51 | -11.22 | -10.86 | -10.22 | -11.69 | -11.46 | -10.42 | -10.51 | |
| 18000 | 17782.80 | -9.76 | -10.24 | -10.80 | -10.99 | -11.37 | -11.93 | -12.53 | -12.49 | -12.07 | -12.86 | -12.64 | -12.84 | -11.76 | -11.89 | -10.91 | -12.08 | -12.48 | -11.15 | -11.39 | |
| 19000 | 18836.50 | -10.50 | -11.05 | -11.74 | -12.45 | -12.44 | -12.86 | -13.22 | -13.33 | -12.90 | -13.90 | -13.76 | -13.71 | -13.09 | -13.30 | -12.01 | -12.61 | -13.63 | -12.05 | -12.01 | |
| 20000 19952.60 -1 | 1.34 | -11.75 | -12.63 | -13.00 | -13.60 | -13.92 | -14.22 | -14.21 | -14.52 | -14.27 | -15.01 | -14.99 | -13.71 | -14.36 | -12.72 | -13.38 | -15.20 | -13.07 | -12.92 | ||
The maximum measurement uncertainty of the data is with 95 % probability (k=2).
• 250 Hz to 1 kHz 0.3 dB
• 1 kHz to 4 kHz 0.5 dB
• 4 kHz to 8 kHz 1.0 dB
• 8 kHz to 12.5 kHz 1.5 dB

Appendix
Information for Calibration
Type Description
Integrating sound level meter type NTi Audio XL2-TA•
Standards
The XL2-TA Sound Level Meter has been certified in accordance with the class 1 requirements of
Approval Identification
The XL2-TA Sound Level Meter requires the approved firmware listed in the following table:
| Germany Switzerland Austria | ||
| Firmware V4.21 Firmware V4.11 Firmware V4.21 | ||
| Certificate No.: DE-16-M-PTB-0003 |  |  |
Hints for Performing the Electrical Measurements
Electrical input facility
(Refer IEC61672-1 paragraphs 5.1.15, 9.3.g)
The capsule replacement NTI-K65-15 is used to insert electrical signals to the preamplifier MA220. The device provides at one side a contact that corresponds to the center contact of the replaced microphone capsule, at the other side a BNC-plug for the electrical signals. The impedance at the output of the device is 15 pF with a maximum deviation of ±1 pF. The electrical noise floor is measured by shorting the contacts of the BNC plug. Before the NTI-K65-15 can be mounted to the preamplifier MA220, the microphone capsule must first be detached. The nominal sensitivity S of the capsule is S = 42 mV/Pa. Measurements with the NTI-K65-15 therefore require that the sensitivity in the calibration menu is manually adjusted to S = 42 mV/Pa. The linear operating ranges according to IEC 61672 have been verified during the type approval procedure.
Certified Calibrator
The following sound level calibrators are certified with the XL2-TA with a 114 dB, 1 kHz reference signal.
• Larson Davis CAL200
• B&K 4231
- Norsonic Nor-1251
Appendix

Compulsory Calibrated Applications
The following acoustic measurements have been verified by German PTB during the type approval process:
Instantaneous sound pressure levels:
LAF •
A-weighted sound pressure level with time weighting FAST LAS •
A-weighted sound pressure level with time weighting SLOW LCF •
C-weighted sound pressure level with time weighting FAST LCS •
C-weighted sound pressure level with time weighting SLOW LZF •
unweighted sound pressure level with time weighting FAST LZS •
unweighted sound pressure level with time weighting SLOW LAI •
A-weighted sound pressure level with time weighting IMPULSE
Time averaged sound pressure levels:
LCpeak •
Peak value of the C-weighted sound pressure level
LAeq
A-weighted average level
LAE •
A-weighted sound exposure level
LAFT3eq
A-weighted clock-impulse maximum level with time weighting FAST for a clock-impulse duration of 3 seconds
LAFT5eq
A-weighted clock-impulse maximum level with time weighting FAST for a clock-impulse duration of 5 seconds
- XL2
- OPERATING MANUAL
- HANDHELD AUDIO AND
- ACOUSTIC ANALYZER
- Contact NTi Audio at
- Table of Contents
- Introduction
- Introduction
- How to Read this Manual
- Overview
- Overview
- ① Page Control
- ② Volume of Speaker and Headphone Output
- The Screen Display
- Display Contrast Setting
- Updating of display
- Getting Started
- Getting Started
- Power Supply
- Operation using Mains Power Supply
- Mains Power Adapter
- DC Power supply specifications
- Rechargeable Li-Po Battery
- Caution
- AA-Batteries
- Attaching the Hand Strap
- Unfolding the Stand
- Connecting the XL2
- Acoustic Measurements
- Audio Measurements: XLR Connection
- Audio Measurements: RCA Connection
- Switching the XL2 On and Off
- Select Measurement Function
- Calibration prior Measurement
- Sound Level Meter
- Sound Level Meter
- Extended Acoustic Pack (optional)
- SLMeter/RTA function•
- FFT function•
- RT60 function•
- Page Selection using the Page Button
- Page Selection using the Rotary Wheel
- SLMeter: Sound Level Meter
- RTA: Real-Time Spectrum
- Reporting: Report Setting
- Logging: Setup of Data Logging
- Event Trigger: Event Setting (optional)
- Limit LED: Limit Setting
- KSET Correction: Setup of Correction Values
- Set EQt, L%: Selection of measured levels
- Numeric Result Page
- Real-Time Analyzer Page
- ① Sound Level Result 1
- Change Parameter
- Change Font Size
- ② Sound Level Result 2 & 3
- ③ Sound Level Result 4 & 5
- ④ Input Range
- ⑤ Run Indication
- ⑥ Actual Measurement Time
- CNT Timer Mode Continuous
- Timer Mode Single
- Timer Mode Repeat
- Timer Mode Repeat Synchronized
- Preset Measurement Time
- ⑧ Phantom Power Supply
- ⑨ Result Symbols / Capture
- Broadband Results
- Readout Frequency
- Setting of Test Result Resolution
- Measurement Unit
- LOW - Indication
- Overload Indication
- Sound Level Meter - Getting Started
- Test Preparations
- Select Displayed Test Result
- Select Frequency Weighting
- Select Time Weighting
- Select Parameter
- Select Correction Value
- Select further Sound Levels
- Select Input Range
- Start Measurement
- Stop Measurement and Data Saving
- Data Post-Processing
- RTA Measurement - Getting Started
- RTA Configuration
- Select RTA Frequency Weighting
- Select RTA Time Weighting
- Select Upper/Lower RTA Parameter
- Start RTA Measurement
- Reporting
- ① Add Spectra
- ② Report Values
- ③ Selected Report Values
- Logging
- ⑥ Log Value Setting
- ⑦ Selected Log Values
- Wav-File Recording
- Broadcast Wave Format BWF
- Pausing Measurement
- Events
- Events (optional)
- Advantages
- Data Logging
- Recommendation
- Functions
- Features:
- ① Trigger Events
- ② Start [dB]
- Start Duration 13
- ③ Stop [dB]
- Stop Duration 12
- Hysteresis 14
- ④ Level Selection
- ⑤ Log Audio
- ⑥ Format
- ⑦ Audio Logging Period
- ⑧ Status Information
- ⑨ Actual Level
- ⑩ Event Counter
- Trigger Events: on external key press
- Event Stop Mode and Event Duration
- Button Functionality of Input Keypad
- How to Setup the XL2 for Triggered Event Measurements
- Logging Enabled
- Auto Save
- Wav-files
- Limits
- ⑤ I/O - Level 1
- ⑥ Selected Sound Level Values
- ⑦ I/O - Level 2
- ⑧ LED - Level 2
- I/O Limits with Triggered Events
- Correction Value KSET
- Measurement Position
- Level Difference
- How to Measure the Correction Value
- Manual Setting of Correction Values
- Reset Correction Values
- Display k1 and k2 during Measurement
- Correction Values in Profiles
- Locked Run Mode
- Start Locked Run Mode
- End Locked Run Mode
- FFT Analysis + Tolerance
- Acoustic Analyzer
- ① Result Symbols / Capture & Start Tolerance Mode
- Manage captures
- Start tolerance mode
- ② Measurement Result
- ③ Y-Scale setting
- ④ Measurement Result
- ⑤ Input Range
- ⑥ Time Weighting
- ⑦ Run Indication
- ⑧ Actual Measurement Time
- ⑨ Preset Measurement Time
- ⑩ Readout Frequency
- ⑪ Zoom Mode
- Phantom Power Supply
- 48V
- ASD
- Measurement Unit
- ⑭ Page Selector X-Scale and Parameter Setting
- FFT Analysis - Getting Started
- Configuration
- Select Upper/Lower Reading
- Audio Recording
- Capture References and Create Tolerances
- Reverberation Time RT60
- What is Reverberation Time RT60?
- T20•
- T30•
- ① Set Level Markers
- ② Input Range
- ③ Run Indication
- ④ Measurement Status STAT
- ⑤ Average AVRG
- ⑥ Actual Real-Time Spectrum
- ⑦ Level Marker
- ⑧ Band Status
- ⑨ Measurement Method
- ⑩ Measurement Resolution
- ⑪ Phantom Power Supply
- ⑫ Page Selector RT60
- ⑭ Y-Axis Reverberation Time
- ⑭ Uncertainty Factor
- Overall Reverberation Time Test Result
- X-Axis
- ⑰ Cursor Readout
- Measurement Result Selection
- Last Last Test Result
- xx Single Test Cycle Results
- AVRG Averaged Test Result
- Test Signals
- RT60 Measurement - Getting Started
- Test Signal: Pink Noise
- Test Signal: Impulse
- Set Level Markers
- Get Ready for the Reverberation Time Measurement
- Start the Measurement
- Continue the Measurement
- Stop the Measurement and Read Out the Result
- Read Out the Individual Cycle Result
- Error Indications
- LOW LEVL•
- T>18S •
- Polarity
- Positive/Negative Result Page
- Detailed Result Page
- ① Input Selection
- ② Polarity Test Result
- ③ Level RMS
- ④ Balance Indicator
- ⑤ Relative Level Indicator
- ⑥ Polarity Indication
- ⑦ X-Axis
- ⑧ Negative Polarity Area
- ⑨ Uncertain Polarity Area ???
- Positive Polarity Area
- Polarity Measurement - Getting Started
- Delay Time
- ① Delay Signal Source
- ② Store Button
- ③ Reference Delay Time
- ④ Calculated Distance
- ⑤ Synchronization Time Bar
- ⑥ Calculated Delay Time: Store - Actual
- ⑦ Actual Delay
- Delay Test utilizes VoiceNote Microphone
- Rear Speaker
- Delay Measurement - Getting Started
- Measure Reference Speaker A
- Store Reference
- Measure Sub Speaker B
- Automated Difference Calculation
- Result Interpretation
- Distance in meter/feet
- 1/12 Octave + Tolerance
- 1/12 Octave + Tolerance (optional)
- Features
- Applications
- Tolerance Handling
- ④ Spectral Measurement Result
- Broadband Results
- ⑪ Readout Frequency
- ⑫ Setting of Test Result Resolution
- Phantom Power Supply
- ⑭ Measurement Unit
- Band Listening
- 1/12 Octave - Getting Started
- 1/12 Octave - Fast Frequency Response Measurement
- Test Signal
- Measurement in 1/3 Octave Resolution
- Optimize the Frequency Response
- Test Signal „Fast Pink Noise“ Advantage
- Noise Curves
- Noise Curves (optional)
- Noise Rating NR
- Noise Criteria NC
- Room Noise Criteria RNC
- Preferred Noise Criteria PNC (in accordance with ASA 1971)
- Room Criteria RC (in accordance with ANSI S12.2-1995)
- ① Noise Curve
- Measurement Result
- ④ Noise Measurement Result
- ⑤ Noise Floor
- ⑥ X-Scale
- ⑦ Live View
- ⑧ Run Indication
- ⑨ Actual Measurement Time
- Preset Measurement Time
- ⑫ SIL Measurement Result
- Large Fluctuations
- Correction Values
- Noise Curves - Getting Started
- STIPA
- Speech Intelligibility STIPA (optional)
- Signal Source
- NTi Audio
- Minirator
- MR-PRO
- CD Player
- ③ Sound Level LAeq
- ④ Sound Level LAS
- ⑤ Analog Test Result Bargraph
- ⑥ Qualification Scale
- ⑦ Measurement Unit
- ⑧ Edition of Standard IEC60268-16
- ⑨ Progress Bar
- Page Selector
- Octave Bands
- ⑫ Sound Pressure Level L_eq
- STIPA Modulation Ratio mr1, mr2
- Error Detection
- Cycle Reading
- ⑯ STI-Average
- Difference
- Start next Cycle Measurement
- Ambient Noise Measure / Load / Save
- Source of Data
- LAeq of Ambient Noise
- Spectral Level of Ambient Noise
- Activation of manual Octave Band Level Setting
- Activation of Ambient Noise Correction
- Question Mark ? at individual Octave Bands
- Flashing Question Marks ???? at ②
- STI Measurement - Getting Started
- Start STIPA Test Signal
- Averaging of STI Results
- Start Averaging
- Add Cycles
- Finish
- Display of STIPA Numeric Result Page
- Ambient Noise Correction
- Measurement Sequence
- Enable Ambient Noise Correction
- Commissioning New PA-Systems
- Measure Ambient Noise
- STI Measurement
- STI Reporting Tool
- STI Measurement Hints
- Hints: Ambient Noise
- Hints: German Standard VDE 0833-4 Requirements
- Hints: CD-Player
- Hints: Measurement
- Audio Analyzer
- RMS /THD+N
- Audio Analyzer
- ① Filter
- ② Level RMS
- ③ THD+N
- ④ Frequency in Hz
- ⑤ Balance Indicator
- PreNotch Listening
- PostNotch Listening
- Oscilloscope
- Vibration Meter
- VibMeter / Spectrum
- Vibration Meter
- Values: Vibration Meter
- Spectrum: Constant Percentage Bandwidth CPB
- Constant Percentage Bandwidth Analyzer Page
- ① Vibration Level Result 1
- ② Vibration Level Result 2
- ③ Filter
- ④ Result Symbols / Capture
- Capture•
- ⑤ Measurement Result
- ⑥ Y-Scale setting
- ⑦ Measurement Result
- ⑧ X-Scale setting
- ⑤ Time Weighting
- ⑥ Readout Frequency
- ⑦ Zoom Mode
- ⑧ Measurement Unit
- ⑨ Page Selector X-Scale and Parameter Setting
- Measurement Result
- ⑦ Setting of Test Result Resolution
- Calibration
- Calibration
- Instrument Calibration
- Microphone Sensitivity
- Environmental Conditions
- Ambient Noise
- Field Calibration - With External Sound Calibrator
- Field Calibration - Manual Sensitivity Setting
- Field Sensitivity
- Free-field Correction
- Example - Field Calibration
- Applying Correction Values @ M2230
- Profiles
- Profiles
- Profiles - Getting Started
- Activate Profile Selection at Startup
- Preset Measurement Function
- Store MyProfile
- Select Profile during Operation
- Run Measurement
- Export MyProfile to PC
- Import MyProfile from PC
- Spectral Limits Option (Capture + Tolerances)
- Capture the EQ Measurement Results
- Capture + Tolerances
- Edit Capture Manually
- See the difference between Live Level and Capture
- Manual Editing of Capture Data
- Start Tolerance Mode for Passed/Failed Measurements
- Passed Result
- ① PASSED / FAILED Result
- ② Tolerance Bandwidth
- ③ Level Offset
- Failed Result
- Select another Tolerance File
- Tolerance Menu
- Advanced Start Functions
- Digital I/O Interface
- Tolerance Management
- Create Tolerance Files Manually on PC
- Band-limited Measurement Range
- Unit
- Mode
- Columns
- BandTolerances
- LevelOffset
- HideUnusedBands
- nAllowedViolations
- Unit dBr (relative), fixed setting
- Mode Describes tolerance type; the XL2 allows setting of the tolerance type independently of the tolerance file.
- Columns Column headings for further tolerance data separated into columns:
- ATolerances Defines the tolerance band for the A-weighted wideband level (not mandatory).
- CTolerances Defines the tolerance band for the C-weighted wideband level (not mandatory).
- ZTolerances Defines the tolerance band for the Z-weighted wideband level (not mandatory).
- BandSum Defines the tolerance band for the
- Band
- LevelOffset All levels in the tolerance file are relative levels dBr. Thus the level offset provides the relation between the relative level and actual sound pressure level. (not mandatory)
- Hide Defines the way measurement results are UnusedBands shown.
- nAllowed Allows a PASSED result with a maximum violations number of n failed frequency bands (not mandatory)
- FreqScale Spacing Defines the frequency scale spacing in the X-axis for the tolerance data. (not mandatory)
- AutoStart Enables auto start function. (not mandatory)
- AutoStartTrig Sets the sound level in dBZ for an automated gerLevel level trigger; the passed/failed measurement starts as soon as the set level e.g. 95 dB is reached or exceeded. The actual input level can be monitored at the input range bar. (mandatory if #AutoStart is True)
- AutoStartSet-Defines the settling time, after the auto start tlingTime trigger level is exceeded, until the start of the measurement; the time is set in 100 millisecond steps e.g. setting 0.5 equals a settling time of 0.5 seconds. If the input level drops below the auto start trigger level during this period, no measurement is carried out. (not mandatory)
- MeasTime Defines the measurement time in 100 millisecond steps; e.g. setting 1.5 equals a measurement period of 1.5 seconds. (not mandatory)
- FailDeadTime Defines the delay for a failed condition in seconds; for example the XL2 triggers "failed" if the measurement result is beyond the tolerance limits for e.g. 60 seconds. This feature supports condition monitoring applications. (not mandatory)
- System Settings
- System Settings
- Settings
- Page Selector
- ④ Backlight
- ⑤ Date and Time Setting
- ⑥ Show Profile List
- ⑦ Phantom Power
- ⑧ Speaker
- ⑨ USB Mode
- Decimal Separator
- ⑪ Calibration Menu Setting
- Vibration
- Scheduler
- XL2 Actions after pressing Start Schedule
- Scheduling - Getting Started
- Stopping the Scheduler
- Operation with PC
- Options
- Information
- Data Management
- Data Management
- ① Create New Project Folder
- ② Select Project Folder
- ③ Project Folder Name
- ④ Autosave
- ⑩ Write Cache (available with Extended Acoustic Pack)
- Memory Structure of SD Card
- ① Projects
- ② XL2.htm
- ③ XL2\_SYS
- Measurement Data - Getting Started
- Enable Data Logging
- LAeq 5 ---
- Select Parameters for Measurement Report
- Complete the Measurement
- Select File Name
- Predefined Save Names
- Record Voice Notes
- Save Screenshot
- Measurement Data Logging:
- Overview of Measurement Data Files
- ① Test System File
- ② Sound Level Log File
- ③ Measurement Report File
- ④ Wav-File
- ⑤ RTA Log File
- ⑥ Voice Note
- ⑦ Screenshot
- Transfer Measurement Data to PC
- Card Reader
- Additional Data Files using Repeat Mode
- Microsoft Excel
- Log File Format
- Level LAeq\_dt "delta t"
- Report File Format
- XL2 File Validator
- Recall Measurements
- Load Test
- View Measurement Data
- Append Measurements
- Start the Append Mode
- Select Filename
- Take Measurement Results
- Store Measurement Results
- Append Further Measurement Results
- Exit Append Mode
- Append After Power Up
- XL2 Projector PRO
- XL2 Projector PRO Software
- Installation Instructions
- XL2 Data Explorer
- XL2 Data Explorer (optional)
- XL2 Data Explorer Option
- Data Explorer 365
- Supported operating systems
- Building Acoustics
- Building Acoustics (optional)
- XL2 Sound Insulation Option
- Sound Insulation Reporter 365
- Requirements
- Room Acoustics
- Room Acoustics (optional)
- XL2 Room Acoustics Option
- Room Acoustics Reporter 365
- Sound Power
- Sound Power (optional)
- XL2 Sound Power Option
- Sound Power Reporter 365
- NoiseScout
- Unattended Noise Monitoring
- Noise Monitoring in "Managed Mode"
- Noise Monitoring in "Gateway Mode"
- How to connect?
- ① Network Status Indication
- Time Synchronization
- Time Synchronization
- XL2 User Interface
- Start without GPS
- Minutes of deviation
- Example
- Connection Diagram
- Remote Measurement
- Remote Measurement
- Example Command Set
- Auto Start
- Microphones
- Microphones
- Integrated Preamplifier
- Electronic Data Sheet
- Microphone plugs directly into the XL2
- Microphone Connection via the ASD Cable
- Microphone Connection via a professional Audio Cable
- Outdoor Microphone M2230-WP
- Further Information
- Further Information
- My NTi Audio
- How to Register
- Tips and Troubleshooting
- Resetting to Factory Default
- XL2 Starts Up with Limited Functions
- Can I use another SD Card?
- Formatting the SD Card
- SD Card Errors
- Other Error Messages on Display
- Stored Data or Wav-files not available on SD Card
- Firmware Update
- XL2.htm
- Firmware update with XL2 in hand, PC online:
- No PC available
- Projector PRO Option
- Spectral Limits Option
- FFT and 1/12 octave Analyzer•
- 1/12 octave Spectral Analyzer•
- FFT Analyzer•
- Sound Level Meter•
- Noise Curves•
- Cinema Meter Option
- Create new cinema•
- Calibrate cinema•
- Verify Cinema•
- - Lock into Verify Mode
- • View verification results
- - Exit
- Features of the Sound Power Reporter software:
- XL2 Input Keypad
- ASD Cable
- NetBox
- NTi Audio #:
- WP30 Weather Protection for M2230
- Limit Light
- Stack Light
- Class 1 Sound Calibrator
- Class 2 Sound Calibrator
- Weatherproof Enclosure for Noise Monitoring Terminal
- Shroud MXA01
- Basic Outdoor Case
- Heavy Duty Outdoor Case
- GPS Receiver (customized)
- Data Explorer Software
- Sound Insulation Reporter Software
- Room Acoustics Reporter Software
- Sound Power Reporter Software
- XL2 Projector PRO Software
- 1/2" Windscreen 90 mm
- WP30 Windscreen 90 mm
- GB SD Card (default)
- SD Card 32 GB
- Lightweight Tripod
- Minirator MR-PRO
- NTi Audio TalkBox
- Tracer Battery Adapter Cable
- Warranty Conditions
- International warranty
- Service and Repairs
- Limitations
- Statutory Rights
- Calibration Certificate
- Sample Calibration Certificate
- Manufacturer Calibration Certificate
- Declaration of Conformity
- C ∈
- Information for Disposal and Recycling
- Regulations for the EU and other European countries with corresponding laws
- Other countries outside the EU
- Specifications
- Technical Data XL2
- Free Field - Pressure Correction Factors
- Example:
- Actuator Correction
- Diffuse Field Correction Factors
- Spectral Correction for horizontal Sound Incidents using the Outdoor Microphone
- Technical Data PreAmplifier
- Appendix
- Appendix 2: Factory Default Profiles
- How to Measure
- Measurement Results
- V-NISSG 100dB / V-NISSG 100dB&Audio
- Appendix 3: Description Sound Levels
- Capture
- Sound Exposure Level
- Time-Average Sound Level or
- Moving Time-Average Sound Level or Moving Equivalent Continuous Sound Level
- Fast Time Weighting
- Holding Maximum Level
- Impulse Time Weighting
- Impulse Penalty ImpPenalty
- Correction Value k1
- Correction Value k2
- Parameter live
- Parameter max
- Parameter min
- Correction Value off
- Peak Level
- Percentile Sound Level - Level Statistics
- Previous Level
- Slow Time Weighting
- Parameter T3
- Parameter T3eq
- Parameter T5
- Parameter T5eq
- Inverted X-Curve
- Z-frequency weighting in accordance with IEC 61672 (= flat frequency response, no filter)
- Appendix 5: Vibration Meter Functions
- Peak Particle Velocity PPV
- Details IEC 61672 & IEC 61260
- Environment
- Configuration "Microphone Detached"
- Configuration "Microphone Attached"
- Configuration "Outdoor Microphone Detached"
- General Information
- Reference Sound Pressure Level
- Reference Level Range
- Reference Orientation
- Verified Frequency Range
- Greatest Peak-To-Peak Voltage at the Electric Input
- Initial Time Interval after Power On (IEC61672-1, 5.1.18)
- Insertion of Electrical Signals
- Typical Time Interval Needed to Stabilize after Changes in Environmental Conditions (IEC61672-1, 6.1.2, 9.3I)
- No Limit on Operational Environment
- Exposure to Electrostatic Discharges
- Exposure to AC Power and Radio Frequency Fields
- Impact of Electromagnetic Fields
- Susceptibility to AC Power and Radio Frequency Fields
- Measuring Low-Level Sound Fields
- Influence of the ASD Cable
- Influence of Mechanical Vibrations
- Modes of Operation and Accessories
- Technical Details
- Details for Calibration
- Level Linearity
- Level Linearity of Octaveband-Spectrum
- Level Linearity of Third-Octaveband-Spectrum
- Self-generated Noise with Microphone
- Frequency Response Corrections at 250 - 20000 Hz
- Directional Response (dB)
- Information for Calibration
- Type Description
- Standards
- Approval Identification
- Hints for Performing the Electrical Measurements
- Certified Calibrator
- Compulsory Calibrated Applications
Brand : NTi Audio
Model : M2211
Category : Microphone