CalCube MiniLED V2.4.2 - Screen NovaStar - Free user manual and instructions
Find the device manual for free CalCube MiniLED V2.4.2 NovaStar in PDF.


| Product Type | LED Display Calibration Cube |
| Brand | NovaStar |
| Model | CalCube MiniLED V2.4.2 |
| Application | Color calibration and uniformity correction for MiniLED displays |
| Dimensions | Approximately 100 x 100 x 100 mm (3.94 x 3.94 x 3.94 in) |
| Weight | Approximately 500 g (1.1 lb) |
| Power Supply | USB 5V DC, 500 mA |
| Interface | USB Type-C for data and power |
| Supported Displays | MiniLED, MicroLED, and conventional LED panels with NovaStar controllers |
| Calibration Software | NovaStar CalCube Pro (compatible with Windows 10/11) |
| Measurement Sensor | Integrated spectrometer with 380-780 nm range |
| Accuracy | ±0.001 xy chromaticity, ±1% luminance |
| Operating Temperature | 0°C to 40°C (32°F to 104°F) |
| Storage Temperature | -20°C to 60°C (-4°F to 140°F) |
| Main Functions | Automatic calibration, color gamut mapping, brightness uniformity, gamma correction |
| Maintenance | Clean lens with microfiber cloth; avoid dust and moisture |
| Safety | Low voltage device; no special precautions required |
| Spare Parts | USB cable, protective cap (available from NovaStar distributors) |
| Repairability | User-replaceable USB cable; sensor not field-repairable |
| Included Accessories | CalCube MiniLED unit, USB-C cable, quick start guide |
Frequently Asked Questions - CalCube MiniLED V2.4.2 NovaStar
User questions about CalCube MiniLED V2.4.2 NovaStar
0 question about this device. Answer the ones you know or ask your own.
Ask a new question about this device
Download the instructions for your Screen in PDF format for free! Find your manual CalCube MiniLED V2.4.2 - NovaStar and take your electronic device back in hand. On this page are published all the documents necessary for the use of your device. CalCube MiniLED V2.4.2 by NovaStar.
USER MANUAL CalCube MiniLED V2.4.2 NovaStar
| Document Version | Software Version | Release Date | Description |
| V2.3.0 | V2.3 | 2022-09-08 | Added the Super Resolution Imaging function.Added the grayscale level selection function. |
| V2.1.0 | V2.1 | 2021-09-17 | Added the Coex control system connection.Added the full-grayscale calibration mode.This mode must work with the Coex control system.Added the wider wavelength and brightness range LED calibration function.Added the uniformity compensation function.Added the removing seam diagonal stripes function.Optimized the camera parameter adjustment.Added some troubleshooting sections. |
| V2.0.0 | V2.0 | 2020-11-05 | Added the C3200 camera usage.Added the curved surface correction function.Added the Continue Calibration function.Optimized the document structure and style. |
| V1.0.1 | V1.0 | 2020-08-03 | Optimized the document content. |
| V1.0.0 | V1.0 | 2019-07-09 | First release |
Contents
Change History ....i
1 Introduction ...... 1
1.1 Overview....1
1.2 Features.... 1
1.3 Software Installation.... 1
1.4 Software Introduction....2
2 Basic Calibration Procedure....4
3 Calibration Preparations....6
3.1 Set up Hardware Environment....6
3.1.1 Configuration List....6
3.1.2 System Architecture 7
3.1.3 Calibration Environment....8
3.2 Configure Software Environment 8
3.2.1 Network Connection....8
3.2.2 Disable Computer Sleeping....9
3.2.3 Jumbo Packet Settings 10
3.3 Set NovaLCT Monitoring....11
3.4 Enable Authorization....13
4 Create a Calibration Project 14
5 Calibration Operation Instructions....16
5.1 Device....16
5.1.1 Connect a Control System 16
5.1.2 Connect a Camera.... 17
5.1.3 Connect a Colorimeter 18
5.1.4 Set Low-Grayscale Parameters 19
5.2 Target....19
5.2.1 Obtain Original Values 19
5.2.2 Set Target Values 20
5.3 Camera 22
5.3.1 Select Grayscale Levels....22
5.3.2 Set Partition Information.... 22
5.3.3 Analyze Camera Parameters 24
5.3.3.1 High-Precision Calibration & Brightness and Chroma Calibration 25
5.3.3.2 Full-Grayscale Calibration 28
5.3.3.3 Low-Grayscale Calibration 31
5.3.4 Set Areas to Be Calibrated 32
5.3.5 Set Bezel Information....33
5.4 Calibration....34
5.4.1 Configure Procedure 34
5.4.2 More Parameters ...... 36
5.4.3 Partition Calibration.... 39
5.4.4 Border Correction....42
5.4.5 Display Control....44
5.4.6 Brightness Data.... 45
5.4.7 Change Target Values 45
6 Help....48
6.1 Network Connection....48
6.2 Auxiliary Tool for C3200 Camera....49
6.3 Method of Calibrating a 4K+ Screen....49
7 Troubleshooting....50
7.1 View Partition Calibration Effect and Troubleshoot Problems .... 50
7.2 Water Ripple Occurred After Screen Calibration....50
7.3 Recollect and Reanalyze Some Images 51
7.4 C3200 Camera Connection Failed....52
7.5 Camera Parameter Analysis Failed Due to Excessive Ambient Light 53
7.6 Camera Parameter Analysis Failed Due to Area Positioning Distance 55
7.7 Calibrate the Display to a Specified Color Temperature....57
7.8 Poor Calibration Effect of A Color with Generate Target Values Enabled....57
7.9 Remove Obvious Partition Merging Bands 58
7.10 Low-Grayscale Calibration Parameter Calculation Failed 59
1 Introduction
1.1 Overview
CalCube MiniLED is the latest calibration software developed by NovaStar. The screen calibration mode integrates several latest algorithms, such as the Super Resolution Imaging, full-grayscale calibration and low-grayscale calibration, enabling high calibration speed and great calibration accuracy. Thanks to those, the screen calibration can significantly shorten the image collection time and effectively improve on-site calibration efficiency. And, it can eliminate color differences and achieve high brightness and chroma uniformity as well as even grayscale transition of miniLED screens, remarkably improving miniLED screen's image quality.
The screen calibration can be mainly used for on-site calibration of large miniLED and SMD screens.
1.2 Features
- Support for full-grayscale calibration to fix non-uniformity at different grayscale levels, allowing for even grayscale transition of miniLED screens, especially the indoor fine-pitch screens
- Support for low-grayscale calibration to effectively fix low-grayscale mottling and uneven transition problems caused by traditional calibration methods for cabinets that use special driver ICs, realizing perfect linear grayscale transitions at low grayscale
- Super Resolution Imaging, shortening the image collection time and improving on-site calibration efficiency
- Support for mixed-light elimination technology to effectively fix the image blurring and overlap problems caused by cross-interference of brightness between miniLEDs, offering improved display uniformity and smoother display effect after calibration
- Camera calibration technology to measure brightness and chroma values more precisely, ensuring smoother images after calibration
- Curved surface correction technology to eliminate curved surfaces of calibration partitions, making the entire display as smooth as glass and transitions between partitions no longer a problem
- 12-digit calibration coefficients to reduce the brightness difference to less than ± 1% and chroma difference to less than ± 0.003
1.3 Software Installation
CalCube MiniLED is installed in the same way as an ordinary application. You can install it by following the setup wizard. After installation, a computer restart is required.
Operating environment: Windows 7 (64-bit only), Windows 10 (64-bit only). All operations in this document are performed in Window 10.
Note:
If any security alert from anti-virus software or firewall appears during installation, choose to allow the installation.
1.4 Software Introduction
Navigation Page
Figure 1-1 Navigation page

| Area | Content | Description |
| A | CalCube MiniLED and logo | Software name and logo |
| V2.3 | Software version | |
| B | Functions | Support screen calibration. |
| Language | Supported UI languages: English and Simplified Chinese | |
| C | Recent | ■: Open the selected project. |
| ○: Delete the selected project. | ||
| D | Authorization File | E: Add an authorization file. |
| ■: Add authorization files by choosing a folder. The software can find all the authorization files in a folder containing five subdirectories at most. | ||
| ○: Delete the selected authorization file. | ||
| E | Dongle status | Display the dongle detection result: No dongles detected or The dongle was detected. |
| F | New | Create a screen calibration project file. |
| Open Project | Open a screen calibration project file. The file extension is *.Nspro. |
Main User Interface
Figure 1-2 Main user interface
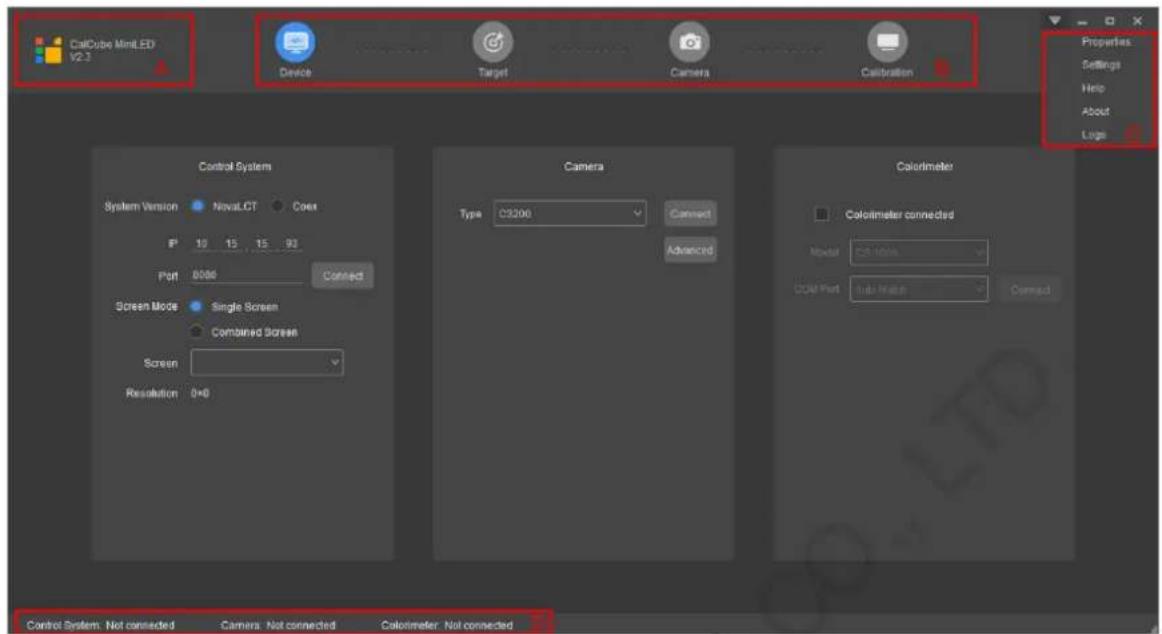
| Area | Content | Description |
| A | CalCube MiniLED and logo | Software name and logo |
| V2.3 | Software version | |
| B | Device | Connect the control system, camera and colorimeter devices. |
| Target | Obtain the original values of LED display, set the calibration target values, etc. | |
| Camera | Set partition information and analyze image parameters obtained by camera. | |
| Calibration | Display the parameters used to calibrate the screen, including display control, brightness data, target values, etc. | |
| C | Properties | View information such as project name, module size, and calibration mode. |
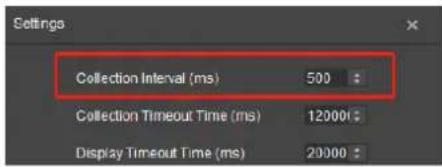
| Settings | Provide functions such as setting collection interval, software timeout, expanded module rows and columns, log save path, and more. | |
| Help | Open the software help document. | |
| About | Display the vendor information, including software name and version, company information, and official email address. | |
| Logs | Provide a direct access to the directory where the relevant logs are located for users to easily obtain the logs. | |
| D | Control System | Display the control system connection status. |
| Camera | Display the camera connection status. | |
| Colorimeter | Display the colorimeter connection status. |
Note:
If the resolution of the screen to be calibrated is higher than 2K, select Settings > Collection Interval in area C to increase the number of interval appropriately.
2 Basic Calibration Procedure
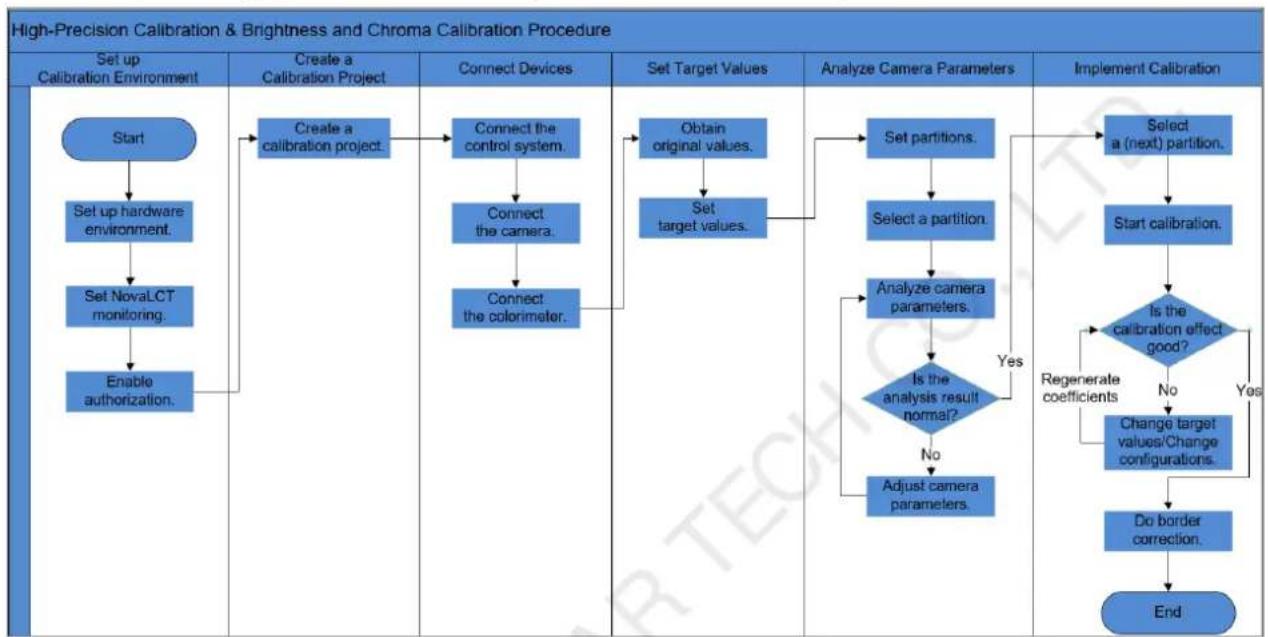
The basic calibration procedure includes setting up calibration environment, creating a calibration project, connecting devices, setting target values, analyzing camera parameters and enabling calibration. Different calibration modes have different calibration procedures.
High-Precision Calibration & Brightness and Chroma Calibration
Figure 2-1 High-precision calibration & brightness and chroma calibration procedure
flowchart
graph TD
    A["Start"] --> B["Set up hardware environment."]
    B --> C["Set NovaLCT monitoring."]
    C --> D["Enable authorization."]
    D --> E["Create a calibration project"]
    E --> F["Connect the control system."]
    F --> G["Connect the camera."]
    G --> H["Connect the colorimeter."]
    H --> I["Obtain original values."]
    I --> J["Set target values."]
    J --> K["Analyze camera parameters."]
    K --> L{Is the analysis result normal?}
    L -->|Yes| M["Regenerate coefficients"]
    L -->|No| N["Change target values/Change configurations."]
    N --> O["Do border correction."]
    O --> P["End"]
    K --> Q["Adjust camera parameters."]
    Q --> R{Is the calibration effect good?}
    R -->|Yes| S["Implement Calibration"]
    R -->|No| T["Select a (next) partition."]
    T --> U["Start calibration."]
    U --> V{Is the calibration effect good?}
    V -->|Yes| W["Implement Calibration"]
Full-Grayscale Calibration
Figure 2-2 Full-grayscale calibration procedure

flowchart
graph TD
    A["Start"] --> B["Finish the Precise Grayscale operation."]
    B --> C["Set up hardware environment."]
    C --> D["Set NovaLCT monitoring"]
    D --> E["Enable authorization."]
    E --> F["Create a calibration project"]
    F --> G["Connect the control system."]
    G --> H["Connect the camera."]
    H --> I["Connect the colorimeter."]
    I --> J["Obtain original values."]
    J --> K["Set target values."]
    K --> L["Analyze camera parameters"]
    L --> M{Is the analysis result normal?}
    M -->|No| N["Adjust camera parameters."]
    M -->|Yes| O["Regenerate coefficients"]
    O --> P{Is the calibration effect good?}
    P -->|No| Q["Change target values/Change configurations."]
    P -->|Yes| R["End"]
    Q --> S["Do border correction."]
    S --> T["End"]
    style A fill:#f9f,stroke:#333
    style T fill:#bbf,stroke:#333
Note
Before full-grayscale calibration, make sure you have finished the Precise Grayscale operation of Image Booster for the screen in NovaLCT. For details, please refer to NovaLCT LED Configuration Tool for Synchronous Control System User Manual.
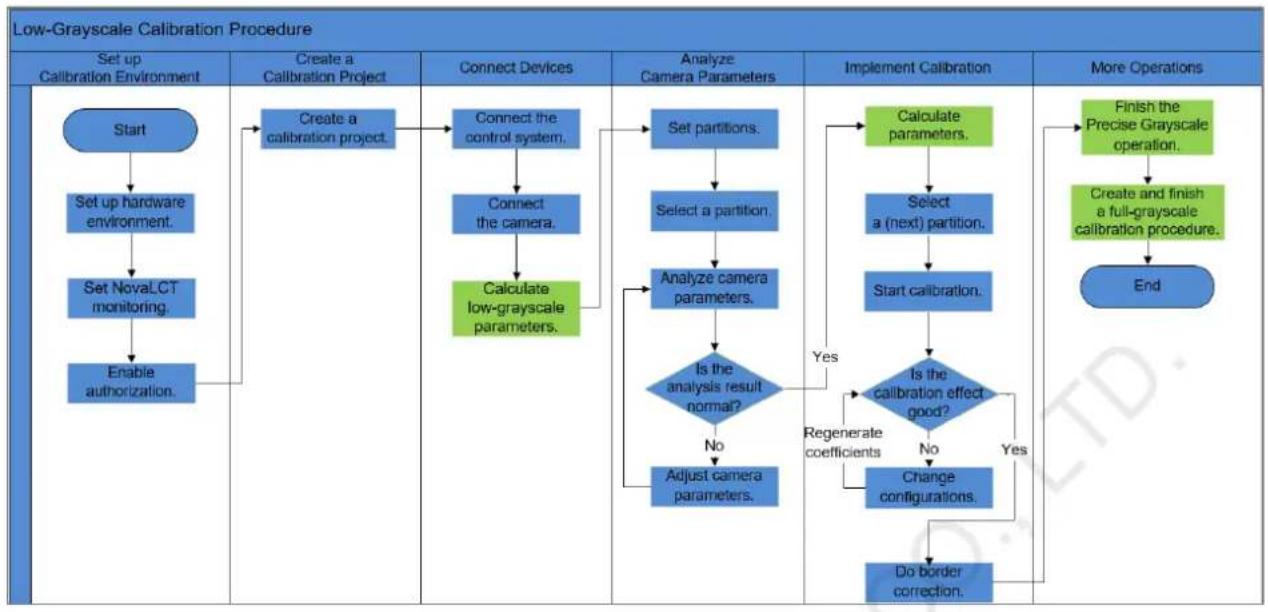
Low-Grayscale Calibration
Figure 2-3 Low-grayscale calibration procedure
flowchart
graph TD
    A["Start"] --> B["Set up hardware environment."]
    B --> C["Set NovaLCT monitoring."]
    C --> D["Enable authorization."]
    D --> E["Create a calibration project."]
    E --> F["Connect the control system."]
    F --> G["Connect the camera."]
    G --> H["Calculate low-grayscale parameters."]
    H --> I{Is the analysis result normal?}
    I -->|No| J["Adjust camera parameters."]
    I -->|Yes| K{Is the calibration effect good?}
    K -->|Yes| L["Regenerate coefficients"]
    K -->|No| M["Change configurations."]
    M --> N["Do border correction."]
    N --> O["Implement Calibration"]
    O --> P["Calculate parameters."]
    P --> Q["Select a (next) partition."]
    Q --> R["Start calibration."]
    R --> S{Is the calibration effect good?}
    S -->|Yes| T["Finish the Precise Grayscale operation."]
    S -->|No| U["Change configurations."]
    U --> V["End"]
Note
For screens that use special ICs, after the low-grayscale calibration procedure is finished, do a full-grayscale calibration procedure to ensure a good calibration effect.
3 Calibration Preparations
3.1 Set up Hardware Environment
3.1.1 Configuration List
| Calibration Tools | Type | Description |
| Camera | C1200 | Collect LED display images. |
| C3200 | ||
| Colorimeter | CS-100A | Measure the original values of the LED display.A Colorimeter, such as light gun, color analyzer, or spectroradiometer, is a device that measures color characteristics of the LED display. |
| CS-2000 | ||
| CA-410 | ||
| Dongle | / | It is a USB dongle and contains the software authorization file. |
| Controller | / | Convert audio and video signals from the computer and send them to the LED display.To use the Super Resolution Imaging function, please select the CX series, MX series, and MCTRL4K controllers.Note: This function is enabled by default in low-grayscale calibration mode. |
| Router | / | Provide long-distance network connection. |
| Computer | Control computer | When the CalCube MiniLED software works with the NovaLCT control system, install NovaLCT on the control computer to control the LED display.When the CalCube MiniLED software works with the Coex control system, the software connects to the controller via Ethernet cable directly and no control computer is needed. |
| Calibration computer | A computer installed with CalCube MiniLED software to calibrate the LED display |
Note
If you use the C3200 for calibration, the recommended configuration for the calibration computer is as follows.
• CPU: 3.0 GHz or greater
• RAM: 16 G or greater
• Network adapter: Intel(R) Ethernet Connection network adapter
- Operating system: Windows 10 (64-bit)
| Required System | Name | Version |
| Control system | NovaLCT | V5.4.2 or later |
| Coex | V1.0.0 or later |
3.1.2 System Architecture
Figure 3-1 System architecture - one computer used
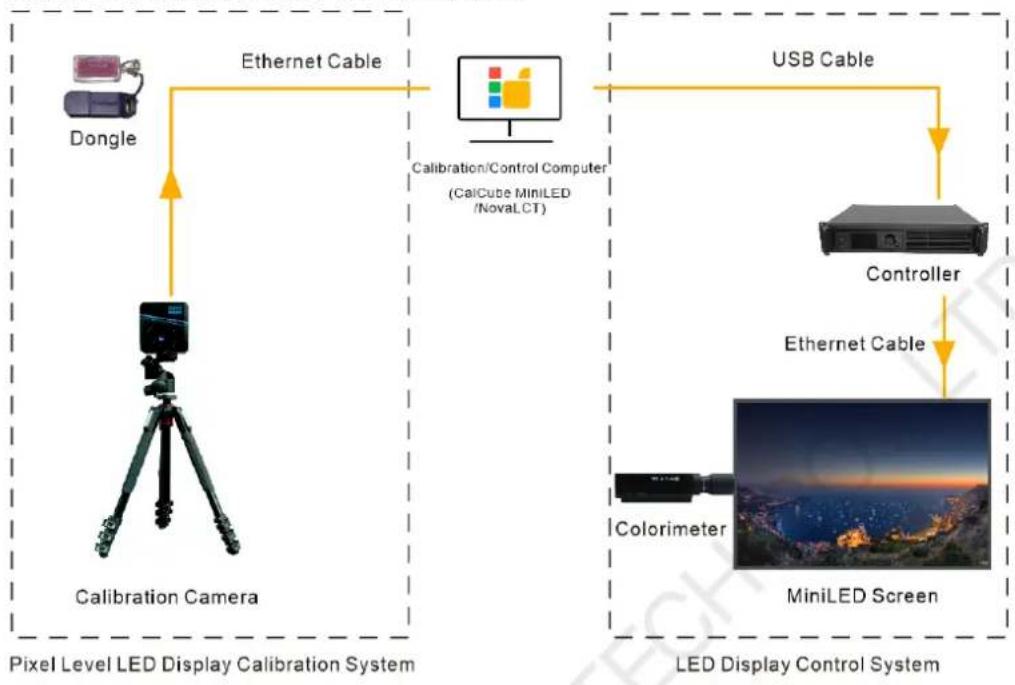
flowchart
graph TD
    subgraph "Pixel Level LED Display Calibration System"
        A["Dongle"] --> B["Calibration Camera"]
        C["Ethernet Cable"] --> B
        B --> D["LED Display Control System"]
    end

    subgraph "LED Display Control System"
        E["Controller"] --> F["MiniLED Screen"]
        G["Colorimeter"] --> F
        F --> H["USB Cable"]
        H --> I["Ethernet Cable"]
        I --> J["Calibration/Control Computer (CalCube MiniLED / NovaLCT)"]
    end

    A --> C
    C --> E
    E --> F
    F --> H
    H --> I
Figure 3-2 System architecture - two computers used

flowchart
graph TD
    subgraph "Pixel Level LED Display Calibration System"
        direction LR
        A["Dongle"] --> B["Calibration Computer (CalCube MiniLED)"]
        B --> C["Ethernet Cable"]
        C --> D["Calibration Camera"]
        D --> E["Pixel Level"]
    end

    subgraph "LED Display Control System"
        direction LR
        F["Control Computer (NovaLCT)"] --> G["USB Cable"]
        G --> H["Controller"]
        H --> I["Ethernet Cable"]
        I --> J["MiniLED Screen"]
        J --> K["Colorimeter"]
    end

    B -->|TCP/IP| F
    F -->|USB Cable| H
    H -->|Ethernet Cable| I
Note:
- Before calibration, make sure that the calibration computer and graphics card have the same resolution and the scale is set to 100%. In addition, scaling must be disabled on the controller.
- When the CalCube MiniLED software works with the Coex control system, the software connects to the controller via Ethernet cable directly and only one computer is enough. There is no distinction between control computer and calibration computer.
3.1.3 Calibration Environment
Light Requirements
Ensure the following calibration site requirements are met:
- There is no external light interference and no obvious light around the screen during the calibration process.
- There is no infrared light emitting equipment (such as infrared light-sensing camera) at the camera alignment position.
Calibration Distance
Make sure the LED partition image is in the center of the camera preview area and takes only 4/5 of the preview area.
For example, to calibrate a COB screen with a pixel pitch of P0.9, the best distance for a 4K screen is 7 m to 8 m, and the best distance for a 2K screen is 3 m to 4 m.
Note:
The camera lens needs to be perpendicular to the center of the screen (left and right center + up and down center) to avoid a large angle, otherwise abnormal results such as Moiré are likely to occur.
Figure 3-3 Illustration of calibration environment

natural_image
Interior of a modern studio with a green screen and camera rig, under purple lighting (no visible text or symbols)3.2 Configure Software Environment
3.2.1 Network Connection
When the CalCube MiniLED software works with the NovaLCT control system, network connection settings are required. When the CalCube MiniLED software works with the Coex control system, the software connects to the controller with Ethernet cable directly and there is no distinction between control computer and calibration computer. In this situation, skip this section.
- If the control computer and calibration computer are the same one:
No network connection is required. The entire calibration procedure can be completed on the single computer.
- If the control computer and calibration computer are separate:
If the distance between the two computers is within 100 meters, use Ethernet cables to connect them directly. If the distance is greater than 100 meters, connect them wirelessly.
- Cable connection: Connect the computers to the LAN ports of the router with Ethernet cable.
- Wireless connection: Connect the computers to the Wi-Fi of the router.
With cable connection or wireless connection, IP addresses of the two computers and the default IP address of router must be on the same network segment when a control system is connected for calibration.
Figure 3-4 Connection method

flowchart
graph LR
    A["Calibration Computer"] -->|LAN| B["Control Computer"]
Note:
- When two computers are used, the calibration computer's Ethernet port needs to be connected directly to the C3200 camera. To realize communication between the calibration computer and control computer, connect a HUB that converts USB to Ethernet port to a USB port of the calibration computer.
- The control computer and calibration computer can be laptop or desktop computer.
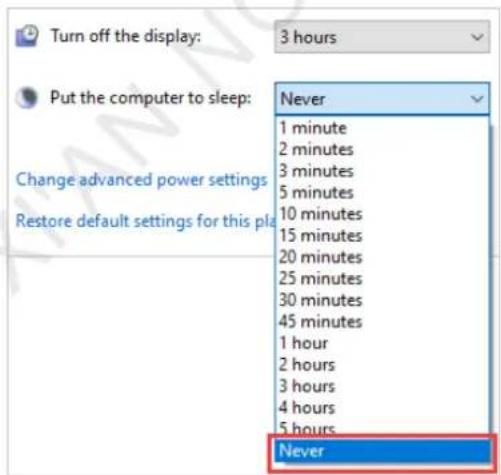
3.2.2 Disable Computer Sleeping
Step 1 Right-click a blank area on the desktop of the control computer and select Personalize.
Step 2 On the displayed page, select Screen Saver in the lower right corner.
Step 3 Choose Change power settings > Change plan settings.
Step 4 Set the computer sleeping settings to Never.
3.2.3 Jumbo Packet Settings
If you use the C3200 for calibration, the calibration computer requires jumbo packet settings. If you use the C1200, ignore this section.
Step 1 Right-click the Computer icon on the desktop and select Manage to open the Computer Management page.
Step 2 Click Device Manager on the left panel and then select Network adapters.

Step 3 In the drop-down options under Network adapters, double-click the computer's primary network adapter. At the same time, make sure that the C3200 calibration camera is connected to the computer's primary network adapter.
Step 4 In the displayed properties window, click the Advanced tab and change the following adapter parameters.
- Set Jumbo Packet to 9014 Bytes.
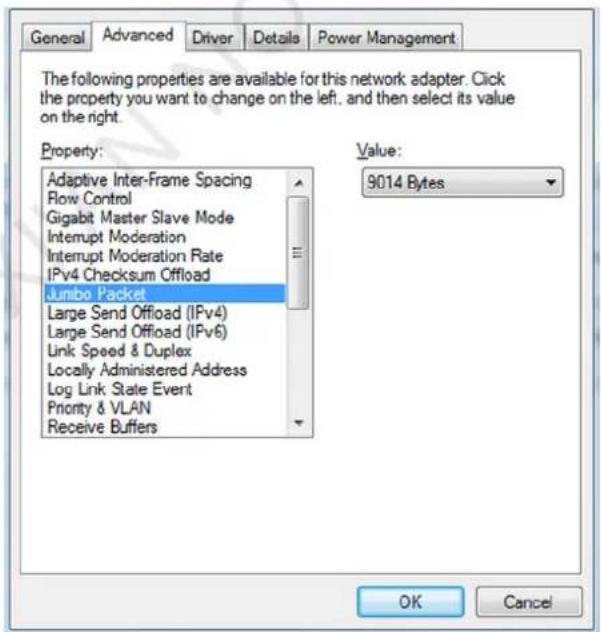
- Set Receive Buffers to 2048.
Step 5 Click OK.
3.3 Set NovaLCT Monitoring
If the CalCube MiniLED software works with the NovaLCT control system, monitoring settings are required. If the Coex control system is used, skip this section.
Step 1 Open NovaLCT and ensure good communication between the calibration computer and control computer.
Step 2 Choose User > Advanced Synchronous System User Login, enter the password (initial password: admin), and click Login.
Figure 3-5 Login

Step 3 Click Calibration to open the calibration page.
Figure 3-6 Calibration button

Step 4 On the Screen Calibration page, set Local IP and Port under Network Setting.
- Local IP: Indicates the IP address of the control computer. This IP address and the IP address of the calibration computer must be on the same network segment.
- Port: The default value is 8080.
If a message saying Enable network monitoring successfully is displayed, the monitoring settings are done in NovaLCT. If a message indicating that monitoring failed is displayed, please check whether the network connection is normal and whether there is a port conflict. If there is a conflict, change the port number and try again.
Figure 3-7 Ready for calibration

3.4 Enable Authorization
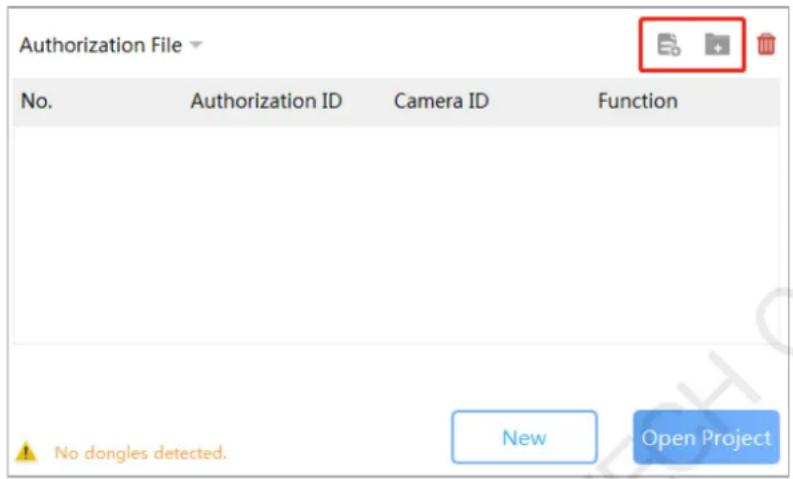
The authorization management method of CalCube MiniLED is that a dongle and an authorization file are bond. A dongle corresponds to an authorization file. Both the dongle and authorization file are required. The authorization file can be obtained from the USB drive provided along with the software.
Step 1 Open CalCube MiniLED and insert the dongle into the USB port of the calibration computer.
Step 2 In the Authorization File area, click 📄 or 🙏 to import the authorization file corresponding to the dongle. The software will search for and find all the authorization files in a folder containing five subdirectories at most, and read and import them to the software.
Note:
- During authorization file importing, if both the newly imported camera ID and authorization ID are the same as the authorization information imported earlier, the new information will replace the old information by default.
- During authorization file importing, if the newly imported camera ID is the same as the camera ID imported earlier but the new and old authorization IDs are different, the software will automatically add the new authorization file.
- An authorization ID can correspond to only one camera ID.
4 Create a Calibration Project
Step 1 Select Screen Calibration and click the New button to open the project page.
Step 2 (Optional) On the displayed Project page, change the project name.
The project name defaults to "New_Screen_YearMonthDayHourMinuteSecond". The project name can contain Chinese characters, English letters, numbers and underlines. You are advised to use an easy-to-understand project name.
Step 3 Click next to Path to choose a path to save the project. The default path is desktop.
Figure 4-1 Choosing project save path

Step 4 Click next to Image Save Path to choose a path to save the images. The default path is Documents/NovaCLB/Screen.
Figure 4-2 Choosing image save path

Step 5 Check whether the sizes of modules are the same. They are the same by default.
- Same: Go to Step 6.
• Different: Got to Step 7.
Step 6 Enter Width and Height values.
Please enter the values according to the actual module size to ensure a perfect transition of differences between modules after calibration.
Step 7 Deselect Same Module Size to skip module size setting.
Step 8 Select a calibration mode from High-Precision Calibration, Brightness and Chroma Calibration, Full-Grayscale Calibration, and Low-Grayscale Calibration.
• High-Precision Calibration: It is suitable for calibration of common COB screens.
- Brightness and Chroma Calibration: It is suitable for calibration of common SMD screens.
- Full-Grayscale Calibration: Select this mode if you want to ensure good calibration effect at medium grayscale and low grayscale, and if the calibration site has the supporting equipment that supports full grayscale calibration.
- Low-Grayscale Calibration: It is suitable for calibration of screens that use special driver ICs and have bad low-grayscale effect.
Step 9 Click OK to finish creating a project and enter the main user interface.
5 Calibration Operation Instructions
Before calibration, if this is your first time to perform the calibration process, please follow chapter 3 Calibration Preparation to complete the calibration preparations, such as calibration environment setup.
5.1 Device
5.1.1 Connect a Control System
Coex Control System
Step 1 Click Refresh and the Coex control system will be automatically connected.
After successful connection, Coex will be displayed next to Control System in the status bar at the bottom.
Figure 5-1 Connecting the Coex control system
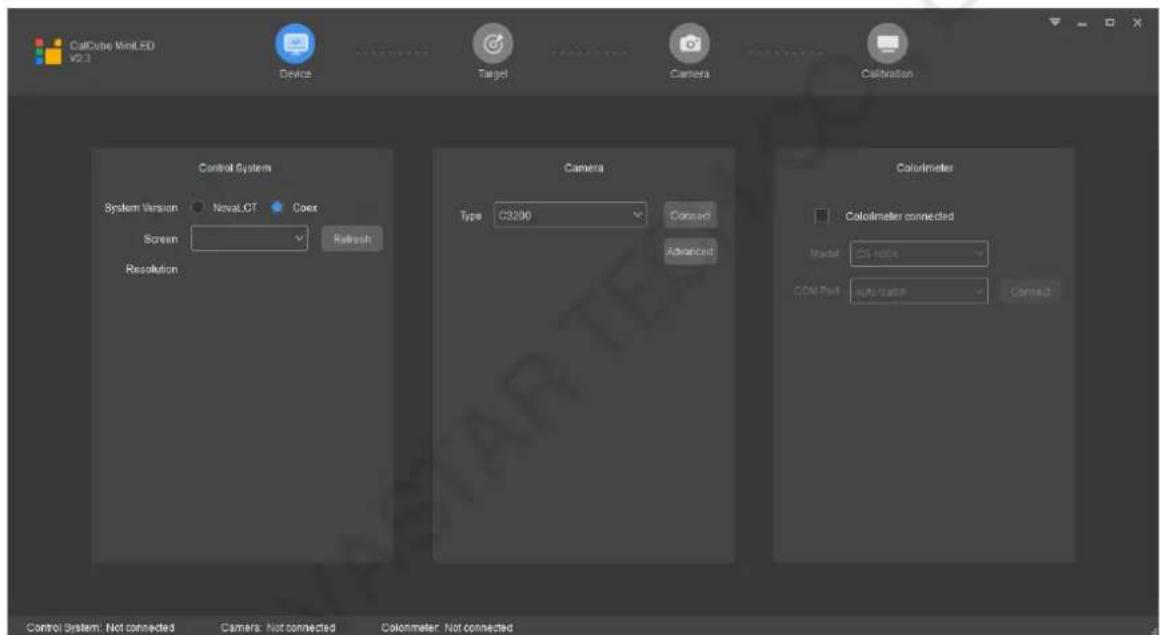
Step 2 Click next to Screen to select the screen to be calibrated.
Resolution shows the current screen resolution that is read from Coex. If you want to change the resolution, please reconfigure the screen size first.
NovaLCT Control System
Step 1 Obtain the IP address and port number from the Screen Calibration page in NovaLCT.
Figure 5-2 Network setting in NovaLCT

Step 2 On the Device page in CalCube MiniLED, enter the obtained information in the IP and Port boxes in the Control System area, and click Connect.
After NovaLCT is successfully connected, NovaLCT will be displayed next to Control System in the status bar at the bottom.
Figure 5-3 Control system information

Step 3 Choose a screen mode according to the on-site screen assembly mode, either single screen or combined screen.
Step 4 Click next to Screen to select the screen to be calibrated.
Resolution shows the current screen resolution that is read from NovaLCT. If you want to change the resolution, please reconfigure the screen size first according to NovaLCT LED Configuration Tool for Synchronous System User Manual.
Note:
If the control system connection failed, please check to make sure:
- The firewall has been logged out or closed (only when the control computer and calibration computer are separate).
- The control system is running normally.
- The authorization file you loaded is correct.
- The dongle you inserted matches the camera.
- The calibration computer and control computer are on the same network segment.
5.1.2 Connect a Camera
CalCube MiniLED supports the Caliris industrial cameras, including the C1200 and C3200 models.
Note:
In low-grayscale calibration mode, only the C3200 camera is supported.
Connect the C1200
Step 1 Connect the camera to a power supply and to the calibration computer with USB cable. After the camera indicator turns green, click Connect in the Camera area in CalCube MiniLED.
Step 2 After successful connection, a prompt saying "Camera connected successfully" is displayed and the model of the connected device is displayed next to Camera in the status bar at the bottom.
Connect the C3200
Step 1 Connect the camera to a power supply and to the calibration computer with USB cable. After the camera indicator turns green, click Connect in the Camera area in CalCube MiniLED.
Step 2 When you connect the C3200 camera for the first time for calibration, click the Advanced button and select Initialize Camera to adjust the collection efficiency of the C3200 to the best.
On this window, you can also configure the camera IP address manually or restart the camera if needed.

Step 3 After successful connection, a prompt saying "Camera connected successfully" is displayed and the model of the connected device is displayed next to Camera in the status bar at the bottom.
Note:
Because the C3200 camera has a compatibility issue with some computers and causes connection failure, you can reconnect the camera by disabling the network adapter connected to the C3200 and re-enabling it.
The camera can be managed by using the tool that is installed together with CalCube MiniLED. For details, see 6.2 Auxiliary Tool for C3200 Camera.
5.1.3 Connect a Colorimeter
The colorimeter is used to measure the brightness and chroma of the current screen. The tool is optional. The measured values are the original values of the LED screen.
Step 1 Check whether a colorimeter is connected in the calibration environment.
- Connected: Go to Step 2.
- Not connected: Skip this section.
Step 2 Install the colorimeter driver program on the calibration computer.
Step 3 Select Colorimeter connected.
Step 4 Click next to Model to select the model of the connected colorimeter.
Step 5 Click next to COM Port to select the COM port number.
Note:
If the corresponding port number is not listed, follow the steps below to troubleshoot:
Step I: Check whether the connection between the colorimeter and calibration computer is normal.
• Normal: Go to Step II.
- Abnormal: Reconnect the colorimeter to the calibration computer, restart the software, and go to Step 5.
Step II: Check whether the device driver is normal.
- Normal: Please contact NovaStar technical support.
- Abnormal: Install the colorimeter driver again, restart the software, and go to Step 5.
Step 6 After settings, click Connect.
After successful connection, an actual colorimeter model such as CS-2000, CS-100A, or CA-410 will be displayed next to Colorimeter in the status bar at the bottom.
If you do not select Colorimeter connected, you will not need to use colorimeter to measure the original values. The Model and COM Port will be grayed out and unavailable.
5.1.4 Set Low-Grayscale Parameters
In low-grayscale calibration mode, you need to set the low-grayscale parameters. Skip this section in other calibration modes.

- Number of Calibration: The number of low-grayscale calibration. It defaults to 3. You can set it based on the screen uniformity situation and your calibration experience.
- Max Coef: Enter the maximum calibration coefficient value based on the receiving card chip type (please ask the chip supplier).
- Initial Coefs: Set the initial coef values for the red, green and blue before calibration for the camera. The follow-up calibration coefs will be based on these values.
5.2 Target
5.2.1 Obtain Original Values
Original values are the brightness and chroma information of the LED display before calibration. They are measured by the colorimeter. Please obtain as accurate as possible the original values, which can improve the calibration quality of the LED display.
• Measure original values manually
Step 1 Set the display brightness for measuring the original values of the display. Once you have set the brightness and started measuring the red, green and blue colors, you cannot change the brightness value. There are 3 methods to set brightness:
- Drag the slider.
- Click

- Enter a value.
Step 2 Select one color to be measured at a time, such as red, green and blue.
• Measure original values automatically
If the colorimeter is connected to the software, click Auto Measure. The software will automatically read and display the original brightness and chroma values.
Figure 5-4 Automatic measurement

other
Original Values | | Brightn... | Cx | Cy | |---|---|---|---| | R | 0.93 | 0.6926 | 0.3046 | | G | 1.54 | 0.1750 | 0.7370 | | B | 0.29 | 0.1278 | 0.0783 | Auto Measure Brightness : 255 : Color : ● ■ ■ ■ ■Note:
To calibrate MiniLED screens, a colorimeter must be used to measure the original values. In this way, the calibration result can be better and the target values can be modified based on the calibration result after the calibration is complete.
5.2.2 Set Target Values
Target values are the brightness and chroma values you expect for the LED screen after calibration. The system will automatically generate a group of target values based on the measured original values. The recommended values can be used for common COB screens.
You can also customize the target values based on the on-site requirements, but the value of each target value parameter cannot exceed the value of each original value parameter.
Customize Target Values
There are two methods to customize target values.
- Enter values
Double click a value of Brightness, Cx or Cy, and enter a target value with the keyboard.
Cx is x-coordinate in the color space and Cy is the y-coordinate.
Every time you change a parameter value, the Brightness Decay Percentage and Color Space diagram will be updated correspondingly.
- Change the brightness decay percentage or color temperature, and the color space diagram together
There are two methods to adjust the brightness:
Drag the R, G and B sliders under Brightness Decay Percentage to set the brightness decay. If you select Synchronous Decay, the R, G and B brightness will be reduced in the same proportion when you adjust any of them.
- Select Keep Color Temperature and adjust the color temperature. You can directly use a recommended color temperature value below the slider bar.
You can move the mouse to change the coordinates in the color space and adjust the chroma. Chroma and brightness changes can be viewed in real time in the target value table.

other
| X | Y | Value | |------|------|-------| | 0.1 | 0.1 | 470 | | 0.2 | 0.7 | 530 | | 0.3 | 0.5 | 540 | | 0.4 | 0.4 | 560 | | 0.5 | 0.3 | 570 | | 0.6 | 0.2 | 580 | | 0.7 | 0.1 | 590 | | 0.8 | 0.0 | 600 | | 0.9 | -0.1 | 610 | | 1.0 | -0.2 | 620 | | 1.1 | -0.3 | 630 | | 1.2 | -0.4 | 640 | | 1.3 | -0.5 | 650 | | 1.4 | -0.6 | 660 | | 1.5 | -0.7 | 670 | | 1.6 | -0.8 | 680 | | 1.7 | -0.9 | 690 | | 1.8 | -1.0 | 700 | | 1.9 | -1.1 | 710 | | 2.0 | -1.2 | 720 | | 2.1 | -1.3 | 730 | | 2.2 | -1.4 | 740 | | 2.3 | -1.5 | 750 | | 2.4 | -1.6 | 760 | | 2.5 | -1.7 | 770 | | 2.6 | -1.8 | 780 | | 2.7 | -1.9 | 790 | | 2.8 | -2.0 | 800 | | 2.9 | -2.1 | | | 3.0 | -2.2 | | | Note: The actual values for 'Original' and 'Target' are not provided in the code snippet, so they are represented as NaN or missing values outside the plot area.In the figure above, the white triangle represents the original color gamut, namely the original brightness and chroma values measured by the colorimeter. The black triangle represents the target color gamut. The figure above also shows the area of the current color gamut that will be lost after adjustment. When you drag the black triangle to change its size, the target brightness and chroma values change accordingly in real time. The black triangle cannot go beyond the white triangle when you are dragging. That is to say, target values cannot be greater than the original values.
You can click to enlarge the color space diagram to adjust target values more precisely.
Figure 5-5 Larger view of color space diagram

heatmap
| Value | Original | Target | |-------|----------|--------| | R | 902.00 | 0.6900 | | G | 1990.00 | 0.1700 | | B | 327.00 | 0.1300 | | W | 2259.30 | 0.3150 | | R | 631.40 | 0.6870 | | G | 1393.00 | 0.1730 | | B | 228.90 | 0.1330 | | W | 2259.30 | 0.3150 | | R | 631.40 | 0.6870 | | G | 1393.00 | 0.1730 | | B | 228.90 | 0.1330 | | W | 2259.33 | 0.3150 | | R | 631.40 | 0.6870 | | G | 1393.00 | 0.1730 | | B | 228.90 | 0.1330 | | W | 2259.33 | 0.3150 | | R = 470X, G = 460, W = 480, C = 490, C = 510, C = 530, C = 540, C = 550, C = 570, C = 580, C = 590, C = 600, C = 610, C = 620, C = 630, C = 640, C = 660, C = 680, C = 700, C = 720, C = 740, C = 760, C = 780, C = 800, C = 820, C = 840, C = 860, C = 880, C = 900, C = 920, C = 940, C = 960, C = 980, C = 1000, C = 1020, C = 1040, C = 1060, C = 1080, C = 1120, C = 1140, C = 1160, C = 1180, C = 1220, C = 1240, C = 1260, C = 1280, C = 1320, C = 1340, C = 1360, C = 1380, C = 1420, C = 1440, C = 1460, C = 1480, C = 1520, C = 1540, C = 1560, C = 1580, C = 1620, C = 1640, C = 1660, C = 1680, C = 1720, C = 1740, C = 1760, C = 1780, C = 1820, C = 1840, C = 1860, C = 1880, C = 1920, C = 1940, C = 1960, C = 1980, C = 2020, C = 2040, C = 2060, C = 2125, C = 2145, C = 2165, C = 2225 | | R | | | | G | | | | B | | | | R | | | | G | | | | B | | | | W | | | | R | | | | G | | | | B | | | | W | | | | R | | | | G | | | | B | | | | W | | | | R | | | | G | | | | B | | | | W | | | R | | | | G | | | | B | | | | W | | | | R | | | | G | | | | B | | | | W | | | | R | | | | G | | | | B | | | | W | | | | R | | | | G | | | | B | | | | W | | | | R | | | | G | | | | B | | | | W | | | | R | | | | G | | | | B | | | | W | | | | R | | | | G | | | | B | | | | W | | end end subgraph "Keep Color Temperature" direction: Red=Blue subgraph "Original Values" direction: Blue direction: Green direction: Yellow direction: Red direction: Yellow direction: Blue direction: Black direction: Black direction: Black direction: Black direction: Black direction: Black direction: Black direction: Black direction: Black direction: Black direction: Black direction: Black direction: Black direction: Black direction: Black direction: Black direction: Black direction: Black direction: Black direction: Black direction: Orange direction: White direction: DarkRed direction: Red direction: Red direction: Red direction: Red direction: Red direction: Red direction: Red direction: Red direction: Red direction: Red direction: Red direction: Red direction: Red direction: Red direction: Red direction: Red direction: Red direction: Red direction: Red direction: Red direction: Orange direction: White direction: DarkRed direction: Red direction: Red direction: Red direction: Red direction: Red direction: Red direction: Red direction: Orange direction: White direction: DarkRed direction: Red direction: Red direction: Red direction: Red direction: Red direction: Red direction: Orange direction: White direction: DarkRed direction: Red direction: Red direction: Red direction: Red direction: Red direction: Orange direction: White direction: DarkRed direction: Red direction: Red direction: Red direction: Red direction: Orange direction: White direction: DarkRed direction: Red direction: Red direction: RedNote:
If you have enabled the Generate Target Values function on the Custom Procedure page, calibration coefficients will be generated based on the target values that are automatically generated by the software. The target color gamut set by you will not take effect.
5.3 Camera
5.3.1 Select Grayscale Levels
In full grayscale calibration, you can view the collected grayscale levels and set them. In other calibration modes, skip this section.
Figure 5-6 Selecting grayscale levels
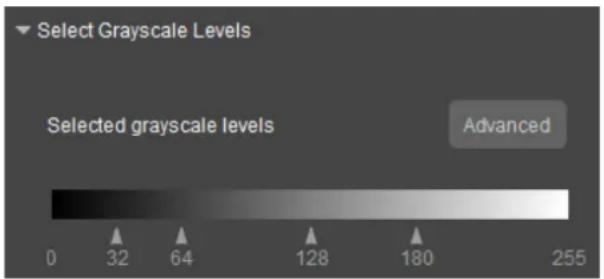
Click Advanced and on the displayed page, you can set the layers of grayscale level (4 layers by default) and position of grayscale level collection flexibly based on the screen characteristics. If the screen uniformity is not too bad, you can decrease the layer quantity appropriately to shorten the calibration time.
Figure 5-7 Selecting grayscale levels - Advanced

5.3.2 Set Partition Information
If the screen resolution is very high, the camera cannot collect image of the entire screen in just one time. You must divide the screen into multiple partitions for calibration.
Figure 5-8 Partition settings

Step 1 Check whether the screen has blocked parts or a bezel.
- No: Go to Step 2.
- Yes: Set the area to be calibrated or the bezel information. For details, see 5.3.4 Set Areas to Be Calibrated and 5.3.5 Set Bezel Information.
Step 2 Click the Partition button.
The system will automatically calculate the partition according to the screen resolution and the resolution of the image collected by the camera, and automatically set the unit size and partition information.
When the C3200 is used and you click the Partition button for the first time, a How to Adjust a Camera page will be displayed, guiding you on camera settings.
Step 3 View the partition size and unit size to determine whether customizing partition is necessary. If the saturation and image size are improper after camera parameter adjustment, you can change the unit size to change the pixel pitch and let the parameter analysis result become normal.
- Necessary: Go to Step 4.
- Unnecessary: Go to Step 5.
Note:
You are advised to set the unit size to 3×3 for 2K screens and 5×5 for 4K and larger screens.
Step 4 Select Custom Partition and click to select a unit size. Then, enter numbers or click to set Max Columns Collected Once and Max Rows Collected Once. The information of a single partition will be displayed next to Single Partition Size. At last, click the Partition button to confirm the partition information.
- Unit Size: Indicates the number of isolated LEDs. A total of 10 options are available: 1×1, 2×2, 3×3, 4×4, 5×5, 6×6, 7×7, 8×8, 9×9, 10×10.
- Max Rows Collected Once: Indicates the number of LED rows that can be collected each time.
- Max Columns Collected Once: Indicates the number of LED columns that can be collected each time.
The values of Max Rows Collected Once and Max Columns Collected Once cannot be greater than the maximum resolution of the image that can be collected by the camera.
- When Super Resolution Imaging is enabled
Only the C3200 camera is supported. The maximum resolution for the camera is 2300 × 1600 . - When Super Resolution Imaging is disabled
Maximum resolution for the C1200: 480×330
Maximum resolution for the C3200: 1050×650
- Single Partition Size: Indicates the resolution of a single partition.
The LED display will not be partitioned strictly according to the numbers of rows and columns you set to collect each time. There will be some smart adjustments. For example, if the resolution of the area to be calibrated is 208×208 and the rows and columns collected each time are set to 128×128, the software will change the size of a single partition to 104×104.
Step 5 Select a partition on the Partition Topology tab page. The selected area becomes light gray. When you move the mouse to the partition, the X, Y, W and H values will be displayed.
Figure 5-9 Selecting a partition
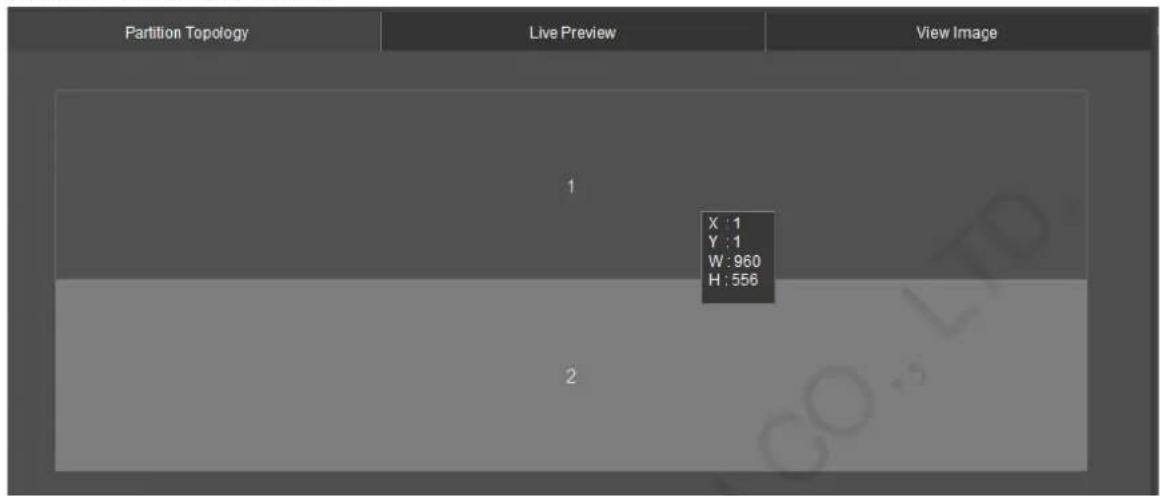
- X: Indicates the horizontal initial coordinate of the selected partition.
- Y: Indicates the vertical initial coordinate of the selected partition.
- W: Indicates the horizontal width of the selected partition.
● H: Indicates the vertical height of the selected partition.
Note:
Partition sizes may be uneven, which is normal and does not affect subsequent operations.
5.3.3 Analyze Camera Parameters
The CalCube MiniLED software supports four calibration modes: high-precision calibration, brightness and chroma calibration, full-grayscale calibration, and low-grayscale calibration. They have different camera parameter adjustment methods.
5.3.3.1 High-Precision Calibration & Brightness and Chroma Calibration
Figure 5-10 Analyzing camera parameters – High-Precision Calibration
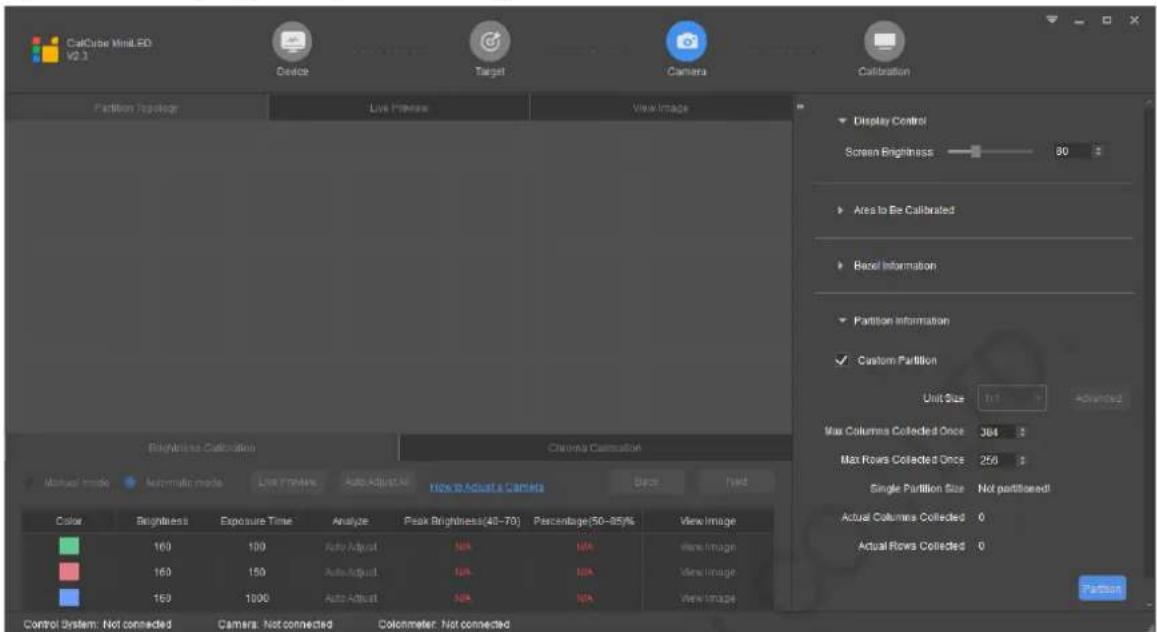
Step 1 On the current tab page, follow the method below to adjust the camera settings. Both the C1200 and C3200 cameras are supported.
There are different camera adjustment methods depending on whether the Super Resolution Imaging function is enabled. See the methods below.
Note:
-
When you connect the control system, the software automatically checks whether the connected controller supports the Super Resolution Imaging function. If it is supported, it will be enabled by default. Controllers that support this function include the CX series, MX series, and MCTRL4K.
-
You can enable or disable this function on the More Params tab page. After changing the switch status, camera parameter reanalysis is needed.
- When the Super Resolution Imaging function is enabled

- When the Super Resolution Imaging function is disabled
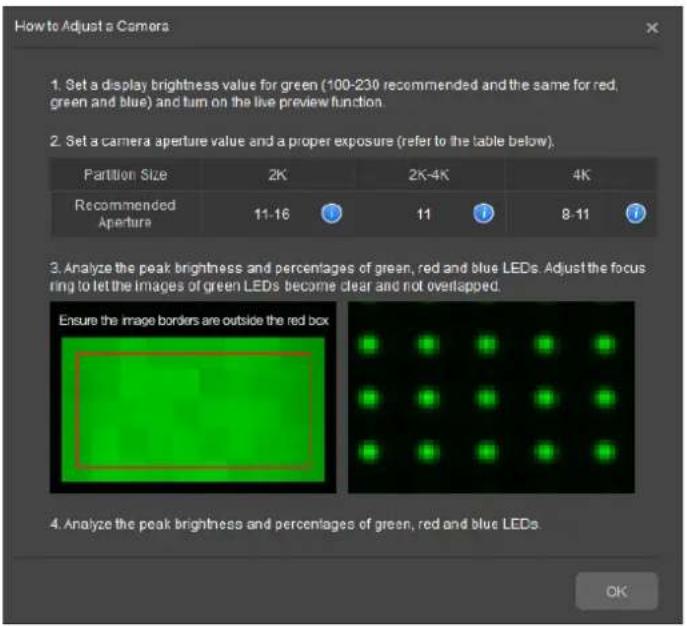
Step 2 Select the Auto Adjust method to adjust the settings for green.
After you click Airadis software will automatically analyze and adjust the Peak Brightness and Percentage values to be with the appropriate range. If these values still do not meet the requirements, adjust the focus ring and aperture. After adjustment, click Auto Adjust again.
Step 3 Eliminate the ambient light.
During adjustment, when the page below is displayed, drag the four vertexes to make the vertexes close to the edges of the image. The purpose is to adjust the effective calibration area and eliminate the interference light around the display to be calibrated. If the display area is normal, click OK directly.

Step 4 Select the Auto Adjust All method to adjust the settings for red and blue.
In this mode, you only need to click , and the software will automatically analyze and adjust the Peak Brightness and Percentage values to be with the appropriate range.
Step 5 Check the statuses of the Peak Brightness and Percentage values of all calibration procedures.
- If all the values are in white, they are normal. Go to Step 7.
- If a value is in red or a value cell has a red border, the value is abnormal. Go to Step 6.
Step 6 Switch to the Manual mode and adjust the abnormal values.
- For red values, adjust the Exposure Time value or turn the focus ring to adjust the focus.
Based on the difference between the actual values of Peak Brightness and Percentage and the standard value range, adjust the exposure time and focus ring properly, and click the Manually Adjust button.
- If the Peak Brightness value is below the appropriate range, increase the exposure time.
- If the Peak Brightness value is above the appropriate range, decrease the exposure time.
- If the Percentage value is below the appropriate range, turn the focus ring to let the image become blurry.
- If the Percentage value is above the appropriate range, turn the focus ring to let the image become clear.
- For red borders, click Advanced Adjustment in the Manual mode to adjust the filters that has a red value.
The adjustment method is the same as the above method. After adjustment, click OK to save the adjustments.

Step 7 Click the Chroma Calibration tab and repeat Step 2–Step 6 to finish the analysis and adjustment.
For the Brightness and Chroma Calibration mode, there is one calibration procedure only, as described above. After that procedure is finished, you can view the image directly.
Step 8 After adjustment, click View the images collected by camera during analysis.
Click to choose a color and view the collected image in that color. You can zoom in the image by clicking , entering a number, or pressing Ctrl and rolling the mouse wheel at the same time, to check whether the clarity of collected LEDs meet requirements.
5.3.3.2 Full-Grayscale Calibration
Figure 5-11 Camera parameter analysis – full-grayscale calibration

Step 1 On the High-Brightness tab page, adjust the camera settings at the default grayscale level for image displaying.
There are different camera adjustment methods depending on whether the Super Resolution Imaging function is enabled. See the methods below.
Note:
-
When you connect the control system, the software automatically checks whether the connected controller supports the Super Resolution Imaging function. If it is supported, it will be enabled by default. Controllers that support this function include the CX series, MX series, and MCTRL4K.
-
You can enable or disable this function on the More Params tab page. After changing the switch status, camera parameter reanalysis is needed.
- When the Super Resolution Imaging function is enabled
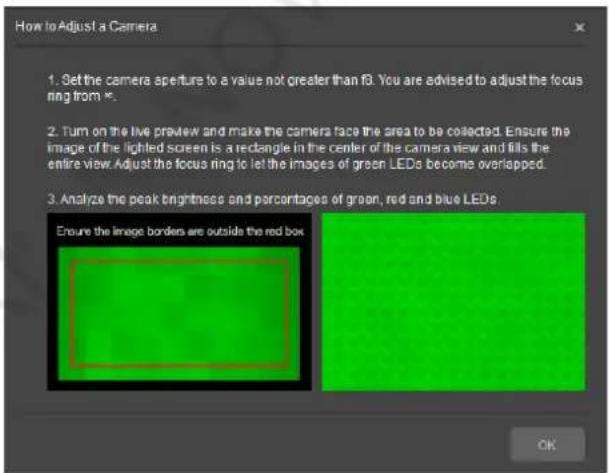
- When the Super Resolution Imaging function is disabled

Step 2 Select the Auto Adjust method to adjust the settings for green.
After you click Airadis software will automatically analyze and adjust the Peak Brightness and Percentage values to be with the appropriate range. If these values still do not meet the requirement, adjust the focus ring and aperture. After adjustment, click Auto Adjust again.
Step 3 Eliminate the ambient light.
During adjustment, when the page below is displayed, confirm the locating box. If the display area is normal, click OK directly. If the display area is abnormal, drag the vertexes to select the effective calibration area.

Step 4 Select the Auto Adjust All method to adjust the settings for red and blue.
In this mode, you only need to click Auto Adjust All, and the software will automatically adjust the Peak Brightness and Percentage values to be with the appropriate range.
Step 5 Check the statuses of Peak Brightness and Percentage values of all calibration procedures.
- If all the values are in white, they are normal. Go to Step 7.
- If a value is in red or a value cell has a red border, the value is abnormal. Go to Step 6.
Step 6 Switch to the Manual mode and adjust the abnormal values.
- For red values, adjust the Exposure Time value or turn the focus ring to adjust the focus.
Based on the difference between the actual values of Peak Brightness and Percentage and the standard value range, adjust the exposure time and focus ring properly, and click the Manually Adjust button.
- If the Peak Brightness value is below the appropriate range, increase the exposure time.
- If the Peak Brightness value is above the appropriate range, decrease the exposure time.
- If the Percentage value is below the appropriate range, turn the focus ring to let the image become blurry.
- If the Percentage value is above the appropriate range, turn the focus ring to let the image become clear.
- For red borders, click Advanced Adjustment in the Manual mode to adjust the filters that has a red value.
The adjustment method is the same as the above method. After adjustment, click OK to save the adjustments.
Figure 5-12 Advanced adjustment

Step 7 Click Next. On the Low-Brightness Parameter Record tab page, record the aperture and focus values.
Figure 5-13 Recording parameter values

Step 8 Click Next. On the High-Brightness tab page, refer to Step 2–Step 7 to adjust the high-brightness parameter and record the corresponding aperture and focus value.
Step 9 After adjustment, click ViewImage the images collected by camera during analysis.
Click to choose a color and view the collected image in that color. You can zoom in the image by clicking, entering a number, or pressing Ctrl and rolling the mouse wheel at the same time, to check whether the clarity of collected LEDs meet requirements.
5.3.3.3 Low-Grayscale Calibration
Figure 5-14 Camera parameter analysis – low-grayscale calibration

Step 1 On the Brightness Calibration1 tab page, follow the How to Adjust a Camera instructions to adjust the camera settings. Only the C3200 camera is supported and Super Resolution Imaging is enabled by default. The method of using the camera is as below.
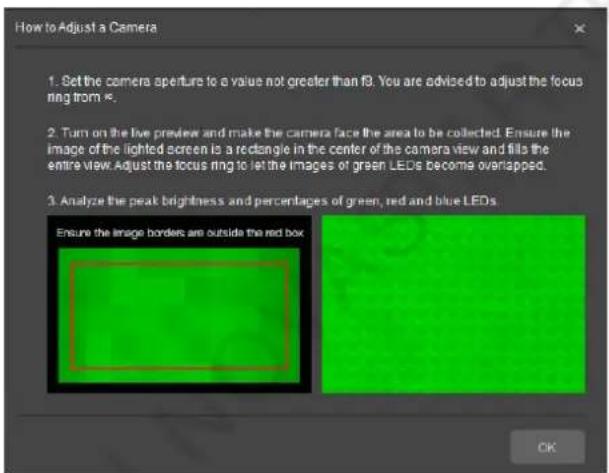
Step 2 Select the Auto Adjust method to adjust the settings for green.
After you click Auto adjust software will automatically analyze and adjust the Peak Brightness and Percentage values to be with the appropriate range. If these values still do not meet the requirements, adjust the focus ring and aperture. After adjustment, click Auto Adjust again.
Step 3 Eliminate the ambient light.
During adjustment, when the page below is displayed, confirm the locating box. If the display area is normal, click OK directly. If the display area is abnormal, drag the vertexes to select the effective calibration area.
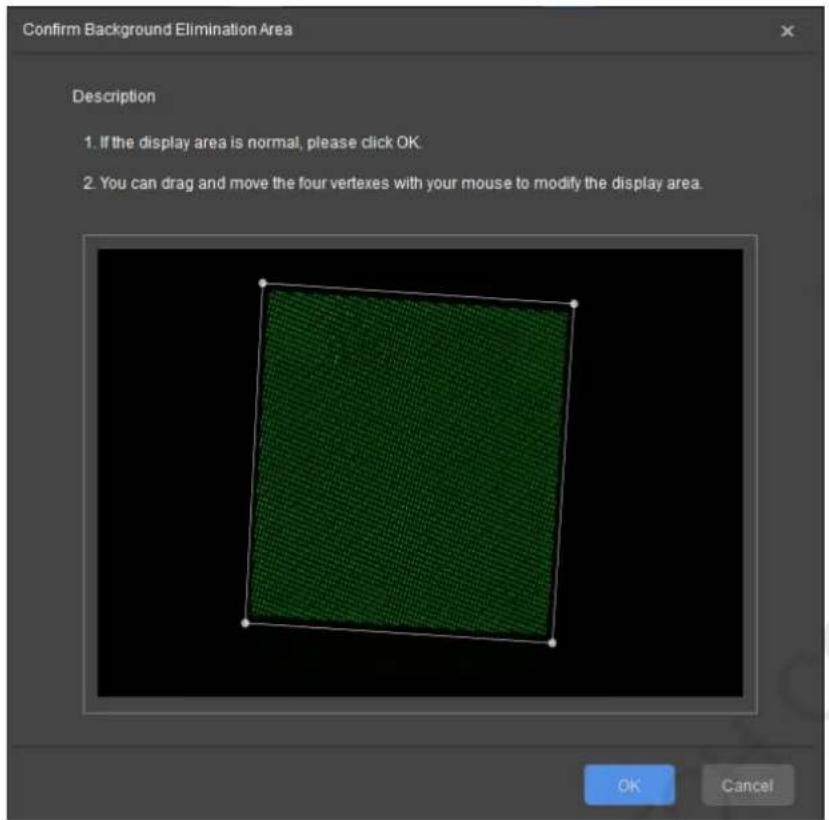
Step 4 Select the Auto Adjust All method to adjust the settings for red and blue.
In this mode, you only need to click AutoA-JustAll, and the software will automatically analyze and adjust the Peak Brightness and Percentage values to be with the appropriate range.
Step 5 Check the statuses of Peak Brightness and Percentage values of all calibration procedures.
- If all the values are in white, they are normal. Go to Step 7.
- If a value is in red, it is abnormal. Go to Step 6.
Step 6 Switch to the Manual Mode and adjust the abnormal values.
Adjust the Exposure Time values or turn the focus ring to adjust the focus.
Based on the difference between the actual values of Peak Brightness and Percentage and the standard value range, adjust the exposure time and focus ring properly, and click the Manually Adjust button.
- If the Peak Brightness value is below the appropriate range, increase the exposure time.
- If the Peak Brightness value is above the appropriate range, decrease the exposure time.
- If the Percentage value is below the appropriate range, turn the focus ring to let the image become blurry.
- If the Percentage value is above the appropriate range, turn the focus ring to let the image become clear.
Step 7 After procedure 1 analysis is complete, the software will automatically calculate and generate the camera parameter values of the rest procedures.
Step 8 After adjustment, click to view the images collected by camera during analysis.
Click to choose a color and view the collected image in that color. You can zoom in the image by clicking, entering a number, or pressing Ctrl and rolling the mouse wheel at the same time, to check whether the clarity of collected LEDs meet requirements.
5.3.4 Set Areas to Be Calibrated
When the areas to be calibrated are not on the same surface or they have a certain angle, they need to be set in the software. If there are no such situations, skip this section.
For example, for the screens mounted on the four sides of a pillar, there is a 90^ angle between each two adjacent screens. For adjacent screens that are separated by objects, they are not on the same surface.
Figure 5-15 Setting the area to be calibrated

Step 1 Set the information about the area to be calibrated by entering a number or clicking

● Full Screen Resolution: The screen resolution read by the software
- Start Row: The horizontal initial coordinate of the area to be calibrated
- Start Column: The vertical initial coordinate of the area to be calibrated
● Height: The height of the area to be calibrated
- Width: The width of the area to be calibrated
Step 2 Click Preview. The area to be calibrated turns green on the LED display. At this time, The Preview button changes to Stop. Click Stop to stop preview.
Step 3 After the settings are done, click Apply.
5.3.5 Set Bezel Information
When the screen to be calibrated has a bezel, the bezel information needs to be set in the software. If you do not set the information, positioning of the start LEDs during calibration and the calibration result will be affected. If there are no such situations, skip this section.
For example, the four sides of on-site screens can be sealed in order to prevent water or dust. Some rows and columns of LEDs near the sides are wrapped up.
Figure 5-16 Bezel information

Step 1 In the text box next to Top, enter the number of rows that are wrapped up.
Step 2 Click View to check whether the information you set is correct. The LEDs for which you set bezel information will display the image in white on the LED screen. When the first row of LEDs on top of the screen displays image, the top bezel setting is done.
Step 3 Repeat Step 1 and Step 2 to set the bottom, left and right bezels.
Step 4 After the settings are done, click Apply.
5.4 Calibration
5.4.1 Configure Procedure
For common COB screens, use High-Precision Calibration (default procedure). After selecting a partition, you can start calibration directly. Based on the on-site calibration situation, you can also select Full-Grayscale Calibration, Brightness and Chroma Calibration or Custom.
- To ensure good calibration effect in medium grayscale and low grayscale and if the calibration site has the supporting equipment that supports full grayscale calibration, select Full-grayscale calibration.
- For common LED screens, select Brightness and Chroma Calibration.
- If you need specific calibration effects, for example, blue and white optimization effect, automatic target value generation, etc., select Custom and configure the number of procedures based on the on-site calibration situation and select the functions for each procedure.
Figure 5-17 Procedure

Custom
Figure 5-18 Custom configuration

Step 1 Configure the number of procedures required.
- Click Add to add a calibration procedure.
- Click Delete to delete the current calibration procedure.
Step 2 Select a coef type.
- Brightness coef
This changes only brightness of the R, G and B primary colors. It does not sacrifice the color gamut of LED display, but it cannot eliminate chroma difference between LEDs. If the display does not have obvious chroma difference but has bright and dark blocks, use brightness calibration. - Chroma coef It is used in the scenario where the screen uses different batches of LEDs or modules, and it has obvious brightness and chroma differences.
- Common chroma coef
This changes brightness of the primary colors and slightly sacrifices the color gamut. However, it ensures high LED brightness consistency and chroma consistency. If the display has chroma difference, use chroma calibration.
Step 3 Select the calibration configuration for this procedure.
- Mixed-Light Elimination
- High-accuracy calibration, primarily for the miniLED display calibration
• Curved Surface Correction
Eliminate the curved surface problems between partitions caused by calibration. - Seam Correction
It is mainly used for calibration of fine-pitch screens, which can correct the bright line problems caused by module splicing, and also has certain correction effect on the dark lines caused by module splicing.
- Generate Blue/White Coefs
Optimize the display effect for the blue and white after calibration.
- Generate Target Values
Generate a set of target values automatically according to the screen's original brightness and chroma information and the target achievement ratio (95% by default) you set.
Step 4 Select the calibration processes for the current procedure.
- Warm Up: Set the brightness of the LED display after it is turned on and how long that brightness level lasts before you start calibration. You can set them by entering numbers or clicking 🏠 During warm-up, the LED screen displays a white image.
- Area Positioning: Confirm the background elimination area.
- Collect Red LEDs: Collect and analyze the red LEDs.
- Collect Green LEDs: Collect and analyze the green LEDs.
- Collect Blue LEDs: Collect and analyze the blue LEDs.
- Generate Coefs: Calculate and generate the calibration coefficients.
- Upload Coefs: Upload the coefficients in a quick or stable manner. Stable uploading ensures data accuracy. Quick uploading uploads data very fast and is the default uploading method.
- The LED display goes black during quick uploading but not during stable uploading.
- Save Coefs: Save the coefficients to the database.
- Save Coefs to HW: Save the coefficients into the receiving card.
Step 5 When all the procedure configurations are complete, click OK to generate the custom configuration.
Also, if you need to re-collect and re-analyze some images, you can precisely locate them via custom configuration, as described in 7.3 Recollect and Reanalyze Some Images.
5.4.2 More Parameters
More parameter settings include LED positioning parameters, calibration parameters, module specifications, uniformity optimization parameters, data calibration, wider wavelength and brightness range LED calibration, uniformity compensation, eliminate seam strips, and Super Resolution Imaging.
Figure 5-19 Settings of more parameters

Pixel Positioning Parameters
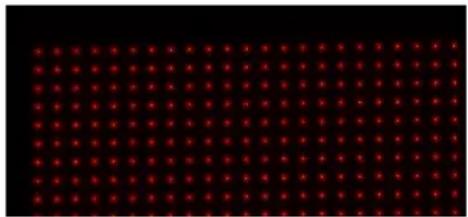
To obtain and calculate the brightness and chroma parameters of each LED to ensure the calibration effect, each LED must be positioned precisely.
Figure 5-20 Preview of LED positioning
natural_image
Grid of red dots on a black background, no text or symbols presentAllowed Dead LED Ratio: To ensure the calibration effect, the ratio of LEDs that cannot be identified (dead LEDs) in the calibration area must be less than this ratio.
You can enter a number or click the up or down arrow to set the ratio. The maximum allowed ratio is 500%.
Calibration Parameters
- Ambient Light Elimination: Eliminate the background light. Calibration is generally required to be done in a very dark environment. If this function is enabled, calibration can be done even if the environment is not dark enough.
- Blocked Areas Brightness Processing: If some partitions are blocked by leaves and/or electric wires, this function can be enabled to automatically detect the blocked areas and process them accordingly, ensuring the final calibration effect.
- Stable Coefficient Uploading: Upload the coefficients stably to ensure data accuracy.
- Save Images of All Partitions: Select this function to save images of all the partitions. If this function is not enabled, only the images of current partition will be saved. Click to choose a path to save the images. The default path is Documents\NovaCLB\Screen.
- Save Images of All Procedures: Select this function to save images of all the procedures. If this function is not enabled, only the most recently collected procedure images will be saved. Click to choose a path to save the images. The default path is Documents\NovaCLB\Screen.
Note:
If stable coefficient uploading is not enabled, the default uploading method is quick uploading. To use quick uploading, make sure that the graphics card of the control computer must work in full range. If it works in limited range, the calibration coefficients transmitted may have a problem.
Screen Information
Confirm the module size and screen type again. Please fill in the information according to the on-site situation, otherwise the effect of correcting seam brightness caused by splicing will be compromised.
Uniformity Optimization Parameters
Figure 5-21 Uniformity optimization parameters

- White Brightness Preferred: If this function is enabled, the calculated white target value after calibration is consistent with the white target value set by the user. However, the screen uniformity may be affected. If this function is not enabled, screen brightness will be sacrificed to ensure the screen uniformity and the white target value will be changed.
- Target Achievement Ratio: This function controls the ratios of red, green and blue LEDs that can achieve the target value when the Generate Target Values function is enabled. The default ratio for each color is 0.95.
If you find that a color has poor effects after calibration, you can lower the ratio of that color appropriately and regenerate coefficients to adjust the calibration effect. The coefficient adjustment does not affect effects of the other colors. It only affects that color itself and the white color. - Optimization Mode: This function is used to select the desired blue and white optimization effect when blue and white optimization function is enabled.
The options include RGBW balanced and BW preferred. If the chroma uniformity of blue before screen calibration is good, select the BW preferred mode.
Note:
After the calibration is complete, if you make changes to the uniformity parameters based on the calibration effect, you can upload the calibration effect as follows.
- For the High-Precision Calibration and Full grayscale calibration procedures, select Procedure 2 on the Manual Calibration page. Then, click Generate Coefficient > Upload Coefs to re-upload the calibration coefficients.
- For the Brightness and Chroma Calibration procedure, coefficient uploading is not involved.
- For the Custom procedure, check whether the last item of the last procedure in the configuration items on the Procedure page is Generate Target Values. If it is, select the last procedure on the Manual Calibration page. Then, click Generate Coefs > Upload Coefs to re-upload the calibration coefficients. If it is not, do calibration again.
- For the High-Precision Calibration and Full grayscale calibration procedures, select Procedure 2 on the Manual Calibration page. Then, click Generate Coefficient > Upload Coefs to re-upload the calibration coefficients. - For the Brightness and Chroma Calibration procedure, coefficient uploading is not involved. - For the Custom procedure, check whether the last item of the last procedure in the configuration items on the Procedure page is Generate Target Values. If it is, select the last procedure on the Manual Calibration page. Then, click Generate Coefs > Upload Coefs to re-upload the calibration coefficients. If it is not, do calibration again.
Wider Wavelength and Brightness Range LED Calibration
Figure 5-22 Wider wavelength and brightness range LED calibration
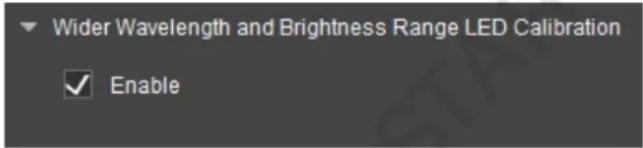
This function is enabled by default. With the reasonable calibration coefficients that match different ranges of precisely collected wavelength and brightness of LEDs, the display effects of different batches of LEDs can be significantly improved.
If the screen to be calibrated uses different batches of LEDs, or the calibration site has no optical measuring device, please make sure to enable this function.
Uniformity Compensation
Figure 5-23 Uniformity compensation

This function is enabled by default. It is suitable for screens with poor display effects before calibration. It can effectively improve the display uniformity.
Eliminate Seam Stripes
Figure 5-24 Eliminating seam stripes

This function is used to remove the diagonal stripes around the seams caused by high-resolution partitions after calibration.
If this problem occurs on the splices after calibration, enable this function, regenerate calibration coefficients and upload them so that stripes can be removed directly.
Super Resolution Imaging
Figure 5-25 Super Resolution Imaging

This function is used to greatly increase the calibration speed with a latest algorithm.
Note:
- When you connect the control system, the software automatically checks whether the connected controller supports the Super Resolution Imaging function. If it is supported, it will be enabled by default. Controllers that support this function include the CX series, MX series, and MCTRL4K.
- After the Super Resolution Imaging switch status is changed, camera parameter reanalysis is needed.
- In low-grayscale calibration mode, Super Resolution Imaging is enabled by default and cannot be disabled.
5.4.3 Partition Calibration
Prerequisites:
When you have configured a custom procedure and the number of procedures is greater than 2, you need to return to the Camera page, select the procedure to be analyzed, and perform the camera parameter analysis manually before starting the calibration. For details, see 5.3.3 Analyze Camera Parameters.
Partition calibration can be done manually or automatically.
- Automatic Mode
In this mode, the software can start the calibration procedure automatically, including collecting data, analyzing data, and generating, uploading and saving coefficients., which is very convenient and efficient.
- In high-precision calibration or common calibration mode, you only need to click Auto Calibration.

- In full-grayscale calibration mode, click Auto Calibration first. During the calibration process, the following window will be displayed. Please adjust the camera aperture and focus to the values displayed in the window.

- In low-grayscale calibration mode, click Parameter Calculation first to automatically calculate the parameters needed during the low-grayscale calibration process. Then, click Auto Calibration and complete the calibration.

- Manual Mode
In this mode, you must manually control the calibration procedure, such as collecting image data, generating, uploading and saving coefficients, etc.

After a partition is calibrated, go to the Calibration page again, select the next partition to calibrate. Repeat these actions until the entire screen is calibrated.
Note:
-
In low-grayscale and full-grayscale calibration modes, when Super Resolution Imaging is enabled, manual collection is not supported.
-
For screens that use special ICs, after the low-grayscale calibration procedure is finished, do a full-grayscale calibration procedure to ensure a good calibration effect.
Preferred Calibration
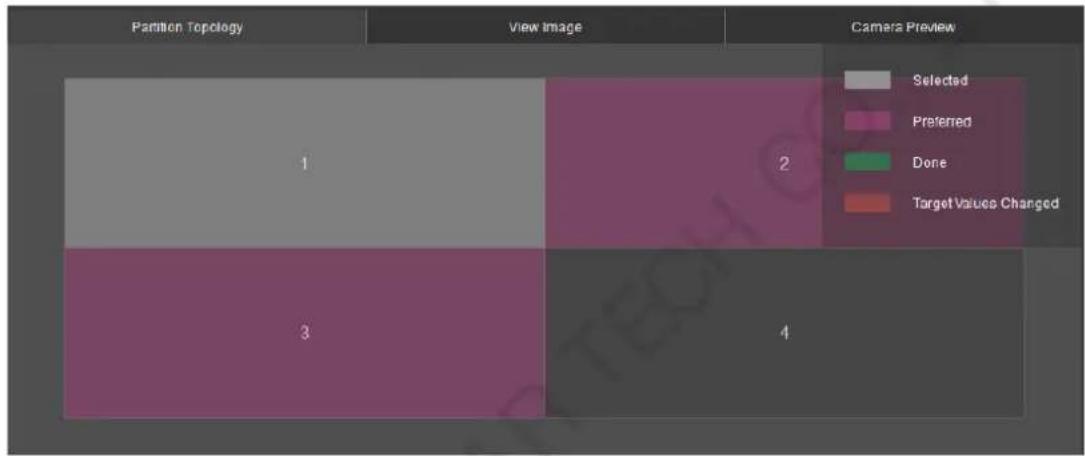
After you calibrate the first partition, go to the Calibration page again. Some preferred calibration partitions (in pink) will appear on the partition topology.
Select a preferred calibration partition and calibrate it. After that partition is calibrated, new preferred calibration partitions will appear. Repeat these actions until the entire screen is calibrated.
Note:
• After a partition is calibrated, its adjacent partitions will be preferred calibration partitions. Please select one of them to calibrate.
- You are advised to calibrate partitions in the recommended preferred calibration order. That ensures smoother transitions between partitions and better calibration effects.
Figure 5-26 Preferred calibration
Continue Calibration
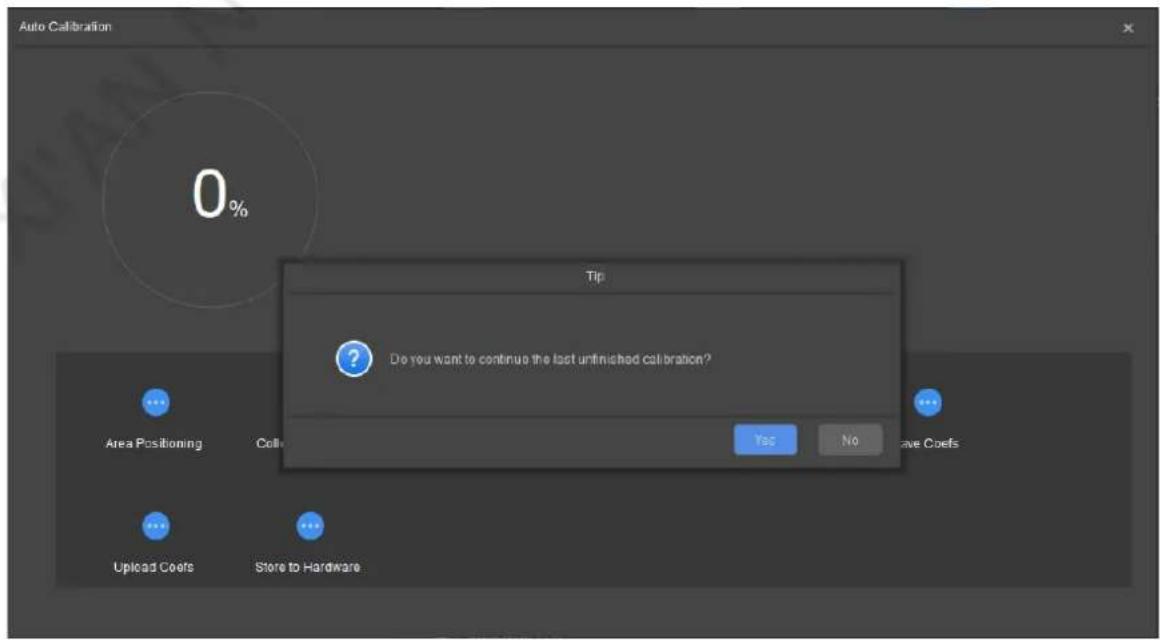
When the calibration is disrupted due to image analysis failure, click Enable Calibration again. A message saying "Do you want to continue the last unfinished calibration?" will be displayed.
- Click Yes to continue calibration from the image with failed analysis last time.
- Click No to start calibration from the beginning.
Figure 5-27 Continuing calibration
Confirm Calibration Effect
When the number of configured procedures is greater than or equal to 2, after the first calibration procedure is completed, the Confirm Calibration Effect page will pop up. You can check whether the calibration effect is as expected through the Display Control functions.
- If it is as expected, click Continue and start the second calibration procedure.
- If it is not expected, click End to end the calibration procedure and return to the Camera page. On that page, fine-tune the image size. For details, see 5.3.3 Analyze Camera Parameters. After fine-tuning, start calibration again.
Figure 5-28 Confirming calibration effect

Generate Target Values
When a custom procedure is configured and Generate Target Values is selected, after the first partition is calibrated, you can go to the Target tab page and view the re-generated target values. You can also fine-tune the target values based on the calibration effect of the first partition.
Figure 5-29 Target values (auto generated)
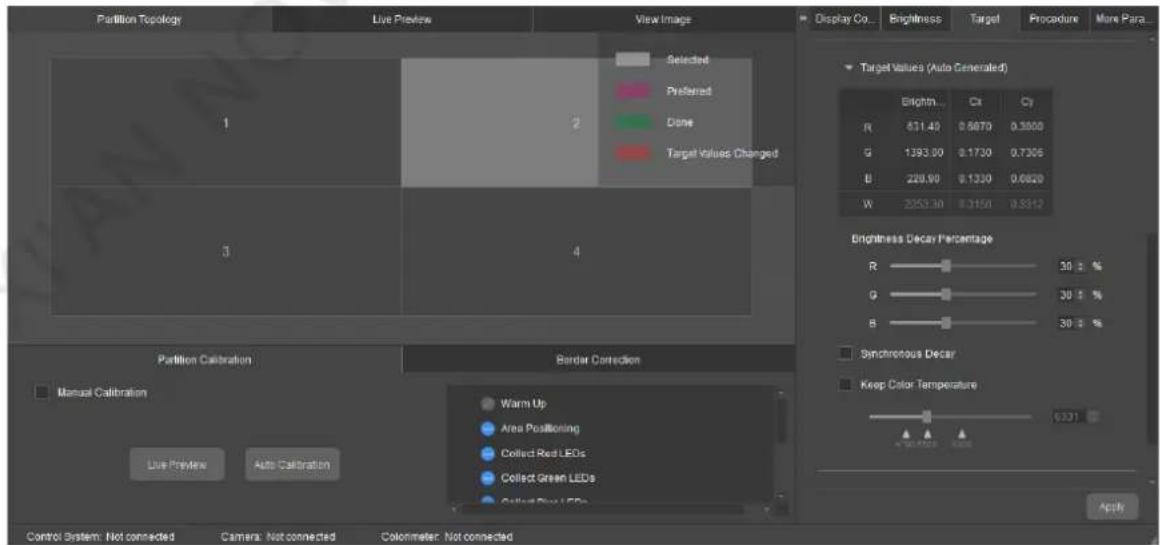
5.4.4 Border Correction
If there are multiple partitions, perform border correction according to the order of Border Correction > Coef Simulation > Upload Coefs > Save Coefs to HW > Save Coefs. The system will eliminate the partition borders, upload coefficients, save parameters to hardware and save the adjustment data.
Figure 5-30 Border correction
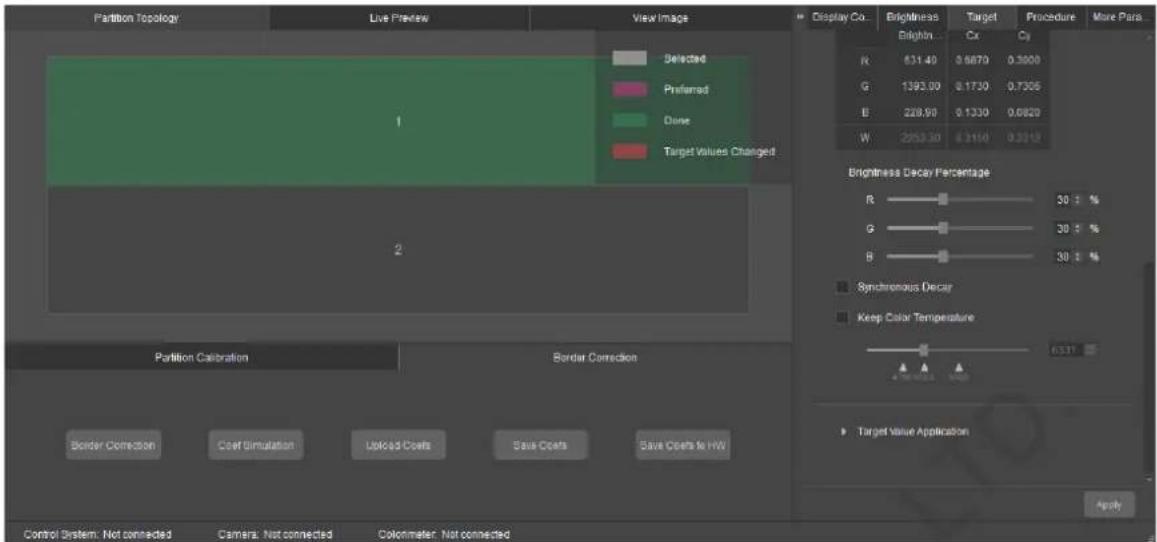
- Border Correction: Correct the brightness and chroma nonuniformity of the borders between partitions.
- Coef Simulation: The software uses the calibration coefficients to restore the display effect of the LED screen before calibration. The restored image is simulation image. By comparing the simulation image with the actual display effect before calibration, you can know whether the calibration result is OK.
Figure 5-31 Coefficient simulation
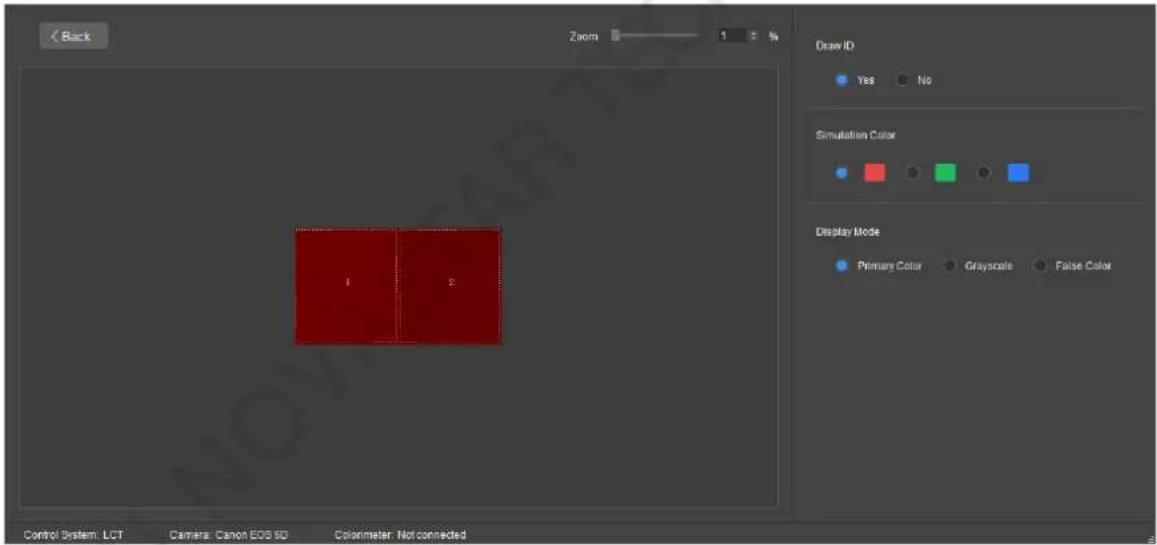
- Draw No.: Draw the partition No. on the simulation image.
- Simulation Color: Select red, green or blue as the simulation color.
Display Mode: Set the display mode of the simulation image. You can select the best display mode based on your observation. The display modes include:
Primary Color: The simulation image in this color is a color image. Its color is the same as the simulation color.
Grayscale: The simulation image in this color is a grayscale image. It is always a grayscale image no matter what the simulation color is.
➢ False Color: The simulation image in this color is an image where a brightness range is represented by one color.
- Upload Coefs: Upload the coefficients to the receiving card.
- Save Coefs: Save the coefficients to the database.
- Save Coefs to HW: Save the coefficients to the receiving card.
Upload Calibration Coefficients
After the calibration coefficients are saved to the database, right click the topology and click Upload Calibration Coefficients, and you can upload the coefficients of the current partition to the screen.
To upload calibration coefficients of several partitions, click and drag the mouse to select partitions, rick click and select Upload Calibration Coefficients.

5.4.5 Display Control
Using this function, you can adjust the screen brightness and clearly see the actual calibration effect change of each level of grayscale. You can also switch colors to see the uniformity of red, green, blue and white.
Figure 5-32 Display control

Step 1 After partition calibration, choose a color for the current partition on the screen to display.
Step 2 Adjust the screen brightness by dragging the slider, clicking or entering a number.
Step 3 Select Enable Correction to view the post-calibration display effect in the selected color on the LED screen.
At the same time, you can select or deselect Pixel-by-Pixel Display to view the calibration effect in pixel-by-pixel display mode and non-pixel-by-pixel display mode.
Step 4 Select Full-Screen Display to illuminate all partitions.
- If both Enable Calibration and Full-Screen Display are selected, the calibrated partition(s) will display the calibration effect, but the uncalibrated partition(s) will display the image in the original status.
- If Enable Calibration is not selected but Full-Screen Display is selected, both the calibrated and uncalibrated partitions will display the image in the original status.
5.4.6 Brightness Data
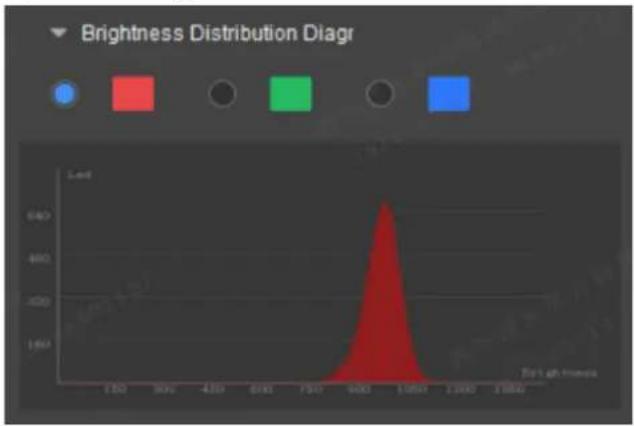
Brightness data include the brightness distribution, brightness distribution diagram, dead LED information and the achievable percentage of brightness coefficients that are read by the software after calibration. These parameters are the LED display brightness information after calibration and they cannot be modified.
Figure 5-33 Brightness data
line
| Brightness Range | Frequency | | ---------------- | --------- | | 0 | 0 | | 100 | 0 | | 200 | 0 | | 300 | 0 | | 400 | 0 | | 500 | 0 | | 600 | 0 | | 700 | 0 | | 800 | 0 | | 900 | 0 | | 1000 | 1 | | 1100 | 0 | | 1200 | 0 | | 1300 | 0 | | 1400 | 0 | | 1500 | 0 | | 1600 | 0 | | 1700 | 0 | | 1800 | 0 |- Brightness Distribution: Display the brightness uniformity, maximum brightness values, minimum brightness values and average brightness values of the red, green and blue in digital form, respectively.
- Brightness Distribution Diagram: Display the distribution of brightness in the selected color and the numbers of LEDs under the brightness.
- Dead LED Information: Display the number of dead LEDs in the selected color.
- Achievable Percentage of Brightness Coefficients: Display the percentage of LEDs that have achieved the brightness coefficients.
5.4.7 Change Target Values
If the calibration effect of the current partition or the entire screen is unsatisfactory, you can modify the target values on the Target tab page to correct the calibration coefficients without calibrating the partition again.
Figure 5-34 Changing target values

contour
| X | Y | Value | |------|------|-------| | 0.0 | 0.0 | 480 | | 0.1 | 0.1 | 520 | | 0.2 | 0.2 | 530 | | 0.3 | 0.3 | 540 | | 0.4 | 0.4 | 550 | | 0.5 | 0.5 | 560 | | 0.6 | 0.6 | 570 | | 0.7 | 0.7 | 580 | | 0.8 | 0.8 | 590 | | 0.9 | 0.9 | 600 | | 1.0 | 1.0 | 610 | | 1.1 | 1.1 | 620 | | 1.2 | 1.2 | 630 | | 1.3 | 1.3 | 640 | | 1.4 | 1.4 | 650 | | 1.5 | 1.5 | 660 | X: 0.353, Y: -0.002- Chroma Coordinate Distribution: It is shown in a color space diagram and can be changed through one of the following two methods:
In drag the three vertexes in the diagram to change the target values.
- Click Target View to enter the larger view page. Drag the three vertexes on the right diagram to change the target values, double click the values in the target value table and enter numbers, or select Keep Color Temperature and change color temperate value to change the target values.
Figure 5-35 Changing target values
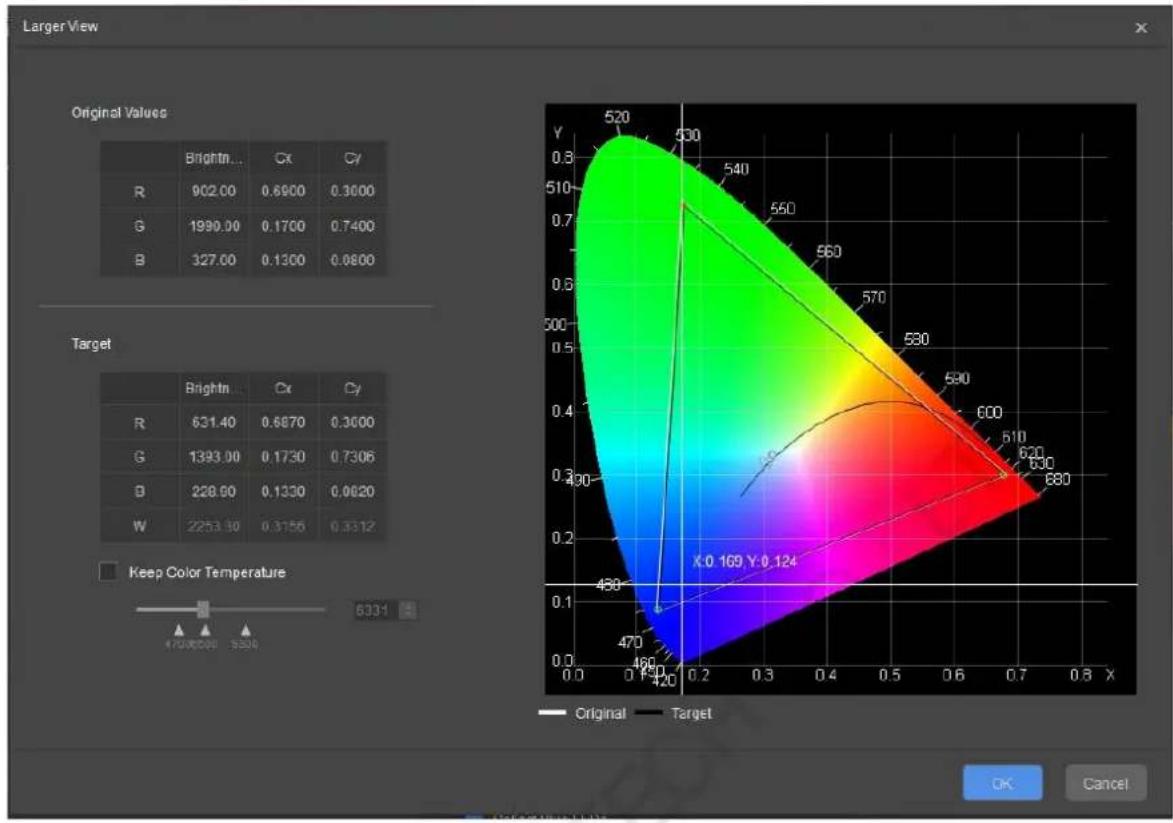
heatmap
| R | Brightn | Cx | Cy | |-------|---------|-------|-------| | R | 902.00 | 0.6900| 0.3000| | G | 1999.00 | 0.1700| 0.7400| | B | 327.00 | 0.1300| 0.0800| | Target| | | | | R | 631.40 | 0.6870| 0.3000| | G | 1393.00 | 0.1730| 0.7306| | B | 228.90 | 0.1330| 0.0620| | W | 2253.30 | 0.3156| 0.3312| | Keep Color Temperature | | | | | X: 0:169 Y:0.124; Y:420; Y:470; Y:480; Y:510; Y:540; Y:560; Y:570; Y:590; Y:600; Y:620; Y:630; Y:680; Original Target OK Cancel- Target Values: Double click to enter values directly, drag the Brightness Decay Percentage sliders or change the color temperature value to change the target values.
If Generate Target Values is selected, after the first partition is calibrated, you can view and change the regenerated target values on this page.
- Target Values Application: Apply the current target values to the current partition or all partitions. After selection, click Apply.
If you select Current Partition, you will apply the modified target values to the current partition and upload calibration coefficients. The target values of other partitions will not be changed.
- If you select All Partitions, you will apply the modified target values to all the partitions and upload the calibration coefficients of the current partition. Other calibrated partitions will turn red on the topology.
6 Help
6.1 Network Connection
If the distance between the control computer that controls the LED screen and the calibration computer is within 100 meters during pixel level calibration, connect the computers with Ethernet cable. If the distance is greater than 100 meters, connect them wirelessly.
Here the router shown in Figure 6-1 will be taken as an example to illustrate how to set and use a router.
Figure 6-1 Wireless router

natural_image
White wireless router with three antennas on a white base (no text or symbols visible)Step 1 Connect the router to the control computer with Ethernet cable via a yellow port of the router.
Figure 6-2 Ports of wireless router

natural_image
Front view of a white wireless router with three antennas and ports (no visible text or labels)Step 2 Use the wireless network function of the calibration computer to connect it to the wireless router. Note that whether with cable connection or wireless connection, IP addresses of the two computers and the default IP address of the router must be on the same network segment when NovaLCT is used together for calibration.
Figure 6-3 Setting IP address

6.2 Auxiliary Tool for C3200 Camera
You can use the IP configuration tool that comes with the camera to manage the cameras.
In the System list in the upper-left corner, you can see all the network adapters of the computer directly connected to the C3200 and which adapter the C3200 is connected to.
![GxGigelPConfig Help System Bluetooth Device (Personal Area Network) (0.0.0.0[1C-1B-B5-F1-C4-... Realtek PCIe GBE Family Controller(192.168.0.1[B0-0C-D1-31-E7-09]) MARS-3140-3GM-P-M03(192.168.0.11[00-21-49-02-28-94]) SVN Adapter V1.0(0.0.0.0[00-FF-30-75-09-7D]) Intel(R) Dual Band Wireless-AC 8265(172.17.163.124[1C-1B-B5-F1-C... Microsoft Wi-Fi Direct Virtual Adapter #3(0.0.0.0[1C-1B-B5-F1-C4... Microsoft Wi-Fi Direct Virtual Adapter #4(0.0.0.0[1E-1B-B5-F1-C4... Refresh Devices Auto Config Manual Config Static IP IP Address 0 .0 .0 .0 Subnet Mask 0 .0 .0 .0 Gateway 0 .0 .0 .0 DHCP LLA Device User ID Save Reset Device Reconnect Device](/content/2026/05/1016208/images/91f302146da95cf95931723f6bfb1fb3b22e112ab831256e0784b798d8ad07e4.jpg)
- Refresh Devices: Click to view the latest connection status of the devices.
- Reset Device: Click to power off the C3200 and restart it.
- Reconnect Device: Click to disconnect and reconnect the C3200.
6.3 Method of Calibrating a 4K+ Screen
When using a C3200 camera to calibrate a screen larger than 4K, it's best to calibrate a 4K part each time to ensure the efficiency. If there is a difference in the curved-surface transitions between partitions after the calibration is completed, you need to deal with it by following CalCube MiniLED Ultra-Large Screen Calibration Technology Quick Start Guide.
7 Troubleshooting
7.1 View Partition Calibration Effect and Troubleshoot Problems
Calibration effects of some areas may not be ideal. You need to troubleshoot the problems purposely based on the calibration effects. Before troubleshooting, follow the steps below to learn how to view camera collected image.
Click ☐ on the Partition Calibration page to enter the measured image page. First, observe the clarity and completeness of the image. Second, observe whether all the LEDs have been selected by the smart positioning rectangle, as shown in Figure 7-1.
Figure 7-1 Observing measured image

- Screen blurring phenomenon 1: Some vertical bright or dark lines appear between partitions after calibration.
Reason: Generally speaking, this problem is caused by poor quality of imaging. You can observe whether the LED image is clear on the collected image after zooming it in. Usually, the reason of poor imaging quality is that the resolution you set for a partition is too high or the lens focusing is not clear.
- Screen blurring phenomenon 2: Water ripple phenomenon occurred on the calibrated partition.
Reason: This problem is generally caused by insufficient image collection. Let the LED screen display the calibration effects in red, green and blue, respectively, to find out the color or colors in which the calibration effect is undesirable. Slightly adjust the focal length or focus again and recalibrate the display in that color or those colors to resolve the problem.
In addition, some on-site conditions may also lead to undesirable calibration effect. For example, ambient light interference or wind causes lens shaking, or raining or snowing causes blurred imaging. Calibration engineers must take measures to avoid influence of these external environmental factors in order to achieve the ideal calibration effect.
7.2 Water Ripple Occurred After Screen Calibration
The LED display in a certain color, most frequently in blue, may have water ripple phenomenon after calibration. The reason is that the LED screen resolution is too high, but the camera resolution is relatively insufficient and sampling frequency is very low. This phenomenon is known as moiré pattern in optical imaging.
To resolve this problem, use any of the methods below and recollect images in red, green and blue.
- Change the camera angle. You can rotate the camera to slightly change the camera angle in order to eliminate or change the moiré pattern.
- Change the camera location. You can move the camera leftward, rightward, upward or downward to change the angle between the camera and LED screen to reduce moiré pattern.
-
Change the camera focusing. Too clear focus and obtaining precise details on detailed patterns may cause moiré pattern. Please adjust the focus ring to make imaging a little blurred in order to change clarity and therefore help eliminate moiré pattern.
-
Change the focal length. You can use different focal lengths to change or eliminate moiré pattern.
7.3 Recollect and Reanalyze Some Images
If the calibration effect is not satisfactory or the calibration cannot be carried out smoothly and recollection of some images is required, the custom configuration in the Procedure function can be used to precisely locate the images that need recollection.
For example, the 4 images in the red box below need to be recollected. The detailed operations are as follows.
Figure 7-2 Stored images

Step 1 Under the Procedure tab, click Custom to enter the Custom Procedure page.
Step 2 Configure the calibration procedure and select a calibration mode. The mode must be the same as the calibration mode of the images you want to collect.
Figure 7-3 Custom procedure

Step 3 Select colors of LEDs that you want to collect. In this example, select green and blue.
Step 4 Click Specify next to Collect Green LEDs to specify the locations of the images to be collected.
Step 5 Click the check box next to Filter to select the filters you want to obtain (Select the X and Y filters).
Step 6 In the topology diagram, select the locations of the LEDs to be captured. (Select area 2, namely the lower-left corner).
Step 7 Click Specify next to Collect Blue LEDs to specify the locations of the images to be collected.
Step 8 Click the check box next to Filter to select the filter you want to obtain (Select the X filter).
Step 9 In the topology diagram, select the locations of the LEDs to be captured. (Select areas 0 and 1, namely the two on the top row).
Step 10 In the Calibration Procedure area, select other functions for the current procedure.
Step 11 Click OK to generate the custom configuration.
Step 12 Perform the calibration procedure and recollect the images. For details, see 5.3.3 Analyze Camera Parameters.
7.4 C3200 Camera Connection Failed
The C3200 camera has compatibility issues with some computers and it may cause a connection failure. The following methods can be used to reconnect the C3200.
Step 1 On the Device page, click Advanced. On the displayed page, select Configure IP manually and complete the settings. Make sure the camera IP and the network adapter IP are on the same network segment.
Figure 7-4 Advanced settings
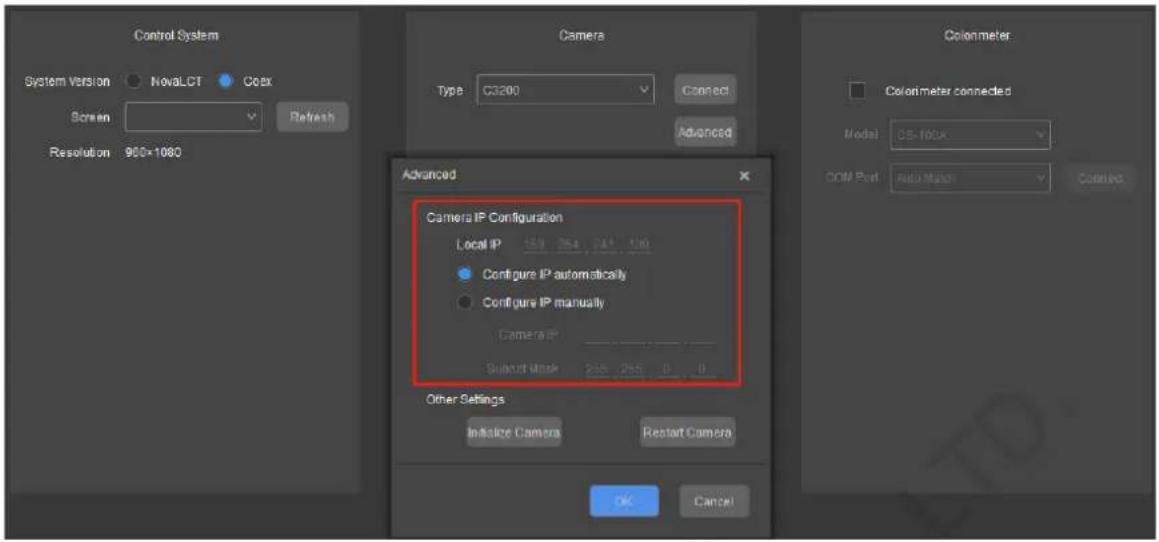
Step 2 Disable the network adapter that is connected to the C3200 and then enable the adapter again.
Step 3 Click OK to go back to the Device page and click Connect under Camera to reconnect the C3200.
7.5 Camera Parameter Analysis Failed Due to Excessive Ambient Light
During camera parameter analysis, if a prompt saying "There is excessive ambient light. Please increase screen brightness or reduce the ambient light in the room." is displayed, follow the steps below to troubleshoot.
Figure 7-5 Error code 0x1605

- Check whether there is any interference from unstable ambient light.
-
Check whether the collected images are normal.
-
Open the Saturation folder in the image save path.
You can click ▼ at the top right of the main user interface and select Properties to find the image save path.

- Open the folder of the procedure that has the analysis failure problem and check the image (.png) in the color that is currently being analyzed.
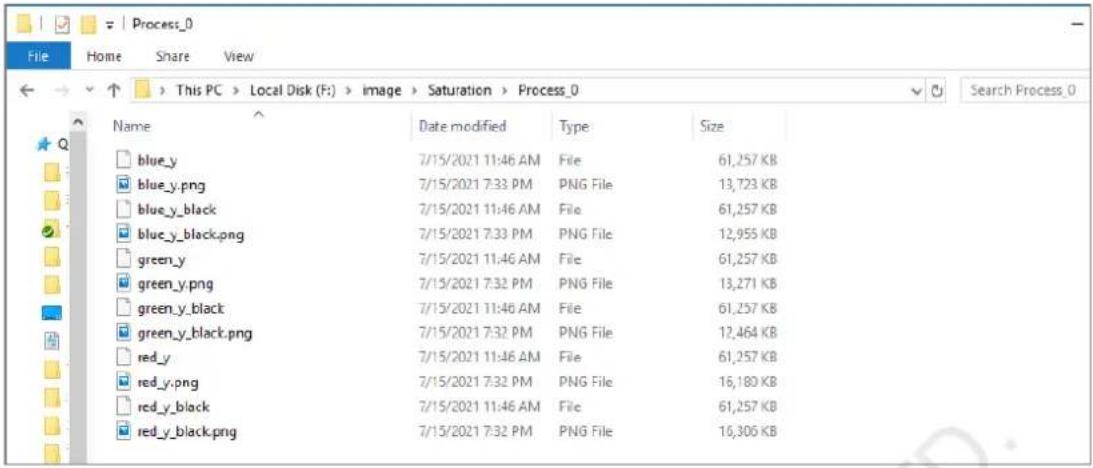
- Check whether the background image (_black.png) has lighted pixels or whether the collected color image (_y.png) does not have lighted pixels.
- If yes to the above, check whether displaying image on screen during image collection is normal (after area positioning, observe whether the color and order of displaying image on screen are correct).
- If displaying image on screen is normal
click ▼ at the top right of the main user interface and select Settings. On the Settings page, increase Collection Interval appropriately.

- If displaying image on screen is abnormal
Check whether the output dynamic range of graphics card is Full and change the sending card firmware version and NovaLCT version to a more stable one.

- Do camera parameter adjustment again.
7.6 Camera Parameter Analysis Failed Due to Area Positioning Distance
During camera parameter analysis, if a prompt saying "Camera parameter analysis failed. Please check: Whether the area positioning box borders are too far from the edges of the collected image." is displayed and the prompt still exists after you make the distance shorter, follow the steps below to troubleshoot.
Figure 7-6 Error code 0x1314

Step 1 On the Camera page, select the partition where the analysis failed.
Step 2 In the Partition Information area, check whether Actual Columns Collected and Actual Rows Collected during displaying image on screen are correct.

Step 3 If the number of lighted pixels on the screen during displaying image on screen is different from the number of actual collected columns and rows, reconfigure the screen in NovaLCT and ensure Sending Card Resolution and Graphics Output Resolution values are the same to avoid the problem of displaying image on screen.

Step 4 Do camera parameter analysis again.
Note:
If camera parameter analysis failed and the error code is 0x1315, you also need to check whether Actual Columns Collected and Actual Rows Collected during displaying image on screen are correct.
7.7 Calibrate the Display to a Specified Color Temperature
When the Wider Wavelength and Brightness Range LED Calibration function is enabled, follow the steps below to calibrate the display to a specified color temperature.
Step 1 After a partition is calibrated, select the Target tab on the Calibration page.
Figure 7-7 Target

other
| Metric | Value | | :--- | :--- | | Brightness | 631.72 | | Cx | 0.6811 | | Cy | 0.3034 | | R | 1340.02 | | G | 0.1790 | | 0.7232 | 0.7232 | | B | 294.19 | | 0.0874 | 0.1317 | | W | 2265.93 | | 0.3103 | 0.3003 | | Synchronous Decay (%) | 29 | | Keep Color Temperature (%) | 32 | | Target Value Application (Current Partition) | 8092 | | Target Value Application (All Partitions) | 47006500 9300 |Step 2 Select Keep Color Temperature, drag the color temperature slider or enter a number to change the color temperature.
Step 3 Select All Partitions under Target Value Application.
Step 4 Click Apply.
Step 5 Continue to calibrate the remaining partitions.
7.8 Poor Calibration Effect of A Color with Generate Target Values Enabled
After the calibration with the Generate Target Values function enabled is done, a certain color has low saturation or bad uniformity. Follow the steps below to troubleshoot.
Step 1 On the Calibration page, select the More Params tab.
Figure 7-8 Uniformity optimization parameters

Step 2 In the Uniformity Optimization Parameters area, adjust the target achievement ratio for the corresponding color.
- For lower saturation, decrease the ratio for that color appropriately.
- For bad uniformity, increase the ratio for that color appropriately.
Step 3 Regenerate coefficients to adjust the calibration effect.
The coefficient adjustment does not affect effects of the other colors. It only affects that color itself and the white color.
7.9 Remove Obvious Partition Merging Bands
After calibration, an obvious partition merging band may appear. Do the following to remove it.
Step 1 At the top right of the main user interface, click the button.
Figure 7-9 Expanded module rows/columns

Step 2 Click Settings to open the settings page.
Step 3 Based on the on-site situation, increase the values of Expanded Module Rows and Expanded Module Columns appropriately.
Step 4 Click OK.
Step 5 Set partitions again and do camera parameter analysis.
Step 6 Recollect calibration data.
7.10 Low-Grayscale Calibration Parameter Calculation Failed
Step 1 After the initial low-grayscale calibration coefficients are applied, run NovaLCT and use the test tool to let the screen display a red image.
Figure 7-10 NovaLCT - Test tool


Step 2 Use the colorimeter to measure the brightness value of red.
Step 3 In the Low-Grayscale Parameters area, increase the red initial coef by one and click Apply.
Figure 7-11 Low-grayscale parameters

Step 4 Use the colorimeter to measure the brightness value of red again.
Note that the Grayscale value in the test tool for the second measurement should be the same as that in the first measurement.
Step 5 Calculate the difference between the two brightness values of red.
- If the difference is a positive value (about a few thousandths), go to Step 7.
- If the difference is a negative value, go to Step 6.
Step 6 Increase the red initial coef by one again and click Apply, use the colorimeter to measure the brightness value of red, and calculate the difference between this brightness value and the value in the first measurement. Repeat this procedure until the brightness value difference is a positive value.
Step 7 Calculate the stepping value for red.
The stepping value is the number of measurements when the brightness value difference is a positive value
Step 8 Repeat Step 1 to Step 7 to do data analysis for green and blue in order and record the stepping values of the three colors. Find the maximum value of the stepping values and the maximum value will be the final stepping value.
Step 9 In the Low-Grayscale Parameters area, click Advanced and enter the stepping value obtained in the previous step.
Figure 7-12 Advanced - Stepping

Copyright © 2022 Xi'an NovaStar Tech Co., Ltd. All Rights Reserved.
No part of this document may be copied, reproduced, extracted or transmitted in any form or by any means without the prior written consent of Xi'an NovaStar Tech Co., Ltd.
Trademark
NOVA STAR is a trademark of Xi'an NovaStar Tech Co., Ltd.
Statement
Thank you for choosing NovaStar's product. This document is intended to help you understand and use the product. For accuracy and reliability, NovaStar may make improvements and/or changes to this document at any time and without notice. If you experience any problems in use or have any suggestions, please contact us via the contact information given in this document. We will do our best to solve any issues, as well as evaluate and implement any suggestions.

- Contents
- Change History ....i
- Introduction
- Overview
- Features
- Software Installation
- Note:
- Software Introduction
- Navigation Page
- Main User Interface
- Basic Calibration Procedure
- High-Precision Calibration & Brightness and Chroma Calibration
- Full-Grayscale Calibration
- Note
- Low-Grayscale Calibration
- Calibration Preparations
- Set up Hardware Environment
- Configuration List
- System Architecture
- Calibration Environment
- Light Requirements
- Calibration Distance
- Configure Software Environment
- Network Connection
- Disable Computer Sleeping
- Jumbo Packet Settings
- Set NovaLCT Monitoring
- Enable Authorization
- Create a Calibration Project
- Calibration Operation Instructions
- Device
- Connect a Control System
- Coex Control System
- NovaLCT Control System
- Connect a Camera
- Connect the C1200
- Connect the C3200
- Connect a Colorimeter
- Set Low-Grayscale Parameters
- Target
- Obtain Original Values
- Set Target Values
- Customize Target Values
- Camera
- Select Grayscale Levels
- Set Partition Information
- Analyze Camera Parameters
- High-Precision Calibration & Brightness and Chroma Calibration
- Full-Grayscale Calibration
- Low-Grayscale Calibration
- Set Areas to Be Calibrated
- Set Bezel Information
- Calibration
- Configure Procedure
- Custom
- More Parameters
- Pixel Positioning Parameters
- Calibration Parameters
- Screen Information
- Uniformity Optimization Parameters
- Wider Wavelength and Brightness Range LED Calibration
- Uniformity Compensation
- Eliminate Seam Stripes
- Super Resolution Imaging
- Partition Calibration
- Prerequisites:
- Preferred Calibration
- Continue Calibration
- Confirm Calibration Effect
- Generate Target Values
- Border Correction
- Upload Calibration Coefficients
- Display Control
- Brightness Data
- Change Target Values
- Help
- Network Connection
- Auxiliary Tool for C3200 Camera
- Method of Calibrating a 4K+ Screen
- Troubleshooting
- View Partition Calibration Effect and Troubleshoot Problems
- Water Ripple Occurred After Screen Calibration
- Recollect and Reanalyze Some Images
- C3200 Camera Connection Failed
- Camera Parameter Analysis Failed Due to Excessive Ambient Light
- Camera Parameter Analysis Failed Due to Area Positioning Distance
- Calibrate the Display to a Specified Color Temperature
- Poor Calibration Effect of A Color with Generate Target Values Enabled
- Remove Obvious Partition Merging Bands
- Low-Grayscale Calibration Parameter Calculation Failed
- Trademark
- Statement
Brand : NovaStar
Model : CalCube MiniLED V2.4.2
Category : Screen