
ProSafe NMS200 - Network Management Software NETGEAR - Free user manual and instructions
Find the device manual for free ProSafe NMS200 NETGEAR in PDF.


| Product Type | Network Management Software |
| Brand | NETGEAR |
| Model | ProSafe NMS200 |
| Version | v1.1 (202-10838-04) |
| Category | Network Management & Monitoring |
| Deployment | Web-based portal with application server and web server |
| Supported Operating Systems | Windows 2003, XP, Vista, 2008, 7 (32/64-bit) |
| Supported Web Browsers | Chrome (v6+), Safari (v5+), Firefox (v3.6+), Internet Explorer (v8+) |
| Hardware Requirements | 2.8 GHz dual core CPU, 4GB RAM (8GB for 64-bit), 20GB disk space |
| Database | MySQL (open-source) |
| Key Features | Automated device discovery, topology maps, custom alarms, event history, performance dashboards, configuration backup/restore, reporting |
| Supported Protocols | TCP/IP, SNMP (v1/v2c/v3), HTTP/S, UDP Multicast, ICMP, Telnet, SSH |
| SNMP Security | Community strings for v1/v2c; MD5/SHA1 authentication and DES56/AES128 encryption for v3 |
| User Management | Role-based access control with Administrator, User, and custom roles |
| Scalability | Supports up to licensed device count; distributed deployment available |
| Maintenance | Database aging policies (DAP) for archiving; scheduler for recurring tasks |
| Spare Parts / Updates | License file updates for new features or device expansion |
| Safety | Secure communication via HTTPS; encrypted SNMPv3; user authentication |
Frequently Asked Questions - ProSafe NMS200 NETGEAR
User questions about ProSafe NMS200 NETGEAR
0 question about this device. Answer the ones you know or ask your own.
Ask a new question about this device
Download the instructions for your Network Management Software in PDF format for free! Find your manual ProSafe NMS200 - NETGEAR and take your electronic device back in hand. On this page are published all the documents necessary for the use of your device. ProSafe NMS200 by NETGEAR.
USER MANUAL ProSafe NMS200 NETGEAR
ProSafe Network Management Software NMS200
User Guide
350 East Plumeria Drive San Jose, CA 95134 USA
January 2012 202-10838-04 v1.1
©2012 NETGEAR, Inc. All rights reserved
No part of this publication may be reproduced, transmitted, transcribed, stored in a retrieval system, or translated into any language in any form or by any means without the written permission of NETGEAR, Inc.
Technical Support
Thank you for choosing NETGEAR. To register your product, get the latest product updates, get support online, or for more information about the topics covered in this manual, visit the Support website at http://support.netgear.com.
Phone (US & Canada only): 1-888-NETGEAR
Phone (Other Countries): Check the list of phone numbers at http://support.netgear.com/app/answers/detail/a_id/984
Trademarks
NETGEAR, the NETGEAR logo, and Connect with Innovation are trademarks and/or registered trademarks of NETGEAR, Inc. and/or its subsidiaries in the United States and/or other countries. Information is subject to change without notice. Other brand and product names are registered trademarks or trademarks of their respective holders. © 2011 NETGEAR, Inc. All rights reserved.
Statement of Conditions
To improve internal design, operational function, and/or reliability, NETGEAR reserves the right to make changes to the products described in this document without notice. NETGEAR does not assume any liability that may occur due to the use, or application of, the product(s) or circuit layout(s) described herein.
Revision History
| Publication Part Number | Version | Publish Date | Comments |
| 202-10838-01 | v1.1 | May 2011 | First publication |
| 202-10838-04 | v1.1 | January 2012 | Second publication |
Contents
Chapter 1 Introduction
Why NMS200? 7
Key Features 7
Networks with NMS200 8
Additional Products....9
Online Help / Filter 9
Expand / Collapse options ....10
A Note About Performance....10
Chapter 2 Getting Started
System Basics ...... 11
Network Basics....13
Authentication....14
Updating Your License ....14
Getting Started 15
Installation and Startup....16
Starting Web Client....16
Control Panel 17
Portal > Users. 18
Portal > Communities ..... 19
Database Aging Policies (DAP) 19
Aging Policies Editor....20
Aging Policies Options .21
Sub-Policies 22
Repositories ....23
Quick Navigation 24
License Viewer 25
Discovery 26
Managed Resources 28
Common Setup Tasks .....28
SMTP Configuration .....28
Netrestore File Servers....30
Chapter 3 Portal Conventions
Help / Tooltips....32
Refresh....32
The Back Button....32
Show Versions ....33
The Dock 33
ProSafe Network Management Software NMS200
Status Bar Messaging 34
Chat / Conferencing 34
Menu Bar 35
Graphs 36
Portlets 37
Common Menu Items....42
Import / Export 42
Sharing 43
View as PDF....44
Audit Trail / Jobs Screen 45
Audit Trail Viewer 46
Audit Trail Portlet 46
Schedules. 48
Schedules Portlet 49
Chapter 4 NMS200 Portlets
Alarms 51
Event History 56
Event Processing Rules 58
Rule Editor Example. 59
Rule Editor 61
File Servers 74
File Server Editor 76
OS Images 77
OS Image Editor....78
Deploy OS 80
Contacts 81
Contacts Editor....82
Locations 83
Visualize My Network....85
Control and Styles 87
Data / Node Finder 89
Layout. 91
OVERVIEW 95
Alarms in Topology....95
Vendors 95
Chapter 5 Monitoring
Resource Monitors 97
Monitor Editor....99
Monitor Options Type-Specific Panels 106
Scheduling Refresh Monitor Targets 113
Top [Asset] Monitors 113
Top Configuration Backups 114
Dashboard Views 115
Performance Dashboard 116
Dashboard Editor....117
ProSafe Network Management Software NMS200
Key Metric Editor ....118
Chapter 6 Resource Management
Authentication....121
Resource Discovery 123
Discovery Profiles....124
Managed Resource Groups 130
Static Group 131
Dynamic Group. 132
Managed Resources 133
File Management....138
Configuration Files 143
New Link....144
Link Discovery ....145
Equipment Details 146
Performance Indicators....147
Interfaces 147
Alarms. 149
Ports 149
Details. 152
Live Details 154
Scheduling Actions....154
Direct Access....155
MIB Browser 156
Terminal 157
Ports 158
Reports. 161
Branding Reports 163
Chapter 7 File Server / File Management
File Servers 165
File Server Editor....167
File Management....168
Configuration Files 171
Image Repository ....173
Firmware Image Editor....173
Configuration Image Editor....174
Deploy Firmware 175
Deploy Configuration 176
Chapter 8 Storage Arrays
Storage Array Portlet 178
Storage Array Portlet Expanded....179
General....182
ProSafe Network Management Software NMS200
Appendix A Glossary
Index
NMS200 can give you automated, consolidated configuration and control of your network's resources.
NMS200's Administration Guide describes some of the runtime features supporting these applications. The NMS200 Installation Guide and Administration Guide discuss licensing. Consult Release Notes for information about changes not covered in this Synergy User Guide.
Why NMS200?
NMS200's benefits:
- Productive. Discovery and wizard-driven configuration features within minutes of installing NMS200, you can monitor your network.
- Easy. NMS200 provides the network information you need, and offers advanced capabilities with minimal configuration overhead.
- Valuable. NMS200 often costs less to use and maintain than most other solutions.
• Scalability. You can scale NMS200 to almost any size.
Key Features
The following are some key features of NMS200:
- Automate and Schedule Device Discovery. Device discovery populates NMS200's database and begins network analysis. You can also create network discovery schedules to automatically run Discovery whenever you need them.
- Open Integration. NMS200 supports industry standards. It comes with an open-source MySQL database. It also uses industry-standard MIBs and protocols.
- Topology. The NMS200 topology screen lets you create multi-layered, fully customizable, web-based maps of your network to track devices wherever they are in your network in real time.
- Alarms. You can configure custom alarms to respond to hundreds of possible network scenarios, including multiple condition checks. NMS200's alarms help you recognize issues before your network users experience productivity losses. Alarms can also trigger
actions like email, paging, SNMP traps, Syslog messaging, and external application execution.
- Traps and Syslog. NMS200 lets you investigate network issues with traps and Syslog messages. You can use NMS200 to set up events / alarms and then receive, process, forward, and send syslog and trap messages.
- Reports and Graphs. NMS200 comes with many pre-configured reports and graphs to display data from its database. You can archive and compare reports, or automate creating them with NMS200's scheduler.
Networks with NMS200
The beginning of network management with NMS200 is Discovery of the resources on a network. After that occurs, you can configure Visualize My Network, Resource Monitors and Performance Dashboards.
Once you have done these initial steps, NMS200 helps you understand and troubleshoot your network. For example: Suppose a NMS200 Performance Dashboard displays something you want troubleshoot. You can right-click the impacted device in the Visualize My Network to access configuration and actions. The color of the icon in topology indicates the highest severity alarm on the device or its sub-components. For example, read indicates a Critical alarm.
Displays include right-click access to the Details screen (see Equipment Details on page 146), where you can examine each section of device information and right-click to see further applicable actions. For example right-click to Show Performance, and edit and/or save that view of performance as another Performance Dashboard. Performance can also display portlets that Show Top Talkers (the busiest devices) or Show Key Metrics.
From looking at Performance Dashboards or Top [Asset] Monitors you may conclude some configuration changes made memory consumption spike. Right-click to access resource actions under File Management that let you see the current configuration files on devices, and compare current to previous. You can also back up devices (see How To Backup on page 141) and restore previously backed up files (see How To Restore on page 142). Finally, you may simply want to Resync (another right-click menu item) to insure the device and your management system are up-to-date.
Tip: Alternatively, the Alarms portlet also lets you right-click to expose Alarm Actions.
You can right click for Direct Access – Telnet or Direct Access – MIB Browser to display a command line telnetting to the device, or an SNMP MIB browser to examine SNMP possibilities for it.
The Managed Resources portlet can display the anatomy of a Resource with its right-click actions (see Equipment Details on page 146). Click the plus in the upper right corner to see Managed Resources Expanded. This displays detail or "Snap-in" panels with additional information about a selected resource.
Reports let you take snapshots of network conditions to aid in analysis of trends, and Audit Trail Portlets track message traffic between NMS200 and devices.
Additional Products
The following describes how to increase the power of your NMS200 installation. While the documents mentioned above describe everything available with NMS200, your installation may provide only a limited subset of those features.
Updating Your License
If you have a limited license — for example NMS200 may limit discovery to a certain number of devices— then your application does not function outside those licensed limits.
You can purchase additional capabilities, and can update your license for NMS200 by putting the updated license file in a convenient directory. Then click License Management in the Quick Navigation portlet item to open a screen with a button leading to a file browser (Register License: Select File). Locate the license file, and click the Register License button. Your updated license should be visible in the License Viewer (See License Viewer on page 25 for details.)
Note: If you update your installation from a previous one where you upgraded license, you must also re-register those licenses.
You must restart application server or wait up to 15 minutes before a license modification takes effect. If you import a license that, for example, changes the application's expiration date, it does not immediately take effect. You must restart application server or wait at least 15 minutes.
Online Help / Filter
You can access online help for each portlet by clicking the question mark icon at the bottom of each portlet.
This opens an online help screen with information about the portlet in which you click.
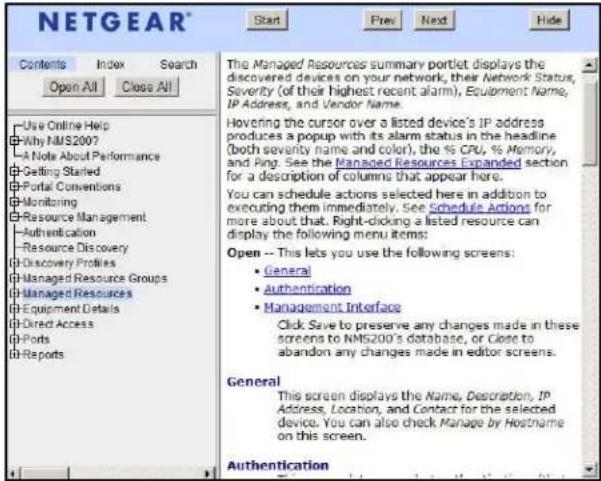
By default, this opens a separate browser window. You can arrange the display so the help screen does not conceal the portlet it describes. By default it also appears without the table of contents, index and search tabs. Click the Show button to display those tabs (Hide conceals them again), and the Prev / Next buttons, or clicking table of contents topics moves to different topics within the helpset.
Expand / Collapse options
Clicking the Expand / Collapse options button to the right of the question mark expands the display of buttons so you can click to Refresh Data for the current portlet, or toggle the display filter and number of items to display, for example. Clicking Expand / Collapse options again returns to the original display.
A Note About Performance
These applications are designed to help you manage your network with alacrity. Unfortunately, the devices they manage or the networks that communicate with those devices are not always as fast as this software. If discovery takes a long time (it can), often network and device latency is the culprit. You can also optimize installations to be faster (see the recommendations in the installation and administration guides), and limit device queries with filters, but device and network latency limit how quickly your system can respond.
Tip: If you use management systems other than this one, you must perform a device level resync before performing configuration actions. Best practice is to use a single management tool whenever possible.
This chapter describes how to install and start NMS200 for basic network monitoring and management.
If you are sure your hardware, software and network is correct and just want to get started immediately, go to Getting Started on page 15.
The NMS200 portal delivers powerful solutions to network problems, and, in addition to the NMS200 technology documented in the following pages, NMS200 offers the following capabilities:
• Message Boards, Blogs, Wikis
• Shared Calendars
• Enterprise Chat / Messaging
- RSS Feeds
• Tagging, Ratings, Comments
System Basics
System requirements depend on how you use the application and the operational environment. Your specific network and devices may require something different from the recommendations for typical installations.
Generally, base the minimum configuration of any system on its expected peak load. Your installation should spend 95% of its time idle and 5% of its time trying to keep pace with the resource demands.
Supported Operating System Versions
The following are supported operating system versions:
- Microsoft Windows®—This application supports most Windows operating systems from Windows XP forward, with their latest service packs. The supported operating systems are: Windows 2003 (Standard, Enterprise and Web), Windows XP (Pro) SP3 or later, Windows Vista (Business or Ultimate), Windows Server 2008, Enterprise Edition, and Windows 7 (Business or better). This is a 32-bit application, however it has been tested for Windows on both 32- and 64-bit operating system versions, and supports both in the supported Windows versions.
Note: Windows Terminal Server is not supported. The installer becomes non-responsive with Data Execution Prevention enabled. This option is disabled by default on Windows Server 2008, but is enabled on a Windows Server 2008 machine running Terminal Server.
- You must disable User Account Control if you are installing on Vista or Windows Server 2008.
- In Vista, you must either to disable User Account Control or run application server as service. Another option is to run as administrator on startappserver. In Vista, right click the startappserver icon and select run as administrator.
- Inst aller may halt when pre-existing bash sessions or cmd sessions left are open. Close all such sessions.
Supported Web Browsers
Supported web browsers include:
- Chrome (v 6 and above)
• Safari (v 5 and above) - Firefox (v 3.6 and above)
• Internet Explorer (v 8 and above)
Note: Internet Explorer has some minor alignment issues, slower JavaScript and flash processing. Overall page processing is slower and some transparencies do not work. You will also see other anomalies like non-rounded corners, no alpha rendering and others.
You can download and install updates if your browser or version varies from those supported. To have all NMS200 functionality, you must also install the latest version of Adobe's Flash™ and Adobe's Acrobat® that works with these browsers. Flash for 64-bit browsers is currently a preliminary version, but you can typically run a 32-bit browser even in a 64-bit operating system, so Flash features will still be available even if you do not want to run Adobe's beta software.
Note: If Flash is installed, but the screen still requests it, reload the page in the browser. Also: Your screen must be at least 1250 pixels wide.
Tip: When no cursor or focus is onscreen, some browsers interpret backspace as the Previous button.
Hardware Recommendations
NMS200 contains an Application Server that runs continuously in the background, and a Client (the user interface you actually see). The stand-alone installation runs a Web Server in addition to the application server. Minimum hardware recommendations are based on the different types of installation available:
- Full Installation (Application server + Web Server)—2.8 GHz dual core CPU, 4G RAM (8G for 64-bit operating systems), and 20G available disk space.
- Web Server Installation—2.8 GHz dual core CPU, 4G. If you want to serve more than 10 web clients, upgrade your hardware.
You can start and stop the client portion of the software without impacting the application server. Device monitoring stops when you stop the application server or turn off its host machine. The client can also be on a different machine than the application server.
Note: See Starting Web Client on page 16 for more information about using web access to this software.
Network Basics
NMS200 communicates over a network. In fact, the machine where you install it must be connected to a network for the application to start successfully. Firewalls, or even SNMP management programs using the same port on the same machine where this software is installed can interfere with communication with your equipment.
Dealing with any network barriers to communicating with NMS200, any required initial device configuration to accept management, and managing security measures or firewalls—all are outside the scope of these instructions. Consult with your network administrator to ensure this software has access to the devices you want to manage with the Protocols described below.
Tip: One simple way to check connectivity from a Windows machine to a device is to open a command shell with Start > Run cmd. Then, type ping [device IP address] at the command line. If the device responds, it is connected to the network. If not, consult your network administrator to correct this. No useful information comes from disconnected or powered-down devices.
Name Resolution
NMS200 server and client require resolution of equipment names to work completely, whether by host files or domain name system (DNS). The application server cannot respond to hosts with IP addresses alone. The application server might not even be in the same network and therefore the host would be unable to connect.
If your network does not have DNS, you can also assign hostnames in
%windir%\system32\drivers\etc\hosts on Windows. Here, you must assign a hostname in addition to an IP address somewhere in the system. Here are some example hosts file contents (including two commented lines where you would have to remove the # sign to make them effective):
| # | 102.54.94.97 | rhino.acme.com | # source server |
| # | 38.25.63.10 | x.acme.com | # x client host |
| 127.0.0.1 | localhost | ||
Protocols
NMS200 uses the following protocols: TCP/IP, SNMP, HTTP/S, UDP Multicast.
Fixed IP Address
NMS200 includes a web server and application server which must be installed to hosts with fixed IP addresses or permanently assigned Dynamic Host Control Protocol (DHCP) leases. For trial purposes, you can rely on a dynamic IP address assignment with a long lease, but this is not recommended for production installations.
If you do change your host's IP address
To accommodate a changed IP address, first delete the contents of \oware\temp. Change your local IP address anywhere it appears in
\owareapps\installprops\lib\installed.properties. Then restart your machine.
Alternatively, in a shell, after running oware to set the environment, you can run ipaddresschange -n followed by the new IP address.
If you do change your server's IP address, you must also change the URL for web client access in your browser.
Authentication
For successful discovery of the resources on your network, this software requires authenticated management access to the device. To get this access, you must provide the correct SNMP community strings, and any other command-line (Telnet / SSH) or browser (HTTP/HTTPS) authentication, and SNMP must be turned on, if that is not the device's default. Some devices require pre-configuration to recognize this management software. Consult your network administrator or the device's manuals for instructions about how to enable those.
Updating Your License
If you have a limited license then your application does not function outside those licensed limits. If you purchase additional licenses, put the updated license file in a convenient directory, then click License Management in the Quick Navigation menu item. Click Select
File and choose the file. Your updated license should be visible in the License Viewer. See License Viewer on page 25 for details.
Note: You must also re-register licenses if you have updated your installation from a previous version where you previously upgraded licenses. In any case, you must restart application server or wait up to 15 minutes before a license modification is effective. If you import a license that, for example, changes the application's expiration date, it does not immediately take effect. You must restart application server or wait at least 15 minutes. If you license new features, restart the application server and client.
Getting Started
The following section outlines the steps in a typical installation and subsequent first use. Because the software described here is both flexible and powerful, this section does not exhaustively describe all the details of available installations. Instead, this Guide refers to those descriptions elsewhere in the NMS200 Installation Guide, Administration Guide, User Guide or online help.
A typical installation means doing the following:
- Installation and Startup—Installation and Startup on page 16 below includes instructions for a basic installation. If you have a large network, or anticipate a large number of web clients, then best practice is to install NMS200 as the Installation Guide guide instructs.
- Discovery—After you first install the application, you must discover the equipment you want to manage. See Discovery on page 26.
- Resource Management — See Managed Resources on page 28, and Chapter 6 in this Guide.
- Configuration Management — Use NMS200 to backup, restore, and compare configuration files. See Top Configuration Backups on page 114.
- Problem Diagnosis—See Alarms on page 51 for information about Fault Management.
- Network Troubleshooting—See Alarms on page 51, and Chapter 5 for details of NMS200's performance management capabilities.
- Reports—Run reports to clarify the state of your network and devices. See Reports on page 161 for details.
-
Real-time Diagnosis thru Collaboration—Collaborate with others about network issues, both by sending them messages that display the device conditions of concern, and with online chat within NMS200. See Sharing on page 43, and Status Bar Messaging on page 34 for details.
-
Unified View—You can scale your NMS200 installation to handle the largest, most complex environments with distributed deployment. Consult the Installation Guide for more about installing distributed, and even high availability systems.
• Finally do not neglect what Common Setup Tasks on page 28 describes.
Installation and Startup
Application server produces the NMS200 information for web clients. It monitors devices, and produces the output which the web server then makes available for those web clients.

CAUTION:
To manage Windows systems—in single server deployments, you must install this application on a Windows host. In distributed deployments, a mediation server installed on Windows must communicate to managed Windows systems.
Windows installation also installs Internet Information Services (IIS)—formerly called Internet Information Server. That installation does not turn IIS on by default. Do not enable IIS on the host(s) running NMS200.
Also: do not install if you are logged in as user "admin."
Installation and startup include:
- Running the installer, responding to its prompts.
Starting application server. In Windows, you can use the Start button (Start > Redcell > Start application server), or type startappserver in a command shell, or right-click the server manager tray icon and select Start if you have installed NMS200 as a service and that icon is red, not green.
Starting web server. You can use the Start button (Start > Redcell > Synergy Manager), or right click the web server's tray icon to start it. You can also double-click this icon and automate web server startup. - Starting the Client. After starting the web server, open a browser and go to the web address hostname:8080 where hostname is the name of the machine running application server (or it's IP address).
- Start using NMS200 as summarized in Getting Started on page 15, or below.
Starting Web Client
You can also open the client user interface in a browser. See Supported Web Browsers on page 12. The URL is
http://[application server hostname or IP address]:8080
The default login user is netgear, with a password of netgear.
The application server hostname is the name of the system where NMS200 is installed.
A Printer Management - Web layout also comes with the application. Use this for better performance from web clients.
HTTPS
You can connect to application server securely by configuring the included Apache Tomcat server for secure access. See http://tomcat.apache.org/tomcat-6.0-doc/ssl-howto.html, among other resources.
The following sections discuss typical administrative steps in getting started, once you have installed NMS200. See Getting Started on page 15 for a list of, and links to, other initial tasks once you have installed NMS200.
Changing the Session Timeout Period
You must modify two web.xml files with the same values to alter the session timeout. One controls the overall server and the other is the push servers for Async-based views. These web.xml files are in the following directories:
/dorado/oware/synergy/tomcat-XX/webapps/ROOT/WEB-INF/web.xml
And
/dorado/oware/synergy/tomcat-xx/webapps/netview/WEB-INF/web.xml
The xml element that contains the session timeout is
<session-config>
<session-timeout>30</session-timeout>
</session-config>
The portal.properties file is in /portal/portal-impl/classes. The property containing the session timeout (in minutes) is:
session.timeout=30
Control Panel
To configure access to NMS200, you must be signed in as a user with the Administrator role's permissions. (The default admin user has such permissions.) The Manage > Control Panel menu item opens a screen with the tabs of interest.
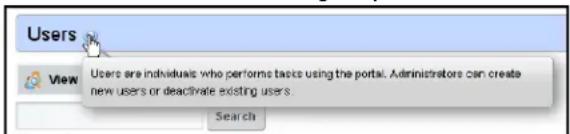
Tooltips describing these screens and fields appear when you hover the cursor over fields, or the blue circle surrounding a question mark next to them.

CAUTION:
When you create users with less-than-Administrator permissions, those users may not see all of the features described in this guide.
Portal > Users
Add users with the following steps:
- Click Manage > Control Panel > Portal Users.
- Click the Ad d tab under the Users heading at the top of the page.
- Enter the details of the new user (Name, Job Title, and so on).
- After you click Save notice that the right panel expands to include additional information. Make sure you specify a Password. Organizations, Communities, and Roles let you specify those for the new user.
- After clicking the Portal > Users item on the left, click Actions > Manage Pages to the right of the user to specify which pages this user will see.
- You can also click Action > Permissions to configure
- You can also specify contact information and Instant Messenger information. The built-in instant messaging is available to users in NMS200 in addition to such instant messaging.
- Fin ally, notice the Miscellaneous information that specifies Announcements to which this user subscribes, Display Settings and Comments.
Once you have configured a user, you can click the View All tab and use the Action > menu to the right of the user listed in Portal > Users on the Control Panel page to do the following:
• Edit—Re-configure the selected user.
- Permissions—Manage the user's access to and control over various parts of the portal.
- Manage Pages—Configure the Public or Private pages for a user, depending on the selected tab. Possible actions here include changing the look and feel of pages (for computers and mobile browsers), adding pages and child pages, and importing or exporting page configurations. Notice that you can configure meta tags, and javascript on these pages too.
Exports are in .lar format, and go to the download location configured in the browser you are using. The export screen lets you select specific features, and the date range of pages to export.
Tip: If you want to set up several pages already configured elsewhere for another user, or even for an entire community of users, export those pages from their origin, then Manage Pages from the Action menu for the user or community.
- Deactivate—Retires a user configured on your system. You can also check users and click the Deactivate button above the listed users.
Your organization has a number of geographic locations and you plan to manage the network infrastructure for all these locations using RC7 Synergy. You can define the geographic locations to which devices can be associated. This will help you manage and view your network, grouped by location or branches. See Locations on page 83 for the specifics about the portlet where you can set up locations.
Tip: To edit your own information as a signed-in user, simply click your login name in the upper right corner of the portal screen.
Portal > Communities
Add Communities with the following steps:
- Click Man age > Control Panel and navigate to Portal > Communities.
- Click the Add tab under the Communities heading at the top of the page.
- Enter the details of the new community (Name, Description).
- By clicking Action ns to the right of any listed Community, you can also select its membership, permissions, viewable pages and so on.
Database Aging Policies (DAP)
Database Aging Policies prevent the NMS200 database from filling up by saving designated contents to an archive file on a specified cycle. Database Aging Policies configure which contents to archive, the archive location, and the configuration of that archive file.
To view and manage such policies, right click an item with them (for example, an alarm), and under Redcell click Database Aging Policies.
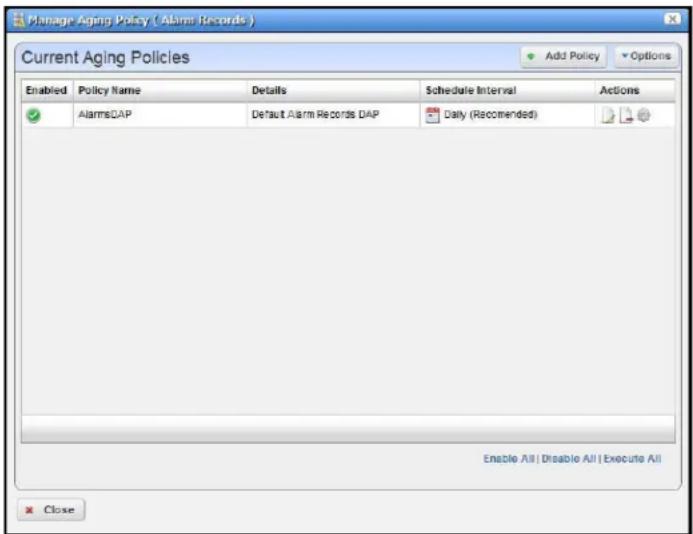
Policies appear in the Aging Policies tab of this screen, with columns that indicate whether the policy is Enabled, the Policy Name, Details (description), Scheduled Intervals and icons
triggering three Actions (Edit, Delete and Execute). Notice that the bottom right corner of this page also lets you Enable / Disable / Execute All policies listed.
DAP Workflow
The following are steps typical for implementing DAP:
- From the screen listing Database Aging Policies (DAP), click Add Policy, and select a policy from the displayed list of alternatives.
- Th is opens Aging Policies Editor.
- In the Aging Policies > General tab, specify the name, schedule interval, whether this policy is Enabled, and so on.
- Specify the Archive Location. Those listed are the Repositories listed on the Repositories tab. You can manage those on that tab.
- In the Aging Policies Options tab, specify either the archiving and retention you want, or further specify Sub-Policies that refine the items archived, and specify archiving and retention for those sub-policy elements. Which one you can specify depends on the type of DAP you are configuring.
- Click Apply until the displayed screen is the DAP manager.
Aging Policies Editor
When you click Add Policy in the upper right corner of the Database Aging Policies (DAP) screen, first a selector appears where you can click on the kind of policy you want to create, then the editor appears. If you click the Edit icon to the right of a listed policy, the Aging Policies Editor appears with that policy's information already filled out, ready to modify.
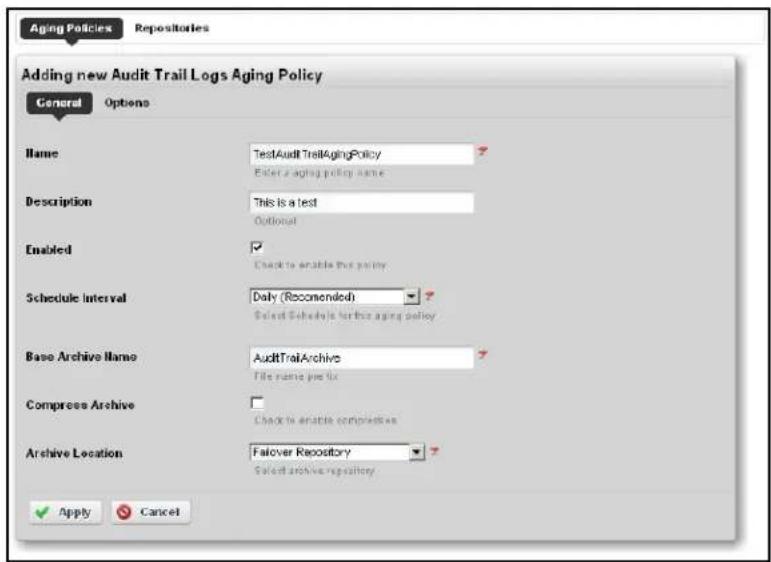
The General screen has the following fields:
• Name—An identifier for the policy
• Description—A text description of the policy
• Enabled—Check to enable the policy.
- Schedule Interval—Use the pick list to select an interval. Once you have configured an interval here, you can re-configure it in the Schedules Portlet.
• Base Archive Name — The prefix for the archived file.
- Compress Archive — Check to compress the archive file.
• Archive Location—Select from the available Repositories in the pick list.
Aging Policies Options
The Options tab in this editor can vary, depending on the type of policy.
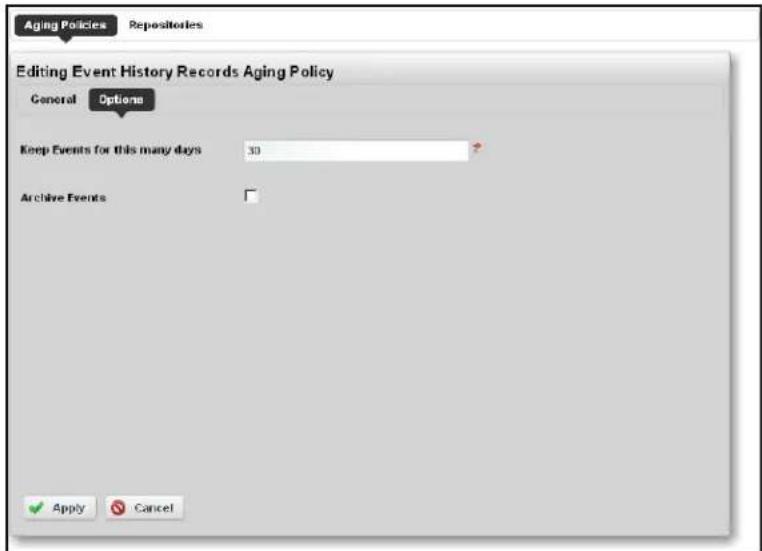
Typical fields can include the following:
- Keep [Aged Item] for this many days—The number of days to keep the aged item before archiving it.
- Archive [Aged Item]—Check this to activated archiving according to this policy.
Sub-Policies
Some types of Database Aging Policies can have sub-policies that further refine the aging for their type of contents.
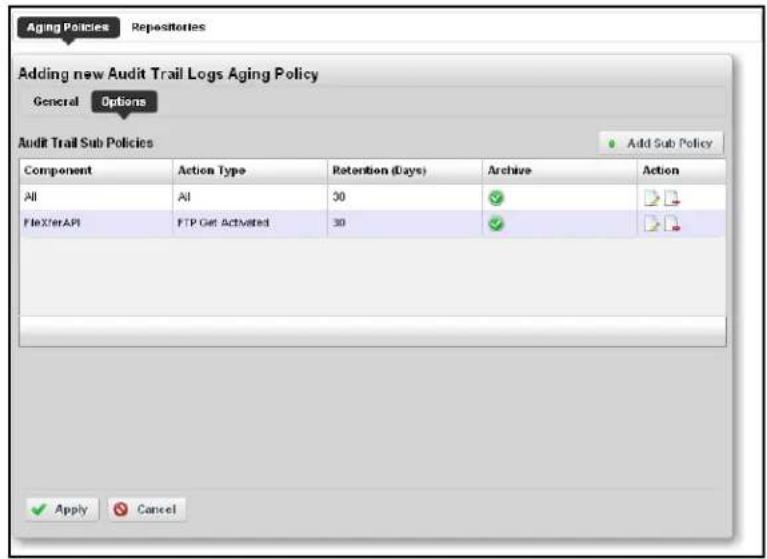
These appear listed in the Aging Policies Options tab. Click Add Sub Policy to create them. Notice that you can Edit or Delete listed policies with the icons in the far-right Action column in this list.
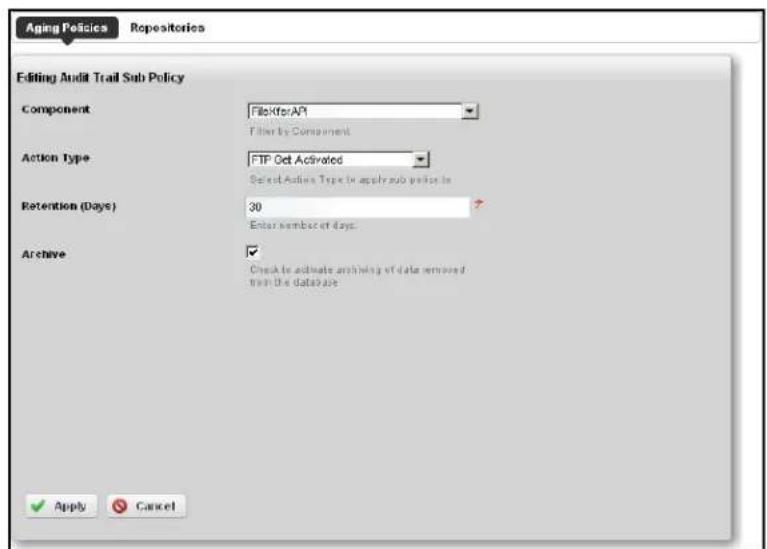
Such sub-policies contain the following types of fields:
• Component—Select the component for the sub-policy from the pick list.
• Action Type—This further sub-classifies the Component.
• Retention (Days)—The number of days to keep the aged item before archiving it.
- Archive—Check this to activated archiving according to this policy.
Repositories
When you select a repository in the Aging Policies Editor, the available policies come from what is configured in this tab of the editor.
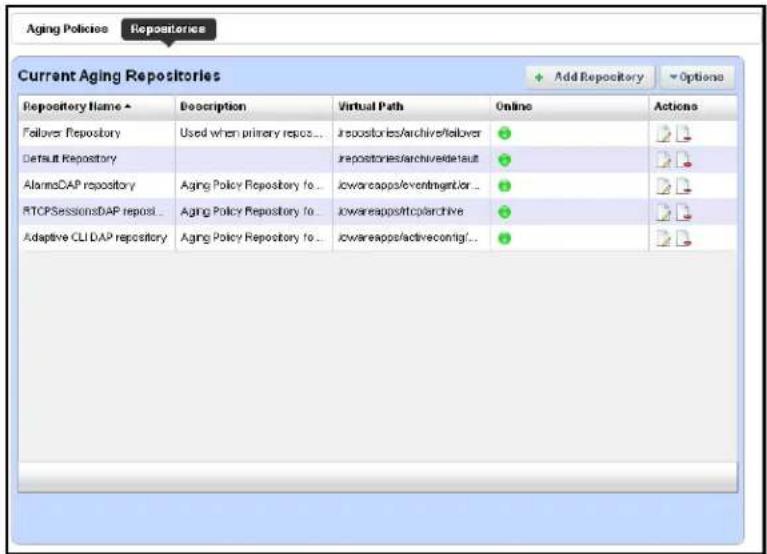
Available repositories appear listed in the initial screen. Like the Aging Policies Editor, you can click Add Repository to create a new repository, and Edit or Delete selected, listed policies with the icons in the Action column. Notice the listed policies indicated whether the archiving destination is Online with a green icon (this is red, when the destination is offline).
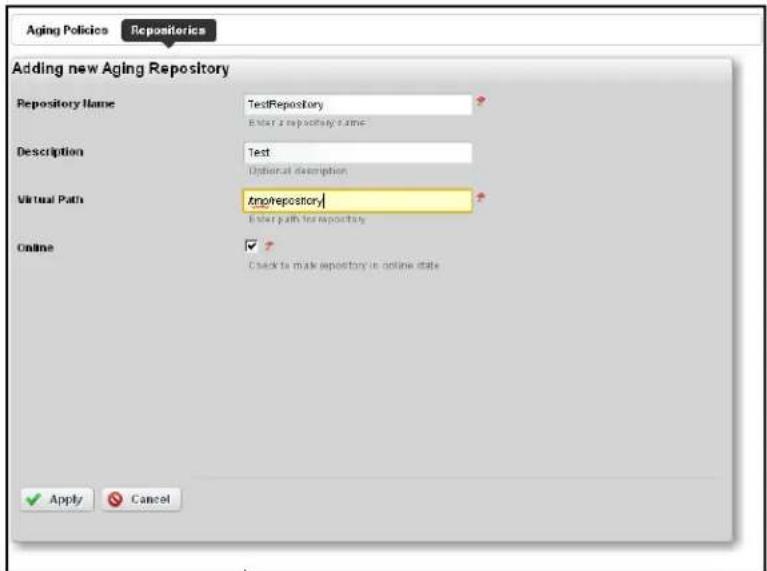
When you Add Repository or Edit an existing one, the following fields appear in the editor:
- Repository Name—An identifier for the archiving destination.
• Description — A text comment.
• Virtual Path—This is the path relative to the installation root directory.
• Online—Check this to put this repository online.
Quick Navigation
The Quick Navigation portlet lets you quickly perform some basic tasks:
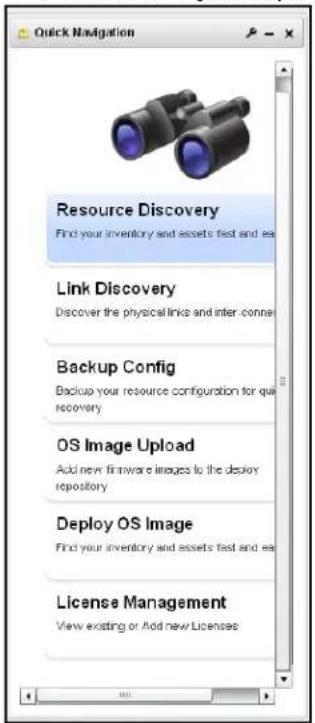
- Resource Discovery—Discover devices in your network with the Quick Discovery defaults, or lets you construct a Quick Discovery profile if none exists. See Resource Discovery on page 123 for details.
- Link Discovery—After you have discovered resources, this discovers their connections. See Link Discovery on page 145.
- Backup Config Files—This lets you back up discovered devices' configuration files. Before you can use this feature, you must have servers configured as described in Netrestore File Servers on page 30 and/or File Servers on page 74. See also File Management on page 138.
- OS Image Upload—Upload firmware updates for devices. See OS Image Editor on page 78 for more about these capabilities.
- Deploy OS Image—This deploys firmware updates. To deploy images, you must have File Servers configured, as described above for Backup. See Deploy OS on page 80.
- View / Add Licenses—This lets you see and manage the licensed capabilities of NMS200. See License Viewer below for details.
License Viewer
This screen appears when you click View / Add Licenses in the Quick Navigation portlet.
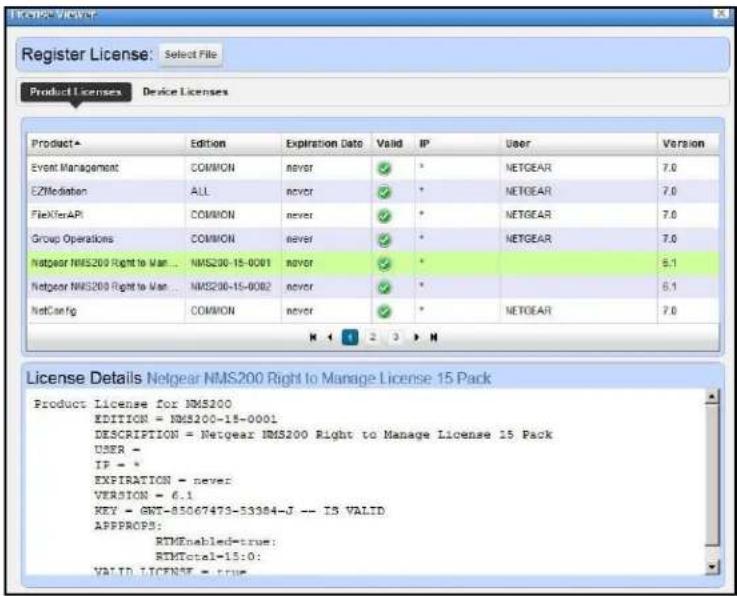
Register License
To register a license click the Select File button at the top, and use the subsequent screen to select a license file.
You must restart application server or wait up to 15 minutes before a license modification takes effect. If you import a license that, for example, changes the application's expiration date, it does not immediately take effect. You must restart application server or wait at least 15 minutes.
Product Licenses
This portion of the License Viewer lists the products for which you have licenses already, displaying the Product, Edition, Expire Date, whether the license is Valid, any IP restrictions, the User who installed the product and/or license, and the Version of product for which the license is valid.
License Details: [Product]
This portion of the screen displays the details of a license selected in the Registered Product Licenses portion of the License Viewer screen. It is blank if you have not selected a license in the list above this panel.
Device Licenses
This tab displays the Maximum Allowed number of licenses for devices, the Count Managed the Variance between maximum and managed, and Type of license.
Discovery
To begin managing resources in your network, you must discover them to store their information in the application database. This begins with Discovery Profiles portlet. By default, this appears in the Admin page.
Discovery profiles configure equipment discovery for NMS200.
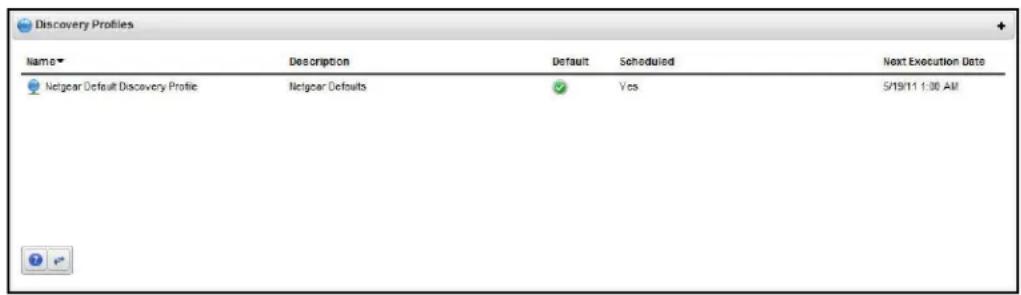
The summary view displays the Name, Description, Default (the green check indicates the default profile), whether the profile is Scheduled and Next Execution Date for scheduled discovery.
To Begin
- Right click the Discovery Profiles list and select New.
- The e Discovery Profile Editor appears, with a step-by-step set of screens to configure resource discovery. You can navigate through it by clicking the screen tab names at the top, or by clicking the Next button at the bottom of the page.
Discovery Profile Editor
Use this editor to configure discovery. Baseline discovery is the initial discovery to compare to later discoveries. Follow these steps to discover equipment on your network:
-
General Par ameters—Set the Name, Description and whether this profile is the baseline default.
-
Profile Options—Select the Device Naming Format (how the device appears in lists, once discovered), whether to Manage by IP address or hostname, and check whether to Resolve Hostname(s), ICMP Ping Device(s), Manage ICMP-only Device(s), or Manage Unclassified Device(s). This last checkbox determines whether NMS200 attempts to manage devices that have no device driver installed. Management may be possible, but more limited than for devices with drivers installed, provided this capability is one you have licensed.
Network
- After you click Next, the Network screen appears.
• Network Type and Addresses—Select the type of entry in the pick list (IP Address(es), CIDR Address, Hostname, SNMP Broadcast, Subnet).
Tip: You can specify an IP Address range by separating the beginning and end with a dash. For example: 192.168.1.1 - 192.168.1.240.
The tooltips in the data entry field describe what valid entries look like.
- Authenticati on—You can create new, or add existing authentications. See for details. Notice that authentications appear with Edit / Delete icons and Up / Down arrows on their right. The Edit icon opens the authentication editor. Click the arrows to arrange the order in which credentials are tried (top first). Ordering only applies when two credentials are of the same type.
Inspect
- Inspect—This screen lets you preview the discovery profile's actions and access to devices. If you clicked Next rather than Inspect at the bottom of the previous screen, click Start Inspection in the top right corner of this screen to begin the inspection process that validates the device's credentials. Notice that the Inspection Status fields at the bottom of the screen indicate the success or failure of Ping, Hostname resolution, and Authentications.
If the device does not match all required authentications, you can click the Fix it icon (far left) to edit them for the selected device.
When authentications are unsuccessful, you can click Previous to go to the Network screen and remove or edit them.
- Save—Click Save to preserve the profile. You can then right-click it to select Execute and begin discovery. If you select Execute from the profile editor, NMS200 does not save the profile to execute later.
Results
- Execu te—Clicking Execute begins discovery, and the message traffic between NMS200 and the device appears on the Results screen.
This is a standard Audit screen. See Audit Trail / Jobs Screen on page 45 for more about it. - A message (Discovery Profile Execute is complete) appears in the Messages at the bottom left of the status bar.
Tip: You can also schedule discovery profiles to run periodically, updating your NMS200 database with any network changes. For more, see Schedules on page 48.
- The devices in your network now appear in the Managed Resources portlet, and elsewhere (in Topology, for example).
See Discovery Profiles on page 124 for more details about this process.
Managed Resources
This portlet displays all the devices you have discovered.
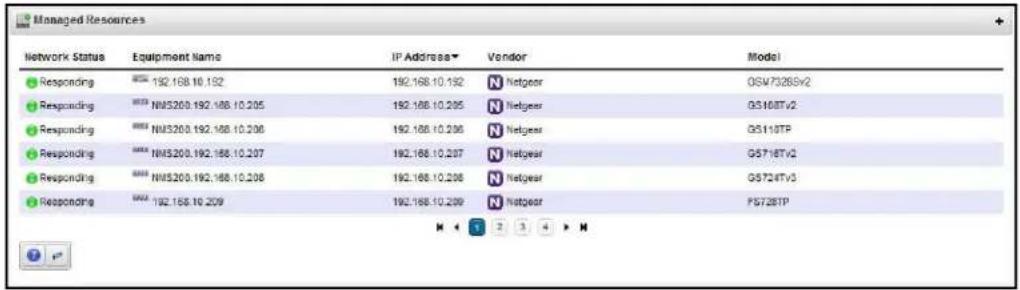
See Managed Resources on page 133 for the details of this screen's capabilities.
See also Managed Resource Groups on page 130.
Common Setup Tasks
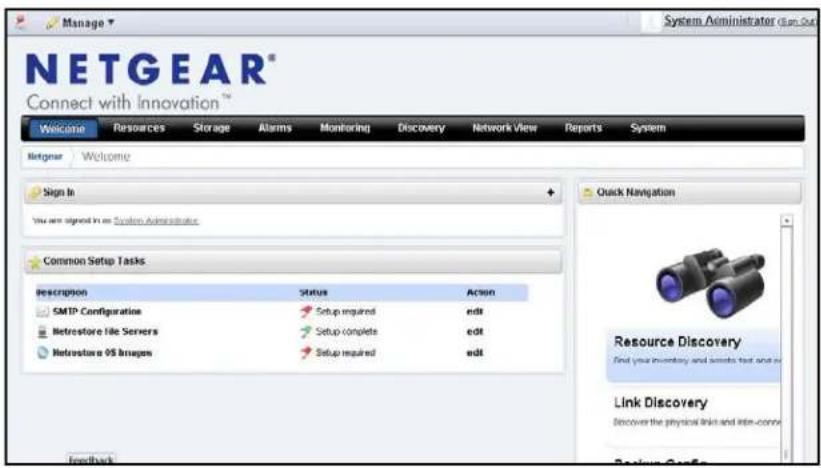
By default this portlet appears on the first page after you sign in, and reminds you of the following common tasks:
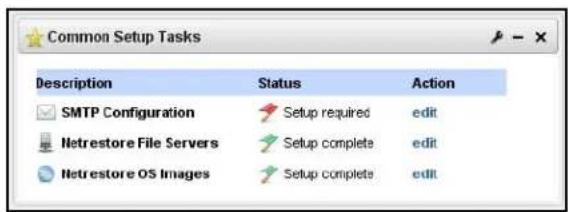
- SMTP Configuration
• Netrestore File Servers
• Netrestore OS Images
A red flag appears with the "Setup required" message in the Status column when these are not configured. Configuring them displays a green flag with the "Setup complete" message. Click the edit link in the Action column to open editors for each of these.
SMTP Configuration
You can use NMS200's messaging capabilities to communicate with other users, but if you want to receive e-mails automated by actions like configuration file backups, NMS200 must
have a mail account. This screen configures the e-mail server so NMS200 can send such automated e-mails.
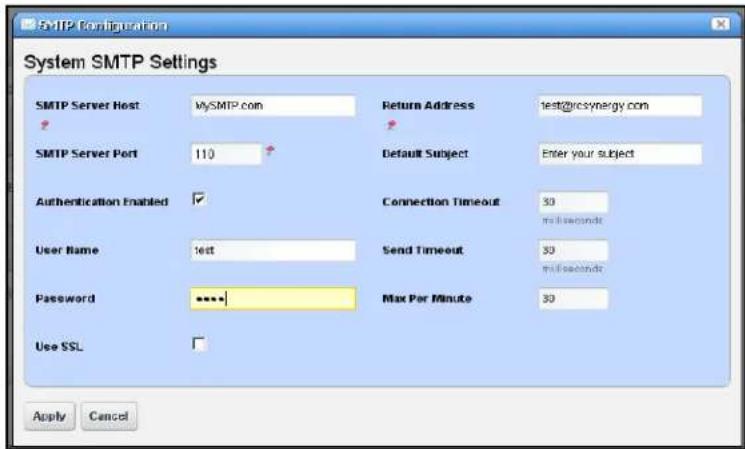
This screen contains the following fields:
- SMTP Server Host—The IP address or hostname of your SMTP server.
- SMTP Server Port—The port for your SMTP server (110 is typical).
- Authentication Enabled—Check this to enable authentication for this server. Checking enables the next two fields.
- User Name—The login ID for the SMTP server, if authentication is enabled.
- Password—The password for the SMTP server, if authentication is enabled.
• Use SSL—Enable Secure Sockets Layer protocol to interact with your SMTP server. - Return Address—The return address for mail sent from NMS200.
- Default Subject—Text that appears by default in the subject line of mail sent by NMS200.
- Connection / Send Timeout — The time-outs for mail sent by NMS200.
• Max Per Minute—The maximum number of e-mails NMS200 can send per minute. - SMTP Server Host—The IP address or hostname of your SMTP server.
- SMTP Server Host—The IP address or hostname of your SMTP server.
Two settings for e-mail servers appear in Control Panel, one in the Control Panel > Portal > Settings Mail Host Names edit screen, and another in Control Panel > Server Administration > Mail. The Portal-based e-mail settings help Administrators limit signups to e-mails only existing in their organization. The screen in that panel provides a list of allowed domain names, if that feature is enabled.
Control Panel > Server Administration > Mail is where to configure the Main server and authentication for routing mail
Netrestore File Servers
The Netrestore file servers provide FTP connections for retrieving and deploying devices' configuration files, and for deploying firmware updates to devices on your network. See File Servers on page 74 for a description of the portlet that manages file servers. If you want to configure servers from the Common Setup Tasks portlet, a slightly different screen appears when you click Edit.
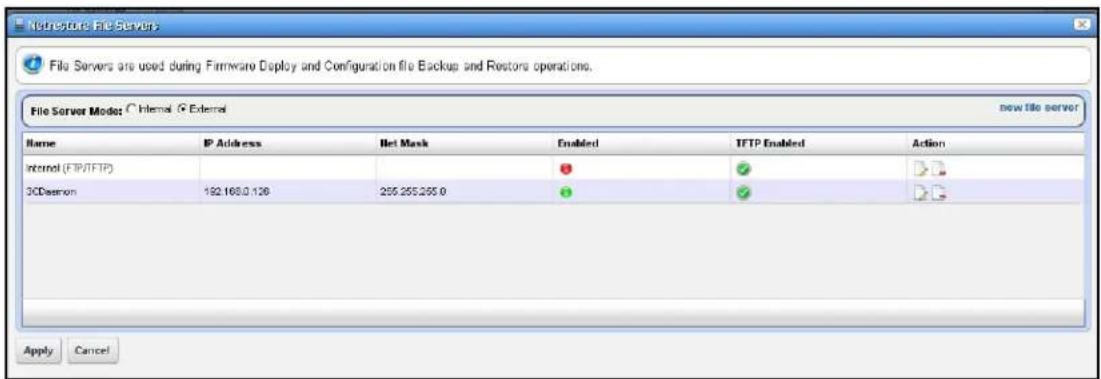
This displays configured file servers. Configure new servers by clicking the new file server link in the upper right corner. The editing process after that is as described in File Server Editor on page 76.
This section explains how to navigate and configure the NMS200 web portal. Because this portal is based on open source features, and can be so flexible, this is not a comprehensive catalog of all its features. The following discusses only features significant for using NMS200.
The application's web Portal contains the following common elements:
The Dock
• Status Bar Messaging
- Menu Bar
- Portlets
Because the elements that manage the Web portal are so flexible, and can be very detailed, only NMS200's most important, or most-frequently-used features appear documented below.
Tip: Clicking Go to in the Dock and selecting My Private Pages to open pages not shared with others, unless you configure sharing. (See Sharing on page 43.)
Because they are so fundamental to NMS200's functioning, this section also describes the following portlets:
• Audit Trail Portlet
- Schedules
Help / Tooltips
In NMS200, the far right menu item is typically a Help page, with links to this document and others, but the whole application has extensive tooltips that appear when you the cursor over the blue circle with a question mark (the help icon).
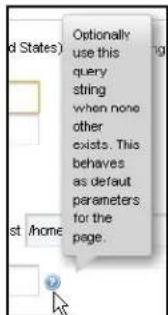
Tooltips also display the full content for most fields in portlets. If the screen does not allow a full field to appear, you can still find out what is in a field by letting the tooltip re-state what it contains.
Refresh
You may have to refresh your browser to see screen updates. One way to refresh without re-loading the entire window, however, is to change the Max items displayed number for a portlet.
The Back Button
Although browsers have a Back button, this is not always the best way to return to a previous screen within the portal. If it is available, the Return to previous button in the upper right corner of a screen provides the most dependable way to return to a previous screen. It typically goes back to a page rather than a maximized view of a portlet.
Show Versions
To see which products are installed, and what versions, select the Manage > Show Versions menu item.
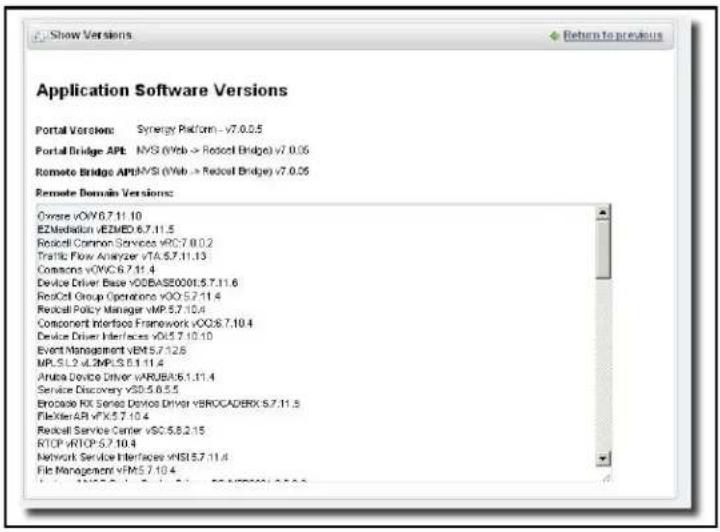
This can be critical information if you request support for your NMS200 installation. The Application Software Versions screen appears with the product versions listed in the bottom. Device drivers list supported devices and their operating systems. This can be important for troubleshooting, and is vital information for support.
The Dock
This bar appears at the top of portal pages. Its exact appearance depends on your package. With it, you can navigate to portal pages and content.

Click the down arrow to see menus for items on the dock. Here are its functions
- Pin—The "push pin" on the left side of this bar keeps the dock at the top of the screen when the page is large enough to scroll past it.
- Manage — This menu lets you alter the following:
- Control Panel—Lets you manage your account, and communities throughout the portal. See Control Panel on page 17 for instructions about this.
The NMS200 elements include Show Versions on page 33.
- Go To—Makes the selected screen type appear. Select My Public Pages or My Private Pages, for example. When you add a new Community, its configured pages appear in this menu too.

CAUTION:
NMS200 does not support multiple tab browsing as a reliable way to see its screens. Pages overcome that limitation.
- [User Name] (sign out)—Opens the My Account screen in Control Panel, where you can configure your name, job title, image, and so on. The Sign out link lets you log out of NMS200.
Status Bar Messaging
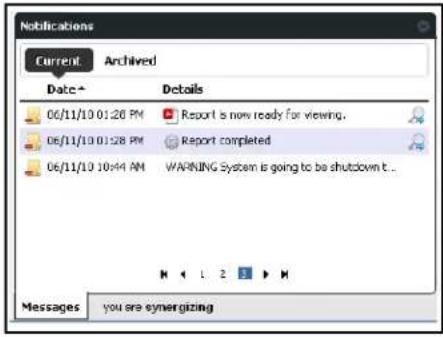
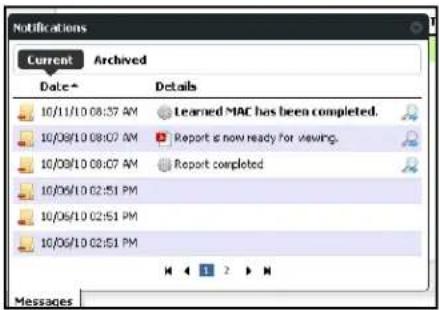
The Message bar appears at the bottom of the portal. On the left, it catalogs messages and notifications you have received, including generated reports. Click the magnifying glass to the right of reports and Job Status notifications to open a separate viewing window. The panel includes Current and Archived messages tabs.
Chat / Conferencing
This portion of the message bar lets you send and receive messages to colleagues who are online at the same time you are.
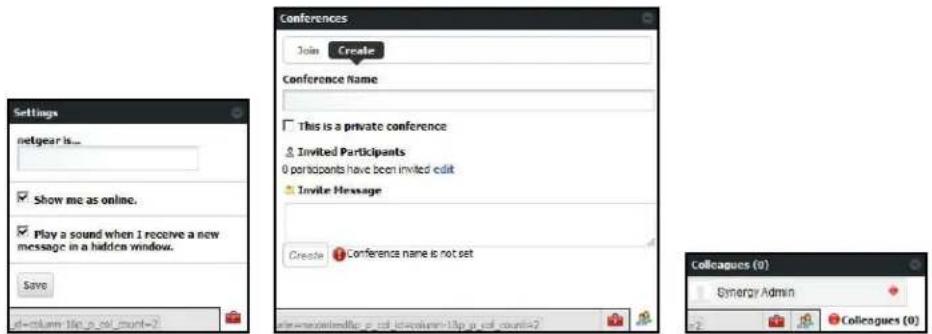
This has the following fields and other possibilities for you to configure:
• [Saying]—Configure this text in the menu produced by the Settings icon (the next item).
- (Settings)—This configures your user settings for any online chat with your colleagues, including the saying, whether your online presence appears, and whether to play a sound when messages arrive.
Tip: When you have a message from another user, that user's name appears on the status bar to the left of this icon.
(Conferences)—This configures your user settings for any online chat with multiple colleagues. The Create tab lets you edit to invite colleagues, configure an invitation message and check to make a private conference that only invites can attend. The Join tab becomes active when you are invited to a conference. An online chat window appears after you join.
- Colleagues (n) — A green dot indicates others are online (it's red when you are alone), and n is the number of colleagues online. Click to open the chat screen. Click on a colleague and enter text at the bottom of the popup that appears to send messages. Previous chat history also appears above any current text on that chat popup.
Click the minus icon in the top right corner of these screens to close them.
Menu Bar
The Menu Bar appears below the The Dock, and any icon you have selected. It consists of Menu items that lead to separate pages you have configured with Manage > Add Page.

Notice that a “breadcrumbs” trail describing an access path to the page you have selected appears beneath the Menu Bar. The pages that appear on this bar can vary, depending on which NMS200 package you purchase
Tip: You can drag and drop the menu bar labels to different positions, and can click a label to rename the page, or delete it (with the "x").
Graphs
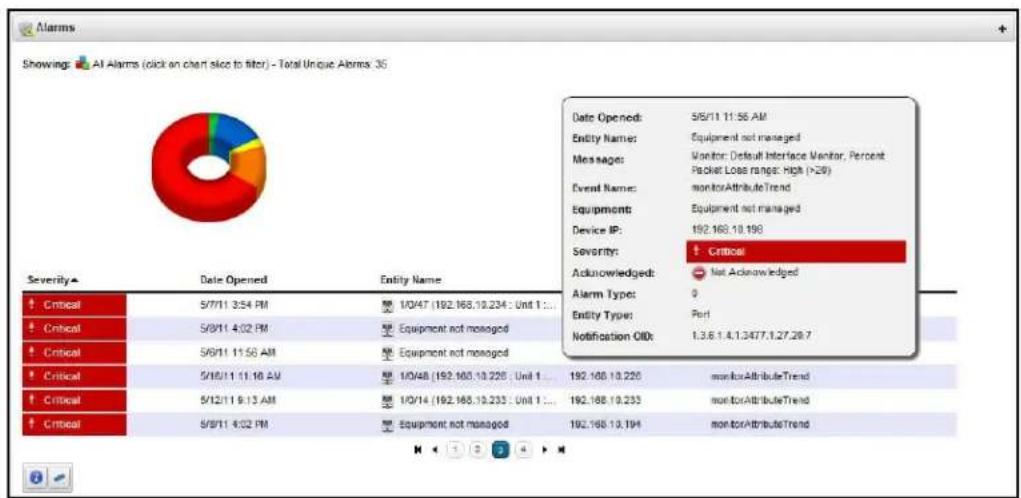
Graphs appear in alarm and performance portlets functions. These display the real-time division of total alarms or performance metrics, and you can change their appearance, or associated data lists display.
pie
Air Alarms Showings: All Alarms (click on chart slot to filter) - Total Unique Alarms: 35 | Severity | Date Opened | Entity Name | |---|---|---| | Critical | 5/7/11 3:54 PM | 1/0/47 (192.168.19.234 : Unit 1 ...) Equipment not managed | | Critical | 5/9/11 4:02 PM | Equipment not managed | | Critical | 5/9/11 11:58 AM | Equipment not managed | | Critical | 5/10/11 11:18 AM | 1/0/48 (192.168.19.226 : Unit 1 ...) 1/0/14 (192.168.19.235 : Unit 1 ...) Equipment not managed | | Critical | 5/12/11 9:13 AM | 1/0/14 (192.168.19.235 : Unit 1 ...) 192.168.19.233 192.168.19.194 Severity: Critical Acknowledged: Not Acknowledged Alarm Type: 0 Entity Type: Perf Notification CIO: 1,3,6,1,4,1,3477,1,27,29,7 monitorAttributeTrend monitorAttributeTrend monitorAttributeTrendFor example, clicking the Critical alarms slice means only Critical alarms appear listed in the portlet. Notice also that the graph “explodes” to highlight the selected slice. Hover the cursor over a portion of the graph and a tooltip with information about that slice also appears.
Hovering the cursor over a listed item in the column where a question mark appears indicates a “tooltip” with more information is available for this item. An informational popup screen appears after a brief wait to query the application server. These pop-ups can include graphs of recent activity too.
Graphs can appear as lines, bars or pie graphs, depending on the portlet, device and activity monitored.
Note: Install the latest Adobe Flash for graph functionality.
Portlets
Portlets are the elements of any page within the NMS200 web client. Initially, they appear in a small, summary screen format. Click Add > More... to add a portlet to a page you have created.
For a more specific look at available portlets, see the chapters following this one. The following describe common portlet features.
One of the first portlets typical users see is Discovery Profiles.
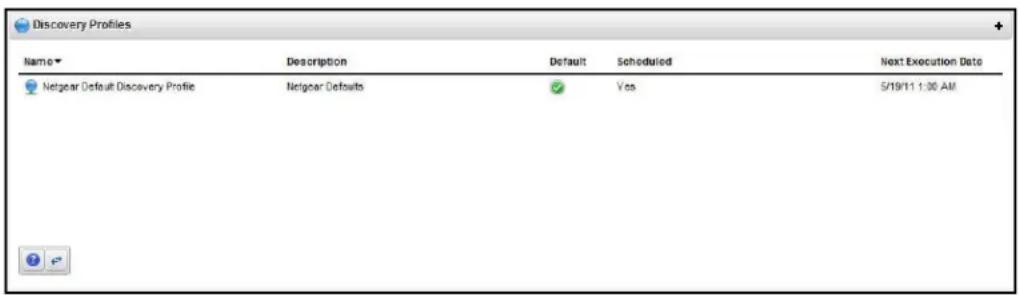
To act on listed items, right-click. A menu appropriate to the portlet appears.
The title bar for the portlet displays its name. To rename it, click on the name, and the field becomes editable. You can make changes, then click the green checkbox to accept them (or the red "X" to abandon them). The right portion of the title bar contains several editing controls. Clicking on the wrench icon produces a menu that leads to editors for the Configuration of this portlet (user permissions to view and configure, Sharing, and so on).
The plus or minus (+ or -) icons Minimize, Maximize lead to Expanded Portlets.
Tip: To see information about listed items in a portlet, hover your cursor over the row until a question mark appears. A mini-query about the selected item appears in a large tooltip. See Online Help / Filter on page 9 and Expand / Collapse options on page 10 for a description of the buttons at the bottom of portlets.
Expanded Portlets
Some portlets appear with a plus (+) icon in their upper-right corner, and can expand to display more information. Return to the smaller portlet by clicking Return to Previous in the expanded portlet's upper right corner.
Tip: If you want to multi-select within listed items in a portlet, you must expand it.
User permissions may limit access to the expanded portlets. For example, NMS200 can have many communities and limit users' memberships. Such users can lightly browse other communities' screens without full privileges.
Note: Screen size limitations may require you to expand the browser to see expanded screens correctly. You must have at least 1250 pixels in width.
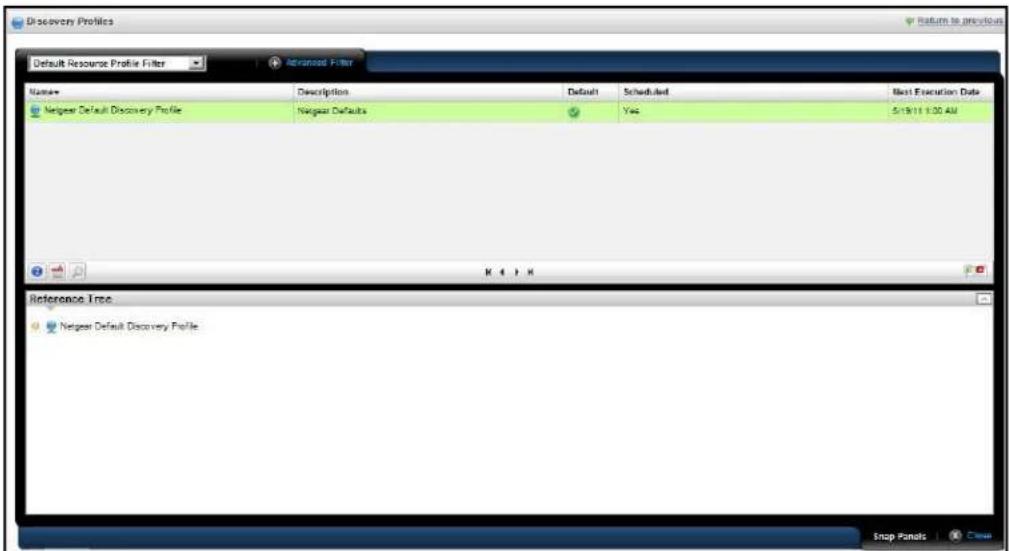
You can right-click to act on listed elements as in the basic, smaller portlet, but here you can also see details about a selected row in the Snap Panels below the table list items in an expanded portlet.
Tip: Best practices uses the "breadcrumb" trail of links at the top pages to navigate. This lets you precisely "drill out" to previously seen screens. The browser's Back button is not supported, and produces unpredictable behavior
Snap Panels
The snap panels that appear below the expanded portlet's list can "stack" on top of each other, so several can appear simultaneously in each slot for Snap Panels. Click the title bar of
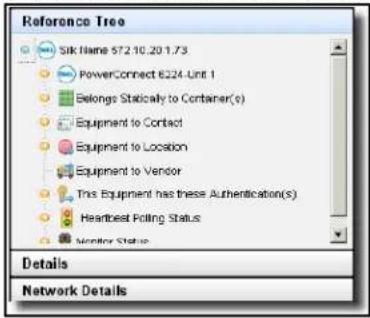
the panel to toggle its expansion or collapse. In the Reference Tree snap panel, click the plus (+) to expand the tree of connections.
Filters
Filters typically appear at the top of expanded portlets. You can pick from already-configured filters with the drop-down on the left, or you can click Advanced Filter to create one of your own.

After you click the green plus (+), select and or or on the left to combine more than one filter. Click Apply Filter to see the list after the filter acts on it. Click Reset to return the list to its original state.
Click Save As to preserve a filter you have configured for future use. The pick list in the upper left corner of this filter panel is where you would select it.
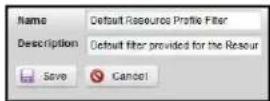
Create a name and description, then click Save on the next screen to preserve your filter configuration.
Note: When using a filter you must click the refresh icon to the right of the drop down list to populate it.
Rows and Search
The "basket" icon midscreen on the left opens Rows per Page and Max Items selectors, along with a Go button to activate any changes you make there.

For performance reasons, these are set to relatively low defaults.
You can search by clicking the magnifying glass icon. This opens a search field where you can enter search terms for all the fields that appear in the list at the top of the portlet. The search is for what you enter, no wildcards are supported.
Click the icon again to close the row configuration or search field.
Tip: Sort on a column by clicking on that column's heading. Reverse the sort order by clicking it again.
Add / Remove Columns
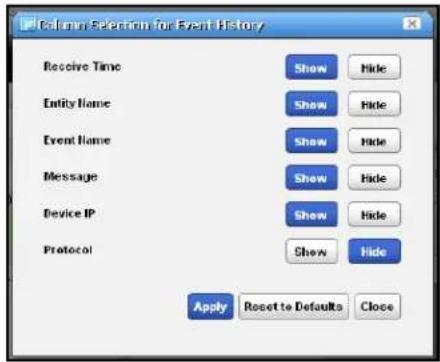
Often when you right-click a list in an expanded portlet, a menu item appears that lets you add or remove columns. When you select this, a screen showing the available columns appears with Show / Hide buttons to the right of the column name. Click the appropriate buttons (they change color), and click Apply to change the columns that appear on screen by default. You can also Reset to Defaults or abandon any changes and Close this screen. The changes appear instantaneously when you return to the expanded portlet.
Pages
Most portlets use the “recorder” icons to page through a list that occupies more than one screen. The right/left arrows go forward and back one page. The icons at either end go to the beginning or end of the pages.

Exports
At the bottom right corner of the list, appear an Excel and Acrobat icon. Click these to export the list contents as either an Excel spreadsheet (.xls), or a pdf file. These download to the default download location you have configured on your browser.
Snap Panels (Reference Tree)
These vary, depending on the portlet, but the convention of displaying a Reference Tree panel is common. This displays items related to the selected list item in tree form. Click the plus (+) to expand a node on the tree.
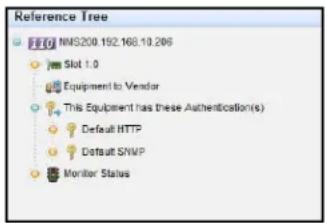
Click Return to previous in the upper right corner of the expanded portlet to return to the page where you started, with the smaller portlet. If the page you are on has a “breadcrumbs trail” of intervening detail pages (for example), you can click an intervening page’s breadcrumb if you do not want to return to the previous screen
Mandatory Fields
Some portlets include editors. These appear after you select an item, right-click, and select either New or Open. Mandatory fields in these editors appear with a red flag icon to their right.

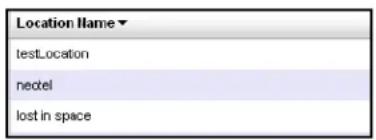
Sorting
Sorting tables that list items occurs when you click a column heading. The arrow to the right of that heading's text displays the direction of the sort (ascending or descending). When the arrow appears in a heading, the selected column is the basis for sorting.
Common Menu Items
Several menu items appear in multiple portlets. In addition to editing commands (New, Open), such menus let you:
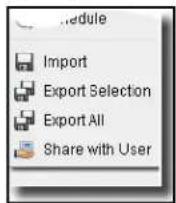
- Import / Export
• Share with User (see Sharing on page 43).
• View as PDF
Note: You can also export or import page configurations as well as items NMS200 manages like equipment, discovery profiles, locations and so on.
Import / Export
Menus often contain these options:
- Import—Retrieve a file with an XML description of the listed items in the manager. Some imports can come from a URL.
- Export Selection—Export a file with a text or XML description of the selected item(s) in the manager
- Export All—Export a file with a text or XML descriptions of all listed items in the manager.
Tip: Printing manager contents: You can Export a full size manager into PDF or Excel format and print from there.
Export / Import Page Configurations
Export / Import also appears as a tab in screens that manage pages (Manage > Page and Manage > Control Panel screens display these tabs). For example, click Manage > Settings in the Dock. Use the checkboxes on the Export / Import page to select exactly what elements to export. The automated file name includes your login identity, the date, and the lar extension. The file itself is a compressed collection of XML file configuration settings for the Pages / Portlets you have elected export. Its destination is the browser's default download location.
Note: Use the More Options link at the bottom of the Export screen to expose more export options.
Use this same page to import, if it is enabled.
Sharing
You can share elements within NMS200 with colleagues, and consult with them using the texting described in Status Bar Messaging on page 34. To share an something, first select it where it appears listed in the appropriate portlet. Right click and select Share Asset.
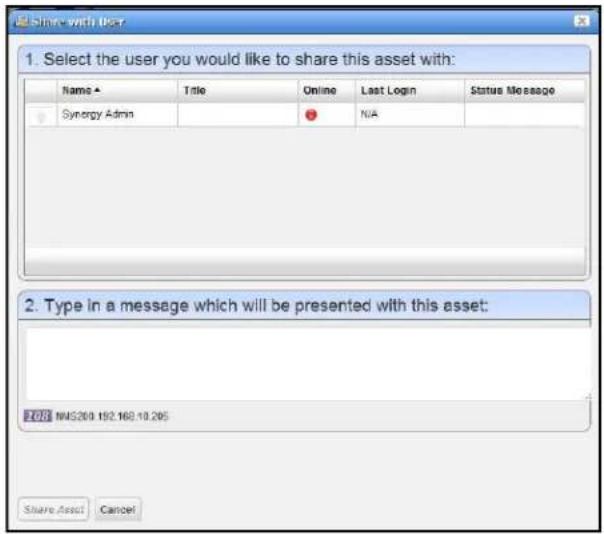
In the subsequent screen, select a user with whom you want to share, type any message you want to include and click Share Asset. The chat message to the selected user includes your text and a link that opens to display the Snap Panels for the selected item. Cancel aborts sharing.
View as PDF
This displays the selected asset's information as a PDF.
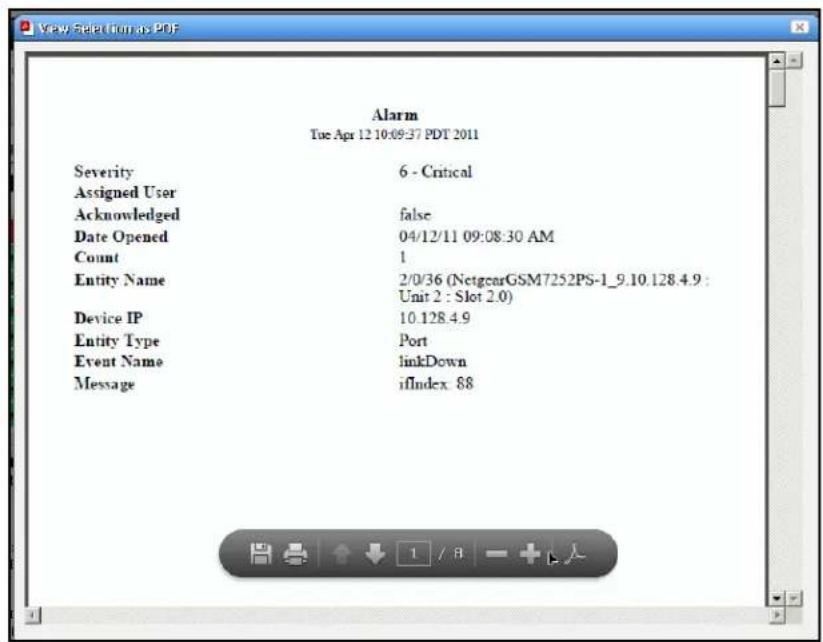
You can search, print or save this to file, and use any of the other Acrobat capabilities. Clicking the acrobat logo docks the floating / disappearing Acrobat toolbar within this screen.
Tip: To search the PDF produced, click the binocular icon in the docked toolbar.
You can also create PDF reports containing descriptions of multiple selected assets, but you must open an expanded portlet to multi-select.
Audit Trail / Jobs Screen
When you execute an action, for example discovering network resources, an audit trail screen appears with a tree displaying the message traffic between NMS200 and the device(s) the action addresses.
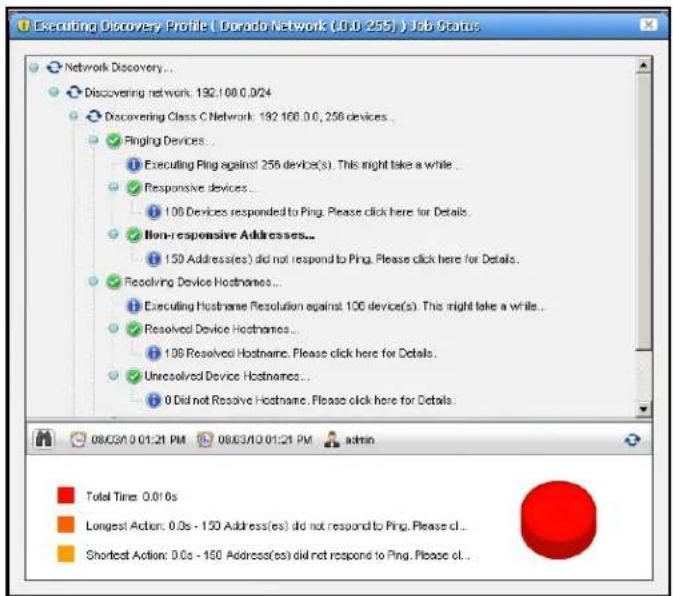
To see the details of any message, click on it, and those details appear in the lowest panel of this screen. If you click on a summary message (not a "leaf" on the tree), a graph appears displaying the time for its component messages. Hover your cursor over each portion of the graph for more details.
Tip: The time for messages and logged in user initiating the action appear on the bar between the upper and lower screen.
For many activities, you can close the audit trail viewer any time. The action, for example, discovery, continues to run on the application server in the background, and the audit trail is archived. See Audit Trail Portlet on page 46 for more about retrieving archived audit trails and other screen details as they appear in that portlet.
Audit Trail Viewer
Some portlets also offer an Audit Trail menu item that displays Audit Trail / Jobs Screens for the selected item.
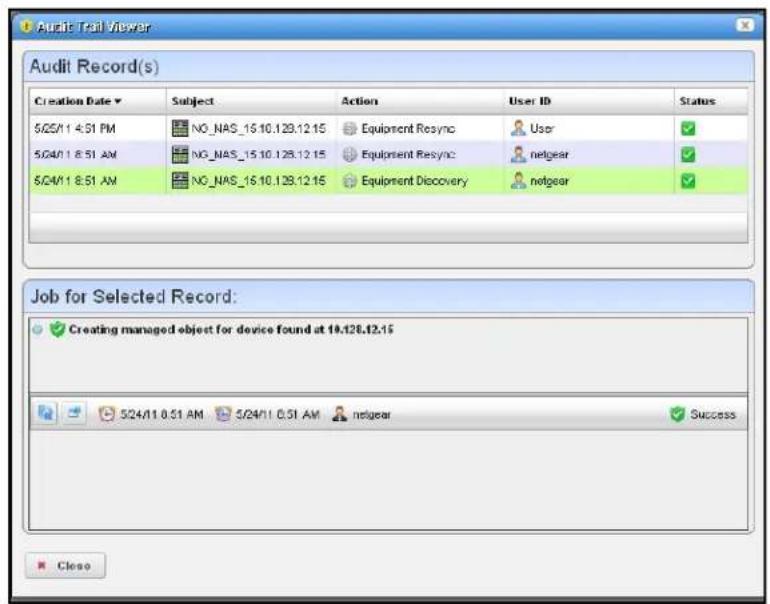
The top of this screen contains a list of Audit Records. Click one of this list to see the Job details as you would in the Audit Trail / Jobs Screen.
Audit Trail Portlet
The audit trail summary displays an archive of the message traffic between NMS200 and monitored devices, as well as NMS200's reaction to failed message transmission.
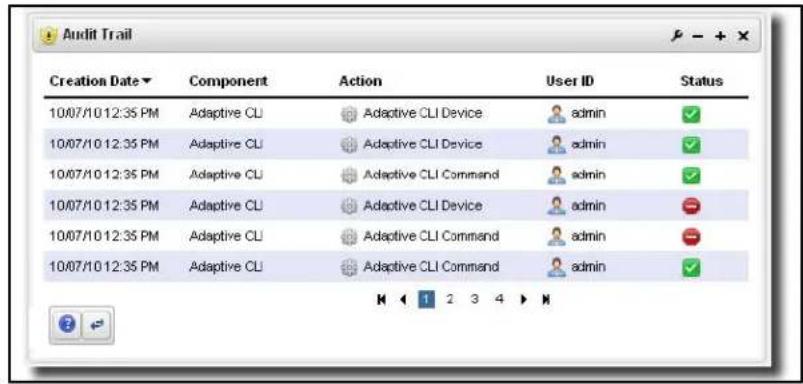
The Creation Date, Component, Action (the summary message of the audit trail), User ID (the login ID of the user whose actions resulted in this trail), and Status of the messages appear in the table (hover the cursor over the icon for a text message describing status).
Right click to Delete a message, View job (see the message traffic archived) or Share with User.
Tip: To see the audit trail for recently completed processing, open the Messages tab in the lower left corner of the portal, and click the magnifying glass to the right of the appropriate message.
Expanded Audit Trail Portlet
When you click the plus (+) in the upper right corner of the summary screen, the expanded portlet appears. You can right click to Add / Remove Columns in this screen, and, as always, filter the appearance of the screen with the filter capabilities at its top.
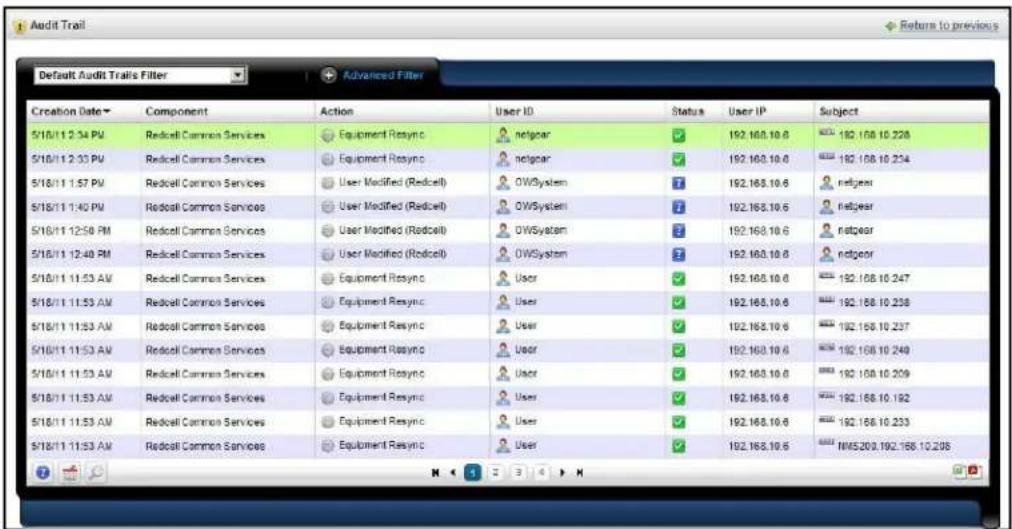
In addition to the summary screen's columns, the following are available in this screen:
• User IP—The IP address of the user who created this audit trail.
- Subject—The equipment at the origin of the message traffic with NMS200.
You can right-click a selected item and either Delete it, or View Job. This last option displays a screen with the details of the job itself.
View Job
The Audit Job Viewer displays the audit trail messages in tree form. To see the contents of an individual message that appears in the upper panel, select it and view its contents in the bottom panel. The divider has the binoculars in the left corner, and the Refresh icon in the right. Click Refresh to clear an old message so you can view a new one.
Click the binocular icon to check (info, warning, error) filters that limit the types of visible messages. Notice that the date and time of the message appears to the right of the binocular icon.

Schedules
To schedule an action, for example using a discovery profile, right click and select Schedule. The Schedule panel appears, where you can create a new schedule, entering a Starting On date and time, and Stopping On date and time or occurrence number. You can also configure recurrence in this screen.
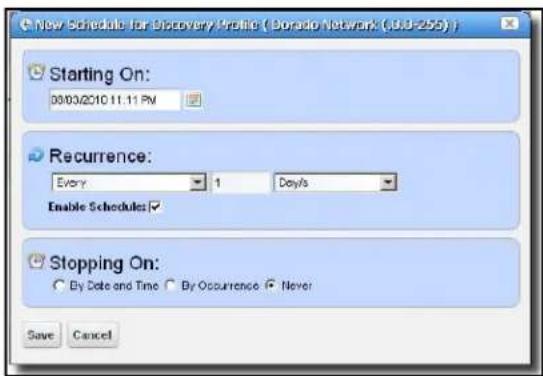
Once you save the schedule, the action (for example Discovery Profile) it also appears in the Schedules Portlet as a scheduled item.
Schedules Portlet
You can view and modify schedules in the Schedules portlet, or the Expanded Schedules Portlet
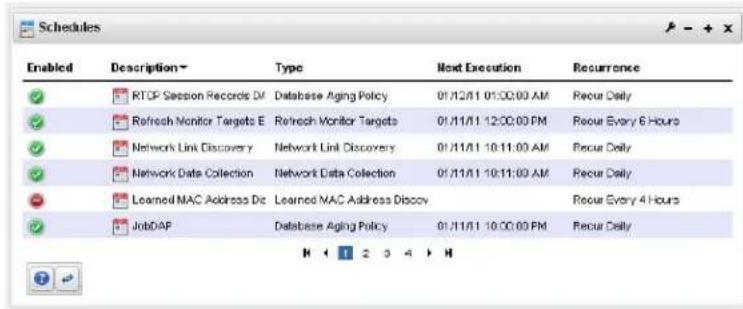
This displays the Enabled status, a Description, the Type of schedule, its Next Execution and Recurrence in columns. You can do the following by right-clicking a scheduled item, and selecting the appropriate menu item:
- Delete—Deletes the selected scheduled item, displaying a confirming dialog box.
- Enable Schedule—Appears on an already disabled scheduled item so you can change its status. To enable the schedule, you can also edit it and check the Enabled check box.
- Disable Schedule — Appears on an already enabled scheduled item.
- Execute—Executes the scheduled item. If the scheduled item is an activity-based or discovery-profile based scheduled item, an audit viewer appears progress of the selected item.
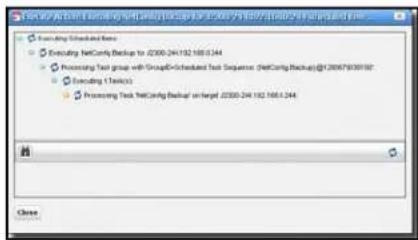
For other types of scheduled actions, a dialog appears saying The scheduled item(s) has been sent to the application server for immediate execution. You can monitor its progress in the audit trail portlet. (see Audit Trail / Jobs Screen on page 45)
- New—This lets you initiate new schedules for a variety of actions. The subsequent screen's appearance depends on the action selected. See Managed Resources on page 133 for more about available actions.
- Open — This appears for an activity-based scheduled items. It opens the activity editor, and lets you modify the activity's data/properties and schedule parameters.
To edit an existing schedule for an already scheduled action like a Discovery Profile, just right click the item in its portlet and select Schedule. This displays the schedule information for the discovery profile and lets you make modifications.
Tip: Schedule new actions from the portlet that ordinarily executes them, for example Resource Discovery on page 123.
Expanded Schedules Portlet
When you expand this portlet, the additional columns that appear include Submission Date, Start Date, whether the schedule is still active (Scheduled), and the Execution Count.
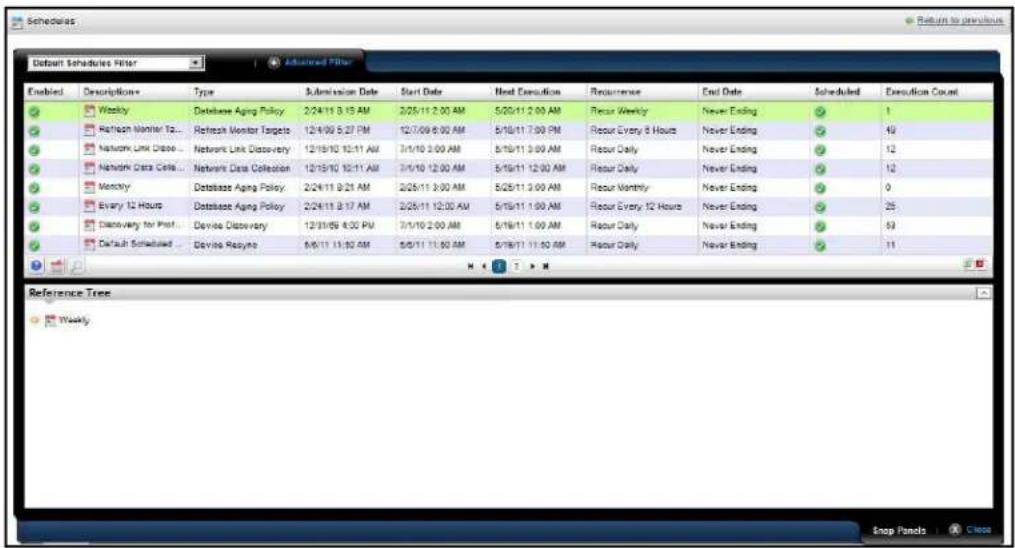
If a green icon appears in the Scheduled column, it means the schedule will be executed on next start date. If the schedule has exceeded execution count or passed stop date (if specified), then a red icon appears there.
This section describes the available NMS200 portlets. You may not have access to all of these with the user permissions you have been assigned by the portal administrator.
Alarms
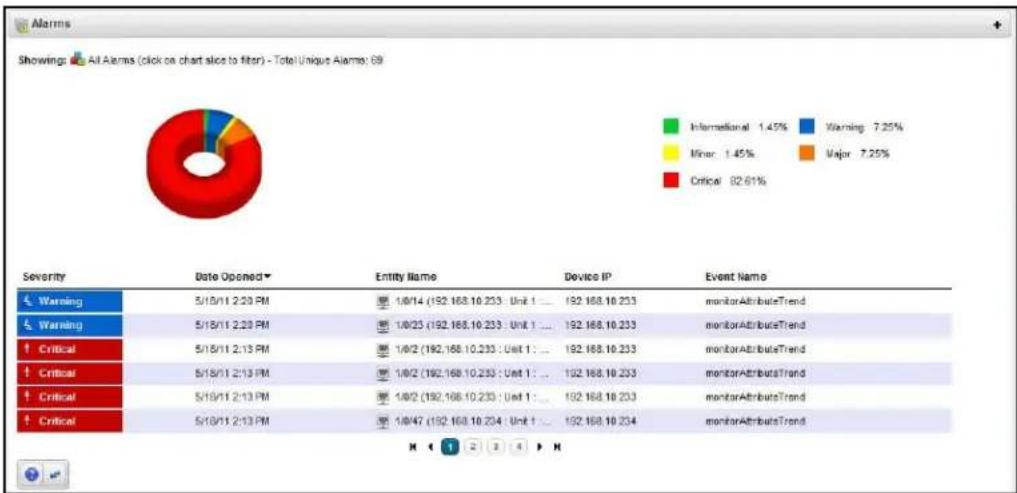
In its summary form, this portlet displays alarms and a graph that summarizes them.
pie
| Severity | Date Opened | Entity Name | Device IP | Event Name | |---|---|---|---|---| | Warning | 5/10/11 2:20 PM | 1/0/14 (192.168.10.233 : Unit 1 : ... | 192.168.10.233 | monitorAttributeTrend | | Warning | 5/18/11 2:20 PM | 1/0/25 (192.168.10.233 : Unit 1 : ... | 192.168.10.233 | monitorAttributeTrend | | Critical | 5/18/11 2:13 PM | 1/0/2 (192.168.10.233 : Unit 1 : ... | 192.168.10.233 | monitorAttributeTrend | | Critical | 5/18/11 2:13 PM | 1/0/2 (192.168.10.233 : Unit 1 : ... | 192.168.18.233 | monitorAttributeTrend | | Critical | 5/18/11 2:13 PM | 1/0/2 (192.168.10.233 : Unit 1 : ... | 192.168.18.233 | monitorAttributeTrend | | Critical | 5/18/11 2:13 PM | 1/04/7 (192.168.10.204 : Unit 1 : ... | 192.168.10.234 | monitorAttributeTrend |To filter the listed alarms that appear on this screen to a particular severity, click a slice of the graph or on a color in the legend to its right. The graph “explodes” to highlight the selected slice, and the alarms that appear are of that severity only. Click the color again to restore the slice to its place in the circle. After you click the graph, click [reset] to view all alarms, not just those for the selected slice.
Note: The alarms that appear when using the slices as a filter only include those within the selected Max items returned.
See Menu on page 54 for details about menu items available when you right-click in the summary and expanded portlets.
The alarm display includes the following columns:
- Severity—The alarm severity indicated by the color of the leftmost icon. The severity only has meaning for Alarms and Security Alarms. Informational Alarms get a severity level of Indeterminate.
• Date Opened — The date the alarm appeared.
• Entity Name—The entity emitting this alarm (often within the Equipment).
• DeviceIP — The IP address of the equipment where the alarm appeared.
• Event Name — The event associated with the alarm.
Tip: If you hover the cursor over a row in the portlet display, a tooltip appears with information about the alarm. This can include the alarm's Notification OID, Date Opened, the Entity Name and type, its Impact Propagation, its status as Service Effecting), Event Name, Equipment, Severity, any alarm Message, whether the alarm was Suppressed, or Acknowledged and the Device IP.
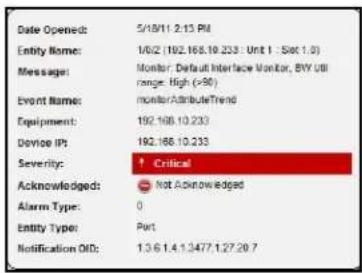
If an alarm is Service Effecting, (reflect an impact on a service) it can propagate to appear as components of service- and link-related alarms. Service-effecting alarms are of indeterminate or greater severity.
See Alarms in Topology on page 95 for a description of how alarms appear in the topology portlet.
Expanded Alarm Portlet
The expanded Alarm portlet appears when you click the plus (+) in the top right corner of the smaller screen.
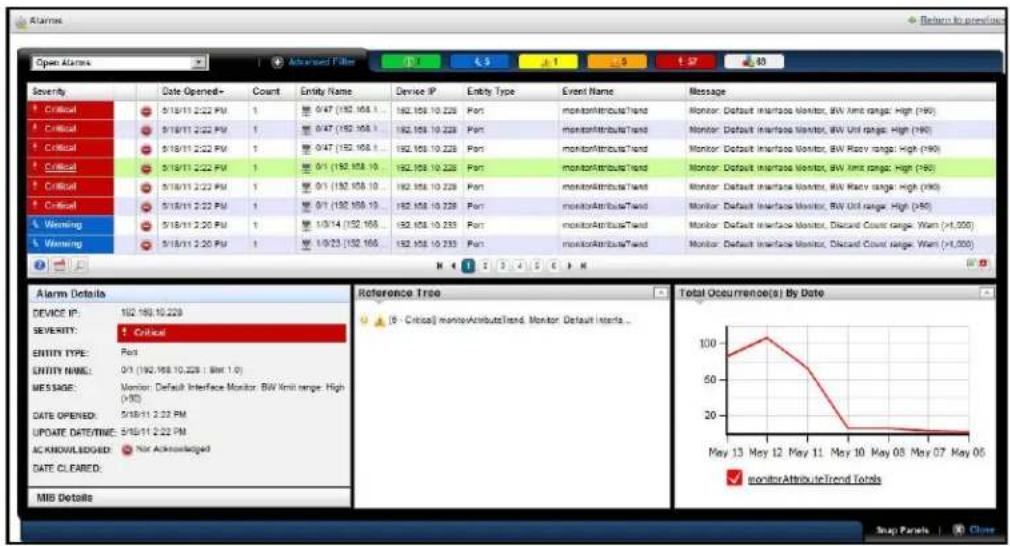
This displays listed alarms and Snap Panel details of a selected alarm. The colored icons at the top of this screen display a count of the open alarms in each severity category (hover the cursor over the icon to see which severity it represents), and a total.
By default this screen adds the first of the following columns to those visible in the Event History's summary screen view. To add the others listed here, right click, and select Add Columns to change the screen appearance.
• Entity Type — The type of monitored entity.
• Message — Any message that accompanies the alarm / event.
• Alarm State — The state (open / closed) of the alarm.
• Date Cleared—The date and time that the alarm was closed.
- UpdateDate Time—The time stamp for when this alarm was updated (for an additional count, the time the last duplicate was received).
- Notification OID—The identifier of the notification displayed as an alarm.
• Equipment — The name for the entity emitting the alarm.
• Acknowledged—True or False.
- Assigned User—The user who has been assigned this alarm (right click or click Action to do this).
• Date Assigned — The date and time that the alarm was assigned.
- Ack Time — The time the alarm was acknowledged.
• Cleared By—The user who cleared the alarm.
• MIB Text — The alarm's MIB Text.
Rather than filtering with the pie graph, the expanded portlet lets you either the pick list at the top left, or create custom filtering by clicking Advanced Filters.
Menu
Right clicking an alarm lets you select from the following menu items:
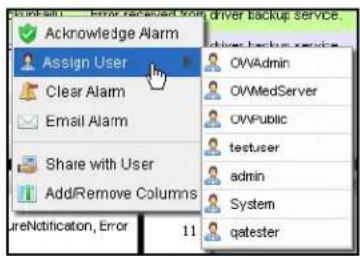
- Acknowledge / Unacknowledge Alarm — Acknowledges the selected Alarm(s). The current date and time appear in the Ack Time field. Unacknowledges previously acknowledged alarm(s), and clears the entries in the Ack By and Ack Time fields. The red “unacknowledged” icon appears in the expanded portlet and turns to a green check “acknowledged” icon the alarm has been acknowledged.
- Assign User—Assign this alarm to one of the users displayed in the sub-menu by selecting that user. An icon also appears in the expanded portlet indicating the alarm has been assigned to someone.
- Clear Alarm—Clearing the alarm removes the alarm from the default alarm view and marks it as a candidate for the database archiving process (DAP). Essentially it is an indication to the system that the alarm has been resolved/addressed. If your system has enabled propagation policies, clearing recalculates dependent alarms.
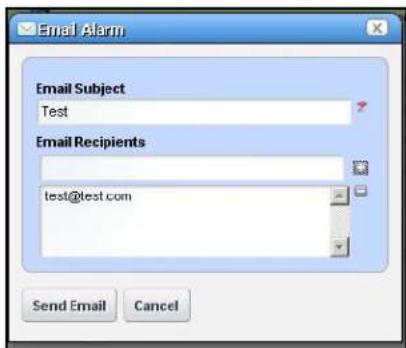
- Email Alarm—E-mail the alarm. Enter a subject an e-mail address to which you want to mail the alarm's content, and click the + to add to the list of addresses (the minus deletes them). Then click Send Email. Clicking Cancel ends this operation without sending e-mail. See SMTP Configuration on page 28 for instructions about setting up e-mail from NMS200. You can also consult the NMS200 Administration Guide for instructions about how to set up application server e-mails. See Alarm Email on page 55 for an example of what the content looks like.
• Show Performance—The columns that appear by default in this expanded
- Aging Policy—This lets you select a policy that determines how long this alarm remains in the database. See Database Aging Policies (DAP) on page 19 for information about configuring such policies.
• View as PDF —Create an Acrobat PDF document containing this portlet's contents. - Share with User—Selecting this opens a screen where you can select the user you want to send the selected alarm, and can enter a message you want to send with it. See Sharing on page 43. Clicking Share Asset sends a chat message to the selected user with a link that opens to display the Alarm Snap Panels for the selected item.
- Add / Remove Columns—The columns that appear by default in this expanded portlet are not all the ones available. The screen that appears after you select this menu item lets you configure what shows, and what is hidden.
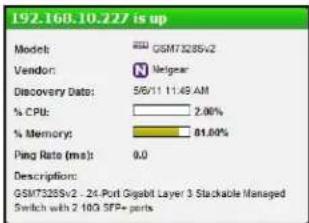
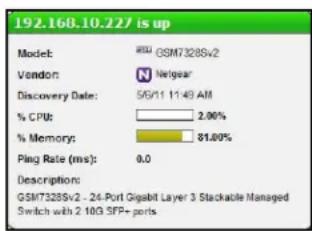
Tip: Hover your cursor over the Device IP Address column, and a tooltip appears with information about the alarm source's Model, Vendor, Discovery Date, and a Ping Rate bar graph. This can also include other device-dependent items. For example: bar graphs to display the % CPU [utilization], % Memory, and Description.
The convention indicating such tooltips are available is the question mark that appears next to the cursor when you hover it over the displayed field.
Alarm Snap Panels
These include the following:
- Alarm Details—The source, Severity, Message, Date Opened, and so on.
• MIB Details—The Notification OID, and MIB Text for the selected alarm.
• Reference Tree—The connection between the alarm and its source in tree form.
• Graph—Total occurrences of this alarm, by date.
Alarm Email
The e-mail sent by right-clicking an alarm has the subject specified when you send it, and contains the information within the alarm. For example:
Alarm: monitorIntervalSkip
Alarm Attributes:
ProSafe Network Management Software NMS200
Device IP =
Message =
Alarm State = Open
Severity = 5 - Major
Count = 1
Date Opened = Tue Dec 14 22:01:30 PST 2010
Update Date/Time = Tue Dec 14 22:01:36 PST 2010
Entity Name =
Entity Type =
Entity Description =
Equipment =
Region = SUPDEMOPartition
Location =
Assigned By = OWSystem
Date Assigned = Thu Dec 16 10:40:24 PST 2010
Assigned User = qatester
Acknowledged = false
Ack By =
Ack Time =
Cleared By =
Date Cleared =
MIB Text = Monitor session was skipped due to resource constraints. Typically, this implies one or more monitors should run less frequently. This may also be caused by a large number of timeouts which force executions to take longer to complete than normal.
Advisory Text =
Event History
Not all events appear as alarms. Event History preserves all event information for your system.
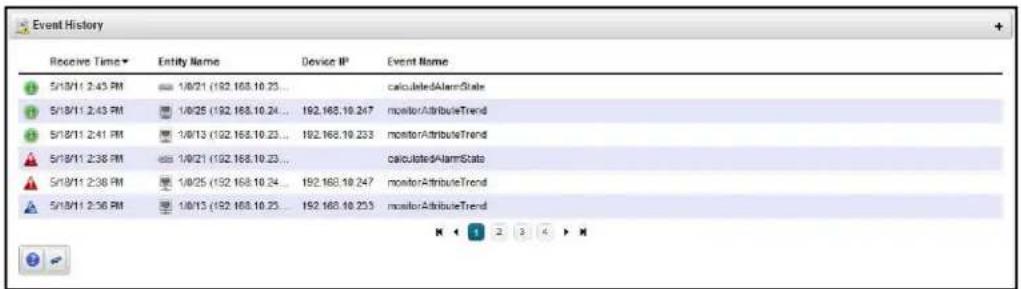
The initial portlet view displays an icon whose color reflects any alarm state associated with the event. It also displays the Receive Time, Entity Name, Device IP, and Event Name. You can right-click to Share with User in this screen.
Tip: Hovering the cursor over the DeviceIP column produces a tooltip that lets you know the device's current state (up / down) and that contains Model, Vendor, Discovery Date, Ping Rate (ms), and the device's Description information.
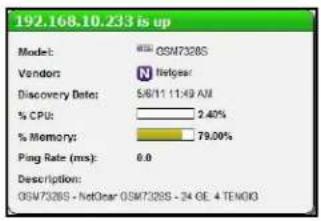
Expanded Event History Portlet
Clicking the plus (+) in the upper right corner of the initial portlet view displays the expanded Event History. As in other expanded portlets, you can use the filtering capabilities at the top of the screen to further limit the default view of all events.
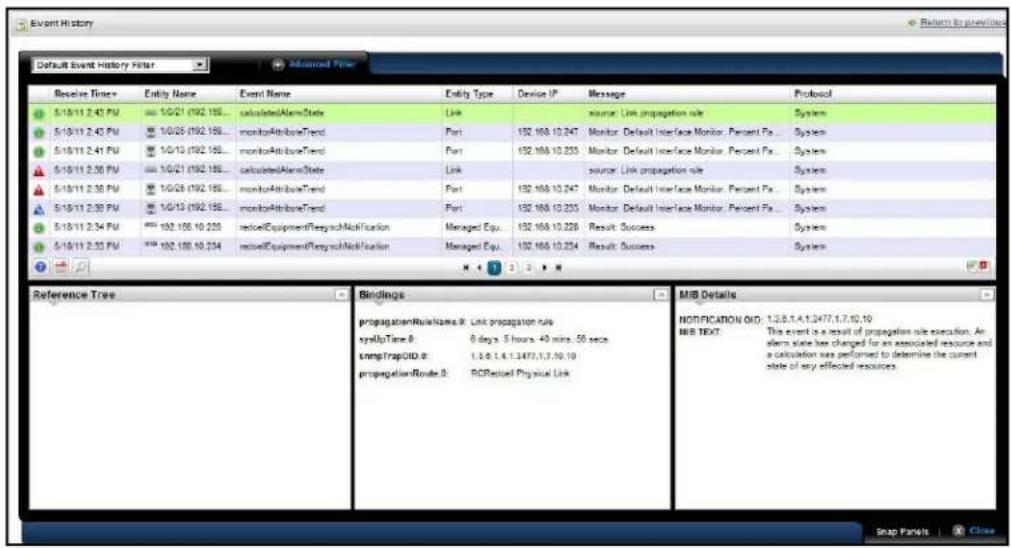
This screen has many of the columns described in Alarms on page 51 or Expanded Alarm Portlet on page 53. Configure these as visible or hidden with a right-click to select Add / Remove columns. The following are some additional columns available.
• Receive Time — The date the event was received.
• Event Name — The event identifier.
- Location — The location of the equipment emitting the event.
- SubType —A classification for the event. For example: Trap.
- Protocol —The protocol that delivered the event. Frequently: System, indicating NMS200 itself delivered it.
- Notification OID— The object identifier (OID) for the event type.
• Instance ID —The instance identifier for the event.
Event History Snap Panels
Click a listed alarm to display its details in the Snap Panels. The Reference Tree displays the event's relationship to any alarms, and to the source device. Click the plus (+) next to an item in the tree to unpack it.
The Bindings Snap Panel displays the event's varbind information, including the trap OID, the device's IP address, and other event-specific information.
You can right-click the listed events and Share with User (see Sharing on page 43), or Add / Remove Columns.
Event Processing Rules
This portlet manages NMS200's response to events. By default it appears with seeded rules, but you can create your own (New), copy or modify (Copy or Open) or delete (Delete) existing rules by right-clicking in the portlet. You can also Import and Export rules to files.
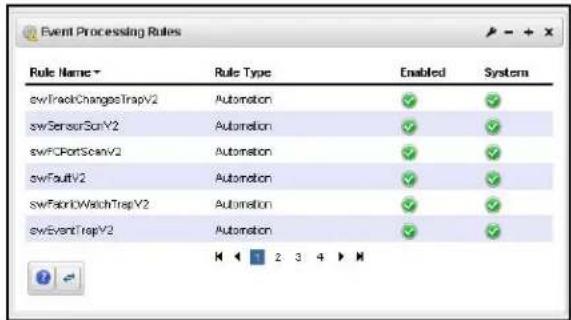
The Rule Type column indicates whether rules are Pre-Processing (Correlation) or Post-Processing (Automation).
Icons in the Enabled and System columns indicate whether the rule is enabled—green is enabled, red is not—and whether it is a System rule, or a non-system (user-created) rule.
Modifying or creating rules opens Rule Editor. See Rule Editor Example for steps to create these rules.
When you Copy an event processing rule, NMS200 generates a new name, but you must change that name before you save the event processing rule.
Expanded Event Processing Rules Portlet
The expanded portlet displays additional columns. Details about selected rules appear in the snap-in panels at the bottom of this screen.
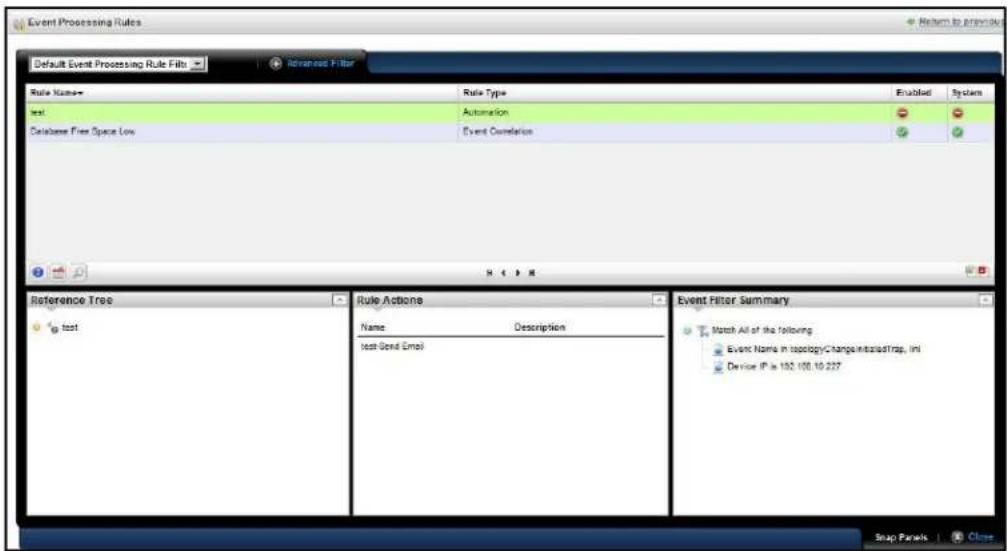
The Reference Tree panel displays the selected rule's connection to events. The Rule Actions list any configured actions associated with the rule. The Event Filter Summary summarizes any configured filter(s) for the selected rule.
Rule Editor Example
To create a rule, follow these steps:
- Right-click and select ct New, then select a rule type. These can be Pre-Processing (correlation) or Post-Processing (automation) rules.
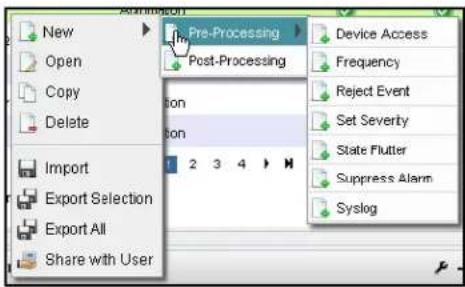
If Pre-Processing is your selection, Device Access, Frequency, Reject Event, Set Severity, State Flutter, Suppress Alarm, and Syslog are the types available. See Filtering / Settings on page 61, Syslog Escalation Criteria on page 64, and Actions on page 65 for more about the differences available between rule types.
- For this example, we select Pre-Processing > Device Access. The Rule Editor screen appears. Enter a Name to identify the rule, an optional Description, and check Enabled if you want this rule to begin working immediately.
- Click Next to open the Filtering / Settings tab.
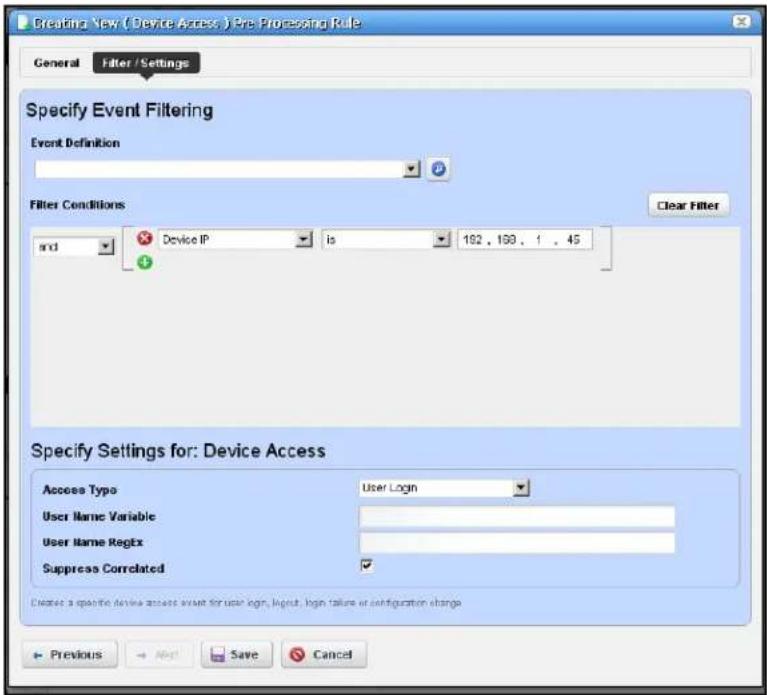
Specify Event Filtering
In this panel select the Event Definition. Click pick list to find available events. Typing a letter goes to that letter in the list. You can then click to select from the pick list.
Click Add Filter to further filter the selected events. See Filters on page 39 for more about this feature.
Specify Settings for: [Selected Rule Type]
This panel's appearance depends on the type of rule you selected when you clicked New. When you are editing an existing rule, it defaults to that rule's screen. For more about the available alternatives, see Filtering / Settings on page 61.
- The D device Access example creates a specific device access event for user login, logout, login failure or configuration change. Select the Access Type (Config Change, Login Failure, User Login, User Logout) from the pick list for that field.
- Enter the User Name Variable and/or User Name RegEx match string in those fields. This confines rule response to the selected users.
- Check Suppress Correlated events if you do not want to see events correlated with this one.
- Click Save to preserve the event processing rule.
Rule Editor
After you select between pre- and post-processing rules for new rules, the following screens manage the event processing described in brief in the Rule Editor Example on page 59. The following screens and fields appear in this editor.
- General
- Filtering / Settings
- Syslog Escalation Criteria (for pre-processing Syslog rules)
• Actions (for post-processing, automation rules)
The following sections describe these in detail.
General
The General screen is common to all rule types.
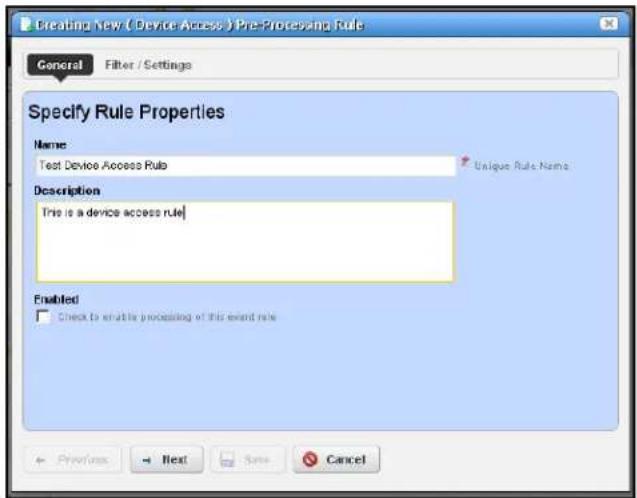
It contains the following fields:
• Name—A text identifier for the rule.
• Description—An optional text description of the rule
- Alarm Only—This is visible only in post-processing rules. Check this to enable the rule only if an alarm is generated, not suppressed.
- Enabled—Check this to enable the rule.
Filtering / Settings
For all rule types, select the Event Definition. Click Add to open a screen where you can select events to include in the event you are creating. This includes a filter at the top that you can use to search for specific events. For example: Event Name Contains ____. You can then click Add Selection to include selected items in this filter, or Add All to include all
displayed events. After you finish event selection, click Done at the bottom of this selection screen.
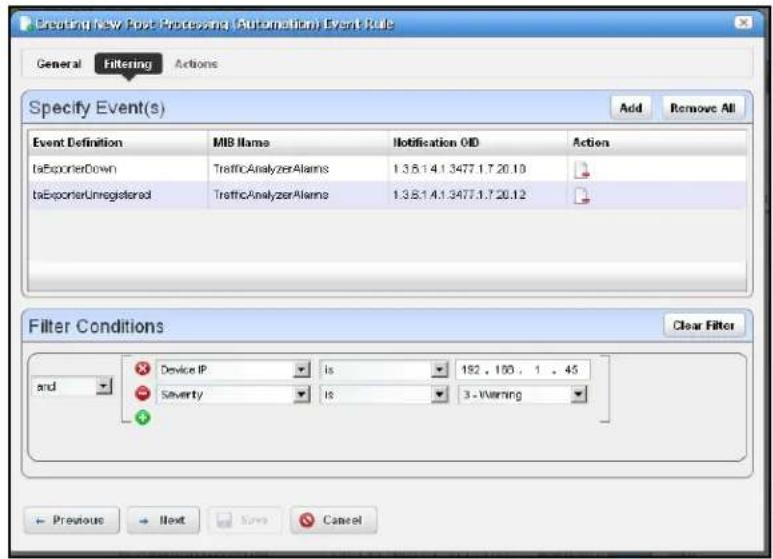
Click Add Filter to further filter the selected events. See Filters on page 39 for more about this feature. After you Add Filter the button changes to Clear Filter so you can remove any filter from the event rule.
Tip: NMS200 supports multiple IP addresses per resource. During event processing, filters that include IP address criteria may behave incorrectly when NMS200 evaluates the filter. Best practice is using resource name(s) instead of IP addresses.
The following are processing rule types, and a description of their properties.
- Pre-Processing—These rules either override the event definition, change the behavior of an event or generate another event. The following are the different subtypes. These are also called Correlation rules. See the descriptions below for additional information about the available types.
- Post-Processing—Also called Automation rules, these execute specified actions for the rule after the event processing occurs.
The following are Pre-Processing/ Correlation rule subtypes:
- Device Access—The Device Access example creates a specific device access event for user login, logout, login failure or configuration change. Select the Access Type (Config Change, Login Failure, User Login, User Logout) from the pick list for that field.
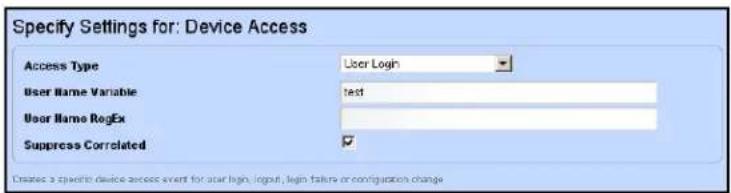
Enter the User Name Variable and/or User Name RegEx match string in those fields. This confines rule response to the selected users.
Check Suppress Correlated events if you do not want to see events correlated with this one.
- Frequency — This rule type changes event behavior based on the frequency of the selected event's occurrence frequency.
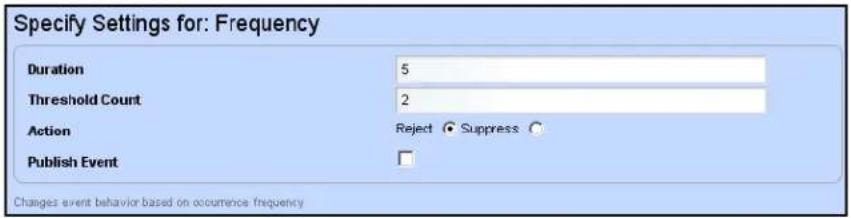
Enter the Duration (seconds) and Threshold Count for the event, then select an Action (Reject or Suppress the event) and check Publish Event if you want it to register for NMS200. If you Reject an event, it does not appear in Event history; if you Publish it, however, listeners for that event will "hear" it.
- Reject Event—This screen presents the Specify Event Filtering portion of the screen without any Settings in the lower screen. Specify events to reject with this selection and filtering.
- Set Severity—This rule overrides the default alarm severity of an event selected and filtered in the upper screen.

- State Flutter—This type of rule changes event behavior on transient state change events like a series of LinkUp and LinkDown events for the same interface.
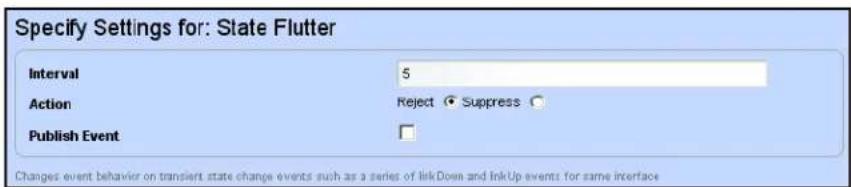
After you select the event and filtering, enter the Interval (seconds), the Action (Reject or Suppress the event) and check Publish Event if you want it to register for NMS200. If you Reject an event, it does not appear in Event history; if you Publish it, however, listeners for that event will "hear" it.
- Suppress Alarm—This screen presents the Specify Event Filtering portion of the screen without any Settings in the lower screen. Specify events/alarms to suppress with this selection and filtering.
- Syslog—This screen presents the Specify Event Filtering portion of the screen without any Settings in the lower screen. Specify events to select. Then click Next to go to the Escalation tab.
Post-processing (automation) rules let you modify the Specify Event Filtering portion of the screen without any Settings in the lower screen. Specify events to select. Then click Next to go to the Actions tab. See Actions on page 65 for more about that feature.
Syslog Escalation Criteria
This tab of Syslog Event Rules lets you manage events based on matching text, and configure messages in response to such matches.
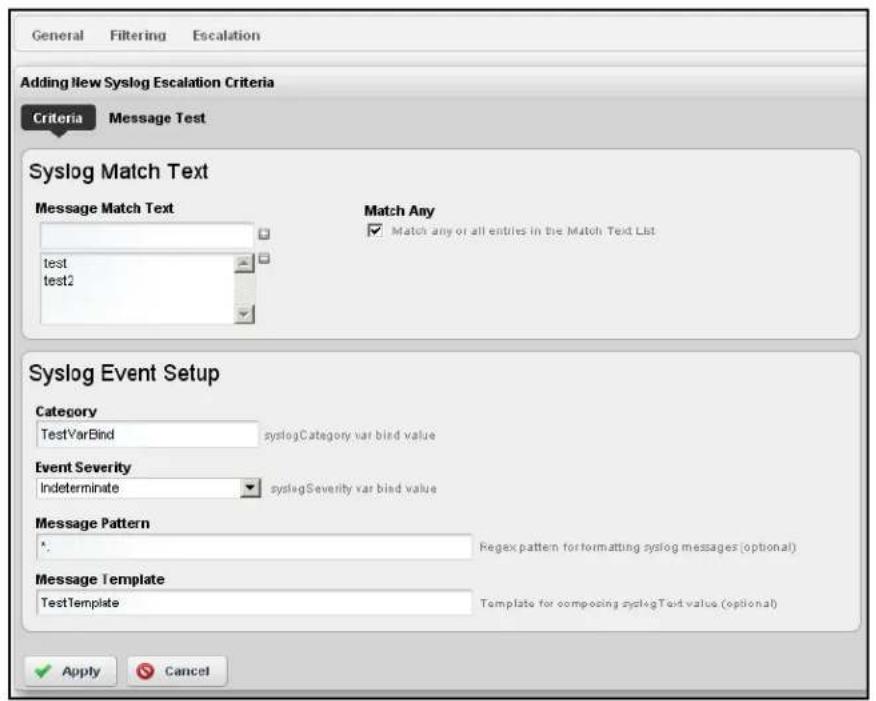
Criteria: Syslog Match Text
In this tab, enter the Syslog Match Text. Click the plus to add matching text to the list below the Message Match Text field. Check the Match Any to match any or all of the entered match text, rather than one or more specific strings.
Criteria: Syslog Event Setup
This portion of the Criteria screen sets up the event emitted when matching occurs. Here are the fields:
• Category—The syslog category varbind value.
• Event Severity—Select the alarm severity of the event emitted when a match occurs.
- Message Pattern—An optional regular expression for the text to retrieve and transmit in the created event's message.
- Message Template—The configuration of the message when sent. For example: the template %1 occurred on %3 for %2 creates a message with the first message pattern retrieved, followed by the third, then the second within the specified text.
Message Test
This screen lets you test your message against the pattern and/or template. Click the Test button to the right of the top field to activate this testing.
• Test Message — Enter a message to test.
• Test Message Result—The text extracted for the event as it appears in the template.
Click Apply to accept these escalation criteria, or Cancel to abandon them without saving.
Actions
This screen catalogs the actions configured for the Post-Processing (Automation) rule you have configured in previous screens.
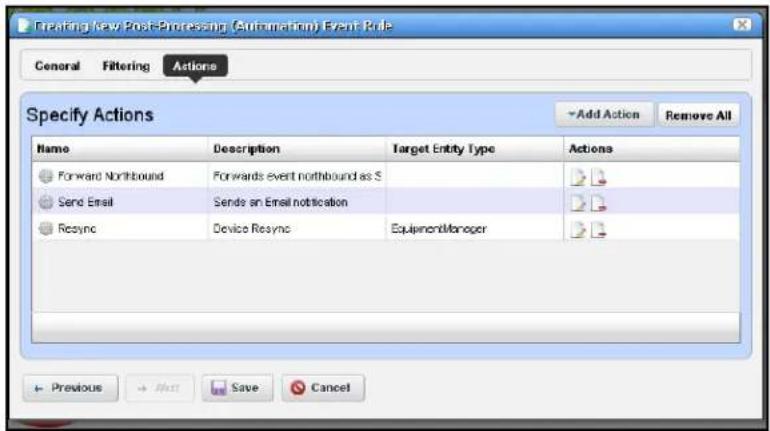
Click Add Action to create anew action in the editor. The Actions column lets you revise (Edit this entry) or Delete entries in this table. Click Save to preserve the action(s) configured here, or Cancel to abandon any edits.
Clicking Add Action lets you select from the following:
• Forward Northbound
- Email
- Custom
Click Apply to accept configured actions, or Cancel to abandon their editor and return to this screen.
Tip: Actions available here are like those for Discovery Profiles on page 124.
Forward Northbound
When you want to forward an SNMP v2 event (trap) to another host, then configure automation in this screen to do that.
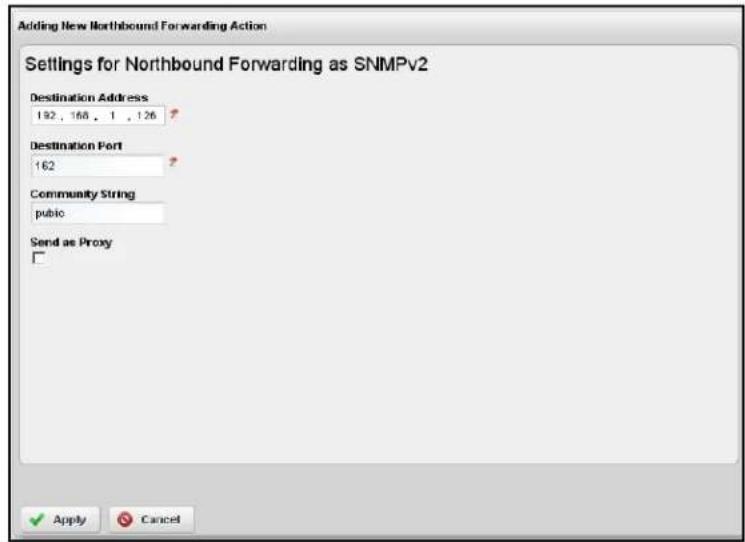
Enter the following fields:
- Destination Address—The IP address of the northbound destination.
- Destination Port — The port on the northbound destination.
• Community String—The SNMP community string for the northbound destination. - Send as Proxy—When checked, this sends the IP address of the application server as the source of the event. Unchecked, it sends the IP address of the source device.
Email actions configure destinations and messages for e-mail and SMS recipients. You can include fields that are part of the event by using the variables described in Email Action Variables on page 69.
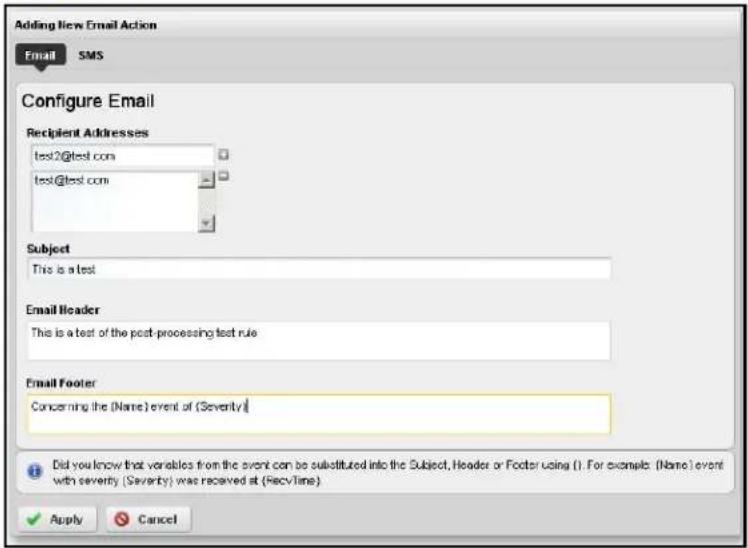
The SMS tab is similar to the e-mail tab, but limits the number of characters you can enter with a field at its bottom.
Note: You must send SMS to the destination phone carrier's e-mail-to-SMS address. For example sending text to 916-555-1212 when Verizon is the carrier means the destination address is 9165551212@vtext.com.
This screen has the following fields:
- Recipient Addresses—Enter an e-mail address in the field below this label, then click the plus (+) sign to add it to the list of recipients. The minus (-) removes selected recipients.
• Subject—The e-mail subject. - Email Header / Footer — The e-mail's heading and footing.
• SMS Body—The e-mail contents to be sent as text. - SMS Max Length—The maximum number of characters to send in the SMS. Typically this is 140, but the default is 0, so be sure to set to your carrier's maximum before saving.
Here is what Email looks like when it arrives:
Sent: Wednesday, March 02, 2011 2:37 PM To: techpubs@doradosoftware.com Subject: Web Test
ProSafe Network Management Software NMS200
Notification: redcellInventoryAttrChangeNotification
Notification Attributes:
====================
sysUpTime.0 = 5 hours, 16 mins, 43 secs
snmpTrapOID.0 = 1.3.6.1.4.1.3477.2.2.1
redcellInventoryAttrName.0 = RedCell.Config.EquipmentManager_Notes
redcellInventoryAttrChangedBy.0 = admin
redcellInventoryAttrNewValue.0 = hello
world
severity
auto
redcellInventoryAttrOldValue.0 = hello
world
severity
Custom
This screen lets you configure Action based on Adaptive CLI actions available in the system. Notice that you can select by most common or by keyword search, depending on which of the links in the upper right corner of the screen is selected.
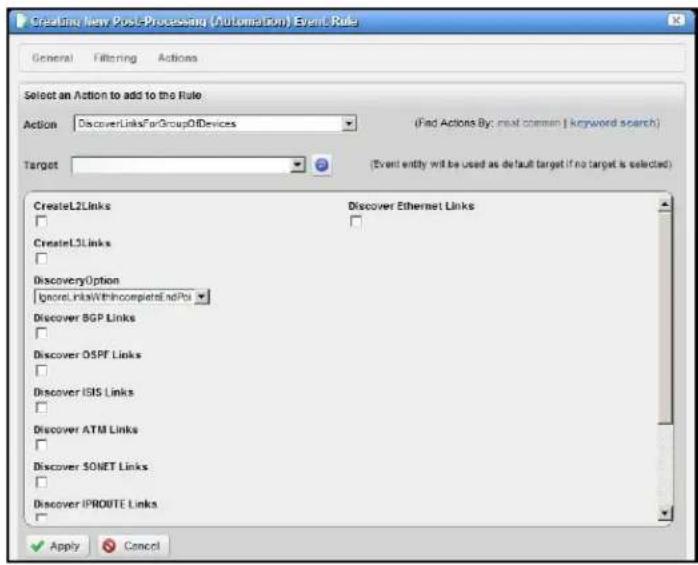
The most common actions include those you have used most recently. To search for actions, either enter a keyword, or click the search icon (the magnifying glass) to produce a pick list below the Action field. Select an action by clicking on its appearance in that list.
Select the device target of the custom action by selecting from the Target pick list. If you do not specify an explicit target, NMS200 uses the default entity for the event as the target.
If you select an action with additional parameters, those parameters appear in the screen below the Target field. To see definitions for such parameters, hover the cursor over the field and a tooltip describing the field appears.
Click Apply to accept your edits, or Cancel to abandon them.
Email Action Variables
The following are the Email Action variables you can use in customizing the content of action e-mail. These appear classified as follows:
- Basic Variables
• Managed Equipment Variables - Entity Type: Port
• Entity Type: Interface, Logical interface

CAUTION:
To successfully retrieve Custom attributes, you must first enable them in the Inventory Config manager screen.
You can also configure more limited variables that are slightly more efficient in performance, if not as detailed as those described in the following section.
For example, you can retrieve the following attributes:
{RedCell.Config.EquipmentManager_Custom1}
{RedCell.Config.EquipmentManager_Custom2}
{RedCell.Config.EquipmentManager_LastBackup}
{RedCell.Config.EquipmentManager_LastConfigChange} and
{RedCell.Config.EquipmentManager_HealthStatus}
Note: If the entity does not contain/return these values, then the message [No data for
Basic Variables
| Attribute Description Email Action Variable | ||
| Name The event / alarm name {Name} | ||
| Message Description from the event {Message} | ||
| Entity Name The entity (interface, card...) name {EntityName} | ||
| Equipment Manager Name | The name of the equipment, parent or chassis. | {EquipMgrName} |
| Device IP address the IP of the device in alarm {DeviceIP} | ||
| Entity Type | Type of entity (Router, and so on) | {EntityType} |
| Instance ID | An identifier for the event | {InstanceId} |
| Protocol Type | Of originating alarm (SNMP, syslog, etc.) | {ProtocolType} |
| Protocol Sub Type | Inform, Trap, [blank] (for internal events) | {ProtocolSubType} |
| Receive Time | {RecvTime} | |
| Region | The mediation server partition name. | {Region} |
| Severity | 0 - cleared, through 6 - critical, from Alarm Definition | {Severity} |
| Source IP address | The IP of the component sending the alarm | {SourceIP} |
The following section describe variables whose use may have a performance impact.
Managed Equipment Variables
| Attribute Description | Email Action Variable | |
| Custom 1 Note that although you can re-name any Custom attribute, you must use the variable's original name. For example here, that is {RedCell.Config.EquipmentManager_Custom1} | {RedCell.Config.EquipmentManager_Custom1} | |
| Custom 2 {RedCell.Config.EquipmentManager_Custom2} | ||
| Custom 3 {RedCell.Config.EquipmentManager_Custom3} | ||
| Custom 4 {RedCell.Config.EquipmentManager_Custom4} | ||
| Custom 5 {RedCell.Config.EquipmentManager_Custom5} | ||
| Custom 6 {RedCell.Config.EquipmentManager_Custom6} | ||
| Custom 7 {RedCell.Config.EquipmentManager_Custom7} | ||
| Custom 8 {RedCell.Config.EquipmentManager_Custom8} | ||
| Custom 9 {RedCell.Config.EquipmentManager_Custom9} | ||
| Custom 10 {RedCell.Config.EquipmentManager_Custom10} | ||
| Custom 11 {RedCell.Config.EquipmentManager_Custom11} | ||
| Custom 12 {RedCell.Config.EquipmentManager_Custom12} | ||
| Custom 13 {RedCell.Config.EquipmentManager_Custom13} | ||
| Description | Description of the equipment | {RedCell.Config.EquipmentManager_DeviceDescription} |
| DNS Hostname | Hostname of equipment | {RedCell.Config.EquipmentManager_Hostname} |
| Equipment Type | Equipment Type | {RedCell.Config.EquipmentManager_CommonType} |
| Firmware Version | Version of the equipment's firmware | {RedCell.Config.EquipmentManager_Firmware Version} |
| Hardware Version | Version of the equipment's hardware | {RedCell.Config.EquipmentManager_Hardware Version} |
| Last Backup | Last Backup | {RedCell.Config.EquipmentManager_LastBackup} |
| Last Configuration Change | Last Configuration Change | {RedCell.Config.EquipmentManager_LastConfigChange} |
| Attribute | Description | Email Action Variable |
| Last Modified | Timestamp of Last Modified | {RedCell.Config.EquipmentManager_LastModified} |
| Model | Model number of the equipment | {RedCell.Config.EquipmentManager_Model} |
| Name Component name | {RedCell.Config.EquipmentManager_Name} | |
| Network Status | Network Status | {RedCell.Config.EquipmentManager_HealthStatus} |
| Notes Equipment Notes | {RedCell.Config.EquipmentManager_Notes} | |
| OSVersion OSVersion | {RedCell.Config.EquipmentManager_OSVersion} | |
| Serial Number | Unique identifier for the equipment | {RedCell.Config.EquipmentManager_SerialNumber} |
| Software Version | Version of the equipment's software | {RedCell.Config.EquipmentManager_SoftwareVersion} |
| System Object Id | SNMP based system object identifier | {RedCell.Config.EquipmentManager_SysObjectID} |
Entity Type: Port
| Attribute Description | Email Action Variable | |
| Custom 1 Note that although you can re-name any Custom attribute, you must use the variable's original name. For example here, that is {RedCell.Config.EquipmentManager_Custom1} | {RedCell.Config.Port_Custom1} | |
| Custom 2 {RedCell.Config.Port_Custom2} | ||
| Custom 3 {RedCell.Config.Port_Custom3} | ||
| Custom 4 {RedCell.Config.Port_Custom4} | ||
| Encapsulation Encapsulation {RedCell.Config.Port_Encapsulation} | ||
| Hardware Version | Version of the port's hardware | {RedCell.Config.Port_HardwareVersion} |
| If Index SNMP If Index {RedCell.Config.Port_lfIndex} | ||
| MAC Address "Typically a MAC Address, with the octets separated by a space, colon or dash depending upon the device. Note that the separator is relative when used as part of a query." | {RedCell.Config.Port_UniqueAddress} | |
| Model Model number of the port {RedCell.Config.Port_Model} | ||
| MTU | Maximum Transmission Unit | {RedCell.Config.Port_Mtu} |
| Name | Port name | {RedCell.Config.Port_Name} |
| Notes | Port Notes | {RedCell.Config.Port_Notes} |
| Port Description | Description of the port | {RedCell.Config.Port_DeviceDescription} |
| Port Number | Port Number | {RedCell.Config.Port_PortNumber} |
| Slot Number | Slot Number | {RedCell.Config.Port_SlotNumber} |
| Speed | Speed | {RedCell.Config.Port_Speed} |
| Subnet Mask SubMask | {RedCell.Config.Port_SubMask} | |
Entity Type: Interface, Logical interface
| Attribute Description Redcell Email Action variable | ||
| Custom 1 Note that although you can re-name any Custom attribute, you must use the variable's original name. For example here, that is {RedCell.Config.EquipmentManager_Custom1} | {RedCell.Config.Interface_Custom1} | |
| Custom 2 {RedCell.Config.Interface_Custom2} | ||
| Custom 3 {RedCell.Config.Interface_Custom3} | ||
| Custom 4 {RedCell.Config.Interface_Custom4} | ||
| Encapsulation Encapsulation {RedCell.Config.Interface_Encapsulation} | ||
| IfIndex SNMP Interface Index {RedCell.Config.Interface_IfIndex} | ||
| Interface Description | Description of the Interface | {RedCell.Config.Interface_DeviceDescription} |
| Interface Number | Interface Number | {RedCell.Config.Interface_InterfaceNumber} |
| Interface Type | Common Interface Type | {RedCell.Config.Interface_CommonType} |
| MTU | Maximum Transmission Unit | {RedCell.Config.Interface_Mtu} |
| Name | Interface name | {RedCell.Config.Interface_Name} |
| Notes | Interface Notes | {RedCell.Config.Interface_Notes} |
| Port Number | Port Number | {RedCell.Config.Interface_PortNumber} |
| Slot Number | Slot Number | {RedCell.Config.Interface_SlotNumber} |
| Subnet Mask | Subnet Mask of the Interface | {RedCell.Config.Interface_SubMask} |
Best practice is to clarify such attributes by combining them with others that spell out their source.
File Servers
You must configure FTP and/or TFTP file servers to push and pull configuration files to and from devices, or to deploy firmware updates. With this portlet you can switch between internal and external file server mode, and Show or Hide not applicable File Servers depending on
the file server mode by checking/unchecking the Show All Servers check box. When this is un-checked, only the relevant file server(s) appear onscreen.
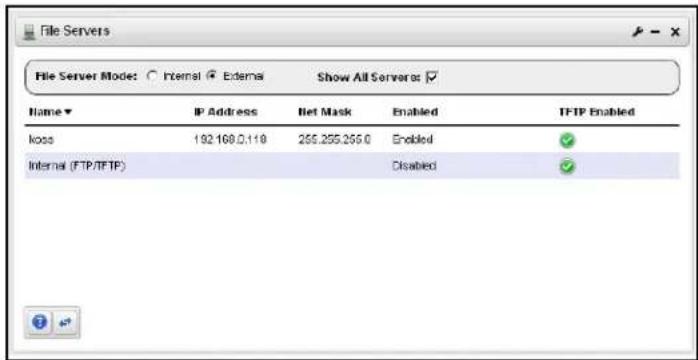
Right clicking a file server, or the empty list space lets you do the following:
- Delete—Removes the selected file server from the list. This appears for External File Servers only.
- Disable—Disables the selected file server. When file servers are disabled, they are not used in a Backup, Restore or Deploy operation. This too appears only for External File Servers.
- Enable—Activates the selected file server. Again, exposed for External file Servers only.
- New—Displays the File Server Editor screen.
- Open—Displays the selected File Server in the File Server Editor screen.
• Test—Tests the selected file server by sending and retrieving a file.
Note: You can select whether NMS200 is in Internal or External File Server Mode with the radio buttons at the top of this portlet. Checking Show All Servers displays the internal file server.

CAUTION:
Port conflicts prevent having an external file server and internal file server operate on the same machine.
Columns in this manager identify the server, and describe whether it is enabled, and has TFTP enabled.
Note: The internal FTP/TFTP server is for testing only, not for production use. For those concerned that the internal server provides some insecure access to NMS200, it was designed to be ultra-secure. It literally creates a separate authentication and virtual file system for each file retrieved. It also responds only to Redcell's internal requests.
File Server Editor
This editor lets you configure new and existing file servers.
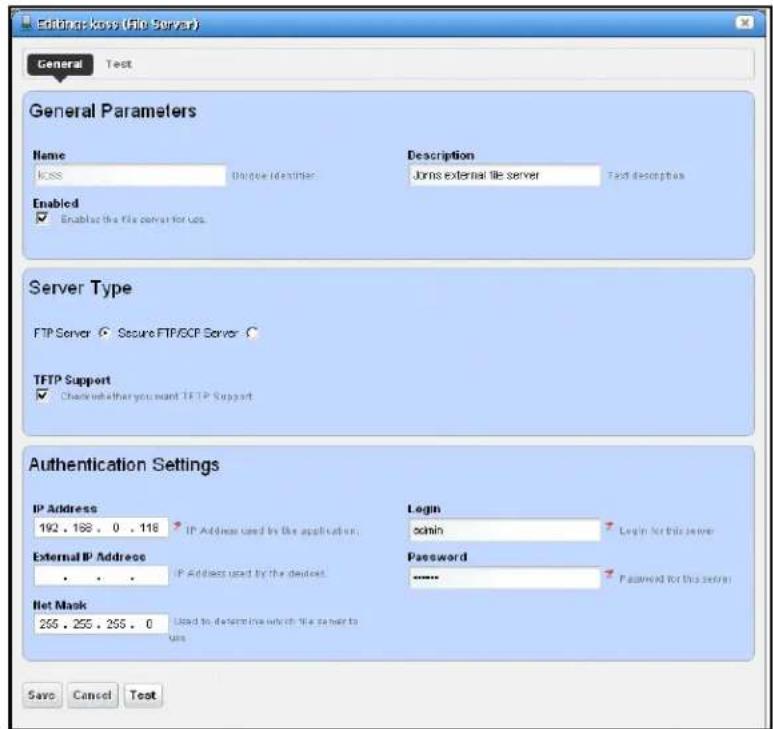
This is where you specify the Name, whether the server is Enabled, whether the connection is secure (Secure FTP/SCP Server), supports TFTP, internal and external (optional) IP addresses, and Net Masks, and the login and password for the file server. Once you have configured a server, you can test the file server credentials by clicking on the Test button at the bottom of the screen. Click Save to preserve your changes.
Tip: FTP servers typically must be on the same side of the firewall as the devices with which they communicate. If you have several such servers, the specified Net Mask also determines which server communicates with devices in which portion of the network.
Notice that you can now configure an IP address used by NMS200, and another External IP Address used by the devices. If you configure multiple file servers, NMS200 selects the server with the Net Mask whose subnet is closest to the device(s) with which it communicates.
OS Images
OS Images are typically the firmware updates you want to deploy to devices in your network. You must add such software to your NMS200 system before you can deploy it. The summary screen listing these images displays their Name, Description, File Name, Image Type and Installed Date. Right-clicking this screen displays the following menu items:
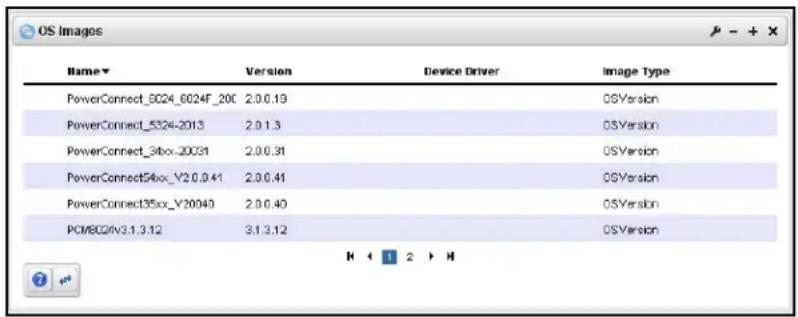
- Delete—Removes the selected OS image from the list.
- Deploy—Deploys the selected file to devices you select in a subsequent selection screen. For this to function, you must have enabled a server, as described in File Servers on page 74.
- Download Firmware For—Some devices support a firmware download. These devices appear listed in a sub-menu. Select the type for which you want to download OS images, and NMS200 automatically downloads them.
- New—Displays the OS Image Editor screen.
- Open—Displays the selected image in the OS Image Editor screen.
• Share with User—See Sharing on page 43.
Expanded OS Images portlet
When you click the plus, this portlet expands to display the OS images list, a snap panel Reference tree of the connections to devices, and another panel listing the files within the selected image.
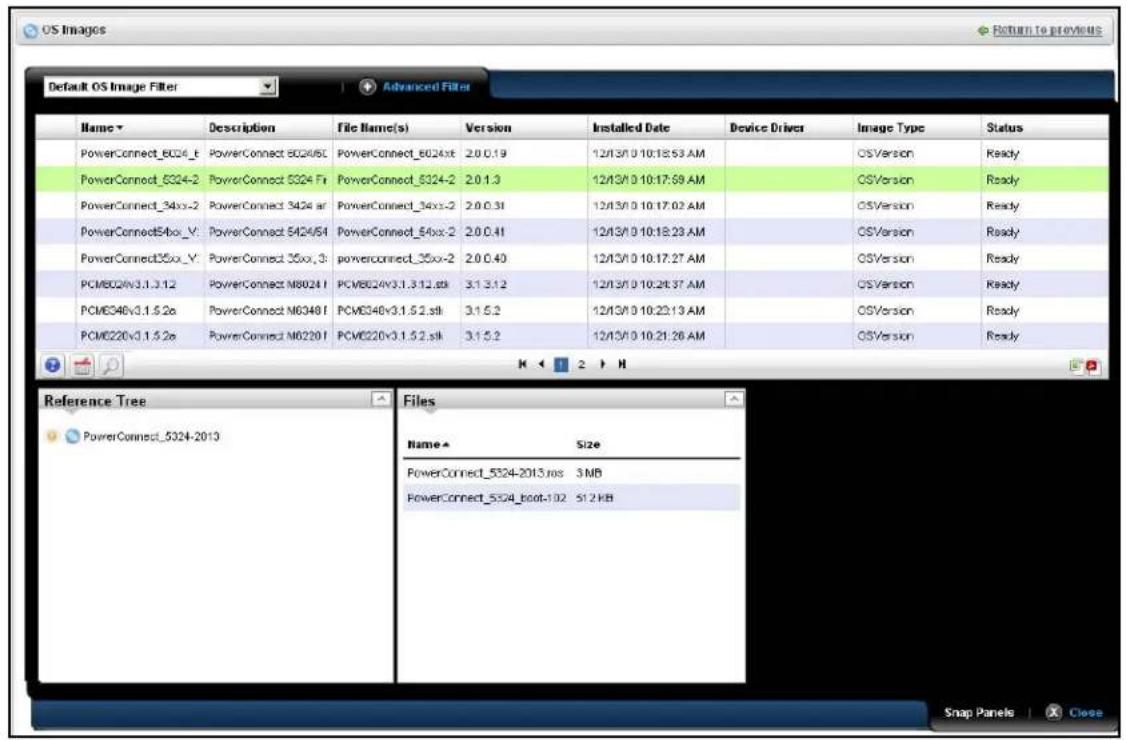
OS Image Editor
When you open or create an OS image, its configuration appears in this editor. The General Parameters tab contains its OS Image Name, Description, Version, and a Create Date. The Image Files tab displays a selector that lets you create new OS Images, retrieving files from the local file system (Import from Disk) or a URL (Import from URL). Because such images
can consist of multiple files, you can import multiple files here. Finally, you can also import a Readme File to accompany this image, and view it in that tab.
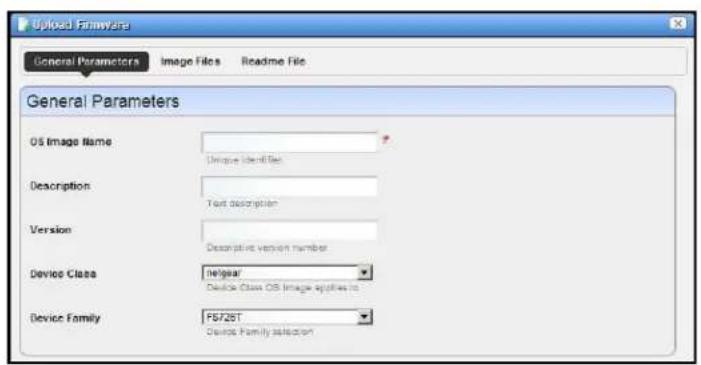
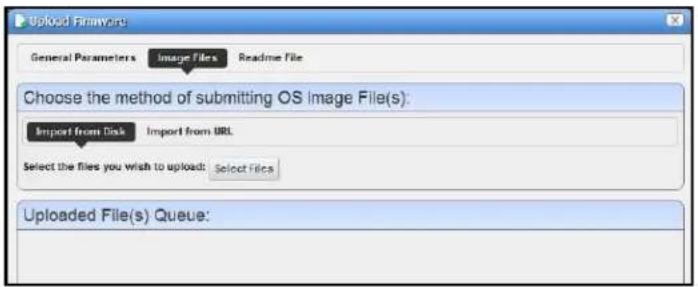
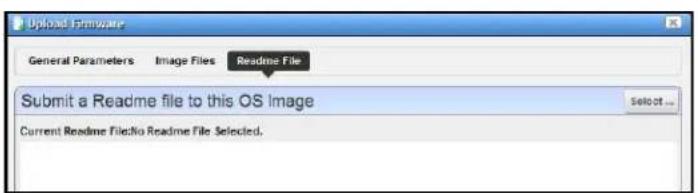
Click Save to preserve the OS Image you have configured, or Cancel to exit these screens without saving.
Deploy OS
This screen lets you configure a deployment, whether triggered from resource groups, individual resources, or the OS Images screen. Deployment validates the selected image is appropriate for the selected devices, or appropriate devices within a group.
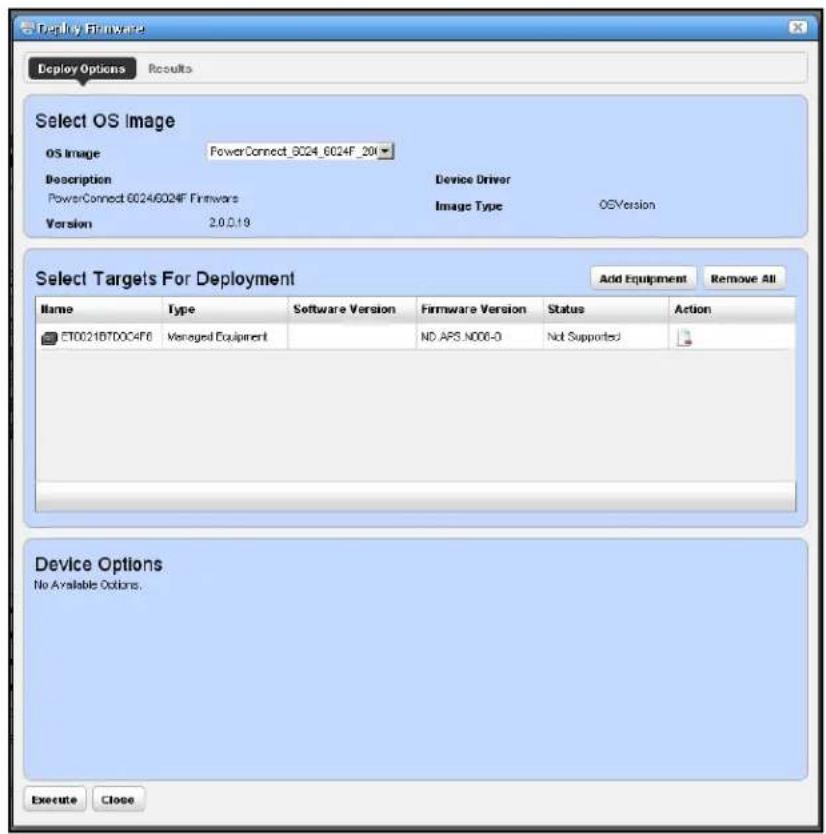
To deploy an OS image, follow these steps:
- Make sure you have an FTP / TFTP server correctly configured. See File Servers on page 74.
- Right click a device in Managed Resources or the groups or OS Images pages and select File Management > Deploy.
- The Deploy Firmware screen appears.
You can Select OS Image in the top panel, and configure deployment with the following fields:
- OS Image—Select an image. It must already have been uploaded in the OS Images manager.
• Description — A text description of the image.
• Version — The image version.
• Device Driver — The device driver associated with this image.
• Image Type—A read-only reminder of the type of image.
- Select Targets for Deployment—Select targets for deploying the image. This defaults to the device right-clicked in Managed Resources to initiate this action, or devices that match the selected file you want to deploy. You can then click the Add Equipment button (again, restricted to devices that match the deploy file's type). You can also remove devices from the target list with the Remove All button. Notice the Status column in the table of targets shows whether the OS deployment is supported or not.
Note: You can also select devices, then change the OS selection so a potential mismatch will occur. This will likely trigger rejection of the deployment by the device, but is not a recommended experiment.
- Device Options—The appearance of the Device Options panel, at the bottom of this screen, depends on the device selected in the Targets panel. These vendor-specific fields let you fine-tune the deployment.
- Click one of the butt ons at the bottom of the screen to initiate the next backup action.
Add Schedule opens the scheduling screen to let you automate the backup you have configured on a specified date, time, or repetition. See Scheduling Actions on page 154.
Execute performs the backup immediately. The Results tab in this screen opens, displaying the message traffic between NMS200 and the device(s). See Audit Trail Portlet on page 46.
Save preserves this configuration without scheduling or executing it.
Close closes this screen without saving the configured backup.
Contacts
The contact manager displays available contacts for your system. There is no expanded version of this portlet.
You can right-click to create, modify or remove (New, Open, Delete) the selected contact. You can also Import, Export All (see Import / Export on page 42) or Share with User (see Sharing on page 43).
New or Open displays the Contacts Editor.
Contacts Editor
This editor has two panels where you can enter contact information (Name, Address, Phone, and so on). Click the tabs at the top of this screen to move between the panels. The Contact ID, a unique identifier for the contact in your system, is a required field at the top of the first page.
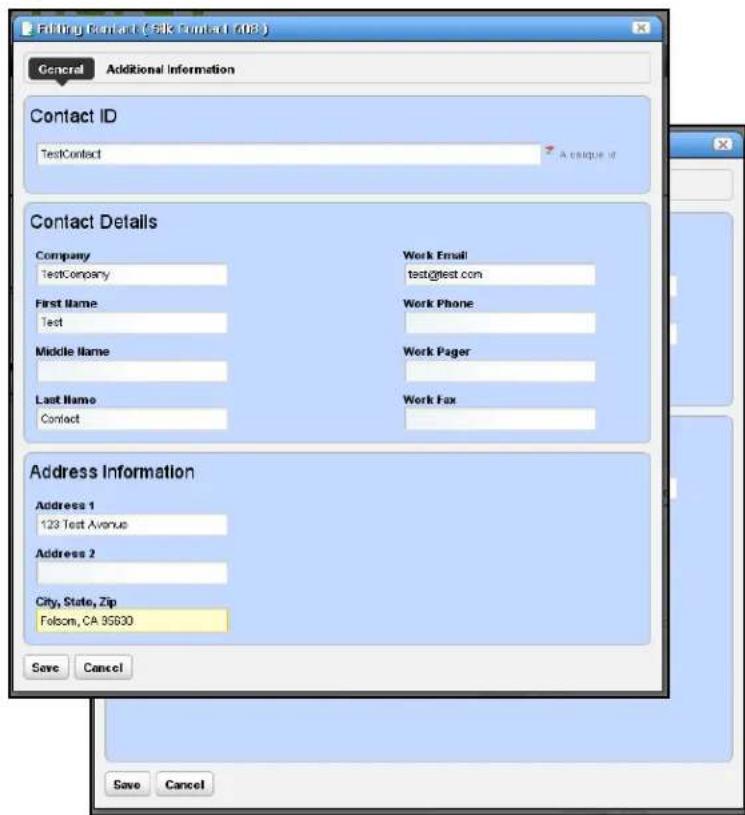
Click Save to preserve your new or modified contact information. Click Cancel to leave the contact unmodified.
Locations
In its summary form, the locations portlet displays configured locations in your system.
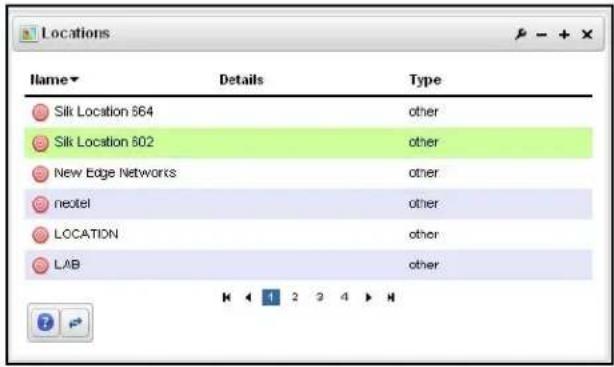
You can right-click to create, modify or remove (New, Open, Delete) the selected location. You can also Share with User. See Sharing on page 43.
This screen has the following columns:
• [Icon]—The icon for this location.
• Name—The name for this location.
• Details — A description for this location.
• Type —A designated type for the location.
Location Editor
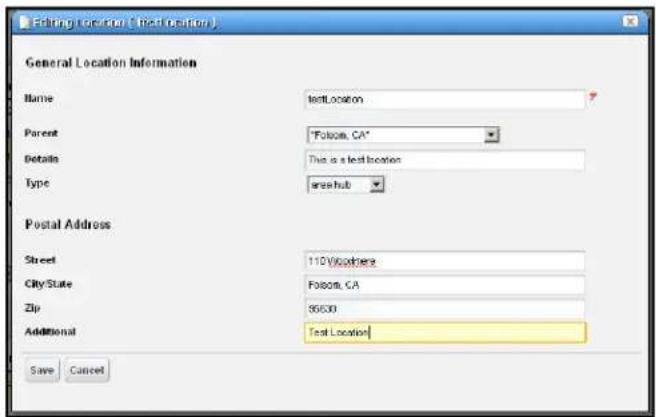
When you click New or Open, an editor appears. The Name field is mandatory.
- Name—A unique name for the Location. If you alter the name of an existing location already in use by existing equipment, the editor creates a new location. To change a location name, you must delete the original location and the equipment using it then re-make it. You can change the name of an unused location without deleting anything.
- Parent—The “parent” of this location (the location to which this location is subordinate). Select a Parent Location from the pick list. The maximum number of levels supported is 15.
- Type—Type of location, as selected from the drop-down menu. Available types are: Area Hub, Customer, National Hub, Other, Provider, Regional Hub, and State.
- Postal Address—The Street, City/State, Zip address of the location.
• Additional — Any optional notes.
Click Save save the Location, or any modifications you have made.
Expanded Location Portlet
The location portlet displays a list of all locations, with Snap Panels to display a selected location's connection to the network, and details.
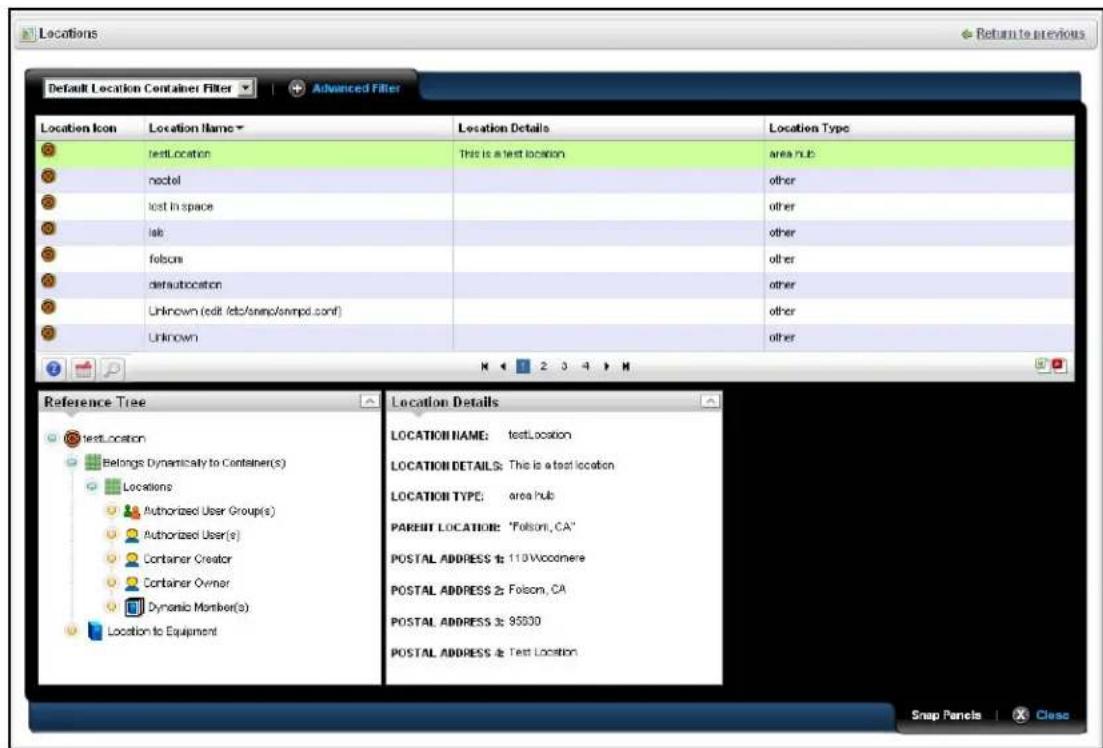
The New menu option appears in the expanded location portlet and the Add / Remove Columns item (see Add / Remove Columns on page 40). This has the same columns as Locations on page 83.
Locations Snap Panels
Selecting a location row displays the Reference Tree Snap Panel, with that location's connection to equipment. Click the plus (+) icons to expand the tree. The Location Details panel displays what has been configured in the Location Editor.
Visualize My Network
The Visualize My Network portlet displays discovered devices, mapping them in relationship to each other. You can click and drag displayed portions of this screen to see other parts of the topology. To move the display more, click in the OVERVIEW panel.
You can also expand / collapse the panels on the left of the screen by clicking their title bars. (Figures below display them expanded.)
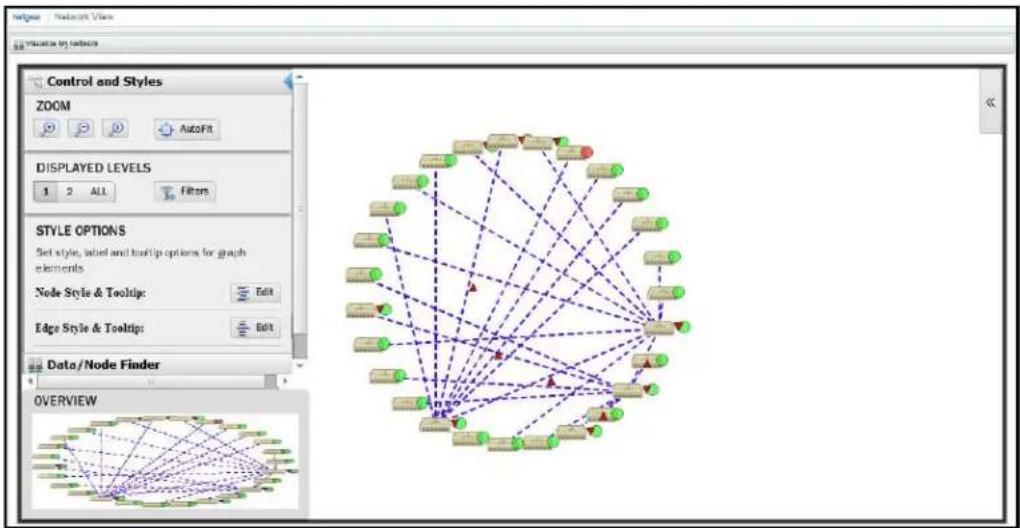
flowchart
graph TD
    A["Node Style & Tooltips"] --> B["Node 1"]
    A --> C["Node 2"]
    A --> D["Node 3"]
    A --> E["Node 4"]
    A --> F["Node 5"]
    A --> G["Node 6"]
    A --> H["Node 7"]
    A --> I["Node 8"]
    A --> J["Node 9"]
    A --> K["Node 10"]
    A --> L["Node 11"]
    A --> M["Node 12"]
    A --> N["Node 13"]
    A --> O["Node 14"]
    A --> P["Node 15"]
    A --> Q["Node 16"]
    A --> R["Node 17"]
    A --> S["Node 18"]
    A --> T["Node 19"]
    A --> U["Node 20"]
    A --> V["Node 21"]
    A --> W["Node 22"]
    A --> X["Node 23"]
    A --> Y["Node 24"]
    A --> Z["Node 25"]
    A --> AA["Node 26"]
    A --> AB["Node 27"]
    A --> AC["Node 28"]
    A --> AD["Node 29"]
    A --> AE["Node 30"]
    A --> AF["Node 31"]
    A --> AG["Node 32"]
    A --> AH["Node 33"]
    A --> AI["Node 34"]
    A --> AJ["Node 35"]
    A --> AK["Node 36"]
    A --> AL["Node 37"]
    A --> AM["Node 38"]
    A --> AN["Node 39"]
    A --> AO["Node 40"]
    A --> AP["Node 41"]
    A --> AQ["Node 42"]
    A --> AR["Node 43"]
    A --> AS["Node 44"]
    A --> AT["Node 45"]
    A --> AU["Node 46"]
    A --> AV["Node 47"]
    A --> AW["Node 48"]
    A --> AX["Node 49"]
    A --> AY["Node 50"]
Hover the cursor over an icon or link between icons to see a small screen describing its contents and alarm state. Click an icon to highlight it (or click its name in the GRAPH INVENTORY tab list) and its connections to the network. See Alarms in Topology on page 95 for more about the alarm states indicated by icons in topology.

CAUTION:
If you have installed a firewall on the application server, ports 80 and 8080 must both be open for topology to work.
Click the double arrows in the upper right corner to open the Legend for this screen, which describes the link colors and their meaning. Hover the cursor over a link to see its type described. See Icons on page 90 for an explanation of the icons that appear in these screens.
The screen to the left of the map displays the following panels:
• Control and Styles
• Data / Node Finder
- Layout
• OVERVIEW
Click on the title bars when these appear collapsed on the left of the screen to expand them. Click the blue left arrow at the top of them to re-collapse them.
In addition to the screen components immediately displayed, you can right-click an icon or component, and Drill in or Expand a device to see its subcomponents. If you expand, then its subcomponents appear onscreen with the rest of the topology. If you Expand w/o Filtering, then any filtering you have applied in the Data / Node Finder tab does not apply to the subcomponents that appear. If you drill in, other components do not appear. Finally, you can select Actions to execute. The Layout selected in determines the arrangement of such expansions or drill-ins.
When you drill in, the path back to the top level appears below the topology.
Drill-in Path:
Home
192.168.10.211
Click the level where you want to "drill out," or click Home to go to the top level.
Right-clicking a device can also let you select available Adaptive CLI Actions to execute on the selected device or component.
If you right click the blank area of the screen, you can Export it as either an image or GML (graphic markup language), or print the displayed topology.
Note: Because Topology uses Adobe Flash, menu items appear for that software when you right-click nodes. This includes Settings, Global Settings and About Flash menu items. The text below does not discuss these.
Actions
Available Node Actions mirror the kinds of menu items available in Managed Resources on page 133.
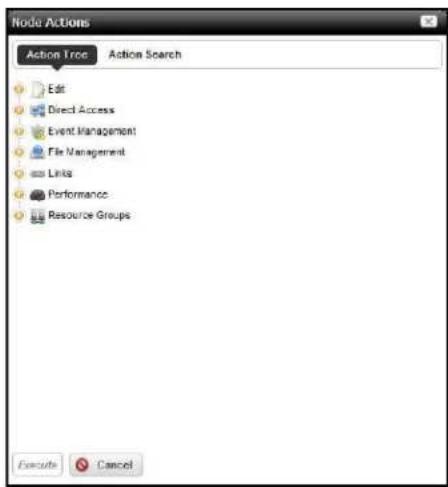
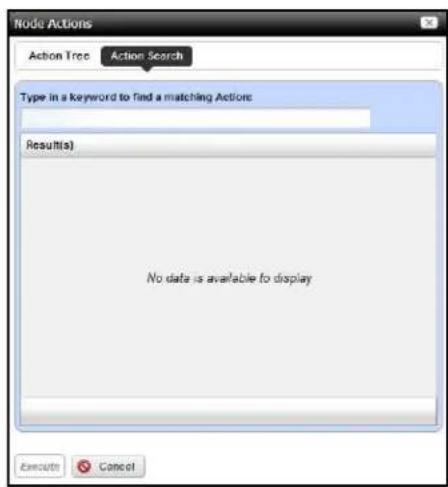
The Action Tree panel displays the available actions. The Action Search panel lets you enter a desired action and search for it. Select an action and click Execute to implement it. Click Cancel to dismiss this screen without running any action.
Control and Styles
- ZOOM
• DISPLAYED LEVELS
ZOOM
Click the + or - icons to zoom in or out. The 1 icon returns to the original default magnification (100%). The Autofit icon zooms to fit all devices in the topology.
DISPLAYED LEVELS
Clicking 1 displays the top level. Clicking 2 displays the top level and the one below it. Clicking All displays all discovered levels, from device to interface.
Tip: The fewer levels displayed, the more quickly the display appears.
Clicking the Filter button opens a screen that lets you further tune the Topology display. It includes the following:
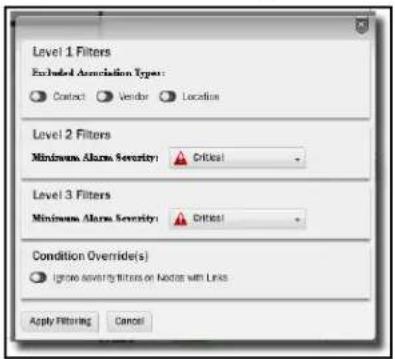
Level 1 Filters
Excluded Association Types (Contact, Vendor, Location) lets you turn off those icons. When these are activated, the icons disappear.
Level 2 Filters
Select a Minimum Alarm Severity to display from the pick list. When you select a severity, then only resources with that alarm level or greater appear in the topology display.
Level 3 Filters
Select a Minimum Alarm Severity to display from the pick list. This restricts the display on a lower level than Level 2.
Condition Override(s)
When active, this excludes level expands on nodes with links that do not match the severity filters.
Click the Apply Filtering button to implement your configuration, or Cancel to dismiss this screen without applying it.
STYLE OPTIONS
This tab's options configure node and line appearance. It displays the following when you click buttons in this panel. Notice the fist two have Tooltips tabs in addition to the first one you see:
- Node Style Options — Configure how nodes appear in topology.
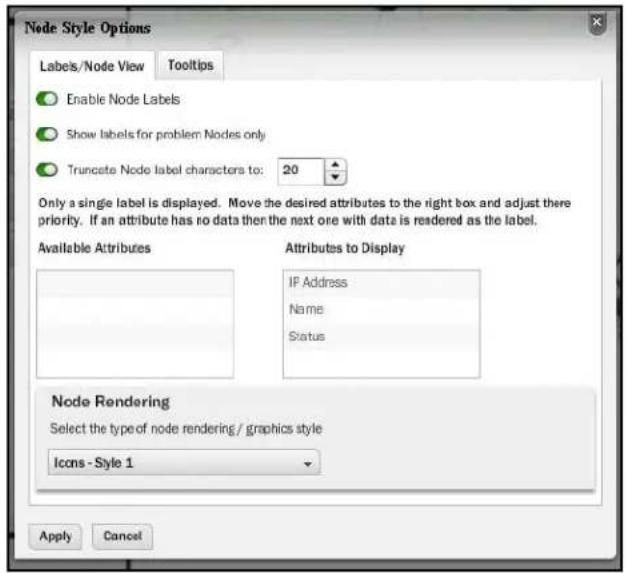
In the Label / Node View tab, you can elect to Enable Node Labels so labels appear next to icons in topology. Select the attributes in the middle panel. You can also elect to Show Labels for Problem Nodes Only, and Truncate Node Label Characters (and select the maximum number of characters).
Click to move attributes from Attributes to Display (all appear by default) to Available Attributes to conceal attributes you do not want displayed.
The Node Rendering pick list lets you select from several styles of icon that appear in topology. These include two icon styles (Style 1, the default, and Style 2), colored Circles (the color is the associated alarm color), and Labels Only. This last style overrides any previous selection to display labels only for problem nodes.
- Edge Style Options—This lets you configure the colors on connections between icons.
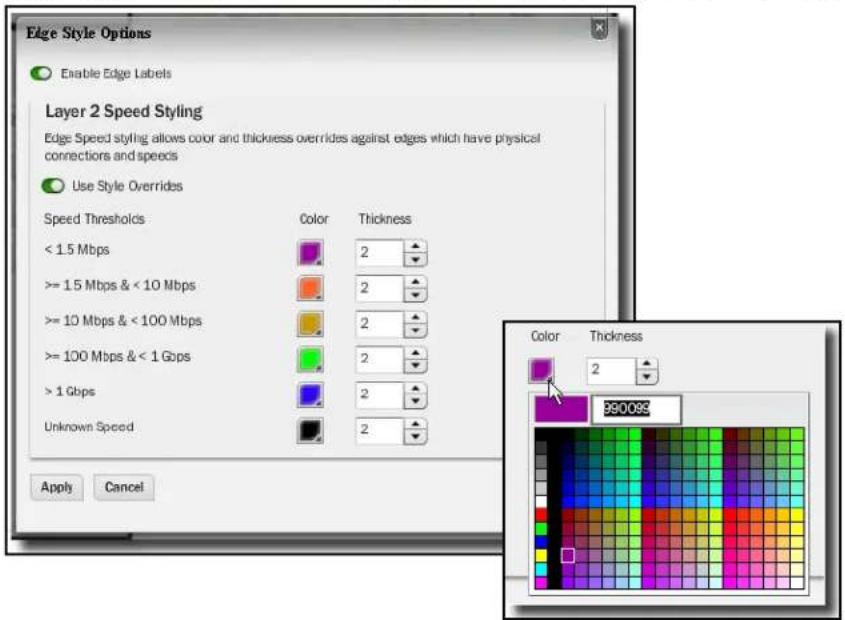
First, click to Enable Edge Labels. To have the edge reflect speeds, you can then elect Layer 2 Speed Styling (enable Use Style Overrides). Select colors for speeds by clicking the lower right corner of the colored boxes that appear next to speed range labels. You can also configure the thickness of the edge next to that color selector. Click Apply to enable your configuration, or Cancel to abandon it and close this options screen.
Note: Revising colors does not mean the revision appears in the legend
- Background Image—Click the + to select an image, typically a map, that you want to appear in the background, or the - to remove an existing one. Click and drag icons to locations on that image after it has appeared onscreen.
The selector looks for images on the machine where the browser is located. The size and appearance of images depends on the resolution of the monitor and the layout of the page in the browser. For example, setting the screen to 1280 by 1024 pixel resolution, with a one-column layout for the page where topology appears, a background graphic can be as large as 800 x 650 pixels.
Data / Node Finder
This screen offers additional topology information to help you locate specific resources within the visualization you have produced.
GRAPH INVENTORY
This displays a legend of icon types followed by a count (in parentheses) of how many of each appear in the topology. The switch at the bottom of this panel centers the display around the selected icon.
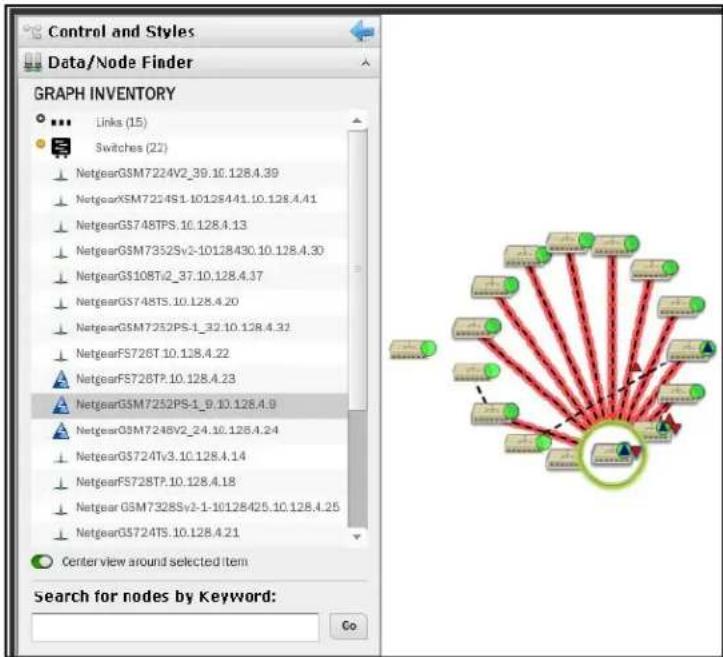
Click the plus (+) to the left of the inventory category icons to display a list of devices in that category in the topology. Click on a list item to highlight that device and its network connection in the topology view. A circle highlights the device and a colored glow highlights its network connection(s). Notice that the listed inventory changes if you drill in.
Tip: To make sure the selection appears in your view, select Center view around selected item at the bottom of this panel.
This tab also lets you Search for nodes by Keyword. Search results highlight specific items within the topology.
Icons
The the icons next to listed devices mean the following:
| Icon Type Explanation | ||
| Alarm | This shows the alarm state of the devices listed. In a composite list, like appears in Inventory, it shows the highest alarm state. | |
| Indeterminate No alarm information is available for this device. | ||
| Status Green means the device is Online, red means Offline, and yellow means indeterminate. | ||
| Topology Alarm Triangle These appear next to the device icons. The upward pointing triangle indicates the icon attached is a top-level device. The color in the circle is connection status color described above. The color in the triangle the device's alarm state. If the triangle points down, it indicates the triangle's alarm state color comes from a “child” component of the node. | ||
In the GRAPH INVENTORY tab (not the topology), the icons to the left of the devices are alarm icons, and their color reflects the highest alarm state on that device. Icons that appear on the right in the summary tree view displays the highest alarm severity for that type of device.
Layout
The layout tab lets you select and configure the type of automated node layout that appears in the topology display.
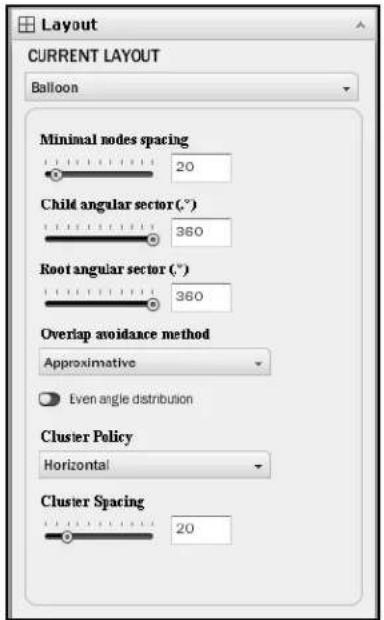
Under CURRENT LAYOUT, use the pick list to select the type of layout. The fields and selectors that appear below depend on the selection. Here are the available layouts, and the fields that go with them:
Balloon
Balloon layouts display links between managed objects in a balloon tree structure. The root is typically whatever device you have expanded or drilled into.
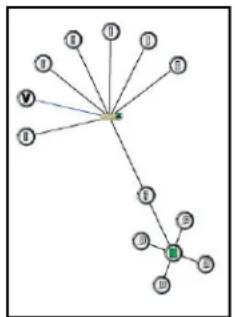
flowchart
graph TD
    A["Node"] --> B["Node 1"]
    A --> C["Node 2"]
    A --> D["Node 3"]
    A --> E["Node 4"]
    A --> F["Node 5"]
    A --> G["Node 6"]
    A --> H["Node 7"]
    A --> I["Node 8"]
    A --> J["Node 9"]
    A --> K["Node 10"]
    A --> L["Node 11"]
    A --> M["Node 12"]
    A --> N["Node 13"]
    A --> O["Node 14"]
    A --> P["Node 15"]
    A --> Q["Node 16"]
    A --> R["Node 17"]
    A --> S["Node 18"]
    A --> T["Node 19"]
    A --> U["Node 20"]
You can specify the following in the settings for this layout:
- Minimal nodes spacing—Use the slider to determine how close nodes are to each other.
- Child / Root angular sector (.o) – Use the slider to determine the angular sector. The root sector determines how much of an arc around that root the child nodes fill, and the child sector determines the orientation around the child nodes.
• Overlap avoidance method—Select Approximate or Deterministic. - Even angle distribution—Enable even angle distribution of nodes.
- Cluster Policy—Select Vertical or Horizontal. This determines the (automated) orientation of the topology. Remember, you can click and drag device icons.
- Cluster Spacing—Use the slider to determine the spacing between icons not in child / parent hierarchy.
Orthogonal
Orthogonal connections include right angles. You can specify the following settings for such layouts.
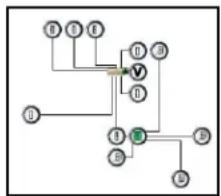
flowchart
graph TD
    v --> B
    v --> C
    v --> D
    v --> E
    v --> F
    v --> G
    v --> H
    v --> I
    v --> J
    v --> K
    v --> L
- Minimal nodes spacing – Use the slider to configure the node spacing.
- Use pseudo-orthogonal edges—Enable pseudo-orthogonal edges that have non-right angles.
- Cluster Policy—Select Vertical or Horizontal. This determines the (automated) orientation of the topology. Remember, you can click and drag device icons.
- Cluster Spacing—Use the slider to determine the spacing between icons not in child / parent hierarchy.
Radial
Radial layouts arrange nodes in concentric rings.
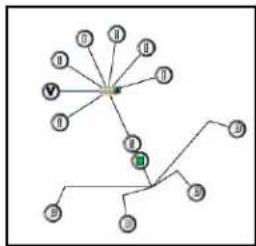
flowchart
graph TD
    A["Node"] --> B["Node 1"]
    A --> C["Node 2"]
    A --> D["Node 3"]
    A --> E["Node 4"]
    A --> F["Node 5"]
    A --> G["Node 6"]
    A --> H["Node 7"]
    A --> I["Node 8"]
    A --> J["Node 9"]
    A --> K["Node 10"]
    A --> L["Node 11"]
    A --> M["Node 12"]
    A --> N["Node 13"]
    A --> O["Node 14"]
    A --> P["Node 15"]
    A --> Q["Node 16"]
    A --> R["Node 17"]
    A --> S["Node 18"]
    A --> T["Node 19"]
    A --> U["Node 20"]
- Minimal concentric rings radius – Use the slider to determine the concentric ring spacing.
- Minimal nodes spacing—Use the slider to determine the nodes spacing.
- Angular sector (.o)–Use the slider to determine the arc where child nodes appear.
• Overlap avoidance method—Select Approximate or Deterministic. - Root node selection policy—Select Most weighted (for general graphs), Manual (for general graphs) or Directed (only for tree graphs).
- Link drawing type—Select from Straight, Straight polyline, Curved polyline, Orthogonal polyline, Orthogonal curved.
- Cluster Policy—Select Vertical or Horizontal. This determines the (automated) orientation of the topology. Remember, you can click and drag device icons.
- Cluster Spacing—Use the slider to determine the spacing between icons not in child / parent hierarchy.
Circular
Circular layouts arrange all nodes in a circle.
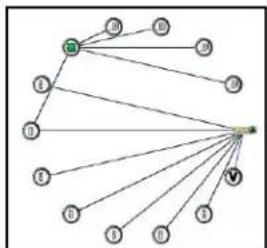
flowchart
graph TD
    A["Node"] --> B["Node 1"]
    A --> C["Node 2"]
    A --> D["Node 3"]
    A --> E["Node 4"]
    A --> F["Node 5"]
    A --> G["Node 6"]
    A --> H["Node 7"]
    A --> I["Node 8"]
    A --> J["Node 9"]
    A --> K["Node 10"]
    A --> L["Node 11"]
    A --> M["Node 12"]
    A --> N["Node 13"]
    A --> O["Node 14"]
    A --> P["Node 15"]
    A --> Q["Node 16"]
    A --> R["Node 17"]
    A --> S["Node 18"]
    A --> T["Node 19"]
    A --> U["Node 20"]
    A --> V["Node 21"]
    A --> W["Node 22"]
    A --> X["Node 23"]
    A --> Y["Node 24"]
    A --> Z["Node 25"]
- Minimal circle radius – Use the slider to determine the radius of the circle.
- Minimal nodes spacing—Use the slider to determine the nodes spacing.
- Wedge Angle—Use the slider to determine the arc where child nodes appear.
• Overlap avoidance method—Select Approximate or Deterministic. -
Root node selection policy—Select Most weighted (for general graphs), Manual (for general graphs) or Directed (only for tree graphs).
-
Link drawing type—Select from Straight, Straight polyline, Curved polyline, Orthogonal polyline, Orthogonal curved.
- Cluster Policy—Select Vertical or Horizontal. This determines the (automated) orientation of the topology. Remember, you can click and drag device icons.
- Cluster Spacing—Use the slider to determine the spacing between icons not in child / parent hierarchy.
Hierarchical-Cyclic
This arranges connections in a hierarchy. Use the following settings to alter its appearance.
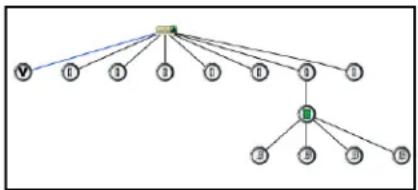
flowchart
graph TD
    A[" "] --> B["V"]
    A --> C["I"]
    A --> D["B"]
    A --> E["C"]
    A --> F["D"]
    A --> G["E"]
    A --> H["F"]
    A --> I["G"]
    A --> J["H"]
    A --> K["I"]
    A --> L["B"]
    A --> M["C"]
    A --> N["D"]
- Distance between levels—Use the slider to determine the distance between levels.
- Distance between nodes—Use the slider to determine the distance between nodes.
- Orientation—Select from Top to Bottom, Bottom to Top, Left to Right or Right to Left.
- Draw edges from—Select from Node Center or Node Side.
- Link drawing type—Select from Straight, Straight polyline, Curved polyline, Orthogonal polyline or Orthogonal curved.
- Cluster Policy—Select from Horizontal or Vertical.
- Cluster Spacing—Use the slider to determine the spacing between icons not in child / parent hierarchy.
Basic Spring
Basic Spring is an algorithm attempts to produce a natural layout that optimizes a spread out topology.
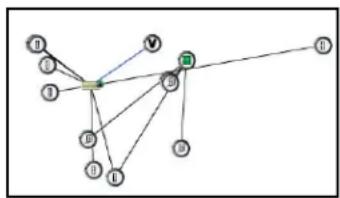
flowchart
graph TD
    n --> 1
    n --> 2
    n --> 3
    n --> 4
    n --> 5
    n --> 6
    n --> 7
    n --> 8
    n --> 9
    n --> 10
    n --> 11
    n --> 12
    n --> 13
    n --> 14
    n --> 15
    n --> 16
    n --> 17
    n --> 18
    n --> 19
    n --> 20
    n --> 21
    n --> 22
    n --> 23
    n --> 24
    n --> 25
    n --> 26
    n --> 27
    n --> 28
    n --> 29
    n --> 30
    n --> 31
    n --> 32
    n --> 33
    n --> 34
    n --> 35
    n --> 36
    n --> 37
    n --> 38
    n --> 39
    n --> 40
    n --> 41
    n --> 42
    n --> 43
    n --> 44
    n --> 45
    n --> 46
    n --> 47
    n --> 48
    n --> 49
    n --> 50
    n --> 51
    n --> 52
    n --> 53
    n --> 54
    n --> 55
    n --> 56
    n --> 57
    n --> 58
    n --> 59
    n --> 60
    n --> 61
    n --> 62
    n --> 63
    n --> 64
    n --> 65
    n --> 66
    n --> 67
    n --> 68
    n --> 69
    n --> 70
    n --> 71
    n --> 72
    n --> 73
    n --> 74
    n --> 75
    n --> 76
    n --> 77
    n --> 78
    n --> 79
    n --> 80
- Optimal Edge Length—Use the slider to determine the distance between nodes.
- Cluster Policy—Select from Horizontal or Vertical.
- Cluster Spacing—Use the slider to determine the spacing between icons not in child / parent hierarchy.
OVERVIEW
This displays a thumbnail of the entire topology that appears in the larger screen to the right. Click a location to move the larger view to center on it.
Alarms in Topology
Colored circles and triangles appear next to topology nodes to indicate its network status (circles) or the alarm state of the device (triangles, apex points up) or the alarm state of its child entities (off-center triangles, apex points down). For information about the alarm, hover your cursor over the triangle, and a popup appears describing the device, whether the alarm is on the device or a "child," and what is its severity.
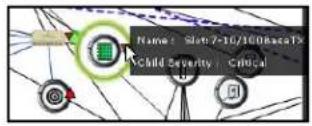
The alarms indicated are like alarms described in the portlet Alarms on page 51.
Vendors
In its summary form, this portlet displays the available vendors for network resources.
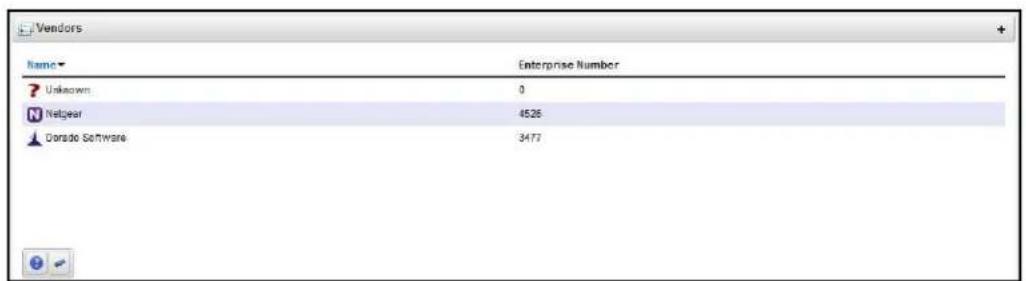
Right-clicking a row lets you Share with User, (See Sharing on page 43.) or use the Import / Export common menu capabilities described in Import / Export on page 42.
This screen has the following columns:
• Vendor Icon — The icon for this vendor.
• Enterprise Number—The enterprise number for this vendor.
• Vendor Name — The name for this vendor.
Expanded Vendor Portlet
When you expand the Vendor portlet, besides sharing you can also Add / Remove Columns item (see Add / Remove Columns on page 40). This screen has the same columns available as the summary screen.
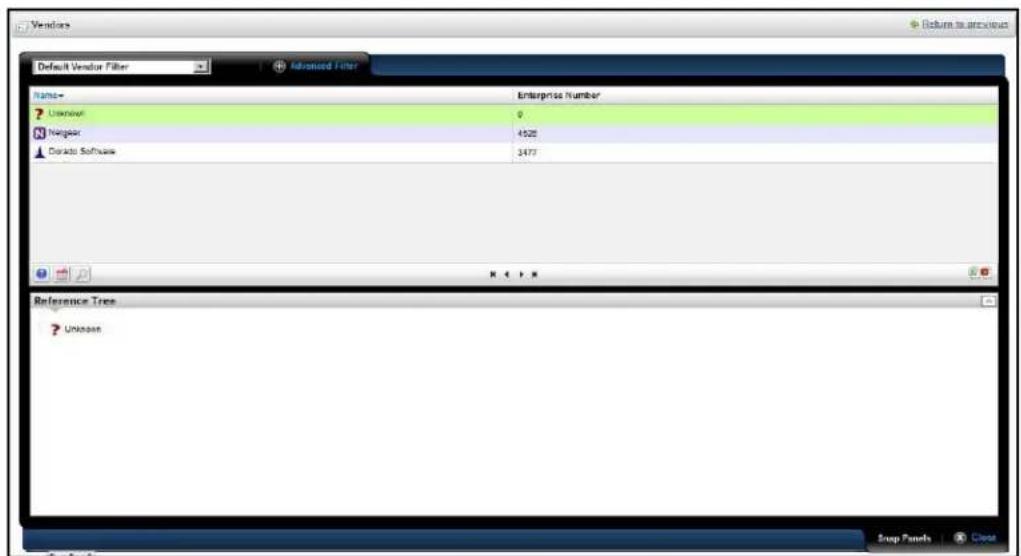
Vendors Snap Panel
The snap panel displays the containers where the selected vendor is a member.
This chapter describes Resource Monitors as they appears in NMS200's web portal. For more information about creating, managing and configuring such monitors, refer to NMS200's User Guide. The following describes these monitors:
• Resource Monitors
- Top [Asset] Monitors (pre-configured monitors that come with your installation by default.
Finally, this chapter contains a reminder about scheduling refreshes of monitor target groups. See Scheduling Refresh Monitor Targets on page 113.
Resource Monitors
This summary screen displays currently, active performance monitors in brief.
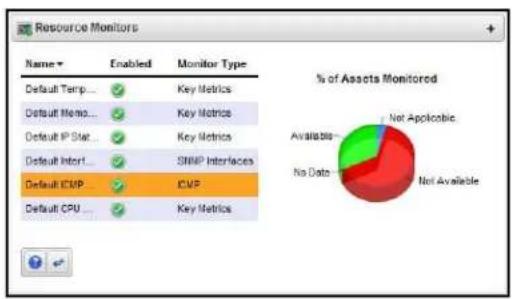
pie
| Category | Percentage | | ------------------ | ---------- | | Default Temp | ✓ | | Default Menu | ✓ | | Default IP Stat | ✓ | | Default Intert | ✓ | | Default ICMP | ✓ | | Default CPU | ✓ |The Name column displays the identifier for each monitor instance, Enable displays a green check if it is currently enabled, or a red minus if it is disabled.
The Monitor Type column typically displays what the monitor covers. Hover your cursor over this column to see a popup with the selected monitor's properties. The popup that appears after this query displays the relevant information for the monitor, including whether it is Enabled, Name, Description, Target Count, Retention Policy, and Polling Interval Value.
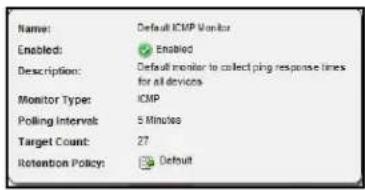
The graph that appears to the right of the monitors displays the aggregate availability information for the enabled monitors. Topics graphed include, Available, Not Available, No Data and Not Applicable.
Right-click a listed monitor to do the following (not all menu items appear for all types of monitors):
- Refresh Monitor— Re-query to update any targets for the current monitor. See Scheduling Refresh Monitor Targets on page 113 for instructions about automating this.
- Enable / Disable Monitor—Enables or disables the monitor. Only one of these options appears.
- New Monitor—Lets you create a new monitor of the type you select in the sub-menu. See Monitor Editor on page 99 for details.
- Open Monitor—Opens the Monitor Editor, where you can modify the selected monitor's configuration.
- Delete—Removes the selected monitor.
Expanded Resource Monitor
This screen appears when you click the plus in the upper right corner of the summary screen.
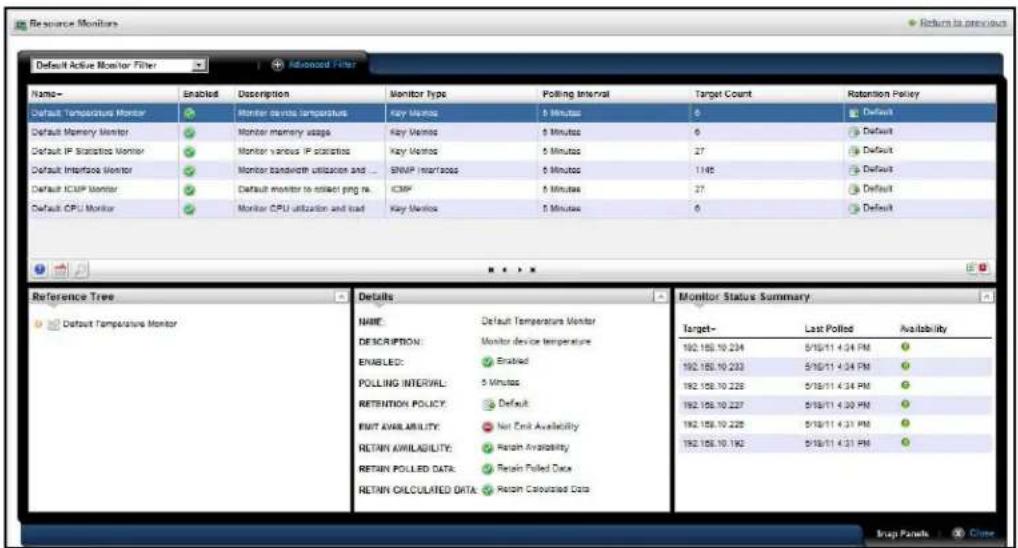
As in most expanded views, this one displays a list ordered by the Name of the monitor, and adds Add / Remove Columns to the previously available menu. Available columns include those on the summary screen (Name, Enabled, Monitor Type) as well as Description, Poling Interval, Target Count and Retention Policy.
Resource Monitor Snap Panels
When you select a monitor, the Snap Panels at the bottom of the screen display details about it. The Reference Tree shows the selected monitor's connection to attributes, groups, retention policies and its membership (the devices monitored).
The Details Snap Panel displays the attributes the popup shows when you hover the cursor over the Monitor Type column in the summary screen, and adds Emit Availability (events), Retain Availability, Retain Polled Data, and Retain Calculated Data parameters.
The Monitor Status Summary Snap Panel displays the status of each individual member (Target) of the monitor, showing the Last Polled time and date, and a title bar and icon indicating Availability (green is available, red is not).
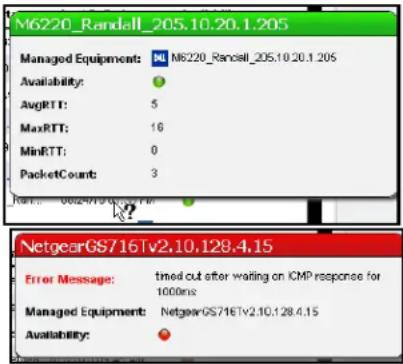
Hover the cursor over the Availability icon, and a popup appears with details about availability. If the device is available, the RTT (round-trip time) for communication appears in Avg (average), Max (maximum), and Min (minimum) amounts, along with the PacketCount. If it is not, an Error Message appears instead of the RTT and PacketCount parameters.
To edit more performance settings and targets than are available here, use the features described in Dashboard Views on page 115. You can create and display dashboards by right-clicking items in Managed Resources, selecting Show Performance.
Monitor Editor
This editor lets you fine-tune the monitor you selected and right-clicked to open the editor. It includes the following panels and fields:
- General
• Monitor Options
• Calculated Metrics - Thresholds
• Inventory Mappings
General
The General panel is common to all different monitor types.
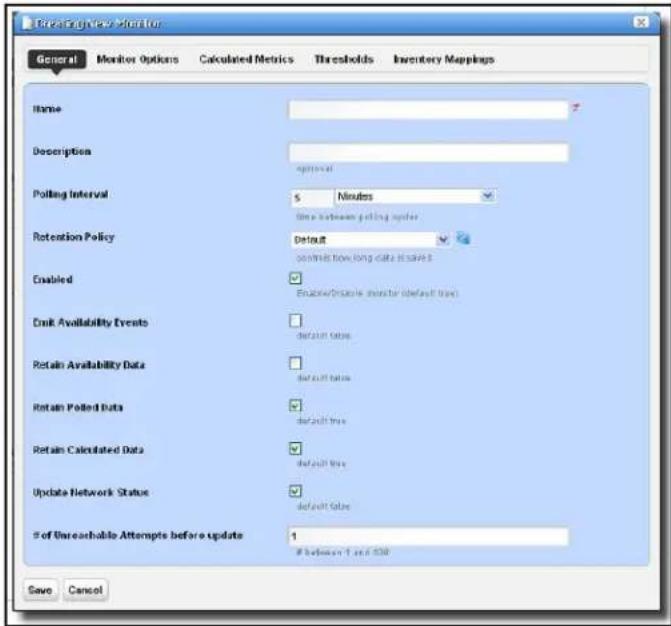
• Name—The identifier for this monitor.
• Description — A text description for this monitor.
- Polling Interval—Use these fields to configure how often the monitor polls its target(s).
Retention Policy—This configures how long NMS200 retains the monitor's data.
• Enabled — Check to enable.
- Emit Availability Events—Check to activate emitting availability events.
- Retain Availability Data—Check to activate. You must Retain availability data to enable alarms. If you define thresholds, you should retain availability data. Retain availability data stores the Boolean values of whether availability data was in the range your defined metrics.
- Retain Polled Data—Check to activate. If you uncheck Retain polled data only calculated data remains, you cannot view data retrieved from monitored entities. Turning off Retain polled data discards the data as it arrives from the device.
- Retain Calculated Data—Check to activate. Retain calculated data complements Retain polled data. If checked, it stores the calculated results which came from the raw poll data received from the device.
- Update Network Status—Check to activate a check of the monitored device's network status.
- # of Unreachable Attempts before update—The number of attempts to reach the device before NMS200 updates the displayed network status of the device. (1-100)
Click Save to preserve any edits you make, or Cancel to abandon them.
Monitor Options
Monitor options contains two panels. The entity panel lets you select the monitor targets. The types of monitor entities allowed varies depending on the type of monitor. The second panel contains options specific to the monitor type being edited.
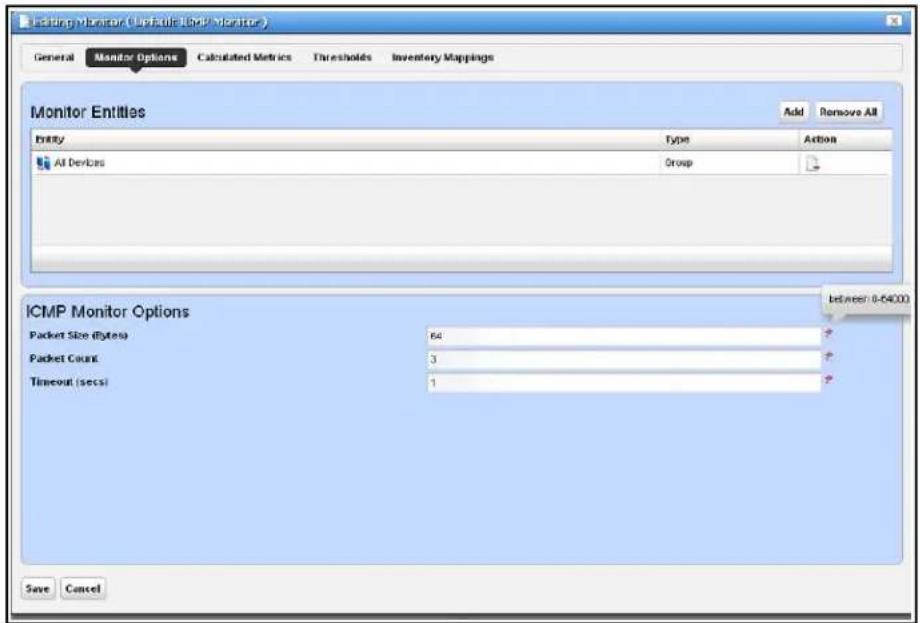
The entity and options panels for the various types of monitors appear below in Monitor Options Type-Specific Panels on page 106.
Calculated Metrics
The calculated metrics panel lets you create attributes that are calculated from existing monitor attributes. The metric attribute legend assigns a letter value to each monitor attribute. The Reassign button reassigns the letters. This is useful if some attributes have been deleted and their letters are no longer used.
The Configured Metrics table lists the calculated metrics. An edit and delete action appears to the right of each row. The Add button creates a new calculated metric and the Remove All button deletes all the calculated metrics.
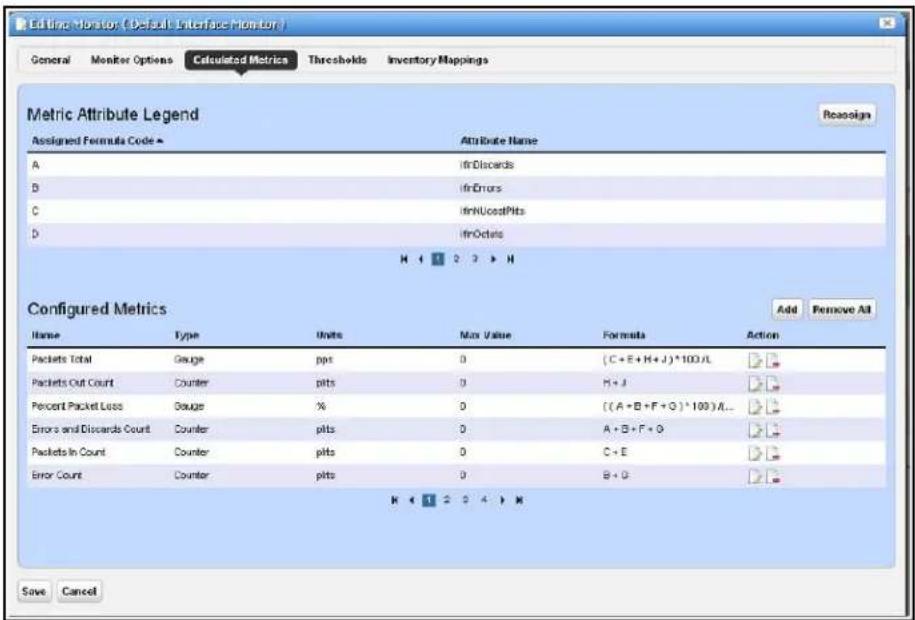
Clicking on the Add button or edit button displays the calculation editor.
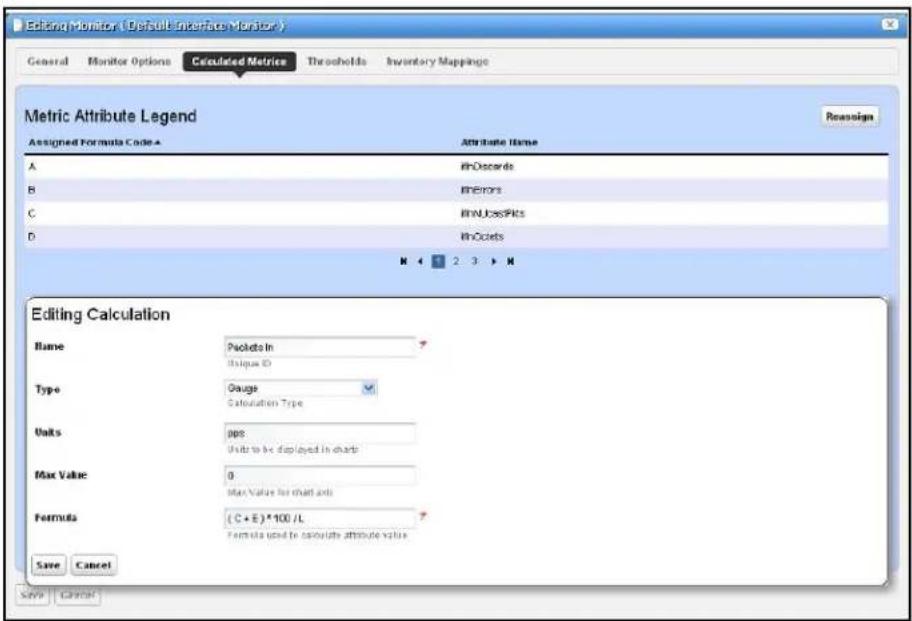
This panel contains the following properties:
• Name—The attribute name to be displayed for the calculation
• Type — Calculation Type - Gauge or Counter
- Units—Units string to appear in graphs
• Max Value — Maximum value to be used in graphing (0 = no max) - Formula—The formula for the calculation using the assigned formula codes from the metric attribute legend.
Thresholds
The thresholds panel allows the user to set threshold intervals on attributes in the monitor. The table lists the attributes for which attributes have been configured. Each row has an edit action and delete action. The Add button allows thresholds to be specified for another attribute. If all monitor attributes have thresholds defined for them the Add button will be disabled.
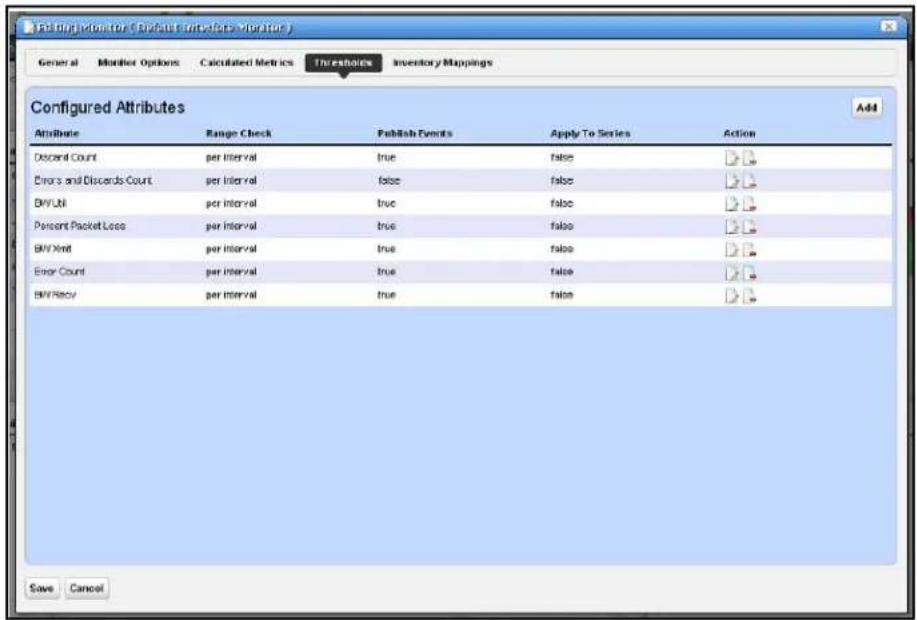
The Add or Edit buttons open a threshold editor (blank or with existing, configured thresholds, respectively).
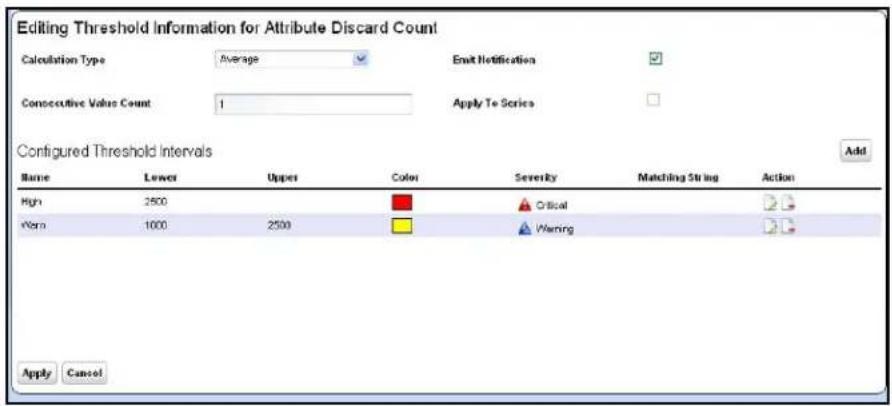
- Configure threshold intervals you Add at the bottom of this screen according to the following parameters.
- Attribute Name—Appears when you click Add rather than Editing a selected threshold. Use the pick list that appears in this screen to select the attribute for which you are specifying threshold information. When you Edit, the name of the attribute appears as a title within the editor screen.
• Calculation Type—Select from the pick list. Specifies whether the range calculation is to be done based on Average or Consecutive values. - Consecutive Value Count—Select how many consecutive values to consider at once for a range calculation. Typically the larger the number here, the less “flutter” in reporting threshold crossings.
- Emit Notification—Check to emit an event if the device crosses the configured threshold(s).
- Apply to Series—Check to enable on composite attributes only. Checking this applies the threshold to individual elements within the series. When it is unchecked, the threshold applies only to aggregate measurements (the overall value of the series), not individual elements within the series.
For example; a Key Metric monitor for CPU utilization on a device with two CPUs actually monitors both CPUs. When unchecked, the threshold applies to the average of both CPUs, when checked, the threshold applies to each individual CPU.
Tip: When you check this, you can also apply thresholds to regular expressions. This is useful to monitor components within components, for example cores within a CPU.
Click Apply to preserve your edits, or Cancel to abandon them.
The threshold interval editor pops up when you select the Add button or the Edit icon to the right of a threshold's row in the threshold attribute editor.
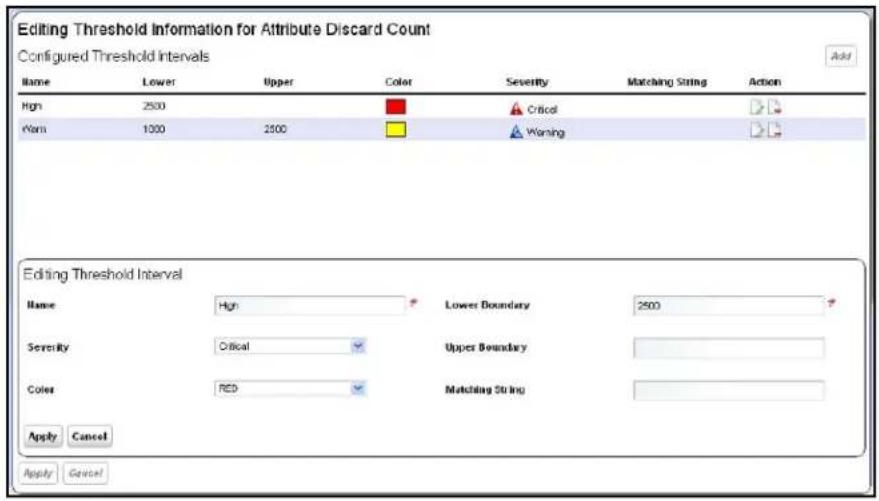
This screen contains the following fields:
• Name—The identifier for the threshold interval.
- Severity—The event severity for crossing this threshold interval (informational/indeterminate/warning/minor/major/critical)
• Color—The color to display threshold interval on graphs.
- Lower Boundary — The interval's lower boundary.
• Upper Boundary—The interval's upper boundary. May be blank.
- Matching String — A Regex matching string.
Inventory Mappings
The inventory mappings panel allows the user to associate any of several predefined inventory metrics with a monitor attribute. The available metrics are CPU Utilization %, Memory Utilization %, ICMP Round Trip Time, ICMP packet errors, and Bandwidth utilization %.
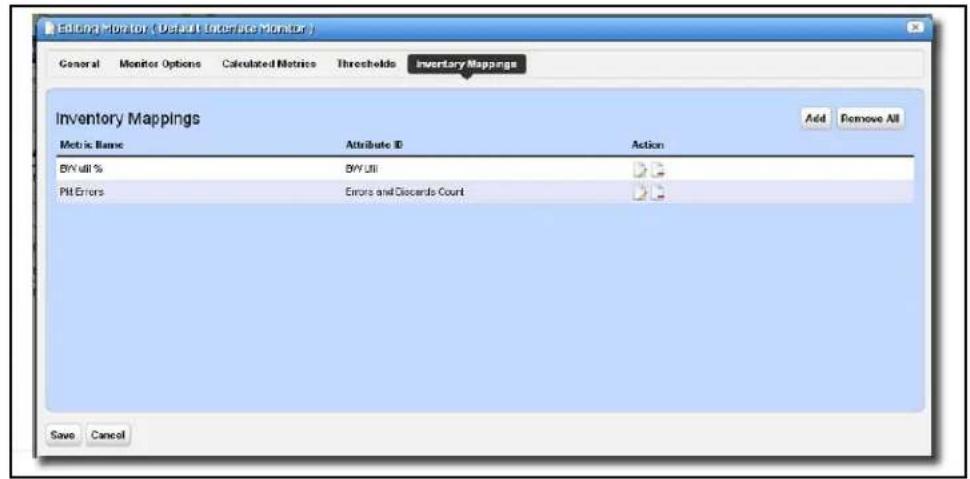
You can Add a new mapping with that button, or Remove All listed mappings with that button. You can also edit or delete listed mappings with the Action icons to the right of each row. Adding or editing opens the Inventory Mapping Editor.
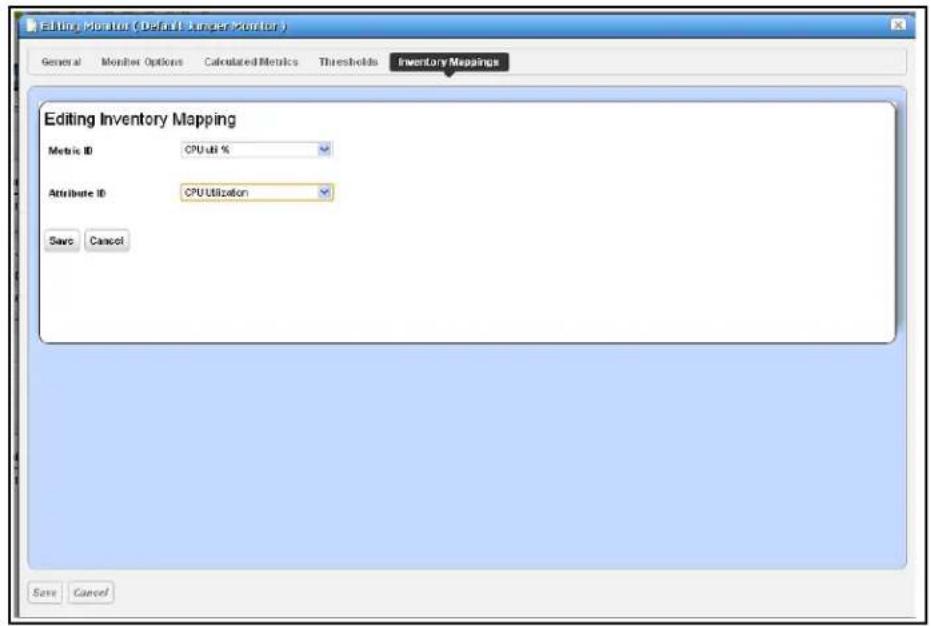
This lets you configure the following:
• Metric ID—Inventory metric name
• Attribute ID — Attribute to associate with the inventory metric
Monitor Options Type-Specific Panels
The following describes the panels associated with the following Monitor Options types.
- ICMP Monitor
• Key Metrics Monitor
• SNMP Monitor
• SNMP Interface Monitor
The SNMP Interface Monitor Example describes creating a monitor
SNMP Interface Monitor Example
To set up a typical performance monitor, follow these steps:
- In the Resource Mon itors portlet, and create a new monitor by right-clicking and selecting New.
-
Select the type of monit or from the submenu—for this example, an SNMP Interfaces monitor.
-
In the General screen, enter a name, leave Enabled checked, enter a polling interval (5 minutes is the default). For this example, check Retain polled data and accept the remaining defaults for checkboxes and the retention policy.
- Select an entity to monitor by clicking the Add button in the top portion of the Monitor Options screen. For an interface monitor, select Interface as the Type at the top of the screen. You can also filter the list of interfaces that appear further by selecting Interface Type as Ethernet, for example.
Tip: Notice that you can add refinements like filtering on Administrative State and IP Address to the filter.
- Select inter faces (Ctrl+click to add more than one), then click Add Selection then Done to confirm your entity.
Tip: Hover your cursor over a line describing an interface to have a more complete description appear as a popup.
- Click Browse to display the MIB Browser (see SNMP Monitor on page 110) For the sake of this example, we elect to monitor ifInErrors (in RFC Standard MIBs, RFC1213-MIB > Nodes > mib-2 > interfaces > ifTable > ifEntry > ifInErrors).
- In the Thre sholds screen, configure thresholds by first clicking Add.
- In the threshold editor, enter a name (Examples: Low, Medium, Overload), an upper and lower boundary, (0 - 10, 10 - 100, 100+), a severity (Informational, Warning, Critical) and color (BLUE, YELLOW, RED). In this case, no string matching is necessary. When the data crosses thresholds, the monitor reacts.
Attributes available depend on the type of monitor you are creating. Notice that, you can also check to make crossing this threshold emit a notification (an alarm that would appear on the Alarm panel). You can also configure the type of calculation, and so on. You can even alter existing thresholds, by selecting one, then clicking Edit to the right of the selected threshold.
Note: If a threshold's counter is an SNMP Counter32 (a 32-bit counter) monitoring can exceed its capacity with a fully utilized gigabit interface in a relatively short period of time. The defaults configured in this monitor account for this, but if you know that this is an issue, you can probably configure the monitor to account for it too.
After taking a look at Thresholds no more configuration is required. Notice, however, that you can also configure Calculated Metrics and Inventory Mappings on other screens in this editor to calculate additional values based on the monitored attributes, and to map them.
Tip: Calculated Metrics is particularly valuable if you want to monitor a composite like ifInErrors + ifOutErrors or want to calculate a parameter like errors per minute when you have a 5-minute monitoring interval.
Consult the sections above for more information about the other screens and their capabilities.
-
Click Apply for each threshold interval you configure, then Apply for the entire threshold configuration.
-
Click Save and the monitor is now active.
Notice that the Availability icon appears at the top of a Monitor Status Summary snap panel in the Expanded Resource Monitor next to a time/date stamp of its last polling. Right-click the monitor and select Refresh Monitor to manually initiate polling.
Values displayed in the Overall Availability column of the Monitor Manager do not automatically refresh and may be out of date. The Reference Tree snap panel maps the monitor's relationship to its target(s) attribute(s) and other elements. The Details snap panel summarizes the monitor's configuration.
- For information about having the monitor's results appear in the a Dashboard portlet, see Dashboard Views on page 115.
ICMP Monitor
The ICMP Monitor Options panel contains the following properties:
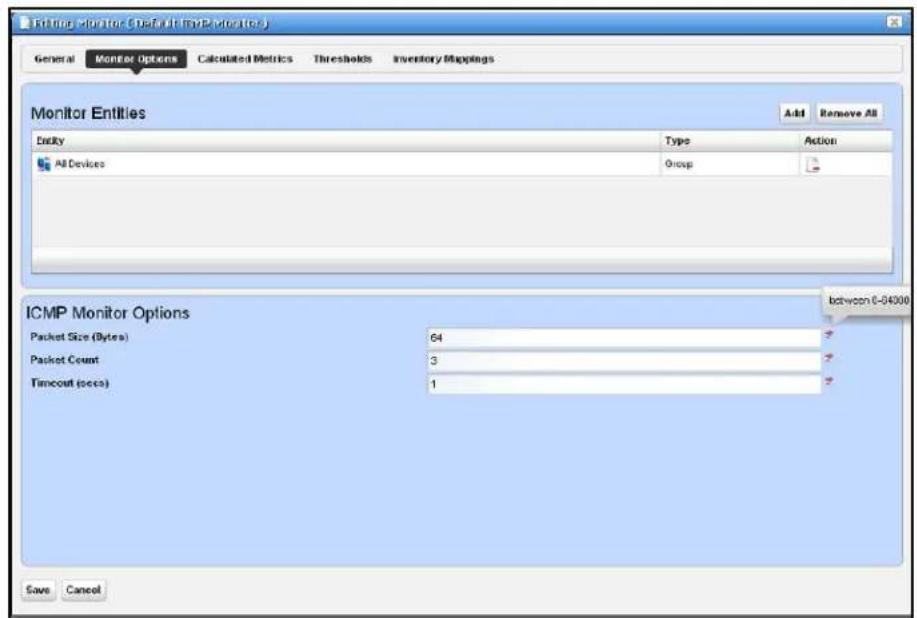
• Packet Size — Size of packet for ICMP transmission
• Packet Count —Number of packets to send.
- Timeout—Number of seconds without a response before a timeout is issued
The ICMP Entity Panel lets you select resource groups and Resource manager objects. Clicking Add button displays a selector panel for these.
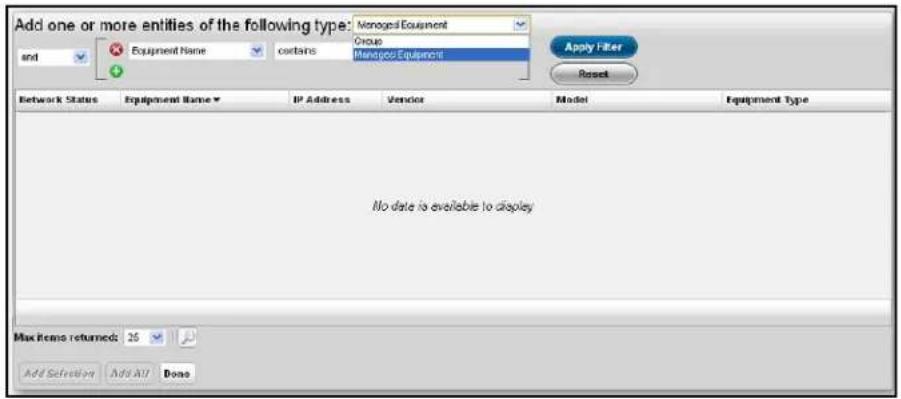
Select the type of entity you want to add, then select any desired filter attributes, then click Apply Filter. Select from the entities that appear and add them to the monitor.
Key Metrics Monitor
The Key Metrics Properties panel contains a list of key metrics you can add to the monitor. They are grouped by category.
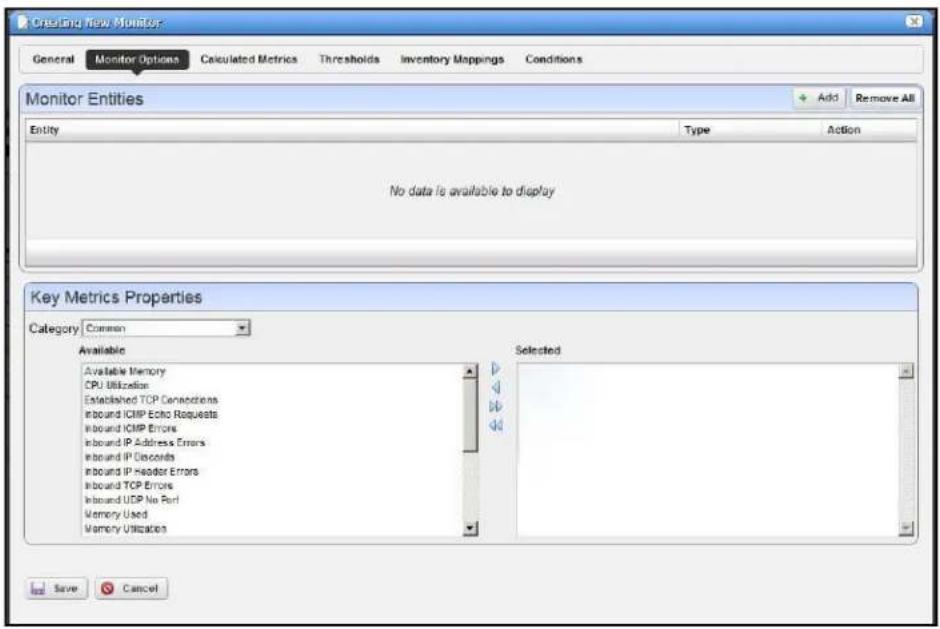
The Monitor Entities Panel lets you select equipment group and equipment manager objects (as described in ICMP Monitor on page 108, above).
The Key Metrics Properties panel at the bottom of this screen uses a pre-defined list of key metrics. It does not check if the key metrics selected are supported by the devices and groups selected in the monitor.
SNMP Monitor
The SNMP attributes panel lets you specify which SNMP attributes are to be monitored.
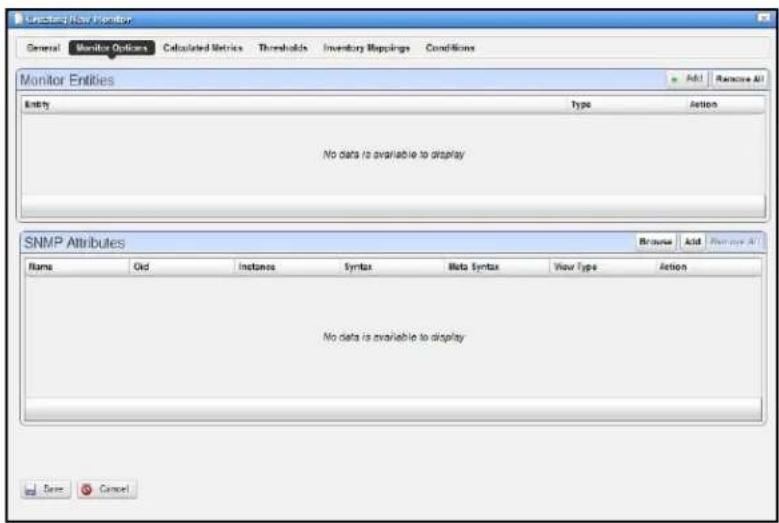
You can specify the SNMP attributes the following ways:
• With the SNMP browser, or
- Entering the SNMP attribute properties explicitly.
The Browse button launches the SNMP browser.
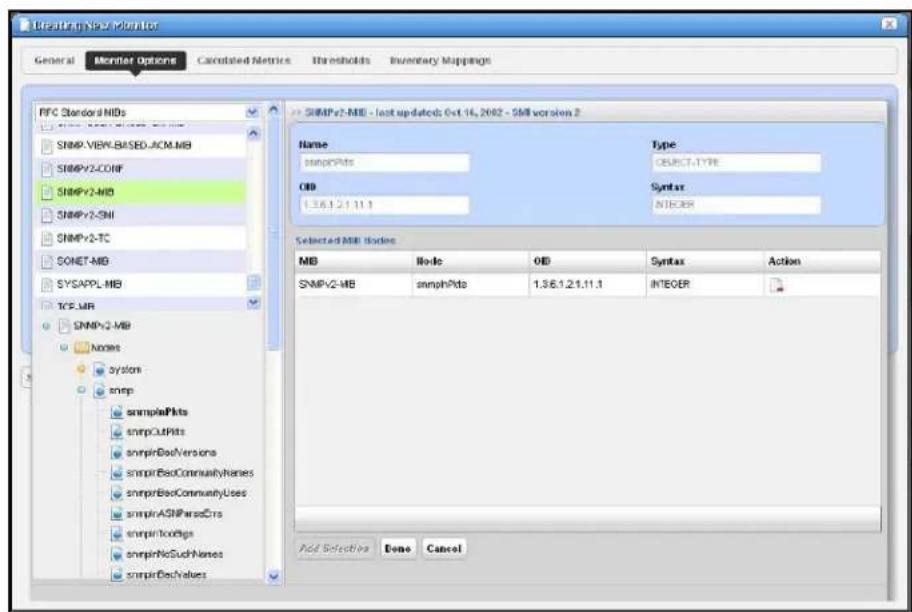
Click on the desired SNMP nodes and then click on the Add Selection button to add an SNMP attribute. When done selecting, click the Done button to add selected attributes to the monitor or Cancel to abandon the operation and close the browser.
The Add and Edit buttons in the SNMP attribute panel launch the SNMP Attribute editor.
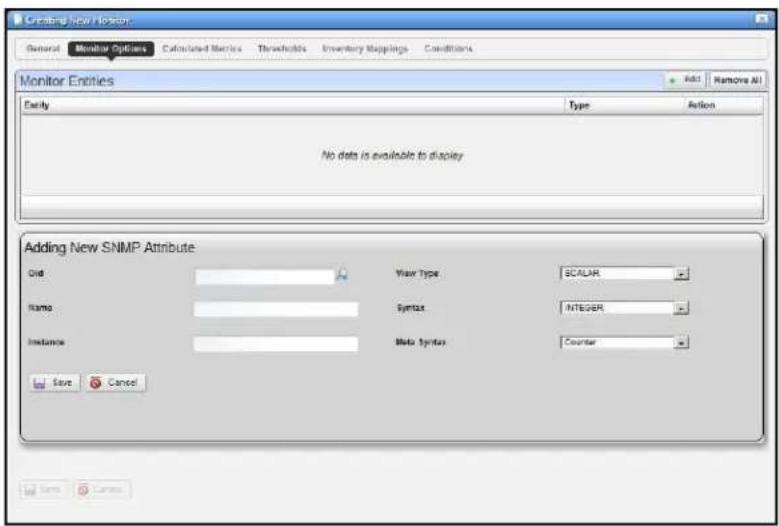
This panel contains the following properties:
- Old—The object identifier for this attribute
• Name—This attribute's name - Instance—SNMP instance. 0 for scalar or the ifIndex value for an SNMP column.
• View Type—Scalar or Column. - Syntax—Integer, Boolean, DisplayString, and so on.
• Meta Syntax—Counter, Gauge, and so on.
If you type in an OID and click the search button next to the OID field, the browser searches the MIB for the OID and fills in the other values if it finds the OID.
SNMP Interface Monitor
The SNMP Interface Monitor Entity editor supports the following entity types: group, equipment manager, port and interface. It also supports port and interface filters on groups and equipment manager objects.
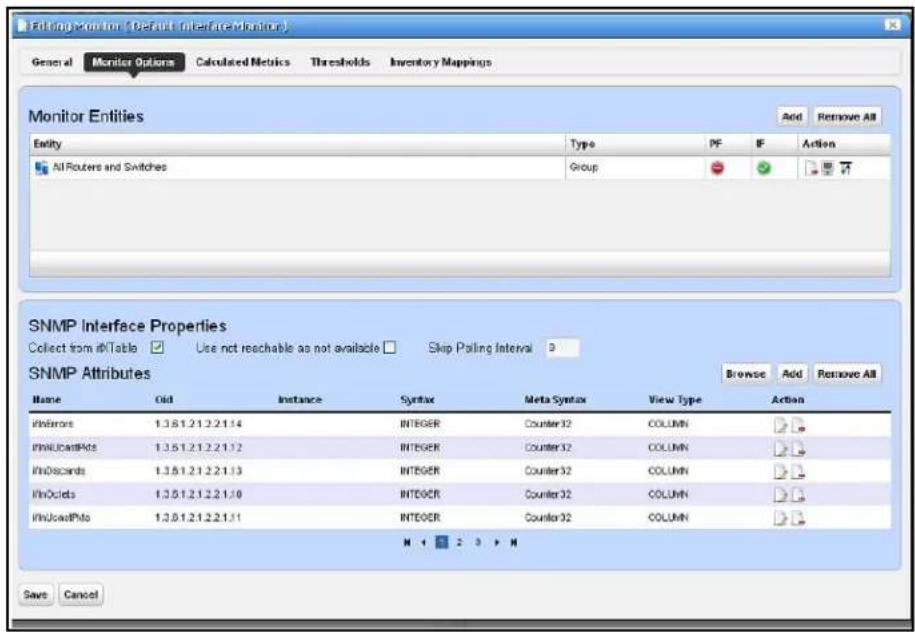
The PF and IF table columns indicate if a port filter or interface filter is configured for the entity. Click the icons on the right side of the list of Monitor Entities to configure filters. Clicking these buttons displays an interface configuration panel.
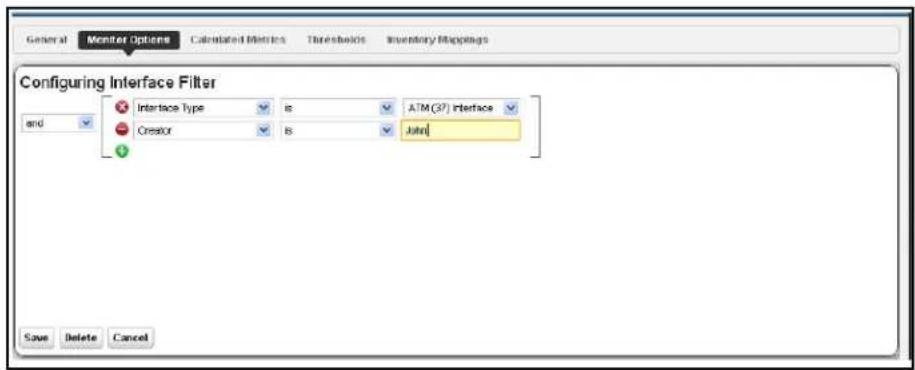
This panel lets you specify filter attributes for the port or interface filters you want to monitor. For example, if you select a device but only want to monitor active interfaces created by a particular user, then these filters do the job.
The SNMP Attributes panel is the same as described in SNMP Monitor on page 110.
Scheduling Refresh Monitor Targets
Because monitors can address targets that are members of dynamic groups, refreshing these ensures that group memberships are up-to-date. To do this, you can create or alter the schedule for Monitor Target Refresh. When executed, this updates monitors with groups as targets based on current memberships. This removes targets no longer members of a monitored group and adds new group members. A seeded schedule refreshes these every six hours, by default.
Tip: You can also Refresh Monitor manually by right-clicking in the Resource Monitors table.
Top [Asset] Monitors
NMS200 uses seeded, default Active Performance Monitors (APM) to display performance data in several categories. These portlets display the summary results of device monitoring, for example, the devices using the most memory.
![NETGEAR ProSafe NMS200 - Top [Asset] Monitors - 1](/content/2026/05/977508/images/3311331a2762b2db9bcb746bd06a445559cec6c1084e9883a8853c8217d35adb.jpg)
bar
Top Memory Utilization | Equipment | % Memory (%) | | :--- | :--- | | 192.168.10.226 | 80.5 | | 192.168.10.192 | 79.5 | | 192.168.10.227 | 80.5 | | 192.168.10.228 | 80.5 | | 192.168.10.234 | 89.00% | | 192.168.10.233 | 79.00% |Devices appear, ranked by the monitored parameter. Hover the cursor over a row's summary graph of % Memory and a popup graph of recent activity over time appears.
If you right-click a monitored item, you can select from menu items like those that appear in the portlet described in Managed Resources on page 133.
For some portlets (for example Top CPU Utilization, Top Ping Response and Top Memory Utilization), the right-click Performance menu items include Key Metrics (see Key Metric Editor on page 118). The menu can include Performance History.
- Performance History—When this appears, it can open a screen that by default displays the past 30 minutes of the selected portlet's monitoring.
![NETGEAR ProSafe NMS200 - Top [Asset] Monitors - 2](/content/2026/05/977508/images/0cf44ab221939f1ddd1c38cc4a10bff53b0b58cdd78822910036816741e53779.jpg)
line
| Time | Performance | | ------ | ----------- | | 13:32 | 97.68 | | 19:32 | 97.35 | | 23:32 | 97.32 | | 28:32 | 97.30 | | 33:32 | 97.70 | | 38:32 | 97.30 |Click the clock icon in the upper right corner of this screen to change the default interval. Click the green checkbox to confirm your selected interval and display the re-configured graph. The change only lasts while this screen appears. Close and re-open it, and the interval returns to the default.
Top Configuration Backups
This panel lists the most recent configurations backed up from devices. You can right click to Top Configuration Backups > View a configuration, or Share it. You can also Top Configuration Backups > Compare configurations with each other as described below. The pick list in the upper right corner lets you select not just the top 10 such backups, but the top 25, and so on.
Right-clicking a backup offers the same functionality described in Top [Asset] Monitors on page 113.
Top Configuration Backups > View
This lets you see the backed up configuration file. See File Management on page 138 for a description of this capability.
Top Configuration Backups > Compare
This lets you compare different configuration files. See File Management on page 138 for a description of this capability.
Dashboard Views
The Dashboard Views portlet lets you assemble several monitors into a single display, or dashboard. You can create and display dashboards by right-clicking items in Managed Resources, selecting Show Performance, or by selecting New in the Dashboard Views portlet.
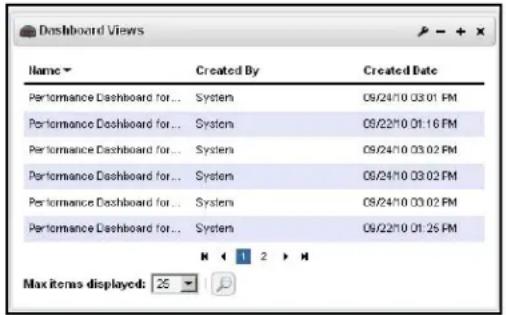
Right-click the listed dashboards, and a menu appears that lets you Copy and rename, Delete, Edit, or Launch a Dashboard View. You can also use the Sharing capabilities described previously to send a particular dashboard to a coworker. When you Edit a view, Dashboard Editor appears. It lets you select which monitors appear in the dashboard, the monitored entities, and attributes.
The expanded portlet offers similar capabilities. To make a monitor appear on a page, use the portlet described in Performance Dashboard on page 116.
Launch a Dashboard View
Launching a view lets you view the monitors active for a Dashboard view.
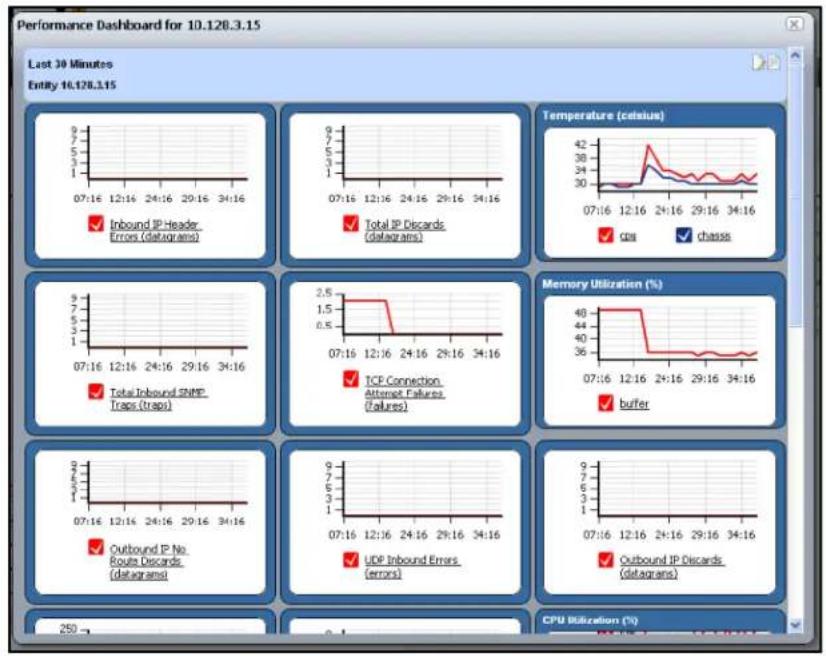
You can make Dashboards appear by selecting a device or devices in Managed Resources portlet, right-clicking and choosing Show Performance. To select more than one device, use the expanded Managed Resources portlet.
The first time you create a default dashboard for a single device, NMS200 saves it in the Dashboard Views manager. Invoking Show Performance for that device subsequently displays its default view.
The icons in the dashboard's upper right corner let you edit Dashboard Properties with the Dashboard Editor, or Save the dashboard with the other icon.
Tip: Hovering the cursor over the individual charts displays the charted attribute value(s) as popup tooltips. If a graph has multiple lines, the data points for different lines are charted at different times (NMS200 distributes polling to balance the load on its mediation service). Hover the cursor over the time when a line's data point appears, and that line's value appears as a tooltip.z
Performance Dashboard
This portlet lets you install and configure Dashboard Views as permanent displays rather than portlets. When you initially install this portlet, it appears empty. The message "No
Dashboard View has been set:" appears with a Select button. Click that button to open the Dashboard View Selection screen.

Dashboard View Selection
This screen displays any existing dashboards so you can select one for the Performance Dashboard you want to appear on a page in NMS200.
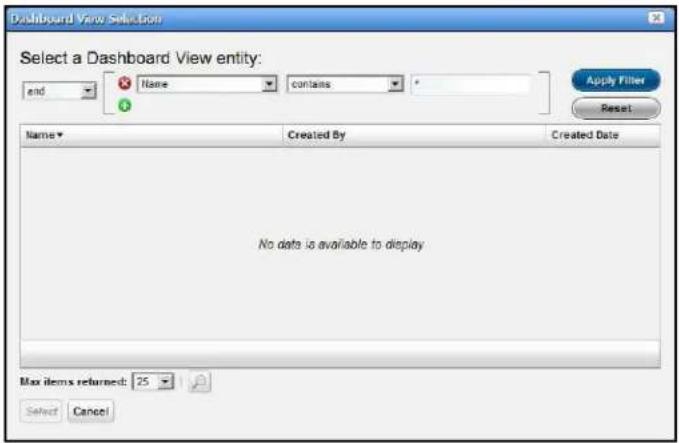
Use the filter at the top of this selector to limit the listed dashboards from which you can select. See Dashboard Views on page 115 for more about creating and configuring the views from which you select.
Dashboard Editor
When you Edit dashboard by right-clicking a resource in Managed Resources and selecting Show Performance, or create (select New) a dashboard from the Dashboard Views portlet,
an editor appears that lets you select and rearrange the monitor components of the dashboard.
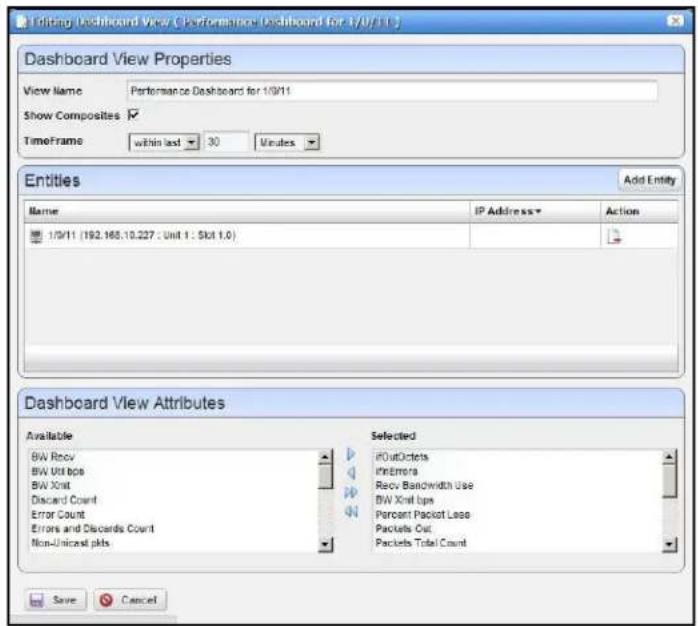
This screen has the following fields:
- View Name—The identifier for the dashboard. The default is “Performance dashboard for [IP address],” but you can edit this. This is what appears in the Dashboard Views list.
• Show Composites—Show attributes that are constructed from other attributes.
- TimeFrame—Use the selectors to configure the time frame for the performance measurement displayed.
- Entities—Select the equipment you want to monitor. When you right-click to Show Performance with resource(s) selected, those resources appear in this list.
- Dashboard View Attributes—Click the arrows between Available and Selected panels to select monitors for the dashboard. The Available Attributes list shows all the available attributes for that device based on its monitor affiliations. If you select none, a chart appears for each attribute that has data. This is the default. If the user moves some attributes to the Selected list then only charts for those attributes appear.
Key Metric Editor
When you select Show Key Metrics, this editor appears for devices that have such metrics. It displays the available Metrics, and a Chart panel where you can configure their display.
Metrics
This panel's display depends on the selected device.
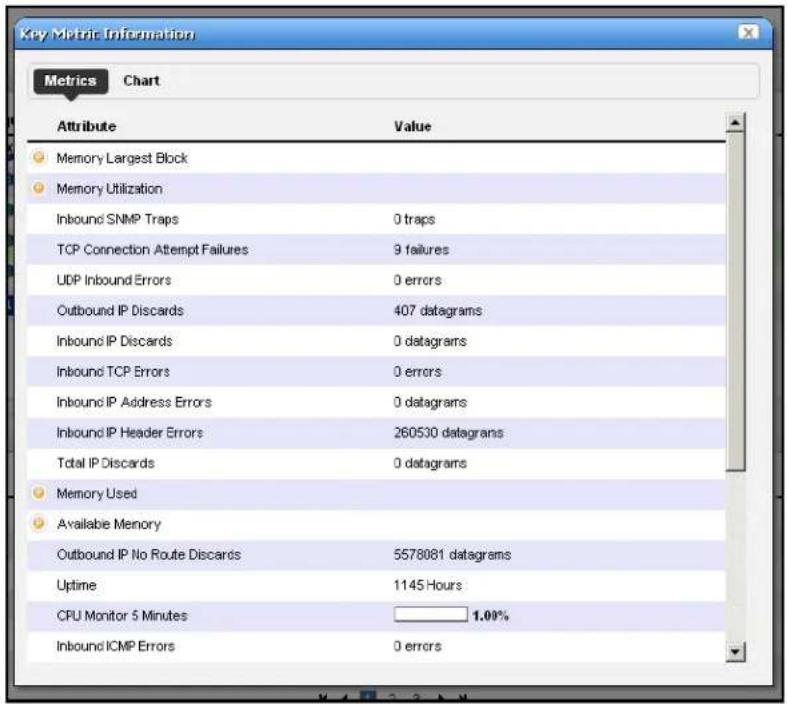
Chart
Click Chart to first select up to three metrics you want to graph, and the polling interval for the graph.
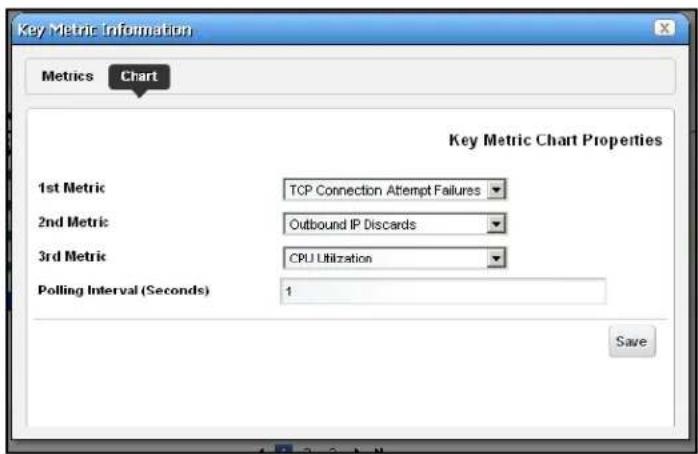
Then click Save, and the graph appears.
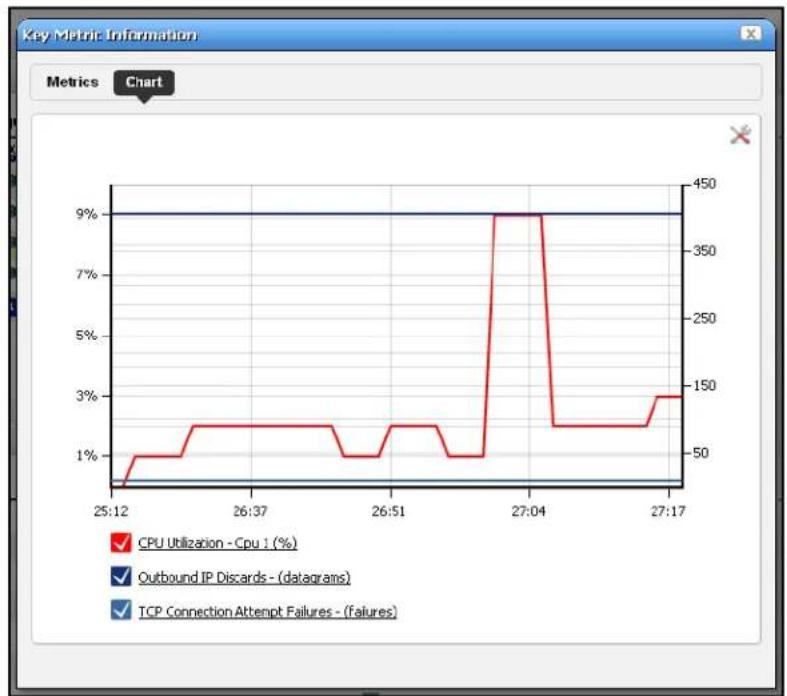
line
| Time | CPU Utilization - Cpu 1 (%) | Outbound IP Discards - (datagrams) | TCP Connection Attempt Failures - (failures) | | -------- | --------------------------- | ----------------------------------- | -------------------------------------------- | | 25:12 | 1% | 450 | 0 | | 26:37 | 1% | 450 | 0 | | 26:51 | 1% | 450 | 0 | | 27:04 | 9% | 450 | 0 | | 27:17 | 3% | 450 | 0 |Click the screwdriver / wrench icon in the upper right corner to return to the chart configuration screen.
The Resource management portlets let you manage devices you have discovered or created on your network.
Resource Management portlets let you view device-specific information, both general (name, type, location, contact) and technical (vendor, subcomponents, and so on).
This chapter contains information about the following portlets:
- Authentication
• Discovery Profiles - Managed Resources
- Ports
- Reports
Consult the following sections, and the appropriate portions of the NMS200 User Guide for more information.
Authentication
The authentication summary screen displays credentials used to communicate with and manage devices.
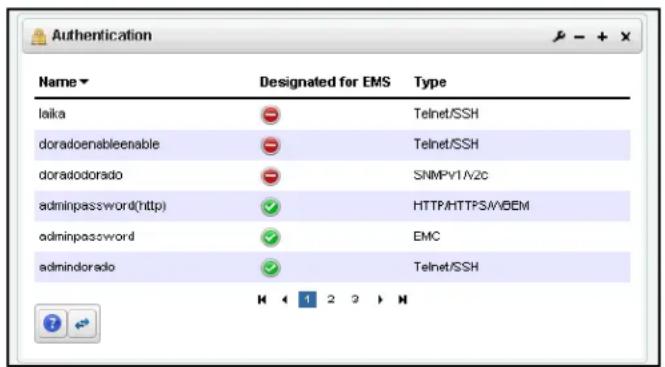
This portlet displays credentials used in discovery and communication with network resources. The Name column identifies the set of credentials, Designated for EMS means it is available for all users, and Type indicates the protocol for that authentication.
Functions common to many menus, in addition to the Import / Export and Sharing, include the following actions are available in the right-click menu:
- Delete—Deletes the selected authentication. If it is in use, an error message appears saying that deletion is not allowed.
- New—Opens Authentication Editor, where you can create a new authentication.
- Open—Open Authentication Editor where you can edit the selected authentication. You cannot change the Authentication Type.
Authentication Editor
You can right-click and select New or Open to create or modify credentials for your system. You can also Delete and Share with User from that right-click menu.
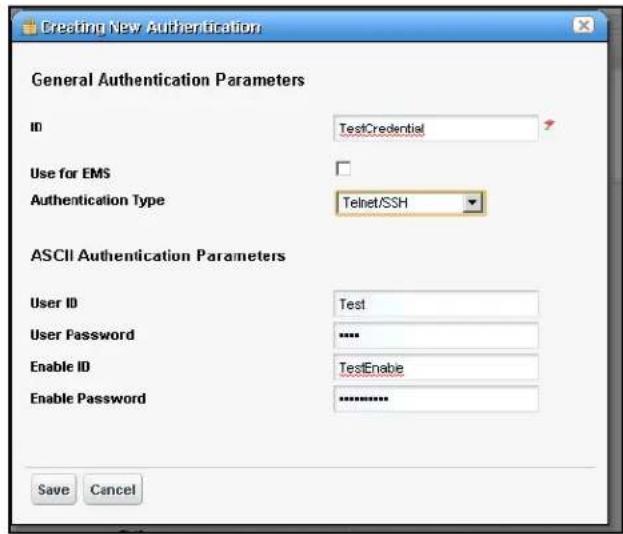
The fields that appear in this editor vary, depending on the type of authentication. The ID (name) for the authentication is mandatory. If you Add an existing authentication, for example to Discovery Profiles, you can also configure the Management Interface Parameters like Timeout, Retries, and Port used. If you have an authentication that works for multiple protocols (for example SSH or Telnet), you can also select the Protocol Type.
Expanded Authentication Portlet
The right-click menu in the expanded Authentication portlet offers Add / Remove Columns in addition to those in the summary screen (see Add / Remove Columns on page 40). This offers the same column setup as the summary screen.
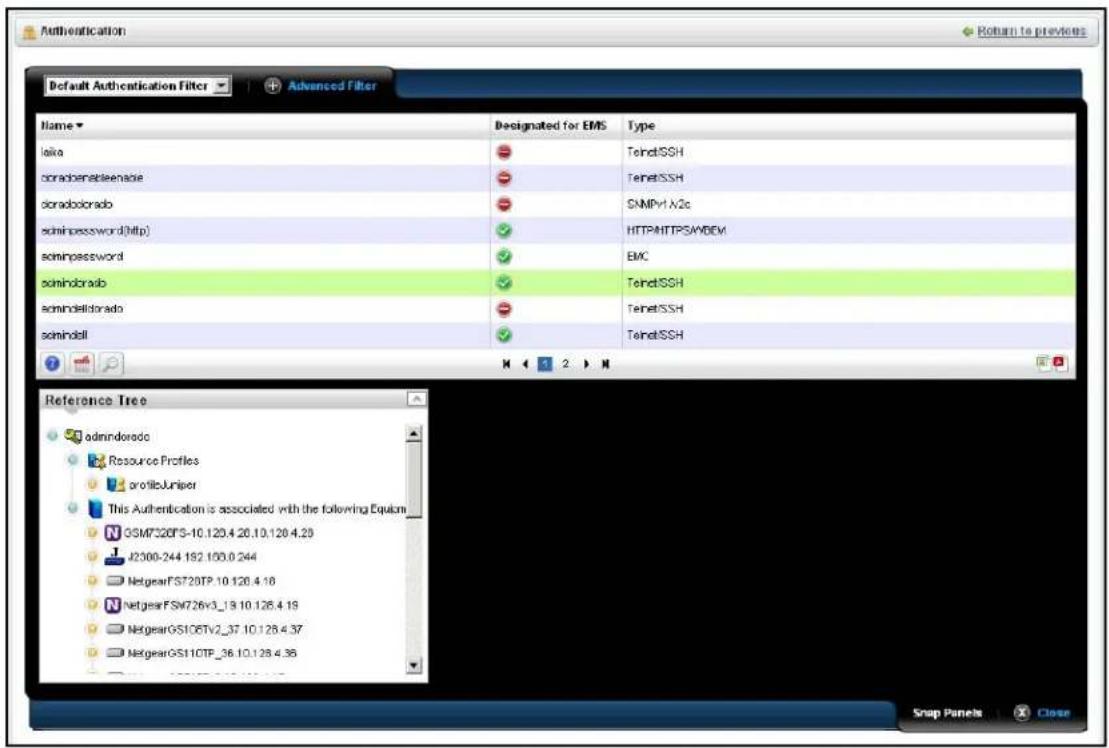
Authentication Snap Panel
When you select a listed authentication the Reference Tree Snap Panel displays a tree of that authentication's connections to Discovery profiles and equipment.
Resource Discovery
The following explains and demonstrates the features included in Resource Discovery. The guide assumes you have full access to all the features (full license) included in the web portal.
Here are the steps:
- Set up Discovery Profiles for the resources you want to discover.
- Execute the profile
- View the results in the Managed Resources portlet.
Tip: Quick Discovery executes the selected Default discovery profile.
Discovery Profiles
The discovery profiles set up equipment discovery for NMS200.
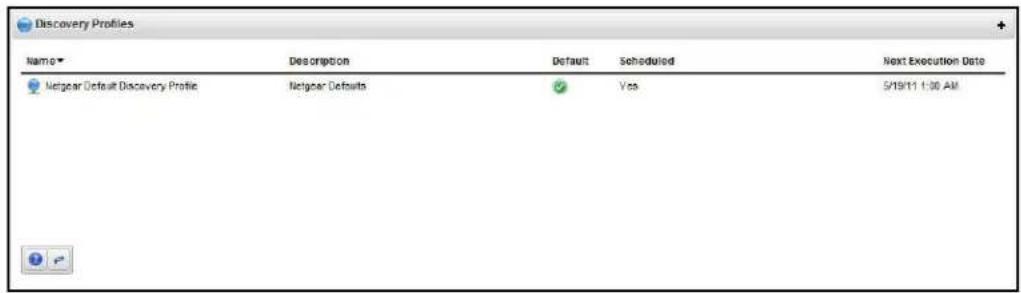
The summary view displays the Name, Description, Default (the green check indicates the default profile), whether the profile is Scheduled and Next Execution Date for scheduled discovery.
Menu Options
When you right-click a profile, the following menu options appear (in addition to the Common Menu Items):
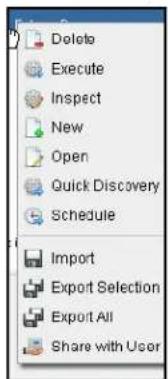
- Delete—Deletes a discovery profile, after you confirm deletion. A notification message appears when deletion is completed on the application server.
- Execute—Executes a discovery profile. This also produces an Audit trail (see Audit Trail / Jobs Screen on page 45).
- Inspect—Validate the profile's credentials, and that the device pings, and is licensed for discovery. Described in Inspect on page 128.
- New—Opens Discovery Profile Editor in new profile mode. (see General on page 125)
• Open—Opens Discovery Profile Editor. - Quick Discovery—Opens discovery wizard displaying network and authentications. Click the Execute button once you open this screen to quickly discover equipment. (See Network on page 126 for more about the screen this displays.)
- Schedule—Opens schedule editor where you can create and/or modify the schedule for a discovery profile's execution.
The remaining menu items include Import, Export Selection, Export All and Share with User.
Discovery Profile Editor
This editor lets you create or modify profiles. It has the following sub-sections:
- General
Network - Actions
- Inspect
- Results
Here are the steps it presents:
General
The General Panel collects all required data for a discovery profile. NMS200 validates each field, one at a time. Hints and tooltips appear if you hover your cursor near a field or label.
- General Parameters—Set the Name, Description and a checkbox to indicate whether this profile is the discovery default.
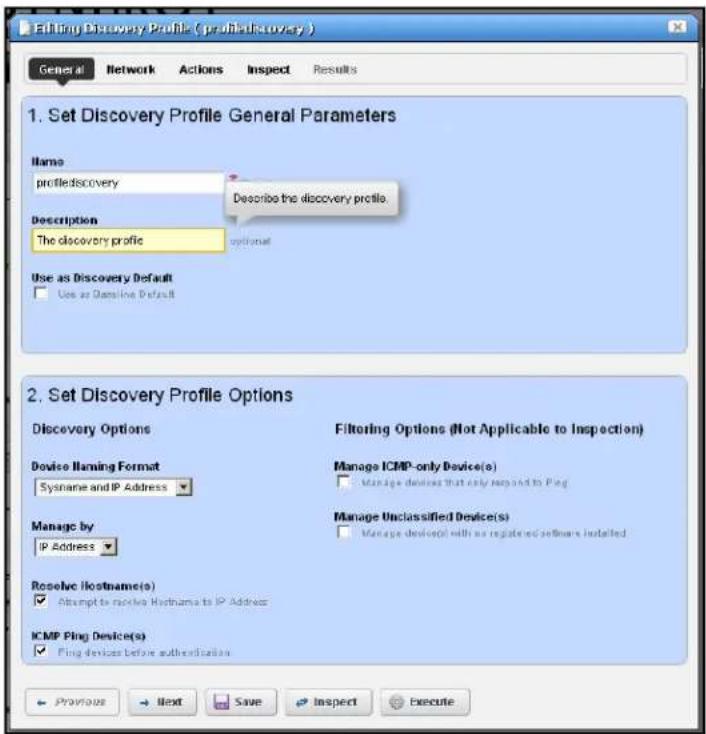
- Profile Options—Select the Device Naming Format (how the device appears in lists, once discovered), whether to Manage by IP address or hostname, and check whether to Resolve
Hostname(s), ICMP Ping Device(s), Manage ICMP-only Device(s), or Manage Unclassified Device(s). This last checkbox determines whether NMS200 attempts to manage devices that have no NMS200 device driver installed. If your system's license permits it, such management may be possible, but more limited than for devices with drivers installed.

CAUTION:
If your license limits the number of devices you manage, discovering such "generic" devices may count against that limit.
The buttons at the bottom of the Profile Editor let you navigate through this series of panels. Previous / Next move back and forth between screens, Save lets you preserve whatever stage you have configured, and close the editor, Inspect moves directly to the Inspect screen (described below), and Execute triggers the discovery profile and opens the Results panel, displaying message traffic between NMS200 and the device(s). Click the "X" in the top right corner of these screens to close them without saving.
Network
The Network Panel collects the network (IP range, hosts, and so on) and the authentication information for the discovery profile.
- After you click Next, the Network panel appears.
• Network Type and Addresses—Select the type of entry in the pick list (IP Address(es), CIDR Address, Hostname, SNMP Broadcast, Subnet).
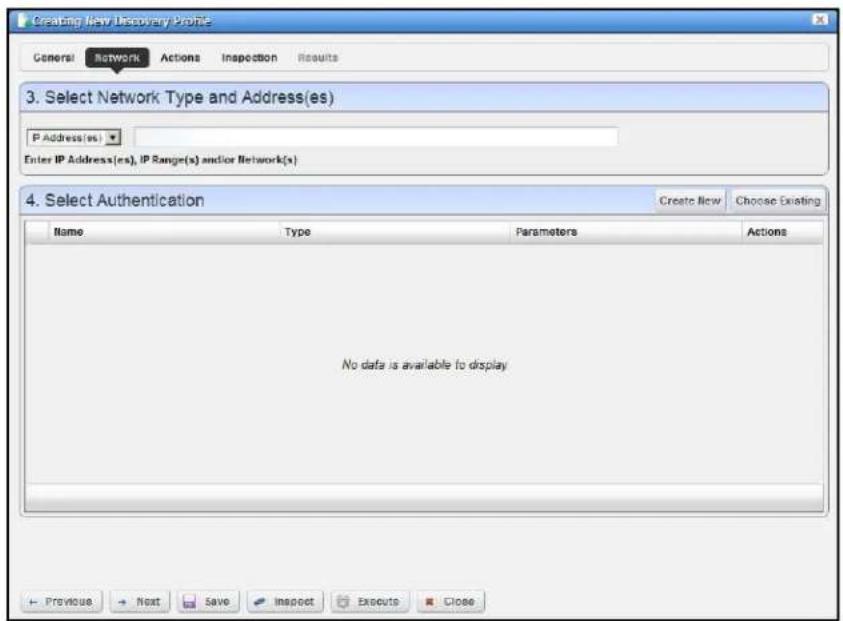
The tooltips in the data entry field tell what valid entries look like.
- Authentication—You can create new, or add existing authentications. See Authentication on page 121 for the way to create such authentications outside the discovery process.
Notice that authentications appear with Edit / Delete icons and Up / Down arrows on their right. The Edit icon opens the authentication editor. Click the arrows to arrange the order in which credentials are tried (top first). Ordering only applies when two credentials are of the same type.
Actions
- When you click Next, the Actions panel appears.
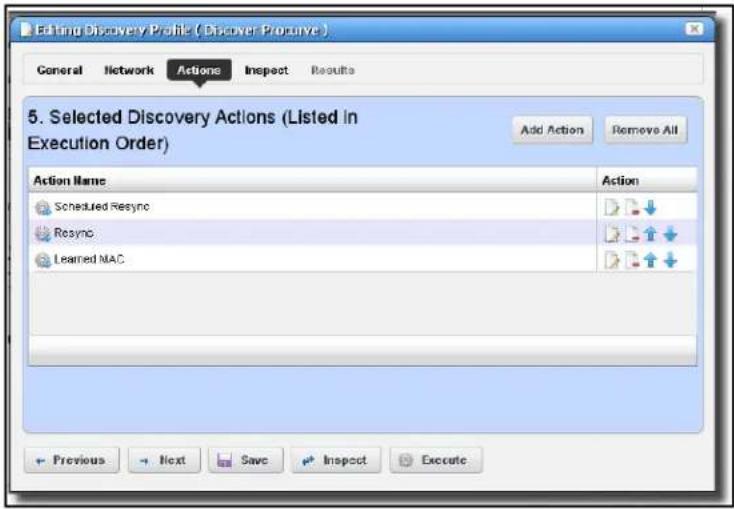
You can simply accept the default actions that appear here (like Scheduled Resync, Resync, and Learned MAC discovery) by clicking Next to the Inspect portion of discovery, or you can do the following:
- Add Action—This opens a screen with a selection list of available actions. Click Apply to select an action to add to the list for this profile.
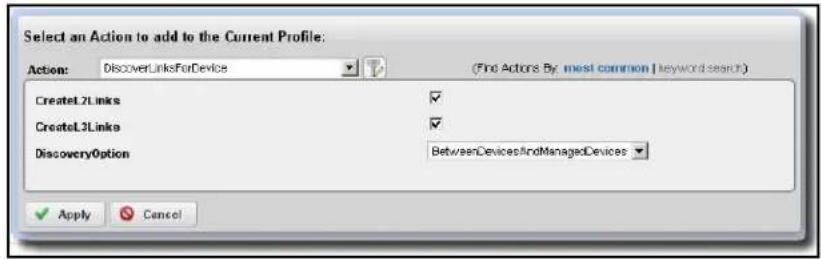
Notice the default for this screen displays the most common actions, but you can also click keyword search in the top right corner to display a search field instead of a pick list with the most common actions. The search results appear in the pick list. When you select an item, if it has parameters, they appear listed below that item. Use the checkbox(es) or pick list to configure these parameters, then click Apply to select this action as part of the profile.
- Edit, Delete, Move—These icons appear to the right of each action. If you Edit a profile with parameters, you can change them. The screen looks like the one that appears when you Add actions. Deleting actions removes them from the list, and the Move arrows help arrange the order in which actions appear listed, and are executed. The list of actions the profile executes goes from top-to-bottom.
Inspect
Using the Inspection Panel is an optional step. If you want to execute the profile after entering the required information on the General and Network panels, you can skip this step, and just click Execute at the bottom of the panel.
- In spect — This screen lets you preview the discovery profile's actions and access to devices. If you clicked Next rather than Inspect at the bottom of the previous screen, click Start Inspection in the top right corner of this screen to begin the inspection process that validates the device's credentials.
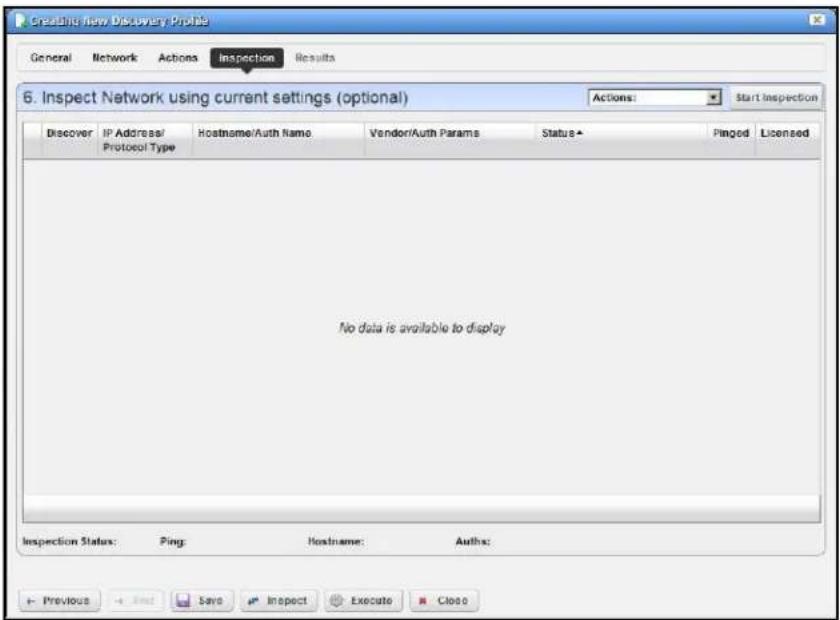
Notice that the Inspection Status fields at the bottom of the screen indicate the success or failure of Ping, Hostname resolution, and Authentications, and the Status column displays whether a valid authentication exists, whether it has been tested, and whether the test is successful.
When authentications are unsuccessful, you can click Previous to go to the Network screen and remove or edit them. You can also click the wrench / screwdriver "fix it" icon in
the Discover column to open an editor where you can revise the authentications for that device.
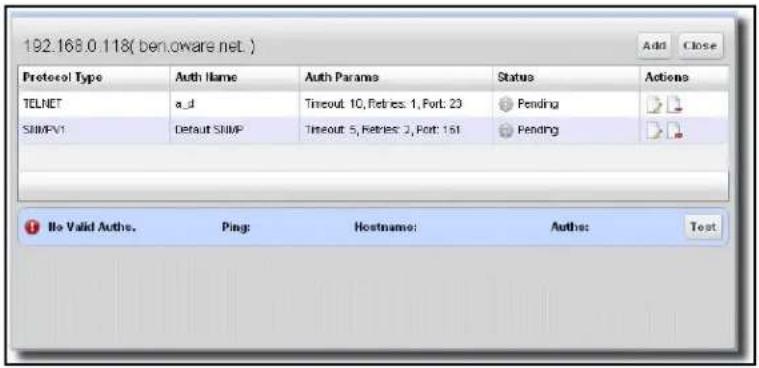
Clicking Add lets you create new authentications, Test lets you try them out, and Close closes this screen.
- Save—Click Save to preserve the profile. You can then right-click it to select Execute. If you select Execute from the profile editor, NMS200 does not save the profile to execute later.
Results
- Execute—Clicking Execute begins discovery, and the message traffic between NMS200 and the device appears on the Results screen.
This produces a standard Audit Trail / Jobs Screen screen displaying the message traffic. See also Audit Trail / Jobs Screen on page 45 for more about retrieving archives of such screens.
-
A message (Discovery Profile Execute is complete) appears in the Messages at the bottom left of the status bar.
-
Click the X in the top right corner of the discovery profile editor to close it.
Discovery Profiles Expanded
This larger view offers a Reference Tree snap panel where you can see the connection between a selected profile and the authentications and discovery tasks it includes.
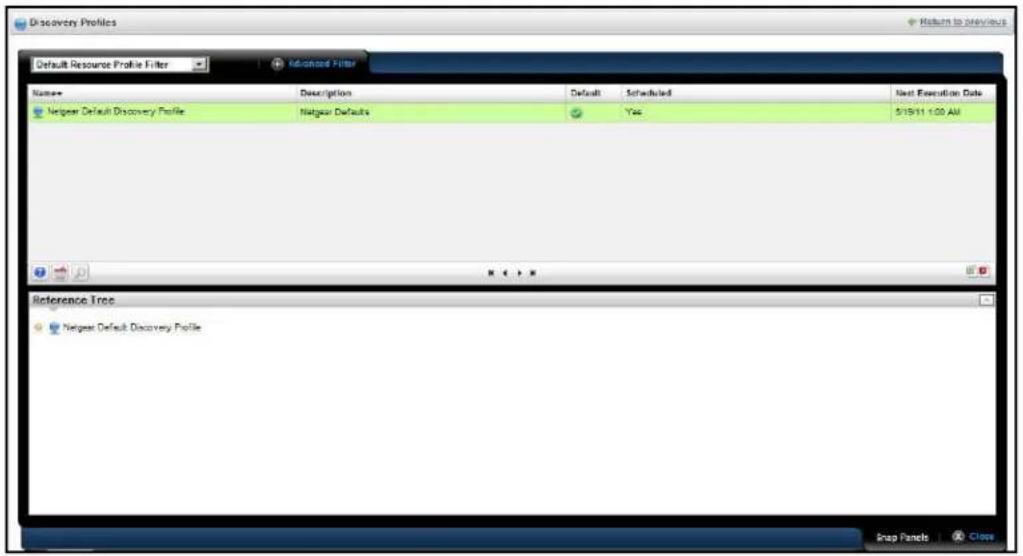
In addition to the right-click available in the summary screen, you can also Add / Remove columns (the same columns as the summary screen).
Managed Resource Groups
These groups make acting on several devices at once more convenient, making "Group Operations" possible. The summary screen displays columns describing the group Name, Type, and Icon. You can also right-click to do the following:
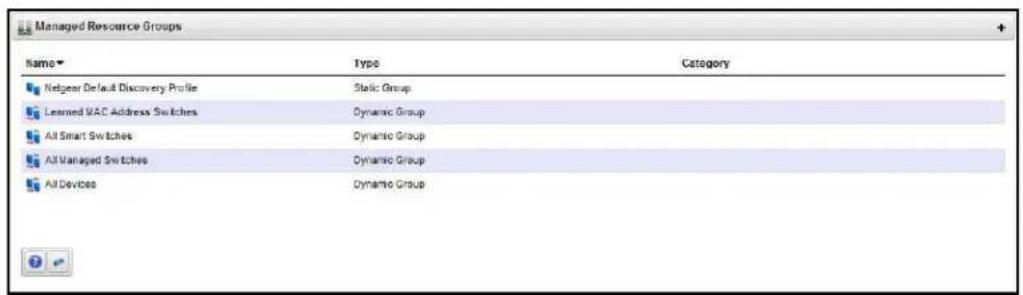
- Delete—Remove the selected group from inventory. The devices remain in inventory, but this removes the grouping.
-
File Management > Backup, Restore, Deploy—Lets you call on NMS200's NetConfig configuration file backup, restore and deploy capabilities. See How To Backup on page 141 for an example of the steps this follows. See also File Management on page 138 and more about deploying updates to the OS for the selected resource group. See Deploy OS on page 80 for details.
-
Links—Create a new link or discover links between members of the selected group, and others. See New Link on page 144 and Link Discovery on page 145 for details.
- New—Lets you make either a Static Group (one in which you select devices) or a Dynamic Group (one in which a filter selects devices). See details of these screens below.
- Open—This opens the same editors as New, populated with the information for the selected group.
- RC Inventory—Lets you perform some post-discovery tasks with devices discovered with the selected profile. These include:
Learned MAC-Perform a learned MAC discovery for discovered ports. An audit Job Viewer screen appears as this occurs. See Audit Trail / Jobs Screen on page 45.
Scheduled Resync—Performs a resync that queries the device to update discovered parameters. An audit screen appears as this occurs.
Update Resources—Lets you specify a resource type and attribute to update. An audit screen appears as this occurs.
Resync-Performs a resync that queries the device to update discovered parameters. An audit screen appears as this occurs.
- Share with User—Share the group with another user. See Sharing on page 43.
NMS200 no longer supports static groups that include members retrieved by (dynamic) filters. You can configure membership with dynamic resource groups that include group memberships as filter criteria. For example you can create a filter for members of ResourceGroupABC or members of ResourceGroupXYZ.
Expanded Managed Resource Groups
The expanded Managed Resource Groups screen lets you see the summary screen's groups with a Reference Tree snap panel that displays a selected group's relationship to its content devices.
Static Group
Selecting Static Group as the type to create displays a selector screen where you can Name and select a Category for the group, then search for available resources with a filter. Click Apply Filter after you have configured it, and a list of devices fitting its criteria appears. Select device(s) and click Add Selected, or simply click Add All to add the entire list to your static
group. Notice that you can continue to re-use this filter to list devices, and continue to select them.
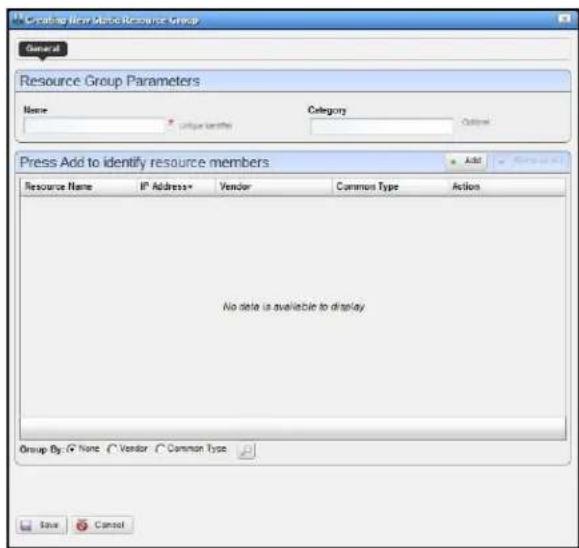
When you select a device, it no longer appears listed. When you click Done the subsequent screen displays all devices you have selected. You can click Add on this screen to return to the previous screen (or Remove All to delete the listed devices from the group). At the bottom of this screen, you can also elect to group devices by None, Vendor or Common Type (Switch, Router, and so on). These last two create "trees" with nodes for each vendor or type. You can also click the magnifying glass to search through listed devices. Clicking Remove All removes all devices in the group.
Click Save to preserve the group you have configured.
Dynamic Group
In contrast to Static Groups, Dynamic Groups do not let you select individual equipment. You simply configure a filter, and NMS200 creates the group on the fly. After you enter the Name and Category for the group, create the filter. To see what the group would look like, click Preview Group. This opens the Preview tab, concealing the General tab. To return to
General, click that at the top of the screen. Click Save to preserve the group configuration, or Cancel to exit without saving.
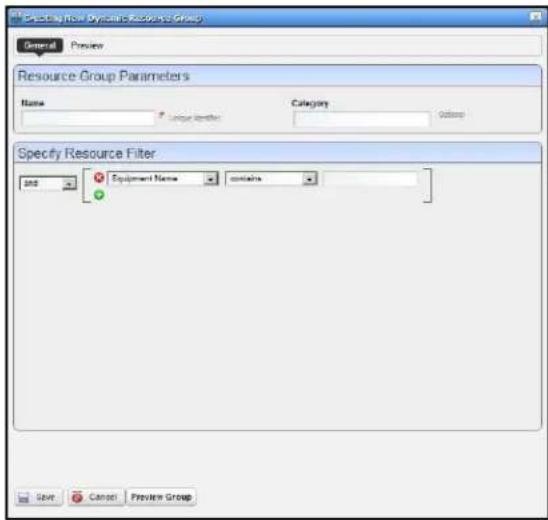
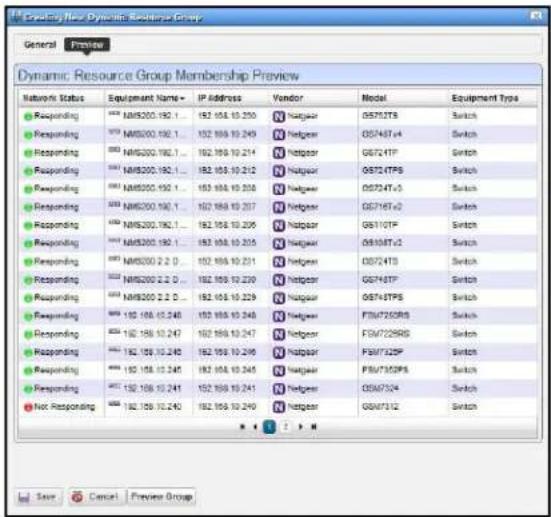
Managed Resources
The Managed Resources summary portlet displays the discovered devices on your network, their Network Status, Severity (of their highest recent alarm), Equipment Name, IP Address, and Vendor Name.
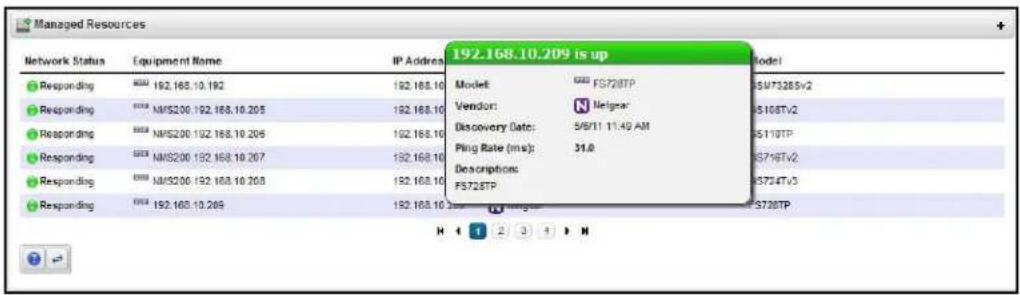
Hovering the cursor over a listed device's IP address produces a popup with its alarm status in the headline (both severity name and color), the % CPU, % Memory, and Ping. See the Managed Resources Expanded section for a description of columns that appear here.
You can schedule actions selected here in addition to executing them immediately. See Scheduling Actions on page 154 for more about that. Right-clicking a listed resource can display the following menu items:
- Open — This lets you use the following screens:
- General
- Authentication
- Management Interface
Click Save to preserve any changes made in these screens to NMS200's database, or Close to abandon any changes made in editor screens.
General
This screen displays the Name, Description, IP Address, Location, and Contact for the selected device. You can also check Manage by Hostname on this screen.
Authentication
This screen lets you select authentications (that originate in the portlet described in Authentication on page 121) for the selected device. Click Add Auth to select from available authentications. Click the minus icon to the right of a selected authentication to remove it.
Management Interface
This lets you configure the management interface for the selected device. Click Add Interface to configure a new one. First select the type (Telnet, SSH, and so on), then configure the IP Address, Port, Retries, Timeout and whether the interface is Enabled in a subsequent screen.
- Actions—These can include things like service discovery, or custom Adaptive CLI Activities you have configured. For some devices, the last sub-menu item (Adaptive CLI) opens a popup selector with a Find field at the bottom where you can review all available actions for the selected device. If you select one, you can click Execute to run it manually.
Note: Since menu items appear in alphabetical order, this may be in a different location, depending on the device vendor name.
- Delete—Remove the selected device from inventory.
- Details—Displays several panels with detailed resource information. These include Response Times graphs, Interfaces, Alarms, Ports, Latest Configurations. and a Details panel with model and other information.
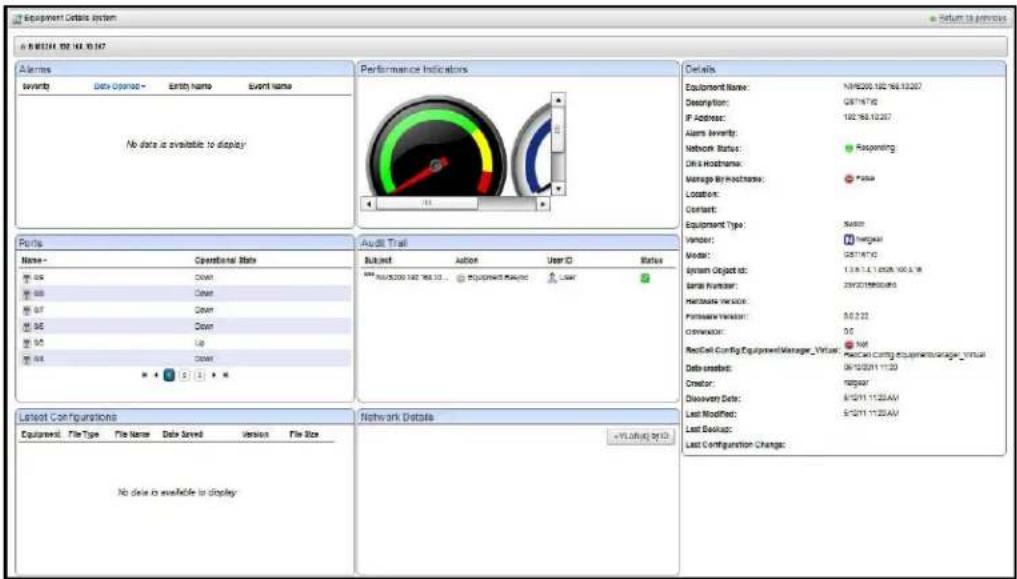
Notice that you can right-click listed interfaces, configuration files, and so on to perform more actions.
- Direct Access — This opens a sub-menu where you can select the type of available direct cut-thru access to the selected device. See MIB Browser on page 156 and Terminal on page 157 for more the about the available direct access options.
- Event Management —This lets you suppress or update alarms related to the selected resource. You can Start Alarm Suppression (Stop appears, once you have started suppression), Stop All Alarm Suppression, Schedule Alarm Suppression, View Active Suppression(s), and Resync Alarms (re-query the device for up-to-date alarm information. When you Start suppression, you must supply a reason in the subsequent screen, and a message appears confirming the suppression has started. Schedule presents a Parameters screen where you can describe the scheduled suppression and select a duration and any additional suppression targets. The Schedule tab on this screen lets you start suppression at a specific time and configure any recurrence, and termination (Stopping on) for the scheduled suppression. The termination can either be a date, a number of occurrences or Never.
Suppressed events / alarms do not appear in the Alarm display, but, unlike rejected events, the Event History screen can display a record of them.
- File Management —Lets you call on NMS200's NetConfig configuration file capabilities. You can view a current configuration file, compare it to any previous backup, backup, restore, deploy and import a config file. See File Management on page 138 for details.
Tip: You can select multiple devices by Ctrl+clicking them in the expanded portlet (Managed Resources Expanded). This lets you do these same tasks on more than one device. You can also perform many of these tasks on configured managed groups. See Managed Resource Groups on page 130.
- Links —Create a new link or discover links between members of the selected group, and others. See New Link on page 144 and Link Discovery on page 145 for details.
• Performance—Select from the following options:
Show Performance—This displays a dashboard with various performance metrics for the selected device. These can include packet counts, RTT (round-trip time) measurements, and CPU / Memory utilization graphs.
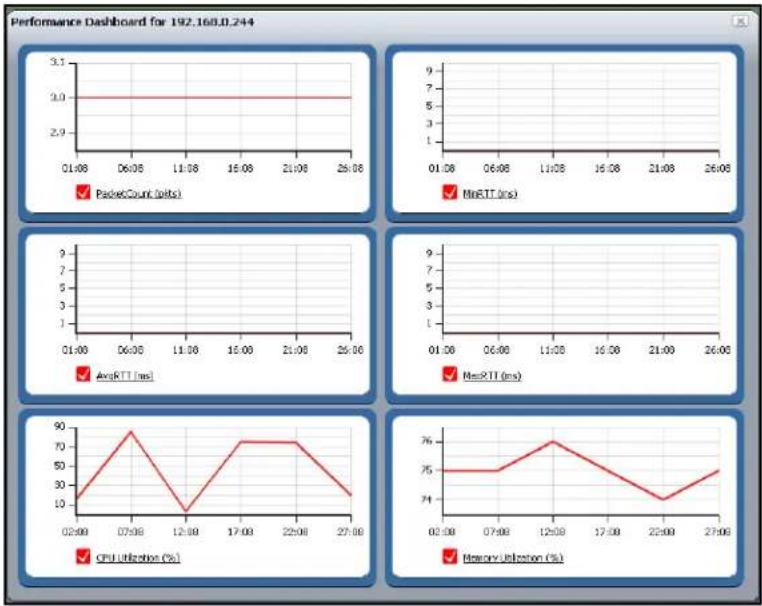
line
Performance Dashboard for 192.168.0.244 | Time | PacketCount (bits) | NetRTT (ms) | AvgRTT (ms) | CPU Utilization (%) | Memory Utilization (%) | |---|---|---|---|---|---| | 01:00 | 3.0 | 7 | 9 | 20 | 75 | | 06:00 | 3.0 | 7 | 9 | 80 | 75 | | 11:00 | 3.0 | 7 | 9 | 10 | 75 | | 16:00 | 3.0 | 7 | 9 | 75 | 75 | | 21:00 | 3.0 | 7 | 9 | 70 | 74 | | 26:00 | 3.0 | 7 | 9 | 20 | 75 |See Dashboard Views on page 115 for more about re-using and managing these capabilities.
Show Top Talkers—This displays a Top Talkers Dashboard of performance metrics for the selected resource. Use the icon in the top right corner to re-configure the default display. See Dashboard Views on page 115 and Top [Asset] Monitors on page 113 for more information.
Show Key Metrics—This lets you see available key metrics for the selected resource, and configure their display. See Key Metric Editor on page 118 for more information.
• Resource Groups—This lets you add the selected device to new Dynamic or Static groups, or to existing groups. See for Managed Resource Groups on page 130 more about this.
- Resync — This re-queries the device for more current information.
Tip: If you want to multi-select within listed items in a portlet, you must expand it.
Managed Resources Expanded
If you click the plus (+) in the upper right corner of the summary screen, this expanded screen appears. As in all such screens, you can limit what appears listed with the filters at the top of the screen. Select the filter from default, seeded filters with the pick list at the top left corner of the screen. You can also create your own custom filter by clicking Advanced Filter to the right of this pick list (see Filters on page 39 for more).
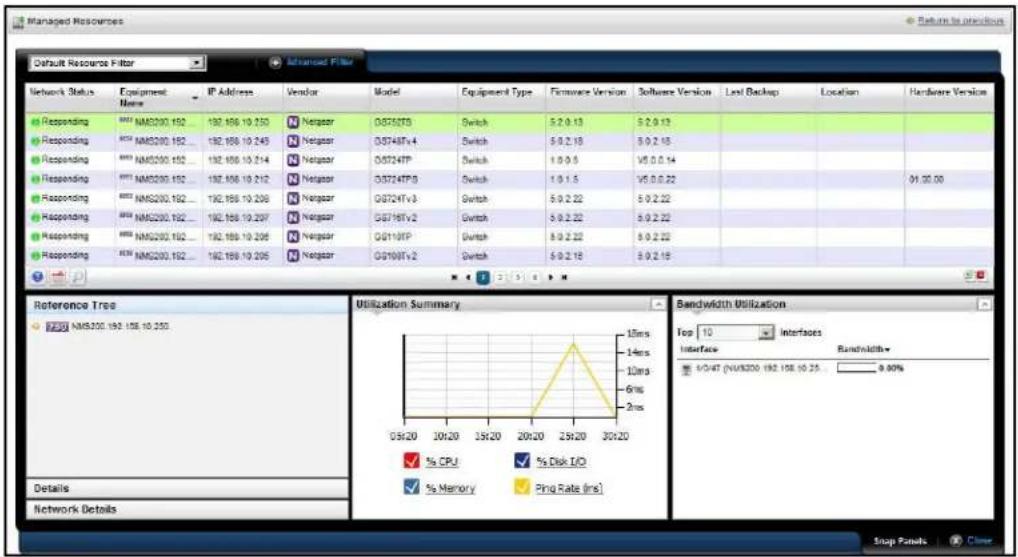
In addition to the right-click menu items available in the summary screen, this view lets you Add / Remove columns. The following are available columns:
• Network Status — The network status of the device.
• Alarm Severity—The highest open alarm for the device.
• Equipment Name — The name of the device.
• IP Address—The IP address of the device.
• Vendor Name — The vendor for this device.
• Model — The model of the device.
• Equipment Type — The type of equipment.
- Firmware Version — The firmware version of the device.
• Software Version — The software version of the device.
- Last Backup — The device's last backup date.
- Location Name — The device's location.
• Hardware Version — The hardware version for the device.
- Backup Result — The result the device's last backup.
- Restore Result—The result the device’s last restoration.
This screen has several snap panels, some compressed “windowshade” style. Click the title bar for these snap panels to toggle expand / collapse. These display information about the device selected in the list at the top of the panel.
Reference Tree
This displays the device and connected components, tree style.
General Details
This includes information about the Equipment Name, Vendor, Location, Contact, Icon, and its Last Modified and Discovery Date.
Settings
This includes the system Object Id, Date Created (that is, discovered), Creator (the user who performed discovery), Install Date, Administrative State (Locked [Device use is prohibited] Shutting Down [Only existing users can use the device] Unlocked [Normal use of device is permitted]), Operational State (Disabled [Inoperable because of a fault, or resources are unavailable] Enabled [Operable and available for use] Active [Device is operable and currently in use with operating capacity available to support further services] Busy [Operable and currently in use with no operating capacity to spare]).
Properties
This includes the IP Address, DNS Hostname, Firmware Version, Hardware Version, Model, Serial Number, Software Version, Managed by Hostname (if active, this resolves a DNS name rather than use an IP address to manage this resources), and Equipment Type information.
Utilization Summary
A graph of the device utilization, typically for CPU, Disk I/O, Memory and ping rate.
Bandwidth Utilization
A graph of the device's bandwidth utilization. Notice that you can change the number of top interfaces graphed, when this is applicable.
File Management
In addition to letting you back up and restore configuration files, and deploy firmware updates to devices, this menu manages viewing and comparing configuration files backed up from the selected devices. Details about these capabilities appear below.
Compare and View options have the following limitations:
- If you select a config file that is a single file, without any historical precedent, no comparison option appears on the menu since the selected version does not have a prior version.
- If you select a single config file of version two or higher, comparison is an option. When selected, Redcell automatically compares against the prior version for that device and file name.
• If you select two config files of any version, compares is between those two versions.
• If you select three or more config files, no comparison option appears.
• The View option appears for a single selection only.
The file management menu contains the following:
This opens a panel displaying the configuration file's contents. Use the browser's Find function to locate specific text within the Config File. You can also select and copy text within this screen.
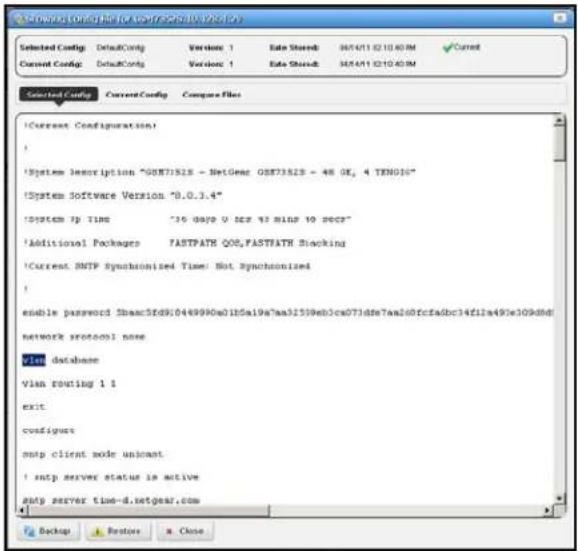
Notice that Selected Config and Current Config version and storage dates appear at the top of this screen.
You can also compare two different configurations (Selected Config and Current Config) in the tabs that appear on this screen. with the Compare Files tab at the top.
Finally, you can Backup and Restore configurations and Close the screen with the buttons at its bottom.
- Compare Current vs. Previous—You can compare configurations by right-clicking a device, then selecting Compare. If you right click a single device, then the comparison is between the latest and next-to-latest backup.
- Ctrl+click to select two different devices before you Compare.
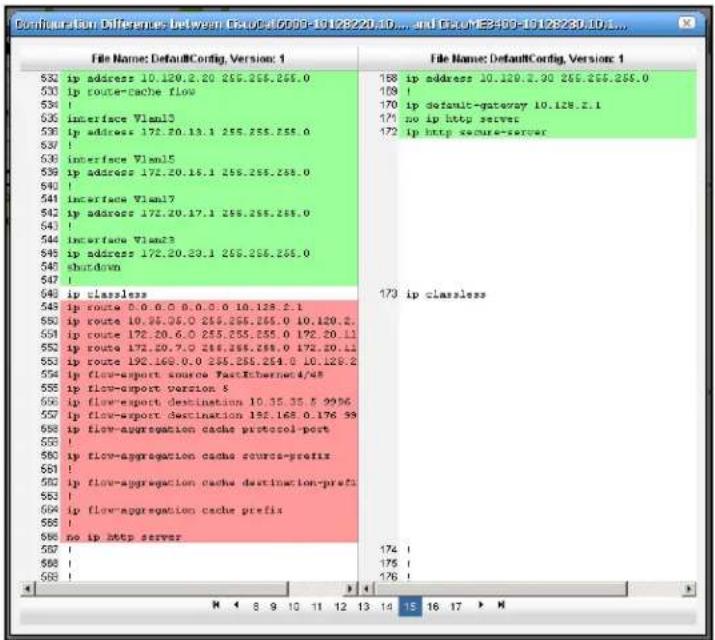
The comparison screen appears with the configurations side-by-side (note the file names in the title bar of this screen). Lines that differ between the two configurations appear highlighted green. Lines that are missing in one, but that appear in another appear highlighted red. Added lines appear highlighted in yellow. Use the right/left arrows to page through the side-by-side comparison.
Tip: You can use the browser's "Find" function (typically initiated by Ctrl+F) to locate text within these views.
- Backup / Restore —Select these to backup or restore a configuration file. See How To Backup on page 141 or How To Restore on page 142 for step-by-step instructions. You must have already configured an FTP server (see Netrestore File Servers on page 30) before backup or restore is possible.
- Deploy —Select this option to deploy an OS Image (firmware). See OS Images on page 77 for instructions about getting such firmware, and Deploy OS on page 80 for information about the deployment process.
- Import Config File —This opens a screen that lets you select a locally-accessible file to store, view, compare and deploy. See Configuration Files on page 143 for the way to export configuration files.
Tip: You can see configuration files in the Latest Configurations portion of the Details screen for a device or in the Configuration Files or Top Configuration Backups portlets.
How To Backup
NMS200 simplifies backing up devices so you always have their configuration files, even if the one on the device becomes corrupted or out-of-date.
Tip: You can back up several devices at once for what amounts to a "group operation." Select more than one device by Ctrl+clicking in the expanded portlet, then right-click as outlined below. You must expand portlets to multi-select.
Here are the steps to back up a device:
- Make sure you have configured an FTP or TFTP server to handle the backup. See Netrestore File Servers on page 30.
- Right-click a device in the Managed Resources portlet.
- Select File Management > Backup.
- Configure the subsequent Back up Device screen.
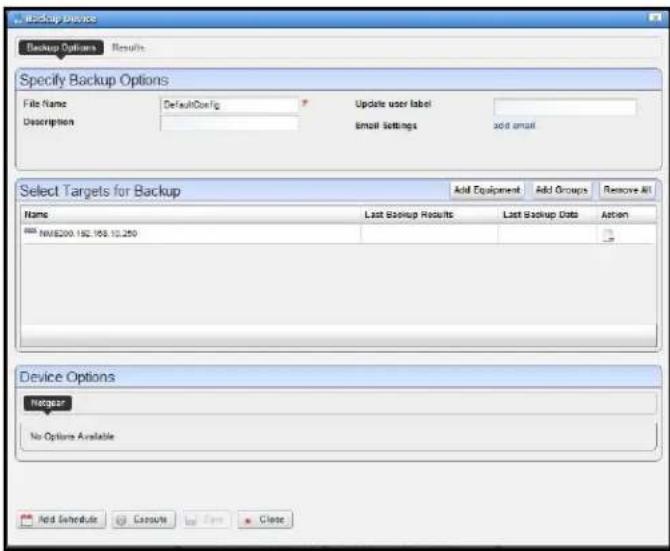
This screen lets you configure the following:
• File Name—A text identifier for the file
• Description—A text identifier for the file
- Update User Label —A text identifier for the file
- Email Settings —Click add email to configure an email notification about this backup.
- Select Targets for Backup—This screen defaults to the device you selected in Managed Resources. You can also click the Add Equipment to add individual devices, or Add Groups to add groups, or Remove All to manage devices that appear in this list of targets.
- Device Options—This portion of the Backup Options screen displays detailed configuration options available for the selected target. For example, you could select between backing up the running-config and the startup-config.
- Click one of the buttons at the bottom of the screen to initiate the next backup action.
Add Schedule opens the scheduling screen to let you automate the backup you have configured on a specified date, time, or repetition. See Scheduling Actions on page 154.
Execute performs the backup immediately. The Results tab in this screen opens, displaying the message traffic between NMS200 and the device(s). See Audit Trail Portlet on page 46.
Save preserves this configuration without scheduling or executing it.
Close closes this screen without saving the configured restoration.
How To Restore
The following are the steps to restore a config file to a device:
-
Make sure you have configured an FTP or TFTP server to handle the backup. See Netrestore File Servers on page 30.
-
Right-click a device in the Managed Resources portlet.
-
Select File Manage ment > Restore.
-
Configure the subsequent Restore Device screen.
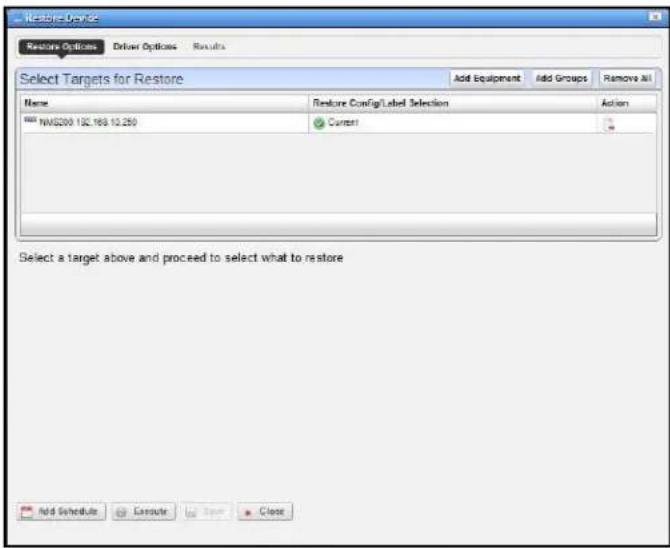
This screen lets you configure the following:
- Select Targets for Restore—This portion of the screen lets you Add Equipment, Add Groups, or Remove All target devices. Listed targets and their Restore Config / Label Selection. Click the icon in the Action column to remove the listed target.
- Select what to apply to the selected target—This portion of the screen lets you select either a label (like Current, Compliant and so on), or Restore a specific Configuration File. The latter lists available files and lets you click to select. Click Apply to configure the selected target, or Apply to All to configure all targets.
- Click one of the butt ons at the bottom of the screen to initiate the next backup action.
Add Schedule opens the scheduling screen to let you automate the restoration you have configured on a specified date, time, or repetition. See Scheduling Actions on page 154.
Execute performs the restoration immediately. The Results tab in this screen opens, displaying the message traffic between NMS200 and the device(s). See Audit Trail Portlet on page 46.
Save preserves this configuration without scheduling or executing it.
Close closes this screen without saving the configured restoration.
Configuration Files
One place backed up configuration files can appear in this portlet. Right-clicking offers you the following options (all options listed may not be available):
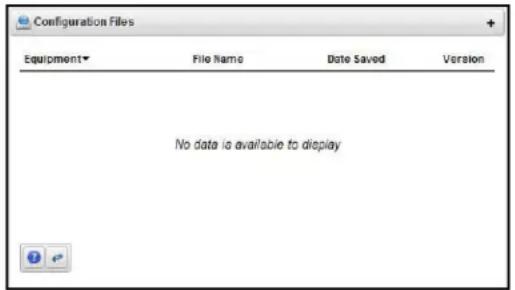
- Archive—This exports the selected configuration file, then deletes it from NMS200's database. You must confirm you want to delete this file before the action proceeds.
- Compare to Label / Compare Selected — If you have only selected one configuration, this menu item (Compare to Label) compares the selected configuration files to one of the following labels: Change Determination, Compliant, Current, and displays the result as described in the comparison screen as described in File Management on page 138.
- Delete—Removes the file from the NMS200 database without exporting it.
- Export—When you select and confirm this option, NMS200 writes the file to the browser's selected default download location.
• View—Opens the file viewer described in File Management on page 138.
Tip: You can use the browser's "Find" function (typically initiated by Ctrl+F) to locate text within the view.
- Restore—Lets you restore a selected config. See How To Restore on page 142.
- Aging Policy—Opens the Aging Policy selector. See Database Aging Policies (DAP) on page 19 for more about these.
The Expanded portlet lets you filter the list of files, and displays the file Type, Description, and Size in columns. To see the most recent configuration files, see Top Configuration Backups on page 114.
New Link
When you create a new link, the Link Details screen appears where you can configure the link.
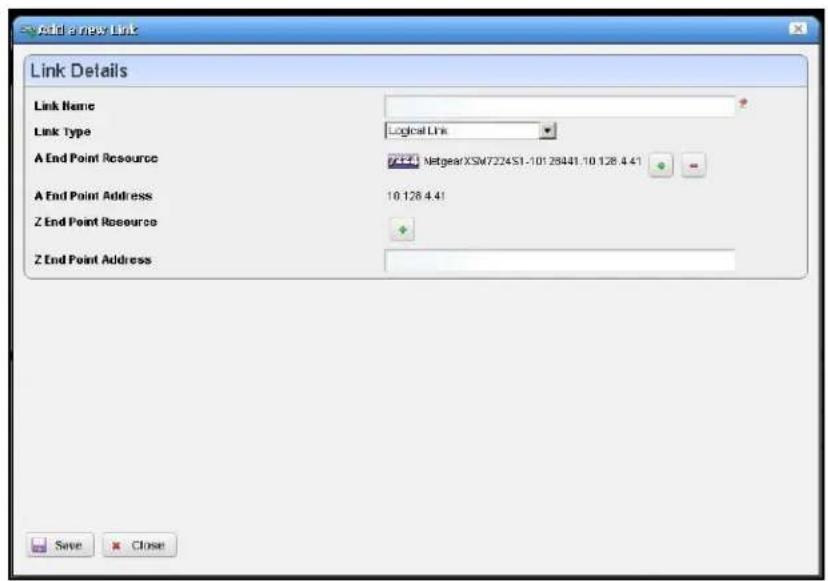
This screen has the following fields:
• Link Name — A text identifier for the link.
- Link Type — Select the type of link from the pick list.
- A End Point Resource / Address—Click the plus (+) to select a resource for one end of the link. When you right-click a selected resource, it automatically appears here. Click the minus (-) to remove it.
- Z End Point Resource / Address—Click the plus (+) to select a resource for one end of the link. When you have selected two resources, they automatically appear as A and Z endpoints.
Tip: Remember, you can only multi-select in the expanded version of the portlet.
Link Discovery
This is an automated network link discovery feature that you can initiate from individual devices in the Managed Resources portlet, or with the Link Discovery button on the home screen. Links discovered can appear in the screen described in Visualize My Network on page 85.
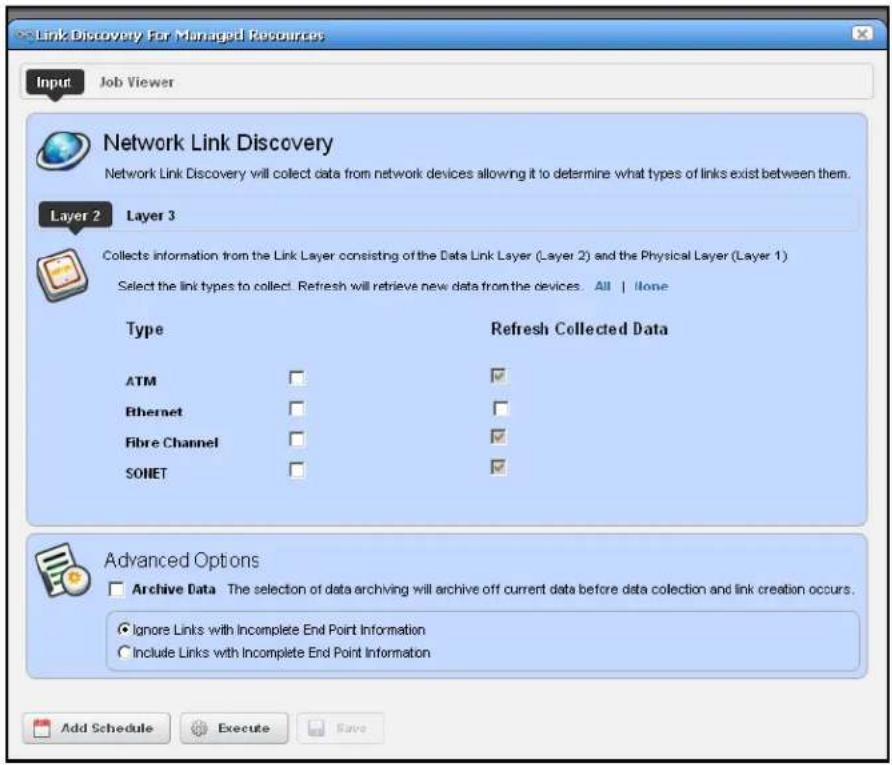
Check the type of links you want to discover or from which you want to refresh collected data. Other options available on this screen include the following:
Advanced Options
- Archive Data—Checking this archives current data before collecting information about and discovering links.
- Ignore / Include Links with Incomplete Endpoint Information—Select the option best suited for your network.
Click Add Schedule to schedule link discovery, or Execute to run it now. The Job Viewer tab in the link discovery screen displays the message traffic between NMS200 and the device(s). See Audit Trail Portlet on page 46 for more about Job Viewer screens.
Equipment Details
This screen lets you "drill down" to display equipment details for resources. You can see it by selecting Details in the right-click menu for the Managed Resources portlet.
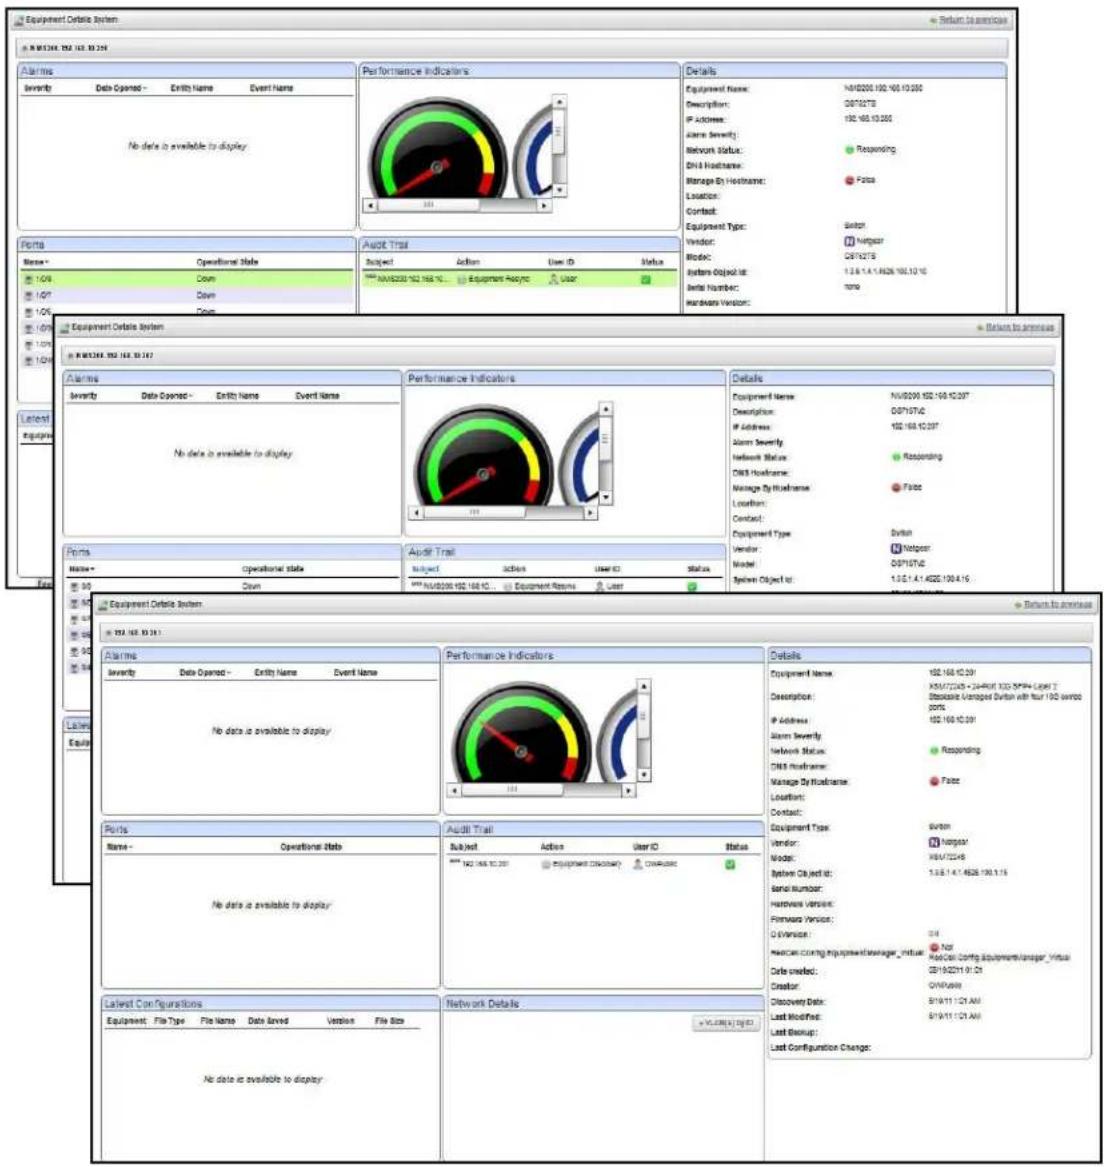
The Equipment Details screen can have the following sub-panels:
• Performance Indicators
- Interfaces
• Top Configuration Backups (see Top Configuration Backups on page 114)
- Alarms
- Ports
Details
You can also right-click to open further Details screens about some subcomponents like Interfaces and Ports. These display a Reference Tree (like Snap Panels (Reference Tree) on page 41) too. You can even right-click nodes in that reference tree to drill down to additional details.
Tip: Notice the breadcrumb trail at the top of the Equipment Detail panel tracks the levels through which you drill down. You can click a level that appears in this trail to return to a previous screen. If you click Return to previous in the upper right corner of the screen, you will return to the original screen from which you selected the basic equipment.

Performance Indicators
These gauges display CPU and Memory Utilization. The numbers indicate percentage of capacity. These rely on Flash.
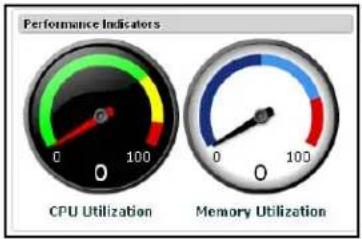
gauge
| Metric | Value | | ------------------ | ----- | | CPU Utilization | 100 | | Memory Utilization | 100 |Interfaces
This panel displays interfaces on the selected device. Notice that you can right-click these to display additional details, or to share this list with another user. You can right-click to Share an interface's information, or to open a Interfaces > Details screen.
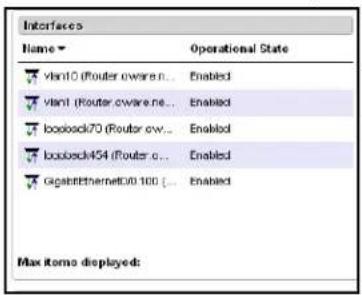
Interfaces > Details
The details available for interfaces can include a Reference Tree panel that displays the interface's root equipment and its sub-components. The Details panel also appears with the following fields:
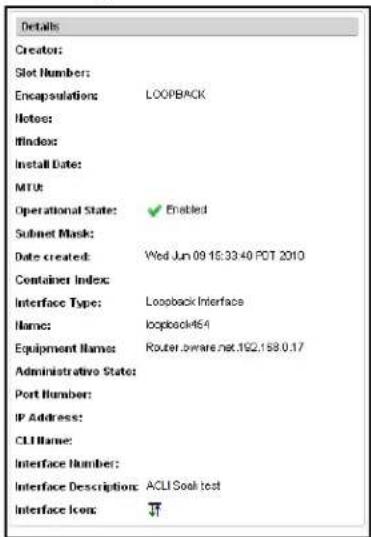
- Creator—The user that created this interface.
- Slot Number—This interface's type. For example Loopback.
• Name—The interface name.
• Equipment Name—The name of the equipment that contains the interface.
• Administrative State — The state of the interface.
• Port Number—The port for this interface.
• IP Address—The interface's IP address.
• CLI Name—The command line interface name.
• Interface Number — A numeric identifier for the interface.
• Interface Description — A text description for the interface.
• Interface Icon — An icon for the interface.
Alarms
The alarm panel in Equipment Details displays alarms connected to the selected equipment. You can right-click these and Acknowledge, Clear, or Email the selected alarm. You can also Assign User and Share with User.
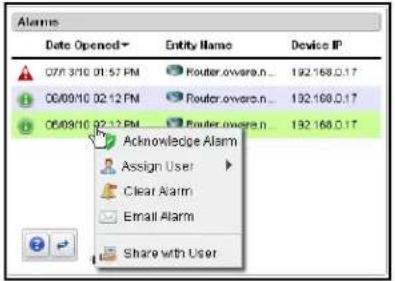
Hover the cursor over an alarm and a popup appears with that alarm's details just as described in Alarms on page 51.
Ports
This displays the equipment's ports. If you hover the cursor over a port, you can also see the Port Type (for example, Fast Ethernet, T1, and so on), Name (port identifier), and Operational State (Up, Down). A column in the summary portlet lists what Equipment the port belongs to.
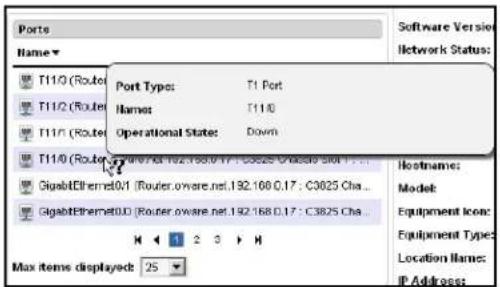
Tip: If the Ports portlet is on the same page as the Managed Resources portlet, selecting a device in Managed Resources makes its ports appear in the Ports portlet.
Ports > Details
You can right-click to Share port information, or to open a Details screen for the selected port. This includes the device's Reference Tree so you can see this port in relation to other parts of the device. It also includes a Details panel that can include the following fields:
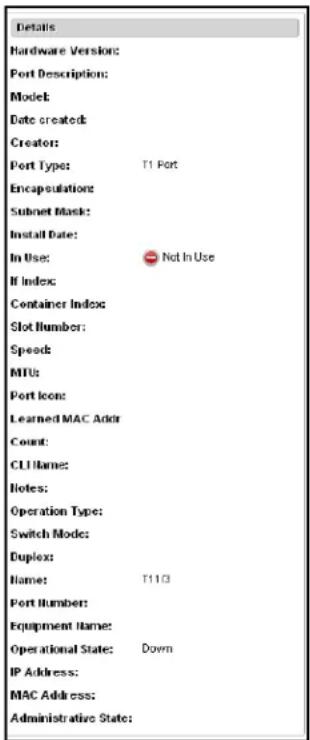
- Hardware Version — The port's hardware version
• Port Description — A text description of the port.
• Model—A model number.
• Date created—When the port was discovered. - Creator—The logged-in user who discovered it.
- Port Type — The port's type (T1, Fast Ethernet, and so on).
• Encapsulation — The port's encapsulation. - Subnet Mask — The port's subnet mask.
• Install Date — The port's installation date.
• In Use — An indicator use.
• IF Index—The SNMP MIB designation for the port. - Container Index—The SNMP MIB designation for the port's container.
-
Slot Number — The port's slot number.
• Speed — The port's speed.
MTU—The port's MTU. -
Port Icon—The port's configured icon.
- Learned MAC Addr — The port's learned MAC address.
• Count—The port's count. - CLI Name—The port's command line interface name.
• Notes—Any notes recorded about the port.
• Operation Type — The port's operation type.
- Switch Mode — Is the port in switch mode?
• Duplex—Is the port in duplex mode?
• Name—The port's name.
• Port Number—The port's number.
- Equipment Name — The port's equipment name.
- Operational State—One of following possible values describing the availability of the resource.
- Down / Disa bled—Inoperable because of a fault, or resources are unavailable.
- Enabled—Operable and available for use.
- Active—Device is operable and currently in use with operating capacity available to support further services.
- Busy—Operable and currently in use with no operating capacity to spare.
• IP Address—The port's hardware version
- Hardware Version — The port's hardware version
- MAC Address—The port's Media Access Control (MAC) address.
• Administrative State — One of three descriptive values. The options are:
- L ocked — Device use is prohibited.
- Shutting Down—Only existing users can use the device.
- Unlocked — Normal use of device is permitted.
Details
This panel displays detailed information about the equipment selected. This can include the following fields:
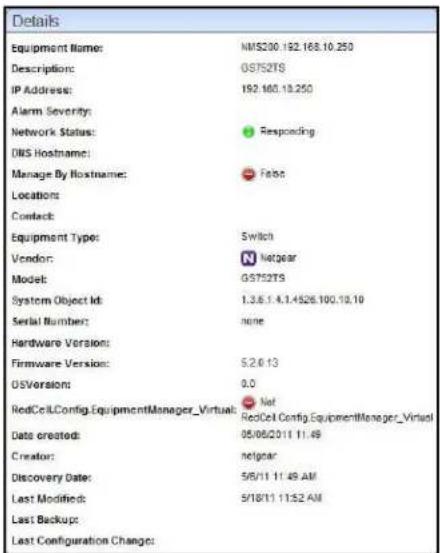
- Serial Number — The selected resource's serial number.
- Last Configuration—The date for the last backed-up configuration file.
• Change — The date for the last configuration file change.
• System Object ID — The SysObjectID of the resource. - Operational State—One of following possible values, selected from a drop-down menu, describing the availability of the resource.
- Disabled—Inoperable because of a fault, or resources are unavailable.
- Enabled—Operable and available for use.
- Active—Device is operable and currently in use with operating capacity available to support further services.
- Busy—Operable and currently in use with no operating capacity to spare.
• Install Date — The date this equipment was installed.
• Notes—Any notes recorded about the device.
• RTM Category — The "Right to Manage" category for licensing.
• DNS Hostname—The DNS name of the resource; this name must be unique.
- Vendor—The vendor that manufactures/distributes this resource. See the User Guide for more information about managing vendors.
- Hardware Version —This resource's hardware version.
- Software Version—The selected resource's software version.
• Network Status—The status of the resource in the network. For example: Responding means this application can, via some network protocol, get the device to respond. Not
Responding means the device does not respond to the protocol. Indeterminate means the monitoring software has not tried to reach the device or there was some other error which prevented us from determining one of the other two statuses.
The appearance of Network Status depends on the default ICMP monitor (see Resource Monitors on page 97. If you exclude this equipment from the monitor or disable it (for example, for performance reasons) then a status may appear, but it is not meaningful.
- Creator—The logged in user that created this record in the database.
- Firmware Version — This resource’s firmware version.
- Backup Result—The result of any attempted configuration file backup for this resource.
- Managed By Hostname—True/false. True means DNS rather IP address is how NMS200 manages this resources.
- Model — The resource's model number.
- Equipment Icon—The resource's icon (typically related to the Vendor).
- Equipment Type—The resource's type. For example Router.
- Location Name — The resource's location.
- IP Address—The resource's IP address.
• Discovery Date — When the resource was discovered.
• Administrative State — One of three descriptive values. The options are:
- L ocked — Device use is prohibited.
- Shutting Down—Only existing users can use the device.
- Unlocked — Normal use of device is permitted.
- Hardware Version — The resource's hardware version.
- Last Backup — When the resource's configuration was last backed up.
- Last Modified—When the resource's configuration was last modified.
- Equipment Name — The resource's name on the network.
• Alarm Severity—The most severe alarm on the resource. - Restore Result—The result of any attempted restoration of configuration for this resource.
• Description—A text description of the device.
Live Details
This panel appears for wireless devices. Click the View Data button to see live data of the selected category for the selected device.
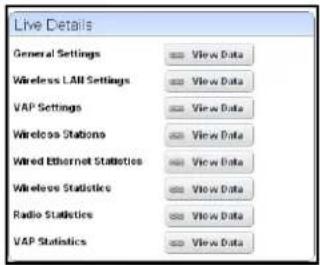
Scheduling Actions
To schedule an action triggered from a right-click menu (for example from Managed Resources) rather than execute it immediately, follow these steps.
- Select the action in the right-click menu. For example: Netconfig Backup.
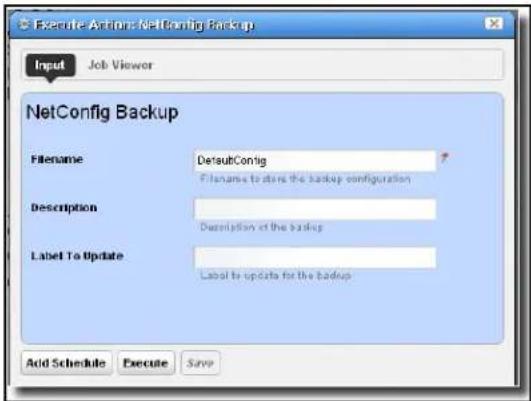
-
Rather than clicking Execute, click Add Schedule.
-
The schedule panel appears.
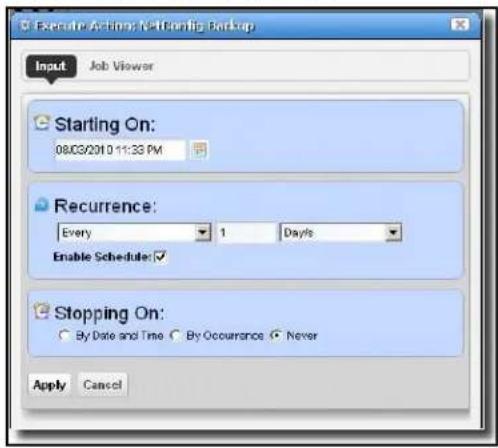
-
Once you click Apply on this panel, the previous panel returns, the Add Schedule button now appearing as Edit Schedule.
-
If you click Save, NMS200 creates a scheduled item around the activity and its data. A row also appears in the screen described in Schedules Portlet on page 49 for this schedule.
-
When you have scheduled something from the Add Schedule button, clicking Apply in the schedule panel returns you to the previous screen.
-
If you click Execute in that previous screen, the action begins, and audit trail panel appears, displaying the running job for the activity. If you have attached a Schedule, NMS200 also saves the activity as a scheduled item in the Schedules Portlet.
Direct Access
Direct access provides a less-mediated connection to the device in the following ways:
• MIB Browser
- Terminal
The following sections describe those direct options in more detail.
MIB Browser
As part of the Direct Access menu, the MIB Browser lets you examine SNMP data available about devices.
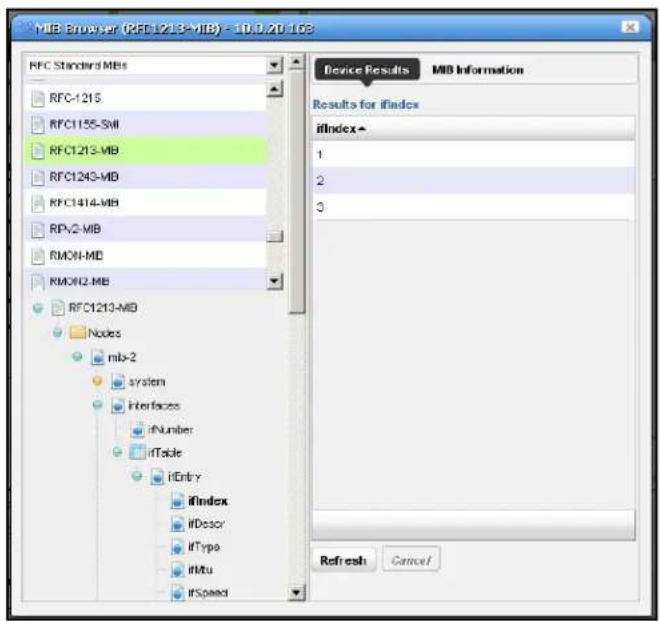
The screen that opens when you select this option displays MIBs available in NMS200 in a tree on the left. Notice that a pick list at the top of the left column narrows what appears in the tree.
Note: A progress bar at the bottom of this screen indicates a query for the selected information is in progress.
Select a MIB and expand it to see the contents for a selected node appear on the right. In addition to the Device Results tab, which displays what the currently selected device uses
from the MIB, the MIB Information tab displays the parameters available for the selected node.
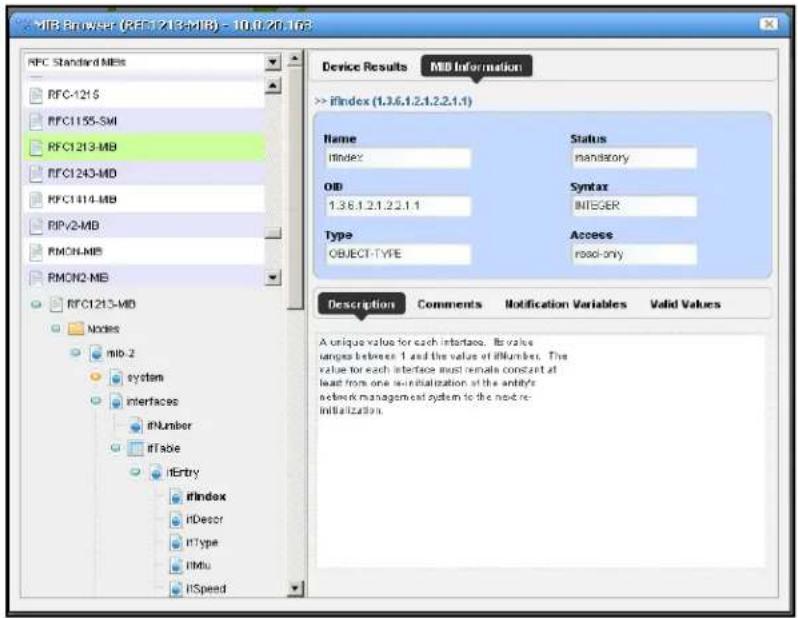
Notice that the Description, Comments, Notification Variables, and Valid Values tabs appear at the bottom of this screen.
Terminal
This opens a terminal shell connected to the selected device.
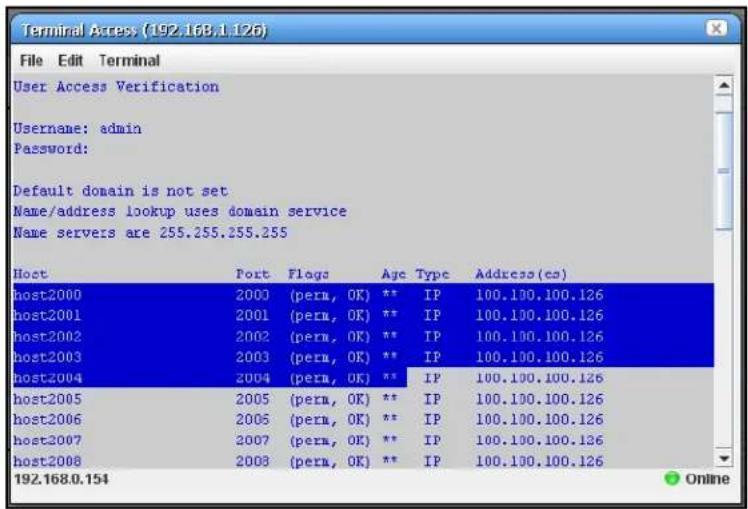
A green icon in the lower right corner indicates the device is online, while the IP address of the device appears in title bar. The IP address of NMS200's server also appears in the lower left corner, when the connection is active.
The following menus appear for your terminal session:
- File—This menu lets you Connect or Disconnect to the device.
- Edit—This menu lets you Copy or Paste text within the terminal session. Click and drag to select text.
- Terminal—This menu lets you set Foreground and Background colors, as well as configuring the Font and Buffer sizes. Reset Terminal restores the defaults.
Note: Terminal is now an applet that requires a Java Runtime Environment be installed and associated to the browser as a plug-in on the client machine.
Ports
This summary portlet displays discovered device ports.
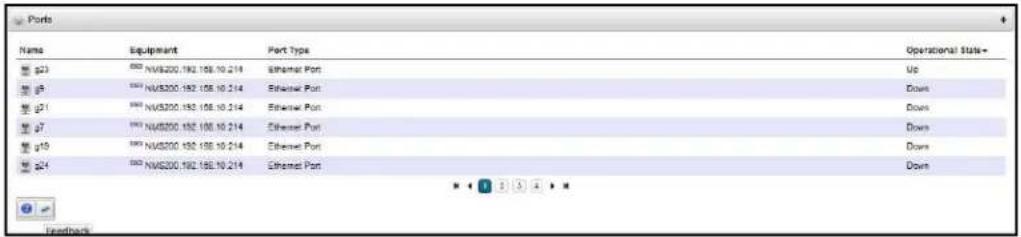
This displays a list of ports, with columns for Port Icon, Equipment Name, Name, Type and Encapsulation. Hover your cursor over the Name column, and a popup appears adding the port's Date Created and Operational State information. If you right-click a row in this summary, you can Share with User... or see Details.
Port Details
This screen displays all the port's settings that have been retrieved, including a Reference Tree of logical interfaces below the port, a Learned MAC Address panel, Alarms related to the port, and other Details.
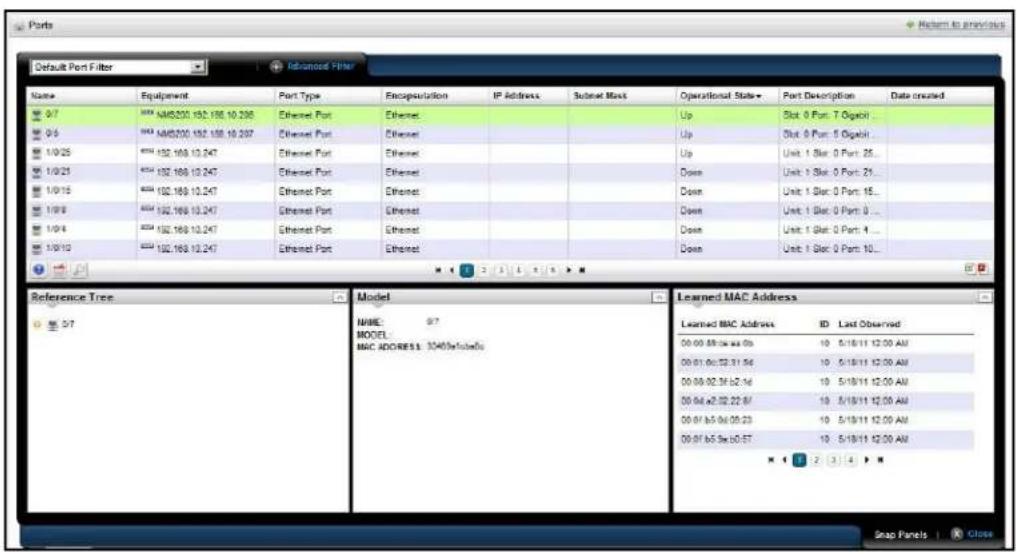
In Details, fields describing the following for the selected port: Hardware Version, Port Description, Model, Date Created (typically, this is the date discovered), Creator, Port Type, Encapsulation, Subnet Mask, Install Date, In Use, If Index, Container Index, Slot Number, Speed, MTU (maximum transmission unit), Port Icon, Learned MAC Addr, Count, CLI Name, Notes, Operation Type, Switch Mode, Duplex, Name, Port Number, Equipment Name, Operational State, IP Address, MAC address, Administrative State. See Port Details on page 159 and Managed Resources Expanded on page 137 for an explanation of some of these fields.
Ports Expanded
Clicking the plus (+) in the upper right corner of the summary screen displays this expanded view of available ports.
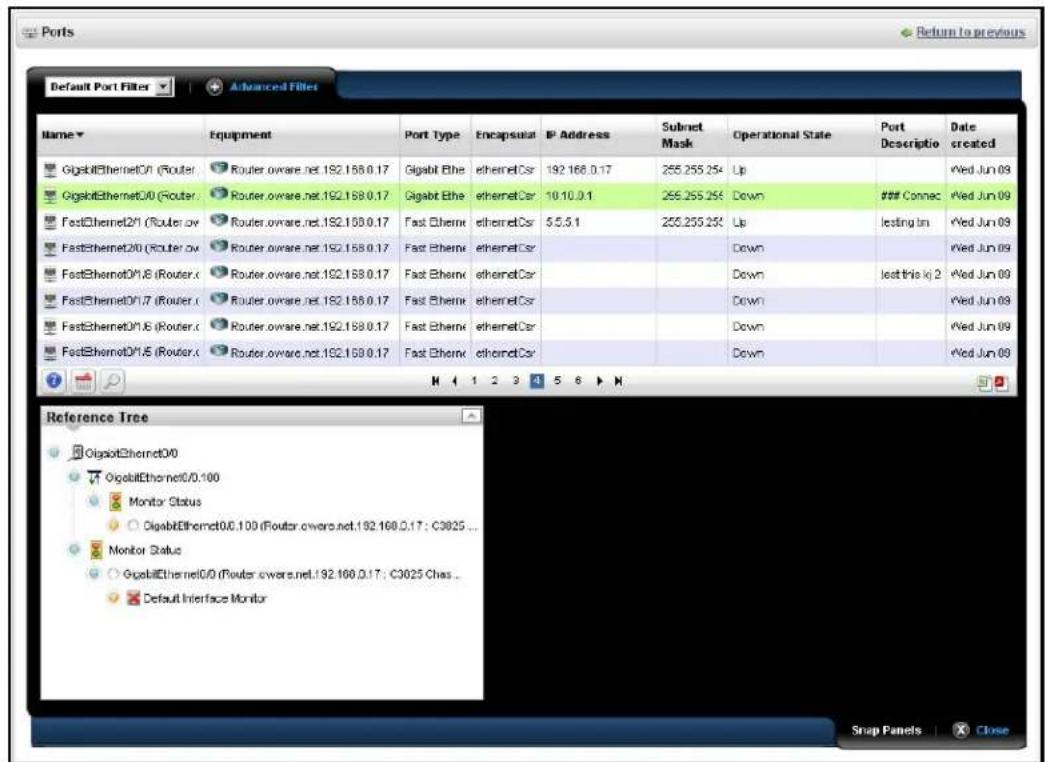
In addition to the right-click capabilities of the summary screen, you can Add / Remove columns in this one. The available columns for this view include many related to the attributes that appear in Port Details on page 159, above. This screen also includes a Reference Tree displaying a tree of the selected port's relationship to logical interfaces and monitors.
Reports
This portlet's summary screen lists the available reports that you can run with NMS200.
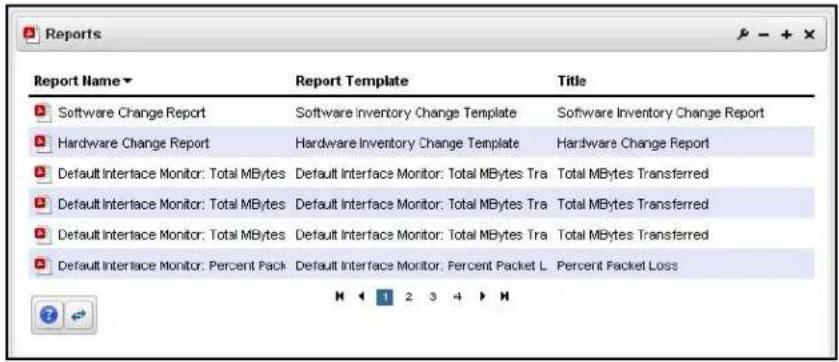
The report Icon, Name, Template, and Subtitle appear in the columns in this summary screen.
Right-click a selected report to Execute Report, Share with User or Execute Report (Advanced). When you execute a report, a numbered message notification appears, and a link to the report appears in the Messages panel to notify you the report is ready for viewing. Click the magnifying glass to the right of the notification to view either the audit trail or the report.
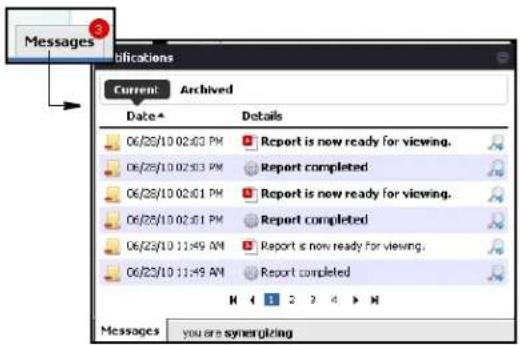
When you Execute Report (Advanced), a configuration screen appears that lets you select several report parameters.
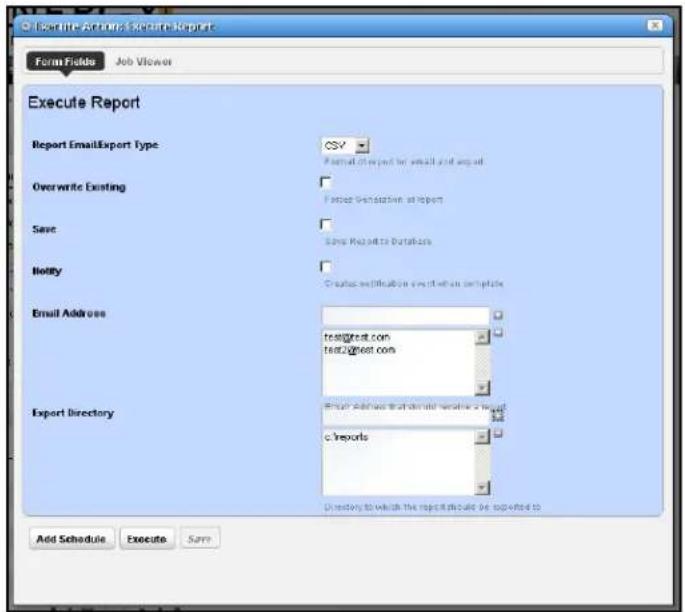
The parameter selection includes the following:
- Report Email / Export Type—Select the export file type from the pick list. Options include CSV, HTML, PDF, XLS, and XLSM.
• Overwrite Existing—Check to activate overwriting any existing report. - Save—Check to activate saving the report to the database.
- Notify—Check to activate emitting a notification event.
- Email Address—Enter an e-mail destination for the generated report, and click the plus (+) to list it. You can enter several such e-mails.
- Export Directory—Enter directory destinations for saved reports as you would e-mail destinations.
Click Add Schedule to schedule the report for future or repeated execution, Execute to run the report immediately, or Save to preserve this report's configuration. The Job Viewer tab displays the report's progress if you click Execute.
Expanded Reports Portlet
Clicking the plus (+) icon displays the expanded portlet. the expanded portlet adds Add / Remove Column to the menu options available in the summary screen.
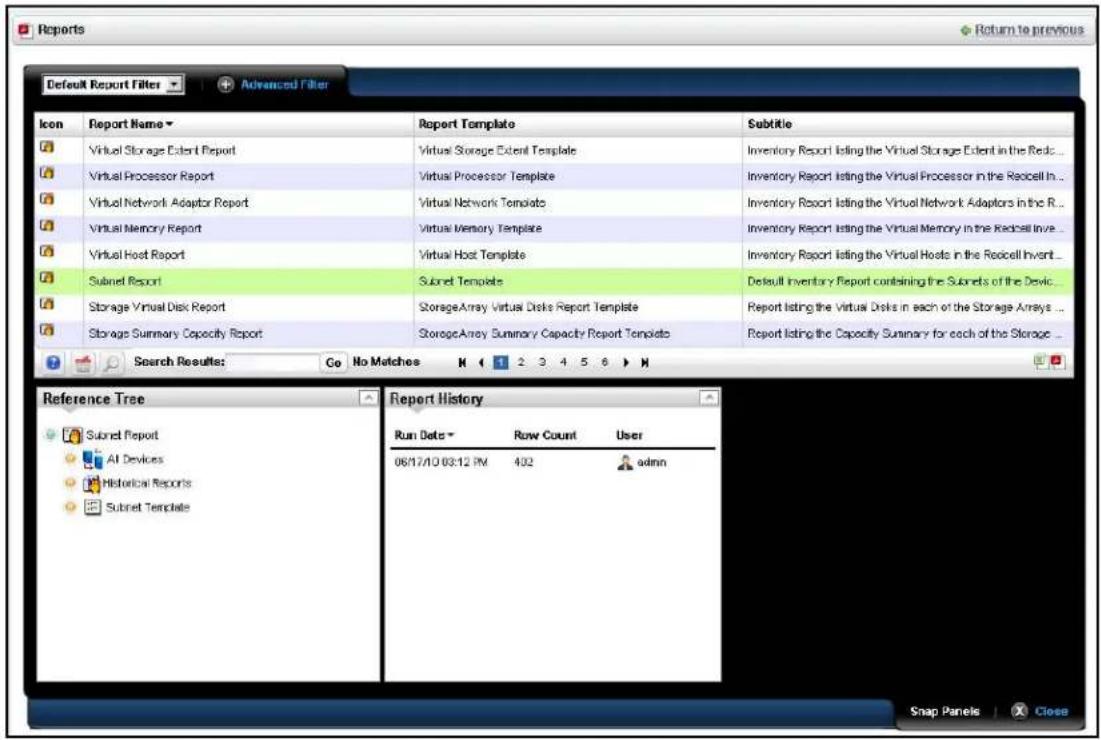
Available columns are the same as the summary screen's.
Reports Snap Panels
The Snap Panels for reports display a Reference Tree of connections between the selected report and target equipment, and between the report and any Report Template.
The Report History Snap Panel displays the selected report's Run Date, Row Count and the User who ran the report. Right-click a row in this panel, and you can View (the report), Print (the report history), Delete, or Export (the report history). If you View the report, a message with a link to the report appears in the bottom left of the screen.
The Branding Reports section below describes how to change the default appearance of reports.
Branding Reports
Reports come with a default logo, but you can change that, as is illustrated in the above screen. Put the .png, .jpg or .gif graphic file with your desired logo in owareapps\redcell\images on the application server. In the owareapps\installprops\lib\installed.properties file, alter this property:
ProSafe Network Management Software NMS200
redcell.report.branding.image=
No need to include the path, just use the file name.

CAUTION:
You must create images that are no taller than 50 pixels, and no wider than 50 pixels.
This chapter contains information about the following portlets:
- File Servers
- File Management
File Servers
You must configure FTP and/or TFTP file servers to push and pull configuration files to and from devices, or to deploy firmware updates. With this portlet you can switch between internal and external file server mode, and Show or Hide not applicable File Servers depending on the file server mode by checking/unchecking the Show All Servers check box. When this is un-checked, only the relevant file server(s) appear onscreen.
Right clicking a file server, or the empty list space lets you do the following:
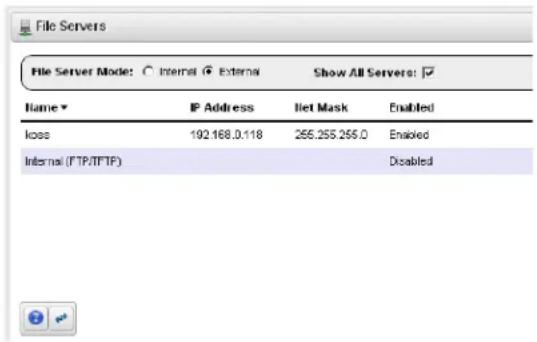
• New—Displays the File Server Editor screen.
- Edit—Displays the selected File Server in the File Server Editor screen.
- Disable—Disables the selected file server. When file servers are disabled, they are not used in a Backup, Restore or Deploy operation. This too appears only for External File Servers.
- Enable—Activates the selected file server. Again, exposed for External file Servers only.
• Test—Tests the selected file server by sending and retrieving a file.
- Delete—Removes the selected file server from the list. This appears for External File Servers only.
Note: You can select whether NMS200 is in Internal or External File Server Mode with the radio buttons at the top of this portlet. Checking Show All Servers displays the internal file server.

CAUTION:
Port conflicts prevent having an external file server and internal file server operate on the same machine.
Columns in this manager identify the server, and describe whether it is enabled, and has TFTP enabled.
Note: The internal FTP/TFTP server is for testing only, not for production use. For those concerned that the internal server provides some insecure access to NMS200, it was designed to be ultra-secure. It literally creates a separate authentication and virtual file system for each file retrieved. It also responds only to Redcell's internal requests.
File Server Editor
This editor lets you configure new and existing file servers.
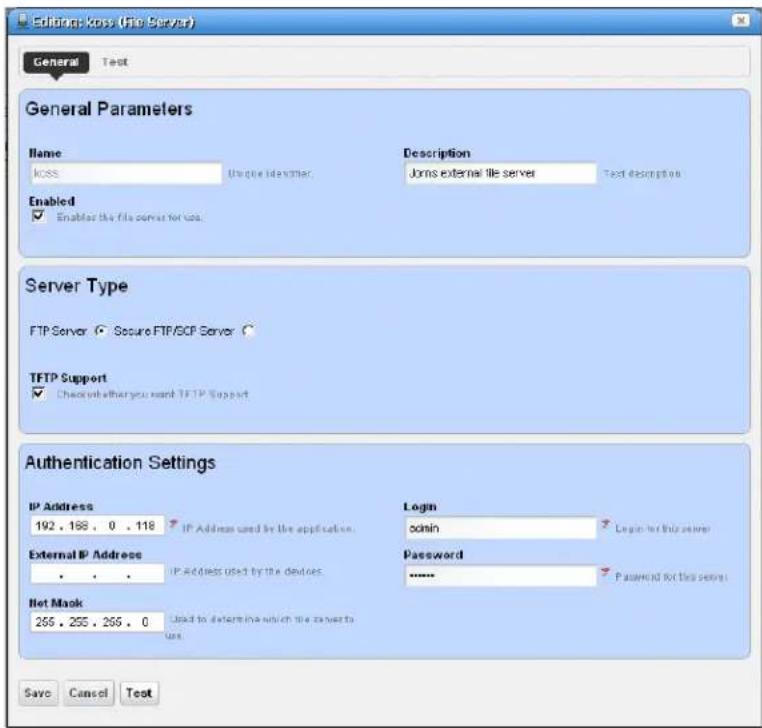
This is where you specify the Name, whether the server is Enabled, whether the connection is secure (Secure FTP/SCP Server), supports TFTP, internal and external (optional) IP addresses, and Net Masks, and the login and password for the file server. Once you have configured a server, you can test the file server credentials by clicking on the Test button at the bottom of the screen. Click Save to preserve your changes.
Tip: FTP servers typically must be on the same side of the firewall as the devices with which they communicate. If you have several such servers, the specified Net Mask also determines which server communicates with devices in which portion of the network.
Notice that you can now configure an IP address used by NMS200, and another External IP Address used by the devices. If you configure multiple file servers, NMS200 selects the server with the Net Mask whose subnet is closest to the device(s) with which it communicates.
File Management
In addition to letting you back up and restore configuration files, and deploy firmware updates to devices, this menu manages viewing and comparing configuration files backed up from the selected devices. Details about these capabilities appear below.
Compare and View options have the following limitations:
- If you select a config file that is a single file, without any historical precedent, no comparison option appears on the menu since the selected version does not have a prior version.
- If you select a single config file of version two or higher, comparison is an option. When selected, NMS200 automatically compares against the prior version for that device and file name.
• If you select two config files of any version, compares is between those two versions.
• If you select three or more config files, no comparison option appears. - The View option appears for a single selection only, and only lets you view files that are not binary.
Tip: The icon to the left of the File Name listed in the portlet lets you know whether a configuration file is binary (☐), and not viewable, or text (☐), and viewable.
The file management menu contains the following:
View / Edit— This opens a panel displaying the configuration file's contents. Use the browser's Find function (as demonstrated on the right) to locate specific text within the Config File. You can also select and copy text within this screen.
Notice that Selected Config and Live Config (current) version and storage dates appear at the top of this screen. When you perform a backup that differs from the config that is Labeled Current, that label changes to Live Config if changes are detected.
Selected Config appears when you open this screen from the Configuration Files Portlet, but Live Config / Current Config appear side-by-side when you open this screen from the Managed Resources portlet.
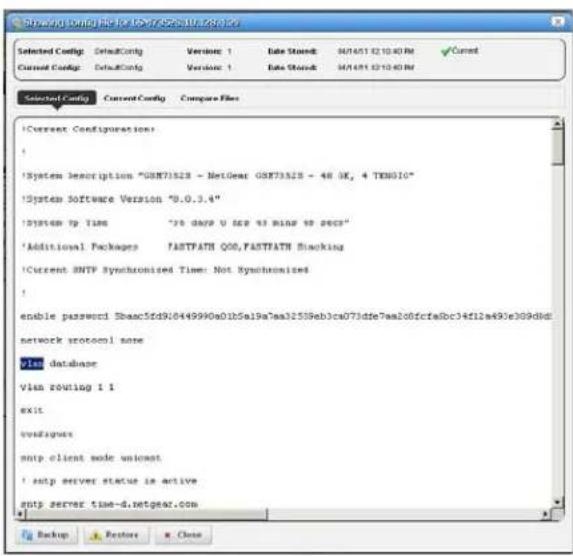
You can also compare two different configurations (Selected Config and Labeled Current / Live Config) in the tabs that appear on this screen. with the Compare Files tab at the top.
Close the screen with the buttons at its bottom. Notice you can also Backup or Restore what you are viewing with buttons at the bottom of the screen.
- Assign Labels—Use this option to select an existing label or create a new one. You cannot assign System labels (Current, Compliant, and so on).
- Compare Current v. Previous / to Label / Selected—You can compare configurations by right-clicking a device, or two devices then selecting Compare. If you right click a single device with a previous backup, then the comparison is between the latest and next-to-latest backup. If it does not have a previous backup, then the menu offers to compare to a designated label. You can compare two different Selected devices too.
- Ctrl+click to select two different devices before you Compare.
Notice that the Prev / Next buttons at the bottom of this screen cycle through as many as five previous configuration files.
The comparison screen appears with the configurations side-by-side (note the file names in the title bar of this screen).
Lines that differ between the two configurations appear highlighted green. Lines that are missing in one, but that appear in another appear highlighted red. Added lines appear highlighted in yellow. Use the right/left arrows to page through the side-by-side comparison.
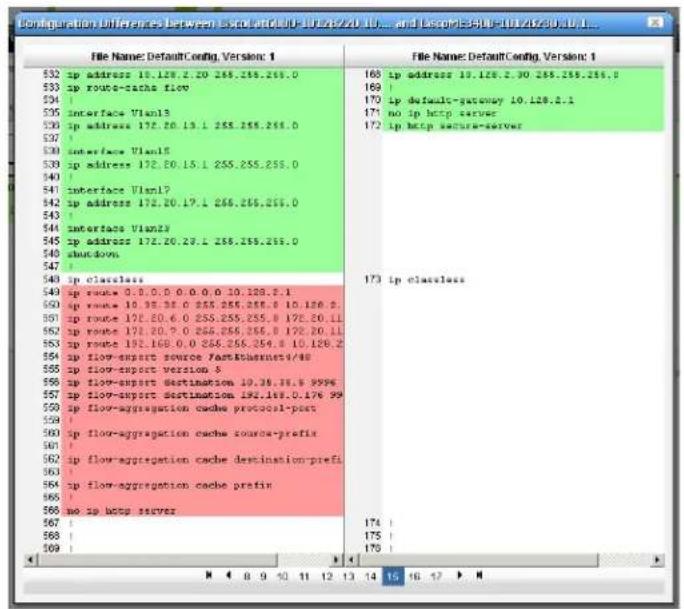
The page numbers and beginning / forward / back / end arrows help you navigate between pages of pairs of files. Notice also that if you have more than two such files, a panel appears at the bottom that lets you navigate between adjacent pairs of such files (1 and 2, 2 and 3, 3 and 4, and so on). Click the Prev / Next links to move between pairs of files.
Tip: You can use the browser's "Find" function (typically initiated by Ctrl+F) to locate text within these views.
- Backup / Restore — Select these to backup or restore a configuration file. See How to: Backup Configurations on page 170 or Restore Configurations on page 171 for step-by-step instructions.
- Deploy—Select this option to deploy an OS Image (firmware).
- Export / Import —Export lets you save a local copy of the selected config file. Import opens a screen that lets you select a locally-accessible file to store, view, compare and deploy.
Tip: You can see configuration files in the Latest Configurations portion of the Details screen for a device or in the Configuration Files or Top Configuration Backups portlets.
Backup Configurations
NMS200 simplifies backing up devices so you always have their configuration files, even if the one on the device becomes corrupted or out-of-date.
Tip: You can back up several devices at once for what amounts to a “group operation.” Select more than one device by Ctrl+clicking in the expanded portlet, then right-click as outlined below. You must expand portlets to multi-select.
Here are the steps to back up a device:
-
Make su re you have configured an FTP or TFTP server to handle the backup. See Netrestore File Servers on page 30.
-
Right-click a device in the Managed Resources portlet.
-
Select File Management > Backup.
-
Configure the subsequent Backup Device screen.
This screen lets you configure the following:
- File Name — A text identifier for the file
• Description — A text identifier for the file - Update User Label—A text identifier for the file. Entering such a label creates it, and makes it available for later restoration, comparison, and so on.
- Email Settings—Click add email to configure an email notification about this backup.
- Select Targets for Backup—This screen defaults to the device you selected in Managed Resources. You can also click the Add Equipment to add individual devices, or Add Groups to add groups, or Remove All to manage devices that appear in this list of targets.
-
Device Options—This portion of the Backup Options screen displays detailed configuration options available for the selected target. For example, you could select between backing up the running-config and the startup-config.
-
Click one of the buttons at the bottom of the screen to initiate the next backup action.
Add Schedule opens the scheduling screen to let you automate the backup you have configured on a specified date, time, or repetition.
Execute performs the backup immediately. The Results tab in this screen opens, displaying the message traffic between NMS200 and the device(s). See Audit Trail Portlet on page 46.
Save preserves this configuration without scheduling or executing it.
Close closes this screen without saving the configured restoration.
Restore Configurations
The following are the steps to restore a config file to a device:
- Make sure you have configured an FTP or TFTP server to handle the backup. See Netrestore File Servers on page 30.
- Right -click a device in the Managed Resources portlet.
- Select File Man agement > Restore.
- Configure the subsequent Restore Device screen.
This screen lets you configure the following:
- Select Targets for Restore—This portion of the screen lets you Add Equipment, Add Groups, or Remove All target devices. Listed targets and their Restore Config / Label Selection. Click the icon in the Action column to remove the listed target.
-
Select what to apply to the selected target—This portion of the screen lets you select either a label (like Current, Compliant and so on—a selector listing available labels appears onscreen once you click this option), or Restore a specific Configuration File. The latter lists available files and lets you click to select. Click Apply to configure the selected target, or Apply to All to configure all targets.
-
Click one of the buttons at the bottom of the screen to initiate the next backup action.
Add Schedule opens the scheduling screen to let you automate the restoration you have configured on a specified date, time, or repetition.
Execute performs the restoration immediately. The Results tab in this screen opens, displaying the message traffic between NMS200 and the device(s). See Audit Trail Portlet on page 46.
Save preserves this configuration without scheduling or executing it.
Close closes this screen without saving the configured restoration.
Configuration Files
One place backed up configuration files can appear in this portlet. Right-clicking offers you the following options (all options listed may not be available):
- View / Edit—See or edit the backed up configuration file, if it is not a binary file. See File Management on page 168 and Configuration File Editor on page 172 for a description of these capabilities.
- Compare to Label / Compare Selected—Compare labeled configuration files to the current selection. See File Management on page 168 for a description of this capability.
You can create labels when you back up a config file, or you can compare to the default labels (Change Determination, Current, Compliant). If you select two configuration files in the expanded portlet, you can also Compare Selected.
- Promote—Makes the selected config file available for mass deployment. This is a useful way to make a “pattern” configuration file to deploy to several devices.
- Backup / Restore—Back up the device (again) related to the selected file, or restore the selected file.
- Archive—Save the selected file to disk, and optionally delete it from this list.
- Import / Export—Export the selected config file to disk, or import it from disk.
- Delete—Removes the file from the NMS200 database without exporting it.
Tip: You can use the browser's "Find" function (typically initiated with Ctrl+F) to locate text within the view.
- Aging Policy—Opens the Aging Policy selector. See Database Aging Policies (DAP) on page 19 for more about these.
• You can also import and export a selected config file.
Tip: You cannot select multiple lines in most summary portlets. This is the one exception. You do not need to open Configuration Files Expanded to select multiple lines.
Configuration Files Expanded
The Expanded portlet lets you filter the list of displayed configuration files, and displays the File Type, Description, File Size and whether the configuration file is Labeled in columns.
The Labeled column appears with green or red icons depending on whether the config file has a label. When a label applies to a configuration, you cannot Delete or Archive it.
The Labels Using Config File snap-in displays all labels connected to the selected configuration file, and the date on which that connection was made. The Reference Tree displays the configuration file name, and lets you right-click it to access the available operations it supports.
To see the most recent configuration files, see Top Configuration Backups on page 114.
Configuration File Editor
This editor lets you manually edit configuration files, and save them to the NMS200 database.
When you select a file in the Configuration Files portlet, and right-click to select Edit, this screen appears with the following features.
- Find / Replace—Click the magnifying glass icon to open a text search feature. Notice that you can check A/a to make your search case-sensitive, or RegEx to use regular expressions to search.
Click the Find button to locate text in the config file. Click Replace to replace found text, once it is located. Check the All checkbox and click Replace to bulk replace all instances of the Find text.
Click Save to preserve your edits, or Close to abandon them. Notice that the edited configuration appears listed with the other Configuration Files in the portlet as a different version than the original (the version increments by one every time you edit and save a configuration).
Image Repository
The Image repository manages firmware updates to deploy to devices in your network, or configurations you want to deploy to several devices.
You must add such files to your NMS200 system before you can deploy them. The summary screen listing these images displays their Name, Description, File Name, Image Type and Installed Date. Right-clicking this screen displays the following menu items:
- New—Select either Firmware Image, or Configuration Image. Firmware Image displays the Firmware Image Editor screen. Configuration Images originate from Configuration Files that are promoted to mass restore. See the Configuration Image Editor on page 174 for its functionality.
- Edit—Displays the selected Firmware image in the Firmware Image Editor screen, or the Configuration Image Editor if the selected line is a configuration image.
- Deploy—Deploys the selected file to devices, and with the options you select in a subsequent selection screen. For this to function, you must have enabled a server, as described in File Management on page 191.
- Download Firmware For—Some devices (typically Dell) support downloading firmware from the internet. These devices appear listed in a sub-menu. Select the type for which you want to download OS images, and NMS200 automatically downloads them.
- Delete—Removes the selected OS image / configuration from the list.
Expanded Image Repository portlet.
When you click the plus, this portlet expands to display the OS images list, a snap panel Reference tree of the connections to devices, and another panel listing the files within the selected image.
Firmware Image Editor
When you open or create an OS image, its configuration appears in this editor. The General Parameters tab contains its OS Image Name, Description, Version, and the Device Class and Device Family. The Image Files tab displays a selector that lets you create new OS Images, retrieving files from the local file system (Import from Disk) or a URL (Import from URL).
Because such images can consist of multiple files, you can import multiple files here. Finally, you can also import a Readme File to accompany this image, and view it in that tab.
Click Save to preserve the OS Image you have configured, or Cancel to exit these screens without saving.
Configuration Image Editor
This editor appears for new configuration images, or for configurations you Promote in the Configuration Files portlet for mass restoration. This screen has the following tabs:
- General Parameters
- Configuration
General Parameters
In this screen you can name and describe the configuration file, and configure a filter to screen restoration targets.
The Version field automatically tracks changes to the original.
The Target Filter panel lets you configure how this configuration decides which devices to target. When targets fail, restoration skips them.
Configuration
This panel lets you configure what is restored, and what is variable in mass deployments.
This screen appears without contents when you create a new Configuration Image, but appears with data from any promoted configuration file, if it originated as a promoted config file.
Target Param
The panel of parameters that appears to the right of this screen lets you insert a value retrieved from NMS200's database into the restored configuration file.
For example, if a Contact appears in the file, delete the specifics retrieved from a particular device's config and double-click the Target Param "Contact." NMS200 inserts \$_EquipmentManager_RedCell_Config_EquipmentManager_Contact (a unique identifier for the database's Contact field) wherever you put the cursor.
Now, when you deploy this config file to the devices that pass the filter in the General Parameters editor screen, NMS200 first updates this parameter with discovered data retrieved from the device before restoring the configuration. This facilitates deploying the same config to many devices while retaining individual Target Params like contacts, DNS Hostname, and so on.
Note: Target Params include all available discover-able parameters. Some may not apply to the specific device or configuration file.
Deploy Firmware
This screen lets you configure a deployment, whether triggered from resource groups, individual resources, or the Image Repository screen. Deployment validates the selected image is appropriate for the selected devices, or appropriate devices within a group.
Notice you can Add Schedule to schedule this deployment rather than Execute it immediately. Click Save if you schedule this deployment, or Close to abandon your edits.
Deploy Firmware
To deploy firmware, follow these steps:
- Make sure you have an FTP / TFTP server correctly configured. See File Management on page 191.
- Right click a device in Managed Resources or the groups or Image Repository pages and select File Management > Deploy.
-
The Deploy Firmware screen appears.
-
You can Select OS Image in the top panel, and configure deployment with the following fields:
- OS Image—Select an image. It must already have been uploaded in the Image Repository.
• Description—A text description of the image.
• Version — The image version.
• Device Driver — The device driver associated with this image.
• Image Type — A read-only reminder of the type of image. - Select Targets for Deployment—Select targets for deploying the image. This defaults to the device right-clicked in Managed Resources to initiate this action, or devices that match the selected file you want to deploy. You can then click the Add Equipment button (again, restricted to devices that match the deploy file's type). You can also remove devices from the target list with the Remove All button. Notice the Status column in the table of targets shows whether the OS deployment is supported or not.
Add Schedule opens the scheduling screen to let you automate the backup you have configured on a specified date, time, or repetition. See Schedule Actions on page 169.
Execute performs the backup immediately. The Results tab in this screen opens, displaying the message traffic between NMS200 and the device(s). See Audit Trail Portlet on page 52.
Save preserves this configuration without scheduling or executing it.
Close closes this screen without saving the configured backup.
Deploy Configuration
When you deploy a configuration, a screen appears to configure how that occurs.
It has the following fields:
Select Firmware Image
- Firmware Image — The identifier for the image
• Description — The description for the image
• Version — The version for the image - Generate and Save Configuration Only — Check this if you simply want to configure for later restoration.
- Label for Configuration — Enter a label name, if applicable.
Select Targets for Deployment
Use the Add Equipment or Add Groups buttons to select individual devices or groups of devices (both are possible together). Use Remove All to delete all targets, or use the delete icon in the Action column to delete individual equipment or groups.
Note: The listed targets must still pass the filter set in the editor's General Parameters.
Restore a single configuration to many target devices
The following steps describe restoring a single configuration to many discovered devices without overwriting those devices' essential information.
- Back up a single device's configuration that is nearest to the kind you would like to see generally.
- Right-click this backed up file in the File Management portlet, and Promote it so it appears in the Image Repository portlet.
-
Right-click > Edit the promoted configuration in the Image Repository.
-
Name the file, and, if necessary, configure a filter In the General Parameters tab of the editor.
- In the Configuration tab, locate the parameters you want to preserve in discovered devices when you restore this file. This can include items like the device's DNS Hostname, IP Address, and so on. Delete the file's specifics and double-click to insert the Target Params in place of these variables.
- Save the configuration.
- Right -click to deploy this configuration.
- You can check Generate and save for configuration only if you simply want to configure deployment for later, and save for now. You can also optionally name a label for the deployed files.
- Select the devices, or groups of devices to which you want to deploy.
- Click Save, Execute or Add Schedule depending on your desired outcome.
- If you click Execute, you will have to confirm this action.
When NMS200 performs the restoration (deploy), it reads the Target Params from those discovered for each device, inserts those in the config file, then restores it, device by device, skipping any that do not pass the filter set up in step 4.
This chapter describes Storage Arrays as they appears in NMS200's web portal. These appear in the portlet described in Managed Resources on page 133, as well as the Storage Array Portlet, which offers storage-array-specific capabilities. The following sections describe these capabilities.
Storage arrays appear in the Storage Array Portlet when they are discovered. See Discovery on page 26 for a description of that process.
Storage Array Portlet
This portlet lets you manage storage arrays on your network.
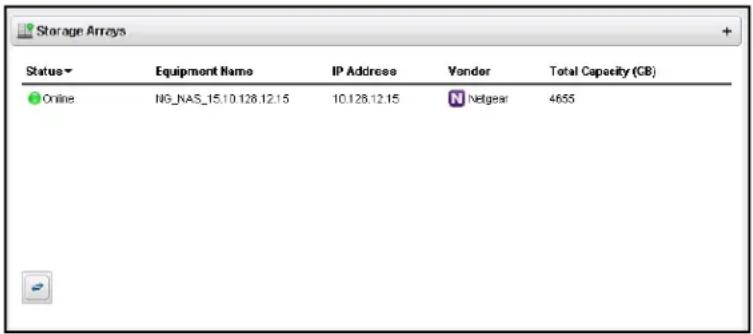
The summary portlet displays columns describing the listed arrays' Status, Equipment Name, IP Address, Vendor, and Capacity.
The following menu items are available from right-clicking in the portlet:
- Edit—Select from the General, Authentication or Management Interface editors in the sub-menu. For information about the last two, see Managed Resources on page 133.
- Details—This opens a screen for the selected storage array like the one described in Equipment Details on page 146.
- Resync—Updates NMS200 with the latest information from the device.
- Delete—Remove the selected service array from the list.
- Show Key Metrics—Displays the key metrics for the selected array. See Key Metric Editor on page 118 for more about configuring these.
- Audit Trail—Displays the audit trails for the selected storage array, as described in Audit Trail Viewer on page 46.
For additional information, you can click the plus in the upper right corner of this portlet to see the Storage Array Portlet Expanded.
Storage Array Portlet Expanded
The expanded portlet displays additional information about discovered storage arrays.
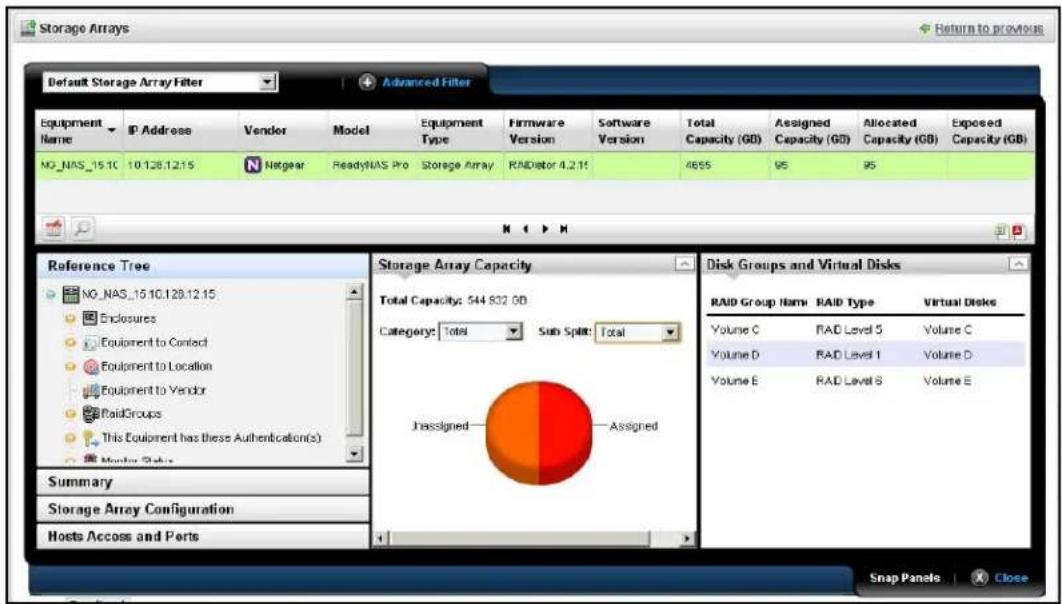
The expanded portlet adds columns for Firmware Version, Software Version, Total Capacity (GB), Assigned Capacity (GB), Allocated Capacity (GB), and Exposed Capacity (GB).
This screen also contains several Snap panels that contain information about the listed array you select. The first four are visible when you click their labels on the left of the screen.
- Reference Tree
- Summary
• Storage Array Configuration
• Host Access and Ports
• Storage Array Capacity
• Disk Groups and Virtual Disks
Reference Tree
This panel displays the array's connection to various components like Enclosures (including fans, power supplies, controllers and disk drives), Contacts, Locations, Vendors, Raid Groups, Authentications, and monitors.
Tip: You can right-click some of the reference tree items to edit or otherwise act on them.
Summary
This panel displays the following information about the selected array:
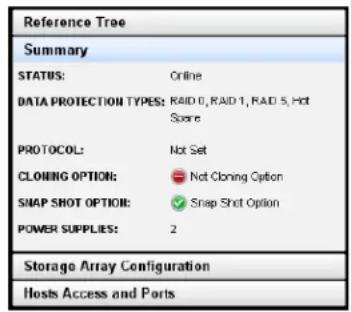
- STATUS — Whether the array is online.
- DATA PROTECTION TYPES—The data protection types on the array. For example, the RAID type.
- PROTOCOL — The protocol to communicate with this array.
- CLONING OPTION — Whether the array is cloned or not.
- SNAP SHOT OPTION — Whether the array has a snap shot or not.
Storage Array Configuration
This panel displays the following information about the selected array:
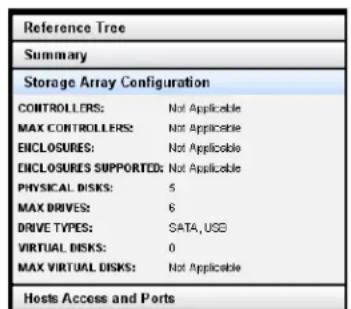
- CONTROLLERS— A count of the array's controllers.
- MAX CONTROLLERS— The array's maximum number controllers.
• ENCLOSURES—A count of the array's enclosures.
• ENCLOSURES SUPPORTED— The number of enclosures supported. - PHYSICAL DISKS—A count of the array's physical disks.
• MAX DRIVES—The number of physical disks this array can support. -
DRIVE TYPES—The types of drives in the array (SATA, USB, and so on).
-
VIRTUAL DISKS—A count of the array's virtual disks.
• MAX VIRTUAL DISKS— How many virtual disks the array can support.
Host Access and Ports
• This panel displays the following information about the selected array:
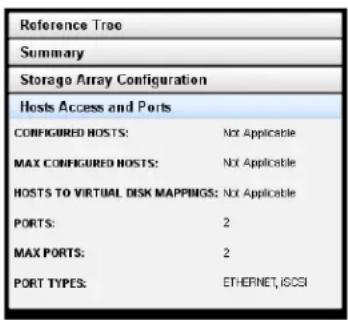
- CONFIGURED HOSTS—The hosts configured for the array.
- MAX CONFIGURED HOSTS— The maximum number of configured hosts the array supports.
- HOSTS TO VIRTUAL DISK MAPPINGS—Connections between virtual disks and configured hosts.
- PORTS—The number of ports within the array.
• MAX PORTS—The maximum number of ports the array supports. - PORT TYPES—The type of ports the array supports (Ethernet iSCSCI, and so on).
Storage Array Capacity
This panel displays a graph and the following information about the selected array:
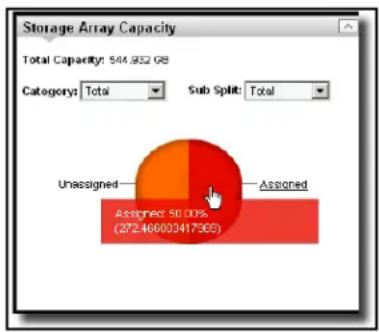
pie
Storage Array Capacity | Category | Sub Split | Total | |---|---|---| | Unassigned | Assigned | 50.00% (272.466003417369) | Total Capacity: $44,932.68• Total Capacity— The array's total capacity.
The following fields do not appear for all devices.
- Category—Select the category of storage displayed in the graph. These include Total, Assigned, Allocated, Unexposed.
- Sub Split—Options include Total, Assigned, Allocated and Unexposed.
Hover the cursor over the graph to see the GB and percentage of the segment(s) displayed.
Disk Groups and Virtual Disks
This displays the disk groups and virtual disks for the selected array. This lists the RAID Group Name, the RAID Type, and its Virtual Disk.
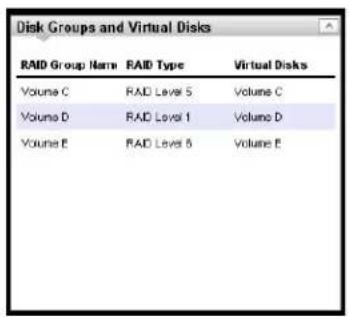
General
This editor lets you configure general features of discovered storage arrays.
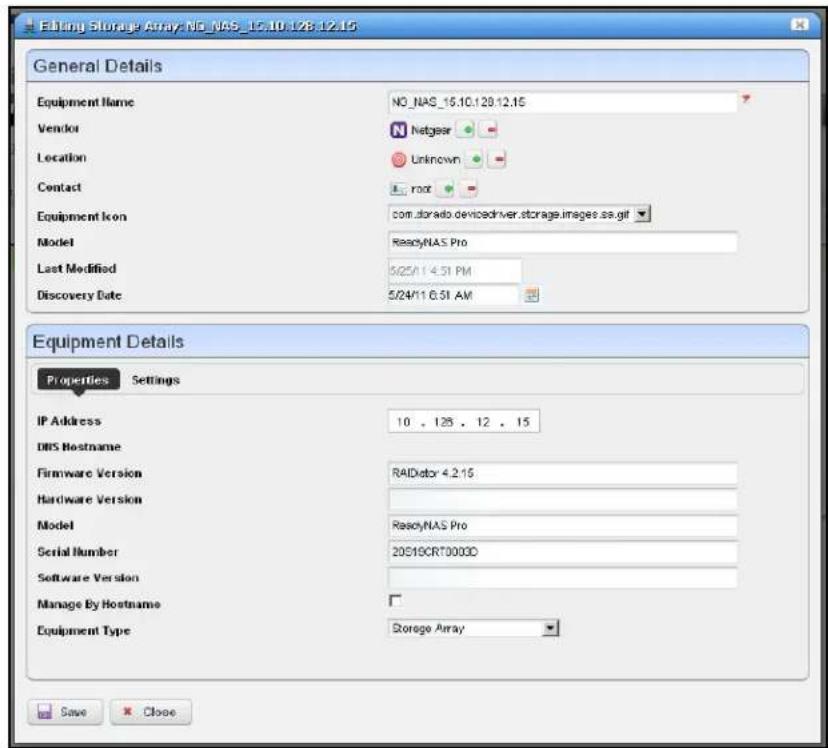
This screen has the following fields:
General Details
• Equipment Name — The identifier for the array.
- Vendor —The brand of the array. Use the + or - buttons to select this if discovery did not automatically populate this field.
- Location —The location of the array. Use the + or - buttons to select this if discovery did not automatically populate this field. See Locations on page 83 for information about configuring locations.
- Contact —The contact for the array. Use the + or - buttons to select this if discovery did not automatically populate this field. See Contacts on page 81 for information about configuring contacts.
• Equipment Icon —The icon that appears in the portlet.
• Model — The model of the array.
• Last Modified — The date this array was last modified.
• Discovery Date — The date this array was discovered.
Equipment Details / Properties
• IP Address—The IP address for the array.
• DNS Hostname —The DNS host for the array.
- Firmware Version — The firmware version for the array.
• Hardware Version — The hardware version for the array.
• Model — The model of the array.
- Serial Number—The serial number of the array.
• Software Version —The software version for the array.
- Manage By Hostname —Check to manage by hostname rather than IP address.
• Equipment Type — The software version for the array.
Equipment Details / Settings
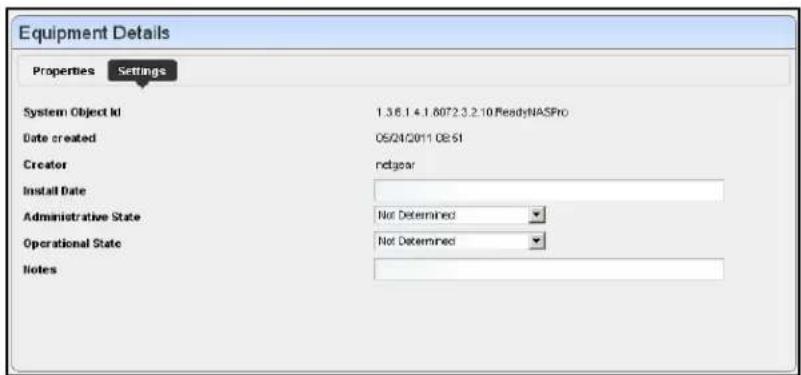
This tab has the following fields:
• System Object Id—The Sys object ID of the array.
• Date Created — The date the NMS200 record for the array was created.
- Creator—The logged in user who created the record for the array.
• Install Date — The date the array was installed.
- Administrative State—The administrative state of the array (Not Determined, Unlocked, Locked, Shutting Down).
- Operational State—The operational state of the array (Not Determined, Enabled, Active, Busy, Disabled).
• Notes—Enter text to describe the array here.
| Access Control | Refers to mechanisms and policies that restrict access to computer resources. An access control list (ACL), for example, specifies what operations different users can perform on specific files and directories. |
| Alarm | A signal alerting the user to an error or fault. Alarms are produced by events. Alarms produce a message within the Alarm Window. |
| API | Application Programming Interface—A set of routines used by the application to direct the performance of procedures by the computer's operating system. |
| Authentication | The process of determining the identity of a user that is attempting to access a network. Authentication occurs through challenge/response, time-based code sequences or other techniques. See CHAP and PAP. |
| Authorization The process of determining what types of acti vities or access are permitted on a network. Usually used in the context of authentication: once you have authenticated a user, they may be authorized to have access to a specific service. | |
| CoS | Class of Service—Describes the level of service provided to a user. Also provides a way of managing traffic in a network by grouping similar types of traffic. |
| Database An organized collection of Oware objects. | |
| Deployment The distribution of solution blades throughout the domain. | |
| Digital Certificate | A digital certificate is an electronic “credit card” that establishes your credentials when doing business or other transactions on the Web. It is issued by a certification authority (CA). It contains your name, a serial number, expiration dates, a copy of the certificate holder's public key (used for encrypting and decrypting messages and digital signatures), and the digital signature of the certificate-issuing authority so that a recipient can verify that the certificate is real. |
| Domain | A goal-oriented environment that can include an industry, company, or department. You can use Oware to create solutions within your particular domain. |
| Encryption Scrambling data in such a way that it can on ly be unscrambled through the application of the correct cryptographic key. | |
| Equipment | A network device managed by the system. |
ProSafe Network Management Software NMS200
| Ethernet Trunk | An Ethernet Trunk service represents a point-to-point connection between two ports of two devices. Ethernet frames transported by the connection are encapsulated according to IEEE 802.1Q protocol. The each tag ID value in 802.1Q encapsulated Ethernet frames distinguishes an Ethernet traffic flow. Thus, an Ethernet trunk can aggregate multiple Ethernet VLANs through a same connection which is why “trunk” describes these. |
| Ethernet Trunk Port | An Ethernet trunk port is a port that terminates a point-to-point Ethernet trunk. Since Ethernet trunk is a point-to-point connection, each Ethernet trunk contains two Ethernet trunk ports. |
| Ethernet Service | An Ethernet service represents a virtual layer broadcast domain that transports or transmits Ethernet traffic entering from any one endpoint to all other endpoints. Often, this is a VLAN service across multiple devices.An Ethernet service may or may not use Ethernet trunk, depending on the desired connection between two neighboring devices. If the connection is exclusively used for this Ethernet service, no Ethernet trunk is needed. On the other hand, if the connection is configured as an aggregation which can be shared by multiple Ethernet services, an Ethernet trunk models such a configuration.Each Ethernet service can have multiple Ethernet Access Ports through which Ethernet traffic flows get access to the service. |
| Ethernet Access Service | Since an Ethernet trunk can be shared by multiple Ethernet Services, each Ethernet Service relates to a shared trunk via a unique Ethernet Access component.Because Ethernet trunk is a point-to-point connection, there are two Ethernet Access Services per trunk per Ethernet service instance. |
| Ethernet Access Point | These represent the access points through which Ethernet frames flow in and out of an Ethernet service.For an Ethernet Service that uses an Ethernet Trunk Service, an Ethernet Access Port must be associated with either one of the two Ethernet Access Services. |
| Event Notification received from the NMS (Network Management System). Notifications may originate from the traps of network devices or may indicate an occurrence such as the closing of a form. Events have the potential of becoming alarms. | |
| Event Definition | Parameters that define what an event does. For example, you can tell Oware that the event should be to wait for incoming data from a remote database, then have the Oware application perform a certain action after it receives the data. |
| Event Instance | A notification sent between two Oware components. An event instance is the action the event performs per the event definition. |
| Event Template | Defines how an event is going to be handled. |
| Event Threshold | Number of events within a given time period that must occur before an alarm is raised. |
| Exporting | Saving business objects, packages, or solution blades to a file for others to import. |
| Filter In network security, a filter is a program or secti on of code that is designed to examine each input or output request for certain qualifying criteria and then process or forward it accordingly. | |
| GUI Graphical User Interface | |
ProSafe Network Management Software NMS200
| ICMP | NMS200 uses the Internet Control Message Protocol (ICMP) to poll for status using ping and echo requests of managed devices. When it polls a managed device using ICMP, if the device is operationally up, ICMP returns a response time and record of any dropped packets. NMS200 uses this information to monitor device status and measure average response time and packet loss percentage for managed devices.NMS200 only uses ICMP to poll devices for status, average response time, and packet loss percentage. Other information displayed comes from SNMP requests. |
| ISATAP | The Intra-Site Automatic Tunnel Addressing Protocol (ISATAP) is an IPv6 transition mechanism which is defined as a tunneling IPv6 interface and is meant to transmit IPv6 packets between dual-stack nodes on top of an IPv4 network. |
| Key | In cryptography, a key is a variable value that is applied using an algorithm to a string or block of unencrypted text to produce encrypted text. The length of the key generally determines how difficult it will be to decrypt the text in a given message. |
| Key Management | The establishment and enforcement of message encryption and authentication procedures, in order to provide privacy-enhanced mail (PEM) services for electronic mail transfer over the Internet. |
| Managed Object A network device managed by the system. | |
| Mediation | Communication between this application and external systems or devices, for example, printers. Mediation services let this application treat these devices as objects. |
| Mediation Agent | Any communication to and from equipment is handled by the Mediation Agent. This communication includes SNMP requests, ASCII requests, and unsolicited ASCII messages. In addition, the Mediation Agent receives and translates emitted SNMP traps and converts them into events. |
| MEG Maintenance Entity Group | |
| MEP Maintenance End Point | |
| MIB Management Information Base. A virtual dat | abase (repository) of equipment containing object characteristics and parameters that can be monitored by the network management system.MIBs describe objects managed using SNMP. MIB-I refers to the initial MIB definition, and MIB-II refers to the current definition. Each MIB object stores values like sysUpTime, bandwidth utilization, or sysContact. Most network devices can support several different types of MIBs. While most devices support the standard MIB-II MIBs, they may also support any of a number of additional MIBs that you may want to monitor. |
| OAM Operation, Administration and Maintenance | |
| OID Object ID. | |
| OSPF Open Shortest Path First routing protocol. | |
| Policy A rule made up of conditions and actions and | associated with a profile. Policy objects contain business rules for performing configuration changes in the network for controlling Quality of Service and Access to network resources. Policy can be extended to perform other configuration functions, including routing behavior, VLAN membership, and VPN security. |
ProSafe Network Management Software NMS200
| Policy Enforcement Points (PEP) | In a policy enforced network, a policy enforcement point represents a security appliance used to protect one or more endpoints. PEPs are also points for monitoring the health and status of a network. PEPs are generally members of a policy group. |
| Policy routing | Routing scheme that forwards packets to specific interfaces based on user-configured policies. Such policies might specify that traffic sent from a particular network should be routed through interface, while all other traffic should be routed through another interface. |
| Policy Rules | In a policy enforced network (PEN), policy rules determine how the members and endpoint groups of a policy group communicate. |
| PPTP (Point-to-Point Tunneling Protocol) | Point-to-Point Tunneling Protocol (PPTP) is a network protocol that enables the secure transfer of data from a remote client to a private enterprise server by creating a virtual private network (VPN) across TCP/IP-based data networks. PPTP supports on-demand, multi-protocol, virtual private networking over public networks, such as the Internet. |
| Private Key | In cryptography, a private or secret key is an encryption/decryption key known only to the party or parties that exchange secret messages. In traditional secret key cryptography, a key would be shared by the communicators so that each could encrypt and decrypt messages. The risk in this system is that if either party loses the key or it is stolen, the system is broken. A more recent alternative is to use a combination of public and private keys. In this system, a public key is used together with a private key. |
| Profile A profile is an abstract collection of configura | |
| tion data that is utilized as a template to specify configuration parameters to be applied to a device as a result of a policy condition being true. | |
| Public Key | A public key is a value provided by some designated authority as a key that, combined with a private key derived from the public key, can be used to effectively encrypt and decrypt messages and digital signatures. The use of combined public and private keys is known as asymmetric encryption. A system for using public keys is called a public key infrastructure (PKI). |
| QoS Quality of Service. In digital ci | |
| rcuits, it is a measure of specific error conditions as compared with a standard. The establishment of QoS levels means that transmission rates, error rates, and other characteristics can be measured, improved, and, to some extent, guaranteed in advance. Often related to Class of Service (CoS). | |
| RADIUS RADIUS (Remote Authentication Dial -In User Service) is a client/server protocol and software that enables remote access servers to communicate with a central server to authenticate dial-in users and authorize their access to the requested system or service. RADIUS allows a company to maintain user profiles in a central database that all remote servers can share. | |
| RIP Routing Information Protocol | |
| Self-signed Certificate A self-signed certificate uses it s own certificate request as a signature rather than the signature of a CA. A self-signed certificate will not provide the same functionality as a CA-signed certificate. A self-signed certificate will not be automatically recognized by users' browsers, and a self-signed certificate does not provide any guarantee concerning the identity of the organization that is providing the website. | |
SMTP Simple Mail Transfer Protocol.
SNMP
Simple Network Management Protocol. Network management protocol used almost exclusively in TCP/IP networks. SNMP provides the means to monitor and control network devices, and to manage configurations, statistics collection, performance, and security.
NMS200 uses SNMP for many network monitoring and management tasks. SNMP-enabled network devices, including routers, switches, and PCs, host SNMP agents that maintain system status and performance information that is tied to specific Object Identifiers (OIDs). This information is a Management Information Base (MIB). NMS200 uses MIB OIDs as references to retrieve specific data about a selected, SNMP-enabled, managed device. MIB data may be accessed either with SNMP Community Strings, as provided with SNMPv1 and SNMPv2c, or with optional SNMP credentials, as provided with SNMPv3.
To monitor devices on your network, you must enable SNMP on monitored devices can do SNMP communications. The steps to enable SNMP differ by device, so you may need to consult the documentation provided by your device vendor.
SNMP credentials secure access to SNMP-enabled managed devices. SNMPv1 and SNMPv2c credentials serve as a type of password that is authenticated by confirming a match between a cleartext SNMP Community String provided by an SNMP request and the SNMP Community String stored as a MIB object on an SNMP-enabled, managed device. SNMPv3 provides a more secure interaction by employing the following fields:
Credentials: The SNMP User Name is a required cleartext string configured in NMS200's authentication. User Name functions similarly to the SNMP Community String of SNMP v1 and v2c.
SNMPv3 provides two optional Authentication Methods: Message Digest 5 (MD5) and Secure Hash Algorithm 1 (SHA1). Both methods, MD5 and SHA1, include the Authentication Key with the SNMPv3 packet and then generate a digest of an entire SNMPv3 packet then sent. MD5 digests are 20 bytes long, and SHA1 digests are 16 bytes long. When the device receives the packet, it uses the User Name to recreate a packet digest using the appropriate method. Both digests are then compared to authenticate.
SNMPv3 also provides two optional Privacy/Encryption Methods: Data Encryption Standard (DES56) and Advanced Encryption Standard (AES128) using a 128 bit key. DES56 uses a 56 bit key with a 56 bit salt, and AES128 uses a 128 bit key with a 128 bit salt to encrypt the full SNMP v3 packet.
Spanning Tree Protocol (STP)
The inactivation of links between networks so that information packets are channeled along one route and will not search endlessly for a destination.
SSH (Secure Shell)
A protocol which permits secure remote access over a network from one computer to another. SSH negotiates and establishes an encrypted connection between an SSH client and an SSH server.
SSL (Secure Sockets Layer)
A program layer created by Netscape for managing the security of message transmissions in a network. Netscape's idea is that the programming for keeping your messages confidential ought to be contained in a program layer between an application (such as your Web browser or HTTP) and the Internet's TCP/IP layers.
The “sockets” part of the term refers to the sockets method of passing data back and forth between a client and a server program in a network or between program layers in the same computer.
Trap (SNMP Trap)
A notification from a network element or device of its status, such as a server startup. This notification is sent by an SNMP agent to a Network Management System (NMS) where it is translated into an event by the Mediation Agent.
ProSafe Network Management Software NMS200
Trap
Forwarding
The process of re-emitting trap events to remote hosts. Trap Forwarding is available from the application through Actions and through the Resource Manager.
VLAN A virtual local area network (LAN), commonly known as a VLAN, is a group of hosts
with a common set of requirements that communicate as if they were attached to the Broadcast domain, regardless of their physical location. A VLAN has the same attributes as a physical LAN, but it allows for end stations to be grouped together even if they are not located on the same network switch. Network reconfiguration can be done through software instead of physically relocating devices.
Index
A
A Note About Performance 10
About Box 33
Access Control 185
Active Performance Monitor
SNMP Performance Monitoring 106
SNMP Performance Monitoring Example 106
Additional Products 9
Aging Policies Editor 20
Aging Policies Options 21
Alarm 185
Alarm Email 55
Alarm Snap Panels 55
Alarms 51
Alarm State 53
Assigned User 53
Date Assigned 53
Date Closed 53
Date Opened 52
Entity Type 52
Notification Instance 53
Alarms (in Equipment Detail) 149
Alarms in Topology 95
API 185
Top 113
Audit Trail 46
Audit Trail Screen 45
Audit Trail Snap Panels 48
Authentication 14, 185
Authentication Editor 122
Authentication Portlet 121
Authentication Snap Panel 123
Authorization 185
B
Back button 32
Backups
Compare 114
Latest Configurations 114
View 114
Balloon 92
Basic Network Considerations 13
Basic Spring 94
Branding Reports 163
Breadcrumb trail 38, 147
Browser Back button 38
C
Changing the Session Timeout Period 17
Chat / Conferencing 34
Circular 93
Common Menu Items 42
Common Setup Tasks 28
Condition Override(s) 88
Configuration File Editor 172
Configuration Files 143, 171
Contacts Editor 82
Contacts Portlet 81
Control Panel 17
CoS 185
Creating a new label 170
Customizing Report Logos 163
D
DAP 19
DAP Workflow 20
Dashboard Editor 117
Dashboard View Selection 117
Dashboard Views 115
DATA (Topology) 90
DATA / VIEW SETTINGS (Topology) 89
Database 185
Database Aging Policies 19
Database Aging Sub-Policies 22
Deploy OS 80, 175
Deployment 185
Details 152
Digital Certificate 185
Direct Access 155
Discover Network Devices 26
Discovery Portlet 26
Discovery Profile
Actions 127
General 125
Inspect 27, 128
Network 27, 126
Results 27, 129
Discovery Profile Editor 26, 125
Discovery Profiles 124
Discovery Profiles Expanded 130
DISPLAYED LEVELS (Topology)87
DNS 13, 14
Dock 33
Domain 185
Domain Name Servers 14
Dynamic Group 132
E
Email Action Variables 69
Encryption 185
Equipment 185
Equipment Details 146
Equipment Name 53
Ethernet Access Point 186
Ethernet Access Service 186
Ethernet Service 186
Ethernet Trunk 186
Ethernet Trunk Port 186
Event 186
Event Definition 186
Event History Portlet 56
Event History Snap Panels 58
Event Instance 186
Event processing filters 62
Event Processing Rules 58
Event Template 186
Event Threshold 186
Expand / Collapse options 10
Expanded Alarm Portlet 53
Expanded Audit Trail Portlet 47
Expanded Authentication Portlet 123
Expanded Event History Portlet 57
Expanded Location Portlet 84
Expanded OS Images portlet. 78, 173
Expanded Portlets 37
Expanded Reports Portlet 163
Expanded Resource Monitor 98
Expanded Vendor Portlet 96
Export / Import 42
Export / Import Page Configurations 42
Exporting 186
F
File Management 138, 168
File Server Editor 76, 167
File Servers Portlet 165
Filter 9, 186
Filter / Settings (Rule Editor) 61
Fixed IP Address 14
Flash for 64-bit browsers 12
G
General (Rule Editor) 61
Getting Started 15
Graphs 36
Group Operations 130, 141, 170
GUI 186
H
Hardware Recommendations 13
Help / Tooltips 32
Hierarchical-Cyclic 94
How to
Backup Configurations 170
Deploy an OS Image 175
Restore a single configuration to many target devices 176
Restore Configurations 171
How To Backup 141
How To Restore 142
|
ICMP 187
ICMP Monitor 108
Icons 90
IIS 16
Import / Export 42
Installation and Startup 16
Interfaces 147
Interfaces > Details 148
Internet Information Services 16
IP address changes 14
ISATAP 187
K
Key 187
Key Features 7
Key Management 187
Key Metric Editor 118
Key Metrics Monitor 109
L
Labels 169
LAYOUT 91
Level 1 Filters 87
Level 2 Filters 87
Level 3 Filters 88
License 9, 14
License Viewer 25
Link Discovery 145
Location Editor 83
Location Manager
Address 84
Parent location 84
Locations Portlets 83
Locations Snap Panels 84
M
Managed Object 187
Managed Resource Groups 130
Managed Resources 28
Managed Resources Expanded 137
Managed Resources Portlet 133
Managing Windows systems 16
Mandatory Fields 41
mass deployments 174
Mediation 187
Mediation Agent 187
MEG 187
Menu 54
Menu Bar 35
Menu Options 124
MEP 187
MIB 187
MIB Browser 156
Minimum hardware 11
Monitor Options Type Specific Panels 106
Monitors 113
N
Name Resolution 13
Navigation 31
Netrestore File Servers 30
Network Considerations 13
Network Requirements 14
Network Topology 85
New link creation 144
newlink ConfigImageEditor 174
O
OAM 187
OID 187
OS Image Editor 78, 173
OS Images Portlet 77, 173
OSPF 187
P
PDF 44
Performance Dashboard 116
Performance Dashboard Portlet 116
Performance Indicators 147
Performance Note 10
Policy 187
Policy Enforcement Points (PEP) 188
Policy routing 188
Policy Rules 188
Port Details 159
Port Expanded 160
Portal > Communities 19
Portal > Users 18
Portlets 37
Ports > Details 149, 150
Ports Expanded 160
Ports Portlet 158
Post-processing rules 64
PPTP (Point-to-Point Tunneling Protocol) 188
Printing manager contents 42
Private Key 188
Profile 188
Protocols Used 14
Public Key 188
Q
QoS 188
Quick Navigation 24
Quick Start 15
R
RADIUS 188
Recommended Operating System Versions 11
Recorder / Page turn icons 40
Refresh 32
Refresh Monitor Targets 113
Reports
Customizing Logos 163
Reports Portlet 161
Reports Snap Panels 163
Repositories 23
Resource Discovery 123
Resource Management Portlets 121
Resource Monitor Snap Panels 98
Resource Monitors Portlet 97
Return to previous 32
RIP 188
Rule Editor 61
Actions 65
Rule Editor Example 59
S
Schedule Refresh Monitor Targets 113
Schedules 48
Schedules Portlet 49
Scheduling 48
Scheduling Actions 154
Scheduling Monitor Target Refresh 113
Scheduling Refresh Monitor Targets 113
Screen width in pixels 12
Search in Portlets 40
Self-signed Certificate 188
Sharing 43
Show Versions 33
SMTP 188
SMTP Configuration 28
Snap Panels 38
SNMP 189
SNMP Interface Monitor 112
SNMP Interface Monitor Example 106
SNMP Monitor 110
Sorting 41
Spanning Tree Protocol (STP) 189
SSH (Secure Shell) 189
SSL (Secure Sockets Layer) 189
Starting Web Client 16
Static Group 131
Status Bar Messaging 34
Storage
Array Capacity 181
Disk Groups and Virtual Disks 182
General 182
Host Access and Ports 181
Reference Tree 179
Storage Array Configuration 180
Summary 180
Storage Array Portlet 178
Storage Array Portlet Expanded 179
Sub-Policies 22
Supported Operating System Versions 11
Supported Web Browsers 12
Syslog Escalation Criteria 64
System Basics 11
System requirements 11
T
technical support 2
Terminal 157
The Back Button 32
Tooltips 32
Top [Asset] Monitors Portlets 113
Top Configuration Backups
Compare 114
Top Configuration Backups Portlet 114
Top Configuration BackupsLView 114
Topology 85
Actions 86
Balloon 92
Circular 93
DATA 90
DATA / VIEW SETTINGS 89
DISPLAYED LEVELS 87
LAYOUT 91
Orthogonal 92
OVERVIEW 95
Radial 93
STYLE 88
ZOOM 87
trademarks 2
Trap (SNMP Trap) 189
Trap Forwarding 190
U
Updating Your License 9, 14
Upgrade licenses from previous version 9, 15
ProSafe Network Management Software NMS200
V
Vendors Portlet 95
Vendors Snap Panel 96
View as PDF 44
Visualize My Network 85
VLAN 190
W
Why Redcell Synergy? 7
Windows Server 2008 12
Windows Terminal Server 12
- ProSafe Network Management Software NMS200
- Technical Support
- Trademarks
- Statement of Conditions
- Contents
- Chapter 1 Introduction
- Chapter 2 Getting Started
- Chapter 3 Portal Conventions
- Chapter 4 NMS200 Portlets
- Chapter 5 Monitoring
- Chapter 6 Resource Management
- Chapter 7 File Server / File Management
- Chapter 8 Storage Arrays
- Why NMS200?
- NMS200's benefits:
- Key Features
- Networks with NMS200
- Additional Products
- Updating Your License
- Online Help / Filter
- Expand / Collapse options
- A Note About Performance
- System Basics
- Supported Operating System Versions
- Supported Web Browsers
- Hardware Recommendations
- Network Basics
- Name Resolution
- Protocols
- Fixed IP Address
- If you do change your host's IP address
- Authentication
- Getting Started
- Installation and Startup
- CAUTION:
- Starting Web Client
- HTTPS
- Changing the Session Timeout Period
- Control Panel
- Portal > Users
- Add users with the following steps:
- Portal > Communities
- Add Communities with the following steps:
- Database Aging Policies (DAP)
- DAP Workflow
- The following are steps typical for implementing DAP:
- Aging Policies Editor
- Aging Policies Options
- Sub-Policies
- Repositories
- Quick Navigation
- License Viewer
- Register License
- Product Licenses
- License Details: [Product]
- Device Licenses
- Discovery
- To Begin
- Discovery Profile Editor
- Network
- Inspect
- Results
- Managed Resources
- Common Setup Tasks
- SMTP Configuration
- Netrestore File Servers
- Help / Tooltips
- Refresh
- The Back Button
- Show Versions
- The Dock
- Status Bar Messaging
- Chat / Conferencing
- Menu Bar
- Graphs
- Portlets
- Expanded Portlets
- Snap Panels
- Filters
- Rows and Search
- Add / Remove Columns
- Pages
- Exports
- Snap Panels (Reference Tree)
- Mandatory Fields
- Sorting
- Common Menu Items
- Import / Export
- Export / Import Page Configurations
- Sharing
- View as PDF
- Audit Trail / Jobs Screen
- Audit Trail Viewer
- Audit Trail Portlet
- Expanded Audit Trail Portlet
- View Job
- Schedules
- Schedules Portlet
- Expanded Schedules Portlet
- Alarms
- Expanded Alarm Portlet
- Menu
- Alarm Snap Panels
- Alarm Email
- Event History
- Expanded Event History Portlet
- Event History Snap Panels
- Event Processing Rules
- Expanded Event Processing Rules Portlet
- Rule Editor Example
- To create a rule, follow these steps:
- Specify Event Filtering
- Specify Settings for: [Selected Rule Type]
- Rule Editor
- General
- Filtering / Settings
- Syslog Escalation Criteria
- Criteria: Syslog Match Text
- Message Test
- Actions
- Forward Northbound
- Custom
- Email Action Variables
- File Servers
- File Server Editor
- OS Images
- Expanded OS Images portlet
- OS Image Editor
- Deploy OS
- To deploy an OS image, follow these steps:
- Contacts
- Contacts Editor
- Locations
- Location Editor
- Expanded Location Portlet
- Locations Snap Panels
- Visualize My Network
- Control and Styles
- ZOOM
- DISPLAYED LEVELS
- Level 1 Filters
- Level 2 Filters
- Level 3 Filters
- Condition Override(s)
- STYLE OPTIONS
- Data / Node Finder
- GRAPH INVENTORY
- Icons
- Layout
- Balloon
- Orthogonal
- Radial
- Circular
- Hierarchical-Cyclic
- Basic Spring
- OVERVIEW
- Alarms in Topology
- Vendors
- Expanded Vendor Portlet
- Vendors Snap Panel
- Resource Monitors
- Expanded Resource Monitor
- Resource Monitor Snap Panels
- Monitor Editor
- of Unreachable Attempts before update 1
- between 1 and 200
- Monitor Options
- Calculated Metrics
- Thresholds
- Inventory Mappings
- Monitor Options Type-Specific Panels
- SNMP Interface Monitor Example
- To set up a typical performance monitor, follow these steps:
- ICMP Monitor
- Key Metrics Monitor
- SNMP Monitor
- SNMP Interface Monitor
- Scheduling Refresh Monitor Targets
- Top [Asset] Monitors
- Top Configuration Backups
- Top Configuration Backups > View
- Top Configuration Backups > Compare
- Dashboard Views
- Launch a Dashboard View
- Performance Dashboard
- Dashboard View Selection
- Dashboard Editor
- Key Metric Editor
- Metrics
- Chart
- Authentication Editor
- Expanded Authentication Portlet
- Authentication Snap Panel
- Resource Discovery
- Here are the steps:
- Discovery Profiles
- Menu Options
- Here are the steps it presents:
- Discovery Profiles Expanded
- Managed Resource Groups
- Expanded Managed Resource Groups
- Static Group
- Dynamic Group
- Management Interface
- Managed Resources Expanded
- Reference Tree
- General Details
- Settings
- Properties
- Utilization Summary
- Bandwidth Utilization
- File Management
- How To Backup
- Here are the steps to back up a device:
- How To Restore
- Configuration Files
- New Link
- Link Discovery
- Advanced Options
- Equipment Details
- Performance Indicators
- Interfaces
- Interfaces > Details
- Ports
- Ports > Details
- Details
- Live Details
- Scheduling Actions
- Direct Access
- MIB Browser
- Terminal
- Port Details
- # # # # # # # # # # # # # # # # # # # # # # # # # # # # # # # # # # # # # # # # # # # # # # # # # # #
- Ports Expanded
- Reports
- Expanded Reports Portlet
- Reports Snap Panels
- Branding Reports
- Backup Configurations
- Restore Configurations
- Configuration Files Expanded
- Configuration File Editor
- Image Repository
- Expanded Image Repository portlet.
- Firmware Image Editor
- Configuration Image Editor
- General Parameters
- Configuration
- Target Param
- Deploy Firmware
- Deploy Configuration
- Select Firmware Image
- Select Targets for Deployment
- Restore a single configuration to many target devices
- Storage Array Portlet
- Storage Array Portlet Expanded
- Summary
- Storage Array Configuration
- Host Access and Ports
- Storage Array Capacity
- Disk Groups and Virtual Disks
- Equipment Details / Properties
- Equipment Details / Settings
- SNMP
- Spanning Tree Protocol (STP)
- SSH (Secure Shell)
- SSL (Secure Sockets Layer)
- Trap (SNMP Trap)
- Index
- A
- B
- C
- D
- E
- F
- G
- H
- |
- K
- L
- M
- N
- O
- P
- Q
- R
- S
- T
- U
- V
- W
Brand : NETGEAR
Model : ProSafe NMS200
Category : Network Management Software