
GDS-220 - Multimeter GW Instek - Free user manual and instructions
Find the device manual for free GDS-220 GW Instek in PDF.


| Product Type | Digital Multimeter |
| Brand | GW Instek |
| Model | GDS-220 |
| Display | LCD, 4000 counts |
| DC Voltage Range | 400 mV to 600 V |
| AC Voltage Range | 400 mV to 600 V |
| DC Current Range | 400 µA to 10 A |
| Resistance Range | 400 Ω to 40 MΩ |
| Capacitance Measurement | 4 nF to 100 µF |
| Frequency Measurement | Up to 100 kHz |
| Diode Test | Yes |
| Continuity Test | Yes, with buzzer |
| Data Hold | Yes |
| Auto Power Off | Yes, after 15 minutes |
| Dimensions (H x W x D) | 180 mm x 80 mm x 40 mm |
| Weight | Approximately 0.35 kg |
| Power Supply | 9V battery (6F22) |
| Safety Rating | CAT II 600V |
| Accessories Included | Test leads, battery, manual |
| Operating Temperature | 0°C to 40°C |
Frequently Asked Questions - GDS-220 GW Instek
User questions about GDS-220 GW Instek
0 question about this device. Answer the ones you know or ask your own.
Ask a new question about this device
Download the instructions for your Multimeter in PDF format for free! Find your manual GDS-220 - GW Instek and take your electronic device back in hand. On this page are published all the documents necessary for the use of your device. GDS-220 by GW Instek.
USER MANUAL GDS-220 GW Instek
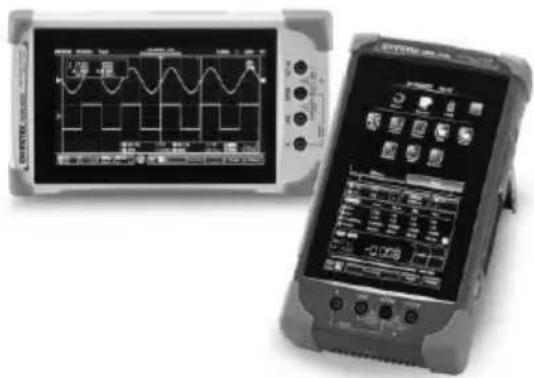
Compact Digital Storage Oscilloscope and Digital Multimeter
GDS-200 and GDS-300 Series
USER MANUAL
GW INSTEK PART NO. 82DS-22000EA1
This manual contains proprietary information, which is protected by copyright. All rights are reserved. No part of this manual may be photocopied, reproduced or translated to another language without prior written consent of Good Will company.
The information in this manual was correct at the time of printing. However, Good Will continues to improve products and reserves the rights to change specification, equipment, and maintenance procedures at any time without notice.
Table of Contents
SAFETY INSTRUCTIONS 5
GETTING STARTED 10
GDS-200 and GDS-300 Series Overview 12
Appearance....15
Initial Setup 30
OPERATION 37
Gesture Control 41
Common Menu UI Elements 47
Vertical Menu Operation 50
Trigger Menu Operation....66
Trigger Setting 68
Run Mode 80
Cursor Measurements....83
Automatic Measurements 86
Drop-Down Menu 94
Utility Menu....96
Acquire Menu 107
Display Menu....112
Go-NoGo Menu 118
Save Operations 124
Recall Operations 135
File Manager.... 139
DMM Mode 143
EE APPs 154
REMOTE CONTROL CONFIG ....164
Interface Configuration 165
FAQ 171
APPENDIX 173
Firmware Update 175
Fuse Replacement 176
Resistor Standards....177
GDS-200/300 Default Settings ..... 180
GDS-200/300 Specifications...... 181
GDS-200/300 Dimensions....185
Declaration of Conformity 186
INDEX....187
SAFETY INSTRUCTIONS
This chapter contains important safety instructions that you must follow during operation and storage. Read the following before any operation to insure your safety and to keep the instrument in the best possible condition.
Safety Symbols
These safety symbols may appear in this manual or on the instrument.

WARNING
Warning: Identifies conditions or practices that could result in injury or loss of life.

CAUTION
Caution: Identifies conditions or practices that could result in damage to the instrument or to other properties.

DANGER High Voltage

Attention Refer to the Manual
Do not dispose electronic equipment as unsorted municipal waste. Please use a separate collection facility or contact the supplier from which this instrument was purchased.
Safety Guidelines
General Guideline

CAUTION
- Do not place any heavy object on the instrument.
- Avoid severe impact or rough handling that leads to damaging the instrument.
- Do not discharge static electricity to the instrument.
- Use only mating connectors, not bare wires, for the terminals.
- Do not block the cooling fan opening.
- Do not disassemble the instrument unless you are qualified.
- Do not use sharp objects or press with undue force on the touch screen display.
- Do not apply more than 300Vrms (CAT II, DSO inputs); 600V (CAT II, DMM inputs) or 300V (CAT III, DMM inputs).
(Measurement categories) EN61010-1:2010, EN61010-2-030 and EN61010-2-033 specify the measurement categories and their requirements as follows. The GDS-200/300 falls under category II & III.
- Measurement category IV is for measurement performed at the source of low-voltage installation.
- Measurement category III is for measurement performed in the building installation.
- Measurement category II is for measurement performed on the circuits directly connected to the low voltage installation.
- Measurement category 0 is for measurements performed on circuits not directly connected to Mains.
| AC Adapter Power Supply (AC Mains)WARNING | AC Input voltage range: 100VAC-240VACFrequency: 47Hz-63HzOutput: 12 DCV, 36W MaxTo avoid electrical shock connect the protective grounding conductor of the AC power cord to an earth ground. |
| Power Supply (DC) | DC Input voltage range (10.5-13.5 V DC, 3A) |
| Cleaning the Instrument | Disconnect the power cord before cleaning.Use a soft cloth dampened in a solution of mild detergent and water. Do not spray any liquid.Do not use chemicals containing harsh material such as benzene, toluene, xylene, and acetone. |
| Operation Environment | Location: Indoor, no direct sunlight, dust free, almost non-conductive pollution (Note below)Relative Humidity: 20%-85%Altitude: < 2000mTemperature: 0°C to 50°C(Pollution Degree) EN 61010-1:2010 specifies the pollution degrees and their requirements as follows. The instrument falls under degree 2.Pollution refers to “addition of foreign matter, solid, liquid, or gaseous (ionized gases), that may produce a reduction of dielectric strength or surface resistivity”.Pollution degree 1: No pollution or only dry, non-conductive pollution occurs. The pollution has no influence.Pollution degree 2: Normally only non-conductive pollution occurs. Occasionally, however, a temporary conductivity caused by condensation must be expected.Pollution degree 3: Conductive pollution occurs, or dry, non-conductive pollution occurs which becomes conductive due to condensation which is expected. In such conditions, equipment is normally protected against exposure to direct sunlight, precipitation, and full wind pressure, but neither temperature nor humidity is controlled. |
| Storage environment | · Location: Indoor · Temperature: -25°C to 70°C · Relative Humidity: <90% |
Disposal  | Do not dispose this instrument as unsorted municipal waste. Please use a separate collection facility or contact the supplier from which this instrument was purchased. Please make sure discarded electrical waste is properly recycled to reduce environmental impact. |
| Battery | · Type: Rechargeable Li-ion polymer · Model: FT8862103P · Manufacturer: Chinese Precision Technology (Assembled in China) · Rating: 7.4Vdc ===, 6100mAh (45 Watt) |
 Battery Caution Battery Caution | · The internal battery should not be replaced by the end-user. Please return the unit back to your local dealer for assistance. · Never allow the battery to come in contact with fire or water. · Discard used batteries according to the manufacturer's instructions or local laws. · Read the manual before use. |
Power cord for the United Kingdom
When using the instrument in the United Kingdom, make sure the power cord meets the following safety instructions.
NOTE: This lead/appliance must only be wired by competent persons
WARNING: THIS APPLIANCE MUST BE EARTHED
IMPORTANT: The wires in this lead are coloured in accordance with the following code:
Green/ Yellow: Earth
Blue: Neutral
Brown: Live (Phase)
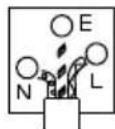
As the colours of the wires in main leads may not correspond with the coloured marking identified in your plug/appliance, proceed as follows:
The wire which is coloured Green & Yellow must be connected to the Earth terminal marked with either the letter E, the earth symbol or coloured Green/Green & Yellow.
The wire which is coloured Blue must be connected to the terminal which is marked with the letter N or coloured Blue or Black.
The wire which is coloured Brown must be connected to the terminal marked with the letter L or P or coloured Brown or Red.
If in doubt, consult the instructions provided with the equipment or contact the supplier.
This cable/appliance should be protected by a suitably rated and approved HBC mains fuse: refer to the rating information on the equipment and/or user instructions for details. As a guide, a cable of 0.75mm^2 should be protected by a 3A or 5A fuse. Larger conductors would normally require 13A types, depending on the connection method used.
Any exposed wiring from a cable, plug or connection that is engaged in a live socket is extremely hazardous. If a cable or plug is deemed hazardous, turn off the mains power and remove the cable, any fuses and fuse assemblies. All hazardous wiring must be immediately destroyed and replaced in accordance to the above standard.
GETTING STARTED
This chapter will allow you to quickly set up a GDS-200 or GDS-300 series oscilloscope and run over the basic operation and features.
Before you can get started, you will need to check the package contents (standard accessories, page 14). After the contents are checked the Overview section will describe all the major features and functions of the oscilloscopes in the GDS-200 and GDS-300 series. The Appearance section will go over the front, rear and side panels of the instrument. The Display Overview will give a brief introduction to the display and how the display changes depending on the current function, orientation or mode. Lastly the Getting Started section will explain how to turn on the instrument, explain how to set up the instrument, and go over the gestures and operating conventions that are used with the capacitive touch panel on the unit.
GDS-200 and GDS-300 Series Overview....12
Series Lineup 12
Main Features....12
Accessories....14
Appearance.... 15
GDS-200/300 Front Panel....15
Rear Panel....17
Interface Panel....18
BNC Panel 20
Display Overview....21
Horizontal 21
Vertical....22
How to Use the Touch Interface....25
Help Menu....28
Initial Setup 30
Power Up 30
USB Driver Installation 31
Tilting the Stand....32
Setting the System Date & Time 33
Setting the Language 34
Switching Horizontal and Vertical View....34
Compensating a Probe 34
GDS-200 and GDS-300 Series Overview
Series Lineup
There are 6 models in the series, divided by DSO bandwidth, DSO memory depth, DMM digit resolution and the DMM temperature function.
| Model name | Bandwidth | Memory depth | DMM Resolution | Temperature measurement |
| GDS-207 | 70MHz | |||
| GDS-210 | 100MHz | 1M points per channel | 312 | No |
| GDS-220 | 200MHz | |||
| GDS-307 | 70MHz | |||
| GDS-310 | 100MHz | 5M points per channel | 412 | Yes |
| GDS-320 | 200MHz |
Note: Throughout the user manual, when we are referring to any of the models generically, we will write “GDS”, “GDS-200” or “GDS-300”, unless explicitly stated otherwise.
Main Features
Performance
• 1 G Sa/s sampling rate max
• 70/100/200MHz bandwidth
• Acquisition memory: 5Mpts for GDS-300 series; 1Mpts for GDS-200 series
- Max 300Vrms (CAT II, DSO); 600V (CAT II) or 300V (CAT III) for DMM
• 30,000 Waveforms can be replayed
Features
• Simultaneous DMM and DSO operation
• Portrait and landscape modes
- Large 800 x 480 TFT panel and capacitive touch panel
- 7.4V/6100mAh battery for up to 4 hours operation
• Support for differential probes
- Handy APPs – EE calculator, Resistance calculator, Attenuation calculator
• Shielded BNC terminals
- DSO Features
- X-Y mode
- Go/No Go
• 36 automatic measurement functions - Trend plot
- Edge, Alt, Video and Pulse trigger functions
- FFT, FFTrms, +, -, /, * math functions
- Replay function
• DMM Features
- 50,000 counts
- DCV, DCA, ACV, ACA, R, Diode, Continuity, Temperature
- Fuse protection for the current ports
Interface
- Mini-B USB device port
Accessories
| Standard Accessories | Part number | Description |
| Certificate of calibration | ||
| 82DS-2200E01 | User manual CD | |
| GAP-001 | AC-DC adapter | |
| GTP-100A-4 | 100MHz Probe. for GDS-207 /307, GDS-210 /310 | |
| GTP-200A-4 | 200MHz Probe. for GDS-220 /320 | |
| GTL-207 | Multimeter test lead x2 | |
| GSC-010 | Soft carrying case (large) | |
| GSC-011 | Protection bag (small) | |
| GWS-001 | Wrist strap | |
| Optional Accessories | Part number | Description |
| GDP-040D | Dual-channel Differential Probe, Only for GDS-200/300 | |
| GTL-253 | Type A - Mini-B USB cable | |
| GCL-001 | Vertical Calibration cable | |
| Download | Name | Description |
| dso_vpo.inf | USB driver |
Appearance
GDS-200/300 Front Panel
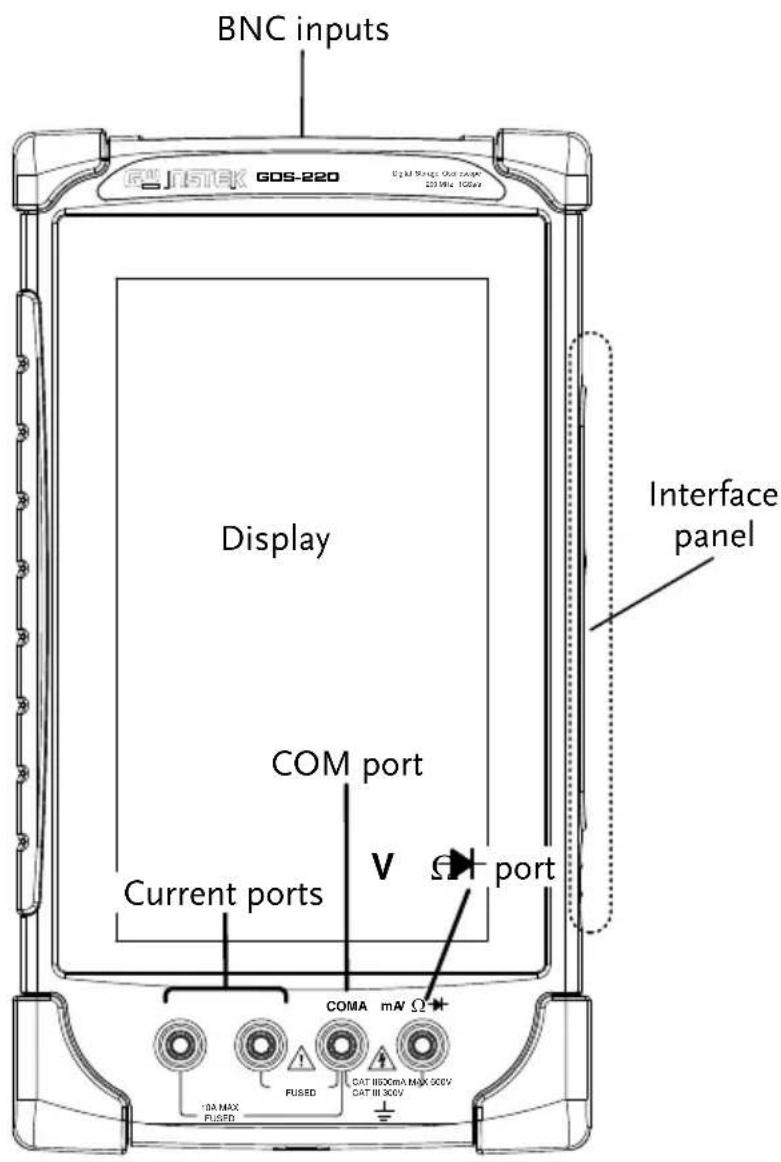
Display Color LCD screen, 800 x 480, capacitive touch.
Interface Panel The interface panel holds a number of different interfaces such as the input power socket, USB device port and the options power port. See page 18 for details.
DMM Ports
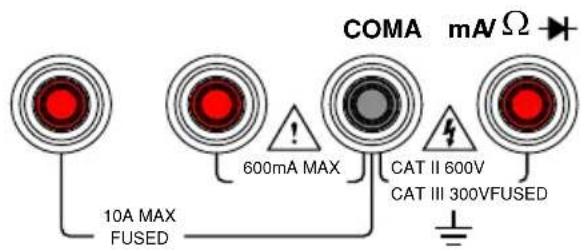
mA
Accepts up to 600mA.
Fuse protection: 1A.
A
Accepts up to 10A.
Fuse protection: 10A
COM
Com port
Voltage, Resistance and Diode port.
Max voltage: 600V
Rear Panel
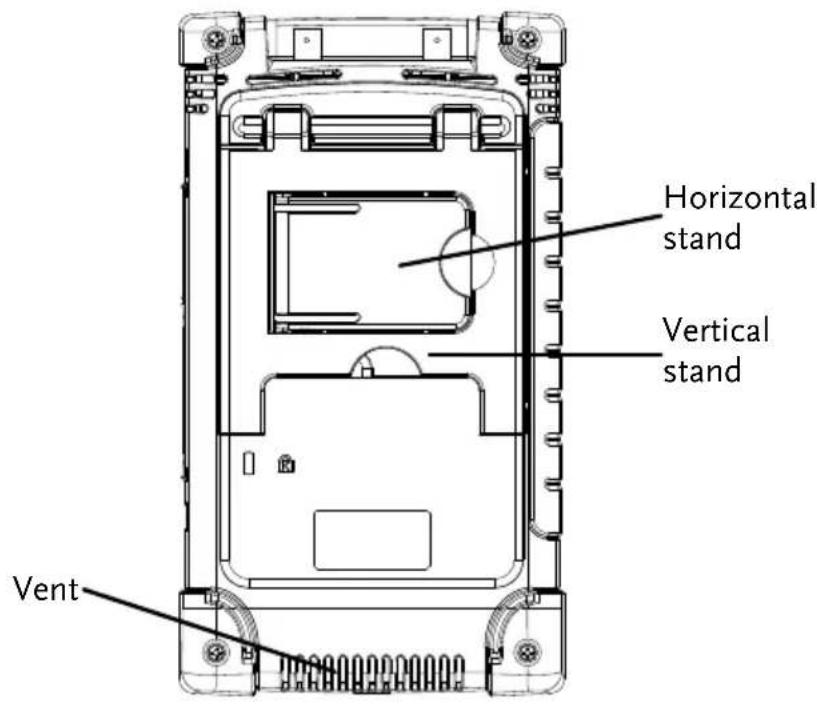
Vent Do not block the vent opening.
Vertical Stand Use the vertical stand to position the unit vertically.
Horizontal Stand Use the horizontal stand to use the unit horizontally.
Interface Panel
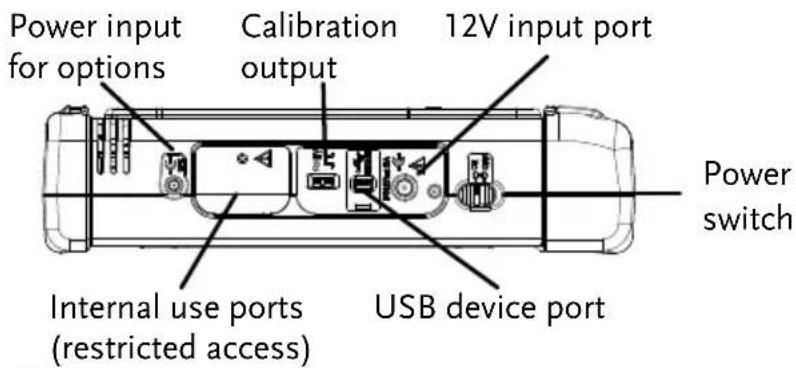
Power Switch
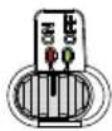
Power switch to turn the unit on or off.
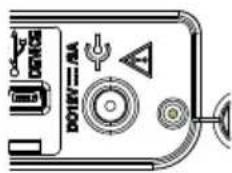
DC input. This port is used for charging the internal lithium battery. Accepts power from the supplied AC-DC power adapter.
Input Voltage: 10.5V - 13.5V Input Current: At least 3.5A.
USB Device Port
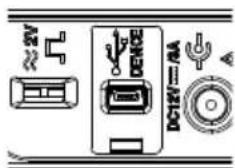
Mini-B USB device port. This port is used access the internal 120MB flash memory. When connected to a PC, the GDS-200/300 will be recognized as an external hard disk.
Calibration Port
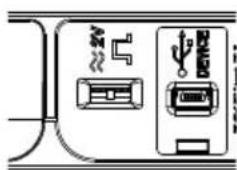
The calibration port is used to output a 2Vpk-pk 1kHz square wave for probe calibration purposes.
Internal Use Port
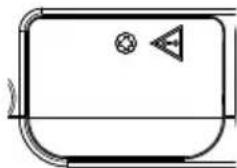
natural_image
Simple line drawing of a rectangular device with circular and triangular symbols on the sides (no text or labels)This panel houses two ports that are for internal use only. Use of these ports are restricted and not for end-user use.
External Power Port.
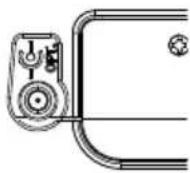
This port supplies power for optional accessories such as the differential probe option (GW part number: GDP-040D
Voltage output: 5V Current output: 250mA
BNC Panel
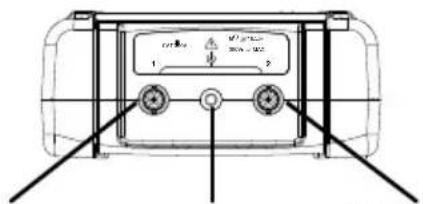
CH2 inputT
CH1, CH2 Inputs Channel 1 and channel 2 BNC inputs.
Input impedance: 1MΩ
Input Capacitance: 16.5pF
Max voltage: 300V max (CAT II)
Tapped Hole
The tapped hole is used to secure the differential probe option to the GDS-200/300. See the differential probe manual for details.
Display Overview
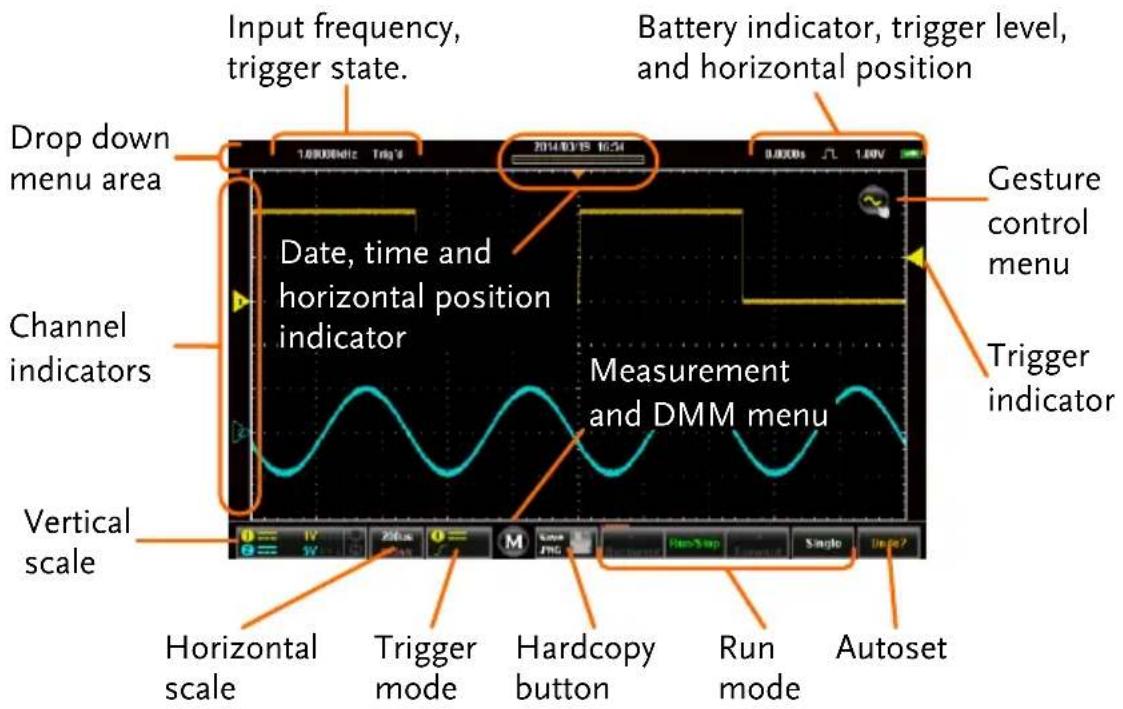
Horizontal
Vertical
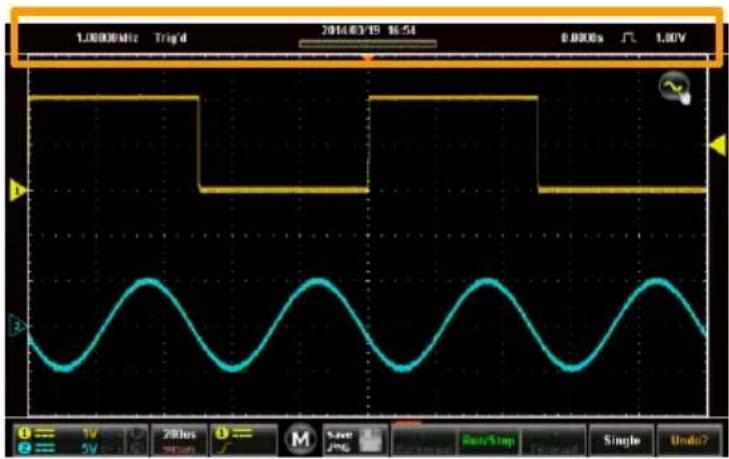
In order: Input frequency, trigger state, time, horizontal position, acquisition mode, trigger level, battery indicator.
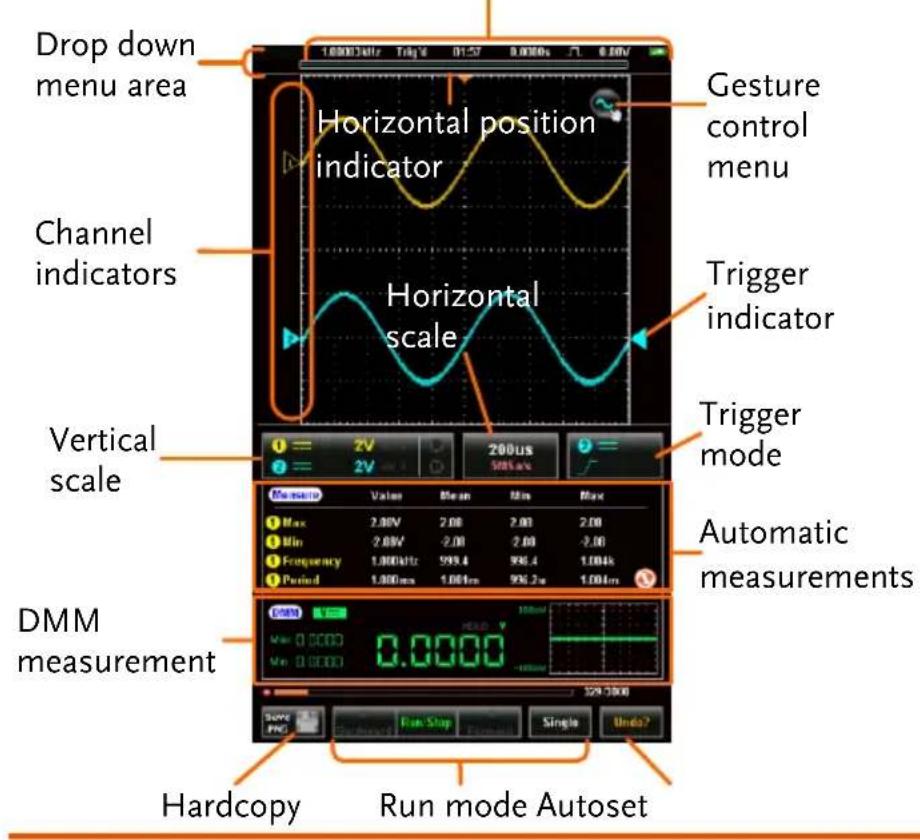
| Input Frequency | Displays the triggered signal frequency. |
| Trigger State | Indicates the trigger state:Trig'd (triggered)Stop<2Hz |
| Date and Time | Displays the date (horizontal only) and time.See page 33 to set the time. |
| Horizontal Position | Shows the horizontal position. |
| Acquisition Mode | Displays the acquisition mode (Sample, Peak Detect, Average) |
| Horizontal Window Indicator | Shows the current horizontal scale and position in relation to the record length. |
| Drop Down Menu Area | Tapping anywhere in the title bar will trigger the drop down menu. |
| Gesture Control Menu | The gesture control menu allows you to configure whether the touch gestures control the input waveforms or the cursors. This menu will also turn the cursor display on or off. |
| Channel Indicators | The channel indicator shows the vertical position of each active channel. |
| Trigger Indicator | Selects the trigger input channel and selects the trigger source. |
| Vertical Scale | Shows the vertical scale of each active channel. Indicates whether any of the reference or math channels are activated. |
| Horizontal Scale | Indicates the horizontal scale and the sampling rate. |
| Trigger Mode | Shows and configures the trigger settings. |
| Automatic Measurements | Shows the automatic measurements. The automatic measurements can be minimized or hidden when used in the horizontal mode. |
| DMM Measurements | Shows the DMM measurements. When in the horizontal view the DMM measurements can be minimized or even hidden. |
| Hardcopy Key | The Hardcopy key is used as a quick-save key either for image screenshots, waveforms, setup files or all of the above. |
| Run Mode(Backward, Run/Stop, Forward, Single) | The Run/Stop key is used to start/stop acquiring samples. The Forward/Backward keys step backward/forward through each consecutively sampled waveform. The Single key puts the trigger into single mode. |
| Autoset | The Autoset function automatically configures the panel settings to position the input signal to the best viewing condition. |
How to Use the Touch Interface
Background
Unlike other oscilloscopes or digital multimeters, the GDS-200 and GDS-300 Series have no physical hardware keys, therefore operation is completely controlled using the capacitive touch screen. Using a capacitive touch screen is a new interface paradigm for DSOs; the gestures and general user interface is easier to use and more intuitive than traditional DSO interfaces. Before you begin to use these instruments, we highly recommend you take a few moments to get to know the basic gestures and interface conventions.
Basic Gestures
There are a few basic gestures that can be used to operate the GDS-200/GDS-300. When asked to perform a gesture throughout the user manual, you can refer to the gestures below.
Tap / Press
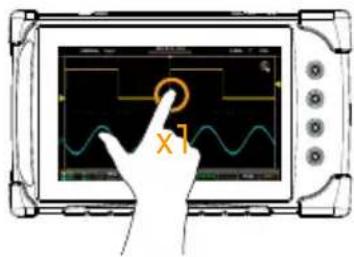
Tap/Press once to select an item.
The gesture will be recognized after you lift your finger off the display.
Long Press / Tap & Hold
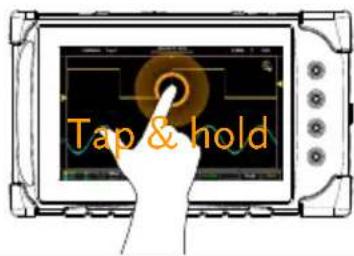
Press and hold an item until a sub-menu system or secondary option appears.
Swipe
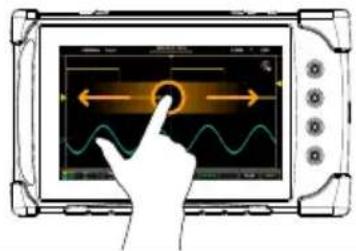
natural_image
Illustration of a hand interacting with a digital oscilloscope displaying waveforms (no text or symbols visible)Horizontally swipe on the screen.
Scroll
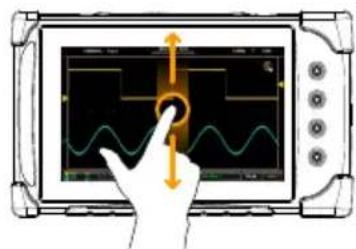
natural_image
Illustration of a hand interacting with an oscilloscope displaying waveforms (no text or symbols visible)Drag your finger vertically on the screen to scroll.
Pinch In
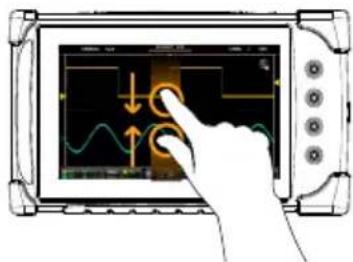
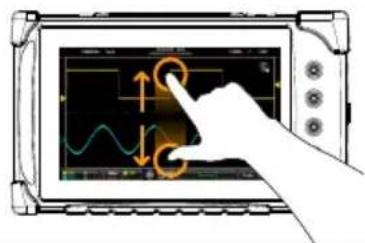
Pinch the screen to zoom out (make the waveforms smaller), or spread your fingers apart to zoom in (make the waveforms larger).
Pinch Out
Drag and drop
Drop Drag
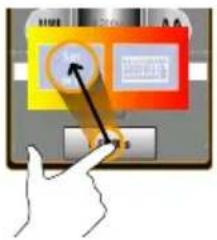
Drag an item to an option and let go*.
*The drag and drop gesture is usually used in the Horizontal, Vertical or Trigger menu to manually set a positional value.
Help Menu
Background
If at any time you are not sure how to use a particular function, the help icon can be used to put an overlay on the screen to show the basic function of each icon.
Steps
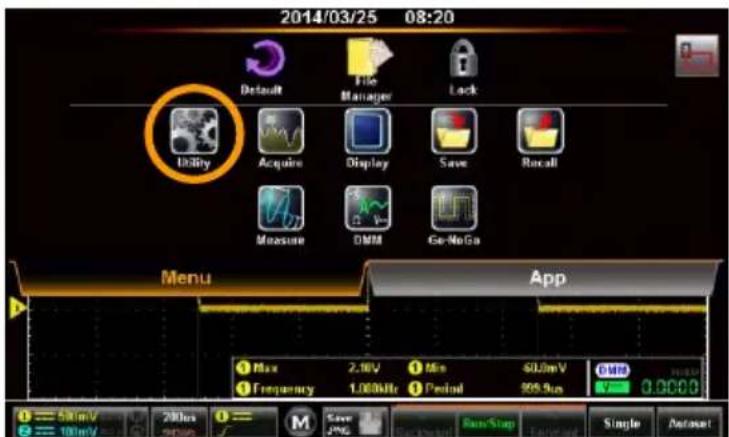
Tap the title bar on the top of the LCD display to bring up the Drop Down menu.
Tap on the Utility icon.
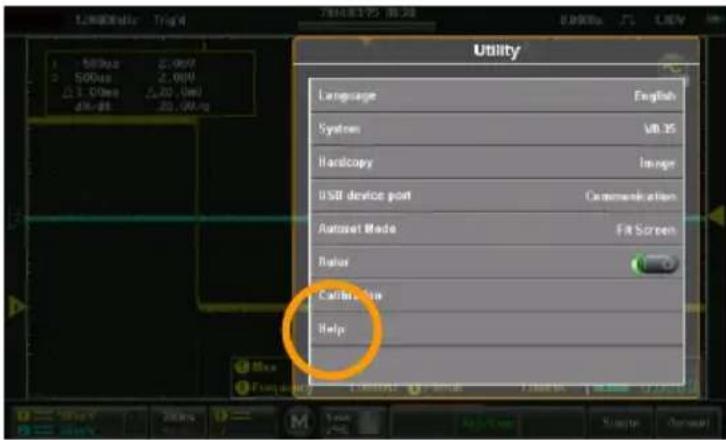
Tap on the Help option in the Utility menu.
The help screen overlay is shown on the display. There are three help screens. Use the numbered icons, 1, to view the corresponding help screen. Use the exit icon to exit from the help screen.
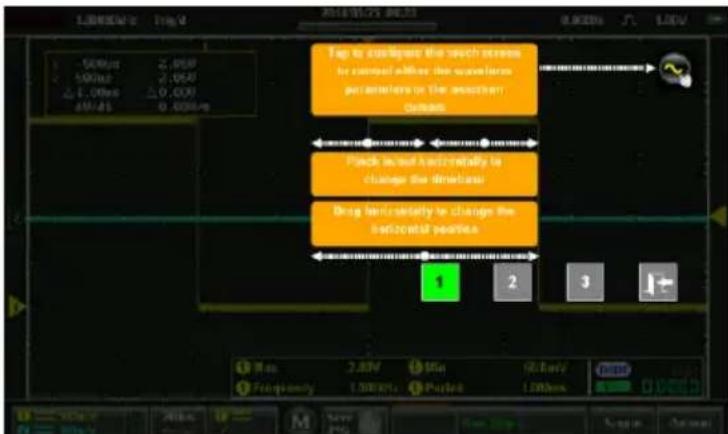
flowchart
graph TD
    A["Start"] --> B{Step 1: Tap to trigger the switch screen for command within the waveform parameters on the waveform output}
    B --> C{Step 2: Check as well horizontally to change the direction}
    C --> D{Step 3: Check horizontally to change the horizontal position}
    D --> E["End"]
Initial Setup
This chapter should be used to set up the instrument when used for the first time or if the firmware has been updated.
Power Up
| Requirements | Before the unit is powered up for the first time, it is recommended that the unit is first fully charged. |
| Steps | Plug the AC-DC power pack into the mains outlet.Connect the 12V plug into the 12V socket on the interface panel of the GDS-200/300.The unit will begin charging. An orange battery indicator light indicates charging, while green indicates charged.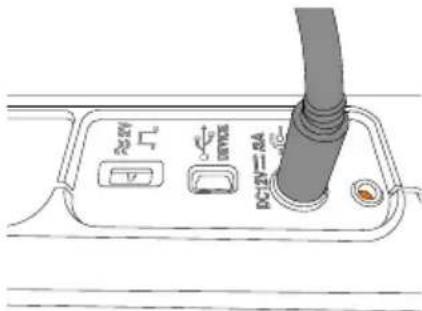 Battery indicator4. Slide the power switch to the ON position, located on the interface panel. Battery indicator4. Slide the power switch to the ON position, located on the interface panel.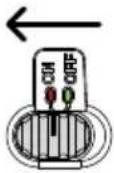 5. The unit will turn on in a short while. 5. The unit will turn on in a short while. |
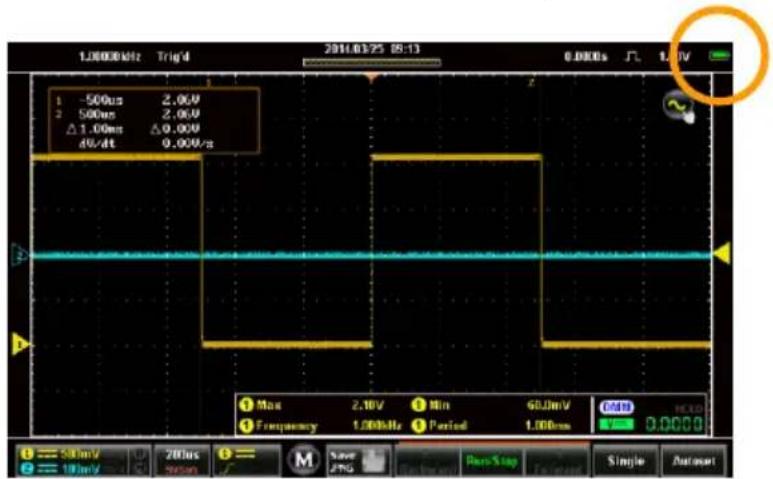
- The battery indicator is shown on the top right-hand corner of the main display.
USB Driver Installation
Background
The GDS-200/300 has a USB device driver that should be installed to get the most out of the unit.
Installation
-
Turn off the GDS-200/300.
-
When the PC is on, connect the USB cable from the GDS-200/300 to the PC.
-
Turn the GDS-200/300 on.
-
Access the Menu tray by pressing the title bar. Go to Utility>USB device port and set the device port to Communication.
-
The PC will now recognize the unit as a new device and ask to search for the driver.
-
Direct the driver installation wizard to the USB device driver (dso_vpo.inf) on the User Manual CD.
-
The GDS-200/300 will now be recognized as a virtual com port (VCP).
Tilting the Stand
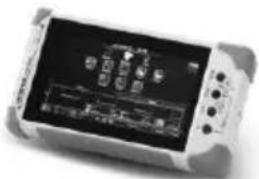
Horizontal
natural_image
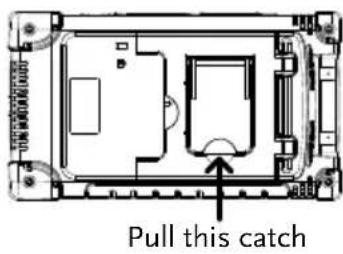
Black-and-white photo of a handheld electronic device displaying an abstract diagram on its screen (no readable text or symbols)To tilt the stand horizontally, pull the catch from the smaller of the two stands.
Vertical
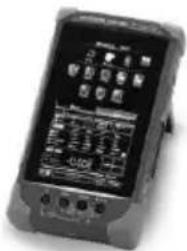
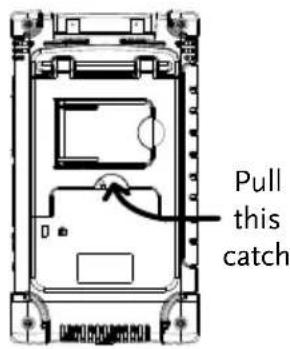
To tilt the stand vertically, release the catch from the larger of the stands.
Setting the System Date & Time
Background
The GDS-200/300 will keep the date and time settings saved so long as the battery is not allowed to fully discharge.
-
Access the Menu tray by tapping the title bar.
-
Press Utility>System>Date&Time.
The Date&Time menu will appear.
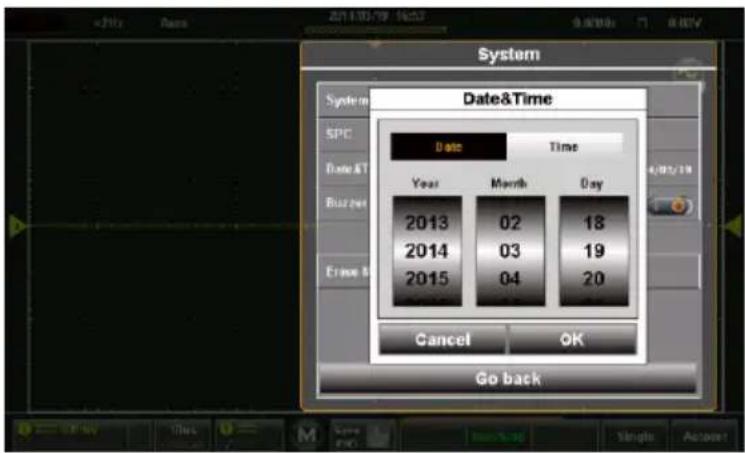
-
To set the date, press Date and use the number picker to set the year, month and day.
-
To set the time, press Time and use the number picker to set the hour and minute.
-
Press OK to save the date and time settings.
Note
The date and time settings only remain saved if the battery is not fully drained. However, if the unit shuts down due to insufficient battery power, there will usually still be enough battery power to keep the internal clock running for sometime.
Setting the Language
| Background | The GDS-200/300 menu system can be set to display a number of languages. |
| 1. Access the Menu tray by tapping the title bar.2. Press Utility>System>Language.The Language menu will appear.3. To set the language, press your preferred language. |
Switching Horizontal and Vertical View
| Background | By default the GDS-200/300 is set to the vertical view. |
| Switch View | 1. Tap the title bar to access the Menu tray.2. Press the icon to toggle between horizontal and vertical view. |
Compensating a Probe
| Background | To demonstrate connecting the probes, we will use the 1kHz calibration signal on the interface panel and compensate the probe from this signal. |
| Connection | 1. Connect a probe to the CH1 BNC terminals. |
-
Set the probe attenuation to x10 on the probe.
-
Connect the probe to the 2V calibration signal. The calibration signal outputs a 1kHz, 2Vpp square wave signal.
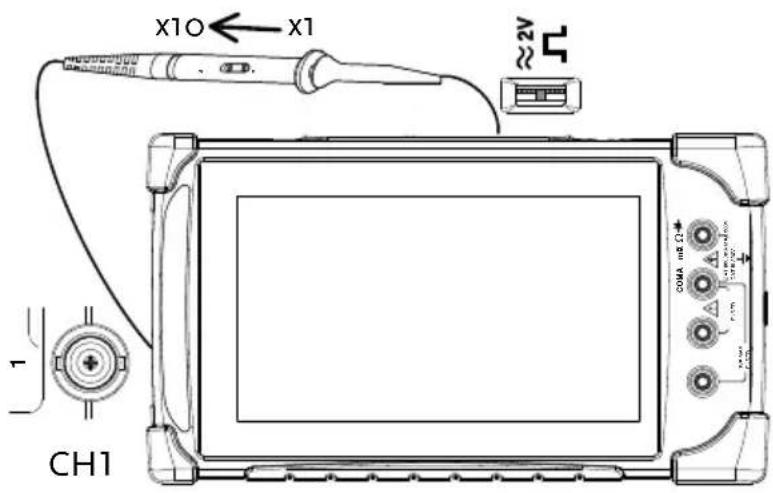
-
Press the
-
Select CH1, if it is not already selected.
-
Press the option icon.
-
Press Probe and set the probe to 10X.
-
Exit from the Vertical menu (tap anywhere outside the Vertical menu).
-
Press the Asset set button on the bottom corner of the screen.
-
The calibration signal is displayed on the screen.
-
Tap the title bar to access the Menu tray.
-
Press Display>Type and select Vector as the
interpolation type.
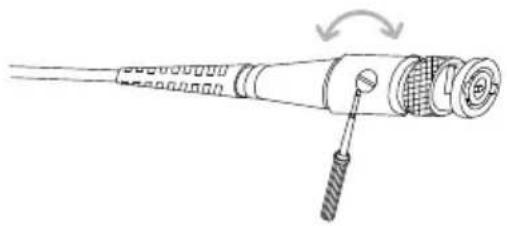
- Turn the adjust point on the probe until the probe is properly compensated.
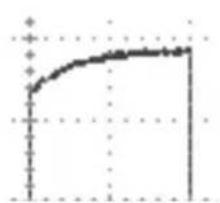
line
| X | Y | |---|---| | 0 | 0 | | 1 | 0.5 | | 2 | 0.75 | | 3 | 0.9 | | 4 | 0.95 | | 5 | 0.98 | | 6 | 0.99 | | 7 | 0.995 | | 8 | 0.998 | | 9 | 0.999 | | 10 | 1 | | 11 | 1 | | 12 | 1 | | 13 | 1 | | 14 | 1 | | 15 | 1 | | 16 | 1 | | 17 | 1 | | 18 | 1 | | 19 | 1 | | 20 | 1 | | 21 | 1 | | 22 | 1 | | 23 | 1 | | 24 | 1 | | 25 | 1 | | 26 | 1 | | 27 | 1 | | 28 | 1 | | 29 | 1 | | 30 | 1 | | 31 | 1 | | 32 | 1 | | 33 | 1 | | 34 | 1 | | 35 | 1 | | 36 | 1 | | 37 | 1 | | 38 | 1 | | 39 | 1 | | 40 | 1 | | 41 | 1 | | 42 | 1 | | 43 | 1 | | 44 | 1 | | 45 | 1 | | 46 | 1 | | 47 | 1 | | 48 | 1 | | 49 | 1 | | 50 | 1 | | 51 | 1 | | 52 | 1 | | 53 | 1 | | 54 | 1 | | 55 | 1 | | 56 | 1 | | 57 | 1 | | 58 | 1 | | 59 | 1 | | 60 | 1 | | 61 | 1 | | 62 | 1 | | 63 | 1 | | 64 | 1 | | 65 | 1 | | 66 | 1 | | 67 | 1 | | 68 | 1 | | 69 | 1 | | 70 | 1 | | 71 | 1 | | 72 | 1 | | 73 | 1 | | 74 | 1 | | 75 | 1 | | 76 | 1 | | 77 | 1 | | 78 | 1 | | 79 | 1 | | 80 | 1 | | 81 | 1 | | 82 | 1 | | 83 | 1 | | 84 | 1 | | 85 | 1 | | 86 | 1 | | 87 | 1 | | 88 | 1 | | 89 | 1 | | 90 | 1 | | 91 | 1 | | 92 | 1 | | 93 | 1 | | 94 | 1 | | 95 | 1 | | 96 | 1 | | 97 | 1 | | 98 | 1 | | 99 | 1 | | Note: The actual values in the 'Y' column are not explicitly labeled in the code provided in the code. The 'X' label is not present in the code. The 'Y' label is estimated based on the 'Y' label in the code. There is no additional data series in this code. The values are estimated based on the 'Y' label in the code. There is no trend or variation in the data series. The values for the last two series (after the first) are estimated based on the given code.Under Compensation
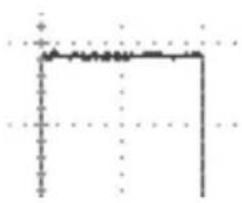
natural_image
Pure geometric lines forming an L-shape with no text, numbers, or symbolsNormal
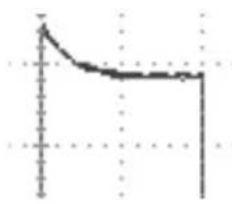
natural_image
Simple line drawing of a downward curve with vertical tick marks (no text or symbols)Over Compensation
natural_image
Diagram of a medical or surgical device with a screw inserted, showing internal components and a rotation arrow (no text or symbols)
PERATION
Gesture Control.... 41
Select a Channel, Math or Reference Waveform......41
Set the Vertical Position of the Selected Waveform 42
Set the Vertical Scale of the Selected Waveform....43
Set the Horizontal Position 44
Set the Horizontal Scale....45
Select the Trigger Source and the Trigger Level....46
Common Menu UI Elements.... 47
Radio Check Boxes....47
Toggle Switches....47
Sliding Scales....47
Value Picker....48
Keyboards and Keypads 48
Vertical Menu Operation 50
Vertical Icon Overview....50
Entering the Vertical Menu....51
Channel or Reference/Math Waveform Selection and Activation....51
Vertical Scale and Position 52
Vertical Options – Channel....53
Vertical Options - Reference Waveforms....56
Vertical Options - Math....56
Horizontal Position 59
Horizontal Expansion....60
Zoom....63
Trigger Menu Operation 66
Trigger Icon Overview....66
Entering the Trigger Menu....67
Trigger Setting.... 68
Trigger Types....68
Trigger Parameters and Settings 69
Trigger Mode....71
Forced Trigger....72
Alternate Trigger....72
Trigger Level 73
Edge Trigger....74
Pulse Trigger....76
Video Trigger 77
Autoset 78
Run Mode 80
Run/Stop and Single Key Overview....80
Run/Stop Mode....81
Single Mode 82
Cursor Measurements 83
Using Cursors....83
Automatic Measurements....86
Measurement Types....86
Viewing Automatic Measurements....89
Selecting an Automatic Measurement....90
Automatic Measurement Options....92
Drop-Down Menu.... 94
Opening the Drop-down Menu....94
Return to Default Settings....94
Panel Lock 95
Utility Menu 96
Accessing the Utility Menu....96
Set the Language 96
View System Information....97
Signal Path Compensation....98
Setting the System Date & Time 99
Touch Sounds ....100
Erase Memory....100
Configure the Hardcopy Function....100
Configure USB Device Port....102
Configure Autoset Mode....103
Set Ruler....104
Calibration 105
Acquire Menu....107
Accessing the Acquisition Menu....107
Select Acquisition Mode 108
Show Waveform in XY Mode 109
Set the Record Length....110
Set the Interpolation....111
Display Menu....112
Accessing the Display Menu 112
Display the Waveform as Dots or Vectors 112
Set the Level of Persistence....113
Set the Waveform Intensity....114
Set the Graticule Intensity....115
Set the Graticule Type....116
Set the Brightness Level....117
Go-NoGo Menu....118
Accessing the Go-NoGo Menu....118
Configuring the Go-NoGo Menu....118
Running a Go-NoGo Test....122
Save Operations....124
Accessing the Save Menu....124
Saving and Configuring Image Files....125
Saving and Configuring Waveform Files....128
Saving and Configuring Setups....131
Saving and Configuring Images, Waveforms and Setups All at Once......133
Recall Operations....135
Accessing the Recall Menu....135
Recalling Waveform Files 135
Recalling Setups 138
File Manager....139
Accessing the File Manager....139
Navigating the File System....140
DMM Mode....143
Accessing the Multimeter 143
Multimeter Display Overview....145
AC/DC Voltage Measurement....145
Current Measurement ...... 146
Resistance Measurement....147
Diode Measurement....149
Continuity Measurement....150
Temperature Measurement....152
EE APPs 154
Accessing the EE Apps 154
Attenuator Calculator....155
Advanced DMM 156
Calculator....158
QR Code Link App....159
Resistance Calculator....159
Gesture Control
This chapter will go over all of the basic touch gestures that are available using the default settings. The touch gestures cover all the most frequently used operations that an engineer uses, allowing the GDS-200/300 to operate completely without panel keys or knobs.
The gestures described below are only applicable if "Waveform" is selected as the gesture control method. See page 83 for details.
Select a Channel, Math or Reference Waveform
| Background | Any channel, math waveform or reference waveform that has already been turned on can be selected from the left of the grid. See page 51 to turn on a waveform, math function or waveform. |
| Steps | To select the active waveform, tap the desired channel, math or reference indicator.When selected, the icon will become a solid triangle. |
Example
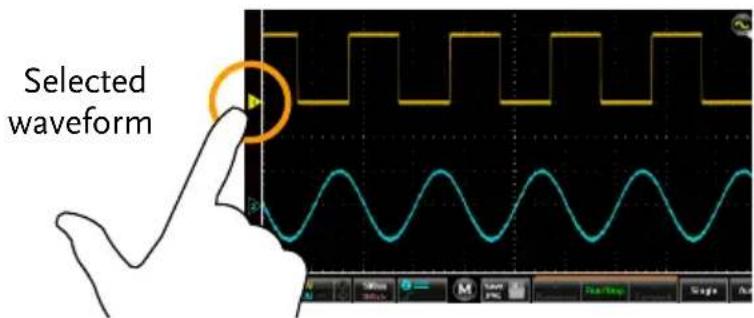
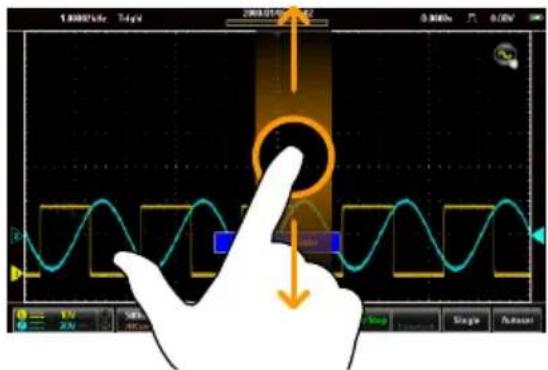
Set the Vertical Position of the Selected Waveform
| Background | The touch screen can be used to conveniently set the vertical position of the selected waveform. |
| Steps | Swipe the screen vertically to set the vertical position of the selected waveform.The vertical position will also be shown in a popup window.The waveform will automatically snap to the zero position at each crossing. To move past the zero position, use the swipe gesture again.Tapping the upper or lower part of the screen will also increase/decrease the vertical position. |
Example
Set the Vertical Scale of the Selected Waveform
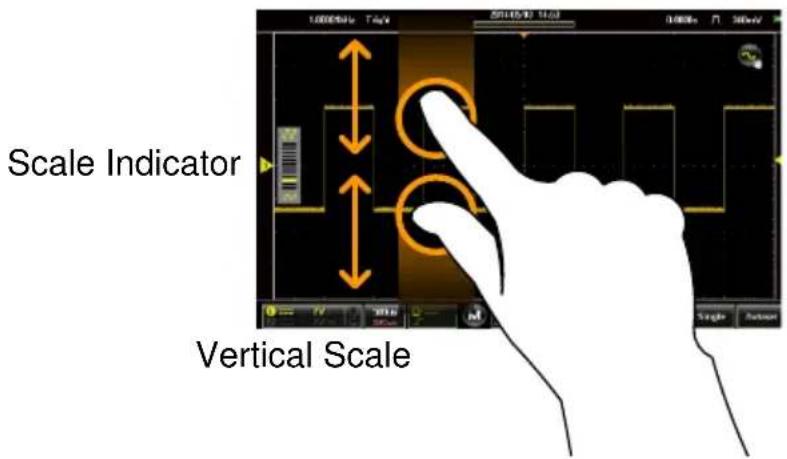
| Background | The touch screen can be used to conveniently set the vertical scale of the selected waveform. To set other vertical scale options, see from page 53 |
| Steps | Pinch in/out vertically to set the vertical scale of the selected waveform.A scale indicator will popup to show the current scale in relation to full vertical scale range.When the scale indicator appears, simply tapping the upper or lower half of the screen will also change the vertical scale.The vertical scale (as a value) is shown in the bottom left-hand side of the display. |
Example
Set the Horizontal Position
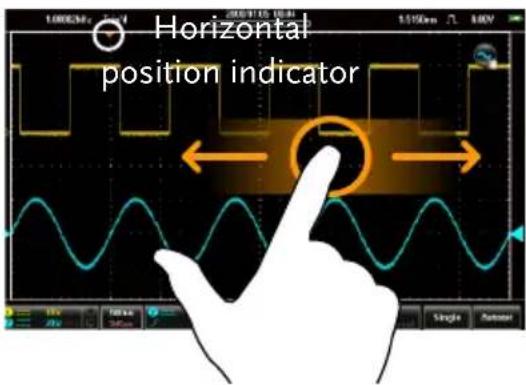
| Background | The touch screen can be used to conveniently set the horizontal position. |
| Steps | Swipe the screen horizontally to set the horizontal position of the displayed waveforms.The horizontal indicator is a solid orange triangle at the top to the grid.The horizontal position (as a value) is shown at the top of the grid.The waveform will automatically snap to the zero position at each crossing. To move past the zero position, use the swipe gesture again. |
Example
Horizontal Position
Set the Horizontal Scale
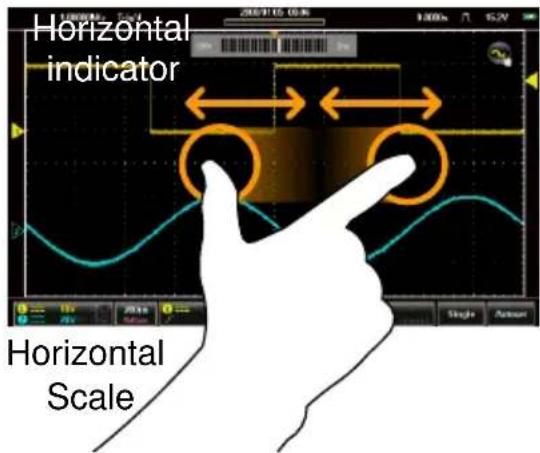
| Background | The touch screen can be used to conveniently set the horizontal scale of the displayed waveforms. To set other horizontal scale options, see page 60. |
| Steps | Pinch in/out horizontally to set the horizontal scale of the display.A scale indicator will popup to show the current scale in relation to full horizontal scale range.When the scale indicator appears, simply tapping the left or right-half of the screen will also change the horizontal scale.The horizontal scale (as a value) is shown in the bottom left-hand side of the display. |
Example
Select the Trigger Source and the Trigger Level
Background
The touch screen can be used to conveniently select the trigger source as well as set the trigger level.
Select Trigger Source
Tap on the trigger level indicator to toggle between trigger sources.
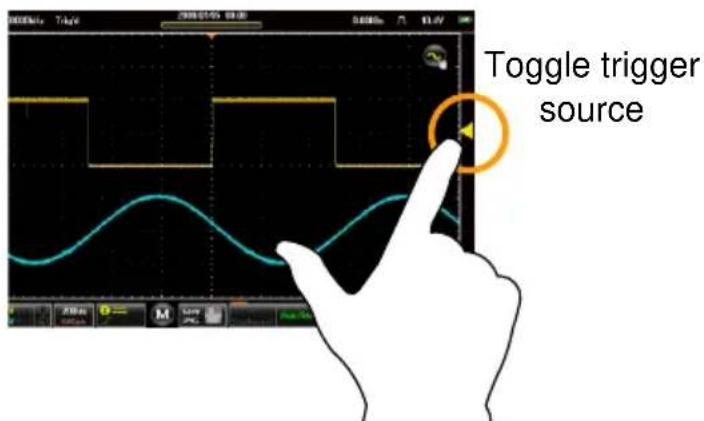
Set the Trigger Level
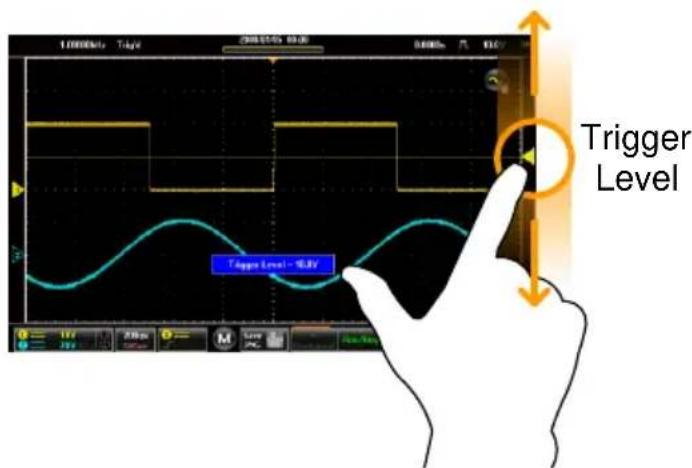
Swipe the screen to the right of the grid to set the trigger level with the currently selected source.
The trigger level will also be shown in a popup window.
Example
Common Menu UI Elements
This section will give a brief overview of some of the common UI elements that are used to select parameters and values in menus. Not all of the UI elements look the same but will have similar functions. User interface elements that are not shown below will be specifically shown in the user manual.
Radio Check Boxes
Background
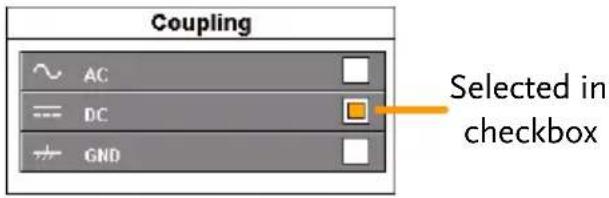
A radio checkbox allows a single option to be selected.
Example
Toggle Switches
Background
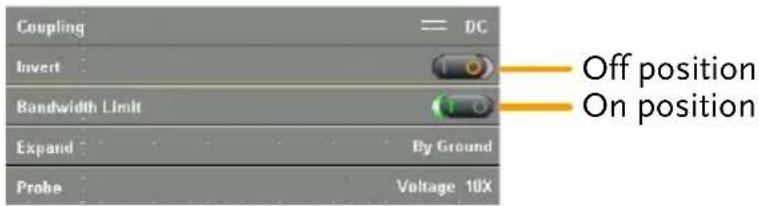
Toggle switches are used to turn options on or off.
Example
Sliding Scales
Background
Sliders are used to quickly enter a value, on a sliding scale. They are usually accompanied by some common preset value buttons.
Example
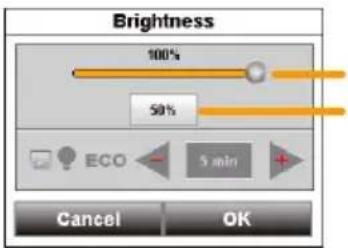
Slider Preset value button
Value Picker
Background
Value pickers are used to enter discrete values. They are usually accompanied by some common preset value buttons.
Example
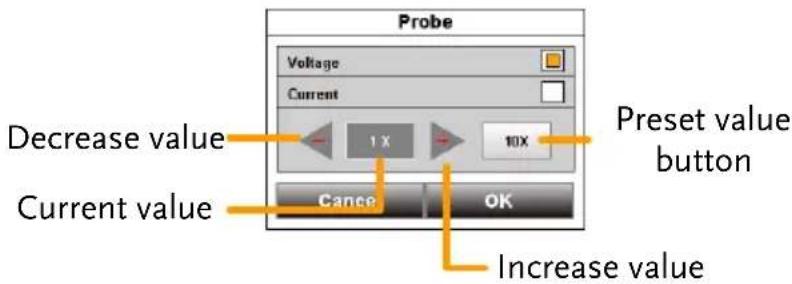
Keyboards and Keypads
Background
Software keyboards and keypads are used to enter specific values. Keyboards are used to enter letters and numbers, such as making text notes or files names. Keypads are used to enter values, such as the horizontal position.
Example: keypad
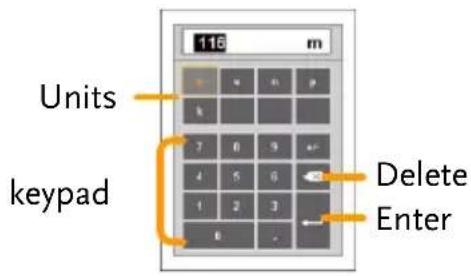
When using a keypad:
- Select the unit
- Enter the value using the keypad
- Press Enter to confirm the entered value.
Example: Keyboard
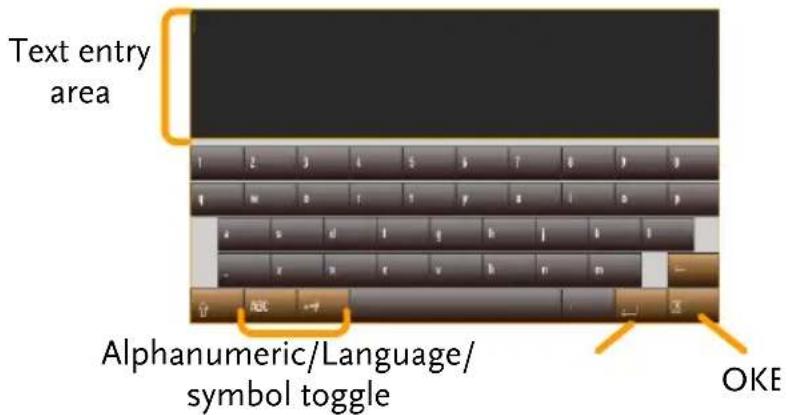
When using the keyboard:
- The text entry area will display the text that is entered.
- The +=# key will bring up a symbol keyboard
- The ABC/Language key will bring up the alphanumeric or native language keyboard.
- Press Enter to go to the next line.
- Press OK to finish entering the text.
Vertical Menu Operation
The vertical menu controls the vertical scale and position, channel activation, coupling, expansion modes and probe settings.
Vertical Icon Overview
Major settings that have been set in the vertical menu will be reflected in the Vertical icon.
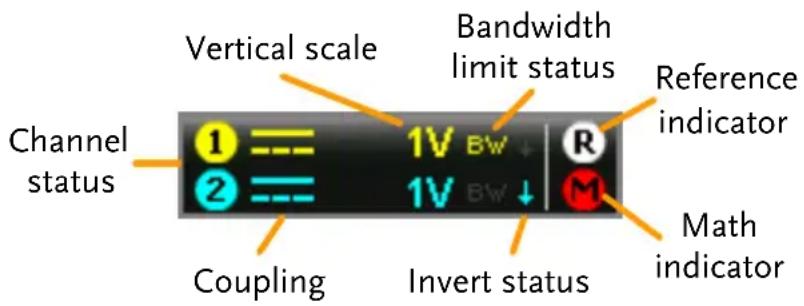
| Item | Description |
| Channel Status | Indicates if a channel is turned on. |
| Coupling | Indicates DC, AC or GND coupling. |
| Vertical Scale | Indicates the vertical scale. |
| Bandwidth | Indicates the bandwidth limit is turned on for that channel. |
| Limit Status | |
| Invert Status | Indicates that the channel waveform is inverted. |
| Reference | Indicates that either R1 or R2 is turned on. |
| Indicator | |
| Math Indicator | Indicates that the Math function is turned on. |
Entering the Vertical Menu
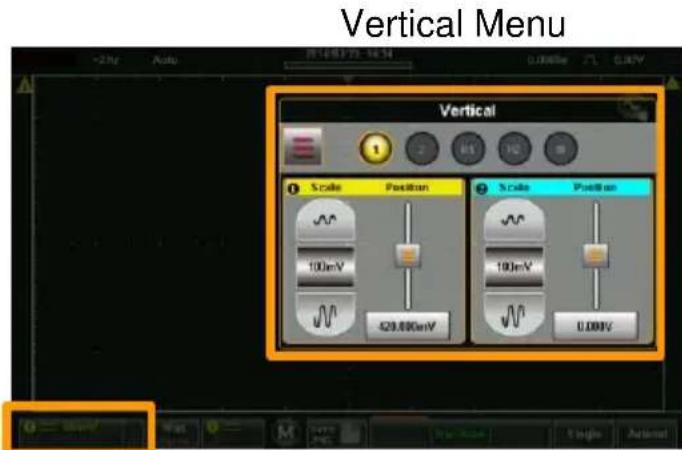
Steps
-
Press the vertical icon to bring up the vertical menu.
-
The Vertical Menu appears.
Vertical icon
Channel or Reference/Math Waveform Selection and Activation
Turning a Channel On
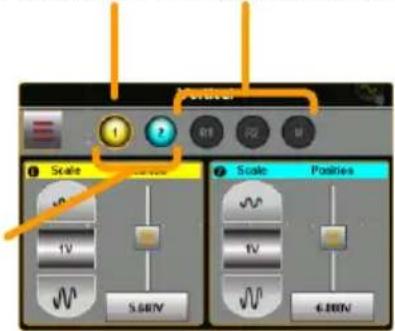
From the vertical menu press the icon of the desired channel, reference waveform or math waveform to turn the channel on or to select the channel as the active channel.
- When activated the channel icon will be colored.
- The active channel will have an orange ring around the channel icon.
- Channels that are turned off will be grayed-out.
Example
Selected/active channel Disabled channels
Activated
channels
Vertical Scale and Position
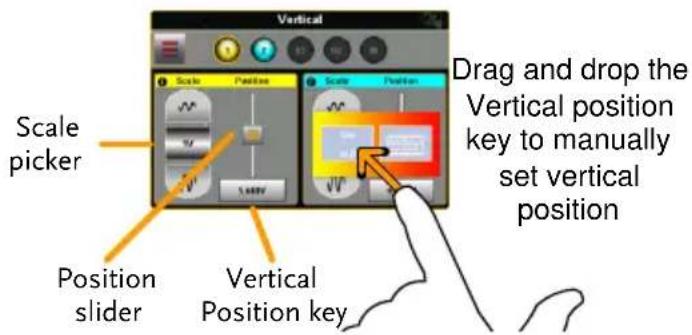
| Background | The vertical scale and position can be configured in the vertical menu in addition to the using the touch gestures. |
| Touch Control | Select the desired channel, reference waveform or math function. Page 41 |
| Note | Position: When using touch control, the waveform will automatically snap to the zero position at each crossing. To move past the zero position, use the swipe gesture again. |
| Menu Control | Use the scale picker to set the vertical scale for the selected channel.Use the position slider to set the vertical position for the selected channel.To set the vertical position to 0, drag from the Vertical Position key and drop to the “Set to 0” option.To manually set the vertical position, drag from the Vertical Position key and drop to the keyboard icon. Type in the value for the vertical position with the keypad that appears. |
Vertical Options – Channel
Background
The Options menu in the Vertical menu allows you to set the coupling, invert waveforms, turn the bandwidth limit on, set the expansion mode and set the probe attenuation.
Setup
-
Select a channel by tapping on the corresponding channel icon. Page 51
-
Press the Options icon to bring up the vertical options.
The vertical options for the selected channel/waveform will be displayed.
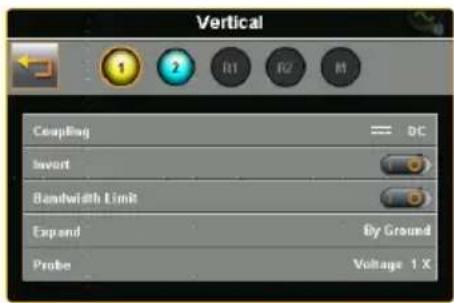
Coupling
-
Press Coupling to set the coupling for the selected channel.
-
Choose the coupling type in the Coupling menu that appears.
| Coupling DC, AC, GND | ||
| Invert | Press the Invert toggle switch to invert the waveform for the selected channel. | |
| Bandwidth Limit | Press the Bandwidth Limit toggle switch to turn the bandwidth limit on or off. | |
| Bandwidth limit 20MHz, Off | ||
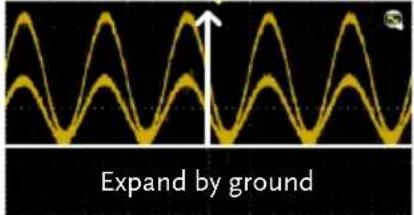
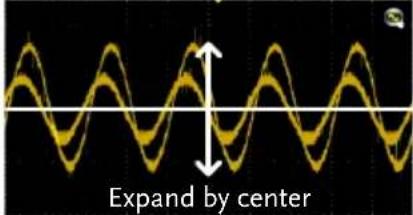
| Expand | When the voltage scale is changed, the Expand function designates whether the signal expands from the center of the signal or from the signal ground level. Expand by Center can be used to easily see if a signal has a voltage bias. Expand by Ground is the default setting. | |
| 1. Press the Expand key to set the expand mode for all the displayed waveforms. | ||
| 2. Choose the expansion type in the Expand menu that appears. | ||
| Expand By Center, By Ground | ||
| Example | Expand by Ground | Expand by Center |
 |  | |
Note
If the vertical scale is changed when the Expand function is set to ground, the signal will expand from the ground level. The ground level position does not change when the vertical scale is changed.
If the vertical scale is changed when the Expand function is set to center, the signal will expand from the center of the waveform window. The ground level position will suit to match the signal position.
Probe
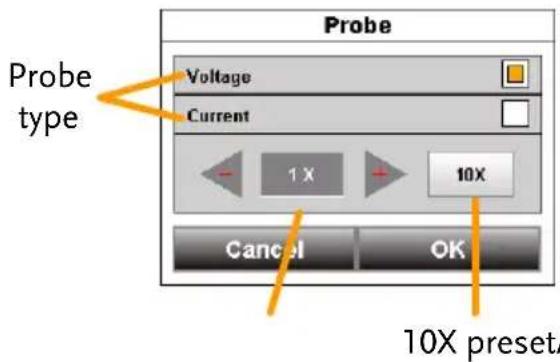
This menu sets the probe attenuation and the probe type.
Press Probe and set the probe parameters for the chosen channel in the Probe menu that appears.
| Probe Type | Voltage, Current |
| Probe attenuation | 0.001X - 1000X(1-2-5 step resolution) |
| 10X (preset) |
Vertical Options – Reference Waveforms
| Background | The Options menu in the Vertical menu allows you to view the selected reference waveform sample rate, record length and creation date. |
| Setup | 1. Select a reference by tapping on the corresponding R1 or R2 icon.Page 51 |
| 2. Press the Options icon to bring up the vertical options. | |
| The data for the selected reference waveform will be displayed. | |
| Note | The reference waveforms can only be recalled if they have been saved first. |
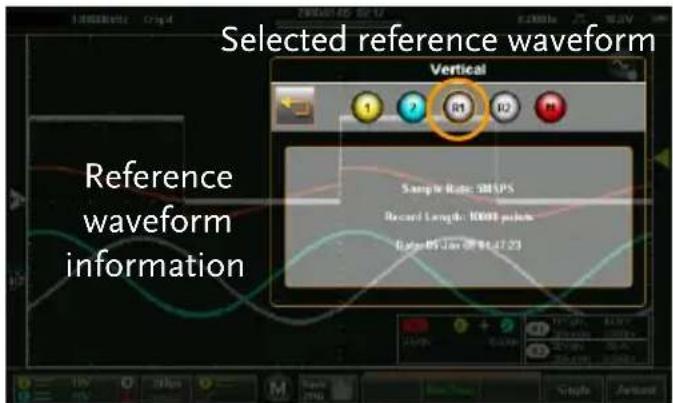
Vertical Options – Math
| Background | When Math (M) is selected, the Options menu in the Vertical menu allows you to set the math mode, source operators, units and windowing function. |
Setup
-
Select the math channel by selecting Page 51 the M icon.
-
Press the Options icon to bring up the math settings.
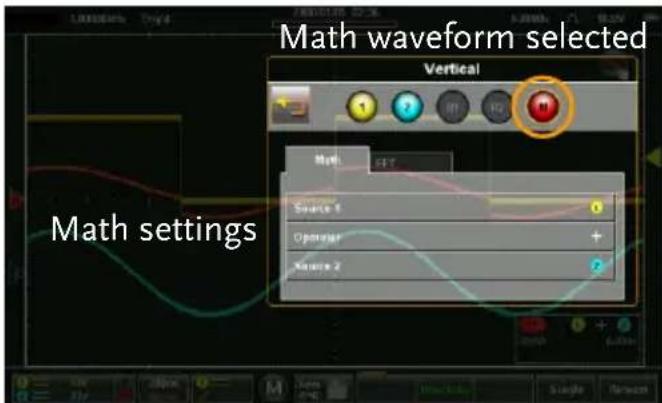
Math
-
Press the Math tab to reveal the math options.
-
From the Math tab select the sources and the math operator.
| Source 1 | CH1, CH2, Ref1, Ref2 |
| Operator | +, -, ×, ÷ |
| Source 2 | CH1, CH2, Ref1, Ref2 |
FFT
-
Press the FFT tab to reveal the FFT math options.
-
From the FFT tab select the source, units and FFT window function.
| Source 1 | CH1, CH2, Ref1, Ref2 |
| Operator | dBV RMS, Linear RMS |
| Window | Hanning, Rectangular, Hamming, Blackman |
Example
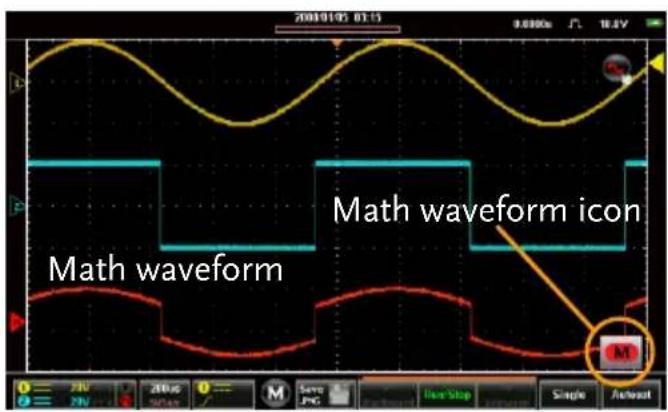
Math details
The Math icon can be expanded to show the sources, volt/div and offset of the Math function. Press the Math icon to toggle between the collapsed and expanded Math icon.
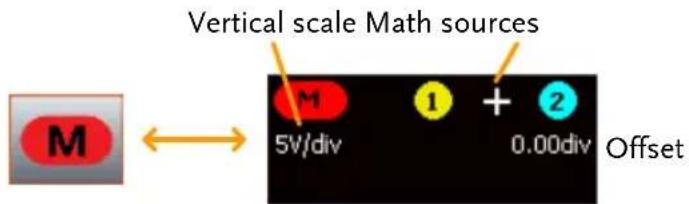
Collapsed Expanded
Horizontal Position
Background
The horizontal scale and position can be configured in the Horizontal menu in addition to the using the touch gestures.
Menu Control
-
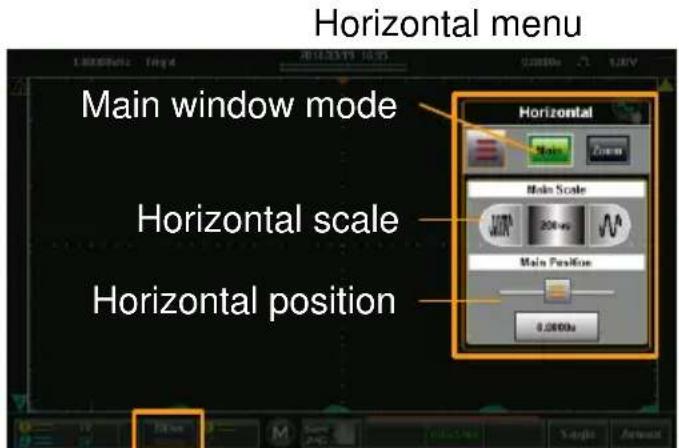
Press the 500us 2MSPS Horizontal key to access the Horizontal menu.
-
Press Main to set the scope to the main window mode.
Horizontal icon
-
From the Main horizontal menu the horizontal scale and position can be configured.
-
Use the scale picker to set the horizontal scale.
-
Use the position slider to set the horizontal position.
-
To set the horizontal position to 0, drag from the Horizontal Position key and drop to the "Set to 0" option.
-
To manually set the horizontal position, drag from the Horizontal Position key and drop to the keyboard icon. Type in the value for the horizontal position with the keypad that appears.
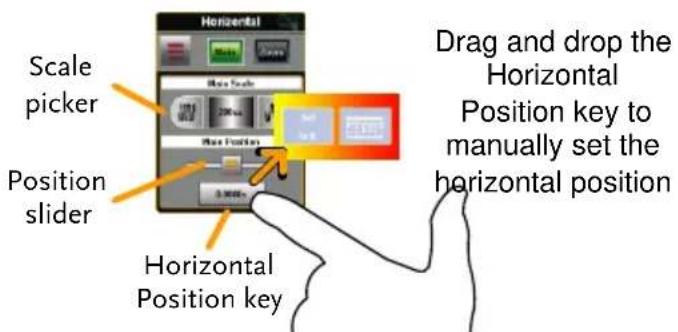
Touch Control
-
Swipe the screen to set the horizontal Page 44 position.
-
Use a pinch gesture to increase or decrease the horizontal scale. Page 45

Position: When using the touch screen to set the horizontal position, it will automatically snap to the zero position at each crossing. To move past the zero position, use the swipe gesture again.
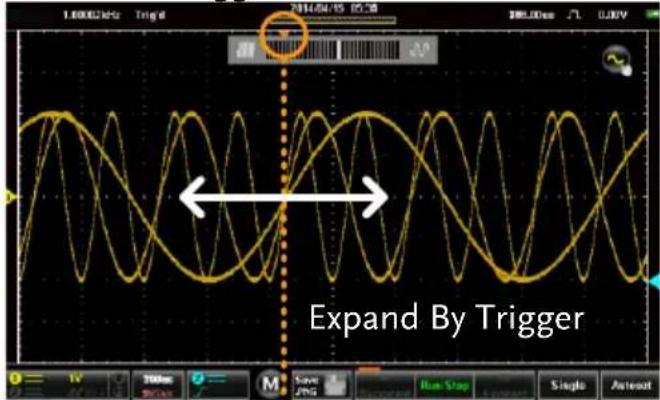
Horizontal Expansion
Background
The Options menu in the Horizontal/Zoom menu allows you to set the horizontal expansion mode.
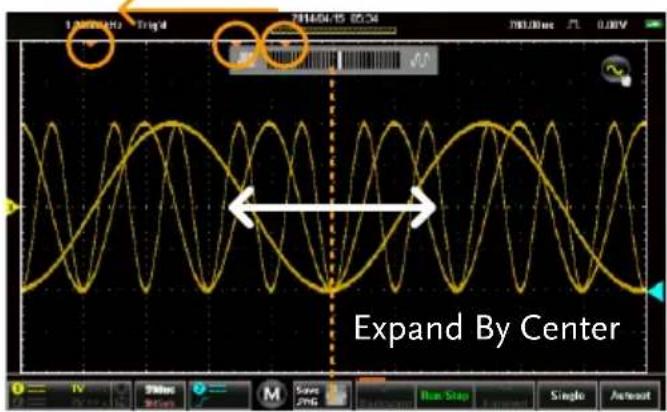
There are two horizontal expansion options: By Center and By Trigger Position.
By Center
Scales the waveform from the center of the display.
| By Trigger Position | Scales the waveform from the trigger position. |
Steps
- Access the Horizontal or Zoom menu.
Page 59 or 63
- Press the Options icon to bring up the Horizontal options menu.
The expansion settings will be displayed.
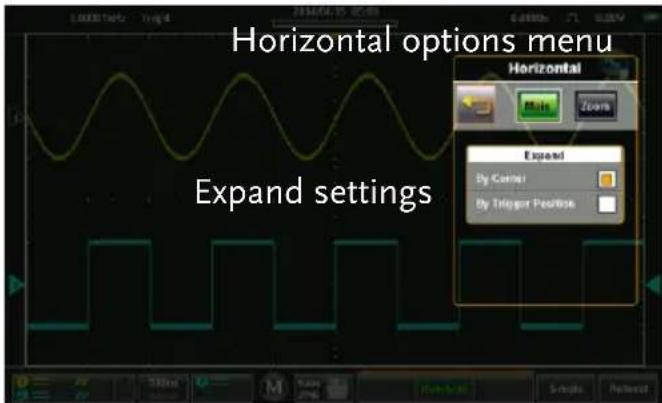
- Choose the expansion type in the Expand menu that appears.
Expand By Center, By Trigger Position
Example: By Center
Trigger position
Example: By
Trigger Position
Trigger Position
Zoom
Background
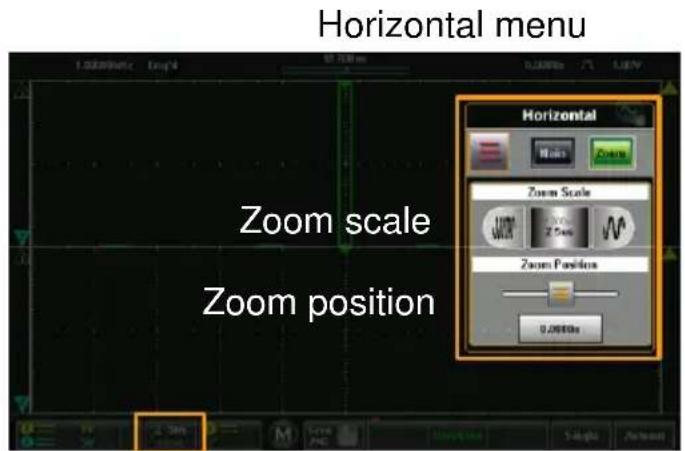
The Zoom menu can be accessed from the Horizontal menu.
Setup
-
Press the 500us 2MSPS Horizontal key to access the Horizontal menu.
-
Press Zoom to set the scope to Zoom window mode.
Horizontal icon
- From the Zoom horizontal menu the zoom scale and zoom position can be configured.
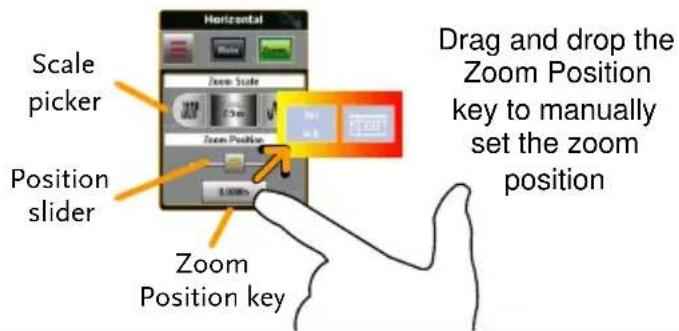
Menu Control
- Use the scale picker to set the horizontal scale for the zoom window.
- Use the position slider to set the horizontal position for the zoom window.
- To set the zoom position to 0, drag from the Zoom Position key and drop to the "Set to 0" option.
- To manually set the zoom position, drag from the Zoom Position key and drop to the keyboard icon. Type in the value for the zoom position with the keypad that appears.
Touch Control
-
The zoom window can be zoomed in and out using a horizontal pinch.
-
The horizontal position of the zoom window can be moved by swiping the screen left or right.
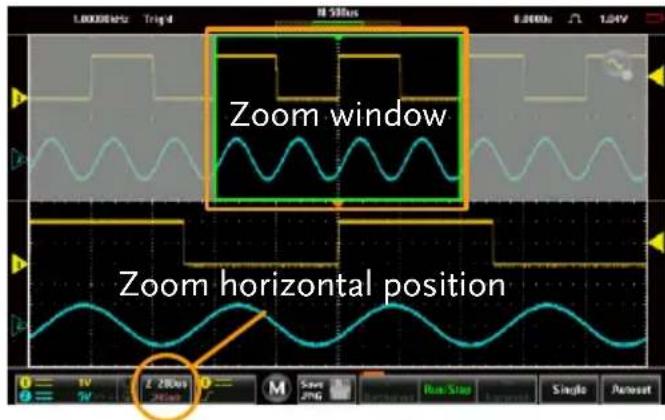
Note
Position: In the main display, the zoom window will automatically snap to the zero position at each crossing. To move past the zero position, use the swipe gesture again.
Trigger Menu Operation
The Trigger menu controls the trigger position, trigger type and trigger modes.
Trigger Icon Overview
The settings that have been set in the Trigger menu will be reflected in the Trigger Menu Icon.
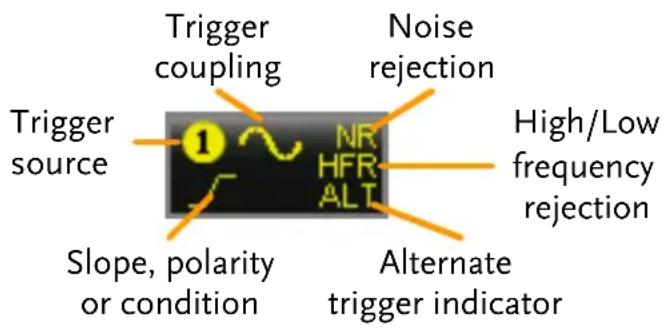
| Item | Description | |
| Trigger Source | Shows the trigger source channel. CH1, CH2 | |
| Trigger Coupling | Shows the trigger coupling. AC Coupling, DC Coupling | |
| Noise Rejection | Indicates that noise rejection is activated | |
| Frequency rejection | Indicates that high or low frequency rejection is activated. HFR = high frequency rejection LFR = low frequency rejection | |
| Alternate trigger indicator | Indicates that the alternate trigger is activated. | |
| Slope, polarity or condition | This area will display the current trigger conditions: | |
| Edge | Rising slope, Falling slope, Either slope | |
| Pulse | Falling edge, Rising edge | |
| Video | NTSC, PAL, SECAM | |
Entering the Trigger Menu
Steps
-
Press the HFR icon to bring up the Trigger menu.
-
The Trigger menu appears.
Example
Trigger menu
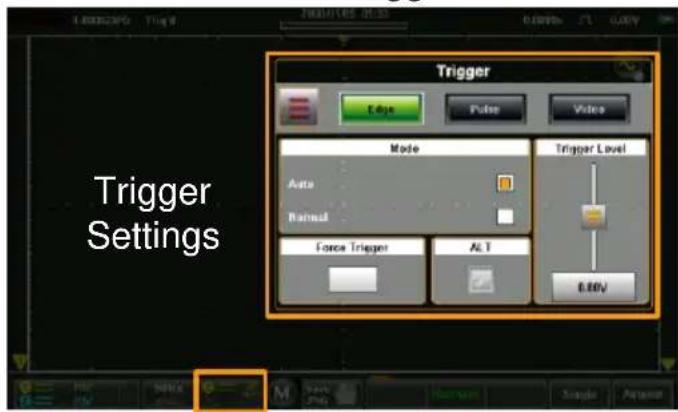
Trigger icon
Trigger Setting
Trigger Types
The trigger configures the conditions for when the GDS-200/300 captures a waveform.
Edge
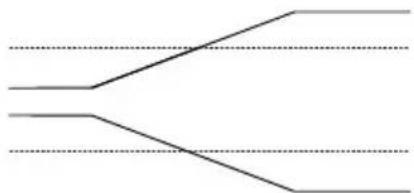
The edge trigger is the simplest trigger type. An edge trigger triggers when the signal crosses an amplitude threshold with either a positive or negative slope.
natural_image
Pure electrical circuit lines without any symbolsRising edge trigger
Triggers when the pulse width of the signal is less than, equal, not equal or greater than a specified pulse width.

Pulse width
Video
Extracts a sync pulse from a video format signal, and triggers on a specific line or field.
Trigger Parameters and Settings
The following trigger parameters apply to all the trigger types unless stated otherwise.
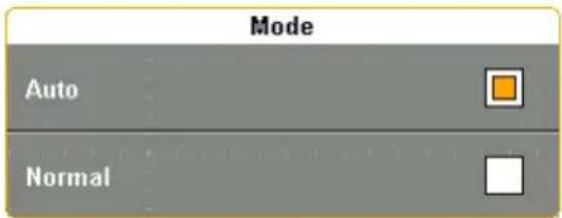
| Mode | Auto | The GDS-200/300 generates an internal trigger if there is no trigger event, to make sure waveforms are constantly updated regardless of trigger events. Select this mode especially when viewing rolling waveforms at slower timebases. |
| Normal | The GDS-200/300 only acquires a waveform when triggered. | |
| (Single) | Pressing the Single will acquire a single waveform. (This mode is not selectable from the Trigger menu. See page 82 for details) | |
| Force Trigger | This setting will force a trigger to be generated when pressed. This setting is useful if triggering a waveform is difficult. | |
| ALT | Alternates the source between channel 1 and channel 2. | |
| Trigger level | Level | Used to manually adjust the trigger level for the current source. |
| TTL (1.4V) | Sets the trigger level to 1.4V, suitable for triggering on TTL signals. | |
| ECL (-1.3V) | Sets the trigger to -1.3V. This is suitable for ECL circuits. | |
| 50% | Sets the trigger level to 50% of the waveform amplitude. | |
| Source | CH1, CH2 | Channel 1 or channel 2 input. |
| Coupling (Edge, Pulse only) | DC | Sets the coupling to DC. |
| AC | Sets the coupling to AC. | |
| Slope (Edge only) | Rising | Trigger on rising edge. |
| Falling | Trigger on falling edge. | |
| Either | Trigger on either rising or falling edge. | |
| Reject | Off | Frequency rejection turned off. |
| LFR | Low frequency rejection. | |
| HFR | High frequency rejection. | |
| NR | Noise rejection | |
| Holdoff | Holdoff | Sets the holdoff time. The holdoff time delays triggering the next waveform for a set amount of time after triggering. |
| Polarity (Pulse) | Positive polarity | Positive polarity (triggered on the high to low transition) |
| Negative polarity | Negative polarity (triggered on the low to high transition) | |
| Polarity (Video) | Positive polarity | Positive polarity. |
| Negative polarity | Negative polarity. | |
| Trigger When (Pulse) | = | Equal to. |
| > | Longer than. | |
| < | Shorter than. | |
| ≠ | Not equal to. | |
| When | Pulse width (10ns - 10s) | |
| Standard | NTSC | National Television System Committee |
| PAL | Phase Alternate by Line | |
| SECAM | SEquential Couleur A Memoire | |
| Trigger On | Field1 | Sets the trigger point to a line on field1 (odd). |
| Field2 | Sets the trigger point to a line on field2 (even). | |
| All Fields | Trigger on all fields. | |
| All Lines | Trigger on all lines. |
Trigger Mode
Background
The trigger mode can be set to Normal or Auto (untriggered roll). The triggering mode applies to all the trigger types. See page 69.
From the Trigger menu, set the Mode to Auto or Normal.
Forced Trigger
Background
If the input waveforms are not triggered, they can be force triggered using the Force Trigger button.
From the Trigger menu, press the Force Trigger button. The scope will trigger immediately.
Alternate Trigger
Background
The Alternate trigger allows the scope to trigger alternatively between CH1 and CH2.
From the Trigger menu, press the ALT button. A check will indicate if the ALT function is active. The ALT function applies to all the trigger types.
Trigger Level
| Background | The trigger level can be set using touch gestures or from the trigger level. |
| Touch Control | 1. Select the trigger source from the side of the graticule.2. Swipe up and down from the right side of the graticule to set the trigger level for the selected trigger source. |
| Menu Control | 1. From the Trigger menu use the Trigger Level slider to set the trigger level.2. To set the trigger level to 50%, drag from the Trigger Level button and drop to the “Set to 50%” option.3. To manually set the trigger level, drag from the Trigger Level button and drop to the keyboard icon. Type in the value for the trigger level with the keypad that appears. |
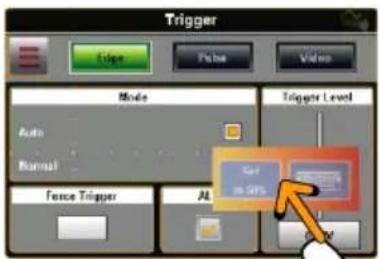
Drag and drop the Trigger Level button to manually set the trigger level
Trigger Level button
Edge Trigger
Background
The Edge trigger allows you to acquire a waveform on a rising or falling edge.
Setup
-
Press the Edge button.
-
Press the Options icon to bring up the Trigger options for the Edge trigger.
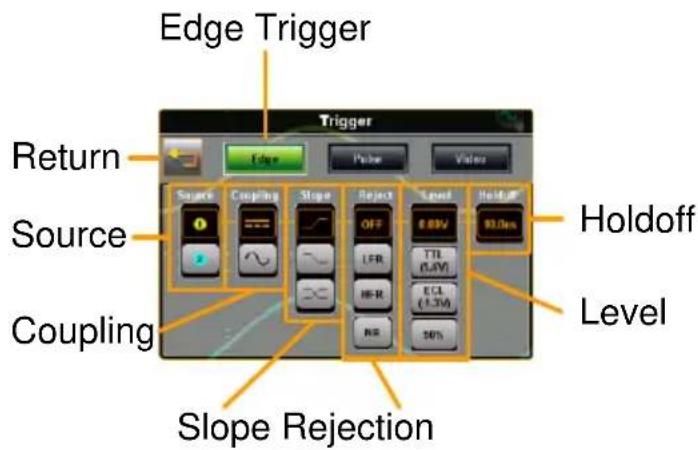
- Select the appropriate parameters. See page 69 for a description of each parameter.
Source CH1, CH2
Coupling DC, AC
Slope Rising, falling, either
Reject Off, low frequency rejection, high frequency rejection, noise rejection
Level 0.00V, TTL(1.4V), ECL(-1.3V), 50%
Holdoff 10ns - 10s
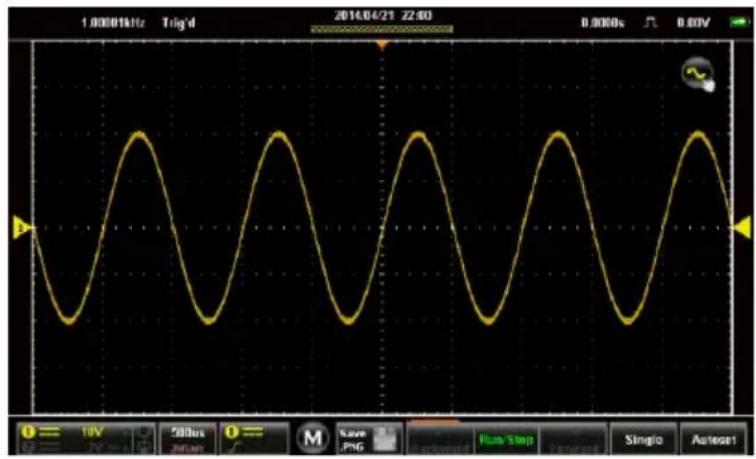
Example
Pulse Trigger
Background
The Pulse trigger allows you to acquire a waveform on a rising or falling pulse of a defined width.
Setup
- Press the Pulse button.
Page 67
- Press the Options icon to bring up the Trigger options for the Pulse trigger.
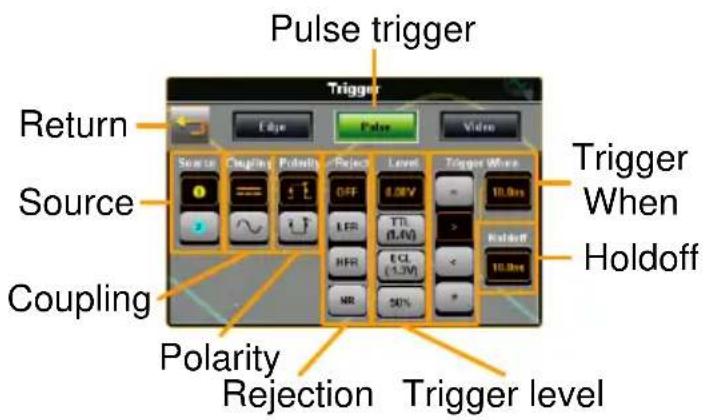
- Select the appropriate parameters. See page 69 for a description of each parameter.
Source CH1, CH2
Coupling DC, AC
Polarity Positive, negative
Reject Off, low frequency rejection, high frequency rejection, noise rejection
Level 0.00V, TTL(1.4V), ECL(-1.3V), 50%
Trigger Equal, greater than, less than, not When equal to. (Time: 10ns - 10s)
Holdoff 10ns - 10s
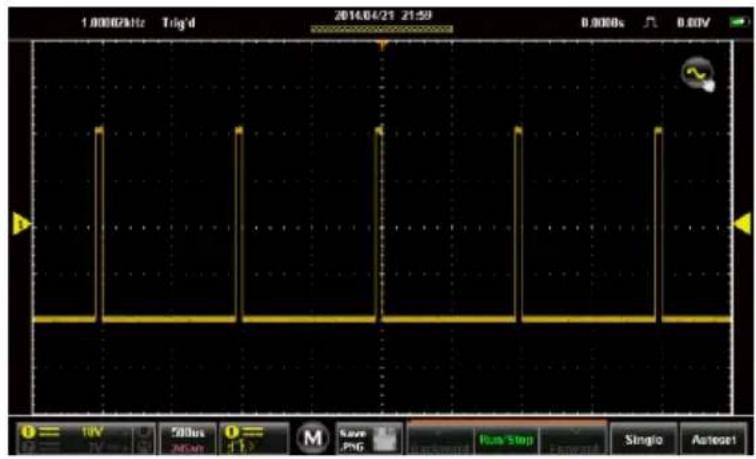
Example
Video Trigger
Background
The Video trigger allows you to acquire PAL, NTSC and SECAM video signals. The GDS-200/300 can trigger on any line or field.
Setup
- Press the Video button.
Page 67
- Press the Options icon to bring up the Trigger options for the Video trigger.
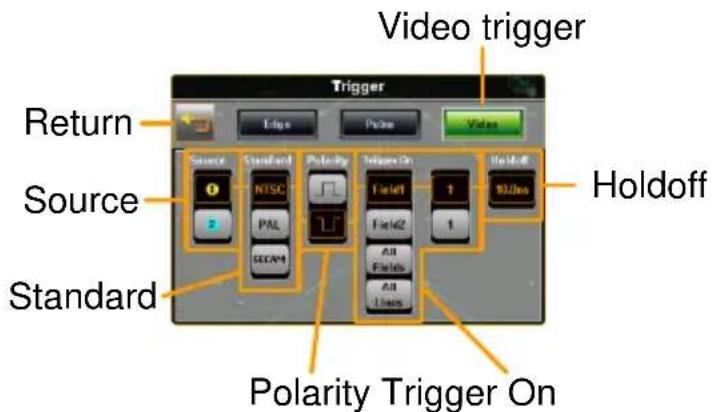
- Select the appropriate parameters. See page 69 for a description of each parameter.
Source CH1, CH2
Standard NTSC, PAL, SECAM
Polarity Positive, negative
Trigger On Field 1 (line 1-263), Field 2 (line 1-262), All Field, All Lines
Level 0.00V, TTL(1.4V), ECL(-1.3V), 50%
Holdoff 10ns - 10s
Example
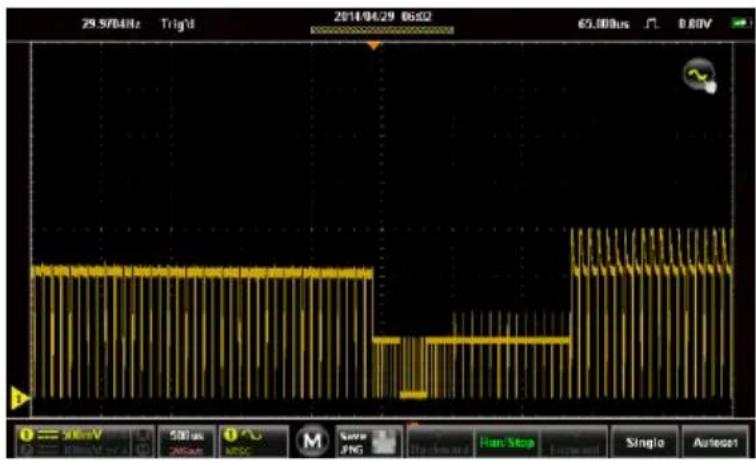
Autoset
Background
The Autoset function will automatically choose the best timebase and vertical scale for the activated waveforms. The Fit Screen and AC Priority settings position the input signal to the best viewing condition.

Note
Note the Autoset function is only applicable when the input is equal or greater than 30mV & 20Hz.
Autoset Settings
Descriptions
Fit Screen
Fit Screen mode will fit the waveform to the best scale, including any DC components (offset).
| AC Priority | AC Priority mode will scale the waveform to the screen by removing any DC component. | |
| Steps | 1. From the main display press the Autoset key. | Autoset |
| 2. The waveform will appear on the display. | ||
| 3. For a few seconds you will have the option to press [Lindn?] to undo the autoset configuration. | ||
| Autoset Mode | 1. Long press Autoset to bring up the Autoset Mode menu. | |
| 2. Press the appropriate check-box to select Fit Screen or AC Priority. | ||
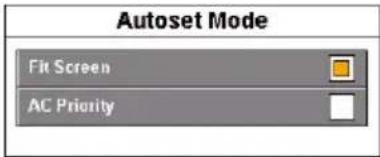 | ||
 | The Autoset Mode menu can also be accessed via the Utility menu, see page 103 for details. | |
Run Mode
The scope has three main running modes, Run, Stop and Single.
Run mode continuously captures (triggered) waveforms in a FIFO buffer. Each waveform that is captured can be replayed when the scope is in the Stop mode. The number of waveforms that are captured depends on the sample rate and the memory length.
Stop mode stops capturing waveforms and allows you to view any waveform that was previously captured in the Run mode.
Single mode captures a single waveform as soon as the trigger conditions are met.
Run/Stop and Single Key Overview
The Run/Stop key shows the Run/Stop status, the record progress of the captured waveforms and the navigation keys for navigating captured waveforms when in the Stop mode.
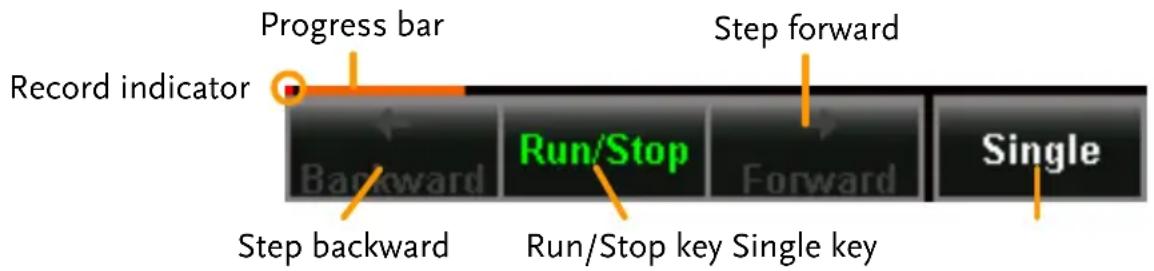
| Item | Description |
| Record Indicator | The Record indicator blinks when the scope is triggering. |
| Progress Bar | The Progress bar indicates the record progress. |
| Step Forward | Steps to the next captured waveform when the scope is in Stop mode. |
| Step Backward | Steps to the previous captured waveform when the scope is in Stop mode. |
| Run/Stop Key | Toggles the scope between Run and Stop mode. |
| Single Key | Turns on the Single Trigger mode. |
Run/Stop Mode
| Background | By default the scope is in Run mode as soon as it is turned on.The Run/Stop key is shown in green when the scope is in Run mode and red when it is in Stop mode. |
| Toggle Modes | Press the Run/Stop key to toggle between Run and Stop modes. |
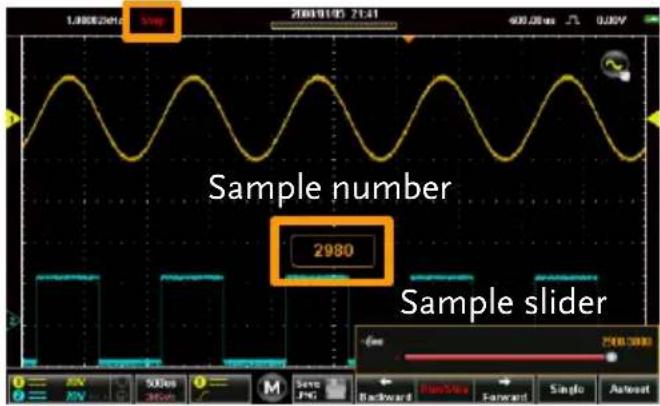
| Record Navigation | 1. Put the scope into Run mode (described above).2. After the desired number of samples has been recorded, toggle the scope to Stop mode by pressing the Run/Stop key.3. Use the Backward and Forward keys to navigate to the desired waveform sample.4. When the Backward or Forward keys are used a slider will appear allowing you to quickly navigate to the desired sample. The slider will disappear after a short while of inactivity.5. The slider can be pinned/unpinned from the menu bar by toggling the pin icon. |
Example
Trigger status
Single Mode
Single Mode
Single
Simply press the Single Single key to set the scope to single trigger mode.
The scope will capture a waveform when the trigger conditions are met. This is useful for intermittent signals.
Cursor Measurements
Horizontal or vertical cursors are used to show the position and values of waveform measurements and math operation results. These results cover voltage, time, frequency and other math operations. When the cursors (horizontal or combined) are activated, they will be shown on the main display unless turned off.
Using Cursors
Background
The Gesture Control icon is used to toggle the touch screen controls between Waveform controls and Cursor controls. The Cursor Display must be activated to use and see the cursor measurements.
Steps
- Press the Gesture Control icon, located in the top corner of the graticule.
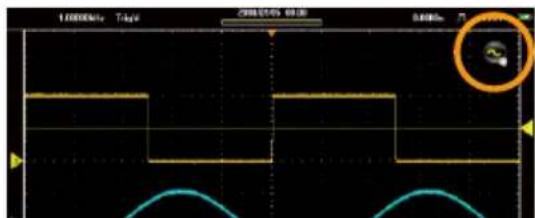
Gesture Control
-
Set the Gesture Control to Horizontal or Combined Cursor control.
-
Turn Cursor Display on.
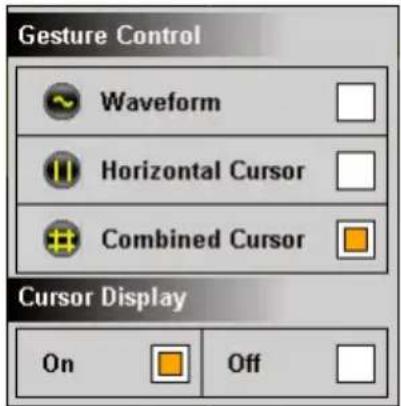
- Cursors will now appear on the display for the currently selected channel, 2 lined cursors for the Horizontal Cursor option and 4 lined cursors for the Combined Cursor option.
- The cursor measurements will appear in a window in the top left-hand side.
Horizontal:
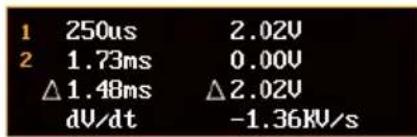
Cursor 1, 2 Time/frequency, voltage/current at crossing.
Delta (difference between cursors) dV/dt or dI/dt.
Combined:
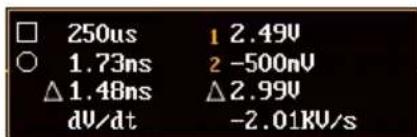
□,○
Time/Frequency: Cursor 1, cursor 2
Cursor 1, 2 Voltage/Current : Cursor 1, cursor 2
Δ Delta (difference between cursors) dV/dt or dI/dt.
- Pressing the cursor window will toggle the horizontal reading between frequency and time.
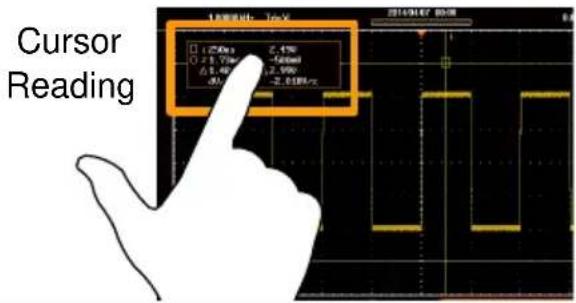
Moving the Cursors
-
To move the cursors horizontally, touch and swipe a cursor line horizontally to the desired position.
-
To move the cursors vertically, touch and swipe a cursor line vertically to the desired position.
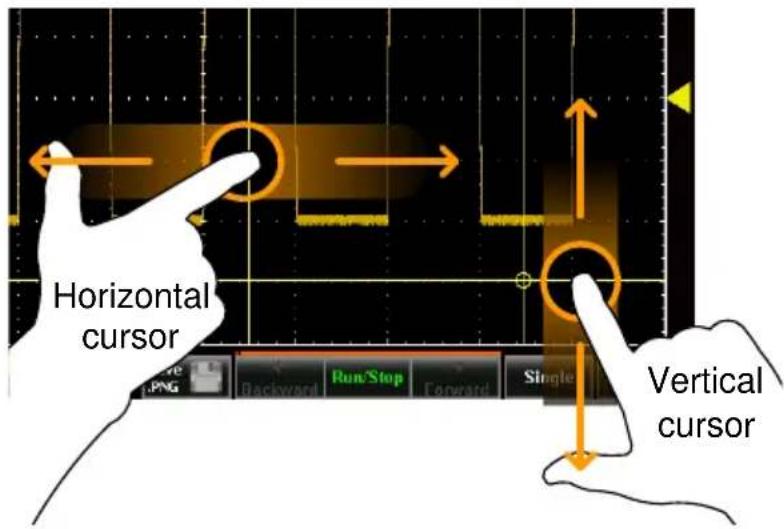
- Return the Gesture Control back to Waveform after the cursors have been positioned. See step 2 above.
Automatic Measurements
Up to 4 automatic measurements can be calculated from the trigger configuration conditions each time a waveform is captured.
The automatic measurements can be based on the entire record length, the area of the waveform displayed on-screen or from a gated region bound by the onscreen cursors.
Measurement Types
Amplitude Measurements
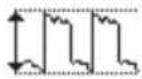 | Pk-Pk | Difference between positive and negative peak. (=max - min) |
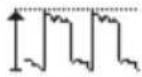 | Max | Positive peak. |
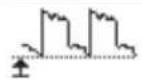 | Min | Negative peak. |
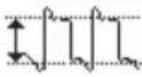 | Amplitude | Difference between the global high value and the global low value, measured over the entire waveform or gated region. (=high - low) |
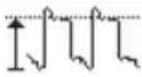 | High | Global high voltage. |
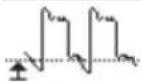 | Low | Global low voltage. |
 | Mean | The arithmetic mean value is calculated for all data samples as specified by the Gating option. |
 | Cycle Mean | The arithmetic mean value is calculated for all data samples within the first cycle found in the gated region. |
 | RMS | The root mean square of all data samples specified by the Gating option. |
 | Cycle RMS | The root mean square value is calculated for all data samples within the first cycle found in the gated region. |
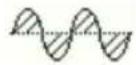 | Area | Measures the positive area of the waveform and subtracts it from the negative area. The ground level determines the division between positive and negative areas. |
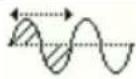 | Cycle Area | The Summation based on all data samples within the first cycle found in the gated region. |
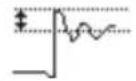 | ROVShoot | Rise overshoot. |
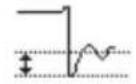 | FOVShoot | Fall overshoot. |
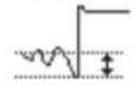 | RPREShoot | Rise preshoot. |
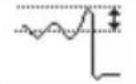 | FPREShoot | Fall preshoot. |
| Time Measurements | ||
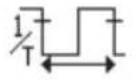 | Frequency | Frequency of the waveform. |
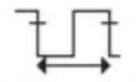 | Period | Waveform cycle time. (=1/Freq) |
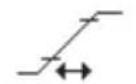 | Rise Time | The time required for the leading edge of the first pulse to rise from the low reference value to the high reference value. |
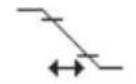 | Fall Time | The time required for the falling edge of the first pulse to fall from the high reference value to the low reference value. |
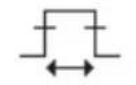 | +Width | Positive pulse width. |
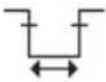 | -Width | Negative pulse width. |
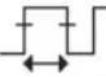 | Duty Cycle | Ratio of signal pulse compared with whole cycle. =100x (Pulse Width/Cycle) |
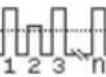 | +Pulses | Measures the number of positive pulses. |
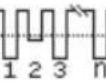 | -Pulses | Measures the number of negative pulses. |
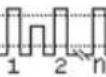 | +Edges | Measures the number of positive edges. |
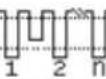 | -Edges | Measures the number of negative edges. |
| Delay Measurement | ||
| FRR | Time between:Source 1 first rising edge and Source 2 first rising edge. | |
| FRF | Time between:Source 1 first rising edge and Source 2 first falling edge. | |
| FFR | Time between:Source 1 first falling edge and Source 2 first rising edge. | |
| FFF | Time between:Source 1 first falling edge and Source 2 first falling edge. | |
| LRR | Time between:Source 1 first rising edge and Source 2 last rising edge. | |
| LRF | Time between:Source 1 first rising edge and Source 2 last falling edge. | |
Delay Measurement
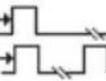 | FRR | Time between:Source 1 first rising edge and Source 2 first rising edge. |
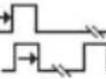 | FRF | Time between:Source 1 first rising edge and Source 2 first falling edge. |
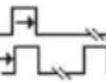 | FFR | Time between:Source 1 first falling edge and Source 2 first rising edge. |
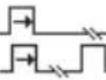 | FFF | Time between:Source 1 first falling edge and Source 2 first falling edge. |
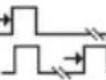 | LRR | Time between:Source 1 first rising edge and Source 2 last rising edge. |
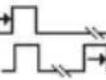 | LRF | Time between:Source 1 first rising edge and Source 2 last falling edge. |
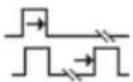 | LFR | Time between:Source 1 first falling edge and Source 2 last rising edge. |
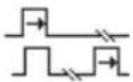 | LFF | Time between:Source 1 first falling edge and Source 2 last falling edge. |
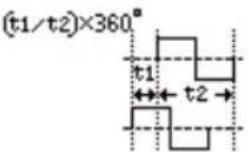 | Phase | The phase difference of two signals, calculated in degrees. 1t2 °C |
Viewing Automatic Measurements
| Background | There are two different display options for automatic measurements. A minimized and a maximized view*. |
| The minimized view will display the real-time measurement results. | |
| The maximized view will display the real-time, mean, minimum and maximum measurement results. | |
 | *The minimized view is only applicable in the landscape viewing mode. The vertical viewing mode displays automatic measurements in the maximized view by default and will always be displayed on screen. |
Steps
- Press the M (Measure) icon in the menu bar at the bottom of the display.
- The minimized view will appear above the menu bar.
- To toggle between the minimized and maximized view, tap anywhere within the area that the automatic measurements are displayed.
- To remove the automatic measurements from the display*, press the M (Measure) icon again in the menu bar.
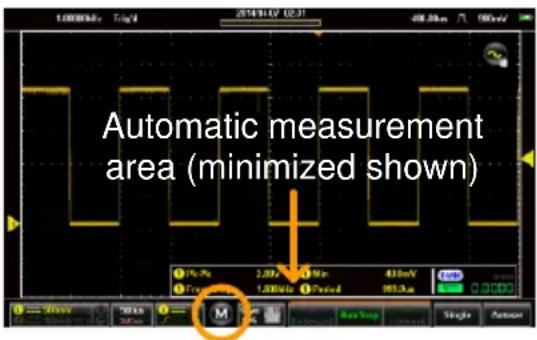
Measure icon
Selecting an Automatic Measurement
Background
Automatic measurements can be accessed from the drop down menu or from the menu bar at the bottom of the screen.
Steps
-
Make sure the automatic measurements are visible at the bottom of the display.
-
From the Menu Bar: Long-press anywhere within the area that the automatic measurements are displayed to bring up the Measurement menu.
OR
From the Drop Down Menu: Press the top of the screen to access the drop down menu. From the Menu tray, select the Measure icon.
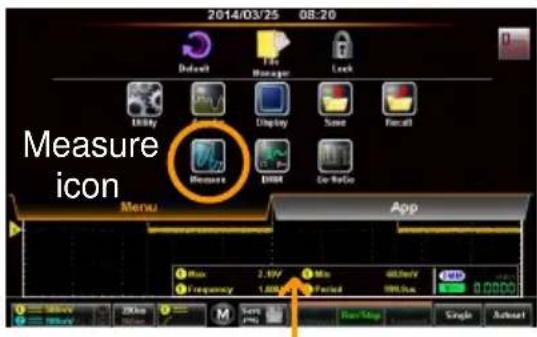
Long press
-
Select a measurement slot (from 1 of 4 quadrants).
-
Select a measurement category (Amplitude, Time, Delay).
-
Select an automatic measurement from the selected category.
Tip: Tapping the bottom of the selection window will display the next group of automatic measurements for the category.
- To select the source for the selected automatic measurement, long-press the measurement selection. Select the source from the submenu that appears.
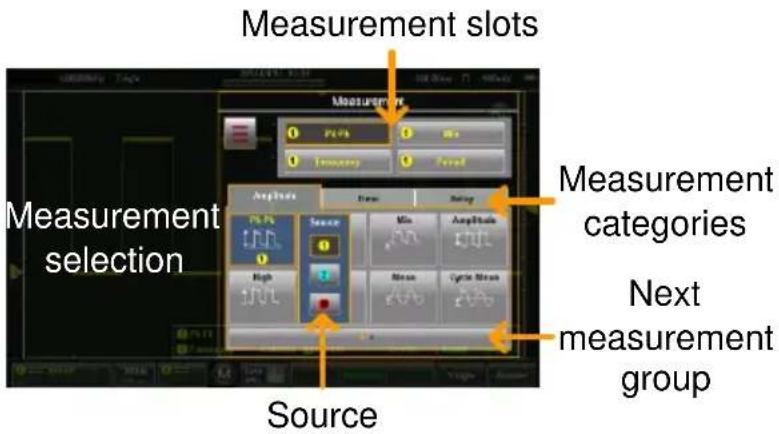
Automatic Measurement Options
Background
The Option menu will limit the bounds of the automatic measurements to the entire record length, to the screen graticule or to the onscreen cursors. For measurement statistics, the mean number of samples can also be set. The default number of samples is set to 2.
Steps
-
Access the Measurement menu.
-
Press the Options icon to bring up the options menu.
-
From the Options menu select the measurement gating:
Gating Off (Full Record), Screen, Between Cursors
- For Statistics, select the number of mean samples. The number of samples is used to calculate the Mean measurement for when the automatic measurements are displayed in the maximized mode.
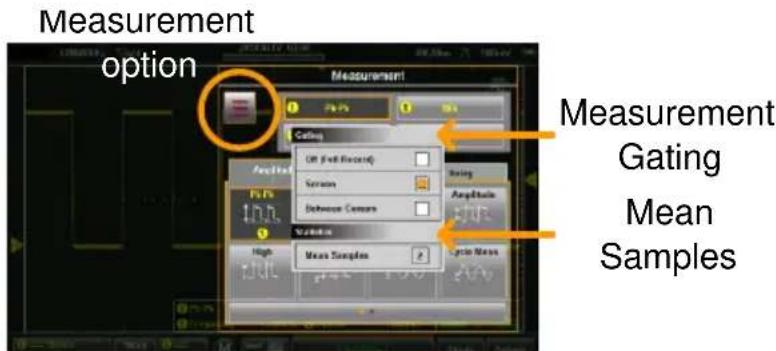
Drop-Down Menu
The Drop-down menu is split into the Menu tray and the App tray. The Menu tray contains all the configuration settings and other miscellaneous functions not directly related to the operation. The App tray contains a number of EE apps that can be used as supplementary tools for the GDS-200/300.
Opening the Drop-down Menu
Background
From the main screen, press the title bar to bring up the Drop-down menu.
The Drop-down menu will be displayed. To return to the main display, press anyway outside of the drop down menu system.
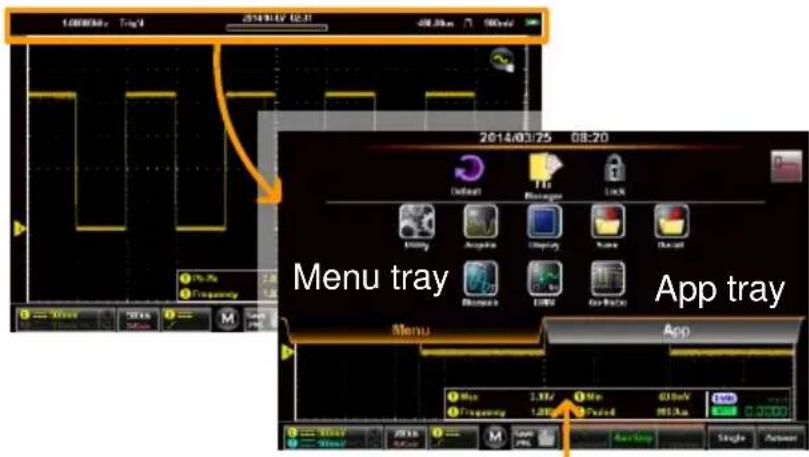
Press anywhere outside to exit
Return to Default Settings
Background

The default icon will allow you to return the scope to the factory default settings. See page 180 for a list of the factory default settings.
OPERATION
Steps
Press the Default icon from the Menu tray.
- The default settings will be restored immediately.
Panel Lock
Background
The panel lock can be used to prevent any settings from being inadvertently changed.
Activate Panel Lock
Press the Lock icon from the Menu tray.
- The panel lock will appear at the bottom of the screen.
Disable Panel Lock
Press and hold the Padlock icon.
- Wait for the progress bar to finish before letting go
- "Panel locked" will be displayed when the screen is touched anywhere other than the Padlock button.
Example
Press and hold the Padlock icon until the green progress bar is full.
Utility Menu
The Utility Menu configures a number of general system settings such as the System language, Hardcopy settings, USB device port settings, Calibration and other settings.
Accessing the Utility Menu
From the main screen, press the title bar to bring up the Drop Down menu. Press the Utility icon to show the Utility menu.
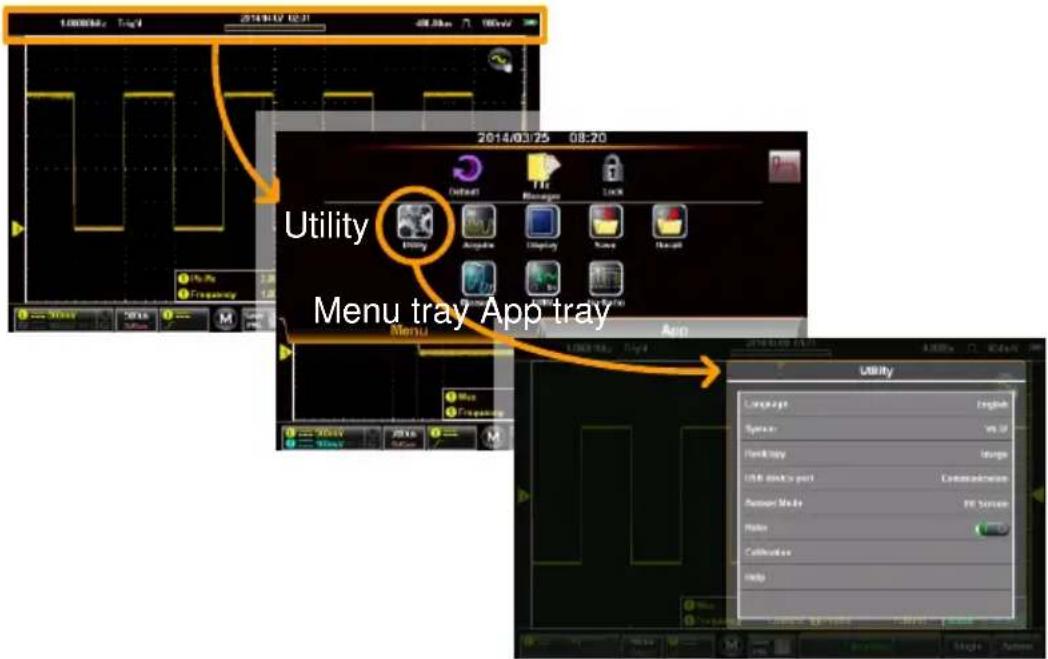
Set the Language
| Background | The Language menu selects the system language. | |
| Steps | From the Utility menu, press Language and select your preferred language. | |
| Note: | The languages available may vary from that shown. | |
View System Information
Background
The system information displays the model name, serial number, firmware version, FPGA revision and GW Instek website address.
- A QR code for the serial number is also shown.
Steps
From the Utility menu, press System>System Information.
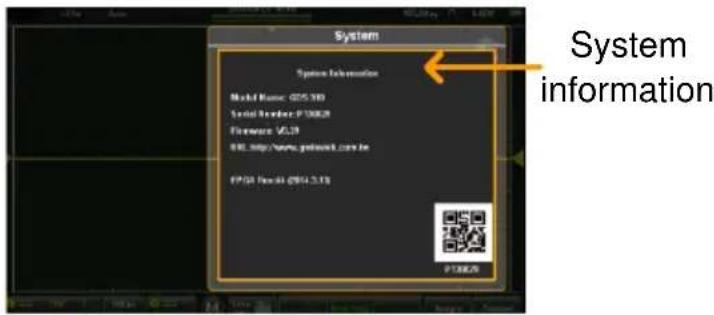
Signal Path Compensation
| Background | Signal Path Compensation (SPC) is used to compensate the internal signal path due to ambient temperature and long term drift. SPC is able to optimize the accuracy of the oscilloscope with respect to the ambient temperature and signal drift. |
 | Ensure the scope has been warmed up for at least 10 minutes before performing signal path compensation. |
Steps
- From the Utility menu, press System>SPC.
- Disconnect all probes/cables from CH1 & CH2 when prompted and then press OK.
- The calibration items will show sequentially at the bottom of the display.
- "Calibration Successful!", will be shown after each channel has been calibrated. It takes \~1 minute per channel.
Setting the System Date & Time
Background
The GDS-200/300 will keep the date and time settings saved so long as the battery is not allowed to fully discharged.
- Press Utility>System>Date&Time.
The Date&Time menu will appear.
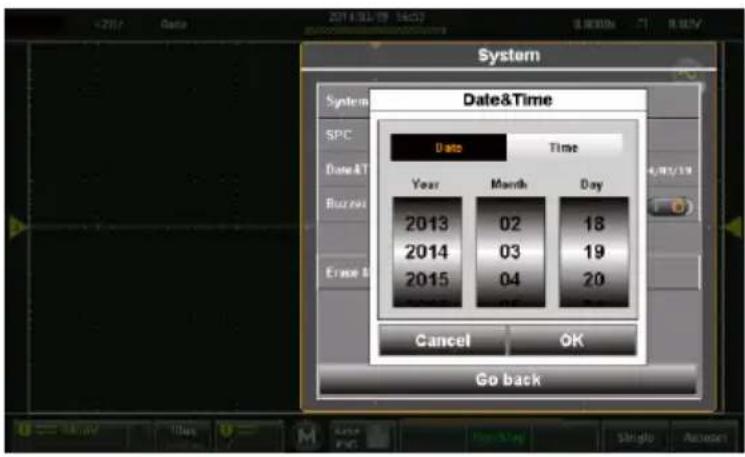
- To set the date, press Date and use the number picker to set the year, month and day.
- To set the time, press Time and use the number picker to set the hour and minute.
- Press OK to save the date and time settings.
Note
The date and time settings only remain saved if the battery is not fully drained. However, if the unit shuts down due to insufficient battery power, there will usually still be enough battery power to keep the internal clock running for sometime.
Touch Sounds
| Background | When turned on, the Touch Sounds function will produce a buzzer sound when a button is pressed on the touch screen. By default the buzzer sound is turned off. |
| Press Utility>System>Touch Sounds and toggle Touch Sounds on/off. |
Erase Memory
| Background | The Erase Memory function will delete all waveform and setup files from the internal memory. |
| Press Utility>System>Erase Memory and press OK to erase the memory. |
Configure the Hardcopy Function
| Background | The Hardcopy function is a quick save function. Each time the Hardcopy Save key is pressed, according to the Hardcopy setting, an image, waveform or setup file is saved. |
Steps
-
From the Utility menu, press Hardcopy and select the save function for the Hardcopy function.
-
The Hardcopy Save key now be used to save the item configured with the Hardcopy function.
-
See the Save Operations and Recall Operations chapters for the file format details, see page 124&135.
Hardcopy Image, Waveform, Setup, All
Configure USB Device Port
| Background | The setting, “USB device port” in the Utility menu determines whether the internal storage is seen as an internal or external drive. When set to Disk Drive, the internal storage can be accessed via a USB connection to a PC or via a USB OTG cable on a smart phone. When the USB device port is set to Communication, the unit can be used for remote control. |
 | When connected to a PC via the Mini-B USB port, the USB device port must be set to Communication in order to save files. See page 124. |
| Steps | From the Utility menu, press USB device port and select the USB interface type. USB device port Communication, Disk Drive |
 | A Note about USB OTG:• USB OTG functionality is only supported on some smartphones/tablets running the android operating system.• If your smartphone/tablet supports USB OTG, a file manager that supports USB OTG as well as a USB OTG cable are also needed.• To use USB OTG, connect the GTL-253 Type A - Mini-B USB cable to the USB OTG cable. Connect the OTG cable to the smart phone. The GDS-200/300 should now be visible on the smartphone's file manager. |
Configure Autoset Mode
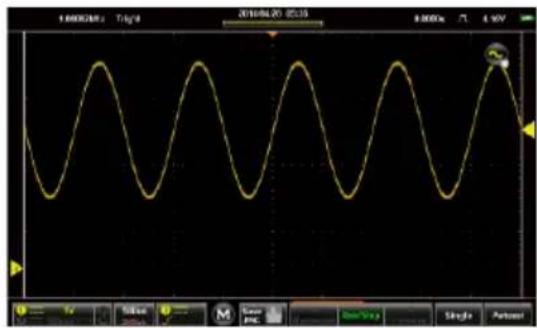
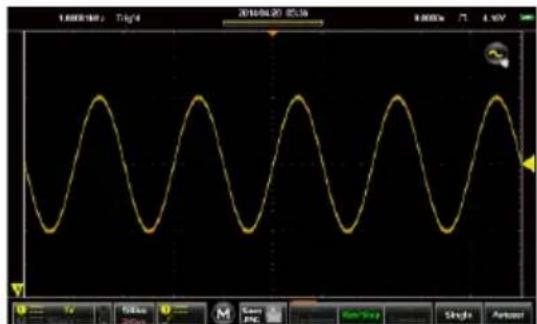
| Background | There are two operating modes for the Autoset function: Fit Screen Mode and AC Priority Mode. Fit Screen Mode will fit the waveform to the best scale, including any DC components (offset). AC Priority mode will scale the waveform to the screen by removing any DC component. |
| Steps | From the Utility menu, press Autoset Mode and select the mode.Autoset Mode Fit Screen Priority, AC Priority |
Example 2VPP signal with 2V DC offset
Fit Screen
AC Priority
Set Ruler
| Background | The Ruler function adds a scale to the graticule. Note this mode only functions in the vertical view. See page 34 to set the display to the vertical mode. | |
| Steps | From the Utility menu, press Ruler to toggle the Ruler function on/off. | |
| Ruler | On, Off | |
| Example | 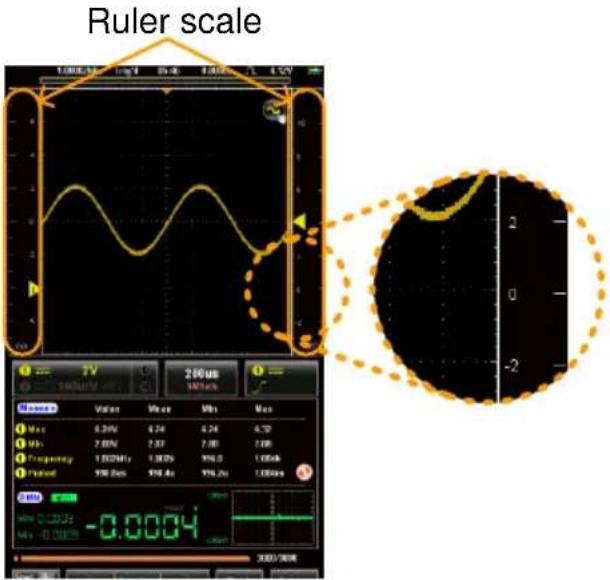 | |
Calibration
Background
The Calibration menu allows you to perform vertical calibration on the oscilloscope channels.
Steps
-
From the Utility menu, press Calibration>Vertical Calibration to start vertical calibration.
-
A prompt will appear asking you to connect the CAL output to CH1.
-
Connect the Vertical Calibration cable, GCL-001, to the input in the restricted panel* on the interface panel and to CH1.
*You may need to use a Philips head screwdriver to remove the panel.
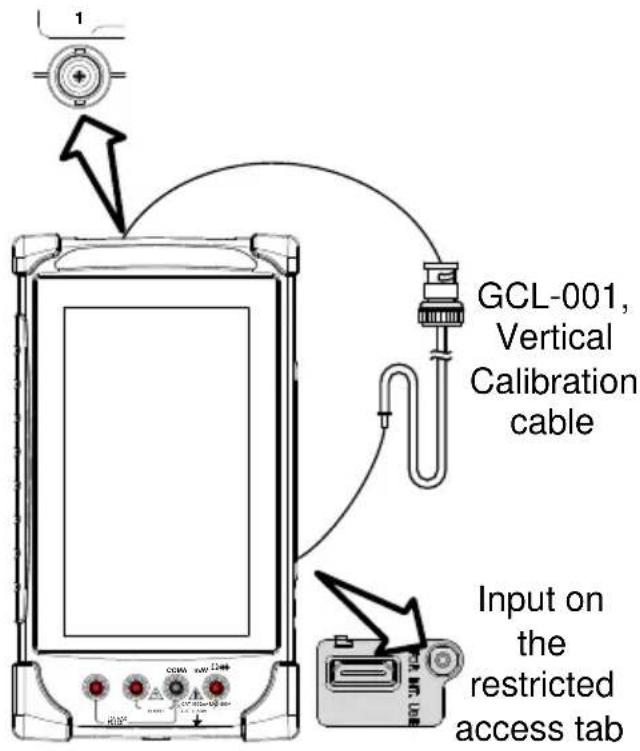
-
Press OK to start the CH1 calibration.
-
Repeat the above steps for CH2.
-
Reset the scope when the calibration has finished.
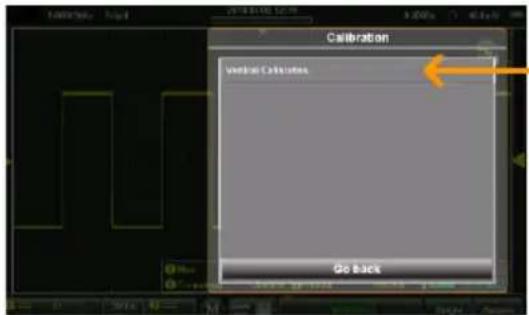
Vertical Calibration menu
Acquire Menu
The Acquire Menu sets the acquisition mode, channel mapping (XY mode), record length and the sample interpolation type.
Accessing the Acquisition Menu
From the main screen, press the title bar to bring up the Drop Down menu. Press the Acquire icon to show the Acquire menu
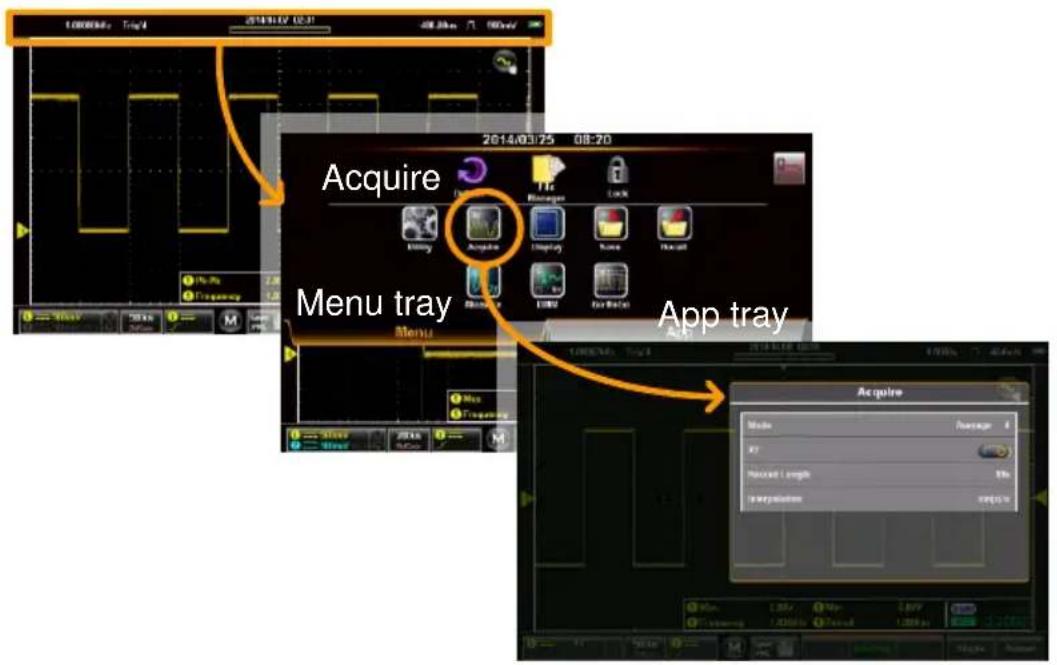
Select Acquisition Mode
| Background | The acquisition process samples the analog input signals and converts them into digital formats for internal processing. The acquisition mode determines how the samples are used to reconstruct a waveform. | |
| Modes | Sample | This is the default acquisition mode. Every sample from each acquisition is used. |
| Peak Detect | Only the minimum and maximum value pairs for each acquisition interval (bucket) are used. This mode is useful for catching abnormal glitches in the signal. | |
| Average | Multiple acquired data is averaged. This mode is useful for drawing a noise-free waveform.Average Setting: 2, 4, 8, 16, 32, 64, 128, 256 | |
| Steps | From the Acquire menu, press Mode and select an option. When a mode has been selected, press OK. | |
| Mode: | Sample, Peak Detect, Average | |
| Example | Sample | Peak Detect Average (256) |
Show Waveform in XY Mode
Background
The XY mode maps the input of channel 1 to the input of channel 2. This mode is useful for observing the phase relationship between waveforms.
XY mode can also be used with cursors, see page 83 to turn cursors on.
Connection
-
Connect channel 1 to the X-axis source.
-
Connect channel 2 to the Y-axis source.
-
Activate both channel 1 and channel 2.
CH2, Y-axis
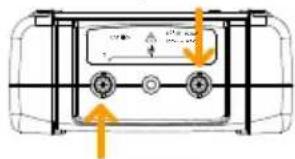
CH1, X-axis
Steps
-
From the Acquire menu toggle XY mode on.
-
The X-Y mode will appear.
Example
X-Y cursor
measurements
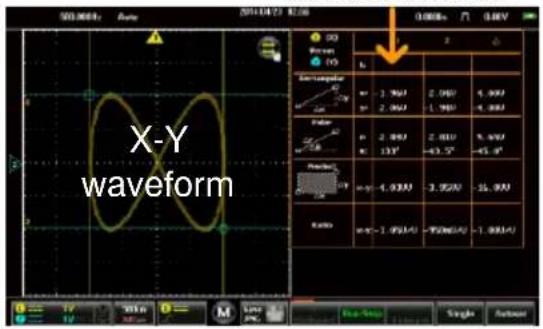
Set the Record Length
| Background | The number of samples that can be stored is set by the record length. Record length is important in an oscilloscope as it allows longer waveforms to be recorded and/or allows higher sampling rates to be achieved when equivalent time sampling is used. |
| Record Length | 1k 30,000 waveforms max10k 3,000 waveforms max100k 300 waveforms max1M 20 waveforms max5M 4 waveforms max |
| Steps | From the Acquire menu, press Record Length and select the record length.Record Length 1k, 10k, 100k, 1M, 5M |
Example
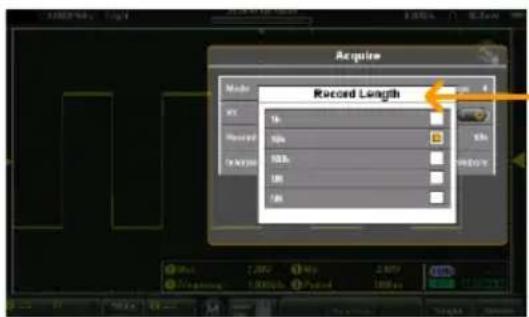
Record Length menu
Set the Interpolation
| Background | The GDS-200/GDS-300 has two types of interpolation modes: ET (Equivalent Time) and Sin(x)/x interpolation. Equivalent time sampling is able to achieve a sample rate of 20GSa/s when sampling periodic waveforms. Sin(x)/x interpolation uses a sinc interpolation formula to reconstruct a continuous signal between sampled points. | |
| Sin(x)/x | Samples of data are used to reconstruct a single waveform. Sin(x)/x sampling should be used when the time base is fast or if single shot events need to be captured. | |
| Equivalent-time sampling | Sampled data is accumulated a number of times to reconstruct a single waveform. This increases the sampling rate, but can only be used for repetitive signals. This mode is usually used when the time base is too fast for real-time sampling. | |
| Steps | From the Acquire menu, press Interpolation and select the interpolation method.Interpolation ET, sin(x)/x | |
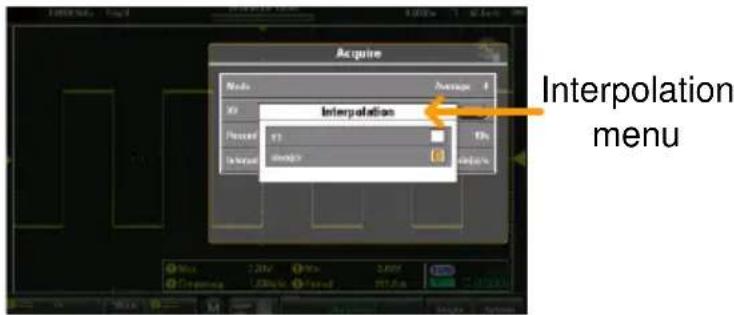
Display Menu
The Display Menu defines how the waveforms and parameters appear on the display.
Accessing the Display Menu
From the main screen, press the title bar to bring up the Drop Down menu. Press the Display icon to show the Display menu
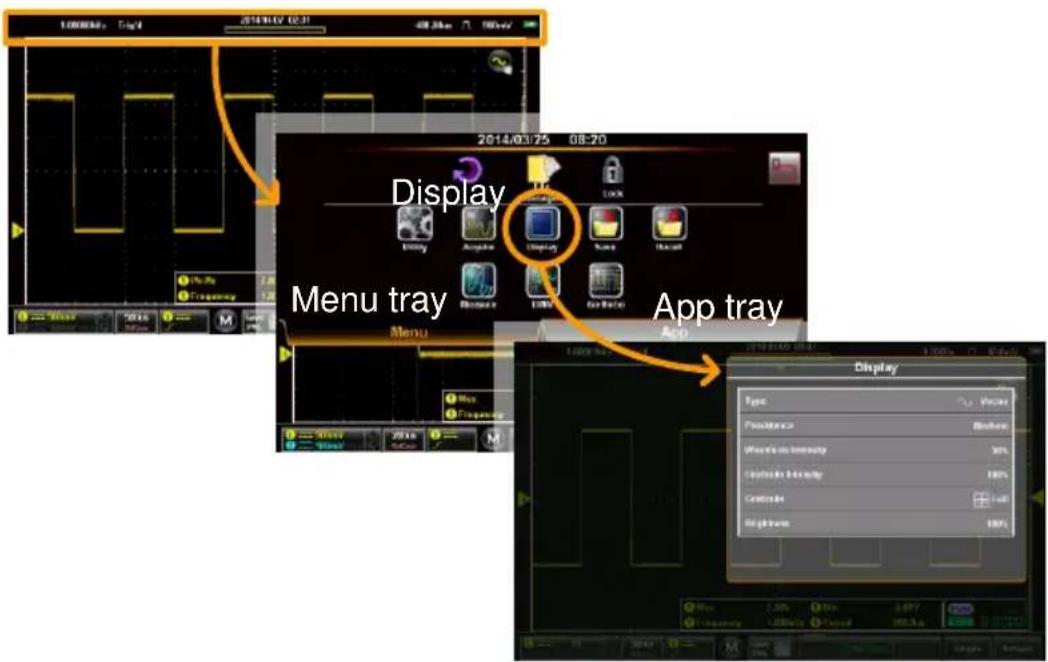
Display the Waveform as Dots or Vectors
Background
When the waveform is displayed on screen, it can be displayed as dots or vectors.
Modes
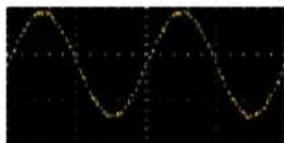
natural_image
Pure waveform diagram showing two identical sinusoidal peaks against a black background (no text or symbols)Dots: Only sampled dots are displayed.
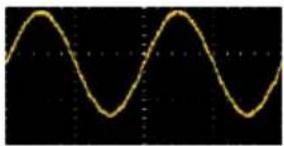
natural_image
Waveform signal with two identical peaks and troughs on a black background (no text or symbols)Vectors: Both the sampled dots and the connecting line are displayed.
Steps
From the Display menu press Type and select the display mode.
Type
Vectors, Dots
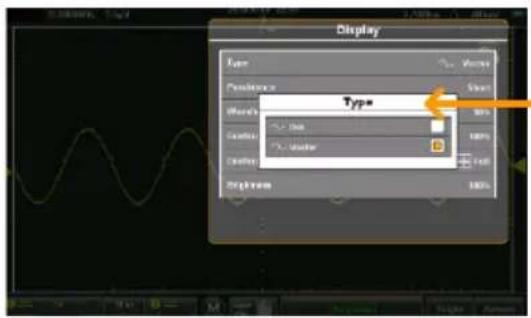
Type Menu
Set the Level of Persistence
| Background | The Persistence function allows the GDS-200/GDS-300 to mimic the trace of a traditional analog oscilloscope. A waveform trace can be configured to “persist” for a designated amount of time. | |
| Steps | From the Display menu press Persistence and set the level of persistence with the slider or the preset keys.Persistence Off, Short, Medium, Long, Infinite | |
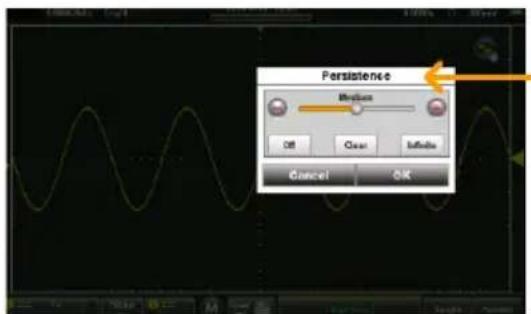
Persistence Menu
Set the Waveform Intensity
| Background | The intensity level of a signal can also be set to mimic the intensity of an analog oscilloscope by setting the digital intensity level. |
| Steps | From the Display menu press Waveform Intensity and select the intensity level.Waveform Intensity 0 - 100% |
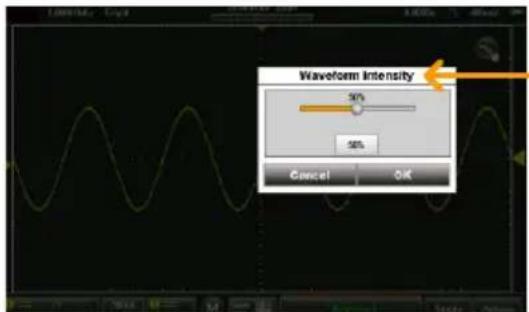
Waveform Intensity Menu
Set the Graticule Intensity
| Background | The graticule intensity level can also be configured. |
| Steps | From the Display menu press Graticule Intensity and select the intensity level.Graticule Intensity 0 - 100% |
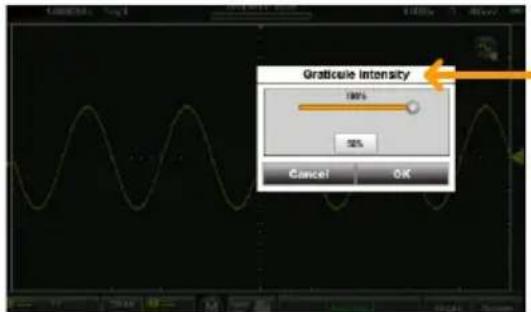
Graticule Intensity Menu
Set the Graticule Type
| Background | There are 4 types of selectable graticule. | |
| Steps | From the Display menu press Graticule and select the graticule type. | |
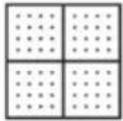 | Full: Shows the full grid; X and Y axis for each division. | |
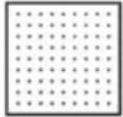 | Grid: Show the full grid without the X and Y axis. | |
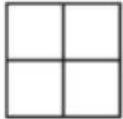 | Cross Hair: Shows only the center X and Y frame. | |
 | Frame: Shows only the outer frame. | |
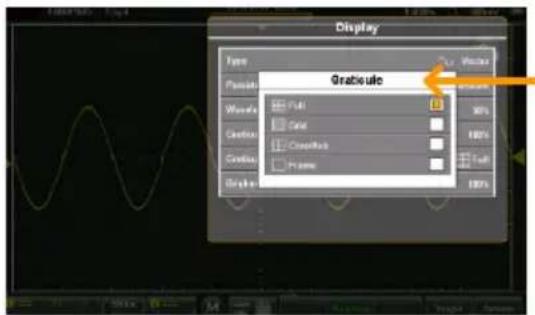
Graticule Menu
Set the Brightness Level
| Background | The Brightness menu sets the display brightness and the display power management, known as ECO mode. ECO mode turns the brightness down after a set amount of time until the display is touched again. | |
| Steps | From the Display menu press Brightness and select the brightness level and set the ECO mode time. | |
| Brightness | 0 - 100% | |
| ECO Mode | 1, 2, 5, 10, 30 minutes | |
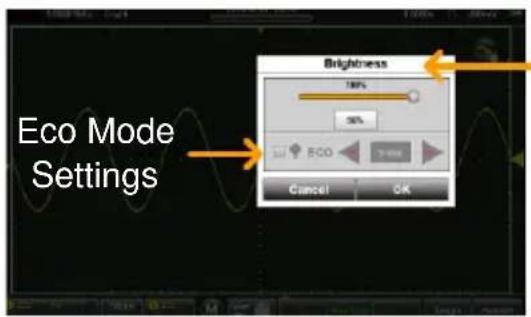
Brightness Menu
Go-NoGo Menu
A Go-NoGo test checks if a waveform fits inside a user-specified maximum and minimum boundary. Boundary templates can be automatically created from a source channel or created manually using the touch screen. Boundary tolerances and violation conditions can also be set.
Accessing the Go-NoGo Menu
From the main screen, press the title bar to bring up the Drop Down menu. Press the Go-NoGo icon to show the Go-NoGo menu
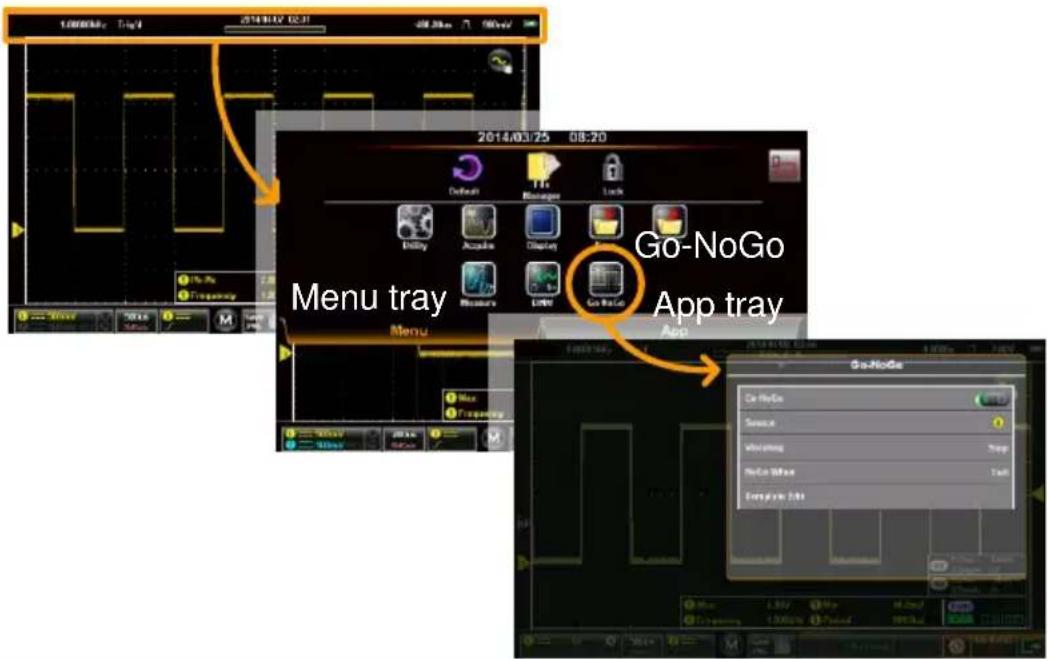
Configuring the Go-NoGo Menu
Source
- Press the Source option to set the source waveform.
Source CH1, CH2
Condition
- Press NoGo When to set the NoGo conditions.
| Enter | Sets the NoGo condition to when the input signal stays within the limit boundary. | |
| Exit | Sets the NoGo condition to when the input signal exceeds the limit boundary. | |
| Violating | 3. Press Violating to set the NoGo Action. This setting determines the action of the scope when the NoGo When setting is true. | |
| Stop | The waveform stops when the conditions are violated. | |
| Stop Beep | The waveform stops and a beep will be output when the conditions are violated. | |
| Continue | Ignore violations and continue to monitor the signal. | |
| Continue Beep | Output a beep when a violation occurs, but continue to monitor the signal. | |
| Turn Go-NoGo On | 4. Press Go-NoGo and turn Go-NoGo on.An upper and lower template will appear on the display as Ref1 and Ref2, respectively.The Template Edit option will now be available in the Go-NoGo menu. | |
| Template Edit | 5. The Template Edit option configures the upper and lower template based on the source channel selected above.6. Select either the Max/Min or the Auto option | |
| Max/Min | Individually sets the offset for the upper and lower templates. These are based on the ground level of the source channel. | |
| Auto | Sets the tolerance for the upper and lower template an equal distance from the source channel. This is set to 0.4% by default. | |
Save Template
- To save or recall a template, press the Option button when in the Template Edit menu.
For the Max/Min option, there are a number of recall options:
From Allows you to recall either an internally saved reference waveform (Wave 1 - Wave 2), or to recall a reference waveform using the file manager.
To Recall the waveform to R1 (upper template) or R2 (lower template).
Recall Recalls the selected reference waveform to the corresponding template.
Save options:
Save Max to R1 Saves the Max template to reference 1.
Save Min to R2 Saves the Min template to reference 2.
For the Auto option, there is a single save option, there is not a recall option:
Save Template
Saves both the upper and lower template to R1 and R2 respectively.
Max/Min Example
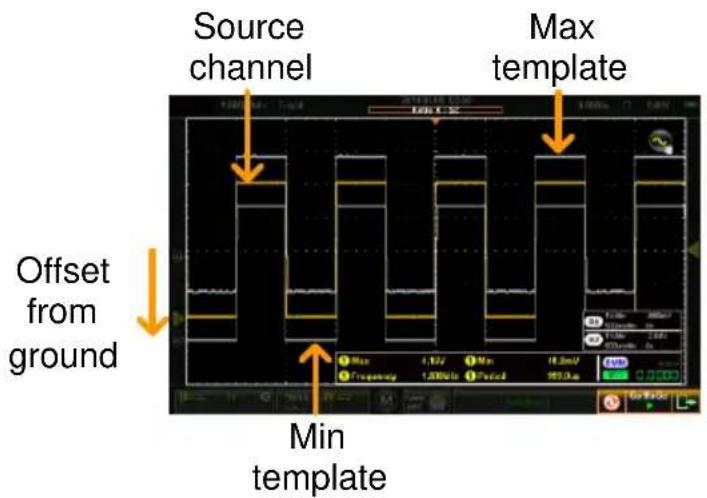
Auto Template
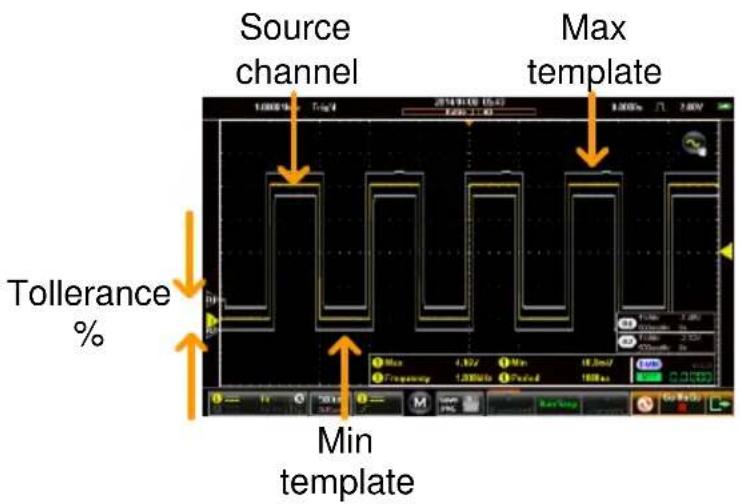
Running a Go-NoGo Test
Background
The Go-NoGo controls are located at the bottom left-hand corner of the screen. The Fail/Total ratio (Violations/Number of Tests) is shown in the title bar.
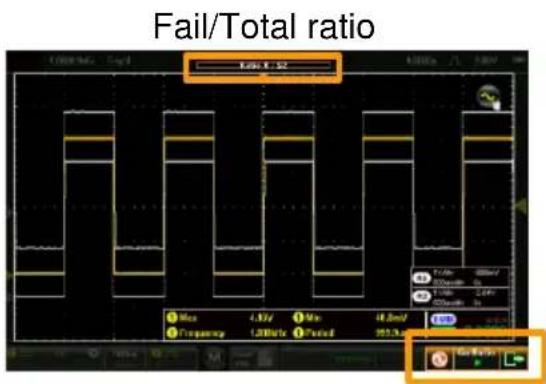
Go-NoGo controls
Run Go-NoGo Test
- Toggle the Go-NoGo button from pause to play.
The test will run continuously until the test is stopped.
Pressing the Go-NoGo button again will stop the test and toggle the button back to pause.
If the Violating setting was set to Stop or Stop Beep, press the Go-NoGo button again to restart the test after it has stopped.
| Results | 2. When Go-NoGo is running, the Fail/Total ratio is displayed in the title bar. The first digit represents the number of failed tests, and the second digit represents the number of tests.When the test has stopped the scope goes into the Stop mode (page 81) allowing you to step though each acquisition with the Go-NoGo template overlay. |
| Reset Go-NoGo | 3. To reset the Go-NoGo test, press the Reset button |
| Exit Go-NoGo Testing | 4. To exit from Go-NoGo testing press the Exit button |
Save Operations
The Save function configures the save file destination, file format and in the case of image files, the on-screen items that should be saved.
When connected to a PC, files can only be saved if the USB mode is configured to "Communication". See page 102 for details.
Accessing the Save Menu
From the main screen, press the title bar to bring up the Drop Down menu. Press the Save icon to show the Save menu.
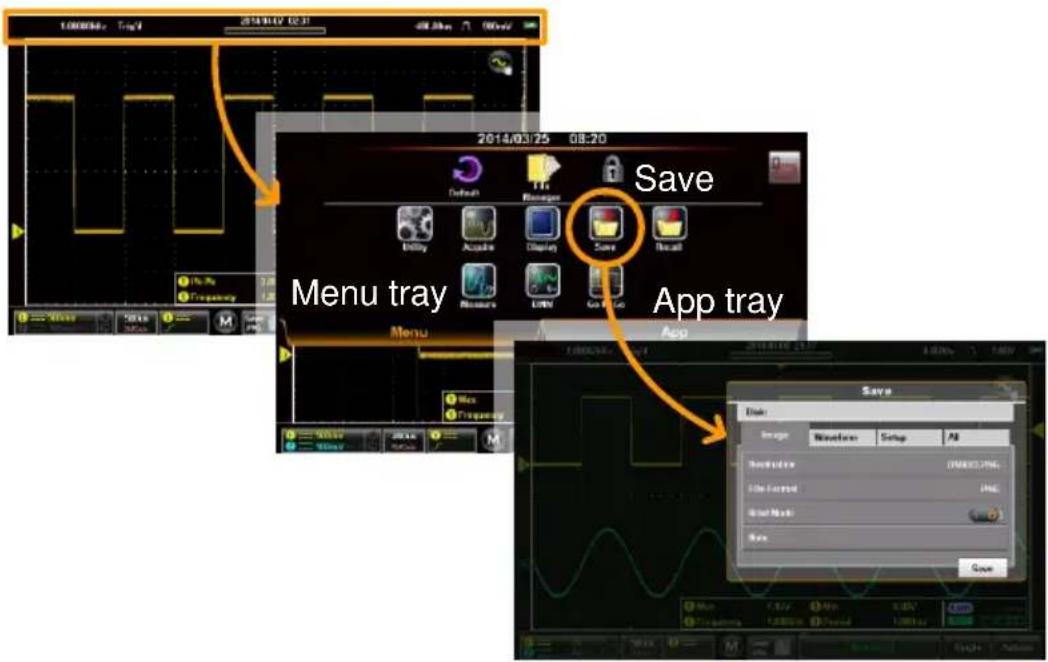
Saving and Configuring Image Files
| Background | Image files can be saved to the internal memory in a number of file formats. Custom notes can also be saved with the image file. The brief mode allows Custom notes can also be attached to image files or on-screen items such as automatic measurements and trigger positions can be saved as extra data in the image file using the Brief Mode. | |
| Image File Items | Destination | Selects the save file destination. |
| File Format | Selects the image file format. | |
| Brief Mode | Embeds data into the image file. | |
| Note | Saves a note with the same filename as the image file is corresponds to. | |
| Save Image | 1. From the Save menu, press the Image tab.2. To save, press the Save button at the bottom of the image tab.The file will be saved into the configured file path. See below for the configuration details.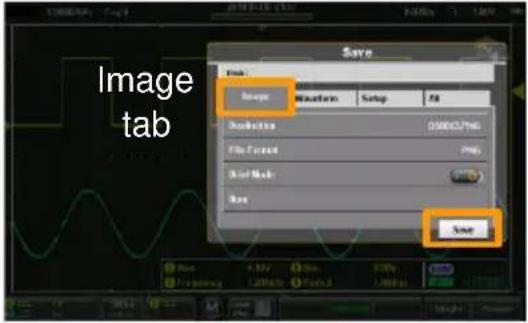 Save button Save button | |
| Destination | 3. Press Destination to set the save file destination.There are two options: | |
| File Manager | Goes to the file manager to set the save-file path or to create new folders. See page 139 for details on using the file manager. | |
| Rename | By default, files are saved in the format DSXXXX.PNG, where XXXX is a number starting at 0001 that is incremented each time an image file is saved. This default save-filename can be changed using the Rename option.This option will allow you to rename the default file name using the on-screen keyboard. | |
| File Format | 4. Press File Format to select the save file format: | |
| BMP | Sets the image format to bitmap. | |
| PNG | Sets the image format to PNG (default format) | |
| Adding Notes (Text file) | 5. To add Notes, Brief Mode must be turned off. When the Brief Mode is turned off, the Note option will be available. | |
| 6. Press Note. The on-screen keyboard will appear. Enter your note and press OK when finished*. See page 48 for details on using the on-screen keyboard.When the image file is saved, the note will be saved as text file (*.txt) into the same file path and with the same base filename as the image file.*Multilanguage notes are possible if the system language is not English. | ||
Brief Mode
Brief mode adds a series of user-selectable data to the bottom of an image file. It also reverts the normally black background into a white background for easy printing.
-
Toggle Brief Mode on.
-
Press Brief Mode Setting to set what data gets saved to the image file:
Date&Time Saves the date and time. Vertical Saves the vertical scale, coupling, DC mode and bandwidth limit of all the active channels.
Horizontal Saves the horizontal position and scale.
Trigger Saves the trigger channel, coupling, slope, frequency rejection, Noise rejection, trigger level and other data associated with the selected trigger type.
Cursor Saves the cursor position to the image file.
Cursor Measure Saves the cursor information overlay to the image file.
Measure Saves automatic measurements and DMM measurement readings.
Note Adds a user-created note at the bottom of the image file. Note: Multilanguage notes are possible if the system language is not English.
- To preview the image file before saving, press the Preview button.
Example Image File with Brief Mode = On
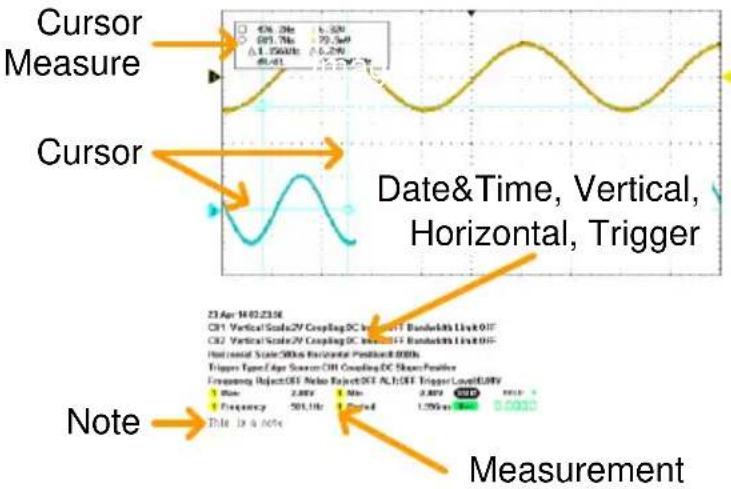
line
| Metric | Value | |--------|-------| | Date & Time | 0.0000 | | Vertical Scale | 29.3 | | Horizontal Scale | 29.3 | | Trigger Type | 1.55 | | Current | 0.0000 |Saving and Configuring Waveform Files
| Background | Each displayed waveform can be saved either separately or together in a folder for later recall. Waveforms can be saved from any of the source channels, reference channels or math waveform. | |
| Waveform File Items | From | Selects the waveform source |
| Destination | Selects the destination to save the waveform. | |
Save Waveform
-
From the Save menu, press the Waveform tab.
-
To save, press the Save button at the bottom of the Waveform tab.
The file will be saved into the configured file path with the configured file format. See below for the configuration details.
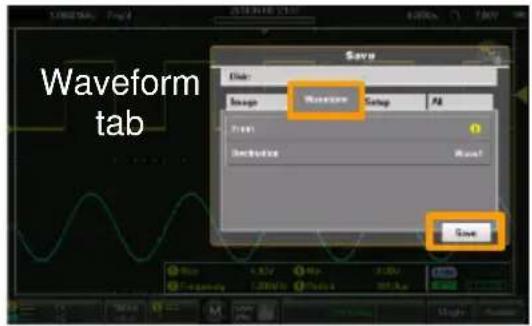
Save button
From
- Use the From option to select the source waveform:
1 Channel 1
2 Channel 2
M Math source
R1 Reference waveform 1
R2 Reference waveform 2
All Displayed Saves all the displayed waveforms into a directory, ALXXXX, where XXXX is a number that is incremented each time a save is performed.
Destination
- If only a single source waveform is to be saved, the following destination options are available:
Wave1 Wave1 - Wave20
Ref R1 - R2
File Pressing File will allow you to either set the file path or rename the file from the default of DSXXXX.LSF, where XXXXX is a number that is incremented each time the waveform is saved.
| 5. If All Displayed waveforms are to be saved, then the following destination options are available: | ||
| File Manager | Pressing File will allow you to change the file path from the root directory of the internal disk. | |
| Rename | Pressing Rename will allow you to rename the default directory from ALXXXX. | |
| File Format | 6. Press File Format to select the save file format: | |
| LSF | Internal file format. This format saves and recalls waveforms the fastest. | |
| Fast CSV | Comma separated values. Allows the waveforms to be saved in a format that is readable by spreadsheets. | |
| Note | Fast CSV files can only be recalled if the record length is 1k or 10k. | |
| Adding Notes | A text file note can be added to the same file path as the saved waveform file. | |
| 7. Press Note. The on-screen keyboard will appear. Enter your note and press OK when finished. See page 48 for details on using the on-screen keyboard. | ||
| When the waveform file is saved, the note will be saved as a text file (*.txt) into the same file path and with the same base filename as the image file. | ||
For example if the waveform is saved as DS001.lsf then the note will be saved as DS001_LSF.txt.
Saving and Configuring Setups
| Background | Setup files can be saved so that the instrument state can be recalled at a later time. | |
| Setup File Items | Destination | Selects the save file destination. |
| Save Setup | 1. From the Save menu, press the Setup tab.2. To save, press the Save button at the bottom of the Setup tab.The file will be saved into the configured destination. See below for the configuration details. | |
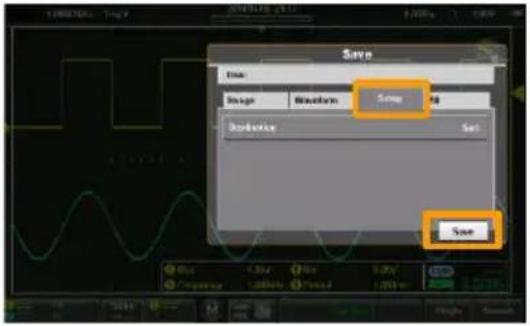 | SetuptabSavebutton | |
Destination
- Press Destination to set the destination:
Set
Set 1 - Set 20
Press Edit label to set a label for the selected setup slot.
File
Pressing File will allow you to either set the file path or rename the file from the default of DSXXXX.SET, where XXXX is a number that is incremented each time the waveform is saved.
Saving and Configuring Images, Waveforms and Setups All at Once
| Background | Images, Waveforms and Setup files can all be saved at the same time into a directory at the same time using the All option. | |
| All File Contents | All the files are saved, by default, to a directory named AXXXX, where XXXX is a number that is incremented each time a save operation is performed. | |
| AXXXX.PNG | Image file | |
| AXXCH1/2.LSF | Waveform save file | |
| DSXXXX.SET | Setup up file | |
Save All
-
From the Save menu, press the All tab.
-
To save, press the Save button at the bottom of the All tab.
An image file, setup file and waveform files will be saved into the configured destination. See below for the configuration details.
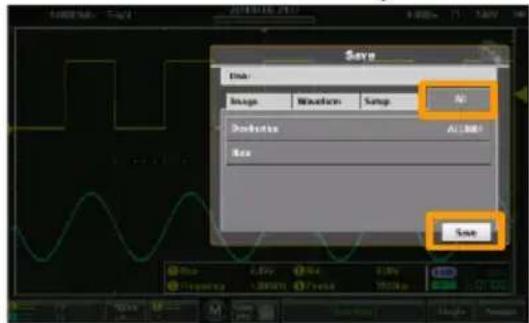
All tab
Save button
Destination
- Press Destination to set the destination:
File Manager Goes to the file manager to set the save-file path or to create new folders. See page 139 for details on using the file manager.
Rename By default, files are saved into a directory called AXXXX, where XXXX is a number starting at 0001 that is incremented each time a save operation is performed. This option will allow you to rename the default directory name using the on-screen keyboard.
Recall Operations
The Recall function configures the save file destination, file format and in the case of image files, the on-screen items that should be saved.

Files can only be recalled if the USB port is configured to "Communication". See page 102 for details.
Accessing the Recall Menu
From the main screen, press the title bar to bring up the Drop Down menu. Press the Recall icon to show the Recall menu.
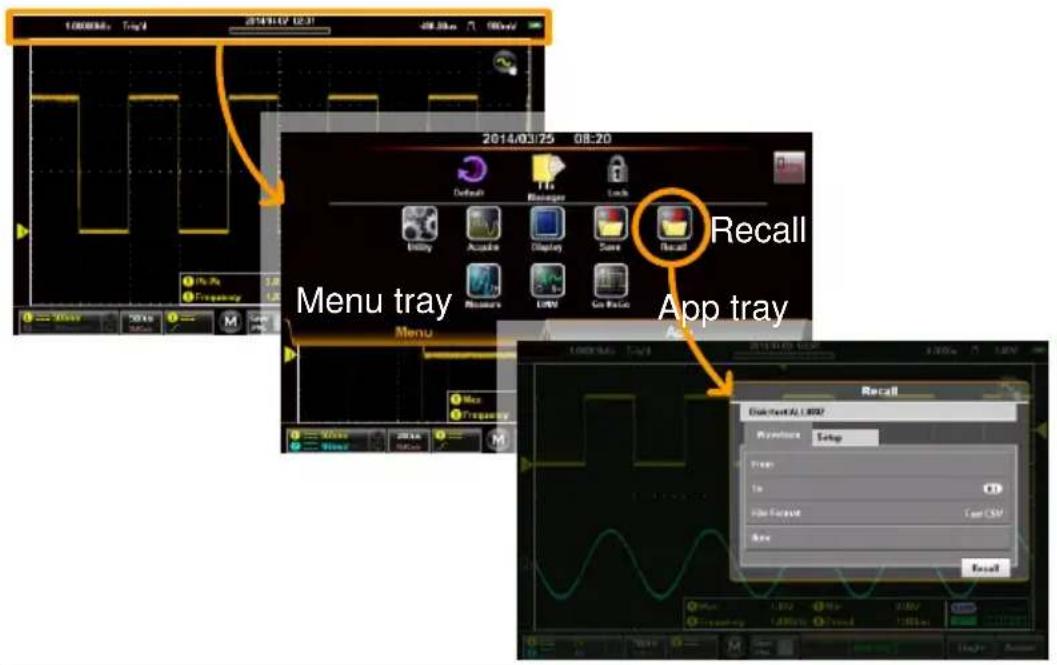
Recalling Waveform Files
Background
Waveforms can be recalled from either the internal memory slots (wave1 - wave20) or files saved in the LSF or CSV file formats.
| Waveform Recall Items | From | Selects the source waveform. |
| To | Selects the destination to recall to. | |
| File Format | Selects the file format to recall. |
Recall Waveform
-
From the Recall menu, press the Waveform tab.
-
To recall, press the Recall button at the bottom of the Waveform tab.
The waveform will be recalled from the configured file path/source and recalled to one of the reference waveforms. See below for configuration details.
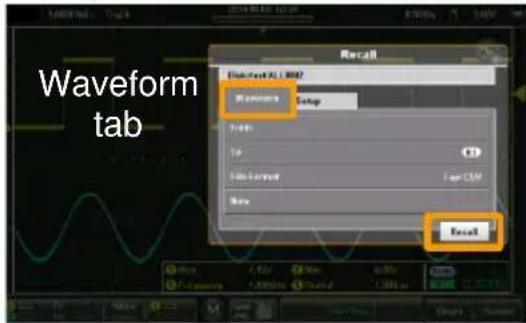
Recall button
From
- The From option selects the source waveform:
Wave
Wave 1 - Wave 20
A label can also be set for the recalled waveform.
File
*.LSF and *.CSV files can be recalled from the file manager.
To
- The To option selects where to recall the waveform:
R1, R2
Reference 1, reference 2
| File Format | 5. Chooses the file format that is to be recalled.This option will determine whether *.LSF or*.CSV files are shown in the From option.LSF Internal file format.CSV Comma separated values. |
| !Note | Fast CSV files can only be recalled if the record length is 1k or 10k. |
| View & Edit Notes | If a note for the selected file has been saved, the Note option will display the contents of the note. Pressing the Note option will allow you to edit the note.6. Press Note. The on-screen keyboard will appear. The note can now be edited.Note that the waveform note can be edited even after if it is recalled. |
Recalling Setups
| Background | Setup files can be recalled from the internal Set (setup) memories or from the internal disk. | |
| Setup Recall Items | From | Selects the source setup. |
| Recall Setup | 1. From the Recall menu, press the Setup tab.2. To recall, press the Recall button at the bottom of the Setup tab.The setup will be recalled from the configured source. See below for the configuration details. | |
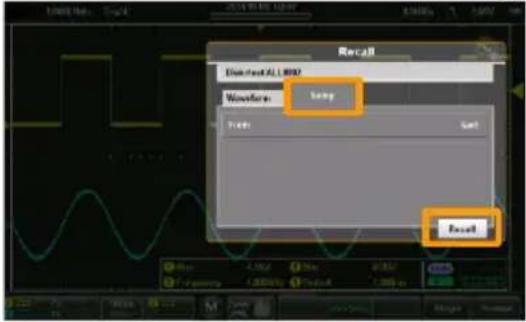 | Setup tabRecall button | |
From
- Press From to set the source:
Set
Set 1 - Set 20
Press Edit label to set a label for the selected setup slot.
File
Pressing File will allow you to select a source file (XXXX.SET) from the internal disk.
File Manager
The file manager is used to navigate the internal file system, create new folders or to delete files.
Accessing the File Manager
From the main screen, press the title bar to bring up the Drop Down menu. Press the File Manager icon to show the File Manager.
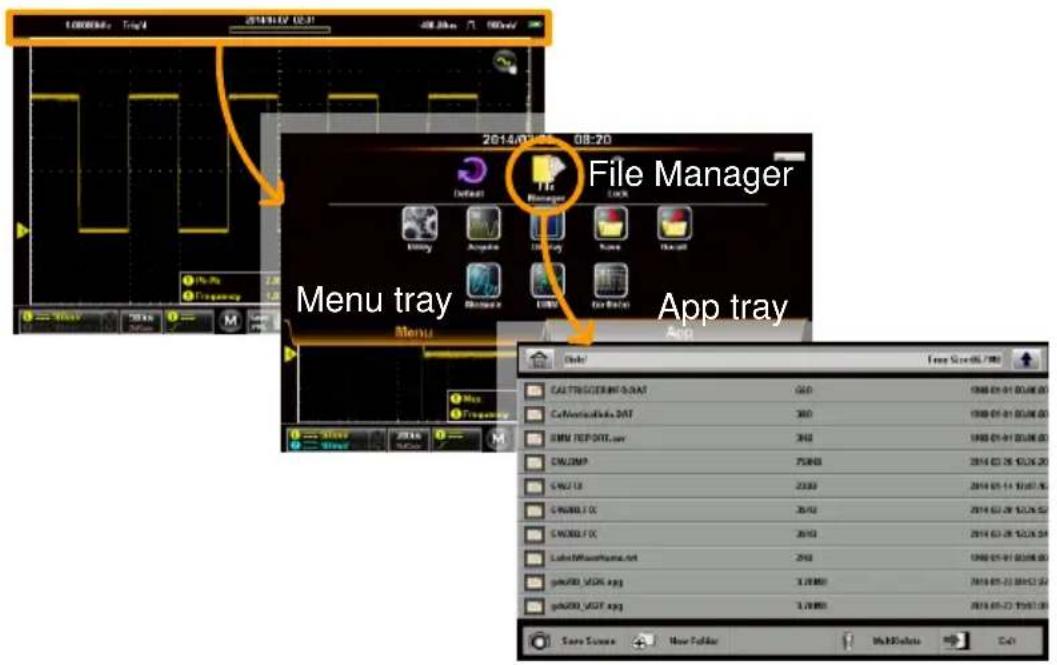
Navigating the File System
Background
The following diagram will show the file manager functions.
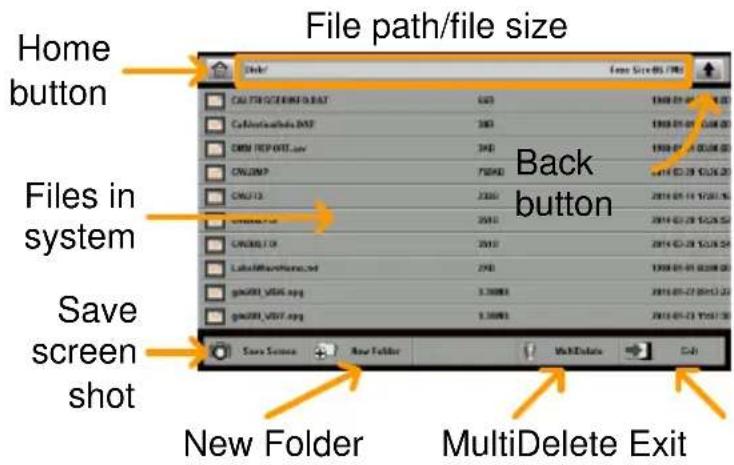
| Home button | Goes back to the root directory. |
| Back button | Goes back to the previous directory. |
| Save screen shot | Saves a screen shot of the file manager. |
| New Folder | Creates a new folder. |
| MultiDelete | Allows you to delete multiple files at the once. |
| Exit | Exits the file manager. |
| Navigation | 1. Scroll up and down to view files that are out of view. |
| 2. Select a folder to enter a directory. | |
| 3. Press the Back button to return to the previous directory.Selecting an image file will allow you to preview the image.Selecting a text(note) file will preview the message.Selecting an *.UPG (upgrade) file will allow you to upgrade the firmware. | |
| Create Folder | 4. Press the New Folder button to create a new file.Enter the name of the new folder using the popup keyboard. |
| Delete or Rename Files | 5. Long press the file that you want to delete or rename.Choose to Delete or Rename the file from the popup that appears. |
| MulitDelete | The MultiDelete button allows you to delete multiple files at once. |
| 6. Press the MultiDelete button. | |
| 7. Select the files that you want to delete by marking the relevant checkboxes. | |
| 8. After the checkboxes are marked, press Delete, then OK to confirm. | |
| Save Screenshot | Press Save Screen to save a screenshot of the file system. |
Exit
Press Exit to exit from the file system.
DMM Mode
The DMM function can be used simultaneously with the DSO function. The DMM function is a basic digital multimeter. By default the DMM measurements are hidden in landscape mode. In the vertical display mode the DMM functions and measurements are displayed on the bottom of the screen automatically.
Accessing the Multimeter
There are two methods to access the DMM. Most of these instructions assume that the scope is in the vertical mode. See page 34 to switch to the vertical mode.
First Method: From the main screen, press the title bar to bring up the Drop Down menu. Press the DMM icon to show the multimeter settings.
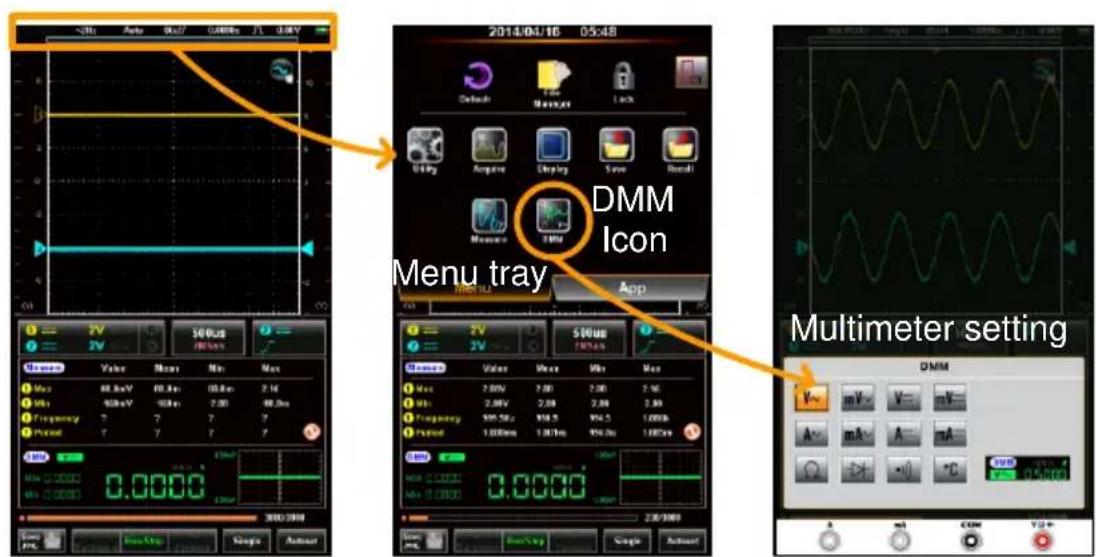
Second Method:
Vertical Orientation: Press and hold the DMM area for a short while to directly bring up the multimeter settings.
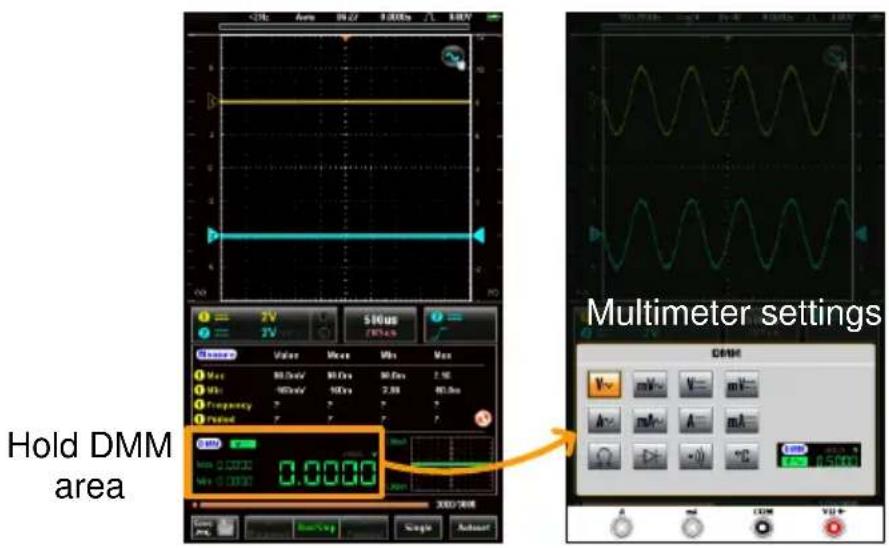
Horizontal Orientation: Press the Measure button to reveal the DMM area*. Press and hold the DMM area for a few seconds to bring up the multimeter settings.
*The DMM area can be expanded/collapsed by pressing once on the DMM area.
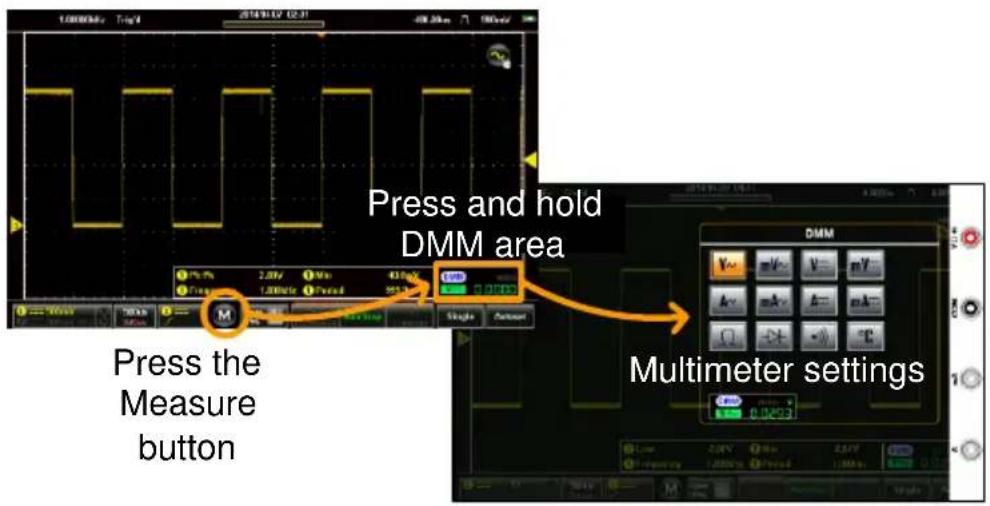
Multimeter Display Overview
The DMM display will show the measurement mode, max, min and current measurement, and a trend plot (vertical view only) of the last 120 measurements. Please note that in the horizontal view, the DMM display is only fully shown in the expanded view, see above for details.
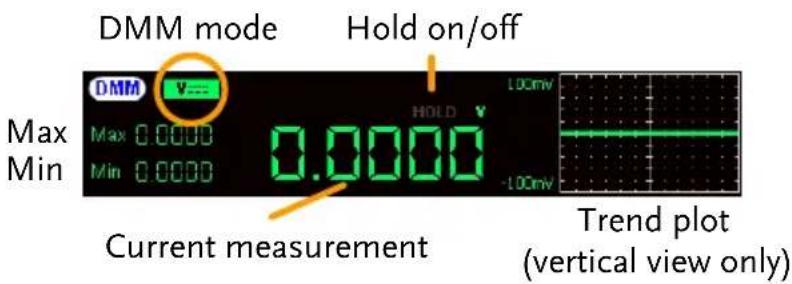
AC/DC Voltage Measurement
Background
The GDS-200/300 can measure up to 600V (CAT II) or 300V (CAT III).
Connection
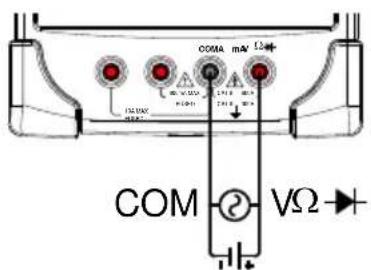
Steps
- From the multimeter settings choose ACV, ACmV, DCV or DCmV.
$$ \mathrm{ACV} = \boxed {\vee \sim} $$
$$ \mathrm{ACmV} = \boxed {\mathrm{mV} \sim} $$
$$ \mathrm{DCV} = \boxed {\mathrm{V} -} $$
$$ \mathrm{DCmV} = \boxed {\mathrm{mV}} $$
- The selected mode will be previewed in the lower corner.
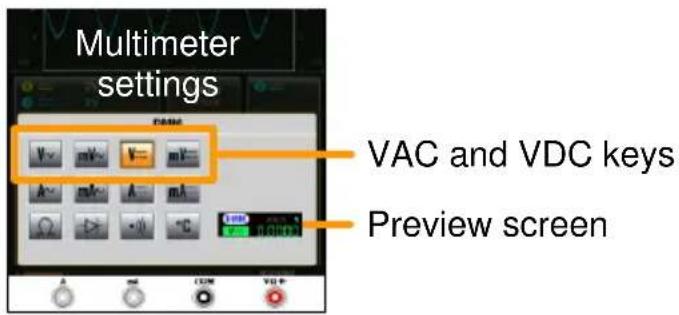
- Press anywhere outside of the multimeter settings area to return to the main display.
Example
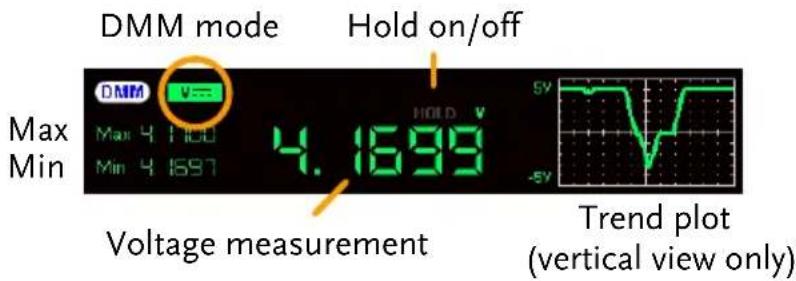
Current Measurement
Back Ground
The GDS-200/300 can measure AC and DC current from two input terminals, depending on the current range. There is a 10A input for I≤10A, and a mA terminal for I≤600mA.
Connection
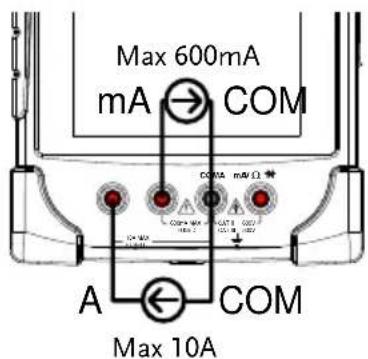
Steps
- From the multimeter settings choose ACA, ACmA, DCA or DCmA. Ensure that no more than the 600mA is input into the mA port.
$$ \mathrm{ACA} = \boxed {\mathrm{A} \sim} $$
$$ \mathrm{ACmA} = \mathrm{mA} \sim $$
$$ D C A = \boxed {A =} $$
$$ \mathrm{DCmA} = \boxed {\mathrm{mA}} $$
- The selected mode will be previewed in the lower corner.
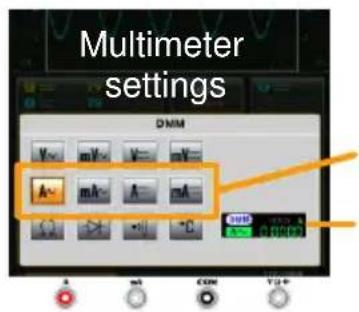
ACA and DCA keys
Preview screen

Note
Ensure that no more than 600mA is input into the mA port. Failure to do so will blow the fuse. See page 176 to replace the fuse.
- Press anywhere outside of the multimeter settings area to return to the main display.
Example
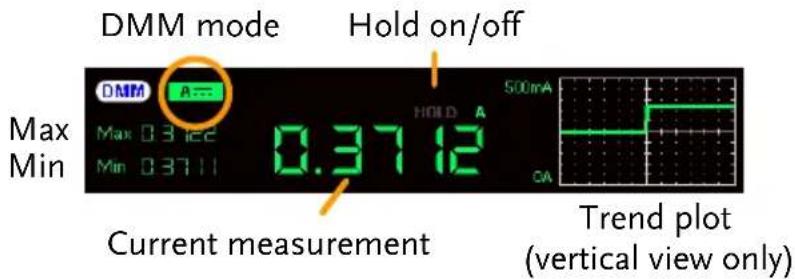
Resistance Measurement
Back Ground
The GDS-200/300 can measure resistance up to 4 counts.
Connection
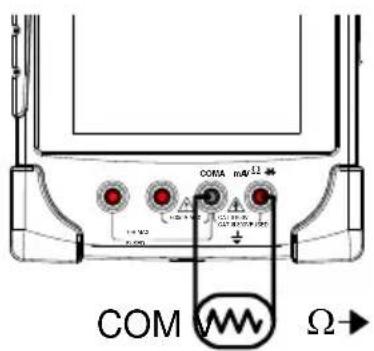
Steps
- From the multimeter settings choose the resistance measurement.
Resistance = Ω
- The selected mode will be previewed in the lower corner.
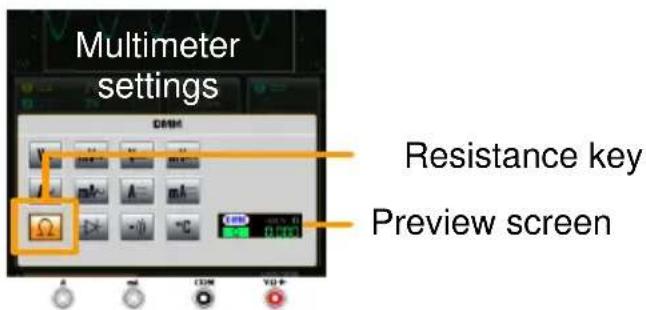
- Press anywhere outside of the multimeter settings area to return to the main display.
Example
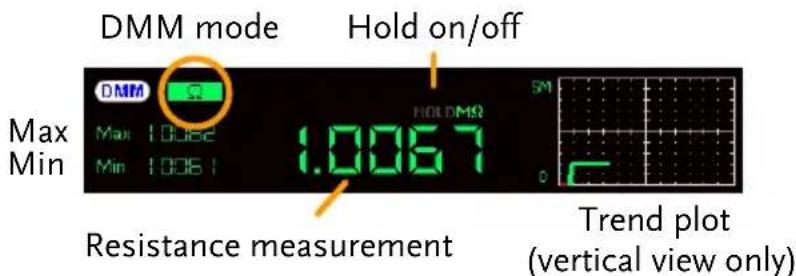
Diode Measurement
Back Ground
The diode test checks the forward bias characteristics of a diode by running a constant forward bias current through the DUT and measuring the forward voltage drop.
Connection
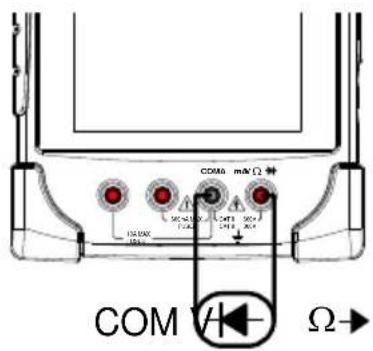
Steps
- From the multimeter settings choose the diode measurement.
Diode =
- The selected mode will be previewed in the lower corner.
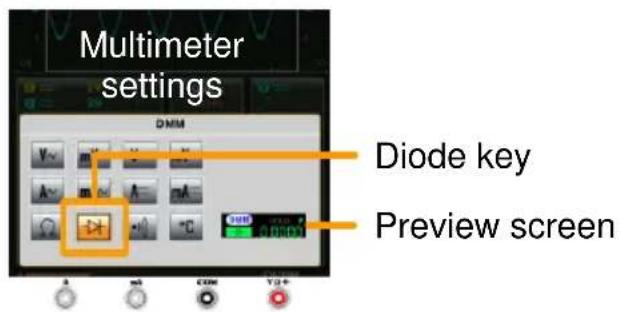
-
Press anywhere outside of the multimeter settings area to return to the main display.
-
OPEN will be displayed when the diode passes the diode test.

Note
Ensure the diode polarity is correct before performing the diode measurement.
Example
DMM mode Hold on/off
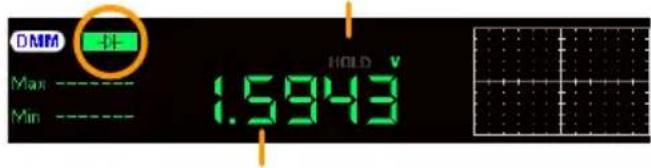
Diode measurement
Continuity Measurement
Back Ground
The continuity test checks that the resistance in the DUT is low enough to be considered continuous (of a conductive nature). The continuity threshold level is set to <15 .
Connection
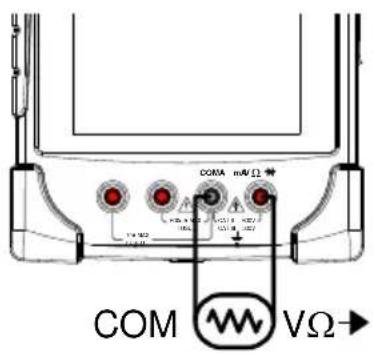
Steps
- From the multimeter settings choose the continuity measurement.
Continuity =
- The selected mode will be previewed in the lower corner.
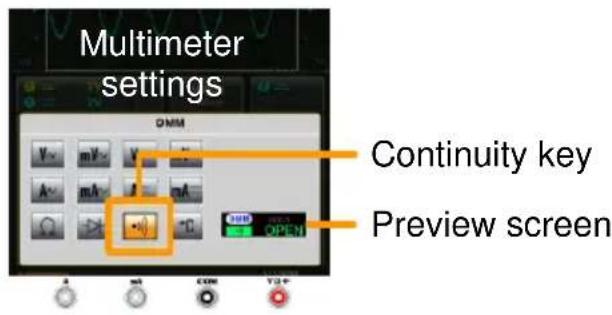
-
Press anywhere outside of the multimeter settings area to return to the main display.
-
The approximate resistance will be displayed when there is continuity present in the connection.
OPEN will be displayed if continuity is not present.
Example
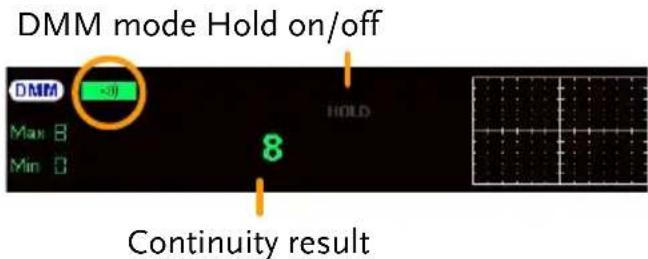
Temperature Measurement
| Back Ground | The GDS-300 can measure temperature using a thermocouple. To measure temperature, the DMM accepts a thermocouple input and calculates the temperature from the voltage fluctuation. The thermocouple type is taken into consideration. Temperature measurement is only supported on the GDS-300. |
 Note Note | Please see the specifications on page 184 for the thermocouple specifications. |
| Connection | 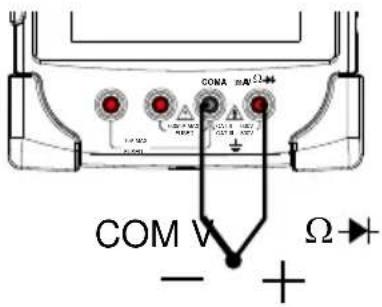 |
Steps
- From the multimeter settings choose the temperature measurement.
- Pressing the Temperature button will toggle between °C and °F.
Temperature = °C / °F
- Next, select the thermocouple type.
Thermocouple = B E, J, K, N, R, S, T
- The selected mode will be previewed in the lower corner.
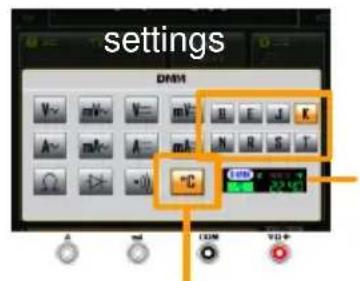
Thermocouple type Preview screen
Temperature key/toggle temperature unit
- Press anywhere outside of the multimeter settings area to return to the main display.
Example
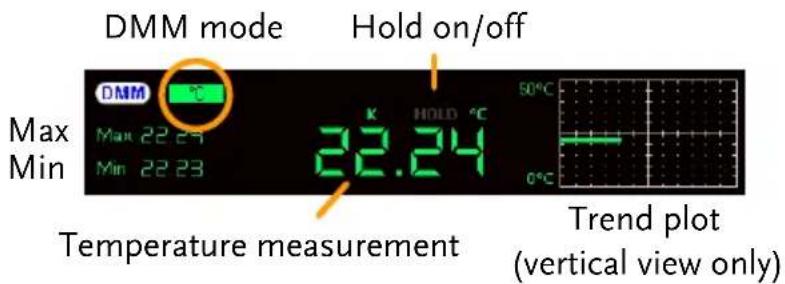
EE APPs
The GDS-200/300 has a number of handy engineering apps built-in. The following apps are available by default:
Attenuation Calculator, Resistance Calculator, Calculator, Advanced DMM, Template Editor and QR-Code Link.
Accessing the EE Apps
From the main screen, press the title bar to bring up the Drop Down menu. Press the App tray to show the EE Apps menu tray.
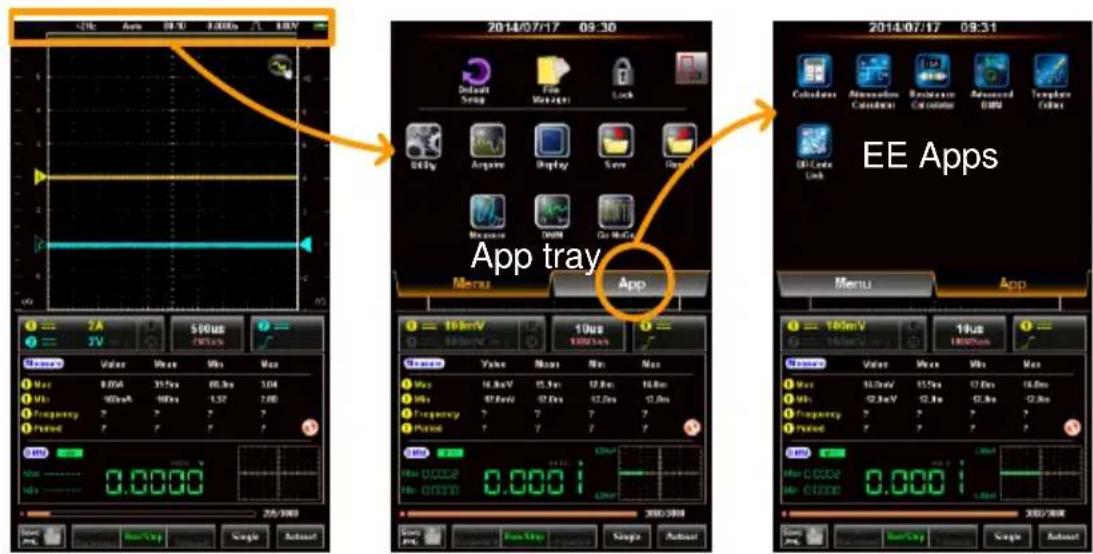
Attenuation Calculator
Background
The attenuation calculator calculates the resistor values of 5 common attenuator circuits. The only input required is the attenuation required (dB), the system impedance (Z_0) and the resistor accuracy (Standard E6 - E192).
Example
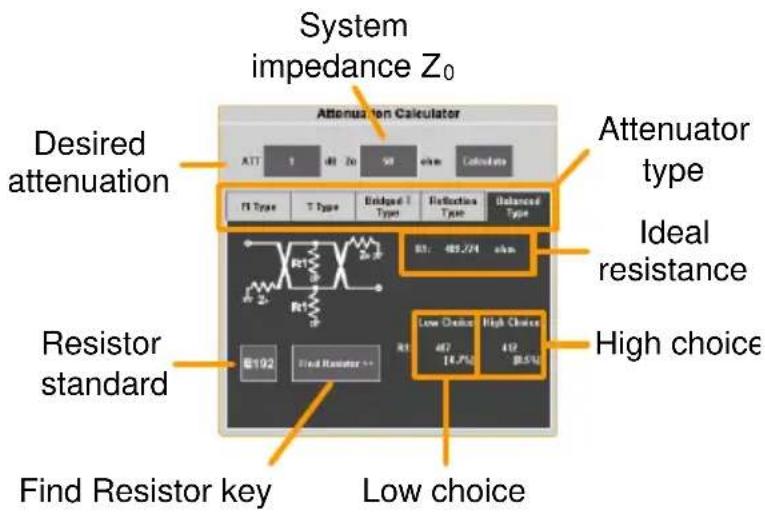
Steps
- From the EE Apps tray select the Attenuation Calculator icon.
- In the ATT field enter the attenuation required in dB.
- In the Z_0 field input the system impedance in ohms. This value is typically 50 .
- Select the type of attenuator circuit.
Circuit: Pi Type, T Type, Bridged-T Type, Reflection Type, Balanced Type
-
Press Calculate. This will calculate the exact resistance values required for the desired attenuation and system impedance
-
Press the EXXX button to select the resistor standard.
-
Press Find Resistor to find the resistors that most closely match the ideal resistance values calculated in step 5.
- The best high and best low resistors are shown along with the percentage offset from the ideal value.
Advanced DMM
Background
The Advanced DMM is similar to the regular DMM mode, however it is full screen and includes an advanced trend plot that can log up to 400 measurements. The trend plot is able to log from 40 seconds to 6 hours worth of measurements.
Example
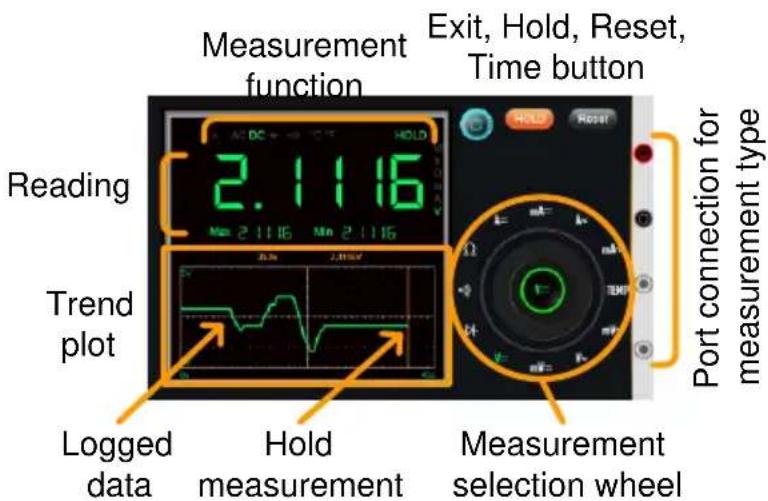

Note
Please see the DMM chapter for details on the different measurement modes and connections. See from page 143.
Select Measurement
-
From the EE Apps tray select the Advanced DMM icon.
-
From the measurement selection wheel select the measurement type.
-
The current measurement, minimum and maximum measurement will be shown as soon as the measurement type is selected.
Logging
-
Data is automatically logged as soon as a measurement function is selected. Logged data is plotted as a green line in the trend plot.
-
Press the Time button and select the logging time. Press OK to confirm the logging duration time.
-
The time is shown as the X-axis of the trend plot.
Time: 40 ~s, 3 ~m, 6 ~m, 15 ~m, 30 ~m, 1 hr, 3 hr, 6 hr
-
To pause the measurement and data logging, press the Hold button.
-
To reset the logging, press the Reset button.
Exit
To exit from the Advanced DMM app, press the Exit button. The advanced DMM will retain its state even after exiting, allowing data logging to continue.
Calculator
| Background | The Calculator function is a convenient scientific calculator especially suited to electronic calculations. |
| Example | Entered equation 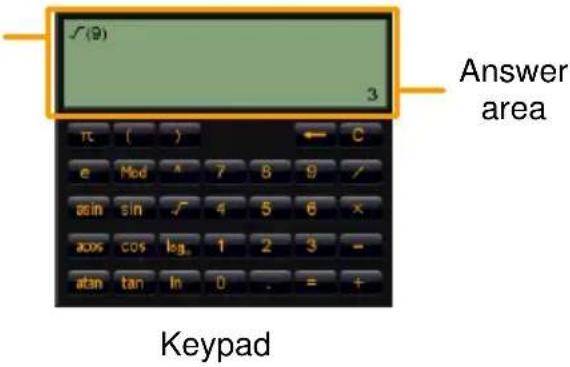 |
Steps
- From the EE Apps tray select the Calculator app.
-
Using the keypad, enter the desired equation.
-
The equations follow standard order of operations.
-
The equation will appear on the top left-hand side.
-
Press the Equals button to perform the calculation
- The answer will appear in the bottom right-hand side.
QR Code Link App
Background
The QR Code Link app displays QR codes for commonly used websites relating to the GDS-200/300. The GW Instek webpage is included as an example.
To use the QR Code Link app, download a QR code reader app for your smartphone and read the QR codes from the QR Code Link app.
Example
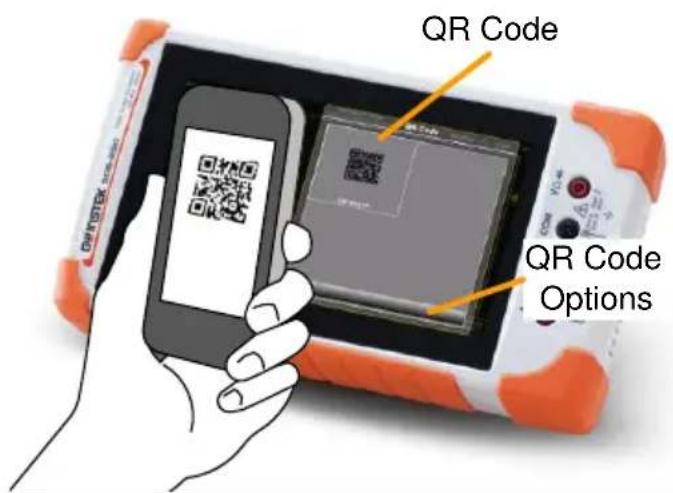
Resistance Calculator
Background
The resistance calculator can calculate the value of a resistor based on the band code. The calculator can also calculate the resistance of SMD resistors based on the 3/4 digit SMD code, EIA-96 (1%) or 2/5/10% code.
See page 177 for information on the various resistor codes.
Standard Resistor 1. From the EE Apps tray select the Resistance Values Calculator icon.
- Press the Color Code button for standard pin-type resistors.
- Select the 4 band or 5 band tab.
- Press each of the colored bands in succession and choose the appropriate color for each band from the pop-up window.
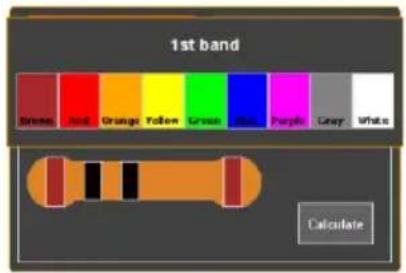
- Press Calculate to calculate the value of the resistor.
Example: Color Code
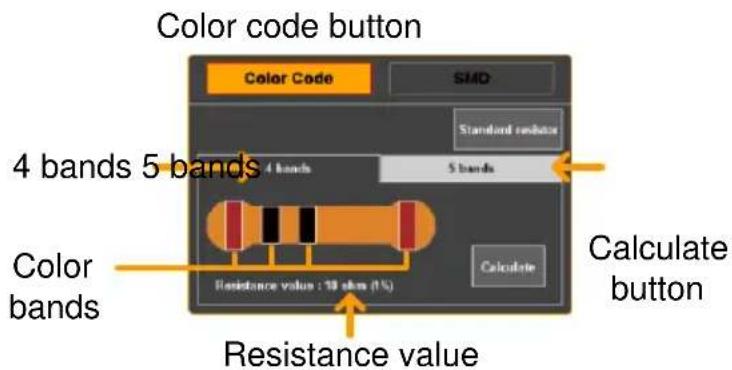
SMD Resistor Values
- SMD resistor values can be calculated in one of 3 ways; using a 3 or 4 digit code, using EIA-96 code or using 2%/5%/10% code.
- Press the SMD button to select SMD resistors.
- Select the tab corresponding to code used on the SMD.
SMD 3-digit/4-digit code EIA-96 2%, 5%, 10%
- Press the SMD code button and enter the SMD code in the pop-up window.
- Press Calculate to calculate the value of the SMD resistor.
Example: SMD
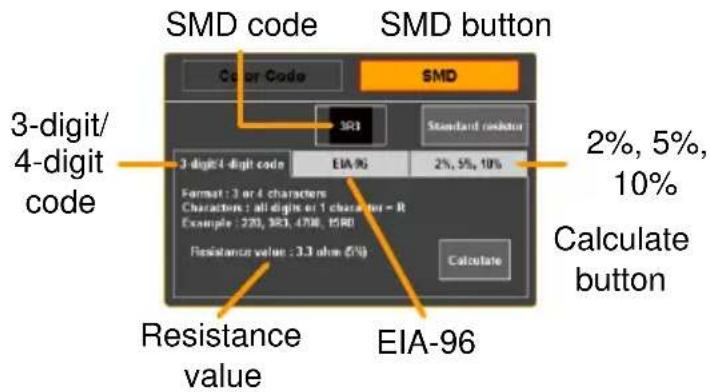
Template Editor
Background
The Template Editor function can be used for Go-NoGo testing. Templates can be edited from existing templates created from the Go-NoGo function or drawn directly from the touch screen.
See page 118 for details on using the Go-NoGo function.
Example
Template offset from source ground
Edit window
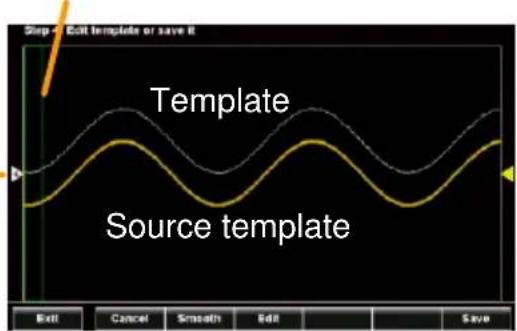
Steps
- From the EE Apps tray select the Template Editor icon.
- Select "Draw New Template" or "Load template from...".
Draw New Template
Draw a template freehand
Load Template from...
Uses a previously saved waveform as a template
- Select a source channel and press Next.
-
If "Draw New Template" was selected, simply trace a template (from left to right) on the screen using the source as guide. The template will be created from a number of points.
-
Press Clear to redo the template drawing.
- Press Undo to delete the last trace point.
• After the points have been drawn, touching any point on the screen will return the vertical value.
Press Next when the template is drawn.
- After the template is first drawn/loaded, the template offset can be edited by swiping the screen up or down from the left of the graticule.
- To edit the template further, swipe the screen
left and right to position the green edit window and press the Edit button.
• Each point within the edit window can now be edited to a fine scale by drawing on the screen.
- Press OK when done.
- To smooth the template press the Smooth button.
- Points will be removed to smooth the template.
- To save the template, press the Save button.
- Choose to save the template to Ref1, Ref2 or as an *.LSF file.
- After saving, you will be given the option to: edit a new template, go directly to the Go-NoGo function or to exit from the Template editor.
REMOTE CONTROL
CONFIG
This chapter describes basic configuration for remote control. For a command list, refer to the programming manual downloadable from the GWInstek website, www.gwinstek.com
Interface Configuration ....165
Configure USB Interface 165
Remote Control Function Check....166
Using Realterm to Establish a Remote Connection....167
Interface Configuration
The GDS-200/300 uses the USB device port for remote control.
When using the remote control function, the GDS-200/300 acts as a virtual COM port (VCP).
New drivers can be downloaded from the GW Instek website, www.gwinstek.com.
Configure USB Interface
| Configuration | PC side connection Type A, host portGDS side connection Type Mini-B, device port |
| Background | The GDS's USB device port needs to be configured to the “Communication” mode to enable the remote connection. |
| Configuration | 1. Connect the PC to the GDS-200/300 using the supplied USB-A to USB Mini-B cable.2. From the Drop Down menu press the Utility icon>USB device port and select Communication. (See page 102).3. When the PC asks for the USB driver, select the USB driver included on the accompanying User Manual CD or download the driver from the GW Instek website, www.gwinstek.com. The driver automatically sets the GDS-200/300 as a virtual COM port.4. The DSO should now be ready for remote control. See page 166 for the remote control function check. |
Remote Control Function Check
| Functionality check | Invoke a terminal application such as Realterm. |
| In the terminal program, set the COM port, baud rate, stop bit, data bit and parity to match the settings for the virtual COM port of the DSO. | |
| To check the COM settings of the DSO in Windows, see the Windows Device Manager. For example, in WinXP go to the Control panel → System → Hardware tab. | |
 Note Note | If you are not familiar with using a terminal application to send/receive remote commands, please page 167 (Using Realterm to Establish a Remote Connection) for more information. |
| Run this query command via the terminal after the instrument has been configured for USB remote control (page 165). | |
| *idn? | |
| This should return the Manufacturer, Model number, Serial number, and Firmware version in the following format. | |
| • GW,GDS-310, XXXXXX, VX.XX | |
 Note Note | For further details, please see the programming manual, available on the GW Instek web site @ www.gwinstek.com. |
Using Realterm to Establish a Remote Connection
| Background | Realterm is a terminal program that can be used to communicate with a device attached to the serial port of a PC or via an emulated serial port via USB.The following instructions apply to version 2.0.0.70. Even though Realterm is used as an example to establish a remote connection, any terminal program can be used that has similar functionality. |
| Note | Realterm can be downloaded on Sourceforge.net free of charge.For more information please see http://realterm.sourceforge.net/ |
| Operation | 1. Download Realterm and install according to the instructions on the Realterm website.2. Connect the GDS-200/300 via USB to a PC and configure for remote control connection (page 165).3. Make note of the baud rate, stop bits and parity of the VCP driver.Go to the Windows device manager and find the COM port number for the connection. For example, go to the Start menu > Control Panel > Device ManagerDouble click thePortsicon to reveal the connected serial port devices and the COM port for each connected device. |
The baud rate, stop bit and parity settings can be viewed by right-clicking the connected device and selecting the Properties option.
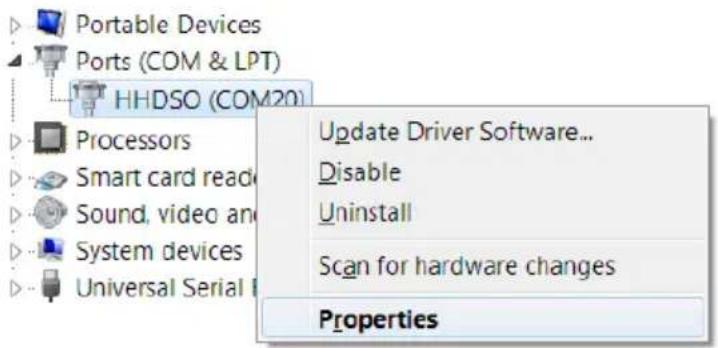
- Start Realterm on the PC as an administrator. Click:
Start menu>All Programs>RealTerm>realterm
Tip: to run as an administrator, you can right click the Realterm icon in the Windows Start menu and select the Run as Administrator option.
- After Realterm has started, click on the Port tab.
Enter the Baud, Parity, Data bits, Stop bits and Port number configuration for the connection.
The Hardware Flow Control and Software Flow Control options can be left at the default settings.
Press Open to connect to the GDS-200/300.
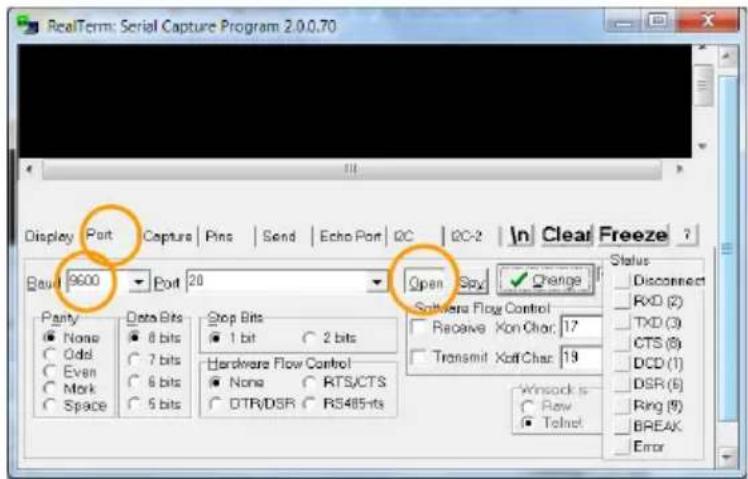
- Click on the Send tab.
In the EOL configuration, check on the +CR and +LF check boxes.
Enter the query:
*idn?
Click on Send ASCII.
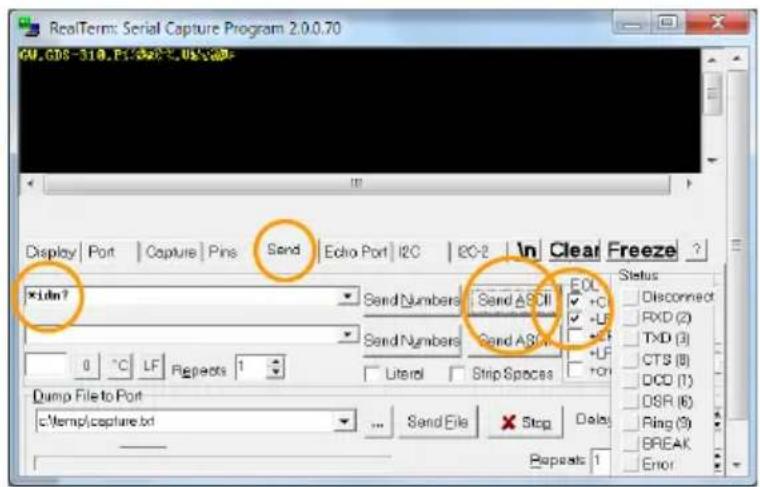
- The terminal display will return the following:
GW, GDS-310, XXXXXXXX, VX.XX
(manufacturer, model, serial number, version)
- If Realterm fails to connect to the unit, please check all the cables and settings and try again.
FAQ
• I connected the signal but it does not appear on the display.
• I want to remove the measurement or FFT results from the display.
• The waveform does not update (frozen).
• The probe waveform is distorted.
• Autoset does not catch the signal well.
• The date and time settings are not correct.
• The accuracy does not match the specification.
I connected the signal but it does not appear on the display.
Make sure you have activated the channel by accessing the vertical menu. You can tell if the channel is activated if its channel indicator is to the left of the graticule. See page 51 to activate a channel.
I want to remove the measurement or FFT results from the display.
In the vertical display mode there is no way to remove the automatic measurements from the display. However in the horizontal display mode the automatic measurements can be removed by pressing the M (Measure) icon in the bottom of the display. See page 89 for further details.
The waveform does not update (frozen).
Press the Run/Stop key to unfreeze the waveform. See page 80 for details.
If this does not help, the trigger mode might be set to Single. Press theRun/Stop key to change out from Single mode.
The probe waveform is distorted.
You might need to compensate the probe. For details, see page 34.
Autoset does not catch the signal well.
The Autoset function cannot catch signals under 30mV or 20Hz. Please manually set the trigger conditions. See page 78 for Autoset details.
The date and time settings are not correct.
For date and time setting details, please see page 33. If it does not help, the battery may be flat. Charge the instrument.
The accuracy does not match the specification.
Make sure the device is powered On for at least 30 minutes, within +20°C-+30°C. This is necessary to stabilize the unit to match the specification.
For more information, contact your local dealer or GWInstek at www.gwinstek.com / marketing@goodwill.com.tw.
APPENDIX
The Appendix contains basic maintenance, miscellaneous information and the device specifications.
Firmware Update....175
Fuse Replacement 176
Resistor Standards 177
Resistor Standards....177
Standard Resistor Code....177
3 or 4 Digit SMD Resistor Standards....178
EIA-96 Code 178
First Two Digits 178
Multiplier 179
2%, 5%, 10% Code....179
Multiplier 179
Last Two Digits....179
GDS-200/300 Default Settings....180
GDS-200/300 Specifications 181
Scope Specifications 181
Vertical....181
Signal Acquisition....181
Trigger....181
Horizontal 182
X-Y Mode....182
Cursors and Measurement....182
Miscellaneous....182
Battery....182
Probe Compensation....182
Interface....182
Display....183
Power Adapter....183
Dimensions and Weight....183
DMM Specifications....183
Basic 183
DC Voltage 183
DC Current....183
AC Voltage....184
AC Current ^* ....184
Resistance* 184
Diode Test....184
Temperature (Thermocouple)* 184
Continuity Beeper 184
Continuity Beeper 184
GDS-200/300 Dimensions ....185
Declaration of Conformity 186
Firmware Update
Background
The GDS-200/GDS-300 firmware can be upgraded by copying the new firmware to the internal memory and installing it.
New firmware can be downloaded on the GW Instek website.
- From the Utility menu set the USB device port to Disk Drive. See page 102 for details.
- The GDS-200/300 will be accessible to the windows file explorer. Copy the firmware file to the root directory of the GDS-200/GDS-300.
- From the Utility menu set the USB device port back to the Communication setting.
- From the File Manager, select the firmware file (tap the file name). See page 139 for details.
- From the popup window select OK to update.
- Do not turn the scope off during the update.
- If using the battery power, ensure that there is adequate power before starting the update.
- Cycle the power off and on after being prompted.
Fuse Replacement
Background
The GDS-200/300 has fuse protection for both current ports, a 10A and a 1A fuse.
Fuse Type 1A: T1A 500V
10A: T10A 500V
Steps
-
Turn the power switch off on the GDS-200/300.
-
Remove the 4 screws that hold the back panel in place.
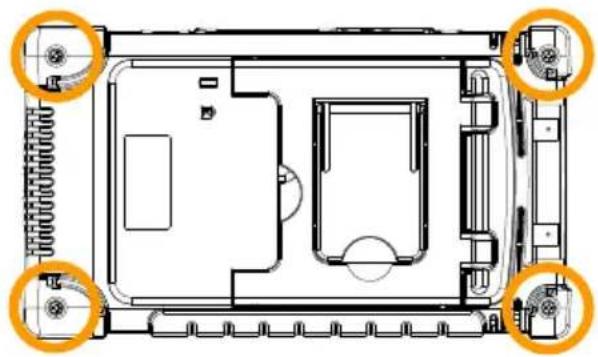
natural_image
Top-down schematic of a device layout with four orange circular annotations pointing to specific components (no text or labels present)- Remove the back panel carefully. You will need a case opening tool to pry open the case after the screws are removed.
Note: the fan wiring is connected to the back panel.
- Replace the fuse that has been blown, as shown below (bottom right-hand side).
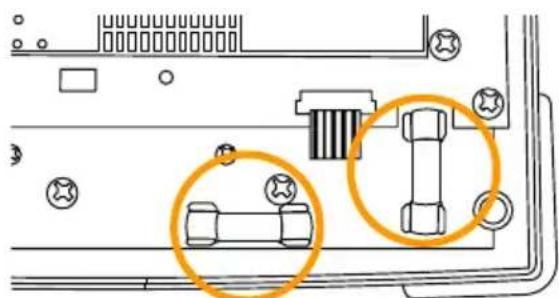
natural_image
Diagram of a computer motherboard showing connectors and socket (no text or symbols)1A fuse 10A fuse
Resistor Standards
Resistor Standards
| Standard | Tolerance | Standard | Tolerance |
| E6 | 20% | E48 | 2% |
| E12 | 10% | E96 | 1% |
| E24 | 5% | E192 | 0.5% |
Standard Resistor Code
Standard resistors use colored bands to represent the value of the resistor. To read 4-colored bands, the first two digits represent the base value, the third is a multiplier and the last band is the tolerance. For a 5-colored band, the first 3 digits represent the base value, the 4^th digit is the multiplier and the last digit is the tolerance.
| Band color | Base digits | Multiplier | Tolerance |
| Black | 0 | 10^0 | - |
| Brown | 1 | 10^1 | ±1% |
| Red | 2 | 10^2 | ±2% |
| Orange | 3 | 10^3 | - |
| Yellow | 4 | 10^4 | - |
| Green | 5 | 10^5 | - |
| Blue | 6 | 10^6 | - |
| Violet | 7 | 10^7 | - |
| Grey | 8 | 10^8 | - |
| White | 9 | 10^9 | - |
| Silver | - | 10^-2 | ±10% |
| Gold | - | 10^-1 | ±5% |
Example: 4 bands, Brown, Black, Black, Brown:
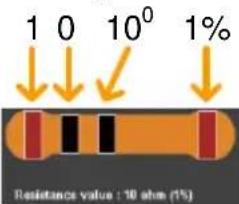
$$ 10 \times 1, 1 \% = 10 \Omega \pm 1 \% $$
3 or 4 Digit SMD Resistor Standards
For 3 or 4 digit SMD codes, the first 2 or 3 digits represent the base value and the last digit represents the multiplier. The letter R is used as a decimal point.
Example1: The code 220 equals 22Ω.
Example2: The code 12R0 equals 12.0Ω.
EIA-96 Code
The EIA-96 standard is a 3 letter code. The first 2 digits codify a base value and the last digit is a letter that codifies a multiplier. EIA-96 code is used for tolerances of 1%.
First Two Digits
| Code | Value | Code | Value | Code | Value | Code | Value | Code | Value | Code | Value |
| 01 | 100 | 17 | 147 | 33 | 215 | 49 | 316 | 65 | 464 | 81 | 681 |
| 02 | 102 | 18 | 150 | 34 | 221 | 50 | 324 | 66 | 475 | 82 | 698 |
| 03 | 105 | 19 | 154 | 35 | 226 | 51 | 332 | 67 | 487 | 83 | 715 |
| 04 | 107 | 20 | 158 | 36 | 232 | 52 | 340 | 68 | 499 | 84 | 732 |
| 05 | 110 | 21 | 162 | 37 | 237 | 53 | 348 | 69 | 511 | 85 | 750 |
| 06 | 113 | 22 | 165 | 38 | 243 | 54 | 357 | 70 | 523 | 86 | 768 |
| 07 | 115 | 23 | 169 | 39 | 249 | 55 | 365 | 71 | 536 | 87 | 787 |
| 08 | 118 | 24 | 174 | 40 | 255 | 56 | 374 | 72 | 549 | 88 | 806 |
| 09 | 121 | 25 | 178 | 41 | 261 | 57 | 383 | 73 | 562 | 89 | 825 |
| 10 | 124 | 26 | 182 | 42 | 267 | 58 | 392 | 74 | 576 | 90 | 845 |
| 11 | 127 | 27 | 187 | 43 | 274 | 59 | 402 | 75 | 590 | 91 | 866 |
| 12 | 130 | 28 | 191 | 44 | 280 | 60 | 412 | 76 | 604 | 92 | 887 |
| 13 | 133 | 29 | 196 | 45 | 287 | 61 | 422 | 77 | 619 | 93 | 909 |
| 14 | 137 | 30 | 200 | 46 | 294 | 62 | 432 | 78 | 634 | 94 | 931 |
| 15 | 140 | 31 | 205 | 47 | 301 | 63 | 442 | 79 | 649 | 95 | 953 |
| 16 | 143 | 32 | 210 | 48 | 309 | 64 | 453 | 80 | 665 | 96 | 976 |
Multiplier
| Letter Code | Multiplier | Letter Code | Multiplier |
| F | 10^5 | B | 10^1 |
| E | 10^4 | A | 10^0 |
| D | 10^3 | X or S | 10^-1 |
| C | 10^2 | Y or R | 10^-2 |
Example: 01A = 100Ω
2%, 5%, 10% Code
A variation to the EIA-96 standard is also used for tolerances of 2%, 5% or 10%. This variation also uses a 3 letter code. The first digit codifies the multiplier and the last two digits codify the base value.
Multiplier
The multiplier is the same as the EIA-96 standard.
| Letter Code | Multiplier | Letter Code | Multiplier |
| F | 10^5 | B | 10^1 |
| E | 10^4 | A | 10^0 |
| D | 10^3 | X or S | 10^-1 |
| C | 10^2 | Y or R | 10^-2 |
Last Two Digits
| 2% Tolerance | 5% Tolerance | 10% Tolerance | |||||||
| Code | Value | Code | Value | Code | Value | Code | Value | Code | Value |
| 01 | 100 | 13 | 330 | 25 | 100 | 37 | 330 | 49 | 100 |
| 02 | 110 | 14 | 360 | 26 | 110 | 38 | 360 | 50 | 120 |
| 03 | 120 | 15 | 390 | 27 | 120 | 39 | 390 | 51 | 150 |
| 04 | 130 | 16 | 430 | 28 | 130 | 40 | 430 | 52 | 180 |
| 05 | 150 | 17 | 470 | 29 | 150 | 41 | 470 | 53 | 220 |
| 06 | 160 | 18 | 510 | 30 | 160 | 42 | 510 | 54 | 270 |
| 07 | 180 | 19 | 560 | 31 | 180 | 43 | 560 | 55 | 330 |
| 08 | 200 | 20 | 620 | 32 | 200 | 44 | 620 | 56 | 390 |
| 09 | 220 | 21 | 680 | 33 | 220 | 45 | 680 | 57 | 470 |
| 10 | 240 | 22 | 750 | 34 | 240 | 46 | 750 | 58 | 560 |
| 11 | 270 | 23 | 820 | 35 | 270 | 47 | 820 | 59 | 680 |
| 12 | 300 | 24 | 910 | 36 | 300 | 48 | 910 | 60 | 820 |
Example: A22 = 22Ω
GDS-200/300 Default Settings
The following default settings are the factory configuration settings for the GDS-200/300.

To return the factory default setting, press the Default Definition from the Drop Down menu. See page 94 to access the Drop Down menu.
| Function Group | Default Settings | |
| Acquire | Mode: Sample Interpolation: Sin(x)/x Record length: 10k | XY: OffSample rate: 100MSa/s |
| Display | Mode: Vector Waveform intensity: 50% Brightness: 80% (ECO:On) | Persistence: Short Graticule intensity: 50% Graticule: Full |
| Channel | Scale: 100mV/Div Coupling: DC Invert: Off Expand: By ground Probe: voltage | CH1: On Impedance: 1MΩ Bandwidth limit: Off Position: 0.00V Probe attenuation: 1x |
| Cursor | Horizontal cursor: Off | Vertical cursor: Off |
| Measure | Source: CH1 Display: Off | Gating: Screen Mean & Std Dev Samples: 2 |
| Horizontal | Scale: 10us/Div | Position: 0.000s |
| Math | Source1: CH1 Source2: CH2 Unit/Div: 200mV | Operator: + Position: 0.00 Div Math: Off |
| Trigger | Type: Edge Coupling: DC Rejection: Off Slope: Positive Mode: Auto | Source: CH1 Alternative: Off Noise Rejection: Off Level: 0.00V Holdoff: 10.0ns |
| Utility | Hardcopy: Save image | File format: PNG |
GDS-200/300 Specifications
The specifications apply when the GDS-200/GDS-300 is powered on for at least 30 minutes.
Scope Specifications
Vertical
| Channel | 2 (BNC-Shield) |
| Input Impedance | 1MΩ |
| Maximum Input | CATII 300VRMs |
| Input Coupling | AC, DC, GND |
| Bandwidth | DC-70/100/200MHz (-3dB) |
| Rise Time | <5ns / 3.5ns / 1.75ns approx. |
| Sensitivity | 2mV/div-10V/div (1-2-5 increments) |
| Accuracy | ±(3% x Readout + 0.1 div + 1mV) |
| Bandwidth Limit | 20MHz(-3dB) |
| Polarity | Normal, Invert |
| Offset Position Range | 2mV/div-50mV/div: ±0.4V100mV/div-500mV/div: ±4V1V/div-5V/div: ±40V10V/div: ±300V |
Signal Acquisition
| Realtime Sample Rate | 1GSa/s |
| Memory Depth | 5M points per channel (GDS-307/310/320) |
| 1M points per channel (GDS-207/210/220) | |
| Acquisition Mode | Average: 2-256 waveforms |
| Peak detect: 10ns | |
| sin(x)/x or ET | |
| Replay wfms. | 30,000 wfms |
Trigger
| Source | Ch1 or Ch2 |
| Trigger Mode | Auto, Normal, Single, Force |
| Trigger Type | Edge, Pulse width, Video, Alternative |
| Trigger Holdoff | 10ns - 10s |
| Coupling | AC, DC, LFR, HFR, NR |
Sensitivity
DC - 25MHz: approx. 0.5div or 5mV
25MHz - 70/100/200MHz: approx. 1.5div or 15mV
Horizontal
| Range | 5ns-100s/Div (1-2-5 increments) |
| Roll | 100ms/div - 100s/div |
| Pre-Trigger | 10 div max. |
| Post-Trigger | 1,000 div max (depend on time base) |
| Accuracy | ±20ppm over any > 1ms time interval |
X-Y Mode
| Phase Shift | ±3° at 100kHz |
Cursors and Measurement
| Cursors | Voltage difference between cursors(ΔV), time difference between cursors(ΔT), frequency measure(1/ΔT) |
| Auto-measurement | 36 sets |
| Auto-counter | 6 digits. Range: 2Hz to rated bandwidth |
| Autoset | Available |
Miscellaneous
| Multi-language Menu | Available |
| On-line Help | Available |
| Time and Clock | Available |
Battery
| Battery Power | Li-polymer 6100mA/hr, 7.4V (Built-in) |
| Charge Time | 2.0 hour (75%) |
| Operation Time | 4.1 hours, depending on the operating conditions. |
Probe Compensation
2V, 1kHz, 50% Duty cycle
Interface
| USB | USB Device (Isolated) |
| Internal Flash Disk | 120MB |
Display
| Type | 7 Inch |
| Display Resolution | 480 x 800 |
| Display Orientation | Landscape and Portrait |
| Backlight Control | Manual adjustable & ECO mode |
| Touch Panel | Capacitive |
Power Adapter
| Line Voltage | AC 100V-240V, 47-63Hz, Power Consumption 40W |
| DC Output | 12V/3A, double shielded wire cable |
Dimensions and Weight
| Weight | 1.5kg |
| Dimensions | HxWxD(mm) 240.2mm x 136.0mm x 59.7 mm |
DMM Specifications
Basic
| Reading | 50,000 counts, 4 12 digits (GDS-307/310/320) |
| 3 12 digits (GDS-207/210/220) | |
| Voltage Input | CAT II 600VRMS, CAT III 300VRMS |
DC Voltage
| Range | 50mV, 500mV, 5V, 50V, 500V, 1000V, 6 ranges |
| Accuracy | GDS-307/310/320: 50mV, 500mV, 5V, 50V, 500V ±(0.05% + 5 digits), 1000V ±(0.1% + 5 digits)GDS-207/210/220: 50mV, 500mV, 5V, 50V, 500V, 1000V ±(0.1% + 5 digits) |
| Input Impedance | 10MΩ |
DC Current
| Range | 50mA, 500mA, 10A, 3 ranges |
| Accuracy | GDS-307/310/320: 50mA - 500mA, 2 Ranges, ±(0.1% + 5 digits), 10A ±(0.5% + 1 digits)GDS-207/210/220: 50mA - 500mA, 10A 3 Ranges, ±(0.5% + 1 digits) |
AC Voltage
| Range | 50mV, 500mV, 5V, 50V, 700V 5 ranges |
| Accuracy | 50mV, 500mV, 5V, 50V, 700V ±(1.5% + 15 digits) at 50Hz-1kHz |
AC Current*
| Range | 50mA, 500mA, 10A 3 ranges |
| Accuracy | 50mA, 500mA, ±(1.5% + 15 digits) at 50Hz-1kHz |
| 10A ±(3% + 15 digits) at 50Hz-1kHz |
* Measure range: >10mA
Resistance*
| Range | 500Ω, 5kΩ, 50kΩ, 500kΩ, 5MΩ, 5 range |
| Accuracy | 500Ω, 5kΩ, 50kΩ, 500kΩ ± (0.3% + 3 digits) |
| 5MΩ ± (0.5% + 5 digits) |
* Measure range: 50Ω to 5MΩ
Diode Test
Maximum forward voltage 1.5V, Open voltage 2.8V
Temperature (Thermocouple)*
| Range | -50°C - + 1000°C |
| Resolution | 0.1°C |
| Thermocouple | B, E, J, K, N, R, S, T |
* Specifications do not include probe accuracy. Temperature specifications only apply to the GDS-307/310/320.
Continuity Beeper
< 15 Ω
Continuity Beeper
| Functions | Auto Range, Max, Min, Hold, Trend plot |
GDS-200/300 Dimensions
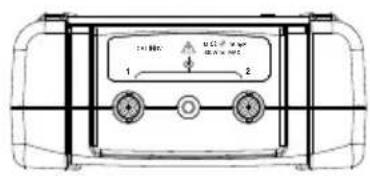
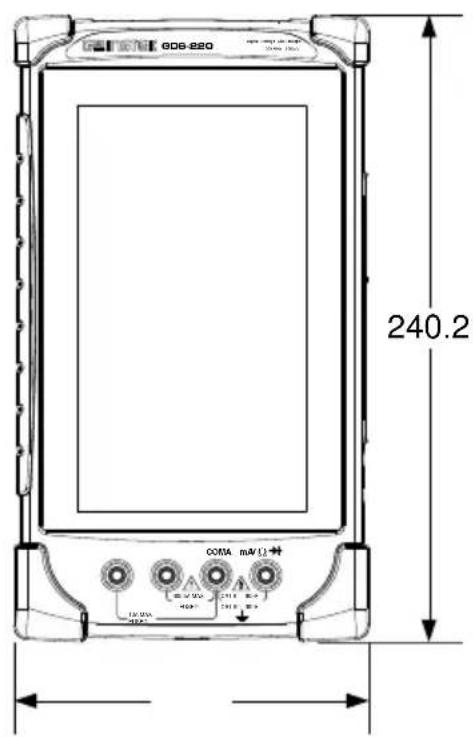
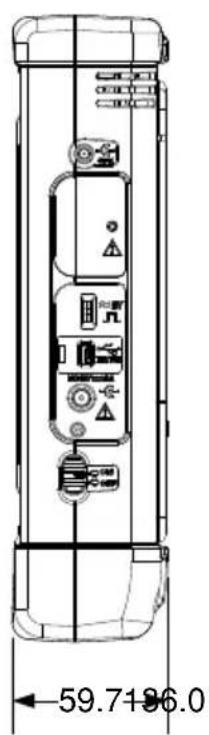
Declaration of Conformity
We
GOOD WILL INSTRUMENT CO., LTD.
No. 7-1, Jhongsing Rd, Tucheng Dist., New Taipei City 236. Taiwan.
GOOD WILL INSTRUMENT (SUZHOU) CO., LTD.
No. 69 Lushan Road, Suzhou New District Jiangsu, China.
declare that the below mentioned product
Type of Product: Compact Digital Storage Oscilloscope and Multimeter
Model Number: GDS-207, GDS-210, GDS-220, GDS-307, GDS-310, GDS-320
are herewith confirmed to comply with the requirements set out in the Council Directive on the Approximation of the Law of Member States relating to Electromagnetic Compatibility (2004/108/EC) and Low Voltage Directive (2006/95/EC).
For the evaluation regarding the Electromagnetic Compatibility and Low Voltage Directive, the following standards were applied:
| ◎ EMC | ||
| EN 61326-1:EN 61326-2-1:EN 61326-2-2: | Electrical equipment for measurement, control and laboratory use -- EMC requirements (2013) | |
| Conducted & Radiated EmissionEN 55011: 2009+A1: 2010 | Electrostatic DischargeEN 61000-4-2: 2009 | |
| Current HarmonicsEN 61000-3-2: 2006+A1: 2009+A2: 2009 | Radiated ImmunityEN 61000-4-3: 2006+A1: 2008+A2: 2010 | |
| Voltage FluctuationsEN 61000-3-3: 2008 | Electrical Fast TransientsEN 61000-4-4: 2012 | |
| -------- | Surge ImmunityEN 61000-4-5: 2006 | |
| -------- | Conducted SusceptibilityEN 61000-4-6: 2009 | |
| -------- | Power Frequency Magnetic FieldEN 61000-4-8: 2010 | |
| -------- | Voltage Dip/ InterruptionEN 61000-4-11: 2004 | |
| Low Voltage Equipment Directive 2006/95/EC | ||
| Safety Requirements | EN 61010-1: 2010 (Third Edition)EN 61010-0-030: 2010 (First Edition)EN 61010-2-033: 2012 (First Edition) | |
INDEX
Accessories 14
Advanced DMM 156
Amplitude measurements ..... 86
Area measurements 87
Attenuation calculator .... 155
Autoset configuration ...... 103
Battery
Safety instruction 8
BNC Panel 20
Brightness 117
Buzzer 100
Calculator 158
Calibration 105
Caution symbol 5
Cleaning the instrument ..... 7
Common UI elements ...... 47
Declaration of conformity ..... 186
Default settings 94
Default settings list ...... 180
Delay measurements 88
Delete files 141
Delete folders 141
Dimensions 185
Display Overview 21
Disposal instructions 8
DMM 143
Continuity 150
Current 146
Diode 149
Resistance 147
Temperature 152
Voltage 145
EE Apps 154
EIA-96 codes....178
EN61010
measurement category ...... 6
Pollution degree....7
Environment
Safety instruction 7
Erase memory 100
Erase Memory 100
FAQ 171
File manager 139
Firmware update 175
Frequency measurements ..... 87
Front panel diagram 15
Fuse replacement 176
Gesture control 41
Gestures 25
Go-NoGo....118
Running a test 122
Graticule 116
Hardcopy configuration ...... 100
Help menu 28
Horizontal orientation ...... 34
Initial setup 30
Date & time 33
Language 34
Power up 30
Screen orientation 34
Stand 32
Intensity
Graticule 115
Waveform 114
Interface configuration ...... 165
Interface panel diagram ...... 18
Language 96
List of features 12
Mean measurements 86
Model differences ...... 12
Operation
Acquisition 107
Acquisition mode 108
ALT trigger....72
Automatic measurement options92
Automatic measurements ..... 86
Automatic measurements types 86
Autoset 78
Autoset configuration ...... 103
Channel selection .... 51
Cursor operation 83
Display 112
Display dots.... 112
Display vectors 112
Drop-down menu.... 94
Edge trigger....74
Force trigger 72
Gesture control 41
Horizontal expansion ...... 61
Horizontal position 59
Intensisty 114
Interpolation.... 111
Math 57
Panel lock 95
Panel lock 95
Persistence 113
Pulse trigger 76
Record length 110
Reference waveforms 56
Run mode 80
Selecting automatic measurements.... 90
Single trigger mode 82
Touch sounds 100
Trigger 66
Trigger level 73
Trigger mode....71
Trigger parameters.... 69
Trigger settings 68
UI elements....47
USB device port 102
Utility menu 96
Vertical menu 50
Vertical options 53
Vertical scale 52
Video trigger 77
View automatic measurements..89
XY mode.... 109
Zoom 63
Overshoot measurements ..... 87
Overview
Using the touch interface ...... 25
Peak measurements 86
Peak to peak measurement ..... 86
Power on/off Safety instruction .... 7
Probe compensation .... 34
Pulse measurements 87
QR code link app 159
Rear panel diagram 17
Recall 135
Setup 138
Waveforms 135
Remote control 165
Remote control function check166
Realterm 167
Rename files 141
Resistance calculator .... 159
Resistor codes 177
Resistor standards ..... 177
RMS measurements 86
Ruler 104
Save 124
All 133
Images 125
Setups 131
Waveforms 128
Service operation About disassembly .... 6 contact .... 172
SMD codes 178
SPC 98
Specifications 181
System date & time 99
System date and time ...... 33, 99
System information 97
Template Editor 161
Touch sounds 100
UK power cord 9
Updating the firmware ..... 175
USB device port 102
USB driver installation 31
USB OTG 102
Vertical orientation 34
Warning symbol 5

- Compact Digital Storage Oscilloscope and Digital Multimeter
- Table of Contents
- SAFETY INSTRUCTIONS 5
- GETTING STARTED 10
- OPERATION 37
- REMOTE CONTROL CONFIG ....164
- FAQ 171
- APPENDIX 173
- INDEX....187
- SAFETY INSTRUCTIONS
- Safety Symbols
- Safety Guidelines
- Power cord for the United Kingdom
- WARNING: THIS APPLIANCE MUST BE EARTHED
- GETTING STARTED
- Appearance.... 15
- Initial Setup 30
- GDS-200 and GDS-300 Series Overview
- Series Lineup
- Main Features
- Performance
- Features
- Interface
- Appearance
- Interface Panel
- Display Overview
- Horizontal
- Vertical
- How to Use the Touch Interface
- Background
- Basic Gestures
- Help Menu
- Steps
- Initial Setup
- USB Driver Installation
- Installation
- Tilting the Stand
- Setting the System Date & Time
- Note
- PERATION
- Gesture Control.... 41
- Common Menu UI Elements.... 47
- Vertical Menu Operation 50
- Trigger Menu Operation 66
- Trigger Setting.... 68
- Acquire Menu....107
- Display Menu....112
- Go-NoGo Menu....118
- Save Operations....124
- Recall Operations....135
- File Manager....139
- DMM Mode....143
- EE APPs 154
- Gesture Control
- Example
- Select the Trigger Source and the Trigger Level
- Select Trigger Source
- Set the Trigger Level
- Common Menu UI Elements
- Radio Check Boxes
- Toggle Switches
- Sliding Scales
- Value Picker
- Keyboards and Keypads
- Vertical Menu Operation
- Vertical Icon Overview
- Entering the Vertical Menu
- Channel or Reference/Math Waveform Selection and Activation
- Turning a Channel On
- Vertical Options – Channel
- Setup
- Coupling
- Probe
- Math
- FFT
- Math details
- Horizontal Position
- Menu Control
- Touch Control
- Horizontal Expansion
- Zoom
- Trigger Menu Operation
- Trigger Icon Overview
- Entering the Trigger Menu
- Trigger Setting
- Trigger Types
- Edge
- Video
- Trigger Parameters and Settings
- Trigger Mode
- Forced Trigger
- Alternate Trigger
- Edge Trigger
- Pulse Trigger
- Video Trigger
- Autoset
- Run Mode
- Run/Stop and Single Key Overview
- Single Mode
- Single
- Cursor Measurements
- Using Cursors
- Automatic Measurements
- Measurement Types
- Viewing Automatic Measurements
- Selecting an Automatic Measurement
- OR
- Automatic Measurement Options
- Drop-Down Menu
- Opening the Drop-down Menu
- Return to Default Settings
- OPERATION
- Panel Lock
- Activate Panel Lock
- Disable Panel Lock
- Utility Menu
- Accessing the Utility Menu
- View System Information
- Calibration
- Acquire Menu
- Accessing the Acquisition Menu
- Show Waveform in XY Mode
- Connection
- Display Menu
- Accessing the Display Menu
- Display the Waveform as Dots or Vectors
- Go-NoGo Menu
- Accessing the Go-NoGo Menu
- Configuring the Go-NoGo Menu
- Source
- Condition
- Save Template
- Running a Go-NoGo Test
- Run Go-NoGo Test
- Save Operations
- Accessing the Save Menu
- Brief Mode
- From
- Destination
- Save All
- Recall Operations
- Accessing the Recall Menu
- Recalling Waveform Files
- File Manager
- Accessing the File Manager
- Navigating the File System
- DMM Mode
- Accessing the Multimeter
- Multimeter Display Overview
- AC/DC Voltage Measurement
- Current Measurement
- Back Ground
- Resistance Measurement
- Diode Measurement
- Continuity Measurement
- EE APPs
- Accessing the EE Apps
- Attenuation Calculator
- Advanced DMM
- Select Measurement
- Logging
- Exit
- QR Code Link App
- Resistance Calculator
- Template Editor
- REMOTE CONTROL
- CONFIG
- Interface Configuration ....165
- Interface Configuration
- FAQ
- APPENDIX
- Firmware Update
- Fuse Replacement
- Resistor Standards
- Standard Resistor Code
- or 4 Digit SMD Resistor Standards
- EIA-96 Code
- Multiplier
- GDS-200/300 Default Settings
- GDS-200/300 Specifications
- Scope Specifications
- DMM Specifications
- Declaration of Conformity
- INDEX
Brand : GW Instek
Model : GDS-220
Category : Multimeter