MHO2034 - Uncategorized Rigol - Free user manual and instructions
Find the device manual for free MHO2034 Rigol in PDF.


| Product Type | Mixed Signal Oscilloscope (MSO) |
| Bandwidth | 350 MHz |
| Number of Channels | 4 Analog + 16 Digital |
| Sample Rate (Maximum) | 2 GSa/s (half channels), 1 GSa/s (all channels) |
| Memory Depth | 100 Mpts (half channels), 50 Mpts (all channels) |
| Display | 10.1 inches TFT LCD, 1024 x 600 pixels, capacitive touch |
| Vertical Sensitivity | 1 mV/div to 10 V/div |
| Timebase Range | 2 ns/div to 1000 s/div |
| Input Impedance | 1 MΩ ± 2% || 14 pF ± 3 pF |
| Power Supply | AC 100-240 V, 50/60 Hz, maximum 150 VA |
| Dimensions (W x H x D) | 390 mm x 205 mm x 120 mm |
| Weight | Approximately 4.2 kg |
| Operating Temperature | 0°C to +50°C |
| Storage Temperature | -40°C to +70°C |
| Interfaces | USB (Host & Device), LAN, HDMI, GPIB (optional), AUX |
| Main Functions | Waveform capture, FFT analysis, serial decoding, mask test, recording, math functions |
| Maintenance and Cleaning | Keep vents clear; clean with a soft, dry cloth; no harsh chemicals |
| Safety Certifications | CE, UL, CSA, IEC 61010-1 |
| Spare Parts and Repairability | Contact Rigol authorized service centers; replaceable probes and fuses |
| General Information | Includes probes, power cord, USB cable; optional software for PC connectivity |
Frequently Asked Questions - MHO2034 Rigol
User questions about MHO2034 Rigol
0 question about this device. Answer the ones you know or ask your own.
Ask a new question about this device
Download the instructions for your Uncategorized in PDF format for free! Find your manual MHO2034 - Rigol and take your electronic device back in hand. On this page are published all the documents necessary for the use of your device. MHO2034 by Rigol.
USER MANUAL MHO2034 Rigol
Guaranty and Declaration
Copyright
© 2025 RIGOL TECHNOLOGIES CO., LTD. All Rights Reserved.
Trademark Information
RIGOL ® is the trademark of RIGOL TECHNOLOGIES CO., LTD.
Notices
• RIGOL products are covered by P.R.C. and foreign patents, issued and pending.
- RIGOL reserves the right to modify or change parts of or all the specifications and pricing policies at the company's sole decision.
• Information in this publication replaces all previously released materials.
• Information in this publication is subject to change without notice.
- RIGOL shall not be liable for either incidental or consequential losses in connection with the furnishing, use, or performance of this manual, as well as any information contained.
- Any part of this document is forbidden to be copied, photocopied, or rearranged without prior written approval of RIGOL.
Product Certification
RIGOL guarantees that this product conforms to the national and industrial standards in China as well as the ISO9001:2015 standard and the ISO14001:2015 standard. Other international standard conformance certifications are in progress.
Contact Us
If you have any problem or requirement when using our products or this manual, please contact RIGOL.
E-mail: service@rigol.com
Website: http://www.rigol.com
Section Description Page
List of Figures....IX
List of Tables.....XVI
1 Safety Requirement ....1
1.1 General Safety Summary .... 1
1.2 Safety Notices and Symbols 3
1.3 Measurement Category 3
1.4 Ventilation Requirement 4
1.5 Working Environment 4
1.6 Care and Cleaning 6
1.7 Environmental Considerations 6
2 Product Features 8
3 Document Overview 9
4 Quick Start 11
4.1 General Inspection 11
4.2 Product Appearance 12
4.3 Appearance and Dimensions 13
4.4 To Prepare for Use 13
4.4.1 To Adjust the Supporting Legs 13
4.4.2 To Connect to AC Power 14
4.4.3 Turn-on Checkout 15
4.4.4 To Replace the Fuse 15
4.4.5 To Set the System Language 16
4.4.6 To Connect the Probe 16
4.4.7 Function Inspection 19
4.4.8 Probe Compensation 21
4.5 Product Overview 21
4.5.1 Front Panel 21
4.5.2 Front Panel Function Overview 22
4.5.3 Rear Panel 28
4.5.4 User Interface 30
4.6 Touch Screen Gestures 33
4.6.1 Tap 33
4.6.2 Pinch&Stretch 33
4.6.3 Drag 34
4.6.4 Rectangle Drawing 35
4.7 Parameter Setting Method 37
4.8 To Use the Security Lock 41
4.9 To Use the Built-in Help System 41
4.10 To View the Option and the Option Installation 41
5 To Set the Vertical System 43
5.1 To Enable or Disable the Analog Channel 43
5.2 To Adjust the Vertical Scale 45
5.3 To Adjust the Vertical Offset 46
5.4 Channel Coupling 47
5.5 BW Limit 48
5.6 Input Impedance 48
5.7 Waveform Invert 49
5.8 Probe 50
5.9 Amplitude Unit 54
5.10 Bias 55
5.11 Channel Delay 55
5.12 Channel Label 56
6 Horizontal System 57
6.1 To Adjust the Horizontal Time Base 57
6.2 To Adjust the Horizontal Position 58
6.3 Zoom Mode (Delayed Sweep) 59
7 Acquisition System 62
7.1 Acquisition Mode 62
7.2 Sampling Mode 63
7.3 Sample Rate 64
7.4 Memory Depth 65
7.5 Horizontal Expansion 66
7.6 Roll Mode 67
7.7 XY Mode 68
8 To Trigger the Oscilloscope 70
8.1 Trigger Source 71
8.2 Trigger Level 71
8.3 Trigger Mode 72
8.4 Trigger Coupling 74
8.5 Trigger Holdoff 74
8.6 Noise Rejection 75
8.7 Trigger Type 75
8.7.1 Edge Trigger 75
8.7.2 Pulse Trigger 76
8.7.3 Slope Trigger 79
8.7.4 Video Trigger 82
8.7.5 Pattern Trigger 84
8.7.6 Duration Trigger 86
8.7.7 Timeout Trigger 89
8.7.8 Runt Trigger 91
8.7.9 Window Trigger 93
8.7.10 Delay Trigger 95
8.7.11 Setup/Hold Trigger 98
8.7.12 Nth Edge Trigger 100
8.7.13 RS232 Trigger 102
8.7.14 I2C Trigger 104
8.7.15 SPI Trigger 108
8.7.16 CAN Trigger 111
8.7.17 FlexRay Trigger (Option) 114
8.7.18 LIN Trigger (Option) 116
8.7.19 I2S Trigger (Option) 119
8.7.20 MIL-STD-1553 Trigger (Option) 122
8.8 Zone Trigger 126
8.9 Trigger Output Connector 128
9 Math Operation 129
9.1 Arithmetic Operation 131
9.2 Function Operation 132
9.3 FFT Operation 134
9.4 Logic Operation 138
9.5 Digital Filter 141
9.6 Parameter Settings of the Math Operation Result 143
10 Measurements 145
10.1 Measurement Parameter 145
10.1.1 Time Parameters 145
10.1.2 Count Values 146
10.1.3 Delay and Phase Parameters 148
10.1.4 Voltage Parameters 149
10.1.5 Other Parameters 151
10.2 To Select the Measurement Item 151
10.3 Measurement Settings 152
10.4 Statistics of Measurement Results 155
10.5 To Remove the Measurement Results 157
10.6 Auto Measurement 157
10.7 Cursor Measurements 158
10.7.1 Manual Mode 160
10.7.2 Track Mode 162
10.7.3 XY Mode 165
11 Digital Voltmeter (DVM) and Frequency Counter 168
11.1 Digital Voltmeter (DVM) 168
11.1.1 Measurement Settings 168
11.1.2 To Remove the Measurement 170
11.2 Frequency Counter 170
11.2.1 Measurement Settings 171
11.2.2 To Reset Statistics 172
12 Digital Channel 173
12.1 Basic Settings 173
12.1.1 To Enable or Disable the Digital Channel 174
12.1.2 To Set the Label 174
12.1.3 To Select the Digital Channel 175
12.1.4 To Set the Threshold 175
12.2 Other Settings 175
12.2.1 To Set the Waveform Size 176
12.2.2 To Set the Channel Sequence 176
12.2.3 Priority of the Waveform Display 176
12.2.4 To Set the Probe Delay 177
13 Histogram Analysis 178
13.1 To Enable or Disable the Histogram 178
13.2 To Select the Histogram Type 179
13.3 To Select the Histogram Source 179
13.4 To Set the Histogram Height 180
13.5 To Set the Histogram Range 180
13.6 Histogram Analysis Results 180
13.7 To Remove the Measurement 181
13.8 To Clear Statistics 181
14 Function/Arbitrary Waveform Generator (Option) 182
14.1 To Output Basic Waveforms 183
14.1.1 Sine 183
14.1.2 Square 185
14.1.3 Ramp 185
14.1.4 Pulse 186
14.1.5 Noise 186
14.1.6 DC 187
14.1.7 Exp.Rise 187
14.1.8 Exp.Fall 187
14.1.9 ECG1 188
14.1.10 Gauss 188
14.1.11 Lorentz 189
14.1.12 Haversine 190
14.1.13 Sinc 190
14.2 Modulation 191
14.2.1 AM 192
14.2.2 FM 193
14.2.3 PM 195
15 Bode Plot 197
15.1 Basic Setting 198
15.1.1 To Enable or Disable the Bode Plot Function 198
15.1.2 To Run or Stop the Drawing of the Bode Plot 198
15.1.3 To Set the Input/Output Source 198
15.1.4 To Set the Sweep Signal 199
15.1.5 To Set the Display Type 199
15.1.6 To View the Connection Diagram 201
15.2 Ampl/Freq Setting 202
15.3 To Save and Load the Bode Plot File 202
16 Power Analysis (Option) 204
16.1 Power Quality 204
16.2 Ripple 207
17 Reference Waveform 209
17.1 To Enable the Ref Function 209
17.2 To Set the Reference Waveform 209
17.3 To Set the Ref Waveform Display 210
17.4 To Export and Import the Reference Waveform 212
18 Pass/Fail Test 214
18.1 To Enable or Disable the Pass/Fail Test Function 214
18.2 To Select the Source 215
18.3 To Set the Test Mask 215
18.4 To Set the Output Form of the Test Results 216
18.5 To Start or Stop the Pass/Fail Test Operation 217
18.6 To Display the Statistics Information of the Test Results 217
19 Protocol Decoding 219
19.1 Parallel Decoding 219
19.1.1 Clock Setting (CLK) 220
19.1.2 Bus Setting 221
19.1.3 Display-related Setting 223
19.1.4 Event Table 223
19.2 RS232 Decoding 224
19.2.1 Source Setting 225
19.2.2 To Set Data Package 226
19.2.3 Display-related Setting 227
19.2.4 Event Table 227
19.3 I2C Decoding 228
19.3.1 Source Setting 229
19.3.2 Display-related Setting 231
19.3.3 Event Table 231
19.4 SPI Decoding 232
19.4.1 To Set the Source 233
19.4.2 To Set the Mode and Data 234
19.4.3 Display-related Setting 235
19.4.4 Event Table 235
19.5 CAN Decoding 236
19.5.1 Signal Configuration 237
19.5.2 Display-related Setting 239
19.5.3 Event Table 239
19.6 LIN Decoding (Option) 240
19.6.1 Signal Configuration 241
19.6.2 Display-related Setting 242
19.6.3 Event Table 242
19.7 I2S Decoding (Option) 243
19.7.1 Source Setting 244
19.7.2 Bus Setting 245
19.7.3 Display-related Setting 245
19.7.4 Event Table 246
19.8 FlexRay Decoding (Option) 247
19.8.1 Signal Configuration 247
19.8.2 Display-related Setting 248
19.8.3 Event Table 249
19.9 1553B Decoding (Option) 250
19.9.1 To Set the Data Channel Source and the Threshold 251
19.9.2 Event Table 251
20 Multi-pane Windowing 254
21 Waveform Recording and Playing 256
21.1 Common Settings 256
21.2 Record Options 257
21.3 Play Options 258
22 Search and Navigation Function 261
22.1 Search Function 261
22.2 Navigation Function 263
23 Display Control 267
23.1 Display Type 267
23.2 Persistence Time 267
23.3 Waveform Intensity 268
23.4 To Set the Screen Grid 268
23.5 Display Setting 268
23.6 Show Scale 269
23.7 Color Grade 269
23.8 Waveform Freeze 269
24 To Store and Load 270
24.1 To Enter the Storage Menu 270
24.2 To Save a File 270
24.2.1 To Save the Image 272
24.2.2 To Save the Wave 272
24.2.3 To Save the Setup 274
24.2.4 Binary Data Format (.bin) 274
24.3 To Upload the File via the FTP Server 278
24.4 To Load the Setup File 278
24.5 Upgrade 279
24.6 Disk Management 280
25 System Utility Function Setting 283
25.1 I/O Setting 283
25.2 Basic Settings 285
25.3 About this Oscilloscope 288
25.4 Other Settings 288
25.5 Auto Config 289
25.6 SelfCal 289
25.7 Option List 290
25.8 Quick Operation 290
25.9 Self-check 292
26 Remote Control 295
26.1 Remote Control via USB 296
26.2 Remote Control via LAN 296
26.3 Remote Control via GPIB 297
27 Troubleshooting 299
28 Appendix 301
28.1 Appendix A: Options and Accessories 301
28.2 Appendix B: Warranty 302
28.3 Factory Settings 302
List of Figures
Figure 4.1 Front Panel .... 12
Figure 4.2 Rear Panel 12
Figure 4.3 Front View ....13
Figure 4.4 Side View ....13
Figure 4.5 Adjust the Supporting Legs 14
Figure 4.6 Connect to AC Power 14
Figure 4.7 Replace the Fuse .... 16
Figure 4.8 Connect the Passive Probe ....17
Figure 4.9 Connect the Probe Head to the Preamp of the Active Probe ..... 17
Figure 4.10 Connect the Active Probe ....18
Figure 4.11 Connect the Logic Probe .... 19
Figure 4.12 Use the Compensation Signal ......20
Figure 4.13 Square Waveform Signal ......20
Figure 4.14 Probe Compensation ....21
Figure 4.15 Front Panel 22
Figure 4.16 Rear Panel ....28
Figure 4.17 User Interface ....30
Figure 4.18 Tap Gesture ....33
Figure 4.19 Pinch&Stretch Gesture ....34
Figure 4.20 Drag Gesture ....35
Figure 4.21 Rectangle Drawing Gesture (a) ......35
Figure 4.22 Rectangle Drawing Gesture (b) ......36
Figure 4.23 English Input Interface ....37
Figure 4.24 Chinese Input Interface 39
Figure 4.25 Numeric Keypad ....40
Figure 4.26 Use the Security Lock ....41
Figure 5.1 Channel Vertical System Menu .... 43
Figure 5.2 Input Impedance Modification ....49
Figure 5.3 Waveform Invert ....50
Figure 5.4 Probe Setting Menu ....50
Figure 5.5 Active Probe Setting Menu ....51
Figure 5.6 Zero Offset .... 56
Figure 6.1 Horizontal System Menu ....57
Figure 6.2 Zoom Mode (Delayed Sweep Mode) 60
Figure 7.1 Horizontal Menu 62
Figure 7.2 Memory Depth 65
Figure 7.3 XY Menu ....68
Figure 7.4 Measurement Schematic Diagram of Phase Deviation ...... 69
Figure 8.1 Trigger System Menu ....70
Figure 8.2 Schematic Diagram of the Acquisition Memory ....72
Figure 8.3 Trigger Holdoff ....75
Figure 8.4 Positive Pulse Width/Negative Pulse Width ....77
Figure 8.5 Pulse Trigger Setting Menu ....77
Figure 8.6 Positive Slope Time/Negative Slope Time ....79
Figure 8.7 Slope Trigger Setting Menu 80
Figure 8.8 Video Trigger Setting Menu ....82
Figure 8.9 Pattern Trigger 84
Figure 8.10 Pattern Trigger Setting Menu ....85
Figure 8.11 Duration Trigger 87
Figure 8.12 Duration Trigger Setting Menu ....87
Figure 8.13 Timeout Trigger ....89
Figure 8.14 Timeout Trigger Menu ....90
Figure 8.15 Runt Trigger ......91
Figure 8.16 Runt Trigger Setting Menu ....91
Figure 8.17 Window Trigger Setting Menu ......94
Figure 8.18 Delay Trigger 96
Figure 8.19 Delay Trigger Setting Menu 96
Figure 8.20 Setup/Hold Trigger 98
Figure 8.21 Setup/Hold Trigger Setting Menu 99
Figure 8.22 Nth Edge Trigger ....101
Figure 8.23 Nth Edge Trigger Setting Menu ....101
Figure 8.24 Schematic Diagram of RS232 Protocol ....102
Figure 8.25 RS232 Trigger Setting Menu .... 103
Figure 8.26 Sequential Chart of I2C Bus ....105
Figure 8.27 I2C Trigger Setting Menu ....105
Figure 8.28 Bin Format Setting ....107
Figure 8.29 Hex Format Setting ...... 107
Figure 8.30 Sequential Chart of SPI Bus 108
Figure 8.31 SPI Trigger Setting Menu .... 109
Figure 8.32 Data Frame Format of the CAN Bus ....111
Figure 8.33 CAN Trigger Setting Menu ....111
Figure 8.34 Sample Position (CAN Trigger) 112
Figure 8.35 Frame Format of FlexRay Bus 114
Figure 8.36 FlexRay Trigger Setting Menu ....115
Figure 8.37 Data Frame Format of the LIN Bus 116
Figure 8.38 LIN Trigger Setting Menu ....117
Figure 8.39 Sample Position (LIN Trigger) ...... 118
Figure 8.40 Sequential Chart of I2S Bus 119
Figure 8.41 I2S Trigger Setting Menu ....120
Figure 8.42 Formats of the Command Word, Data Word, and Status Word of the 1553B Bus ....123
Figure 8.43 MIL-STD-1553 Trigger Setting Menu .... 124
Figure 9.1 Math Operation Menu ....130
Figure 9.2 Math Operation Result Display Window ...... 130
Figure 9.3 Arithmetic Operation Result Display Window ....131
Figure 9.4 Function Operation Menu ....133
Figure 9.5 Function Operation Result Display Window ...... 133
Figure 9.6 FFT Operation Menu .... 134
Figure 9.7 FFT Operation Window 135
Figure 9.8 Peak Search ....137
Figure 9.9 Logic Operation Menu ....139
Figure 9.10 Logic Operation Result Display Window 140
Figure 9.11 Digital Filter Menu .... 141
Figure 9.12 Digital Filter Operation Result Display Window ...... 142
Figure 10.1 Time Parameters ......145
Figure 10.2 Delay and Phase Parameters ....148
Figure 10.3 Voltage Parameters ...... 149
Figure 10.4 Measurement Settings Menu .... 152
Figure 10.5 Display Position of the Measurement Results ......156
Figure 10.6 Cursors ...... 158
Figure 10.7 Manual Mode Setting Menu .... 160
Figure 10.8 Manual Cursor Measurement Example ...... 162
Figure 10.9 Track Mode Setting Menu ....163
Figure 10.10 Track Measurement (before Horizontal Expansion) 165
Figure 10.11 Track Measurement (after Horizontal Expansion) ......165
Figure 10.12 XY Mode Setting Menu .... 166
Figure 11.1 DVM Setting Menu ....169
Figure 11.2 Frequency Counter Setting Menu .... 171
Figure 12.1 Basic Settings Tab of Logic Analyzer Interface ...... 173
Figure 12.2 "Other Settings" Tab of Logic Analyzer Interface 176
Figure 13.1 Histogram Setting Menu .... 178
Figure 13.2 Histogram Analysis Interface ...... 179
Figure 14.1 AFG Menu ....183
Figure 14.2 Exp.Rise ....187
Figure 14.3 Exp.Fall .... 188
Figure 14.4 ECG1 188
Figure 14.5 Gauss .... 189
Figure 14.6 Lorentz .... 189
Figure 14.7 Haversine .... 190
Figure 14.8 Sinc ....190
Figure 14.9 Modulation Setting Interface ....191
Figure 14.10 AM ...... 192
Figure 14.11 FM 194
Figure 14.12 PM ....195
Figure 15.1 Bode Plot Setting Menu .... 197
Figure 15.2 Minimized Bode Plot Window ...... 197
Figure 15.3 Bode Plot Displayed in Waveform Display Form 200
Figure 15.4 Bode Plot Chart Display ......201
Figure 16.1 Power Analysis Interface ......204
Figure 16.2 Power Quality Analysis Result Display ....206
Figure 16.3 Connection Diagram of Power Quality Analysis ......206
Figure 16.4 Ripple Analysis Result Display ....207
Figure 16.5 Connection Diagram of Ripple Analysis ......208
Figure 17.1 Reference Waveform Menu ....209
Figure 18.1 Pass/Fail Test Menu ....214
Figure 18.2 Pass/Fail Test Interface ...... 217
Figure 19.1 Schematic Diagram of Parallel Decoding ...... 219
Figure 19.2 Parallel Decoding Menu 220
Figure 19.3 Parallel Decoding Event Table ......223
Figure 19.4 Schematic Diagram of RS232 Serial Bus ...... 224
Figure 19.5 RS232 Decoding Menu 225
Figure 19.6 RS232 Decoding Event Table 228
Figure 19.7 I2C Serial Bus ....229
Figure 19.8 I2C Decoding Menu 229
Figure 19.9 I2C Decoding Event Table 231
Figure 19.10 SPI Serial Bus 232
Figure 19.11 SPI Decoding Menu 233
Figure 19.12 SPI Decoding Event Table 236
Figure 19.13 CAN Decoding Menu 237
Figure 19.14 Sample Position ......238
Figure 19.15 CAN Decoding Event Table 239
Figure 19.16 LIN Decoding Menu ....241
Figure 19.17 LIN Decoding Event Table 242
Figure 19.18 I2S Decoding Menu 244
Figure 19.19 I2S Decoding Event Table 246
Figure 19.20 FlexRay Decoding Menu 247
Figure 19.21 Sample Position ....248
Figure 19.22 FlexRay Decoding Event Table ...... 249
Figure 19.23 1553B Decoding Menu 251
Figure 19.24 1553B Decoding Event Table 252
Figure 20.1 Add Window Interface 254
Figure 21.1 Waveform Recording Interface ...... 256
Figure 21.2 Minimized Window of Play Operation Interface ......259
Figure 22.1 Search Menu ...... 261
Figure 22.2 Mark Table 263
Figure 22.3 Navigation Menu 264
Figure 22.4 Minimized Navigation Window (Time Navigation) ......264
Figure 22.5 Search Event Navigation Interface ......265
Figure 23.1 Display Setting Menu 267
Figure 24.1 Storage Menu 271
Figure 24.2 Waveform Saving Setting Menu 273
Figure 24.3 Setup Saving Setting Menu ....274
Figure 24.4 Setup File Loading Interface 279
Figure 24.5 Upgrade Menu ....280
Figure 24.6 Disk Management Interface ......281
Figure 25.1 Self-calibration Menu 290
Figure 25.2 Key Test Interface 292
Figure 25.3 Touch Screen Test Interface ......293
Figure 26.1 Search for the Available Device ......298
Figure 26.2 Confirm the Available Device 298
List of Tables
Table 5.1 Probe Ratio of the Voltage Probe .... 52
Table 5.2 Probe Ratio of the Current Probe ....53
Table 5.3 Range of the External Attenuation ....54
Table 8.1 Video Standard 83
Table 9.1 Window Function ......136
Table 9.2 Logic Operation ...... 139
Table 19.1 Bus Setting ......221
Table 24.1 BIN File Format ...... 274
Table 24.2 File Header ......275
Table 24.3 Waveform Header ......275
Table 24.4 Waveform Data Header 277
Table 28.2 Factory Settings .... 302
1 Safety Requirement
1.1 General Safety Summary
Please review the following safety precautions carefully before putting the instrument into operation so as to avoid any personal injury or damage to the instrument and any product connected to it. To prevent potential hazards, please follow the instructions specified in this manual to use the instrument properly.
- Use Proper Power Cord.
Only the exclusive power cord designed for the instrument and authorized for use within the local country could be used.
• Ground the Instrument.
The instrument is grounded through the Protective Earth lead of the power cord. To avoid electric shock, it is essential to connect the earth terminal of the power cord to the Protective Earth terminal before connecting any inputs or outputs.
- Connect the Probe Correctly.
If a probe is used, the probe ground lead must be connected to earth ground. Do not connect the ground lead to high voltage. Improper way of connection could result in dangerous voltages being present on the connectors, controls or other surfaces of the oscilloscope and probes, which will cause potential hazards for operators.
- Observe All Terminal Ratings.
To avoid fire or shock hazard, observe all ratings and markers on the instrument and check your manual for more information about ratings before connecting the instrument.
- Use Proper Overvoltage Protection.
Ensure that no overvoltage (such as that caused by a bolt of lightning) can reach the product. Otherwise, the operator might be exposed to the danger of an electric shock.
- Do Not Operate Without Covers.
Do not operate the instrument with covers or panels removed.
- Do Not Insert Objects Into the Air Outlet.
Do not insert anything into the holes of the fan to avoid damaging the instrument.
- Use Proper Fuse.
Please use the specified fuses.
- Avoid Circuit or Wire Exposure.
Do not touch exposed junctions and components when the unit is powered on.
- Do Not Operate With Suspected Failures.
If you suspect damage occurs to the instrument, have it inspected by RIGOL authorized personnel before further operations. Any maintenance, adjustment or replacement especially to circuits or accessories must be performed by RIGOL authorized personnel.
- Provide Adequate Ventilation.
Inadequate ventilation may cause an increase of temperature in the instrument, which would cause damage to the instrument. So please keep the instrument well ventilated and inspect the air outlet and the fan regularly.
- Do Not Operate in Wet Conditions.
To avoid short circuit inside the instrument or electric shock, never operate the instrument in a humid environment.
- Do Not Operate in an Explosive Atmosphere.
To avoid personal injuries or damage to the instrument, never operate the instrument in an explosive atmosphere.
- Keep Instrument Surfaces Clean and Dry.
To avoid dust or moisture from affecting the performance of the instrument, keep the surfaces of the instrument clean and dry.
- Prevent Electrostatic Impact.
Operate the instrument in an electrostatic discharge protective environment to avoid damage induced by static discharges. Always ground both the internal and external conductors of cables to release static before making connections.
- Use the Battery Properly.
Do not expose the battery (if available) to high temperature or fire. Keep it out of the reach of children. Improper change of a battery (lithium battery) may cause an explosion. Use the RIGOL specified battery only.
- Handle with Caution.
Please handle with care during transportation to avoid damage to keys, knobs, interfaces, and other parts on the panels.

WARNING
Equipment meeting Class A requirements may not offer adequate protection to broadcast services within residential environment.
1.2 Safety Notices and Symbols
Safety Notices in this Manual:
WARNING
Indicates a potentially hazardous situation or practice which, if not avoided, will result in serious injury or death.

CAUTION
Indicates a potentially hazardous situation or practice which, if not avoided, could result in damage to the product or loss of important data.
Safety Notices on the Product:
• DANGER
It calls attention to an operation, if not correctly performed, could result in injury or hazard immediately.
- WARNING
It calls attention to an operation, if not correctly performed, could result in potential injury or hazard.
- CAUTION
It calls attention to an operation, if not correctly performed, could result in damage to the product or other devices connected to the product.
Safety Symbols on the Product:

Hazardous Voltage

Safety Warning Protective Earth
Terminal


Chassis Ground Test Ground
1.3 Measurement Category
Measurement Category
This instrument can make measurements in Measurement Category I.

WARNING
This instrument can only be used for measurements within its specified measurement categories.
Measurement Category Definitions
- Measurement category I is for measurements performed on circuits not directly connected to MAINS. Examples are measurements on circuits not derived from MAINS, and specially protected (internal) MAINS derived circuits. In the latter case, transient stresses are variable. Thus, you must know the transient withstand capability of the equipment.
- Measurement category II is for measurements performed on circuits directly connected to low voltage installation. Examples are measurements on household appliances, portable tools and similar equipment.
- Measurement category III is for measurements performed in the building installation. Examples are measurements on distribution boards, circuit-breakers, wiring (including cables, bus-bars, junction boxes, switches and socket-outlets) in the fixed installation, and equipment for industrial use and some other equipment. For example, stationary motors with permanent connection to a fixed installation.
- Measurement category IV is for measurements performed at the source of a low-voltage installation. Examples are electricity meters and measurements on primary overcurrent protection devices and ripple control units.
1.4 Ventilation Requirement
This instrument uses a fan to force cooling. Please make sure that the air inlet and outlet areas are free from obstructions and have free air. When using the instrument in a bench-top or rack setting, provide at least 10 cm clearance beside, above and behind the instrument for adequate ventilation.

CAUTION
Inadequate ventilation may cause an increase of temperature in the instrument, which would cause damage to the instrument. So please keep the instrument well ventilated and inspect the air outlet and the fan regularly.
1.5 Working Environment
Temperature
Operating: -10°C to +50°C
Non-operating: -30°C to +60°C
Humidity
- Operating:
Below +30°C : ≤ 90% RH (without condensation) +30°C to +40°C : ≤ 75% RH (without condensation)
+40°C to +50°C: ≤45%RH (without condensation)
• Non-operating:
Below +60°C: ≤90% RH (without condensation)

WARNING
To avoid short circuit inside the instrument or electric shock, never operate the instrument in a humid environment.
Altitude
- Operating: below 3 km
• Non-operating: below 15 km
Protection level against electric shock
ESD ±8kV
Installation (Overvoltage) Category
This product is powered by mains conforming to installation (overvoltage) category II.

WARNING
Ensure that no overvoltage (such as that caused by a bolt of lightning) can reach the product. Otherwise, the operator might be exposed to the danger of an electric shock.
Installation (Overvoltage) Category Definitions
Installation (overvoltage) category I refers to signal level which is applicable to equipment measurement terminals connected to the source circuit. Among these terminals, precautions are done to limit the transient voltage to a low level.
Installation (overvoltage) category II refers to the local power distribution level which is applicable to equipment connected to the AC line (AC power).
Pollution Degree
Pollution Degree 2
Pollution Degree Definition
- Pollution Degree 1: No pollution or only dry, nonconductive pollution occurs. The pollution has no effect. For example, a clean room or air-conditioned office environment.
- Pollution Degree 2: Normally only nonconductive pollution occurs. Temporary conductivity caused by condensation is to be expected. For example, indoor environment.
- Pollution Degree 3: Conductive pollution or dry nonconductive pollution that becomes conductive due to condensation occurs. For example, sheltered outdoor environment.
- Pollution Degree 4: The pollution generates persistent conductivity caused by conductive dust, rain, or snow. For example, outdoor areas.
Safety Class
Class 1 – Grounded Product
1.6 Care and Cleaning
Care
Do not store or leave the instrument where it may be exposed to direct sunlight for long periods of time.
Cleaning
Clean the instrument regularly according to its operating conditions.
- Disconnect the instrument from all power sources.
- Clean the external surfaces of the instrument with a soft cloth dampened with mild detergent or water. Avoid having any water or other objects into the chassis via the heat dissipation hole. When cleaning the LCD, take care to avoid scarifying it.
CAUTION
To avoid damage to the instrument, do not expose it to caustic liquids.
WARNING
To avoid short-circuit resulting from moisture or personal injuries, ensure that the instrument is completely dry before connecting it to the power supply.
1.7 Environmental Considerations
The following symbol indicates that this product complies with the WEEE Directive 2012/19/EU.
The equipment may contain substances that could be harmful to the environment or human health. To avoid the release of such substances into the environment and avoid harm to human health, we recommend you to recycle this product
appropriately to ensure that most materials are reused or recycled properly. Please contact your local authorities for disposal or recycling information.
You can click on the following link https://int.rigol.com/services/services/declaration to download the latest version of the RoHS&WEEE certification file.
2 Product Features
Product Features
- Based on RIGOL's brand new self-developed Centaurus technical platform
• 12-bit resolution [1]
• Max. 350 MHz bandwidth, 4 analog channels, and 1 external trigger channel - Standard configuration of 16 digital channels (required to purchase the logic analyzer probe)
• Real-time sample rate: up to 2 GSa/s
• Max. memory depth 500 Mpts
• Vertical sensitivity up to 200 μV/div - Max. waveform capture rate of 1,000,000 wfms/s (in fast recording mode)
• Arbitrary/Function Waveform Generator (AFG) [2], power analysis, histogram, digital signal analysis, Bode plot, and protocol decodings - Search and navigation functions enable users to quickly search for the signals with exceptions and locate them accurately
• 256-level intensity grading display, with digital real-time fluorescence technology
• 10.1" 1280*800 high-definition touch screen - Brand new Flex knob brings friendly user experience
- Standard configuration of USB Device, USB Host, LAN, HDMI interfaces
- Battery pack-powered, convenient to charge anytime and anywhere, providing great feasibility for measurement
- Online upgrade
- Standard configuration of the photoelectric encoder operating knob to improve the service life of the instrument
The MHO2000 series is a high-resolution 4-CH digital oscilloscope designed for the vast mainstream digital oscilloscope market to meet the design, debugging, and test demands. It is developed based on RIGOL's brand new self-developed Centaurus technical platform. Its 1,000,000 wfms/s waveform capture rate (in fast recording mode), 500 Mpts memory depth, 12-bit resolution, excellent noise floor and vertical measurement accuracy can meet the test demands for higher accuracy. The MHO2000 series digital oscilloscope supports AFG, digital signal analysis, Bode plot, and other functions. It is powered by battery pack, applicable for various complex test scenarios.
Note:
[1]: Up to 16-bit in high resolution mode
[2]: AFG is the optional configuration.
3
Document Overview
This manual gives you a quick review about the front and rear panel of MHO2000 series, the user interface, and its basic operation method.

TIP
For the latest version of this manual, download it from the official website of RIGOL (http://www.rigol.com).
Publication Number
UGA44100-1110
Software Version
00.01.00
Software upgrade might change or add product features. Please acquire the latest version of the manual from RIGOL website or contact RIGOL to upgrade the software.
Format Conventions in this Manual
1. Key
The front panel key is denoted by the menu key icon. For example, indicates the "DEFAULT" key.

2. Menu
The menu item is denoted by the format of "Menu Name (Bold) + Character Shading" in the manual. For example, Setup indicates clicking or tapping the Setup sub-menu under the "Utility" function menu to view the basic setting configuration items.
3. Operation Procedures
The next step of the operation is denoted by ">" in the manual. For example,

Storage indicates that first clicking or tapping the icon 🎨, then clicking or tapping Storage.
- The connectors on the front or rear panel are denoted by the format of "Connector Name (Bold) + Square Brackets (Bold)". For example, [AUX OUT].
5. Knob
| Label Knob Label Knob | |||
Horizontal  POSITION POSITION | Horizontal Position Knob |  | Multifunction Knob 1 |
 Horizontal SCALE Horizontal SCALE | Horizontal Scale Knob |  _ _ | Multifunction Knob 2 |
 Vertical SITION Vertical SITION | Channel Vertical Scale Knob |  LEVEL LEVEL | Trigger Level Knob |
 | Channel Vertical Scale Knob | - | - |
Content Conventions in this Manual
MHO2000 series digital oscilloscope includes the following models. Unless otherwise specified, this manual takes MHO2034 as an example to illustrate the functions and operation methods of the MHO2000 series.
| Model | Max. Analog Bandwidth | No. of Analog Channels | No. of AWG Channels | No. of Digital Channels | Bode Plot |
| MHO2024 2 | 00 MHz 4 | 2[1] | 16 | Supported [1] | |
| MHO2034 3 | 50 MHz 4 | 2[1] | 16 | Supported [1] |
Note: [1] Available to use when the MHO2000-AWG option has been installed.
4 Quick Start
4.1 General Inspection
1. Inspect the packaging
If the packaging has been damaged, do not dispose the damaged packaging or cushioning materials until the shipment has been checked for completeness and has passed both electrical and mechanical tests.
The consigner or carrier shall be liable for the damage to the instrument resulting from shipment. RIGOL would not be responsible for free maintenance/rework or replacement of the instrument.
2. Inspect the instrument
In case of any mechanical damage, missing parts, or failure in passing the electrical and mechanical tests, contact your RIGOL sales representative.
3. Check the accessories
Please check the accessories according to the packing lists. If the accessories are damaged or incomplete, please contact your RIGOL sales representative.
Recommended Calibration Interval
RIGOL suggests that the instrument should be calibrated every 18 months.
4.2 Product Appearance

Figure 4.1 Front Panel

Figure 4.2 Rear Panel
4.3 Appearance and Dimensions

Figure 4.3 Front View

Figure 4.4 Side View
4.4 To Prepare for Use
4.4.1 To Adjust the Supporting Legs
Adjust the supporting legs properly to use them as stands to tilt the oscilloscope upwards for stable placement of the oscilloscope to better operate and observe. You
can also fold the supporting legs when the instrument is not in use for easier storage or shipment, as shown in the figure below.

(a) To unfold the supporting legs

(b) To fold the supporting legs
Figure 4.5 Adjust the Supporting Legs
4.4.2 To Connect to AC Power
The AC power requirements of the oscilloscope are 100-240 V, 50/60 Hz, 400VA Max. Please use the power cord provided in the accessories to connect the oscilloscope to the AC power source, as shown in the figure below.

Power Cord Connector
Figure 4.6 Connect to AC Power

WARNING
To avoid electric shock, ensure that the instrument is correctly grounded.

TIP
When the oscilloscope equipped with the battery pack is connected to the AC power, the oscilloscope is energized and the AC power can also charge the battery pack. For details about battery pack installation, refer to BatHolder138 User Guide.
4.4.3 Turn-on Checkout
After the instrument is connected to the power source, press the power key at the lower-left corner of the front panel to power on the instrument. During the start-up process, the instrument performs a series of self-tests. After the self-test, the splash screen is displayed.
- Restart: Click or tap 📋 > Restart. Then a prompt message "Are you sure to reboot?" is displayed. Click or tap OK to restart the instrument.
- Shutdown:
- Click or tap ⚙ > Shutdown. Then a prompt message "Are you sure to shutdown?" is displayed. Click or tap OK to shut down the instrument.
- Press the power key and a prompt message "Are you sure to shutdown?" is displayed. Click or tap OK to shut down the instrument.
- Press twice to directly shut down the instrument.
- Press for three seconds to directly shut down the instrument.

TIP
You can also click or tap > Utility > Setup, then select "Switch On" under the "Power Status" menu. After this setting, the instrument powers on once connected to power.
4.4.4 To Replace the Fuse
If you need to replace the fuse, please use the proper fuse (AC 250 V, T5 A; 5.2 mm×20 mm) and follow the steps shown below.
- Power off the instrument and remove the power cord.
- Insert a small straight screwdriver into the slot at the power socket and pry out the fuse holder gently.
- Remove the fuse.
-
Insert the proper fuse into the fuse holder.
-
Re-insert the fuse holder into the power socket.

Figure 4.7 Replace the Fuse

WARNING
To avoid electric shock, please make sure that the instrument is powered off and disconnected from the power before replacing the fuse. Also, please make sure the fuse is consistent with the required fuse rating.
4.4.5 To Set the System Language
This oscilloscope supports multiple languages. You can click or tap > Utility > Setup > Language to select the system language.
4.4.6 To Connect the Probe
RIGOL provides the passive probe, the active probe, and the logic probe for the MHO2000 series. For specific probe models, please refer to MHO2000 Data Sheet. For detailed technical information of the probes, please refer to the corresponding Probe User Guide.
Connect the Passive Probe
- Connect the BNC terminal of the probe to the front-panel analog channel input terminal of the oscilloscope, as shown in the figure below.
- Connect the ground alligator clip or spring of the probe to the circuit ground terminal, and then connect the probe tip to the circuit point to be tested.

Figure 4.8 Connect the Passive Probe
After you connect the passive probe, check the probe function and probe compensation adjustment before making measurements. For detailed procedures, refer to Function Inspection and Probe Compensation.
Connect the Active Probe
Take PVA7250 (active differential probe) as an example.
- Connect the probe head to the preamp of the active probe, as shown in the figure below.

Figure 4.9 Connect the Probe Head to the Preamp of the Active Probe
- Connect the other end of the preamp to an analog channel input terminal of the oscilloscope on the front panel, as shown in the figure below. Note that you need to push the probe to the due position to lock it firmly.

Figure 4.10 Connect the Active Probe
- Use the probe's auxiliary device to connect the probe head to the circuit under test. For details about the probe, please refer to User Guide for PVA7000 Series Active Probe.
After connecting the active probe, you can perform probe calibration and offset voltage adjustment if necessary. For detailed procedures, refer to descriptions about the active probe in User Guide.
Connect the Logic Probe
-
Connect the output terminal of the logic probe to the front-panel digital channel input terminal of the oscilloscope in the correct direction, as shown in the figure below.
-
Connect the input terminal of the logic probe to the signal terminal under test. The MHO2000 series is equipped with PLA3204 as an option. For details about how to use the probe, refer to PLA3204 Active Logic Probe User Guide.

Figure 4.11 Connect the Logic Probe

TIP
- For ground connection of high-speed signals, the ground lead shall be connected to the ground test point near the measured signal, and the ground lead shall be kept as short as possible.
- If there are a large number of input signal channels, please connect each signal to a ground signal. If there is only one ground test point, connect all ground leads on the probe to the ground test point.
- Set a proper threshold value for the logic probe according to the actual level range of the signal under test. Set the threshold value to the middle of the level range.
4.4.7 Function Inspection
-
Press the front-panel DEFAULT and a prompt message "Restore default settings?" is displayed. Click or tap OK to restore the instrument to its factory default settings.
-
Connect the ground alligator clip of the probe to the "Ground Terminal" as shown in Figure 4.12.
-
Use the probe to connect the input terminal of CH1 and the "Compensation Signal Output Terminal" of the probe, as shown in Figure 4.12.

Figure 4.12 Use the Compensation Signal
- Set the probe ratio based on the attenuation of the probe, and then click or tap

- Observe the waveform on the display. In normal condition, you should see a square waveform as shown in the figure below.

Figure 4.13 Square Waveform Signal
- Use the same method to test other channels. If the square waveforms actually shown do not match that in the figure above, please perform Probe Compensation introduced in the next section. If no waveform is displayed on the screen, perform the above steps again.

WARNING
To avoid electric shock when using the probe, please make sure that the insulated wire of the probe is in good condition. Do not touch the metallic part of the probe when the probe is connected to high voltage source.
4.4.8 Probe Compensation
When used for the first time, the oscilloscope probe must be compensated to match the input characteristics of the oscilloscope channel to which it is connected. The non-compensated or poorly compensated probe may cause measurement errors. The compensation procedure is as follows:
- Perform step 1, 2, 3, and 4 in Function Inspection.
- Check the displayed waveforms and compare them with waveforms shown in the figure below.

Figure 4.14 Probe Compensation
- Use the probe compensation adjustment tool provided in the accessories to adjust the low-frequency compensation adjustment hole on the probe until the displayed waveform is consistent with the "Perfectly compensated" waveform shown in the figure above.
4.5 Product Overview
The MHO2000 series is a high-resolution digital oscilloscope designed for the vast mainstream digital oscilloscope market to meet the design, debugging, and test demands. It is developed based on RIGOL's brand new self-developed Centaurus technical platform. Its 2 GSa/s sample rate, 1,000,000 wfms/s waveform capture rate (in fast recording mode), 500 Mpts memory depth, 12-bit resolution, excellent noise floor and vertical measurement accuracy can meet the test demands for higher accuracy. Besides the enhancement of the hardware specifications, the MHO2000 series digital oscilloscope also supports AFG, digital signal analysis, and Bode plot. It is powered by battery pack, convenient to operate and control to meet demands of various complex test scenarios.
4.5.1 Front Panel
This document takes MHO2034 as an example to introduce the MHO2000 series.
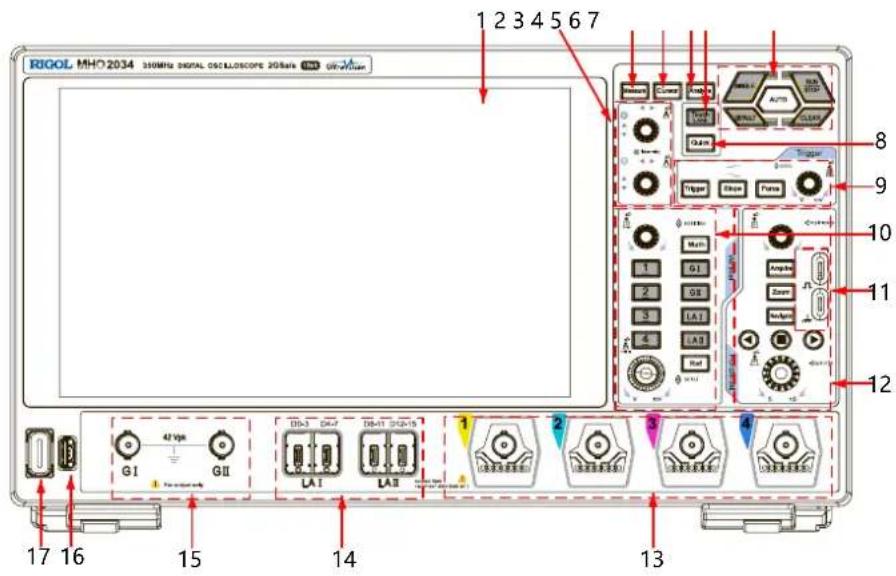
Figure 4.15 Front Panel
1 10.1" Capacitive Multi-touch Screen 10 Vertical Control Area
2 Multifunction Knob 11 Probe Compensation Signal Output Terminal/Ground Terminal
3 Measure Key 12 Horizontal Control Area
4 Cursor Key 13 Analog Input Connector
5 Analyse Key 14 Digital Channel Input (Type-C interface)
6 Touch Lock Key 15 Dual-channel Function/Arbitrary Waveform Generator Output Terminal [1]
7 Common Operation Key 16 USB HOST Interface
8 Quick Operation Key (Related to quick operation setting) 17 Power Key
9 Trigger Control Area

NOTE
[1]: Available to use when the MHO2000-AWG option has been installed.
4.5.2 Front Panel Function Overview
1. 10.1" Capacitive Touch Screen
Displays the waveform, menu name, parameter setting, system state, prompt messages, and etc.
2. Multifunction Knob

- Non-menu Operation:
In non-menu-operation mode, rotate knob 1 to adjust the brightness of waveform display. When a cursor, decoding, Math waveform, or reference waveform is added on the screen, rotate the multifunction knob (knob 1 and 2) to move the cursor, adjust the decode threshold (knob 1) and decode result display position (knob 2), adjust the vertical scale (knob 1) and vertical offset (knob 2) of the math/reference waveform. You can click or tap Flex Knob on the toolbar at the upper-right of the screen to set the priority.
- Automatic: Cursor > (Math/Ref/Decode) > Intensity (default priority).
- Manual: all non-menu operation items are listed at the lower part of the Flex Knob menu. You can select one of them as the current item for the multifunction knob to adjust.
- Menu Operation:
When operating on the menu, you can rotate the multifunction knob 1 or 2 to adjust the value in the menu. When you click or tap the input field and then the
1 or 2con is displayed in the input field, it indicates that you can use the specified knob to set the value. The LED indicator of the corresponding knob is illuminated. At this point, you can rotate the knob to adjust the value or press down the knob to restore the parameter to the default value.
When using the virtual numeric keypad or selecting from the drop-down list, you can rotate the knob to navigate through the keypad or select the item from the drop-down list, then press down the knob to select an item.
3. Measure Key
Measure: press this key to enter the "Measure" interface. You can set the measurement source, select the measurement item, etc.
4. Cursor Key
Cursor: press this key to enter the cursor measurement interface. The measurement results are displayed in the result list. The oscilloscope provides three cursor modes: Manual, Track, and XY. XY mode is only available when the XY function is enabled.
5. Analyse Key
Analyse: press this key to enter the "Analyse" interface. You can click or tap "DVM", "Counter", "UPA", "Record", and "Pass/Fail" to enter the specified function interface.
6. Touch Lock Key
Touch Lock: press this key to disable the touch screen. Once disabled, press this key again to enable the touch screen.
7. Common Operation Keys
![graph TD A["AUTO"] --> B["SINGLE"] A --> C["RUN/STOP"] A --> D["DEFAULT"] A --> E["CLEAR"]](/content/2026/07/1498798/images/50e1a26455d4a38fb36121c56205b367b2175651faed066f7fa3255713195e77.jpg)
- : waveform auto setting key. Press this key to enable the waveform auto setting function. The oscilloscope will automatically adjust the vertical scale, horizontal time base, and trigger mode according to the input signal to realize optimal waveform display.
- RUN: runs or stops the instrument. Press this key to set the operating state of the oscilloscope to "RUN" or "STOP". In the "RUN" state, the backlight of the key is illuminated in green. In the "STOP" state, the backlight of the key is illuminated in red.
- SINGLE : single trigger key. Press this key to set the trigger mode to "Single".
- : default setting key. Press this key, and then a prompt message is displayed. Click or tap OK to restore the instrument to its default settings.
- : Clear key. Press this key to clear all the waveforms on the screen. If the oscilloscope is in the "RUN" state, new waveforms will continue being displayed.
8. Quick Operation Key (Related to quick operation setting)
Quick: press this key to perform the quick operation for the specified function such as saving image, saving waveforms, saving setup files, performing All Measure function, resetting statistics, recording waveforms, and saving group.
9. Trigger Control Area

- : trigger setting key. Press this key to open the trigger menu.
- : trigger edge setting key. Press this key to switch the edge type (rising, falling, or either) of the Edge trigger signal. When Trigger is set to other types other than the edge type, this key is unavailable to use.
- Force: force trigger key. Press this key to generate a trigger signal forcibly.
- LEVEL: used to modify the trigger level/threshold level. Rotate it clockwise to increase the level, and rotate it counterclockwise to decrease the level. Press down the knob to quickly set the trigger level/threshold level to 50 % of the waveform peak-peak value.
10. Vertical Control Area

- Vertical POSITION: channel vertical position knob. Rotate this knob to modify the vertical position of the waveform for the specified channel. The
waveforms will move up and down on the screen. Press down the knob to reset the vertical position to zero.

- Vertical SCALE: channel vertical scale knob. Rotate this knob to modify the amplitude of each vertical grid of the selected waveform, making its amplitude increase or decrease. Press down this knob to switch between the coarse and fine adjustment of the vertical scale.
- Ref: reference waveform key. Press this key to enter the reference waveform setting interface. You can compare the actually measured waveform with the reference waveform to locate the circuit failure.
- Math: math operation key. Press this key to enter the math operation interface. The math operations include A+B, A-B, A×B, A/B, and FFT. Besides, you can also set the math operation label.
- LAI, LAI indicates the logic analyzer key. Press this key to open the logic analyzer control menu. You can enable or disable any channel or channel group, modify the waveform size of the digital channel, modify the threshold of the digital channel, and group the 16 digital channels. Besides, you can also set a label for each digital channel.
- GI, GII indicates the Function/Arbitrary Waveform Generator setting key. Press GI to enable or disable the output of the [GI] connector on the front panel; press GII to enable or disable the output of the [GII] connector on the front panel; and then enter the corresponding signal source setting interface. Enable or disable the status display of the current signal.
- 1, 2: analog channel key. Press the specified key to enable or disable the specified channel.
- If the channel is not displayed, you can press the channel key to open the channel in the waveform view window.
- If the channel is displayed but not selected, you can press the channel key to select the channel.
- If the channel is both displayed and selected, you can press the channel key to close its display in the waveform view.
11. Probe Compensation Signal Output Terminal/Ground Terminal
This terminal outputs the probe compensation signal which helps you match a probe's input capacitance to the oscilloscope channel to which it is connected.
12. Horizontal Control Area

- Horizontal POSITION: horizontal position knob. Rotate this knob to modify the horizontal position (that is, trigger position), making the waveforms move left and right. Press down this knob to quickly reset the horizontal position.
- Horizontal SCALE: horizontal scale knob. Rotate this knob to modify the horizontal time base of the waveform, then the displayed waveforms of all channels are expanded or compressed horizontally. Press down this knob to quickly switch the horizontal time base adjustment mode between "Coarse" and "Fine".
- Acquire: waveform acquisition setting key. Press this key to enter the acquisition and horizontal menu. You can set the time base mode, the acquisition mode, memory depth, and etc.
- Zoom: zoom key. Press this key to enable or disable the delayed sweep function.
- Navigate: navigation key. Press this key to enter the navigation menu. You can set the navigation mode by time or search event.
- : navigation combination key.
13. Analog Channel Input Terminals
Used to connect the probe and input the analog signal.
14. Digital Channel Input (Type-C Interface)
Four USB Type-C interfaces. They are used to connect the logic analyzer probe to input the digital signal.
15. Dual-channel Function/Arbitrary Waveform Generator Output Terminal
Used to connect the Function/Arbitrary Waveform Generator signal. Press GI to enable or disable the output of the [GI] connector on the front panel; press GII to enable or disable the output of the [GII] connector on the front panel; and then enter the corresponding signal source setting interface. Note: This function is only available when the instrument has installed with the MHO2000-AWG option.
16. USB HOST Interface
Supports FAT32 format Flash type USB storage device and the USB-GPIB interface adapter.
- USB storage device: imports or exports data (software update, waveform, setup, or captured image).
- USB-GPIB module: extends the GPIB interface for RIGOL instruments that integrates the USB HOST interface but not the GPIB interface.
17. Power Key
Powers on or off the instrument.
4.5.3 Rear Panel

Figure 4.16 Rear Panel
1. 10 MHz REF OUT
A BNC connector that is used to output the 10 MHz clock signal generated by the internal crystal oscillator inside the instrument.
2. 10 MHz REF IN
A BNC connector that is used to input the external reference clock signal.
3. Battery Pack Snap-Fit Slot
Used to insert the battery pack snap-fit part to fasten the battery pack.
4. HDMI
Connects the instrument to an external display that has the HDMI interface (e.g. monitor or projector) via this interface to better observe the waveform display clearly. At this time, you can also view the waveforms on the LCD of the instrument.
5. USB DEVICE
Connects the instrument to the PC via this interface. Then you can use the PC software to send the SCPI commands or use the user-defined programming to control the instrument.
6. LAN
Connects the instrument to network via this interface. The instrument is in compliance with the standards specified in LXI Device Specification 2011. It can be used to set up a test system with other standard devices. Then you can control the instrument through using Web Control to send the SCPI commands. When update is available, you can perform online upgrading for the system software of the instrument via the LAN interface.
7. Security Lock Hole
Use a standard PC/laptop lock cable to secure the oscilloscope to a work bench or other location.
8. Screw Mounting Hole
Used for securing the instrument to the bracket of the PC.
9. AC Power Cord Connector
The rated AC power source supported by the instrument is 100-240 V, 50-60 Hz. Please use the power cord provided in the accessories to connect the instrument to the AC power source.
10. Fuse
If you need to replace the fuse, use only the specified fuse.
11. Battery Pack Interface
Used to connect the battery pack.
12. Battery Pack Mounting Slot
Used to insert the battery pack snap-fit part to fasten the battery pack.
13. AUX OUT
- Trigger output:
When the AUX output is set to "TrigOut", the oscilloscope generates a trigger and outputs a signal that can reflect the current capture rate of the oscilloscope via this interface. Connect the signal to a waveform display device and measure the frequency of the signal. The measurement result is the same as the current capture rate.
- Pass/Fail:
When the AUX output is set to "PassFail", in the pass/fail test, the instrument will output a pulse via the [AUX OUT] connector when a passed or failed waveform is detected during the pass/fail test.
14. EXT TRIG
A BNC connector that is used to input the external trigger signal to the oscilloscope.
4.5.4 User Interface

Displays the measurement waveform window of analog and digital channels. Click or tap at the upper-right corner of the window to close the window. Click or tap to enter the configuration menu of the specified function.
2. Operating Status
Displays the operating status of the instrument.
3. Horizontal Timebase Label
Displays the current horizontal time base. Click or tap this label to enter the horizontal setting menu.
4. Sample Rate & Memory Depth Label
Displays the current sample rate and memory depth. Click or tap this label to enter the horizontal setting menu.
5. Horizontal Position Label
Displays the current horizontal position. Click or tap this label to enter the horizontal setting menu.
6. Trigger Information Label
- Displays the trigger information of the system, including the trigger type, trigger level, trigger mode, and etc.
- Click or tap the trigger information label, then the trigger setting window is displayed. You can set the parameters for the trigger.
7. Quick Operation Toolbar
Provides STOP/RUN, XY, Default, Flex Knob, Navigate keys and some function keys in the function navigation menu for quick operation.
8. Result List
Displays the measurement results and statistics of various functions. Click or tap
at the lower-right corner of the screen to fold the "Result" list of the specified function.
9. Notification Area
Displays the USB storage device icon, LAN connection icon, sound icon, and remote control icon as well as date and time. You can click or tap this area to open the "Utility" menu.
- USB storage device icon: When a USB storage device is detected, will be displayed.
- LAN connection icon: When the LAN interface is successfully connected, displayed.

- Sound icon: In the "Utility" menu, click or tap Setup > Beeper to enable or disable the sound. When enabled, will be displayed; when disabled, will be displayed. You can also click on or tap the icon to enable or disable the sound.
- Remote control icon: When you control use Web Control to control the instrument remotely, Rmt be displayed.
- Date and time: Displays the system date and time. You can set them in the Setup menu.
10. Channel Operation Label
Displays the on/off state, operation type, and vertical scale of Math1-Math4.
11. Digital Channel Label
Displays the current on/off status of the 16 digital channels. When a digital channel is enabled, click or tap this label to enter the logic analyzer (LA) setting menu.
12. Function/Arbitrary Waveform Generator Label [1]
Displays the on/off state, waveform type, amplitude, and frequency for Arbitrary Waveform Generator GI/GII. Click or tap the label to enable/disable the AFG output. When the AFG output is enabled, click or tap this label to open the AFG setting menu.
13. Multi-pane Windowing Display Area
If you enable multiple functions, multiple windows can be displayed on the screen at one time.
14. Analog Channel Label
- Displays the on/off status of analog channels (CH1-CH4).
- Displays the channel coupling mode.
- Displays the vertical scale of the channel.
- Displays the vertical offset of the channel.
15. Function Navigation Icon
Click or tap the icon to open the function navigation menu. Click or tap the specified menu icon to enter the specified function setting menu.

NOTE
[1]: Available to use when the MHO2000-AWG option has been installed.
4.6 Touch Screen Gestures
The instrument provides a capacitive touch screen, which is convenient for you to operate and make configurations. It has strong waveform display capability and excellent user experience. It features great convenience, high flexibility, and great sensitivity. The multi-capacitive touch screen supports gesture-enabled operation. The gestures supported by the touch screen controls include tapping, pinching & stretching, dragging, etc.
4.6.1 Tap
Use one finger to tap the symbol or characters on the screen slightly, as shown in Figure 4.18. With the Tap gesture, you can perform the following operations:
- Tap the menu displayed on the screen to operate on the menu.
- Tap the function navigation icon at the lower-left corner of the touch screen to enable the function navigation.
- Tap the displayed numeric keypad to set the parameters.
- Tap the virtual keypad to set the label name and the filename.
- Tap the close button at the upper-right corner of the message box to close the prompt window.
- Tap other windows on the touch screen and operate on the windows.

Figure 4.18 Tap Gesture
4.6.2 Pinch&Stretch
Pinch or stretch two points on the screen with two fingers to zoom in or out the waveform. To zoom in the waveform, first pinch the two fingers and then stretch the fingers; to zoom out the waveform, first stretch the two fingers, and then pinch the
fingers together, as shown in the figure below. With the pinch&stretch gesture, you can perform the following operation:
- Pinching&stretching in the horizontal direction can adjust the horizontal time base of the waveform.
- Pinching&stretching in the vertical direction can adjust the vertical scale of the waveform.

Figure 4.19 Pinch&Stretch Gesture
4.6.3 Drag
Use one finger to select the object, and then drag the object to a destination place, as shown in the figure below. With the drag gesture, you can perform the following operation:
- Drag the waveform to change its position or scale.
- Drag the window controls to change the position of the window (e.g. numeric keypad).
- Drag the cursor to move the cursor.
- Drag the trigger cursor to change the trigger level.
- In multi-window display, drag one of the displayed windows to change its position on the display.

Figure 4.20 Drag Gesture
4.6.4 Rectangle Drawing
Open the function navigation menu, and then click or tap the "DrawRect" icon to switch to the rectangle drawing mode. Drag a finger from upper left to lower right across the screen to draw a rectangle on the screen, as shown in Figure 4.21. Move your finger away from the screen, and then a menu is displayed on the screen. At this time, you can tap to select "Trigger zone A", "Trigger zone B", "Histogram", "Horizontal zoom in", "Vertical zoom in", or "Waveform zoom in". Drag a finger from lower right to upper left across the screen to draw a rectangle on the screen, as shown in Figure 4.22. Move your finger away from the screen, and then a menu is displayed on the screen. At this time, you can tap to select "Trigger zone A", "Trigger zone B", "Histogram", "Horizontal zoom out", "Vertical zoom out", or "Waveform zoom out".

Figure 4.21 Rectangle Drawing Gesture (a)

Figure 4.22 Rectangle Drawing Gesture (b)
- Trigger zone A:
- Draw the region for Trigger zone A;
- Open Trigger zone A:
- Open the "Zone Trigger" menu.
- Trigger zone B:
- Draw the region for Trigger zone B;
- Open Trigger zone B:
- Open the "Zone Trigger" menu.
- Histogram:
- Draw the region for the histogram;
-
Open the "Histogram" menu.
-
Horizontal zoom in: expands the waveform in the horizontal direction. Horizontal zoom out: compresses the waveform in the horizontal direction.
- Vertical zoom in: expands the waveform in the vertical direction. Vertical zoom out: compresses the waveform in the vertical direction.
- Waveform zoom in: expands the waveforms both in the horizontal and vertical direction. Waveform zoom out: compresses the waveforms both in the horizontal and vertical direction.

TIP
Click or tap the "DrawRect" icon to switch between the rectangle drawing and waveform operation.

4.7 Parameter Setting Method
The parameters can be set by using the knob or the touch screen. The common parameter setting methods are as follows:
- Method 1: Some parameters can be adjusted by rotating the knob on the front panel.
- Method 2: Click or tap the input field of a specified parameter, then a virtual keypad is displayed. Complete the parameter setting with the keypad.
Input Chinese and English Characters
When naming a label, this instrument supports Chinese/English input method. The following part introduces how to input Chinese and English characters with the Chinese/English input method.
- Input English Characters

Figure 4.23 English Input Interface
- Select English input method
First check the input method type. If it shows "En/中" currently, then go to Step 2; if it shows "中/En", click or tap the input method switchover key to switch to "En/中" (English input method).
2. Clear the name input area
If there is no character in the "Name Input Area", please go to the next step. If there are characters in the "Name Input Area", click or tap the Backspace key to delete all the characters from the "Name Input Area" in sequence.
3. Input the upper-case letter
If you want to input an upper-case letter, first use the Caps key to switch between the upper-case and lower-case mode. If the Caps key is selected, input the upper-case letter with the virtual keypad. If not, first click or tap the Caps key to ensure it is selected, then input the upper-case letter. All the input letters will be displayed in the "Name Input Area".
4. Input the lower-case letter
Refer to the operation specified in the previous step. If the Caps key is not selected, directly input the lower-case letter.
5. Input numbers or symbols
If the letter keypad is displayed, you need to click or tap the numeric switchover key to switch to the numeric keypad, and input numbers or symbols with the numeric keypad. All the input letters will be displayed in the "Name Input Area".
6. Modify or delete the unwanted characters that have been input
During the name input process, you can modify or delete the unwanted character if necessary. To delete the input characters, click or tap the Backspace key in the virtual keypad to delete the characters. To modify the characters that have been input, delete the unwanted characters first and then input the new characters.
You can directly move the cursor to the character to be modified or deleted, delete the desired character or input the new characters after deleting the unwanted character.
7. Confirm the input
After completing the input operation, click or tap "OK".
- Input Chinese Characters

Figure 4.24 Chinese Input Interface
- Select Chinese input method
First check the input method type. If it shows "中/En" currently, then go to Step 2; if it shows "En/中", click or tap the input method switchover key to switch to "中/En" (Chinese input method).
- Clear the name input area
If there is no character in the "Name Input Area", please go to the next step. If there are characters in the "Name Input Area", click or tap the Backspace key to delete all the characters from the "Name Input Area" in sequence.
If there are characters in the "Pinyin Input Area", when you delete characters from the name input area, the characters in the Pinyin input area will be deleted first.
- Input Chinese characters
Click or tap the characters in the virtual keypad to input Pinyin into the input area, then the characters to be selected will be displayed in the Chinese character selection area. Slide to view more Chinese characters for you to choose. Select the desired Chinese character, and then the selected character will be displayed in the input area.
- Modify or delete the unwanted characters that have been input
During the name input process, you can modify or delete the unwanted character if necessary. To delete the input characters, click or tap the Backspace key in the virtual keypad to delete the characters. To modify the characters that have been input, delete the unwanted characters first and then input the new characters.
- Confirm the input
After completing the input operation, click or tap "OK".
Input a Value
When setting or modifying a parameter, input an appropriate value with the numeric keypad.
- Click or tap the value or unit in the numeric keypad to complete the input.
- Rotate the specified multifunction knob (1 or 2) to move the cursor to select the value and unit. Press down the specified knob to input the selected value or unit.

Figure 4.25 Numeric Keypad
After you input all the values and select the desired units, the numeric keypad is turned off automatically. This indicates that you have completed parameter setting. Besides, after you have input the values, you can also press OK directly to close the numeric keypad. At this time, the unit of the parameter is the default unit. In the numeric keypad, you can perform the following operation:
- Delete the parameter value that has been input;
- Set the parameter to a maximum or minimum value (sometimes, the maximum or minimum value are the specified one for the current state);
- Set the parameter to a default value;
- Clear the parameter input field.
4.8 To Use the Security Lock
If necessary, you can lock the instrument to a fixed location by using the security lock (please purchase it by yourself), as shown in the figure below.
The method is as follows: align the lock with the lock hole and plug it into the lock hole vertically, turn the key clockwise to lock the oscilloscope, and then pull the key out.

Figure 4.26 Use the Security Lock

CAUTION
Please do not insert other objects into the security lock hole to avoid damaging the instrument.
4.9 To Use the Built-in Help System
The built-in help file provides information about the functions and menu
introductions of the instrument. Click or tap > Help to enter the help system.
In the help system, you can get its help information by clicking on or tapping the link for the specified chapter.
4.10 To View the Option and the Option Installation
This series oscilloscope provides multiple options to fulfill your measurement requirements. If you need any of these options, order them according to the Order No. available in "Appendix A: Options and Accessories", and then install the options
according to this section. Besides, you can also view the options currently installed on the oscilloscope or activate the newly purchased option.
View the Installed Option
The instrument is installed with the trial versions of the options before leaving factory. You can use the option for a trial period of 2,160 minutes starting from the first time you power on the instrument. Perform the following operations to view the option name and the option status.
- Click or tap the function navigation icon

at the lower-left corner of the
screen, and then select Utility to enter the "Utility" menu.
- Click or tap Options to view the option list. If you have purchased and installed the option, it shows "Forever" state. If you haven't installed the specified option, it shows "Limit".
Install the Option
The option license is a string of fixed characters. Each instrument has one unique license. The license file should be in specific format, with the filename extension "*.lic". After you purchase an option, you will obtain a key (used for obtaining the license). Then, you can install the option according to the following steps.
1. Obtain an option license
a. Log in to the RIGOL official website (http://www.rigol.com), click SERVICE CENTRE > License Activation to enter the license activation interface.
b. Input the correct key, serial number (click or tap the function navigation icon

Utility > About to acquire the serial number of the instrument), and ification code. Click Generate Knob to acquire the option license.
2. Install the option
Run the command :SYSTem:OPTION:INSTall
5 To Set the Vertical System
This series provides four analog input channels (CH1\~ CH4), and each channel is equipped with an independent vertical control system. The setting method for the vertical system of each channel is the same. This chapter takes CH1 as an example to introduce the setting method for the vertical system.
When a channel is selected, click or tap the channel status label at the bottom of the screen. Then the Vertical system menu for the channel is displayed.

Figure 5.1 Channel Vertical System Menu
5.1 To Enable or Disable the Analog Channel
Enable the Analog Channel
When a signal is connected to CH1, you can enable the channel in the following ways.
- Click or tap the channel status label at the bottom of the screen to enable the channel.
- Press the front-panel key is illuminated. 1 key to enable the channel, and the backlight of this
- In the Vertical menu, select the CH1 tab. Select ON for the Display menu to turn CH1 on, and select OFF to turn CH1 off.
When CH1 is activated, its status label at the bottom of the screen is as shown in the figure below.

The information displayed in the channel status label is related to the current channel setting (irrelevant with the on/off status of the channel). After the channel is turned on, modify the parameters such as the vertical scale, horizontal time base, trigger mode, and trigger level according to the input signal for easy observation and measurement of the waveform.
When CH1 is enabled but not activated, its status label is as shown in the following figure.

Click or tap the channel status label at the bottom of the screen or press the front-panel key to activate CH1. You can also select the CH1 tab in Vertical menu to activate it.
Disable the Analog Channel
You can disable the analog channel in the following ways.
- If CH1 has been enabled and activated, you can press the front-panel key to disable it directly. You can also click or tap the channel status label at the bottom of the screen to open the Vertical menu and then click or tap the label again to disable the channel.
- If CH1 has been enabled but not activated, first activate the channel. Then press the front-panel 1 key again to disable CH1. You can also click or tap the channel status label to disable CH1.
- You can also disable CH1 by setting Display to OFF in the Vertical menu.
- In addition, you can click or drag to slide down the channel label to disable the channel.
If CH1 is disabled, its status label is as shown in the figure below.

5.2 To Adjust the Vertical Scale
Vertical scale indicates the voltage value per grid in the vertical axis of the screen. It is often expressed in V/div. While you adjust the vertical scale, the display amplitude of the waveform would enlarge or reduce. The scale information of the channel status label at the bottom of the screen would change accordingly.

The adjustable range of the vertical scale is related to the currently set probe ratio and input impedance. By default, when (probe ratio x external attenuation ration) is 1X and the input impedance is 1 MΩ, the adjustable range of the vertical scale is from 200 μV/div to 10 V/div.

CAUTION
When the vertical scale is less than or equal to 500 µ V, the bandwidth limit will be enabled automatically.
When CH1 is turned on and activated, you can adjust the vertical scale in the following methods:
- Rotate the front-panel Vertical
the adjustable range. Rotate it clockwise to decrease the scale, and rotate it counterclockwise to increase the scale. - Enable the touch screen function, and then adjust the vertical scale with the pinch & stretch gesture on the touch screen. For details, refer to descriptions in Pinch&Stretch.
- In the Vertical menu, rotate the specified front-panel multifunction knob indicated in the input field of Scale or click/tap the icon at the right side of the input field of Scale to increase or decrease the scale value. You can also click or tap the input field to input a specific value with the displayed numeric keypad.


In the Vertical system menu, click or tap the ON/OFF tab for Fine to enable or disable the fine adjustment of the vertical scale. By default, it is OFF. You can also press down
the front-panel Vertical SCALE knob to switch the scale adjustment mode between "Coarse" and "Fine".

- Fine adjustment: Click or tap the icon at the right side of the input field of Scale to further adjust the vertical scale within a relatively smaller range to improve the vertical resolution. If the amplitude of the input waveform is a little bit greater than the full scale under the current scale and the amplitude would be a little bit lower if the next scale is used, fine adjustment can be used to improve the amplitude of waveform display to view signal details.
- Coarse adjustment: Click or tap the icon at the right side of the input field of Scale to adjust the vertical scale at 1-2-5 step, i.e. 200 µV / div , 500 µV / div , 1 mV / div , 2 mV / div , 5 mV / div , 10 mV / div...10 V / div .
5.3 To Adjust the Vertical Offset
Vertical offset indicates the offset of the signal ground level position of the waveform from the screen center in the vertical direction. Its unit is consistent with the currently selected amplitude unit (refer to Amplitude Unit). When adjusting the vertical offset, the waveforms of the corresponding channel moves up and down. The vertical offset information (as shown in the following figure) in the channel status label at the bottom of the screen will change accordingly.

The adjustable range of the vertical offset is related to the current input impedance, probe ratio, and vertical scale.
When CH1 is turned on and activated, you can adjust the vertical offset in the following ways.
- Rotate the Vertical
POSITION knob at the right section of the front panel to
adjust the vertical offset within the adjustable range. Rotate this knob clockwise to increase the vertical offset or rotate it counterclockwise to reduce the vertical offset. Pressing down the knob can quickly reset the vertical offset (set the vertical offset to 0). - Enable the touch screen function, and then adjust the vertical offset with the drag gesture. For details, refer to Drag.

- In Vertical menu, click or tap the Up/Down arrow icon at the right side of the input field of Offset to increase or decrease the offset value or use the specified multifunction knob to set the value. You can also click or tap the input field of Offset to input a specific value with the pop-up numeric keypad.

5.4 Channel Coupling
You can remove unwanted signals by setting the coupling mode. For example, the signal under test is a square waveform with DC offset.
Click or tap the channel status label at the bottom of the screen, and then the Vertical menu is displayed. Click or tap the drop-down button of Coupling to select the coupling mode.

- When the coupling mode is "DC", both the DC and AC components of the signal under test can pass the channel.
- When the coupling mode is "AC", the DC components of the signal under test are blocked.
- When the coupling mode is "GND", the DC and AC components of the signal under test are blocked.
After a coupling mode is selected, it is indicated in the channel status label at the bottom of the screen, as shown in the figure below.


TIP
When the input impedance is set to "50 Ω", the channel coupling is set to DC coupling by force, and the Coupling menu is grayed out and cannot be modified.
5.5 BW Limit
This oscilloscope supports the bandwidth limit function. Setting the bandwidth limit can reduce the noises in the displayed waveforms. For example, the signal under test is a pulse with high frequency oscillation.
- When the bandwidth limit is disabled, the high frequency components of the signal under test can pass the channel.
- When the you enable the bandwidth limit, the high frequency components found in the signal under test that are greater than the limit are attenuated.
Click or tap the channel status label at the bottom of the screen. Then the Vertical system menu is displayed. Click or tap the drop-down button of BW Limit to select the specified bandwidth. When the bandwidth limit is enabled, the specified bandwidth limit value will be displayed in the channel status label at the bottom of the screen, as shown in the figure below.

The supported bandwidth limits include 250 MHz and 20 MHz.
- When the vertical scale is greater than 500 µV , the bandwidth limit is disabled.
- When 200µV / div < vertical scale ≤ 500 µV , the 250 MHz bandwidth limit is enabled automatically and bandwidth limit cannot be disabled.
- When the vertical scale is equal to 200 µV , the 20MHz bandwidth limit is enabled automatically and bandwidth limit cannot be disabled.
5.6 Input Impedance
To reduce the circuit load between the oscilloscope and the circuit under test, this oscilloscope provides two input impedance modes: 1 MΩ (default) and 50 Ω. In the Vertical system menu, click or tap to select "1 MΩ" or "50Ω" under Impedance.
- 1 MΩ: The input impedance of the oscilloscope is very high, and the current flowed from the circuit under test can be ignored.
- 50 Ω : makes the oscilloscope match with the device whose input impedance is 50 Ω .
After modifying the input impedance value, the circuit diagram in the Vertical system menu will also be changed, as shown in the figure below.
![Vertical CH1 CH2 CH3 CH4 Display Impedance Fine Scale Offset OFF ON 1MΩ 500 100.00mV 0.00V Probe 50Ω GND DC 1MΩ AC Trigger Acquisition Measure [M] DC 0.00V OFF 0.00s Unit Coupling Bias BW Limit Ch-Ch Skew OFF ON CH1 OFF ON Label Invert](/content/2026/07/1498798/images/92f1b343939936c566d71e2a69eb6bc7eb2688a42f9b2b4590e11527081cb4bf.jpg)
Figure 5.2 Input Impedance Modification

TIP
• After the oscilloscope recognizes the probe automatically, the input impedance will also be auto recognized. You do not have to set it manually.
- The setting of the input impedance will affect the ranges of channel vertical scale and offset.
5.7 Waveform Invert
Click or tap the channel status label at the bottom of the screen. Then the Vertical system menu is displayed. Then click or tap the ON/OFF tab for Invert to enable or disable the waveform invert function.

When "ON" is selected, the channel label is as shown in the figure below.

When "OFF" is selected, the waveform is displayed normally; when the waveform invert is enabled, the voltage values of the displayed waveform are inverted, as shown in the following figure below. Enabling the waveform invert will change the result of math function and waveform measurement.

"Invert" Off

"Invert" On
Figure 5.3 Waveform Invert

TIP
When the waveform invert is enabled, the trigger edge or the trigger polarity will change (e.g. Edge trigger, Pulse trigger, or Slope trigger).
5.8 Probe
The analog channel of this oscilloscope not only supports the common passive probe, but also the active probe. It can automatically recognize the currently connected probe type and its probe ratio. For detailed technical information of the probes, please refer to the corresponding Probe User Guide.
Enable the touch screen operation and tap the channel status label at the bottom of the screen. Then the Vertical system interface is displayed. Then tap Probe to enter the Probe setting menu.

Figure 5.4 Probe Setting Menu
If the instrument works with RP7000/PVA7000 series probes (e.g. PVA7250), the probe ratio cannot be modified and you need to calibrate the probe. For specific probe models, please refer to MHO2000 Data Sheet. For detailed technical information of the probes, please refer to the corresponding Probe User Guide.

Figure 5.5 Active Probe Setting Menu
Probe Ratio
The probe ratio is defined as the percentage of the voltage of the signal under test to the probe voltage output to the oscilloscope. The higher the probe ratio, the higher the probe sensitivity, indicating that more low-level signals can be detected.
- The series oscilloscope auto-recognizes certain probes with a fixed attenuation ratio. After being recognized, the probe ratio can be auto recognized. You do not have to set it manually.
- If the oscilloscope is unable to auto-recognize the probe, you are allowed to set the probe ratio manually. To obtain the correct measurement results, you must set the probe ratio properly. By default, the probe ratio is 1X.
When a voltage probe is connected to the oscilloscope, refer to Amplitude Unit to set the amplitude unit to V. The following table lists the preset probe ratio of the oscilloscope. You can also set a user-defined probe ratio according to your needs.
Table 5.1 Probe Ratio of the Voltage Probe
| Menu | Attenuation (display amplitude of the signal: actual amplitude of the signal under test) |
| 0.001X | 0.001:1 |
| 0.002X | 0.002:1 |
| 0.003X | 0.003:1 |
| 0.005X | 0.005:1 |
| 0.01X | 0.01:1 |
| 0.02X | 0.02:1 |
| 0.03X | 0.03:1 |
| 0.05X | 0.05:1 |
| 0.1X | 0.1:1 |
| 0.2X | 0.2:1 |
| 0.3X | 0.3:1 |
| 0.5X | 0.5:1 |
| 1X (default) | 1:1 |
| 2X | 2:1 |
| 3X | 3:1 |
| 5X | 5:1 |
| 10X | 10:1 |
| 15X | 15:1 |
| 20X | 20:1 |
| 50X | 50:1 |
| 100X | 100:1 |
| 150X | 150:1 |
| 200X | 200:1 |
| 500X | 500:1 |
| 1000X | 1000:1 |
| 1500X | 1500:1 |
| 2000X | 2000:1 |
| 5000X | 5000:1 |
| 10000X | 10000:1 |
| 15000X | 15000:1 |
| 20000X | 20000:1 |
| 50000X | 50000:1 |
When a current probe is connected to the oscilloscope, refer to Amplitude Unit to set the amplitude unit to A. The following table lists the preset probe ratio of the oscilloscope. You can also set a user-defined probe ratio according to your needs.
Table 5.2 Probe Ratio of the Current Probe
| Menu | Attenuation (display amplitude of the signal: actual amplitude of the signal under test) |
| 0.001 V/A | 0.001 |
| 0.002 V/A | 0.002 |
| 0.003 V/A | 0.003 |
| 0.005 V/A | 0.005 |
| 0.01 V/A | 0.01 |
| 0.02 V/A | 0.02 |
| 0.03 V/A | 0.03 |
| 0.05 V/A | 0.05 |
| 0.1 V/A | 0.1 |
| 0.2 V/A | 0.2 |
| 0.3 V/A | 0.3 |
| 0.5 V/A | 0.5 |
| 1 V/A | 1 |
| 2 V/A | 2 |
| 3 V/A | 3 |
| 5 V/A | 5 |
| 10 V/A | 10 |
External Attenuation
This oscilloscope allows you to set the external attenuation, supporting setting it in log format.
display amplitude of the signal under test = actual amplitude of the signal under test x probe ratio x attenuation ratio (not affect the actual amplitude of the signal)
Table 5.3 Range of the External Attenuation
| Probe Ratio Max. Value Min. Value | ||
| ≤ 1 100kX (10μ/Probe Ratio)X | ||
| > 1 (100k/Probe Ratio)X 10 μX |
Skew
To avoid measurement result errors arising from the transmission delay of the probe cable, the oscilloscope provides the probe delay adjustment. Click or tap the input field of Skew to set the delay time of the probe with the pop-up numeric keypad. You can also use the specified knob to set it. Its range is from -100.00 ns to 100.00 ns. The default value is 0.00 s.
Bias
The oscilloscope provides the bias voltage adjustment function for active probes. This function is used to adjust the signal under test that exceeds the input dynamic range of the probe amplifier to an appropriate range to ensure the integrity of the signal under test. When working with the RP7000/PVA7000 series probe, you need to click or tap the input field of Bias to set the bias voltage of the probe with the pop-up numeric keypad.
Probe Information
After the oscilloscope recognizes the probe automatically, In the probe menu, you can view information about the currently connected probe, such as the vendor, model, serial number, and the last calibration time.
Go Back to the Vertical System Menu
In the Probe setting menu, click or tap the Vertical menu to go back to the Vertical system menu.
5.9 Amplitude Unit
Click or tap the channel status label at the bottom of the screen. Then the Vertical system menu is displayed. Click or tap the drop-down button of Unit to select W, A, V, or U. The default unit is V.

When the amplitude unit is changed, the unit related to the channel will also be changed accordingly.
5.10 Bias
When you use an oscilloscope to make actual measurements, a small offset that arises from the temperature drift of the component or external environment disturbance may occur on the zero-cross voltage of the channel, which will affect the measurement results of the vertical parameters. This series oscilloscope allows you to set an offset calibration voltage for calibrating the zero point of the corresponding channel, so as to improve the accuracy of the measurement results.
Click or tap the Up and Down arrow icon at the right side of the input field of Bias to increase or decrease the bias value. You can also click or tap the input filed to input a specific value with the pop-up numeric keypad. Also, you can use the specified knob indicated in the input field to set the value.

The range of bias voltage is related to the input impedance and the vertical scale.

TIP
If the zero-cross voltage of the channel has a larger amplitude offset that exceeds the adjustable null range, please perform self-calibration for the instrument to ensure the measurement accuracy. For details, refer to descriptions in SelfCal section.
5.11 Channel Delay
When using an oscilloscope for actual measurement, the transmission delay of the probe cable may bring relatively greater errors (zero offset). This series oscilloscope allows you to set a delay time for calibrating the zero offset of the corresponding channel. Zero offset is defined as the offset of the crossing point of the waveform and trigger level line relative to trigger position, as shown in the figure below.

Figure 5.6 Zero Offset
In the "Vertical" menu, click or tap the input field for the Ch-Ch Skew item to set the channel-to-channel skew time. The available range is from -100 ns to 100 ns.
5.12 Channel Label
The instrument uses the channel number to mark the corresponding channel by
default. For ease of use, you can also set a label for each channel. For example,

Click or tap the channel status label at the bottom of the screen. Then the Vertical system menu is displayed. Click or tap the ON/OFF tab for Label to select whether to display the channel label. You can also click or tap the channel label input field to input a specific name for the channel label with the pop-up numeric keypad.

6 Horizontal System
To enter the Horizontal system menu, perform any of the following operations:
- Press the front-panel horizontal controls Acquire key to enter the Horizontal menu.
- Click or tap the channel status label at the bottom of the screen, and then the Vertical menu is displayed. Click or tap the Acquisition button to enter the Horizontal menu.
- Click or tap the horizontal time base label ("H" icon), acquisition label ("A" icon), or horizontal position label ("D" icon) at the top of the screen to enter the Horizontal menu.


Figure 6.1 Horizontal System Menu
6.1 To Adjust the Horizontal Time Base
Horizontal time base, also called the horizontal scale, refers to the time of each grid in the horizontal direction of the screen. It is usually expressed in s/div. For MHO2024, its range of the horizontal time base is from 2 ns/div to 500 s/div; for MHO2034, its range of the horizontal time base is from 1 ns to 500 s/div.
While you change the horizontal time base, the displayed waveforms of all channels are expanded or compressed (refer to Horizontal Expansion) horizontally relative to the current selected horizontal reference baseline. The horizontal time base at the upper-left corner of the screen will be changed accordingly, as shown in the figure below.

You can adjust the horizontal time base in the following ways.
- Rotate the front-panel Horizontal

SCALE knob to adjust the horizontal time
base within the adjustable range. Rotate it clockwise to reduce the horizontal time base, and counterclockwise to increase the horizontal time base.
- Enable the touch screen function, and then adjust the horizontal time base with the Pinch&Stretch gesture. For details, refer to Pinch&Stretch.
- In the Horizontal system menu, rotate the specified front-panel multifunction knob indicated in the input field of Scale or click/tap the icon at the right side of the input field to increase or decrease the scale value. You can also click or tap the input field to input a specific value with the displayed numeric keypad.

In the Horizontal system menu, you can click or tap the ON/OFF tab for Vernier to enable or disable the fine adjustment function. You can also press down the
Horizontal SCALE knob to switch the scale adjustment mode between "Coarse" and "Fine".
- Coarse adjustment: Click or tap the icons at the right side of the input field of Scale to adjust the horizontal time base of the waveforms of all channels in a 1-2-5 step sequence within the adjustable range.
- Fine adjustment: Click or tap the icon at the right side of the input field of Scale to adjust the horizontal time base of the waveforms of all channels at a smaller step within the adjustable range.
6.2 To Adjust the Horizontal Position
Horizontal position, also called trigger position, refers to the trigger point position of the waveforms of all channels in the horizontal direction relative to the screen center.
When the waveform trigger point is at the left (right) side of the screen center, the horizontal position is a positive (negative) value.
While you change the horizontal position, the waveform trigger points and the displayed waveforms of all channels are moved left and right. The horizontal position at the top of the screen changes accordingly, as shown in the figure below.

You can adjust the horizontal position with the following methods.
- Rotate the front-panel Horizontal

POSITION multifunction knob to adjust
the horizontal position within the adjustable range. Rotate it clockwise to reduce the horizontal position, and counterclockwise to increase the horizontal position. Pressing down the knob can quickly reset the Horizontal position (set the horizontal position to 0).
- Enable the touch screen, and then adjust the horizontal position with the Drag gesture. For details, refer to Drag.
- Open the Horizontal system menu, rotate the specified front-panel multifunction knob indicated in the input field of Position or click/tap the icon at the right side of the input field to increase or decrease the value, as shown in the figure below. You can also click or tap the input field of Position to input a specific value with the displayed numeric keypad.

6.3 Zoom Mode (Delayed Sweep)
Zoom mode (delayed sweep) can be used to expand a length of waveform horizontally to view waveform details. In the Horizontal system menu, click or tap the ON/OFF tab for Zoom to enable or disable the delayed sweep function. When the delayed sweep is enabled, you can set the scale and position for the delayed sweep.

- Zoomed Scale: Rotate the specified multifunction knob to increase or decrease the time base. Click or tap the icon at the right side of the Scale input field to increase or decrease the zoom scale. You can also click or tap the input field to input the specific value directly via the pop-up numeric keypad.
- Zoomed Position: Rotate the specified multifunction knob to increase or decrease the horizontal position. Click or tap the Left/Right arrow icon at the right side of the Position input field to increase/decrease the position. You can also click or tap the input field to input the specific value directly via the pop-up numeric keypad.
In delayed sweep mode, the screen is divided into two display areas as shown in the figure below.

Figure 6.2 Zoom Mode (Delayed Sweep Mode)
• Waveform before expansion:
The upper portion of the display that is not covered by subtransparent gray shows the normal display of the waveform. Its horizontal time base (called the main time base) is indicated in the label at the upper-left corner of the display. You can move the area left and right by adjusting the horizontal position and increase or decrease the size of the area by adjusting the horizontal scale.
• Waveform after expansion:
The lower portion shows the horizontally expanded version of the normal waveform display. Its horizontal time base (called the zoomed time base) is
displayed in the middle. Compared with the main time base, the zoomed time base has higher horizontal resolution.

TIP
The zoomed time base should be smaller than or equal to the main time base.
7 Acquisition System
The "Horizontal" menu allows you to configure the instrument's acquisition system.

Figure 7.1 Horizontal Menu
7.1 Acquisition Mode
The acquisition mode is used to control how to generate waveform points from the sample points. In the Horizontal system menu, click or tap the desired acquisition mode for the Acquisition menu. The available choices include Normal, Average, Peak, High Res. By default, the acquisition mode is Normal. The acquisition mode will be displayed in the acquisition label at the top of the screen.

Normal
In Normal acquisition mode, the oscilloscope samples the signal at a fixed time interval to rebuild the waveform. For most of the waveforms, this mode is adopted to achieve optimal display effects..
Average
In this mode, the oscilloscope averages the waveforms from multiple samples to reduce the random noise of the input signal and improve the vertical resolution. Greater number of averages can lower the noise and increase the vertical resolution; while at the same time, it will slow the response of the displayed waveform to the waveform changes.

When you select "Average" mode, click or tap the input field of Averages to set it with the pop-up numeric keypad. You can also use the specified knob to set it. Its range is from 2 to 65536. Its default value is 2.
TIP
The number of averages must be the Nth power of 2. When it is not in N power-of-2 increments, a prompt message "Truncation average error" is displayed. At this time, a value that is smaller than the one you input and the closest to N power-of-2 increments will be input automatically.
Peak
In this mode, the oscilloscope acquires the maximum and minimum values of the signal within the sample interval to get the envelope of the signal or the narrow pulse that might be lost. In this mode, signal aliasing can be prevented, but the noise displayed would be larger.
In this mode, the oscilloscope can display all the pulses whose pulse widths are at least the same as the sample period.
High Resolution
This mode uses a kind of ultra-sample technique to average the neighboring points of the sample waveform to reduce the random noise on the input signal and generate much smoother waveforms on the screen. This is generally used when the sample rate of the digital converter is higher than the storage rate of the acquisition memory.
When you select "High Res" mode, click or tap the drop-down button of Bits to select 14 or 16. By default, it is 14. The bandwidth of the selected bit appears at the right side of the input field.

TIP
- The averaging modes of the "Average" and "High Res" are different. The former uses "Multi-sample Average" and the latter uses "Single Sample Average".
- In "High Res" mode, the oscilloscope improves the measurement accuracy at the cost of bandwidth. Each time the sample rate changes, the current bandwidth changes with it dynamically, as shown at the right side of the Bits input field in the Horizontal system menu.
7.2 Sampling Mode
This oscilloscope only supports the real-time sampling mode. In this mode, the oscilloscope produces the waveform display from samples collected during one trigger event. The max. real-time sample rate of this series is 2 Gsa/s. The current sample rate is displayed in the acquisition label at the top of the screen.
By default, the operating status label at the left top of the screen is in green, indicating that the instrument is undergoing real-time sampling. Then the STOP/RUN
icon at the top of the screen is in green. Click or tap STOP/RUN to stop sampling. You can also press on the front panel to stop sampling. At this time, the operating status label of the instrument at the upper-left part of the screen shows a red STOP
icon. The STOP/RUN key on the front panel is illuminated in red. The oscilloscope will maintain its last captured graph. You can still expand or zoom the waveforms by using the horizontal and vertical control menu.
7.3 Sample Rate
Sampling is the process of converting the analog signal into the digital signal at a specified time interval and then restoring them in sequence. The sample rate is the reciprocal of the time interval.
In the Horizontal system menu, "SampleRate" shows the current sample rate. The current sample rate is displayed in the acquisition label at the top of the screen, as shown in the figure below.

The maximum sample rate of this oscilloscope is 2 GSa/s.
The impact of low sample rate on the waveform:
- Waveform Distortion: when the sample rate is too low, some waveform details are lost, and the sample waveform displayed is rather different from the actual waveform of the signal.

- Waveform Aliasing: when the sample rate is twice lower than the actual signal frequency (Nyquist Frequency), the frequency of the waveform rebuilt from the sample data is smaller than the actual signal frequency.

- Waveform Leakage: when the sample rate is too low, the waveform rebuilt from the sample data does not reflect all the actual signal information.

7.4 Memory Depth
Memory depth refers to the number of points of the oscilloscope that can store in one trigger acquisition. It reflects the storage capability of the acquisition storage. The max. memory depth of the MHO2000 series is 500 Mpts in half-channel mode and 250 Mpts in full-channel mode.

Figure 7.2 Memory Depth
MDepth ≥ SRate x TSCale x HDivs
The following equation shows the relations among memory depth, sample rate, and horizontal time base scale:
• MDepth indicates the memory depth. The unit is pts.
• SRate indicates the sample rate. The unit is Sa/s.
• TSCale indicates the horizontal time base scale. The unit is s/div.
- HDivs indicates the number of grids in the horizontal direction. The unit is div.
Therefore, under the same horizontal time base scale, a higher memory depth can ensure a higher sample rate.
In the Horizontal system menu, click or tap the drop-down button of Mem Depth to select the memory depth. By default, the memory depth is 10 kpts. The memory depth value will be displayed in the sample rate label at the top of the screen.

- CH1 and CH3 are considered as one group; CH2 and CH4 are considered as another group.
- When only one of the channels in each group is enabled, or when both channels in either group are enabled, the memory depths available include Auto, 1 kpts, 10 kpts, 100 kpts, 1 Mpts, 10 Mpts, 25 Mpts, 50 Mpts, 100 Mpts, 125 Mpts, 200 Mpts, 250 Mpts, and 500 Mpts.
- When one or two channels in either group are both enabled, the memory depths available include Auto, 1 kpts, 10 kpts, 100 kpts, 1 Mpts, 10 Mpts, 25 Mpts, 50 Mpts, 100 Mpts, 125 Mpts, 200 Mpts, and 250 Mpts.
TIP
- In "Auto" mode, the oscilloscope selects the memory depth automatically according to the current sample rate.
- When Acquisition Mode is set to "High Res", "Auto" is not available for the memory depth setting.
- When Acquisition Mode is set to "Average", only 1 kpts, 10 kpts, 100 kpts, 1 Mpts, 10 Mpts, 25 Mpts, and 50 Mpts are available for the memory depth setting.
7.5 Horizontal Expansion
Horizontal expansion indicates the reference position that the screen waveform is referenced to when it is horizontally expanded or compressed in adjusting the horizontal time base.
In the Horizontal system menu, click or tap the drop-down button of Expand to select the horizontal reference baseline. The available choices include Center, Left, Right, Trigger, and User. The default is "Center".
- Center: when the horizontal time base is modified, the waveform will be expanded or compressed horizontally relative to the screen center.
- Left: when the horizontal time base is modified, the waveform will be expanded or compressed horizontally relative to the leftmost position of the screen.
- Right: when the horizontal time base is modified, the waveform will be expanded or compressed horizontally relative to the rightmost position of the screen.
- Trigger: when the horizontal time base is modified, the waveform will be expanded or compressed horizontally relative to the trigger point.
- User: when the horizontal time base is modified, the waveform displayed will be expanded or compressed horizontally relative to the user-defined reference position.
When you select "User", click or tap the input field of User Expansion. Input the horizontal expansion reference value with the displayed numeric keypad. Its range is from -500 to 500. Its default value is 0.
7.6 Roll Mode
In Roll mode, the waveforms are updated rolling from right to left on the screen. You do not need to wait until all the complete waveforms are acquired. You can see the acquired data points at any time during its acquisition. In the Horizontal system menu, click or tap to select "Auto" or "OFF" for the Roll menu.
- Auto: enables the Roll mode. When the horizontal time base is set to 50 ms/div or lower than the value, the instrument automatically enters the roll mode.
- OFF: disables the Roll mode. In this mode, when the horizontal time base is set to 200 ms/div or lower than this value, the instrument enters slow sweep mode. In this mode, the instrument first acquires the data at the left of the trigger point and then waits for a trigger event. After the trigger occurs, the instrument continues to generate the waveform at the right of the trigger point. When observing the low-frequency signal in the slow sweep mode, it is recommended that you set "Channel Coupling" to "DC".

TIP
- If the current delayed sweep is enabled, then when you enable the Roll mode, the delayed sweep is disabled automatically.
- The following functions are not available when the Roll mode is enabled:
To Adjust the Horizontal Position (available when the operating status of the oscilloscope is in STOP state), Zoom Mode (Delayed Sweep), To Trigger the Oscilloscope, Pass/Fail Test, Waveform Recording and Playing Persistence Time, Average, and XY Mode.
7.7 XY Mode
By default, this series oscilloscope uses the YT mode for waveform display window. In YT mode, Y-axis indicates the Voltage and X-axis indicates the Time. Besides, it supports XY display window. In this display window, X-axis and Y-axis indicate voltage. The two input channels display from "Voltage-Time" to "Voltage-Voltage".
Enable the XY Mode
You can enable the XY display mode in the following ways.
- Click or tap the Windows button in the function navigation menu or on the toolbar to enter the Add Window menu. In the "Diagram" item, click or tap XY > Add to enable the XY display mode.
- Click or tap the XY button in the function navigation menu or on the toolbar to enable the XY display mode.
• In the "Horizontal" menu, check the checkbox of XY to enable the XY mode.
Configure the XY Mode
Click or tap at the upper-right corner of the XY display window to enter the XY configuration menu.

Figure 7.3 XY Menu
- Source: Click or tap the drop-down button of Source X to select the source channel of the X-axis in the XY window. Click or tap the drop-down button of Source Y to select the source channel of the Y-axis in the XY window.
- Grid: Please refer to To Set the Screen Grid to set the grid of the XY window.
Phase Deviation Measurement
In this mode, you can use the Lissajous method to measure the phase deviation of the two input signals whose frequencies are the same. The following figure shows the measurement schematic diagram of phase deviation.

Figure 7.4 Measurement Schematic Diagram of Phase Deviation
According to = A/B or C/D , is the phase deviation angle between the two channels. The definitions of A, B, C, and D are shown in the figure above. The phase deviation angle is obtained, that is:
=±(A/B) or ±(C/D)
If the principal axis of the ellipse is within Quadrant I and III, the phase deviation angle obtained should be within Quadrant I and IV, namely within (0 to π/2 ) or (3 π /2 to 2 π ). If the principal axis of the ellipse is within Quadrant II and IV, the phase deviation angle obtained should be within Quadrant II and III, namely within ( π /2 to π ) or ( π to 3 π /2).
The XY mode can be used to measure the phase deviation occurred when the signal under test passes through a circuit network. Connect the oscilloscope to the circuit to monitor the input and output signals of the circuit.
8 To Trigger the Oscilloscope
The trigger system allows you to set specific trigger conditions as required. The oscilloscope captures a waveform and its neighboring part to display them on the screen once a particular trigger condition is met. For a digital oscilloscope, it samples waveforms ceaselessly no matter whether it is stably triggered. However, only stable triggering can guarantee the stable display of waveforms. The trigger module ensures that every time base sweep or acquisition starts from the user-defined trigger condition, namely every sweep is synchronous with the acquisition and the waveforms acquired are overlapped so as to display the stable waveforms.
You should set the triggers based on the features of the input signal. To quickly capture your desired waveforms, you need to understand the signal under test. This oscilloscope provides a variety of trigger types that help you focus on the desired waveform details.
You can enter the Trigger menu in the following ways.
- Press the front-panel key to enter the trigger menu.
- In the Vertical menu, click or tap the Trigger button to enter the trigger setting menu.
- Click or tap the trigger label (as shown in the figure below) at the top of the screen to enter the trigger menu.


Figure 8.1 Trigger System Menu
8.1 Trigger Source
In the "Trigger" menu, click or tap the drop-down button of Source to select the desired source from the drop-down list. The available sources include: analog channels, digital channels, EXT (external trigger), and AC Line.
Analog Channel
Signals input from analog channels can all be used as trigger sources. No matter whether the channel selected is enabled, the channel can work normally.
Digital Channel
Signals input from digital channels (D0-D15) can all be used as trigger sources. No matter whether the channel selected is enabled, the channel can work normally.
AC Line
The trigger signal is obtained from the AC power input of the oscilloscope. AC trigger is usually used to measure signals relevant to the AC power frequency. For example, stably triggering the waveform output from the transformer of a transformer substation. It is mainly used in related measurements of the power industry.
EXT (External Trigger)
The external trigger source can be used to trigger on the fifth channel while all the other four channels are acquiring data. The trigger signal (e.g. external clock or signal of the circuit under test) input from the EXT trigger source via the external trigger input terminal [EXT TRIG] connector can be used as the external trigger source. You can set the trigger conditions within the range of the trigger level (from -8 V to +8 V).
8.2 Trigger Level
Trigger level determines the position of the trigger point on the edge. The adjustment of the trigger level/threshold level is related to the type of the trigger source.
- When the trigger source is analog channel or digital channel, rotate the front-
panel LEVEL knob or use the specified multifunction knob (when the trigger menu is opened) to adjust the trigger level. You can also click or tap the input field of Level to set the value with the pop-up numeric keypad.
When the trigger source is D0-D15, you can set the threshold level for digital channels in the basic settings tab of the logic analyzer interface shown in Basic Settings. For details, refer to To Set the Threshold. The current threshold level is displayed in the the trigger information label at the top of the screen.
During the adjustment, a trigger level line (the color of the trigger level line is the same as that of the channel) and a trigger label "T" are displayed on the
screen, and they move up and down with the variation of the trigger level. When you stopping modifying the trigger level, the trigger level line disappears in about 2 s. The current trigger level is displayed in the the trigger information label at the top of the screen.
In Runt Trigger, Slope Trigger, and Window trigger, you need to set the upper
and lower limits of the trigger level. Two trigger level labels T1 and T2 are displayed at the right section of the screen.
- When the trigger source is AC Line, there is no trigger level.
- When the trigger source is EXT, rotate the front-panel LEVEL knob or use the specified multifunction knob (when the trigger menu is opened) to adjust the trigger level. You can also click or tap the input field of Level to set the value with the pop-up numeric keypad. The current trigger level is displayed in the the trigger information label at the top of the screen.
For this trigger source, only the variation of the trigger level value is displayed on the screen during the adjustment of the trigger level, without displaying the trigger level lines on the screen.
To better trigger the waveforms, for a trigger with a single level, you can directly click or tap 50% in the level menu or press down the trigger level knob to make the level move to the middle of the waveform. However, for a trigger (e.g. Slope trigger, Runt trigger, Window trigger, and MIL-STD-1553 trigger) with two levels, you need to click or tap 90% for Level A and 10% for Level B in the level menu or press down the trigger level knob to make the level move within the range of the waveform amplitude. If you check the checkbox of Linkage, when you modify either of the levels, both Level A and Level B will be adjusted simultaneously.
8.3 Trigger Mode
The following is the schematic diagram of the acquisition memory. To easily understand the trigger event, we classify the acquisition memory into the pre-trigger buffer and post-trigger buffer.

Figure 8.2 Schematic Diagram of the Acquisition Memory
After the oscilloscope starts running, it first fills the pre-trigger buffer. Then, after the pre-trigger buffer is filled, the oscilloscope starts searching for a trigger. While searching for the trigger, the data sampled will still be transmitted to the pre-trigger buffer (the new data will continuously overwrite the previous data). When a trigger is found, the pre-trigger buffer contains the events that occurred just before the trigger. Then, the oscilloscope will fill the post-trigger buffer and display the data in the acquisition memory.
If the acquisition is initiated via the front-panel key, the oscilloscope will repeat this process. If the acquisition is initiated via , the oscilloscope will stop after finishing a single acquisition (you can pan and zoom the currently displayed waveform).
This series oscilloscope provides Auto, Normal, and Single trigger modes. The default trigger mode is Auto.
Click or tap the trigger information label in the main interface (as shown in the figure below) to enter the trigger setting interface. You can also press the front -panel
Trigger key to enter the trigger setting interface. Then select the desired trigger mode under Mode. The trigger mode is displayed in the trigger information label at the top of the screen: A (Auto), N (Normal), and S (Single).

- Auto: In this trigger mode, if the specified trigger conditions are not found, triggers are forced and acquisitions are made so as to display the waveforms. This trigger mode should be used when the signal level is unknown or the DC should be displayed as well as when forcible trigger is not necessary as the trigger condition always occurs.
- Normal: In this trigger mode, triggers and acquisitions only occur when the specified trigger conditions are found. This trigger mode should be used when the signal is with low repetition rate or only the event specified by the trigger setting needs to be sampled as well as when auto trigger should be prevented to acquire stable display.
- Single: In this trigger mode, the oscilloscope performs a single trigger and acquisition when the specified trigger conditions are found, and then stops. This trigger mode should be used when you need to perform a single acquisition of the specified event and analyze the acquisition result (you can pan and zoom the currently displayed waveform, and the subsequent waveform data will not overwrite the current waveform). After a single trigger mode is initiated, the operating status of the oscilloscope is in "STOP" state.
When the trigger mode is Normal or Single, click or tap Force in the trigger setting interface to generate a trigger signal forcibly. You can also press the front-panel

to generate a trigger signal forcibly.
8.4 Trigger Coupling
Trigger coupling decides which kind of components will be transmitted to the trigger module. Please distinguish it from channel coupling (Channel Coupling). This function is available only when the trigger type is Edge and the trigger source is an analog channel.
In the "Trigger" menu, click or tap the drop-down button of Coupling to select the desired coupling mode (by default, it is DC).

- DC: allows DC and AC components to pass the trigger circuitry.
• AC: blocks the DC components and attenuates the signals. - LFR: blocks the DC components and rejects the low-frequency components.
• HFR: rejects the high frequency components.

TIP
When "AC" or "LFR" is selected as the coupling mode, no trigger level lines and trigger icons are displayed. When you adjust the trigger level, you can only see the changes of the trigger level values in the trigger information label at the top of the screen.
8.5 Trigger Holdoff
Trigger holdoff can be used to stably trigger on complex repetitive waveforms that have multiple edges or other events between waveform repetitions (such as pulse series). Holdoff time indicates the time that the oscilloscope waits for re-arming the trigger module after generating a correct trigger. The oscilloscope will not trigger even if the trigger condition is met during the holdoff time and will only re-arm the trigger module after the holdoff time expires.
For example, to stably trigger the repetitive pulse series as shown in the figure below, the holdoff time should be set to a value that is greater than t1 and smaller than t2.

Figure 8.3 Trigger Holdoff
In the trigger interface, click or tap the input field of Holdoff to set the holdoff time with the pop-up numeric keypad to make it to trigger stably. By default, it is 8 ns. You can also rotate the specified multifunction knob indicated in the input field to set the value. The adjustable range of the holdoff time is from 8 ns to 10 s.
8.6 Noise Rejection
Noise rejection can reject the high frequency noise in the signal and reduce the possibility of miss-trigger of the oscilloscope.
Click or tap the ON/OFF tab for Noise Reject to enable or disable the noise rejection.

TIP
This function is only valid when the trigger source is an analog channel, digital channel, or EXT.
8.7 Trigger Type
This series oscilloscope provides the following trigger types.
8.7.1 Edge Trigger
Triggers on the trigger level of the specified edge of the input signal.
Select the Trigger Type
Click or tap the drop-down button of Type to select "Edge" from the drop-down list.
For the Edge trigger menu, refer to Figure 8.1.
After selecting the trigger type, and then the current trigger setting information (including trigger type, trigger source, and trigger level) Back is displayed in the
trigger information label at the top of the screen, as shown in the figure below. The information will change based on the trigger settings.

Select the Source
Click or tap the drop-down button of Source to select analog channels, digital channels, AC Line, or EXT. For the available channels, refer to descriptions in Trigger Source. The current trigger source is displayed in the trigger information label at the top of the screen.
Only when we select the channel (that has been input with signals) as the trigger source, can we obtain a stable trigger.
Edge Type
In the Slope item, select which edge of the input signal will trigger the oscilloscope. The selected slope will be indicated in the trigger information label.
- Rising: triggers on the rising edge of the input signal when the voltage level meets the specified trigger level.
- Falling: triggers on the falling edge of the input signal when the voltage level meets the specified trigger level.
- Either: triggers on the rising or falling edge of the input signal when the voltage level meets the preset trigger level.

TIP
When edge trigger is selected, you can also press the front-panel key to switch the edge type.
8.7.2 Pulse Trigger
Triggers on the positive or negative pulse with a specified width. In this mode, the oscilloscope will trigger when the pulse width of the input signal satisfies the specified pulse width condition.
In this oscilloscope, positive pulse width is defined as the time difference between the two crossing points of the trigger level and positive pulse; negative pulse width is defined as the time difference between the two crossing points of the trigger level and negative pulse, as shown in the figure below.

Figure 8.4 Positive Pulse Width/Negative Pulse Width
Trigger Type
Click or tap the drop-down button of Type to select "Pulse" from the drop-down list. Then set the parameters for Pulse trigger.

Figure 8.5 Pulse Trigger Setting Menu
After selecting the trigger type, and then the current trigger setting information (including trigger type, trigger source, and trigger level) is displayed in the trigger label at the top of the screen, as shown in the figure below. The information will change based on the trigger settings.

Select the Source
Click or tap the drop-down button of Source to select the analog channel or digital channel as the trigger source. The current trigger source is displayed in the trigger information label at the top of the screen.
Only when we select the channel (that has been input with signals) as the trigger source, can we obtain a stable trigger.
Polarity
In the Polarity item, select the desired polarity: positive polarity ( ) or negative polarity ( )
Trigger Condition
Set the trigger condition in the When item.
- When you select "Positive" for polarity, "> " for trigger condition, the oscilloscope triggers when the positive pulse width of the input signal is greater than the specified pulse width.
- When you select "Positive" for polarity, "<" for trigger condition, the oscilloscope triggers when the positive pulse width of the input signal is smaller than the specified pulse width.
- When you select "Positive" for polarity, "< >" for trigger condition, the oscilloscope triggers when the positive pulse width of the input signal is greater than the specified lower limit of pulse width and smaller than the specified upper limit of pulse width.
- When you select "Negative" for polarity, "> " for trigger condition, the oscilloscope triggers when the negative pulse width of the input signal is greater than the specified pulse width.
- When you select "Negative" for polarity, "<" for trigger condition, the oscilloscope triggers when the negative pulse width of the input signal is smaller than the specified pulse width.
- When you select "Negative" for polarity, "< >" for trigger condition, the oscilloscope triggers when the negative pulse width of the input signal is greater than the specified lower limit of pulse width and smaller than the specified upper limit of pulse width.
Pulse Width Setting
- In the When menu, when ">" or "<" is selected, click or tap the input field of Lower or Upper to set the lower limit value or the upper limit value with the pop-up numeric keypad. You can also use the specified multifunction knob to set the value. The pulse range available is from 1 ns to 10 s.
- In the When menu, when "< >" is selected, click or tap the input field of Upper and Lower respectively to set the lower limit value and the upper limit value with the pop-up numeric keypad. You can also use the specified multifunction knob to set the values. The lower limit of the pulse width must be smaller than the upper limit.
8.7.3 Slope Trigger
In Slope trigger, the oscilloscope triggers on the positive or negative slope of the specified time. This trigger mode is applicable to ramp and triangle waveforms.
In this oscilloscope, positive slope time is defined as the time difference between the two crossing points of trigger level line A and B with the rising edge; negative slope time is defined as the time difference between the two crossing points of trigger level line A and B with the falling edge. As shown in the figure below:

Figure 8.6 Positive Slope Time/Negative Slope Time
Trigger Type
Click or tap the drop-down button of Type to select "Slope" from the drop-down list. Then set the parameters for Slope trigger.

Figure 8.7 Slope Trigger Setting Menu
After selecting the trigger type, and then the current trigger setting information (including trigger type, trigger source, and trigger level) is displayed in the trigger information label at the top of the screen, as shown in the figure below. The information will change based on the trigger settings.

Source Selection
Click or tap the drop-down button of Source to select the desired analog channel from the drop-down list. The current trigger source is displayed in the trigger information label at the top of the screen.
Only when we select the channel (that has been input with signals) as the trigger source, can we obtain a stable trigger.
Edge Type
Select the input signal edge (in the Slope item) on which the oscilloscope triggers.
- Rising: triggers on the rising edge of the input signal.
- Falling: triggers on the falling edge of the input signal.
Trigger Condition
Sets the trigger condition in the When item.
- When you select "Rising" for the edge type, "> " for trigger condition, the oscilloscope triggers when the positive slope time of the input signal is greater than the specified time.
- When you select "Rising" for the edge type, "<" for trigger condition, the oscilloscope triggers when the positive slope time of the input signal is smaller than the specified time.
- When you select "Rising" for the edge type, "< >" for trigger condition, the oscilloscope triggers when the positive slope time of the input signal is greater than the specified lower limit time and smaller than the specified upper limit time.
- When you select "Falling" for the edge type, "> " for trigger condition, the oscilloscope triggers when the negative slope time of the input signal is greater than the specified time.
- When you select "Falling" for the edge type, "<" for trigger condition, the oscilloscope triggers when the negative slope time of the input signal is smaller than the specified time.
- When you select "Falling" for the edge type, "< >" for trigger condition, the oscilloscope triggers when the negative slope time of the input signal is greater than the specified lower limit time and smaller than the specified upper limit time.
Slope Time Setting
- In the When item, when "> " or "<" is set to trigger conditions, click or tap the input field of Lower or Upper to set the lower limit value or the upper limit value with the pop-up numeric keypad. You can also use the corresponding knob to set the value. The slope time available is from 1 ns to 10 s.
- In the When item, when "< >" is set to trigger conditions, click or tap the input field of Upper and Lower respectively to set the upper limit value and the lower limit value with the pop-up numeric keypad. You can also use the corresponding knob to set the values. The lower slope time limit must be smaller than the upper slope time limit.
Level Selection and Setting
After the trigger condition setting is completed, you need to adjust the trigger level to correctly trigger the signal and obtain a stable waveform.
Click or tap the input field of Level A and that of Level B to set Level A an Level B with the pop-up numeric keypad. You can also use the trigger level knob or use the specified multifunction knob to adjust Level A and Level B respectively. Check the checkbox of Linkage to link Level A and Level B. The Level A and Level B will be adjusted synchronously. The upper limit and lower limit values change at the same time. The trigger level deviation (the difference between the upper limit and lower limit of the trigger level) remains unchanged. For details, refer to descriptions in
Trigger Level. The current trigger level is displayed in the trigger information label at the top of the screen.

TIP
Press down the trigger level knob and rotate it to adjust Level A, Level B, and Level AB (when linkage is enabled) in sequence.
8.7.4 Video Trigger
The video signal can include image information and timing information, which adopts different standards and formats. This series oscilloscope can trigger on the standard video signal field or line of NTSC (National Television Standards Committee), PAL (Phase Alternating Line), or SECAM (Sequential Couleur A Memoire).
Trigger Type
Click or tap the drop-down button of Type to select "Video" from the drop-down list. Then set the parameters for Video trigger.

Figure 8.8 Video Trigger Setting Menu
After selecting the trigger type, and then the current trigger setting information (including trigger type, trigger source, and trigger level) is displayed in the trigger information label at the top of the screen, as shown in the figure below. The information will change based on the trigger settings.

Source Selection
Click or tap the drop-down button of Source to select the desired analog channel from the drop-down list. The current trigger source is displayed in the trigger information label at the top of the screen.
Only when we select the channel (that has been input with signals) as the trigger source, can we obtain a stable trigger.
Video Polarity
In the Polarity item, select the desired polarity: positive polarity ( ) or negative polarity ( )
Video Standard
Click or tap the drop-down button of Standard to select the desired video standard.
Table 8.1 Video Standard
| Video Standard | Frame Frequency (Frame) | Scan Type TV Scan Line |
| NTSC 30 Interlaced Scan 525 | ||
| PAL/SECAM 25 Interlaced Scan 625 | ||
| 480p/60Hz 60 Progressive Scan 525 | ||
| 576p/50Hz 50 Progressive Scan 625 | ||
| 720p/60Hz 60 Progressive Scan 750 | ||
| 720p/50Hz 50 Progressive Scan 750 | ||
| 720p/30Hz 30 Progressive Scan 750 | ||
| 720p/25Hz 25 Progressive Scan 750 | ||
| 720p/24Hz 24 Progressive Scan 750 | ||
| 1080p/60Hz 60 Progressive Scan 1125 | ||
| 1080p/50Hz 50 Progressive Scan 1125 | ||
| 1080p/30Hz 30 Progressive Scan 1125 | ||
| 1080p/25Hz 25 Progressive Scan 1125 | ||
| 1080p/24Hz 24 Progressive Scan 1125 | ||
| 1080i/60Hz 60 Interlaced Scan 1125 | ||
| 1080i/50Hz 50 Interlaced Scan 1125 | ||
Sync
Selects the desired sync type from the drop-down list of the Sync menu.
• All Lines: triggers on the first line found.
• Line: triggers on the specified line.
When this sync type is selected, you can specify a line number. Click or tap the input field of Line to set the line number with the pop-up numeric keypad. You can also use the specified knob to set it. The range of the line number is related to the currently selected video standards. The range is from 1 to 525 (NTSC), 1 to 625 (PAL/SECAM, 1 to 525 (480p), 1 to 625 (576p), 1 to 750 (720p), or 1 to 1125 (1080p/1080i).
- Odd: triggers on the rising edge of the first ramp pulse in the odd field. It is only available when the video standard is set to "NTSC" or "PAL/SECAM".
- Even: triggers on the rising edge of the first ramp pulse in the even field. It is only available when the video standard is set to "NTSC" or "PAL/SECAM".

TIP
- For a better observation of the waveform details in the video signal, you can set a larger memory depth first.
- In the trigger debugging process of video signals, the frequency in different part of the signal can be reflected by a different brightness, as RIGOL's digital oscilloscope provides the intensity graded color display function. Experienced users can quickly judge the signal quality and discover abnormalities during the debugging process.
8.7.5 Pattern Trigger
Identifies a trigger condition by searching for a specified pattern. This pattern is a logical "AND" combination of channels. Each channel can be set to H (high), L (low), or X (don't care). A rising or falling edge (you can only specify a single edge) can be specified for one channel included in the pattern. When an edge is specified, the oscilloscope will trigger at the edge specified if the pattern set for the other channels are true (namely the actual pattern of the channel is the same as the preset pattern). If no edge is specified, the oscilloscope will trigger on the last edge that makes the pattern true. If all the channels in the pattern are set to "X", the oscilloscope will not trigger.

Figure 8.9 Pattern Trigger
Trigger Type
Click or tap the drop-down button of Type to select "Pattern" from the drop-down list. Then set the parameters for the Pattern trigger.

Figure 8.10 Pattern Trigger Setting Menu
After selecting the trigger type, and then the current trigger setting information (including trigger type, trigger source, and trigger level) is displayed in the trigger information label at the top of the screen, as shown in the figure below. The information will change based on the trigger settings.

Select the Source
Click or tap the drop-down button of Source to select the analog channel or digital channel as the trigger source. The current trigger source is displayed in the trigger information label at the top of the screen.
Only when we select the channel (that has been input with signals) as the trigger source, can we obtain a stable trigger.
Pattern Setting
The following five patterns are available:
- 1: sets the pattern of the channel selected to "1", i.e. the voltage level is higher than the trigger level of the channel.
- 0: sets the pattern of the channel selected to "0", i.e. the voltage level is lower than the trigger level of the channel.
- X: sets the pattern of the channel selected to "X", i.e. this channel is not used as a part of the pattern. When all channels in the pattern are set to "X", the oscilloscope will not trigger.

sets the pattern to the rising edge of the channel selected.

sets the pattern to the falling edge of the channel selected.
The Left/Right arrow key indicates moving left/right to switch the channel pattern. "All" indicates all bits. Select a pattern for a channel, then click or tap All. The patterns of all the other channels will be set to the currently selected pattern. The pattern setting is shown in the figure below:

Only one edge (rising or falling edge) can be specified in the pattern. If one edge item is currently defined and then another edge item is defined in another channel in the pattern, then a prompt message "Invalid input" is displayed.
8.7.6 Duration Trigger
In duration trigger, the instrument identifies a trigger condition by searching for the duration of a specified pattern. This pattern is a logical "AND" combination of the channels. Each channel can be set to 1 (high), 0 (low), or X (don't care). The instrument triggers when the duration ( ΔT ) of this pattern meets the preset time, as shown in the figure below.

Figure 8.11 Duration Trigger
Trigger Type
Click or tap the drop-down button of Type to select "Duration" from the drop-down list. Then set the parameters for Duration trigger.

Figure 8.12 Duration Trigger Setting Menu
After selecting the trigger type, and then the current trigger setting information (including trigger type, trigger source, and trigger level) is displayed in the trigger
information label at the top of the screen, as shown in the figure below. The information will change based on the trigger settings.

Select the Source
Click or tap the drop-down button of Source to select the analog channel or digital channel as the trigger source. The current trigger source is displayed in the trigger information label at the top of the screen.
Only when we select the channel (that has been input with signals) as the trigger source, can we obtain a stable trigger.
Pattern Setting
The following three patterns are available:
- 1: sets the pattern of the channel selected to "1", i.e. the voltage level is higher than the trigger level of the channel.
- 0: sets the pattern of the channel selected to "0", i.e. the voltage level is lower than the trigger level of the channel.
- X: sets the pattern of the channel selected to "X", i.e. this channel is not used as a part of the pattern. When all channels in the pattern are set to "X", the oscilloscope will not trigger.
The Left/Right arrow key indicates moving left/right to switch the channel pattern. "All" indicates all bits. Select a pattern for a channel, then click or tap All. The patterns of all the other channels will be set to the currently selected pattern.
Trigger Condition
Sets the trigger condition in the When menu.
-
: triggers when the duration of the pattern is greater than the preset time. Click or tap the input field of Lower to set the lower limit of the duration of the pattern with the pop-up numeric keypad. You can also use the specified knob to set it. The available range is from 1 ns to 10 s.
- <: triggers when the duration of the pattern is smaller than the preset time. Click or tap the input field of Upper to set the upper limit of the duration of the pattern with the pop-up numeric keypad. You can also use the specified knob to set it. The available range is from 1 ns to 10 s.
- <>: triggers when the duration of the pattern is smaller than the upper limit of the preset time and greater than the lower limit of the preset time. Click or tap the input field of Upper and Lower to set the upper and lower limit of the duration of the pattern with the pop-up numeric keypad. You can also use the specified knob to set them. The range of the upper limit is from 1.01 ns to 10 s,
and that of the lower limit is from 1 ns to 9.9 s. The lower time limit must be smaller than the upper time limit.
- > <: triggers when the duration of the pattern is greater than the upper limit of the preset time or smaller than the lower limit of the preset time. Click or tap the input field of Upper and Lower to set the upper and lower limit of the duration of the pattern with the pop-up numeric keypad. You can also use the specified knob to set them. The range of the upper limit is from 1.01 ns to 10 s, and that of the lower limit is from 1 ns to 9.9 s. The lower time limit must be smaller than the upper time limit.
8.7.7 Timeout Trigger
In Timeout trigger, the instrument triggers when the time interval ( ΔT ) (the time from when the rising edge (or falling edge) of the input signal passes through the trigger level to the time from when the neighboring falling edge (or rising edge) passes through the trigger level) is greater than the preset timeout value, as shown in the figure below.
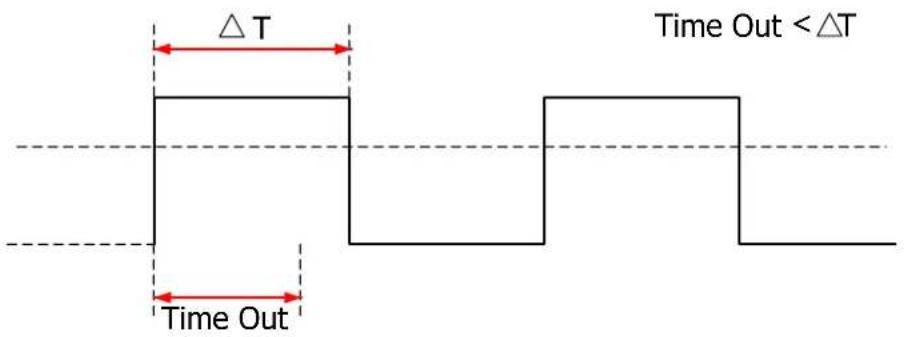
Figure 8.13 Timeout Trigger
Trigger Type
Click or tap the drop-down button of Type to select "Timeout" from the drop-down list. Then set the parameters for the Timeout trigger.

Figure 8.14 Timeout Trigger Menu
At this time, the current trigger setting information (including trigger type, trigger source, and trigger level) is displayed at the top of the screen, as shown in the figure below. The information will change based on the trigger settings.

Select the Source
Click or tap the drop-down button of Source to select the analog channel or digital channel as the trigger source. The current trigger source is displayed in the trigger information label at the top of the screen.
Only when we select the channel (that has been input with signals) as the trigger source, can we obtain a stable trigger.
Edge Type
In Slope item, select the edge type from which the input signal passes through the trigger level.
- Rising: starts timing when the rising edge of the input signal passes through the trigger level.
- Falling: starts timing when the falling edge of the input signal passes through the trigger level.
- Either: starts timing when either edge of the input signal passes through the trigger level.
Timeout Value
Timeout value represents the maximum time that the signal remains idle before the signal passes through the trigger level. Click or tap the input field of Timeout to set the timeout value with the pop-up numeric keypad. You can also use the specified knob to set it.
8.7.8 Runt Trigger
This trigger mode is used to trigger pulses that pass through one trigger level but fail to pass through another trigger level, as shown in the figure below.

Figure 8.15 Runt Trigger
Trigger Type
Click or tap the drop-down button of Type to select "Runt" from the drop-down list. Then set the parameters for Runt trigger.

Figure 8.16 Runt Trigger Setting Menu
After selecting the trigger type, and then the current trigger setting information (including trigger type, trigger source, and trigger level) is displayed at the top of the screen, as shown in the figure below. The information will change based on the trigger settings.

Source Selection
Click or tap the drop-down button of Source to select the desired analog channel from the drop-down list. The current trigger source is displayed in the trigger information label at the top of the screen.
Only when we select the channel (that has been input with signals) as the trigger source, can we obtain a stable trigger.
Polarity
Select the pulse polarity of Runt trigger under the Polarity item.
- Positive 📂: indicates that the instrument triggers on the positive runt pulse.
- Negative : triggers on the negative runt pulse.
Trigger Condition
Sets the Runt trigger condition in the When menu.
- None: indicates not setting the trigger condition of Runt trigger.
- >: triggers when the runt pulse width is greater than the lower limit of pulse width. Click or tap the input field of Lower to set the minimum pulse width of Runt trigger with the pop-up numeric keypad. You can also use the specified knob to set it.
- <: triggers when the runt pulse width is smaller than the upper limit of pulse width. Click or tap the input field of Upper to set the maximum pulse width of Runt trigger with the pop-up numeric keypad. You can also use the specified knob to set it.
- < >: triggers when the runt pulse width is greater than the lower limit and smaller than the upper limit of pulse width. Click or tap input field of Upper and Lower respectively to set the maximum and minimum pulse width of Runt trigger with the pop-up numeric keypad. You can also use the specified knob to set them respectively. The lower limit of the pulse width must be smaller than the upper limit.
Level Selection and Setting
After the trigger condition setting is completed, you need to adjust the trigger level to correctly trigger the signal and obtain a stable waveform.
Click or tap the input field of Level A and that of Level B to set Level A an Level B with the pop-up numeric keypad. You can also use the trigger level knob or use the specified multifunction knob to adjust Level A and Level B respectively. Check the checkbox of Linkage to link Level A and Level B. The Level A and Level B will be adjusted synchronously. The upper limit and lower limit values change at the same time. The trigger level deviation (the difference between the upper limit and lower limit of the trigger level) remains unchanged. For details, refer to descriptions in Trigger Level. The current trigger level is displayed in the trigger information label at the top of the screen.

TIP
Press down the trigger level knob and rotate it to adjust Level A, Level B, and Level AB (when linkage is enabled) in sequence.
8.7.9 Window Trigger
Window trigger provides a high trigger level and a low trigger level. The instrument triggers when the input signal passes through the high trigger level or the low trigger level.
Trigger Type
Click or tap the drop-down button of Type to select "Window" from the drop-down list. Then set the parameters for Window trigger.

Figure 8.17 Window Trigger Setting Menu
After selecting the trigger type, and then the current trigger setting information (including trigger type, trigger source, and trigger level) is displayed in the trigger information label at the top of the screen, as shown in the figure below.

Source Selection
Click or tap the drop-down button of Source to select the desired analog channel from the drop-down list. The current trigger source is displayed in the trigger information label at the top of the screen.
Only when we select the channel (that has been input with signals) as the trigger source, can we obtain a stable trigger.
Edge Type
Selects the desired input signal edge on which the oscilloscope triggers.
- Rising: triggers on the rising edge of the input signal when the voltage level is higher than the preset high trigger level.
- Falling: triggers on the falling edge of the input signal when the voltage level is lower than the preset low trigger level.
- Either: triggers on the rising or falling edge of the input signal when the voltage level meets the preset trigger level.
Trigger Position
After selecting the window type, click or tap Position to further specify the time point of trigger by selecting the trigger position.
- Enter: triggers when input signal enters the specified trigger level range.
- Exit: triggers when input signal exits the specified trigger level range.
- Time: triggers when the accumulated hold time since the input signal entered the specified trigger level range is equal to the window time. When this type is selected, you can set the window time. Its available range is from 1 ns to 10 s.
Set the Trigger Level
After the setting is completed, you need to adjust the trigger level to correctly trigger the signal and obtain a stable waveform.
- Level A: only adjusts the upper limit of the trigger level, and the lower limit of the trigger level remains unchanged.
- Level B: only adjusts the lower limit of the trigger level, and the upper limit of the trigger level remains unchanged.
- Linkage: When you check the checkbox of Linkage, the upper and lower trigger level can be adjusted synchronously. The trigger level deviation (the difference between the upper limit and lower limit of the trigger level) remains unchanged.
You can set "Level A" and "Level B" with the pop-up numeric keypad. You can also rotate the Trigger Level knob on the front panel or the specified multifunction knob indicated in the input field of Level A and Level B to set the value. For details, refer to descriptions in Trigger Level.

TIP
Press down the trigger level knob and rotate it to adjust Level A, Level B, and Level AB (when linkage is enabled) in sequence.
8.7.10 Delay Trigger
In Delay trigger, you need to set Source A and Source B. The oscilloscope triggers when the time difference ( ΔT ) between the specified edges (Edge A and Edge B) of Source A and Source B meets the preset time limit, as shown in the figure below. Edge A and Edge B must be two neighboring edges.

Figure 8.18 Delay Trigger
Trigger Type
Click or tap the drop-down button of Type to select "Delay" from the drop-down list. Then set the parameters for Delay trigger.

Figure 8.19 Delay Trigger Setting Menu
After selecting the trigger type, and then the current trigger setting information (including trigger type, trigger source, and trigger level) is displayed in the trigger information label at the top of the screen, as shown in the figure below. The information will change based on the trigger settings.

Source Setting
- Source A
Click or tap the drop-down button of SourceA to select the analog channel or digital channel. The current trigger source is displayed in the trigger information label at the top of the screen.
Only when we select the channel (that has been input with signals) as the trigger source, can we obtain a stable trigger.
- Edge A
Click or tap the trigger edge type ("Rising" or "Falling") of Source A in Delay trigger under the EdgeA menu.
- Source B
Click or tap the drop-down button of SourceB to select the analog channel or digital channel. The current trigger source is displayed in the trigger information label at the top of the screen.
Only when we select the channel (that has been input with signals) as the trigger source, can we obtain a stable trigger.
- Edge B
Click or tap the trigger edge type ("Rising" or "Falling") of Source B in Delay trigger under the EdgeB menu.
Set the Trigger Condition
Sets the time limit condition of Delay trigger for When menu item.
- >: triggers when the time difference (ΔT) between the specified edges of Source A and Source B is greater than the preset time lower limit. Click or tap the input field of Lower to set the delay time lower limit with the pop-up numeric keypad. You can also use the specified knob to set it.
- < : triggers when the time difference ( ΔT ) between the specified edges of Source A and Source B is smaller than the preset time upper limit. Click or tap the input field of Upper to set the delay time upper limit with the pop-up numeric keypad. You can also use the specified knob to set it.
- <>: triggers when the time difference (ΔT) between the specified edges of Source A and Source B is greater than the lower limit of the preset time and smaller than the upper limit of the preset time. Click or tap input field of Upper and Lower respectively to set the delay time upper limit and lower limit with the pop-up numeric keypad. You can also use the specified knob to set them respectively. The lower time limit must be smaller than the upper time limit.
- > <: triggers when the time difference (ΔT) between the specified edges of Source A and Source B is smaller than the lower limit of the preset time or
greater than the upper limit of the preset time. Click or tap input field of Upper and Lower respectively to set the delay time upper limit and lower limit with the pop-up numeric keypad. You can also use the specified knob to set them respectively. The lower time limit must be smaller than the upper time limit.
Level Selection and Setting
After the trigger condition setting is completed, you need to adjust the trigger level to correctly trigger the signal and obtain a stable waveform.
Click or tap the input field of Level A and Level B respectively to set Level A and Level B with the pop-up numeric keypad. You can also use the specified multifunction knob to adjust level A and level B or use the trigger level knob to adjust the level (the focus of the trigger level knob is the last modified level). For details, refer to descriptions in Trigger Level. The current trigger level is displayed in the trigger information label at the top of the screen.
8.7.11 Setup/Hold Trigger
In setup&hold trigger, you need to set the clock source and data source. The setup time starts when the data signal passes the trigger level and ends at the coming of the specified clock edge; the hold time starts at the coming of the specified clock edge and ends when the data signal crosses the trigger level again, as shown in the figure below. The oscilloscope triggers when the setup time or hold time is smaller than the preset time.

Figure 8.20 Setup/Hold Trigger
Trigger Type
Click or tap the drop-down button of Type to select "Setup/Hold" from the dropdown list. Then set the parameters for Setup/Hold trigger.

Figure 8.21 Setup/Hold Trigger Setting Menu
After selecting the trigger type, and then the current trigger setting information (including trigger type, trigger source, and trigger level) is displayed at the top of the screen, as shown in the figure below. The information will change based on the trigger settings.

Clock Source
Click or tap the drop-down button of SCL to select the analog channel or digital channel as the trigger source. The current trigger source is displayed in the trigger information label at the top of the screen.
Only when we select the channel (that has been input with signals) as the trigger source, can we obtain a stable trigger.
Edge Type
Selects "Rising" or "Falling" as the edge type of clock source.
Data Source
Click or tap the drop-down button of SDA to select the analog channel or digital channel as the trigger source. The current trigger source is displayed in the trigger information label at the top of the screen.
Only when we select the channel (that has been input with signals) as the trigger source, can we obtain a stable trigger.
Data Type
Sets the effective pattern of the data signal. It can be set to H (high level) or L (low level).
Trigger Condition
Sets the Setup/Hold trigger condition in the When menu.
- Setup: the oscilloscope triggers when the setup time is smaller than the specified setup time. Click or tap the input field of Setup to set the setup time with the pop-up numeric keypad. You can also use the specified knob to set it.
- Hold: the oscilloscope triggers when the hold time is smaller than the specified hold time. After selecting this type, click or tap the input field of Hold to set the hold time with the pop-up numeric keypad. You can also use the specified knob to set it.
- Setup/Hold: the oscilloscope triggers when the setup time or hold time smaller than the specified time value. After selecting this type, click or tap the input field of Setup and Hold respectively to set the setup and hold time with the pop-up numeric keypad. You can also use the specified multifunction knob to set the values.
Level Selection and Setting
After the trigger condition setting is completed, you need to adjust the trigger level to correctly trigger the signal and obtain a stable waveform.
Click or tap the input field of SCL Level or SDA Level respectively to set SCL level and SDA level with the pop-up numeric keypad. You can also use the specified multifunction knob to adjust SCL level and SDA level or use the trigger level knob to adjust the level (the focus of the trigger level knob is the last modified level). For details, refer to descriptions in Trigger Level. The current trigger level is displayed in the trigger information label at the top of the screen.
Triggers on the Nth edge that appears after the specified idle time. For example, in the waveform shown in the figure below, the instrument should trigger on the second rising edge after the specified idle time (the time between two neighboring rising edges), and the idle time should be within the range between P and M (P < Idle Time < M). Wherein, M is the time between the first rising edge and its previous rising edge; P is the maximum time between the rising edges that participate in counting.

Select the Source
Click or tap the drop-down button of Source to select the analog channel or digital channel as the trigger source. The current trigger source is displayed in the trigger information label at the top of the screen. Only when we select the channel (that has been input with signals) as the trigger source, can we obtain a stable trigger.Edge Type
Select the input signal edge (in the Slope item) on which the oscilloscope triggers. - Rising: triggers on the rising edge of the input signal when the voltage level meets the specified trigger level. - Falling: triggers on the falling edge of the input signal when the voltage level meets the specified trigger level.Idle Time
Click or tap the input field of Idle Time, then use the pop-up numeric keypad to set the idle time before the edge counting in Nth edge trigger. You can also use the specified multifunction knob to set the value.Edge Count
Click or tap the input field of Edges, then use the pop-up numeric keypad to set the value of "N" in the Nth edge trigger. You can also use the specified knob to set the value. The available range is from 1 to 65,535.8.7.13 RS232 Trigger
RS232 bus is a serial communication mode used in data transmission between PCs or between a PC and a terminal. In RS232 serial protocol, a character is transmitted as a frame of data. The frame consists of 1 start bit, 5-8 data bits, 1 check bit, and 1-2 stop bits. Its format is as shown in the figure below. This series oscilloscope triggers when the start frame, error frame, check error, or the specified data of the RS232 signal is detected.  Stop BitCheck BitData BitStart B Figure 8.24 Schematic Diagram of RS232 ProtocolTrigger Type
Click or tap the drop-down button of Type to select "RS232" from the drop-down list. Then set the parameters for RS232 trigger.  Figure 8.25 RS232 Trigger Setting Menu After selecting the trigger type, and then the current trigger setting information (including trigger type, trigger source, and trigger level) is displayed at the top of the screen, as shown in the figure below. The information will change based on the trigger settings. Polarity
Select the polarity of data transmission in the Polarity item. It can be set to "Positive" or "Negative"Trigger Condition
- Start: triggers on the start frame position. - Error: triggers when an error frame is detected. - Check Error: triggers when a check error is detected. - Data: triggers on the last bit of the preset data bits. Click or tap the drop-down button of Data to set the data of RS232 trigger with the pop-up numeric keypad. You can also use the specified knob to set it.Baud Rate
You can select the baud rate of data transmission (i.e. specifies a clock frequency). Click or tap the drop-down button of Baud Rate, then select the preset baud rate. The available baud rates include 50 bps, 75 bps, 110 bps, 134 bps, 150 bps, 300 bps, and etc. You can also self-define the baud rate.Data Bits
Indicate the number of bits per frame. Click or tap the drop-down button of Data Bits to select the desired data bits. The available data bits include "5 Bits", "6 Bits", "7 Bits", and "8 Bits".Stop Bit
Indicates when to stop outputting data. Select the desired stop bit in the Stop Bit item. The available data bits include 1 Bit, 1.5 Bits, and 2 Bits.Parity
Used to check whether the data are properly transmitted. Select None, Even, or Odd in the Parity item. - None: indicates that no check bit appears during the transmission. - Even: indicates that the total number of "1" in the data bit and check bit is an even number. For example, when 0x55 (01010101) is sent, "0" should be added to the check bit. - Odd: indicates that the total number of "1" in the data bit and check bit is an odd number. For example, when 0x55 (01010101) is sent, "1" should be added to the check bit.8.7.14 I2C Trigger
I2C is a 2-wire serial bus used to connect the microcontroller and its peripheral device. It is a bus standard widely used in the microelectronic communication control field. The I2C serial bus consists of SCL and SDA. Its transmission rate is determined by SCL, and its transmission data is determined by SDA, as shown in the figure below. The instrument series triggers on the start condition, restart, stop, missing acknowledgment, specific device address, or data value. Besides, it can also trigger on the specific device address and data values at the same time.  Figure 8.26 Sequential Chart of I2C BusTrigger Type
Click or tap the drop-down button of Type to select "I2C" from the drop-down list. Then set the parameters for I2C trigger.  Figure 8.27 I2C Trigger Setting Menu At this time, the current trigger setting information (including trigger type, trigger source, and trigger level) is displayed at the top of the screen, as shown in the figure below. The information will change based on the trigger settings. Source Selection
Click or tap the drop-down button of SCL and SDA to select the analog channel or digital channel as the source of SCL and SDA respectively. For details, refer to descriptions in Trigger Source. The current trigger source is displayed in the trigger information label at the top of the screen. Only when we select the channel (that has been input with signals) as the trigger source, can we obtain a stable trigger.Trigger Condition
Sets the the desired trigger condition in the When menu. - Start: triggers when SDA data transitions from high level to low level while SCL is high level. - Stop: triggers when SDA data transitions from low level to high level while SCL is high level. - Restart: triggers when another start condition occurs before a stop condition. \- MissedAck: triggers when ACK is 1. \- Address: the trigger searches for the specified address value. When this event occurs, the oscilloscope will trigger on the read/write bit. After this trigger condition is selected: \- Click or tap the drop-down button of Direction drop select "Write", "Read", or "R/W". This setting is not available when AddrBits is set to "8 Bits". \- Click or tap the drop-down button of AddrBits to select the desired address bits. The available address bits are "7 Bits", "8 Bits", and "10 Bits". \- Click or tap the input field of Address to set the address of I2C trigger with the pop-up numeric keypad. You can also use the specified knob to set it. \- Data: the trigger searches for the specified data value on the data line (SDA). When this event occurs, the oscilloscope will trigger on the clock line (SCL) transition edge of the last bit of data. After this trigger condition is selected, you can set the address bits, data, and bytes. \- Click or tap the drop-down button of AddrBits to select the desired address bits. The available address bits are "7 Bits", "8 Bits", and "10 Bits". \- Click or tap the input field of Bytes to set the length of data with the popup numeric keypad. You can also use the specified knob to set it. Its range is from 1 to 5. \- Click or tap the input field of Data, then the "Format" interface is displayed. You can select "Bin" or "Hex" format to set the data format.  Figure 8.28 Bin Format Setting  Figure 8.29 Hex Format Setting \- A&D: the oscilloscope searches for the specified address and data at the same time, then triggers when both the address and data meet the conditions. After this condition is selected, you need to set the sub-menu items such as Direction, Bytes, AddrBits, Address, and Data. For the setting methods, refer to descriptions in "Address" and "Data" conditions.Level Selection and Setting
After the trigger condition setting is completed, you need to adjust the trigger level to correctly trigger the signal and obtain a stable waveform. - SCL Level: Click or tap the input field of SCL Level to set the level of SCL with the pop-up numeric keypad. You can also use the specified multifunction knob to set it. - SDA Level: Click or tap the input field of SDA Level to set the level of SDA with the pop-up numeric keypad. You can also use the specified multifunction knob to set it. For details, refer to descriptions in Trigger Level. The current trigger level is displayed in the trigger information label at the top of the screen.8.7.15 SPI Trigger
In SPI trigger, after the CS or timeout condition is satisfied, the oscilloscope triggers when the specified data is found. When using SPI trigger, you need to specify the CLK clock sources and MISO data sources. Below is the sequential chart of SPI bus.  Figure 8.30 Sequential Chart of SPI BusTrigger Type
Click or tap the drop-down button of Type to select "SPI" from the drop-down list. Then set the parameters for SPI trigger.  Figure 8.31 SPI Trigger Setting Menu After selecting the trigger type, and then the current trigger setting information (including trigger type, trigger source, and trigger level) is displayed in the trigger information label at the top of the screen, as shown in the figure below. The information will change based on the trigger settings. Source Selection
Click or tap the drop-down button of CLK and MISO to select the analog channel or digital channel of the source of CLK and MISO. For the channel sources supported by different models, refer to descriptions in Trigger Source. The current trigger source is displayed in the trigger information label at the top of the screen. Only when we select the channel (that has been input with signals) as the trigger source, can we obtain a stable trigger.Edge Type
Click or tap the drop-down button of Slope to select the desired clock edge type. - Rising: samples the MISO data on the rising edge of the clock. - Falling: samples the MISO data on the falling edge of the clock.Trigger Condition
Click or tap the drop-down button of When to set the trigger condition. \- With CS: if the CS signal is valid, the oscilloscope will trigger when the data (SDA) satisfying the trigger conditions is found. - Click or tap the drop-down button of CS to select the analog channel or the digital channel as the CS channel. The current CS channel will be displayed in the trigger information label at the top of the screen. - Click or tap to select "Positive" (high level is valid) or "Negative" (low level is valid) under CS Mode. \- Timeout: the oscilloscope starts to search for the data (MISO) on which to trigger after the clock signal (CLK) stays in the idle state for a specified period of time. After selecting this condition, click or tap the input field of Timeout to set the timeout value with the pop-up numeric keypad. You can also use the specified knob to set it. The available range of the timeout value is from 8 ns to 10 s.Data
Click or tap the input field of Data, then the "Format" interface is displayed. You can set the data bit that needs to be operated on. For details, refer to descriptions in I2C Trigger.Data Bits
Click or tap the input field of Data Bits to set the number of bits in the serial data with the pop-up numeric keypad. You can also use the specified knob to set it. The number of bits in the string can be set to any integer ranging from 4 to 32.Level Selection and Setting
After the trigger condition setting is completed, you need to adjust the trigger level to correctly trigger the signal and obtain a stable waveform. - CLK Level: Click or tap the input field of CLK Level to set the CLK level with the pop-up numeric keypad. You can also use the specified multifunction knob to set it. - MISO Level: Click or tap the input field of MISO Level to set the MISO level with the pop-up numeric keypad. You can also use the specified multifunction knob to set it. - CS Level: Click or tap the input field of CS Level to set the level of CS with the pop-up numeric keypad. You can also use the specified multifunction knob to set it. For details, refer to descriptions in Trigger Level. The current trigger level is displayed in the trigger information label at the top of the screen.8.7.16 CAN Trigger
This series oscilloscope can trigger on the start of a frame, end of a frame, frame of the specified type (e.g. Remote, Overload, Data, etc.), or error frame of the specified type (e.g. Answer Error, Check Error, Format Error, etc.) of the CAN signal. The data frame format of the CAN bus is as shown in the figure below.  Figure 8.32 Data Frame Format of the CAN BusTrigger Type
Click or tap the drop-down button of Type to select "CAN" from the drop-down list. Then set the parameters for CAN trigger. Wherein, CAN-FD Baud and FD Sample Position are available when you have installed the MHO2000-AUTOA option. The CAN-FD Baud is the baud rate of the CAN-FD trigger.  Figure 8.33 CAN Trigger Setting Menu After selecting the trigger type, and then the current trigger setting information (including trigger type, trigger source, and trigger level) is displayed in the trigger information label at the top of the screen, as shown in the figure below. The information will change based on the trigger settings. Select the Source
Click or tap the drop-down button of Source to select the analog channel or digital channel as the trigger source. The current trigger source is displayed in the trigger information label at the top of the screen. Only when we select the channel (that has been input with signals) as the trigger source, can we obtain a stable trigger.Signal Type
Click or tap the drop-down button of Signal Type to select the desired signal type. - CAN_H: indicates the actual CAN_H bus signal. - CAN_L: indicates the actual CAN_L bus signal. - TX/RX: indicates the Transmit signal and Receive signal from the CAN bus transceiver. - DIFF: indicates the CAN differential bus signals connected to an analog channel by using a differential probe. Connect the probe's positive lead to the CAN_H bus signal and connect the negative lead to the CAN_L bus signal.Baud Rate
Click or tap the drop-down button of Baud to select the preset baud rate. The available baud rates include 10 kbps, 20 kbps, 33.3 kbps, 50 kbps, 62.5 kbps, 83.3 kbps, and etc. You can also self-define the baud rate.Sample Position
Sample position is a point within a bit's time. The oscilloscope samples the bit level at this point. The sample position is represented by the proportion of "the time from the start of the bit to the sample position" to the "bit time", as shown in the figure below.  Figure 8.34 Sample Position (CAN Trigger) Click or tap the input field of Sample Position to set the sample position with the pop-up numeric keypad. You can also use the specified knob indicated in the input field to set it. Its settable range is from 10% to 90%. Set the CAN-FD Baud CAN-FD baud rate is a dedicated setting for the CAN-FD trigger. It is available only when the MHO2000-AUTOA option has been installed. Click or tap the drop-down button of CAN-FD Baud to select the variable baud rate from the drop-down list. The available baud rates include 1 Mbps, 2 Mbps, 3 Mbps, 4 Mbps, and etc. You can also self-define the baud rate. Trigger Condition Click or tap the drop-down button of When to select the desired trigger condition. \- SOF: triggers at the start of a frame. \- EOF: triggers at the end of a frame. \- Remote ID: triggers on the specified ID of Remote frame. When you select Remote ID, you need to set the following parameters. \- Click or tap the ON/OFF tab for extended ID. Extended ID to enable or disable the \- Click or tap the input field of ID, and then the "Format" interface is displayed. You can set the ID that needs to be operated on. For details, refer to descriptions in 12C Trigger. • Overload: triggers on the overload frames. \- Frame ID: triggers on the data frames with the specified ID. After selecting Frame ID, you can refer to the "Remote ID" mentioned above to set Extended ID and ID. \- Frame Data: triggers on the data frames with the specified Data. When you select Frame Data, you need to set the following parameters. \- Click or tap the input field of Data, and then the "Format" interface is displayed. You can set the data bit that needs to be operated on. For details, refer to descriptions in I2C Trigger. \- Click or tap the input field of Bytes to set the length of data with the pop-up numeric keypad. You can also use the specified knob to set it. Its range is from 1 to 8. \- Data & ID: triggers on the data frames with the specified ID and data. When you select Data & ID, you need to set ID, Extended ID, Data, and Bytes. • Frame Error: triggers on the error frame. \- Bit Fill: triggers on the error frame with the bit fill. - Answer Error: triggers on the answer error frame. - Check Error: triggers on the check error frame. - Format Error: triggers on the format error frame. \- Random Error: triggers on the random error frame, such as the format error frame, answer error frame, etc.8.7.17 FlexRay Trigger (Option)
This series oscilloscope can trigger on the specified frame, symbol, error, or position of the FlexRay bus. FlexRay is a type of differential serial bus configured with three consecutive segments (i.g. packet header, payload, and packet trailer). Its data transmission rate is up to 10 Mb/s. Each frame contains a static segment and a dynamic segment, and ends with the bus idle time. Its format is as shown in the figure below.  Figure 8.35 Frame Format of FlexRay BusTrigger Type
Click or tap the drop-down button of Type to select "FlexRay" from the drop-down list. Then set the parameters for FlexRay trigger.  Figure 8.36 FlexRay Trigger Setting Menu After selecting the trigger type, and then the current trigger setting information (including trigger type, trigger source, and trigger level) is displayed in the trigger information label at the top of the screen, as shown in the figure below. The information will change based on the trigger settings. Select the Source
Click or tap the drop-down button of Source to select the analog channel or digital channel as the trigger source. The current trigger source is displayed in the trigger information label at the top of the screen. Only when we select the channel (that has been input with signals) as the trigger source, can we obtain a stable trigger.Baud Rate
You can set the baud rate of the signal. Click or tap the drop-down button Baud to select a FlexRay baud rate that matches the FlexRay bus signal. The available baud rates include 2.5 Mbps, 5 Mbps, and 10 Mbps.Trigger Condition
Click or tap the drop-down button of When to set the trigger condition. - Post: triggers on the specified position of the FlexRay bus. Select Post as the trigger condition, and then click or tap its drop-down button to select "TSS End", "FSS_BSS End", "FES End", or "DTS End" from the drop-down list. - Error: triggers when an error occurs to the FlexRay bus. Click or tap the drop-down button of Error to select the error type. It includes "Head CRC Err", "Tail CRC Err", "Decode Err", and "Random Err". • Frame: triggers on the frame of FlexRay bus. - Click or tap the drop-down button of Frame to select the frame type. The types of frames include null, Syns, Start, and All. - Click or tap the drop-down button of Define to select "ID" or "Cyc Count". When you select "Cyc Count", set the following parameters: Cyc Comp, Count Min, and Count Max. Click or tap the drop-down button of Cyc Comp to select the comparison conditions. The available choices include =, ≠, >, <, ><, and <>. When a certain condition is selected, click or tap the input field of Count Min or Count Max to set the min. count or max. count. When you select "ID", set the following parameters: ID Comp, ID Min, and ID Max. Click or tap the drop-down button of ID Comp to select the comparison conditions. The available choices include =, ≠, >, <, ><, and <>. When a certain condition is selected, click or tap the input field of ID Max or ID Min to set the value. You can also use the specified knob to set it with the pop-up numeric keypad. As the occurrence possibility of specified FlaxRay frame is very low, it is recommended that you set the oscilloscope to "Normal" trigger mode when the trigger condition is set to "Frame", so as to prevent the instrument from triggering automatically while waiting for the specified frame. The same goes for "Error" trigger condition.8.7.18 LIN Trigger (Option)
This oscilloscope can trigger on the sync field of LIN signal, and can also trigger on the specified identifier, data, or frame. The data frame format of the LIN bus is as shown in the figure below.| Sync Break | Sync Field | Identifier Field | Data Fields | Checksum Field |
Trigger Type
Click or tap the drop-down button of Type to select "LIN" from the drop-down list. Then set the parameters for LIN trigger.  Figure 8.38 LIN Trigger Setting Menu After selecting the trigger type, then the current trigger setting information (including trigger type, trigger source, and trigger level) is displayed in the trigger information label at the top of the screen, as shown in the figure below. The information will change based on the trigger settings. Select the Source
Click or tap the drop-down button of Source to select the analog channel or digital channel as the trigger source. The current trigger source is displayed in the trigger information label at the top of the screen. Only when we select the channel (that has been input with signals) as the trigger source, can we obtain a stable trigger.Protocol Version
In Version, select the protocol version that matches the signal under test. The available versions include 1.X, 2.X and Both.Baud Rate
Click or tap the drop-down button of Baud to select the preset baud rate. The available baud rates include 1.2 kbps, 2.4 kbps, 4.8 kbps, 9.6 kbps, 19.2 kbps, and etc. You can also self-define the baud rate.Sample Position
Sample Position is a point within a bit's time. The oscilloscope samples the bit level at this point. The sample position is represented by the proportion of "the time from the start of the bit to the sample position" to the "bit time", as shown in the figure below.  Figure 8.39 Sample Position (LIN Trigger) Click or tap the input field of Sample Position to set the sample position of the LIN trigger with the pop-up numeric keypad. You can also use the specified knob to set it. Its settable range is from 10% to 90%.Trigger Condition
Click or tap the drop-down button of When to set the the desired trigger condition. \- Sync: triggers on the last bit of the sync field. \- ID: triggers when the frames with the specified ID are found. Click or tap the input field of ID to set ID value with the pop-up numeric keypad. You can also use the specified knob to set it. \- Data: triggers when the data that meet the preset conditions are found. \- Click or tap the input field of Data, and then the "Format" interface is displayed. You can set the data bit that needs to be operated on. For details, refer to descriptions in I2C Trigger. \- Click or tap the input field of Bytes to set the length of data with the popup numeric keypad. You can also use the specified knob to set it. Its range is from 1 to 8. \- Data&ID: triggers when the frames with the specified ID and data that meet the preset conditions are both found. When Data&ID is selected, you need to set the Data, Bytes, and ID. \- Sleep: triggers when the sleep frame is found. \- Wakeup: triggers when the wakeup frame is found. \- Error: triggers on the specified type of error frame. Click or tap the drop-down button of Error Type to select the error type: Sync, Even Odd, or Check Sum.8.7.19 I2S Trigger (Option)
In I2S trigger, the oscilloscope searches for the specified data value and take it as the condition for identifying the trigger. You need to specify the serial clock line (SCLK, 1 pulse is found on the clock line once 1 bit of digital audio data is sent), frame clock line (WS, used for switch the audio channel data), and serial data line (SDA, used for transmit audio data represented in binary (2's complement)). Below is the sequential chart of I2S bus.  Figure 8.40 Sequential Chart of I2S BusTrigger Type
Click or tap the drop-down button of Type to select "I2S" from the drop-down list. Then set the parameters for I2S trigger.  Figure 8.41 I2S Trigger Setting Menu After selecting the trigger type, then the current trigger setting information (including trigger type, trigger source, and trigger level) is displayed in the trigger information label at the top of the screen, as shown in the figure below. The information will change based on the trigger settings. Source Selection
Click or tap the drop-down button of SCLK, WS, and SDA to select the analog channel or the digital channel as the source of SCLK, WS, and SDA respectively. For the available channels, refer to descriptions in "Trigger Source". The current trigger source is displayed in the trigger information label at the top of the screen. Only when we select the channel (that has been input with signals) as the trigger source, can we obtain a stable trigger.Edge Type
Selects the desired clock edge from the drop-down list of SCLK Edge. - Rising: samples the SDA data on the rising edge of the clock. - Falling: samples the SDA data on the falling edge of the clock.Audio
Click or tap the drop-down button of Audio to select the audio channel ("Left", "Right", or "Either").Trigger Condition
Click or tap the drop-down button of When to set the the desired trigger condition. \- =: triggers when the channel's data equal the set data value. Click or tap the input field of Data, and "Format" interface is displayed. You can set the data bit that needs to be operated on. \- ≠: triggers when the channel's data do not equal the set data value. Click or tap the input field of Data, and then the "Format" interface is displayed. You can set the data bit that needs to be operated on. \- >: triggers when the channel's data are greater than the set data value. Click or tap the input field of Data Min, and then the "Format" interface is displayed. You can set the lower limit of the data bit. \- <: triggers on when the channel's data are smaller than the set data value. Click or tap the input field of Data Max, and then the "Format" interface is displayed. You can set the upper limit of the data bit. \- <>: triggers when the channel's data are smaller than the upper limit of the data value and greater than the lower limit of the data value.. Click or tap the input field of Data Max and Data Min, and then the "Format" interface is displayed. You can set the upper limit and lower limit of the data bit. \- > <: triggers when the channel's value is greater than the upper limit of the data value and smaller than the lower limit of the data value. Click or tap the input field of Data Max and Data Min, and then the "Format" interface is displayed. You can set the upper limit and lower limit of the data bit. For details, refer to descriptions in I2C Trigger.User Width
Click or tap the input field of User Width to set the user width with the pop-up numeric keypad. You can also use the specified knob to set it. Its range is from 4 to 32. The user width is smaller than or equal to the width.Width
Click or tap the input field of Width to set the width with the pop-up numeric keypad. You can also use the specified knob to set it. Its range is from 4 to 32.Alignment
Click or tap the drop-down button of Alignment to select the alignment way for data signal. - I2S: data transmission (MSB first) begins at the second edge of the WS transition. - LJ: data transmission (MSB first) begins at the edge of the WS transition. - RJ: data transmission (MSB first) is right-justified to the WS transition.Trigger Level
- SCLK Level: Click or tap the input field of SCLK Level to set the level of SCLK with the pop-up numeric keypad. You can also use the specified multifunction knob to set it. - WS Level: Click or tap the input field of WS Level to set the WS level with the pop-up numeric keypad. You can also use the specified multifunction knob to set it. - SDA Level: Click or tap the input field of SDA Level to set the level of SDA with the pop-up numeric keypad. You can also use the specified multifunction knob to set it. For details, refer to descriptions in Trigger Level. The current trigger level is displayed in the trigger information label at the top of the screen.8.7.20 MIL-STD-1553 Trigger (Option)
1553B is the abbreviation for the MIL-STD-1553 bus. This oscilloscope can trigger on the sync field of 1553B bus, and can also trigger on the specified data word, command word, status word, or error type. The command word, data word, and status word format of the 1553B bus is as shown in the figure below.  Figure 8.42 Formats of the Command Word, Data Word, and Status Word of the 1553B BusTrigger Type
Click or tap the drop-down button of Type to select "1553B" from the drop-down list. Then set the parameters for MIL-STD-1553 trigger.  Figure 8.43 MIL-STD-1553 Trigger Setting Menu After selecting the trigger type, and then the current trigger setting information (including trigger type, trigger source, and trigger level) is displayed in the trigger information label at the top of the screen, as shown in the figure below. The information will change based on the trigger settings. Select the Source
Click or tap the drop-down button of Source to select the analog channel or digital channel as the trigger source. The current trigger source is displayed in the trigger information label at the top of the screen. Only when we select the channel (that has been input with signals) as the trigger source, can we obtain a stable trigger.Polarity
In the Polarity item, select the desired polarity: positive polarity (☐) or negative polarity (☐).Level Selection and Setting
After the trigger condition setting is completed, you need to adjust the trigger level to correctly trigger the signal and obtain a stable waveform. Click or tap the input field of Level A and that of Level B to set Level A an Level B with the pop-up numeric keypad. You can also use the trigger level knob or use the specified multifunction knob to adjust Level A and Level B respectively. Check the checkbox of Linkage to link Level A and Level B. The Level A and Level B will be adjusted synchronously. The upper limit and lower limit values change at the same time. The trigger level deviation (the difference between the upper limit and lower limit of the trigger level) remains unchanged. For details, refer to descriptions in Trigger Level. The current trigger level is displayed in the trigger information label at the top of the screen. TIP
Press down the trigger level knob and rotate it to adjust Level A, Level B, and Level AB (when linkage is enabled) in sequence.Trigger Condition
Click or tap the drop-down button of When to set the the desired trigger condition. \- Sync: triggers on the specified sync type. After this trigger condition is selected, click or tap the drop-down button of Sync to select the desired sync type: Data Sync, Cmd/Status Sync, or All Sync. \- Data: triggers on the specified data word. After this trigger condition is selected, click or tap the comparison conditions from the Comp click. The available choices include =, ≠, >, <, ><, and <>. \- =: triggers when the channel's data word equals the set data word. Click or tap the input field of Min, and then the "Format" interface is displayed. You can set the lower limit of the data word. For details, refer to descriptions in I2C Trigger. \- #: triggers when the channel's data word does not equal the set data word. Click or tap the input field of Min, and then the "Format" interface is displayed. You can set the lower limit of the data word. For details, refer to descriptions in I2C Trigger. \- >: triggers when the channel's data word is greater than the set data word. Click or tap the input field of Min, and then the "Format" interface is displayed. You can set the lower limit of the data word. For details, refer to descriptions in I2C Trigger. \- <: triggers when the channel's data word is smaller than the set data word. Click or tap the input field of Max, and then the "Format" interface is displayed. You can set the upper limit of the data word. For details, refer to descriptions in I2C Trigger. \- <>: triggers when the channel's data word is smaller than the upper limit of the data word and greater than the lower limit of the data word. Click or tap the input field of Max and Min, and then the "Format" interface is displayed. You can set the upper limit and lower limit of the data word. For details, refer to descriptions in I2C Trigger. \- > <: triggers when the channel's data word is greater than the upper limit of the data word or smaller than the lower limit of the data word. Click or tap the input field of Max and Min, and then the "Format" interface is displayed. You can set the upper limit and lower limit of the data word. For details, refer to descriptions in I2C Trigger. \- RTA: triggers on the specified remote terminal address. After this trigger condition is selected, click or tap the input field of RTA, and then the "Format" interface is displayed. You can set the remote terminal address. For details, refer to descriptions in I2C Trigger. \- RTA+11Bit: triggers on the RTA and the remaining 11 bits. After this trigger condition is selected: \- Click or tap the input field of RTA, and then the "Format" interface is displayed. You can set the remote terminal address. For details, refer to descriptions in I2C Trigger. \- Click or tap the input field of Bit Time, and then the "Format" interface is displayed. You can set the bit time position value to 0 (low), 1 (high), or X (don't care). For details, refer to descriptions in I2C Trigger. \- Error: triggers on the specified error type. After this trigger condition is selected, click or tap the drop-down button of Err Type to select the error type. \- Sync Error: triggers when an invalid sync pulse is found. \- Check Error: triggers when the parity bit is incorrect for the data in the word.8.8 Zone Trigger
This series oscilloscope supports the zone trigger and provides two rectangle areas: Trigger zone A and Trigger zone B. You can set the trigger conditions to "Intersect" or "Not intersect". Refer to Rectangle Drawing to draw a rectangular in the waveform view. When you move your finger away from the screen, the sub-menus are displayed. Click or tap to select "Trigger zone A" or "Trigger zone B". Double-click the area to enter the specified zone trigger interface. Also, in the Trigger menu, you can click or tap Trigger to enter the zone trigger interface.Set the Trigger Zone
In the rectangular drawing mode, the region that you draw in the waveform view is called the trigger zone. In the trigger zone interface, you can set "Center X" and "Center Y" to adjust the position of the trigger zone. Set "Width" and "Height" to adjust the area of the trigger zone.Enable or Disable the Trigger Zone
Click or tap the ON/OFF tab for Zone A and Zone B to enable or disable the specified trigger zone in the waveform view. They can be controlled independently.Select the Source
Selects the source for trigger zone A and B. The available sources are CH1-CH4. The color of the zone name and the zone frame are the same as that of the the selected channel.Select the Trigger Condition
If you enable Zone A, select CH1 as Source A and select "Intersect" as the condition, as shown in the figure below.  If you enable Zone A, select CH1 as Source A and select "Intersect" as the condition, the following figure is displayed.  TIP
If both trigger zone A and trigger zone B are enabled, the the logic "And" operation is the final trigger condition.Set the Trigger Logic for Zone Trigger
• A or B: triggers when one of the trigger conditions set for Zone A and Zone B is met. • A & B: triggers when both of the trigger conditions set for Zone A and Zone B are met.8.9 Trigger Output Connector
The trigger output connector ([AUX OUT]) on the rear panel of this series oscilloscope can output trigger signals (trigger hardware) based on the current setting. Click or tap the function navigation icon > Utility. Click or tap Setup, and then in the AUX Out menu, select "TrigOut". A signal which reflects the current oscilloscope capture rate can be output from [AUX OUT] connector each time a trigger is generated by the oscilloscope. If this signal is connected to a waveform display device to measure the frequency, the measurement result is the same as the current capture rate. If "PassFail" is selected for the AUX Out menu, the instrument can output a pulse from the [AUX OUT] connector when a pass/failed event is detected during the pass/fail test.9 Math Operation
This series of oscilloscopes can realize multiple math operations between waveforms of different channels, including arithmetic operation, spectrum operation, logic operation, function operation, and digital filter. To enter the Math menu, perform any of the following operations: \- Click or tap the function navigation icon at the lower-left corner of the screen, and then select Math to enter the "Math" menu. \- Click or tap Math on the toolbar at the upper-right of the interface to enter the "Math" menu. \- Click or tap the math label (M) at the bottom of the screen. Then the math operation label is displayed below.  Click or tap the specified math operation label to enable the specified math operation, and the specified math operation window is displayed on the screen, as shown in Figure 9.2. Click or tap the specified math label again or click/tap at the upper-right corner of the math operation window to enter the math operation setting menu. \- Press the front-panel Math key to enter the math operation menu.  Figure 9.1 Math Operation Menu This oscilloscope provides four math operations: Math1, Math2, Math3, and Math4. Click or tap the Math1, Math2, Math3, or Math4 tab to enter the specified math operation menu. You can also slide on the current math operation menu to switch among different math operation tabs. This manual takes Math1 as an example to introduce math operation. By default, the math operation is disabled. When the specified math operation is enabled respectively, the corresponding math operation is displayed on the screen, as shown in the figure below.  Figure 9.2 Math Operation Result Display Window Users can drag the title bar of the display window to change the position of the window. You can also click/tap the close button at the upper-right corner of the window to close it.9.1 Arithmetic Operation
In the Math menu, click or tap the drop-down button of Operator to select the desired math operation. The arithmetic operations supported by this oscilloscope include A+B, A-B, A×B, and A÷B. - A + B : adds the waveform voltage values of signal source A and B point by point and displays the results. • A-B: subtracts the waveform voltage values of signal source B from that of source A point by point and displays the results. - A×B: multiplies the waveform voltage values of signal source A and B point by point and displays the results. - A÷B: divides the waveform voltage values of signal source A by that of source B point by point and displays the results. It can be used to analyze the Multiple relation of the two channels waveforms. For the arithmetic operation menu, refer to Figure 9.1.Arithmetic Operation Result Display Window
Click or tap the ON/OFF tab for Operation to enable or disable the display of the arithmetic operation result window. The source and the vertical scale parameters are displayed at the top of the window, as shown in the figure below.  Figure 9.3 Arithmetic Operation Result Display WindowSource
Click or tap the drop-down button of SourceA or SourceB to select CH1\~CH4 or Ref1\~Ref10. When a source channel is selected, the selected channel automatically switches to the ON state. TIP
In addition to CH1\~CH4 and Ref1\~Ref10, the available sources for Math2 also include Math1; the sources for Math3 also include Math1 and Math2; the sources for Math4 also include Math1, Math2, and Math3. The selected Math channel and operation status will automatically be enabled.9.2 Function Operation
In the Math menu, click or tap the drop-down button of Operator to select the desired function operation. The available function operation types of this oscilloscope include Intg, Diff, Sqrt, Lg (Base 10 Exponential), Ln, Exp, Abs, and AX+B. - Intg: calculates the integral of the selected source. For example, you can use integral to measure the area under a waveform or the pulse energy. - Diff: calculates the discrete time derivative of the selected source. For example, you can use differentiate to measure the instantaneous slope of a waveform. - Sqrt: calculates the square roots of the selected source point by point and displays the results. - Lg (Base 10 Exponential): calculates the base 10 exponential of the selected source point by point and displays the results. - Ln: calculates the natural logarithm (Ln) of the selected source point by point and displays the results. - Exp: calculates the exponential of the selected source point by point and displays the results. - Abs: calculates the absolute value of the selected source and displays the results. - AX+B: applies a linear function to the selected source, and displays the results.  Figure 9.4 Function Operation MenuOperation Result Display Window
Click or tap the ON/OFF tab for the Operation menu to enable or disable the display of the operation result window. The source and the vertical scale parameters are displayed at the top of the window, as shown in the figure below.  Figure 9.5 Function Operation Result Display WindowSource
Click or tap the drop-down button of Source to select CH1-CH4 or Ref1-Ref10. When a source channel is selected, the selected channel automatically switches to the ON state. TIP
In addition to CH1\~CH4 and Ref1\~Ref10, the available sources for Math2 also include Math1; the sources for Math3 also include Math1 and Math2; the sources for Math4 also include Math1, Math2, and Math3. The selected Math channel and operation status will automatically be enabled.9.3 FFT Operation
FFT (Fast Fourier Transform) is used to transform time-domain signals to frequency-domain components (frequency spectrum). This oscilloscope provides FFT operation function which enables you to observe the time-domain waveform and spectrum of the signal at the same time. FFT operation can facilitate the following works: • Measure harmonic components and distortion in the system; - Display the characteristics of the noise in DC power; - Analyze vibration. In the Math menu, click or tap the drop-down button of Operator to select FFT to enter the FFT operation menu, as shown in the figure below.  Figure 9.6 FFT Operation MenuOperation
Click or tap the ON/OFF tab for Operation to enable or disable the FFT operation result window. The parameters such as center frequency, span, and FFT resolution (RBW) are displayed at the top of the window, as shown in the figure below. Of which, FFT resolution is the quotient of the sample rate and the number of FFT points. If the number of FFT points is a fixed value (65535 at most), then the lower the sample rate, the higher the resolution.  Figure 9.7 FFT Operation WindowSource
Click or tap the drop-down button of Source to select CH1-CH4. When a source channel is selected, the selected channel automatically switches to the ON state.Frequency Range
In the X item menu, select "Span-Center" (frequency span to center frequency) or "Start-End" (start frequency to stop frequency) as a frequency range mode. \- Span-Center (span to center frequency): Span specifies the frequency range represented by the width from the frequency at the left side of the window to the frequency at the right side of the window. Divide the frequency span by 10 to obtain the frequency per division. Click or tap the input field of Center Freq to set the frequency of the frequency-domain waveform relative to the horizontal center of the window. You can also use the specified knob to set the value. Its range is from 5 Hz to 1 GHz. Click or tap the input field of Span to set the set the frequency span with the pop-up numeric keypad. You can also use the specified knob to set it. Its range is from 10 Hz to 1 GHz. \- Start-End (start frequency to stop frequency): Start frequency refers to the frequency at the left side of the window. Click or tap the input field of Start Freq to set the start frequency of the frequency-domain waveform with the pop-up numeric keypad. You can also set the value by using the specified knob. Its range is from 0 Hz to (stop frequency -10 Hz). Stop frequency refers to the frequency at the right side of the window. Click or tap the input field of End Freq to set the stop frequency of the frequency-domain waveform with the pop-up numeric keypad. You can also set the values by using the specified knob. Its range is from (start frequency + 10 Hz) to 1 GHz. Its default value is 10 MHz.Unit of Vertical Scale/Offset
Selects "dBm/dBV" or "Vrms" as the unit for Scale and Offset.Window Function
Spectral leakage can be considerably decreased when a window function is used. The oscilloscope provides 6 FFT window functions which have different characteristics and are applicable to measure different waveforms. You need to select the window function according to the characteristics of the waveform to be measured. Click or tap the drop-down button of Window to select the desired window function. Table 9.1 Window Function| Window Function | Characteristics | Waveforms Applicable to the Window Function |
| Rectangular | Best frequency resolutionPoorest amplitude resolutionSimilar to the situation when no window is applied. | Transient or short pulse, the signal levels before and after the multiplication are basically the sameSine waveforms with the same amplitudes and rather similar frequenciesWide band random noise with relatively slow change of waveform spectrum |
| Blackman-Harris | Best amplitude resolutionPoorest frequency resolution | Single frequency signal, searching for higher order harmonics |
| Hanning | Better frequency resolution and poorer amplitude resolution compared with Rectangular | Sine, periodic, and narrow band random noise |
| Hamming | A little bit better frequency resolution than Hanning | Transient or short pulse, the signal levels before and after the multiplication are rather different |
| Flattop Measure the signals accurately | Measure the signal that has no accurate reference and requires an accurate measurement | |
| Triangle Better frequency resolution | Measure the narrow band signal and that has strong noise interference | |
Color Grade
Click or tap the ON/OFF button for the Color Grade item to enable/disable the color grade display of FFT operation results. When enabled, different colors are displayed on the screen to indicate the times of data acquisition or acquisition probability. Click or tap the Reset button for the Color Grade menu to clear the color grade display and display the color grade again.Peak Search
Click or tap the icon at the right side of Peak Search to enter the peak search menu, as shown in the figure below.  Figure 9.8 Peak Search \- Peak Search ON/OFF: click or tap the ON/OFF button for the Peak Search menu to enable or disable the display of the peak search window. By default, it is OFF. - Peak Number: click or tap the input field of Peak Number and use the pop-up numeric keypad to set the number of peaks. You can also use the specified knob to set the value. The number of peaks ranges from 1 to 15. Its default value is 5. - Threshold: click or tap the input field of Threshold to set the threshold of the peak with the pop-up numeric keypad. You can also use the specified knob to set it. The range of the threshold is related to the current FFT scale and offset. - Excursion: click or tap the input field of Excursion and use the pop-up numeric keypad to set the excursion of the peak. You can also use the specified knob to set it. The min. value of Excursion is 0. Its unit is consistent with that of FFT. - Table Order: click or tap to select Amp Order or Freq Order as the sorting mode under the Table Order menu. By default, it is "Amp Order". Click or tap Export, then the export setting interface is displayed. You can export the peak search results to the internal memory or the external USB storage device in CSV format. In the menu, click or tap the input field of File Name to set the file name. Click or tap the input field of File Path, and then the disk management menu (Disk Management) is displayed. Select the desired location to export the file and then click or tap Export to export the peak search results. Clicking or tapping the icon 🖼️ at the right side of Peak Search can close the peak search menu.9.4 Logic Operation
In the Math menu, click or tap Operator to select the desired math operation. The logic operations supported by this oscilloscope include A&&B, A||B, A^B, and !A. After selecting the desired logic operation from the drop-down list of Operator, you can configure its settings for the selected logic operation type.  Figure 9.9 Logic Operation Menu \- A&&B: Performs logic "AND" operation on the waveform voltage values of the specified sources point by point and displays the results. In operation, when the voltage value of the source channel is greater than the threshold of the corresponding channel, it is regarded as logic "1"; otherwise it is logic "0". \- A||B: Performs logic "OR" operation on the waveform voltage values of the specified sources point by point and displays the results. In operation, when the voltage value of the source channel is greater than the threshold of the corresponding channel, it is regarded as logic "1"; otherwise it is logic "0". \- A^B: Performs logic "XOR" operation on the waveform voltage values of the specified sources point by point and displays the results. In operation, when the voltage value of the source channel is greater than the threshold of the corresponding channel, it is regarded as logic "1"; otherwise it is logic "0". \- !A: Performs logic "NOT" operation on the waveform voltage values of the specified sources point by point and displays the results. In operation, when the voltage value of the source channel is greater than the threshold of the corresponding channel, it is regarded as logic "1"; otherwise it is logic "0". Table 9.2 Logic Operation| A B A&&B A||B A^B !A | ||||
| 0 0 0 0 0 1 | ||||
| 0 1 0 1 1 1 | ||||
| 1 0 0 1 1 0 | ||||
| 1 1 1 1 0 0 |
Operation Result Display Window
Click or tap the ON/OFF tab for Operation to enable or disable the display of the logic operation result window. The source and the waveform sizes parameters are displayed at the top of the window, as shown in the figure below.  Figure 9.10 Logic Operation Result Display WindowSource
Click or tap the drop-down button of SourceA or SourceB to select analog channels or digital channels. When a source channel is selected, the selected channel automatically switches to the ON state.Wave Size
Click or tap to select "Small", "Medium", or "Large" as the waveform display mode. Sensitivity
Sets the sensitivity of the digital signal converted from the analog signal on the source. Click or tap the input field of Sensitivity to set the sensitivity with the pop-up numeric keypad. You can also use the specified knob to set it.Threshold
Sets the threshold of the channel source. Click or tap the input field to set the sensitivity with the pop-up numeric keypad. You can also use the specified knob to set it.9.5 Digital Filter
In the Math menu, click or tap the drop-down button of Operator to select the desired math operation. The digital filter supported by this oscilloscope includes: low-pass filter, high-pass filter, band-pass filter, and band-stop filter. - LowPass: only allows the signals whose frequencies are lower than the current upper limit frequency to pass. - HighPass: only allows the signals whose frequencies are higher than the current lower limit frequency to pass. - BandPass: only allows the signals whose frequencies are higher than the current lower limit frequency and lower than the current upper limit frequency to pass. - BandStop: only allows the signals whose frequencies are lower than the current lower limit frequency or higher than the current upper limit frequency to pass.  Figure 9.11 Digital Filter MenuOperation Result Display Window
Click or tap the ON/OFF tab for Operation to enable or disable the display of the operation result window. The source and the vertical scale parameters are displayed at the top of the window, as shown in the figure below.  Figure 9.12 Digital Filter Operation Result Display WindowSource
Click or tap the drop-down button of Source to select CH1-CH4 or Ref1-Ref10. When a source channel is selected, the selected channel automatically switches to the ON state.TIP
In addition to CH1\~CH4 and Ref1\~Ref10, the available sources for Math2 also include Math1; the sources for Math3 also include Math1 and Math2; the sources for Math4 also include Math1, Math2, and Math3. The selected Math channel and operation status will automatically be enabled.Frequency Limit
\- LowPass: click or tap the input field of ωc and use the pop-up numeric keypad to set the upper frequency limit. You can also use the specified knob indicated in the input field to set the value. \- HighPass: click or tap the input field of ωc and use the pop-up numeric keypad to set the lower frequency limit. You can also use the specified knob indicated in the input field to set the value. \- BandPass: click or tap the input field of ωc1 and use the pop-up numeric keypad to set the lower frequency limit. Click or tap the input field of ωc2 and use the pop-up numeric keypad to set the upper frequency limit. You can also use the specified knob indicated in the input field to set the value. \- BandStop: click or tap the input field for the ωc1 menu item and use the pop-up numeric keypad to set the lower limit frequency. Click or tap the input field of ωc2 and use the pop-up numeric keypad to set the upper frequency limit. You can also use the specified knob indicated in the input field to set the value. 9.6 Parameter Settings of the Math Operation Result
After configuring the operator and source, you can adjust the math operation result waveforms with the following methods to get better view effects.Display Area
Sets where the math operation result is displayed. - Math: By default, the waveforms of math operation are displayed in the math operation result window. - Main: displays the math operation result waveforms in the waveform view.Scale
Sets the vertical scale of operation result window. To set the vertical scale, perform the following operations: - In the Math menu, rotate the specified front-panel multifunction knob indicated in the input field of Scale to increase or decrease the vertical scale. You can also click or tap the input field to input a specific value with the pop-up numeric keypad. - When you close the Math menu, you can use the pinch & stretch gesture to adjust the vertical scale. To use the multifunction knob to adjust the value, you should move the cursor to the input field before you close the menu, then the specified knob appears so that you can use the specified knob to adjust the value.Offset
Sets the vertical offset of the operation result window. set the vertical offset, perform the following operations: - In the Math menu, rotate the specified front-panel multifunction knob indicated in the input field of Offset or click/tap the icon at the right side of the input field to increase or decrease the vertical offset value. You can also click or tap the input field to input a specific value with the pop-up numeric keypad. - When you close the Math menu, you can use the drag gesture to adjust the vertical offset. To use the multifunction knob to adjust the value, you should move the cursor to the input field before you close the menu, then the specified knob appears so that you can use the specified knob to adjust the value.Auto Setting
Click or tap AutoSetting, and then the vertical scale and offset of the math operation result window will be automatically adjusted to optimal values based on the current configurations, so that users can get a better observation of the results.Invert
Sets to enable or disable the inverted display of the waveform. For setting methods, refer to descriptions in Waveform Invert. FFT operation does not support Invert.Waveform
Sets the time base region of the math operation waveform. - Main: the measurement range is within the main time base region. By default, it is Main. - Zoom: the measurement range is within the zoomed time base region. When you select "Zoom", you need to enable Zoom Mode (Delayed Sweep) in Horizontal System. FFT does not support zoom region display.Vertical Expansion
Sets the vertical expansion of the math operation result window. \- GND: when the vertical scale is changed, the math operation waveform will be expanded or compressed around the signal ground level position. \- Center: when the vertical scale is changed, the math operation waveform will be expanded or compressed around the screen center. FFT does not support Center expansion.Label
Sets whether to enable or disable the display of the math operation label of the waveform. For setting methods, refer to descriptions in Channel Label.Grid
When the Display Area is set to "Math", you can set the screen grid. For setting methods, refer to To Set the Screen Grid10 Measurements
This series oscilloscope provides the quick measurements after "Auto" is selected, auto measurements for 41 waveform parameters, as well as the cursor measurement function.10.1 Measurement Parameter
This oscilloscope supports the measurement of 41 waveform parameters, including time parameters, count values, delay and phase parameters, voltage parameters and other parameters.10.1.1 Time Parameters
 Figure 10.1 Time Parameters - Period: defined as the time between the middle threshold points of two consecutive, like-polarity edges. • Frequency: defined as the reciprocal of period. - Rise Time: indicates the time for the signal amplitude to rise from the threshold lower limit to the threshold upper limit. - Fall Time: indicates the time for the signal amplitude to rise from the threshold upper limit to the threshold lower limit. - +Width: indicates the time between the threshold middle value of a rising edge to the threshold middle value of the next falling edge. - -Width: indicates the time between the threshold middle value of a falling edge to the threshold middle value of the next rising edge. • +Duty: indicates the ratio of the positive pulse width to the period. - -Duty: indicates the ratio of the negative pulse width to the period. - Tvmax: indicates the time that corresponds to the maximum value of the waveform (Vmax). - Tvmin: indicates the time that corresponds to the minimum value of the waveform (Vmin). The default values for threshold upper limit, threshold middle value, and threshold lower limit are 90%, 50%, and 10%, respectively.10.1.2 Count Values
The default values for threshold upper limit and threshold lower limit are 90% and 10%, respectively.Positive Pulse Count
It is specified as the number of positive pulses that rise from under the threshold lower limit to above the threshold upper limit. Positive Pulse Count = n Negative Pulse Count
It is specified as the number of negative pulses that fall from above the threshold upper limit to below the threshold lower limit. Negative Pulse Count = n Rising Edge Count
It is specified as the number of rising edges that rise from under the threshold lower limit to above the threshold upper limit. Falling Edge Count
It is specified as the number of falling edges that fall from above the threshold upper limit to below the threshold lower limit. 10.1.3 Delay and Phase Parameters
 Figure 10.2 Delay and Phase Parameters 1. Delay(r-r): indicates the time difference between the threshold middle values of the rising edge of Source A and that of Source B. Negative delay indicates that the rising edge of Source A occurred after that of Source B. 2. Delay(f-f): indicates the time difference between the threshold middle values of the falling edge of Source A and that of Source B. Negative delay indicates that the falling edge of Source A occurred after that of Source B. 3. Delay(r-f): indicates the time difference between the threshold middle values of the rising edge of Source A and the falling edge of Source B. Negative delay indicates that the rising edge of Source A occurred after the falling edge of Source B. 4. Delay(f-r): indicates the time difference between the threshold middle values of the falling edge of Source A and the rising edge of Source B. Negative delay indicates that the falling edge of Source A occurred after the rising edge of Source B. 5. Phase(r-r): indicates the phase deviation between the threshold middle values of the rising edge of Source A and that of Source B. The phase formula is as follows: _ R BPhaseA _ R BDelayA Period _ sourceA Wherein, PhaseARBR represents Phase(r-r), DelayARBR represents Delay(r-r), and PeriodsourceA represents the period of Source A. 6. Phase(f-f): indicates the phase deviation between the threshold middle values of the falling edge of Source A and that of Source B. The phase formula is as follows: _ F BPhaseA _ F BDelayA Period _ sourceA ° 3 Wherein, PhaseAFBF represents Phase (f-f), DelayAFBF represents Delay(f-f), and PeriodsourceA represents the period of Source A. 7. Phase(r-f): indicates the phase deviation between the threshold middle values of the rising edge of Source A and the falling edge of Source B. The phase formula is as follows: _ R BPhaseA _ R BDelayA Period _ sourceA Wherein, PhaseARBR represents Phase (r-f), DelayARBR represents Delay(r-f), and PeriodsourceA represents the period of Source A. 8. Phase(f-r): indicates the phase deviation between the threshold middle values of the falling edge of Source A and the rising edge of Source B. The phase formula is as follows: _ F B _ R PhaseA _ F B _ R DelayA Period _ sourceA Wherein, PhaseAFBR represents Phase (f-r), DelayAFBR represents Delay(f-r), and PeriodsourceA represents the period of Source A. TIP
- Source A and Source B can be any analog channels and Math1\~Math4. • The default threshold middle value is 50%.10.1.4 Voltage Parameters
 Figure 10.3 Voltage Parameters 1. Vmax: indicates the voltage value from the highest point of the waveform to the GND. 2. Vmin: indicates the voltage value from the lowest point of the waveform to the GND. 3. Vpp: indicates the voltage value from the highest point to the lowest point of the waveform. 4. Vtop: indicates the voltage value from the flat top of the waveform to the GND. 5. Vbase: indicates the voltage value from the flat base of the waveform to the GND. 6. Vamp: indicates the voltage value from the top of the waveform to the base of the waveform. 7. Vupper: indicates the actual voltage value that corresponds to the threshold maximum value. 8. Vmid: indicates the actual voltage value that corresponds to the threshold middle value. 9. Vlower: indicates the actual voltage value that corresponds to the threshold minimum value. 10. Vavg: indicates the arithmetic average value on the whole waveform or in the gating area. The formula is shown as follows: Average = _ i = 1 ^ n x _ in Wherein, xi is the ith point, and n is the number of points being measured. 11. VRMS: indicates the root mean square value on the whole waveform or in the gating area. The formula is as follows: RMS = √ _ i = 1 ^ n x _ i ^ 2n Wherein, xi is the measurement result of the ith point, and n is the number of points being measured. 12. Per.VRMS: indicates the root mean square value within a period. The formula is as shown above. 13. Overshoot: indicates the ratio of the difference between the maximum value and the top value of the waveform to the amplitude value. 14. Preshoot: indicates the ratio of the difference between the minimum value and the base value of the waveform to the amplitude value. 15. AC RMS: indicates the root-mean-square value of the waveforms, with the DC component removed. The formula is shown as follows: Std.Dev = √ _ i = 1 ^ n ( _ i - Averagex) ^ 2 .n Wherein, xi is the amplitude of the ith point, Average is the waveform average value, and n is the number of points being measured.10.1.5 Other Parameters
\- Positive Slew Rate: On the rising edge, first calculate the difference between the high value and the low value, then use the difference to divide the corresponding time value to obtain the positive slew rate. \- Negative Slew Rate: On the falling edge, first calculate the difference between the low value and the high value, then use the difference to divide the corresponding time value to obtain the negative slew rate. \- Area: indicates the area of the whole waveform within the screen. The unit is V*s. The area of the waveform above the zero reference (namely the vertical offset) is positive, and the area of the waveform below the zero reference is negative. The area measured is the algebraic sum of the area of the whole waveform within the screen. \- Period Area: indicates the area of the first period of waveform on the screen. The unit is V*s. The area of the waveform above the zero reference (namely the vertical offset) is positive, and the area of the waveform below the zero reference is negative. The area measured is the algebraic sum of the whole period area.10.2 To Select the Measurement Item
In the Measure menu, click or tap Vertical, Horizontal, or Other to go to the desired menu. You can also slide to select the measurement item to enter the corresponding interface. Click or tap any of the measurement items to enable the specified measurements. This series oscilloscope allows you to enable measurements of up to 14 items at the same time. TIP
You can also refer to Multi-pane Windowing to enable all measurements. • Vertical: Vmax, Vmin, Vpp, Vtop, Vbase, Vamp, Vupper, Vmid, Vlower, Vavg, VRMS, Per. VRMS, AC.RMS, Overshoot, Preshoot, Area, and Period Area. - Horizontal: Period, Frequency, Rise Time, Fall Time, +Width, -Width, +Duty, -Duty, Positive Pulse Count, Negative Pulse Count, Rising Edge Count, Falling Edge Count, Tvmax, Tvmin, +Slew Rate, and -Slew Rate. - Other: Delay (r-r), Delay (r-f), Delay (f-r), Delay (f-f), Phase (r-r), Phase (r-f), Phase(f-r), and Phase (f-f). After selecting the specified measurement item, you can view the measurement results of the specified measurement item in the result list. You can click or tap the measurement results of the specified item, then its sub-menus are displayed. You can perform relevant settings, such as setting the measurement parameters and removing the measurement results.10.3 Measurement Settings
To enter the measurement setting menu, perform either of the following operations: \- In the Measure menu, click or tap the Setting button to enter the measurement setting menu. \- Click or tap any measurement item shown in the result list. Then the sub-menu is displayed. Click or tap Setting to enter the measurement setting menu.  Figure 10.4 Measurement Settings MenuMeasurement Histogram
When completing the measurement of specified parameters, you can view the data distribution of measurement results through the measurement histogram function. Click or tap the ON/OFF tab for Histogram to enable (ON) or disable (OFF) the measurement histogram function. When the measurement histogram function is enabled, the histogram waveform is displayed in the measurement histogram window. The measurement histogram result is displayed in the result list. The measurement results include the following items: - Type: indicates the measurement item. - Sum: indicates the sum of all bins (buckets) in the histogram. - Peaks: indicates the maximum number of hits in any single bin. - Max: indicates the value that corresponds to the maximum bin that has any hits. - Min: indicates the value that corresponds to the minimum bin that has any hits. - Pk_Pk: indicates the Delta between the max. value and the min. value. - Mean: indicates the average value of the histogram. • Median: indicates the median value of the histogram. - Mode: indicates the mode value of the histogram. - Bin width: indicates the width of each bin (bucket) in the histogram. - Sigma: indicates the standard deviation of the histogram. - XScale: indicates the horizontal scale of the histogram. It is 100 times the value of Bin width.Indicator
Click or tap ON or OFF for Indicator to enable or disable the indicator. If enabled, one or multiple cursors will be displayed on the screen. Before enabling the indicator, you need to at least enable one auto measurement parameter and the number of cursors will change with the measurement parameter enabled. TIP
No cursor will be displayed if no cursor measurement parameter is selected or the measurement source has no input. When the waveform is expanded or compressed horizontally, the cursor will move accordingly.Measurement Threshold
\- First, click or tap % or Abs as the display type. - Click or tap the drop-down button of Source to select the desired channel. The available channels include analog channels and Math1-Math4. \- Click or tap the input field of Upper to set the upper limit of the measurement with the pop-up numeric keypad. You can also use the specified knob to set it. When the upper limit is set to be smaller than or equal to the current middle value, a prompt message "Set at lower limit" is displayed. Then, the oscilloscope will automatically adjust the upper limit and make it greater than the middle value. By default, it is 90%. The default absolute value varies with the vertical setting of the channel. \- Click or tap the input field of Mid to set the middle value of the measurement with the pop-up numeric keypad. You can also use the specified knob to set it. The middle value is limited by the settings of the upper limit and lower limit. By default, it is 50% . The default absolute value varies with the vertical setting of the channel. \- Click or tap the input field of Lower to set the lower limit of the measurement with the pop-up numeric keypad. You can also use the specified knob to set it. When the lower limit is set to be greater than or equal to the current middle value, a prompt message "Set at upper limit" is displayed. Then, the oscilloscope will automatically adjust the lower limit and make it smaller than the middle value. By default, it is 10% . The default absolute value varies with the vertical setting of the channel. \- Click or tap Default, and then the upper value, middle value, and lower value will be restored to the defaults. Click or tap the ON/OFF tab for Threshold to enable or disable the threshold settings.TIP
Modifying the threshold will affect the measurement results of time, delay, and phase parameters.Measurement Range
Click or tap the drop-down button of Region to select "Main" or "Zoom". \- Main: indicates that the measurement range is within the main time base region. \- Zoom: indicates that the measurement range is within the zoomed time base region. "Zoom" is available to choose after you have enabled Zoom Mode (Delayed Sweep) first. \- Cursor: When CursorAB is set to ON, then two cursors will be displayed on the screen. At this time, click or tap the input field of CursorA and CursorB  respectively and use the pop-up numeric keypad to modify the cursor position and determine the measurement range. Amplitude Measurement Method
Click or tap Auto or Manual as the amplitude measurement method, which affects the measurement method for the top and base values.  If you select "Manual", set the following parameters: • Under the Top menu item, click or tap to select Histogram or Max-Min as the top value measurement method. - Under the Base menu item, click or tap to select Histogram or Max-Min as the base value measurement method. TIP
If you select "Manual" for the amplitude method, the measurement results of other parameters may be affected. "Histogram" and "Max-Min" are the internal measurement algorithm for the oscilloscope.10.4 Statistics of Measurement Results
In the measurement setting menu, you can set where to display the measurement results. You can select "Right", "Bottom", or "Both" to display the measurement results at the right section of the screen, at the bottom of the screen, or at both the right side and bottom of the screen.  Figure 10.5 Display Position of the Measurement ResultsDisplay Result Statistics of All Measurement Items
In the result list displayed at the right section of the screen, click or tap at the lower-right part of the displayed measurement item to unfold all the statistical results of the specified measurement item. Click or tap to fold all the displayed statistical results of the specified measurement item, with only the current value being displayed. In the setting menu of the specified measurement item, click or tap the ON/OFF tab for Statistic to display all statistical results or only the current value of the specified measurement item in the result list.Set the Measurement Count
In the measurement setting menu, click or tap the input field of Count to set the statistical count of with the pop-up virtual numeric keypad. You can also rotate the specified knob indicated in the input field to set it. Its range is from 2 to 100,000. Its default value is 1,000.Reset the Statistics of the Measurement Results
In the result list, click or tap any measurement item, then the sub-menus are displayed. Click or tap Reset Stat. to clear the history statistics data and makes statistics again. You can also click or tap Reset Stat. in the measurement setting menu.10.5 To Remove the Measurement Results
After completing the measurement, you can remove the specified measurement item or remove all the measurement items.Remove the Specified Measurement Item
- In the Setting menu of the specified measurement item, click or tap Remove to remove the current measurement item. - Click or tap any measurement item shown in the result list. Then the sub-menu is displayed. Click or tap Remove to remove the currently selected measurement item. - To remove the result list displayed at the right section of the screen, drag the result list of the specified measurement item to the right. To remove the result list displayed at the bottom of the screen, drag it downward to remove it.Remove All Measurement Items
- In the Setting menu, click or tap Remove All to remove all the measurement items. - Click or tap any measurement item shown in the result list. Then the sub-menu. Click or tap Remove All to remove all the displayed measurement items.10.6 Auto Measurement
When the oscilloscope is properly connected and received a valid signal, click or tap the function navigation icon at the lower-left corner of the screen to select the Auto icon to enable the waveform auto setting function and open the auto setting function menu. You can also press on the front panel to enable the waveform auto setting and open the auto setting interface.  - Click or tap the first icon, and then signal in two periods is displayed automatically on the screen. Meanwhile, the system will make measurements for the "period" and "frequency" of the currently displayed waveforms. The measurement results are displayed at the right side of the screen under the "Result" list. - Click or tap the second icon, and then multiple periods of the signal are displayed automatically on the screen. Meanwhile, the system will make measurements for the "period" and "frequency" of the currently displayed waveforms in a multiple periods. The measurement results are displayed at the right side of the screen under the "Result" list. - Click or tap the third icon, and then "rise time" measurement item is enabled. Its measurement results are displayed at the right side of the screen under the "Result" list. By default, it is intended for the fast edge signal. - Click or tap the fourth icon, and then "fall time" measurement item is enabled. Its measurement results are displayed at the right side of the screen under the "Result" list. By default, it is intended for the fast edge signal. - Click or tap the fifth icon to cancel the auto setting and recovers to the parameter settings prior to pressing the Auto key. - Click or tap the sixth icon to enter the Auto Config sub-menu under the Utility menu. For details on how to operate this menu, please refer to Auto Config. TIP
The waveform auto setting function requires that the frequency of the signal should be greater than or equal to 35 Hz, the amplitude greater than or equal to 10 mV. If not meeting the conditions, the waveform auto setting function may be invalid.10.7 Cursor Measurements
Cursor measurement can measure the X axis values (e.g. Time) and Y axis values (e.g. Voltage) of the selected waveform. Before making cursor measurements, connect the signal to the oscilloscope to acquire stable display. The cursor measurement function provides the following two cursors.  Figure 10.6 Cursors• X Cursor
X cursor is a vertical solid/dotted line that is used to make horizontal adjustments. It can be used to measure time (s) and frequency (Hz). \- Cursor A is a vertical solid line (is displayed at the bottom of the screen), and Cursor B is a vertical dotted line (is displayed at the bottom of the screen). \- In the XY cursor mode, X cursor is used to measure the waveform amplitude of Source X.- Y Cursor
Y cursor is a horizontal solid/dotted line that is used to make vertical adjustments. It can be used to measure amplitude (the unit is the same as that of the source channel amplitude). \- Cursor A is a horizontal solid line (AY) is displayed at the right section of the screen), and Cursor B is a horizontal dotted line (BY) is displayed at the right section of the screen). \- In XY cursor mode, Y cursor is used to measure the waveform amplitude of Source Y. You can enable cursor measurements in the following ways. \- Click or tap the function navigation icon measurements.  > Cursors to enable cursor \- Click or tap the Cursors button on the toolbar to enable cursor measurements. \- Press the front-panel key to enable cursor measurements. The measurement results are displayed in the "Result" bar at the right side of the screen.  - AX: indicates the X value at Cursor A. - AY: indicates the Y value at Cursor A. - BX: indicates the X value at Cursor B. • BY: indicates the Y value at Cursor B. - ΔX : indicates the horizontal spacing between Cursor A and Cursor B. - ΔY : indicates the vertical spacing between Cursor A and Cursor B. - 1 / ΔX : indicates the reciprocal of the horizontal spacing between Cursor A and Cursor B. Click or tap the result bar and then select Remove or Setting in the pop-up window. - Click or tap Remove. Then the current cursor measurement results will be cleared. - Click or tap Setting. Then the "Cursors" menu is displayed. You can select the cursor mode: Manual, Track, and XY.10.7.1 Manual Mode
In the manual cursor mode, you can adjust the cursor manually to measure the value of the waveforms of the specified source at the current cursor. If the settings for the parameter such as the cursor type and measurement source are different, the measurement results will be different for cursor measurement. In the Cursors menu, click or tap Manual for the Mode item to enable the Manual cursor measurement function. The measurement results are displayed in the result list. When you change the cursor position, the measurement results will be changed accordingly.  Figure 10.7 Manual Mode Setting MenuSelect the Measurement Source
Click or tap the drop-down button of Source to select the desired channel (None, CH1-CH4, or Math1-Math4). If the specified channel is selected as the source, the channel will be enabled automatically.Select Cursor Type
Click or tap "X" or "Y" under Select to select the cursor type. \- X: It is a pair of vertical solid (Cursor A)/dotted (Cursor B) lines, used for measuring time parameters. The measurement results include AX, BX, X, and 1/ X. \- Y: It is a pair of horizontal solid (Cursor A)/dotted (Cursor B) lines, used for measuring voltage parameters. The measurement results include AY, BY, and Δ Y.Adjust the Cursor Position
1. When "X" is selected, you can adjust the position of X cursor. \- Click or tap the input field of AX and use the pop-up numeric keypad to set the horizontal position of Cursor A (X cursors). The horizontal axis indicates time, and the unit of its setting value is the same as that of the horizontal unit. Its adjustable range is limited within the screen. \- Click or tap the input field of BX and use the pop-up numeric keypad to set the horizontal position of Cursor B (X cursors). The horizontal axis indicates time, and the unit of its setting value is the same as that of the horizontal unit. Its adjustable range is limited within the screen. \- Click or tap the AX BX on/off switch to turn on/off adjusting the horizontal position of Cursor A and Cursor B (X cursors) simultaneously. The horizontal spacing between Cursor A and Cursor B (X cursors) remains unchanged. 2. When "Y" is selected, you can adjust the position of Y cursor. \- Click or tap the input field of AY, and then use the pop-up numeric keypad to set the vertical position of Cursor A (Y cursors). The vertical axis indicates voltage, and the unit of its setting value is the same as that of the vertical unit. \- Click or tap the input field of BY and use the pop-up numeric keypad to set the vertical position of Cursor B (Y cursor). The vertical axis indicates voltage, and the unit of its setting value is the same as that of the vertical unit. \- Click or tap the AY BY on/off switch to turn on/off adjusting the vertical position of Cursor A and Cursor B (Y cursors) simultaneously. The vertical spacing between Cursor A and Cursor B (Y cursors) remains unchanged. You can also use the multifunction knob on the front panel to adjust the cursor position.Minimize the Cursor Setting Window
Click or tap the ON/OFF tab for Minimize to select whether to minimize the window. When you select ON, the cursor setting window will be minimized and displayed the cursor menu at the right section of the screen, making the waveform view look more simplified and concise. When you select OFF, the cursor setting menu window is displayed on the screen. In the minimized window, click or tap Max to maximize the cursor setting window, and it will be displayed on the main screen again. Click or tap Close to close the window.Measurement Example
Measure the period of a sine wave by using the manual cursor measurement and auto measurement respectively. The measurement results are both 8 µ s.  Figure 10.8 Manual Cursor Measurement Example10.7.2 Track Mode
In the Track mode, you can adjust the two pairs of cursors (Cursor A and Cursor B) to measure the X and Y values on two different sources respectively. When the cursors are moved horizontally/vertically, the markers will position on the waveform automatically. When the waveform is expanded or compressed horizontally/vertically, the markers will track the points being marked at the last adjustment of the cursors. In the Cursors menu, click or tap Track for the Mode item to enable the Track cursor measurement function. The measurement results are displayed in the result list.  Figure 10.9 Track Mode Setting MenuSelect the Measurement Source
- Click or tap the drop-down button of Source A to select the desired channel (None, CH1-CH4, or Math1-Math4). - Click or tap the drop-down button of Source B to select the desired channel (None, CH1-CH4, or Math1-Math4). If the specified channel is selected as the source, the channel will be enabled automatically.Select the Track Mode
Click or tap the Track toggle button to select "X" or "Y" as the current track axis. By default, it is "X". • X: When the X cursor position is adjusted, Y cursor will automatically track the intersection point between X cursor and source signal - Y: When the Y cursor position is adjusted, X cursor will automatically track the intersection point between Y cursor and source signal.Adjust the Cursor Position
\- When "X" is selected for the track mode, you can adjust the position of X cursor. \- Click or tap the input field of AX and use the pop-up numeric keypad to set the horizontal position of Cursor A (X cursor). Its adjustable range is limited within the screen. - Click or tap the input field of BX and use the pop-up numeric keypad to set the horizontal position of Cursor B (X cursors). Its adjustable range is limited within the screen. - Click or tap the ON/OFF tab for AX BX to adjust the horizontal positions of Cursor A and Cursor B (X cursors) simultaneously. The horizontal spacing between Cursor A and Cursor B (X cursors) remains unchanged. \- When "Y" is selected for the track mode, you can adjust the position of Y cursor. - Click or tap the input field of AY and use the pop-up numeric keypad to set the vertical position of Cursor A (Y cursor). - Click or tap the input field of BY and use the pop-up numeric keypad to set the vertical position of Cursor B (Y cursor). - Click or tap the ON/OFF tab for AY BY to adjust the vertical positions of Cursor A and Cursor B (Y cursors) simultaneously. The vertical spacing between Cursor A and Cursor B (Y cursors) remains unchanged. You can also use the multifunction knob on the front panel to adjust the cursor position.Minimize the Cursor Setting Window
Click or tap the ON/OFF tab for Minimize to select whether to minimize the window. When you select ON, the cursor setting window will be minimized and displayed the cursor menu at the right section of the screen, making the waveform view look more simplified and concise. When you select OFF, the cursor setting menu window is displayed on the screen. In the minimized window, click or tap Max to maximize the cursor setting window, and it will be displayed on the main screen again. Click or tap Close to close the window.Measurement Example
Set Source A to CH1, Source B to CH2, and Track to "X". When you adjust the AX cursor position, the AY cursor will automatically track the crossing point between AX cursor and the waveform of the specified channel (CH1); When you adjust the BX cursor position, the BY cursor will automatically track the crossing point between the BX cursor and the waveform of the specified channel (CH2). The measurement results are displayed in the result list, as shown in Figure 10.10. Then, expand the waveforms horizontally, and you will find that the cursor will track the point that has been marked, as shown in Figure 10.11.  Figure 10.10 Track Measurement (before Horizontal Expansion)  Figure 10.11 Track Measurement (after Horizontal Expansion)10.7.3 XY Mode
In the Cursors menu, click or tap XY for the Mode item to enable the XY cursor measurement function. The measurement results are displayed in the result list.  Figure 10.12 XY Mode Setting Menu TIP
By default, XY mode is unavailable. It is only available when the horizontal time base mode is "XY". To enable the XY mode, please refer to XY Mode.Adjust the Cursor Position
\- Click or tap to select the "X" tab under the Select menu item to set the X value for the specified cursor. - Click or tap the input field of the X value at Cursor A. AX and use the pop-up numeric keypad to set - Click or tap the input field of BX and then use the pop-up numeric keypad to set the X value at Cursor B. - Click or tap to select "ON" for the AX BX menu item to adjust the X value at Cursor A and the X value at Cursor B simultaneously. \- Click or tap to select the "Y" tab under the Select menu item to set the Y value for the specified cursor. - Click or tap the input field of AY and use the pop-up numeric keypad to set the X value at Cursor A. - Click or tap the input field of BY and then use the pop-up numeric keypad to set the X value at Cursor B. - Click or tap to select "ON" for the AY BY menu item to adjust the Y value at Cursor A and the Y value at Cursor B simultaneously. You can also use the multifunction knob on the front panel to adjust the cursor position.Minimize the Cursor Setting Window
Click or tap the ON/OFF tab for Minimize to select whether to minimize the window. When you select ON, the cursor setting window will be minimized and displayed the cursor menu at the right section of the screen, making the waveform view look more simplified and concise. When you select OFF, the cursor setting menu window is displayed on the screen. In the minimized window, click or tap Max to maximize the cursor setting window, and it will be displayed on the main screen again. Click or tap Close to close the window.11 Digital Voltmeter (DVM) and Frequency Counter
This series oscilloscope provides a built-in digital voltmeter (DVM) and frequency counter, which enable you to perform more accurate measurements, improving user experience in counter and frequency measurement.11.1 Digital Voltmeter (DVM)
The built-in DVM of this series oscilloscope provides 4-digit voltage measurements on any analog channel. DVM measurements are asynchronous from the oscilloscope's acquisition system and are always acquiring. To enable the DVM measurement, perform the following operations: - Click or tap the function navigation icon > DVM to enable DVM measurements. - Click or tap the DVM button on the toolbar to enable DVM measurements. - Press the front-panel Analyse key and then select DVM in the displayed "Analyse" menu to enable the DVM measurements. After the DVM measurement is enabled, the "DVM" label displaying the current voltage value and voltage mode appears in the "Result" list at the right section of the screen, as shown in the figure below.  The voltage value above shows the measurement extrema over the last 3 seconds. Click or tap the "DVM" label and then a window is displayed. Click or tap Setting to enter the DVM setting menu. Click or tap Remove to remove the DVM measurement results and exit the DVM measurement.11.1.1 Measurement Settings
After the DVM measurement is enabled, the DVM result list is displayed. Click or tap the result list, the sub-menus are displayed. Click or tap Setting to enter the DVM setting menu.  Figure 11.1 DVM Setting MenuSelect the Measurement Source
Click or tap the drop-down button of Source to select the desired source from the drop-down list. The analog channel (CH1\~CH4) can be selected to be the measurement source. Even if the analog channel (CH1\~CH4) is not enabled, you can still perform the DVM measurement.Select the Measurement Mode
In the Mode item, you can select the DVM mode. The DVM measurement modes include AC RMS, DC, and AC+DC RMS. - AC RMS: displays the root-mean-square value of the acquired data, with the DC component removed. - DC: displays the average value of the acquired data. - AC+DC RMS: displays the root-mean-square value of the acquired data.Set the Limits
Click or tap the ON/OFF tab for Beeper to enable or disable the beeper. When enabled, you can set when ("In Limits" or "Out Limits") to sound an alarm. \- Limits Condition Setting Click or tap to select the desired condition under the When menu. The limits conditions include "In Limits" and "Out Limits". \- In Limits: when the voltage value is within the limits, you can enable or disable the beeper to sound an alarm. \- Out Limits: when the voltage value is outside of the limits, you can enable or disable the beeper to sound an alarm. • Upper/Lower Limit Setting Click or tap the input field of Upper to set the upper limit of the voltage with the pop-up numeric keypad. You can also use the specified knob to set it. Click or tap the input field of Lower to set the lower limit of the voltage with the pop-up numeric keypad. You can also use the specified knob to set it. The available range of the upper limit is from 1 nV to 500 V. By default, it is 1 V. The available range of the lower limit is from -500 V to 990.00 mV. By default, it is 0 V.11.1.2 To Remove the Measurement
Click or tap the DVM label in the result list, then the sub-menus are displayed. Click or tap Remove to remove the measurement results and exit the DVM measurement. You can also click or tap Remove in the DVM setting menu to remove the measurement results.11.2 Frequency Counter
The frequency counter analysis function provides frequency, period, or edge event counter measurements on any analog channel. You can enable the counter in the following ways: - Click or tap 📋 > Counter to enable the counter. - Click or tap the Counter button on the toolbar to enable the counter. - Press the front-panel key and then select Counter in the displayed "Analyse" menu to enable the counter. After the counter is enabled, the "Counter" label displaying the counter measurement results appears in the "Result" bar at the right section of the screen, as shown in the figure below.  You can click or tap the "Counter" label in the "Result" bar and select Reset Stat, Setting, or Remove in the displayed window.11.2.1 Measurement Settings
After the frequency counter is enabled, the frequency counter result list is displayed. Click or tap the result list, and then select Setting. Then the frequency counter interface is displayed.  Figure 11.2 Frequency Counter Setting MenuSelect the Measurement Source
Click or tap the drop-down button of Source to select the desired source from the drop-down list. Analog channels, digital channels, and EXT can all be selected as the source of the frequency counter.Select the Measurement Item
In the Measure item, you can select the desired measurement item. Available options include Frequency, Period, and Totalize. Wherein, Totalize indicates the count of edge events on the signal.Set the Resolution
For Period and Frequency measurements, you need to set the readout resolution. Click or tap the input field of Resolution to set the resolution with the pop-up numeric keypad. You can also use the specified knob to set it. The range of resolution is from 3 bits to 6 bits. By default, it is 4 bits. The greater the resolution, the longer the gate time. In this way, the measurement time will be longer.Clear Count
When "Totalize" is selected as the measurement item, the oscilloscope measures the count of edge events on the signal. At this time, click or tap Clear Count to clear the measurement results and start the measurements again.Disable the Frequency Counter
After completing the measurement, click or tap Remove in the frequency counter setting interface to disable the frequency counter. All the frequency counter menu and statistics results are closed. You can also click or tap the result list, then click or tap Remove from the displayed sub-menus to clear the measurement result. The frequency counter result list disappears.11.2.2 To Reset Statistics
Statistics Results
In the Counter setting menu, click or tap the ON/OFF tab for Statistic to enable or disable the display of the counter statistics. When enabled, all the statistical results will be displayed in the "Counter" result list.Reset Statistics
Click or tap Reset Stat. in the Counter setting interface to reset the statistics of the counter measurement results. You can also click or tap the Counter result list first. Then the sub-menus are displayed. Click or tap Reset Stat. to reset the statistics of the counter measurement results.12 Digital Channel
MHO2000 series oscilloscope provides the standard configuration of the logic analyzer (LA) function. It has 16 digital channels, with D3-D0 as one group, D7-D4 as one group, D11-D8 as one group, D15-D12 as one group. The oscilloscope compares the voltages acquired in each sample with the preset logic threshold. If the voltage of the sample point is greater than the logic threshold, it will be stored as logic "1"; otherwise, it will be stored as logic "0". The oscilloscope displays logic levels ("1" and "0") in the form of a graph for you to easily detect and analyze the errors in circuit design (hardware design and software design). To enter the Logic Analyzer (LA) menu, perform one of the following operations: - Press LA I or LA II key on the front panel to enter the LA menu. - Click or tap the "L" label at the bottom of the screen to enter the logic analyzer (LA) menu. Before using the digital channels, connect the PLA3204 active logic analyzer probe (option, required to purchase by yourself) to the oscilloscope and the device under test (DUT). For details about how to use the PLA3204 probe, refer to descriptions in PLA3204 Active Logic Probe User Guide.12.1 Basic Settings
In the Basic Settings tab, you can enable or disable the specified digital channel, set the channel label, and set the threshold for the channel.  Figure 12.1 Basic Settings Tab of Logic Analyzer Interface12.1.1 To Enable or Disable the Digital Channel
The LA function allows you to enable or disable all the channels of the specified group; enable or disable each single digital channel. The digital channel label at the bottom of the screen displays the on/off status of the digital channel. The channels indicated in gray are disabled and those indicated in green are enabled. Enable or Disable a Single Channel
You can click or tap the ON/OFF tab following the specified digital channel to enable or disable any of digital channels (D0-D15).TIP
When the specified group of digital channels is enabled or disabled, you can still set the on/off status independently for the specified channel in this group.Enable or Disable the Channels of a Specified Group
In the LA interface, you can enable or disable all the digital channels in the specified group with the global on/off tab for the specified group (D15-D12, D11-D8, D7-D4, or D3-D0).On/Off Control of All Channels
When some digital channels have been enabled and you want to disable all the enabled channels, click to drag the digital channel label downward. You can also drag it downward on the touch screen to disable all the enabled digital channels.12.1.2 To Set the Label
By default, the instrument takes D0-D15 as the channel label of the 16 digital channels respectively. You can set a user-defined label for each digital channel to differentiate the channel and their input signal.Enable or Disable the Label Display
Click or tap the ON/OFF tab for the channel label to display or hide the channel label of the specified group channel. If enabled, the labels of the specified channel group will be displayed at the leftmost side of the waveform view.Use Preset Labels
This oscilloscope presets the common signal type names for the channel label, including ACK, ADO, ADDR, BIT, CAS, CLK, and DATA. Click or tap the drop-down button of the specified channel label name to select the preset channel label for the channel.Set the User-defined Label
To set a user-defined label for the channel, click or tap to select User from the dropdown list, then you can use the pop-up numeric keypad to set the channel label.12.1.3 To Select the Digital Channel
When the digital channels are enabled, click or tap the digital channel label or the channel waveforms on the screen to select the specified channel. By default, the waveforms of the digital channels are displayed in green. When you click or tap the specified channel label or waveform of the specified channel, the selected waveform of the channel is displayed in red. TIP
Only the enabled digital channels can be selected.12.1.4 To Set the Threshold
The MHO series oscilloscope allows you to set the threshold for each group of digital channels. The threshold levels for the four groups (D15-D12, D11-D8, D7-D4, and D3-D0) of digital channels are set independently. When the voltage of the input signal is greater than the currently set threshold, it is treated as logic 1; otherwise, it is treated as logic 0.Use the Preset Threshold
To facilitate operation, the system has preset the threshold for the common signals, including TTL(1.4 V), CMOS5.0(2.5 V), CMOS3.3(1.65 V), CMOS2.5(1.25 V), CMOS1.8(0.9 V), ECL(-1.3 V), PECL(3.7 V), and LVDS(1.2 V). Click or tap the drop-down button of Thres to select the desired preset threshold for the channel group.Set the User-defined Threshold
To set a user-defined threshold for the channel, click or tap the drop-down button of Thres to select "User". Then set the threshold with the pop-up numeric keypad. The range of the threshold is from -15 V to 15 V.12.2 Other Settings
In the Other Settings tab, you can set the waveform size of the digital channels, the channel sequence, probe delay, probe calibration, and etc.  Figure 12.2 "Other Settings" Tab of Logic Analyzer Interface12.2.1 To Set the Waveform Size
This series oscilloscope allows you to set the waveform size for the digital channels. If you need to observe several waveforms of the digital channels, you can set the waveform size to small, medium, and large to make them easy to observe. TIP
"Large" is only available when the number of currently enabled digital channels is less than or equal to 8.12.2.2 To Set the Channel Sequence
You can set the waveform sequence for the enabled channels according to your needs. - D0-D15: the waveforms of D0-D15 are displayed in sequence on the screen in the waveform view. - D15-D0: the waveforms of D15-D0 are displayed in sequence on the screen in the waveform view. You can also drag the waveform of the specified digital channel to a specified position to adjust the channel waveform sequence.12.2.3 Priority of the Waveform Display
When the waveform of the digital channel and that of the analog channel are overlapped, you can enable or disable the priority of the waveforms of the analog channels and the digital channels to be displayed. \- When set to OFF, the waveform of the analog channel is displayed in high priority. The waveforms of the digital channels are overlaid. \- When set to ON, the waveform of the digital channel is displayed in high priority. The waveforms of the analog channels are overlaid.12.2.4 To Set the Probe Delay
To avoid measurement result errors arising from the transmission delay of the probe cable, you can set the probe delay on the oscilloscope. In the LA interface, click or tap the Other Settings tab to enter the other settings interface. Click or tap the input field of Probe Delay to set the probe delay with the pop-up numeric keypad. Its range is from -200 ns to 200 ns. By default, it is set to 0 s. You can also use the Up/Down arrow to adjust the probe delay. Also, if no probe delay is required, you can directly click or tap 0 to reset it to zero.13 Histogram Analysis
The histogram analysis function provides you a statistical view of the waveforms or measurement results, enabling you to judge the trend of waveforms, and quickly locate the potential problems of the signal. This series oscilloscope supports horizontal histogram, vertical histogram and and measurement histogram. Click or tap the function navigation icon 📋 at the lower-left corner of the screen, and then select Histogram to enter the histogram setting menu.  Figure 13.1 Histogram Setting Menu13.1 To Enable or Disable the Histogram
In the "Histogram" setting menu, click or tap the ON/OFF tab for Enable to enable or disable the histogram analysis function. When enabled, with the on-going acquisition and measurement of the waveforms, the height of the bar graph of the histogram will change within the set range of the histogram window to indicate the number of times for data statistics. Here takes the horizontal histogram as an example. When enabled, the histogram is displayed on the screen as shown in the figure below. The histogram result is displayed in the "Result" list at the right section of the screen.  Figure 13.2 Histogram Analysis Interface When the histogram is enabled, click or tap the histogram result list, the sub-menus of histogram are displayed. Click or tap Setting to enter the histogram setting interface. TIP
For the definitions of the measurement items in the histogram result, refer to Histogram Analysis Results.13.2 To Select the Histogram Type
In the "Histogram" setting menu, click or tap the drop-down button of Type to select the histogram type from the drop-down list. \- Horizontal: displays the number of times for statistics making in the forms of columns in the histogram bar graph at the bottom of the graticule. • Vertical: displays the number of times for statistics making in the forms of rows in the histogram bar graph at the left of the graticule.13.3 To Select the Histogram Source
In the Histogram setting menu, click or tap the drop-down button of Source to select the desired source from the drop-down list. All the analog channels can be selected to be the Histogram source.13.4 To Set the Histogram Height
The histogram height indicates the number of grids that fall into the bar of the histogram graph. In the histogram setting interface, click or tap the input field of Height to set the height of the histogram with the pop-up numeric keypad.. The range of the histogram height is from 1 div to 4 div. By default, it is 2 div.13.5 To Set the Histogram Range
When the histogram type is set to Vertical or Horizontal, you need to set the histogram range. Set "Left Limit", "Right Limit", "Top Limit", and "Bottom Limit" respectively to adjust the size and position of the histogram. Click or tap the input field of the specified limit to set the limit of the histogram with the pop-up numeric keypad. You can also use the specified knob indicated in the input field of the specified limit to set it. You also directly drag the left, right, top, or bottom edge of the white histogram diagram window to adjust the position and size the histogram. NOTE
The adjustment for the horizontal time base and vertical scale will not affect the histogram range, but only shows variation with the change of the scale.13.6 Histogram Analysis Results
When the histogram function is enabled, the histogram result is displayed in the "Result" list at the right section of the screen. The test result includes the following test items: - Sum: indicates the sum of all bins (buckets) in the histogram. - Peaks: indicates the maximum number of hits in any single bin. - Max: indicates the value that corresponds to the maximum bin that has any hits. - Min: indicates the value that corresponds to the minimum bin that has any hits. - Pk_Pk: indicates the Delta between the max. value and the min. value. - Mean: indicates the average value of the histogram. • Median: indicates the median value of the histogram. - Mode: indicates the mode value of the histogram. - Bin width: indicates the width of each bin (bucket) in the histogram. - Sigma: indicates the standard deviation of the histogram. - µ ± σ : indicates the proportion of the number of frequencies or counts of the histogram hits that lie within one standard deviation of the mean to the total number of histogram hits. µ indicates the mean value in normal distribution. It is the average of the numbers. σ indicates the standard deviation in the normal distribution. \- µ ± 2σ : indicates the proportion of the number of frequencies or counts of the histogram hits that lie within two standard deviations of the mean to the total number of histogram hits. µ indicates the mean value in normal distribution. It is the average of the numbers. σ indicates the standard deviation in the normal distribution. \- µ ± 3σ : indicates the proportion of the number of frequencies or counts of the histogram hits that lie within three standard deviations of the mean to the total number of histogram hits. µ indicates the mean value in normal distribution. It is the average of the numbers. σ indicates the standard deviation in the normal distribution.13.7 To Remove the Measurement
\- Click or tap the histogram result list, then the sub-menus of the histogram function are displayed. Click or tap Remove to remove the measurement results and close the histogram result list and exit the histogram function. \- Click or tap to drag the result list to the right, then release it to remove the measurement results and exit the histogram function.13.8 To Clear Statistics
Click or tap the histogram result list, then the sub-menus of the histogram function are displayed. Click or tap Clear to clear the statistics.14 Function/Arbitrary Waveform Generator (Option)
With an optional configuration of built-in 50 MHz Function/Arbitrary Waveform Generator (AFG), the MHO2000 series integrates the Function/Arbitrary Waveform Generator and the oscilloscope into one, thus providing great convenience for engineers who need to use the Function/Arbitrary Waveform Generator and oscilloscope at the same time. This chapter introduces how to use the built-in Function/Arbitrary Waveform Generator option. To enable the AFG function, perform any of the following operations: - Press GI or GII on the front panel to enable GI or GII, then enter the specified setting interface. - Click or tap the GI or GII label at the bottom of the screen to enter the specified AFG setting interface. The on/off status of the specified AFG channel is indicated in its label color. When enabled, the label is highlighted in orange, with output waveform information on it. When disabled, the label is grayed out.  To disable the AFG function, press or on the front panel to disable GI or GII. You can also click or tap the enabled GI or GII label at the bottom of the screen to exit the specified AFG interface. Also, you can drag the label downward to disable the enabled AFG channel and exit the specified AFG interface.14.1 To Output Basic Waveforms
 Figure 14.1 AFG Menu The front-panel GI and GII can output different waveform types at the same time. You can set parameters for GI and GII output channels respectively. The built-in AFG (GI and GII) can output various types of waveforms. \- Standard waveforms: Sine, Square, Ramp, Pulse, and Noise • Built-in waveforms: DC, Sinc, Exp.Rise, Exp.Fall, ECG1, Gauss, Lorentz, and Haversine After completing the waveform parameter settings, set Output to "ON". The waveforms set in the AFG interface can be output from the specified front-panel AFG channel (G1 or GII).14.1.1 Sine
In the Basic Waveforms tab, click or tap the drop-down button of Type to select "Sine". Then you can set the Sine parameters. At this time, you can set the parameters for the Sine waveform.Set the Frequency/Period
Click or tap the input field of Freq/Period to set the frequency or period of the current Sine signal with the pop-up numeric keypad. You can also use the specified knob indicated in the input field to set it. Different waveforms have different frequency or period (reciprocal of the frequency) ranges. • Sine: 1 μHz to 50 MHz • Square/Pulse: 1 μHz to 30 MHz - Ramp: 1 µ Hz to 2 MHz - DC and Noise: no frequency parameter.Set the Amplitude
Click or tap the input field of Amp to set the amplitude of the current Sine signal with the pop-up numeric keypad. You can also use the specified knob indicated in the input field to set it. The amplitude range of the Sine waveform is as follows: • 2 mVpp to 10 Vpp (1 MΩ) • 1 mVpp to 5 Vpp (50 Ω)Set the Offset
Click or tap the input field of Offset to set the offset of the current Sine signal with the pop-up numeric keypad. You can also use the specified knob indicated in the input field to set it. The offset range is from 1 nV to 1 µ V. - -9 V to 9 V (1 MΩ) - -4.5 V to 4.5 V (50 Ω)Set the High/Low Level
In the amplitude and offset setting of the output waveform, you can also click or tap to select HighL or LowL to set the high level and low level of the output waveforms. - Amplitude = (High Level - Low Level)/2 - Offset = (High Level + Low Level)/2 The available range of high level is from -2.5 V to +10 V. By default, it is 1 V. The available range of low level is from -10 V to +2.5 V. By default, it is -1 V.Set the Start Phase
Click or tap the input field of Phase to set the start phase with the pop-up numeric keypad. You can also use the specified knob indicated in the input field to set it. The available range of start phase is from 0° to 360° . By default, it is 0° .Align Phase
Click or tap Align Phase to re-configure the two channels to output according to the set frequency and phase. If these two signals whose frequencies are identical or in multiple, you can click or tap this menu to align their phases. Use the oscilloscope to acquire the waveforms of the two channels and stably display the waveforms. After switching the channel status, the phase deviation between the two waveforms is changed. At this time, click or tap Align Phase, then the phase deviation shown on the oscilloscope will restore to the current phase deviation between the two waveforms automatically.14.1.2 Square
In the Basic Waveforms tab, click or tap the drop-down button of Type to select "Square". Then you can set the Square parameters. At this time, you can set the parameters for the Square waveform. Refer to Sine to set the frequency, phase, amplitude, and offset parameters. This section will only elaborate on how to set the duty cycle.Set the Duty Cycle
Duty cycle is defined as the percentage that the high level takes up in the whole period, as shown in the figure below. This parameter is only available when Square is selected.  Click or tap the of input field of Duty to set the duty cycle with the pop-up numeric keypad. You can also use the specified knob indicated in the input field to set it. The available range of duty cycle is from 1% to 99%. By default, it is 50%.14.1.3 Ramp
In the Basic Waveforms tab, click or tap the drop-down button of Type to select "Ramp". Then you can set the Ramp parameters. At this time, you can set the parameters for the ramp waveform. Refer to Sine to set the frequency, phase, amplitude, and offset parameters. This section will only elaborate on how to set the symmetry.Symmetry
Symmetry is defined as the percentage that the rising period of the ramp takes up in the whole period (as shown in the figure below). This parameter is only available when Ramp is selected.  Click or tap the of input field of Symm to set the symmetry with the pop-up numeric keypad. You can also use the specified knob indicated in the input field to set it. The available range of symmetry is from 0.1% to 99.9%. By default, it is 50%.14.1.4 Pulse
In the Basic Waveforms tab, click or tap the drop-down button of Type to select "Pulse". Then you can set the Pulse parameters. Refer to Sine to set the frequency, phase, amplitude, and offset parameters. For the duty cycle, refer to descriptions in Square. This section only elaborates on how to set the rising edge and falling edge. The rising edge time is defined as the duration of the pulse amplitude rising from 10% to 90% threshold, while falling edge time is defined as the duration of the pulse amplitude moving down from 90% to 10% threshold.  Click or tap the input field of Rise Edge to set the pulse rising edge time. Click or tap the input field of Fall Edge to set the pulse falling edge time with the pop-up numeric keypad. You also use the specified knob indicated in the input field to set the rising and falling edge time. The rising/falling edge time ranges from 1 ps to 1 s. By default, it is 300 ps.14.1.5 Noise
In the Basic Waveforms tab, click or tap the drop-down button of Type to select "Noise". Then you can set Noise parameters. You can click or tap Amp to set the amplitude of Noise waveform. Its available range is from 2 mV to 2 V . Click or tap Offset to set the offset of the Noise waveform. The range of the offset is related to its amplitude value. You can also click or tap to switch to the HighL and LowL tab to set the high level and low level of the Noise waveform. For details, refer to descriptions in Sine.14.1.6 DC
In the Basic Waveforms tab, click or tap the drop-down button of Type to select "DC". Then you can set the DC parameters. Click or tap the input field of Offset to set the offset of the DC signal with the pop-up numeric keypad. You can also use the specified knob indicated in the input field to set it. The available range of offset is from -10 V to 10 V.14.1.7 Exp.Rise
The Exp.Rise waveform is as shown in the figure below  Figure 14.2 Exp.Rise In the Basic Waveforms tab, click or tap the drop-down button of Type to select "Exp.Rise". Then set the Exp.Rise parameters. For setting methods, refer to descriptions in Sine.14.1.8 Exp.Fall
The Exp.Fall waveform is as shown in the figure below.  Figure 14.3 Exp.Fall In the Basic Waveforms tab, click or tap the drop-down button of Type to select "Exp.Fall". Then set the Exp.Fall parameters. For setting methods, refer to descriptions in Sine.14.1.9 ECG1
The ECG1 waveform is as shown in the figure below  Figure 14.4 ECG1 In the Basic Waveforms tab, click or tap the drop-down button of Type to select "ECG1". Then set the ECG1 parameters. For setting methods, refer to descriptions in Sine.14.1.10 Gauss
The Gauss waveform is as shown in the figure below:  Figure 14.5 Gauss In the Basic Waveforms tab, click or tap the drop-down button of Type to select "Gauss". Then set the Gauss parameters. For detailed setting methods, refer to descriptions in Sine.14.1.11 Lorentz
The Lorentz waveform is as shown in the figure below:  Figure 14.6 Lorentz In the Basic Waveforms tab, click or tap the drop-down button of Type to select "Lorentz". Then set the Lorentz parameters. For detailed setting methods, refer to descriptions in Sine.14.1.12 Haversine
The Haversine waveform is as shown in the figure below:  Figure 14.7 Haversine In the Basic Waveforms tab, click or tap the drop-down button of Type to select "Haversine". Then set the Haversine parameters. For detailed setting methods, refer to descriptions in Sine.14.1.13 Sinc
The Sinc waveform is as shown in the figure below  Figure 14.8 Sinc In the Basic Waveforms tab, click or tap the drop-down button of Type to select "Sinc". Then set the Sinc parameters. For setting methods, refer to descriptions in Sine.14.2 Modulation
Modulation is a process of converting analog or digital signals into high-frequency signals that are suitable for transmission. We called the original signal as the modulating waveform; the high-frequency signal used to carry the modulating signal is called the carrier waveform. The AFG function supports AM, FM, and PM modulation types. The modulating signal is the built-in waveform of AFG; the carrier waveform signal is the basic waveform output by the AFG. In the AFG interface (G1 or G2), click or tap the Modulation tab to enter the modulation setting menu.  Figure 14.9 Modulation Setting Interface Please configure the modulation settings according to the following procedures. 1. In the Basic Waveforms tab, click or tap ON to enable the output for the specified channel. 2. Click or tap the drop-down button of Type to select the desired waveform type. Then configure the parameter settings for the selected waveform type. For details of the parameter configurations, refer to To Output Basic Waveforms. The DC, Noise, and Pulse waveforms are not supported as carrier waveforms. If you select those waveforms that are not supported as the carrier waveforms, the modulation function is unavailable. 3. Click or tap the drop-down button of Mod Type to select the desired modulation type. Then configure the parameter settings for the selected modulation type. 4. Set the Mod. State to "ON". The modulated signal can be output from the specified front-panel AFG channel (G1 or G2). The following section introduces the three modulation types.14.2.1 AM
AM (Amplitude Modulation), namely the amplitude of the carrier waveform changes with that of the modulating waveform, as shown in the figure below.  Figure 14.10 AMSelect the Modulation Type
Click or tap the drop-down button of Mod. Type to select "AM".Select the Modulating Waveform
The instrument uses the built-in signal to perform waveform modulation. Click or tap the drop-down button of Waveform to select the modulating waveform. The available waveform types include: - Sine • Square with 50% duty cycle • Triangle with 50% symmetry - UpRamp with 100% symmetry • DnRamp with 0% symmetry - Noise - white gaussian noiseSet the Modulation Depth
Modulation depth is a percentage that represents the amplitude variation. Click or tap the input field of Mod. Depth to set the modulation depth with the pop-up numeric keypad. You can also use the specified knob indicated in the input field to set it. The available range of the modulation depth is from 0% to 120%. By default, it is 100%. - At 0% depth, the output amplitude is half of the carrier waveform amplitude. - At 100% depth, the amplitude is identical to the carrier's amplitude setting. - At >100% depth, the output amplitude of the instrument will not exceed 10 Vpp.Set the Modulation Frequency
When you select the modulating waveforms other than Noise, you can set the modulation frequency. Click or tap the input field of Mod. Freq to set the modulation frequency with the pop-up numeric keypad. You can also use the specified knob indicated in the input field to set it. The available range of the AM frequency is from 2 mHz to 1 MHz.Enable the Modulation Output
Click or tap ON for Mod. State to enable the modulation function. In the Basic Waveforms interface, click or tap ON for Output to enable the waveform output. Then the modulated waveforms will be output from the specified AFG terminal based on the settings.DSSC
Click or tap ON for DSSC to enable the DSSC function. It can remove the carrier components from the output signal, improve the bandwidth usage, and improve the efficiency of transmission power.14.2.2 FM
FM (Frequency Modulation), namely the frequency of the carrier waveform changes with the voltage of the modulating waveform.  Figure 14.11 FMSelect the Modulation Type
Click or tap the drop-down button of Mod. Type to select "FM".Select the Modulating Waveform
The instrument uses the built-in signal to perform waveform modulation. Click or tap the drop-down button of Waveform to select the modulating waveform. The available waveform types include: - Sine • Square with 50% duty cycle • Triangle with 50% symmetry - UpRamp with 100% symmetry • DnRamp with 0% symmetry - Noise - white gaussian noiseSet the Frequency Deviation
It represents the peak variation in frequency of the modulated waveform from the carrier frequency. Click or tap the input field of Deviation to set the frequency deviation with the pop-up numeric keypad. You can also use the specified knob indicated in the input field to set it. The settable FM frequency deviation range is from 2 mHz to the current frequency of the carrier waveform. TIP
The frequency deviation plus the carrier frequency must be less than or equal to the selected carrier's maximum frequency.Set the Modulation Frequency
When you select the modulating waveforms other than Noise, you can set the modulation frequency. Click or tap the input field of Mod. Freq to set the modulation frequency with the pop-up numeric keypad. You can also use the specified knob indicated in the input field to set it. The available range of the FM frequency is from 2 mHz to 1 MHz.Enable the Modulation Output
Click or tap ON for Mod. State to enable the modulation function. In the Basic Waveforms interface, click or tap ON for Output to enable the waveform output. Then the modulated waveforms will be output from the specified AFG terminal based on the settings.14.2.3 PM
PM (Phase Modulation), namely the phase of the carrier waveform changes with the voltage of the modulating waveform.  Figure 14.12 PMSelect the Modulation Type
Click or tap the drop-down button of Mod. Type to select "PM".Select the Modulating Waveform
The instrument uses the built-in signal to perform waveform modulation. Click or tap the drop-down button of Waveform to select the modulating waveform. The available waveform types include: - Sine • Square with 50% duty cycle • Triangle with 50% symmetry - UpRamp with 100% symmetry • DnRamp with 0% symmetry - Noise - white gaussian noiseTo Set the Phase Deviation
The phase deviation represents the peak variation in phase of the modulated waveform from the carrier waveform. Click or tap the input field of Phase Dev to set the phase deviation with the pop-up numeric keypad. You can also use the specified knob indicated in the input field to set it. The available setting range of the phase deviation is from 0° to 360°. By default, it is 90°.Set the Modulation Frequency
When you select the modulating waveforms other than Noise, you can set the modulation frequency. Click or tap the input field of Mod. Freq to set the modulation frequency with the pop-up numeric keypad. You can also use the specified knob indicated in the input field to set it. The available range of the PM frequency is from 2 mHz to 1 MHz.Enable the Modulation Output
Click or tap ON for Mod. State to enable the modulation function. In the Basic Waveforms interface, click or tap ON for Output to enable the waveform output. Then the modulated waveforms will be output from the specified AFG terminal based on the settings.15 Bode Plot
Bode plot is a way of graphically displaying the frequency response of a system. In the switching power supply and operational amplifier's circuit feedback network, the Bode plot provides the curves displaying the variation of gain and phase with the frequency for a loop analysis. The analysis on the system's gain and phase margins enables you to test the stability of the system. With the built-in signal generator module, the digital oscilloscope generates the sweep signal of a specified frequency range and outputs to the switching power supply circuit under test. Then, the oscilloscope draws a Bode plot displaying the variation of phase and gain with different frequencies. Click or tap the function navigation icon 🎨 at the lower-left corner of the screen, and then select Bode Plot to enter the Bode plot setting menu.  Figure 15.1 Bode Plot Setting Menu Click or tap to minimize the Bode plot window.  Figure 15.2 Minimized Bode Plot Window NOTE
The Bode plot function can only test the response of basic devices such as amplifiers, but cannot test circuits with greater noises.15.1 Basic Setting
Click or tap the Basic Setting tab to enter the basic setting menu. In this menu, you can enable or disable the Bode plot function, start or stop the Bode plot operation, set the input/output source, set the sweep type and display type, and check the connection diagram. In the Bode Plots setting menu, click or tap the ON/OFF tab for Bode Plot to enable or disable the Bode function. After the Bode plot function is enabled, the Bode plot window will be displayed on the screen.15.1.1 To Enable or Disable the Bode Plot Function
In the Bode plot setting interface, click or tap the ON/OFF tab for Bode Plot to enable or disable the Bode plot function. After the Bode plot function is enabled, the Bode plot window will be displayed on the screen. For the Bode plot display interface, refer to To Set the Display Type.15.1.2 To Run or Stop the Drawing of the Bode Plot
When the Bode plot is enabled, in the Bode plot interface, click or tap for Operating Status to start the loop analysis and Bode plot drawing based on the current Bode plot settings. In the running status, is displayed for Operating Status. After completing the Bode plot drawing, the icon after the Operating Status menu turns out to be To stop Bode plot drawing during the drawing process, click or tap to suspend drawing. NOTE
After completing the Bode plot test, the Bode plot setting interface is closed automatically. To open the Bode plot setting interface again, click or tap at the upper-right corner of the Bode plot window.15.1.3 To Set the Input/Output Source
\- Input Source: The input source indicates the channel input with the reference signal. The current frequency takes the frequency of this channel as the reference. The analog channel can be selected as the input source. The default input channel is CH1. Before selecting the input source, connect the signal under test to the analog channel input terminal of the oscilloscope.- Output Source:
The output source indicates the channel that connects the feedback output signal. The analog channel can be selected as the output source. The default output channel is CH2. Before selecting the output source, connect the signal under test to the analog channel output terminal of the oscilloscope.15.1.4 To Set the Sweep Signal
Sweep Source
Selects the AFG channel from the drop-down list of AFG Chan as the channel source to output the sweep signal. The default channel is AFG1.Sweep Type
Click or tap the drop-down button of Sweep Type to select "Log" or "Linear". - Linear: the frequency of the swept sine wave varies linearly with the time. - Log: the frequency of the swept sine wave varies logarithmically with the time.15.1.5 To Set the Display Type
Click or tap the drop-down button of Disp Type to select "Wave" or "Chart".Waveform Display
The Bode plot waveform display is as shown in the figure below. The X-axis in the Bode plot represents the frequency; and the Y-axis represents gain or phase. The magnitude-frequency curve (indicated in red) represents the gain between system input and output. The phase-frequency curve (indicated in green) represents the phase deviation between system input and output.  Figure 15.3 Bode Plot Displayed in Waveform Display Form 1. Cursor: rotate the specified multifunction knob to move the cursor. The cursor information is displayed in the upper-left corner of the Bode plot. 2. Bode plot curves: magnitude-frequency curve (indicated in red) and phase-frequency curve (indicated in green). 3. Cursor information display: - Freq: indicates the X-axis value where the cursor is located in the Bode plot. - Gain: indicates the Y-axis value of the crossing point between the cursor and the red magnitude-frequency curve. - Phase: indicates the Y-axis value of the crossing point between the cursor and the green phase-frequency curve. The cursor appears as a white vertical line in the Bode plot waveform display. You can rotate the specified multifunction knob to adjust the cursor position and view information about each point. 4. Margin result (displayed when the Bode plot operation stops): - PM: phase margin. It is the difference in phase between the phase at 0 dB gain frequency point and 0-degree phase. - GM: gain margin. It is the gain measurement difference between the value at 0 dB and the frequency point at 0-degree phase. That is, GM = 0 dB - Gain Measurement Value. 5. Operation button: click or tap ☐ to open the Bode plot setting menu. Click or tap ✗ to close the Bode plot waveform display window and disable the Bode function.Chart Display
The Bode plot chart display is as shown in the figure below. It shows the frequency, gain, and phase of all sample points. Click or tap to open the bode plot setting menu. Click or tap to close the Bode plot chart and disable the Bode function.| Bode Plot | |||
| Index | Freq | Gain | Phase |
| 1 | 100Hz | 8.70dB | 22.83° |
| 2 | 125.89Hz | 3.32dB | 133.41° |
| 3 | 158.48Hz | 4.64dB | -35.00° |
| 4 | 199.52Hz | -1.63dB | -31.39° |
| 5 | 251.18Hz | -0.18dB | -33.55° |
| 6 | 316.22Hz | -5.86dB | 100.27° |
| 7 | 398.10Hz | -9.54dB | -7.38° |
| 8 | 501.18Hz | 6.80dB | -150.68° |
| 9 | 630.95Hz | -12.39dB | -34.44° |
| 10 | 794.32Hz | -7.42dB | -128.75° |
| 11 | 1kHz | 6.01dB | 168.11° |
| 12 | 1.2589kHz | 3.57dB | 65.11° |
| 13 | 1.5848kHz | 6.96dB | -73.35° |
| 14 | 1.9952kHz | -9.04dB | 68.02° |
| 15 | 2.5118kHz | -3.91dB | -73.77° |
| 16 | 3.1622kHz | -7.34dB | 179.73° |
| 17 | 3.9810kHz | 7.18dB | 18.78° |
15.1.6 To View the Connection Diagram
Before enabling the Bode plot function, make a proper loop connection. Click or tap Connection Diagram to view the loop connection diagram. According to the connection diagram, connect the front-panel AFG output interface of the oscilloscope to the isolation transformer. Input the output signal of the isolation transformer to the ends of the injection resistor of the circuit under test. Then measure the signals at the input terminal and the output terminal.15.2 Ampl/Freq Setting
Click or tap the Ampl/Freq Setting tab to enter the Ampl/Freq Setting menu. Then set the following parameters. \- Start Frequency: click or tap the input field of Start Freq to set the start frequency of the Sine waveform with the pop-up numeric keypad. You can also use the specified multifunction knob to set the value. The settable range is from 10 Hz to 3 MHz. \- Stop Frequency: click or tap the input field of Stop Freq to set the stop frequency of the Sine waveform with the pop-up numeric keypad. You can also use the specified multifunction knob to set the value. The available range of stop frequency is from 100 Hz to 30 MHz. Stop Frequency ≥ 10 x Start Frequency. \- Points/Decade: click or tap the input field of Points/Decade to set the number of displayed points per decade. You can also use the specified multifunction knob to set the value. The setting range is from 10 to 100. By default, it is 10. \- Amplitude: click or tap the input field of Amp to set the voltage amplitude of the Sine waveform when the Var.Amp. is set to "OFF". \- Variable Amplitude: click or tap the ON/OFF tab for Var.Amp. to enable or disable the variable amplitude. When enabled, you can set the voltage amplitude of the Sine waveform under different frequency ranges.TIP
The stop frequency shall be greater than the start frequency. 15.3 To Save and Load the Bode Plot File
Click or tap the Save tab to enter the save setting interface. Here you can save and load the Bode plot data.Save the Test Data
1. Click or tap the drop-down button of Format to select the format of the saved Bode plot. The available file types include "*.csv" and "*.html". 2. Click or tap the input field of File Name to input the filename with the pop-up virtual keypad. 3. Click or tap the input field of File Path, and then the "Disk" interface is displayed. Select the desired destination path, and then click or tap OK to confirm the operation. For details about the disk management, refer to Disk Management. 4. Click or tap Save to save the Bode plot file according to the settings.Load the Test Data
1. Click or tap the drop-down button of File Type to select "*.csv" as the format of the file to be loaded. 2. Click or tap the input field of File Path, and then the "Disk" interface is displayed. Select the desired file from the specified path, and then click or tap OK to confirm the operation. For details about the disk management, refer to Disk Management. 3. Click or tap Load to load the Bode plot file. The test data of the loaded file will be displayed on the screen in a wave/chart format (depending on the display type that you select).16 Power Analysis (Option)
This series oscilloscope supports power analysis function, which can help you easily analyze the efficiency and reliability of the switching power supply. With the power analysis function, you can analyze the power quality and output ripple noise of the input power. To enter the UPA interface, perform any of the following operations: \- Click or tap and select UPA to enter the "UPA" menu. \- Press the front-panel Analyse key and then select UPA to enter the "UPA" menu.  Figure 16.1 Power Analysis Interface16.1 Power Quality
By analyzing the power quality, you can test the quality of AC input lines. The specific measurement parameters for power quality analysis include reference frequency, V_RMS, I_RMS, real power, apparent power, reactive power, power factor, phase angle, impedance, voltage crest factor, and current crest factor. In the power analysis interface, click or tap the drop-down button of Type to select Power Quality.Set Power Quality Analysis Source
- Click or tap the drop-down button of Voltage to select the desired voltage source from the drop-down list. The sources include CH1-CH4. - Click or tap the drop-down button of Current to select the desired current source from the drop-down list. The sources include CH1-CH4. \- Click or tap the drop-down button of Freq.Ref to select "Voltage" or "Current" as the frequency reference.Set the Reference Level
\- Click or tap the drop-down button of Type to set the reference level display type to "Percent(%)" or "Absolute". \- Click or tap the input field of Upper to set the upper limit value with the pop-up numeric keypad. You can also use the specified multifunction knob to set the value. The upper limit value should be greater than the middle value. \- Click or tap the input field of Mid to set the middle value with the pop-up numeric keypad. You can also use the specified multifunction knob to set the value. The middle value should be smaller than the upper limit value and greater than the lower limit value. \- Click or tap the input field of Lower to set the lower limit value with the pop-up numeric keypad. You can also use the specified multifunction knob to set the value. The lower limit value should be smaller than the middle value. \- Click or tap Default, and then the upper value, middle value, and lower value will be restored to the defaults.Set the Count
Click or tap the input field of Count to set the statistical count of the power quality analysis with the pop-up virtual numeric keypad. You can also use the specified knob indicated in the input field to set it. Its range is from 1 to 1,000. By default, it is 500. Click or tap Reset Stat. to clear the current data and execute statistics on the measurement results again.Enable the Power Analysis
Click or tap the ON/OFF tab for Enable to enable or disable the power quality analysis. When enabled, the statistical results will be displayed on the screen. Click or tap the close icon ✗ at the upper-right corner of the power analysis result interface to close the window.| Power Analysis | ||||||||
| Index | Name | Source | Current | Average | Maxi...um | Minimum | Deviation | Count |
| 1 | Ref_Freq | Chan1 | 1.25...Hz | 1.250...Hz | 1.25...Hz | 1.248...Hz | 1.25...kHz | 261 |
| 2 | Vrms | Chan1 | 190...mV | 190...mV | 190...mV | 190...mV | 0.0000V | 261 |
| 3 | Irms | Chan2 | 741.67uA | 710.34uA | 774.90uA | 649.79uA | 22.561uA | 261 |
| 4 | Real_P | Math1 | -12.9...uW | -11.7...uW | -8.72...uW | -13.8...uW | 965...nW | 261 |
| 5 | App...t_P | Chan1 | 140...uVA | 135...uVA | 147...uVA | 123...uVA | 4.2...uVA | 261 |
| 6 | Rea...e_P | Chan1 | 140...VAR | 134...VAR | 146...VAR | 123...VAR | 4.2...VAR | 261 |
| 7 | P_Factor | Chan1 | -91.991m | -86.669m | -65.903m | -100.15m | 5.4106m | 261 |
| 8 | Pha...ngle | Chan1 | 95.278° | 94.972° | 95.748° | 93.778° | 302.98m° | 261 |
| 9 | Imp | Chan1 | 256.25Ω | 267.81Ω | 292.47Ω | 245.25Ω | 8.5096Ω | 261 |
| 10 | V Cr...ctor | Chan1 | 1.1493 | 1.1494 | 1.1494 | 1.1493 | 0.0000 | 261 |
| 11 | I Cr...ctor | Chan2 | 1.8876 | 2.3279 | 3.3320 | 1.8199 | 257.73m | 261 |
TIP
When the power quality analysis is enabled, its result is displayed on the screen. Meanwhile, the multiplication operation is also enabled automatically.View the Connection Diagram
Click or tap Connection Diagram, and then the connection diagram of the power quality analysis is displayed on the screen. Please connect the cables according to the connection method in the diagram. To close the connection diagram window, click or tap the close icon ✗ at the upper-right corner of the connection diagram window.  Figure 16.3 Connection Diagram of Power Quality Analysis16.2 Ripple
Power ripple is an important parameter for evaluating DC power supply, which indicates the ripple quantity of the output DC voltage. The ripple analysis can measure the current value, average value, minimum value, maximum value, standard deviation, and count value of the ripples on the power output terminal. Click or tap the drop-down button of Type to select "Ripple". TIP
1:1 probe is recommended for ripple measurement. For example, PVP2150 and PVP2350.Set the Ripple Analysis Source
Click or tap the drop-down button Source to select the desired source from the drop-down list. The sources include CH1-CH4.Set the Count
Click or tap the input field of Count to set the statistical count of the ripple analysis with the pop-up virtual numeric keypad. You can also use the specified knob indicated in the input field to set it. Its range is from 1 to 1,000. By default, it is 500.Reset Statistics
Click or tap Reset Stat. to clear the current data and execute statistics on the measurement results again.View the Statistics of the Measurement Results
Click or tap the ON/OFF tab for Enable to enable or disable the display of the ripple analysis results. When enabled, the statistical results will be displayed on the screen, as shown in the figure below. Click or tap the close icon ✗ at the upper-right corner of the power analysis result interface to close the window.| Power Analysis | ||||||||
| Index | Name | Source | Current | Average | Maximum | Minimum | Deviation | Count |
| 1 | Meas_Vpp | Chan1 | 436.90mV | 436.90mV | 436.90mV | 436.90mV | 0.0000V | 73 |
View the Connection Diagram
Click or tap Connection Diagram, and then the connection diagram of the ripple analysis is displayed on the screen. Please connect the cables according to the connection method in the diagram. To close the connection diagram window, click or tap the close icon ✗ at the upper-right corner of the connection diagram window.  Figure 16.5 Connection Diagram of Ripple Analysis17 Reference Waveform
This series oscilloscope provides 10 reference waveform positions (Ref1\~Ref10). In the actual test process, you can compare the signal waveform with the reference waveform to locate the failure.17.1 To Enable the Ref Function
To enter the Ref interface, perform any of the following operations: \- Click or tap the function navigation icon at the lower-left corner of the screen, and then select Ref to enter the reference waveform function menu. \- Press the front-panel key to enter the reference waveform function menu.  Figure 17.1 Reference Waveform Menu17.2 To Set the Reference Waveform
In the Ref menu, you can specify a channel to serve as the reference channel, save and clear the reference channel.Select the Reference Channel
Click or tap the drop-down button of Current to select the reference waveform channel (Ref1-Ref10) from the drop-down list. By default, Ref1 is enabled.Select the Ref Source
Click or tap the drop-down button of Source to select the desired source of the reference waveform. The available sources include analog channels, digital channels, and Math1-Math4.Save the Reference Waveform to Internal Memory
Click or tap SaveToRef to save the displayed waveform for the specified source to the internal memory as the reference waveform. CAUTION
This operation only saves the reference waveform to the volatile memory, and the waveform will be cleared at power-off or restoring to the default settings. If you want to store reference waveforms that can be recalled when necessary, please export the waveform to internal or external memory (Export to Internal or External Memory).Clear the Specified Reference Waveform
Click or tap Clear to clear the specified reference waveform for the "current channel". You can also click or tap the Clear icon in the function navigation menu to clear the reference waveforms of all the reference channels. Also, you can press the front-panel  key to clear the reference waveforms of all the reference channels.Minimize the Reference Waveform Window
Click or tap the ON/OFF tab for Minimize to select whether to minimize the reference waveform setting window. By default, it is OFF. When enabled, the reference waveform setting window will be minimized to be displayed at the right section of the screen. You can set the parameters in the minimized window. To restore to the normal display of the window, click or tapMax. To close the window, click or tapClose.17.3 To Set the Ref Waveform Display
After clicking or tapping SaveToRef to save the current channel as reference waveform channel, you can adjust the vertical scale, vertical offset, and horizontal offset of the reference waveform specified under Current.Adjust the Vertical Scale
Click or tap the input field of VScale to input the vertical scale of the reference waveform with the pop-up numeric keypad. You can also click or tap the icon at the right of the input field of VScale to increase or decrease the vertical scale. Also, you can use the specified multifunction knob indicated in the input field to set the value. Modify the Vertical Offset
Click or tap the input field of VOffset to set the vertical offset of the reference waveform with the pop-up numeric keypad. You can also click or tap the icon at the right of the input field of VOffset to increase or decrease the vertical offset. Also, you can use the specified multifunction knob indicated in the input field to set the value. Horizontal Offset
Click or tap the input field of HOffset to set the horizontal offset of the reference waveform with the pop-up numeric keypad. You can also click or tap the icon at the right of the input field of HOffset to increase or decrease the horizontal offset. Also, you can use the specified multifunction knob indicated in the input field to set the value.Reset the Reference Waveform
After you have done the save operation for the reference waveform and you want to restore the reference waveform to the position prior to its last Save operation, Click or tap Reset.Set the Reference Waveform Color
This series oscilloscope provides five colors (gray, green, light blue, red, and orange) to mark the reference waveforms of different channels to distinguish them. Click or tap the drop-down button of Color to select the color of the reference waveform of the channel.Set the Reference Waveform Label
Click or tap the ON/OFF tab for Label to enable or disable the label display of the specified reference waveform. Click or tap the input field of Label to set the label of the specified reference waveform with the pop-up numeric keypad.17.4 To Export and Import the Reference Waveform
Export to Internal or External Memory
After saving the reference waveform, the reference waveform will be saved to the internal memory or external USB storage device. The format of the reference waveform file can be "*.ref", "*.bin", or "*.csv". Click or tap Export to enter the reference waveform file exporting interface.- Set the Format
In the file exporting interface, click or tap the drop-down button of Format to select "*.ref", "*.bin", or "*.csv" as the file format.- Set the Filename
Click or tap the input field of File Name, then filename editing interface is displayed. Input the filename with the pop-up numeric keypad. For the methods of using the numeric keypad, refer to descriptions in Parameter Setting Method.- Set the File Path
Click or tap the input field of File Path, then the disk management interface is displayed. Through the disk management menu, you can save the current reference waveform to the internal memory or external USB storage device. After selecting the desired storage path, click or tap Export to export the desired file. For the disk management operation, refer to descriptions in Disk Management. TIP
\- Only when the reference waveform is saved, can this export function be valid. \- This series oscilloscope only supports the flash memory USB storage device of FAT32 format. \- For the "*.bin" format file, refer to " Binary Data Format (.bin)".Import from Internal or External Memory
You can import the stored reference waveform file from the internal memory or external USB storage device to the internal instrument and display the file on the screen. Click or tap Import to enter the reference waveform file importing interface.- Set the Format
In the file importing interface, click or tap the drop-down button of Format to select "*.ref" as the file format.- Set the Import Path
Click or tap the input field of File Path, then the disk management interface is displayed. Through the disk management menu, you can import the saved reference waveform to the oscilloscope and display it in the waveform view of the oscilloscope. After selecting the desired reference waveform, click or tap Import to import the waveform file. For the disk management operation, refer to descriptions in Disk Management.18 Pass/Fail Test
During the product design and manufacturing process, you usually need to monitor the variations of the signal or judge whether the product is up to standard. The pass/fail test function of this series oscilloscope can accomplish this task perfectly. With this function, you can set the test mask based on the known "basic" waveforms, then compare the signal under test with the "basic" waveforms to display the test result. When a successful or failed event is detected, you can set the error action performed by the instrument, such as stopping immediately, enabling the beeper to sound, and capturing the current screen shot. Click or tap the function navigation icon 🎨 at the lower-left corner of the screen to open the function navigation menu. Click or tap to select Pass/Fail to enter the pass/fail test interface. You can also press on the front panel, then click or tap Pass/Fail to enter the pass/fail test interface.  Figure 18.1 Pass/Fail Test Menu18.1 To Enable or Disable the Pass/Fail Test Function
In the "Pass/Fail" setting menu, click or tap the ON/OFF tab for Enable to enable or disable the pass/fail test function. When enabled, you can select the source, set the test mask, and set the parameters for the output of the test results.18.2 To Select the Source
Click or tap the drop-down button of Source to select the desired source from the drop-down list. The available channels include CH1-CH4. TIP
When the disabled channel is selected as the source, it will be enabled automatically.18.3 To Set the Test Mask
In the Pass/Fail menu, you can self-define the pass/fail test mask, save and load the test mask.Create a Mask
Click or tap the input field of X Mask and Y Mask respectively to set the horizontal tolerance range and vertical tolerance range with the pop-up numeric keypad. You can also use the Up/Down arrow at the right side of the input field of Y Mask to adjust the value of Y Mask; use the Left/Right arrow at the right side of the input field of X Mask to adjust the value of X Mask. Also, you can use the specified knob indicated in the input field of Y Mask and X Mask to set it respectively. After configuring the settings, click or tap Create to apply the currently created mask (the region not covered by blue within the screen).Load a Mask
When the pass/fail test function is enabled, you can load the test mask files from the internal memory or external USB storage device (when detected) and apply them to the current pass/fail test function. Click or tap Load to enter the file loading interface. Click or tap the input field of File Path to load the specified test mask files (in *.pf format) and apply them to the current pass/fail test function. For detailed operations, refer to descriptions of Disk Management in To Store and Load.Save a Mask
When the pass/fail test function is enabled, you can save the current test mask range to the internal memory or external USB storage device (when detected) in "*.pf" format. Click or tap Save to enter the file saving interface. Click or tap the input field of File Name and File Path to input the filename and select the desired file path to save the test mask file to the internal or external memory. For detailed operations, refer to descriptions of Disk Management in To Store and Load.18.4 To Set the Output Form of the Test Results
In the "Option" menu of the pass/fail test interface, you can set the follow-up operations that the oscilloscope will do when test results are generated according to your needs.Set the Output Event and Aux Output
\- Click or tap the ON/OFF tab for Aux Output to enable or disable the Aux output. \- When enabled, in the Utility menu, the sub-menu AUX Out under the Setup menu is automatically set to "PassFail". When a successful or failed event is detected, a pulse will be output from the [AUX OUT] connector. \- If disabled, in the Utility menu, the sub-menu AUX Out under the Setup menu is automatically set to "TrigOut". The output of the [AUX OUT] connector is irrelevant with the pass/fail test. \- Click or tap to select "Pass" or "Fail" for the Output Event menu. Then when the specified output event is detected, a pulse will be output from the [AUX OUT] connector.Set the Output Polarity and Output Pulse Width
Click or tap to select "Positive" or "Negative" for the Polarity menu. Then click or tap the input field of Pulse to set the pulse width with the pop-up numeric keypad. You can also use the specified knob indicated in the input field to set the value. The available range is from 100 ns to 10 ms. By default, it is 1 µ s.Set the Error Action
In the Err Action menu, you can set the follow-up operations that the oscilloscope will do when a failed event is detected. \- Stop: indicates stopping sampling when a failed test event is detected. \- Beeper: indicates that the beeper sounds an alarm (irrelevant with the on/off status of the beeper of the instrument) when a failed test event is detected. \- Screenshot: captures the screen when a failed test event is detected. If an external storage device is detected, the screenshot will be saved to the external storage device directly. Otherwise, it will be saved to the local disk. If "Screenshot" is selected, "Stop" action will be executed forcibly. The sampling operation will be stopped automatically. After the Screenshot operation is completed, the sampling will continue.18.5 To Start or Stop the Pass/Fail Test Operation
After you have enabled the pass/fail test and completed the settings in the Pass/Fail menu, click or tap for the Operate menu item to start the test. During testing, click or tap to suspend testing at any time. During the test process, the oscilloscope will test the waveforms, display the test information, and output the test information based on the current of settings. The "Pass/Fail" measurement results are displayed in the "Result" list. The test interface is as shown in the figure below.  Figure 18.2 Pass/Fail Test Interface TIP
- Only when the pass/fail test function is enabled, can you start or stop the pass/fail test operation, save and load the test mask. • After starting the test operation, you can neither modify the source channel nor adjust the test mask.18.6 To Display the Statistics Information of the Test Results
When the "Pass/Fail" test is enabled, the test results are displayed under the "Result" list at the right side of the screen. Click or tap the icon on the lower-right part of the waveform view to fold the result list. The statistics information in the pass/fail test results includes number of failed frames, number of passed frames, and the total number of frames, as shown in the figure below.  Click or tap the test results under the result list, then the sub-menus are displayed. You can perform the following operations: - Click or tap Reset Stat. to reset the test results to zero. - Click or tap Setting to enter the pass/fail setting interface. - Click or tap Remove to disable the pass/fail function and exit the current interface.19 Protocol Decoding
You can use the protocol analysis to discover errors, debug hardware, and accelerate development easily, ensuring you to accomplish the projects with high speed and good quality. Protocol decoding is the basis of protocol analysis. Only protocol analyses with correct protocol decoding are acceptable, and only correct protocol decoding can identify more error information. This oscilloscope provides four bus decoding modules (Decode 1, Decode 2, Decode 3, and Decode 4) to make common protocol decoding for the input signals of the analog channels. It provides standard serial decodes including Parallel, RS232/UART, I2C, CAN, and SPI; optional serial decodes including LIN, CAN-FD, FlexRay, I2S and MIL-STD-1553. As the decoding functions and setting methods of Decode1, Decode2, Decode3, and Decode4, this chapter takes Decode1 as an example for illustration. \- Click or tap  > Decode to enter the "Decode" menu. \- Click or tap the Decode button on the toolbar to enter the "Decode" menu. To get the decoding option information, refer to descriptions in Appendix A: Options and Accessories. If you have purchased the decoding option, activate it according to the descriptions in To View the Option and the Option Installation.19.1 Parallel Decoding
Parallel bus consists of clock line and data line. As shown in the figure below, CLK is the clock line, Bit0 and Bit1 are the 0 bit and 1st bit on the data line. The oscilloscope will sample the channel data on the rising edge, falling edge, or the rising/falling edge of the clock and judge each data point (logic "1" or logic "0") according to the preset threshold level.  Figure 19.1 Schematic Diagram of Parallel Decoding In the Decode menu, click or tap the drop-down button of Bus Type to select Parallel, then configure the parameters for Parallel decoding.  Figure 19.2 Parallel Decoding MenuBus Status
Click or tap the ON/OFF tab for Bus Status to enable or disable the bus decoding.19.1.1 Clock Setting (CLK)
Clock Setting (CLK)
Click or tap the drop-down button of CLK to select the analog channel or the digital channel as the desired clock channel. If "OFF" is selected, no clock channel is set, and sampling is performed when a hop occurs to the data of the data channel during decoding.Threshold
When the clock source is set to an analog channel, you need to set the threshold. Click or tap the input field of Threshold to set the threshold with the pop-up numeric keypad. You can also use the specified knob to set it. The range of the threshold is related to the current vertical scale and offset.CLK Edge
You can select "Rising", "Falling", or "Both" for CLK Edge when configuring the clock channel. \- Rising: samples the channel data on the rising edge of the clock. \- Falling: samples the channel data on the falling edge of the clock. \- Both: samples the channel data on the rising edge or the falling edge of the clock.19.1.2 Bus Setting
Set the Bus
You can select the analog channel or the digital channel as the bus source. You can also use the user-define bus source. Table 19.1 Bus Setting| Bus Width | Bit X Channel | Remarks | ||
| CH1 1 0 | CH1 | Width, Bit X, and CH are set automatically, and you cannot modify them. | ||
| CH2 1 0 | CH2 | Width, Bit X, and CH are set automatically, and you cannot modify them. | ||
| CH3 1 0 | CH3 | Width, Bit X, and CH are set automatically, and you cannot modify them. | ||
| CH4 1 0 | CH4 | Width, Bit X, and CH are set automatically, and you cannot modify them. | ||
| D7-D0 8 | 0 (default) D0 (default) | Bit0 to Bit7 are set to D7 to D0 respectively.Widthis set automatically, and you cannot modify it. | ||
| D15-D8 | 8 0 (default) D8 (default) | Bit0 to Bit7 are set to D15 to D8 respectively.Widthis set automatically, and you cannot modify it. | ||
| D15-D0 | 16 0 (default) D0 (default) | Bit0 to Bit15 are set to D15 to D0 respectively.Widthis set automatically, and you cannot modify it. | ||
| Bus Width Bit X Channel | Remarks | |||
| D0-D7 8 | 0 (default) D7 (default) | Bit0 to Bit7 are set to D0 to D7 respectively.Widthis set automatically, and you cannot modify it. | ||
| D8-D15 | 8 0 (default) | D15 (default) | Bit0 to Bit7 are set to D8 to D15 respectively.Widthis set automatically, and you cannot modify it. | |
| D0-D15 | 16 0 (default) | D15 (default) | Bit0 to Bit15 are set to D0 to D15 respectively.Widthis set automatically, and you cannot modify it. | |
| User | 1 to 4, 1 for default | 0 (default) | CH1-CH4, D0-D15 | When the bus is set to "User", you can set the bus width. |
Set the Threshold Level
When the analog channel is set as the bus source, to judge logic "1" and logic "0" of the buses, you need to set a threshold for each analog channel. When the channel signal amplitude is greater than the preset threshold, it is judged as logic "1"; otherwise logic "0". Click or tap the input field of Threshold to set the threshold of with the pop-up numeric keypad. You can also use the specified knob to set it. The range of the threshold is related to the current vertical scale and offset. Endian
In Endian, select "Invert" or "Normal" as the endian of the bus.Polarity
In Polarity, select "Positive" or "Negative" as the data polarity.19.1.3 Display-related Setting
In the Decode menu, set the following display-related parameters.Set the Display Format
Click or tap the drop-down button of Format to select the display format of the bus data and that of the event table. The available formats include "Hex", "Dec", "Bin", and "ASCII".Set the Label Display
Click or tap the ON/OFF tab for Label to enable or disable the label display of the decoding bus. When enabled, the bus label will be displayed at the upper-left side of the bus (when the bus display is enabled). The label shows the current bus type.19.1.4 Event Table
The event table displays the decoded data and the corresponding decoding information in time order in the form of a table. It can be used to observe relatively longer decoded data. The decoding information includes the decoded data, the corresponding line number, time, etc. When the event table is enabled, the event table window of the specified decoding is displayed on the screen. The decoding information is shown in the event table.  Figure 19.3 Parallel Decoding Event Table TIP
\- When you adjust the horizontal time base, the waveform displayed on the screen will also change, and the total number of lines containing the decoding information in the event table will also be changed. \- The displayed decoded data information in the bus is related to the value of the horizontal time base. Reducing the horizontal time base can help you view the detailed information.Set the Event Table Format
Click or tap the drop-down button of Format to select the display format of the event table. The available formats include "Hex", "Dec", "Bin", and "ASCII".Export
When the operating status of the instrument is STOP, you can export the time and corresponding decoding data from the current event table. Click or tap Export to enter the file export interface. You can export the data list to the internal memory or the external USB storage device (when detected) in "*.csv" format. The detailed export operation is similar to the save operation, you can refer to relevant descriptions in To Store and Load.19.2 RS232 Decoding
RS232 serial bus consists of the transmitting data line (TX) and the receiving data line (RX).  Figure 19.4 Schematic Diagram of RS232 Serial Bus In RS232, baud rate is used to represent the transmission rate (namely bits per second) of the data. You need to set the start bit, data bits, check bit (optional), and stop bits for each frame of data.| Start Bit | Data Bit | Check Bit | Stop Bit |
Bus Status
Click or tap the ON/OFF tab for Bus Status to enable or disable the bus decoding.Quickly Apply Trigger Settings to Decoding
Copy trig indicates applying the trigger settings to the specified decoding setting. Click or tap Copy Trig to apply the trigger settings to the specified decoding setting.19.2.1 Source Setting
Set the Tx Source and the Threshold
Click or tap the drop-down button of Tx to select the desired source. The available sources include analog channels, digital channels, and OFF. When the Tx source is set to an analog channel, click or tap the input field of Threshold to set the threshold of Tx source with the pop-up numeric keypad. You can also use the specified knob to set it. The range of the threshold is related to the current vertical scale and offset. When you modify the threshold of the Tx source channel, a dotted line displaying the current threshold level is displayed on the screen. It disappears in about 2 s after you stop modifying the threshold.Set the Rx Source and the Threshold
Use the same method to select the Rx source and set the threshold. The default state of Rx is OFF.TIP
The sources of Tx and Rx cannot be set to OFF at the same time.Polarity
Click or tap "Positive" or "Negative" in Polarity. - Positive: High level is logic "1" and low level is logic "0". - Negative: High level is logic "0" and low level is logic "1".Set the baud rate
Click or tap the drop-down button of Baud to select the baud rate. The available baud rates include 50 bps, 75 bps, 110 bps, 134 bps, 150 bps, and etc. The oscilloscope allows you to self-define the baud rate. Click or tap the drop-down button of Baud to select "User" and then set the baud rate with the pop-up numeric keypad.19.2.2 To Set Data Package
Data
Click or tap the drop-down button of Data to select the data bits. The available data bits are 5 bits, 6 bits, 7 bits, 8 bits, and 9 bits.Parity
It is used to check whether the data transmission is correct. Click or tap the dropdown button of Parity to select the desired parity mode. - None: indicates that no check bit appears during the transmission. - Even: indicates that the total number of "1" in the data bit and check bit is an even number. For example, when 0x55 (01010101) is sent, "0" should be added to the check bit. - Odd: indicates that the total number of "1" in the data bit and check bit is an odd number. For example, when 0x55 (01010101) is sent, "1" should be added to the check bit.Stop Bit
Click or tap the drop-down button of Stop Bit to set the stop bits after each frame of data. It can be set to 1 bit, 1.5 bits, or 2 bits.Endian
Click or tap the drop-down button of Endian to select the desired endian. • LSB: indicates Least Significant Bit transmission sequence, i.e. the lowest bit of the data is transmitted first. \- MSB: indicates Most Significant Bit transmission sequence, i.e. the highest bit of the data is transmitted first. 19.2.3 Display-related Setting
In the Decode menu, set the following display-related parameters.Set the Display Format
Click or tap the drop-down button of Format to select the display format of the bus data and that of the event table. The available formats include "Hex", "Dec", "Bin", and "ASCII".Set the Label Display
Click or tap the ON/OFF tab for Label to enable or disable the label display of the decoding bus. When enabled, the bus label will be displayed at the upper-left side of the bus (when the bus display is enabled). The label shows the current bus type.19.2.4 Event Table
When the event table is enabled, the event table window of the specified decoding is displayed on the screen. The decoding information is shown in the event table.  Figure 19.6 RS232 Decoding Event Table TIP
- When you adjust the horizontal time base, the waveform displayed on the screen will also change, and the total number of lines containing the decoding information in the event table will also be changed. - The displayed decoded data information in the bus is related to the value of the horizontal time base. Reducing the horizontal time base can help you view the detailed information.Set the Event Table Format
Click or tap the drop-down button of Format to select the display format of the event table. The available formats include "Hex", "Dec", "Bin", and "ASCII".Export
When the operating status of the instrument is STOP, you can export the time and corresponding decoding data from the current event table. Click or tap Export to enter the file export interface. You can export the data list to the internal memory or the external USB storage device (when detected) in "*.csv" format. The detailed export operation is similar to the save operation, you can refer to relevant descriptions in To Store and Load.19.3 I2C Decoding
I2C serial bus consists of the clock line (SCL) and the data line (SDA). SCL: samples SDA on the rising or falling edge of the clock. SDA: indicates the data channel.  Figure 19.7 I2C Serial Bus In the Decode menu, click or tap the drop-down button of Bus Type to select I2C, then configure the parameters for I2C decoding.  Figure 19.8 I2C Decoding MenuBus Status
Click or tap the ON/OFF tab for Bus Status to enable or disable the bus decoding.Quickly Apply Trigger Settings to Decoding
Copy trig indicates applying the trigger settings to the specified decoding setting. Click or tap Copy Trig to apply the trigger settings to the specified decoding setting.19.3.1 Source Setting
Set the Clock Channel and Data Channel
\- You can select the analog channel or the digital channel as the clock source. When the source is set to an analog channel, you can set SCL Thre with the popup numeric keypad. You can also use the specified multifunction knob to set the threshold. When you modify the threshold of the clock channel, a dotted line displaying the current threshold level is displayed on the screen. It disappears in about 2 s after you stop modifying the threshold. \- You can select the analog channel or the digital channel as the data source. When the source is set to an analog channel, set SDA Thre with the pop-up numeric keypad. You can also use the specified multifunction knob to set the threshold.Exchange Sources
Click or tap "SCL/SDA" or "SDA/SCL" under Exchange to exchange the current clock channel source and data channel source.Set the Address Width
Click or tap the drop-down button of Width to select the address width. The available choices include "7 Bits", "8 Bits", and "10 Bits". When "7 Bits" is selected, R/W bit is not included in the address. When "8 Bits" or "10 Bits" is selected, R/W bit is included in the address. \- 7: In 7-bit addressing, after the START condition, a slave address is sent. The address starts to transfer from the first byte, as shown in the figure below. The first seven bits of the first byte make up the slave address, and the eighth bit is the LSB (least significant bit) which determines the direction of the message, also called a data direction bit (R/W). A "zero" indicates a transmission (WRITE), a "one" indicates a request for data (READ).  \- 8: same as the 7-bit addressing. A R/W bit is included in the 8-bit addressing for the slave address. • 10: 10-bit addressing is compatible with, and can be combined with, 7-bit addressing. As shown in the figure below, in 10-bit addressing, the first byte is the special reserved address 10-bit Address Indicator to indicate the current 10-bit address that is transferring. 19.3.2 Display-related Setting
In the Decode menu, set the following display-related parameters.Set the Display Format
Click or tap the drop-down button of Format to select the display format of the bus data and that of the event table. The available formats include "Hex", "Dec", "Bin", and "ASCII".Set the Label Display
Click or tap the ON/OFF tab for Label to enable or disable the label display of the decoding bus. When enabled, the bus label will be displayed at the upper-left side of the bus (when the bus display is enabled). The label shows the current bus type.19.3.3 Event Table
When the event table is enabled, the event table window of the specified decoding is displayed on the screen. The decoding information is shown in the event table.  Figure 19.9 I2C Decoding Event Table TIP
\- When you adjust the horizontal time base, the waveform displayed on the screen will also change, and the total number of lines containing the decoding information in the event table will also be changed. \- The displayed decoded data information in the bus is related to the value of the horizontal time base. Reducing the horizontal time base can help you view the detailed information.Set the Event Table Format
Click or tap the drop-down button of Format to select the display format of the event table. The available formats include "Hex", "Dec", "Bin", and "ASCII".Export
When the operating status of the instrument is STOP, you can export the time and corresponding decoding data from the current event table. Click or tap Export to enter the file export interface. You can export the data list to the internal memory or the external USB storage device (when detected) in "*.csv" format. The detailed export operation is similar to the save operation, you can refer to relevant descriptions in To Store and Load.Address Information of I2C Decoding
For I2C bus, each frame of data starts with the address information (read address and write address). In the address information, "Read" indicates the read address Error Expressions in I2C Decoding
In I2C decoding, the decoded data may include address with ACK or without ACK (NACK). When NACK appears following the write address, an error message indicated in red is displayed.19.4 SPI Decoding
SPI bus is based on the master—slave configuration and usually consists of chip select line (CS), clock line (CLK), and data line (SDA). Wherein, the data lines include the master input/slave output (MISO) data line and master output/slave input (MOSI) data line. The oscilloscope samples the channel data on the rising edge or falling edge of the clock signal and judges each data point (logic "1" or logic "0") according to the preset threshold level.  Figure 19.10 SPI Serial Bus In the Decode menu, click or tap the drop-down button of Bus Type to select SPI, then configure the parameters for SPI decoding.  Figure 19.11 SPI Decoding MenuBus Status
Click or tap the ON/OFF tab for Bus Status to enable or disable the bus decoding.Quickly Apply Trigger Settings to Decoding
Copy trig indicates applying the trigger settings to the specified decoding setting. Click or tap Copy Trig to apply the trigger settings to the specified decoding setting.19.4.1 To Set the Source
Set the Clock Signal
- You can select the analog channel or the digital channel as the clock signal. - When the source is set to an analog channel, click or tap the input field of Threshold to set the threshold for the specified channel with the pop-up numeric keypad. You can also use the specified multifunction knob to set the threshold. \- Click or tap to select "Rising" or "Falling" under Slope to set the instrument to sample MISO and MOSI on the rising or falling edge of the clock signal.Set MISO and MOSI
\- The available channels for MISO include analog channels, digital channels, and OFF. When the source is set to an analog channel, click or tap the input field of Threshold to set the threshold for the specified channel with the pop-up numeric keypad. You can also use the specified multifunction knob to set the threshold. \- The available channels for MOSI include analog channels, digital channels, and OFF. When the source is set to an analog channel, click or tap the input field of Threshold to set the threshold for the specified channel with the pop-up numeric keypad. You can also use the specified multifunction knob to set the threshold. NOTE
The MISO and MOSI sources cannot be set to "OFF" at the same time.19.4.2 To Set the Mode and Data
Mode
Click or tap "Timeout" or "CS" under Mode.- Timeout:
you can perform frame synchronization according to the timeout, and the timeout value must be greater than half of the clock cycle. Click or tap the input field of Timeout to set the timeout value with the pop-up numeric keypad. You can also use the specified knob to set it. The adjustable range of the timeout value is from 8 ns to 10 s. By default, it is 1 µ s.• CS:
contains a chip select line (CS). You can perform frame synchronization according to CS. When "CS" is selected, - Click or tap drop-down button of CS to select the desired source from the drop-down list. The available channels include digital channels and analog channels. - When the source is set to an analog channel, click or tap the input field of Threshold to set the threshold with the pop-up numeric keypad. You can also use the specified knob to set the threshold. - In CS Polarity menu, click or tap to select "Positive" or "Negative".Endian
Click or tap the drop-down button of Endian to select the desired endian. \- LSB: indicates Least Significant Bit transmission sequence, i.e. the lowest bit of the data is transmitted first. \- MSB: indicates Most Significant Bit transmission sequence, i.e. the highest bit of the data is transmitted first. Polarity
In Polarity, select "Positive" or "Negative".Width Setting
Click or tap the input field of Width to set the bits of each frame of data with the pop-up numeric keypad. You can also use the specified knob to set it. The setting range is from 4 to 32. By default, it is 8.19.4.3 Display-related Setting
In the Decode menu, set the following display-related parameters.Set the Display Format
Click or tap the drop-down button of Format to select the display format of the bus data and that of the event table. The available formats include "Hex", "Dec", "Bin", and "ASCII".Set the Label Display
Click or tap the ON/OFF tab for Label to enable or disable the label display of the decoding bus. When enabled, the bus label will be displayed at the upper-left side of the bus (when the bus display is enabled). The label shows the current bus type.19.4.4 Event Table
When the event table is enabled, the event table window of the specified decoding is displayed on the screen. The decoding information is shown in the event table.  Figure 19.12 SPI Decoding Event Table TIP
- When you adjust the horizontal time base, the waveform displayed on the screen will also change, and the total number of lines containing the decoding information in the event table will also be changed. - The displayed decoded data information in the bus is related to the value of the horizontal time base. Reducing the horizontal time base can help you view the detailed information.Set the Event Table Format
Click or tap the drop-down button of Format to select the display format of the event table. The available formats include "Hex", "Dec", "Bin", and "ASCII".Export
When the operating status of the instrument is STOP, you can export the time and corresponding decoding data from the current event table. Click or tap Export to enter the file export interface. You can export the data list to the internal memory or the external USB storage device (when detected) in "*.csv" format. The detailed export operation is similar to the save operation, you can refer to relevant descriptions in To Store and Load.19.5 CAN Decoding
The oscilloscope samples the CAN (standard) or CAN-FD (option) signal at the specified sample position, and judges each data point to be logic "1" or logic "0" according to the preset threshold level. You need to specify the CAN or CAN-FD signal type and sample position. In the Decode menu, click or tap the drop-down button of Bus Type to select CAN, then configure the parameters for CAN decoding. Wherein, CAN-FD Baud and FD Sample Position are available when you have installed the MHO2000-AUTOA option. The CAN-FD Baud is the baud rate of the CAN-FD bus.  Figure 19.13 CAN Decoding MenuBus Status
Click or tap the Bus Status on/off switch to enable or disable the bus decoding.Quickly Apply Trigger Settings to Decoding
Copy trig indicates applying the trigger settings to the specified decoding setting. Click or tap Copy Trig to apply the trigger settings to the specified decoding setting.19.5.1 Signal Configuration
Set the Source and the Threshold
- Click or tap the drop-down button of Source to select the desired source from the drop-down list. The sources include analog channels, digital channels, and Math1-Math4. - When an analog channel or Math1-Math4 is selected as the source, you can set the threshold for the specified channel with the pop-up numeric keypad. You can also use the specified multifunction knob to set the threshold. When you modify the threshold, a dotted line displaying the current threshold level is displayed on the screen. It disappears in about 2 s after you stop modifying the threshold.Select the Signal Type
Click or tap the drop-down button of Signal to select a signal type that matches the CAN bus signal. The available signal types include CAN_H, CAN_L, Rx, Tx, and Diff. - CAN_H: indicates the actual CAN_H bus signal. - CAN_L: indicates the actual CAN_L bus signal. - Rx: indicates the Receive signal from the CAN bus transceiver. - Tx: indicates the Transmit signal from the CAN bus transceiver. \- Diff: indicates the CAN differential bus signals connected to the source channel by using a differential probe. Connect the probe's positive lead to the CAN_H bus signal and connect the negative lead to the CAN_L bus signal.Specify the Standard Signal Rate
Click or tap the drop-down button of Baud to select the preset baud rate from the drop-down list. The available baud rates include 10.0 kbps, 19.2 kbps, 20.0 kbps, 33.3 kbps, 38.4 kbps, 50.0 kbps, and etc. You can also click or tap User to set a user-defined baud rate.Sample Position
Sample position is a point within a bit's time. The oscilloscope samples the bit level at this point. The sample position is represented by the proportion of "the time from the start of the bit to the sample point" to the "bit time", as shown in the figure below.  Figure 19.14 Sample PositionSet the CAN-FD Baud
CAN-FD baud rate is a dedicated setting for the CAN-FD decoding. It is available only when the MHO2000-AUTOA option has been installed. Click or tap the drop-down button of CAN-FD Baud to select the variable baud rate from the drop-down list. The available baud rates include 1 Mbps, 2 Mbps, 3 Mbps, 4 Mbps, and etc.Set the FD Sample Position
FD sample position a dedicated setting for the CAN-FD decoding. It is available only when the MHO2000-AUTOA option has been installed. Click or tap the input field of FD Sample Position to set the sample position of the CAN-FD decoding with the pop-up numeric keypad. You can also use the specified knob to set it. The settable range is from 10% to 90%.19.5.2 Display-related Setting
In the Decode menu, set the following display-related parameters.Set the Display Format
Click or tap the drop-down button of Format to select the display format of the bus data and that of the event table. The available formats include "Hex", "Dec", "Bin", and "ASCII".Set the Label Display
Click or tap the ON/OFF tab for Label to enable or disable the label display of the decoding bus. When enabled, the bus label will be displayed at the upper-left side of the bus (when the bus display is enabled). The label shows the current bus type.19.5.3 Event Table
When the event table is enabled, the event table window of the specified decoding is displayed on the screen. The decoding information is shown in the event table.  Figure 19.15 CAN Decoding Event Table TIP
\- When you adjust the horizontal time base, the waveform displayed on the screen will also change, and the total number of lines containing the decoding information in the event table will also be changed. \- The displayed decoded data information in the bus is related to the value of the horizontal time base. Reducing the horizontal time base can help you view the detailed information.Search ID
When the event table is enabled and the operating status of the oscilloscope is STOP (stopping acquisition), you can search for the event with the specified ID from the current event table. When you enable "Search On" and input the specified search ID, the event table will only display the event with specified ID.Set the Event Table Format
Click or tap the drop-down button of Format to select the display format of the event table. The available formats include "Hex", "Dec", "Bin", and "ASCII".Export
When the operating status of the instrument is STOP, you can export the time and corresponding decoding data from the current event table. Click or tap Export to enter the file export interface. You can export the data list to the internal memory or the external USB storage device (when detected) in "*.csv" format. The detailed export operation is similar to the save operation, you can refer to relevant descriptions in To Store and Load.Interpret the CAN Decoding Frame Structure
- Frame ID: expressed in Hex, displayed as "ID:". - DLC (Data Length Code): expressed in Hex, displayed as "DLC": - Data: Its display format is the same as that of the bus data (Hex, Dec, Bin, or ASCII), displayed as "Data:". - CRC (Cyclic Redundancy Check): expressed in Hex, displayed as "CRC:" - ACK (Acknowledgement): displayed as "ACK:"; when errors (ACK is detected to be 1) occur, it is displayed as a red patch. - R (Remote Frame): displayed as "R:". - Stuff (Bit Filling Error): displayed as "Stuff".19.6 LIN Decoding (Option)
The oscilloscope samples the LIN signal, and judges each data point to be logic "1" or logic "0" according to the preset threshold level. The LIN decoding is required to specify the LIN signal protocol version. In the Decode menu, click or tap the drop-down button of Bus Type to select LIN, then configure the parameters for LIN decoding.  Figure 19.16 LIN Decoding MenuBus Status
Click or tap the ON/OFF tab for Bus Status to enable or disable the bus decoding.Quickly Apply Trigger Settings to Decoding
Copy trig indicates applying the trigger settings to the specified decoding setting. Click or tap Copy Trig to apply the trigger settings to the specified decoding setting.19.6.1 Signal Configuration
Set the Source and the Threshold
\- You can select the analog channel or the digital channel as the source. \- When the source is set to an analog channel, you can set the threshold for the specified channel with the pop-up numeric keypad. You can also use the specified multifunction knob to set the threshold. When you modify the threshold, a dotted line displaying the current threshold level is displayed on the screen. It disappears in about 2 s after you stop modifying the threshold.Set the Signal
\- You can select the preset baud rate. The preset baud rates include 2.4 kbps, 4.8 kbps, 9.6 kbps, 10.0 kbps, 19.2 kbps, and etc. You can also set a user-defined baud rate. \- You can select whether the data contain the parity bit. \- You can select the protocol version that matches the LIN bus. The versions include "1.X", "2.X", and "Both".19.6.2 Display-related Setting
In the Decode menu, set the following display-related parameters.Set the Display Format
Click or tap the drop-down button of Format to select the display format of the bus data and that of the event table. The available formats include "Hex", "Dec", "Bin", and "ASCII".Set the Label Display
Click or tap the ON/OFF tab for Label to enable or disable the label display of the decoding bus. When enabled, the bus label will be displayed at the upper-left side of the bus (when the bus display is enabled). The label shows the current bus type.19.6.3 Event Table
When the event table is enabled, the event table window of the specified decoding is displayed on the screen. The decoding information is shown in the event table.  Figure 19.17 LIN Decoding Event Table TIP
- When you adjust the horizontal time base, the waveform displayed on the screen will also change, and the total number of lines containing the decoding information in the event table will also be changed. - The displayed decoded data information in the bus is related to the value of the horizontal time base. Reducing the horizontal time base can help you view the detailed information.Set the Event Table Format
Click or tap the drop-down button of Format to select the display format of the event table. The available formats include "Hex", "Dec", "Bin", and "ASCII".Export
When the operating status of the instrument is STOP, you can export the time and corresponding decoding data from the current event table. Click or tap Export to enter the file export interface. You can export the data list to the internal memory or the external USB storage device (when detected) in "*.csv" format. The detailed export operation is similar to the save operation, you can refer to relevant descriptions in To Store and Load.Interpret the LIN Decoding Frame Structure
- Break (Sync Break): expressed in Hex, displayed as "Break": - SYNC (Sync): expressed in Hex, displayed as "SYNC:". - ID (Frame ID): expressed in Hex, displayed as "ID:". - Data: Its display format is the same as that of the bus data (Hex, Dec, Bin, or ASCII), displayed as "Data:". - Checksum: expressed in Hex, displayed as "Checksum:". When errors occur, it is displayed as a red patch. - Wakeup: displayed as "Wakeup".19.7 I2S Decoding (Option)
The oscilloscope samples the I2S signal, and judges each data point to be logic "1" or logic "0" according to the preset threshold level. I2S decoding is required to specify the serial clock, channel signal, and the data's source channel. You need to set Alignment, WS Low, and other parameters. In the Decode menu, click or tap the drop-down button of Bus Type to select I2S, then configure the parameters for I2S decoding.  Figure 19.18 I2S Decoding MenuBus Status
Click or tap the ON/OFF tab for Bus Status to enable or disable the bus decoding.Quickly Apply Trigger Settings to Decoding
Copy trig indicates applying the trigger settings to the specified decoding setting. Click or tap Copy Trig to apply the trigger settings to the specified decoding setting.19.7.1 Source Setting
Set the SCLK Source and Threshold
\- Click or tap the drop-down button of SCLK to select the analog channel or the digital channel as the desired serial clock source. \- When the source is set to an analog channel, click or tap the input field of SCLK Thre to set the SCLK threshold with the pop-up numeric keypad. You can also use the specified multifunction knob to set the threshold. When you modify the threshold of the clock channel, a dotted line displaying the current threshold level is displayed on the screen. It disappears in about 2 s after you stop modifying the threshold. \- In SCLK Edge menu, click or tap to select "Rising" or "Falling" as the desired clock edge.Set the WS Source and Threshold
\- Click or tap the drop-down button of WS to select the analog channel or the digital channel as the desired WS source. \- When the source is set to an analog channel, click or tap the input field of WS Thre to set the WS threshold with the pop-up numeric keypad. You can also use the specified multifunction knob to set the threshold. When you modify the WS threshold, a dotted line displaying the current threshold level is displayed on the screen. It disappears in about 2 s after you stop modifying the threshold.Set the SDA Source and Threshold
\- Click or tap the drop-down button of SDA to select the analog channel or the digital channel as the desired SDA source. \- When the source is set to an analog channel, click or tap the input field of SDA Thre to set the SDA threshold with the pop-up numeric keypad. You can also use the specified multifunction knob to set the threshold. When you modify the data threshold, a dotted line displaying the current threshold level is displayed on the screen. It disappears in about 2 s after you stop modifying the threshold.19.7.2 Bus Setting
Set the Word Size
You can use the pop-up numeric keypad to set Word Size. Its range is from 4 to 32. You can also use the specified knob indicated in the input field to set the value.Set the Receiver Word Size
You can use the pop-up numeric keypad to set Receive. Its range is from 4 to 32. Also, you can use the specified knob indicated in the input field to set the value.Set the Endian
In Endian menu, click or tap to select "LSB" or "MSB". By default, it is "MSB".Set the Alignment Mode
Click or tap the drop-down button of Alignment to select the alignment way for data signal. The available choices include "I2S", "LJ", and "RJ".Set the Audio Polarity
Click or tap the drop-down button of WS Low to select "Left" or "Right".Set the Data Polarity
In Data Polarity menu, click or tap to select "Positive" or "Negative".19.7.3 Display-related Setting
In the Decode menu, set the following display-related parameters.Set the Display Format
Click or tap the drop-down button of Format to select the display format of the bus data and that of the event table. The available formats include "Hex", "Dec", "Bin", and "ASCII".Set the Label Display
Click or tap the ON/OFF tab for Label to enable or disable the label display of the decoding bus. When enabled, the bus label will be displayed at the upper-left side of the bus (when the bus display is enabled). The label shows the current bus type.19.7.4 Event Table
When the event table is enabled, the event table window of the specified decoding is displayed on the screen. The decoding information is shown in the event table.  Figure 19.19 I2S Decoding Event Table TIP
\- When you adjust the horizontal time base, the waveform displayed on the screen will also change, and the total number of lines containing the decoding information in the event table will also be changed. \- The displayed decoded data information in the bus is related to the value of the horizontal time base. Reducing the horizontal time base can help you view the detailed information.Set the Event Table Format
Click or tap the drop-down button of Format to select the display format of the event table. The available formats include "Hex", "Dec", "Bin", and "ASCII".Export
When the operating status of the instrument is STOP, you can export the time and corresponding decoding data from the current event table. Click or tap Export to enter the file export interface. You can export the data list to the internal memory or the external USB storage device (when detected) in "*.csv" format. The detailed export operation is similar to the save operation, you can refer to relevant descriptions in To Store and Load.19.8 FlexRay Decoding (Option)
FlexRay is a type of differential serial bus configured with three consecutive segments (i.e. packet header, payload, and packet trailer). The oscilloscope samples the FlexRay signal at the specified sample position and judges each data point as logic "1" or logic "0" according to the preset threshold level. The FlexRay decoding is required to specify the signal type and baud rate. In the Decode menu, click or tap the drop-down button of Bus Type to select FlexRay, then configure the parameters for FlexRay decoding.  Figure 19.20 FlexRay Decoding MenuBus Status
Click or tap the ON/OFF tab for Bus Status to enable or disable the bus decoding.Quickly Apply Trigger Settings to Decoding
Copy trig indicates applying the trigger settings to the specified decoding setting. Click or tap Copy Trig to apply the trigger settings to the specified decoding setting.19.8.1 Signal Configuration
Set the Source and the Threshold
\- You can select the analog channel or the digital channel as the source. \- When the source is set to an analog channel, you can set the threshold for the specified channel with the pop-up numeric keypad. You can also use the specified multifunction knob to set the threshold. When you modify the threshold, a dotted line displaying the current threshold level is displayed on the screen. It disappears in about 2 s after you stop modifying the threshold.Select the Signal
Click or tap "A" or "B" in Channel to select a channel that matches the actual FlexRay bus signal.Specify the Signal Rate
Click or tap the drop-down button of Baud to select a FlexRay baud rate that matches the FlexRay bus signal. The available baud rates include "2.5 Mbps", "5 Mbps", and "10 Mbps".Set the Signal Type
Click or tap the drop-down button of Signal to select a signal type that matches the actual FlexRay bus signal. The available signal types include "BP", "BM", and "RX/TX".Sample Position
Sample position is a point within a bit's time. The oscilloscope samples the bit level at this point. The sample position is represented by the proportion of "the time from the start of the bit to the sample point" to the "bit time", as shown in the figure below.  Figure 19.21 Sample Position Click or tap the input field of Sample Position to set the sample position of the FlexRay decoding with the pop-up numeric keypad. You can also use the specified knob to set it. The settable range is from 10% to 90%.19.8.2 Display-related Setting
In the Decode menu, set the following display-related parameters.Set the Display Format
Click or tap the drop-down button of Format to select the display format of the bus data and that of the event table. The available formats include "Hex", "Dec", "Bin", and "ASCII".Set the Label Display
Click or tap the ON/OFF tab for Label to enable or disable the label display of the decoding bus. When enabled, the bus label will be displayed at the upper-left side of the bus (when the bus display is enabled). The label shows the current bus type.19.8.3 Event Table
When the event table is enabled, the event table window of the specified decoding is displayed on the screen. The decoding information is shown in the event table.  Figure 19.22 FlexRay Decoding Event Table TIP
- When you adjust the horizontal time base, the waveform displayed on the screen will also change, and the total number of lines containing the decoding information in the event table will also be changed. - The displayed decoded data information in the bus is related to the value of the horizontal time base. Reducing the horizontal time base can help you view the detailed information.Set the Event Table Format
Click or tap the drop-down button of Format to select the display format of the event table. The available formats include "Hex", "Dec", "Bin", and "ASCII".Export
When the operating status of the instrument is STOP, you can export the time and corresponding decoding data from the current event table. Click or tap Export to enter the file export interface. You can export the data list to the internal memory or the external USB storage device (when detected) in "*.csv" format. The detailed export operation is similar to the save operation, you can refer to relevant descriptions in To Store and LoadInterpret the FlexRay Decoding Frame Structure
- TSS: Transmit Start Sequence, displayed as "TSS:". - Sync Frame: displayed as "SYNC:". - ID (Frame ID): expressed in Hex, displayed as "ID:". - PL (Payload Length): expressed in Hex, displayed as "PL:". - HCRC (Header Cyclic Redundancy Check): expressed in Hex, displayed as "HCRC:". When errors occur, it is displayed as a red patch. - CYC (Cycle Number): expressed in Hex, displayed as "CYC:". - Data: Its display format is the same as that of the bus data (Hex, Dec, Bin, or ASCII), displayed as "Data:". - TCRC (Tail Cyclic Redundancy Check): expressed in Hex, displayed as "TCRC":. When errors occur, it is displayed as a red patch.19.9 1553B Decoding (Option)
The oscilloscope samples the 1553B signal, and judges each data point to be logic "1" or logic "0" according to the preset threshold level. 1553B decoding is required to specify the data channel source and the threshold. In the Decode menu, click or tap the drop-down button of Bus Type to select 1553B, then configure the parameters for 1553B decoding.  Figure 19.23 1553B Decoding MenuBus Status
Click or tap the ON/OFF tab for Bus Status to enable/disable the bus decoding.Quickly Apply Trigger Settings to Decoding
Copy trig indicates applying the trigger settings to the specified decoding setting. Click or tap Copy Trig to apply the trigger settings to the specified decoding setting.19.9.1 To Set the Data Channel Source and the Threshold
Select the Data Channel
You can select the analog channel or the digital channel as the source for the data source.Set the Threshold
When an analog channel is selected as the source, you can set the threshold for the specified channel with the pop-up numeric keypad. You can also use the specified multifunction knob to set the threshold. When you modify the threshold of the channel, a dotted line displaying the current threshold level is displayed on the screen. It disappears in about 2 s after you stop modifying the threshold.19.9.2 Event Table
When the event table is enabled, the event table window of the specified decoding is displayed on the screen. The decoding information is shown in the event table.  Figure 19.24 1553B Decoding Event Table TIP
\- When you adjust the horizontal time base, the waveform displayed on the screen will also change, and the total number of lines containing the decoding information in the event table will also be changed. \- The displayed decoded data information in the bus is related to the value of the horizontal time base. Reducing the horizontal time base can help you view the detailed information.Set the Event Table Format
Click or tap the drop-down button of Format to select the display format of the event table. The available formats include "Hex", "Dec", "Bin", and "ASCII".Export
When the operating status of the instrument is STOP, you can export the time and corresponding decoding data from the current event table. Click or tap Export to enter the file export interface. You can export the data list to the internal memory or the external USB storage device (when detected) in "*.csv" format. The detailed export operation is similar to the save operation, you can refer to relevant descriptions in To Store and Load.Interpret the 1553B Decoding Frame Structure
- C/S: command/status word, displayed as "C/S". - RTA: remote terminal address of the command/status word, displayed as "RTA:" - C/S data: the rest data value of the command/status word. Its display format is the same as that of the bus data (Hex, Dec, Bin, or ASCII), displayed as "C/S:" \- Parity bit: displayed as a yellow-green patch; when errors occur, it is displayed as a red patch. \- Data word data: data of the data word. Its display format is the same as that of the bus data (Hex, Dec, Bin, or ASCII), displayed as "Data:".20 Multi-pane Windowing
This series oscilloscope supports multi-pane windowing. You can add multiple windows and result display windows for display and view. Click or tap > Windows to enter the "Add Window" menu. You can also click or tap the Windows icon on the toolbar to enter the enter the "Add Window" menu.  Figure 20.1 Add Window InterfaceAdd Diagram Windows
1. First, select the desired waveform window in the Diagram menu, then you can preview the corresponding waveform and parameter settings at the top of the interface. 2. You can set the parameters such as Source according to your needs. For detailed setting methods, refer to descriptions of relevant chapters. 3. Click or tap Add, then the selected diagram is displayed on the screen.Add Result List Window
Click or tap Measure, All Measure, or Decode under the Result List menu. Then the results of the selected item are displayed in the preview section of the current interface. Click or tap Add, the measurement results window of the selected item will be displayed on the screen.21 Waveform Recording and Playing
Records the waveforms and plays back the recorded waveforms to make an analysis of the waveforms. To enter the waveform recording menu, perform one of the following operations. - Click or tap the function navigation icon at the lower-left corner of the screen to open the function navigation menu. Click or tap to select Record to enter the waveform recording interface. - Click or tap the Record icon on the quick operation toolbar to enter the waveform recording interface. - Press Analyse on the front panel, then the Analyse interface is displayed. Click or tap Record to enter the waveform recording interface.  Figure 21.1 Waveform Recording Interface21.1 Common Settings
Recording Operation
Click or tap the ON/OFF tab for the Enable menu in the Record & Play interface to enable or disable the waveform recording and playing function. Before recording the waveform, you can refer to descriptions in Record Options to set the waveform recording parameters. \- Click or tap the Record icon to start recording the waveforms. Then the record icon turns from to . - The figure at the right side of the recording progress bar shows the number of currently recorded frames and the total number of frames that can be recorded (Number of Currently Recorded Frames/Total Number of Frames that can be Recorded). During the recording, the current recording information updates in a real-time manner on the screen, and the number of currently recorded frames changes constantly. • After the recording is completed, turns out to be and recording stops automatically. - During recording, you can also click or tap to suspend recording manually.  Total FramesPlay Operation
Click or tap the play icon in the Play menu to start to play the recorded waveforms. The play icon turns from to the pause action icon . For details about playing, refer to descriptions in Play Options. During waveform playing, the value of Current changes dynamically. During playing, you can also click or tap the icon again to suspend playing manually. ΔT indicates the time interval between the current frame played and the first frame.Storage
Click or tap Storage, then it goes to the storage interface. For the detailed operation, refer to descriptions in To Save the Wave to save the recorded waveforms based on the settings.21.2 Record Options
During the waveform recording, the oscilloscope records the waveforms of the currently enabled channel at a specified interval until you manually stops the recording operation or the number of recorded frames has reached the set value. Before recording the waveforms, set the following parameters.1. Interval
Indicates the time interval between the frames during the recording process. Click or tap the input field of Interval to set the interval between frames with the pop-up numeric keypad. You can also rotate the specified multifunction knob indicated in the field to set the value. The available range is from 10 ns to 1 s.2. Frames
Indicate the number of frames that can be recorded actually. After starting the recording operation, the oscilloscope will stop the recording operation automatically when the number of recorded frames reaches the set value. Click or tap Frames to set the number of frames that can be recorded with the pop-up numeric keypad. You can also rotate the specified multifunction knob indicated in the field to set the value. The available range is from 1 to the maximum number of frames that can be recorded currently.3. Max Frames
Indicates the maximum number of frames that can be recorded. Click or tap Max which is at the right of the field of Frames, and the maximum number of recorded waveform frames is automatically input into the input field of Frames. As the capacity of the waveform memory is fixed, the more the number of points each frame of waveform has, the less the number of waveform frames that can be recorded. Therefore, the maximum number of recorded frames is related to the currently selected "memory depth" (refer to Memory Depth). The number of points per frame of waveform refers to the current memory depth. Memory Depth ≥ Sample Rate x Horizontal Time Base x Number of Grids in the Horizontal Direction on the Screen. Therefore, the Max Frames value of waveform recording is also related to the "Sample Rate" and "Horizontal Time Base".4. Beeper
Sets whether to enable the beeper after the recording process is completed.  the beeper sounds after recording is completed.  the beeper does not sound after recording is completed.21.3 Play Options
Play back the waveforms currently recorded. In the Play section, click or tap the ON/OFF tab for the Minimize menu to select whether to minimize the Play operation window. If you select ON, the play operation window is minimized, making the interface simple, distinctive, and easy to use, as shown in the figure below.  Figure 21.2 Minimized Window of Play Operation Interface Before playing the waveforms, set the following parameters.1. Play Mode
Plays the waveforms in single mode (☐) or cycle mode (☐) click or tap the first icon at the bottom of the Play option menu to switch the play mode. - plays from the start frame to the end frame, and then stops automatically. - : Plays from the start frame to the end frame, then such playback operation is repeated until you stop it manually.2. Playback Sequence
Plays back the waveforms clockwise ( ) or counterclockwise ( ). Click or tap the last icon at the bottom of the Play option menu to switch the playback sequence. - plays from the start frame to the end frame. - : plays from the end frame to the start frame.3. Interval
Indicates the time interval between the frames during the playing process. Click or tap the input field of Interval to set the interval between frames with the pop-up numeric keypad. You can also rotate the specified multifunction knob indicated in the input field to set the value. The available range is from 1 ms to 1 s.4. Start Frame
Click or tap the input field of "Start Frame" shown in Figure 21.2 to set the start frame to be played back with the pop-up numeric keypad. You can also rotate the specified multifunction knob indicated in the input field to set the value. The default is 1, and the maximum value is the maximum number of waveform frames that have been recorded.5. End Frame
Click or tap the input field of "End Frame" shown in Figure 21.2 to set the end frame to be played back with the pop-up numeric keypad. You can also rotate the specified multifunction knob indicated in the input field to set the value. The default value is the number of waveform frames that have been recorded.6. Current Frame
When stopping playing back, click or tap the input field of Current shown in Figure 21.2 to set the currently displayed frame with the pop-up numeric keypad. You can also rotate the specified multifunction knob indicated in the input field to set the value. The max. value for the current frame is the max. number of frames that have been recorded.22 Search and Navigation Function
The search function can help you quickly locate the concerned events and make a mark. Then, you can use the specific navigation arrow keys to quickly locate the specified event. The search type can be set to Edge or Pulse. The navigation function guides users to quickly locate and view the specified waveforms. You can navigate by time and event.22.1 Search Function
The search function allows you to search the specified Edge or Pulse event, then marks it with an upside-down triangle icon ( ) To enter the Search menu, perform any of the following operations: \- Click or tap the function navigation icon at the lower-left corner of the screen to enter the function navigation. Click or tap Search to enter the search menu. \- Click or tap Search in the Navigation interface to enter the search menu.  Figure 22.1 Search Menu Enable or Disable the Search Function Click or tap the ON/OFF tab for Search to enable or disable the search function. TIP
When the search function is enabled, Zoom Mode (Delayed Sweep) is automatically enabled.Select the Search Type
Select "Edge" or "Pulse" as the search type. - Edge search: After selecting "Edge" as the search type, set the edge type and threshold. For detailed setting methods, refer to Edge Trigger. - Pulse search: After selecting "Pulse" as the search type, set the pulse polarity, search condition, and threshold. For detailed setting methods, refer to Pulse Trigger.Set the Source
Selects an analog channel as the source of the search function.Copy Trigger
- To Trigger
Click or tap To Trigger to copy the selected search type settings to the same trigger type. For example, if the current search type is "Edge", click or tap To Trigger to copy the edge search settings to "Edge Trigger" settings.- From Trigger
Click or tap From Trigger to copy the trigger settings to the specified search type settings. For example, if the current search type is "Edge Trigger", click or tap From Trigger to copy the Edge trigger settings to the "Edge" search settings. NOTE
If you select "From Trigger", you need to set the search type first, and then copy the trigger type settings from the trigger menu.Enable or Disable the Mark Table
When the mark table is enabled, the mark table is displayed, as shown in the figure below. The mark table lists the mark events of the waveforms displayed in the current waveform view. When you zoom or pan to adjust the waveforms, the events in the mark table will change. You can perform the following operations on the mark table. \- When the instrument is in STOP state, click or tap any row in the mark table to select the specified event. The upside-down triangle that marks the selected event turns red (☐). - Click or tap the icon at the upper-right corner of the mark table to open the Search menu. - Clicking on the mark table title bar indicated in gray and long holding the mouse to drag the mark table to adjust its position on the screen. - Click or tap the icon at the upper-right corner of the table to close the mark table.| Index | Time | EventCount | Info |
| 1 | -50us | 1 | Rising edge |
| 2 | -49.59us | 1 | Rising edge |
| 3 | -48.79us | 1 | Rising edge |
| 4 | -47.99us | 1 | Rising edge |
| 5 | -47.19us | 1 | Rising edge |
| 6 | -46.39us | 1 | Rising edge |
| 7 | -45.59us | 1 | Rising edge |
| 8 | -44.79us | 1 | Rising edge |
| 9 | -43.99us | 1 | Rising edge |
| 10 | -43.19us | 1 | Rising edge |
Navigation
Click or tap Navigation to go to the navigation interface. You can also refer to Navigation Function to navigate by search event.Save the Search Event
You can save the event mark data to the internal memory or external USB storage device in "*.csv" format. Click or tap Save Events to enter the event saving interface. Please refer to descriptions in To Save a Fileto save the event mark data to the internal or external memory. NOTE
This series oscilloscope only supports the flash memory USB storage device of FAT32 format.22.2 Navigation Function
The navigation function includes the time navigation and search event navigation. To enter the Navigation interface, perform any of the following operations: \- Press on the front panel to enter the "Navigation" menu. \- Click or tap the Navigate icon on the toolbar at the upper-right part of the screen to enter the Navigation menu. \- In the Search interface, click or tap the Navigation button to enter the Navigation setting menu.  Figure 22.3 Navigation Menu Clicking or tapping the icon can minimize the Navigation window, making the interface simple and clear, as shown in the figure below.  Figure 22.4 Minimized Navigation Window (Time Navigation)NOTE
The navigation function is only available when the operating status of the oscilloscope is STOP.Time Navigation
After stopping data acquisition, use the navigation control buttons in the Navigation interface to play forward and backward the captured waveforms. You can also use the navigation combination keys ◀ □ ▶ on the horizontal control area on the front panel to control the waveforms. \- After selecting time navigation, click or tap to start to play the waveforms.  \- During the play, click or tap to play backward, then stops automatically until it plays back to the start; click or tap to play forward, then stops automatically until it reaches the end. \- When it stopped playing, click/tap or to move backward or forward the waveforms. \- Click or tap to go to the start segment of the waveforms to be played. Click or tap to go to the last segment of the waveforms to be played. Click or tap the drop-down button of Speed to select the play speed of the waveforms.Search Event Navigation
When you enable the navigation function and complete the event search, you can use the navigation combination keys to quickly navigate the specific event in the event mark table.  Figure 22.5 Search Event Navigation Interface After selecting the "Search Event" navigation, click or tap Search to set the search conditions. The search event type can be set to "Edge" or "Pulse", which shall be consistent with the search type specified in Search menu. Click or tap to navigate to the previous event (the serial number in the mark table decreases); click or tap to navigate to the next event (the serial number in the mark table increases); click or tap to go to the first event; click or tap to go the last event.23 Display Control
In the Display setting menu, you can set the type, persistence time, waveform intensity, grid type, grid brightness, and etc. Click or tap the function navigation icon  at the lower-left corner of the screen, and then select Display to enter the "Display" menu. You can also click or tap the icon at the upper-right of the Waveform View to enter the "Display" menu.  Figure 23.1 Display Setting Menu23.1 Display Type
This series oscilloscope provides the "Vector" display mode in which the sample points are connected by lines and displayed. In most cases, this mode can provide the most vivid waveform for you to view the steep edge of the waveform (such as square waveform).23.2 Persistence Time
In the Display setting menu, click or tap the drop-down button of Persistence Time to select the persistence time from the drop-down list. The available values are Min, variable persistence (100 ms, 200 ms, 500 ms, 1 s, 2 s, 5 s, 10 s), and Infinite. The following section illustrates the waveform effects of the frequency sweep signal of the Sine waveform when you make a different choice in persistence time.- Min
Enables you to view waveform changing in high refresh rate.- Variable Persistence
Enables to view glitches that change relatively slowly or glitches with lower occurrence probability after a certain amount of persistence time that you set. The persistence time can be set to 100 ms, 200 ms, 500 ms, 1 s, 2 s, 5 s, or 10 s.- Infinite
In this mode, the oscilloscope will never clear the previous acquisitions of the waveforms while acquiring the new waveforms. The previous acquisitions of the waveforms will be displayed in relatively low-brightness color and the newly acquired waveforms will be displayed in normal brightness and color. You can use infinite persistence to measure noise and jitter and to capture events that occur infrequently.23.3 Waveform Intensity
In Display menu, drag the slide bar of Wave Intensity to set the brightness of waveforms. The default is 50%, and the range available is from 1% to 100%.23.4 To Set the Screen Grid
In the Display setting menu, click or tap "FULL", "HALF", or "NONE" for the Grid menu.  - FULL: turns the background grid and main coordinates on. - HALF: turns the main coordinates off, with the background grid on. - NONE: turns the background grid and main coordinates off.23.5 Display Setting
Grid Brightness
In the Display setting menu, drag the slide bar of Grid Brightness to set the grid brightness. The default is 50%, and the range available is from 0% to 100%.Window Transparency
In the Display setting menu, drag the slide bar of Window Transparency to set the window transparency. The default is 50%, and the range available is from 0% to 100%.Cursor Brightness
In the Display setting menu, drag the slide bar of Cursor Brightness to set the cursor brightness. The default is 80%, and the range available is from 0% to 100%.23.6 Show Scale
In the Display setting menu, click or tap the ON/OFF tab for Show Scale to enable or disable the scale display on the screen. By default, it is ON.23.7 Color Grade
In the Display setting menu, click or tap the ON/OFF tab for Color Grade to enable or disable the color grade. By default, it is OFF. When enabled, different colors are displayed on the screen to indicate the times of data acquisition or acquisition probability.23.8 Waveform Freeze
In the Display setting menu, click or tap the ON/OFF tab for Waveform Freeze to enable or disable the waveform freeze function. By default, it is ON. When enabled, the oscilloscope displays the waveform that has undergone multiple samplings and superpositions after sampling is stopped when you click or tap the STOP/RUN icon on the quick operation toolbar or press on the front panel. If disabled, the last triggered waveform is displayed.24 To Store and Load
You can save the current setups, waveforms, screen image, and parameters of the oscilloscope to the internal memory or external USB storage device (such as USB storage device) in various formats and recall the stored setups or waveforms when necessary. You can also load the upgrade software to the system and perform the upgrade operation for the instrument. You can also copy, delete, or rename the specified type of file from the internal memory or external USB storage device via the disk management menu. This oscilloscope provides two USB HOST interfaces on the front panel, which can all be connected to the USB storage device for external storage. The USB storage devices connected are marked as "Removable USB Disk (D)" and "Removable USB Disk (E)". TIP
This oscilloscope only supports the flash memory USB storage device of FAT32 format.24.1 To Enter the Storage Menu
You can enter the storage setting menu in the following ways. - Click or tap the function navigation icon at the lower-left corner of the screen, and then select Storage to enter the storage setting menu. - Click or tap the Storage button on the toolbar to enter the storage setting menu. In the Storage setting menu, there are three sub-menus (Save, Load, and Upgrade) for you to choose. Select the specified sub-menu and configure the corresponding parameters.24.2 To Save a File
In the Storage interface, click or tap the Save tab to enter the file saving menu.  Figure 24.1 Storage Menu This oscilloscope allows you to save the image, waveforms, and setup files in various format. After completing the parameter settings, save the file according to the following steps. 1. Click or tap the input field of File Name, then input the filename with the pop-up virtual keypad. 2. Click or tap the input field of File Path, then the disk management interface is displayed. In the disk management interface, select the destination storage path, then click or tap OK to set the storage path for the saved file. For the disk management operation, refer to descriptions in Disk Management. When no USB storage device is inserted, by default, the storage path is "Local Disk". When a USB storage device is detected, "D:" automatically appears in the file path. 3. Click or tap the ON/OFF tab for Overlay to enable or disable the file overwriting. When enabled, the existing file in the specified file path will be overwritten by the newly saved file that has the same filename as the existing one. 4. Click or tap Save to save the file based on the current settings. Then the storage menu is closed.NOTE
 The filename can contain letters, numbers, and other non-Chinese characters. The length of the filename shall not exceed 16 characters. Neither the file name nor file path shall contain any special characters such as "#" and ",".24.2.1 To Save the Image
In the Storage menu, click or tap the Save tab to enter the save operation menu. In this menu, click or tap the drop-down button of Choose to select "Save Image" to enter the "Save Image" setting menu. Set the relevant parameters and save the image to the internal or external memory, as shown in Figure 24.1.Image Format
Click or tap the drop-down button of Format to select "*.png", "*.bmp", or "*.jpg" from the drop-down list. Then the screen image will be saved to the internal or external memory in ".png", ".bmp", or ".jpg" format.Invert
Click or tap the ON/OFF button for the Invert menu to enable or disable the waveform invert function.Color
Click or tap "Color" or "Gray" for Color to select the desired storage color.Header
Click or tap the ON/OFF tab for Header to enable or disable the display of the header. If you select "ON", the instrument model and the image creation date will be displayed in the header of the image when you save the image file. TIP
Refer to Quick Operation. When the quick operation type is set to "Save Image", or set to "Save Group" with "Save Image" being selected, pressing the front-panel quick operation key can quickly save the image.24.2.2 To Save the Wave
In the Storage menu, click or tap the Save tab to enter the save operation menu. In this menu, click or tap the drop-down button of Choose to select "Save Wave" to enter the "Save Wave" setting menu. The main setting information (e.g. "On/Off" state of the channel, vertical scale, and horizontal time base) and waveform data of all enabled channel will be save to the internal or external memory.  Figure 24.2 Waveform Saving Setting MenuSet the Source of the Waveform Data
The available sources of the waveform data are as follows: - Screen: waveforms displayed on the screen. • Memory: waveforms from the memory. - Record: waveforms that have been recorded. For details about the recorded waveforms, refer to Waveform Recording and Playing.Set the Waveform Format
The available formats of the waveform data are as follows: - When the data source is "Screen", the available formats are "*.bin" and "*.csv". - When the data source is "Memory", the available formats are "*.bin", "*.csv", and "*wfm". - When the data source is "Record", the available format is "*.csv". TIP
Refer to Quick Operation. When the quick operation type is set to "Save Wave", or set to "Save Group" with "Save Wave" being selected, pressing the front-panel quick operation key can quickly save the waveform file.24.2.3 To Save the Setup
In the Storage menu, click or tap the Save tab to enter the save operation menu. In this menu, click or tap the drop-down button of Choose to select "Save Setup" to enter the "Save Setup" setting menu. Save the settings of the oscilloscope to the internal or external memory in "*.stp" format. When loading, the stored settings can be recalled.  Figure 24.3 Setup Saving Setting Menu Refer to Quick Operation. When the quick operation type is set to "Save Setup", or set to "Save Group" with "Save Setup" being selected, pressing the front-panel quick operation key Quick can quickly save the setup file.24.2.4 Binary Data Format (.bin)
Binary data format stores waveform data in binary format and provides data headers that describe these data. As data are displayed in binary format, its file size is much more smaller than that in ASCII format. If several channels are enabled, then all the displayed channels will be saved (save the first channel then save the second, and then it goes on like this until all the displayed channels are saved). Table 24.1 BIN File Format| File Header | Waveform Header | Waveform Data Header | Channel Data | Waveform Header | Waveform Data Header | Channel Data |
Binary Header Format
1. File Header
There is only one file header in a binary file. The file header contains the following information. Table 24.2 File Header| Cookie | Two-byte characters, RG, indicating that the file is the RIGOL binary data file format. |
| Version Two-byte, indicating the file version. | |
| File Size | An 8-byte long integer, indicating the number of bytes in the file. It includes the header. |
| Number of Waveforms | A 4-byte integer, indicating the number of waveforms that are stored in the file. |
2. Waveform Header
It is possible to store several waveforms in the file. Each stored waveform has a waveform header. When several channels are stored, each channel can be considered as a separate waveform. The waveform header contains the information about the type of waveform data that are stored following the waveform data header. Table 24.3 Waveform Header| Header Size A 4-byte integer, indicating the number of bytes in the header. | |
| Waveform Type | A 4-byte integer, indicating the type of the waveform stored in the file. It is fixed to 1.- 0 = Unknown- 1 = Normal- 2 = Peak Detection- 3 = Average- 4 = Not Used- 5 = Not Used- 6 = Logic |
| Number of Waveform Buffers | A 4-byte integer, indicating the number of waveform buffers required to read the data. It is fixed to 1. |
| Number of Points | A 4-byte integer, indicating the number of waveform points in the data. |
| Count A 4-byte integer. It is fixed to 0. | |
| X Display Range | A 4-byte float, indicating the X-axis duration of the waveform that is displayed. For time-domain waveforms, it indicates the duration of the display. If the value is zero, then no data has been acquired. |
| X Display Origin | An 8-byte double-precision floating-point, indicating the X-axis value at the left edge of the screen. For time-domain waveforms, it indicates the time at the start of the display. The value is treated as a double precision 64-bit float point number. If the value is zero, then no data has been acquired. |
| X Increment | An 8-byte double-precision floating-point, indicating the duration between data points on the X-axis. For time-domain waveforms, it indicates the time between points. If the value is zero, then no data has been acquired. |
| X Origin | An 8-byte double-precision floating-point, indicating the X-axis value of the first data point in the data recording. For time-domain waveforms, it indicates the time of the first point. The value is treated as a double precision 64-bit float point number. If the value is zero, then no data has been acquired. |
| X Units | A 4-byte integer, indicating the unit of measurement for X values in the acquired data. It is fixed to 2.- 0 = Unknown- 1 = Volts (V)- 2 = Seconds (s)- 3 = Constant- 4 = Amps (A)- 5 = Decibel (dB)- 6 = Hertz (Hz) |
| Y Units | A 4-byte integer, indicating the unit of measurement for Y values in the acquired data. The possible values are listed above under X Units. |
| Date | A 16-byte character array, indicating the date when the file is saved. |
| Time | A 16-byte character array, indicating the time when the file is saved. |
| Model | A 24-byte character array in the format of MODEL#:SERIAL#, indicating the oscilloscope's model and serial number. |
| Channel Name | A 16-byte character array that contains the label assigned to the waveform. |
3. Waveform Data Header
A waveform may have multiple data sets. Each waveform data set has a waveform data header. The waveform data header consists of information about the waveform data set. The header is stored before the data set. Table 24.4 Waveform Data Header| Header Size | A 4-byte integer, indicating the number of bytes in the waveform data header. |
| Buffer Type | A 2-byte integer, indicating the type of the waveform data stored in the file.- 0 = Unknown- 1 = Normal 32-bit float data- 2 = Maximum float data- 3 = Minimum float data- 4 = Not Used- 5 = Digital unsigned 8-bit character data (for digital channels) |
| Bytes Per Point | A 2-byte short integer, indicating the number of bytes per data point. |
| Buffer Size | An 8-byte long integer, indicating the number of bytes of the current channel waveform data. |
24.3 To Upload the File via the FTP Server
Use the USB storage device to copy the file from the PC to the local disk of the oscilloscope. You can also upload it via the FTP server to the local disk of the oscilloscope. The operation procedures are as follows: 1. Connect the oscilloscope to the network via the LAN interface. Then obtain the IP address. For example, 192.68.0.1. 2. Open the file explorer of the PC or the browser, then input "ftp://192.68.0.1/" (quotation marks not included) into the address bar to access the file manager of the oscilloscope. 3. Copy the file from the PC to the file manager of the oscilloscope. After uploading the file, you can view the file in the disk management interface of the oscilloscope. NOTE
When you choose to upload the file via the FTP server, note that the name of the file that you upload shall not contain any Chinese characters.24.4 To Load the Setup File
In the Storage interface, click or tap the Load tab to switch to the load menu. Under this menu, you can load the setup file to the instrument from the internal or external memory.  Figure 24.4 Setup File Loading Interface To load the setup file, perform the following procedures. 1. Click or tap the drop-down button of Choose to select "Load Setup". By default, only "Load Setup" is available for you to choose currently. 2. Click or tap the drop-down button of Choose to select "*.stp". The default file type is "*.stp", and no other options are available. 3. Click or tap the input field of File Path. Then Disk Management is displayed. You can select the desired setup file from the specified file path. 4. Click or tap Load to load the setup file to the oscilloscope. Then the setup parameters of the oscilloscope will be loaded and updated to keep consistent with that in the setup file.24.5 Upgrade
This instruments supports local upgrade and online upgrade.Local Upgrade
1. In the storage setting menu, click or tap Upgrade to enter the local upgrade setting menu.  Figure 24.5 Upgrade Menu 2. Click or tap the input field of File Path, then the disk management interface is displayed. Select the upgrade file. For detailed operations, refer to descriptions in Disk Management. 3. Click or tap Upgrade to complete the local upgrade.Online Upgrade
1. First ensure that the rear-panel LAN interface is connected to the network (if you do not have the access to the Internet, please ask the administrator to grant you permission to access the network). 2. Click or tap the function navigation icon 📁 at the lower-left corner of the screen to enter the function navigation. 3. Then click or tap the Upgrade icon to perform the upgrade operation.24.6 Disk Management
To enter the storage setting menu, perform the following operations: - Click or tap the function navigation icon at the lower-left corner corner of the screen, and then select Storage to enter the storage setting interface. - Click or tap the Storage icon on the quick operation toolbar to enter the storage setting interface. In the storage setting interface, click or tap Disk to enter the disk management interface.  Figure 24.6 Disk Management Interface In the disk management menu, you can perform the following operations:Select a Disk
Before using the external storage device, make sure that a USB storage device (FAT32 format, flash memory) is connected properly. By default, Local Disk (Disk C) is displayed. If an external storage device is inserted, the available disks include "Local Disk (C)", "Removable USB Disk (D/E...)". If you select an external storage device, for example, Removable USB Disk (D), you can view the storage contents in it.Create a Folder
Click or tap New Folder, then a folder name input keyboard is displayed. For the name input method, refer to descriptions in Parameter Setting Method. Click or tap any place on the Storage interface to exit the keyboard interface.Clear the Internal Memory
In the Disk interface, click or tap Safe Clear, then a prompt message "Clear all data from the internal memory?" is displayed. Click or tap Yes to confirm the clear operation. Click or tap No to cancel safe clear operation.Select the File
Before operating on the file or folder, first select the desired file or folder. Click or tap the check box at the right side of the folder, if checked, it is selected, with an icon √ being displayed. Click/tap the check box again or click/tap deselect it. The check box restores its original state. You are allowed to select multiple files or folders in one time to perform the relevant operation. You can also click or tap the icon at the upper-right corner of the interface to select all the files and folders under the current disk. Click or tap cancel the select-all operation. Cut, Copy, and Paste a File or a Folder
- Cut a File or a Folder to a Destination Path
Select a specified file or a folder. Click or tap Cut, then select a destination path. Click or tap Paste to paste the desired file or folder to the destination path, and complete the operation.- Copy a File or a Folder to a Destination Path
Select a specified file or a folder. Click or tap Copy, then select a destination path. Click or tap Paste to paste the desired file or folder to the destination path, and complete the operation.Delete a File or a Folder
In the current folder, select the file or folder to be deleted. Click or tap Delete, then a prompt message "Are you sure to delete the file?" is displayed. Click or tap OK to delete the file. Click or tap Cancel to cancel the deletion operation.Rename a File or a Folder
Select a specified file or a folder, then click or tap Rename to input a new filename or folder name with the pop-up numeric keypad. Then, the rename operation is completed.25 System Utility Function Setting
In the Utility menu, you can set the I/O parameters and the system-related function parameters. You can enter the "Utility" menu in the following ways. \- Click or tap the Notification Area at the lower-right corner of the screen. Then the Utility menu is displayed. \- Click or tap the function navigation icon at the lower-left corner of the screen, and then select Utility to enter the Utility menu.25.1 I/O Setting
In the Utility menu, click or tap I/O to enter the I/O setting menu to configure the following parameters.Network Status
Different prompts will be displayed according to the current network connection status. • Network Config Succeeded! • Acquiring IP... \- IP Conflict! • DISCONNECTED! \- DHCP Config Failed \- Read Status Fail! \- CONNECTED \- Invalid IP • IP lost \- Please wait...MAC Address
The MAC address of each oscilloscope is unique. When assigning the IP address for the oscilloscope, the system uses the MAC address to identify the instrument.VISA Address
Displays the VISA address currently used by the instrument.IP Configuration Type
The configuration type of the IP address can be DHCP, Auto IP, or Static IP. In different IP configuration types, the configurations for IP address and other network parameters are different.• DHCP
If "DHCP" is selected, the DHCP server in the current network will assign the network parameters (e.g. IP address, Subnet, Gateway, and DNS) for the instrument.- Auto IP
When "Auto IP" is selected, the instrument will acquire the IP address ranging from "169.254.0.1" to "169.254.255.254" and the subnet mask (255.255.0.0) automatically based on the current network configuration. The "Auto IP" works only when "DHCP" is not selected or connection is failed.- Static IP
If "Static IP" is selected, the instrument is configured with static IP. In this case, you need to disable DHCP and Auto IP manually. At this time, you need to set the IP address, Subnet, Gateway, and DNS manually. At this time, you can self-define the network parameters (e.g. IP address) of the instrument.- Set the IP address
The format of the IP address is nnn.nnn.nnn.nnn. The range of the first segment (nnn) of the address is from 0 to 255 (except 127); wherein, the valid range is from 0 to 223. The range for the other three segments is from 0 to 255. You are recommended to ask your network administrator for an IP address available. This setting will be saved to the non-volatile memory. If "Load Last" is set to "Last", then DHCP and Auto IP are disabled at the next power-on, and the instrument will load the IP address that you set last time automatically.- Set the subnet mask
The format of the subnet mask is nnn.nnn.nnn.nnn. Wherein, the range of first segment (nnn) of the address is from 0 to 255. You are recommended to ask your network administrator for a subnet mask available. This setting will be saved in the non-volatile memory. If "Load Last" is set to "Last", then DHCP and Auto IP are disabled at the next power-on, and the instrument will load the subnet mask that you set last time automatically.- Set the default gateway
You can set this parameter in Static IP mode. The format of the gateway is nnn.nnn.nnn.nnn. The range of the first segment (nnn) is from 0 to 223 (except 127), and the range for the other three segments is from 0 to 255. You are recommended to ask your network administrator for a gate address available. This setting will be saved in the non-volatile memory. If "Load Last" is set to "Last", then DHCP and Auto IP are disabled at the next power-on, and the instrument will load the subnet mask that you set last time automatically.- Set the DNS address
You can set this parameter in Static IP mode. The format of the DNS address is "nnn.nnn.nnn.nnn". The range for the first segment (nnn) of the address is from 0 to 223 (except 127); and the range for the other three segments is from 0 to 255. You are recommended to ask your network administrator for an address available. Generally, you do not need to set the DNS, therefore this parameter setting can be ignored. TIP
- When the three IP configuration types are all turned on, the priority of the parameter configuration from high to low is "DHCP", "Auto IP", and "Static IP". - The three IP configuration types cannot be all turned off at the same time.mDNS
Click or tap the ON/OFF tab for mDNS to enable or disable the multicast Domain Name System (mDNS). This system is used to provide the function of DNS server for service discovery in a small network without a DNS server.Host Name
The length of the host name is a string of 26 characters at most.GPIB
When controlling the instrument via the GPIB, first use the USB-GPIB module to extend a GPIB interface, then use the GPIB cable to connect it to the PC. Configure the GPIB address. Its settable range is from 1 to 30. By default, it is 1.Apply the Network Parameter Setting
Click or tap Apply to apply the current network parameter setting.25.2 Basic Settings
In the Utility menu, click or tap Setup to enter the basic setting menu.Language
This product supports menus in multiple languages. The help information, prompt messages, and interface can be displayed in multiple languages. Click or tap the drop-down button of Language to select the specified system language from the drop-down list.Screen Brightness
Drag the slide to set the screen brightness. Its range is from 1% to 100%.Load Last
You can set the system configuration to be recalled when the oscilloscope is powered on again after power-off. Click or tap "Default" or "Last" for Load Last. - Last: restores the system to its last setting at last power-off. - Default: restores the system to its factory setting.Power Status
- Switch Off: After the oscilloscope is connected to power, you need to press the Power key on the front panel to power on the instrument. - Switch On: After the oscilloscope is connected to power, it will be powered on automatically.Beeper
Click or tap the ON/OFF tab for Beeper to enable or disable the beeper. When the beeper is enabled, you can hear the sound of the beeper when you perform the following operations: - Press a key or a menu key on the front panel - Operate on the touch screen - When a prompt message is displayedAUX Out
Click or tap to select the desired signal type output from the rear-panel [AUX OUT] connector. The available signal types are "TrigOut" and "PassFail". \- TrigOut: After this type is selected, at each trigger (hardware trigger), the oscilloscope outputs a signal from the [AUX OUT] connector on the rear panel that can reflect the current capture rate of the oscilloscope. If this signal is connected to a waveform display device to measure the frequency, it can be found that the measurement result is the same as the current capture rate. When the AUX Out menu is set to "TrigOut", then in the pass/fail test menu (click or tap > Pass/Fail to enter the pass/fail test menu), the Aux Output menu item is automatically disabled. \- PassFail: After this type is selected, the instrument can output a positive or negative pulse via the [AUX OUT] connector when a successful or failed event is detected. When the AUX Out menu is set to "PassFail", then in the pass/fail test menu (click or tap > Pass/Fail to enter the pass/fail test menu), the Aux Output menu item is automatically enabled. For the parameter settings such as pulse width, polarity, and output event of the pulse signal output from the connector, you can set it in the "Option" menu of the "PassFail" interface. For details, refer to To Set the Output Form of the Test ResultsOperation Lock
When enabled, both the touch screen operation and the front-panel keys except the Power key are disabled. You cannot operate with the touch screen and front-panel keys and knobs. To unlock the operation, press the front-panel channel keys CH1 (1), CH3 (2), CH2 (3), and CH4 (4) in sequence to unlock the operation.Vertical Expansion
Click or tap to select the way to expand or compress the waveform. It can be set to "Center" or "GND". \- Center: when the vertical scale is changed, the waveform will be expanded or compressed around the screen center. \- GND: when the vertical scale is changed, the waveform will be expanded or compressed around the signal ground level position.Display Time
Click or tap the ON/OFF tab for Display Time to enable or disable the display of the system time. When enabled, the system time (date and time) is displayed in the Notification Area at the lower-right corner of the screen. The date is displayed in "yyyy/mm/dd" format, and the time is displayed in "hh:mm:ss" format. You can enable or disable the display of system time when saving the waveform. When enabled, the saved file will contain the system time information. \- Date: Click or tap the "Date" area, then the date setting interface is displayed. Drag the year, month, and day section up and down respectively to set the date. Click or tap OK to confirm the date modification. Click or tap the close window icon to cancel the date modification and exit the menu. You can also click or tap any place other than the date setting interface to exit the date modification menu. - Time: Click or tap the "Time" area, then the time setting interface is displayed. Drag the hour and minute section up and down respectively to set the time. Click or tap OK to confirm the time modification. Click or tap the close window icon to cancel the time modification and exit the menu. You can also click or tap any place other than the time setting interface to exit the time modification.25.3 About this Oscilloscope
In Utility menu, click or tap About, and then you can view the model, version, and other information about this instrument in About menu. \- Model Indicates the product model. \- Serial Number Indicates the serial number, the unique identification for the product. \- Firmware Indicates the firmware version number of the product. \- Hardware Indicates the hardware version number of the product. \- Build Indicates the creation time of the software version. \- Android.Build Indicates the creation time of the Android operating system. \- Android.Version Indicates the version number of the Android operating system. For example, 7.1.0. \- Launcher Indicates the desktop UI version number of the Android operating system. \- WebControl Indicates the version number of browser remote control module.25.4 Other Settings
EXT 10M IN
Indicates the rear-panel [10MHz REF IN] reference clock input interface. When ON, the interface is enabled; when OFF, the interface is disabled.Open Source Acknowledgment
Click or tap Open Source Acknowledgment to open the Open Source Acknowledgment of this series oscilloscope.25.5 Auto Config
In the "Utility" menu, click or tap Auto Config to enter the Auto Config menu. You can configure the Auto function. \- Click or tap the ON/OFF tab for Peak to Peak to enable or disable the peak-peak priority setting. This function is intended for the shifted signal. If there is a large deviation, you can view the signal waveform in priority when you enable the function. \- Click or tap the ON/OFF tab for Live CH to enable or disable test the enabled channel. If you select "OFF", the system will test all analog channels in sequence when performing AUTO operation. If no signal is found on the channel, then the channel is disabled. If a signal is found on the channel, the channel will be adjusted to an optimal scale to show the signal. If you select "ON", the system will only test the enabled channels when performing AUTO operation. \- Click or tap the ON/OFF tab for Overlay to enable or disable the waveform overlay display function. If enabled, waveforms of the different channels will be overlaid on the screen when you perform auto setting. If disabled, waveforms of different channels will be displayed on the screen from top to bottom in sequence. \- Click or tap the ON/OFF tab for Keep Coupling to enable or disable the channel coupling keeping. If enabled, the settings for the channel coupling remain unchanged when you perform the auto setting operation. If disabled, the channel is DC-coupled by default.25.6 SelfCal
The self-calibration program can quickly make the oscilloscope to work in an optimal state to get the precise measurement results. You can perform self-calibration at any time, especially when the temperature variation is ±5°C from the ambient temperature. Make sure that the oscilloscope has been warmed up or operating for more than 30 minutes before the self-calibration. In "Utility" menu, click or tap SelfCal, the following self-calibration interface is shown below.  Figure 25.1 Self-calibration Menu - Click or tap Start, and then the oscilloscope will start to execute the self-calibration program. • After starting the self-calibration program, click or tap Exit to cancel self-calibration operation at any time. - Click or tap Close to close the self-calibration information window.25.7 Option List
In the Utility menu, click or tap Options to view all the options. For the procedures of installing the option, refer to descriptions in To View the Option and the Option Installation.25.8 Quick Operation
In the Utility menu, click or tap Quick to enter the quick setting operation menu.Save Image
- Click or tap Save Image, and the current Operation menu shows "Save Image". - In the Format menu item, the available image type can be "*.png", "*.bmp", or "*jpg". - Click or tap the ON/OFF tab for Invert to enable or disable the invert function. - Click or tap "Color" or "Gray" for Color to select the desired storage color. After configuring the settings, press on the front panel to capture the current screen image and save it based on your settings of the image to be saved. The storage location is related to the settings in File Path in the storage menu. For the settings of the storage path, refer to To Save a FileSave Wave
- Click or tap Save Wave, and the current Operation menu shows "Save Wave". - Click or tap to select "Memory", "Screen", or "Record" (only available when Record function is enabled and recorded waveforms are available) under Data Source as the source of waveforms to be saved. - The available choices under Format include "*.bin" and "*.csv". The recorded waveforms can only be saved in "*.csv" format. After configuring the settings, press Quick on the front panel to capture the current waveform and save it based on your settings of the waveforms to be saved. The storage location is related to the settings in File Path in the storage menu. For the settings of the storage path, refer to To Save a FileSave Setup
Click or tap Save Setup, and the current Operation menu shows "Save Setup". After configuring the settings, press on the front panel to save the current settings of the oscilloscope as a file suffixed with "*.stp". The storage path is where you set the File Path under the Storage menu. For the settings of the storage path, refer to descriptions in To Save a File.To Perform All Measurement
\- Click or tap All Measure, and the current Operation menu shows "All Measure". • The available channels under All Measure are CH1-CH4. After configuring the settings, press on the front panel to perform the measurement for the specified channel.Reset Statistics
\- Click or tap Stat Reset, then Operation is set to "Stat Reset". • Under Stat Reset, click or tap "Measure" or "Pass/Fail" to reset the statistics of the specified function. After configuring the settings, press on the front panel to reset the result list of the specified function. Then the instrument restarts to make statistics.Record Waveforms
Click or tap Record, and the current Operation menu shows "Record". After configuring the settings, press on the front panel to record the waveforms.Save Group
- Click or tap Save Group, and the current Operation menu shows "Save Group". • Under Save Group, select one or multiple items from "Save Image", "Save Wave", and "Save Setup". After configuring the settings, press Quick on the front panel to save the specified type based on your choice. The storage location is related to the settings in File Path in the storage menu. For the settings of the storage path, refer to To Save a File25.9 Self-check
In the Utility menu, click or tap Self Check to enter the sub-menus of "Self Check". You can test the following self-check items for the device.Key Test
Click or tap Key Test to enter the key test interface (virtual front panel key), as shown in the figure below.  Figure 25.2 Key Test Interface At this time, you can press the keys on the front panel to check whether the virtual keys are highlighted. If yes, it indicates that the keys work normally; if no, it indicates that there's something wrong with the keys. If the virtual key is not illuminated, the key may fail to work. Click or tap Exit at the lower-left corner of the key test interface to exit the key test interface. You can also press on the front panel for three consecutive times to exit the key test interface.Touch Test
Click or tap Touch Test to enter the touch screen test interface, as shown in the figure below.  Figure 25.3 Touch Screen Test Interface Slide with your finger on the screen. If there is a line displaying in the empty area where you slide on the screen and the box that you tap turns out to be filled with green background, it indicates that the touch function of this area is normal. Click or tap Exit at the lower-left corner of the touch screen test interface to exit the touch screen test interface. You can also press on the front panel for three consecutive times to exit the touch screen test interface.Screen Test
Click or tap Screen Test to enter the screen test interface and check whether the defective pixel exists. There are 15 colors of test screens. Click on the screen to go to the next screen test interface. Click or tap Exit at the upper-left corner of the touch screen test interface to exit the touch screen test interface. You can also press on the front panel for three consecutive times to exit the touch screen test interface.Board Test
Click or tap Board Test, then the board test interface is displayed. Check whether the status of each module is in good condition.26
Remote Control
The following ways of remote control are supported:- User-defined Programming
Users can program and control the instrument by using the SCPI (Standard Commands for Programmable Instruments) commands. For details about the SCPI commands and programming, refer to Programming Guide of this product series.- PC Software
Users can use the PC software to send commands to control the instrument remotely. RIGOL Ultra Sigma is recommended. You can download the software from RIGOL official website (http://www.rigol.com).Operation Procedures:
- Set up communication between the instrument and PC. - Run Ultra Sigma and search for the instrument resource. - Open the remote command control panel to send commands.- Web Control
This instrument supports Web Control. Connect the instrument to the network, then input the IP address of the instrument into the address bar of the browser of your computer. The web control interface is displayed. Click Web Control to enter the web control page. Then you can view the display of the real-time interface of the instrument. Through the Web Control method, you can migrate the device control to the control terminals (e.g. PC, Mobile, iPad, and other smart terminals) to realize remote control of the instrument. This instrument can be connected to the PC via the USB, LAN, or GPIB interface to set up communication and realize remote control through the PC. The remote control can be realized by using SCPI (Standard Commands for Programmable Instruments) commands. This chapter will illustrate how to use the RIGOL Ultra Sigma software to remotely control the instrument via various interfaces. Note: When communicating with the PC via GPIB, the instrument does not support large data transmission operation such as screen shot and waveform reading. CAUTION
Before connecting the communication cable, please turn off the instrument to avoid causing damage to the communication interfaces.26.1 Remote Control via USB
1. Connect the device
Use the USB cable to connect the rear-panel USB DEVICE interface of the instrument to the USB HOST interface of the PC.2. Search for the device resource
Start up Ultra Sigma and the software will automatically search for the resource currently connected to the PC via the USB interface. You can also click USB-TMC to search for the resource.3. View the device resource
The resources found will appear under the "RIGOL Online Resource" directory, and the model number and USB interface information of the instrument will also be displayed.4. Control the instrument remotely
Right-click the device resource name and select "SCPI Panel Control" to open the remotely command control panel. Then you can send commands and read data through the panel. For details about the SCPI commands and programming, refer to the Programming Guide of this instrument.26.2 Remote Control via LAN
1. Connect the device
Use the network cable to connect the instrument to your local area network (LAN).2. Configure network parameters
Configure the network parameters of the instrument in Utility>IO menu.3. Search for Search device resource
Start up Ultra Sigma and click LAN to open the panel as shown in the figure below. Click Search and the software searches for the instrument resources currently connected to the LAN and the resources found are displayed at the right section of the window as shown in the figure below. Click OK to add it.  Besides, you can input the IP address of the instrument manually into the text field under "Manual Input LAN Instrument IP", then click TEST. If the instrument passes the test, click Add to add the instrument to the LAN instrument resource list in the right section; if the instrument fails the test, please check whether the IP address that you input is correct, or use the auto search method to add the instrument resource.4. View the device resource
The resources found will appear under the "RIGOL Online Resource" directory.5. Control the instrument remotely
Right-click the device resource name and select "SCPI Panel Control" to open the remotely command control panel. Then you can send commands and read data through the panel.6. Load LXI webpage
As this instrument conforms to LXI CORE 2011 DEVICE standards, you can load LXI web page through Ultra Sigma (right-click the instrument resource name and select "LXI-Web"). Various important information about the instrument (including the model, manufacturer, serial number, description, MAC address, and IP address) will be displayed on the web page. You can also directly input the IP address of the instrument in the address bar of the PC browser to load the LXI web page.26.3 Remote Control via GPIB
1. Connect the device
Use the USB-GPIB interface converter to extend the GPIB interface for the instrument, and then use the GPIB cable to connect the instrument to the PC to realize remote control.2. Install the driver of GPIB card
Correctly install the driver of the GPIB card which has been connected to the PC.3. Set the GPIB address
Click or tap the Notification Area at the lower-right corner of the screen, then the Utility menu is displayed. Click or tap IO, and then click or tap the input field of GPIB to input the GPIB address with the pop-up numeric keypad.4. Search for the device resource
Start Ultra Sigma, and then click GPIB. A window is displayed as shown in Figure 26.1. Click Search and the software searches for the instrument resource currently connected to the PC via the GPIB interface. The resource found is displayed at the right side of the window, as shown in Figure 26.2. Click OK to add it.  Figure 26.1 Search for the Available Device  Figure 26.2 Confirm the Available Device5. View the device resource
Click OK to go back to the main interface of Ultra Sigma. The searched instrument resource will be displayed under the directory of "RIGOL Online Resource".6. Control the instrument remotely
Right-click the device resource name. In the displayed menu, select "SCPI Panel Control" to open the programming command control panel. Then you can input commands to send commands and read data.27 Troubleshooting
1. When I power on the instrument, the instrument stays black and does not display anything. a. Check whether the power supply has been connected correctly. b. Check whether the power key is really pressed. c. Check whether the fuse is blown. If you need to replace the fuse, use only the specified fuse that conforms to the product. d. Restart the instrument after finishing the above inspections. e. If the problem still persists, please contact RIGOL. 2. No waveform of the signal is displayed on the screen. a. Check whether the probe is properly connected to the item under test. b. Check whether there are signals generated from the item to be tested (you can connect the probe compensation output signal to the faulty channel to locate the problem, and then determine whether the channel or the item to be tested has a problem). c. Resample the signal. d. If the problem still persists, please contact RIGOL. 3. The USB storage device cannot be recognized. a. Check whether the USB storage device can work normally when connected to other instruments or PC. b. Make sure that the USB storage device is FAT32 format and flash type. The instrument doesn't support hardware USB storage device. c. After restarting the instrument, insert the USB storage device again to check whether it can work normally. d. If the USB storage device still cannot work normally, please contact RIGOL. 4. The touch-enabled operation does not work. a. Check whether you have locked the touch screen. If yes, unlock the touch screen. b. Check whether the screen or your finger is stained with oil or sweat. If yes, please clean the screen or dry your hands. c. Check whether there is a strong magnetic field around the instrument. If the instrument is close to the strong magnetic field (e.g. a magnet), please move the instrument away from the magnet field. d. If the problem still persists, please contact RIGOL.28 Appendix
28.1 Appendix A: Options and Accessories| Order Information Order No. | |
| Model | |
| 200 MHz, 2 GSa/s, 12-bit, 4-CH MHO2024 | |
| 350 MHz, 2 GSa/s, 12-bit, 4-CH MHO2034 | |
| Standard Accessories | |
| Power Cord Conforming to the Standard of the Destination Country | — — |
| USB Cable — — | |
| Passive High-impedance Probe x4 PVP2350 | |
| Recommended Accessories | |
| 4-Channel Logic Analyzer Probe x4 PLA3204 | |
| Protocol Decoding Option | |
| CAN-FD/LIN Bus Trigger and Decode Option MHO2000-AUTOA | |
| MIL-STD-1553 Bus Trigger and Decode Option MHO2000-AEROA | |
| FlexRay Serial Bus Trigger and Decode Option MHO2000-FLEXA | |
| I2S Bus Trigger and Decode Option MHO2000-AUDIOA | |
| Optional Accessories | |
| Built-in 2-CH 50 MHz AWG Option MHO2000-AWG | |
| Power Analysis Option MHO2000-PWRA | |
| Function and Application Bundle Options, including AUTOA/AEROA/FLEXA/AUDIOA/PWRA/AWG. | MHO2000-BND |
Note:
For all the mainframes, accessories, and options, please contact the local office of RIGOL.28.2 Appendix B: Warranty
RIGOL TECHNOLOGIES CO., LTD. (hereinafter referred to as RIGOL) warrants that the product mainframe and product accessories will be free from defects in materials and workmanship within the warranty period. If a product proves defective within the warranty period, RIGOL guarantees free replacement or repair for the defective product. To get repair service, please contact your nearest RIGOL sales or service office. There is no other warranty, expressed or implied, except such as is expressly set forth herein or other applicable warranty card. There is no implied warranty of merchantability or fitness for a particular purpose. Under no circumstances shall RIGOL be liable for any consequential, indirect, ensuing, or special damages for any breach of warranty in any case.28.3 Factory Settings
Press on the front panel, then a prompt message "Restore default settings?" is displayed. Click or tap OK to restore the instrument to its factory default settings. You can also click or tap Default on the quick operation toolbar to restore the instrument to its default settings. The following table below lists the default values of the instrument. Table 28.2 Factory Settings| Parameter Factory Settings | |
| Horizontal | |
| Horizontal Scale 2 μs | |
| Horizontal Position 0 s | |
| Delayed Sweep OFF | |
| Roll Auto | |
| Fine OFF | |
| Horizontal Expansion Center | |
| Acquire | |
| Acquisition Mode Normal | |
| Memory Depth 10 kpts | |
| Vertical | |
| CH1 | ON |
| CH2 | OFF |
| CH3 | OFF |
| Parameter Factory Settings | |
| CH4 OFF | |
| Default selected channel CH1 | |
| Display ON | |
| Impedance 1 MΩ | |
| Fine OFF | |
| Vertical Scale 50 mV | |
| VOffset 0 V | |
| Channel Unit [V] | |
| Channel Coupling DC | |
| Bias 0 V | |
| BW Limit OFF | |
| Ch-Ch Skew 0 s | |
| Display Label OFF | |
| Invert | OFF |
| Attenuation | 1X |
| Trigger | |
| Trigger Type | Edge Trigger |
| Trigger Mode | Auto |
| Source Selection | CH1 |
| Trigger level | 0 V |
| Edge Type | Rising |
| Trigger Coupling | DC |
| Trigger Holdoff | 8 ns |
| Noise Rejection | OFF |
| Display | |
| Display Type | Vector |
| Persistence Time | Min |
| Intensity | 50% |
| Grid FULL | |
| Grid Brightness | 50% |
| Window Transparency | 50% |
| Cursor Brightness | 80% |
| Show Scale | ON |
| Color Grade OFF | |
| Waveform Freeze | ON |
| Dual-channel Function/Arbitrary Waveform Generator (AFG)[1] | |
| Channel Output | OFF |
| GI Waveform Type | Sine |
| Parameter Factory Settings | |
| Freq 1 GHz | |
| Amplitude 5 V | |
| Offset 0 V | |
| Start Phase 0° | |
| Modulation State | OFF |
| Modulating Waveform | Sine |
| Modulation Depth 100% | |
| Modulation Frequency 100 MHz | |
| Logic Analyzer (LA) | |
| Display Priority OFF | |
| D15-D12 Off | |
| D11-D8 Off | |
| D7-D4 Off | |
| D3-D0 Off | |
| Wave Size Medium | |
| Channel Sequence D15-D0 | |
| Bode Plot[2] | |
| Bode Plot OFF | |
| Input Source CH1 | |
| Output Source | CH2 |
| AFG Channel | AFG1 |
| Output Impedance | HighZ |
| Sweep Type | Log |
| Display Type | Waveform |
| Start Freq 10 Hz | |
| Stop Freq | 1 MHz |
| Points/Decade | 10 |
| Output Amplitude | 200 mV |
| Var. Amplitude | OFF |
| Measure | |
| Threshold | OFF |
| Histogram OFF | |
| Indicator | OFF |
| Statistics | OFF |
| Count 1,000 | |
| Display Type % | |
| Source CH1 | |
| Upper 90% | |
| Mid 50% | |
| Lower 10% | |
| Amplitude Measurement Method | Auto |
| Region Main | |
| Cursor | |
| Mode Manual | |
| Minimize OFF | |
| Manual | |
| Source CH1 | |
| Select X | |
| AX BX OFF | |
| AX -6 μs | |
| BX 6 μs | |
| Track | |
| Source A | CH1 |
| Source B | CH1 |
| AX BX OFF | |
| Track | X |
| AX -6 μs | |
| BX 6 μs | |
| XY | |
| Select X | |
| AX BX OFF | |
| AX -150 mV | |
| BX 150 mV | |
| Frequency Counter | |
| Source CH1 | |
| Statistics | OFF |
| Measure | Frequency |
| Resolution | 4 |
| DVM | |
| Source CH1 | |
| Mode AC RMS | |
| Beeper OFF | |
| When In Limits | |
| Upper 1 V | |
| Lower 0 V | |
| Save Image | |
| Format *.png | |
| Invert OFF | |
| Color Color | |
| Header ON | |
| Overlay OFF | |
| Save Wave | |
| Data Source Screen | |
| Format *.bin | |
| Save Setup | |
| File Type *.stp | |
| Load Setup | |
| File Type *.stp | |
| System Setting | |
| Beeper OFF | |
| AUX Out TrigOut | |
| Operation Lock OFF | |
| Expand GND | |
| Display Time ON | |
| Other Settings Related to the System Utility | |
| EXT 10M IN | OFF |
| Auto Config | |
| Peak to Peak | ON |
| Live CH | OFF |
| Overlay ON | |
| Coupling | OFF |
| Quick Operation | |
| Operation | Save Image |
| Format *.png | |
| Invert OFF | |
| Color Color | |
| Pass/Fail Test | |
| Enable | OFF |
| Source | CH1 |
| Parameter Factory Settings | |
| Grid FULL | |
| A+B | |
| Operation OFF | |
| SourceA CH1 | |
| SourceB CH1 | |
| Scale 500 mV | |
| Offset 0V | |
| A-B | |
| Operation OFF | |
| SourceA CH1 | |
| SourceB CH1 | |
| Scale 500mV | |
| Offset 0V | |
| A×B | |
| Operation OFF | |
| SourceA CH1 | |
| SourceB CH1 | |
| Scale 500 mU | |
| Offset 0 U | |
| A÷B | |
| Operation OFF | |
| SourceA CH1 | |
| SourceB CH1 | |
| Scale 500 mU | |
| Offset 0 U | |
| FFT | |
| Operation OFF | |
| Source CH1 | |
| X Span-Center | |
| Unit dBm/dBV | |
| Center Frequency 5 MHz | |
| Frequency Range 10 MHz | |
| Vertical Scale 20 dB | |
| Offset 0 dBV | |
| Window Function Hanning | |
| Color Grade | OFF |
| Peak Search | OFF |
| Peak Number | 5 |
| Threshold | 5.5 dBV |
| Excursion | 1.8 dB |
| Table Order | Amp Order |
| A&&B | |
| Operation OFF | |
| SourceA CH1 | |
| SourceB CH1 | |
| Wave Size Medium | |
| Offset 0 div | |
| Sensitivity 300 mdiv | |
| Thre.CH1 0V | |
| Thre.CH2 0V | |
| Thre.CH3 0V | |
| Thre.CH4 0V | |
| A||B | |
| Operation OFF | |
| SourceA CH1 | |
| SourceB CH1 | |
| Wave Size Medium | |
| Offset 0 div | |
| Sensitivity 300 mdiv | |
| Thre.CH1 0V | |
| Thre.CH2 0V | |
| Thre.CH3 0V | |
| Thre.CH4 0V | |
| A^B | |
| Operation OFF | |
| SourceA CH1 | |
| SourceB CH1 | |
| Wave Size Medium | |
| Offset 0 div | |
| Sensitivity 300 mdiv | |
| Thre.CH1 0V | |
| Thre.CH2 0V | |
| Thre.CH3 0V | |
| Thre.CH4 0V | |
| !A | |
| Operation OFF | |
| SourceA CH1 | |
| Wave Size Medium | |
| Offset 0 div | |
| Sensitivity 300 mdiv | |
| Thre.CH1 0V | |
| Thre.CH2 0V | |
| Thre.CH3 0V | |
| Thre.CH4 0V | |
| Intg | |
| Operation OFF | |
| Source CH1 | |
| Scale 500 mV*s | |
| Offset 0 V*s | |
| Bias 0V | |
| Diff | |
| Operation OFF | |
| Source CH1 | |
| Scale 500 mV/s | |
| Offset 0 V/s | |
| Smooth 5 | |
| Sqrt | |
| Operation OFF | |
| Source CH1 | |
| Scale 500 mU | |
| Offset 0 U | |
| Lg | |
| Operation OFF | |
| Source CH1 | |
| Scale 500 mU | |
| Offset 0 U | |
| Ln | |
| Operation OFF | |
| Source CH1 | |
| Scale 500 mU | |
| Offset 0 U | |
| Exp | |
| Operation OFF | |
| Source CH1 | |
| Scale 500 mU | |
| Offset 0 U | |
| Abs | |
| Operation OFF | |
| Source CH1 | |
| Scale 500 mV | |
| Offset 0 V | |
| Low Pass | |
| Operation OFF | |
| Source CH1 | |
| Scale 500 mV | |
| Offset 0 V | |
| ωc 4 kHz | |
| High Pass | |
| Operation OFF | |
| Source CH1 | |
| Scale 500 mV | |
| Offset 0 V | |
| ωc 4 kHz | |
| Band Pass | |
| Operation OFF | |
| Source CH1 | |
| Scale 500 mV | |
| Offset 0 V | |
| ωc 1 4 kHz | |
| ωc 2 8 kHz | |
| Band Stop | |
| Operation OFF | |
| Source CH1 | |
| Scale 500 mV | |
| Offset 0 V | |
| ωc 1 4 kHz | |
| ωc 2 8 kHz | |
| AX+B | |
| Operation OFF | |
| Source CH1 | |
| Scale 500 mV | |
| Offset 0 V | |
| A | 1 |
| B | 0 |
| Ref | |
| Current Ref1 | |
| Source CH1 | |
| Vertical Scale 50 mV | |
| VOffset 0 V | |
| Label REF1 | |
| Label Display OFF | |
| Color Orange | |
| Decode | |
| Bus Type Parallel | |
| Bus Status OFF | |
| Format Hex | |
| Label ON | |
| Event Table OFF | |
| Parallel | |
| CLK OFF | |
| Bus CH1 | |
| Threshold 0 V | |
| Endian Invert | |
| Polarity Positive | |
| RS232 | |
| Tx | CH1 |
| Rx | OFF |
| Threshold 0 V | |
| Polarity Negative | |
| Baud Rate 9.6 kbps | |
| Data Bits 8 bits | |
| Endian LSB | |
| Parity | None |
| Stop Bits | 1 bit |
| I2C | |
| CLK CH1 | |
| SCL Thre | 0 V |
| Data | CH2 |
| SDA Thre | 0 V |
| Exchange | SCL/SDA |
| SPI | |
| CLK CH1 | |
| Threshold 0 V | |
| Slope | Rising |
| MISO | CH2 |
| Threshold 0 V | |
| MOSI | OFF |
| Mode | Timeout |
| Timeout | 1 μs |
| Polarity Positive | |
| Width | 8 |
| Endian MSB | |
| LIN | |
| Source | CH1 |
| Threshold 0 V | |
| Baud Rate 19.2 kbps | |
| Parity Without | |
| Version Both | |
| CAN | |
| Source CH1 | |
| Threshold 0 V | |
| Signal Type CAN_L | |
| Baud 1 Mbps | |
| Sample Position 80% | |
| CAN-FD Baud 1 Mbps | |
| FD Sample Position 80% | |
| FlexRay | |
| Source CH1 | |
| Threshold 0 V | |
| Channel Selection A | |
| Baud Rate 10 Mbps | |
| Signal Type BP | |
| Sample Position 50% | |
| I2S | |
| SCLK CH1 | |
| SCLK Threshold | 0 V |
| SCLK Edge | Rising |
| WS | CH2 |
| WS Threshold 0 V | |
| SDA | CH3 |
| SDA Threshold | 0 V |
| Word Size | 4 |
| Receive | 4 |
| Alignment | I2S |
| WS Low | Left |
| Endian | MSB |
| Data Polarity | Positive |
| 1553B | |
| Data | CH1 |
| Threshold 0 V | |
NOTE
[1]: Optional configuration. [2] : Available to use when the MHO2000-AWG option has been installed.Boost Smart World and Technology Innovation
Industrial Intelligent Manufacturing   Semiconductors  Education& Research   Communication System Integration   New Energy  Cellular-5G/WIFI  UWB/RFID/ZIGBEE  Digital Bus/Ethernet  Optical Communication  Digital/Analog/RF Chip  Memory and MCU Chip  Third-Generation Semiconductor  Solar Photovoltaic Cells  New Energy Automobile  PV/Inverter  Power Test  Automotive ElectronicsProvide Testing and Measuring Products and Solutions for Industry Customers
HEADQUARTER
RIGOL TECHNOLOGIES CO., LTD. No.8 Keling Road, New District, Suzhou,JiangSu,P.R.China Tel: +86-400620002 Email: info-cn@rigol.comJAPAN
RIGOL JAPAN CO., LTD. 5F,3-45-6,Minamiotsuka,Toshima-Ku, Tokyo,170-0005,Japan Tel: +81-3-6262-8932 Fax: +81-3-6262-8933 Email: info.jp@rigol.comEUROPE
RIGOL TECHNOLOGIES EU GmbH Carl-Benz-Str.11 82205 Gilching Germany Tel: +49(0)8105-27292-0 Email: info-europe@rigol.comKOREA
RIGOL KOREA CO., LTD. 5F, 222, Gonghang-daero, Gangseo-gu, Seoul, Republic of Korea Tel: +82-2-6953-4466 Fax: +82-2-6953-4422 Email: info.kr@rigol.comNORTH AMERICA
RIGOL TECHNOLOGIES, USA INC. 10220 SW Nimbus Ave. Suite K-7 Portland, OR 97223 Tel: +1-877-4-RIGOL-1 Email: sales@rigol.comFor Assistance in Other Countries
Email: info.int@rigol.com- GUARANTY AND DECLARATION
- COPYRIGHT
- TRADEMARK INFORMATION
- NOTICES
- PRODUCT CERTIFICATION
- CONTACT US
- SECTION DESCRIPTION PAGE
- TO SET THE VERTICAL SYSTEM
- HORIZONTAL SYSTEM
- ACQUISITION SYSTEM
- TO TRIGGER THE OSCILLOSCOPE
- DIGITAL VOLTMETER (DVM) AND FREQUENCY COUNTER
- DIGITAL CHANNEL
- HISTOGRAM ANALYSIS
- FUNCTION/ARBITRARY WAVEFORM GENERATOR (OPTION)
- TO OUTPUT BASIC WAVEFORMS
- MODULATION
- BODE PLOT
- BASIC SETTING
- POWER ANALYSIS (OPTION)
- REFERENCE WAVEFORM
- PASS/FAIL TEST
- PROTOCOL DECODING
- SYSTEM UTILITY FUNCTION SETTING
- REMOTE CONTROL
- TROUBLESHOOTING
- APPENDIX
- LIST OF FIGURES
- LIST OF TABLES
- SAFETY REQUIREMENT
- GENERAL SAFETY SUMMARY
- WARNING
- SAFETY NOTICES AND SYMBOLS
- CAUTION
- DANGER
- MEASUREMENT CATEGORY
- MEASUREMENT CATEGORY DEFINITIONS
- VENTILATION REQUIREMENT
- WORKING ENVIRONMENT
- TEMPERATURE
- HUMIDITY
- OPERATING
- ALTITUDE
- PROTECTION LEVEL AGAINST ELECTRIC SHOCK
- INSTALLATION (OVERVOLTAGE) CATEGORY
- INSTALLATION (OVERVOLTAGE) CATEGORY DEFINITIONS
- POLLUTION DEGREE
- POLLUTION DEGREE DEFINITION
- CARE AND CLEANING
- ENVIRONMENTAL CONSIDERATIONS
- PRODUCT FEATURES
- NOTE
- DOCUMENT OVERVIEW
- TIP
- PUBLICATION NUMBER
- SOFTWARE VERSION
- FORMAT CONVENTIONS IN THIS MANUAL
- KEY
- MENU
- OPERATION PROCEDURES
- KNOB
- CONTENT CONVENTIONS IN THIS MANUAL
- QUICK START
- GENERAL INSPECTION
- INSPECT THE PACKAGING
- INSPECT THE INSTRUMENT
- CHECK THE ACCESSORIES
- RECOMMENDED CALIBRATION INTERVAL
- PRODUCT APPEARANCE
- APPEARANCE AND DIMENSIONS
- TO PREPARE FOR USE
- TO ADJUST THE SUPPORTING LEGS
- TO CONNECT TO AC POWER
- TURN-ON CHECKOUT
- TO REPLACE THE FUSE
- TO SET THE SYSTEM LANGUAGE
- TO CONNECT THE PROBE
- CONNECT THE PASSIVE PROBE
- CONNECT THE ACTIVE PROBE
- CONNECT THE LOGIC PROBE
- FUNCTION INSPECTION
- PROBE COMPENSATION
- PRODUCT OVERVIEW
- FRONT PANEL
- FRONT PANEL FUNCTION OVERVIEW
- CAPACITIVE TOUCH SCREEN
- MULTIFUNCTION KNOB
- NON-MENU OPERATION
- MENU OPERATION
- MEASURE KEY
- CURSOR KEY
- ANALYSE KEY
- TOUCH LOCK KEY
- COMMON OPERATION KEYS
- QUICK OPERATION KEY (RELATED TO QUICK OPERATION SETTING)
- TRIGGER CONTROL AREA
- VERTICAL CONTROL AREA
- PROBE COMPENSATION SIGNAL OUTPUT TERMINAL/GROUND TERMINAL
- HORIZONTAL CONTROL AREA
- ANALOG CHANNEL INPUT TERMINALS
- DIGITAL CHANNEL INPUT (TYPE-C INTERFACE)
- DUAL-CHANNEL FUNCTION/ARBITRARY WAVEFORM GENERATOR OUTPUT TERMINAL
- USB HOST INTERFACE
- POWER KEY
- REAR PANEL
- MHZ REF OUT
- MHZ REF IN
- BATTERY PACK SNAP-FIT SLOT
- HDMI
- USB DEVICE
- LAN
- SECURITY LOCK HOLE
- SCREW MOUNTING HOLE
- AC POWER CORD CONNECTOR
- FUSE
- BATTERY PACK INTERFACE
- BATTERY PACK MOUNTING SLOT
- AUX OUT
- TRIGGER OUTPUT
- PASS/FAIL
- EXT TRIG
- USER INTERFACE
- OPERATING STATUS
- HORIZONTAL TIMEBASE LABEL
- SAMPLE RATE & MEMORY DEPTH LABEL
- HORIZONTAL POSITION LABEL
- TRIGGER INFORMATION LABEL
- QUICK OPERATION TOOLBAR
- RESULT LIST
- NOTIFICATION AREA
- CHANNEL OPERATION LABEL
- DIGITAL CHANNEL LABEL
- FUNCTION/ARBITRARY WAVEFORM GENERATOR LABEL [1]
- MULTI-PANE WINDOWING DISPLAY AREA
- ANALOG CHANNEL LABEL
- FUNCTION NAVIGATION ICON
- TOUCH SCREEN GESTURES
- TAP
- PINCH&STRETCH
- DRAG
- RECTANGLE DRAWING
- PARAMETER SETTING METHOD
- INPUT CHINESE AND ENGLISH CHARACTERS
- CLEAR THE NAME INPUT AREA
- INPUT THE UPPER-CASE LETTER
- INPUT THE LOWER-CASE LETTER
- INPUT NUMBERS OR SYMBOLS
- MODIFY OR DELETE THE UNWANTED CHARACTERS THAT HAVE BEEN INPUT
- CONFIRM THE INPUT
- INPUT CHINESE CHARACTERS
- INPUT A VALUE
- TO USE THE SECURITY LOCK
- TO USE THE BUILT-IN HELP SYSTEM
- TO VIEW THE OPTION AND THE OPTION INSTALLATION
- VIEW THE INSTALLED OPTION
- INSTALL THE OPTION
- OBTAIN AN OPTION LICENSE
- TO ENABLE OR DISABLE THE ANALOG CHANNEL
- ENABLE THE ANALOG CHANNEL
- DISABLE THE ANALOG CHANNEL
- TO ADJUST THE VERTICAL SCALE
- TO ADJUST THE VERTICAL OFFSET
- CHANNEL COUPLING
- BW LIMIT
- INPUT IMPEDANCE
- WAVEFORM INVERT
- PROBE
- PROBE RATIO
- EXTERNAL ATTENUATION
- SKEW
- BIAS
- PROBE INFORMATION
- GO BACK TO THE VERTICAL SYSTEM MENU
- AMPLITUDE UNIT
- CHANNEL DELAY
- CHANNEL LABEL
- TO ADJUST THE HORIZONTAL TIME BASE
- TO ADJUST THE HORIZONTAL POSITION
- ZOOM MODE (DELAYED SWEEP)
- WAVEFORM BEFORE EXPANSION
- WAVEFORM AFTER EXPANSION
- ACQUISITION MODE
- NORMAL
- AVERAGE
- PEAK
- HIGH RESOLUTION
- SAMPLING MODE
- SAMPLE RATE
- MEMORY DEPTH
- MDEPTH ≥ SRATE X TSCALE X HDIVS
- HORIZONTAL EXPANSION
- ROLL MODE
- XY MODE
- ENABLE THE XY MODE
- CONFIGURE THE XY MODE
- PHASE DEVIATION MEASUREMENT
- ±(A/B) OR ±(C/D)
- TRIGGER SOURCE
- ANALOG CHANNEL
- AC LINE
- EXT (EXTERNAL TRIGGER)
- TRIGGER LEVEL
- TRIGGER MODE
- TRIGGER COUPLING
- TRIGGER HOLDOFF
- NOISE REJECTION
- TRIGGER TYPE
- EDGE TRIGGER
- SELECT THE TRIGGER TYPE
- SELECT THE SOURCE
- EDGE TYPE
- PULSE TRIGGER
- POLARITY
- TRIGGER CONDITION
- PULSE WIDTH SETTING
- SLOPE TRIGGER
- SOURCE SELECTION
- SLOPE TIME SETTING
- LEVEL SELECTION AND SETTING
- VIDEO TRIGGER
- VIDEO POLARITY
- VIDEO STANDARD
- SYNC
- PATTERN TRIGGER
- PATTERN SETTING
- DURATION TRIGGER
- TIMEOUT TRIGGER
- TIMEOUT VALUE
- RUNT TRIGGER
- WINDOW TRIGGER
- TRIGGER POSITION
- SET THE TRIGGER LEVEL
- DELAY TRIGGER
- SOURCE SETTING
- SOURCE A
- EDGE A
- SOURCE B
- EDGE B
- SET THE TRIGGER CONDITION
- SETUP/HOLD TRIGGER
- CLOCK SOURCE
- DATA SOURCE
- DATA TYPE
- IDLE TIME
- EDGE COUNT
- RS232 TRIGGER
- BAUD RATE
- DATA BITS
- STOP BIT
- PARITY
- I2C TRIGGER
- SPI TRIGGER
- DATA
- CAN TRIGGER
- SIGNAL TYPE
- SAMPLE POSITION
- FLEXRAY TRIGGER (OPTION)
- LIN TRIGGER (OPTION)
- PROTOCOL VERSION
- I2S TRIGGER (OPTION)
- AUDIO
- USER WIDTH
- WIDTH
- ALIGNMENT
- MIL-STD-1553 TRIGGER (OPTION)
- ZONE TRIGGER
- SET THE TRIGGER ZONE
- ENABLE OR DISABLE THE TRIGGER ZONE
- SELECT THE TRIGGER CONDITION
- SET THE TRIGGER LOGIC FOR ZONE TRIGGER
- TRIGGER OUTPUT CONNECTOR
- MATH OPERATION
- ARITHMETIC OPERATION
- ARITHMETIC OPERATION RESULT DISPLAY WINDOW
- SOURCE
- FUNCTION OPERATION
- OPERATION RESULT DISPLAY WINDOW
- FFT OPERATION
- OPERATION
- FREQUENCY RANGE
- UNIT OF VERTICAL SCALE/OFFSET
- WINDOW FUNCTION
- COLOR GRADE
- PEAK SEARCH
- LOGIC OPERATION
- WAVE SIZE
- SENSITIVITY
- THRESHOLD
- DIGITAL FILTER
- FREQUENCY LIMIT
- PARAMETER SETTINGS OF THE MATH OPERATION RESULT
- DISPLAY AREA
- SCALE
- OFFSET
- AUTO SETTING
- INVERT
- WAVEFORM
- VERTICAL EXPANSION
- LABEL
- GRID
- MEASUREMENTS
- MEASUREMENT PARAMETER
- TIME PARAMETERS
- COUNT VALUES
- POSITIVE PULSE COUNT
- NEGATIVE PULSE COUNT
- RISING EDGE COUNT
- FALLING EDGE COUNT
- DELAY AND PHASE PARAMETERS
- VOLTAGE PARAMETERS
- OTHER PARAMETERS
- TO SELECT THE MEASUREMENT ITEM
- MEASUREMENT SETTINGS
- MEASUREMENT HISTOGRAM
- INDICATOR
- MEASUREMENT THRESHOLD
- MEASUREMENT RANGE
- AMPLITUDE MEASUREMENT METHOD
- STATISTICS OF MEASUREMENT RESULTS
- DISPLAY RESULT STATISTICS OF ALL MEASUREMENT ITEMS
- SET THE MEASUREMENT COUNT
- RESET THE STATISTICS OF THE MEASUREMENT RESULTS
- TO REMOVE THE MEASUREMENT RESULTS
- REMOVE THE SPECIFIED MEASUREMENT ITEM
- REMOVE ALL MEASUREMENT ITEMS
- AUTO MEASUREMENT
- CURSOR MEASUREMENTS
- X CURSOR
- Y CURSOR
- MANUAL MODE
- SELECT THE MEASUREMENT SOURCE
- SELECT CURSOR TYPE
- ADJUST THE CURSOR POSITION
- MINIMIZE THE CURSOR SETTING WINDOW
- MEASUREMENT EXAMPLE
- TRACK MODE
- SELECT THE TRACK MODE
- DIGITAL VOLTMETER (DVM)
- SELECT THE MEASUREMENT MODE
- SET THE LIMITS
- TO REMOVE THE MEASUREMENT
- FREQUENCY COUNTER
- SELECT THE MEASUREMENT ITEM
- SET THE RESOLUTION
- CLEAR COUNT
- DISABLE THE FREQUENCY COUNTER
- TO RESET STATISTICS
- STATISTICS RESULTS
- RESET STATISTICS
- BASIC SETTINGS
- TO ENABLE OR DISABLE THE DIGITAL CHANNEL
- ENABLE OR DISABLE A SINGLE CHANNEL
- ENABLE OR DISABLE THE CHANNELS OF A SPECIFIED GROUP
- ON/OFF CONTROL OF ALL CHANNELS
- TO SET THE LABEL
- ENABLE OR DISABLE THE LABEL DISPLAY
- USE PRESET LABELS
- SET THE USER-DEFINED LABEL
- TO SELECT THE DIGITAL CHANNEL
- TO SET THE THRESHOLD
- USE THE PRESET THRESHOLD
- SET THE USER-DEFINED THRESHOLD
- OTHER SETTINGS
- TO SET THE WAVEFORM SIZE
- TO SET THE CHANNEL SEQUENCE
- PRIORITY OF THE WAVEFORM DISPLAY
- TO SET THE PROBE DELAY
- TO ENABLE OR DISABLE THE HISTOGRAM
- TO SELECT THE HISTOGRAM TYPE
- TO SELECT THE HISTOGRAM SOURCE
- TO SET THE HISTOGRAM HEIGHT
- TO SET THE HISTOGRAM RANGE
- HISTOGRAM ANALYSIS RESULTS
- TO CLEAR STATISTICS
- SINE
- SET THE FREQUENCY/PERIOD
- SET THE AMPLITUDE
- SET THE OFFSET
- SET THE HIGH/LOW LEVEL
- SET THE START PHASE
- ALIGN PHASE
- SQUARE
- SET THE DUTY CYCLE
- RAMP
- SYMMETRY
- PULSE
- NOISE
- DC
- EXP.RISE
- EXP.FALL
- ECG
- GAUSS
- LORENTZ
- HAVERSINE
- SINC
- AM
- SELECT THE MODULATION TYPE
- SELECT THE MODULATING WAVEFORM
- SET THE MODULATION DEPTH
- SET THE MODULATION FREQUENCY
- ENABLE THE MODULATION OUTPUT
- DSSC
- FM
- SET THE FREQUENCY DEVIATION
- PM
- TO SET THE PHASE DEVIATION
- TO ENABLE OR DISABLE THE BODE PLOT FUNCTION
- TO RUN OR STOP THE DRAWING OF THE BODE PLOT
- TO SET THE INPUT/OUTPUT SOURCE
- OUTPUT SOURCE
- TO SET THE SWEEP SIGNAL
- SWEEP SOURCE
- SWEEP TYPE
- TO SET THE DISPLAY TYPE
- WAVEFORM DISPLAY
- CHART DISPLAY
- TO VIEW THE CONNECTION DIAGRAM
- AMPL/FREQ SETTING
- TO SAVE AND LOAD THE BODE PLOT FILE
- SAVE THE TEST DATA
- LOAD THE TEST DATA
- POWER QUALITY
- SET POWER QUALITY ANALYSIS SOURCE
- SET THE REFERENCE LEVEL
- SET THE COUNT
- ENABLE THE POWER ANALYSIS
- VIEW THE CONNECTION DIAGRAM
- RIPPLE
- SET THE RIPPLE ANALYSIS SOURCE
- VIEW THE STATISTICS OF THE MEASUREMENT RESULTS
- TO ENABLE THE REF FUNCTION
- TO SET THE REFERENCE WAVEFORM
- SELECT THE REFERENCE CHANNEL
- SELECT THE REF SOURCE
- SAVE THE REFERENCE WAVEFORM TO INTERNAL MEMORY
- CLEAR THE SPECIFIED REFERENCE WAVEFORM
- MINIMIZE THE REFERENCE WAVEFORM WINDOW
- TO SET THE REF WAVEFORM DISPLAY
- ADJUST THE VERTICAL SCALE
- MODIFY THE VERTICAL OFFSET
- HORIZONTAL OFFSET
- RESET THE REFERENCE WAVEFORM
- SET THE REFERENCE WAVEFORM COLOR
- SET THE REFERENCE WAVEFORM LABEL
- TO EXPORT AND IMPORT THE REFERENCE WAVEFORM
- EXPORT TO INTERNAL OR EXTERNAL MEMORY
- SET THE FORMAT
- SET THE FILENAME
- SET THE FILE PATH
- IMPORT FROM INTERNAL OR EXTERNAL MEMORY
- SET THE IMPORT PATH
- TO ENABLE OR DISABLE THE PASS/FAIL TEST FUNCTION
- TO SELECT THE SOURCE
- TO SET THE TEST MASK
- CREATE A MASK
- LOAD A MASK
- SAVE A MASK
- TO SET THE OUTPUT FORM OF THE TEST RESULTS
- SET THE OUTPUT EVENT AND AUX OUTPUT
- SET THE OUTPUT POLARITY AND OUTPUT PULSE WIDTH
- SET THE ERROR ACTION
- TO START OR STOP THE PASS/FAIL TEST OPERATION
- TO DISPLAY THE STATISTICS INFORMATION OF THE TEST RESULTS
- PARALLEL DECODING
- BUS STATUS
- CLOCK SETTING (CLK)
- CLK EDGE
- BUS SETTING
- SET THE BUS
- SET THE THRESHOLD LEVEL
- ENDIAN
- DISPLAY-RELATED SETTING
- SET THE DISPLAY FORMAT
- SET THE LABEL DISPLAY
- EVENT TABLE
- SET THE EVENT TABLE FORMAT
- EXPORT
- RS232 DECODING
- QUICKLY APPLY TRIGGER SETTINGS TO DECODING
- SET THE TX SOURCE AND THE THRESHOLD
- SET THE RX SOURCE AND THE THRESHOLD
- SET THE BAUD RATE
- TO SET DATA PACKAGE
- I2C DECODING
- SET THE CLOCK CHANNEL AND DATA CHANNEL
- EXCHANGE SOURCES
- SET THE ADDRESS WIDTH
- ADDRESS INFORMATION OF I2C DECODING
- ERROR EXPRESSIONS IN I2C DECODING
- SPI DECODING
- TO SET THE SOURCE
- SET THE CLOCK SIGNAL
- SET MISO AND MOSI
- TO SET THE MODE AND DATA
- MODE
- TIMEOUT
- CS
- WIDTH SETTING
- CAN DECODING
- SIGNAL CONFIGURATION
- SET THE SOURCE AND THE THRESHOLD
- SELECT THE SIGNAL TYPE
- SPECIFY THE STANDARD SIGNAL RATE
- SET THE CAN-FD BAUD
- SET THE FD SAMPLE POSITION
- SEARCH ID
- INTERPRET THE CAN DECODING FRAME STRUCTURE
- LIN DECODING (OPTION)
- SET THE SIGNAL
- INTERPRET THE LIN DECODING FRAME STRUCTURE
- I2S DECODING (OPTION)
- SET THE SCLK SOURCE AND THRESHOLD
- SET THE WS SOURCE AND THRESHOLD
- SET THE SDA SOURCE AND THRESHOLD
- SET THE WORD SIZE
- SET THE RECEIVER WORD SIZE
- SET THE ENDIAN
- SET THE ALIGNMENT MODE
- SET THE AUDIO POLARITY
- SET THE DATA POLARITY
- FLEXRAY DECODING (OPTION)
- SELECT THE SIGNAL
- SPECIFY THE SIGNAL RATE
- SET THE SIGNAL TYPE
- INTERPRET THE FLEXRAY DECODING FRAME STRUCTURE
- B DECODING (OPTION)
- TO SET THE DATA CHANNEL SOURCE AND THE THRESHOLD
- SELECT THE DATA CHANNEL
- SET THE THRESHOLD
- INTERPRET THE 1553B DECODING FRAME STRUCTURE
- MULTI-PANE WINDOWING
- ADD DIAGRAM WINDOWS
- ADD RESULT LIST WINDOW
- WAVEFORM RECORDING AND PLAYING
- COMMON SETTINGS
- RECORDING OPERATION
- PLAY OPERATION
- STORAGE
- RECORD OPTIONS
- INTERVAL
- FRAMES
- MAX FRAMES
- BEEPER
- PLAY OPTIONS
- PLAY MODE
- PLAYBACK SEQUENCE
- START FRAME
- END FRAME
- CURRENT FRAME
- SEARCH AND NAVIGATION FUNCTION
- SEARCH FUNCTION
- SELECT THE SEARCH TYPE
- SET THE SOURCE
- COPY TRIGGER
- TO TRIGGER
- FROM TRIGGER
- ENABLE OR DISABLE THE MARK TABLE
- NAVIGATION
- SAVE THE SEARCH EVENT
- NAVIGATION FUNCTION
- TIME NAVIGATION
- SEARCH EVENT NAVIGATION
- DISPLAY CONTROL
- DISPLAY TYPE
- PERSISTENCE TIME
- MIN
- VARIABLE PERSISTENCE
- INFINITE
- WAVEFORM INTENSITY
- TO SET THE SCREEN GRID
- DISPLAY SETTING
- GRID BRIGHTNESS
- WINDOW TRANSPARENCY
- CURSOR BRIGHTNESS
- SHOW SCALE
- WAVEFORM FREEZE
- TO STORE AND LOAD
- TO ENTER THE STORAGE MENU
- TO SAVE A FILE
- TO SAVE THE IMAGE
- IMAGE FORMAT
- COLOR
- HEADER
- TO SAVE THE WAVE
- SET THE SOURCE OF THE WAVEFORM DATA
- SET THE WAVEFORM FORMAT
- TO SAVE THE SETUP
- BINARY DATA FORMAT (.BIN)
- BINARY HEADER FORMAT
- FILE HEADER
- WAVEFORM HEADER
- WAVEFORM DATA HEADER
- TO UPLOAD THE FILE VIA THE FTP SERVER
- TO LOAD THE SETUP FILE
- UPGRADE
- LOCAL UPGRADE
- ONLINE UPGRADE
- DISK MANAGEMENT
- SELECT A DISK
- CREATE A FOLDER
- CLEAR THE INTERNAL MEMORY
- SELECT THE FILE
- CUT, COPY, AND PASTE A FILE OR A FOLDER
- CUT A FILE OR A FOLDER TO A DESTINATION PATH
- COPY A FILE OR A FOLDER TO A DESTINATION PATH
- DELETE A FILE OR A FOLDER
- RENAME A FILE OR A FOLDER
- I/O SETTING
- NETWORK STATUS
- MAC ADDRESS
- VISA ADDRESS
- IP CONFIGURATION TYPE
- DHCP
- AUTO IP
- STATIC IP
- SET THE IP ADDRESS
- SET THE SUBNET MASK
- SET THE DEFAULT GATEWAY
- SET THE DNS ADDRESS
- MDNS
- HOST NAME
- GPIB
- APPLY THE NETWORK PARAMETER SETTING
- LANGUAGE
- SCREEN BRIGHTNESS
- LOAD LAST
- POWER STATUS
- OPERATION LOCK
- DISPLAY TIME
- ABOUT THIS OSCILLOSCOPE
- EXT 10M IN
- OPEN SOURCE ACKNOWLEDGMENT
- AUTO CONFIG
- SELFCAL
- OPTION LIST
- QUICK OPERATION
- SAVE IMAGE
- SAVE WAVE
- SAVE SETUP
- TO PERFORM ALL MEASUREMENT
- RECORD WAVEFORMS
- SAVE GROUP
- SELF-CHECK
- KEY TEST
- TOUCH TEST
- SCREEN TEST
- BOARD TEST
- USER-DEFINED PROGRAMMING
- PC SOFTWARE
- WEB CONTROL
- REMOTE CONTROL VIA USB
- CONNECT THE DEVICE
- SEARCH FOR THE DEVICE RESOURCE
- VIEW THE DEVICE RESOURCE
- CONTROL THE INSTRUMENT REMOTELY
- REMOTE CONTROL VIA LAN
- CONFIGURE NETWORK PARAMETERS
- SEARCH FOR SEARCH DEVICE RESOURCE
- LOAD LXI WEBPAGE
- REMOTE CONTROL VIA GPIB
- INSTALL THE DRIVER OF GPIB CARD
- SET THE GPIB ADDRESS
- APPENDIX B: WARRANTY
- FACTORY SETTINGS
- BOOST SMART WORLD AND TECHNOLOGY INNOVATION
- PROVIDE TESTING AND MEASURING PRODUCTS AND SOLUTIONS FOR INDUSTRY CUSTOMERS
- HEADQUARTER
- JAPAN
- EUROPE
- KOREA
- NORTH AMERICA
- FOR ASSISTANCE IN OTHER COUNTRIES
Brand : Rigol
Model : MHO2034
Category : Uncategorized